Embed Size (px)
Citation preview
Australian Journal of Basic and Applied Sciences, 6(13): 334-353, 2012 ISSN 1991-8178
Corresponding Author: F. S. Ramadan, Geology Dept, Faculty of Science, Zagazig University
334
Subsurface Study and Source Rocks Evaluation of Ras Gharib Onshore Oil field in the Central Gulf of Suez, Egypt.
1F.S. Ramadan, 2M.M. El Nady, 2M.M. Hammad and 2N.M. Lotfy
1Geology Dept, Faculty of Science, Zagazig University 2Exploration Dept, Egyptian Petroleum Research Institute
Abstract: The subsurface study and evaluation of the Cretaceous and Miocene rock units in Ras Gharib oil field in the central Gulf of Suez were investigated by studying the composite logs for ten wells through the constructing of isopach, lithfacies maps and stratigraphic cross sections (lithostratigraphic and structural) of some rock units, in order to distinguish the shape and the extent of sedimentary basins and the environment of deposition. On the other hand, we have analyzed twenty five ditch samples collected from five wells using Rock Eval-6 pyrolysis for the determination of the total organic carbon and organic geochemical characteristics of these samples. The Cretaceous units includes; Nubia "A", Raha and Wata formations .The Nubia "A" Formation is deposited in terrestrial to shallow marine environment and has two main depocenters of deposition at the south eastern and south western directions. While, Raha and Wata formations are deposited in shallow marine environment. The thickness of Raha Formation increases towards the north and south eastern directions and Wata Formation has two main depocenters at the south eastern and north western directions. The Miocene units includes; Basal Miocene Bed (Nukhul), Belaiym and South Gharib and Zeit formations. Basal Miocene Bed Formation is deposited in shallow marine environment. Meanwhile, Belayium Formation is deposited in deep to shallow marine environment. In contrary, the South Gharib and Zeit formations were characterized by lagoonal facies. The thickness of Basal Miocene Bed Formation increases towards the north western direction and from the west to east direction in Belaiym Formation. Moreover, South Gharib and Zeit formations are characterized by one main depocenter of deposition. Total organic carbon and pyrolysis analysis of the Cretaceous and Miocene source rocks revealed that the Cretaceous formations are immature source rocks, ranged from fair to good source rocks and have kerogen of type III and type III/II. Meanwhile, Miocene source rocks range from immature to marginally mature source rocks, are considered to range from good to very good source rocks for potential generation of both oil and gas and are characterized by kerogen of type III/II and type II. Key words: Isopach, lithofacies, Miocene, Cretaceous, TOC, Rock-Eval pyrolysis, Ras Gharib, Gulf of Suez, Egypt.
INTRODUCTION
The Gulf of Suez in Egypt has a north-northwest–south-southeast direction and lies at the junction of the
African and Arabian plates where it separates the northeast African continent from the Sinai Peninsula. It has excellent hydrocarbon potential, with the prospective sedimentary basin area measuring approximately 19,000 km2, and it is considered as the most prolific oil province rift basin in Africa and the Middle East. This basin contains more than 80 oil fields, with reserves ranging from 1350 to less than 1 million bbl; in reservoirs of Precambrian to Quaternary age (Schlumberger, 1995). The lithostratigraphic units in the Gulf of Suez can be subdivided into three megasequences: a prerift succession (pre-Miocene or Paleozoic-Eocene), a synrift succession (Oligocene-Miocene), and a postrift succession (Pliocene-Holocene). These units vary in lithology, thickness, areal distribution, depositional environment, and hydrocarbon importance (Said, 1990). Geological and geophysical data show that the northern and central Gulf of Suez consist of several narrow, elongated depositional troughs, whereas the southern part is dominated by a tilt-block terrane, containing numerous offset linear highs (Schlumberger, 1995).
The hydrocarbon potential of the study area is generally high because of (1) rifting tended to produce both restricted and open marine settings favorable to source rock accumulation; (2) relatively high geothermal gradients helped convert organic matter in the source rocks to hydrocarbons; (3) subsequent rotational faulting and marginal uplifting produced clastic systems served by the mature shield terranes and formed shoal areas where porous reef buildups and dolomitized limestones potential reservoirs could develop; (4) rotational faulting of these units produced structural traps, which were sealed by onlapping basinal mudrocks or evaporites during later thermal subsidence of the rift; (5) all faults in the Gulf of Suez are normal faults. The trapping structures of the numerous oil fields are horsts or tilted fault blocks. The intervening grabens contain thick accumulations of basinal shales and marls, producing favorable conditions for rich source rocks (Al-Sharhan, and Salah 1994; 1995).
Aust. J. Basic & Appl. Sci., 6(13): 334-353, 2012
335
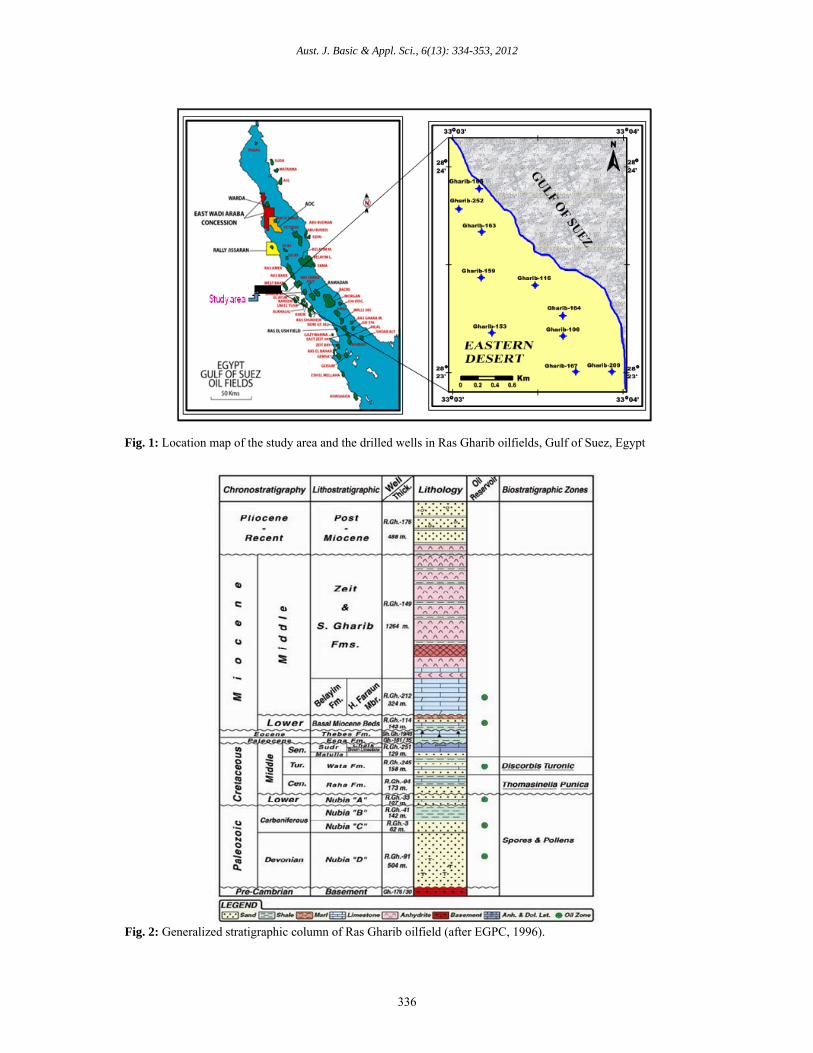
The present work deals with the subsurface characteristics and source rocks evaluation of the Cretaceous (Nubia “A”, Raha and Wata formations) and Miocene rocks (Basal Miocene Bed (Nukhul), Belayium , South Gharib and Zeit formations) in Ras Gharib area lies between latitudes 28о 2328-׳о 24׳ N and longitudes 33о 03׳-33о 04׳ E (Fig.1) and covers a surface area of about 2.4 Km2 in the central part of the coastal strip of the western side of the Gulf of Suez. Figure (2) shows the lithostratigraphic column of Ras Gharib oil field, compiled from the drilled wells in the study area.
The main objectives of the present study are: (1) trace the thickness variations, lithofacies change of the penetrated formations and assess the depositional environments of the different rock units. (2) Studying the probabilities of the source rock from some wells in Ras Gharib onshore oil field for the hydrocarbon generation through identifying the organic richness, type of organic matters, and thermal maturation of these organic materials. For accomplishing this work, the following objectives will be approached:
1. Integrate the lithostratigraphic patterns by constructing isopach, lithfacies maps stratigraphic and structure cross sections of different rock units.
2. Determining the total organic carbon (TOC) wt % in order to evaluate the organic richness of the investigated rock units.
3. Evaluation of the type of organic matter from Rock-Eval pyrolysis data. 4. Using the available geochemical data to establish the thermal maturation of the source rocks.
MATERIALS AND METHODS A composite log for ten wells namely: Gharib-165, Gharib-252, Gharib 163, Gharib-159, Gharib-116,
Gharib-164, Gharib-153, Gharib-106, Gharib 209 and Gharib-167 wells.Twenty five representative ditch samples were collected from “5” wells in the study area (Gharib-252 Gharib-153, Gharib-163, Gharib-164 and Gharib-165). The composite logs and rock samples were supplied by Egyptian General Petroleum Corporation approval.
Isopach and Lithofacies maps of the studied rock units were constructed using Krumbein and Sloss (1963) technique. In addition to, regional stratigraphic cross sections (lithostratigraphic and structural) were constructed to illustrate the different rock units and structural configuration between the wells. Furthermore, the pyrolysis analyses have been carried out by the Egyptian Petroleum Research Institute using Rock-Eval-6 Pyrolysis technique (Espitalie et al., 1977). Pyrolysis results were represented by different parameters such as volatile hydrocarbons (S1 peak) liberated at temperature less than 300°C and the pyrolytic hydrocarbons (S2 peak) released during the temperature programmed pyrolysis in the range 300 to 600°C. The S1 and S2 are expressed in milligrams of hydrocarbons per gram of rock (mg/g) and "S3" peak represents the quantity of CO2 formed by pyrolysis of the organic matter and expressed in milligrams of CO2 per gram of rock (mg/g).
The hydrocarbon potentiality of the Gulf of Suez was studied by different authors, Metwalli et al. (1981), Barakat (1982), Shahin and Shehab (1984); Shahin (1988); Atef (1988); Al-Sharhan and Salah (1994), Younes (2001) and Abd El-Gawad et al., (2007). Younes (2001) reported that the southern part of the Gulf of Suez has good source rocks for hydrocarbon generation. El Sorgy et al. (2002) divided the source rocks into three types. The first type is found in the Upper Senonian carbonate-rich sediments of the Brown Limestone, while the second kindly source rock includes clastics-rich sediments of the Miocene (Rudeis Formation) and the third one is the clastic-rich Lower Senonian (Mattula/Wata formations). Al-sharhan (2003) showed that major prerift and synrift source rocks have potential to yield oil and/or gas and are mature enough in the deep kitchens to generate hydrocarbons. El Nady (2006) showed that the Middle and Upper Miocene source rocks in the Gulf of Suez are immature, originated mainly from mixed organic sources, have poor to fair potential to producing oil, and did not reach to the early stage of hydrocarbon generation till present time. Lower Miocene source rocks are mature, derived from marine organic sources, have good potential to generate oil and gas, and entered to the early stage of hydrocarbon generation and oil window till present time. Abu Shagar (2006) showed that the central onshore part of the Gulf of Suez is richer in total organic carbon when compared with the other two localities, where it is classified as good source rock. Abd El-Gawad et al., (2007) showed that Sudr Chalk and Brown Limestone formations are considered as the principal oil source rock units in the southern Gulf of Suez. Fatehy et al., (2010) showed that the organic matter present in Kareem Formation in the central Gulf of Suez is variegated mainly between fair and good source. Abu Bakr et al., (2010) reported that the total organic matter content of Thebes, Sudr and Brown Limestone in the Central Gulf of Suez varies mainly between good and very good and reached to excellent source for Thebes Formation. El Nady (2011) recognized that the El- Khaligue-4 well in the Central Gulf of Suez is considered as a favorable episode for the accumulation of organic matter petroleum generation owing: (1) good source rocks, (2) high thermal maturity level and (3) deposited with predominance of marine origin.
Aust. J. Basic & Appl. Sci., 6(13): 334-353, 2012
336
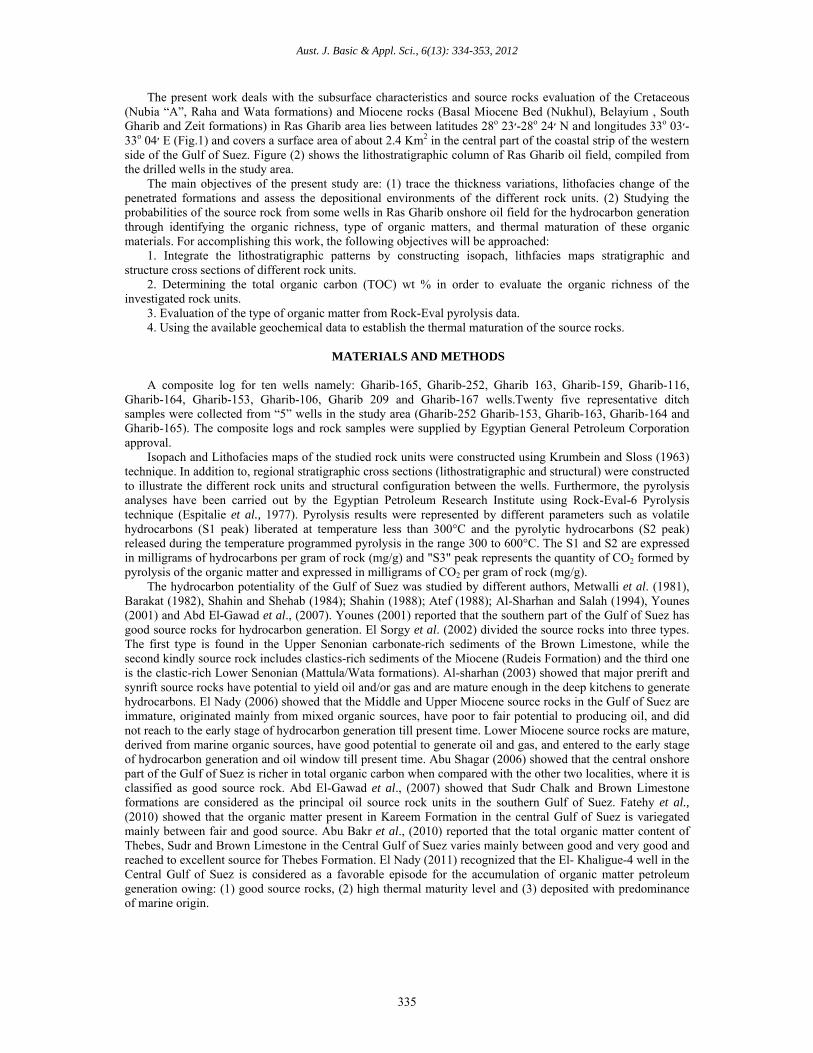
Fig. 1: Location map of the study area and the drilled wells in Ras Gharib oilfields, Gulf of Suez, Egypt
Fig. 2: Generalized stratigraphic column of Ras Gharib oilfield (after EGPC, 1996).
Aust. J. Basic & Appl. Sci., 6(13): 334-353, 2012
337
RESULTS AND DISCUSSIONS 3.1. Isopach and Facies Maps of Cretaceous Sediments: 3.1.1Nubia “A” Formation:
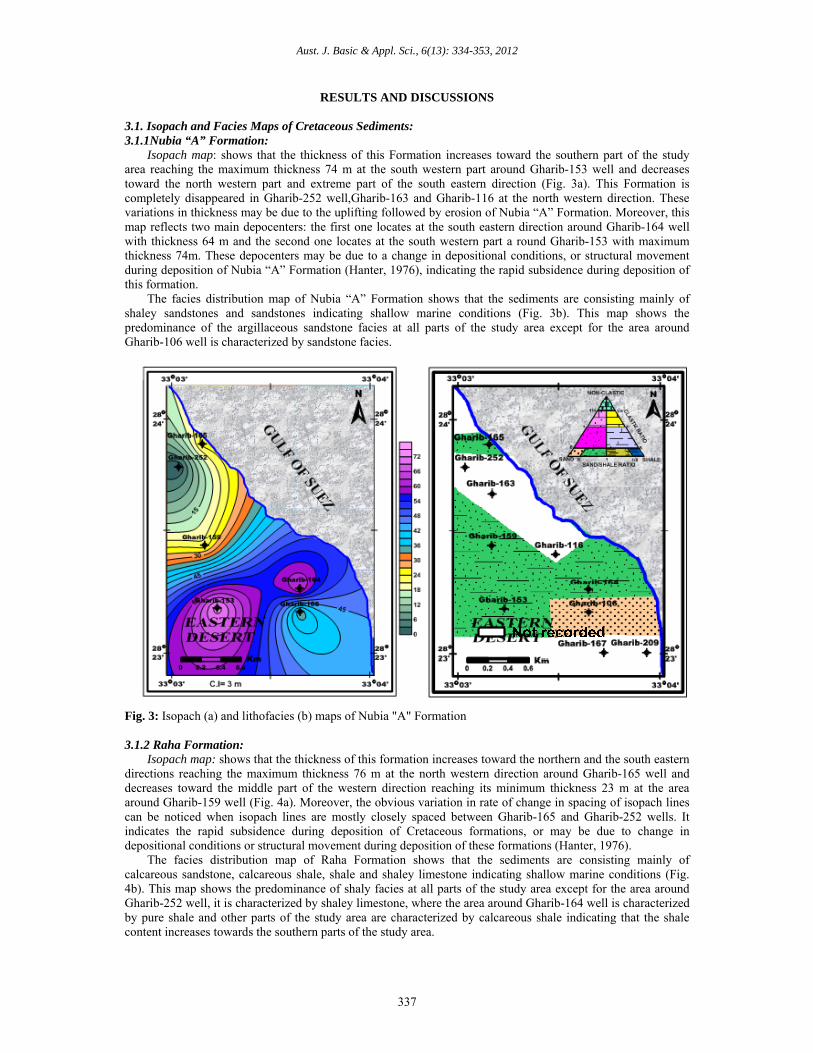
Isopach map: shows that the thickness of this Formation increases toward the southern part of the study area reaching the maximum thickness 74 m at the south western part around Gharib-153 well and decreases toward the north western part and extreme part of the south eastern direction (Fig. 3a). This Formation is completely disappeared in Gharib-252 well,Gharib-163 and Gharib-116 at the north western direction. These variations in thickness may be due to the uplifting followed by erosion of Nubia “A” Formation. Moreover, this map reflects two main depocenters: the first one locates at the south eastern direction around Gharib-164 well with thickness 64 m and the second one locates at the south western part a round Gharib-153 with maximum thickness 74m. These depocenters may be due to a change in depositional conditions, or structural movement during deposition of Nubia “A” Formation (Hanter, 1976), indicating the rapid subsidence during deposition of this formation.
The facies distribution map of Nubia “A” Formation shows that the sediments are consisting mainly of shaley sandstones and sandstones indicating shallow marine conditions (Fig. 3b). This map shows the predominance of the argillaceous sandstone facies at all parts of the study area except for the area around Gharib-106 well is characterized by sandstone facies.
Fig. 3: Isopach (a) and lithofacies (b) maps of Nubia "A" Formation 3.1.2 Raha Formation:
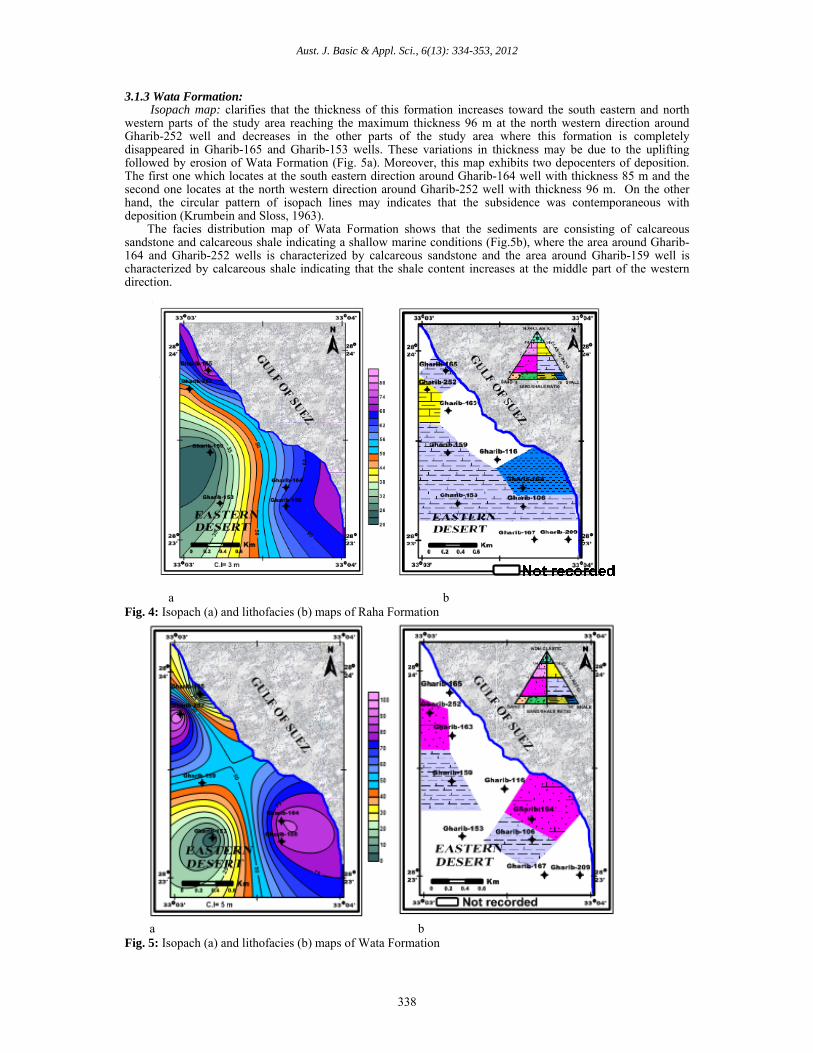
Isopach map: shows that the thickness of this formation increases toward the northern and the south eastern directions reaching the maximum thickness 76 m at the north western direction around Gharib-165 well and decreases toward the middle part of the western direction reaching its minimum thickness 23 m at the area around Gharib-159 well (Fig. 4a). Moreover, the obvious variation in rate of change in spacing of isopach lines can be noticed when isopach lines are mostly closely spaced between Gharib-165 and Gharib-252 wells. It indicates the rapid subsidence during deposition of Cretaceous formations, or may be due to change in depositional conditions or structural movement during deposition of these formations (Hanter, 1976).
The facies distribution map of Raha Formation shows that the sediments are consisting mainly of calcareous sandstone, calcareous shale, shale and shaley limestone indicating shallow marine conditions (Fig. 4b). This map shows the predominance of shaly facies at all parts of the study area except for the area around Gharib-252 well, it is characterized by shaley limestone, where the area around Gharib-164 well is characterized by pure shale and other parts of the study area are characterized by calcareous shale indicating that the shale content increases towards the southern parts of the study area.
Aust. J. Basic & Appl. Sci., 6(13): 334-353, 2012
338
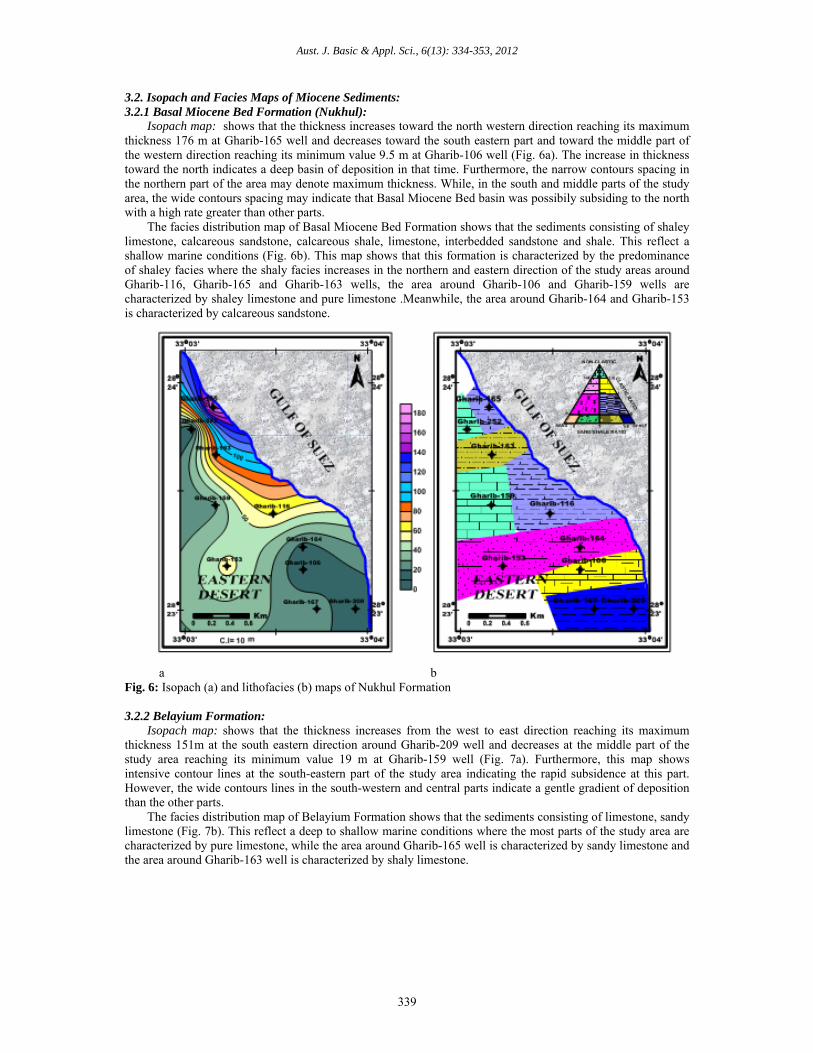
3.1.3 Wata Formation: Isopach map: clarifies that the thickness of this formation increases toward the south eastern and north
western parts of the study area reaching the maximum thickness 96 m at the north western direction around Gharib-252 well and decreases in the other parts of the study area where this formation is completely disappeared in Gharib-165 and Gharib-153 wells. These variations in thickness may be due to the uplifting followed by erosion of Wata Formation (Fig. 5a). Moreover, this map exhibits two depocenters of deposition. The first one which locates at the south eastern direction around Gharib-164 well with thickness 85 m and the second one locates at the north western direction around Gharib-252 well with thickness 96 m. On the other hand, the circular pattern of isopach lines may indicates that the subsidence was contemporaneous with deposition (Krumbein and Sloss, 1963).
The facies distribution map of Wata Formation shows that the sediments are consisting of calcareous sandstone and calcareous shale indicating a shallow marine conditions (Fig.5b), where the area around Gharib-164 and Gharib-252 wells is characterized by calcareous sandstone and the area around Gharib-159 well is characterized by calcareous shale indicating that the shale content increases at the middle part of the western direction.
a b Fig. 4: Isopach (a) and lithofacies (b) maps of Raha Formation
a b Fig. 5: Isopach (a) and lithofacies (b) maps of Wata Formation
Aust. J. Basic & Appl. Sci., 6(13): 334-353, 2012
339
3.2. Isopach and Facies Maps of Miocene Sediments: 3.2.1 Basal Miocene Bed Formation (Nukhul):
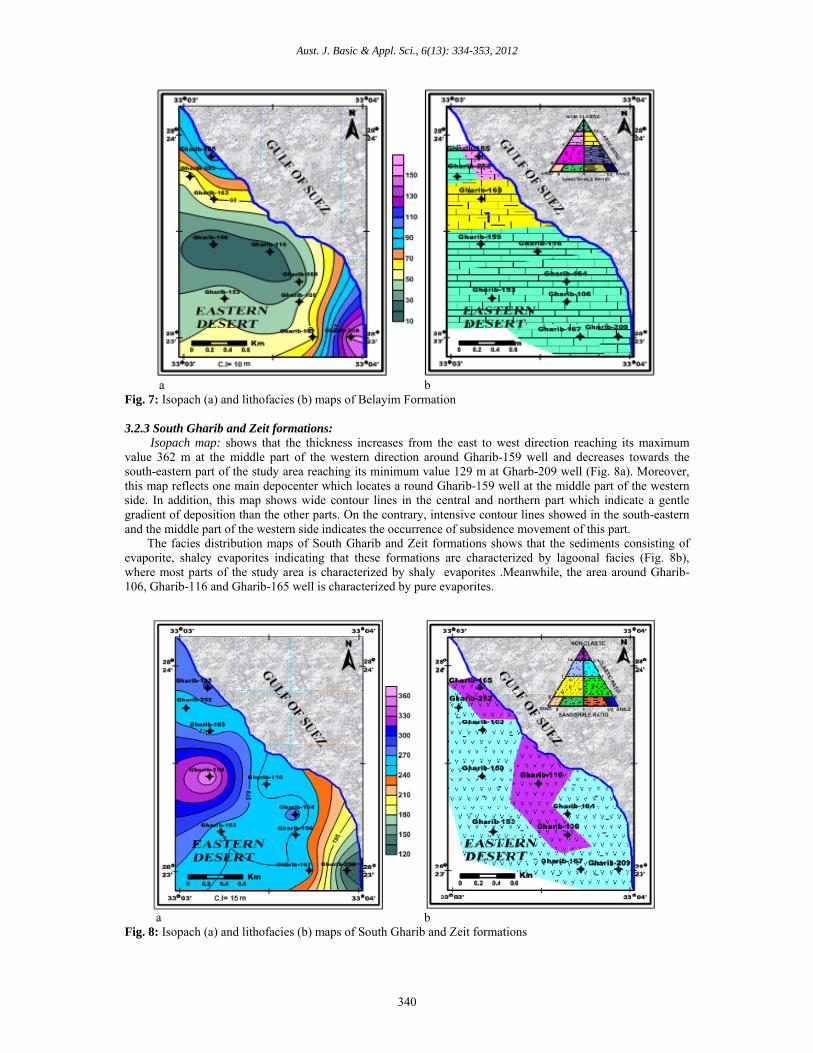
Isopach map: shows that the thickness increases toward the north western direction reaching its maximum thickness 176 m at Gharib-165 well and decreases toward the south eastern part and toward the middle part of the western direction reaching its minimum value 9.5 m at Gharib-106 well (Fig. 6a). The increase in thickness toward the north indicates a deep basin of deposition in that time. Furthermore, the narrow contours spacing in the northern part of the area may denote maximum thickness. While, in the south and middle parts of the study area, the wide contours spacing may indicate that Basal Miocene Bed basin was possibily subsiding to the north with a high rate greater than other parts.
The facies distribution map of Basal Miocene Bed Formation shows that the sediments consisting of shaley limestone, calcareous sandstone, calcareous shale, limestone, interbedded sandstone and shale. This reflect a shallow marine conditions (Fig. 6b). This map shows that this formation is characterized by the predominance of shaley facies where the shaly facies increases in the northern and eastern direction of the study areas around Gharib-116, Gharib-165 and Gharib-163 wells, the area around Gharib-106 and Gharib-159 wells are characterized by shaley limestone and pure limestone .Meanwhile, the area around Gharib-164 and Gharib-153 is characterized by calcareous sandstone.
a b Fig. 6: Isopach (a) and lithofacies (b) maps of Nukhul Formation
3.2.2 Belayium Formation:
Isopach map: shows that the thickness increases from the west to east direction reaching its maximum thickness 151m at the south eastern direction around Gharib-209 well and decreases at the middle part of the study area reaching its minimum value 19 m at Gharib-159 well (Fig. 7a). Furthermore, this map shows intensive contour lines at the south-eastern part of the study area indicating the rapid subsidence at this part. However, the wide contours lines in the south-western and central parts indicate a gentle gradient of deposition than the other parts.
The facies distribution map of Belayium Formation shows that the sediments consisting of limestone, sandy limestone (Fig. 7b). This reflect a deep to shallow marine conditions where the most parts of the study area are characterized by pure limestone, while the area around Gharib-165 well is characterized by sandy limestone and the area around Gharib-163 well is characterized by shaly limestone.
Aust. J. Basic & Appl. Sci., 6(13): 334-353, 2012
340
a b Fig. 7: Isopach (a) and lithofacies (b) maps of Belayim Formation 3.2.3 South Gharib and Zeit formations:
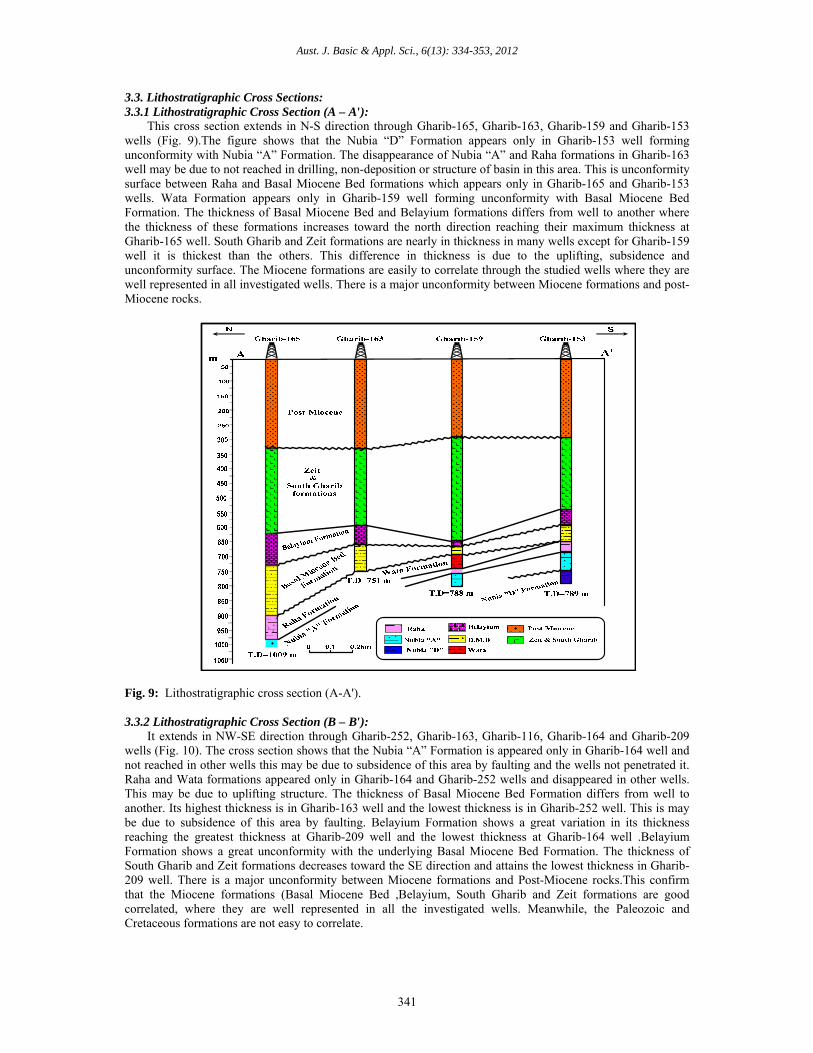
Isopach map: shows that the thickness increases from the east to west direction reaching its maximum value 362 m at the middle part of the western direction around Gharib-159 well and decreases towards the south-eastern part of the study area reaching its minimum value 129 m at Gharb-209 well (Fig. 8a). Moreover, this map reflects one main depocenter which locates a round Gharib-159 well at the middle part of the western side. In addition, this map shows wide contour lines in the central and northern part which indicate a gentle gradient of deposition than the other parts. On the contrary, intensive contour lines showed in the south-eastern and the middle part of the western side indicates the occurrence of subsidence movement of this part.
The facies distribution maps of South Gharib and Zeit formations shows that the sediments consisting of evaporite, shaley evaporites indicating that these formations are characterized by lagoonal facies (Fig. 8b), where most parts of the study area is characterized by shaly evaporites .Meanwhile, the area around Gharib-106, Gharib-116 and Gharib-165 well is characterized by pure evaporites.
a b Fig. 8: Isopach (a) and lithofacies (b) maps of South Gharib and Zeit formations
Aust. J. Basic & Appl. Sci., 6(13): 334-353, 2012
341
3.3. Lithostratigraphic Cross Sections: 3.3.1 Lithostratigraphic Cross Section (A – A'):
This cross section extends in N-S direction through Gharib-165, Gharib-163, Gharib-159 and Gharib-153 wells (Fig. 9).The figure shows that the Nubia “D” Formation appears only in Gharib-153 well forming unconformity with Nubia “A” Formation. The disappearance of Nubia “A” and Raha formations in Gharib-163 well may be due to not reached in drilling, non-deposition or structure of basin in this area. This is unconformity surface between Raha and Basal Miocene Bed formations which appears only in Gharib-165 and Gharib-153 wells. Wata Formation appears only in Gharib-159 well forming unconformity with Basal Miocene Bed Formation. The thickness of Basal Miocene Bed and Belayium formations differs from well to another where the thickness of these formations increases toward the north direction reaching their maximum thickness at Gharib-165 well. South Gharib and Zeit formations are nearly in thickness in many wells except for Gharib-159 well it is thickest than the others. This difference in thickness is due to the uplifting, subsidence and unconformity surface. The Miocene formations are easily to correlate through the studied wells where they are well represented in all investigated wells. There is a major unconformity between Miocene formations and post-Miocene rocks.
Fig. 9: Lithostratigraphic cross section (A-A'). 3.3.2 Lithostratigraphic Cross Section (B – B'):
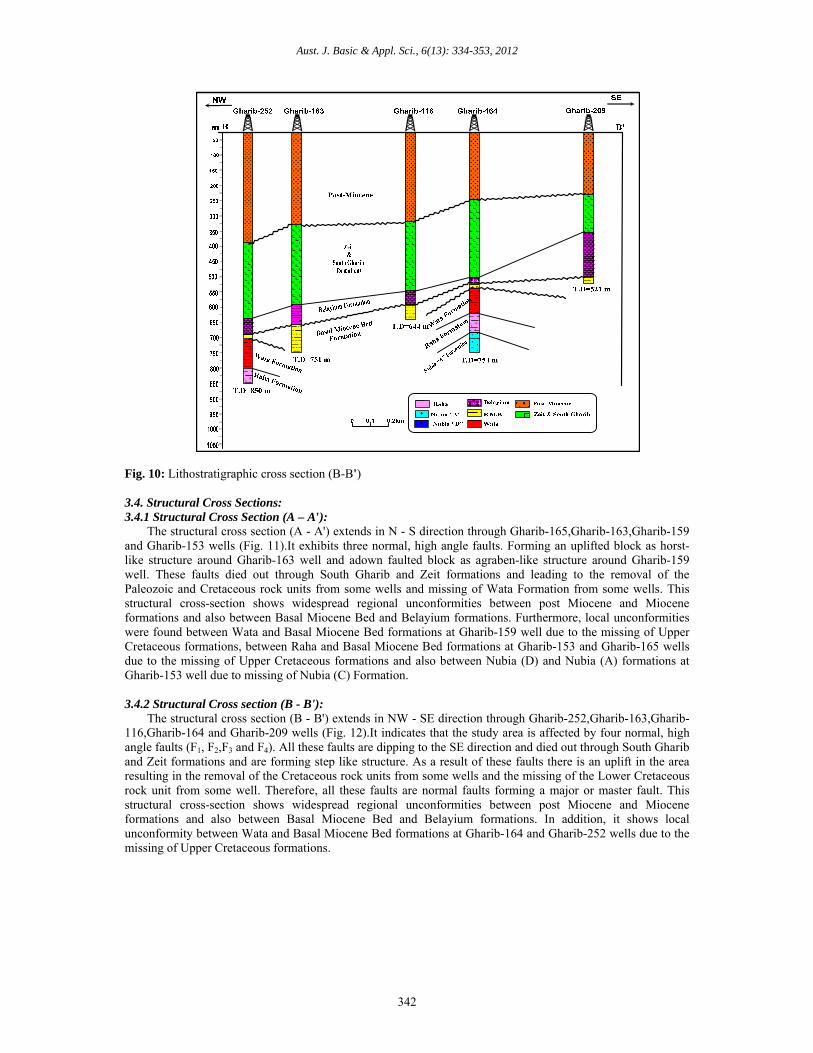
It extends in NW-SE direction through Gharib-252, Gharib-163, Gharib-116, Gharib-164 and Gharib-209 wells (Fig. 10). The cross section shows that the Nubia “A” Formation is appeared only in Gharib-164 well and not reached in other wells this may be due to subsidence of this area by faulting and the wells not penetrated it. Raha and Wata formations appeared only in Gharib-164 and Gharib-252 wells and disappeared in other wells. This may be due to uplifting structure. The thickness of Basal Miocene Bed Formation differs from well to another. Its highest thickness is in Gharib-163 well and the lowest thickness is in Gharib-252 well. This is may be due to subsidence of this area by faulting. Belayium Formation shows a great variation in its thickness reaching the greatest thickness at Gharib-209 well and the lowest thickness at Gharib-164 well .Belayium Formation shows a great unconformity with the underlying Basal Miocene Bed Formation. The thickness of South Gharib and Zeit formations decreases toward the SE direction and attains the lowest thickness in Gharib-209 well. There is a major unconformity between Miocene formations and Post-Miocene rocks.This confirm that the Miocene formations (Basal Miocene Bed ,Belayium, South Gharib and Zeit formations are good correlated, where they are well represented in all the investigated wells. Meanwhile, the Paleozoic and Cretaceous formations are not easy to correlate.
Aust. J. Basic & Appl. Sci., 6(13): 334-353, 2012
342
Fig. 10: Lithostratigraphic cross section (B-B')
3.4. Structural Cross Sections: 3.4.1 Structural Cross Section (A – A'):
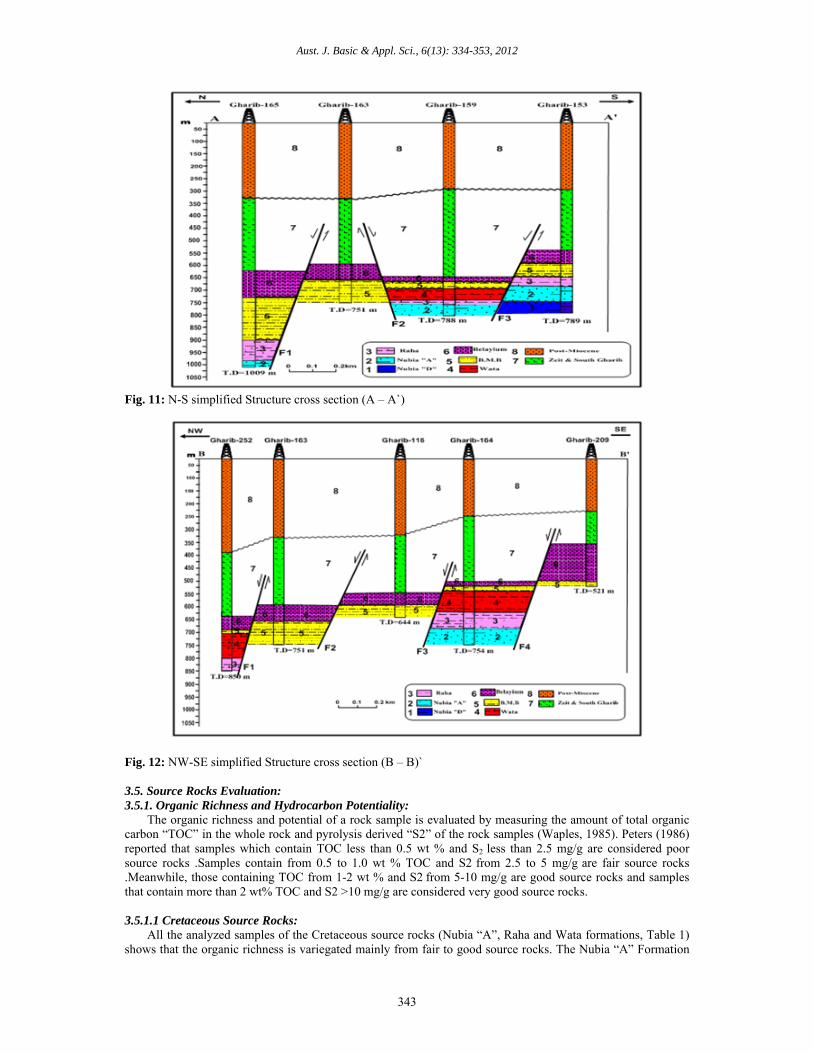
The structural cross section (A - A') extends in N - S direction through Gharib-165,Gharib-163,Gharib-159 and Gharib-153 wells (Fig. 11).It exhibits three normal, high angle faults. Forming an uplifted block as horst-like structure around Gharib-163 well and adown faulted block as agraben-like structure around Gharib-159 well. These faults died out through South Gharib and Zeit formations and leading to the removal of the Paleozoic and Cretaceous rock units from some wells and missing of Wata Formation from some wells. This structural cross-section shows widespread regional unconformities between post Miocene and Miocene formations and also between Basal Miocene Bed and Belayium formations. Furthermore, local unconformities were found between Wata and Basal Miocene Bed formations at Gharib-159 well due to the missing of Upper Cretaceous formations, between Raha and Basal Miocene Bed formations at Gharib-153 and Gharib-165 wells due to the missing of Upper Cretaceous formations and also between Nubia (D) and Nubia (A) formations at Gharib-153 well due to missing of Nubia (C) Formation.
3.4.2 Structural Cross section (B - B'):
The structural cross section (B - B') extends in NW - SE direction through Gharib-252,Gharib-163,Gharib-116,Gharib-164 and Gharib-209 wells (Fig. 12).It indicates that the study area is affected by four normal, high angle faults (F1, F2,F3 and F4). All these faults are dipping to the SE direction and died out through South Gharib and Zeit formations and are forming step like structure. As a result of these faults there is an uplift in the area resulting in the removal of the Cretaceous rock units from some wells and the missing of the Lower Cretaceous rock unit from some well. Therefore, all these faults are normal faults forming a major or master fault. This structural cross-section shows widespread regional unconformities between post Miocene and Miocene formations and also between Basal Miocene Bed and Belayium formations. In addition, it shows local unconformity between Wata and Basal Miocene Bed formations at Gharib-164 and Gharib-252 wells due to the missing of Upper Cretaceous formations.
Aust. J. Basic & Appl. Sci., 6(13): 334-353, 2012
343
Fig. 11: N-S simplified Structure cross section (A – A`)
Fig. 12: NW-SE simplified Structure cross section (B – B)` 3.5. Source Rocks Evaluation: 3.5.1. Organic Richness and Hydrocarbon Potentiality:
The organic richness and potential of a rock sample is evaluated by measuring the amount of total organic carbon “TOC” in the whole rock and pyrolysis derived “S2” of the rock samples (Waples, 1985). Peters (1986) reported that samples which contain TOC less than 0.5 wt % and S2 less than 2.5 mg/g are considered poor source rocks .Samples contain from 0.5 to 1.0 wt % TOC and S2 from 2.5 to 5 mg/g are fair source rocks .Meanwhile, those containing TOC from 1-2 wt % and S2 from 5-10 mg/g are good source rocks and samples that contain more than 2 wt% TOC and S2 >10 mg/g are considered very good source rocks. 3.5.1.1 Cretaceous Source Rocks:
All the analyzed samples of the Cretaceous source rocks (Nubia “A”, Raha and Wata formations, Table 1) shows that the organic richness is variegated mainly from fair to good source rocks. The Nubia “A” Formation
Aust. J. Basic & Appl. Sci., 6(13): 334-353, 2012
344
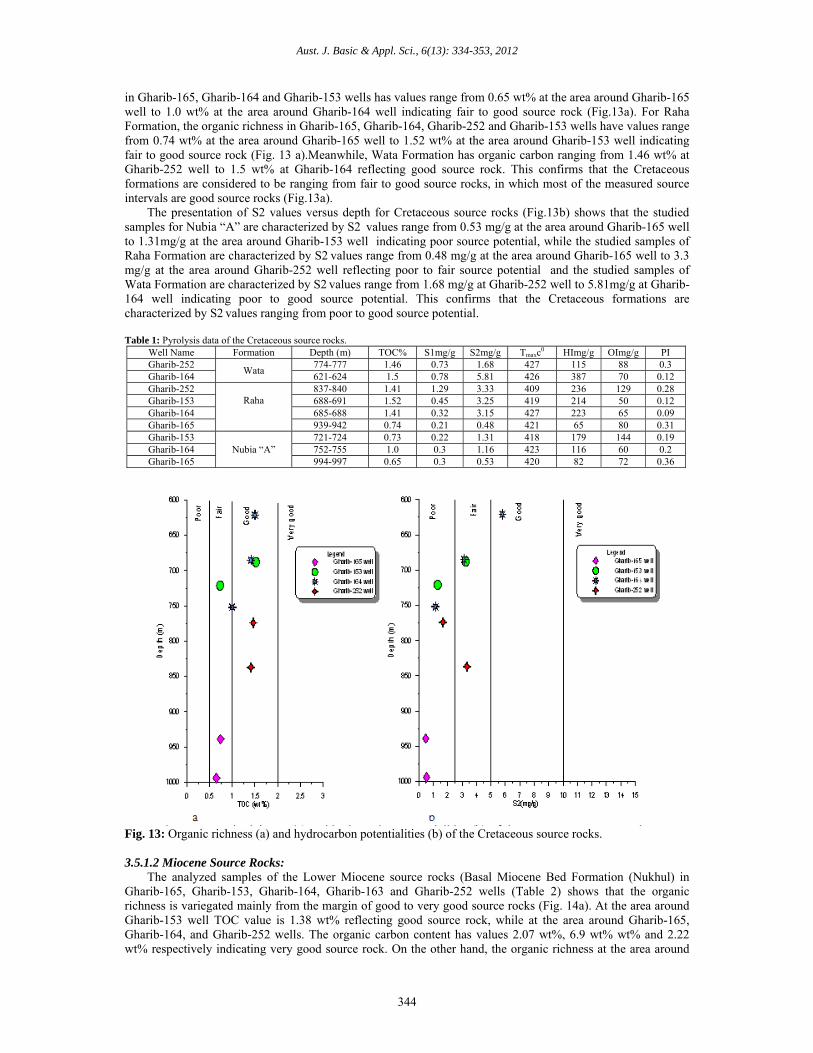
in Gharib-165, Gharib-164 and Gharib-153 wells has values range from 0.65 wt% at the area around Gharib-165 well to 1.0 wt% at the area around Gharib-164 well indicating fair to good source rock (Fig.13a). For Raha Formation, the organic richness in Gharib-165, Gharib-164, Gharib-252 and Gharib-153 wells have values range from 0.74 wt% at the area around Gharib-165 well to 1.52 wt% at the area around Gharib-153 well indicating fair to good source rock (Fig. 13 a).Meanwhile, Wata Formation has organic carbon ranging from 1.46 wt% at Gharib-252 well to 1.5 wt% at Gharib-164 reflecting good source rock. This confirms that the Cretaceous formations are considered to be ranging from fair to good source rocks, in which most of the measured source intervals are good source rocks (Fig.13a).
The presentation of S2 values versus depth for Cretaceous source rocks (Fig.13b) shows that the studied samples for Nubia “A” are characterized by S2 values range from 0.53 mg/g at the area around Gharib-165 well to 1.31mg/g at the area around Gharib-153 well indicating poor source potential, while the studied samples of Raha Formation are characterized by S2 values range from 0.48 mg/g at the area around Gharib-165 well to 3.3 mg/g at the area around Gharib-252 well reflecting poor to fair source potential and the studied samples of Wata Formation are characterized by S2 values range from 1.68 mg/g at Gharib-252 well to 5.81mg/g at Gharib-164 well indicating poor to good source potential. This confirms that the Cretaceous formations are characterized by S2 values ranging from poor to good source potential. Table 1: Pyrolysis data of the Cretaceous source rocks.
Well Name Formation Depth (m) TOC% S1mg/g S2mg/g Tmaxc0 HImg/g OImg/g PI
Gharib-252 Wata
774-777 1.46 0.73 1.68 427 115 88 0.3 Gharib-164 621-624 1.5 0.78 5.81 426 387 70 0.12 Gharib-252
Raha
837-840 1.41 1.29 3.33 409 236 129 0.28 Gharib-153 688-691 1.52 0.45 3.25 419 214 50 0.12 Gharib-164 685-688 1.41 0.32 3.15 427 223 65 0.09 Gharib-165 939-942 0.74 0.21 0.48 421 65 80 0.31 Gharib-153
Nubia “A” 721-724 0.73 0.22 1.31 418 179 144 0.19
Gharib-164 752-755 1.0 0.3 1.16 423 116 60 0.2 Gharib-165 994-997 0.65 0.3 0.53 420 82 72 0.36
Fig. 13: Organic richness (a) and hydrocarbon potentialities (b) of the Cretaceous source rocks. 3.5.1.2 Miocene Source Rocks:
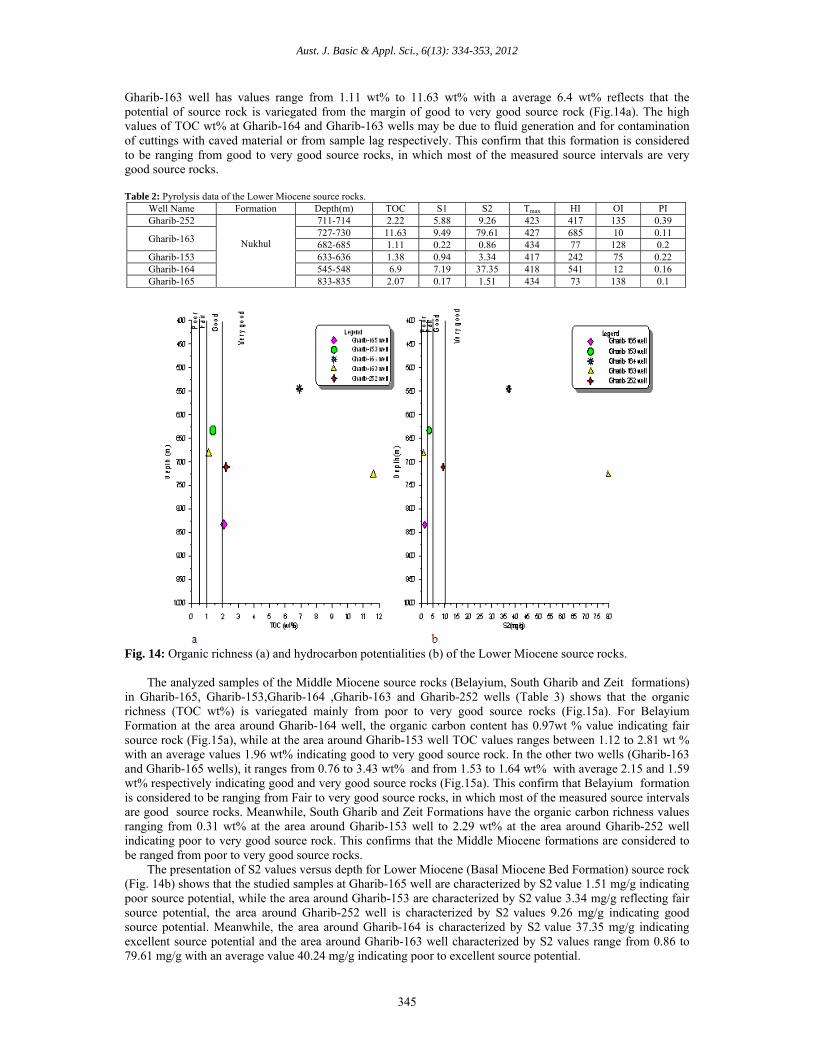
The analyzed samples of the Lower Miocene source rocks (Basal Miocene Bed Formation (Nukhul) in Gharib-165, Gharib-153, Gharib-164, Gharib-163 and Gharib-252 wells (Table 2) shows that the organic richness is variegated mainly from the margin of good to very good source rocks (Fig. 14a). At the area around Gharib-153 well TOC value is 1.38 wt% reflecting good source rock, while at the area around Gharib-165, Gharib-164, and Gharib-252 wells. The organic carbon content has values 2.07 wt%, 6.9 wt% wt% and 2.22 wt% respectively indicating very good source rock. On the other hand, the organic richness at the area around
Aust. J. Basic & Appl. Sci., 6(13): 334-353, 2012
345
Gharib-163 well has values range from 1.11 wt% to 11.63 wt% with a average 6.4 wt% reflects that the potential of source rock is variegated from the margin of good to very good source rock (Fig.14a). The high values of TOC wt% at Gharib-164 and Gharib-163 wells may be due to fluid generation and for contamination of cuttings with caved material or from sample lag respectively. This confirm that this formation is considered to be ranging from good to very good source rocks, in which most of the measured source intervals are very good source rocks.
Table 2: Pyrolysis data of the Lower Miocene source rocks.
Well Name Formation Depth(m) TOC S1 S2 Tmax HI OI PI Gharib-252
Nukhul
711-714 2.22 5.88 9.26 423 417 135 0.39
Gharib-163 727-730 11.63 9.49 79.61 427 685 10 0.11 682-685 1.11 0.22 0.86 434 77 128 0.2
Gharib-153 633-636 1.38 0.94 3.34 417 242 75 0.22 Gharib-164 545-548 6.9 7.19 37.35 418 541 12 0.16 Gharib-165 833-835 2.07 0.17 1.51 434 73 138 0.1
Fig. 14: Organic richness (a) and hydrocarbon potentialities (b) of the Lower Miocene source rocks.
The analyzed samples of the Middle Miocene source rocks (Belayium, South Gharib and Zeit formations)
in Gharib-165, Gharib-153,Gharib-164 ,Gharib-163 and Gharib-252 wells (Table 3) shows that the organic richness (TOC wt%) is variegated mainly from poor to very good source rocks (Fig.15a). For Belayium Formation at the area around Gharib-164 well, the organic carbon content has 0.97wt % value indicating fair source rock (Fig.15a), while at the area around Gharib-153 well TOC values ranges between 1.12 to 2.81 wt % with an average values 1.96 wt% indicating good to very good source rock. In the other two wells (Gharib-163 and Gharib-165 wells), it ranges from 0.76 to 3.43 wt% and from 1.53 to 1.64 wt% with average 2.15 and 1.59 wt% respectively indicating good and very good source rocks (Fig.15a). This confirm that Belayium formation is considered to be ranging from Fair to very good source rocks, in which most of the measured source intervals are good source rocks. Meanwhile, South Gharib and Zeit Formations have the organic carbon richness values ranging from 0.31 wt% at the area around Gharib-153 well to 2.29 wt% at the area around Gharib-252 well indicating poor to very good source rock. This confirms that the Middle Miocene formations are considered to be ranged from poor to very good source rocks.
The presentation of S2 values versus depth for Lower Miocene (Basal Miocene Bed Formation) source rock (Fig. 14b) shows that the studied samples at Gharib-165 well are characterized by S2 value 1.51 mg/g indicating poor source potential, while the area around Gharib-153 are characterized by S2 value 3.34 mg/g reflecting fair source potential, the area around Gharib-252 well is characterized by S2 values 9.26 mg/g indicating good source potential. Meanwhile, the area around Gharib-164 is characterized by S2 value 37.35 mg/g indicating excellent source potential and the area around Gharib-163 well characterized by S2 values range from 0.86 to 79.61 mg/g with an average value 40.24 mg/g indicating poor to excellent source potential.
Aust. J. Basic & Appl. Sci., 6(13): 334-353, 2012
346
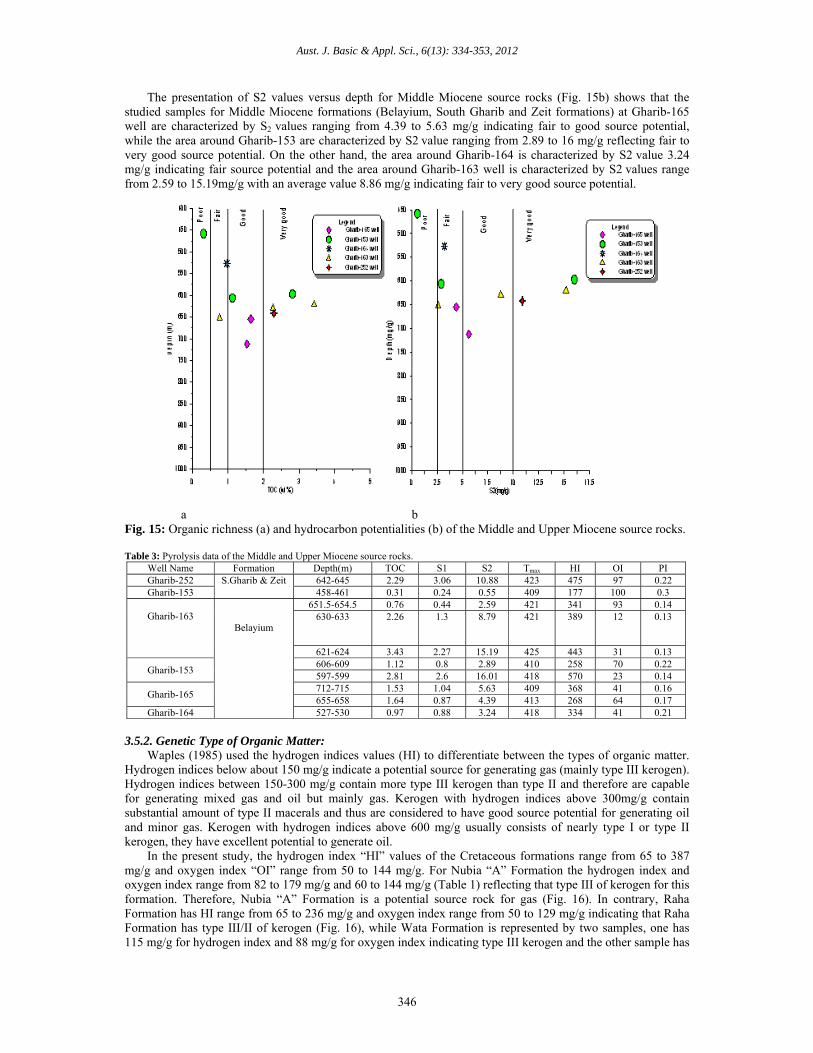
The presentation of S2 values versus depth for Middle Miocene source rocks (Fig. 15b) shows that the studied samples for Middle Miocene formations (Belayium, South Gharib and Zeit formations) at Gharib-165 well are characterized by S2 values ranging from 4.39 to 5.63 mg/g indicating fair to good source potential, while the area around Gharib-153 are characterized by S2 value ranging from 2.89 to 16 mg/g reflecting fair to very good source potential. On the other hand, the area around Gharib-164 is characterized by S2 value 3.24 mg/g indicating fair source potential and the area around Gharib-163 well is characterized by S2 values range from 2.59 to 15.19mg/g with an average value 8.86 mg/g indicating fair to very good source potential.
a b Fig. 15: Organic richness (a) and hydrocarbon potentialities (b) of the Middle and Upper Miocene source rocks.
Table 3: Pyrolysis data of the Middle and Upper Miocene source rocks.
Well Name Formation Depth(m) TOC S1 S2 Tmax HI OI PI Gharib-252 S.Gharib & Zeit 642-645 2.29 3.06 10.88 423 475 97 0.22 Gharib-153 458-461 0.31 0.24 0.55 409 177 100 0.3
Gharib-163
Belayium
651.5-654.5 0.76 0.44 2.59 421 341 93 0.14 630-633 2.26 1.3 8.79 421 389 12 0.13
621-624 3.43 2.27 15.19 425 443 31 0.13
Gharib-153 606-609 1.12 0.8 2.89 410 258 70 0.22 597-599 2.81 2.6 16.01 418 570 23 0.14
Gharib-165 712-715 1.53 1.04 5.63 409 368 41 0.16 655-658 1.64 0.87 4.39 413 268 64 0.17
Gharib-164 527-530 0.97 0.88 3.24 418 334 41 0.21
3.5.2. Genetic Type of Organic Matter:
Waples (1985) used the hydrogen indices values (HI) to differentiate between the types of organic matter. Hydrogen indices below about 150 mg/g indicate a potential source for generating gas (mainly type III kerogen). Hydrogen indices between 150-300 mg/g contain more type III kerogen than type II and therefore are capable for generating mixed gas and oil but mainly gas. Kerogen with hydrogen indices above 300mg/g contain substantial amount of type II macerals and thus are considered to have good source potential for generating oil and minor gas. Kerogen with hydrogen indices above 600 mg/g usually consists of nearly type I or type II kerogen, they have excellent potential to generate oil.
In the present study, the hydrogen index “HI” values of the Cretaceous formations range from 65 to 387 mg/g and oxygen index “OI” range from 50 to 144 mg/g. For Nubia “A” Formation the hydrogen index and oxygen index range from 82 to 179 mg/g and 60 to 144 mg/g (Table 1) reflecting that type III of kerogen for this formation. Therefore, Nubia “A” Formation is a potential source rock for gas (Fig. 16). In contrary, Raha Formation has HI range from 65 to 236 mg/g and oxygen index range from 50 to 129 mg/g indicating that Raha Formation has type III/II of kerogen (Fig. 16), while Wata Formation is represented by two samples, one has 115 mg/g for hydrogen index and 88 mg/g for oxygen index indicating type III kerogen and the other sample has
Aust. J. Basic & Appl. Sci., 6(13): 334-353, 2012
347
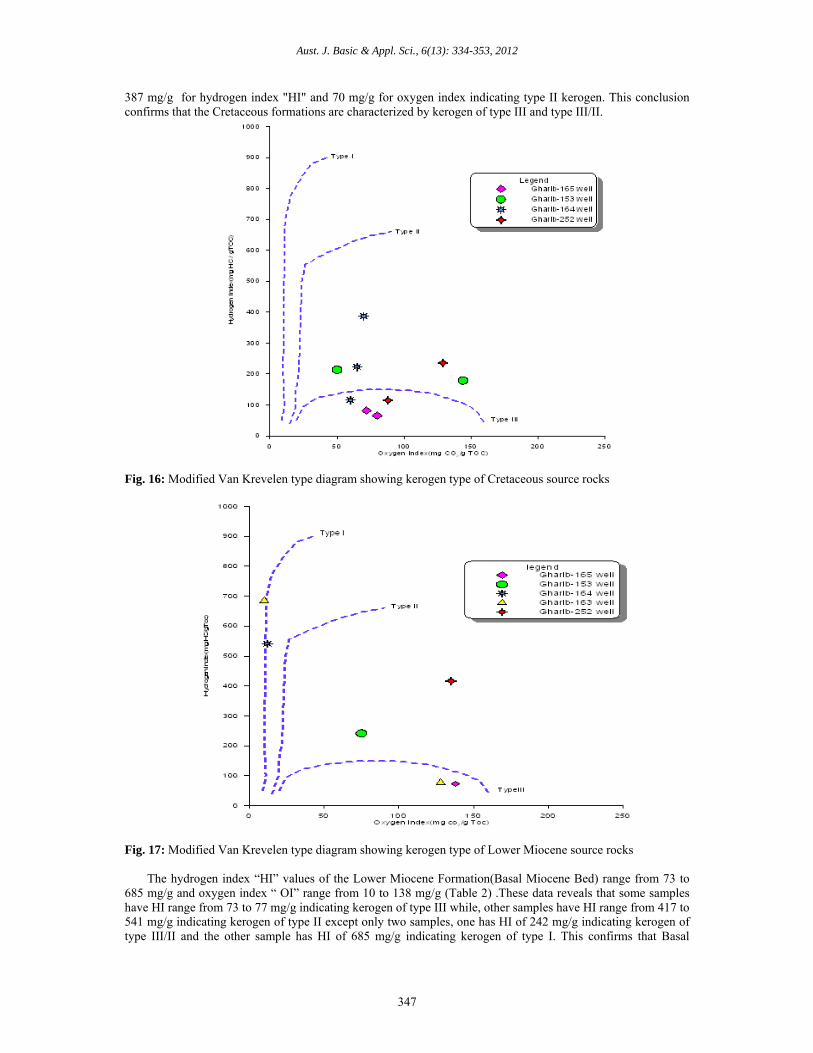
387 mg/g for hydrogen index "HI" and 70 mg/g for oxygen index indicating type II kerogen. This conclusion confirms that the Cretaceous formations are characterized by kerogen of type III and type III/II.
Fig. 16: Modified Van Krevelen type diagram showing kerogen type of Cretaceous source rocks
Fig. 17: Modified Van Krevelen type diagram showing kerogen type of Lower Miocene source rocks The hydrogen index “HI” values of the Lower Miocene Formation(Basal Miocene Bed) range from 73 to
685 mg/g and oxygen index “ OI” range from 10 to 138 mg/g (Table 2) .These data reveals that some samples have HI range from 73 to 77 mg/g indicating kerogen of type III while, other samples have HI range from 417 to 541 mg/g indicating kerogen of type II except only two samples, one has HI of 242 mg/g indicating kerogen of type III/II and the other sample has HI of 685 mg/g indicating kerogen of type I. This confirms that Basal
Aust. J. Basic & Appl. Sci., 6(13): 334-353, 2012
348
Miocene Bed Formation has Kerogen ranges between type III and type II. Thus, Basal Miocene Bed Formation is considered a good source potential for generating oil and minor gas (Fig. 17).
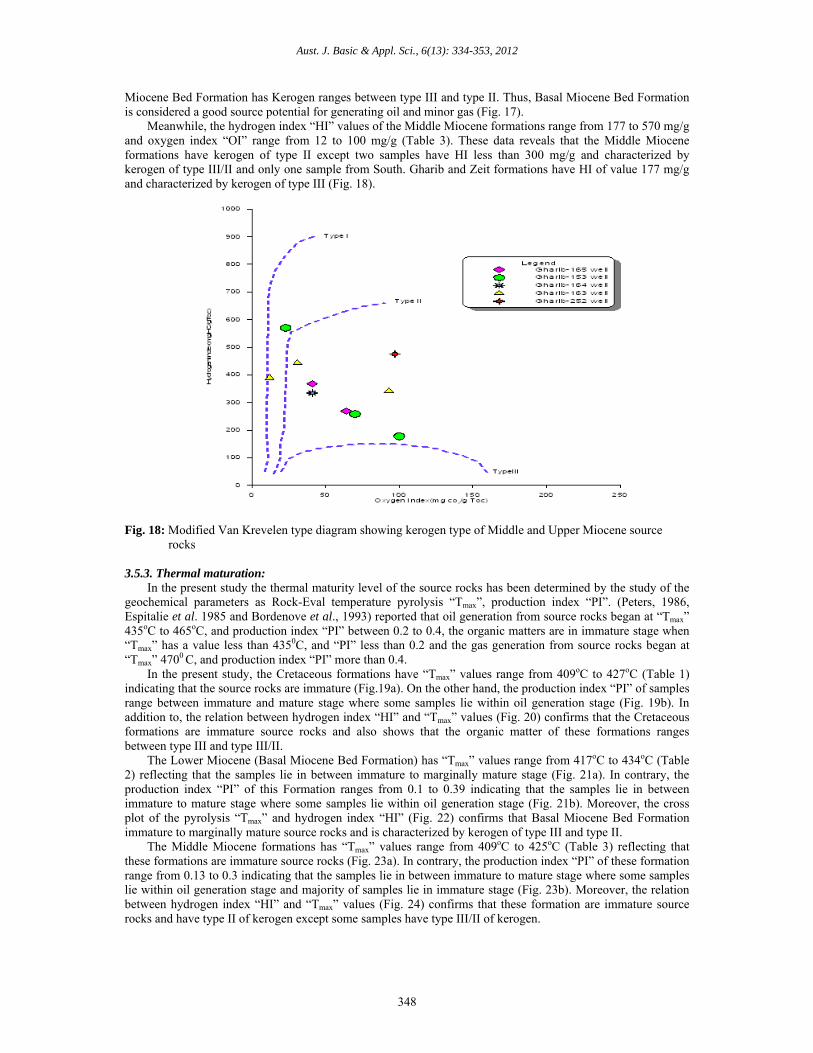
Meanwhile, the hydrogen index “HI” values of the Middle Miocene formations range from 177 to 570 mg/g and oxygen index “OI” range from 12 to 100 mg/g (Table 3). These data reveals that the Middle Miocene formations have kerogen of type II except two samples have HI less than 300 mg/g and characterized by kerogen of type III/II and only one sample from South. Gharib and Zeit formations have HI of value 177 mg/g and characterized by kerogen of type III (Fig. 18).
Fig. 18: Modified Van Krevelen type diagram showing kerogen type of Middle and Upper Miocene source rocks 3.5.3. Thermal maturation:
In the present study the thermal maturity level of the source rocks has been determined by the study of the geochemical parameters as Rock-Eval temperature pyrolysis “Tmax”, production index “PI”. (Peters, 1986, Espitalie et al. 1985 and Bordenove et al., 1993) reported that oil generation from source rocks began at “Tmax” 435oC to 465oC, and production index “PI” between 0.2 to 0.4, the organic matters are in immature stage when “Tmax” has a value less than 4350C, and “PI” less than 0.2 and the gas generation from source rocks began at “Tmax” 4700 C, and production index “PI” more than 0.4.
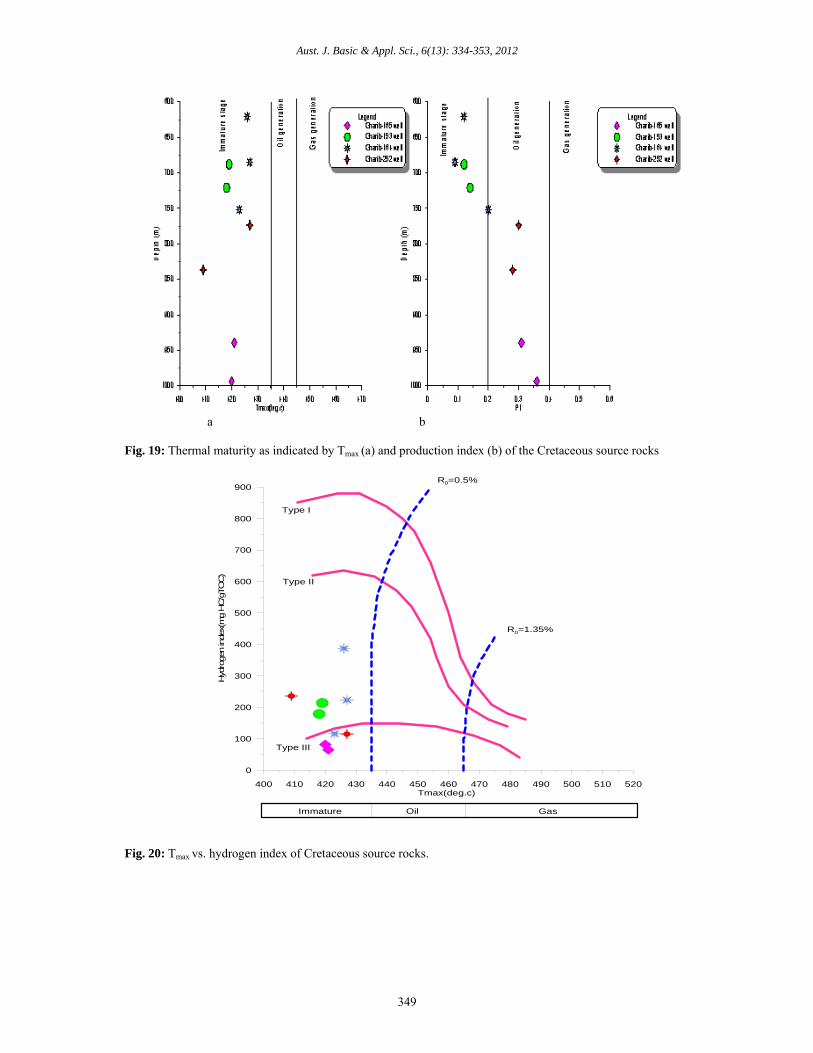
In the present study, the Cretaceous formations have “Tmax” values range from 409oC to 427oC (Table 1) indicating that the source rocks are immature (Fig.19a). On the other hand, the production index “PI” of samples range between immature and mature stage where some samples lie within oil generation stage (Fig. 19b). In addition to, the relation between hydrogen index “HI” and “Tmax” values (Fig. 20) confirms that the Cretaceous formations are immature source rocks and also shows that the organic matter of these formations ranges between type III and type III/II.
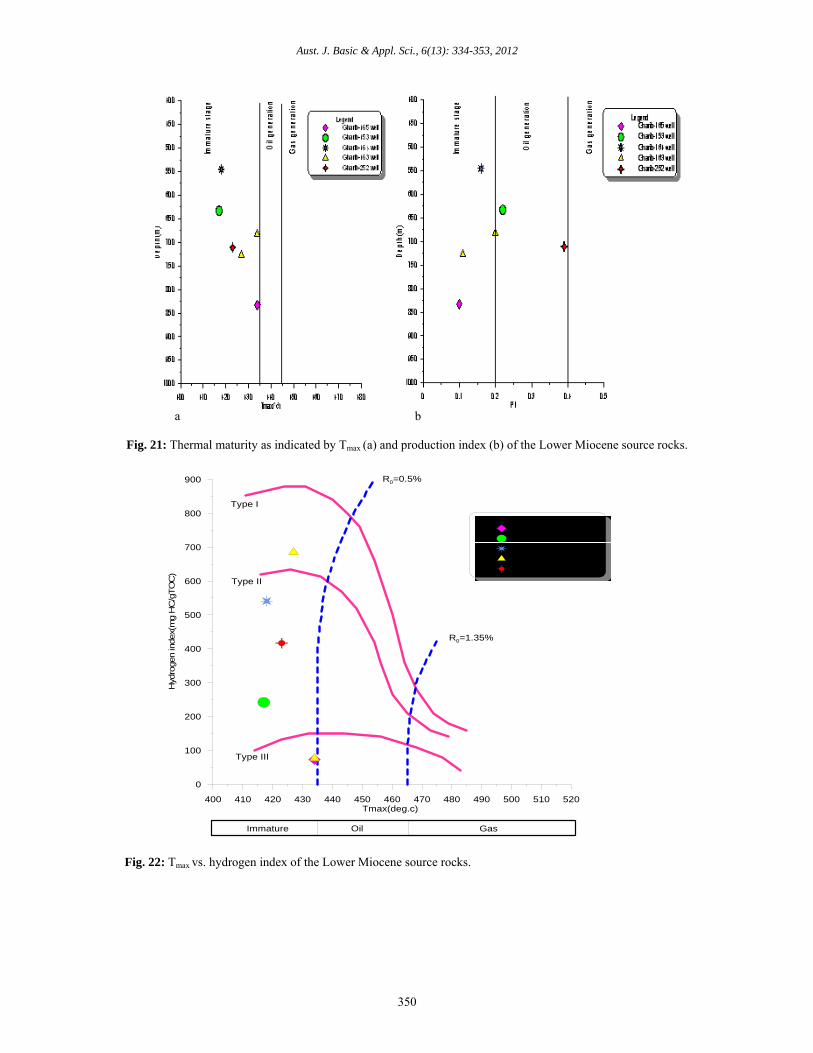
The Lower Miocene (Basal Miocene Bed Formation) has “Tmax” values range from 417oC to 434oC (Table 2) reflecting that the samples lie in between immature to marginally mature stage (Fig. 21a). In contrary, the production index “PI” of this Formation ranges from 0.1 to 0.39 indicating that the samples lie in between immature to mature stage where some samples lie within oil generation stage (Fig. 21b). Moreover, the cross plot of the pyrolysis “Tmax” and hydrogen index “HI” (Fig. 22) confirms that Basal Miocene Bed Formation immature to marginally mature source rocks and is characterized by kerogen of type III and type II.
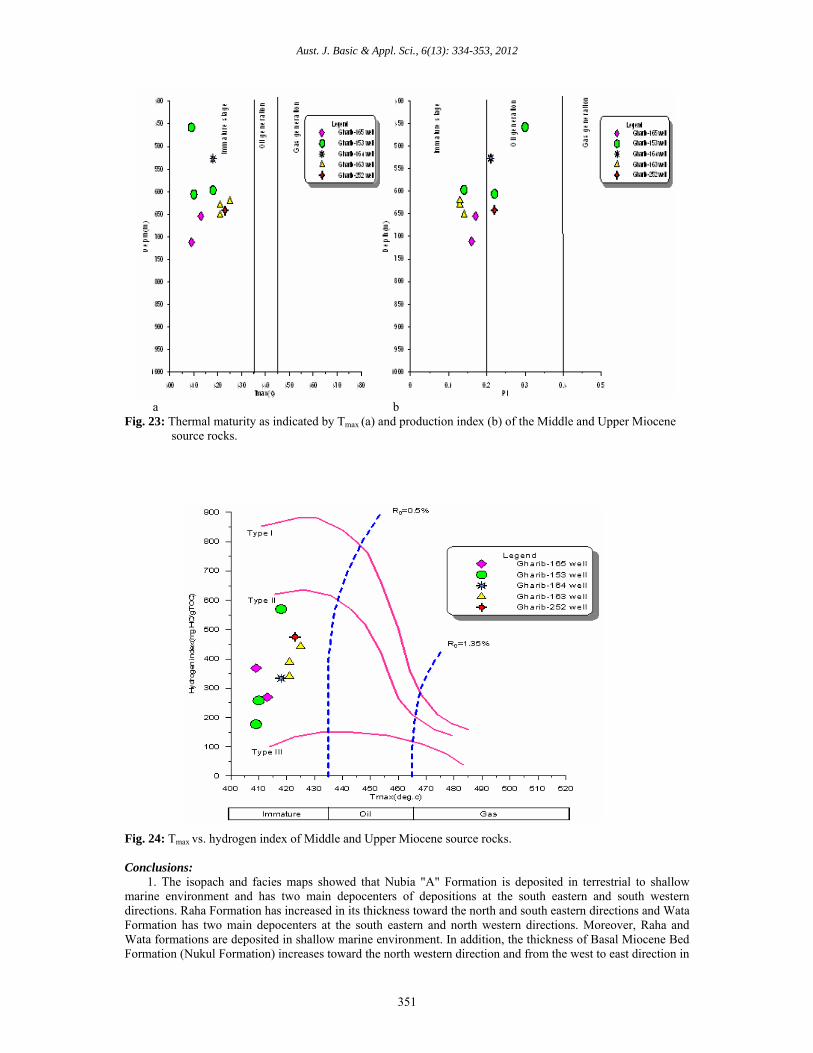
The Middle Miocene formations has “Tmax” values range from 409oC to 425oC (Table 3) reflecting that these formations are immature source rocks (Fig. 23a). In contrary, the production index “PI” of these formation range from 0.13 to 0.3 indicating that the samples lie in between immature to mature stage where some samples lie within oil generation stage and majority of samples lie in immature stage (Fig. 23b). Moreover, the relation between hydrogen index “HI” and “Tmax” values (Fig. 24) confirms that these formation are immature source rocks and have type II of kerogen except some samples have type III/II of kerogen.
Aust. J. Basic & Appl. Sci., 6(13): 334-353, 2012
349
400 410 420 430 440 450 460 470 480 490 500 510 520Tmax(deg.c)
0
100
200
300
400
500
600
700
800
900
Hyd
rogen in
dex(
mg H
C/g
TO
C)
Type I
Type II
Type III
R0=0.5%
R0=1.35%
Immature Oil Gas
a b Fig. 19: Thermal maturity as indicated by Tmax (a) and production index (b) of the Cretaceous source rocks
Fig. 20: Tmax vs. hydrogen index of Cretaceous source rocks.
Aust. J. Basic & Appl. Sci., 6(13): 334-353, 2012
350
400 410 420 430 440 450 460 470 480 490 500 510 520Tmax(deg.c)
0
100
200
300
400
500
600
700
800
900
Hyd
roge
n in
dex(
mg
HC
/gTO
C)
LegendGharib-165 well
Gharib-153 well
Gharib-164 well
Gharib-163 well
Gharib-252 well
Type I
Type II
Type III
R0=0.5%
R0=1.35%
Immature Oil Gas
a b
Fig. 21: Thermal maturity as indicated by Tmax (a) and production index (b) of the Lower Miocene source rocks.
Fig. 22: Tmax vs. hydrogen index of the Lower Miocene source rocks.
Aust. J. Basic & Appl. Sci., 6(13): 334-353, 2012
351
a b Fig. 23: Thermal maturity as indicated by Tmax (a) and production index (b) of the Middle and Upper Miocene source rocks.
Fig. 24: Tmax vs. hydrogen index of Middle and Upper Miocene source rocks.
Conclusions: 1. The isopach and facies maps showed that Nubia "A" Formation is deposited in terrestrial to shallow
marine environment and has two main depocenters of depositions at the south eastern and south western directions. Raha Formation has increased in its thickness toward the north and south eastern directions and Wata Formation has two main depocenters at the south eastern and north western directions. Moreover, Raha and Wata formations are deposited in shallow marine environment. In addition, the thickness of Basal Miocene Bed Formation (Nukul Formation) increases toward the north western direction and from the west to east direction in
Aust. J. Basic & Appl. Sci., 6(13): 334-353, 2012
352
Belaiym Formation. The Basal Miocene Bed Formation is deposited in shallow marine environment. Meanwhile, Belayium Formation is deposited in deep marine environment. In contrary, the South Gharib and Zeit formations were characterized by lagoonal facies and have one main depocenter of deposition.
2. The lithostratigraphic cross sections revealed that the Paleozoic (Nubia "D") and some Cretaceous rock units (Nubia "A "and Wata formations) are not easy to correlate due to missing of some formations in studied wells .While; the Miocene rock units are well correlated.
3. The structural cross sections reflected that the study area is affected by several normal faults forming a horst, graben and step like structures. These normal faults form several structural traps which is suitable for accumulation of oil and gas
4. The geochemical data reflected that the Cretaceous formations are immature source rocks and have fair to good organic richness with kerogen of type III and type III/II. However, Lower Miocene source rocks were ranging from immature to marginally mature source rocks and have good to very good source rocks with kerogen of type III and type II. Meanwhile, the Middle Miocene source rocks are immature source rocks and have good organic richness with kerogen of type III/II.
ACKNOWLEDGMENTS
The authors are deeply grateful to the authority of the Egyptian General Petroleum Corporation EGPC) for
providing composite logs and rock samples for the completion of this wok.
REFERENCES Abd El-Gawad, E., A. Alsharhan and O. Mahrous, 2007. Geochemical Characterization of Source Rocks
and Crude Oils in the Southern Gulf of Suez, Egypt. AAPG European Region Conference, Athens, Greece; AAPG Search and Discovery Article 90072, Egypt, Egyptian journal of aquatic research, pp: 1687-4285.
Abu Shagar, S., 2006. Source rock evaluation of some intervals in the Gulf of Suez area, Egypt. Egyptian Journal of Aquatic Research, 32(1): 70-87.
Abu-bakr, F.M., S.M. Ahmad and I.M. Nadia, 2010. Source Rock and Paleoenvironmental Evaluation of Some Pre-rift Rock Units at the Central Part of the Gulf of Suez, Egypt: Journal of Applied Sciences Research, 6(5): 511-528.
Al-sharhan, A.S., 2003. Petroleum geology and potential hydrocarbon plays in the Gulf of Suez rift basin, Egypt: AAPG Bulletin., 87(1): 143-180.
Al-Sharhan, A.S. and M.G. Salah, 1995. Geology and hydrocarbon habitat in the rift setting: northern and central Gulf of Suez, Egypt. Bull. Canad. Pet. Geol., 43: 156-176.
Al-Sharhan, A.S. and M.G. Salah, 1994. Geology and hydrocarbon habitat in a rift setting: southern Gulf of Suez, Egypt. Bull. Canadian Petrol. Geol., 42(3): 312-331.
Atef, A., 1988. Source rock evaluation of brown limestone formation of Upper Cretaceous in the Gulf of Suez, Egypt .9th EGPC. Explor. Confer., pp: 256-274.
Barakat, H., 1982. Geochemical criteria for source rock, Gulf of Suez: 6th Egyptian General Petroleum Corporation, Petroleum Exploration and Production Conference., 1: 224-251.
Bordenove, M.L., J. Espitalie, P. Leplat, J.L. Oudin and M. Vandenbrouke, 1993. Screening techniques for source rock evaluation. In: Bardenove (ed.), Applied Petrol. Geochem., Paris Editions Technip., pp: 217-278.
EGPC (Egyptian General Petroleum Corporation), 1996. Gulf of Suez oil fields (A comprehensive Overview). EGPC, Cairo, pp: 387.
El Nady, M.M., 2006. The hydrocarbon potential of Miocene source rocks for oil generation in the South Gulf of Suez, Egypt. Petroleum Science and Technology, 24(5): 539-561.
El Nady, M.M., 2011. The Advantage of Rock-Eval pyrolysis, LG and GC/MS in characterizing organic matter: Case Study of El-Khaligue-4 Well, Central Gulf of Suez, Egypt. Accepted in J. Energy sources Part "A".
El Srogy, S.A., I.H. Helal, E.I. Amer and H.A. Mohamed, 2002. Hydrocarbon generation, expulsion and migration in the Geisum and Tawila oil fields- Southern Gulf of Suez. Inter. Petrol. Confer. and Exhibit. 1, 5 (abstract).
Espitalie, J., G. Deroo and F. Marquis, 1985. Rock–Eval pyrolysis and its application. Inst. Fr. Pet. Preprint 33578, 72.
Fatehy, M.A., I.E. Mohamad and M.A. Zakaria, 2010. Hydrocarbon potentiality of some Miocene rock units in the central part of the Gulf of Suez, Egypt: International Journal of Academic research, 2(2): 235-248.
Hanter, G., 1976. Reversed isopaching of Zeit and South Gharib formations, EGPC, 5th Expl. Seminar, Cairo.
Krumbein, W.C. and L.L. Sloss, 1963. Stratigraphy and sedimentation, 2nd Ed., San Francisco, California, Freeman, pp: 660.
Aust. J. Basic & Appl. Sci., 6(13): 334-353, 2012
353
Metwalli, M.H., G. Philip and E. Yousif, 1981. El Morgan oil field crude oil and cycles of oil generation, migration and accumulation the Gulf of Suez petroleum provenance, A. R. Egypt: Acta Geologica Academiae Scientiarum Hungaricae., 24(2-4): 368-387.
Peters, K.E., 1986. Guidelines for evaluating petroleum source using programmed pyrolysis. AAPG Bull., 70: 318-329.
Said, R., 1990. The Geology of Egypt. A. A. Balkeme , Rotterdam, Brook field, pp: 727. Schlumberger, 1995. Well evaluation conference, Egypt: Paris, France, pp: 87. Shahin, A.N., 1988. Oil window in the Gulf of Suez basin, Egypt. AAPG Bull, 72: 1024-1025. Shahin, A.N. and M.M. Shehab, 1984. Petroleum generation, migration and occurrence in the Gulf of Suez
offshore of South Sinai. Proceedings of the 7th petroleum exploration seminar, pp: 126-151. EGPC, Cairo.
Waples, D.W., 1985. Geochemistry in Petroleum exploration: Boston, international Human Resources and Development Co., pp: 232.
Younes, M.A., 2001. Application of biomarkers and stable carbon isotopic composition to assess the depositional environment of source rocks and the maturation of crude oils from East S. Gharib & Zeit Field, southern Gulf of Suez, Egypt. J. Petrol. Science and Technology, 19(9&10): 1039-1061.


