Embed Size (px)
Citation preview
DETERMINATION OF ACCEPTANCE CRITERIA FOR PRESTRESSING STRAND IN
PRE-TENSIONED APPLICATIONS
by
THOMAIDA POLYDOROU
B.S., Kansas State University, 2009
M.S., Kansas State University, 2011
AN ABSTRACT OF A DISSERTATION
submitted in partial fulfillment of the requirements for the degree
DOCTOR OF PHILOSOPHY
Department of Civil Engineering
College of Engineering
KANSAS STATE UNIVERSITY
Manhattan, Kansas
2014

Abstract
ASTM recently adopted the Standard Test Method for Evaluating Bond of Seven-Wire
Steel Prestressing Strand as ASTM A1081, a pull-out test procedure developed for verifying the
ability of steel strands to bond to cementitious materials prior to their use as tensile
reinforcement in prestressed concrete sections. The required by ASTM International precision
and bias statement has not been developed for this test method. In addition, a minimum threshold
value that will ensure only adequately bonding strand sources will be accepted has not yet been
applied to ASTM A1081. The test method was developed after findings that prestressing steel
strand sources of identical type and grade vary significantly as far as their bonding capacity.
Bond is a crucial aspect of the prestressing force being transferred into the concrete, and
insufficient bonding action can result in the prestressed concrete section lacking in capacity to
sustain the loads that it was designed for. After an initial survey of the pull-out strength of North
American Strand in mortar, three strands of differing pull-out strengths were selected for
inclusion in further testing. A precision and bias statement for ASTM A1081 was developed by
first performing ruggedness testing to determine how the results are affected by allowable
variations in methods and materials, and followed by an inter-laboratory study to determine the
reproducibility of the test method. Once the precision and bias statement for the standard test
method was developed, the same strand sources were tested for their performance in concrete
beams. Statistical analysis of the flexural beam testing data and correlation with the prestressing
strand sources’ ASTM A1081 test results was performed, and the industry was provided with
minimum acceptance criteria for prestressing strand tested by ASTM A1081, along with
recommendations regarding the standard test method and aspects of prestressed concrete design.

DETERMINATION OF ACCEPTANCE CRITERIA FOR PRESTRESSING STRAND IN
PRE-TENSIONED APPLICATIONS
by
THOMAIDA POLYDOROU
B.S., Kansas State University, 2009
M.S., Kansas State University, 2011
A DISSERTATION
submitted in partial fulfillment of the requirements for the degree
DOCTOR OF PHILOSOPHY
Department of Civil Engineering
College of Engineering
KANSAS STATE UNIVERSITY
Manhattan, Kansas
2014
Approved by:
Major Professor
Kyle A. Riding

Copyright
THOMAIDA POLYDOROU
2014

Abstract
ASTM recently adopted the Standard Test Method for Evaluating Bond of Seven-Wire
Steel Prestressing Strand as ASTM A1081, a pull-out test procedure developed for verifying the
ability of steel strands to bond to cementitious materials prior to their use as tensile
reinforcement in prestressed concrete sections. The required by ASTM International precision
and bias statement has not been developed for this test method. In addition, a minimum threshold
value that will ensure only adequately bonding strand sources will be accepted has not yet been
applied to ASTM A1081. The test method was developed after findings that prestressing steel
strand sources of identical type and grade vary significantly as far as their bonding capacity.
Bond is a crucial aspect of the prestressing force being transferred into the concrete, and
insufficient bonding action can result in the prestressed concrete section lacking in capacity to
sustain the loads that it was designed for. After an initial survey of the pull-out strength of North
American Strand in mortar, three strands of differing pull-out strengths were selected for
inclusion in further testing. A precision and bias statement for ASTM A1081 was developed by
first performing ruggedness testing to determine how the results are affected by allowable
variations in methods and materials, and followed by an inter-laboratory study to determine the
reproducibility of the test method. Once the precision and bias statement for the standard test
method was developed, the same strand sources were tested for their performance in concrete
beams. Statistical analysis of the flexural beam testing data and correlation with the prestressing
strand sources’ ASTM A1081 test results was performed, and the industry was provided with
minimum acceptance criteria for prestressing strand tested by ASTM A1081, along with
recommendations regarding the standard test method and aspects of prestressed concrete design.

vi
Table of Contents
List of Figures ................................................................................................................................. x
List of Tables ............................................................................................................................... xix
Acknowledgements ..................................................................................................................... xxii
Dedication .................................................................................................................................. xxiv
Chapter 1 - Introduction .................................................................................................................. 1
1.1 Background ........................................................................................................................... 1
1.2 Problem Statement ................................................................................................................ 1
1.3 Project Objectives ................................................................................................................. 2
1.4 Thesis Organization .............................................................................................................. 2
Chapter 2 - Literature Review ......................................................................................................... 4
2.1 Introduction to Prestressing .................................................................................................. 4
2.2 History of Prestressing .......................................................................................................... 5
2.3 Strand Manufacturing ........................................................................................................... 7
2.4 Transfer/Development Length Equations ........................................................................... 11
2.5 Strand Testing ..................................................................................................................... 31
Chapter 3 - Material Selection ...................................................................................................... 43
3.1 Initial Strand Selection ........................................................................................................ 43
3.2 Mortar Mixture Design Procedure ...................................................................................... 45
Chapter 4 - Ruggedness Testing ................................................................................................... 50
4.1 Investigation of Factors Affecting the Test ........................................................................ 50
4.1.1 Sand .............................................................................................................................. 50
4.1.2 Cement ......................................................................................................................... 50
4.1.3 Central Wire Slip during Test ...................................................................................... 53
4.2 ASTM Ruggedness ............................................................................................................. 54
4.2.1 Ruggedness Testing Introduction................................................................................. 54
4.2.2 Ruggedness Testing Materials ..................................................................................... 54
4.2.3 Ruggedness Testing Methodology ............................................................................... 56
4.2.4 Ruggedness Testing Results ........................................................................................ 59

vii
4.2.5 Ruggedness Testing Conclusion .................................................................................. 63
Chapter 5 - Inter-Laboratory Study............................................................................................... 65
5.1 Inter-Laboratory Study Introduction ................................................................................... 65
5.2 Inter-Laboratory Study Materials ....................................................................................... 65
5.3 Inter-Laboratory Study Methodology ................................................................................. 68
5.4 Inter-Laboratory Study Results ........................................................................................... 69
5.5 Inter-Laboratory Study Conclusions ................................................................................... 76
Chapter 6 - Strand Testing by NCHRP 621 .................................................................................. 77
6.1 Weight Loss on Ignition (QC-I) .......................................................................................... 77
6.2 Contact Angle Measurement after Lime Dip (QC-I) .......................................................... 78
6.3 Change in Corrosion Potential (QC-I) ................................................................................ 79
6.4 Organic Residue Extraction with FTIR Analysis (QC-II) .................................................. 80
Chapter 7 - Discussion of ASTM A1081 ...................................................................................... 83
7.1 Summary of Factors that Affected the Test ........................................................................ 83
7.2 Summary of Precision and Bias Statement for ASTM A1081 ........................................... 84
7.3 Strand Pullout Test Values to Consider in Phase II ............................................................ 85
Chapter 8 - Sensitivity Analysis ................................................................................................... 86
8.1 Analysis Using Bentley Software Leap Presto and Microsoft Excel ................................. 86
8.1.1 Sections Analyzed ........................................................................................................ 86
8.1.2 Conditions Analyzed .................................................................................................... 88
8.2 Sensitivity Analysis Results................................................................................................ 88
8.3 Sensitivity Analysis Conclusions and Recommendations .................................................. 96
Chapter 9 - Rectangular Beam Specimens at Stresscon ............................................................... 97
9.1 Introduction ......................................................................................................................... 97
9.2 Beam Specimen Design and Fabrication ............................................................................ 97
9.2.1 Rectangular Beam Specimen Design ........................................................................... 97
9.2.1.1 Beam Dimensions and Strand Location ................................................................ 97
9.2.1.2 Shear Reinforcement Details ................................................................................ 98
9.2.2 Concrete Mixture Design Specifications ..................................................................... 99
9.2.3 Beam Fabrication Procedure ...................................................................................... 100
9.2.3.1 Beam Casting Schedule ...................................................................................... 100

viii
9.2.3.2 Crack Formers and Beam Notching .................................................................... 101
9.2.3.3 Concrete Mixture Placement............................................................................... 106
9.2.3.4 Beam Specimen Curing Conditions .................................................................... 108
9.2.4 Transfer Length Measurements ................................................................................. 109
9.2.4.1 Methodology ....................................................................................................... 109
9.2.4.1.1 End Slip Readings ........................................................................................ 110
9.2.4.1.2 Laser Speckle Imaging ................................................................................. 111
9.2.4.2 Instrumentation Setup for Laser Speckle Imaging Device ................................. 113
9.2.4.3 Transfer Length Measurements at Release ......................................................... 114
9.2.4.4 Transfer Length Measurements at Test............................................................... 115
9.2.5 Flexural Beam Testing ............................................................................................... 116
9.2.5.1 Instrumentation Setup and Testing Procedures................................................... 116
9.2.5.2 Beam Loading Procedures .................................................................................. 119
9.2.5.3 Test Results ......................................................................................................... 120
Chapter 10 - Determination of ASTM A1081 Threshold Value ................................................ 124
10.1 Statistical Analysis of Data ............................................................................................. 124
10.2 Transfer Length Measurements ...................................................................................... 124
10.3 Beam Specimen Experimental Moment ......................................................................... 126
10.3.1 Ultimate Tensile Strength of Strand......................................................................... 126
10.4 Threshold Value Determination ...................................................................................... 127
Chapter 11 - Simple Quality Assurance Test for Strand Bond ................................................... 133
11.1 Introduction ..................................................................................................................... 133
11.2 Beam Specimen Design and Fabrication ........................................................................ 134
11.3 Test Methodology ........................................................................................................... 134
11.4 Test Results ..................................................................................................................... 137
11.5 Simple Quality Assurance Test for Strand Bond Conclusions ....................................... 140
Chapter 12 - Conclusions ............................................................................................................ 141
12.1 Summary of Work Done and Conclusions ..................................................................... 141
12.2 Recommendations for Implementation ........................................................................... 143
12.3 Future Research .............................................................................................................. 144
Bibliography ............................................................................................................................... 146

ix
Rectangular Beam Specimens’ Accompanying Concrete Cylinder Split Tensile
Test Results .......................................................................................................................... 150
Rectangular Beam Specimen Transfer Lengths at Time of Prestress Release ..... 152
Rectangular Beam Specimen Transfer Lengths at Time of Flexural Testing ...... 155
Flexural Beam Specimen End Slip Values .......................................................... 158
Rectangular Beam End Actual Dimensions ......................................................... 161
Moment Capacity Calculation Example ............................................................... 164
Flexural Beam Testing Failure Analysis.............................................................. 167
Flexural Beam Test Results Summary Charts ..................................................... 170
Simple Quality Assurance Test for Strand Bond Summary Charts ...................... 289

x
List of Figures
Figure 2.1 Prestressed Concrete Beam ........................................................................................... 4
Figure 2.2 Raw Steel Coils used for Prestressing Strand Manufacturing ....................................... 7
Figure 2.3 Wire Drawing Process during Strand Manufacturing ................................................... 8
Figure 2.4 Cut Wire Die Cross Section (4a) and Top View (4b) ................................................... 9
Figure 2.5 Variation of Steel Stress along Development Length ................................................. 12
Figure 2.6 Adopted and Proposed Transfer Length Expressions by Year .................................... 30
Figure 2.7 Adopted and Proposed Development Length Equations by Year ............................... 31
Figure 3.1 Average Strand Force (lb) vs. Displacement (in) per Strand Source (Polydorou,
Riding, Peterman, & Murray, 2013) ..................................................................................... 44
Figure 3.2 Pullout Force (lb) for 6 Specimens Tested per Strand Source for (Polydorou, Riding,
Peterman, & Murray, 2013) .................................................................................................. 44
Figure 3.3 Interpolation Procedure used to Select w/c for Cement 1 (Riding, Peterman,
Polydorou, & Ren, 2012) ...................................................................................................... 46
Figure 3.4 Interpolation Procedure use to select s/c for Cement 1 (Riding, Peterman, Polydorou,
& Ren, 2012) ......................................................................................................................... 47
Figure 4.1 Initial and Final Setting Times for Cements 1, 2, and 4, determined by ASTM C403 52
Figure 4.2 Specimen Setup (Polydorou, Riding, Peterman, & Murray, 2013) ............................. 56
Figure 4.3 Tensile Testing Frame (Polydorou, Riding, Peterman, & Murray, 2013) ................... 58
Figure 4.4 LVDT Setup on Specimen (Polydorou, Riding, Peterman, & Murray, 2013) ............ 59
Figure 5.1 Inter-Laboratory Study Results, Method A-Strand A (Polydorou, Riding, & Peterman,
2014) ..................................................................................................................................... 72
Figure 5.2 Inter-Laboratory Study Results, Method B- Strand A (Polydorou, Riding, &
Peterman, 2014) .................................................................................................................... 72
Figure 5.3 Inter-Laboratory Study Results, Method A- Strand I (Polydorou, Riding, & Peterman,
2014) ..................................................................................................................................... 73
Figure 5.4 Inter-Laboratory Study Results, Method B- Strand I (Polydorou, Riding, & Peterman,
2014) ..................................................................................................................................... 73
Figure 5.5 Inter-Laboratory Study Results, Method A- Strand G (Polydorou, Riding, &
Peterman, 2014) .................................................................................................................... 74
xi
Figure 5.6 Inter-Laboratory Study Results, Method B- Strand G (Polydorou, Riding, &
Peterman, 2014) .................................................................................................................... 74
Figure 8.1 7T264 Section Details ................................................................................................. 86
Figure 8.2 Highcore 8-1000 Section Details................................................................................. 87
Figure 8.3 Percent of ACI Moment Capacity per Case Analyzed for 7T264 ............................... 89
Figure 8.4 Percent of ACI Shear Capacity per Case Analyzed for 7T264 ................................... 89
Figure 8.5 Percent of ACI Moment Capacity per Case Analyzed for 10DT24 ............................ 90
Figure 8.6 Percent of ACI Shear Capacity per Case Analyzed for 10DT24 ................................ 90
Figure 8.7 Percent of ACI Moment Capacity per Case Analyzed for HC 8-1000 ....................... 91
Figure 8.8 Percent of ACI Shear Capacity per Case Analyzed for HC 8-1000 ............................ 91
Figure 8.9 Percent of ACI Moment Capacity per Case Analyzed for HC 12 ............................... 92
Figure 8.10 Percent of ACI Shear Capacity per Case Analyzed for HC 12 ................................. 92
Figure 8.11 Shear Diagrams for 30 ft. long HC 12 ....................................................................... 94
Figure 8.12 Moment Diagrams for 40ft. long 7T264 ................................................................... 95
Figure 9.1 Beam Section Dimensions ........................................................................................... 97
Figure 9.2 Short End (60% ACI Ld) Loading Configuration........................................................ 98
Figure 9.3 Long End (80% ACI Ld) Loading Configuration ........................................................ 98
Figure 9.4 Welded Wire Fabric Shear Reinforcement .................................................................. 99
Figure 9.5 Concrete Mixing Plant at Stresscon, Inc. .................................................................... 99
Figure 9.6 Beam Casting Setup and Schedule Details ................................................................ 101
Figure 9.7 Crack Inducer Setup .................................................................................................. 102
Figure 9.8 Crack Former ............................................................................................................. 103
Figure 9.9 Saw Cut on Bottom Surface of Beam........................................................................ 103
Figure 9.10 Saw Cut on Bottom and Side Surfaces of Beam ..................................................... 104
Figure 9.11 Saw Cutting of Flexural Beam Sections .................................................................. 108
Figure 9.12 Taking End Slip Readings ....................................................................................... 111
Figure 9.13 Surface Strain Profile .............................................................................................. 113
Figure 9.14 Laser Speckle Imaging Device and Digital Speckle Patterns ................................. 113
Figure 9.15 LSI Device Mounting Instrumentation .................................................................... 114
Figure 9.16 Beam Testing Setup: Loading Setup ....................................................................... 117
Figure 9.17 Beam Testing Setup: Load Cell, Load Point LVDTs, End Slip LVDT .................. 118

xii
Figure 9.18 Beam Testing Setup: Load Application Point on Steel Plate, LVDTs .................... 119
Figure 9.19 Beam Testing Setup: Roller Support Configuration ............................................... 119
Figure 9.20 Moment, Deflection, End Slip Plot for Beam End G9-S ........................................ 120
Figure 10.1 Ultimate Tensile Strength of Strand Test Specimen after Failure ........................... 126
Figure 10.2 Graphic Representation of Linear Analysis of Data for ASTM A1081 Threshold
Determination ..................................................................................................................... 128
Figure 10.3 Graphic Representation of Polynomial Analysis of Data for ASTM A1081 Threshold
Determination ..................................................................................................................... 129
Figure 10.4 Strand Averaging Effects to Moment Ratio Standard Deviation Values ................ 130
Figure 10.5 Threshold Value vs Number of Strands Combined- Polynomial Analysis ............. 131
Figure 11.1 Simple Quality Assurance Test for Strand Bond Specimen Dimensions................ 133
Figure 11.2 Simple Quality Assurance Test for Strand Bond Loading Configuration ............... 133
Figure 11.3 Simple Quality Assurance Test for Strand Bond Loading Setup ............................ 135
Figure 11.4 Beam A1 Setup for Simple Quality Assurance Test for Strand Bond .................... 135
Figure 11.5 Beam A1 Loaded at 85% of its Nominal Moment Capacity during the Simple
Quality Assurance Test for Strand Bond ............................................................................ 136
Figure 11.6 Beam A1 Loaded at 100% of its Nominal Moment Capacity during the Simple
Quality Assurance Test for Strand Bond ............................................................................ 137
Figure 11.7 Beam A1 Simple Quality Assurance Test for Strand Bond Results ....................... 138
Figure 11.8 Mid span Deflection (in) vs Applied Load (lb) for all Specimens Tested by the
Simple Quality Assurance Test for Strand Bond ................................................................ 139
Figure H.1 Beam End A1-L Flexural Test Results Summary Chart A ...................................... 170
Figure H.2 Beam End A1-L Flexural Test Results Summary Chart B ....................................... 170
Figure H.3 Beam End A1-L Failure ........................................................................................... 171
Figure H.4 Beam End A2-L Flexural Test Results Summary Chart A ...................................... 172
Figure H.5 Beam End A2-L Flexural Test Results Summary Chart B ....................................... 172
Figure H.6 Beam End A2-L Failure ........................................................................................... 173
Figure H.7 Beam End A3-L Flexural Test Results Summary Chart A ...................................... 174
Figure H.8 Beam End A3-L Flexural Test Results Summary Chart B ....................................... 174
Figure H.9 Beam End A3-L Failure ........................................................................................... 175
Figure H.10 Beam End A4-L Flexural Test Results Summary Chart A .................................... 176

xiii
Figure H.11 Beam End A4-L Flexural Test Results Summary Chart B ..................................... 176
Figure H.12 Beam End A4-L Failure ......................................................................................... 177
Figure H.13 Beam End A5-L Flexural Test Results Summary Chart A .................................... 178
Figure H.14 Beam End A5-L Flexural Test Results Summary Chart B ..................................... 178
Figure H.15 Beam End A5-L Failure ......................................................................................... 179
Figure H.16 Beam End A6-L Flexural Test Results Summary Chart A .................................... 180
Figure H.17 Beam End A6-L Flexural Test Results Summary Chart B ..................................... 180
Figure H.18 Beam End A6-L Failure ......................................................................................... 181
Figure H.19 Beam End A7-L Flexural Test Results Summary Chart A .................................... 182
Figure H.20 Beam End A7-L Flexural Test Results Summary Chart B ..................................... 182
Figure H.21 Beam End A7-L Failure ......................................................................................... 183
Figure H.22 Beam End A8-L Flexural Test Results Summary Chart A .................................... 184
Figure H.23 Beam End A8-L Flexural Test Results Summary Chart B ..................................... 184
Figure H.24 Beam End A8-L Failure ......................................................................................... 185
Figure H.25 Beam End A9-L Flexural Test Results Summary Chart A .................................... 186
Figure H.26 Beam End A9-L Flexural Test Results Summary Chart B .................................... 186
Figure H.27 Beam End A9-L Failure ......................................................................................... 187
Figure H.28 Beam End A10-L Flexural Test Results Summary Chart A .................................. 188
Figure H.29 Beam End A10-L Flexural Test Results Summary Chart B ................................... 188
Figure H.30 Beam End A10-L Failure ....................................................................................... 189
Figure H.31 Beam End A1-S Flexural Test Results Summary Chart A ..................................... 190
Figure H.32 Beam End A1-S Flexural Test Results Summary Chart B ..................................... 190
Figure H.33 Beam End A1-S Failure .......................................................................................... 191
Figure H.34 Beam End A2-S Flexural Test Results Summary Chart A ..................................... 192
Figure H.35 Beam End A2-S Flexural Test Results Summary Chart B ..................................... 192
Figure H.36 Beam End A2-S Failure .......................................................................................... 193
Figure H.37 Beam End A3-S Flexural Test Results Summary Chart A ..................................... 194
Figure H.38 Beam End A3-S Flexural Test Results Summary Chart B ..................................... 194
Figure H.39 Beam End A3-S Failure .......................................................................................... 195
Figure H.40 Beam End A4-S Flexural Test Results Summary Chart A ..................................... 196
Figure H.41 Beam End A4-S Flexural Test Results Summary Chart B ..................................... 196

xiv
Figure H.42 Beam End A4-S Failure .......................................................................................... 197
Figure H.43 Beam End A5-S Flexural Test Results Summary Chart A ..................................... 198
Figure H.44 Beam End A5-S Flexural Test Results Summary Chart B ..................................... 198
Figure H.45 Beam End A5-S Failure .......................................................................................... 199
Figure H.46 Beam End A6-S Flexural Test Results Summary Chart A ..................................... 200
Figure H.47 Beam End A6-S Flexural Test Results Summary Chart B ..................................... 200
Figure H.48 Beam End A6-S Failure .......................................................................................... 201
Figure H.49 Beam End A7-S Flexural Test Results Summary Chart A ..................................... 202
Figure H.50 Beam End A7-S Flexural Test Results Summary Chart B ..................................... 202
Figure H.51 Beam End A7-S Failure .......................................................................................... 203
Figure H.52 Beam End A8-S Flexural Test Results Summary Chart A ..................................... 204
Figure H.53 Beam End A8-S Flexural Test Results Summary Chart B ..................................... 204
Figure H.54 Beam End A8-S Failure .......................................................................................... 205
Figure H.55 Beam End A9-S Flexural Test Results Summary Chart A ..................................... 206
Figure H.56 Beam End A9-S Flexural Test Results Summary Chart B ..................................... 206
Figure H.57 Beam End A9-S Failure .......................................................................................... 207
Figure H.58 Beam End A10-S Flexural Test Results Summary Chart A ................................... 208
Figure H.59 Beam End A10-S Flexural Test Results Summary Chart B .................................. 208
Figure H.60 Beam End G1-L Flexural Test Results Summary Chart A .................................... 209
Figure H.61 Beam End G1-L Flexural Test Results Summary Chart B ..................................... 209
Figure H.62 Beam End G1-L Failure ......................................................................................... 210
Figure H.63 Beam End G2-L Flexural Test Results Summary Chart A .................................... 211
Figure H.64 Beam End G2-L Flexural Test Results Summary Chart B ..................................... 211
Figure H.65 Beam End G2-L Failure ......................................................................................... 212
Figure H.66 Beam End G3-L Flexural Test Results Summary Chart A .................................... 213
Figure H.67 Beam End G3-L Flexural Test Results Summary Chart B ..................................... 213
Figure H.68 Beam End G3-L Failure ......................................................................................... 214
Figure H.69 Beam End G4-L Flexural Test Results Summary Chart A .................................... 215
Figure H.70 Beam End G4-L Flexural Test Results Summary Chart B ..................................... 215
Figure H.71 Beam End G4-L Failure ......................................................................................... 216
Figure H.72 Beam End G5-L Flexural Test Results Summary Chart A .................................... 217

xv
Figure H.73 Beam End G5-L Flexural Test Results Summary Chart B ..................................... 217
Figure H.74 Beam End G5-L Failure ......................................................................................... 218
Figure H.75 Beam End G6-L Flexural Test Results Summary Chart A .................................... 219
Figure H.76 Beam End G6-L Flexural Test Results Summary Chart B ..................................... 219
Figure H.77 Beam End G6-L Failure ......................................................................................... 220
Figure H.78 Beam End G7-L Flexural Test Results Summary Chart A .................................... 221
Figure H.79 Beam End G7-L Flexural Test Results Summary Chart B ..................................... 221
Figure H.80 Beam End G7-L Failure ......................................................................................... 222
Figure H.81 Beam End G8-L Flexural Test Results Summary Chart A .................................... 223
Figure H.82 Beam End G8-L Flexural Test Results Summary Chart B ..................................... 223
Figure H.83 Beam End G8-L Failure ......................................................................................... 224
Figure H.84 Beam End G9-L Flexural Test Results Summary Chart A .................................... 225
Figure H.85 Beam End G9-L Flexural Test Results Summary Chart B ..................................... 225
Figure H.86 Beam End G9-L Failure ......................................................................................... 226
Figure H.87 Beam End G10-L Flexural Test Results Summary Chart A .................................. 227
Figure H.88 Beam End G10-L Flexural Test Results Summary Chart B ................................... 227
Figure H.89 Beam End G10-L Failure ....................................................................................... 228
Figure H.90 Beam End G1-S Flexural Test Results Summary Chart A ..................................... 229
Figure H.91 Beam End G1-S Flexural Test Results Summary Chart B ..................................... 229
Figure H.92 Beam End G1-S Failure .......................................................................................... 230
Figure H.93 Beam End G2-S Flexural Test Results Summary Chart A ..................................... 231
Figure H.94 Beam End G2-S Flexural Test Results Summary Chart B ..................................... 231
Figure H.95 Beam End G2-S Failure .......................................................................................... 232
Figure H.96 Beam End G3-S Flexural Test Results Summary Chart A ..................................... 233
Figure H.97 Beam End G3-S Flexural Test Results Summary Chart B ..................................... 233
Figure H.98 Beam End G3-S Failure .......................................................................................... 234
Figure H.99 Beam End G4-S Flexural Test Results Summary Chart A ..................................... 235
Figure H.100 Beam End G4-S Flexural Test Results Summary Chart B ................................... 235
Figure H.101 Beam End G4-S Failure ........................................................................................ 236
Figure H.102 Beam End G5-S Flexural Test Results Summary Chart A ................................... 237
Figure H.103 Beam End G5-S Flexural Test Results Summary Chart B ................................... 237

xvi
Figure H.104 Beam End G5-S Failure ........................................................................................ 238
Figure H.105 Beam End G6-S Flexural Test Results Summary Chart A ................................... 239
Figure H.106 Beam End G6-S Flexural Test Results Summary Chart B ................................... 239
Figure H.107 Beam End G6-S Failure ........................................................................................ 240
Figure H.108 Beam End G7-S Flexural Test Results Summary Chart A ................................... 241
Figure H.109 Beam End G7-S Flexural Test Results Summary Chart B ................................... 241
Figure H.110 Beam End G7-S Failure ........................................................................................ 242
Figure H.111 Beam End G8-S Flexural Test Results Summary Chart A ................................... 243
Figure H.112 Beam End G8-S Flexural Test Results Summary Chart B ................................... 243
Figure H.113 Beam End G8-S Failure ........................................................................................ 244
Figure H.114 Beam End G9-S Flexural Test Results Summary Chart A ................................... 245
Figure H.115 Beam End G9-S Flexural Test Results Summary Chart B ................................... 245
Figure H.116 Beam End G9-S Failure ........................................................................................ 246
Figure H.117 Beam End G10-S Flexural Test Results Summary Chart A ................................. 247
Figure H.118 Beam End G10-S Flexural Test Results Summary Chart B ................................. 247
Figure H.119 Beam End G10-S Failure ...................................................................................... 248
Figure H.120 Beam End I1-L Flexural Test Results Summary Chart A .................................... 249
Figure H.121 Beam End I1-L Flexural Test Results Summary Chart B .................................... 249
Figure H.122 Beam End I1-L Failure ......................................................................................... 250
Figure H.123 Beam End I2-L Flexural Test Results Summary Chart A .................................... 251
Figure H.124 Beam End I2-L Flexural Test Results Summary Chart B .................................... 251
Figure H.125 Beam End I2-L Failure ......................................................................................... 252
Figure H.126 Beam End I3-L Flexural Test Results Summary Chart A .................................... 253
Figure H.127 Beam End I3-L Flexural Test Results Summary Chart B .................................... 253
Figure H.128 Beam End I3-L Failure ......................................................................................... 254
Figure H.129 Beam End I4-L Flexural Test Results Summary Chart A .................................... 255
Figure H.130 Beam End I4-L Flexural Test Results Summary Chart B .................................... 255
Figure H.131 Beam End I4-L Failure ......................................................................................... 256
Figure H.132 Beam End I5-L Flexural Test Results Summary Chart A .................................... 257
Figure H.133 Beam End I5-L Flexural Test Results Summary Chart B .................................... 257
Figure H.134 Beam End I5-L Failure ......................................................................................... 258
xvii
Figure H.135 Beam End I6-L Flexural Test Results Summary Chart A .................................... 259
Figure H.136 Beam End I6-L Flexural Test Results Summary Chart B .................................... 259
Figure H.137 Beam End I6-L Failure ......................................................................................... 260
Figure H.138 Beam End I7-L Flexural Test Results Summary Chart A .................................... 261
Figure H.139 Beam End I7-L Flexural Test Results Summary Chart B .................................... 261
Figure H.140 Beam End I7-L Failure ......................................................................................... 262
Figure H.141 Beam End I8-L Flexural Test Results Summary Chart A .................................... 263
Figure H.142 Beam End I8-L Flexural Test Results Summary Chart B .................................... 263
Figure H.143 Beam End I8-L Failure ......................................................................................... 264
Figure H.144 Beam End I9-L Flexural Test Results Summary Chart A .................................... 265
Figure H.145 Beam End I9-L Flexural Test Results Summary Chart B .................................... 265
Figure H.146 Beam End I9-L Failure ......................................................................................... 266
Figure H.147 Beam End I10-L Flexural Test Results Summary Chart A .................................. 267
Figure H.148 Beam End I10-L Flexural Test Results Summary Chart B .................................. 267
Figure H.149 Beam End I10-L Failure ....................................................................................... 268
Figure H.150 Beam End I1-S Flexural Test Results Summary Chart A .................................... 269
Figure H.151 Beam End I1-S Flexural Test Results Summary Chart B .................................... 269
Figure H.152 Beam End I1-S Failure ......................................................................................... 270
Figure H.153 Beam End I2-S Flexural Test Results Summary Chart A .................................... 271
Figure H.154 Beam End I2-S Flexural Test Results Summary Chart B .................................... 271
Figure H.155 Beam End I2-S Failure ......................................................................................... 272
Figure H.156 Beam End I3-S Flexural Test Results Summary Chart A .................................... 273
Figure H.157 Beam End I3-S Flexural Test Results Summary Chart B .................................... 273
Figure H.158 Beam End I3-S Failure ......................................................................................... 274
Figure H.159 Beam End I4-S Flexural Test Results Summary Chart A .................................... 275
Figure H.160 Beam End I4-S Flexural Test Results Summary Chart B .................................... 275
Figure H.161 Beam End I4-S Failure ......................................................................................... 276
Figure H.162 Beam End I5-S Flexural Test Results Summary Chart A .................................... 277
Figure H.163 Beam End I5-S Flexural Test Results Summary Chart B .................................... 277
Figure H.164 Beam End I5-S Failure ......................................................................................... 278
Figure H.165 Beam End I6-S Flexural Test Results Summary Chart A .................................... 279

xviii
Figure H.166 Beam End I5-S Flexural Test Results Summary Chart B .................................... 279
Figure H.167 Beam End I5-S Failure ......................................................................................... 280
Figure H.168 Beam End I7-S Flexural Test Results Summary Chart A .................................... 281
Figure H.169 Beam End I7-S Flexural Test Results Summary Chart B .................................... 281
Figure H.170 Beam End I7-S Failure ......................................................................................... 282
Figure H.171 Beam End I8-S Flexural Test Results Summary Chart A .................................... 283
Figure H.172 Beam End I8-S Flexural Test Results Summary Chart B .................................... 283
Figure H.173 Beam End I8-S Failure ......................................................................................... 284
Figure H.174 Beam End I9-S Flexural Test Results Summary Chart A .................................... 285
Figure H.175 Beam End I9-S Flexural Test Results Summary Chart B .................................... 285
Figure H.176 Beam End I9-S Failure ......................................................................................... 286
Figure H.177 Beam End I10-S Flexural Test Results Summary Chart A .................................. 287
Figure H.178 Beam End I10-S Flexural Test Results Summary Chart B .................................. 287
Figure H.179 Beam End I10-S Failure ....................................................................................... 288
Figure I.1 Simple Quality Assurance Test for Strand Bond Specimen A1 Summary Chart ...... 289
Figure I.2 Simple Quality Assurance Test for Strand Bond Specimen A2 Summary Chart ...... 290
Figure I.3 Simple Quality Assurance Test for Strand Bond Specimen A3 Summary Chart ...... 291
Figure I.4 Simple Quality Assurance Test for Strand Bond Specimen G1 Summary Chart ...... 292
Figure I.5 Simple Quality Assurance Test for Strand Bond Specimen G2 Summary Chart ...... 293
Figure I.6 Simple Quality Assurance Test for Strand Bond Specimen G3 Summary Chart ...... 294
Figure I.7 Simple Quality Assurance Test for Strand Bond Specimen I1 Summary Chart ........ 295
Figure I.8 Simple Quality Assurance Test for Strand Bond Specimen I2 Summary Chart ........ 296
Figure I.9 Simple Quality Assurance Test for Strand Bond Specimen I3 Summary Chart ........ 297

xix
List of Tables
Table 2-1 Code Adopted and Proposed Equations for Transfer and Development Length ......... 27
Table 2-2 Equation Symbol Description and Assumed Values for Numerical Representation of
Adopted and Proposed Transfer and Development Length Equations ................................. 29
Table 3-1 Mortar Strength and Flow Results per Cement (Riding, Peterman, Polydorou, & Ren,
2012) ..................................................................................................................................... 49
Table 4-1 Dolese Sand Gradations (Polydorou, Riding, Peterman, & Murray, 2013) ................. 50
Table 4-2 Cement Chemical Composition and Physical Properties (Riding, Peterman, Polydorou,
& Ren, 2012) ......................................................................................................................... 53
Table 4-3 Cement 1 Chemical and Physical Properties (Polydorou, Riding, Peterman, & Murray,
2013) ..................................................................................................................................... 55
Table 4-4 Ruggedness Testing Matrix .......................................................................................... 57
Table 4-5 Mortar Compressive Strength Before and After Testing, Mortar Flow, Test Loading
Rate, and Average Pullout Force Values per Test (Polydorou, Riding, Peterman, & Murray,
2013) ..................................................................................................................................... 60
Table 4-6 Average Difference (5) between Pullout Test Results of Test Groups per Factor
Investigated (Polydorou, Riding, Peterman, & Murray, 2013) ............................................. 61
Table 4-7 Two-Sided Tail Probability Values per Effect by ASTM E1169-07 Procedures for
Each Strand Source ............................................................................................................... 62
Table 4-8 Two-Sided Probability Values per Effect for Each ANOVA Model Used to Analyze
the Data (Strand A) ............................................................................................................... 63
Table 5-1 Mixture Proportions and Mixture Flow for Mortar Samples Made with 5 Different
Cement Sources (Polydorou, Riding, & Peterman, 2014) .................................................... 66
Table 5-2 Average ASTM A1081 Test Results per Strand and Cement Source Tested at KSU . 66
Table 5-3 Average Modified ASTM A1081 Test Results per Strand and Cement Source Tested at
KSU (w/c= 0.45 for all mixtures) ......................................................................................... 67
Table 5-4 Method A and Method B Specifications (Polydorou, Riding, & Peterman, 2014) ...... 69
Table 5-5 Inter-Laboratory Study Data- Method A (ASTM A1081) (Polydorou, Riding, &
Peterman, 2014) .................................................................................................................... 70

xx
Table 5-6 Inter-Laboratory Study Data- Method B (Modified ASTM A1081) (Polydorou, Riding,
& Peterman, 2014) ................................................................................................................ 71
Table 5-7 Average Pullout Test Result, Standard Deviation and Coefficient of Variation for
Strands A, G and I, Method A vs Method B (Polydorou, Riding, & Peterman, 2014) ........ 75
Table 6-1 Loss on Ignition Test Data ........................................................................................... 78
Table 6-2 Contact Angle Measurement Test Data ........................................................................ 79
Table 6-3 Change in Corrosion Potential Test Data ..................................................................... 80
Table 6-4 Organic Residue Extraction with FTIR Analysis Test Results .................................... 81
Table 8-1 Summary of ACI Capacities Reduced per Section and Case Analyzed ....................... 93
Table 9-1 Concrete Mixture Design Specifications .................................................................... 100
Table 9-2 Crack Inducing Techniques per Beam End ................................................................ 105
Table 9-3 Concrete Placement Conditions and Mixture Properties per Cast Day ...................... 106
Table 9-4 Day 1 Concrete Mixture Maturity Details (Beams A1-5, I1-5) ................................. 106
Table 9-5 Day 2 Concrete Mixture Maturity Details (Beams G1-5, A6-10) .............................. 107
Table 9-6 Day 3 Concrete Mixture Maturity Details (Beams G6-10, I6-10) ............................. 107
Table 9-7 Time Between Mixture Placement and Specimen Tested per Beam Group .............. 109
Table 9-8 Average Transfer Length Values at Release for Strands A, G, and I by 95% AMS and
ZL Method Analysis ........................................................................................................... 115
Table 9-9 Average Transfer Length Values at Time of Flexural Beam Testing for Strands A, G,
and I by ZL Method Analysis ............................................................................................. 116
Table 9-10 Average Transfer Length, Experimental to Nominal Moment Ratio, and End Slip
During Test Values per Beam End Group .......................................................................... 122
Table 9-11 Beam End Group Failure Mode Summary ............................................................... 122
Table 10-1 ASTM A1081 Pullout Force Values Corresponding to ACI 318 Transfer Length
Values at Release and at Time of Test ................................................................................ 125
Table 10-2 Ultimate Tensile Strength (ksi) per Strand Source ................................................... 127
Table 10-3 Average Moment Ratios per Beam End Group Calculated Using Strand Ultimate
Strength ............................................................................................................................... 127
Table 10-4 Strand Averaging Procedure Example ..................................................................... 130
Table 10-5 Recommended ASTM A1081 Threshold Values ..................................................... 132
Table 11-1 Simple Quality Assurance Test for Strand Bond Results Summarized ................... 139

xxi
Table A-1 Placement Day 1 (7-16-13): Rectangular Beam Specimens A 1-5, I 1-5
Accompanying Cylinders’ Split Tensile Test Results ........................................................ 150
Table A-2 Placement Day 2 (7-18-13): Rectangular Beam Specimens A 5-10, G 1-5
Accompanying Cylinders’ Split Tensile Test Results ........................................................ 150
Table A-3 Placement Day 3 (7-19-13): Rectangular Beam Specimens I 5-10, G 5-10
Accompanying Cylinders’ Split Tensile Test Results ........................................................ 151
Table B-1 Strand G Transfer Lengths at Time of Prestress Release .......................................... 152
Table B-2 Strand A Transfer Lengths at Time of Prestress Release .......................................... 153
Table B-3 Strand I Transfer Lengths at Time of Prestress Release ............................................ 154
Table C-1 Strand G Transfer Lengths at Time of Flexural Testing ............................................ 155
Table C-2 Strand A Transfer Lengths at Time of Flexural Testing ............................................ 156
Table C-3 Strand I Transfer Lengths at Time of Flexural Testing ............................................. 157
Table D-1 Strand G End Slip Values .......................................................................................... 158
Table D-2 Strand A End Slip Values .......................................................................................... 159
Table D-3 Strand I End Slip Values ........................................................................................... 160
Table E-1 Strand A Beam Ends- Actual Dimensions ................................................................. 161
Table E-2 Strand G Beam Ends- Actual Dimensions ................................................................. 162
Table E-3 Strand I Beam Ends- Actual Dimensions .................................................................. 163
Table G-1 Flexural Beam Testing Failure Analysis for Strand A Beam Ends ........................... 167
Table G-2 Flexural Beam Testing Failure Analysis for Strand G Beam Ends ........................... 168
Table G-3 Flexural Beam Testing Failure Analysis for Strand I Beam Ends ............................ 169

xxii
Acknowledgements
I would like to thank my major professors Dr. Kyle A. Riding and Dr. Robert J. Peterman
for their guidance with this research project, their patience, and understanding. I want to take this
opportunity to express my respect to these two outstanding researchers, as well as my gratitude
for being given the opportunity to work on this project. I want to also acknowledge my
committee chairperson and Distinguished Professor from the Department of Physics, Dr. Itzik
Ben-Itzhak, as well as my advisory committee members Dr. Asad Esmaeily, and Dr. B. Terry
Beck, expressing my appreciation for their time, precious advice and constructive remarks on my
work.
I would like to thank the Prestressed Concrete Institute (PCI), the major funding agency
of this project, as well as Kansas State University’s University Transportation Center (UTC) for
supporting my research financially.
I would like to express my gratitude to Dolese Brothers Co., Oklahoma, for donating 2
truckloads of sand, as well as the prestressing strand manufacturing plants and cement
manufacturing plants that donated the materials necessary to make this research project possible:
American Spring Wire, Ash Grove Cement Company, Bekaert Canada, Buzzi Unicem
USA, Essroc Italicementi Group, Holcim (US) Inc., Insteel Wire Products, Lafarge Cement, The
Monarch Cement Company, Rettco Steel, Strand Tech Martin Inc., Sumiden Wire Products
Corporation. I also want to thank Bentley for providing me with a temporary license key to their
product Leap Presto, and acknowledge Mr. Tim Cullen for his guidance on the analysis.
I would also like to acknowledge the laboratories that participated in our Inter-Laboratory
Study, and thank them for their cooperation:
Florida Department of Transportation, Kansas Department of Transportation, Louisiana
Department of Transportation, Missouri Department of Transportation, Ohio Department of
Transportation, Sumiden Wire Products Corporation, Texas Department of Transportation,
Turner Fairbank Highway Research Center. I would like to also thank co-project investigator Dr.
Leigh Murray for her help with the statistical interpretation of the data.
I want to express my deep appreciation to the group of Stresscon, Inc., and the significant
effort they put into our Flexural Beam Study, and acknowledge Stresscon founder Mr. Donald R.
Logan for accommodating this study, and inspiring me with his passion for research on strand

xxiii
bond. I would also like to thank our research technologist Ryan Benteman, my fellow graduate
students for their help, as well as my undergraduate research assistants whose hard work made
this research feasible; Thank you! Matt Arnold, Naga Bodapati, Brandon Bortz, Ben Brabec,
Nick Clow, Brandon Heavener, Dr. Joey Holste, Dustin Hoyt, Jerry Hulsing, Amir Farid
Momeni, Austin Muck, Dr. GengFeng Ren, Noura Saadi, Robert Schweiger, Garrett Sharpe,
Andy Shearrer, and Luke Spaich.
Finally, I want to thank my father, my mother, my sisters, and all the supportive friends
and loving family that I am blessed with; thank my grandmothers, former teachers and Track and
Field coaches for the inspiration, but most importantly my son, who brought true joy to this
rollercoaster ride!

xxiv
Dedication
Σ’ εσένα, που χαμογελάς..!

1
Chapter 1 - Introduction
The Prestressed Concrete Institute (PCI) hired researchers from Kansas State University
to investigate the repeatability and reproducibility of the North American Strand Producers
(NASP) test method, and establish appropriate threshold criteria for prestressing strand to be
used in pre-tensioned applications. The NASP method is a pull-out test procedure developed for
verifying the bonding ability of steel strands to cementitious materials, and is now accepted by
ASTM as the “Standard Test Method for Evaluating Bond of Seven-Wire Steel Prestressing
Strand”.
The methodology, procedures, and presentation of the findings from the extensive
research project “Determination of Acceptance Criteria for Prestressing Strand in Pre-Tensioned
Applications” funded by PCI will be presented and discussed in this doctoral dissertation.
1.1 Background
The bonding performance of prestressing strand in pre-tensioned applications is crucial,
since it is through the bond between the two materials that the tensile stresses are transferred
from the strand tendons to the concrete material. In prestressed concrete, a section relies on the
bond between concrete and steel strands, in order to provide it with the necessary flexural and
shear capacity to withstand the loading it was designed for. Recently it was observed that strands
of the same grade and type vary in their bonding capacity, turning the prestressing industry’s
attention to strand bond research.
1.2 Problem Statement
It is necessary to establish minimum acceptance criteria for the “Standard Test Method
for Evaluating Bond of Seven-Wire Steel Prestressing Strand” in order to ensure adequate
bonding capacity of prestressing strand samples to be used in pre-tensioned applications, and
therefore provide prestressed concrete members that will meet code requirements.

2
1.3 Project Objectives
The purpose of this research project was first of all to determine the reproducibility and
repeatability of the “Standard Test Method for Evaluating Bond of Seven-Wire Steel Prestressing
Strand”, and then provide a precision and bias statement for the test method. Following the
investigation of the test method, this research project was geared towards correlating the pullout
force capacity of three strand sources as tested by the standard test, with their performance in
flexural concrete beam specimens. The objective was to determine an appropriate minimum
threshold for the “Standard Test Method of Evaluating Bond of Seven-Wire Steel Prestressing
Strand” to ensure adequate performance of strand in prestressed concrete applications.
1.4 Thesis Organization
This doctoral dissertation is divided into 12 chapters, with Chapter 1 introducing the
research project and providing the scope of this dissertation.
Chapter 2 presents an extensive Literature Review of the subjects studied, and the
following 10 chapters describe the experimental tasks completed during the course of this
research project.
Chapter 3 is a discussion of the material selection process, employed during the
preliminary testing rounds.
Chapter 4 describes the ruggedness investigation of ASTM A1081.
Chapter 5 follows, presenting the Inter-Laboratory study conducted on the ASTM A1081
test.
Chapter 6 reports the strand surface characteristics tested by NCHRP 621 methods.
Chapter 7 is a discussion of the ASTM A1081 test method investigation findings.
Chapter 8 presents an analysis of the sensitivity of pre-tensioned applications to the
transfer and development length criteria of ACI 318.
Chapter 9 explains and discusses the rectangular beam testing study.
Chapter 10 describes the methods of analysis conducted in order to determine the test
method threshold value.
Chapter 11 presents the Peterman Beam Test program procedures and findings.

3
Chapter 12 is an overall summary and conclusion, with recommendations for
implementation and future research.
4
Chapter 2 - Literature Review
2.1 Introduction to Prestressing
In prestressed concrete applications, steel tendons are inserted at preselected locations in
forms where a concrete section will be fabricated, and are tensioned to a desired stress prior to
the placing of fresh concrete. As the concrete gains compressive strength during the curing
process, it also bonds to the prestressing steel strands. Once the concrete mixture reaches a
specified compressive strength, the steel strands are released from their anchorages. The tensile
stress is transferred into the concrete as the prestressed tendons react upon release, aiming to
return to their original length, and therefore compress the concrete section. A perfect balance
between prestress and load generated stresses is the ideal application of the prestressing theory.
The principle of prestressing is to reduce the tensile stresses that are applied to concrete
as a result of external loading. Achieving this provision delivers a prestressed concrete section
with fewer cracks compared to the equivalent traditionally reinforced concrete section, and also
offers alternative design possibilities that can ease the construction and maximize the economy
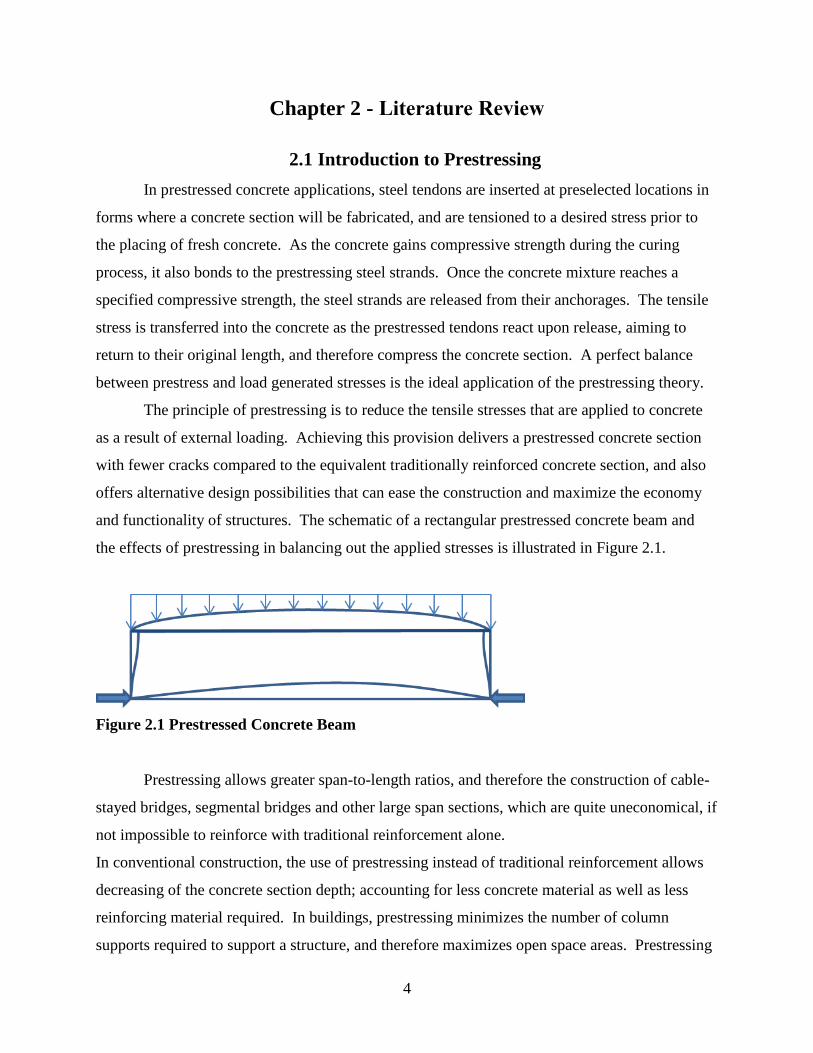
and functionality of structures. The schematic of a rectangular prestressed concrete beam and
the effects of prestressing in balancing out the applied stresses is illustrated in Figure 2.1.
Prestressing allows greater span-to-length ratios, and therefore the construction of cable-
stayed bridges, segmental bridges and other large span sections, which are quite uneconomical, if
not impossible to reinforce with traditional reinforcement alone.
In conventional construction, the use of prestressing instead of traditional reinforcement allows
decreasing of the concrete section depth; accounting for less concrete material as well as less
reinforcing material required. In buildings, prestressing minimizes the number of column
supports required to support a structure, and therefore maximizes open space areas. Prestressing
Figure 2.1 Prestressed Concrete Beam

5
will also contribute to structure longevity, since it limits the amount of contaminants entering the
concrete, by reduced cracking of the section.
2.2 History of Prestressing
As a relatively new concept, it was not until the 1950s that the prestressing industry
began to rise in the United States. The construction of the Walnut Lane Memorial Bridge in
Philadelphia, Pennsylvania is believed to have been the breakthrough of the prestressed concrete
industry in North America. Before then, P.H. Jackson was the first engineer to introduce
prestressing in 1872, with C.W. Doehring to follow in 1888. Both of the engineers’ attempts
were unsuccessful at that time, since neither one accounted for long-term prestress losses. It was
during the 1920s that the prestressing principles started to develop in both the United States and
Europe (Nawy, 2010).
In France in the early 1900s, Eugène Freyssinet was the first engineer who attempted the
construction of pre-compressed bridges, setting successive world records for span length, and
also discovering concrete creep while riding his bicycle across one of his first built bridges.
Freyssinet had to repair his bridges, and did so by replacing the original jacks and raising the
vaults. After studying the phenomena of creep and shrinkage which brought his bridges near
collapse, he concluded that higher quality concrete and higher strength steel was required for
successful prestressing applications. By the 1930s, Freyssinet had grasped his prestressing
vision; he was then using concrete of 4000-5000 psi compressive strength, prestressed with steel
of strength in the range of 190,000-200,000 psi (Xercavins, Demarthe, & Sushkewich, 2008).
During World War II, Belgian engineer and academic Gustave Magnel studied
Freyssinet’s principles and also conducted his own research on full scale sections; his findings
making significant embellishments to the developing technology of prestressed concrete (Dinges,
2009). Through his research, Magnel had discovered that creep in prestressed concrete is not the
effect of concrete material alone as Freyssinet had assumed; it is in fact the prestressing steel that
contributes a large amount of the stress relaxation in a prestressed concrete application. With
this finding, Magnel was able to make more accurate calculations in determining the loss of
prestress in a prestressed concrete section. In addition to his experimental research aptitude,
Gustave Magnel was also a gifted educator, able to simplify concepts and communicate

6
his findings to other engineers and students. Magnel’s book Le Béton Précontraint (Prestressed
Concrete) was translated to English and published in the United States. American engineers
turned to him when planning to construct the first major prestressed concrete structure in the
United States (Dinges, 2009). The first prestressing materials catalogue was published in
America in 1951 by John A. Roebling and Sons Company, named “Roebling- Strands and
Fittings for Prestressed Concrete” (Dinges, 2009).
The completion of the Walnut Lane Memorial Bridge in Philadelphia in 1951 was a landmark in
the history of American prestressing. The challenging design of the long spans of the bridge and
its successful design using prestressing had turned the attention of American engineers to
prestressed concrete, inspiring them to improve prestressing techniques and materials.
The Prestressed Concrete Institute was established in 1954, during the decade when
significant industry innovations were also developing, and prestressing techniques were
becoming standardized (www.pci.org).
Charles Sunderland led extensive research on prestressing materials at John A. Roebling
and Sons, and he was the inventor of the cold drawn stress relieved wire, which later led to the
development of the stress relieved strand (Dinges, 2009). The prestressing industry continued to
thrive with the development of the 7-wire strand, the introduction of the method of pre-casting,
and usage of long-line beds.
In 1963, T.Y. Lin introduced the innovative Load Balancing Method, a design approach
that simplified the design process considerably, making prestressed concrete projects less
intimidating to the structural engineer. The Load Balancing Method relies on simply balancing
the moment provided by the prestressing force at a certain location with the moment developed
due to the loading condition, allowing analysis by conventional methods. Lin’s Load Balancing
Method is commonly used today in prestressed concrete design (Dinges, 2009).
The revolutionary invention of the low relaxation strand came towards the end of the
1970s, a key development for the prestressing industry. Low relaxation strand is the material
that is most commonly used in prestressed concrete today, allowing for longer spans and also
smaller sections, as it experiences highly reduced losses of prestress due to strand creep,
compared to the conventional stress-relieved or normal relaxation prestressing strand.

7
2.3 Strand Manufacturing
Prestressing strands are manufactured daily at wire and strand manufacturing plants in the
United States, to supply the American prestressed concrete industry. The raw material specified
for the production of prestressed concrete wire and strand is a high carbon steel, AISI/SAE 1080
(Osborn, Lawler, & Connolly, 2008). Wire rods of nominal diameter between 3/8” and 1/2” are
commonly used as the initial raw material in the strand manufacturing process, and arrive at the
plants in coils, supplied by steel mills. Figure 2.2 shows several coils of raw steel, stored at a
strand manufacturing plant as received from steel mills.
Figure 2.2 Raw Steel Coils used for Prestressing Strand Manufacturing
Since mill scale and rust is abundant on the surface of the wire rods initially, the first step
at a strand manufacturing plant is either mechanical or chemical cleaning of the raw steel. The
chemical removal of iron oxides from the surface of the wire rods is the most common

8
procedure, and it starts with a process called the pickling, beginning with dipping the steel in
hydrochloric or sulfuric acid, and followed by rinsing it with water. The steel is then pre-
treated with a textured carrier coating that will promote lubricant adherence during the drawing
process that will follow (Hawkins & Ramirez, 2010).
Pre-treating is done by submerging the wire rod into a zinc phosphate solution, or other
less commonly used coating materials like specialized polymers, borax, or lime, and then
proceeding with rinsing of the rod in water and drying. After they are treated with phosphate,
multiple wires of raw steel are welded together to form a longer coil before they enter a
wiredrawing machine (Osborn, Lawler, & Connolly, 2008).
Once it enters the wiredrawing machine, the rod stock will be drawn down the eight or
nine successively smaller carbide dies that the machine consists of, the cold-working process
generating wire of diameter reduced by two-thirds, compared to the original raw steel rod
diameter. Lubricants are introduced to the wire surface during this process as the wire is drawn
through a lubricant box before each die. Part of the wiredrawing process is shown in Figure 2.3,
a photograph taken at one of the North American strand manufacturing plants.
Figure 2.3 Wire Drawing Process during Strand Manufacturing

9
The wire-drawing lubricants used during this process are usually sodium stearate or
calcium stearate, and might differ from plant to plant and even between successive dies of a
wiredrawing machine, allowing the wire to go through multiple wiredrawing lubricants before it
exits the machine (Hawkins & Ramirez, 2010). The lubricants act as barriers between the wire
surface and the carbide drawing dies and therefore can postpone die wear-out, and at the same
time control the frictional heat on the wire surface. A capstan exists for each die in order to pull
the wire through the die, and both capstans and dies are water-cooled during the wiredrawing
process, in order to protect the wire and wiredrawing lubricants, as both can be greatly affected
by high temperatures (Osborn, Lawler, & Connolly, 2008). Figure 2.4 shows a wiredrawing die
that was cut in half for illustration purposes, displaying the cross section of the die in figure 4a)
and the top view of the die in figure 4b).
Figure 2.4 Cut Wire Die Cross Section (4a) and Top View (4b)
The wire rod that enters the wire drawing machine is typically 170 ksi ±5 ksi tensile
strength, and after it gets drawn through the successive dies and has its diameter reduced to the
standard diameter specified for its final use, the wire comes out with a tensile strength of 270 ksi
± 20 ksi, for grade 270 low-relaxation strand wires, which is a tensile strength increase of greater
than 50% as a result of work hardening. For the case of ½” diameter, 7-wire strand, the specified
diameter for the king wire is 0.174” ± 0.002”, and has to be a minimum of 0.003” greater than
the diameter of the 6 outer wires (Hawkins & Ramirez, 2010), (ASTM A416, 2010). Each
individual wire is spooled at the end of the wire drawing machine, and once the seven spools of
wire are produced, they are loaded into a skip strander, to proceed with stranding.
The stranding machine wraps the 6 outer wires helically around the king wire at a
specified rate according to the final strand diameter, as specified by ASTM A416 (Osborn,
4a) 4b)

10
Lawler, & Connolly, 2008), (Hawkins & Ramirez, 2010). When the 7-wire strand is shaped, it
will undergo a thermo-mechanical process, the critical step for the strand’s stress relaxation
properties.
During this step, the strand is drawn through an induction furnace at 700°F ± 80°F,
continuously heating the strand while it’s also under tension, relieving the residual wire drawing
stresses and elongating the strand, to increase the strand’s yield strength and convey it with low
relaxation properties. Any remaining residual lubricants are then washed off; the strand is
cooled and later looped back into a coil (Osborn, Lawler, & Connolly, 2008), (Hawkins &
Ramirez, 2010).
Even though the mechanical properties of prestressed concrete strand and wires are
controlled at wire manufacturing plants as prescribed by the corresponding specifications, the
ability of prestressing steel reinforcement to bond to concrete has been of great concern to the
industry during the last decades. The issue of prestressing strand not having uniform bonding
capabilities was highlighted by a near failure of a structure in Texas in 1997, where thorough
investigation concluded that the severe cracking on the prestressed double tees of the parking
garage had occurred due to inadequate prestressing force at the ends of the members (Wiss,
Janney, Elstner, & Associates).
Prestressing material of the same type and grade, with the only disparity among them
being their plant of manufacture, were identified to have highly variable bonding performance in
identical cementitious mixtures (Russell & Paulsgrove, NASP Strand Bond Testing Round I,
1999), (Russell & Paulsgrove, NASP Strand Bond Testing Round II, 1999), (Russell B. W.,
NASP Strand Bond Testing Round III), (Russell B. , NASP Round IV Strand Bond Testing,
2006), (Logan, 1997).
Dissimilar chemicals used as lubricants during the wire drawing process was one of the
differences observed between strand manufacturing plants, and a possible influence on the strand
bonding behavior. Another method that varies between manufacturing plants is heating during
the stress relieving process, as the temperature ranges used vary between plants, affecting the
degree of lubricant removal from the strand surface; and finally, the speed of winding the wires
together varies according to the stranding machine that each plant is using, and that can affect the
mechanical tightness of the strand and assembly of the king wire to the outer wires, affecting the

11
bonding capacity of the strand as a whole (Hawkins & Ramirez, 2010), (Osborn, Lawler, &
Connolly, 2008).
It is widely accepted that the bond between steel and concrete is affected by the residual
films of any lubricant and other contaminants not adequately removed from the strand surface
during the final stages of the strand manufacturing process. The use of lubricants is essential to
the wiredrawing process during strand manufacturing, and other contaminants cannot be
controlled since the surface condition of the raw steel material will vary. The North American
Strand Producers Association (NASPA) had suggested using the water soluble lubricant sodium
stearate instead of calcium stearate in order to reduce the residual films remaining on the strand
surface after manufacture, but strand bond problems were not eliminated (Osborn, Lawler, &
Connolly, 2008).
The adequacy of strand bond is critical to the transferring of prestressing force into
concrete members, and current codes include a distance called the transfer length, as well as a
development length, depending on the characteristics of the strand utilized in the section. A
structural engineer will design according to the code, assuming that the strand is fully bonded by
the prescribed lengths, and therefore that the strand will develop its effective prestress by the
transfer length, and achieve additional stress increase by the development length, as the
structural member reaches its nominal strength. In the case where there is no sufficient bonding
action between the strand and concrete material, the prestressing force will not be able to transfer
into the concrete, and therefore the section will be lacking in capacity to sustain the loads it was
designed for.
2.4 Transfer/Development Length Equations
In a prestressed concrete member, the prestressing force is transferred from the
prestressing steel to the prestressed concrete member as the strands adhere to the concrete
material along the length of the member. Analytical equations are provided in the American
Concrete Institute (ACI) Building Code, which are intended to predict the distance it takes to
fully transfer and develop the prestressing force from the prestressing strands into the concrete.
The variation in steel stress along the development length of a prestressing strand is illustrated in
Figure 2.5.

12
Figure 2.5 Variation of Steel Stress along Development Length
The transfer length, lt, is defined as the distance from the edge of the concrete member to
the point where the effective prestressing force is fully established into the concrete. The
development length, ld, is defined as the distance from the edge of the member to the point into
the member where the strand stress can achieve additional increase at the ultimate capacity of the
member. The development length consists of the transfer length and an additional distance
called the flexural bond length, ld.
It would be conservative to assume greater transfer lengths and greater development
lengths, but this will only be a conservative assumption if the loads on the member are evenly
distributed. For the cases where a point load is applied near the end of a prestressed member, it
is very important to know exactly where the prestressing force is developed to ultimate stress
level, and also where the prestressing force is fully transferred into the concrete. Predicting the
bonding behavior of prestressing strand might be challenging, but inaccurate assumptions can be
detrimental to structures and possibly life threatening.
It is therefore necessary to develop accurate expressions that will be reliable in
calculating the transfer and development length required for prestressing forces to be transferred
into cementitious materials by strands of known properties. The strands’ ability to bond with the
material will be a crucial factor in transferring prestressing forces, and even though some strand
Steel
Stress
fse
fps
lt
ld
Distance from free end of the strand
At nominal strength of
member
Prestress only
lb

13
samples share identical ASTM A416 properties, their bonding capabilities vary as shown by
strand bond tests.
The expressions in the current ACI code provided for predicting the transfer length and
development length are as shown in Equation 2-1 and Equation 2-2 respectively (ACI 318,
2011):
Lt = (fse
3) db Equation 2-1
Ld = (fse
3) db+ (fps-fse) db
Equation 2-2
where fse = effective stress in prestressing strand, ksi
fps = stress in prestressing strand at nominal strength, ksi
db = nominal strand diameter, in
The equations originate from the research findings of an experimental program conducted
by Hanson and Kaar, published in 1959. In their report, Hanson and Kaar had recommended
minimum embedment lengths per strand diameter; the actual equations were derived later by Dr.
Alan H. Mattock, based on Hanson and Kaar’s test results (Tabatabai & Dickson, 1995). The
forty seven beams tested by Hanson and Kaar were prestressed with 1⁄4, 3⁄8 and 1⁄2 inch
diameter strands. Eighteen of the beams were included in series 1 of the test program, where the
effect of strand diameter and embedment length on bond performance was evaluated. Series 2
included nine beams, all prestressed with 3⁄8 inch diameter strand, but having variable concrete
compressive strengths at roughly 3700 psi, 5400 psi, and 7200 psi, aiming to evaluate the effects
of concrete compressive strength on strand bond performance (Hanson & Kaar).
The third series of the testing program was targeted towards determining the effect of
varying the percentage of reinforcement used in a section, by comparing beams that included
two, four, or six strands. Series 4 was geared towards indicating any effects of strand surface
condition to beam performance, thus four pairs of beams were casted, each pair having one

14
section prestressed with a clean, smooth strand and the other section prestressed with a rusted
strand of equal diameter (Hanson & Kaar).
The researchers found that the strand diameter and strand embedment length had
significant influence on the value of bond stress where strand slipping occurred. It was also
observed that when increasing the percentage of steel reinforcement by prestressing equivalent
beam sections with two, four, and six strands, the occurrence of general bond slip was reduced
even for embedment lengths that were lower than the required critical length. Hanson and Kaar
indicated that with higher percentage of reinforcement, we have lower steel stresses as well as
lower bond stresses at failure for a given embedment length (Hanson & Kaar).
The equation that Dr. Mattock had derived for the transfer length is the expression
currently used and shown in equation 1, but in the case of the development length, Dr. Mattock
had derived an equation which was modified by the ACI Committee in 1962, before it appeared
in the code. Dr. Mattock originally proposed Equation 2-3 for development length (Tabatabai &
Dickson, 1995).
𝐿𝑑 = (1.11 𝑓𝑠𝑢 − 0.77 𝑓𝑠𝑒 ) 𝐷 Equation 2-3
where fse = effective stress in prestressing strand, ksi
fsu = average stress in prestressing strand at ultimate load, ksi
D = db = nominal strand diameter, in
The expression that Dr. Mattock had derived was modified by ACI to Equation 2-4
(Tabatabai & Dickson, 1995):
𝐿𝑑 = ( 𝑓𝑠𝑒
3) 𝐷 + (𝑓𝑠𝑢 − 𝑓𝑠𝑒) 𝐷 Equation 2-4
Since ACI adopted these equations in 1963, and the American Association of State
Highway and Transportation Officials (AASHTO) followed in 1973 (Tabatabai & Dickson,
1995), numerous modifications have been proposed by researchers, in attempts to improve the
accuracy of the equations, and account for the higher compressive strengths of the concrete used

15
in pre-tensioned applications, as well as the strand stress adjustments due to an evolving industry
of strand manufacturing.
In 1976, and after studying a bond related failure of a pre-tensioned application, Martin
and Scott noted that the adopted equations had to be reexamined. In Hanson and Kaar’s study,
on which the code equations were based, the strands were released slowly instead of the
commonly used saw cut or flame cut methods that lead to sudden release of the prestress force.
Because of this slow release method, the strand bonding behavior was not representative of the
industry practice (Martin & Scott, 1976).
Martin and Scott also noted that the equations required reconsideration since the 270 ksi
ultimate strength prestressing strand was becoming more popular at the time. The researchers
also discussed the results obtained during series three of Hanson and Kaar’s experimental
program, where the percentage of prestressing reinforcement was varied, and had significant
effects on the performance of the specimens. Strand bond slip had occurred at 90 percent of the
average calculated design strength for the beams with the lowest percentage of steel used in the
study, at an average of 0.31. This group of beams was the only one out of the three included in
the study that would be of concern, since the percentage of reinforcement included in the other
two groups was over the maximum percentage of steel allowed by code, considering typical
concrete compressive strength of 5 ksi and prestressing strand of 270 ksi ultimate strength
(Martin & Scott, 1976).
The researchers noted that it would be more common to have structural members with
less than 0.31 percent steel, and thus implying that strand bond slip would occur before the
section reaches 90 percent of its calculated design strength, according to Hanson and Kaar’s
findings (Martin & Scott, 1976).
Martin and Scott reevaluated existing test results from prior transfer and development
length studies, and then proposed their code provisions, which implied a much more
conservative expression for the transfer length, set to be equal to 80 times the diameter of
prestressing strand, as seen in Equation 2-5.
Lt = 80 D Equation 2-5

16
The original expression for the transfer length can be estimated as 50 times the strand
diameter, assuming an effective steel prestress of 150 ksi. Martin and Scott’s recommendation
was based on the transfer length study published by Kaar, LaFraugh, and Mass in 1963, where
the strands were released by flame cutting (Martin & Scott, 1976).
Researchers Zia and Mostafa had also published their recommended equations for the
transfer length and flexural bond length, which were developed based on a linear regression
analysis of the data that was available before 1977. Zia and Mostafa’s equation for the transfer
length allows for different concrete compressive strengths at release, initial prestressing forces
and strand diameters to be accounted for, which was reviewed later in a study conducted by
Cousins et al., and was found to be a more conservative expression than the equation adopted by
ACI when it came to larger strand diameters.
Lt = 1.5 ( 𝑓𝑠𝑖
𝑓′𝑐𝑖
) 𝐷 − 4.6 Equation 2-6
Zia and Mostafa based their flexural bond length expression on experimental data from
Hanson and Kaar’s study, and recommended a 25 percent increase to the flexural bond
expression of the development length equation adopted by ACI. Zia and Mostafa’s
recommended transfer and development length equations are shown in Equation 2-6 and
Equation 2-7 (Cousins, Johnston, & Zia, Transfer and Development Length of Epoxy Coated and
Uncoated Prestressing Strand, 1990).
L𝑑 = 1.5 ( 𝑓𝑠𝑖
𝑓′𝑐𝑖
) 𝐷 − 4.6 + 1.25 ( 𝑓𝑠𝑢 − 𝑓𝑠𝑒 ) 𝐷 Equation 2-7
Cousins et al. (1986) conducted a study that was specifically geared towards comparing
the transfer lengths of epoxy-coated prestressing strands to transfer lengths observed for
uncoated strands. It was conducted soon after epoxy-coated strands appeared in the market as a
solution to steel strand corrosion. Single strand beam sections were tested, using 3⁄8, 1⁄2 and 0.6
inch diameter prestressing strands of various surface coating conditions. Transfer length
readings were taken on 13 square beam sections which were prestressed with one concentric

17
strand. Transfer length readings were also taken on the 38 rectangular beams that were
prestressed with a single strand at the lower kern point of the section. The beams were designed
so that the maximum stress level in the concrete after transfer was approximately equal for the
various configurations. The concrete compressive strength of these beams had an average of
4340 psi at release, and an average strength of 5580psi at 28-days from casting (Cousins,
Johnston, & Zia, Transfer Length of Epoxy-Coated Prestressing Strand, 1990). This study
showed that three types of uncoated prestressing strands tested required transfer lengths that
were greater than the lengths predicted by the code equations (Cousins, Johnston, & Zia,
Transfer Length of Epoxy-Coated Prestressing Strand, 1990), agreeing with the previous studies
of Zia and Mostafa, and Martin and Scott (Cousins, Johnston, & Zia, Transfer Length of Epoxy-
Coated Prestressing Strand, 1990) that the current ACI transfer length equation tends to
underestimate the transfer length.
A controversy arose in the Precast/Prestressed Concrete Institute due to Cousins et al.’s
findings, with some of the technical committee members insisting that the ACI code equation
was adequate for all strands, and that the bond failures experienced were due to contaminants on
the strand surface, that simply required cleaning. The rest of the committee members were in
agreement with Cousins et al.’s findings, and as soon as the research material was published, the
strand producers became alarmed. The situation gave birth to Saad Moustafa’s Large Block
Pullout Test (Jurakev, 2004).
In addition, the FHWA was alarmed, and went on to place strict limitations on
prestressing strand (Tabatabai & Dickson, 1995). The memorandum published by FHWA in
1988 banned the use of 0.6 inch diameter strand in pre-tensioned applications, imposed a
minimum strand spacing distance of 4 times the strand diameter, as well as a multiplier of 1.6 to
the development length of fully bonded strands, and a factor of 2.0 to the development length of
de-bonded strands (Akhnoukh, 2008), (Russell & Burns, Design Guidelines for Transfer,
Development and Debonding of Large Diameter Seven Wire Strands in Pretensioned Concrete
Girders, 1993). The restrictions imposed by FHWA required design revisions and equipment
reformatting to the prestressing industry, causing inconvenience and additional expenses to
precast companies at the time. Further investigation of the code equations followed in order to
resolve the issues, and provide better recommendations for the use of 0.6 inch diameter strand.

18
Cousins et al.’s (1986) transfer length study observed that for both uncoated and epoxy-
coated strands the transfer lengths increased with time, with the epoxy-coated strand transfer
lengths experiencing slightly greater rates of increase. Epoxy-coated strands still never reached
the longer transfer lengths of their equivalent uncoated strands. It was also found that the
method used to release the prestressing force affects the beam transfer lengths. In Cousins et
al.’s study, it was observed that the beam ends that were flame-cut for a sudden release of the
prestressing force experienced transfer lengths 8 percent longer than their opposite beam ends
that were saw-cut for gradual release of the force.
Cousins, Johnston and Zia develop analytical models for the transfer and development
length equations, based on an elastic-plastic model. The analysis was made after extensive
review of the existing equations and data from their own experimental program as well as
previous studies; to propose new expressions in 1990, which applied to both uncoated and epoxy
coated strands (Cousins, Johnston, & Zia, Transfer and Development Length of Epoxy Coated
and Uncoated Prestressing Strand, 1990). The equations proposed by Cousins et al. were
developed assuming that bond stress is proportional to slip for small displacements of the strand
during the elastic zone, and also assuming that the bond stress will maintain a maximum yield
value in what is called the plastic zone. The effects of the concrete compressive strength at the
time of prestress transfer were incorporated into the transfer length expression since a review of
prior research findings was indicating that bond strength is proportional to the square root of
concrete compressive strength. The flexural bond length was also idealized in a similar way, but
in this case assuming that the entire bond length is composed of a plastic zone since their data
analysis showed that the elastic region could be neglected. The equation for the flexural bond
length was derived based on the fact that over the plastic bond stress will be resisting the
increase in strand force at the event of failure. The concrete compressive strength at the time of
development length test was incorporated in the flexural bond length expression (Cousins,
Johnston, & Zia, Transfer and Development Length of Epoxy Coated and Uncoated Prestressing
Strand, 1990).
Cousins et al.’s 1990 model was first verified using the experimental data that the
research group had obtained during their previous research program, where they compared the
performance of uncoated and epoxy coated strand of 0.375, 0.5, and 0.6 inch diameter. The
idealized bond stress, bond modulus, and strand stress factors included in the derived equations

19
were determined based on the experimental concrete strain data, and therefore the transfer and
development lengths were calculated for the several specimens of Cousins et al.’s research
program. The concrete compressive strengths for the transfer length specimens one day after
transfer were consistently between 4100-4200 psi. Transfer lengths were also calculated for the
specimens that were specifically fabricated for development length tests, using the average bond
modulus obtained from the transfer length specimens. In this category, the compressive strength
of the specimens one day after transfer ranged from 3890 psi up to 6720 psi. The researchers
also applied their model to data from experimental studies conducted by other researchers in the
past, including tests on 250 ksi as well as 270 ksi strands of 0.375, 0.5, and 0.6 inch diameter.
The compressive strength at time of transfer is noted for every case, and the values vary between
3400 psi and 5500 psi. It should be noted that the model proposed by Cousins et al. was able to
predict the transfer lengths obtained by other researchers, typically overestimating them by an
average of about 20 percent. The equation proposed for the development length was not as
accurate or consistent in predicting experimental data. The researchers explained that
development length parameters should be verified with additional experimental data, and
recommended the expressions shown in Equation 2-8 and Equation 2-9 for the transfer length
and development length respectively (Cousins, Johnston, & Zia, Transfer and Development
Length of Epoxy Coated and Uncoated Prestressing Strand, 1990).
Lt = 0.5 ( U'
t
B ) √f '
ci+ ( fse Aps
πDU't√f '
ci ) Equation 2-8
Ld = 0.5 ( U'
t
B ) √f '
ci+ ( fse Aps
πDU't√f '
ci ) + (
(fps -fse )* Aps
πDU'd√f '
ci ) Equation 2-9
In a comparison of the existing experimental data and proposed transfer and development
length expressions in the literature, Cousins et al. showed that the adopted ACI code equations,
as well as the expression proposed by Zia and Mostafa, are not conservative for uncoated
strands. It was also noted that Martin and Scott’s transfer length equation was the most
conservative for uncoated strand (Cousins, Johnston, & Zia, Transfer and Development Length
of Epoxy Coated and Uncoated Prestressing Strand, 1990).

20
Shahawy et al. (1992) developed a transfer length equation after evaluation of their
experimental findings from three research programs funded by the Florida Department of
Transportation (FDOT) (Akhnoukh, 2008). Their equation proposed changing the ACI 318
transfer length equation by replacing the effective prestress stress term by the initial stress that
the strands experience before prestress losses, as shown in Equation 2-10:
Lt = 1
3 𝑓𝑠𝑖𝐷 Equation 2-10
Equations were proposed by researchers at Purdue, McGill University, and the University
of Texas at Austin in 1993, and they were followed by a proposal published in the PCI Journal in
1994, made after experimental research was conducted by Deatherage et al. at the University of
Tennessee at Knoxville, originally published in 1991 (Akhnoukh, 2008).
During the extensive study conducted at the University of Texas at Austin, and published
by Russell and Burns in 1993, both 0.5 inch and 0.6 inch diameter strands were tested, and
experimental data were compared to the ACI and AASHTO expressions, Shahawy’s proposed
equations, as well as to results from related studies performed during the early 1990s at other
institutions. The authors had indicated that the expression previously proposed by Shahawy
(fsi/3*db) was successful at predicting the behavior of strand embedded in the rectangular
sections tested by Russell and Burns, but not for the rest of the specimens in the study (Russell &
Burns, Design Guidelines for Transfer, Development and Debonding of Large Diameter Seven
Wire Strands in Pretensioned Concrete Girders, 1993).
Russell and Burns tested strand in rectangular beam sections, as well as AASHTO-type
beams and Texas Type C girders utilizing various strand configurations. The strands in Russell
and Burns’ study were initially tensioned to 202.5 ksi, and for most of the specimens, release of
prestressing was accomplished 48 hours after casting, at concrete compressive strengths ranging
between 3853 and 4792 psi (Russell & Burns, Design Guidelines for Transfer, Development and
Debonding of Large Diameter Seven Wire Strands in Pretensioned Concrete Girders, 1993).
The first 18 single strand specimens were flame cut at full tension, but since this
procedure caused damage to the specimens, the multiple strand specimens were flame cut after
being de-tensioned gradually down to 70 percent of their full tension, and the transfer length
readings from these specimens were closely correlated with the AASHTO-type beams and Texas

21
Type C girders which were also flame cut at 100% tension like the single strand specimens. The
effects of strand diameter, strand spacing, de-bonding, size of cross section, and confining
reinforcement on beam transfer lengths were investigated during Russell and Burns’ study
(Russell & Burns, Design Guidelines for Transfer, Development and Debonding of Large
Diameter Seven Wire Strands in Pretensioned Concrete Girders, 1993).
During their transfer length study, Russell and Burns tested 65 specimens, including
rectangular sections, AASHTO-type cross sections and also Texas type C girders. The authors
did not investigate the effects of concrete compressive strength based on the conclusions made
by Kaar, LaFraugh, and Mass that concrete compressive strength will not affect transfer length,
even though they noted that preliminary findings from other research projects indicated that
higher concrete compressive strengths result in shorter transfer lengths. Russell and Burns
actually mentioned that for the few specimens included in their study that were below their
specified concrete compressive strength, the transfer lengths were consistently longer than their
equivalent beams that reached specified strengths (Russell & Burns, Design Guidelines for
Transfer, Development and Debonding of Large Diameter Seven Wire Strands in Pretensioned
Concrete Girders, 1993).
A very important finding from Russell and Burns’ transfer length study was that for
larger cross sections prestressed with greater number of strands, the transfer lengths were
significantly shorter than specimens prestressed with fewer strands. The researchers determined
that strand surface condition was the most effective variable on the transfer lengths (Russell &
Burns, Design Guidelines for Transfer, Development and Debonding of Large Diameter Seven
Wire Strands in Pretensioned Concrete Girders, 1993).
AASHTO-type girders as well as rectangular sections were tested during the
development length study by Russell and Burns. Some of these specimens were prestressed with
0.5 inch diameter strands while others were prestressed with 0.6 inch diameter strands. The
concrete compressive strengths for the beams prestressed with 0.5 inch diameter strands were
between 5110 and 6790 psi, and for the beams prestressed with 0.6 inch diameter strands
between 6260 and 7440 psi. The researchers determined the transfer lengths for their specimens
using the 95% Average Maximum Strain method, a procedure that was established during
Russell and Burns’ research project 3-5-89-1210, “Influence of Debonding Strands on Behavior
of Composite Prestressed Concrete Girders” (Russell & Burns, Design Guidelines for Transfer,

22
Development and Debonding of Large Diameter Seven Wire Strands in Pretensioned Concrete
Girders, 1993).
The 95% Average Maximum Strain method is a transfer length determination procedure
that is based on averaging the concrete strain readings that fall in or near the plateau of a fully
effective prestress force, and taking the 95% of that average. The method might have been
criticized because it doesn’t take into consideration the fully effective concrete strain, but holds
the advantage of predicting values that will be relatively free of arbitrary interpretation, and also
provides the security that the projected value will not be significantly different in the case of
including or excluding 1-2 points in error. The average transfer length reported for the 0.5 inch
diameter strands tested during this study was 30 inches; and 40.9 inches for the 0.6 inch diameter
strands (Russell & Burns, Design Guidelines for Transfer, Development and Debonding of Large
Diameter Seven Wire Strands in Pretensioned Concrete Girders, 1993).
After comparing the behavior of 0.6 inch diameter strands that of 0.5 inch diameter
strands tested in concrete specimens during Russell and Burn’s experimental study, the authors
reported similar transfer lengths as well as concrete strain profiles for the specimens prestressed
with either size diameter strands, and concluded that the restrictions on the use of 0.6 inch
diameter strands in pretensioned applications by the FHWA be reconsidered. The authors
suggested that 0.6 inch diameter strands at 2 inch spacing be used with the same provisions as
other size strands. Russell and Burns also found that strand bond failures will only occur when
cracks propagate in the prestressing strand transfer zone. They concluded that the expression
shown in Equation 2-11 should be used for the transfer length (Russell & Burns, Design
Guidelines for Transfer, Development and Debonding of Large Diameter Seven Wire Strands in
Pretensioned Concrete Girders, 1993).
Lt = 1
2 𝑓𝑠𝑒𝐷 Equation 2-11
Development lengths were also determined during Russell and Burns’ study, after static
loading of both ends of each beam until failure. 28 tests were conducted on rectangular
specimens as well as AASHTO type sections. The authors reported that the development lengths
of 0.5 inch diameter strands in rectangular single strand specimens were much longer than

23
expected (Russell & Burns, Design Guidelines for Transfer, Development and Debonding of
Large Diameter Seven Wire Strands in Pretensioned Concrete Girders, 1993).
By 1993, multiple proposals for transfer and development length equations were
contradicting each other. The FHWA decided to review the existing data obtained from studies
conducted across the United States, in an attempt to bridge the gap between the various
recommended expressions for transfer and development length, in order to come up with a
recommendation.
On behalf of the FHWA, Dr. Dale Buckner reviewed the existing expressions for the
transfer length, and concluded that the equation that was proposed by Shahawy et al. after the
FDOT studies was appropriate for estimating the transfer length. Dr. Buckner based his
conclusion that the code equation was not conservative since the equation was derived based on
the average bond stress of Grade 250 strands, and switching to Grade 270 meant a 6% increase in
cross sectional area of strands compared to their equivalent Grade 250 strands of equal nominal
diameter. The 6% larger cross sectional area of prestressing strands predicts 6% longer expected
transfer lengths, and in addition to that, a 20% increase in transfer length would be expected for
the case of low relaxation strands due to the higher strand stress that low relaxation strands
experience after transfer (Buckner, 1995).
Dr. Buckner also reviewed the ACI code equation for the development length, as well as
the major previously proposed development length expressions, and concluded by
recommending an alternative equation based on his transfer length recommendations, and also
Hanson and Kaar’s variable bond stress approach. Dr. Buckner proposed a development length
expression that is more conservative than the development length equation seen in ACI code,
stating that the code expression was not adequately predicting the development length of
prestressing strands, but failures were avoided since the development length does not prevail in
prestressed concrete design. Dr. Buckner made a fair statement that a conservative expression
for the development length is necessary, because sudden failures without adequate warning could
occur in the possibility of shear related bond failures. Dr. Buckner added that both of his
recommended expressions should be multiplied by a factor of 1.3 for any straight or draped
strands that end up in the upper 1/3 of a member’s depth and have 12 in. or more of concrete cast
beneath them. Dr. Buckner’s recommended expressions are shown in Equation 2-12 and
Equation 2-13 respectively for the transfer and development length (Buckner, 1995).

24
Lt = 1
3 𝑓𝑠𝑖𝐷
Equation 2-12
Ld = 1
3 𝑓𝑠𝑖𝐷 + 𝜆 (𝑓𝑠𝑢 − 𝑓𝑠𝑒) 𝐷 Equation 2-13
Following Dr. Buckner’s report, the FHWA revisited their 1988 restrictions on 0.6 in
diameter prestressing strand in pre-tensioned applications in a memorandum released in 1996.
The use of 0.6 inch diameter strand was allowed at a spacing distance of 2 inches, while 0.5 inch
diameter strands were specified to be spaced at 1.75 inches. The factor of 1.6 which was imposed
on the code development length equation in 1988 was kept until further validation (Akhnoukh,
2008).
Gross and Burns reexamined the transfer and development length equations as they tested
rectangular beams prestressed with 0.6 inch diameter strands. The strands were placed in
rectangular beams that were14 inches wide by 42 inches deep, with six strands spaced at 2 inches
in each beam. The beams were made using high performance concrete, and were designed for
6000 psi release strength, and 8000 psi 28-day strength (Gross & Burns, 1995). The average
transfer length measured in this study was 14.3 inches, lower than the transfer lengths obtained
by previous studies using high performance concrete. The average development length
measured during Gross and Burns study was 78 inches. With experimental transfer and
development lengths being lower than the lengths calculated by the code equations, the
researchers concluded that the code expressions for both the transfer and development lengths
were conservative. The short transfer lengths measured could be because the strand used had a
rusty surface condition (Gross & Burns, 1995).
An experimental research program led by Susan Lane at the FHWA in 1998 was
conducted in order to reevaluate the transfer and development length of prestressing strand.
During this study, the effectiveness of multiple parameters was investigated, some of which were
included into the transfer and development length expressions that they proposed. During the
first phase of the study, 50 rectangular beam specimens were tested, containing either one or
fours strands, and these were with 3/8 inch diameter, 0.5 inch, or 0.6 inch diameter strands,
uncoated or epoxy-coated (Lane, 1998). The second phase of this study incorporated testing 270
ksi low relaxation strand in normal strength as well as high strength concrete AASHTO type II

25
girders. 0.5 inch or 0.6 inch diameter strands were used in the study, embedded in the girders in
3 patterns. Patterns R and T girders included 8 strands, while pattern S girders included 9
strands in a single row at the bottom flange of the beam. The study included 6 of each pattern R
and T girders, and 4 pattern S girders. Flame cutting was used to de-tension all of the specimens
in this study. A 30 percent increase in transfer length was observed between the strand release
and 28 days for the beams prestressed with uncoated strands. This mirrors the transfer and
development length increase also reported by Russell and Paulsgrove. The recommended
expressions for the transfer length and development length from this study are shown in Equation
2-14 and Equation 2-15 (Lane, 1998).
Lt = 4 𝑓𝑝𝑡
𝑓′𝑐𝐷 − 5 Equation 2-14
Ld= 4 𝑓𝑝𝑡
𝑓′𝑐𝐷 − 5 +
6.4 ( 𝑓𝑠𝑢 −𝑓𝑠𝑒 ) 𝐷
𝑓′𝑐+ 15 Equation 2-15
A new development length expression was proposed in 2001 by Shahawy, and was based
on the test results from previously led test programs that took place at the FDOT structures
research center. Shahawy performed an evaluation of the development length tests conducted on
solid and voided prestressed slabs, AASHTO Type II Girders, and prestressed concrete piles.
The solid and voided slabs were tested under static loading conditions, with the incremental
loads applied at varied locations up to failure. AASHTO Type II girders of 3 different strand
configurations were tested at FDOT, by application of a single concentrated load also applied
incrementally to failure. It was observed that shear cracking at the end regions of the girders
affected the bond behavior of prestressing strand. Prestressed concrete piles of 6 different
configurations were also tested up to failure by applying an incremental point load at various
distances from the support (Shahawy, 1999). Shahawy recommended the development length
expression shown in Equation 2-16 (Akhnoukh, 2008):
Ld = 1
3 𝑓𝑠𝑖𝐷 +
( 𝑓𝑝𝑠 −𝑓𝑠𝑒 ) 𝐷
1.2+ 𝐾 Equation 2-16

26
An evaluation of the code requirements for 270 ksi, 0.6 inch diameter prestressing strand
was made by Kose and Burkett. In this study, fully bonded as well as de-bonded 0.6 inch
diameter strands was used in AASHTO-Type II beams of various concrete strengths, in order to
investigate the effects of concrete compressive strength on the transfer and development lengths
of prestressing strands. The research program goal was to establish a new basis for transfer and
development length code requirements, taking into account that high strength concrete is more
commonly utilized in the industry during recent years (Kose & Burkett, 2005).
In Kose and Burkett’s study, three groups of beam specimens were tested at Texas Tech
University, and t University of Texas at Austin. The 3 groups of beams were designed to range
in the following categories; 5000-7000 psi, 9500-11500 psi, and 13000-15000 psi. Specimens
were divided into subgroups according to the percentage of de-bonded reinforcement in the
section, and whether the surface of the strands used in the member was bright or rusty. The
experimental transfer and development lengths were compared to the ACI code equations,
AASHTO LRFD standard, and also Buckner’s and Lane’s proposed expressions. In only one
case, the short term transfer length (at release) was exceeding the ACI code value, and none
exceeded the AASHTO LRFD requirements, Buckner’s or Lane’s predictions. It was observed
that strand de-bonding increases the development length of the strand, and that the code
equations overestimate the development length of fully bonded prestressing strands (Kose &
Burkett, 2005). The equations proposed by Buckner and Lane were characterized as very
conservative for the case of fully bonded strands but less conservative for the case of de-bonded
strands (Kose & Burkett, 2005). Kose and Burkett went on to propose alternative expressions
for both the transfer length and development length, based on their findings (Akhnoukh, 2008).
In 2008, a report for the National Cooperative Highway Research Program was published
by Ramirez and Russell, after completion of the NCHRP Project 12-60. The authors were
concerned that the current code expressions do not include the factor of concrete compressive
strength, which was found to affect significantly the transfer and development lengths measured
during the NCHRP Project 12-60, a finding that came to confirm the results published previously
by researchers who conducted experimental programs before Ramirez and Russell’s study
(Ramirez & Russell, 2008).
Ramirez and Russell specified that the adopted transfer and development length
equations are capable of predicting bonding behavior of prestressing strands embedded in normal

27
strength concrete of 4 ksi release strength. The authors tested both 0.5 inch and 0.6 inch
diameter strands in concrete specimens with release strengths that varied from 4 ksi to 10 ksi. It
was found that there was correlation between Ramirez and Russell’s tests results and the NASP
Bond Test, also developed by Russell before the NCHRP study, and just recently adopted by
ASTM as ASTM A1081 (ASTM A1081, 2012).
For the purpose of this study, the NASP Bond Test was modified in order to utilize
concrete instead of mortar, and the authors were able to develop relationships between the
standard mortar NASP test and the modified concrete NASP test, and therefore conclude with
expressions that are able to estimate the standard mortar NASP pullout test values for
prestressing strands, according to the concrete strength of the specimen they are tested in. The
transfer length data from the NCHRP Project 12-60 showed that the transfer lengths are inversely
related to the concrete release strength, and concluded with a proposed expression for the
transfer length which is shown in Equation 2-17 (Ramirez & Russell, 2008):
Lt = 120 D
√f 'ci
≥40 D Equation 2-17
Ramirez and Russell’s data analysis indicated that the development length also reduces
with increasing concrete release strengths, and the authors proposed an expression for the
development length as well, shown in Equation 2-18 (Ramirez & Russell, 2008).
[120
√f 'ci
+ 225
√f 'c
] D≥100 D Equation 2-18
The original code equations as well as many of the expressions proposed throughout the
years and some of the modifications adopted by ACI and AASHTO are listed in Table 2-1.

28
Table 2-1 Code Adopted and Proposed Equations for Transfer and Development Length
Transfer Length, Lt Development Length, Ld
Alan Mattock
1962
1
3 𝑓𝑠𝑒𝐷 [2-1] ( 1.11 𝑓𝑠𝑢 − 0.77 𝑓𝑠𝑒 ) 𝐷 [2-3]
ACI 318
1963
1
3 𝑓𝑠𝑒𝐷 [2-1]
1
3 𝑓𝑠𝑒𝐷 + ( 𝑓𝑠𝑢 − 𝑓𝑠𝑒 ) 𝐷 [2-4]
Martin and Scott
1976
80 𝐷 [2-5]
Zia and Mostafa
1977 1.5 (
𝑓𝑠𝑖
𝑓′𝑐𝑖
) 𝐷 − 4.6 [2-6] Lt + 1.25 ( 𝑓𝑠𝑢 − 𝑓𝑠𝑒 ) 𝐷 [2-7]
FHWA
1988 1.6 [
1
3 𝑓𝑠𝑒𝐷 + ( 𝑓𝑠𝑢 − 𝑓𝑠𝑒 ) 𝐷]
Cousins et al.
1990 0.5 (
U't
B ) √f '
ci+ ( fse Aps
πDU't√f '
ci
) [2-8] Lt + ( (fps -fse )* Aps
πDU'd√f '
ci
) [2-9]
Shahawy
1992
1
3 𝑓𝑠𝑖𝐷 [2-10]
Abdalla et al.
1993
1
3 𝑓𝑠𝑒 + 1.7 (𝑓𝑝𝑠 − 𝑓𝑠𝑒) 𝐷
Mitchell et al.
1993 0.33 fsi D√
3
f 'ci
+(fps- fse) D√4.5
f 'c
Russell and Burns1993 1
2 𝑓𝑠𝑒𝐷 [2-11]
Deatherage et al.
1994 1
3 𝑓𝑠𝑖𝐷 + 1.5 (𝑓𝑝𝑠 − 𝑓𝑠𝑒) 𝐷
Buckner
1995
1
3 𝑓𝑠𝑖𝐷 [2-12] Lt + 𝜆 (𝑓𝑠𝑢 − 𝑓𝑠𝑒) 𝐷 [2-13]
Lane
1998
4 𝑓𝑝𝑡
𝑓′𝑐𝐷 − 5 [2-14] Lt +
6.4 ( 𝑓𝑠𝑢 −𝑓𝑠𝑒 ) 𝐷
𝑓′𝑐+ 15 [2-15]
Shahawy
2001
1
3 𝑓𝑠𝑖𝐷 +
( 𝑓𝑝𝑠 −𝑓𝑠𝑒 ) 𝐷
1.2+ 𝐾 [2-16]
Ramirez and
Russell2008
120 D
√f 'ci
≥40 D [2-17] [120
√f 'ci
+ 225
√f 'c
] D≥100 D [2-18]

29
The transfer and development length for a common set of assumed conditions was
calculated for each of the equations given in Table 2-1. The assumed values for these equation
factors were selected based on the beam study conducted by Kansas State University at Stresscon
Inc., with the exception of the values for the expressions U’t, U’d and B, which are taken as
suggested by Cousins et al (Cousins, Johnston, & Zia, Transfer and Development Length of
Epoxy Coated and Uncoated Prestressing Strand, 1990). Table 2-2 lists the symbol, description,
and assumed value substituted for each of the equation factors, in order to calculate the transfer
and development length expressions.
Table 2-2 Equation Symbol Description and Assumed Values for Numerical
Representation of Adopted and Proposed Transfer and Development Length Equations
Symbol Description Assumed value
D nominal diameter of prestressing strand 0.5 in
Aps cross-sectional area of prestressing strand 0.153 in2
fse effective stress in prestressing strand after
losses 184 ksi
fsu ultimate strength of prestressing strand 270 ksi
fps stress in prestressed reinforcement at
nominal strength 263 ksi
fpi= fsi initial stress in strand before losses 198 ksi
f’ci concrete compressive strength at transfer 3500 psi
f’c 28-day concrete compressive strength 6000 psi
U’t plastic transfer bond stress 6.7
U’d plastic bond stress for development 1.32
B bond modulus 300 psi/in
λ=0.72+(0.102*β1* f’c*b*de)/(fps * Aps),
where:
multiplying factor applied to flexural bond
length
β1 ratio of depth of equivalent rectangular
stress block to depth of neutral axis
0.75 for
f’c= 6000 psi
B width of compression face of member 6.5in
de effective depth from compression face to
center of gravity of prestressed
reinforcement in tension zone
10 in
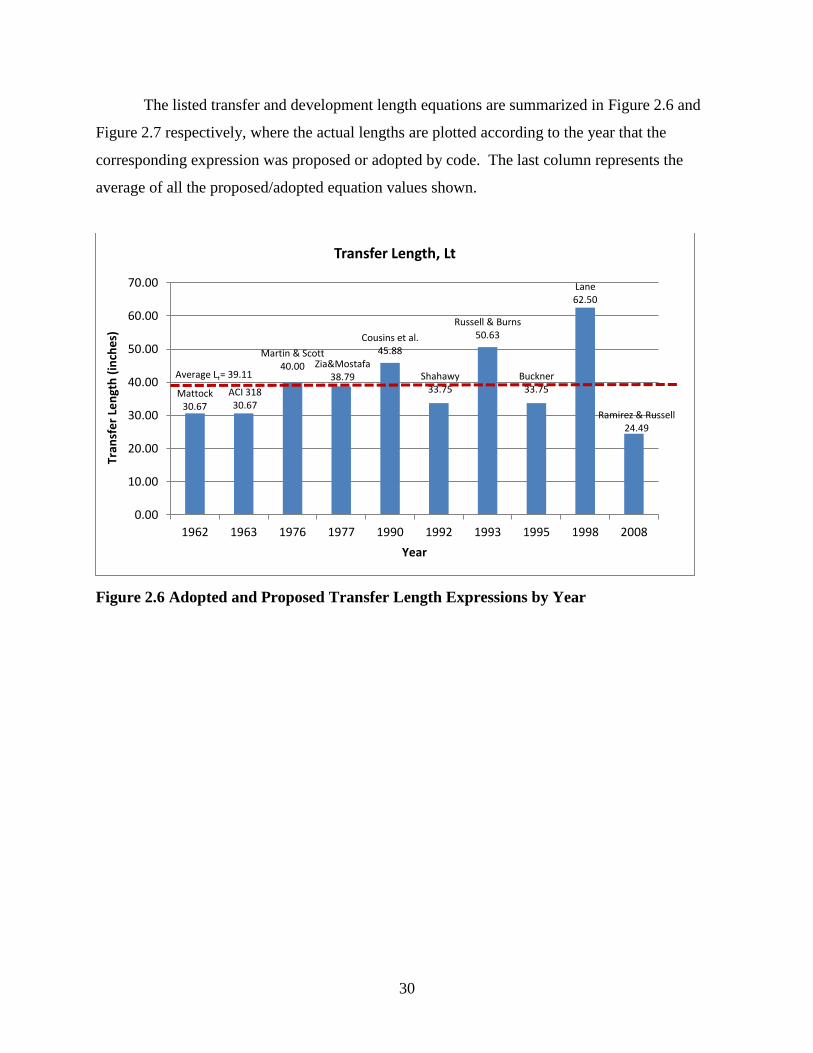
30
The listed transfer and development length equations are summarized in Figure 2.6 and
Figure 2.7 respectively, where the actual lengths are plotted according to the year that the
corresponding expression was proposed or adopted by code. The last column represents the
average of all the proposed/adopted equation values shown.
Figure 2.6 Adopted and Proposed Transfer Length Expressions by Year
Mattock30.67
ACI 31830.67
Martin & Scott40.00 Zia&Mostafa
38.79
Cousins et al.45.88
Shahawy33.75
Russell & Burns50.63
Buckner33.75
Lane62.50
Ramirez & Russell24.49
0.00
10.00
20.00
30.00
40.00
50.00
60.00
70.00
1962 1963 1976 1977 1990 1992 1993 1995 1998 2008
Tran
sfe
r Le
ngt
h (
inch
es)
Year
Transfer Length, Lt
Average Lt= 39.11

31
Figure 2.7 Adopted and Proposed Development Length Equations by Year
2.5 Strand Testing
The most accurate way to evaluate strand bond performance is through testing a beam’s
transfer length, but since this is not a cost or time effective method, various pull-out test
procedures have been suggested throughout the years, with the latest method being accepted by
ASTM International in 2012 as the “Standard Test Method for Evaluating Bond of Seven-Wire
Steel Prestressing Strand”, and designated ASTM A1081/A1081M-12 (ASTM A1081, 2012).
There have been concerns that with simple pullout testing of un-tensioned strand it is not
possible to predict bonding performance in a pre-tensioned beam, but experimental programs
have shown correlation between simple pullout test results and beam transfer lengths. Pullout
testing of un-tensioned strand is actually a conservative way to evaluate strand bond, since the
frictional bonding benefits observed in tensioned applications due to the Hoyer’s effect are not
encountered.
The oldest pullout test proposed as a 7-wire strand bond acceptance test was performed
by Dr. Saad Moustafa in 1974 at Concrete Technology Corporation (CTC), and therefore named
the Moustafa test. This un-tensioned strand pullout test was performed on 0.5 in diameter
strands, to determine if they had enough capacity to be used as lifting loops. The test
incorporated pulling strand specimens that were embedded into a concrete block, utilizing a
Mattock47.73
ACI 31873.67
Zia & Mostafa92.54
FHWA117.87
Cousins et al.121.13
Abdalla et al.128.48
Mitchell et al.65.14
Deatherage et al.93.00
Buckner76.75
Lane123.37
Shahawy66.67
Ramirez & Russell78.00
0.00
20.00
40.00
60.00
80.00
100.00
120.00
140.00
1962 1963 1977 1988 1990 1993 1993 1994 1995 1998 2001 2008
De
velo
pm
en
t Le
ngt
h (
inch
es)
Year
Development Length, Ld
Average Ld= 90.36

32
hydraulic jack, which was driven by an electric powered hydraulic pump. An 18-inch length of
the strand specimens was embedded into the hardened concrete, and pulled during a process that
lasted less than 2 minutes. CTC and Dr. Saad Moustafa conducted a second round of Moustafa
pullout tests in 1992, this time to address a lifting loop failure that took place at CTC, and also
the anchorage failures observed abundant in the rock anchor industry at the time (Rose &
Russell, 1997).
In the meantime, tensioned pullout tests were performed by Brearly and Johnston, the
results published in the Journal of Structural Engineering in 1990. These tensioned pullout tests
involved having 12 inches of strand samples embedded into single strand specimens, pulled at a
much slower rate compared to the Moustafa test; and even allowing for complete strand slipping
between pulling load increments. The tensioned pullout test was slightly altered by Cousins,
Bateaux and Moustafa for their series of tests that was reported in the PCI Journal in 1992, while
another series of tensioned pullout test results was published in the ACI journal in 1993, by
Abrishami and Mitchell, who also slightly altered the original procedure for the tensioned pullout
test. All three versions of the tensioned pullout test had a strand embedment length of 12 inches,
and conducted using the slow pulling approach. The results from the three tensioned pullout test
versions revealed that slower pullout rates implied lower ultimate pullout forces (Rose &
Russell, 1997).
In 1997, Rose and Russell published their findings from an experimental program that
was aiming to identify the method that could predict strand bond behavior most accurately, by
comparing the simple or un-tensioned pullout test method known as the Moustafa test, and the
tensioned pullout test, along with the measured strand end slip method. It was concluded that the
tensioned pullout test proposed was not able to predict prestressing bond, and the researchers
recommended further testing towards development of a simple pullout test procedure based on
the Moustafa test, which proved to predict the bond performance of strand in a previous study
conducted by Logan in 1994 (Rose & Russell, 1997).
Succeeding these findings, an extensive study was funded by the North American Strand
Producers (NASP), the main objective of which was to evaluate three existing untensioned strand
test methods, and determine the most reliable method to be adapted for testing ½ inch diameter 7
wire prestressing strand bond. Along with the Moustafa test, the investigation included the PTI
pullout test, as well as the Friction Bond test.

33
What is known as the PTI pullout test or the Prestressing Strand Bond Capacity Test is
the procedure used by the Post-Tensioning Institute (PTI) to test the bonding capabilities of 0.6
inch diameter prestressing strand in grout, which is used in prestressed ground anchors. This
procedure is now established as ASTM A981 or the Standard Test Method for Evaluating Bond
Strength for 0.6 inch Diameter Steel Prestressing Strand, Grade 270, Un-coated, used in
Prestressed Ground Anchors. The PTI pullout test incorporated testing individual strand samples
casted in 5 inch outer diameter steel grout cylinders, with force applied on the specimens at a rate
of 0.1 inch/minute by a hydraulic or mechanical jack at the lower end of the specimen. The
outcome of this procedure was the force reading that produced a displacement of 0.01 inches at
the unloaded end of the specimen, which indicated the strand’s bond strength (Russell &
Paulsgrove, NASP Strand Bond Testing Round I, 1999).
The third pullout test procedure evaluated by the NASP study was the Friction Bond
Pullout Test. In the case of the Friction Bond Test, the strand specimens are pulled in tension
without being casted into cementitious material. Two bare lengths of a strand sample are
mechanically spliced together, and put under tension as a hydraulic cylinder moves the upper
cross head of the testing setup until failure of the mechanical splice. The test outcome is the
maximum tensile load applied on the specimen (Russell & Paulsgrove, NASP Strand Bond
Testing Round I, 1999).
The first round of the NASP study was completed in 1999 at the University of Oklahoma,
led by Professor Bruce Russell. During the first round of the study, 11 strand samples were
tested, with one round of the Moustafa pullout tests performed at Stresscon Corporation in
Colorado Springs, CO, and two rounds of the Moustafa pullout test performed in Jacksonville,
FL by Florida Wire and Cable (FWC). The PTI pullout tests were also performed by FWC, and
finally the steel to steel friction bond tests were performed at the University of Oklahoma.
Analysis of the Moustafa test results indicated that the results were highly biased by their test
location, since there was inconsistency between the two laboratories with the Stresscon results
being consistently higher than the FWC results (Russell & Paulsgrove, NASP Strand Bond
Testing Round I, 1999).
The Moustafa pullout test method proved to be generally effective in ranking the strands’
bond performance relative to one another, but was considered to be improper for strand
acceptance as some samples would be inconsistently accepted or rejected depending on their

34
testing laboratory. The PTI pullout test method was also characterized as reliable in ranking the
strands’ relative bond performance, but the Friction Bond Test was found to be unable to
differentiate the strands’ bond performance properly (Russell & Paulsgrove, NASP Strand Bond
Testing Round I, 1999).
In conclusion, the authors identified that all three tests were unable to adequately measure
the prestressing strands’ bonding capacities, and recommended an ongoing investigation in order
to improve the Moustafa test, and generate alternative procedures so that the variability of the
existing Moustafa test method and the PTI test method would be diminished (Russell &
Paulsgrove, NASP Strand Bond Testing Round I, 1999).
A second round of the NASP study followed, where the existing Moustafa and PTI tests
were investigated along with a new proposed version of the test called the NASP pullout test.
The NASP pullout test procedure is similar to that of the PTI pullout test, but instead of using
grout to cast the strands in, sand-cement mortar is used for the NASP pullout test. Additionally,
for the NASP pullout tests the load on the strand specimen was recorded not only at 0.01 inch
strand slip, but also at 0.1 inches strand slip, as well as maximum load.
Nine different strand samples were tested overall during the second round of the NASP
study, with testing taking place at the following sites; Moustafa pullout tests were run at
Stresscon Corp., Colorado Springs, Colorado; at Florida Wire and Cable, Inc., Jacksonville,
Florida, and also at the University of Oklahoma, Norman, Oklahoma. The PTI pullout tests were
performed at Florida Wire and Cable, Inc., Jacksonville, Florida, and at the University of
Oklahoma, Norman, Oklahoma; the two locations were the NASP pullout test series were also
performed.
The researchers found that all three of the test methods were able to differentiate between
strands of good quality bond and those of poor quality bond. The NASP pullout test method
performed more consistently than the Moustafa and PTI test methods, where the PTI method
presented the greatest variability within the three. It was also noted that for both the NASP and
PTI test methods, variability increased significantly when measurements were taken at 0.01 inch
end slip instead of 0.1 inch. Russell and Paulsgrove recommended that the NASP test method be
advanced further for the development of a strand acceptance test for measurements at 0.1 inch
(Russell & Paulsgrove, NASP Strand Bond Testing Round II, 1999).

35
A third round of the NASP study followed, aiming to investigate the repeatability and
reproducibility of the three pullout test methods, as well as to define a minimum threshold for
bond as tested by the pullout methods. The study involved running the three pullout test
methods at multiple laboratories, and also correlating the test results to transfer and development
length tests as a basis for determining the threshold.
Ten strand groups were used in the third round of the NASP study, and were tested by the
three pullout test methods. Four out of the ten strand groups were selected based on their pullout
test performance, and used in prestressed concrete beams to implement transfer and development
length testing.
Four beams per strand group were cast for the execution of the concrete beam testing
program. Strand end slip readings were taken at various ages, and therefore transfer lengths
were calculated accordingly. The beams were later loaded to failure and tested at various
embedment lengths, thus flexural bond and strand development were investigated.
The Moustafa pullout tests, PTI bond tests, and the NASP pullout tests were performed at
Florida Wire and Cable (FWC), as well as at the University of Oklahoma. For both the PTI and
NASP pullout test series, the researchers had analyzed data at 0.01 inch and 0.1 inch end slip,
along with the maximum pullout force case for each strand source.
Russell and Paulsgrove reported that the strand source that performed the most poorly in
the pullout testing series had the longest end slips and therefore transfer lengths at 28 days, and
as expected, the strand source the performed the best during the pullout testing series was the one
with the shortest end slips measured and therefore the shortest transfer lengths at 28 days.
The Moustafa test data and the PTI bond test data at 0.01 inches indicated that the two
methods are not capable of ranking strand sources consistently amongst multiple laboratories,
while the NASP test at 0.1 inches was the most consistent in ranking the ten strand sources
between the two testing sites. The results from the third round of the NASP study had confirmed
the researchers’ findings during the second round; the NASP pullout test was shown to be the
most reliable method in ranking strand sources consistently at multiple laboratories.
In addition to the inconsistent ranking of strands between laboratories, low correlation of
the pullout test results to the calculated transfer lengths for the four strand sources that were
tested in beams had shown that the Moustafa pullout test was not a reliable method in predicting
strand bond performance.

36
For the case of the PTI bond test, correlation was evaluated between results from the
pullout tests at 0.1 inch end slip and beam transfer lengths. The data indicated strong correlation
when transfer lengths were correlated to PTI bond test results from Florida Wire and Cable, and
weak correlation when compared to PTI bond test results from the University of Oklahoma. The
researchers concluded that the overall correlation of the PTI test values to the transfer lengths
was not significant, and therefore the test proved unreliable in predicting strand bond
performance as well.
The NASP pullout test results had the highest correlation to the transfer length values,
when compared to the other two strand bond predicting methods. The NASP test at 0.1 inch end
slip was also more consistent amongst test sites, therefore the researchers concluded that it was
the most reliable method to predict strand bond performance, and recommended further
exploration of the new pullout testing method before adaptation.
The development length testing conducted on beams during the third round of the NASP
study revealed that the beams that met their nominal flexure capacities when tested at 100% of
the development length were prestressed with strands that tested at a minimum of 7,300 lb NASP
pullout test load at 0.1 inch displacement as an average of six specimens, and at 5,500 lb NASP
pullout test load at 0.1 inch displacement as a result for individual strand specimens (Russell B.
W., NASP Strand Bond Testing Round III).
Before the NASP study proceeded with a fourth round of testing, another study was
conducted at the University of Arkansas, and was focused on comparing the repeatability and
practicality of the NASP test method to the Moustafa or Large Block Pullout Test (LBPT), and
findings were published in August 2005. During this research program, six strand types were
tested using the two pullout test methods, and conclusions were drawn that both test methods
were able to reliably distinguish between high, middle, and low bond performing strands, and
noted that the two methods showed similar coefficients of variation. Furthermore, it was
discussed that the Large Block Pullout Test involves the use of heavy equipment and therefore it
will be difficult to perform at many laboratories, and was considered a less practical procedure
(Sobin, 2005).
Succeeding these conclusions, results from the fourth round of the NASP study were
published by Russell in 2006. The last round of the study was focused on developing the NASP

37
bond test, and performing round robin test trials at three laboratories; those of Oklahoma State
University, Purdue University, and the University of Arkansas.
During the first part of the fourth round of the NASP study, the effects of the mortar
compressive strength, testing with load control versus displacement control, mortar mixture flow,
loading rate of displacement controlled tests, as well as the effects of curing temperature were
investigated as part of the test protocol refinement process.
The results from Oklahoma State University revealed that using a different cement
source, even at consistent mix proportions can alter the mortar mixture compressive strength
values, therefore it was added that trial batches should be made every time a new cement source
is introduced. Furthermore, it was shown that the mortar compressive strength is inversely
related to the water to cement ratio. It was also indicated that the mortar mixture flow increases
with increasing water to cement ratios, and decreases significantly over time which proved that
for consistent mixture flows the measurements should be completed as soon as possible after
mortar mixing.
Specimen curing temperature increase was able to raise the compressive strength of the
samples as expected, therefore maintaining a consistent curing environment in the laboratory is
crucial. Another finding, the fact that fresh unit weight did not assist in predicting mortar
mixture properties, encouraged the author to avoid setting any limits regarding mortar unit
weight to the NASP test protocols.
The mortar mixture compressive strength was indeed a critical factor to the NASP test
results. The higher the compressive strengths, the higher the pullout test results, especially for
the better bonding strand samples. It was reported that various types of strands can be
differentiated and ranked more easily when the samples obtain higher compressive strengths.
As far as the testing methods are concerned, it was recommended to keep testing the
NASP specimens by displacement controlled loading. The effect of different loading rates as a
result of variable testing frame stiffness was also investigated, but no significant correlation was
observed.
A third version of the test was published; the “official version” of the bond test which
was adopted in 2006 by the North American Strand Producers. The test protocol had undergone
sample preparation and testing procedure modifications since the initial protocol of 2001, but the
basic testing procedure remains unchanged.

38
The second part of this fourth round of the NASP study was basically a round robin test
series where test results from Oklahoma State University were compared to results from Purdue
University and the University of Arkansas. Data analysis showed that the NASP test is a
reproducible strand bond test amongst testing sites and materials (Russell B. , NASP Round IV
Strand Bond Testing, 2006).
The final version of the test protocol was recommended by the author to be adopted as
the Standard Test for Strand Bond, and it was finally accepted by ASTM in 2012 as ASTM
1081, the “Standard Test Method for Evaluating Bond of Seven-Wire Steel Prestressing Strand”
(ASTM A1081, 2012).
Soon after the final NASP study report was released, Russell along with Julio Ramirez of
Purdue jointly worked for the National Cooperative Highway Research Program to publish
NCHRP report 603, where they recommended the addition of the NASP test method to the
AASHTO LRFD bridge design guide, as a standard test for prestressing steel strand bonding
properties. The authors had also introduced and recommended new transfer and development
length equations, which included factors to account for concrete compressive strength, a property
that was found to affect the bonding behavior of strands in previous research.
In the NCHRP report 603, Russell and Ramirez also reported minimum threshold values
to be taken into consideration when qualifying prestressing strand by the NASP test method. It
was recommended that the minimum pullout test average result of 10,500 lb should be reached
by any set of six 0.5 inch diameter strand samples for the strand to be qualified. At the same
time, the minimum individual strand sample threshold was set at 9000 lb for 0.5 inch diameter
strands. When 0.6 inch diameter strand samples are tested for bond properties by the NASP test,
the researchers recommended that a minimum threshold for acceptance should be at 12,600 lb as
an average of the 6 individual strand samples tested, and at 10,800 lb for any individual 0.6 inch
diameter sample (Russell & Ramirez, NCHRP Report 603, 2008).
In the meantime, a due diligence review of the NASP Strand Bond Test was performed
by Hawkins and Ramirez, who were hired by the Prestressed Concrete Institute Committee on
Research and Development shortly after the NASP Study was completed. In addition to the due
diligence review of the test method, an objective of the study was to provide a minimum NASP
test value for strand acceptance.

39
The researchers performed an intensive assessment of the NASP study rounds three and
four, as well as the results from Bruce Russell’s NASP tests which were performed subsequently
to the study for the benefit of strand producers. In addition, they reviewed the work that was
included in NCHRP report 603 and NCHRP report 621.
Within their conclusions, the authors reported that the NASP test method was proven by
the NASP and NCHRP studies to be a reliable test method for the bonding properties of
prestressing strand; as the final NASP test method version was able to differentiate strands in
their ability to meet the ACI development length requirements.
The researchers added that the stress-strain properties of the strand should be reported in
order for the yield and post-yield behavior of strand to be explored before concluding that
strands will develop additional development length under these conditions after reaching their
transfer lengths. They also recommended that additional testing should be performed in order to
determine the ability of strands to attain increase in their transfer lengths with time.
Regarding the development length testing of beams reported in the NASP round three
and NCHRP 603 reports, the authors noted that the resulting numbers were not adequate to
support reasonable minimum criteria for NASP strand strengths. They recommended additional
testing so that a statistically legitimate threshold can be established.
The authors also added that since the NASP values are sensitive to machine stiffness,
there should be a specified range of stiffness for the testing frames used to run the test. It was
also noted that the NASP values can be affected by mortar compressive strength and mortar
mixture flow, therefore the authors suggested that the cohesiveness and workability of mortar
should be controlled by specifying an acceptable range of angularity and gradation of the sand
used in mortar.
The researchers recommended that further round robin testing should be endorsed by the
Precast/Prestressed Concrete Institute and be run at a minimum of four testing sites before the
NASP test protocol is accepted. A ruggedness testing study was also suggested, as a requirement
for ASTM specification approval, since the authors believe that the test should be standardized
for testing the bonding behavior of strands. It was highlighted that for quality assurance of the
strand samples tested in the round robin and ruggedness studies, the recommended tests in
NCHRP report 621 should be done on each strand type.

40
The authors also recommended that additional NASP testing along with development
length testing should be conducted, so that a statistically reasonable minimum threshold value for
NASP test results can be specified. They noted that before testing, the PCI Bond Task Force
needs to agree on the maximum acceptable value of end slip in order to assure adequate bond
between the strand and concrete before the nominal flexural capacity of the member is reached.
Based on the ongoing testing, the authors calculated a five percent fractal minimum
acceptance value for the NASP test to be at 12,000 lb, and noted that the values reported in the
final NASP test protocol were not statistically justifiable.
In the due diligence report for the NASP test, it was also stated that the precast concrete
manufacturers should not solely rely on the strand pullout test to determine the bonding
capability of a given strand, but also run a simple quality assurance test using the concrete
mixture and product details in order to determine if the bond between the strand and that specific
product will be adequate. The authors recommended using Moustafa specimens or Peterman
Beam Test specimens for that purpose; unless the precast concrete suppliers have come up with a
different quality assurance test they can rely on (Hawkins & Ramirez, 2010).
Recently, two other studies were conducted with main objective the investigation of
prestressing strand bond, and both were published in 2012. One study came from the University
of Arkansas, while the other one was performed by the Missouri University of Science and
Technology.
The study conducted at Missouri S&T was focused on prestressing strand bonding
behavior in self-consolidated concrete, but one of the objectives was to evaluate different strand
bond tests, and specifically to evaluate the consistency and make a comparison of the two most
widely used pullout tests for the qualification of prestressing steel strand by its bonding capacity,
the Moustafa or Large Block pullout test, and the NASP pullout test. The research program also
aimed to determine the correlation between measured transfer lengths and pullout test values, as
well as to evaluate the effect of the compressive strength of the cementitious material that the
strand is casted in to the bonding performance of the strand.
The research program findings revealed that the two pullout test methods are equally
consistent in evaluating strand bond performance, as the coefficients of variation obtained by the
pullout test results of the two test methods were very close. The disagreement between the test
methods came when considering acceptance of the strand as adequate bonding, since all three

41
strand types passed the NASP test, but only one out of the three passed the Large Block pullout
test. This issue raised concerns that the minimum acceptance criteria set for one or both of the
test methods might not be realistic. It should be mentioned that the water to cement ratios
reported for the 2 mortar mixtures utilized at Missouri S&T during their NASP test series were
0.38 and 0.395, while the mortar compressive strengths of the mixtures during the test were
ranging between 4770psi and 5000 psi, and the mortar mixture flows were between 100.2 and
116 %. The strand specimens tested at Missouri S&T had average NASP pullout values between
11700 lb and 21600 lb. The author suggested a minimum acceptance value for the NASP pullout
test to be set at 16,000 lb for the average of six specimens, and at 14,000 lb for any individual
strand specimen.
The author also recommended that additional refinement of the minimum values for
acceptance of strand bond be made, and suggested that focusing on testing strands of pullout
values in the ranges of 12,000 – 18,000 lb for the NASP test, and 33- 36 k for the Large Block
pullout test will assist in establishing reasonable thresholds. Another suggestion that came from
this study was that the effects of mortar mixture proportioning on the NASP test should be
further investigated, and recommended that limits should be set on the mortar mix proportions in
addition to the strength and flow limits. It was also noted that the load versus slip curve contours
could possibly indicate bond quality and that additional research should investigate this pattern.
The Missouri S&T research program also concluded that higher compressive strengths
result in lower transfer lengths, and that the transfer length equation should be a function of
concrete compressive strength, and in agreement with Ramirez and Russell’s as well as other
researchers’ findings, it was shown that the transfer length is related to the square root of the
concrete compressive strength. The study findings also confirmed the relationship found by
Russell and Ramirez that correlates the NASP test results, concrete compressive strength, and
initial transfer lengths (Porterfield, 2012).
In the study conducted at the University of Arkansas, the main objective was to
determine how the mortar mixture compressive strength affects the NASP test values.
Prestressing strands of 0.5 inch and 0.6 inch diameters were tested in mortar mixtures with low
compressive strengths, high compressive strengths, and compressive strengths within the NASP
test protocol allowable range. While the NASP protocol requires mixture compressive strengths
between 4500 and 5000 psi, the lowest average mortar compressive strength observed during the

42
University of Arkansas’ study was 3780 psi, and the highest compressive strength was 6540 psi
(Murray, 2012).
When comparing the pullout test results, it was found that the low mortar compressive
strength samples always resulted in low NASP pullout test values, and that the high mortar
compressive strength samples always observed higher NASP pullout test values. The author
suggested that when samples of compressive strengths lower than the NASP protocol specified
range meet the minimum pullout test threshold, they should be considered valid; and noted that
higher mortar compressive strength samples could be over representative of the actual bonding
abilities of the strand tested by the NASP pullout test (Murray, 2012).

43
Chapter 3 - Material Selection
3.1 Initial Strand Selection
Eight sets of samples of 0.5-inch diameter, seven-wire, 270 ksi, low relaxation steel
strands conforming to ASTM A416 (ASTM A416, 2010) were tested according to ASTM
A1081. The samples were supplied by six of the major strand manufacturers in North America,
and were designated as strands A, B, C, E, F, G, H, and I. All of the strands except strand I were
market condition strand. Strand I was a known lower-bonding strand that was supplied by one of
the strand producers in order to assist the researchers in identifying a low bond source.
The purpose of the initial strand selection process was to identify one strand source with
a pull-out force in each of the following ranges:
a) 10,500-12,500 lb
b) 12,500-15,000 lb
c) 15,000-17,500 lb
Figure 3.1 shows the average pull-out strengths versus free end displacement for each
strand source tested. Figure 3.2 shows the pull-out strengths at 0.1 in. free end displacement for
the six specimens tested and average value for each strand source. Strand A was determined to
have an average pull-out force value at 0.1-inch displacement of 14,100 lb during the initial
strand selection process, and was therefore chosen as the b) 12,500-15,000 lb range
representative strand. Strand I was indeed the only representative of the low pull-out force range
a) 10,500-12,500 lb, with an average pull-out force of 10,900 lb during the initial selection
process. Strand G had an average pull-out force of 17,800 lb during the initial round of testing,
and was chosen as the higher pull-out force value representative for range c) 15,000-17,500 lb.
Although strand E had an average pull-out force of 16,700 lb and inside range c, the strand E
free-end displacement vs. force curve was not typical, as shown in Figure 3.1 (Polydorou,
Riding, Peterman, & Murray, 2013).

44
Figure 3.1 Average Strand Force (lb) vs. Displacement (in) per Strand Source (Polydorou,
Riding, Peterman, & Murray, 2013)
Figure 3.2 Pullout Force (lb) for 6 Specimens Tested per Strand Source for (Polydorou,
Riding, Peterman, & Murray, 2013)
0
5000
10000
15000
20000
25000
30000
0 0.02 0.04 0.06 0.08 0.1 0.12 0.14
Forc
e (l
b)
Strand Free-End Displacement (in)
Strand A
Strand B
Strand C
Strand E
Strand F
Strand G
Strand H
Strand I
0
5000
10000
15000
20000
25000
30000
A
14,100
B
25,100
C
24,400
E
16,700
F
15,500
G
17,800
H
25,800
I
10,900
Pull
oun
t F
orc
e (l
b)
Strand Supplier
Average Pull-Out Force (lb)

45
At least 3000 ft. of strand A, G, and I were obtained from the corresponding strand
manufacturers. The longer coils received were retested according to ASTM A 1081 to verify
that the strand received was the same as that tested during the selection process. The pull-out
test results obtained from testing the coil samples were in agreement with the results obtained by
the initial strand selection testing (Polydorou, Riding, Peterman, & Murray, 2013).
3.2 Mortar Mixture Design Procedure
The Standard Test Method for evaluating bond of 7-wire, 0.5 inch diameter prestressing
strand (ASTM A1081) allows any ASTM C33 sand source and any ASTM C150 type III cement
source to be used when designing the mortar mixture for the pullout tests (ASTM A1081, 2012).
The standard specification for the pullout test requires that strand be tested within a time
window of 24 ± 2 hours since the time of mixing, and that the mortar mixture is at a compressive
strength between 4500 and 5000 psi at that time (ASTM A1081, 2012). After taking several trial
and error mortar mixtures to accommodate this requirement with one of the cement samples, a
simple method was developed which greatly assisted with determining the mixture proportions
of mortar mixtures made with the rest of the cement sources, complying with ASTM A1081
requirements.
The procedure was a simple, three step method based on the fact that mortar compressive
strength is controlled by the water to cement ratio of the mix. Even though it is generally
accepted that the relationship between water to cement ratio and compressive strength is non-
linear, a linear relationship was assumed in this case; a valid approximation due to the small
range of values taken into consideration (Riding, Peterman, Polydorou, & Ren, 2012).
As a first step, two mortar mixtures with pre-selected water to cement ratios are mixed,
and three cubes’ compressive strengths per batch are tested at 24 hours from mixing. A linear fit
of the results helped identify the water to cement ratio that corresponded to a mortar mixture
with compressive strength at 4500 psi, 24 hours after mixing. Figure 3.3 illustrates an example of
this procedure (Riding, Peterman, Polydorou, & Ren, 2012).

46
Figure 3.3 Interpolation Procedure used to Select w/c for Cement 1 (Riding, Peterman,
Polydorou, & Ren, 2012)
Once the water to cement ratio is selected, the second step is to choose the sand to cement
ratio of the mixture, which in combination with the selected water to cement ratio will provide a
mortar mixture flow within the specification requirements. Following the same procedure, 2
small mortar batches are mixed at the pre-selected w/c ratio and at 2 different s/c ratios. The
mixture flow is then determined according to ASTM C1437, and the sand to cement ratio vs flow
values are plotted. In a similar fashion, a linear fit indicates the s/c ratio value that will output an
acceptable mortar mixture flow. An example is shown in Figure 3.4 (Riding, Peterman,
Polydorou, & Ren, 2012).
0
1000
2000
3000
4000
5000
6000
0.4 0.42 0.44 0.46 0.48 0.5
mo
rtar
str
engt
h (
psi
)
water to cement ratio (w/c)

47
Figure 3.4 Interpolation Procedure use to select s/c for Cement 1 (Riding, Peterman,
Polydorou, & Ren, 2012)
The third step in this procedure was the mixing of a large scale mortar batch in order to
confirm the compressive strength and mortar flow of the mixture with the selected proportions.
Slight difference in both mixture characteristics were observed, due to the different mixing
action between the small laboratory mortar mixer and the 12ft3 commercial grade concrete mixer
that was used for the large scale batches in this project (Riding, Peterman, Polydorou, & Ren,
2012).
A summary of the mortar mixtures developed using this method is presented in Table
3-1, listing the mixture proportions used per cement trial batch, along with their corresponding
compressive strengths and mixture flows. A variety of w/c ratios had to be used in order to
create mixtures that will reach compressive strengths between 4500-5000 psi at 24 hours for the
5 cements used. Based on the resulting strengths, it is recommended to start with the first step
using w/c ratios of 0.42 and 0.46 at a s/c ratio of 2.6 for every new cement source to be used
(Riding, Peterman, Polydorou, & Ren, 2012).
0
0.5
1
1.5
2
2.5
3
100 110 120 130 140
san
d t
o c
eme
nt
rati
o (
s/c)
mortar flow (%)

48
The predicted and measured compressive strengths and flows are compared for the case
of the large scale mixtures, and we can see that the maximum difference between a predicted and
a measure strength value is at 170 psi or 3.8%, which is lower than the maximum threshold of
the difference between two tests specified by ASTM C109 (8.7%). Another interesting finding is
that when adjusting the w/c ratio only in order to adjust the compressive strength of a mortar
mixture, the flow was only affected slightly. Therefore when adjustments need to be made in
order to accommodate for different compressive strengths between small scale and large scale
batches, we can change the w/c ratio without having to worry about adjusting the s/c ratio;
assuming that the predicted mixture flow is not at the two extremes of the allowable range.
Instead, it was observed during the first few rounds of testing that the mortar mixture flow was
affected much more by improper oiling of the flow table shaft, therefore it was recommended
that ASTM C1437 be followed strictly, especially when developing mortar mixtures using this
methodology (Riding, Peterman, Polydorou, & Ren, 2012).
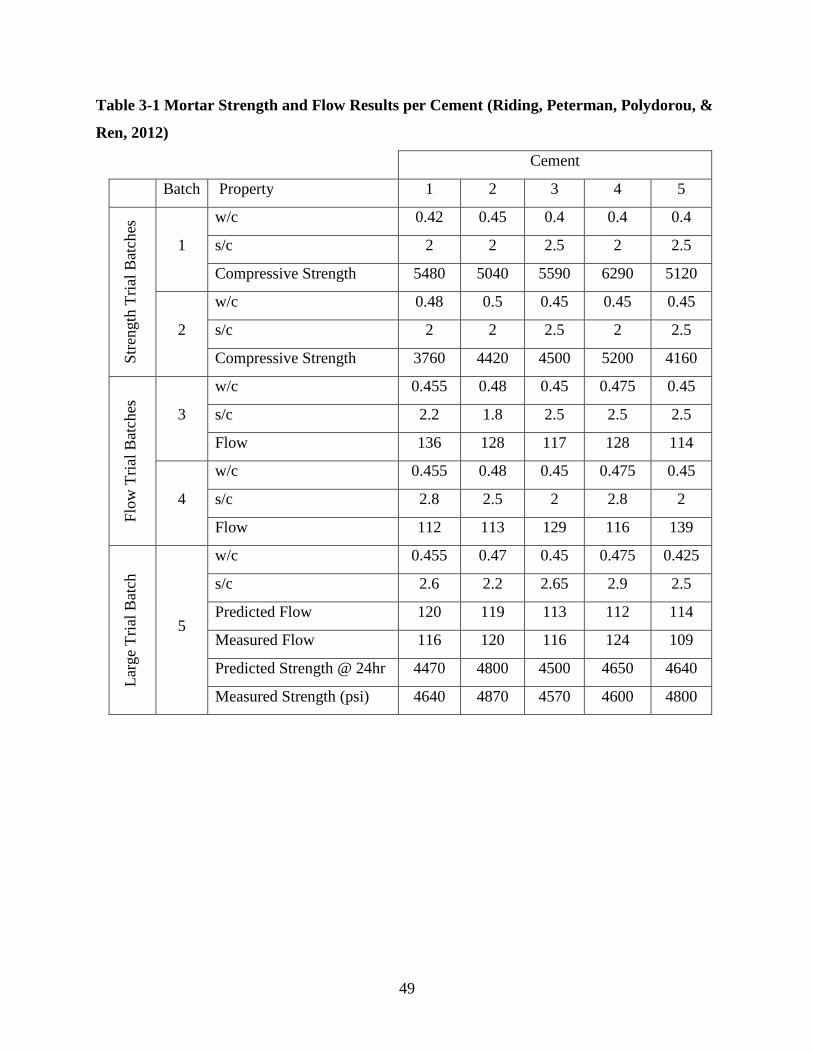
49
Table 3-1 Mortar Strength and Flow Results per Cement (Riding, Peterman, Polydorou, &
Ren, 2012)
Cement
Batch Property 1 2 3 4 5
Str
ength
Tri
al B
atch
es
1
w/c 0.42 0.45 0.4 0.4 0.4
s/c 2 2 2.5 2 2.5
Compressive Strength 5480 5040 5590 6290 5120
2
w/c 0.48 0.5 0.45 0.45 0.45
s/c 2 2 2.5 2 2.5
Compressive Strength 3760 4420 4500 5200 4160
Flo
w T
rial
Bat
ches
3
w/c 0.455 0.48 0.45 0.475 0.45
s/c 2.2 1.8 2.5 2.5 2.5
Flow 136 128 117 128 114
4
w/c 0.455 0.48 0.45 0.475 0.45
s/c 2.8 2.5 2 2.8 2
Flow 112 113 129 116 139
Lar
ge
Tri
al B
atch
5
w/c 0.455 0.47 0.45 0.475 0.425
s/c 2.6 2.2 2.65 2.9 2.5
Predicted Flow 120 119 113 112 114
Measured Flow 116 120 116 124 109
Predicted Strength @ 24hr 4470 4800 4500 4650 4640
Measured Strength (psi) 4640 4870 4570 4600 4800

50
Chapter 4 - Ruggedness Testing
4.1 Investigation of Factors Affecting the Test
4.1.1 Sand
There was some concern that the sand gradation, hardness, and angularity could affect the
test results. To eliminate this concern, a specific sand source at a specified gradation was used
for the mortar mixtures that were included in the initial testing rounds, ruggedness study, and
also in half of the Inter-laboratory study mixtures, where testing was ran using Method A and
Method B; with Method A following the standard procedure as specified in ASTM A1081, and
Method B was a modified procedure which required the use of a specific source of sand at a
specified gradation along with other modifications.
The sand source utilized in the initial testing rounds, ruggedness testing mixtures and
Method B mixtures was supplied by Dolese Brothers Co, Oklahoma, the suppliers of the sand
utilized during the NASP study, where the standard test method was developed. The sand
gradations used for all Method B mixtures are shown in Table 4-1 (Polydorou, Riding, Peterman,
& Murray, 2013).
Table 4-1 Dolese Sand Gradations (Polydorou, Riding, Peterman, & Murray, 2013)
Sieve % Total % Passing
#4 0.5 99.5
#8 4.8 94.7
#16 15.9 78.8
#30 33.5 45.3
#50 31.8 13.5
#100 12 1.5
#200 1.5 0.0
4.1.2 Cement
There were also concerns that the pullout test results are affected by the chemical
composition and physical properties of type III cement sources; therefore 5 type III cement

51
samples were obtained from multiple states of America for the purpose of this investigation. In
order to provide uniformity during the initial testing rounds where the variability in strand
sources was the main concern, a single cement source was used. Similarly, the same cement
source was used throughout the ruggedness testing rounds, where other parameters of the test
method were being investigated. The 5 cement sources were compared in mixtures that met the
ASTM A1081 specification per cement source, and also in mixtures with common water to
cement ratios for all sources.
Large scale mortar mixtures were made for each case, and along with the pullout test
specimens and mortar cubes which were cured as prescribed in ASTM A1081, an extra steel
canister was included with no strand embedded in it, but instead a thermocouple was placed in
the canister in order to keep track of the temperature variation of the mortar with time. In
addition, 2 extra sets of mortar cubes were made, which were matched cured to follow the
temperature of the extra can specimen.
The 2 sets of 3 match cured mortar cubes were tested for their compressive strength along
with the moist cured mortar cubes, in order to compare the values. As it was expected, the match
cured mortar cubes experienced higher compressive strengths than their equivalent moist cured
cubes. The difference in compressive strength is explained by the difference in temperature
between the matched cured and standard moist cured cubes; and this is due to the fact that the
match cured cubes are following the temperature curve of a can specimen, which includes a
larger volume of mortar and therefore cement, accounting for higher heat generation in the
specimen.
The mortar mixture temperature vs curing time was plotted for each cement source, using
the data obtained from the thermocouple in the additional can specimen of each batch. The
curves indicated that cement 1 mixtures were starting to set much sooner than cement 2 and
cement 4 mixtures, and therefore the mortar setting test was conducted on samples of the 3
cement sources. The initial and final setting times were determined for the 3 type III cement
sources, and are illustrated in Figure 4.1.

52
Figure 4.1 Initial and Final Setting Times for Cements 1, 2, and 4, determined by ASTM
C403
Another aspect that was investigated in an attempt to differentiate between the 5 cement
sources was the amount of bleed water generated on the bottom of each pullout test specimen. A
plastic cup was placed under each strand where the mortar mixture bleed water was dripping, and
was later weighed to compare the bleed water amounts per cement. Unfortunately the results did
not conclude to a noteworthy finding in this case. Table 4-2 shows the variability in chemical
composition and physical properties of the 5 type III cement sources used in this project.
0
1
2
3
4
5
6
1 2 3
Tim
e fr
om
mix
ing
(ho
urs
)
Cement
Initial Setting
Final Setting

53
Table 4-2 Cement Chemical Composition and Physical Properties (Riding, Peterman,
Polydorou, & Ren, 2012)
Cement 1 2 3 4 5
SiO2 (%) 21.8 21.0 19.6 18.9 20.4
Al2O3 (%) 4.3 4.4 5.1 5.3 3.9
Fe2O3 (%) 3.3 3.7 2.3 3.0 3.7
CaO (%) 63.3 63.4 62.3 62.8 63.4
MgO (%) 1.9 2.4 3.1 3.2 2.5
SO3 (%) 3.3 3.2 4.7 4.1 3.4
Na2Oeq (%) 0. 0.6 0.9 0.8 0.5
Blaine Fineness
(m2/kg) 577 660 522 577 536
Potential Composition
C3S (%) 49 54 54 61 61
C2S (%) 25 19 16 8 12
C3A (%) 6 5 10 9 4
C4AF (%) 10 11 7 9 11
4.1.3 Central Wire Slip during Test
Another factor that was suspected for affecting the pullout test was the requirement by
ASTM A1081 that the displacement measuring device be placed on the central wire of the
strand, therefore strictly measuring the displacement of that one wire, instead of the strand as a
whole. After the initial testing rounds, it was observed that the central wire was slipping
independently from the other 6 wires in the case of strand I. In order to investigate how this
affects the test results, aluminum caps were fabricated and placed on the top surface of the strand
specimen to be tested. The results of the pullout tests ran with the LVDT set on the center of the
aluminum caps were plotted versus the results of the standard test method where the LVDT was
set on the central wire. Comparison of the test results and the resulting average curves of the two
cases indicated that the central wire slipping did not impose significant effects to the pullout test
results.

54
4.2 ASTM Ruggedness
4.2.1 Ruggedness Testing Introduction
With the conclusion of the strand selection rounds and after studying the findings from
the mixture development process, an official ruggedness testing study was conducted. The
ruggedness testing study was an initial step in developing the precision and bias statement for the
“Standard Test Method for Evaluating Bond of Seven-Wire Steel Prestressing Strand”, or ASTM
A1081/A1081M-12. During this study, the mortar flow, compressive strength at testing, and test
loading rate were varied in order to determine their effect on the test results (Polydorou, Riding,
Peterman, & Murray, 2013).
4.2.2 Ruggedness Testing Materials
The sand source used in this study was the sand obtained from Dolese Brothers Co,
Oklahoma, at the gradations presented in Table 4-1. The ASTM C33 concrete sand had an
absorption content of 0.26%, specific gravity of 2.59, and fineness modulus of 2.67. The sand
was oven dried for 24 hours and then sieved to ensure that there would be no variability in the
pull-out test results due to inconsistent aggregate moisture content between the mortar batches
(Polydorou, Riding, Peterman, & Murray, 2013).
Cement 1 was used for all the ruggedness testing study mixtures, to provide uniformity.
The chemical and physical properties of this cement source are shown in Table 4-3 (Polydorou,
Riding, Peterman, & Murray, 2013).

55
Table 4-3 Cement 1 Chemical and Physical Properties (Polydorou, Riding, Peterman, &
Murray, 2013)
Property Value
SiO2 (%) 21.8
Al2O3 (%) 4.3
Fe2O3 (%) 3.3
CaO (%) 63.3
MgO (%) 1.9
SO3 (%) 3.3
Na2O (%) 0.2
K2O (%) 0.5
Na2Oeq (%) 0.5
Free lime (%) 1.4
Loss on ignition (LOI) (%) 1.6
Insoluble residue (%) 0.4
Blaine Surface Area (m2/kg) 577
POTENTIAL CALCULATED
COMPOUNDS:
C3S (%) 49.2
C2S (%) 25.4
C3A (%) 5.7
C4AF (%) 10.2

56
4.2.3 Ruggedness Testing Methodology
Two rounds of testing were performed in June and July 2012 at KSU in Manhattan, KS.
The mortar mixtures were mixed in a 12 cubic ft. capacity commercial horizontal shaft hydraulic
mortar mixer located in a climate controlled room following ASTM C305 (ASTM C305, 99).
Sample preparation took place before mixing. The 5-inch diameter steel pipes were welded on to
6-inch square plates and sealed before mortar mixing. The specimens were placed on a wooden
cart on wheels before mortar placement (Polydorou, Riding, Peterman, & Murray, 2013).
Strand samples were cut to 32 inches. Following the application of 2-inch wide foam
bond breaker material where the strand sits on the 6-inch square plate, strand samples were
secured in steel cylinders as shown in Figure 4.2. Painter’s tape was used to keep the top surface
of the strand clean from any mortar during mortar placement (Polydorou, Riding, Peterman, &
Murray, 2013).
Figure 4.2 Specimen Setup (Polydorou, Riding, Peterman, & Murray, 2013)

57
After mixing, the mortar flow was immediately measured. The mortar was placed in two
approximately equal lifts. An immersion vibrator was used to vibrate the samples after each lift.
After vibration, specimens were filled to the top with mortar, finished with trowels, and then
wheeled into a 100% humidity room at 73°F for curing. A plastic tarp shielded the top surface of
the specimens from any water dripping onto the mortar while curing (Polydorou, Riding,
Peterman, & Murray, 2013).
While the specimens were being made, 2-inch mortar cubes were prepared according to
ASTM C109 (ASTM C109, 2012). The mortar cubes were covered to protect them from dripping
water and cured in the same 100% humidity room as the steel specimens. The mortar compressive
strength was tested prior to and immediately after the pull-out testing of the samples.
The 4500 psi and 5000 psi compressive strength targets were achieved by testing at
approximately 23 and 28 hours after batch time, respectively. The testing matrix shown in Table
4-4 was repeated twice (Polydorou, Riding, Peterman, & Murray, 2013).
Table 4-4 Ruggedness Testing Matrix
Test # Mortar Cube
Strength (psi)
Loading Rate
(in/min)
Mortar Flow
(%)
1 5000 0.12 125
2 5000 0.12 100
3 5000 0.08 125
4 5000 0.08 100
5 4500 0.12 125
6 4500 0.12 100
7 4500 0.08 125
8 4500 0.08 100
The pull-out tests were performed on a tensile testing frame with a 70,000 lb load
capacity. The testing frame which is identified in Figure 4.3 was fabricated at KSU and uses a
thrust bearing to provide torsion-free test conditions, by allowing the specimen to rotate without
restrictions (Polydorou, Riding, Peterman, & Murray, 2013).

58
Figure 4.3 Tensile Testing Frame (Polydorou, Riding, Peterman, & Murray, 2013)
The strand free-end displacement was measured using a linear variable differential
transformer (LVDT). The LVDTs were attached to the steel specimens with the use of 2
magnetic bases as shown is Figure 4.4, allowing for quick setup of the LVDT’s tip on the top
surface of the center wire of each strand sample (Polydorou, Riding, Peterman, & Murray, 2013).

59
Figure 4.4 LVDT Setup on Specimen (Polydorou, Riding, Peterman, & Murray, 2013)
Processing of the test results was executed with the use of spreadsheets, including an
analysis of the findings performed as directed by ASTM E1169-07 (ASTM E1169, 2007).
Additional statistical analysis of the ruggedness study results was completed utilizing the
statistical analysis software SAS, in order to confirm the ASTM E1169 results and provide a
more accurate representation of the study findings. The results of the study were modeled by
three statistical models as part of an analysis of variance (ANOVA) (Polydorou, Riding,
Peterman, & Murray, 2013).
4.2.4 Ruggedness Testing Results
After the two rounds of testing were completed, the resultant pull-out force average
values for each strand supplier were compared in an attempt to identify the effects of each of the
three factors on the test results. The testing matrix shown in Table 4-4 included eight factor
combinations tested twice; therefore four groups per factor were comparable in terms of the one
factor they had in variance, and since the other two factors were identical for each specific group
(Polydorou, Riding, Peterman, & Murray, 2013).
The actual compressive strength values before and after the pull-out tests, along with the
actual mortar flow rates obtained for each mixture, and the average pull-out force values are

60
given in Table 4-5, where the letters A and B designate the first and second rounds of each test
respectively (Polydorou, Riding, Peterman, & Murray, 2013).
Table 4-5 Mortar Compressive Strength Before and After Testing, Mortar Flow, Test
Loading Rate, and Average Pullout Force Values per Test (Polydorou, Riding, Peterman,
& Murray, 2013)
Test # Mortar
Compressive
Strength
Before Test
(psi)
Mortar
Compressive
Strength
After Test
(psi)
Mortar
Flow
(%)
Test
Loading
Rate
(in/min)
Average
Pull-out
value
(lb)
Strand A
Average
Pull-out
value
(lb)
Strand G
Average
Pull-out
value
(lb)
Strand I
1A 5065 4958 123 0.12 14,194 17,381 12,435
1B 4932 5063 120 0.12 15,410 18,218 12,844
2A 4808 4974 101 0.12 15,065 19,489 12,959
2B 5018 5074 101 0.12 14,763 18,784 13,019
3A 4921 5065 121 0.08 14,577 18,435 10,434
3B 5080 5089 121 0.08 14,489 16,969 11,625
4A 4898 4988 104 0.08 13,931 18,635 11,529
4B 5059 5029 102 0.08 14,336 17,672 12,885
5A 4566 4667 121 0.12 13,952 17,649 10,722
5B 4568 4699 123 0.12 14,312 16,512 12,277
6A 4566 4703 100 0.12 14,313 19,880 12,858
6B 4654 4713 102 0.12 14,783 18,148 11,664
7A 4536 4674 123 0.08 13,657 16,984 11,220
7B 4607 4722 122 0.08 13,336 17,474 11,538
8A 4631 4834 101 0.08 14,737 18,516 12,139
8B 4460 4656 101 0.08 13,875 17,231 12,189
Test groups 1 vs. 5, 2 vs. 6, 3 vs. 7, and 4 vs. 8 were compared to investigate the effect of
the compressive strength on the test results, since the mortar flows and test loading rates are
consistent per group. As shown in Table 4-5, varying the mortar compressive strength between

61
the two limits set by the standard test specification resulted in a 3.4% difference in the pull-out
test values of strand A, a 2.2% difference in the values obtained with strand G, and a 3.0%
difference for strand I (Polydorou, Riding, Peterman, & Murray, 2013).
In order to examine the effect of varying the test loading rate, groups 1 vs. 3, 2 vs. 4, 5 vs.
7, and 6 vs. 8 were compared. Each group shares identical compressive strength and mortar flow
but different loading rates, with 1, 2, 5, and 6 tested by the higher loading rate of 0.12 in. /min.
and 3, 4, 7 and 8 tested at the lower rate of 0.08 in. /min. The results indicate that a variation of
the test loading rate by 0.04 lb/in. reflected a difference of 3.4% in the pull-out test results for
strand A, 2.8% difference for strand G, and 5.6% difference for strand I (Polydorou, Riding,
Peterman, & Murray, 2013).
Test groups 1 vs. 2, 3 vs. 4, 5 vs. 6, and 7 vs. 8 were compared for the purpose of
investigating the effect on the pull-out strengths of a mortar mixture flow varying between the
two extremes allowed by the standard test specification. The results revealed a 1.6% difference
in the test results for strand A, a 5.9% difference for strand G, and a 6.2% difference for strand I.
The average difference between the pull-out test results obtained by varying the three factors per
strand are summarized in Table 4-6 (Polydorou, Riding, Peterman, & Murray, 2013).
Table 4-6 Average Difference (5) between Pullout Test Results of Test Groups per Factor
Investigated (Polydorou, Riding, Peterman, & Murray, 2013)
Factor Strand
A
Strand
G
Strand
I
Compressive Strength 3.4 2.2 3.0
Loading Rate 3.4 2.8 5.6
Mortar Flow 1.6 5.9 6.2
The test method error, calculated after comparing the results from the two rounds of
testing, turned out to be 0.7% in the case of strand A, 4.5% for strand G, and 4.2% for strand I.
Half-normal plots were created for each of the three strands, following the procedures of ASTM
E1169-07. The two-sided tail probabilities (p-values) for each of the factors were calculated for
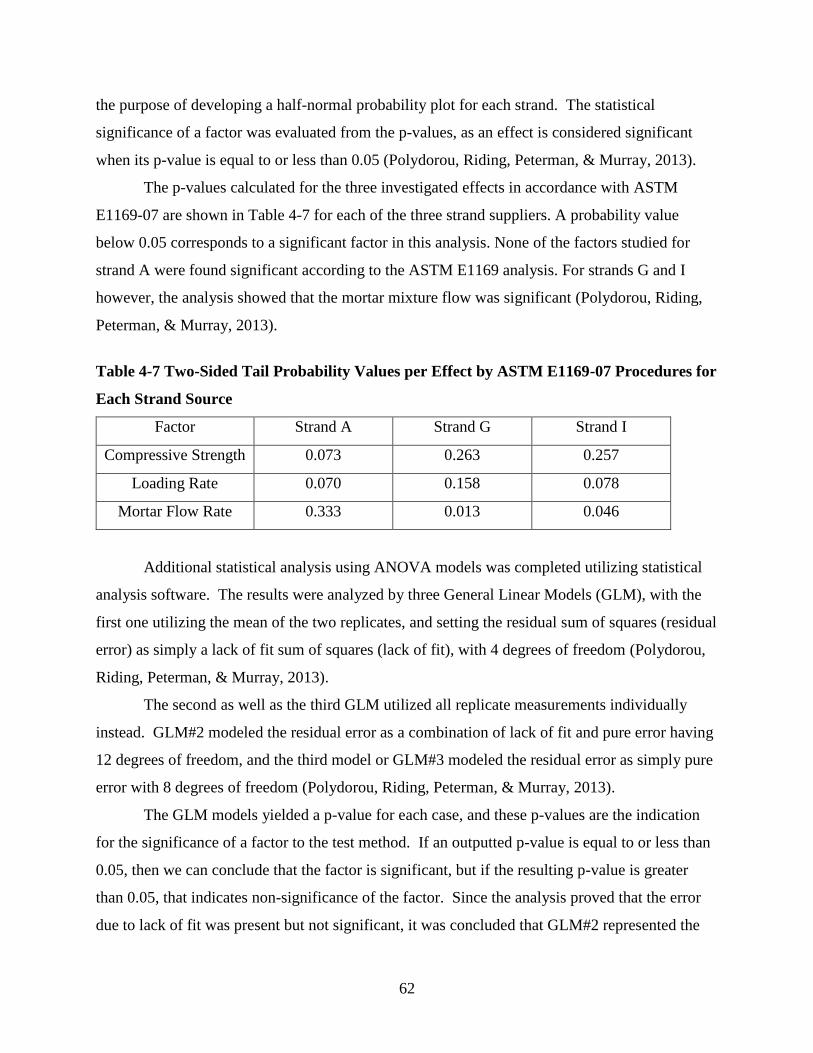
62
the purpose of developing a half-normal probability plot for each strand. The statistical
significance of a factor was evaluated from the p-values, as an effect is considered significant
when its p-value is equal to or less than 0.05 (Polydorou, Riding, Peterman, & Murray, 2013).
The p-values calculated for the three investigated effects in accordance with ASTM
E1169-07 are shown in Table 4-7 for each of the three strand suppliers. A probability value
below 0.05 corresponds to a significant factor in this analysis. None of the factors studied for
strand A were found significant according to the ASTM E1169 analysis. For strands G and I
however, the analysis showed that the mortar mixture flow was significant (Polydorou, Riding,
Peterman, & Murray, 2013).
Table 4-7 Two-Sided Tail Probability Values per Effect by ASTM E1169-07 Procedures for
Each Strand Source
Factor Strand A Strand G Strand I
Compressive Strength 0.073 0.263 0.257
Loading Rate 0.070 0.158 0.078
Mortar Flow Rate 0.333 0.013 0.046
Additional statistical analysis using ANOVA models was completed utilizing statistical
analysis software. The results were analyzed by three General Linear Models (GLM), with the
first one utilizing the mean of the two replicates, and setting the residual sum of squares (residual
error) as simply a lack of fit sum of squares (lack of fit), with 4 degrees of freedom (Polydorou,
Riding, Peterman, & Murray, 2013).
The second as well as the third GLM utilized all replicate measurements individually
instead. GLM#2 modeled the residual error as a combination of lack of fit and pure error having
12 degrees of freedom, and the third model or GLM#3 modeled the residual error as simply pure
error with 8 degrees of freedom (Polydorou, Riding, Peterman, & Murray, 2013).
The GLM models yielded a p-value for each case, and these p-values are the indication
for the significance of a factor to the test method. If an outputted p-value is equal to or less than
0.05, then we can conclude that the factor is significant, but if the resulting p-value is greater
than 0.05, that indicates non-significance of the factor. Since the analysis proved that the error
due to lack of fit was present but not significant, it was concluded that GLM#2 represented the

63
data best. The p-values of the three factors by model are shown in Table 4-8 for the case of
strand A (Polydorou, Riding, Peterman, & Murray, 2013).
Table 4-8 Two-Sided Probability Values per Effect for Each ANOVA Model Used to
Analyze the Data (Strand A)
Strand Factor GLM#1 GLM#2 GLM#3
A Compressive Strength 0.0992 0.0490 0.0575
Loading Rate 0.0958 0.0463 0.0547
Mortar Flow Rate 0.3505 0.3008 0.3056
G Compressive Strength 0.2463 0.3037 0.3528
Loading Rate 0.1526 0.1879 0.2357
Mortar Flow Rate 0.0206 0.0123 0.0270
I Compressive Strength 0.2745 0.2588 0.2831
Loading Rate 0.1021 0.0711 0.0908
Mortar Flow Rate 0.0676 0.0379 0.0534
Even though GLM#2 classifies the effects of the compressive strength and the loading
rate as significant in the case of strand A, their representative p-values are very close to 0.05,
therefore we can say that the effects of the compressive strength and the loading rate were
borderline significant to the pull-out test results for strand A. In the case of strand G, all three
ANOVA models showed that the only significant effect to the pull-out test values was the
variance of the mortar flow. Similarly in the case of strand I, varying the mortar mixture flow
proved to be a significant factor for the difference in pull-out test values obtained.
After the analysis of the results from this study, it is recommended that the mortar
mixture flow rate requirements of ASTM A1081 be adjusted to a tighter permissible range in
order to improve the repeatability and reproducibility of the test method (Polydorou, Riding,
Peterman, & Murray, 2013).
4.2.5 Ruggedness Testing Conclusion
A ruggedness study was conducted to investigate the influence of loading rate, mortar
compressive strength, and mortar flow rate on the results of ASTM A1081 “Standard Test

64
Method for Evaluating Bond of Seven-Wire Steel Prestressing Strand”. In the ruggedness
testing, the loading rate was varied to be 120% and 80% of the specified 0.1 in/minute loading
rate. The mortar flow was varied to be at the low and high end of the allowable range of 100% to
125%. The mortar compressive strength was varied to be at the low and high end of the 4500-
5000 psi range. Statistical analysis of the results indicated that the mortar mixture flow is a
significant factor on the ASTM A1081 pull-out test results. The current specification allows a
range of mortar mixture flows between 100 and 125. It is recommended that the mortar flow
allowable range is confined between 105 and 120, in order to reduce the variability of this test
method. Varying the mortar compressive strength between 4500 and 5000 psi was found to not
be a significant factor to the test results. The test loading rate was found to be a significant factor
in two out of the three strand cases; therefore no modifications can be applied to the specification
regarding the loading rate (Polydorou, Riding, Peterman, & Murray, 2013).

65
Chapter 5 - Inter-Laboratory Study
5.1 Inter-Laboratory Study Introduction
An Inter-Laboratory investigation followed, in order to determine the precision and bias
of the newly adopted ASTM. After evaluating the findings of the ruggedness testing study and
observations while altering different variables of the test method and studying the related effects,
KSU researchers defined a modified ASTM A1081 pullout test procedure (Method B) which was
incorporated in the Inter-Laboratory study, along with the standard test method (Method A) as
specified by ASTM.
5.2 Inter-Laboratory Study Materials
ASTM A1081 allows any ASTM C33 sand source and any ASTM C150 type III cement
source to be used when designing the mortar mixture (ASTM A1081, 2012). There was some
concern that the sand gradation, hardness, and angularity could affect the test results. To
eliminate this concern, Method B required the use of a specific source of sand at a specified
gradation for all testing laboratories (Polydorou, Riding, & Peterman, 2014).
The sand source utilized for the Method B mortar mixtures was supplied by Dolese
Brothers Co, Oklahoma, the suppliers of the sand utilized during the NASP study, where the
standard test method was developed. The sand was sieved by KSU and sent to the participating
research labs for Method B testing. The sand gradations used for all Method B mixtures are
shown in Table 4-1 (Polydorou, Riding, Peterman, & Murray, 2013). The requirements
regarding the cement source were kept as specified by the ASTM standard for Method B also,
allowing the use of any ASTM C150 (ASTM C150, 2012) Type III cement source.
This study was conducted using 0.5 inch diameter, seven-wire steel strand samples that
were supplied by three different manufacturers. The strands used in this study were all
designated as 270 ksi minimum ultimate tensile strength, low relaxation; uncoated steel strands
meeting ASTM A416 (ASTM A416, 2010), and were preselected out of the 8 strand sources
supplied during the initial strand selection round. The participating strand sources were labeled
strand A, strand G, and strand I (Polydorou, Riding, & Peterman, 2014).

66
The three strands were initially tested at KSU Civil Engineering laboratories, using a
simple mixture proportioning method developed to quickly design a mortar mixture made with
any given Type III cement source that will meet ASTM A1081 requirements and is described
elsewhere (Riding, Peterman, Polydorou, & Ren, 2012). The mixture characteristics for the 5
mortar mixtures developed using the different cement sources available at KSU are summarized
in Table 5-1 (Polydorou, Riding, & Peterman, 2014).
Table 5-1 Mixture Proportions and Mixture Flow for Mortar Samples Made with 5
Different Cement Sources (Polydorou, Riding, & Peterman, 2014)
w/c ratio s/c ratio Mixture flow (%)
cement 1 0.455 2.60 123
cement 2 0.480 2.00 121
cement 3 0.475 2.85 124
cement 4 0.450 2.50 123
cement 5 0.452 2.50 123
An average maximum difference of over 21% was obtained when comparing the pullout
test results of identical strand sources tested in mortar mixtures that meet ASTM A1081
standards but utilized different ASTM C150 type III cement sources. The actual test results per
strand source and cement source are listed in Table 5-2 (Polydorou, Riding, & Peterman, 2014).
Table 5-2 Average ASTM A1081 Test Results per Strand and Cement Source Tested at
KSU
Strand A Strand G Strand I
cement 1 12,800 lb 17,400 lb 11,500 lb
cement 2 13,500 lb 17,500 lb 11,300 lb
cement 3 15,300 lb 20,500 lb 11,900 lb
cement 4 16,600 lb 20,900 lb 11,700 lb
cement 5 15,700 lb 21,500 lb 13,400 lb
Max. Difference 23% 24 % 17%

67
The work proceeded with testing the three strands in 5 additional mortar mixtures which
were prepared with the same 5 cements, but this time the water to cement ratio was kept
consistent, at 0.45, for all 5 mixtures. In this case, some of the mortar mixtures did not meet the
test time specification set by ASTM A1081, but all samples were tested while their mortar
compressive strength was between the specified range of 4500-5000 psi, ignoring the specified
test time window. The results per strand and also per cement are listed in Table 5-3 (Polydorou,
Riding, & Peterman, 2014).
Table 5-3 Average Modified ASTM A1081 Test Results per Strand and Cement Source
Tested at KSU (w/c= 0.45 for all mixtures)
Strand A Strand G Strand I
cement 1 14,300 lb 17,000 lb 11,600 lb
cement 2 14,900 lb 17,300 lb 13,000 lb
cement 3 13,400 lb 17,000 lb 11,000 lb
cement 4 13,500 lb 16,800 lb 10,400 lb
cement 5 15,300 lb 17,500 lb 11,200 lb
Max. Difference 14 % 4% 25%
Using a consistent w/c ratio for all 5 cement mortar mixtures reduced the variability of
the pullout test results down to an average maximum difference of just over 14%. It was decided
to further investigate eliminating the test time window requirement and instead imposing a set
water to cement ratio of 0.45 to the standard ASTM A1081 test method. Considering this
finding, Method B was included as an alternate method in the Inter-laboratory study to determine
if these modifications could reduce the test variability.
At Kansas State University, mortar mixtures were developed using the uniform sand
source supplied by Dolese Brothers Co, Oklahoma, which was oven dried, sieved and graded for
every mixture, in order to reduce variability due to inconsistent moisture content and sand
gradation. This sand was sieved and supplied by KSU to the participating laboratories for testing
the strand bond using Method B (Polydorou, Riding, & Peterman, 2014).

68
5.3 Inter-Laboratory Study Methodology
Two methods of testing strand bond were performed during the round robin study
investigating the “Standard Test Method for Evaluating Bond of Seven-Wire Steel Prestressing
Strand”, designated ASTM A1081. The first method, called hereafter Method A, recommends
testing strand samples exactly as prescribed by the ASTM standard. A second method was
defined by the project investigators, hereafter called Method B, which was also a version of the
standard ASTM A1081 test method, modified to reduce variability based on the ruggedness test
results (Polydorou, Riding, & Peterman, 2014).
No requirements are imposed on mixture proportioning by the ASTM standard as long as
the flow and mortar strength requirements are met. For Method B, a water-cement ratio (w/c) of
0.45 was specified. Because different cements would give different strength gain rates at a
constant w/c, the time window requirement was deleted for Method B. The standard test method
allows for a range of mortar flow between 100-125 %, as determined by ASTM C1437 (ASTM
C1437, 2007). Because the ruggedness study determined that mortar flow was a significant
variable in bond testing (Polydorou, Riding, Peterman, & Murray, 2013), this requirement was
modified for Method B. The mortar mixture flow allowable range for Method B was tightened
to 105-120 % (Polydorou, Riding, & Peterman, 2014).
The standard ASTM A1081 test method specifies that samples be tested at 24 ± 2 hours
after mortar mixing takes place. The test also requires that the mortar mixture compressive
strength of the samples be between 4500 and 5000 psi at the time of testing. In the case of
Method B, the project investigators omitted the requirement of keeping the tests within the time
frame of 24 ± 2 hours, and required only that the mortar mixture compressive strength is kept
between 4500 and 5000 psi. The time frame requirement was omitted after initial testing
revealed that it was not possible for all 5 cement source mixtures used at KSU to reach the
specified compressive strength of 4500-5000 psi within 22-26 hours from mixing time at the
Method B specified water-cement ratio (w/c) of 0.45 (Polydorou, Riding, & Peterman, 2014).
Table 5-4 shows a comparison of the key specification differences between Method A (ASTM
A1081) and Method B (Polydorou, Riding, & Peterman, 2014).

69
Table 5-4 Method A and Method B Specifications (Polydorou, Riding, & Peterman, 2014)
Method A Method B
Time of test 24 ± 2 hours after mixing No constraint
w/c ratio No constraint 0.45
Mortar mixture flow 100-125 % 105-120 %
Compressive Strength
at time of test
4500-5000 psi 4500-5000 psi
Sand Source ASTM C33 sand Dolese sand, specified
gradations
Cement Source ASTM C 150 type III cement ASTM C 150 type III cement
A webinar was shared with the participating laboratories, where they were guided on
testing procedures and general test setup since most of the participating laboratories had not
previously run this test as a first step in preparing for the Inter-laboratory study. A detailed guide
was sent to all participating laboratories in order to assist with their mixture development
process; however laboratories were not required to follow this mixture development process as
long as the mortar mixtures they developed met the test requirements. As soon as a participating
laboratory had successfully developed their trial mixtures for both Method A and Method B, a
researcher from KSU traveled to each laboratory to observe testing and record data (Polydorou,
Riding, & Peterman, 2014).
5.4 Inter-Laboratory Study Results
The average mortar compressive strength of each sample, mortar mixture flow, sample
curing conditions, testing conditions, and pullout test results were gathered from 8 external
participating laboratories during the months of the Inter-laboratory study. Data from the 5
cement mixtures tested at KSU laboratories were included in the study, to total 13 sets of data,
but since not all of the specifications were met by 2 of the external participating laboratories,
their data was not taken into consideration during the final round of analysis, and therefore will
not be presented in the data summary tables in this report (Polydorou, Riding, & Peterman,
2014).

70
The average mortar compressive strength during testing, average mortar mixture flow,
and average pullout force per strand group from the remaining 6 laboratories and also from the 5
sets of data obtained by KSU labs are summarized in Table 5-5 for Method A, and Table 5-6 for
Method B (Polydorou, Riding, & Peterman, 2014).
Table 5-5 Inter-Laboratory Study Data- Method A (ASTM A1081) (Polydorou, Riding, &
Peterman, 2014)
Average
Mortar
Compressive
Strength
before test
(psi)
Average
Mortar
Compressive
Strength after
test (psi)
Average
Mortar
Mixture
Flow (%)
Strand A
Average
Pullout
Force (lb)
Strand I
Average
Pullout
Force
(lb)
Strand G
Average
Pullout
Force
(lb)
KSU 1 4554 4701 122.5 12803 14739 16921
KSU 2 4655 4762 122.4 13534 11446 17534
KSU 3 4589 4736 118 15250 12036 20548
KSU 4 4654 4675 124 16564 11652 20423
KSU 5 4619 4641 122 15711 13441 21503
LAB 1 4630 4785 115 14163 10114 20725
LAB 2 4535 4668 120 10947 10515 16722
LAB 3 4634 4814 117.5 14634 12681 17127
LAB 4 4630 4995 111 11103 10682 13832
LAB 5 4699 4896 120.7 10687 8966 12715
LAB 6 4511 4522 123.5 13201 10955 16695

71
Table 5-6 Inter-Laboratory Study Data- Method B (Modified ASTM A1081) (Polydorou,
Riding, & Peterman, 2014)
Average
Mortar
Compressive
Strength
before test
(psi)
Average
Mortar
Compressive
Strength after
test (psi)
Average
Mortar
Mixture
Flow (%)
Strand A
Average
Pullout
Force (lb)
Strand I
Average
Pullout
Force
(lb)
Strand G
Average
Pullout
Force
(lb)
KSU 1 4525 4485 114.5 14267 11585 17060
KSU 2 4525 4443 112 14890 12981 17307
KSU 3 4516 4731 116 13510 10373 16807
KSU 4 4579 4728 112.7 15343 11163 17495
KSU 5 4578 4794 116 13397 11027 16993
LAB 1 4648 4709 116 15250 9581 19037
LAB 2 4707 4884 113.5 13437 10331 20570
LAB 3 4551 4799 107.5 19367 13876 20591
LAB 4 4475 4820 115 12653 12445 17338
LAB 5 4359 4475 115.3 11886 10582 15046
LAB 6 4010 4115 114.5 13813 11589 17735
The mortar compressive strengths from Lab 6 during Method B tests were lower than
expected because some of the mortar cubes tested had visible imperfections on the surface,
indicating poor consolidation. The pullout tests were still performed as some of the cubes
indicated adequate strength and the time from casting was similar to that seen for companion
mixtures made with the same materials and proportions. The pullout test results from the Inter-
Laboratory study are illustrated in Figure 5.1- Figure 5.6, in a more detailed representation that
includes the high and low values for each group of 6 specimens tested. Each figure illustrates a
chart showing the pullout test values obtained per strand group, per method of testing, by the 8
external laboratories that participated in the study, and the 5 sets of data obtained by KSU labs
utilizing a different cement source per set of data. The minimum and maximum pullout force
values of the six strand samples tested per laboratory are shown in each chart. This also

72
illustrates the range of values obtained by each laboratory, highlighting the variability of data
within a single test site (Polydorou, Riding, & Peterman, 2014).
Figure 5.1 Inter-Laboratory Study Results, Method A-Strand A (Polydorou, Riding, &
Peterman, 2014)
Figure 5.2 Inter-Laboratory Study Results, Method B- Strand A (Polydorou, Riding, &
Peterman, 2014)
13,171
9,603
12,300
9,525 10,25511,602 11,171 11,058
13,66915,089
13,770
15,384
13,476
16,600
12,49011,152
14,85014,052
15,741
18,13418,904
16,764
0
5,000
10,000
15,000
20,000
25,000
30,000
LAB1 LAB2 LAB3 LAB4 LAB5 LAB6 KSU1 KSU2 KSU3 KSU4 KSU5
Fo
rce
at
0.1
" d
isp
lace
men
t (l
b)
12,767 12,436
17,462
11,66010,468
11,76313,339 12,698
11,806 12,05613,200
16,17214,901
21,104
13,94013,025
15,130 15,34216,361
14,419 15,111
17,036
0
5,000
10,000
15,000
20,000
25,000
30,000
LAB1 LAB2 LAB3 LAB4 LAB5 LAB6 KSU1 KSU2 KSU3 KSU4 KSU5
Fo
rce
at
0.1
" d
isp
lace
men
t (l
b)

73
Figure 5.3 Inter-Laboratory Study Results, Method A- Strand I (Polydorou, Riding, &
Peterman, 2014)
Figure 5.4 Inter-Laboratory Study Results, Method B- Strand I (Polydorou, Riding, &
Peterman, 2014)
7,374
9,93811,013
9,210 8,69110,290
12,684
9,37510,792
9,942
12,790
12,119 11,621
14,000
11,720
9,437
11,750
16,753
13,17614,492
13,638 13,867
0
5,000
10,000
15,000
20,000
25,000
30,000
LAB1 LAB2 LAB3 LAB4 LAB5 LAB6 KSU1 KSU2 KSU3 KSU4 KSU5
Fo
rce
at
0.1
" d
isp
lace
men
t (l
b)
8,989 9,291 9,346
11,380
8,89310,399
9,186
12,231
10,034 9,52710,504
10,641 10,943
16,235
13,940
12,122 12,752 13,15714,314
12,255 11,798 11,900
0
5,000
10,000
15,000
20,000
25,000
30,000
LAB1 LAB2 LAB3 LAB4 LAB5 LAB6 KSU1 KSU2 KSU3 KSU4 KSU5
Fo
rce
at
0.1
" d
isp
lace
men
t (l
b)

74
Figure 5.5 Inter-Laboratory Study Results, Method A- Strand G (Polydorou, Riding, &
Peterman, 2014)
Figure 5.6 Inter-Laboratory Study Results, Method B- Strand G (Polydorou, Riding, &
Peterman, 2014)
19,250
15,824 15,751
12,540 12,023
15,758 15,811 15,362
19,43518,065 18,449
22,496
17,70219,358
14,39013,219
18,169
20,67919,559
22,310 21,977
24,105
0
5,000
10,000
15,000
20,000
25,000
30,000
LAB1 LAB2 LAB3 LAB4 LAB5 LAB6 KSU1 KSU2 KSU3 KSU4 KSU5
Fo
rce
at
0.1
" d
isp
lace
men
t (l
b)
18,35819,582
16,652 15,960
13,070
16,813
14,604 15,261 15,727 15,980 16,146
19,74621,496
23,233
18,60016,943
19,00018,152
19,033 18,85918,130
19,416
0
5,000
10,000
15,000
20,000
25,000
30,000
LAB1 LAB2 LAB3 LAB4 LAB5 LAB6 KSU1 KSU2 KSU3 KSU4 KSU5
Fo
rce
at
0.1
" d
isp
lace
men
t (l
b)

75
Switching to Method B reduced the variability of the test results within laboratories, as
well as total variability when considering the Inter-Laboratory study as a whole. The standard
deviations and coefficients of variability per strand are shown in Table 5-7 (Polydorou, Riding,
& Peterman, 2014).
Table 5-7 Average Pullout Test Result, Standard Deviation and Coefficient of Variation for
Strands A, G and I, Method A vs Method B (Polydorou, Riding, & Peterman, 2014)
Strand A
Method
A
Strand A
Method
B
Strand G
Method
A
Strand
G
Method
B
Strand I
Method
A
Strand I
Method
B
Average
Pullout
Force (lb)
13,500 14,300 17,700 17,800 11,600 11,400
Standard
Deviation 1903 1882 2728 1576 1543 1212
Coefficient
of
Variation
0.14 0.13 0.15 0.09 0.13 0.11
As observed in Table 5-7, the average test results for strands G and I when comparing
Method A to Method B only vary by 100 lb and 200 lb respectively. In the case of strand A, the
average pullout test result that was obtained when utilizing Method B was 800 lb higher that the
average pullout test result obtained by Method A. The standard deviation of the data samples
was reduced in every case when Method B results were considered, especially for Strand G,
where Method B was able to reduce the variability from a coefficient of variation of 0.15 down
to a 0.09. This reduction in variability was expected since the ruggedness study results
suggested that reducing the mortar mixture flow allowable range would also reduce the test
variability (Polydorou, Riding, & Peterman, 2014).
Enforcing a water to cement ratio of 0.45 was also found to reduce the variability when
KSU researchers first attempted this method modification, but the outliers obtained during the

76
Inter-Laboratory study from specific laboratories raise the question of how the duration of
sample curing affects specimen performance, while they are at equal compressive strengths. This
could be because the mortar cubes were cured at a constant laboratory temperature. The
specimens containing strand were stored in moist rooms kept at a constant temperature. Because
the specimens have a considerable amount of cement, their heat of hydration can raise the
temperature of the specimens significantly, raising the maturity of the samples. This could
explain why mixtures with significantly faster or slower reacting cements at the same w/c gave
different pullout strengths, even when companion mortar strengths were similar (Polydorou,
Riding, & Peterman, 2014).
5.5 Inter-Laboratory Study Conclusions
By using different type III cement sources at the different ILS laboratories and also
within KSU, it was noticed that it was not possible for all cement sources to reach the specified
mortar compressive strength of 4500-5000 psi within 22-26 hours from mixing time when using
a prescribed water-cement ratio of 0.45. For this reason, the modified ASTM A1081 method
proposed imposed no constraints when it came to curing time. This modification to the test
method resulted in curing times that varied substantially among laboratories, leading to wariness
that differences in mortar maturity at the time of test could cause some strength discrepancies
(Polydorou, Riding, & Peterman, 2014).
The ASTM A1081 test method was found to have a coefficient of variation of 14%.
Modifications to the test that include using a standard graded sand source at all laboratories,
using mortar mixtures of a consistent water-cement ratio (w/c) of 0.45 at all sites, and reducing
the allowable mortar mixture flow range reduced the average coefficient of variation to 11%.
While it was found that the modifications proposed did reduce the test variability, the use of a
standard graded sand source would also raise the cost of performing the test substantially
(Polydorou, Riding, & Peterman, 2014).
Using different cements affected the test results. Further investigation of cement source
chemical composition and properties might lead to further recommendations about cement
source selection to reduce test variability (Polydorou, Riding, & Peterman, 2014).
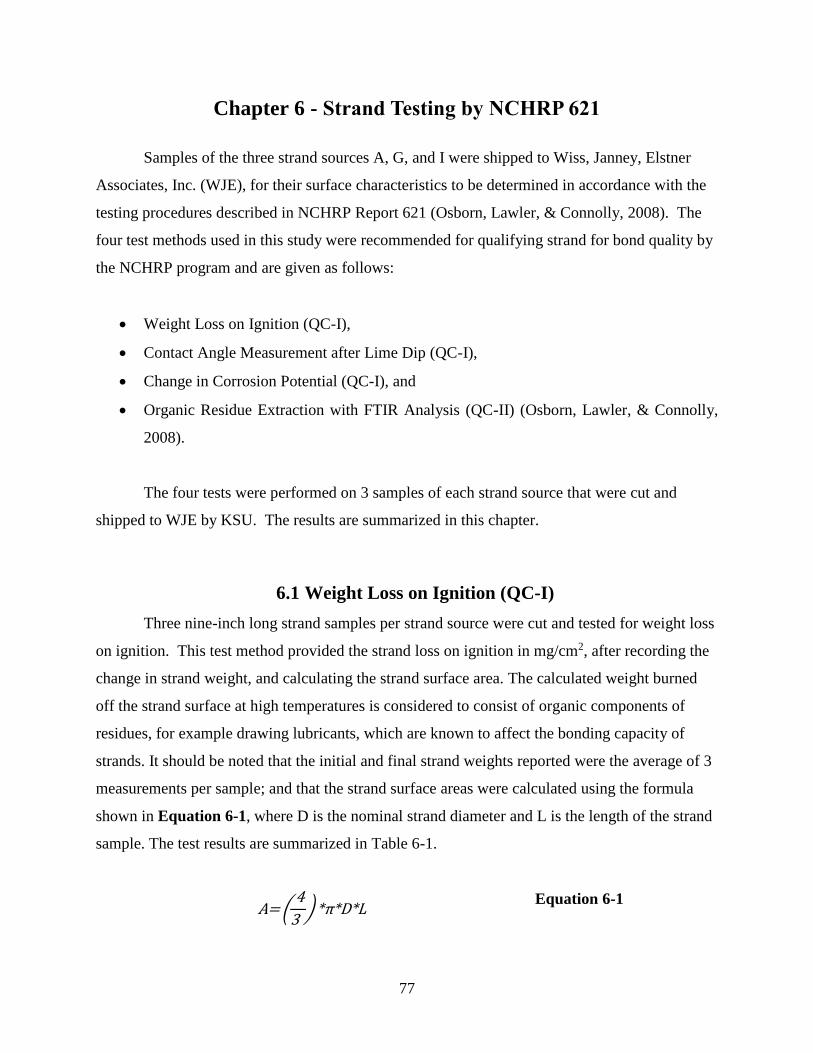
77
Chapter 6 - Strand Testing by NCHRP 621
Samples of the three strand sources A, G, and I were shipped to Wiss, Janney, Elstner
Associates, Inc. (WJE), for their surface characteristics to be determined in accordance with the
testing procedures described in NCHRP Report 621 (Osborn, Lawler, & Connolly, 2008). The
four test methods used in this study were recommended for qualifying strand for bond quality by
the NCHRP program and are given as follows:
Weight Loss on Ignition (QC-I),
Contact Angle Measurement after Lime Dip (QC-I),
Change in Corrosion Potential (QC-I), and
Organic Residue Extraction with FTIR Analysis (QC-II) (Osborn, Lawler, & Connolly,
2008).
The four tests were performed on 3 samples of each strand source that were cut and
shipped to WJE by KSU. The results are summarized in this chapter.
6.1 Weight Loss on Ignition (QC-I)
Three nine-inch long strand samples per strand source were cut and tested for weight loss
on ignition. This test method provided the strand loss on ignition in mg/cm2, after recording the
change in strand weight, and calculating the strand surface area. The calculated weight burned
off the strand surface at high temperatures is considered to consist of organic components of
residues, for example drawing lubricants, which are known to affect the bonding capacity of
strands. It should be noted that the initial and final strand weights reported were the average of 3
measurements per sample; and that the strand surface areas were calculated using the formula
shown in Equation 6-1, where D is the nominal strand diameter and L is the length of the strand
sample. The test results are summarized in Table 6-1.
A= ( 4
3 ) *π*D*L
Equation 6-1

78
Table 6-1 Loss on Ignition Test Data
Strand
Sample
Strand
Length
(cm)
Nominal
Strand
Diameter
(cm)
Average
Initial
Weight
(g)
Average
Final
Weight
(g)
Change
in weight
(mg)
Surface
Area of
Strand
(cm2)
Loss on
Ignition
(mg/cm2)
A 1 (LOI) 23.0 1.3 175.8154 175.8248 -9.4 125.2 -0.075
A 2 (LOI) 23.0 1.3 176.4379 176.4294 8.5 125.2 0.068
A 3 (LOI) 23.0 1.3 175.9624 175.9667 -4.2 125.2 -0.034
G 1 (LOI) 22.9 1.3 176.6762 176.6701 6.1 124.7 0.049
G 2 (LOI) 22.9 1.3 176.2935 176.2966 -3.1 124.7 -0.025
G 3 (LOI) 22.9 1.3 176.1889 176.1845 4.4 124.7 0.035
I 1 (LOI) 23.1 1.3 176.0243 176.0180 6.3 125.8 0.050
I 2 (LOI) 23.0 1.3 175.5060 175.4869 19.1 125.2 0.153
I 3 (LOI) 23.0 1.3 176.0478 176.0284 19.3 125.2 0.154
Compared to the NASP pullout test, the NCHRP study revealed that lower bond applies
to higher Loss on Ignition values, and this study can agree with the trend, since the lower
bonding strand I experienced much higher Loss on Ignition values that the other two sources.
Even though strand G is the highest bonding source in this study as far as pullout test values as
considered, 2 out of 3 strand A samples experienced a Loss on Ignition that was lower than all 3
strand G samples in this study.
6.2 Contact Angle Measurement after Lime Dip (QC-I)
NCHRP 621 prescribes that the surface tension of steel strand be determined by contact
angle measurement (CAM), which is performed by a modified half-angle technique. The contact
angles were calculated for three foot-long samples of each strand source. The average of 6
readings per strand was reported to KSU. The 3 strand I samples had the smallest contact angles
and the 3 strand G samples shared the largest contact angles. The results are shown in Table 6-2.

79
Table 6-2 Contact Angle Measurement Test Data
Strand
Source
Sample # Contact Angle (degrees)
A 1 76.7
A 2 80.2
A 3 82.0
G 1 82.2
G 2 82.8
G 3 81.5
I 1 75.1
I 2 70.0
I 3 67.6
The NCHRP study revealed that strands of a contact angle of 73° or lower will give 90%
confidence of adequate bond through correlation of the Contact Angle Measurement test results
with the NASP pullout test results. This applies to strand I of our study which averaged a 70.9°
Contact Angle, but surprisingly strand I is the lowest bonding strand source of this study.
Looking at all three sources, the exact opposite trend is observed in our study compared to the
NCHRP.
In this study we see the highest bonding strand by the pullout test (Strand G) to obtain the
highest Contact Angles at an average of 80.3°, the in between performer under pullout test strand
A to experience an average Contact Angle Measurement of 79.6°, and the lowest bonding strand
I to experience a very low average Contact Angle at 70.9°.
6.3 Change in Corrosion Potential (QC-I)
The change in corrosion potential of steel strand was determined by sealing one end of
each strand sample with epoxy, and partially submerging it in deionized water. This test is
performed in order to reveal the coating of residue amounts per strand, since it was revealed in
prior studies that strands with a coating of residue are less likely to corrode. The initial corrosion
potential and potential change were measured using a potentiostat. The initial corrosion potential

80
and change after 1 hour and 6 hours are reported in Table 6-3. The NCHRP study revealed that a
Change in Corrosion Potential of -0.175 V or higher (less negative) provides good confidence for
adequate bond.
Table 6-3 Change in Corrosion Potential Test Data
Strand Sample Initial Corrosion
Potential (V)
Corrosion Potential
Change after 1 hour
(V)
Corrosion Potential
Change after 6 hour
(V)
A 1 (CCP) -0.232 -0.126 -0.262
A 2 (CCP) -0.163 -0.167 -0.311
A 3 (CCP) -0.159 -0.181 -0.304
G 1 (CCP) -0.254 -0.144 -0.199
G 2 (CCP) -0.254 -0.139 -0.209
G 3 (CCP) -0.261 -0.115 -0.180
I 1 (CCP) -0.205 -0.141 -0.255
I 2 (CCP) -0.192 -0.168 -0.291
I 3 (CCP) -0.203 -0.151 -0.283
All of the strand samples tested for our study experienced corrosion potential changes
that are less negative than -0.175 V, but still following the trend obtained in the NCHRP study
with Strand G experiencing the least negative corrosion potential change out of the 3 sources, but
strand I slightly outperforming strand A in this test, even though strand I was the lowest
performer in the pullout testing rounds.
6.4 Organic Residue Extraction with FTIR Analysis (QC-II)
Using solvent extraction procedures, as well as gravimetric and Fourier Transform
Infrared (FTIR) spectroscopy, the organic drawing-compound residues of 3 samples from each
strand source were identified and quantified, and the extracted residue concentrations were
reported along with the FTIR spectrum plots for each sample tested. This procedure allows for
identification of the type of residue as well as determination of the amount of residue on a strand

81
surface, and therefore can help in identifying the potential cause of inadequate bond. A
summary of the test results is shown in Table 6-4.
Table 6-4 Organic Residue Extraction with FTIR Analysis Test Results
Strand
Sample
Nominal
Strand
Diameter
(cm)
Mass of
residue (mg)
Surface
Area (cm2)
Residue
(mg/cm2) FTIR Interpretation
A 1 (OR) 1.3 1.4 166.1 0.008 Stearic Acid
A 2 (OR) 1.3 4.8 166.1 0.029 Stearic Acid
A 3 (OR) 1.3 4.9 166.1 0.030 Stearic Acid
G 1 (OR) 1.3 4.4 166.1 0.026 Stearic Acid plus ester
G 2 (OR) 1.3 3.2 166.1 0.019 Stearic Acid plus ester
G 3 (OR) 1.3 2.2 166.1 0.013 Stearic Acid plus ester
I 1 (OR) 1.3 13.0 166.1 0.078 Stearic Acid
I 2 (OR) 1.3 4.8 166.1 0.029 Stearic Acid
I 3 (OR) 1.3 10.5 166.1 0.063 Stearic Acid
Better correlation was observed during the NCHRP study when the FTIR analysis
identified only stearate residue on the samples, but overall, higher concentrations of residue were
matched with lower pullout test values. In the case of our 3 strand sources A, G and I, the test
results match the NCHRP trend exactly, with higher concentrations of residue corresponding to
lower ASTM A1081 pullout force values.
After testing by the 4 recommended Quality Control procedures was concluded, an
analysis of the prediction intervals and thresholds was conducted, following the procedures
outlined in NCHRP Report 621, and taking into consideration the strand source average pullout
force values reported by KSU in June 2012; which were 14,983 lb for Strand A, 19,617 lb for
Strand G, and 12,167 lb for Strand I. The threshold value applied to the data analysis was 10,500
lb, or 0.313 ksi; the same value used for NCHRP Report 621. Based on that information, the
data from this study was analyzed separately, and also in combination with the data from the
NCHRP Report 621. It was observed that even though the values obtained for the Strand Sources

82
A, G, and I for the purpose of this study by all 4 tests conducted fell within the ranges of test
result values obtained for the 9 strand sources tested in 2006 during the NCHRP study, the
Contact Angle Measurement results did not follow the trend seen in the NCHRP study, but
instead revealed an opposite trend that disagrees with the NCHRP Report 621 findings.

83
Chapter 7 - Discussion of ASTM A1081
7.1 Summary of Factors that Affected the Test
During this investigation of ASTM A 1081, “Standard Test Method for Evaluating Bond
of Seven-Wire Steel Prestressing Strand”, a few factors were identified that can affect the test
method and test results.
Great caution should be taken in maintaining the equipment required to run the test,
especially for the sensitive brass table used to measure the mortar mixture flow. ASTM C1437
should be followed strictly in order to avoid inconsistency in mortar mixture flow measurements.
It was seen that improper oiling of the flow table shaft had significant effects on the flow values,
affecting the test method repeatability (Riding, Peterman, Polydorou, & Ren, 2012).
Through the ruggedness testing study, where the effects of the mortar compressive
strength, mortar mixture flow, and test loading rate were investigated, it was determined that the
mortar mixture flow was the only factor that affected the test results significantly (Polydorou,
Riding, Peterman, & Murray, 2013). It is therefore crucial that accurate mortar flow
measurements are taken consistently. Consistency in sand gradations was found to reduce the
variability of the results, since uniformly graded sand will provide uniform mortar mixture flows,
however using graded sand may not be practical (Polydorou, Riding, & Peterman, 2014). The
compressive strength range allowed by the standard test is small enough so that the range of
mortar compressive strength allowed during the test (4500psi to 5000psi) should not be reduced
further because of the variability in mortar compressive strength tests and difficulty in meeting
the test time window specification (Polydorou, Riding, Peterman, & Murray, 2013).
When 5 different cement sources were used at Kansas State University, the average
maximum difference obtained for the three strands tested by the standard method was 21%.
When the test was performed using mortar mixtures that all shared the same water to cement
ratio of 0.45, the average maximum difference was reduced down to 14%. In this case, the test
time window requirement was ignored, in order to accommodate mortar mixtures with all 5
cement sources at this w/c ratio (Polydorou, Riding, & Peterman, 2014).
It was observed that the pullout test results were greatly affected when using ASTM
C150 type III cements coming from different manufacturers. The results experienced higher
variability when performed at multiple testing sites using cements from a wider spectrum of

84
manufacturers. The results obtained that were far away from the mean during the inter-
Laboratory study when all mortar mixtures were made with a w/c ratio of 0.45 raised a concern
that the time required for a mortar mixture to reach the required compressive strength might have
an effect on the test results, and it was recommended that further investigation on the cement
sources’ chemical composition and physical properties be done (Polydorou, Riding, & Peterman,
2014). Setting some limits on the cement source chemistry is expected to reduce the variability
of the ASTM A1081 test results substantially. It is recommended that further investigation of the
cement source chemical composition and properties can lead to a prescribed cement composition
range to be used in this test, in order to reduce its variability.
7.2 Summary of Precision and Bias Statement for ASTM A1081
As part of the Inter-Laboratory study, 5 sets of data from KSU, 1 set per cement source,
plus the data from 6 additional laboratories which participated in the Inter-Laboratory study were
analyzed in order to define the precision and bias statements for ASTM A1081/A1081M-12:
“Standard Test Method for Evaluating Bond of Seven-Wire Steel Prestressing Strand.” Samples
of 0.5 inch diameter strands from the 3 manufacturing plants labeled A, G, and I were tested at
every laboratory according to ASTM A1081-12, with the result of the test method taken as the
average of six individual test determinations.
The single operator coefficient of variation has been found to be 9.0 %. It was also
determined by ASTM C670 that two properly conducted tests (each consisting of the average of
six single determinations) by the same operator on the same material are not expected to differ
by more than 12.1 %. The range (difference between highest and lowest) of the six single
determinations used in calculating the average is not expected to exceed 24.9 %, as determined
by ASTM C670.
The multi-laboratory coefficient of variation was calculated as 14.5 %. The results of
two properly conducted tests in different laboratories on the same material are not expected to
differ by more than 40.2 %, as determined following ASTM C670. It was not possible to make a
justifiable statement on the bias of this test method, since an appropriate accepted reference
value does not exist at this time.

85
7.3 Strand Pullout Test Values to Consider in Phase II
In conclusion of the first phase of this project, the average pullout test values per strand
were finalized. For Strand A, the average pullout force from the Inter-Laboratory study was
determined to be 13,500 lb. Strand G averaged a pullout force of 17,700 lb, and Strand I
averaged 11,600 lb. These ASTM A1081 values are to be taken into consideration in the
analysis of Phase II, where rectangular beam sections were prestressed with a single strand
specimen coming from the coils of either strand A, strand G, or strand I.
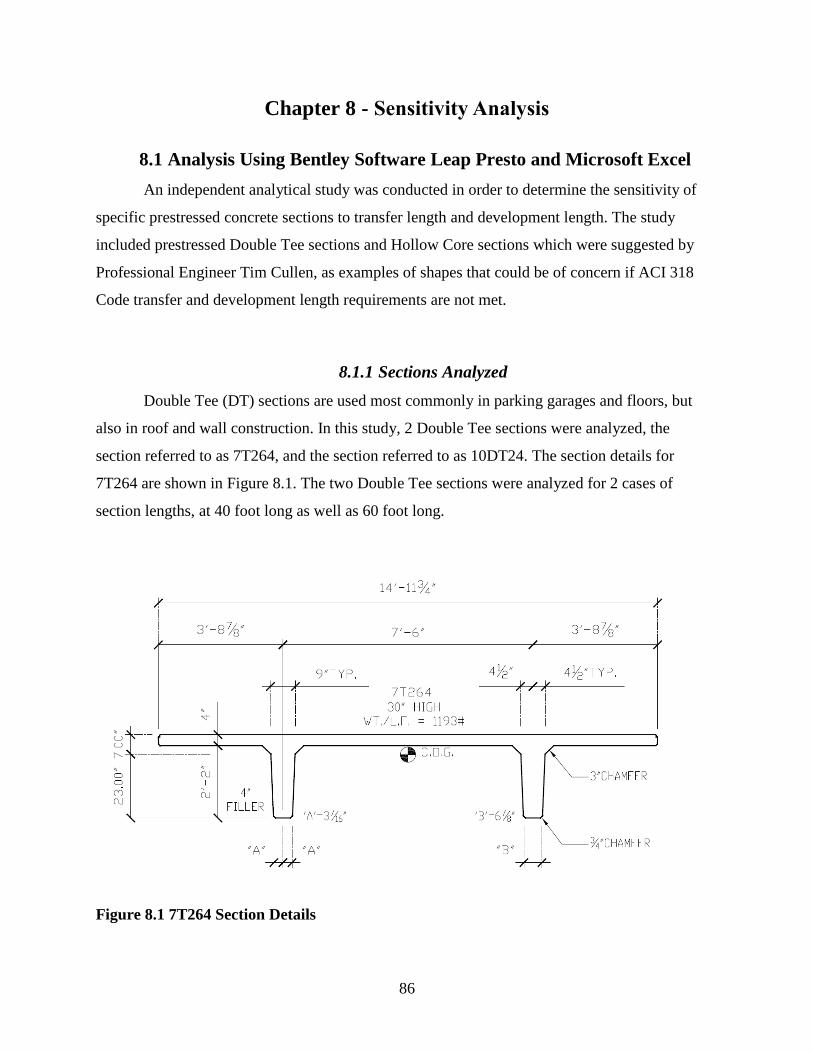
86
Chapter 8 - Sensitivity Analysis
8.1 Analysis Using Bentley Software Leap Presto and Microsoft Excel
An independent analytical study was conducted in order to determine the sensitivity of
specific prestressed concrete sections to transfer length and development length. The study
included prestressed Double Tee sections and Hollow Core sections which were suggested by
Professional Engineer Tim Cullen, as examples of shapes that could be of concern if ACI 318
Code transfer and development length requirements are not met.
8.1.1 Sections Analyzed
Double Tee (DT) sections are used most commonly in parking garages and floors, but
also in roof and wall construction. In this study, 2 Double Tee sections were analyzed, the
section referred to as 7T264, and the section referred to as 10DT24. The section details for
7T264 are shown in Figure 8.1. The two Double Tee sections were analyzed for 2 cases of
section lengths, at 40 foot long as well as 60 foot long.
Figure 8.1 7T264 Section Details

87
Hollow Core sections are also very common in the prestressing industry, used in floor,
roof and wall construction, preferred due to their shallow depths for occasions where floor-to-
floor heights are limited. Hollow Core sections are also preferred in some cases order for
accommodation of HVAC, plumbing and electrical equipment. Two Hollow Core sections were
considered in this analysis, and they are referred to as Highcore 8-1000 and Highcore 12. The
Hollow Core sections were analyzed at 3 different lengths each. Highcore 8-1000 was analyzed
as a 12 foot, 24 foot, and 36 foot long member, and Highcore 12 was analyzed as a 20 foot, 30
foot, and 40 foot member. The details for section Highcore 8-1000 are shown in Figure 8.2.
Figure 8.2 Highcore 8-1000 Section Details
Analysis was performed using the comprehensive software LEAP PRESTO of Bentley
Systems, Inc., as well as Microsoft Excel. The specific section properties, strand reinforcement
patterns and material properties considered in the study were suggested by Mr. Cullen. All
sections were prestressed with 0.5 inch diameter, 270 ksi strands.

88
8.1.2 Conditions Analyzed
The sections were analyzed for the uniform loading condition of 40 lb per square foot
live load and and 25.2 lb per square foot snow load. The analysis was based on varying the
design transfer length and development length values per section case, first by applying the exact
actual code suggested values, and then applying a factor of 1.4 as well as a factor of 2.0 to the
code suggested values. The purpose of this analysis was to study how the moment capacity as
well as the shear capacity varies for each member under these specific loading conditions, and
determine the effects of having prestressing strands of transfer and development lengths that are
longer than the values recommended by ACI 318 code.
8.2 Sensitivity Analysis Results
As expected, the effects of changing the assumed transfer and development length values
were evident near the members’ ends, reducing the moment as well as shear capacities at the
ends of every member analyzed, as the ACI code values’ multipliers were increased from 1.0 to
1.4 and then 2.0. Analysis of the results revealed reduction in moment as well as shear capacity
of all the sections considered, as the transfer and development length factors increased. The
nominal moment and shear capacity values at 6 inch increments through the mid span of each
section were extracted from the software. The values for the case where the ACI transfer and
development lengths are multiplied by 1.0 were considered as the 100% capacities and were
compared to the capacities obtained for the cases where the transfer and development lengths
were multiplied by 1.4 and 2.0, and graphical representations of the specific points that reflected
the maximum capacity reductions, or critical section per case, were prepared. The examples
considered for the Double Tee section 72T64 are shown in Figure 8.3 and Figure 8.4 considering
moment and shear capacities respectively. The moment and shear capacities for the cases
analyzed are shown in Figure 8.5 and Figure 8.6 for section 10DT24, Figure 8.7 and Figure 8.8
for Highcore 8-1000, and Figure 8.9 and Figure 8.10 for Highcore 12. A summary of the
remaining moment and shear capacities at the critical section per case analyzed is shown in
Table 8-1.

89
Figure 8.3 Percent of ACI Moment Capacity per Case Analyzed for 7T264
Figure 8.4 Percent of ACI Shear Capacity per Case Analyzed for 7T264
0
10
20
30
40
50
60
70
80
0 20 40 60 80
% A
CI M
om
en
t C
apac
ity
Span (ft)
7T264
40ft- 1.4 (Lt, Ld)
40ft- 2.0 (Lt, Ld)
60ft- 1.4 (Lt, Ld)
60ft- 2.0 (Lt, Ld)
0
10
20
30
40
50
60
70
80
90
100
0 20 40 60 80
% A
CI S
he
ar C
apac
ity
Span (ft)
7T264
40ft- 1.4 (Lt, Ld)
40ft- 2.0 (Lt, Ld)
60ft- 1.4 (Lt, Ld)
60ft- 2.0 (Lt, Ld)

90
Figure 8.5 Percent of ACI Moment Capacity per Case Analyzed for 10DT24
Figure 8.6 Percent of ACI Shear Capacity per Case Analyzed for 10DT24
0
10
20
30
40
50
60
70
80
0 20 40 60 80
% A
CI M
om
en
t C
apac
ity
Span (ft)
10DT24
40ft- 1.4 (Lt, Ld)
40ft- 2.0 (Lt, Ld)
60ft- 1.4 (Lt, Ld)
60ft- 2.0 (Lt, Ld)
0
10
20
30
40
50
60
70
80
90
100
0 20 40 60 80
% A
CI S
he
ar C
apac
ity
Span (ft)
10DT24
40ft- 1.4 (Lt, Ld)
40ft- 2.0 (Lt, Ld)
60ft- 1.4 (Lt, Ld)
60ft- 2.0 (Lt, Ld)

91
Figure 8.7 Percent of ACI Moment Capacity per Case Analyzed for HC 8-1000
Figure 8.8 Percent of ACI Shear Capacity per Case Analyzed for HC 8-1000
0
10
20
30
40
50
60
70
0 10 20 30 40
% A
CI M
om
en
t C
apac
ity
Span (ft)
HC 8-1000
12ft- 1.4 (Lt, Ld)
12ft- 2.0 (Lt, Ld)
24ft- 1.4 (Lt, Ld)
24ft- 2.0 (Lt, Ld)
36ft- 1.4 (Lt, Ld)
36ft- 2.0 (Lt, Ld)
0
10
20
30
40
50
60
70
80
90
0 10 20 30 40
% A
CI S
he
ar C
apac
ity
Span (ft)
HC 8-1000
12ft- 1.4 (Lt, Ld)
12ft- 2.0 (Lt, Ld)
24ft- 1.4 (Lt, Ld)
24ft- 2.0 (Lt, Ld)
36ft- 1.4 (Lt, Ld)
36ft- 2.0 (Lt, Ld)

92
Figure 8.9 Percent of ACI Moment Capacity per Case Analyzed for HC 12
Figure 8.10 Percent of ACI Shear Capacity per Case Analyzed for HC 12
0
10
20
30
40
50
60
70
80
0 10 20 30 40 50
% A
CI M
om
en
t C
apac
ity
Span (ft)
HC 12
20ft- 1.4 (Lt, Ld)
20ft- 2.0 (Lt, Ld)
30ft- 1.4 (Lt, Ld)
30ft- 2.0 (Lt, Ld)
40ft- 1.4 (Lt, Ld)
40ft- 2.0 (Lt, Ld)
0
10
20
30
40
50
60
70
80
90
100
0 10 20 30 40 50
% A
CI S
he
ar C
apac
ity
Span (ft)
HC 12
20ft- 1.4 (Lt, Ld)
20ft- 2.0 (Lt, Ld)
30ft- 1.4 (Lt, Ld)
30ft- 2.0 (Lt, Ld)
40ft- 1.4 (Lt, Ld)
40ft- 2.0 (Lt, Ld)

93
Table 8-1 Summary of ACI Capacities Reduced per Section and Case Analyzed
Section Length
(ft)
TL/DL
factor
% ACI Moment
Capacity
% ACI Shear
Capacity
7T264
40 1.4 66.5 94.9
2.0 41.1 90.6
60 1.4 71.5 94.3
2.0 50.1 89.4
10DT64
40 1.4 71.6 90.0
2.0 46.3 81.3
60 1.4 63.2 89.9
2.0 43.7 81.4
HC 8-1000
12 1.4 61.8 84.4
2.0 29.4 71.7
24 1.4 61.8 84.2
2.0 29.4 71.4
36 1.4 61.8 86.7
2.0 29.4 73.9
HC 12
20 1.4 66.0 87.6
2.0 32.2 77.0
30 1.4 65.0 87.6
2.0 30.0 77.0
40 1.4 66.7 87.6
2.0 27.0 77.0
Table 8-1 reveals that applying a factor of 1.4 to the ACI transfer and development length
equations can reduce the moment capacity of a section down to 61.8%, and shear capacity down
to 84.2% of ACI values, as determined for the case of the Hollow Core section “HC 8-1000”.
Applying a factor of 2.0 was able to reduce the moment capacity down to 27% of ACI
capacity for the 40ft long Highcore 12 example analyzed in this study. Doubling the
transfer/development lengths assumed by the ACI 318 code was able to reduce the shear capacity
down to 71.4% of ACI capacity for the Hollow Core “HC 8-1000”.

94
In a telephone discussion, design engineer Mr. Tim Cullen agreed that hollow core
sections are of high sensitivity to poor bond, especially when shear requirements are not met,
since most of the time no shear reinforcement is provided in hollow core sections. Mr. Cullen
also added that it is always assumed that the specimen will meet ACI 318 transfer length
provisions, and no consideration for longer transfer lengths is taken in design practice. Unlike for
Hollow Core members, Mr. Cullen mentioned that at least 5 feet of stem mesh is provided for
shear reinforcement in Double Tee members, providing additional capacity at the ends.
The shear diagrams for the Hollow Core section “HC 12” are shown in Figure 8.11 for
the 30 ft. long section, where we can see the 3 shear capacity curves, and notice that the curve
corresponding to the 2.0 factor applied to the ACI 318 code equations for the transfer and
development length does not meet the requirements for shear.
Figure 8.11 Shear Diagrams for 30 ft. long HC 12
0
5
10
15
20
25
30
35
40
45
50
0 2 4 6 8 10 12 14 16 18 20
Shear
[kip
]
Length [ft]
vu/phi TL 1.0 TL 1.4 TL 2.0

95
An example of moment capacity diagrams is presented in Figure 8.12, where the
comparison between the 3 factors applied to the transfer/development length equations is shown
for the 40ft. long Double Tee section 7T264.
Figure 8.12 Moment Diagrams for 40ft. long 7T264
The effects of using lightweight concrete instead of normal weight concrete were also
investigated during the Sensitivity Analysis Study. The results simply revealed that the
lightweight factor, λ, reduces the shear capacities; but the percentages when comparing the 3
cases of transfer and development lengths considered are equal to the percentages obtained with
normal weight concrete, since all the values are affected by the same factor. It was also observed
that the lightweight factor, λ, does not affect moment capacity, therefore the percentages in this
case are also equal to the values obtained when considering normal weight concrete.
-200
0
200
400
600
800
1000
1200
0 5 10 15 20
Mom
ent [k
ip-f
t]
Length [ft]
Mu/phi TL 1.0 TL 1.4 TL 2.0

96
8.3 Sensitivity Analysis Conclusions and Recommendations
The results obtained per beam section investigated in this study are specific to the
section’s case and cannot be generalized. The general trend observed in all cases was the
reduction in moment as well as shear capacity near the beam ends, with an increase in transfer
length.
The effects of longer transfer and development lengths are more pronounced in the
flexural capacity than shear capacity of the sections analyzed.
For the uniformly loaded Double Tee and Hollow Core sections analyzed, the reduced
capacities due to the considered longer transfer and development lengths were still higher than
the factored load demand, indicating that uniformly loaded members may still perform well with
increased transfer and development lengths. However, these results could be misleading as many
Double Tee and Hollow Core members are subjected to heavy point loads near the end of their
span, due to wall loading. The most sensitive cases were determined to be those of hollow core
sections. Additional analysis is recommended, with distributed loading as well as concentrated
loads considered.

97
Chapter 9 - Rectangular Beam Specimens at Stresscon
9.1 Introduction
In order to test the performance of the 3 strand samples A, G, and I in concrete beam
sections, rectangular beams were made using the strands and loaded until failure at Stresscon,
Inc. Stresscon Inc. is a prestressed concrete manufacturer located in Colorado Springs, CO.
Beams were made and tested at Stresscon, Inc. in order to fabricate the beams using the same
aggregates and similar mixture proportions used in a previous study on strand bond (Logan,
1997).
9.2 Beam Specimen Design and Fabrication
9.2.1 Rectangular Beam Specimen Design
9.2.1.1 Beam Dimensions and Strand Location
The rectangular beam specimens made at Stresscon, Inc. had design dimensions of 6.5
inches wide and 12 inches deep, as shown in Figure 9.1. The sections were reinforced with a
single strand specimen placed in the middle of the beam’s width and at a distance of 10 inches
from the top face of the section. Ten 18 foot long beams were cast for each of the strand sources
A, G and I.
Figure 9.1 Beam Section Dimensions

98
9.2.1.2 Shear Reinforcement Details
Every beam section was tested on both sides, at pre-determined distances from the ends
of each beam. Every beam was loaded on one side at a distance of 80% of the prescribed ACI
318 code development length from its end, and on the opposite side at a distance of 60% of the
prescribed ACI 318 code development length from the beam’s end.
The loading point selections were made in agreement with the project advisory
committee, aiming to determine approximate development lengths. The loading configuration
details for the short ends as well as the long ends of each beam are illustrated in Figure 9.2 and
Figure 9.3 respectively. One side of each beam was loaded first, and then the beams were moved
and prepared for their opposite end to be tested.
Figure 9.2 Short End (60% ACI Ld) Loading Configuration
Figure 9.3 Long End (80% ACI Ld) Loading Configuration
Flexural beam sections were reinforced with welded wire fabric for shear between the
two load application points to force beam failure between the beam load application point and
the beam end. The welded wire fabric used for shear reinforcement of the Stresscon beams is
shown in Figure 9.4. Similarly to Mr. Logan’s study, 2 layers of 9 inch deep stem mesh were
used (Logan, 1997), at 9ft and 7 ½ inches long. The shear reinforcement was used in order to
avoid any interactions between the two beam ends, since flexural testing for development length
was conducted on both sides of each beam. Figure 9.2 and Figure 9.3 show the shear
reinforcement configuration details.

99
Figure 9.4 Welded Wire Fabric Shear Reinforcement
9.2.2 Concrete Mixture Design Specifications
The concrete mixture used during the beam study at Stresscon, Inc., was designed to
match the low slump concrete mixture that was used by Mr. Logan during his 1996 strand bond
study, also conducted at Stresscon, Inc. Figure 9.5 shows the concrete mixing plant used at
Stresscon, Inc. The concrete mixture was designed for a concrete compressive strength at the
time of initial prestress (f’ci) of 3500 psi, and a 28-day compressive strength (f’c) of 6000 psi.
The mixture composition is shown in Table 9-1.
Figure 9.5 Concrete Mixing Plant at Stresscon, Inc.

100
Table 9-1 Concrete Mixture Design Specifications
Material Quantity Unit
Type III Cement 658 lb/yd3
Water 322 lb/yd3
Fine Aggregate 1081 lb/yd3
Coarse Aggregate 1876 lb/yd3
Delvo (admixture) 4 oz/cwt
9.2.3 Beam Fabrication Procedure
9.2.3.1 Beam Casting Schedule
The beams were fabricated on a single prestressed concrete bed at Stresscon, Inc. over
three days. Two wooden beam forms were used, in which the strands were placed and tensioned
before concrete placement. Each form was made long enough to include 5 beam sections and two
dummy blocks, one on each end. The dummy blocks were 4 foot-long and were cast on both
ends in order to accommodate de-tensioning by saw cutting. This ensured that all beam ends
experienced the same type of strand release mechanism: saw cutting.
On the first day of concrete placement, the first five strand A and the first five strand I
beams were fabricated. On the second day of concrete placement, the second set of 5 strand A
beams were cast along with the first 5 strand G beams. The second sets of strand G and strand I
beams were fabricated on the third day of concrete placement. The beam casting setup and
schedule details are shown in Figure 9.6.

101
Figure 9.6 Beam Casting Setup and Schedule Details
9.2.3.2 Crack Formers and Beam Notching
It was originally planned to provide 4-inch tall galvanized steel crack inducers at the
lower part of every beam below both locations of loading in order to control stress concentration
and cracking in the concrete. The galvanized crack formers, which were wrapped with tape to
assist with de-bonding from the concrete material, are illustrated in Figure 9.7.
The purpose of the crack formers was to force flexural cracking in the bond region,
increasing the bond stress on the strand at that location. It was believed that this would result in
more bond slip failures.

102
Figure 9.7 Crack Inducer Setup
Unfortunately after cast day 1, it was observed that the much higher strains experienced
by the compressible tape on the crack former in the concrete were causing disturbances in the
surface strain readings. Because of this issue, no crack inducers were placed in the beam forms
on cast days 2 and 3. Instead, cracking was induced by saw cutting the beams at the desired
locations. A single 1 in. deep saw cut was applied to 5 strand G long ends and 5 strand G short
ends, to match the effects of the crack formers placed in the strand A and I beams that were
fabricated on cast day 1. Except for the fact that no crack formers were placed in any of the
strand G beams, the crack inducing techniques were kept consistent between strand groups.
Table 9-2 shows the different crack inducing technique used per beam end. The table lists the
numbered (1-10) beam ends, indicating with the letter “L” the ends which were loaded at a
distance of 80% of the ACI development length (long ends), and with the letter “S” the ends that
were loaded at a distance of 60% of the ACI development length, or short ends. For some of the
sections there was only one, 1 inch deep saw cut implemented on the bottom face of the beam,
but for others there were multiple saw cuts implemented at 2 or 3 locations on the bottom face
and for others also on the sides of the beam. Post-test pictures of sections displaying 3 different
crack induction techniques are shown in Figure 9.8, Figure 9.9, and Figure 9.10.
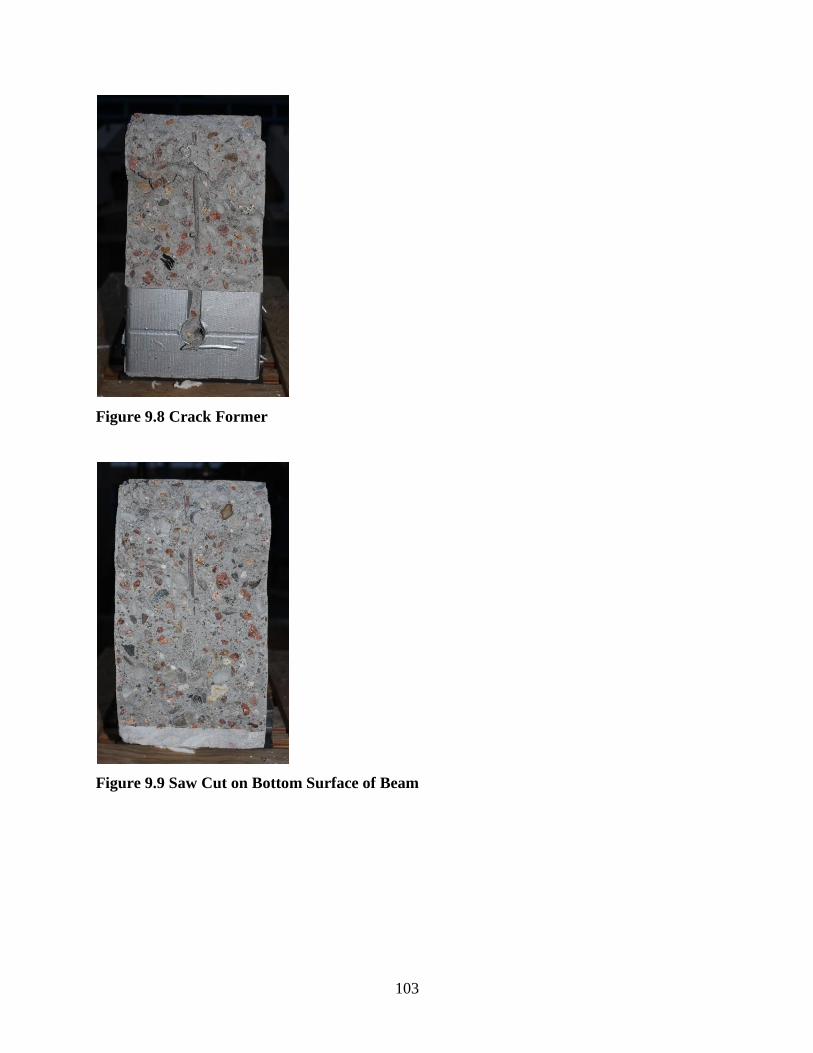
103
Figure 9.8 Crack Former
Figure 9.9 Saw Cut on Bottom Surface of Beam

104
Figure 9.10 Saw Cut on Bottom and Side Surfaces of Beam
Saw cuts in four beams were made under the load application point and at a distance d
from the load towards the beam end on the beam ends tested at 60% of the ACI calculated
development length. For these beam sides tested as short ends, the saw cuts were located at 33 in.
and 43 in. from the ends. Similarly, saw cuts in four beams were made under the load application
point and at a distance d and 2d from the load towards the beam end on the beam ends tested at
80% of the ACI calculated development length. For these beam sides tested as long ends, the saw
cuts were located at distances of 37.5 in., 47.5 in., and 57.5 in. from the beam ends. This was
done with the purpose of investigating the effects of cracking within the development length,
since it is expected that flexural cracking will reduce the average flexural bond stress as the
cracking disturbs the bonding action between the strands and the concrete material (Russell &
Burns, 1993).
No saw cuts in any case made within the ACI transfer length, in order to avoid any bond
slip and anchorage failure due to reduction in strand diameter immediately adjacent to the cracks,
which is caused by the increased tension due to the cracking action. When cracking within the
transfer zone can be avoided, the strands should be expected to develop to their full tension
(Russell & Burns, 1993).

105
Table 9-2 Crack Inducing Techniques per Beam End
Crack Inducing
Technique
Beam End (s): Estimated
Cracking
Moment, Mcr
(kip-in) A-L: A-S: G-L: G-S: I-L: I-S:
4” crack former 1-5 1-4 1-4 1-5 209
4” crack former + (1 or
2) 1.375” saw cuts and
side cuts
5 5 215
One 1” saw cut 6 1-5 1-4, 6 6 250
(2 or 3) 1.375” saw cuts 8-10 8-10 8-10 8-10 8-10 8-10 247
(2 or 3) 1.375” saw cuts
+ 1” side cuts 6 6 5 6 238
NONE 7 7 7 7 7 7 260
The different crack inducing techniques imply different cracking moments (Mcr) per
beam end. These moments were approximated for every case, and considered when comparing
the experimental moment values that caused the first crack to appear on each section. The
cracking moments were calculated assuming a modulus of rupture of 581 psi, which corresponds
to a 6000 psi 28-day compressive strength as the concrete mixture was designed. The split tensile
strengths of accompanying concrete cylinders were also determined experimentally, in order to
compare to the modulus of rupture. The split tensile strengths are listed in Appendix A.
The cracking moment calculated for a standard beam of this study, assuming no crack
inducing technique was determined to be 260 kip-in. For the cases where 4 in. crack formers
were placed in the beams, the cracking moment was estimated at 209 kip-in. Adjustments were
made to the cracking moment calculated for the standard plain concrete beam, in order to
account for the reduced capacity due to the crack former taking up 4 inches of the section height,
and the assumed zero stress on the bottom surface of the beam.
For the beams which were saw cut, the cracking moment was estimated at 250 kip-in. for
the case of 1 in. tall saw cuts and 247 kip-in. where the cuts were 1 3/8” tall. For the case where
there were additional 1 in. saw cuts on the sides of the beams, the cracking moment was
estimated at 238 kip-in. These values were calculated by assuming reduced concrete surface
capacities according to the saw cut dimensions per case. The beam end cracking moments are
listed in Table 9-2.

106
9.2.3.3 Concrete Mixture Placement
The 30 beams were fabricated in groups of 10 on 3 different days, with concrete being
placed at approximately 5 am on placement days 1 and 2, and 9am on placement day 3. Each
cast day’s concrete mixture properties and placement conditions are summarized in Table 9-3.
The concrete compressive strengths and mixture temperatures as they varied with time are
presented in Table 9-4 for the mixture placed on day 1, Table 9-5 for the mixture placed on day
2, and Table 9-6 for the mixture placed on day 3.
Table 9-3 Concrete Placement Conditions and Mixture Properties per Cast Day
Property Day 1 Day 2 Day 3
Air Content (%) 1.6 1.4 1.5
Slump (in) 3.25 3.25 3.5
Unit Weight (lb/ft3) 145.6 145.6 146.0
Concrete Temperature (°F) 74 74 78
Ambient Temperature (°F) 53 57 69
Release Strength (psi) 3860 3680 3880
Compressive Strength at 21
days (psi) 6690 6270 5800
Table 9-4 Day 1 Concrete Mixture Maturity Details (Beams A1-5, I1-5)
Time of Concrete Placement:
5:25am – 6:10am
Cylinder Test
Specimen
Time of Test Compressive Strength
(psi)
Mixture Temperature
(°F)
CS-D1-1 11:35am 552 105
CS-D1-2 1:06 pm 2268 128
CS-D1-3 2:04 pm 2760 136
CS-D1-4 3:00 pm 3133 136
CS-D1-5 3:30 pm 3345 136
CS-D1-6 4:00 pm 3625 136
CS-D1-7 4:47 pm 3864 -
CS-D1-8 6:00 pm 4134 -

107
Table 9-5 Day 2 Concrete Mixture Maturity Details (Beams G1-5, A6-10)
Time of Concrete Placement:
5:11am – 5:39am
Cylinder Test
Specimen
Time of Test Compressive Strength
(psi)
Mixture Temperature
(°F)
CS-D2-1 11:07 am 547 107
CS-D2-2 12:03 pm 1394 125
CS-D2-3 12:30 pm 1927 132
CS-D2-4 1:00 pm 2290 137
CS-D2-5 2:00 pm 2563 136
CS-D2-6 3:10 pm 3129 133
CS-D2-7 3:30 pm 3281 132
CS-D2-8 4:03 pm 3242 131
CS-D2-9 4:55 pm 3543 -
CS-D2-10 5:43 pm 3823 -
Table 9-6 Day 3 Concrete Mixture Maturity Details (Beams G6-10, I6-10)
Time of Concrete Placement:
9:02am – 9:28am
Cylinder Test
Specimen
Time of Test Compressive Strength
(psi)
Mixture Temperature
(°F)
CS-D3-1 3:20 pm 1403 126
CS-D3-2 4:10 pm 2210 135
CS-D3-3 7:16 pm 3351 -
CS-D3-4 8:45 pm 3892 123
CS-D3-5 9:18 pm 3979 120
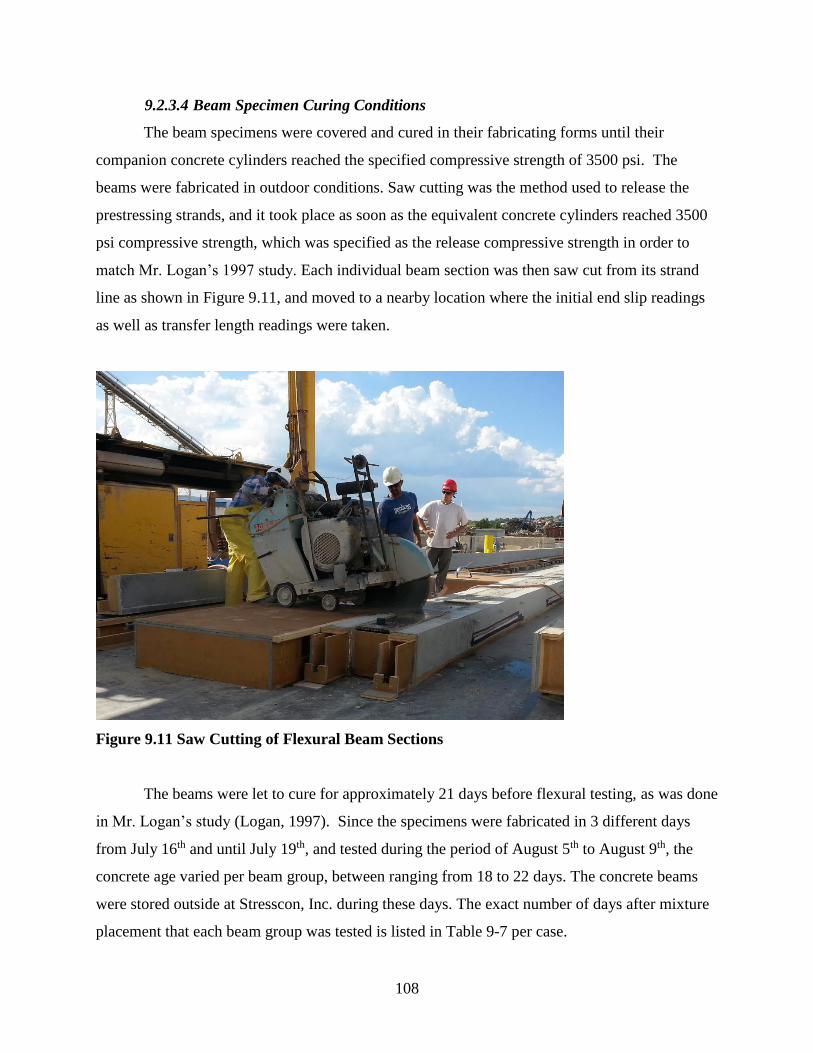
108
9.2.3.4 Beam Specimen Curing Conditions
The beam specimens were covered and cured in their fabricating forms until their
companion concrete cylinders reached the specified compressive strength of 3500 psi. The
beams were fabricated in outdoor conditions. Saw cutting was the method used to release the
prestressing strands, and it took place as soon as the equivalent concrete cylinders reached 3500
psi compressive strength, which was specified as the release compressive strength in order to
match Mr. Logan’s 1997 study. Each individual beam section was then saw cut from its strand
line as shown in Figure 9.11, and moved to a nearby location where the initial end slip readings
as well as transfer length readings were taken.
Figure 9.11 Saw Cutting of Flexural Beam Sections
The beams were let to cure for approximately 21 days before flexural testing, as was done
in Mr. Logan’s study (Logan, 1997). Since the specimens were fabricated in 3 different days
from July 16th and until July 19th, and tested during the period of August 5th to August 9th, the
concrete age varied per beam group, between ranging from 18 to 22 days. The concrete beams
were stored outside at Stresscon, Inc. during these days. The exact number of days after mixture
placement that each beam group was tested is listed in Table 9-7 per case.

109
Table 9-7 Time Between Mixture Placement and Specimen Tested per Beam Group
Specimen Fabrication
Day
Flexural
Test Day
Time
Elapsed
(days)
A 1-2 1 1 20
I 1-2 1 1 20
G 1-2 2 1 18
A 3-4 1 2 22
I 3-4 1 2 22
G 3-4 2 2 19
A 5 1 3 22
A 6 2 3 20
I 5 1 3 22
I 6 3 3 19
G 5 2 3 20
G 6 3 3 19
A 7-8 2 4 21
I 7-8 3 4 20
G 7-8 3 4 20
A 9-10 2 5 22
I 9-10 3 5 21
G 9-10 3 5 21
9.2.4 Transfer Length Measurements
9.2.4.1 Methodology
Transfer lengths were determined immediately after prestress release (initial transfer
lengths) and also before load testing at approximately 21 days after beam fabrication. Transfer
lengths were determined by analysis of end slip readings and surface strain readings. End slip

110
readings were taken after the prestressing force was released and each individual beam section
was saw-cut from its strand line, as well as immediately before flexural testing of each beam.
In addition to end slip readings, a rapid, non-contact laser speckle imaging (LSI) device
was used to measure concrete surface strains and therefore determine the transfer lengths
immediately after strand release (Zhao, 2011).
Attempts were made to read surface strains using the LSI device also at the time of test,
but since the beams were stored outdoors, the concrete surface had weathered and despite the
protective covers that were used to avoid this, the concrete surface of most of the beam ends did
not allow reading strains with the imaging device. Instead, the transfer length values
corresponding to the time of flexural beam testing were determined indirectly by adding the end
slip growth to the initial transfer length values which were determined at the time of prestress
release. The increase in end slip between the time of flexural beam testing and time of prestress
release was multiplied by the appropriate factors recommended for generating transfer lengths
from end slip readings (Logan, 1997). The relationship between transfer length and end slip is
shown in Equation 9-1, where Δ represents the measured strand end slip. It should be noted that
the Modulus of Elasticity of the prestressing strand, Eps, was 28,500 ksi, and the initial stress in
the strand before losses, fsi, was 198 ksi; approximately 98% of the jacking stress which was set
to 75% of the assumed ultimate stress for the strand (270 ksi).
Lt = Δ ( 2 Eps
fsi ) Equation 9-1
9.2.4.1.1 End Slip Readings
Strand end slip readings were taken using a digital depth gauge as shown in Figure 9.12.
The digital length indicator was fixed on 3 supports to ensure stability during measurements. The
device consists of a needle that stretches into the examined depth for a range of 0 to 0.47 inches,
and can be controlled by a lift lever, operated using one hand. The digital display presents depth
measurements of 0.0005 in. resolution.
The end slip readings represent the distance into the section that each strand pulled in,
measured from the flat concrete surface of the beam specimens after they were saw-cut from
their strand line. Strands slip occurs when greater stresses than the bond strength at the steel and
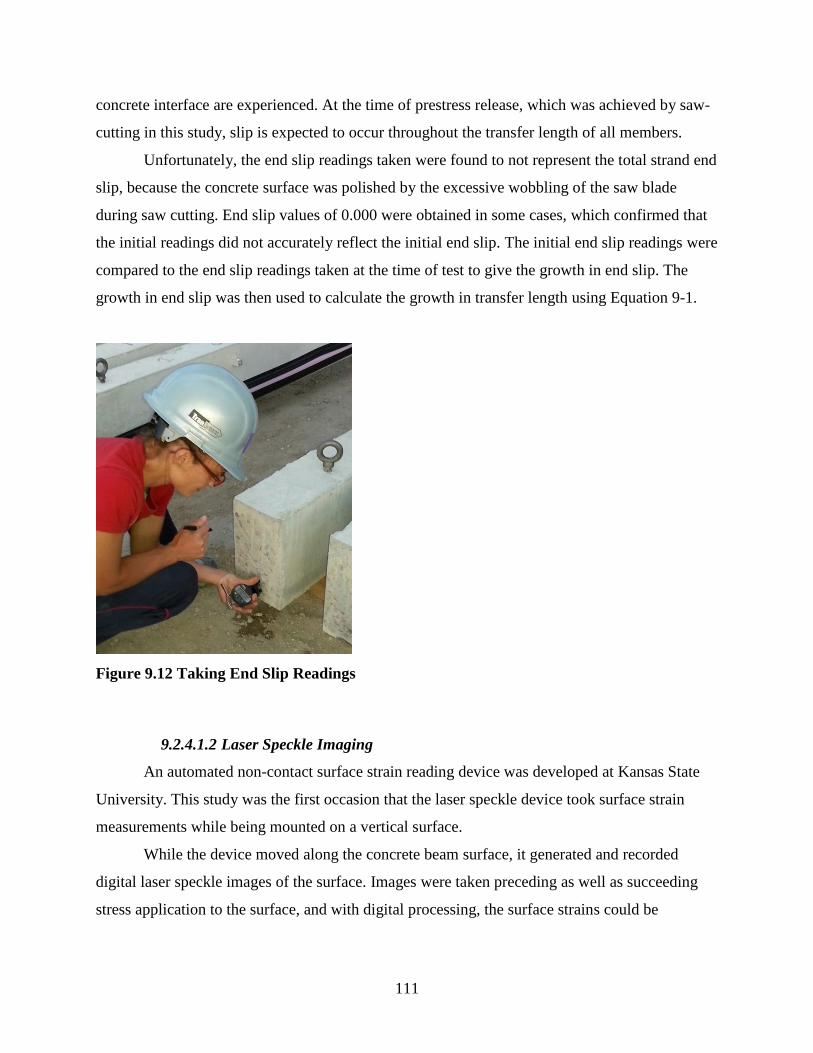
111
concrete interface are experienced. At the time of prestress release, which was achieved by saw-
cutting in this study, slip is expected to occur throughout the transfer length of all members.
Unfortunately, the end slip readings taken were found to not represent the total strand end
slip, because the concrete surface was polished by the excessive wobbling of the saw blade
during saw cutting. End slip values of 0.000 were obtained in some cases, which confirmed that
the initial readings did not accurately reflect the initial end slip. The initial end slip readings were
compared to the end slip readings taken at the time of test to give the growth in end slip. The
growth in end slip was then used to calculate the growth in transfer length using Equation 9-1.
Figure 9.12 Taking End Slip Readings
9.2.4.1.2 Laser Speckle Imaging
An automated non-contact surface strain reading device was developed at Kansas State
University. This study was the first occasion that the laser speckle device took surface strain
measurements while being mounted on a vertical surface.
While the device moved along the concrete beam surface, it generated and recorded
digital laser speckle images of the surface. Images were taken preceding as well as succeeding
stress application to the surface, and with digital processing, the surface strains could be
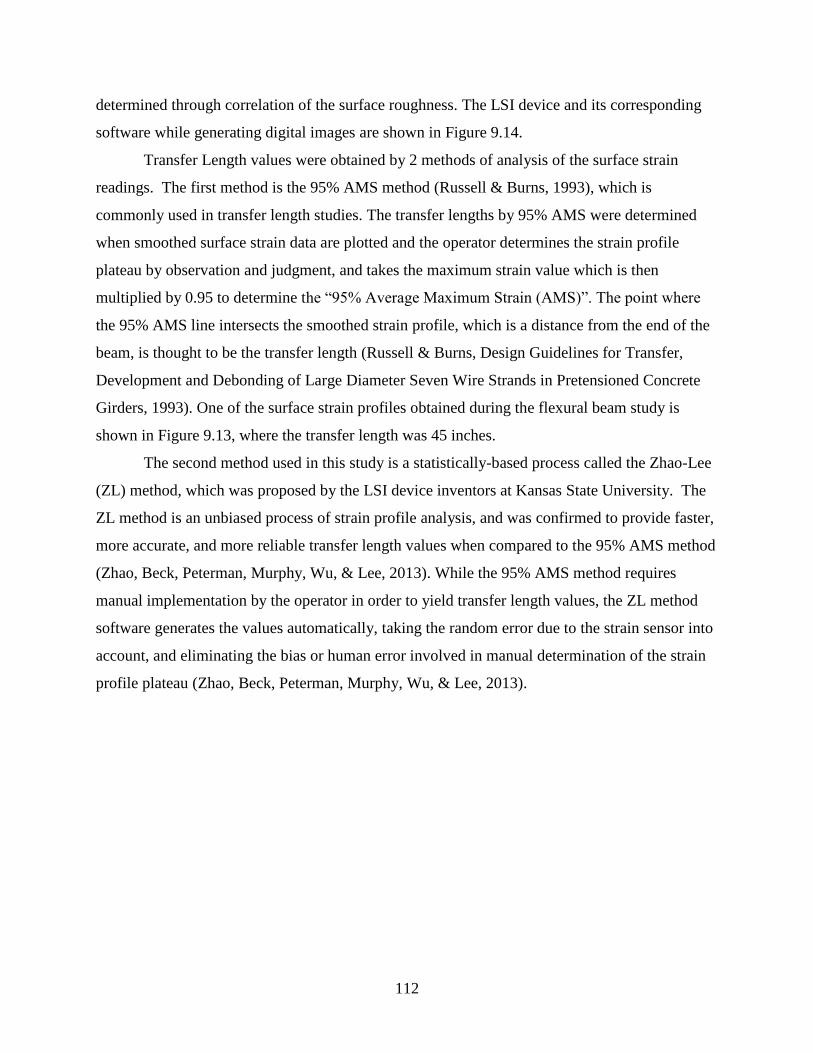
112
determined through correlation of the surface roughness. The LSI device and its corresponding
software while generating digital images are shown in Figure 9.14.
Transfer Length values were obtained by 2 methods of analysis of the surface strain
readings. The first method is the 95% AMS method (Russell & Burns, 1993), which is
commonly used in transfer length studies. The transfer lengths by 95% AMS were determined
when smoothed surface strain data are plotted and the operator determines the strain profile
plateau by observation and judgment, and takes the maximum strain value which is then
multiplied by 0.95 to determine the “95% Average Maximum Strain (AMS)”. The point where
the 95% AMS line intersects the smoothed strain profile, which is a distance from the end of the
beam, is thought to be the transfer length (Russell & Burns, Design Guidelines for Transfer,
Development and Debonding of Large Diameter Seven Wire Strands in Pretensioned Concrete
Girders, 1993). One of the surface strain profiles obtained during the flexural beam study is
shown in Figure 9.13, where the transfer length was 45 inches.
The second method used in this study is a statistically-based process called the Zhao-Lee
(ZL) method, which was proposed by the LSI device inventors at Kansas State University. The
ZL method is an unbiased process of strain profile analysis, and was confirmed to provide faster,
more accurate, and more reliable transfer length values when compared to the 95% AMS method
(Zhao, Beck, Peterman, Murphy, Wu, & Lee, 2013). While the 95% AMS method requires
manual implementation by the operator in order to yield transfer length values, the ZL method
software generates the values automatically, taking the random error due to the strain sensor into
account, and eliminating the bias or human error involved in manual determination of the strain
profile plateau (Zhao, Beck, Peterman, Murphy, Wu, & Lee, 2013).
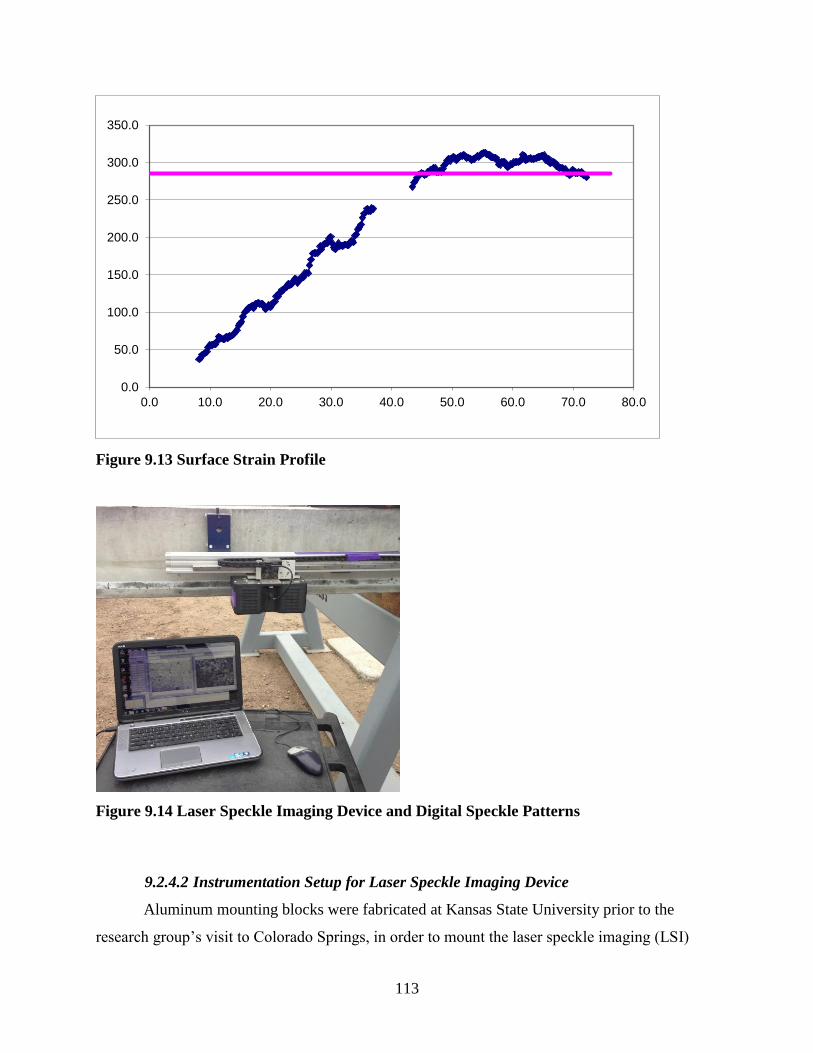
113
Figure 9.13 Surface Strain Profile
Figure 9.14 Laser Speckle Imaging Device and Digital Speckle Patterns
9.2.4.2 Instrumentation Setup for Laser Speckle Imaging Device
Aluminum mounting blocks were fabricated at Kansas State University prior to the
research group’s visit to Colorado Springs, in order to mount the laser speckle imaging (LSI)
0.0
50.0
100.0
150.0
200.0
250.0
300.0
350.0
0.0 10.0 20.0 30.0 40.0 50.0 60.0 70.0 80.0

114
device onto the beams. Bolt inserts were placed on the inside of the concrete beam forms before
concrete placement, and the aluminum blocks were later bolted on the concrete surface once the
wooden forms were removed at the time of prestress release. The aluminum blocks used to
mount the LSI device on the vertical surface of the concrete beams are shown in Figure 9.15.
This method of mounting the LSI device on the vertical surface of the beam sections allowed for
consistent and accurate imaging, assuring that the laser speckle images will be taken at exactly
the same locations before and after de-tensioning.
The black paint on the concrete beam surface seen in Figure 9.15 marks the part of the
surface where laser speckle readings were taken. A textured paint was used in order to create an
artificial speckle pattern for the LSI device to base its initial readings on, and return after de-
tensioning to the same location to take readings on the same speckle pattern, in order to allow for
correlation between the image pairs. The LSI device is sensitive to surface roughness
characteristics, and factors like dust and water that alter the concrete surface can cause the LSI
device to not recognize the strain surface analyzed initially. It is therefore unable to correlate the
subsequent images taken before and after de-tensioning, and generate surface strain values.
Figure 9.15 LSI Device Mounting Instrumentation
9.2.4.3 Transfer Length Measurements at Release
Only the LSI device readings were used to determine transfer lengths at release, since the
end slip readings were considered invalid. It was observed that the excessive wobbling of the

115
saw blade had ruined the concrete surface of the beams; therefore the end slip readings were not
considered for determining the initial transfer lengths.
Analysis of the surface strain measurements obtained by the LSI device returned the
average initial transfer length values shown in Table 9-8, including both the transfer lengths
obtained manually by the 95% AMS method, and the values obtained by the ZL software method
of surface strain measurement analysis. The transfer length values for each individual beam end
at the time of release are listed in Appendix B.
Table 9-8 Average Transfer Length Values at Release for Strands A, G, and I by 95% AMS
and ZL Method Analysis
Strand Source Average Transfer Length at Release (in)
95% AMS method ZL method
A 34.6 35.8
G 27.4 28.1
I 39.6 42.2
9.2.4.4 Transfer Length Measurements at Test
At the time of test, the LSI device was not able to take surface strain readings on all beam
ends. Protective plastic covers were placed on the sides of the beams to prevent mud from
splashing onto the areas where readings were being taken. Between the time of the initial
surface strain readings after strand release and before testing, it was observed that the paint used
to enhance the image definition delaminated. The plastic covers placed on the concrete side
surfaces sealed in the moisture. Moisture from the beam interiors caused the paint to delaminate,
changing the concrete surface. This made it difficult to obtain surface strain readings before load
tests.
End slip readings were taken before flexural beam testing. The difference between these
end slip readings and the initial end slip readings taken at the time of prestress release gave the
growth in end slip. The transfer length growth calculated from the end slip growth values using
Equation 9-1 were added to the transfer lengths at the time of release to give the beam transfer
lengths at the time of load testing. The average transfer length values at the time of flexural
beam testing are shown in Table 9-9. The transfer length values shown in Table 9-9 were
generated by adding the transfer length growth calculated through the end slip growth values to

116
the values determined by the ZL method for the transfer lengths at the time of prestress release.
The transfer length values for each individual beam end at the time of release are listed in
Appendix C, and the individual end slip values per beam end are provided in Appendix D.
Table 9-9 Average Transfer Length Values at Time of Flexural Beam Testing for Strands
A, G, and I by ZL Method Analysis
Strand Source Average Transfer Length at Time of Test (in)
(ZL method)
A 48.5
G 37.7
I 54.7
9.2.5 Flexural Beam Testing
9.2.5.1 Instrumentation Setup and Testing Procedures
A special testing frame was prepared by Stresscon, Inc. for this study. The frame was
fabricated by bolting a steel beam onto two 7ft by 7ft concrete blocks, which served as gravity
loads for the reaction load. The specimens were loaded using a hydraulic cylinder which was
brought to Stresscon, Inc. by the project investigators from KSU. The load and stroke outputs of
KSU’s hydraulic cylinder which is implemented with a pressure transducer, load cell and cable
potentiometer, were captured by a Keithley Model 2700 data acquisition system. Linear Variable
Differential Transformers (LVDTs) were also brought to the testing site from KSU in order to
measure beam deflection and strand end slip during the tests. The beam loading setup is shown
in Figure 9.16, Figure 9.17, and Figure 9.18.
Steel plates were placed on the top surface of each beam section using the gypsum
product “Hydrostone” in order to provide a consistent loading point, and distribute the load along
the width of the beams. Steel plates were also placed on the bottom surface of each beam where
pin and roller support configurations were placed for each beam. The plates are shown in Figure
9.16 - Figure 9.19. Figure 9.19 illustrates the roller support configuration system. Using pin and
roller supports allowed for accurate measurements of the beam deflection at the loading point
and ensured that the beam was statically determinate for analysis.

117
Figure 9.16 Beam Testing Setup: Loading Setup

118
Figure 9.17 Beam Testing Setup: Load Cell, Load Point LVDTs, End Slip LVDT

119
Figure 9.18 Beam Testing Setup: Load Application Point on Steel Plate, LVDTs
Figure 9.19 Beam Testing Setup: Roller Support Configuration
9.2.5.2 Beam Loading Procedures
The loading rate was set to 1000 lb/ minute, up to the 7000 lb limit. After that, loading
proceeded at 250 lb/ minute until beam failure. It should also be noted that as directed by the
advisory committee, during the first 2 days of testing the load was held once strand end slip
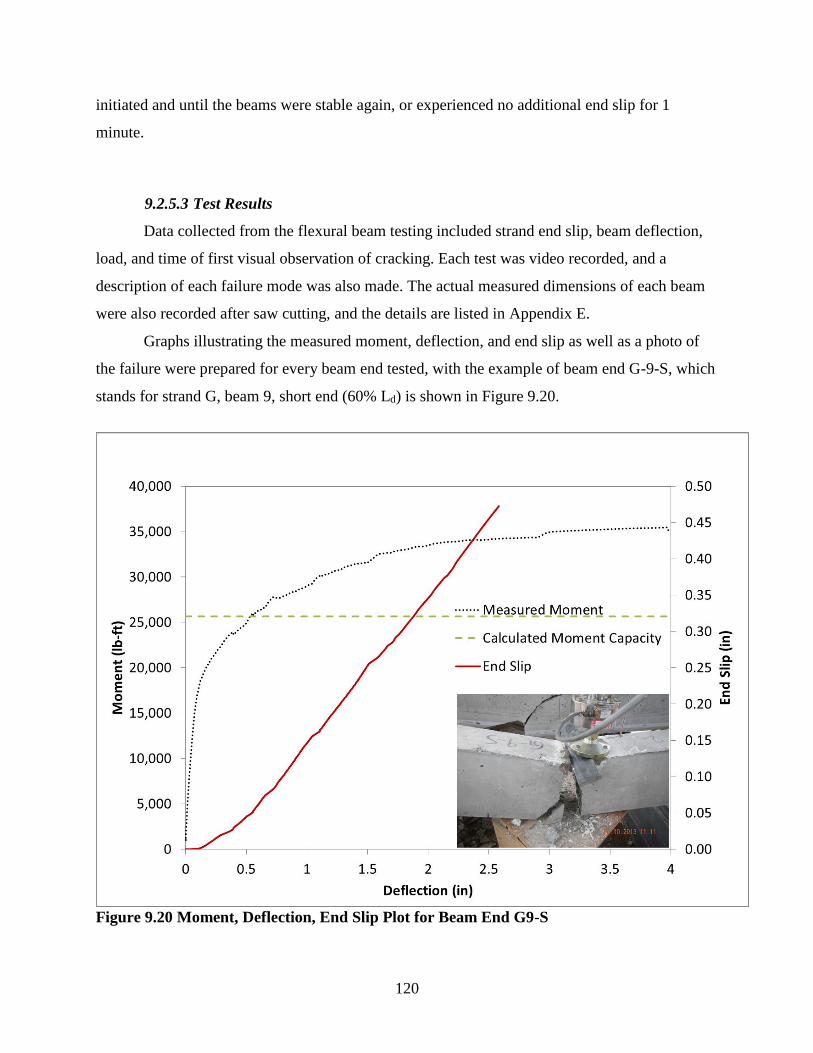
120
initiated and until the beams were stable again, or experienced no additional end slip for 1
minute.
9.2.5.3 Test Results
Data collected from the flexural beam testing included strand end slip, beam deflection,
load, and time of first visual observation of cracking. Each test was video recorded, and a
description of each failure mode was also made. The actual measured dimensions of each beam
were also recorded after saw cutting, and the details are listed in Appendix E.
Graphs illustrating the measured moment, deflection, and end slip as well as a photo of
the failure were prepared for every beam end tested, with the example of beam end G-9-S, which
stands for strand G, beam 9, short end (60% Ld) is shown in Figure 9.20.
Figure 9.20 Moment, Deflection, End Slip Plot for Beam End G9-S

121
A summary of the results from the Flexural Beam Testing study is presented in Table
9-10, where the average transfer length at the time of test, the average ratio of experimental
moment to nominal moment capacity and average end slip are listed by beam end group. The
beam ends are grouped by strand source and length tested.
It should be noted that the nominal moment capacity of the beams tested at a distance of
80% of the ACI code development length was calculated to be 348 kip-in., and the nominal
moment capacity of the beams tested at a distance of 60% of the ACI code development length
was determined to be 308.3 kip-in., therefore each individual experimental moment value was
compared to the nominal capacity of its particular end group. The nominal moment capacities
were calculated as shown in Appendix F.
From the results we can see that the beam ends on which more saw cuts were applied
reached lower experimental to nominal moment ratios compared to the beam ends where fewer
saw cuts were made or no saw cutting was performed at all. In all 3 strand source cases, the
lowest moment ratios were experienced by the longer beams ends. Within each long end
category, the beam ends that reached the lowest ratios were those on which more saw cutting
was applied. The lowest ratio overall was obtained by specimen I-5-L, which was the only beam
in the study with 2 saw cuts applied in addition to its crack former.
Beam ends 8-10, both long and short for all 3 strand sources tested, we saw cut at 1.375
in., but where the short ends had 2 cuts; the long ends had 3 cuts applied to them. The additional
saw cuts affected these ends by disrupting the bond between steel and concrete, and therefore
causing early bond failures. This explains the fact that the short ends resulted in higher ratios
than the long ends, as less saw cutting action on the short ends allowed them to outperform their
calculated nominal capacity by higher percentage. The average experimental to nominal moment
ratios per beam end group are shown in the third column of Table 9-10.
The failure mode experienced by every beam end that was tested was described as either
Shear-Compression, or Strand Rupture. A summary of the failure modes is shown in Table 9-11,
also organized by beam end group. A summary of the flexural beam testing results per beam end
tested is provided in Appendix G. The moment, deflection and end slip charts as well as
photographs of the beam ends after failure are provided in Appendix H.

122
Table 9-10 Average Transfer Length, Experimental to Nominal Moment Ratio, and End
Slip During Test Values per Beam End Group
Beam End
Group
Lt (in.) Mexp/Mn End Slip
during Test
(in.)
A-S 50.4 1.29 0.183
A-L 46.6 1.15 0.046
G-S 36.9 1.32 0.220
G-L 38.4 1.21 0.033
I-S 53.5 1.21 0.668
I-L 56.0 1.09 0.227
Table 9-11 Beam End Group Failure Mode Summary
Beam End
Group
Number of Shear
Compression Failures
Number of Strand
Rupture Failures
A-S 5 5
A-L 9 1
G-S 7 3
G-L 4 6
I-S 5 5
I-L 6 4
Initial observations from the flexural beam testing rounds included the early cracking
loads experienced by the beams, a fact that explains the long transfer lengths noted. It was also
noticed that the beam ends that were characterized by “poor bond” did not experience typical
flexural behavior during the tests, and developed only 1 crack at a single location before failure,
where the beam ends associated with better quality bond were able to develop multiple cracks
before failure. Slip is believed to occur at a location where higher stress is applied compared to
the bond strength of the strand to the concrete at that location. Consequently, for lower bonding
strands there was a longer range of locations where low bond strength was experienced, and slip
had occurred before any cracking was able to form.

123
Another key observation from this study was that when the cracking strength of the
beams was reduced by additional saw cuts, the beam ends were reaching lower moment
capacities compared to their equivalent ends of less or no saw cutting applied to. There were 4
strand I failures and 1 strand A failure which occurred below nominal capacity, all in the case of
beam ends tested at 80% of the ACI Ld, and all in the groups of beam ends with the highest
number of saw cuts applied to.
In general, strand I specimens reached the lowest experimental to nominal moment ratios
compared to their equivalent groups of strand A and strand G beam ends, and also experienced
the highest values of end slips during testing. Strand G outperformed strand A as far as moment
capacity ratios are concerned; which was expected after strand G tested as a higher bonding
source in the ASTM A1081 testing rounds.
The transfer length values obtained per strand source follow the trend that the ILS study
results revealed, with strand G experiencing the shortest transfer length values out of the 3,
strand I experiencing the longest transfer length values out of the three and strand A specimens
having transfer length values between those of I and G, similarly to being the middle performer
when tested by ASTM A1081.

124
Chapter 10 - Determination of ASTM A1081 Threshold Value
10.1 Statistical Analysis of Data
The results from the Inter-Laboratory study (ILS) were analyzed in order to determine a
fair pullout force value for each strand source A, G and I. The data included results from 6
laboratories other than KSU, plus the 5 sets of results from KSU labs where 5 different cement
sources were used in the testing. Statistical analysis of the ASTM A1081 values obtained for
each strand concluded with the numbers listed in
Table 5-7, where Method A represents the standard ASTM A1081 test method.
The average pullout force values from the Inter-Laboratory study are considered
unbiased, since they were obtained at different testing sites while using dissimilar material and
where testing was conducted under diverse conditions.
It was concluded that a simple statistical analysis of the average beam performance
values will be the most applicable in order to determine an acceptable threshold value for ASTM
A 1081 based on the flexural beam performance at Stresscon. Analysis was conducted
considering the multiple sets of results obtained during the flexural beam testing study. The
transfer length values at time of prestress release, transfer length values at the time of test, and
moment performance ratios where some of the data sets the threshold statistics were based on.
Analysis was conducted for every case by plotting the average values per strand against
the ILS study results, and also considering the 90% confidence interval with 5% fractal applied
as well as the 90% interval with a 10% fractal applied.
10.2 Transfer Length Measurements
The transfer length values obtained during the flexural beam study at Stresscon were
considered rather high in comparison with other recent studies, but the early cracking moments
experienced by the beams during flexural testing confirmed the long transfer lengths. The
concrete compressive strengths at release were selected to be as close as possible to 3500 psi
because this is a lower-bound release strength expected for prestressed concrete plants.
Attempts were made in order to determine the ASTM test threshold value based on the
transfer length values determined during the Stresscon study, but the analysis revealed that in

125
order to meet ACI code requirements for transfer length, the strands should have unreasonably
high pullout force values when tested by ASTM A 1081. The threshold values resulting from the
statistical analysis of the transfer lengths at release and also at the time of test are summarized in
Table 10-1.
As agreed with the advisory committee, a 90% confidence interval on 10% fractal as well
as a 90% confidence interval on 5% fractal was applied to the numbers, which brought the
threshold values even higher. After review of the potential threshold values, the committee
decided to consider other criteria for the basis of the ASTM A1081 threshold value.
Determining the 90% confidence values for ASTM A1081 was performed following the
Experimental Statistics portion of the National Bureau of Standards Handbook. The document
lists the factors corresponding to one-sided tolerance limits per sample size per case of
confidence interval targeted and the related fractal values (Natrella, 1963).
For example in our case, for a 90% confidence that 90% of our values will be above the
average value obtained during the ILS, or a 90% confidence that no more than 10% will be lower
than the average ILS average value (10% fractal), the standard deviation of the ILS population
was multiplied by a K factor of 2.012 as recommended by Mary Gibbons Natrella in the National
Bureau of Standards Handbook, and then added to the average value obtained by the ILS
population. Similarly, the 5% fractal values were determined, applying instead the recommended
K factor of 2.503 for a sample size of 11 (Natrella, 1963). The values calculated following
Natrella’s recommendations were incorporated in the threshold determination analysis, obtaining
potential acceptance criteria that will ensure adequate bond strength with high confidence.
Table 10-1 ASTM A1081 Pullout Force Values Corresponding to ACI 318 Transfer Length
Values at Release and at Time of Test
Time of Transfer
Length Measurement
Pullout force that corresponds to the ACI 318 calculated transfer
length for the ASTM A1081 Inter-Laboratory study
Average Pullout
Force (lb)
90% Confidence
Interval on 10%
Fractal (lb)
90% Confidence
Interval on 5%
Fractal (lb)
Strand Release 15,400 20,200 21,400
Time of Flexural
Testing 21,700 29,500 31,500

126
10.3 Beam Specimen Experimental Moment
The experimental moment values were determined for all tests, and compared to the
section’s nominal moment capacity, resulting in ratios above or below unity, showing if the
beams met or not their expected performance to be considered reliable for use in pretensioned
applications. An ultimate strength of 270 ksi was assumed initially for all 3 strand sources, as
they are all rated as 270 ksi minimum ultimate strength samples, but in reality, the strands are
produced to reach higher ultimate strengths than their rated values, therefore the exact ultimate
strengths per strand source A, G and I were determined experimentally at KSU laboratories, in
order to determine the actual strength each strand source was able to reach before rupture.
10.3.1 Ultimate Tensile Strength of Strand
The ultimate tensile strength of each strand source was measured at Kansas State
University after completion of the Flexural Beam Study. The specimens were secured by strand
chucks, and epoxy-filled steel tubes were placed at both ends of each specimen in order to
distribute the force evenly and avoid strand rupture at the chucks. Strand samples were loaded to
failure on a tensile testing frame, and the ultimate force values were recorded. An example
showing one of the test specimens after rupture is illustrated in Figure 10.1.
Figure 10.1 Ultimate Tensile Strength of Strand Test Specimen after Failure

127
The ultimate strength of each strand source was determined as the average of 5 strand
tensile strength tests, and the values are summarized in Table 10-2. These values were used to
calculate the experimental moment calculations for the flexural beams which had failed by strand
rupture at Stresscon, Inc. The ratios of beam experimental moment capacity-to-calculated
moment capacity using the strand measured ultimate strength are listed in Table 10-3.
Table 10-2 Ultimate Tensile Strength (ksi) per Strand Source
Strand Source Fult (ksi)
A 281
G 281
I 280
Table 10-3 Average Moment Ratios per Beam End Group Calculated Using Strand
Ultimate Strength
Beam End
Group
Mexp/Mn
A-S 1.25
A-L 1.15
G-S 1.29
G-L 1.17
I-S 1.20
I-L 1.07
10.4 Threshold Value Determination
After discussion with the committee, it was decided that the most reasonable basis for
proposing a threshold value for ASTM A1081 test would be the experimental performance of the
flexural beams in terms of the moment capacity reached compared to their nominal moment
capacity. The average moment performance ratios per strand source were plotted and compared
to the ILS pullout force average values, 90% confidence, 10% fractal values, as well as the 90%
confidence, 5% fractal values calculated.
Initially, a linear fit of the data was considered to extrapolate and find the ASTM A1081
value for a strand that would have the calculated capacity match that of the experimental
capacity. Figure 10.2 is a graphical explanation of the linear analysis assumption. A linear fit of
the data however was problematic however because it assumes that the moment capacity can
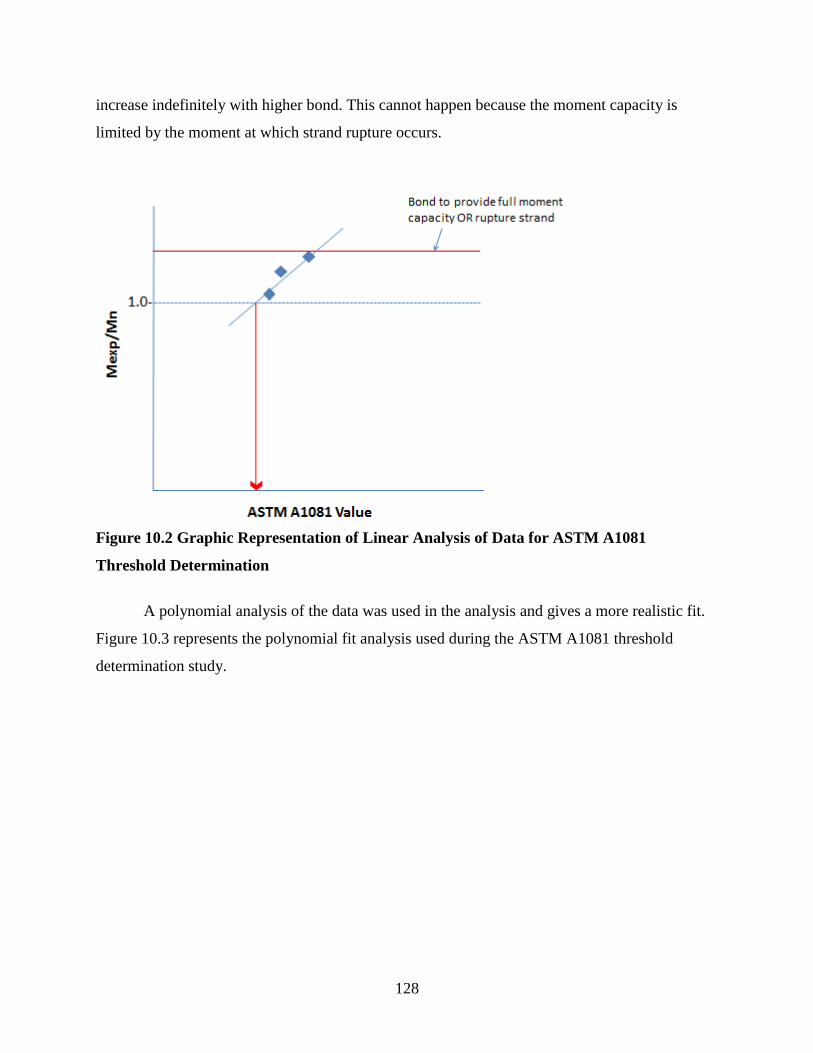
128
increase indefinitely with higher bond. This cannot happen because the moment capacity is
limited by the moment at which strand rupture occurs.
Figure 10.2 Graphic Representation of Linear Analysis of Data for ASTM A1081
Threshold Determination
A polynomial analysis of the data was used in the analysis and gives a more realistic fit.
Figure 10.3 represents the polynomial fit analysis used during the ASTM A1081 threshold
determination study.

129
Figure 10.3 Graphic Representation of Polynomial Analysis of Data for ASTM A1081
Threshold Determination
Since prestressing a concrete beam with a single strand is a very rare occasion, it was
decided to numerically investigate the consequences of using multiple strands in a beam on the
strand moment capacity. For this analysis, it was assumed that the moment capacity of a beam
prestressed with 2 strands instead of 1 will be the average of the moment capacity of 2 separate
beams prestressed with 1 strand each. This method assumed no interactions between the strands.
The committee had advised the project investigators that a combination of 6 strands
would be the minimum number of strands in a beam and was selected for use in the threshold
determination. All combinations of strands up to 20 strands in a single beam were investigated
however. Considering combinations of multiple strands, therefore averaging their performance,
implied lower standard deviations, which resulted in decreasing threshold values with increasing
number of strands combined. The procedure followed is explained in Table 10-4. The strand
averaging effects to the standard deviations considered in this study are presented in Figure 10.4.

130
Table 10-4 Strand Averaging Procedure Example
Combination Combined
Value 1
Combined
Value 2
Strand
Average
1 & 2 1.300 1.310 1.305
1 & 3 1.300 1.380 1.340
1 & 4 1.300 1.351 1.326
2 & 3 1.310 1.380 1.345
2 & 4 1.310 1.351 1.331
3 & 4 1.380 1.351 1.366
Average 1.335
Standard Deviation 0.020
Figure 10.4 Strand Averaging Effects to Moment Ratio Standard Deviation Values
In order to complete the calculations in a timely manner, a macro was written in Visual
Basic for Applications (VBA) in excel, which yielded an over 180,000 values when considering
all possible combinations of 10 out of 20 strands. The combinations were made with all twenty
strands, but were later reproduced after separating the ends among short and long, since the
0
0.02
0.04
0.06
0.08
0.1
0.12
0.14
0.16
0 5 10 15 20 25
Stan
dar
d D
evi
atio
n
# Strands Averaged
Strand I
Strand A
Strand G

131
moment ratios per case are based on different assumptions. Figure 10.5 is a plot of the threshold
value variation as the number of strands in a single beam section increases, using the numbers
generated during the first round of analysis where the ratios of all 20 beam ends tested per strand
source were considered.
Figure 10.5 Threshold Value vs Number of Strands Combined- Polynomial Analysis
The analysis was repeated, with the ratios now considered separately for the short and
long beam ends. Threshold values were calculated considering 6 strands per beam, the average
pullout force values from all the valid sets of data obtained during the Inter-Laboratory study, as
well as the 90% confidence intervals with 5% and 10% fractals applied.
The recommended threshold values are presented in Table 10-5, which lists the
recommended threshold values by method of analysis, for the case of prestressing a beam section
with only 1 strand just as it was incorporated in the Stresscon beam study, but also for the case of
6 strands prestressing a single beam section without any interaction between them.
0
5000
10000
15000
20000
25000
0 5 10 15 20 25
Thre
sho
ld (
lb)
Number of Strands
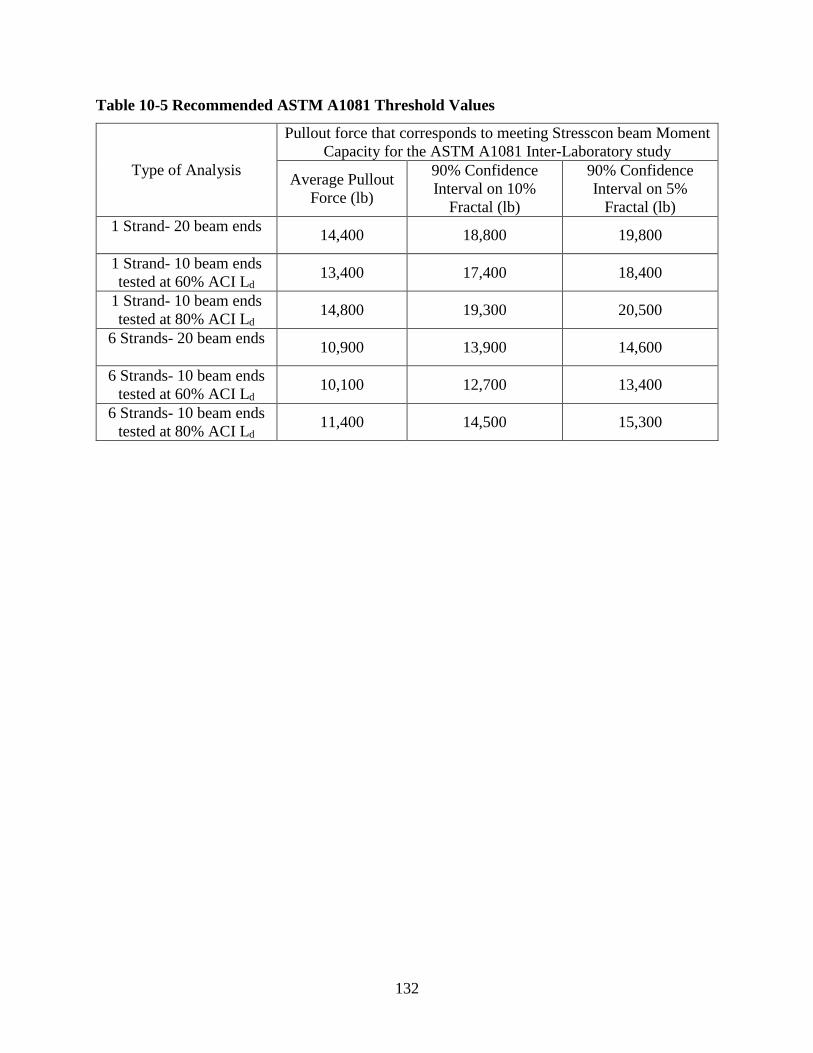
132
Table 10-5 Recommended ASTM A1081 Threshold Values
Type of Analysis
Pullout force that corresponds to meeting Stresscon beam Moment
Capacity for the ASTM A1081 Inter-Laboratory study
Average Pullout
Force (lb)
90% Confidence
Interval on 10%
Fractal (lb)
90% Confidence
Interval on 5%
Fractal (lb)
1 Strand- 20 beam ends
14,400 18,800 19,800
1 Strand- 10 beam ends
tested at 60% ACI Ld 13,400 17,400 18,400
1 Strand- 10 beam ends
tested at 80% ACI Ld 14,800 19,300 20,500
6 Strands- 20 beam ends
10,900 13,900 14,600
6 Strands- 10 beam ends
tested at 60% ACI Ld 10,100 12,700 13,400
6 Strands- 10 beam ends
tested at 80% ACI Ld 11,400 14,500 15,300

133
Chapter 11 - Simple Quality Assurance Test for Strand Bond
11.1 Introduction
In addition to the flexural beams tested at Stresscon, Inc., 3 additional beams for each
strand of smaller cross section were fabricated on cast day 3, and were shipped to be tested by RJ
Peterman and Associates, under the Simple Quality Assurance Test for Strand Bond proposed by
Robert J. Peterman (Peterman, 2009). The test method provides a simple procedure for
verification of bond for the concrete mixture, strand being used, placement conditions, and de-
tensioning conditions used at a particular prestressed concrete plant (Peterman, 2009).
The dimensions of the standard beam tested under the Simple Quality Assurance Test for
Strand Bond are shown in Figure 11.1 and the test loading configuration in Figure 11.2.
Figure 11.1 Simple Quality Assurance Test for Strand Bond Specimen Dimensions
Figure 11.2 Simple Quality Assurance Test for Strand Bond Loading Configuration

134
11.2 Beam Specimen Design and Fabrication
The Peterman test beams were cast at Stresscon, Inc., with the same concrete mixture as
the flexural beam test specimens. Three beams for each strand source A, G and I were fabricated.
The quality assurance beams were dimensioned at the standard 8 in. by 6in. by 11 ft. 6 in. long,
prestressed with a single strand in the beam center at 4.5 in. below the beam top surface. No
shear reinforcement was provided for the specimens, as specified by the test protocol.
The beams were all fabricated in a single line, with splice chucks used in order to connect
the 3 different strand sources. The 9 beam sections were saw cut to their specified length as soon
as the companion concrete cylinder reached a compressive strength of 4040 psi, following the
same de-tensioning procedures as the flexural beam specimens at Stresscon, Inc.
11.3 Test Methodology
The Simple Quality Assurance Test for Strand Bond was employed by setting each beam
on simple supports and gradually loading each beam section to 85% of its calculated nominal
moment capacity, (Peterman, 2009). The loading setup for the quality assurance test is shown in
Figure 11.2 and Figure 11.3, and test specimen A1 is shown in Figure 11.4, as an example of the
full test setup configuration.

135
Figure 11.3 Simple Quality Assurance Test for Strand Bond Loading Setup
Figure 11.4 Beam A1 Setup for Simple Quality Assurance Test for Strand Bond

136
The specimens were then inspected for cracks and strand end slip, documenting the
details. While the load was sustained for 24 hours, the beams were examined for additional signs
of distress, like increased end slip, concrete cracking or crushing. Beam specimen A1 is
represented in Figure 11.5, while sustaining 85% of its nominal moment capacity.
Figure 11.5 Beam A1 Loaded at 85% of its Nominal Moment Capacity during the Simple
Quality Assurance Test for Strand Bond
After sustaining 85% of their nominal moment capacity for 24 hours, the beams were
loaded to their full nominal capacity, and allowed to hold that load for 10 minutes, unless they
failed previously. The beam specimens that were able to sustain their nominal moment capacity
for 10 minutes passed the test, and were later loaded to failure. Figure 11.6 shows beam A1
while loaded at its full nominal moment capacity.

137
Figure 11.6 Beam A1 Loaded at 100% of its Nominal Moment Capacity during the Simple
Quality Assurance Test for Strand Bond
The Simple Quality Assurance Test for Strand Bond results are simply determined as fail
or pass, based on whether the beam collapses or not during the test. In other words, a beam
passes the test if it can successfully hold its nominal moment capacity for 10 minutes, after being
loaded for 24 hours at 85% of its nominal moment capacity. The nine beams tested in this project
were loaded until failure after they held their nominal moment capacity for 10 minutes.
11.4 Test Results
The Simple Quality Assurance Test for Strand Bond specimens were load tested by RJ
Peterman and Associates. The applied load, mid-span deflection and strand end slip during
loading were plotted for each beam, and an example of the test results for the case of beam A1 is
illustrated in Figure 11.7. The corresponding figures for all 9 beams tested are provided in
Appendix I.

138
Figure 11.7 Beam A1 Simple Quality Assurance Test for Strand Bond Results
While 3 beam sections were tested per strand source during the Peterman Test Program,
all of the specimens which were prestressed with strands A and G passed the test and held 100%
of the calculated nominal load, but all 3 strand I specimens failed before reaching the calculated
nominal load.
Table 11-1 presents a summary of the Quality Assurance Test Program, displaying the
mid span deflection per beam after each load sustaining period, as well as the maximum load
sustained by each section. Figure 11.8 also illustrates the performance of the beams, in a plot of
their mid span deflection versus the load applied to them. It should be noted that the mid span
deflection for the beams prestressed with strand I kept growing significantly while the beams
were sustaining 85% of their nominal capacity, and while the 3 strand A and 3 strand G
experienced similar deflections, the 3 strand I specimens averaged almost quadruple deflection
compared to the average of the other two strand sources.

139
Table 11-1 Simple Quality Assurance Test for Strand Bond Results Summarized
Test Beam Deflection (in) After
24 Hours at 85% Mn
Deflection (in) After 10
Minutes at 100% Mn
Maximum Load
(lb)
A-1 0.85 1.45 5740
A-2 0.70 1.16 5978
A-3 0.74 1.17 6106
G-1 0.68 1.08 6143
G-2 0.82 1.30 5802
G-3 0.79 1.31 5778
I-1 3.73 Failed Prior 4659
I-2 2.38 Failed Prior 4774
I-3 2.92 Failed Prior 4607
Figure 11.8 Mid span Deflection (in) vs Applied Load (lb) for all Specimens Tested by the
Simple Quality Assurance Test for Strand Bond
0
1000
2000
3000
4000
5000
6000
7000
0 1 2 3 4 5
Ap
pli
ed L
oa
d (
lb)
Midspan Deflection (in)
Beam A-1
Beam A-2
Beam A-3
Beam I-1
Beam I-2
Beam I-3
Beam G-1
Beam G-2
Beam G-3
ACI Nominal Capacity

140
11.5 Simple Quality Assurance Test for Strand Bond Conclusions
All strand A and strand G samples passed the Simple Quality Assurance Test for Strand
Bond, but none of the three strand I specimens passed the test. The consistent outcome of these
tests indicates that, for the concrete mixture and release strength used, both strands A and G met
the ACI design assumptions for bond while strand I did not. If the strand acceptance value is
established based on the concrete mixture and release strength used to fabricate these beams, the
Simple Quality Assurance Test for Strand Bond results would indicate that the threshold value
should be set such that strand I is excluded but strands A and G are allowed.

141
Chapter 12 - Conclusions
12.1 Summary of Work Done and Conclusions
During the progression of this research project, many aspects of the strand bond subject
were considered. Research initiated with an extensive literature review of the previous studies
conducted since the invention of prestressed concrete.
The first experimental step was the pullout testing of 0.5 inch diameter prestressing
strand samples from 8 plants of the leading strand manufacturers of North America. Testing was
conducted following the now standard pullout test procedure of ASTM A1081. The initial strand
testing round included 7 market condition samples and a non-market condition strand which was
supplied by one of the manufacturers in order to provide a low bonding sample to meet the
specific requirements of the project proposal.
After the initial round of testing was concluded, three strand samples were selected to
participate in the further experimental studies of the project, including the non-market condition
sample labeled as strand I, which represented the lowest bonding strand of the three. Strand
labeled as strand G was selected to represent the highest bonding sample and strand A was
selected as the sample of intermediate bonding performance.
Once the three strand sources were selected, large coils of at least 3000 ft were ordered
from the corresponding manufacturers and were verified once they arrived at KSU labs. Testing
proceeded as the results were in agreement with the values obtained for the three samples during
the initial round of strand testing.
The materials used to prepare the mortar mixture were investigated next. After concerns
that different sand gradation, hardness and angularity could be affecting the mixture
characteristics, a specific source was selected, and the sand was graded at specified gradations to
ensure consistency during the following testing rounds.
Another concern was the fact that even though only Type III cements can be used for this
test, it was suspected that the cement chemical composition could have effects on the mixture;
therefore a specific cement source was obtained for the following testing rounds. In the
meantime, Type III cement samples were obtained from 5 manufacturers, and were used to make
mortar mixtures and test the 3 preselected strands at KSU labs. Significant variability was

142
observed on the pullout test results of the same strand source tested in mixtures created using
different Type III cement sources.
The subsequent task involved investigation of the ASTM A1081 method for ruggedness.
The Ruggedness Testing study was incorporated at Kansas State University, and involved
varying certain test parameters which were suspected to have an influence on the test results. The
mortar mixture flow, compressive strength of the samples at the time of testing, and the test
loading rate were investigated in order to determine their effects numerically. Only the mortar
mixture flow factor was determined significant after statistical analysis of the study results.
An Inter-Laboratory study (ILS) followed, in order to determine the reproducibility of the
ASTM A1081 test method. The actual test as specified in ASTM A1081 (Method A) plus an
alternative version of the test (Method B) were investigated during this study. The different
aspects incorporated into Method B were based on the Ruggedness Testing study findings and
also the application of fixed water to cement ratio in order to accommodate Type III cements of
different fineness without implying significant discrepancy of the test results. The results
obtained from 6 participating laboratories in addition to 5 sets of data from testing conducted at
KSU using different cement sources and mortar mixture characteristics were analyzed to
conclude to a coefficient of variation of 14% for ASTM A1081, which can be reduced to 11% if
the test is modified by Method B specifications.
While test rounds for investigation of ASTM A1081 were taking place at KSU and the
ILS participating laboratories, Wiss, Janney, Elstner Associates, Inc. (WJE) tested the three
strands’ surface characteristics under a quality control program defined in NCHRP Report 621. It
was observed that for the Contact Angle Measurement test, the results for the 3 strand sources A,
G and I followed the exact opposite trend compared to the results from the strands tested during
the NCHRP study. Instead of having the highest bonding source experience the lowest contact
angle, in this study, the lowest bonding source had by far the lowest contact angles determined.
These tasks concluded the first phase of the project and let to the precision and bias
statement of the ASTM A1081 test method, and the final pullout test values for the three strand
samples that were subsequently tested in beam sections during phases II and III.
The precision of the test method was determined as follows; the single operator
coefficient of variation was 9 %, and multi laboratory coefficient of variation was 14.5 %.
143
The second phase of the project initiated with the design and fabrication of 30 rectangular
beam sections, which later underwent flexural testing at Stresscon, Inc. in Colorado Springs, CO.
The beam study was aiming to compare results to a similar study that was also conducted at
Stresscon by Donald R. Logan; therefore the beam sections were fabricated to match Mr.
Logan’s samples, and the concrete mixture used was also designed to reach similar compressive
strengths.
Ten beams per strand source were made to measure the flexural capacity. They were
tested once for each of their two ends, for a total of 20 tests per strand source A, G, and I. The
beams were tested with a single point load, with the load placed at a distance of 60% Ld from
their end on one side (short end), and at a distance of 80% Ld from their end on the other side
(long end).End slip readings and surface strain readings taken by a laser speckle imaging device
were made for transfer length determination at release and before testing. Analysis of the flexural
testing data followed with the transfer length readings compared to ACI code requirements, and
experimental moments reached by the beam ends compared to their nominal moment capacities.
The beam testing results were plotted against the pullout test values set for each strand and
extrapolated in order to determine an acceptable ASTM A1081 threshold value for different
confidence levels. A numerical analysis was done assuming that a beam section is prestressed
using 6 strand specimens instead of one, assuming no interactions between the specimens and
considering the average capacity of all 6 possible combinations per case, to represent the
minimum amount of reinforcement expected in a prestressed concrete section used in the
industry.
During the third phase of this research project, a quality assurance test was conducted on
9 additional beam sections that were also fabricated at Stresscon with the same concrete mixture
as the flexural beam sections, but were of smaller cross sections. The specimens were tested by
RJ Peterman and Associates under the Simple Quality Assurance Test for Strand Bond proposed
by Robert J. Peterman. The test program concluded that strand I is unsafe to be used in pre-
tensioned applications fabricated with the concrete mixture and release strength used.
12.2 Recommendations for Implementation
It is recommended to keep great caution in maintaining the equipment to run the ASTM
A1081 test, since testing during this research project revealed that determining the mortar

144
mixture flow was very sensitive to equipment condition, as well as keeping procedures
consistent. The mortar mixture flow was found during the ruggedness testing to be the parameter
that had significant effects on the test results, when varied between the two extremes that the test
method allows.
A recommendation to use a single sand source, sieved and graded to specified gradations,
could be made for the cases where consistent mortar mixture flows and reduced variability of
pullout test results are of importance beyond the cost and time intensity of sieving and grading
the sand source.
The precision and bias statement for ASTM A1081 was also defined during this project.
The coefficient of variation of the test method was determined to be 9.0% for a single operator,
and 14.5% for multiple laboratory testing. It was determined that two properly conducted tests by
a single operator on the same material should not differ by more than 12.1%, and that the range
of the six single determinations used to calculate the average test result should not exceed 24.9%.
When considering multi-laboratory testing, the difference between 2 properly conducted tests
should not differ by more than 40.2%.
For a 90% confidence interval and 5% fractal, a threshold value of 14,600 lb is
recommended for ASTM A1081, after data analysis from the flexural beam testing study and the
Inter-Laboratory study, assuming that 6 strands will coexist in a beam section. This threshold
would preclude the use of strand I, which was found to be unsafe in the Simple Quality
Assurance Test for Strand Bond. Additionally, this criterion does not guarantee that the ACI 318
code transfer length requirements will be met.
12.3 Future Research
It was obvious during the course of this research project that difference in cement
chemistry can affect the ASTM A1081 test results. Properties such as fineness were dictating the
amount of water required to create mortar mixtures of the specified flow, and variability was also
seen in the cements’ setting times even though they were all Type III samples. It is
recommended that further research on type III cement source chemistry be conducted, in order to
specify the effects that different cement properties reflect on the test method results. It would be

145
helpful to provide certain requirements as far as cement chemical composition that will be
applied to the standard method in order to reduce variability of the test results.
While making attempts to provide a reasonable threshold value for ASTM A1081 based
on ACI 318 code transfer length requirements, it was considered that the current ACI 318 code
equation underestimates the transfer length, and it is highly recommended to revisit the current
code provisions.

146
Bibliography
ACI 318. (2011). Building Code Requirements for Structural Concrete (ACI 318-11) and
Commentary. Farmington Hills: American Concrete Institute.
Akhnoukh, A. K. (2008). Development of High Performance Precast/Prestressed Bridge
Girders. University of Nebraska, Lincoln.
ASTM A1081. (2012). Standard Test Method for Evaluating Bond of Seven-Wire Prestressing
Strand. 5 pp. West Conshohocken, PA: ASTM International.
ASTM A416. (2010). Standard Specification for Steel Strand, Uncoated Seven-Wire for
Prestressed Concrete. 5 pp. West Conshohocken, PA: ASTM International.
ASTM C109. (2012). Standard Test Method for Compressive Strength of Hydraulic Cement
Mortars. 10 pp. West Conshohocken, PA: ASTM International.
ASTM C1437. (2007). Standard Test Method for Flow of Hydraulic Cement Mortar. 2 pp. West
Conshohocken, PA: ASTM International.
ASTM C150. (2012). Standard Specification for Portland Cement. 9 pp. West Conshohocken,
PA: ASTM International.
ASTM C305. (99). Standard Practice for Mechanical Mixing of Hydraulic Cement Pastes and
Mortars of Plastic Consistency. 3 pp. West Conshohocken, PA: ASTM International.
ASTM E1169. (2007). Standard Practice for Conducting Ruggedness Tests. 9 pp. West
Conshohocken, Penn.: ASTM International.
Buckner, C. D. (1995). A Review of Strand Development Length for Pretensioned Concrete
Members.
Cousins, T. E., Johnston, D. W., & Zia, P. (1990). Transfer and Development Length of Epoxy
Coated and Uncoated Prestressing Strand. 35(4).
Cousins, T. E., Johnston, D. W., & Zia, P. (1990). Transfer Length of Epoxy-Coated Prestressing
Strand. ACI Materials Journal, 87(3).
Dinges, T. (2009). The History of Prestressed Concrete: 1888 to 1963. Manhattan, KS: Kansas
State University.
Gross, S. P., & Burns, N. H. (1995). Transfer and Development Length of 15.2mm (0.6 in)
Diameter Prestressing Strand in High Performance Concrete: Results of the Hoblitzell-
Buckner Beam Tests. The University of Texas at Austin, Center for Transportation
Research.
147
Hanson, W. N., & Kaar, P. H. (n.d.). Flexural Bond Tests of Pretensioned Prestressed Beams.
Journal of the American Concrete Institute.
Hawkins, N. M., & Ramirez, J. A. (2010). Due Diligence Review of NASP Strand Bond Test
Method. Chicago, IL: Precast/Prestressed Concrete Institute (PCI).
Jurakev, Y. V. (2004). Investigation of Development of Prestressing Strands and Deformed Bars.
University of Nebraska-Lincoln.
Kose, M. M., & Burkett, W. R. (2005). Evaluation of Code Requirement for 0.6 in. (15 mm)
Prestressing Strand. ACI Structural Journal, 3(102).
Lane, S. N. (1998). A New Development Length Equation for Pretensioned Strands in Bridge
Beams and Piles. McLean, VA: Federal Highway Administration.
Logan, D. R. (1997). Acceptance Criteria for Bond Quality of Strand for Pretensioned
Prestressed Concrete Applications. PCI Journal.
Martin, L. D., & Scott, N. L. (1976). Development of Prestressing Strand in Pretensioned
Members. 73(8).
Murray, C. D. (2012). The effect of Mortar Strength on the Standard Test for Strand Bond.
University of Arkansas, Civil Engineering, Fayetteville, Arkansas.
Natrella, M. G. (1963). Experimental Statistics. In National Bureau of Standards Handbook 91
(pp. 2-13-2-15). Washington, D.C: United States Department of Commerce.
Nawy, E. G. (2010). Prestressed Concrete: A fundamental Approach. Upper Saddle River, NJ:
Pearson Education, Inc.
Osborn, A. E., Lawler, J. S., & Connolly, J. D. (2008). NCHRP Report 621. Washington, D.C.:
Transportation Research Board.
Peterman, R. J. (2009). A simple quality assurance test for strand bond. PCI Journal, 54(2), 143-
161.
Polydorou, T., Riding, K. A., & Peterman, R. J. (2014). Interlaboratory Study for ASTM A1081
Standard Test Method for Evaluating Bond of Seven-Wire Steel Prestressing Strand.
Manhattan, KS: Kansas State University.
Polydorou, T., Riding, K. A., Peterman, R. J., & Murray, L. (2013). Effects of Setup and
Material Parameters on the Standard Test for Strand Bond. Manhattan, KS: Kansas State
University.
Porterfield, K. B. (2012). Bond, Transfer Length, and Development Length of Prestressing
Strand in Self-Consolidating Concrete. Missouri University of Science and Technology,
Civil, Architectural and Environmental Engineering, Rolla, Missouri.

148
Ramirez, J. A., & Russell, B. W. (2008). Transfer, Development, and Splice Length for
Strand/Reinforcement in High-Strength Concrete. Washington, D.C.: Transportation
Research Board.
Riding, K. A., Peterman, R. J., Polydorou, T., & Ren, G. (2012). Simple Mortar Mixture
Proportioning Method for Meeting Minimum and Maximum Flow and Strength
Requirements. Manhattan, KS: Kansas State University.
Rose, D., & Russell, B. W. (1997). Investigation of Standardized Tests to Measure the Bond
Performance of Prestressing Strand.
Russell, B. (2006). NASP Round IV Strand Bond Testing. Final Report.
Russell, B. W. (n.d.). NASP Strand Bond Testing Round III.
Russell, B. W., & Burns, N. H. (1993). Design Guidelines for Transfer, Development and
Debonding of Large Diameter Seven Wire Strands in Pretensioned Concrete Girders.
The University of Texas at Austin, Austin, TX.
Russell, B. W., & Paulsgrove, G. A. (1999). NASP Strand Bond Testing Round I. Norman, OK:
The University of Oklahoma.
Russell, B. W., & Paulsgrove, G. A. (1999). NASP Strand Bond Testing Round II. Norman, OK:
University of Oklahoma.
Russell, B. W., & Ramirez, J. A. (2008). NCHRP Report 603. Washington, DC: Transportation
Research Board.
Shahawy, M. A. (1999). Critical Evaluation of the Design Code Requirements for Development
Length of Prestressing Tendons. Tallahassee, FL: Structural Research Center Florida
Department of Transportation.
Sobin, N. J. (2005). Evaluation of Strand Bond Assurance Tests for Pretensioned Applications.
University of Arkansas, Civil Engineering, Fayeteville.
Tabatabai, H., & Dickson, T. J. (1995). The History of the Prestressing Strand Development
Length Equation. McLean, Virginia: US Department of Transportation Federal Highway
Administration.
Wiss, Janney, Elstner, & Associates. (n.d.). Retrieved October 17, 2013, from Wiss, Janney
Elstner Associates, Inc.Web site:
http://www.wje.com/projects/detail.php?pid=2003.2612.0
www.pci.org. (n.d.). Retrieved 2013, from Precast/Prestressed Concrete Institute.
Xercavins, P., Demarthe, D., & Sushkewich, K. (2008). Eugene Freyssinet- The Invention of
Presressed Concrete and Precast Segmental Construction.

149
Zhao, W. (2011). Development of a Portable Optical Strain Sensor with Applications to
Diagnostic Testing of Prestressed Concrete. Manhattan, KS: Kansas State University.
Zhao, W., Beck, B. T., Peterman, R. J., Murphy, R., Wu, C.-H. J., & Lee, G. (2013). A Direct
Comparison of the Traditional Method and a New Approach in Determining Transfer
Lengths in Prestressed Concrete Railroad Ties. 2013 Joint Railroad Conference.
Knoxville, TN.

150
Rectangular Beam Specimens’ Accompanying
Concrete Cylinder Split Tensile Test Results
Table A-1 Placement Day 1 (7-16-13): Rectangular Beam Specimens A 1-5, I 1-5
Accompanying Cylinders’ Split Tensile Test Results
Cylinder Test
Specimen
Date Tested Split Tensile
Strength (psi)
Time between Concrete
Placement and Test
(days)
ST-D1-1 8-5-13 677 20
ST-D1-2* 8-5-13 652 20
ST-D1-3 8-8-13 630 23
ST-D1-4* 8-8-13 647 23
ST-D1-5* 8-12-13 700 27
*Cylinder was tested for Modulus of Elasticity prior to Split Tensile Test
Table A-2 Placement Day 2 (7-18-13): Rectangular Beam Specimens A 5-10, G 1-5
Accompanying Cylinders’ Split Tensile Test Results
Cylinder Test
Specimen
Date Tested Split Tensile
Strength (psi)
Time between Concrete
Placement and Test
(days)
ST-D2-1 8-5-13 540 18
ST-D2-2* 8-5-13 502 18
ST-D2-3 8-12-13 574 25
ST-D2-4* 8-12-13 692 25
*Cylinder was tested for Modulus of Elasticity prior to Split Tensile Test

151
Table A-3 Placement Day 3 (7-19-13): Rectangular Beam Specimens I 5-10, G 5-10
Accompanying Cylinders’ Split Tensile Test Results
Cylinder Test
Specimen
Date Tested Split Tensile
Strength (psi)
Time between Concrete
Placement and Test
(days)
ST-D3-1 8-8-13 655 20
ST-D3-2* 8-8-13 645 20
ST-D3-3* 8-12-13 814 24
*Cylinder was tested for Modulus of Elasticity prior to Split Tensile Test

152
Rectangular Beam Specimen Transfer Lengths at Time
of Prestress Release
Table B-1 Strand G Transfer Lengths at Time of Prestress Release
Specimen ZL Method Transfer
Length (in)
95% AMS Transfer
Length (in)
G1-S 22.93 23.28
G2-S 27.71 28.56
G3-S 22.41 22.51
G4-S 33.79 32.03
G5-S 30.71 29.24
G6-S 18.43 18.29
G7-S 20.41 19.03
G8-S 36.48 36.71
G9-S 37.30 35.80
G10-S 22.36 19.65
G1-L 26.84 28.62
G2-L 28.99 31.20
G3-L 29.35 31.25
G4-L 35.21 33.70
G5-L 31.94 31.31
G6-L 23.71 23.14
G7-L 32.24 28.41
G8-L 31.44 28.56
G9-L 27.15 27.01
G10-L 21.60 19.88

153
Table B-2 Strand A Transfer Lengths at Time of Prestress Release
Specimen ZL Method Transfer
Length (in)
95% AMS Transfer
Length (in)
A1-S 28.39 28.67
A2-S 45.08 40.54
A3-S 31.70 29.75
A4-S 35.09 33.70
A5-S 56.36 55.85
A6-S 34.65 35.09
A7-S 37.11 33.03
A8-S 34.80 32.15
A9-S 34.98 33.23
A10-S 40.61 39.70
A1-L 27.03 26.14
A2-L 31.45 31.32
A3-L 34.36 30.54
A4-L 17.13 24.82
A5-L 31.50 29.49
A6-L 33.13 38.37
A7-L 39.96 38.82
A8-L 38.46 36.44
A9-L 39.20 34.48
A10-L 44.69 40.15

154
Table B-3 Strand I Transfer Lengths at Time of Prestress Release
Specimen ZL Method Transfer
Length (in)
95% AMS Transfer
Length (in)
I1-S 37.73 N/A
I2-S 30.93 29.78
I3-S 40.65 N/A
I4-S 61.60 57.14
I5-S 58.23 54.08
I6-S 28.69 27.44
I7-S 33.49 31.62
I8-S 56.79 48.60
I9-S 47.45 44.93
I10-S 23.91 21.01
I1-L 39.79 38.18
I2-L 32.85 31.03
I3-L 28.01 26.23
I4-L 54.69 64.04
I5-L 33.98 30.62
I6-L 38.93 36.74
I7-L 44.81 39.92
I8-L 44.34 38.61
I9-L 53.74 47.36
I10-L 52.49 45.74

155
Rectangular Beam Specimen Transfer Lengths at Time
of Flexural Testing
Table C-1 Strand G Transfer Lengths at Time of Flexural Testing
Specimen ZL Method Transfer
Length (in)
G1-S 33.15
G2-S 35.63
G3-S 31.34
G4-S 42.43
G5-S 38.34
G6-S 29.09
G7-S 30.06
G8-S 47.28
G9-S 49.11
G10-S 32.58
G1-L 33.90
G2-L 37.20
G3-L 37.85
G4-L 42.84
G5-L 39.86
G6-L 31.49
G7-L 44.34
G8-L 41.81
G9-L 40.69
G10-L 34.27

156
Table C-2 Strand A Transfer Lengths at Time of Flexural Testing
Specimen ZL Method Transfer
Length (in)
A1-S 40.05
A2-S 55.59
A3-S 40.34
A4-S 47.62
A5-S 69.46
A6-S 46.89
A7-S 50.36
A8-S 50.93
A9-S 50.82
A10-S 51.55
A1-L 37.97
A2-L 42.83
A3-L 42.14
A4-L 34.55
A5-L 44.60
A6-L 46.09
A7-L 52.49
A8-L 49.98
A9-L 54.32
A10-L 61.39

157
Table C-3 Strand I Transfer Lengths at Time of Flexural Testing
Specimen ZL Method Transfer
Length (in)
I1-S 51.27
I2-S 47.20
I3-S 56.06
I4-S 71.82
I5-S 73.21
I6-S 33.87
I7-S 46.16
I8-S 65.14
I9-S 58.25
I10-S 32.12
I1-L 53.04
I2-L 49.27
I3-L 40.54
I4-L 65.78
I5-L 44.20
I6-L 48.43
I7-L 56.33
I8-L 53.56
I9-L 65.69
I10-L 83.02

158
Flexural Beam Specimen End Slip Values
Table D-1 Strand G End Slip Values
Specimen Initial End Slip (in) and
Date Taken (Immediately
after Prestress Release)
1-Day End Slip (in) and
Date Taken
End Slip Before Flexural
Test (in) and Date Taken
G1-S 0.0165 7/18/13 0.0385 7/19/13 0.0520 8/5/13
G2-S 0.0160 7/18/13 0.0320 7/19/13 0.0435 8/5/13
G3-S 0.0170 7/18/13 0.0335 7/19/13 0.0480 8/6/13
G4-S 0.0085 7/18/13 0.0295 7/19/13 0.0385 8/6/13
G5-S 0.0265 7/18/13 0.0425 7/19/13 0.0530 8/7/13
G6-S 0.0095 7/19/13 0.0370 7/20/13 0.0465 8/7/13
G7-S 0.0140 7/19/13 0.0395 7/20/13 0.0475 8/8/13
G8-S 0.0375 7/19/13 0.0695 7/20/13 0.0750 8/8/13
G9-S 0.0480 7/19/13 0.0640 7/20/13 0.0890 8/9/13
G10-S 0.0225 7/19/13 0.0480 7/20/13 0.0580 8/9/13
G1-L 0.0180 7/18/13 0.0380 7/19/13 0.0425 8/5/13
G2-L 0.0170 7/18/13 0.0315 7/19/13 0.0455 8/5/13
G3-L 0.0095 7/18/13 0.0230 7/19/13 0.0390 8/6/13
G4-L 0.0345 7/18/13 0.0485 7/19/13 0.0610 8/6/13
G5-L 0.0000 7/18/13 0.0140 7/19/13 0.0275 8/7/13
G6-L 0.0020 7/19/13 0.0190 7/20/13 0.0290 8/7/13
G7-L 0.0260 7/19/13 0.0480 7/20/13 0.0680 8/8/13
G8-L 0.0155 7/19/13 0.0390 7/20/13 0.0515 8/8/13
G9-L 0.0270 7/19/13 0.0545 7/20/13 0.0740 8/9/13
G10-L 0.0170 7/19/13 0.0460 7/20/13 0.0610 8/9/13

159
Table D-2 Strand A End Slip Values
Specimen Initial End Slip (in) and
Date Taken (Immediately
after Prestress Release)
1-Day End Slip (in) and
Date Taken
End Slip Before Flexural
Test (in) and Date Taken
A1-S 0.0010 7/16/13 0.0385 7/17/13 0.0415 8/5/13
A2-S 0.0360 7/16/13 0.0645 7/17/13 0.0725 8/5/13
A3-S 0.0065 7/16/13 0.0365 7/17/13 0.0365 8/6/13
A4-S 0.0325 7/16/13 0.0605 7/17/13 0.0760 8/6/13
A5-S 0.0480 7/16/13 0.0780 7/17/13 0.0935 8/7/13
A6-S 0.0245 7/18/13 0.0445 7/19/13 0.0670 8/7/13
A7-S 0.0150 7/18/13 0.0435 7/19/13 0.0610 8/8/13
A8-S 0.0360 7/18/13 0.0590 7/19/13 0.0920 8/8/13
A9-S 0.0290 7/18/13 0.0575 7/19/13 0.0840 8/9/13
A10-S 0.0785 7/18/13 0.0945 7/19/13 0.1165 8/9/13
A1-L 0.0200 7/16/13 0.0445 7/17/13 0.0580 8/5/13
A2-L 0.0245 7/16/13 0.0535 7/17/13 0.0640 8/5/13
A3-L 0.0725 7/16/13 0.0890 7/17/13 0.0995 8/6/13
A4-L 0.0255 7/16/13 0.0600 7/17/13 0.0860 8/6/13
A5-L 0.0205 7/16/13 0.0495 7/17/13 0.0660 8/7/13
A6-L 0.0305 7/18/13 0.0465 7/19/13 0.0755 8/7/13
A7-L 0.0310 7/18/13 0.0475 7/19/13 0.0745 8/8/13
A8-L 0.0575 7/18/13 0.0730 7/19/13 0.0975 8/8/13
A9-L 0.0350 7/18/13 0.0585 7/19/13 0.0875 8/9/13
A10-L 0.0275 7/18/13 0.0505 7/19/13 0.0855 8/9/13

160
Table D-3 Strand I End Slip Values
Specimen Initial End Slip (in) and
Date Taken (Immediately
after Prestress Release)
1-Day End Slip (in) and
Date Taken
End Slip Before Flexural
Test (in) and Date Taken
I1-S 0.0435 7/16/13 0.0830 7/17/13 0.0905 8/5/13
I2-S 0.0300 7/16/13 0.0725 7/17/13 0.0865 8/5/13
I3-S 0.0325 7/16/13 0.0725 7/17/13 0.0850 8/6/13
I4-S 0.0870 7/16/13 0.1180 7/17/13 0.1225 8/6/13
I5-S 0.0545 7/16/13 0.0930 7/17/13 0.1065 8/7/13
I6-S 0.0335 7/19/13 0.0470 7/20/13 0.0515 8/7/13
I7-S 0.0510 7/19/13 0.0785 7/20/13 0.0950 8/8/13
I8-S 0.0860 7/19/13 0.1095 7/20/13 0.1150 8/8/13
I9-S 0.0735 7/19/13 0.0950 7/20/13 0.1110 8/9/13
I10-S 0.0295 7/19/13 0.0575 7/20/13 0.0580 8/9/13
I1-L 0.0540 7/16/13 0.0900 7/17/13 0.1000 8/5/13
I2-L 0.0150 7/16/13 0.0600 7/17/13 0.0720 8/5/13
I3-L 0.0190 7/16/13 0.0530 7/17/13 0.0625 8/6/13
I4-L 0.0730 7/16/13 0.1045 7/17/13 0.1115 8/6/13
I5-L 0.0635 7/16/13 0.0895 7/17/13 0.0990 8/7/13
I6-L 0.0500 7/19/13 0.0715 7/20/13 0.0830 8/7/13
I7-L 0.0350 7/19/13 0.0655 7/20/13 0.0750 8/8/13
I8-L 0.0635 7/19/13 0.0850 7/20/13 0.0955 8/8/13
I9-L 0.0640 7/19/13 0.0945 7/20/13 0.1055 8/9/13
I10-L 0.0170 7/19/13 0.0460 7/20/13 0.1230 8/9/13

161
Rectangular Beam End Actual Dimensions
Table E-1 Strand A Beam Ends- Actual Dimensions
Beam End Top Width (in) Depth to c.g. of
Strand (in)
Overall Height
(in)
A1-L 6.8435 10.1250 12.1250
A2-L 6.5350 10.0000 12.1250
A3-L 6.6410 9.8750 12.0625
A4-L 6.6010 10.0000 12.1250
A5-L 6.7320 10.0000 12.1875
A6-L 6.7750 10.0625 12.1250
A7-L 6.6000 10.0000 12.1250
A8-L 6.7705 9.9375 12.0625
A9-L 6.7100 10.0000 12.0000
A10-L 6.9545 9.9375 12.0000
A1-S 6.6630 10.0000 12.1250
A2-S 6.4890 9.8750 12.0625
A3-S 6.6050 10.0000 12.1250
A4-S 6.5915 9.9375 12.1250
A5-S 6.6045 9.8750 12.0625
A6-S 6.5820 10.0000 12.0625
A7-S 6.6120 9.9375 12.0625
A8-S 6.6620 10.0000 12.0000
A9-S 6.7000 9.8125 11.9375
A10-S 6.6785 9.8750 11.8750
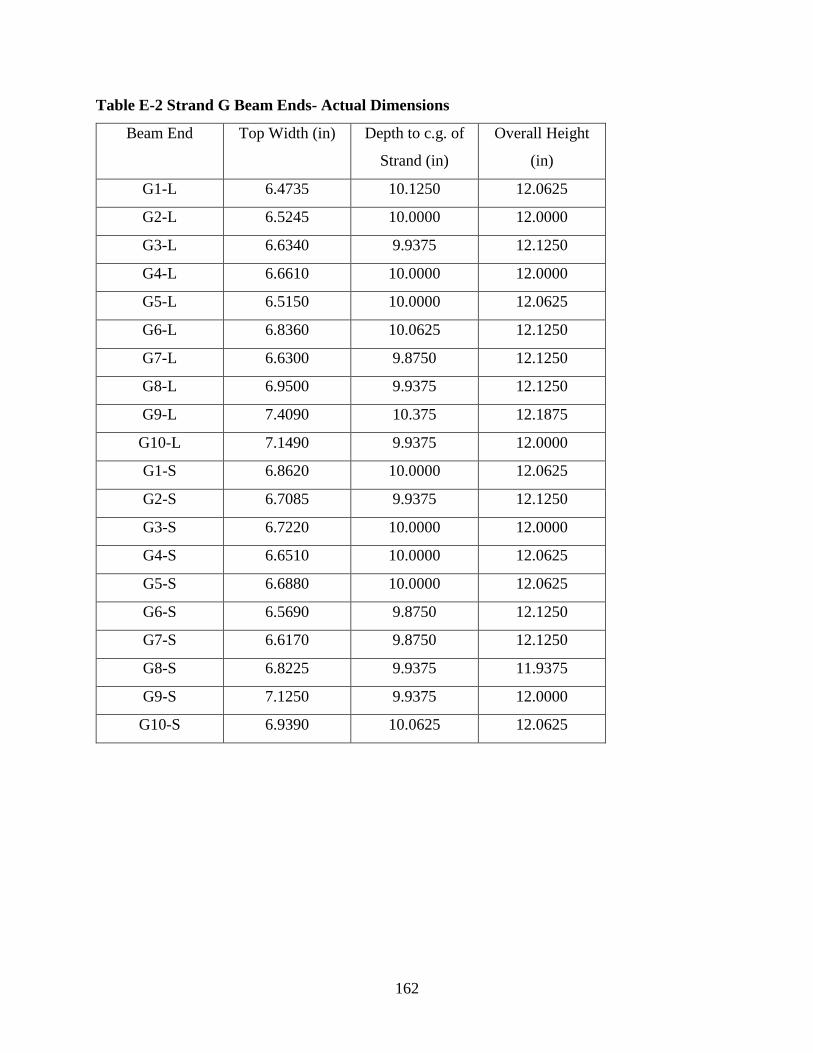
162
Table E-2 Strand G Beam Ends- Actual Dimensions
Beam End Top Width (in) Depth to c.g. of
Strand (in)
Overall Height
(in)
G1-L 6.4735 10.1250 12.0625
G2-L 6.5245 10.0000 12.0000
G3-L 6.6340 9.9375 12.1250
G4-L 6.6610 10.0000 12.0000
G5-L 6.5150 10.0000 12.0625
G6-L 6.8360 10.0625 12.1250
G7-L 6.6300 9.8750 12.1250
G8-L 6.9500 9.9375 12.1250
G9-L 7.4090 10.375 12.1875
G10-L 7.1490 9.9375 12.0000
G1-S 6.8620 10.0000 12.0625
G2-S 6.7085 9.9375 12.1250
G3-S 6.7220 10.0000 12.0000
G4-S 6.6510 10.0000 12.0625
G5-S 6.6880 10.0000 12.0625
G6-S 6.5690 9.8750 12.1250
G7-S 6.6170 9.8750 12.1250
G8-S 6.8225 9.9375 11.9375
G9-S 7.1250 9.9375 12.0000
G10-S 6.9390 10.0625 12.0625

163
Table E-3 Strand I Beam Ends- Actual Dimensions
Beam End Top Width (in) Depth to c.g. of
Strand (in)
Overall Height
(in)
I1-L 6.4760 10.0000 12.0625
I2-L 6.5350 10.0000 12.0625
I3-L 6.6555 9.8750 12.0625
I4-L 6.5910 9.8750 12.0625
I5-L 6.4390 9.8125 12.0625
I6-L 6.5145 9.9375 12.0000
I7-L 6.6480 10.0000 12.1250
I8-L 6.6860 9.9375 12.1875
I9-L 6.7075 10.0625 12.0625
I10-L 6.6220 9.8125 11.8125
I1-S 6.7840 10.0000 12.1250
I2-S 6.7030 9.8750 12.0625
I3-S 6.6890 9.8750 12.0625
I4-S 6.5905 9.8125 12.1250
I5-S 6.7040 10.0000 12.1875
I6-S 6.8790 9.9375 12.0000
I7-S 6.8450 9.9375 12.2500
I8-S 6.7770 10.0000 12.0000
I9-S 6.6910 9.8750 11.8750
I10-S 6.7985 10.1875 12.2500

164
Moment Capacity Calculation Example
Span= 150 in.
Cantilever= 64.5 in.
End Distance= 1.5 in.
Embedment= 44.5 in. (Short End)
= 59 in. (Long End)
Concrete Section Properties:
w= width= 6.5 in.
h= height= 12 in.
A= cross sectional area= 78 in2
I= Moment of Inertia= 936 in4
e= Eccentricity of prestressing force= 4 in.
End Distance
Span Cantilever
Embedment

165
yb= Distance from bottom fiber to center of gravity of section= 6 in.
Sb= Section modulus with respect to bottom fiber= I / yb = 156 in3
Concrete Material Properties:
f’c= Concrete Compressive Strength= 6000 psi
fr= Modulus of rupture of concrete= 7.5 √ (f’c)= 581 psi
Critical Section Loads (Short End):
At the critical section = 44.5 in. from beam end = 43 in. from roller support:
Wself= 150 lb/ft3 = 81.25 lb/ft
MDL= Dead Load Moment= 15.6 kip-in.
MLL= Live Load Moment= 292.9 kip-in.
Mtotal= MDL + MLL= 308.5 kip-in.
Critical Section Loads (Long End):
Critical Section at 59 in. from beam end = 57.5 in. from roller support
Wself= 81.25 lb/ft
MDL= 18.0 kip-in.
MLL= 330.0 kip-in.

166
Mtotal= 348.0 kip-in.
Cracking Moment Calculations:
(Calculations shown for Standard Beam, No crack former or saw cutting applied)
Pe= Effective prestress force= 28.2 kips
fr= 581 psi
e= 4 in.
Sb= I / yb = 156 in3
Mcr= Cracking moment= [ fr + 𝑃𝑒𝐴𝑐⁄ +
(𝑃𝑒 ∗ 𝑒)𝑆𝑏
⁄ ] = 259.8 kip-in.
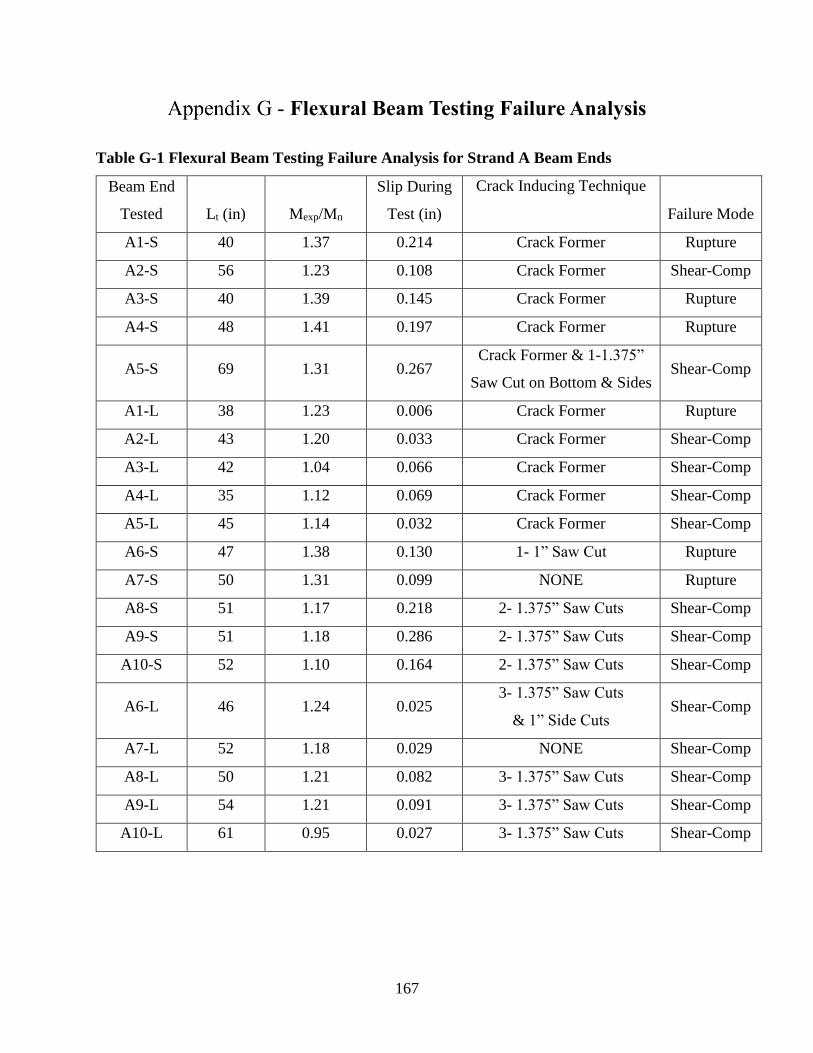
167
Flexural Beam Testing Failure Analysis
Table G-1 Flexural Beam Testing Failure Analysis for Strand A Beam Ends
Beam End
Tested Lt (in) Mexp/Mn
Slip During
Test (in)
Crack Inducing Technique
Failure Mode
A1-S 40 1.37 0.214 Crack Former Rupture
A2-S 56 1.23 0.108 Crack Former Shear-Comp
A3-S 40 1.39 0.145 Crack Former Rupture
A4-S 48 1.41 0.197 Crack Former Rupture
A5-S 69 1.31 0.267 Crack Former & 1-1.375”
Saw Cut on Bottom & Sides Shear-Comp
A1-L 38 1.23 0.006 Crack Former Rupture
A2-L 43 1.20 0.033 Crack Former Shear-Comp
A3-L 42 1.04 0.066 Crack Former Shear-Comp
A4-L 35 1.12 0.069 Crack Former Shear-Comp
A5-L 45 1.14 0.032 Crack Former Shear-Comp
A6-S 47 1.38 0.130 1- 1” Saw Cut Rupture
A7-S 50 1.31 0.099 NONE Rupture
A8-S 51 1.17 0.218 2- 1.375” Saw Cuts Shear-Comp
A9-S 51 1.18 0.286 2- 1.375” Saw Cuts Shear-Comp
A10-S 52 1.10 0.164 2- 1.375” Saw Cuts Shear-Comp
A6-L 46 1.24 0.025 3- 1.375” Saw Cuts
& 1” Side Cuts Shear-Comp
A7-L 52 1.18 0.029 NONE Shear-Comp
A8-L 50 1.21 0.082 3- 1.375” Saw Cuts Shear-Comp
A9-L 54 1.21 0.091 3- 1.375” Saw Cuts Shear-Comp
A10-L 61 0.95 0.027 3- 1.375” Saw Cuts Shear-Comp

168
Table G-2 Flexural Beam Testing Failure Analysis for Strand G Beam Ends
Beam End
Tested Lt (in) Mexp/Mn
Slip During
Test (in)
Crack Inducing Technique
Failure Mode
G1-S 33 1.28 0.289 1- 1” Saw Cut Shear-Comp
G2-S 36 1.30 0.126 1- 1” Saw Cut Shear-Comp
G3-S 31 1.40 0.038 1- 1” Saw Cut Rupture
G4-S 42 1.21 0.092 1- 1” Saw Cut Shear-Comp
G5-S 38 1.37 0.148 2- 1.375” Saw Cuts & 1”
Side Cuts Shear-Comp
G1-L 34 1.23 0.002 1- 1” Saw Cut Rupture
G2-L 37 1.22 0.003 1- 1” Saw Cut Rupture
G3-L 38 1.24 0.007 1- 1” Saw Cut Rupture
G4-L 43 1.16 0.057 1- 1” Saw Cut Shear-Comp
G5-L 40 1.23 0.022 1- 1” Saw Cut Rupture
G6-S 29 1.34 0.104 1- 1” Saw Cut Shear-Comp
G7-S 30 1.34 0.056 NONE Shear-Comp
G8-S 47 1.16 0.304 2- 1.375” Saw Cuts Shear-Comp
G9-S 49 1.38 0.787 2- 1.375” Saw Cuts Rupture
G10-S 33 1.40 0.260 2- 1.375” Saw Cuts Rupture
G6-L 31 1.23 0.002 3- 1.375” Saw Cuts & 1”
Side Cuts Rupture
G7-L 44 1.19 0.020 NONE Rupture
G8-L 42 1.22 0.022 3- 1.375” Saw Cuts Shear-Comp
G9-L 41 1.15 0.172 3- 1.375” Saw Cuts Shear-Comp
G10-L 34 1.26 0.022 3- 1.375” Saw Cuts Shear-Comp

169
Table G-3 Flexural Beam Testing Failure Analysis for Strand I Beam Ends
Beam End
Tested Lt (in) Mexp/Mn
Slip During
Test (in) Crack Inducing Technique Failure Mode
I1-S 51 1.30 1.030 Crack Former Rupture
I2-S 47 1.31 1.098 Crack Former Rupture
I3-S 56 1.38 0.702 Crack Former Rupture
I4-S 72 1.35 1.140 Crack Former Rupture
I5-S 73 1.29 > 0.5 Crack Former Rupture
I1-L 53 1.17 0.295 Crack Former Rupture
I2-L 49 1.11 0.046 Crack Former Shear-Comp
I3-L 41 1.09 0.185 Crack Former Shear-Comp
I4-L 66 1.14 0.533 Crack Former Rupture
I5-L 44 0.88 0.059 Crack Former & 2-1.375”
Saw Cut on Bottom & Sides Shear-Comp
I6-S 34 1.12 0.257 2- 1.375” Saw Cuts & 1”
Side Cuts Shear-Comp
I7-S 46 1.28 0.957 NONE Shear-Comp
I8-S 65 1.01 0.257 2- 1.375” Saw Cuts Shear-Comp
I9-S 58 0.93 0.216 2- 1.375” Saw Cuts Shear-Comp
I10-S 32 1.16 0.525 2- 1.375” Saw Cuts Shear-Comp
I6-L 48 1.22 0.256 1- 1” Saw Cut Rupture
I7-L 56 1.21 0.177 NONE Rupture
I8-L 54 1.16 0.231 3- 1.375” Saw Cuts Shear-Comp
I9-L 66 0.97 0.213 3- 1.375” Saw Cuts Shear-Comp
I10-L 83 0.94 0.270 3- 1.375” Saw Cuts Shear-Comp

170
Flexural Beam Test Results Summary Charts
Figure H.1 Beam End A1-L Flexural Test Results Summary Chart A
Figure H.2 Beam End A1-L Flexural Test Results Summary Chart B

171
Figure H.3 Beam End A1-L Failure
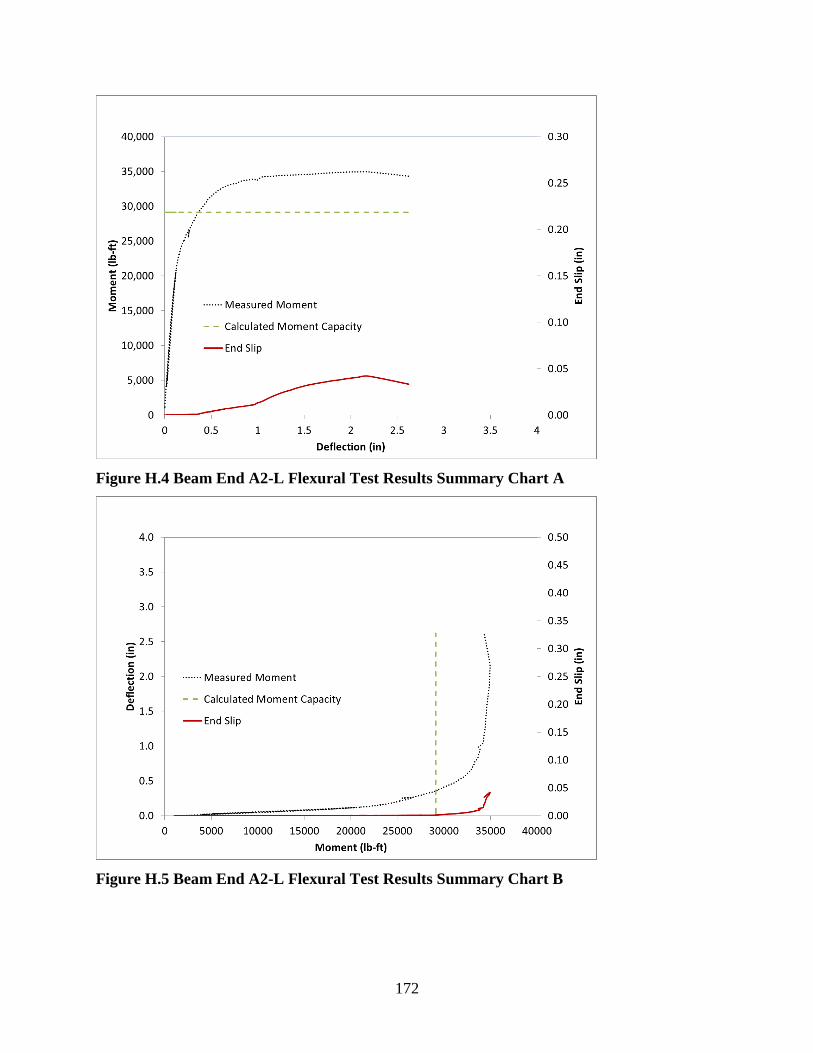
172
Figure H.4 Beam End A2-L Flexural Test Results Summary Chart A
Figure H.5 Beam End A2-L Flexural Test Results Summary Chart B
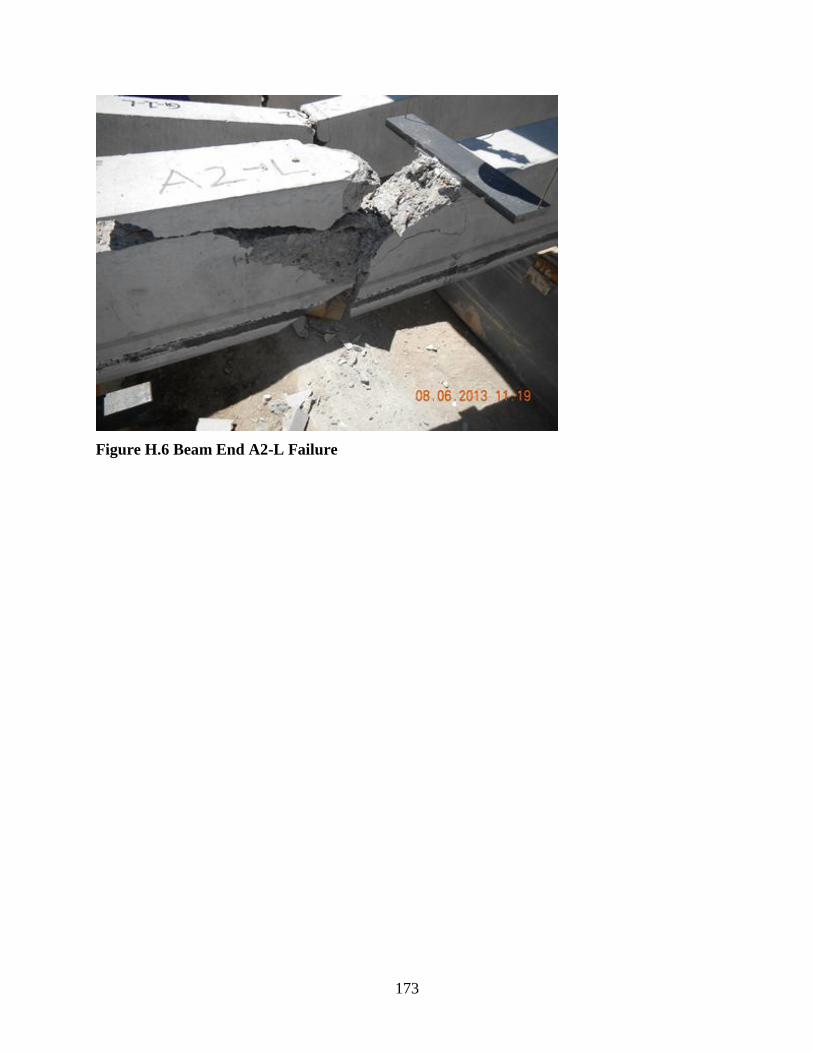
173
Figure H.6 Beam End A2-L Failure

174
Figure H.7 Beam End A3-L Flexural Test Results Summary Chart A
Figure H.8 Beam End A3-L Flexural Test Results Summary Chart B

175
Figure H.9 Beam End A3-L Failure

176
Figure H.10 Beam End A4-L Flexural Test Results Summary Chart A
Figure H.11 Beam End A4-L Flexural Test Results Summary Chart B

177
Figure H.12 Beam End A4-L Failure

178
Figure H.13 Beam End A5-L Flexural Test Results Summary Chart A
Figure H.14 Beam End A5-L Flexural Test Results Summary Chart B

179
Figure H.15 Beam End A5-L Failure
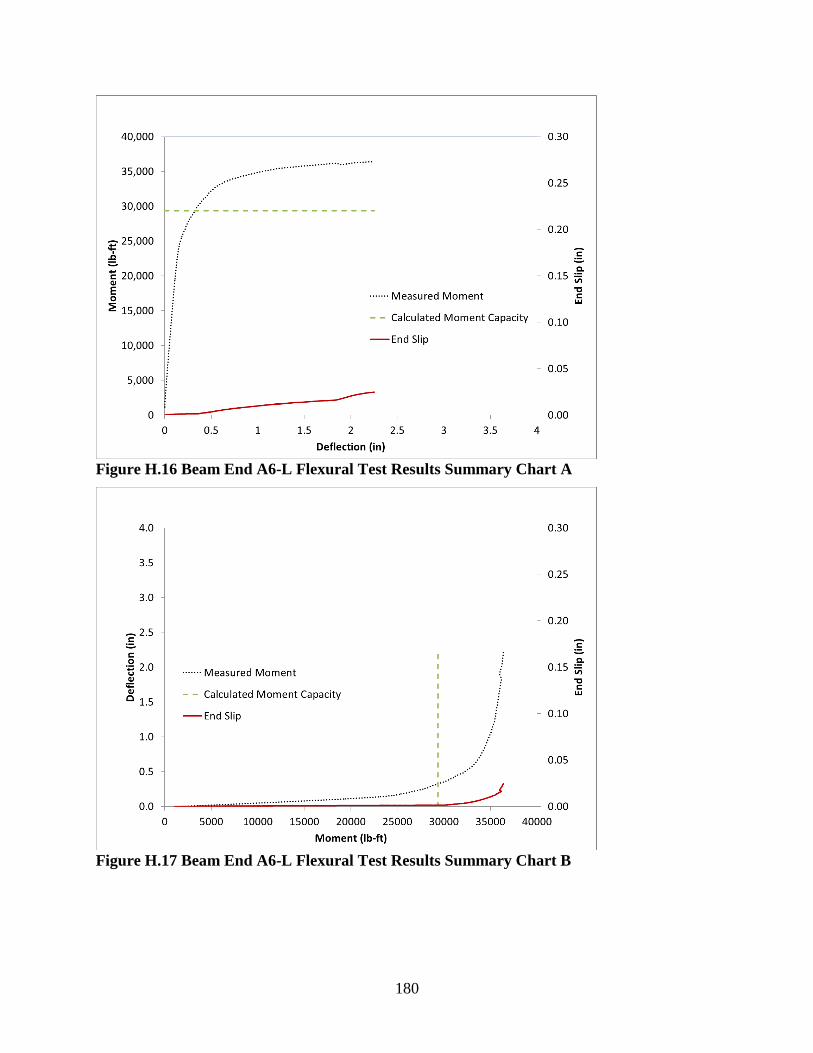
180
Figure H.16 Beam End A6-L Flexural Test Results Summary Chart A
Figure H.17 Beam End A6-L Flexural Test Results Summary Chart B

181
Figure H.18 Beam End A6-L Failure

182
Figure H.19 Beam End A7-L Flexural Test Results Summary Chart A
Figure H.20 Beam End A7-L Flexural Test Results Summary Chart B
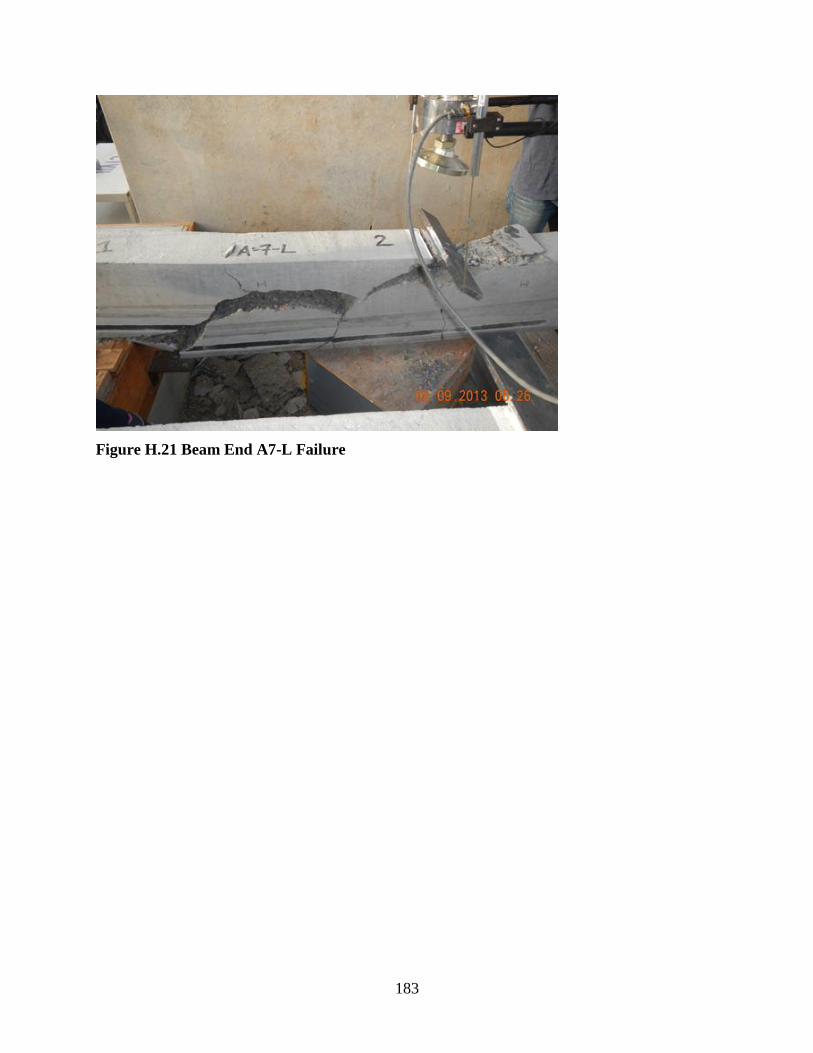
183
Figure H.21 Beam End A7-L Failure

184
Figure H.22 Beam End A8-L Flexural Test Results Summary Chart A
Figure H.23 Beam End A8-L Flexural Test Results Summary Chart B

185
Figure H.24 Beam End A8-L Failure

186
Figure H.25 Beam End A9-L Flexural Test Results Summary Chart A
Figure H.26 Beam End A9-L Flexural Test Results Summary Chart B

187
Figure H.27 Beam End A9-L Failure

188
Figure H.28 Beam End A10-L Flexural Test Results Summary Chart A
Figure H.29 Beam End A10-L Flexural Test Results Summary Chart B

189
Figure H.30 Beam End A10-L Failure

190
Figure H.31 Beam End A1-S Flexural Test Results Summary Chart A
Figure H.32 Beam End A1-S Flexural Test Results Summary Chart B

191
Figure H.33 Beam End A1-S Failure

192
Figure H.34 Beam End A2-S Flexural Test Results Summary Chart A
Figure H.35 Beam End A2-S Flexural Test Results Summary Chart B

193
Figure H.36 Beam End A2-S Failure

194
Figure H.37 Beam End A3-S Flexural Test Results Summary Chart A
Figure H.38 Beam End A3-S Flexural Test Results Summary Chart B

195
Figure H.39 Beam End A3-S Failure

196
Figure H.40 Beam End A4-S Flexural Test Results Summary Chart A
Figure H.41 Beam End A4-S Flexural Test Results Summary Chart B

197
Figure H.42 Beam End A4-S Failure

198
Figure H.43 Beam End A5-S Flexural Test Results Summary Chart A
Figure H.44 Beam End A5-S Flexural Test Results Summary Chart B

199
Figure H.45 Beam End A5-S Failure

200
Figure H.46 Beam End A6-S Flexural Test Results Summary Chart A
Figure H.47 Beam End A6-S Flexural Test Results Summary Chart B

201
Figure H.48 Beam End A6-S Failure

202
Figure H.49 Beam End A7-S Flexural Test Results Summary Chart A
Figure H.50 Beam End A7-S Flexural Test Results Summary Chart B

203
Figure H.51 Beam End A7-S Failure

204
Figure H.52 Beam End A8-S Flexural Test Results Summary Chart A
Figure H.53 Beam End A8-S Flexural Test Results Summary Chart B

205
Figure H.54 Beam End A8-S Failure
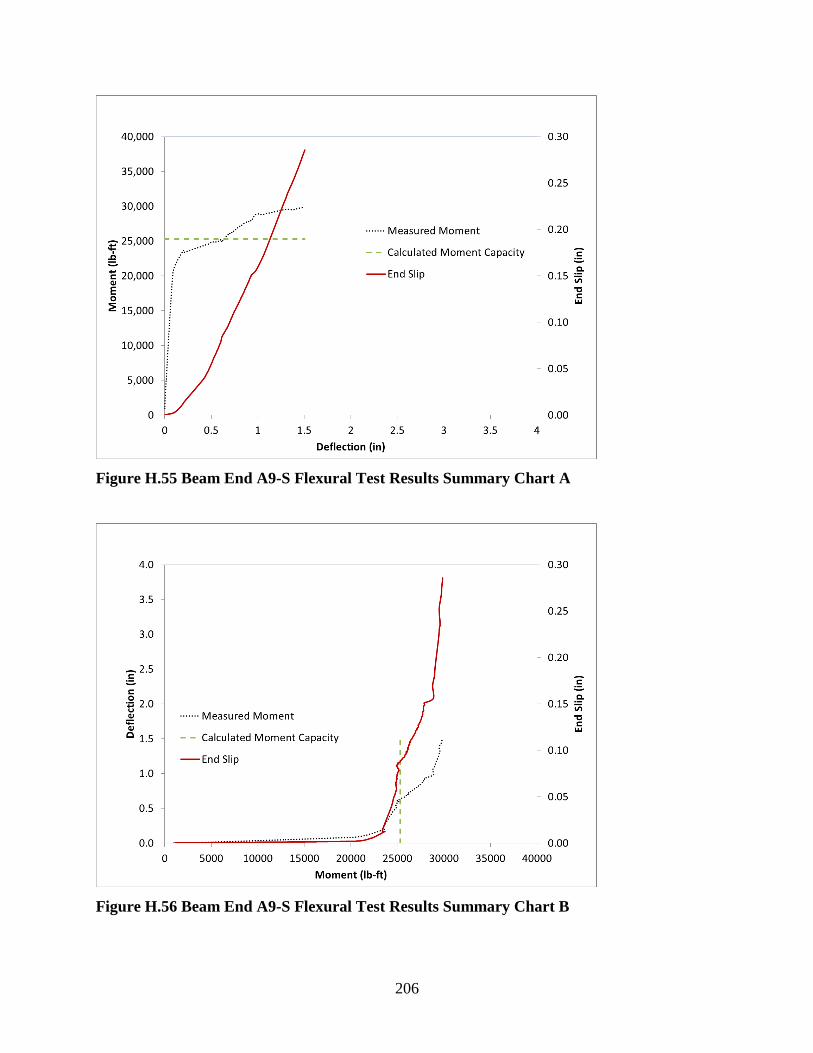
206
Figure H.55 Beam End A9-S Flexural Test Results Summary Chart A
Figure H.56 Beam End A9-S Flexural Test Results Summary Chart B

207
Figure H.57 Beam End A9-S Failure
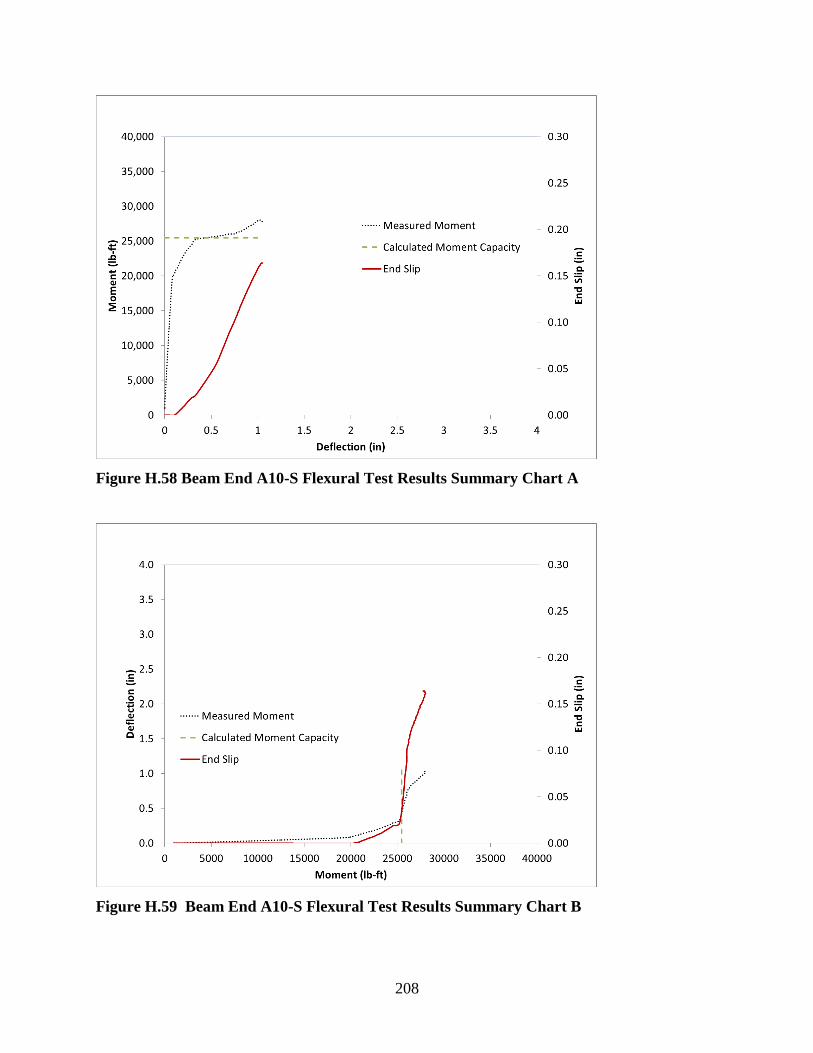
208
Figure H.58 Beam End A10-S Flexural Test Results Summary Chart A
Figure H.59 Beam End A10-S Flexural Test Results Summary Chart B

209
Figure H.60 Beam End G1-L Flexural Test Results Summary Chart A
Figure H.61 Beam End G1-L Flexural Test Results Summary Chart B

210
Figure H.62 Beam End G1-L Failure

211
Figure H.63 Beam End G2-L Flexural Test Results Summary Chart A
Figure H.64 Beam End G2-L Flexural Test Results Summary Chart B
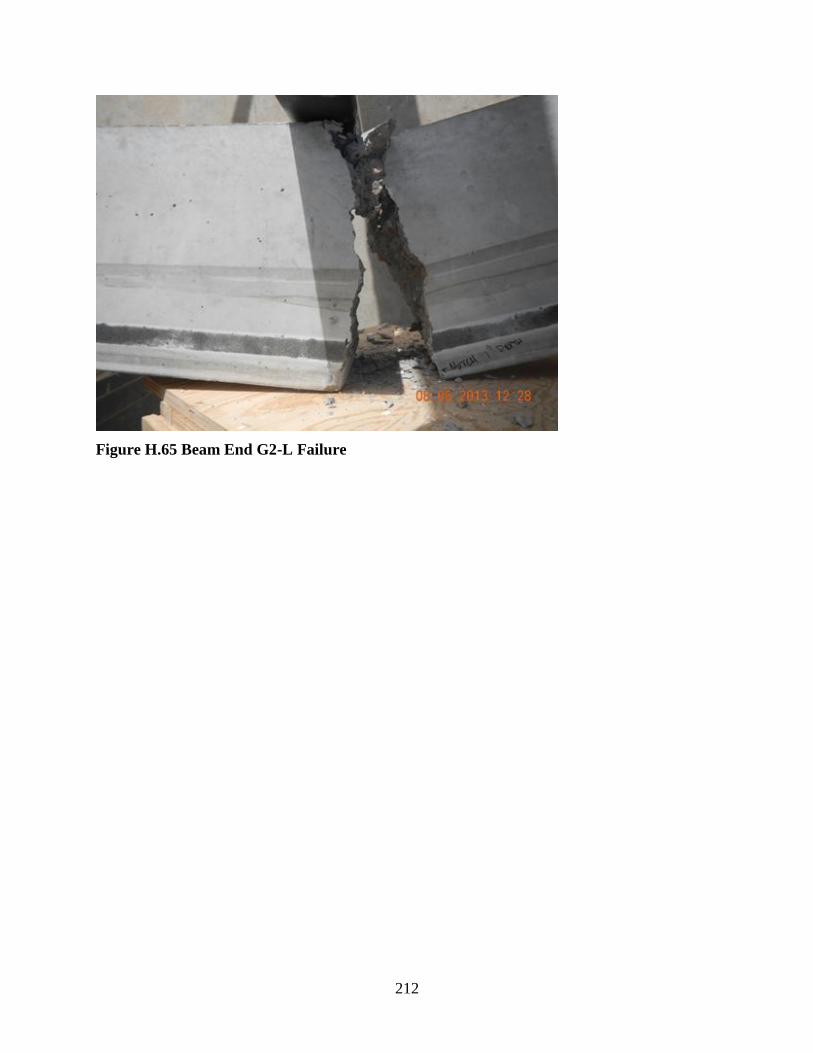
212
Figure H.65 Beam End G2-L Failure

213
Figure H.66 Beam End G3-L Flexural Test Results Summary Chart A
Figure H.67 Beam End G3-L Flexural Test Results Summary Chart B

214
Figure H.68 Beam End G3-L Failure

215
Figure H.69 Beam End G4-L Flexural Test Results Summary Chart A
Figure H.70 Beam End G4-L Flexural Test Results Summary Chart B

216
Figure H.71 Beam End G4-L Failure

217
Figure H.72 Beam End G5-L Flexural Test Results Summary Chart A
Figure H.73 Beam End G5-L Flexural Test Results Summary Chart B

218
Figure H.74 Beam End G5-L Failure

219
Figure H.75 Beam End G6-L Flexural Test Results Summary Chart A
Figure H.76 Beam End G6-L Flexural Test Results Summary Chart B

220
Figure H.77 Beam End G6-L Failure

221
Figure H.78 Beam End G7-L Flexural Test Results Summary Chart A
Figure H.79 Beam End G7-L Flexural Test Results Summary Chart B

222
Figure H.80 Beam End G7-L Failure

223
Figure H.81 Beam End G8-L Flexural Test Results Summary Chart A
Figure H.82 Beam End G8-L Flexural Test Results Summary Chart B

224
Figure H.83 Beam End G8-L Failure

225
Figure H.84 Beam End G9-L Flexural Test Results Summary Chart A
Figure H.85 Beam End G9-L Flexural Test Results Summary Chart B

226
Figure H.86 Beam End G9-L Failure

227
Figure H.87 Beam End G10-L Flexural Test Results Summary Chart A
Figure H.88 Beam End G10-L Flexural Test Results Summary Chart B
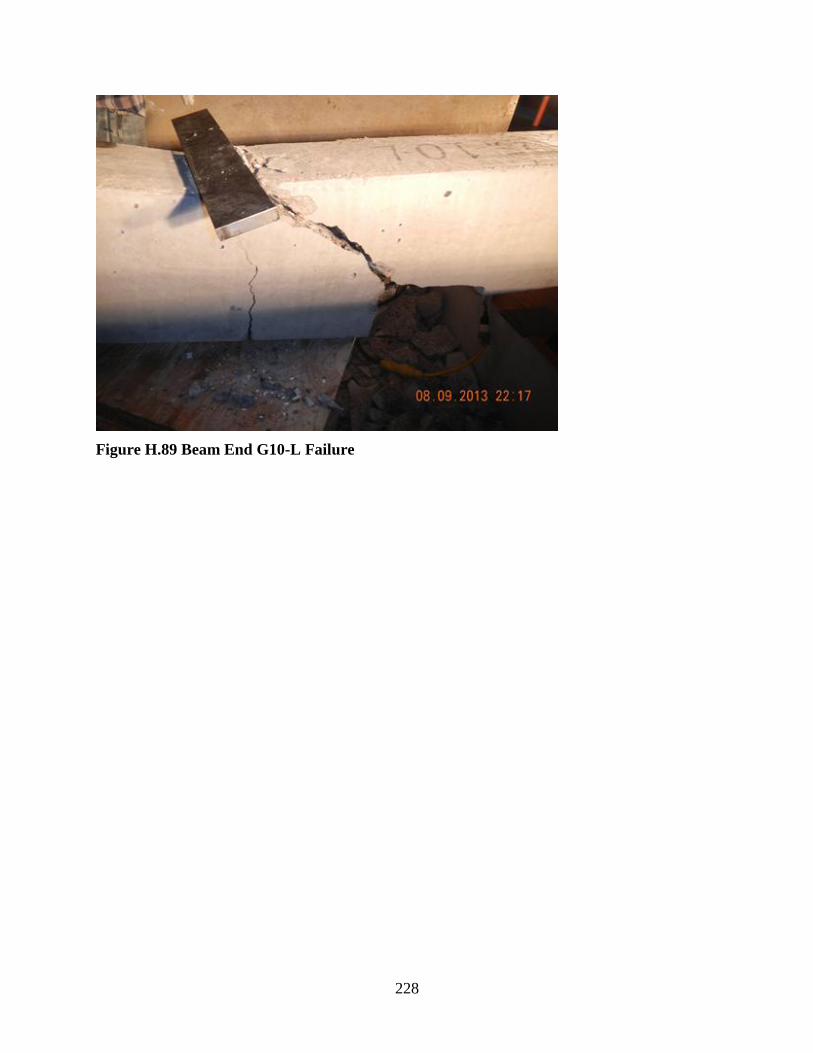
228
Figure H.89 Beam End G10-L Failure

229
Figure H.90 Beam End G1-S Flexural Test Results Summary Chart A
Figure H.91 Beam End G1-S Flexural Test Results Summary Chart B

230
Figure H.92 Beam End G1-S Failure

231
Figure H.93 Beam End G2-S Flexural Test Results Summary Chart A
Figure H.94 Beam End G2-S Flexural Test Results Summary Chart B

232
Figure H.95 Beam End G2-S Failure

233
Figure H.96 Beam End G3-S Flexural Test Results Summary Chart A
Figure H.97 Beam End G3-S Flexural Test Results Summary Chart B

234
Figure H.98 Beam End G3-S Failure

235
Figure H.99 Beam End G4-S Flexural Test Results Summary Chart A
Figure H.100 Beam End G4-S Flexural Test Results Summary Chart B

236
Figure H.101 Beam End G4-S Failure

237
Figure H.102 Beam End G5-S Flexural Test Results Summary Chart A
Figure H.103 Beam End G5-S Flexural Test Results Summary Chart B
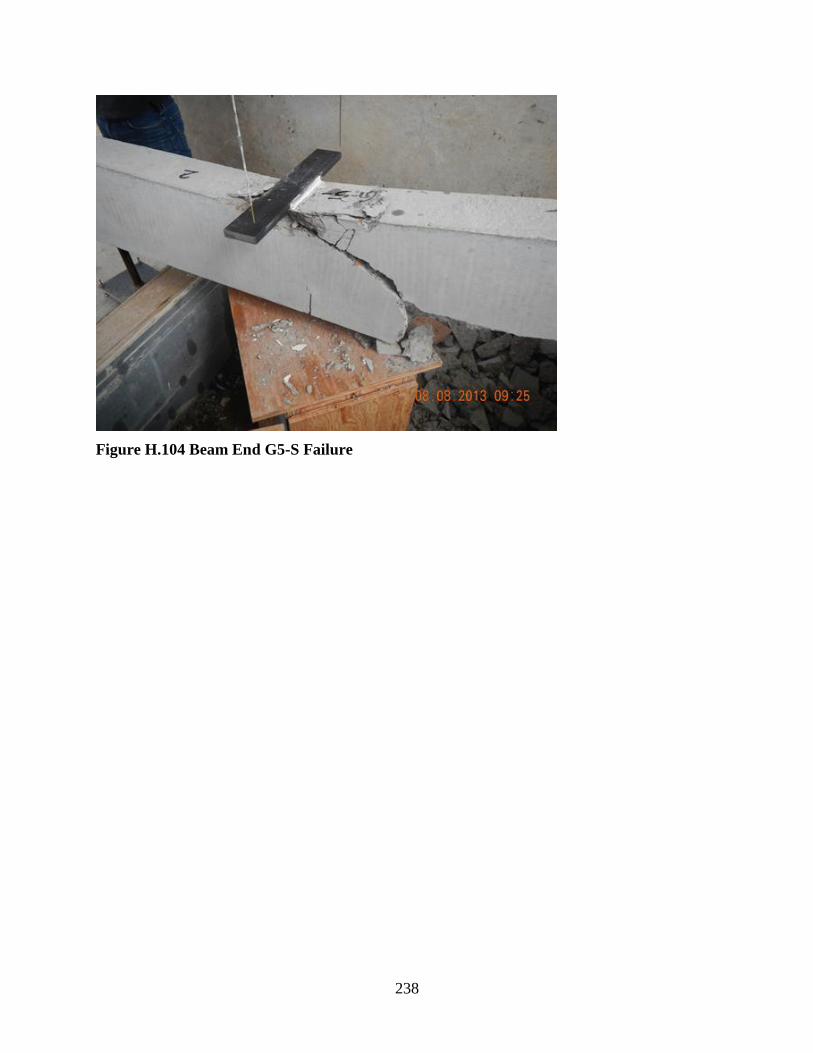
238
Figure H.104 Beam End G5-S Failure
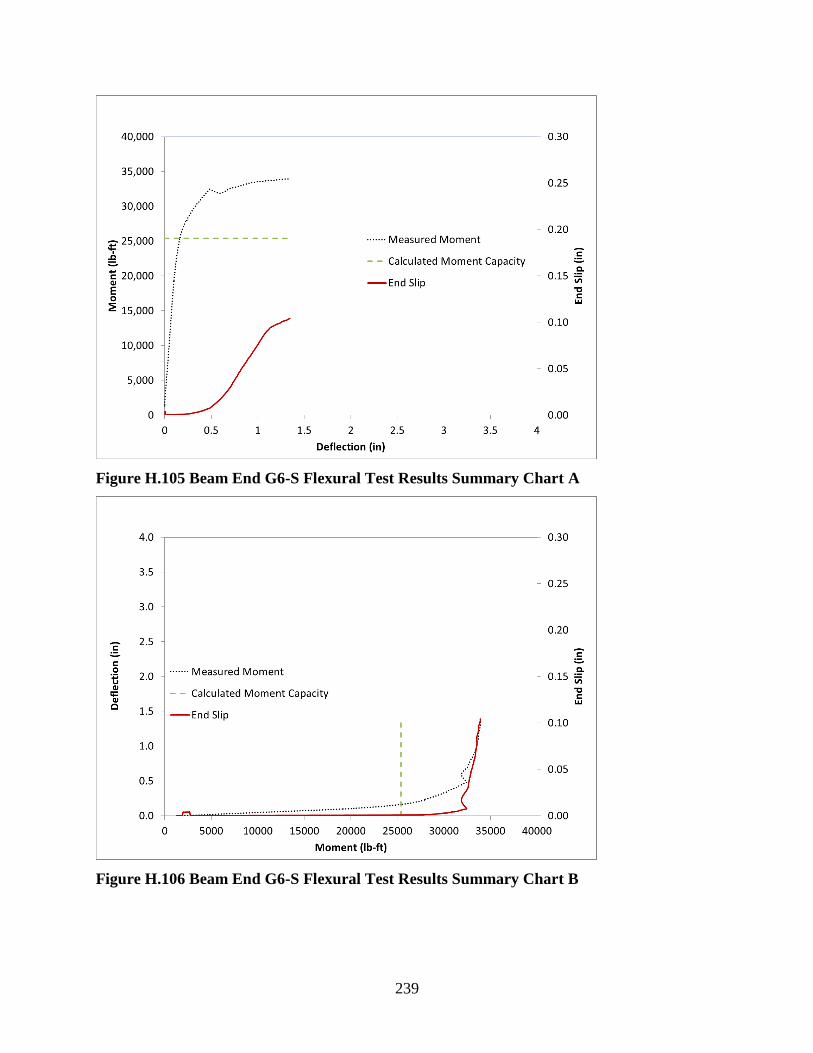
239
Figure H.105 Beam End G6-S Flexural Test Results Summary Chart A
Figure H.106 Beam End G6-S Flexural Test Results Summary Chart B

240
Figure H.107 Beam End G6-S Failure

241
Figure H.108 Beam End G7-S Flexural Test Results Summary Chart A
Figure H.109 Beam End G7-S Flexural Test Results Summary Chart B

242
Figure H.110 Beam End G7-S Failure

243
Figure H.111 Beam End G8-S Flexural Test Results Summary Chart A
Figure H.112 Beam End G8-S Flexural Test Results Summary Chart B

244
Figure H.113 Beam End G8-S Failure

245
Figure H.114 Beam End G9-S Flexural Test Results Summary Chart A
Figure H.115 Beam End G9-S Flexural Test Results Summary Chart B

246
Figure H.116 Beam End G9-S Failure
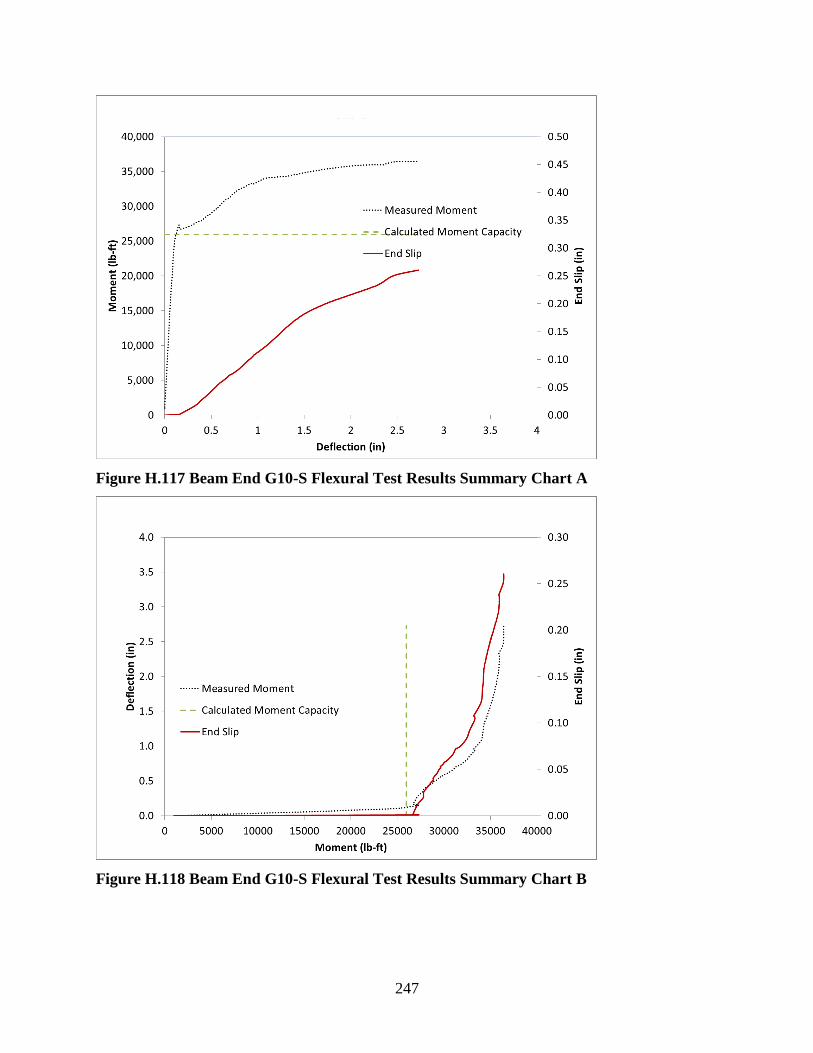
247
Figure H.117 Beam End G10-S Flexural Test Results Summary Chart A
Figure H.118 Beam End G10-S Flexural Test Results Summary Chart B
perso
nal
stuff
may
2013
presen
tation
Share
With
Fello
w
Grad
Stude
nts
speci
men.d
at
weddi
ngper
sonal

248
Figure H.119 Beam End G10-S Failure

249
Figure H.120 Beam End I1-L Flexural Test Results Summary Chart A
Figure H.121 Beam End I1-L Flexural Test Results Summary Chart B

250
Figure H.122 Beam End I1-L Failure

251
Figure H.123 Beam End I2-L Flexural Test Results Summary Chart A
Figure H.124 Beam End I2-L Flexural Test Results Summary Chart B

252
Figure H.125 Beam End I2-L Failure

253
Figure H.126 Beam End I3-L Flexural Test Results Summary Chart A
Figure H.127 Beam End I3-L Flexural Test Results Summary Chart B

254
Figure H.128 Beam End I3-L Failure

255
Figure H.129 Beam End I4-L Flexural Test Results Summary Chart A
Figure H.130 Beam End I4-L Flexural Test Results Summary Chart B

256
Figure H.131 Beam End I4-L Failure

257
Figure H.132 Beam End I5-L Flexural Test Results Summary Chart A
Figure H.133 Beam End I5-L Flexural Test Results Summary Chart B

258
Figure H.134 Beam End I5-L Failure

259
Figure H.135 Beam End I6-L Flexural Test Results Summary Chart A
Figure H.136 Beam End I6-L Flexural Test Results Summary Chart B
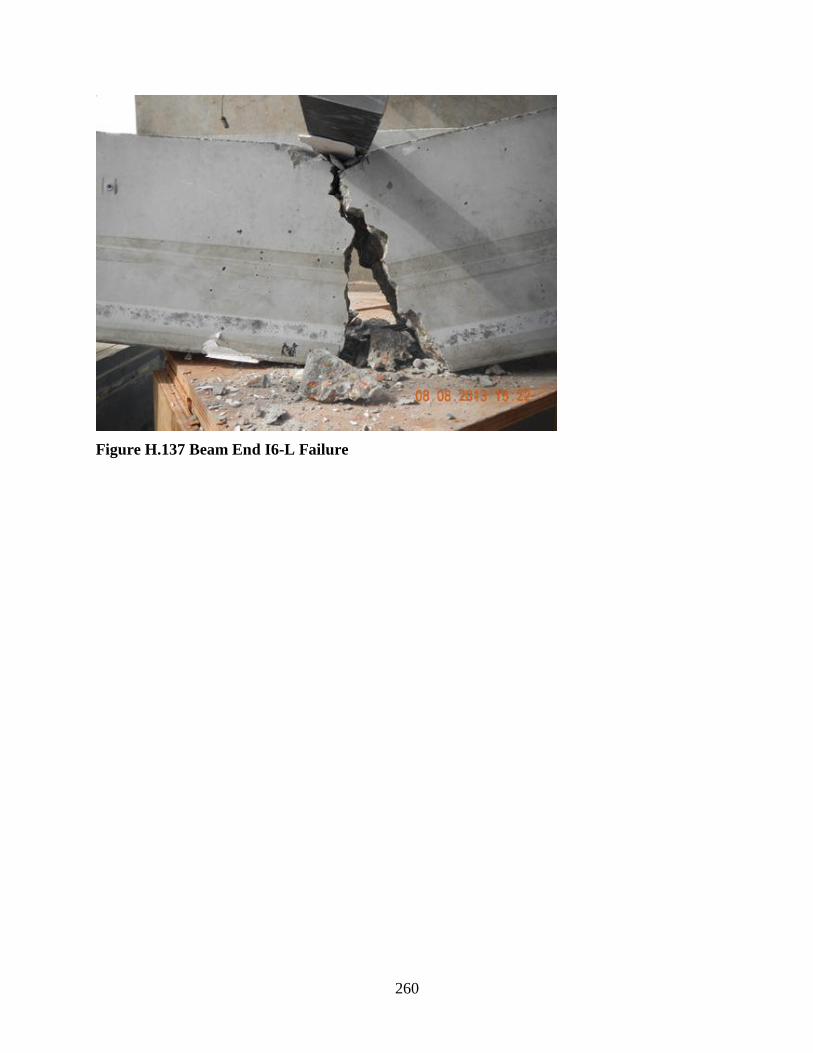
260
Figure H.137 Beam End I6-L Failure

261
Figure H.138 Beam End I7-L Flexural Test Results Summary Chart A
Figure H.139 Beam End I7-L Flexural Test Results Summary Chart B
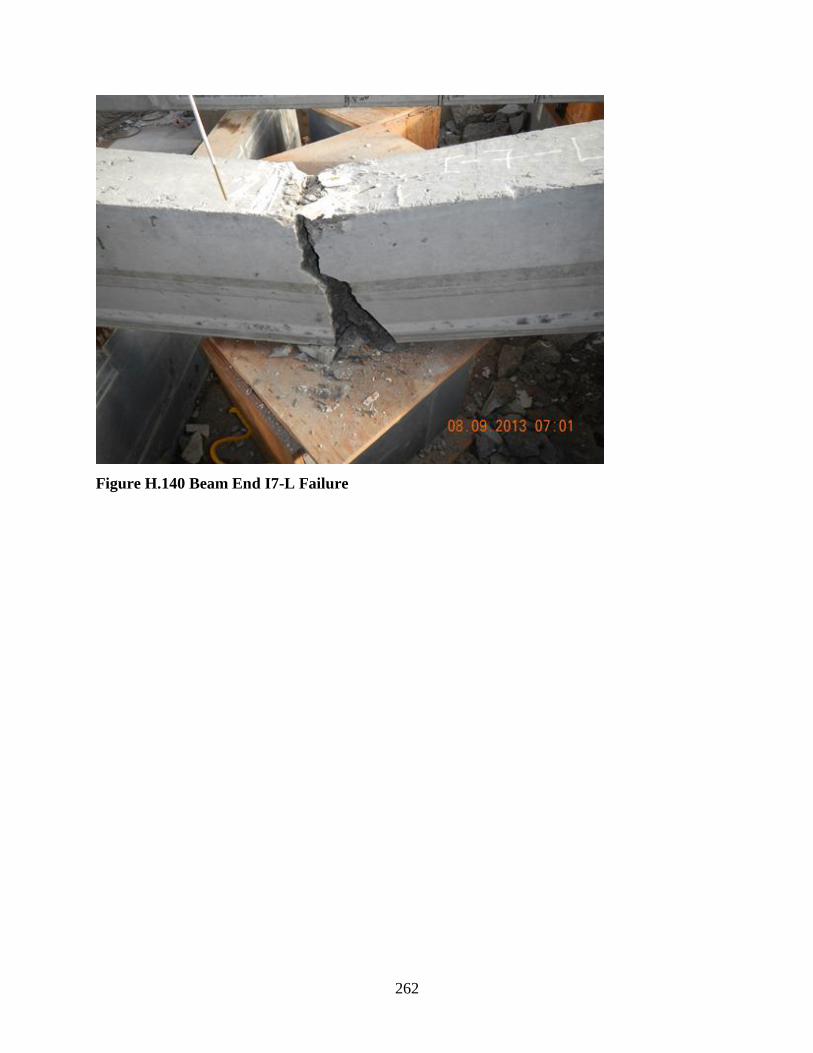
262
Figure H.140 Beam End I7-L Failure

263
Figure H.141 Beam End I8-L Flexural Test Results Summary Chart A
Figure H.142 Beam End I8-L Flexural Test Results Summary Chart B

264
Figure H.143 Beam End I8-L Failure

265
Figure H.144 Beam End I9-L Flexural Test Results Summary Chart A
Figure H.145 Beam End I9-L Flexural Test Results Summary Chart B
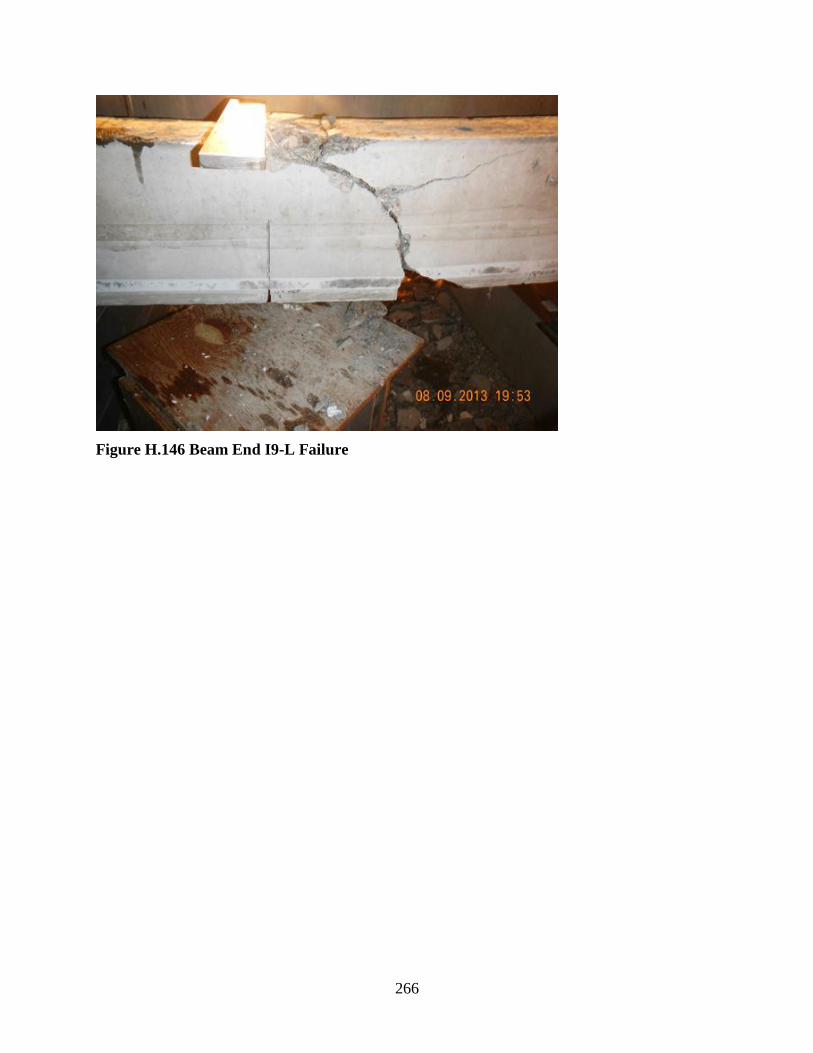
266
Figure H.146 Beam End I9-L Failure
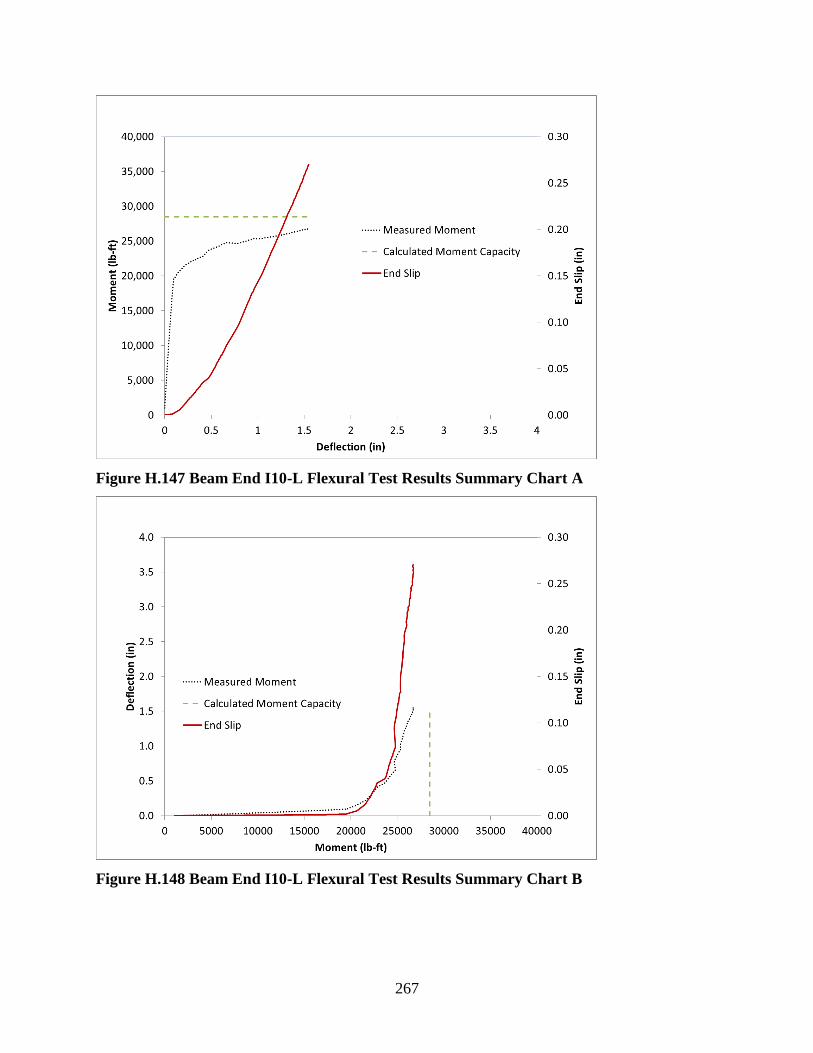
267
Figure H.147 Beam End I10-L Flexural Test Results Summary Chart A
Figure H.148 Beam End I10-L Flexural Test Results Summary Chart B

268
Figure H.149 Beam End I10-L Failure

269
Figure H.150 Beam End I1-S Flexural Test Results Summary Chart A
Figure H.151 Beam End I1-S Flexural Test Results Summary Chart B
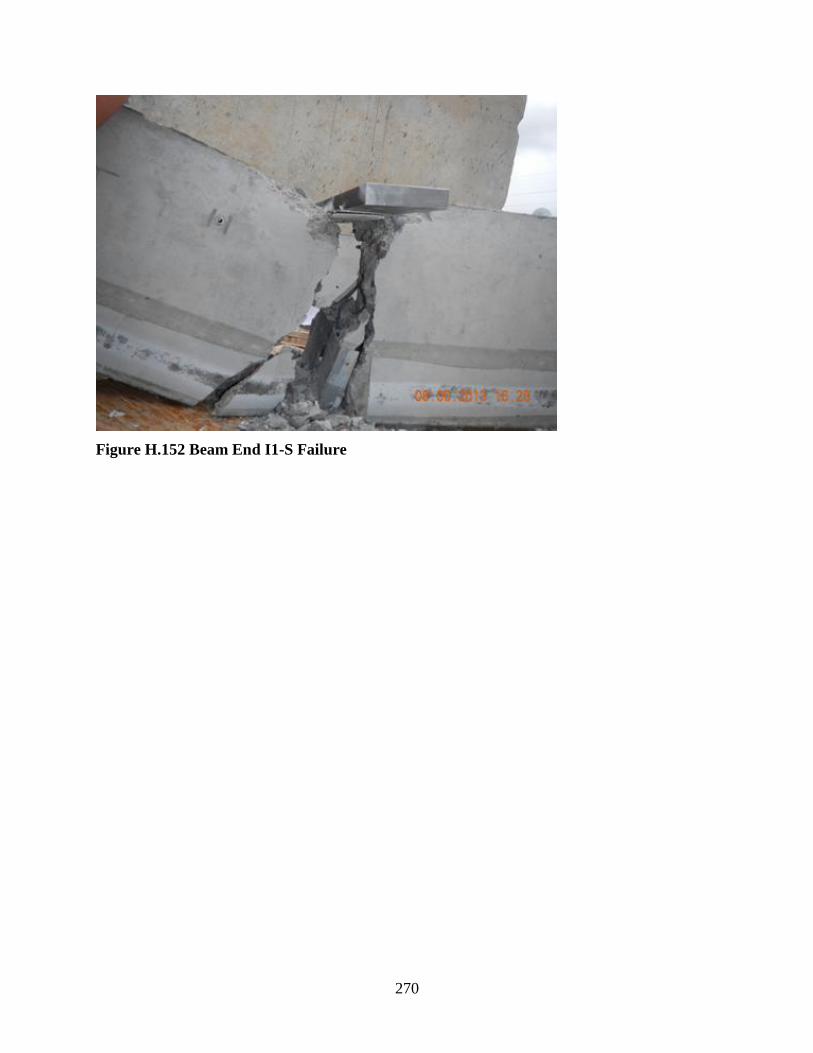
270
Figure H.152 Beam End I1-S Failure

271
Figure H.153 Beam End I2-S Flexural Test Results Summary Chart A
Figure H.154 Beam End I2-S Flexural Test Results Summary Chart B

272
Figure H.155 Beam End I2-S Failure
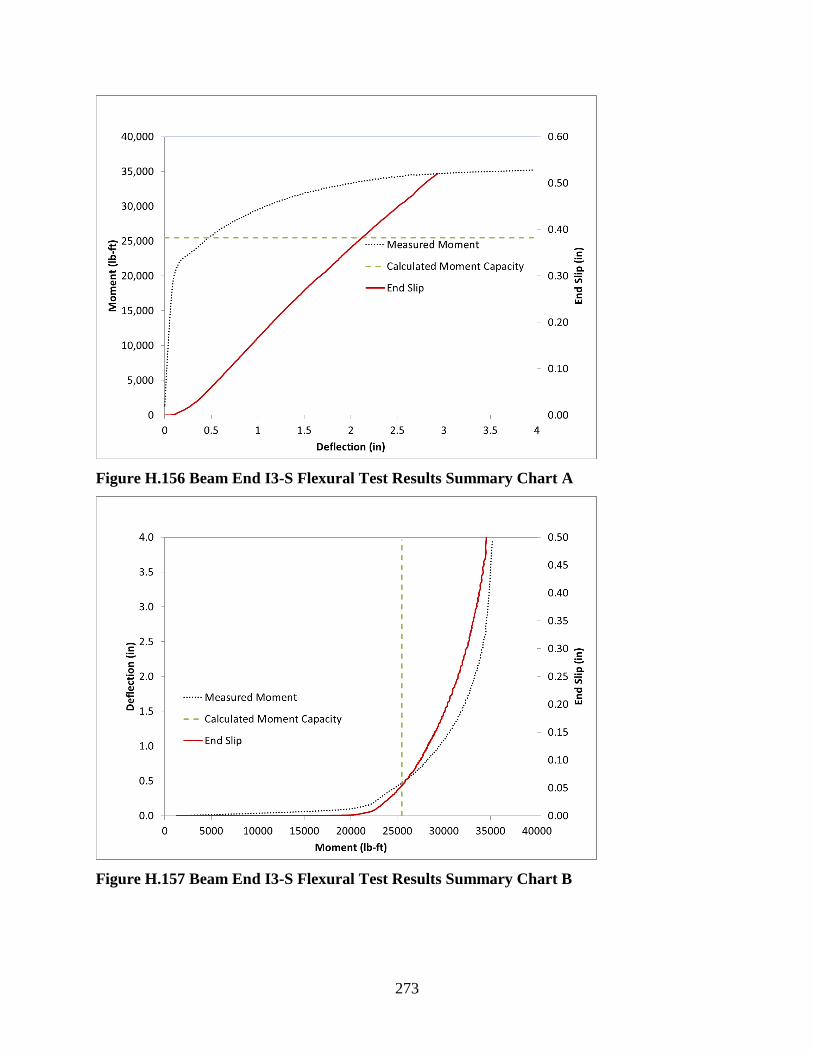
273
Figure H.156 Beam End I3-S Flexural Test Results Summary Chart A
Figure H.157 Beam End I3-S Flexural Test Results Summary Chart B
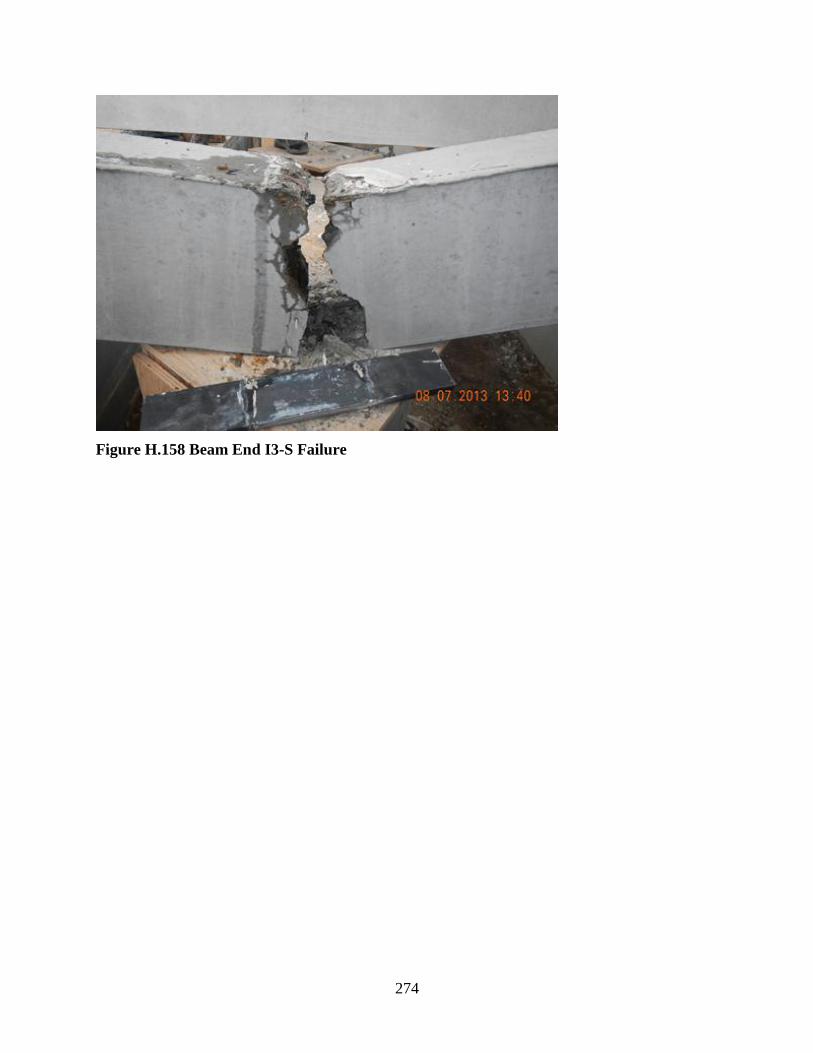
274
Figure H.158 Beam End I3-S Failure

275
Figure H.159 Beam End I4-S Flexural Test Results Summary Chart A
Figure H.160 Beam End I4-S Flexural Test Results Summary Chart B

276
Figure H.161 Beam End I4-S Failure

277
Figure H.162 Beam End I5-S Flexural Test Results Summary Chart A
Figure H.163 Beam End I5-S Flexural Test Results Summary Chart B

278
Figure H.164 Beam End I5-S Failure

279
Figure H.165 Beam End I6-S Flexural Test Results Summary Chart A
Figure H.166 Beam End I5-S Flexural Test Results Summary Chart B

280
Figure H.167 Beam End I5-S Failure

281
Figure H.168 Beam End I7-S Flexural Test Results Summary Chart A
Figure H.169 Beam End I7-S Flexural Test Results Summary Chart B

282
Figure H.170 Beam End I7-S Failure

283
Figure H.171 Beam End I8-S Flexural Test Results Summary Chart A
Figure H.172 Beam End I8-S Flexural Test Results Summary Chart B

284
Figure H.173 Beam End I8-S Failure

285
Figure H.174 Beam End I9-S Flexural Test Results Summary Chart A
Figure H.175 Beam End I9-S Flexural Test Results Summary Chart B

286
Figure H.176 Beam End I9-S Failure

287
Figure H.177 Beam End I10-S Flexural Test Results Summary Chart A
Figure H.178 Beam End I10-S Flexural Test Results Summary Chart B

288
Figure H.179 Beam End I10-S Failure

289
Simple Quality Assurance Test for Strand Bond
Summary Charts
Figure I.1 Simple Quality Assurance Test for Strand Bond Specimen A1 Summary Chart

290
Figure I.2 Simple Quality Assurance Test for Strand Bond Specimen A2 Summary Chart

291
Figure I.3 Simple Quality Assurance Test for Strand Bond Specimen A3 Summary Chart

292
Figure I.4 Simple Quality Assurance Test for Strand Bond Specimen G1 Summary Chart

293
Figure I.5 Simple Quality Assurance Test for Strand Bond Specimen G2 Summary Chart

294
Figure I.6 Simple Quality Assurance Test for Strand Bond Specimen G3 Summary Chart

295
Figure I.7 Simple Quality Assurance Test for Strand Bond Specimen I1 Summary Chart

296
Figure I.8 Simple Quality Assurance Test for Strand Bond Specimen I2 Summary Chart

297
Figure I.9 Simple Quality Assurance Test for Strand Bond Specimen I3 Summary Chart