Embed Size (px)
Citation preview

Seediscussions,stats,andauthorprofilesforthispublicationat:https://www.researchgate.net/publication/47810734
DeterminationofnaproxenusingDBS:Evaluation&pharmacokineticcomparisonofhumanplasmaversushumanbloodDBS
ARTICLEinBIOANALYSIS·AUGUST2010
ImpactFactor:3·DOI:10.4155/bio.10.51·Source:PubMed
CITATIONS
15
READS
115
11AUTHORS,INCLUDING:
NikolayYouhnovski
AlgorithmePharma
21PUBLICATIONS684CITATIONS
SEEPROFILE
Jean-NicholasMess
AlgorithmePharma
15PUBLICATIONS272CITATIONS
SEEPROFILE
MiltonFurtado
AlgorithmePharma
24PUBLICATIONS251CITATIONS
SEEPROFILE
Availablefrom:NikolayYouhnovski
Retrievedon:05February2016

1501ISSN 1757-6180Bioanalysis (2010) 2(8), 1501–151310.4155/BIO.10.51 © 2010 Future Science Ltd
Dried blood spots (DBS) sampling technique is well established and widely used for DNA ana lysis and screening of newborn metabolic disorders [1]. The DBS technique has been used successfully in neonatal screening for metabolic defects such as phenylketonuria, for which normal and abnormal results are significantly different [2]. In recent years, the DBS sam‑pling technique raised the interest of the scien‑tific community for application in therapeutic drug monitoring, pharmacokinetic (PK) and bioavailability s tudies [3–5]. The advantages of DBS are: nCollection of small blood volumes (10–40 µl);
nLower storage and transport costs compared with plasma samples and safer sample han‑dling due to filter paper pretreatment, which lyses cell m embranes;
nDenatures proteins;
nInactivates enzymes and all pathogens such as bacteria and viruses.
In addition, for preclinical studies, the num‑ber of animals could be reduced as no satellite group would be required. For clinical studies, the lower volume of blood collected would cer‑tainly facilitate the recruitment of patients or healthy volunteers mainly in trials where PK assessment is the main objective. A number of validated methods for quantitative ana lysis of pharmaceutical compounds using the DBS
technique have been published [6–15]. However, only a limited number of the published articles describe complete clinical procedures, analyti‑cal validation with parallel ana lysis of the same incurred samples as well as comparison and cor‑relation of the data obtained from DBS and con‑ventional analytical methods utilizing plasma or whole blood. Furthermore, from the published literature, minimal data on the PK profile and/or limited number of subjects are available.
In this study, we describe the analytical vali‑dation of two LC–MS/MS methods for quan‑tification of naproxen using DBS and plasma protein precipitation techniques. Furthermore, a comparison of the PK profiles from four sub‑jects obtained after single dose administration of naproxen sodium 440 mg generated from DBS and plasma samples using LC–MS/MS methods is reported.
Experimentaln Chemicals, reagents & materials
Naproxen (chemical purity 99.9%) was purchased from USP. Naproxen‑D3 (Internal standard [IS], isotopic purity 99.0%) and naproxen acylgluc-uronide (chemical purity 99.4%) were supplied by Toronto Research Chemicals (Canada), and Nanjing Jinglong PharmaTech Inc. (China), respectively (Figure 1). Methanol (MeOH) and propionic acid were supplied by Fisher Scientific, UK. Human plasma and human whole blood con‑taining K
2EDTA as anticoagulant were obtained
Determination of naproxen using DBS: evaluation & pharmacokinetic comparison of human plasma versus human blood DBS
Background: Dried blood spots (DBS) sampling is a well-known technology for qualitative determination such as DNA analysis and screening of newborn metabolic disorders. The scientific community has recently expressed interest in applying the DBS technique for quantitative determination of drugs in biological fluid. Results: Two new bioanalytical assays were developed and validated for the determination of naproxen in human plasma and in DBS samples using liquid chromatography coupled with tandem MS. Furthermore, plasma and DBS clinical samples were collected from four subjects enrolled as part of a bioequivalence study. Concentration data for plasma and DBS samples were determined and pharmacokinetic (PK) profiles in plasma and in DBS samples were compared. Conclusions: A strong correlation between PK data obtained by the DBS and conventional plasma method was observed, which makes DBS a valuable technique for further naproxen bioavailability and PK investigations and studies.
Nikolay Youhnovski1,Josée Michon1, Sylvain Latour1,Jean-Nicholas Mess1, Annik Bergeron1, Milton Furtado1,Marianne Rufiange1, Pascal Guibord1, Marc Lefebvre1, Robert B MacArthur2 & Fabio Garofolo†1
1Algorithme Pharma Inc., 575 Armand-Frappier, Laval, Quebec, H7V 4B3, Canada 2Clinical Horizons Research, Inc., 296 Engle Street, Tenafly, NJ 07670, USA †Author for correspondence:Tel.: +1 450 973 6077 Ext. 2301 Fax: +1 450 973 2446 E-mail: [email protected]
Special FocuS: DrieD BlooD SpotS
reSearch article
For reprint orders, please contact [email protected]

O
OH
COOH
OH
O
OO
OO
HO
OH
OH
OO
Naproxen
Naproxen-D3
Naproxen acylglucuronide
CH3
CD3
reSearch article | Youhnovski, Michon, Latour et al.
Bioanalysis (2010) 2(8)1502 future science group
from Biological Specialty Corporation (PA, USA) and water was dispensed in‑house by a Millipore water distribution system. Harris punch (3 mm), cutting mat, Whatman® FTA Classic Card and Whatman DMPK B Cards were purchased from Whatman (GE Healthcare). Vacutainers (6 ml) containing K
2EDTA were supplied by Becton
Dickinson Diagnostic (NJ, USA), and desicca‑tors were provided by VWR International Ltd (Leicestershire, UK).
n Solutions preparation Naproxen stock and intermediate solutions at con‑centrations of 10, 1, 0.1 and 0.01 mg/ml were pre‑pared in MeOH. Naproxen‑D3 IS stock solution was prepared at a concentration of 100 µg/ml in MeOH and used to prepare the IS working solu‑tion (ISWS) for plasma and DBS methods at a concentration of 3 µg/ml and 0.30 µg/ml in MeOH, respectively. Naproxen acylglucuronide was dissolved in MeOH:H
2O 50:50 v/v at a con‑
centration of 1 mg/ml. All solutions were stored at the nominal temperature of 4°C.
n Preparation of calibration standards & quality control samplesThe human whole blood and human plasma, collected using K
2EDTA as anticoagulant,
were fortified at a nominal temperature of 4°C
by adding naproxen stock or intermediate solu‑tions. Calibration standards at concentrations of 0.50, 1, 2, 5, 15, 25, 40, 70, 85 and 100 µg/ml, and quality control (QC) samples at 0.50, 1.50, 20 and 75 µg/ml were prepared. A second set of QC samples was also prepared with naproxen and naproxen acylglucuronide for stability evaluations. The naproxen acylglucuronide was f ortified at a 1:1 molar p roportion of naproxen.
The plasma calibration and QC samples were aliquoted in polypropylene tubes and stored at ‑20°C. For DBS ana lysis, 20 µl from spiked whole blood calibration standards and QC samples were immediately applied on DBS cards. The cards were dried overnight and stored at room temperature in plastic bags.
n Incurred sample collection & preparationBlood samples were collected from four differ‑ent subjects randomly selected from Algorithme Pharma Inc. during a clinical trial sponsored by Pharmaceutics International Inc., (MD, USA). This trial was performed by plasma method on 26 male and female healthy subjects to evaluate the bioequivalence of naproxen sodium 220 mg liq‑uid gel capsules manufactured by Pharmaceutics International Inc. and naproxen sodium 220 mg liquid gel capsules (equivalent to 200 mg naproxen) from Bayer Health Care following a 440 mg oral dose under fasting conditions.
Incurred sample reproducibility Incurred sample reproducibility (ISR) was performed separately using plasma as well as the DBS method on the selected four sub‑jects at all collected timepoints (0.25, 0.5, 0.67, 0.83, 1, 1.25, 1.5, 2, 2.5, 3, 4, 6 and 8 h post‑drug administration).
Naproxen plasma samplesThe blood samples were collected into K
2EDTA
vacutainers prior to and 0.25, 0.5, 0.67, 0.83, 1, 1.25, 1.5, 2, 2.5, 3, 4, 6 and 8 h after drug admin‑istration. Blood was centrifuged at 1500 × g for 10 min at the nominal temperature of 4°C to sep‑arate the plasma from cells. The plasma samples were stored at ‑20°C until ana lysis. The human plasma samples of naproxen were extracted according to the procedure outlined below in the section titled ‘Sample preparation’.
Naproxen DBS samplesPrior to the centrifugation of previously described samples, an aliquot of 20 µl of whole blood samples was applied onto DBS FTA Classic Card.
Key Terms
Dried blood spots: Technique where an amount of blood is aliquotted to a filter paper and used for qualitative or quantitative determination.
Pharmacokinetic (PK): Study of the absorption, distribution, metabolism and elimination of drugs.
Quantification or Quantitation: Measuring the quantity of a compound.
Validation: Evaluation of different parameters to perform before ana lysis of samples for a new analytical method.
Naproxen: Anti-inflammatory agent with analgesic and antipyretic properties. Used in the treatment of rheumatoid arthritis and other rheumatic or musculoskeletal disorders, dysmenorrhea, and acute gout.
Naproxen glucuronide or naproxen acylglucuronide: Metabolite of naproxen.
Figure 1. Naproxen, naproxen-D3 and naproxen acylglucuronide.

Determination of naproxen using DBS | reSearch article
www.future-science.com 1503future science group
The cards were dried overnight on an open non‑absorbent surface at room temperature and stored at room temperature in plastic bags. All standard calibration samples used for stabilities of naproxen and naproxen acylglucuronide evaluations were freshly prepared and extracted immediately after drying for approximately 3 h, without additional storage. For some experiments, as indicated and described in ‘Recovery & matrix effect compari‑son: classic card versus DMPK‑B cards’, DMPK‑B cards were used. For all other experiments, FTA Classic Cards were used.
n Sample preparation Plasma extraction methodAn aliquot of 50 µl of human plasma was fortified with 250 µl of naproxen‑D3 ISWS at a concentra‑tion of 3 µg/ml prepared in MeOH. The samples were mixed for 5 s to precipitate the plasma pro‑teins. Tubes were centrifuged at 10,000 × g and 50 µl of the supernatant were transferred to a clean 96‑well plate containing 250 µl of MeOH:H
2O
50:50 v/v. After vortexing, the samples were kept at 4°C until the injection.
DBS method extractionA 3‑mm disk was punched out of the DBS cards with a Harris UNICORE™ device and was for‑tified with 150 µl of naproxen‑D3 ISWS at a concentration of 0.3 µg/ml prepared in MeOH. The tubes were vortexed and left for 1 h at room temperature. Next, 150 µl of type 1 water was added to each sample. The tubes were vortexed and the supernatant was transferred into a 96‑well plate and kept at 4°C until the injection.
n Chromatographic conditionsAll analyses were performed using Agilent Technologies HPLC system Series 1100 binary pump, column heater and autosampler, operated at 4°C. The chromatographic separations were per‑formed using a Waters XBridge™ C18 column, 3.5 µm (30 × 2.1 mm) at a temperature of 35°C.
Plasma method chromatographic conditionsFor the plasma method, reversed‑phase chro‑matography using isocratic mode with MeOH and 0.1% propionic acid (60:40 v/v) as mobile phase at a flow rate of 0.6 ml/min was used over 1.25 min (HPLC Program 1).
DBS method chromatographic conditionsReversed‑phase chromatography with mobile phase A 0.1% propionic acid and mobile phase B MeOH, using a gradient (0.0–0.3 min: 50%
A, 0.3–2.0 min: 40–50% A linear, 2–3 min: 40% A, 3.1–4.5 min: 50% A) at constant flow rate of 0.6 ml/min was used (HPLC Program 2) for the DBS method.
n Detection conditionsApplied Biosystems/MDS Sciex API3000™ Triple‑Quadrupole Mass Spectrometer (Toronto, Canada) equipped with the TurboIonSpray source operated in negative ion mode at a volt‑age of ‑2000 V was used. Other MS parameters were: declustering potential: ‑20.00 eV, colli‑sion exit potential: ‑10.00 eV, collision energy: ‑23.00 eV, focusing potential: ‑100.00 eV and exit potential: ‑4.00 eV. The source was set at a temperature of 550°C. Multiple reaction moni‑toring (MRM) mode was used with the mass transitions for naproxen and naproxen‑D3 (IS) of 229.09→170.10 m/z and 232.11→173.00 m/z, respectively. For detection of naproxen acylgluc‑uronide, a transition of 405.10→170.00 was used. Dwell time was set at 100 ms for all transitions.
n Hematocrit determinationThe hematocrit values were measured with COULTER® LH 780 Hematology Analyzer (Beckman‑Coulter, Mississauga, [ON, Canada]). The hematocrit determinations were performed for all subjects before the study.
n Blood spots area determinationMethod 1: The DBS surface area was calculated from the average of 10 DBS (FTA Classic Card) diameters measured with precise instrument (±0.1 mm). The average DBS on FTA Classic Card was estimated to be 7.42 mm. To ensure that the DBS diameters were properly measured, a second method was used. Method 2: 10 DBS were carefully excised by scissors and weighed on an analytical balance. The average was cal‑culated (% coefficient of variation [CV] = 4.8). Ten of the 3‑mm punches were also individually weighed on an analytical balance. The average was calculated (% CV = 1.2). The average sur‑face of the DBS was then back calculated and was estimated to be 7.29 mm. The difference between the results, obtained by the described two methods, was less than 5%.
Results & discussionAnalytical method validations for quantification of naproxen in human plasma and DBS were per‑formed according to Algorithme Pharma stand‑ard operating procedures (SOP) and according to guidelines from regulatory agencies.
Key Term
Hematocrit: Proportion of blood volume that is occupied by red blood cells. It is normally approximately 48% for men and 38% for women.

reSearch article | Youhnovski, Michon, Latour et al.
Bioanalysis (2010) 2(8)1504 future science group
n Internal standardIn order to minimize the variations induced during the extraction and injection process and from potential matrix effect on the naproxen quantification, a stable isotopically labeled IS, naproxen‑D3, was used for plasma method. This compound has similar physicochemical properties as the analyte, which lead to close chromatographic and ionization behavior. These characteristics minimize the variations coming from sample preparation, extraction and/or matrix effect [16,17]. Since the used DBS extrac‑tion procedure does not allow the use of IS, the naproxen‑D3 was used as an external standard, which compensates the influence of the co‑elut‑ing signal suppressors or enhancers coming from the matrix and/or DBS card.
n Chromatography The representative chromatograms of blank, LLOQ (0.50 µg/ml) and ULQ (100.00 µg/ml) samples obtained using the plasma (Figure 2a–c) and DBS (Figure 2D–F) methods are presented in Figure 2. The naproxen retention time dif‑ferences result from the use of two different HPLC mobile phase compositions used to sep‑arate the different suppressors extracted from plasma (HPLC Program 1) and DBS (HPLC Program 2). This gradient program (HPLC Program 2) was used to avoid the suppressors coming from the matrix or the DBS card at the retention time of naproxen. Both the blank samples (Figure 2a & D) were clean from interfer‑ence and the signal‑to‑noise ratio of the LLOQ samples were more than five (Figure 2B & e).
n Linearity & regression type analysisPeak area ratios of naproxen/IS were plotted ver‑sus their corresponding human plasma concentra‑tions. The linearity of the calibration curve over a range of 0.5 to 100.0 µg/ml was determined by a weighted (1/x2) linear least squares regression for naproxen in the human plasma and DBS assays:
y mx b= +equation 1
n SelectivityThe selectivity for plasma and DBS methods was evaluated using blank matrix from ten different human plasma lots and six different human whole blood lots, respectively. These samples were processed according to previ‑ously described methods with addition of the IS (plasma method) and external standard (DBS
method). All plasma and whole blood lots were found to be free of significant interference at the mass transition and retention times of naproxen (<20% of LLOQ) and naproxen‑D3 (<5% of IS response). The maximal interference at the analyte mass transition and retention time rep‑resents 5.3% and 1.6% of the LLOQ peak area for the plasma and DBS methods, respectively.
n Selectivity in presence of concomitantly administered compoundsThe evaluation of potential interference from concomitant medication/active ingredients was performed. The interference from the following compounds due to their ubiquity were investi‑gated with plasma and DBS assays: acetamino‑phen, acetylsalicylic acid/salicylic acid, caffeine, chlorpheniramine dextromethorphan, dimenhy‑drinate, ibuprofen, nicotine/cotinine, phenira‑mine, phenylephrine, pseudoephedrine, diphen‑hydramine, ethinyl estradiol, etonogestrel, norelgestromin, norgestrel and norethindrone,
Blank samples were spiked with the individual concomitantly administered compound (CAC) solutions to give a final concentration in plasma and blood that would represent approximately twice the expected maximum concentration (C
max) usually observed from a typical dosage
strength administered. These samples were evaluated for interference at the naproxen and naproxen‑D3 mass transitions and retention times. Interference at the drug must not exceed 20% of the LLOQ for the analyte. Interference at the IS must not exceed 5.0% of the mean IS response. Low and high QC (QC1 and QC3) samples that were spiked with CAC solutions at the aforementioned concentrations were also extracted and evaluated to ensure no impact on the percent deviations (% dev). None of the CACs tested demonstrated a significant interference according to the above mentioned r equirements for both the plasma and DBS assays.
n Accuracy & precisionThe naproxen plasma and DBS intra‑ and interassay precision and accuracy were assessed using six replicates at four QC concentrations (i.e., 0.5, 1.5, 20.0 and 75.0 µg/ml) in three different batches. Concentrations were back‑calculated against a ten‑point calibration curve. Accuracy was assessed by calculating the %dev from the theoretical concentration and the result must be less than ±15% the nominal value (20% for the LLOQ) and precision was evaluated by calculating the %CV and must be less than ±15%

Blank200
100
00.2 0.6 0.8 1.00.4 1.2
Inte
nsi
ty (
cps)
100
50
00.5 1.0 1.5 2.0 2.5 3.0 3.5
Blank
4.0
Inte
nsi
ty (
cps)
LLOQ5000
3000
1000
0.2 0.4 0.6 0.8 1.0 1.2
Inte
nsi
ty (
cps)
0.59
0
1500
1000
500
0
0.5 1.0 1.5 2.0 2.5 3.0 3.5 4.0
LLOQ
Inte
nsi
ty (
cps)
1.31
ULQ8.0e5
6.0e5
4.0e5
2.0e5
0.0
0.2 0.4 0.6 0.8 1.0 1.2
Inte
nsi
ty (
cps)
Time (min)
0.59 2.0e5
1.0e5
0.0
0.5 1.0 1.5 2.0 2.5 3.0 3.5 4.0
LLOQ
Inte
nsi
ty (
cps)
Time (min)
1.32
Determination of naproxen using DBS | reSearch article
www.future-science.com 1505future science group
(20% for LLOQ) for each set of replicates. This comparison shows that both the DBS and plasma methods provide similar performance in terms of inter‑ and intra‑batch accuracy and precision (taBle 1).
n Matrix stabilityMatrix stabilities for the naproxen plasma assay and naproxen DBS assay were evaluated. For the plasma assay, short‑term, freeze–thaw and long‑term stabilities in plasma were evaluated. For the DBS assay, long‑term on‑card stability at room temperature was assessed. All stability evaluations were compared against a freshly
prepared calibration curve, after drying for approximately 3 h. Naproxen in plasma was proven to be stable at 4°C for 25 h, after three freeze–thaw cycles and for 48 days at ‑20°C. For the DBS assay, a long‑term on‑card stability was proven for 20 days at room temperature.
n Dilution integrityDilution of samples above the ULQ were prepared and evaluated as described before. Human blood was fortified with naproxen at 200 µg/ml (2 × ULQ) and six replicates of 20 µl were spotted onto FTA Classic Cards. After drying at room temperature overnight, a 3‑mm
Figure 2. Representative chromatograms of an extracted blank, LLOQ (0.50 µg/ml) and ULQ (100 µg/ml). Obtained by (A–C) plasma method and (D–F) dried blood spot method.

reSearch article | Youhnovski, Michon, Latour et al.
Bioanalysis (2010) 2(8)1506 future science group
diameter punch was taken from each spiked DBS sample. Each punch was individually extracted according to the extraction procedure with exter‑nal standard. A 50‑µl aliquot of each extracted sample was then diluted with 200 µl of pooled blank extracted diluent to give a final volume of 250 µl, representing fivefold dilution (40.00 µg/ml nominal). Diluent was prepared by individu‑ally extracting with external standard ten 3‑mm punches taken from blank human DBS spots on FTA Classic Cards. These extracted blanks were pooled together to be used as diluent.
Concentrations of naproxen in these individ‑ual extracted dilution samples were determined by LC–MS/MS. The mean of these six indi‑vidual determinations was 38.32 µg/ml, which represents 97.8% of nominal concentration with a standard deviation (SD) of 1.87 µg/ml and %CV of 4.8%.
n Recovery & matrix effect comparison: plasma versus DBS Classic Cards The recovery procedure used during this evalu‑ation permits the evaluation of influences on recovery, for example, extraction efficiency, absolute matrix effect and total recovery.
Extraction efficiency and total recovery for naproxen and naproxen‑D3 (IS) were calcu‑lated for plasma and DBS in six replicates at two concentrations (low 1.50 µg/ml and high 75.00 µg/ml). Resulting peak areas of naproxen and naproxen‑D3 (IS) after extraction from the plasma and DBS were compared with the peak areas of blank samples fortified after extraction with non‑extracted naproxen solution (extraction efficiency) representing 100% total recovery.
To assess the recovery from DBS samples, the blood amount corresponding to a 3‑mm punch disk was calculated by surface comparison to the total surface of DBS after application of 20 µl of blood and those of the 3‑mm punch. This value was estimated to be 3.27 µl of whole blood and it was used for the calculation of the 100% total recovery solution. The means of the extraction efficiencies obtained with the plasma method were over 95% for the both low QC and high QC levels whereas the values from the DBS method were 63.5–73.5%, as shown in taBle 2. This evaluation shows that naproxen was not completely extracted at the applied conditions and up to 37% remained bound to the filter paper or in the blood remains on the DBS cards.
Table 1. Summary of precision and accuracy results for naproxen plasma and dried blood spot methods.
Plasma DBS
Nominal naproxen concentrations (µg/ml)
QC LLOQ (0.50)
QC1 (1.50)
QC2 (20.00)
QC3 (75.00)
QCLOQ (0.50)
QC1 (1.50)
QC2 (20.00)
QC3 (75.00)
Intra-batch
Batch 1
Mean concentration (µg/ml) 0.466 1.431 19.924 71.307 0.51 1.69 21.20 75.33
SD (µg/ml) 0.032 0.118 0.470 3.555 0.01 0.07 0.74 2.30
Accuracy (% dev) -6.7 4.6 -4.0 -4.9 2.8 12.3 6.0 0.4
Precision (% CV) 6.9 8.3 2.4 5.0 2.5 3.9 3.5 3.1
Batch 2
Mean concentration (µg/ml) 0.482 1.614 21.198 78.124 0.49 1.49 21.34 74.33
SD (µg/ml) 0.028 0.030 0.654 1.045 0.02 0.05 0.61 1.46
Accuracy (% dev) -3.3 7.6 6.0 4.2 -2.2 -0.9 6.7 -0.9
Precision (% CV) 5.8 1.8 3.1 1.3 3.4 3.2 2.8 2.0
Batch 3
Mean concentration (µg/ml) 0.494 1.558 19.674 69.940 0.50 1.66 20.68 72.10
SD (µg/ml) 0.016 0.016 0.870 1.495 0.03 0.06 0.83 3.71
Accuracy (% dev) -1.3 3.8 -1.6 -6.7 0.4 11.0 3.4 -3.9
Precision (% CV) 3.2 1.0 4.4 2.1 5.3 3.4 4.0 5.1
Inter-batch
Mean concentration (µg/ml) 0.481 1.534 20.265 73.124 0.50 1.61 21.04 73.89
SD (µg/ml) 0.027 0.103 0.941 4.274 0.02 0.10 0.75 2.84
Accuracy (% dev) -3.9 2.3 1.3 2.5 -1.0 7.0 5.2 -1.5
Precision (% CV) 5.7 6.7 4.6 5.8 3.9 6.3 3.5 3.8CV: Coefficient of variation; QC: Quality control; SD: Standard deviation; % dev: Percentage deviation from nominal concentration.
Determination of naproxen using DBS | reSearch article
www.future-science.com 1507future science group
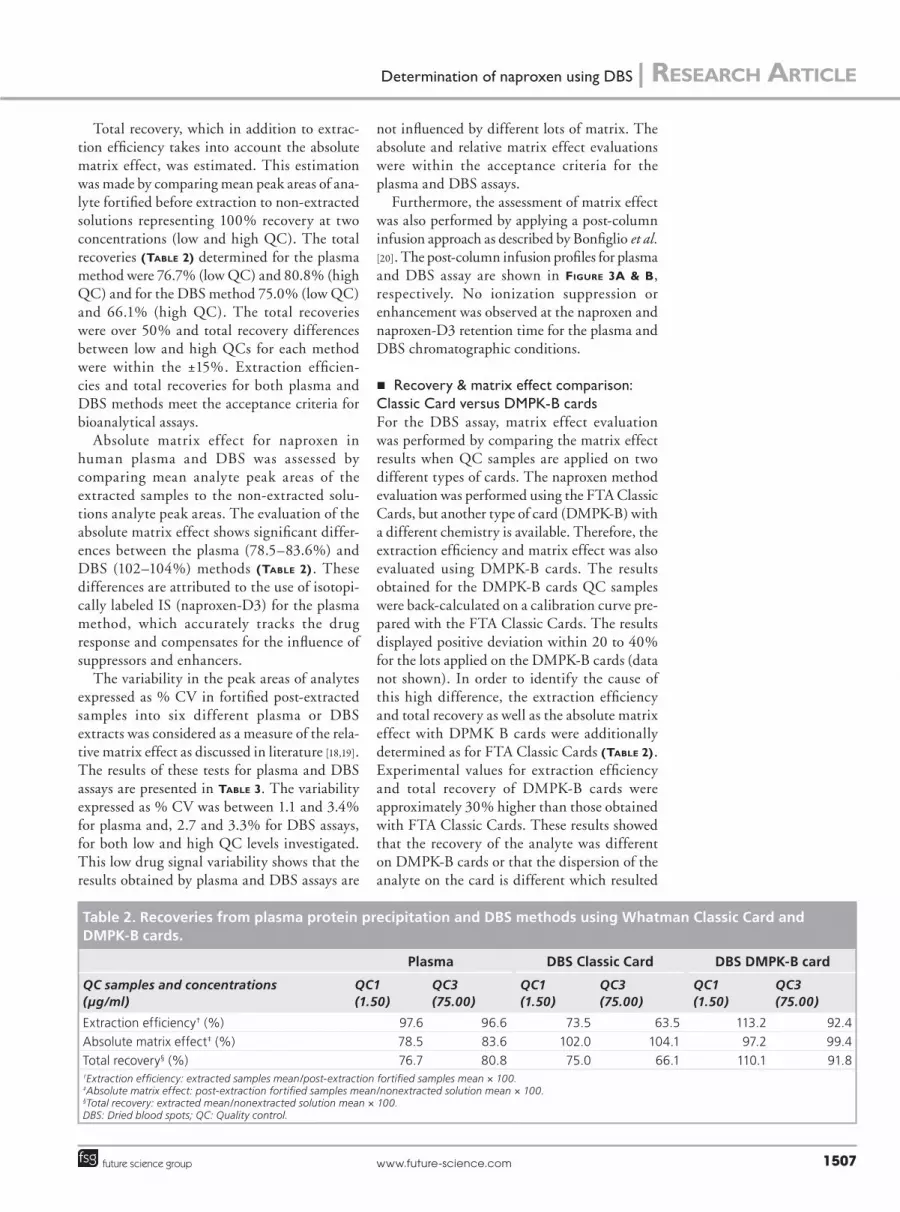
Total recovery, which in addition to extrac‑tion efficiency takes into account the absolute matrix effect, was estimated. This estimation was made by comparing mean peak areas of ana‑lyte fortified before extraction to non‑extracted solutions representing 100% recovery at two concentrations (low and high QC). The total recoveries (taBle 2) determined for the plasma method were 76.7% (low QC) and 80.8% (high QC) and for the DBS method 75.0% (low QC) and 66.1% (high QC). The total recoveries were over 50% and total recovery differences between low and high QCs for each method were within the ±15%. Extraction efficien‑cies and total recoveries for both plasma and DBS methods meet the acceptance criteria for bioanalytical assays.
Absolute matrix effect for naproxen in human plasma and DBS was assessed by comparing mean analyte peak areas of the extracted samples to the non‑extracted solu‑tions analyte peak areas. The evaluation of the absolute matrix effect shows significant differ‑ences between the plasma (78.5–83.6%) and DBS (102–104%) methods (taBle 2). These differences are attributed to the use of isotopi‑cally labeled IS (naproxen‑D3) for the plasma method, which accurately tracks the drug response and compensates for the influence of suppressors and enhancers.
The variability in the peak areas of analytes expressed as % CV in fortified post‑extracted samples into six different plasma or DBS extracts was considered as a measure of the rela‑tive matrix effect as discussed in literature [18,19]. The results of these tests for plasma and DBS assays are presented in taBle 3. The variability expressed as % CV was between 1.1 and 3.4% for plasma and, 2.7 and 3.3% for DBS assays, for both low and high QC levels investigated. This low drug signal variability shows that the results obtained by plasma and DBS assays are
not influenced by different lots of matrix. The absolute and relative matrix effect evaluations were within the acceptance criteria for the plasma and DBS assays.
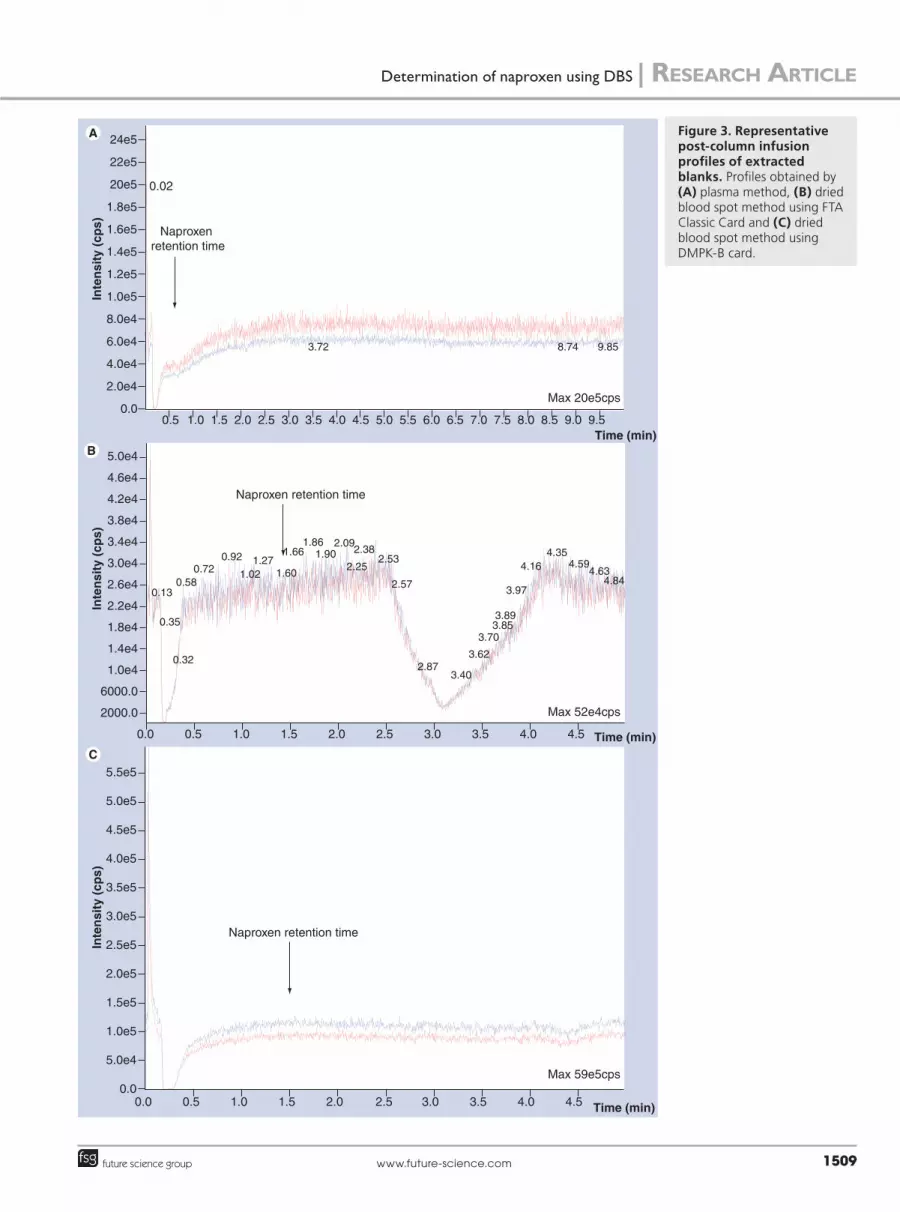
Furthermore, the assessment of matrix effect was also performed by applying a post‑column infusion approach as described by Bonfiglio et al. [20]. The post‑column infusion profiles for plasma and DBS assay are shown in Figure 3a & B, respectively. No ionization suppression or enhancement was observed at the naproxen and naproxen‑D3 retention time for the plasma and DBS chromatographic conditions.
n Recovery & matrix effect comparison: Classic Card versus DMPK-B cardsFor the DBS assay, matrix effect evaluation was performed by comparing the matrix effect results when QC samples are applied on two different types of cards. The naproxen method evaluation was performed using the FTA Classic Cards, but another type of card (DMPK‑B) with a different chemistry is available. Therefore, the extraction efficiency and matrix effect was also evaluated using DMPK‑B cards. The results obtained for the DMPK‑B cards QC samples were back‑calculated on a calibration curve pre‑pared with the FTA Classic Cards. The results displayed positive deviation within 20 to 40% for the lots applied on the DMPK‑B cards (data not shown). In order to identify the cause of this high difference, the extraction efficiency and total recovery as well as the absolute matrix effect with DPMK B cards were additionally determined as for FTA Classic Cards (taBle 2). Experimental values for extraction efficiency and total recovery of DMPK‑B cards were approximately 30% higher than those obtained with FTA Classic Cards. These results showed that the recovery of the analyte was different on DMPK‑B cards or that the dispersion of the analyte on the card is different which resulted
Table 2. Recoveries from plasma protein precipitation and DBS methods using Whatman Classic Card and DMPK-B cards.
Plasma DBS Classic Card DBS DMPK-B card
QC samples and concentrations (µg/ml)
QC1 (1.50)
QC3 (75.00)
QC1 (1.50)
QC3 (75.00)
QC1 (1.50)
QC3 (75.00)
Extraction efficiency† (%) 97.6 96.6 73.5 63.5 113.2 92.4
Absolute matrix effect‡ (%) 78.5 83.6 102.0 104.1 97.2 99.4
Total recovery§ (%) 76.7 80.8 75.0 66.1 110.1 91.8†Extraction efficiency: extracted samples mean/post-extraction fortified samples mean × 100.‡Absolute matrix effect: post-extraction fortified samples mean/nonextracted solution mean × 100. §Total recovery: extracted mean/nonextracted solution mean × 100. DBS: Dried blood spots; QC: Quality control.

reSearch article | Youhnovski, Michon, Latour et al.
Bioanalysis (2010) 2(8)1508 future science group
in a different extraction volume with the 3‑mm punch and caused the deviation in the back‑calculated concentration.
The post‑column infusion profile after extrac‑tion of the DBS DMPK‑B card spotted with blank blood is presented in Figure 3c. In compari‑son to the post‑column infusion profile obtained after extraction of DBS FTA Classic Card, there were no suppressors eluted between 2.5 and 4.0 min. These results demonstrated that it is impor‑tant to evaluate different types of card in order to produce the best assay performance [21].
It is noteworthy that except the above men‑tioned experiments, FTA Classic Cards were used for all other DBS validation tests and DBS incurred samples ana lysis.
n Solubilization time influence on the DBS extraction yield In order to evaluate the influence of the solubili‑zation time on the extraction yield of naproxen, the samples with the same concentrations were solubilized for 10, 30, 60, 120 and 240 min prior to their analysis by LC–MS/MS. The resulting areas corresponding to the naproxen peak were compared. The performed experiment shows that the recoveries after 10–60 min were within 2–5% difference (data not shown). Only long solubilization times such as 120 and 240 min gave 9–10% higher recoveries (data not shown)Since longer solubilization times produced only minor increases in recovery (≤10%), it was decided to use a standard solubilization time of 60 min in all the experiments.
n Processed reconstituted stabilityThe evaluation of processed reconstituted sta‑bility was performed by re‑injecting low and high QC samples from a validation batch after
storage at 4°C, back‑calculating against freshly extracted calibration standards and comparing to freshly extracted QC samples. The reconsti‑tuted naproxen samples were proven stable for 48 h for the plasma assay and for 216 h for the DBS assay.
n Metabolite stabilityThe naproxen plasma and DBS methods were verified for the absence of interference from naproxen metabolites. Naproxen biotransfor‑mation generates multiple metabolites that are not causing any interference to the methods due to their different molecular weight and transi‑tions. However, the naproxen acylglucuronide metabolite could be unstable ex vivo and in vitro and could also convert in the mass spectrom‑eter source and/or interface. All stability evalu‑ations were performed for the plasma and DBS assays with and without this potentially unsta‑ble metabolite. Naproxen acylglucuronide was proven stable in plasma at 4°C for 17 h, after three freeze–thaw cycles, following long‑term storage at ‑20°C for 6 days in human plasma, and on‑card at room temperature for 20 days. In addition, the naproxen acylglucuronide is chromatographically separated from naproxen in the plasma and DBS assays and did not cause interference (data not shown).
n Incurred sample reproducibility Incurred sample reproducibility was evaluated for the plasma and DBS assays by assessing on two different occasions the same subject sam‑ples. Both assays were proven to be reproducible, such that the % difference between initial and second analysis was less than 20% for at least 2/3 of the samples, and met the acceptance criteria (data not shown).
Table 3. Relative matrix effect evaluation summary of naproxen.
Matrix lot Low QC (1.50 µg/ml) High QC (75.00 µg/ml)
Peak area (plasma) Peak area (DBS) Peak area (plasma) Peak area (DBS)
1 49363.3 61696.1 2026796.7 2798809.3
2 50709.7 60661.9 1988929.4 2768185.4
3 49083.6 60378.1 1977034.8 2827753.0
4 53303.8 57254.0 1968026.2 2880632.8
5 49236.3 59642.0 1967138.9 2847748.1
6 49027.2 58348.9 1972174.2 3036929.4
Mean 50120.6 59663.5 1983350.0 2860009.7
SD 1679.7 1623.2 22720.7 94967.3
N 6 6 6 6
% CV 3.4 2.7 1.1 3.3CV: Coefficient of variation; N: Number of measurements; QC: Quality control; SD: Standard deviation.
Inte
nsi
ty (
cps)
Inte
nsi
ty (
cps)
Inte
nsi
ty (
cps)
Max 20e5cps
Max 52e4cps
Max 59e5cps
Time (min)
Time (min)
Time (min)
5.5e5
5.0e5
4.5e5
3.5e5
3.0e5
5.0e4
1.0e5
1.5e5
2.0e5
2.5e5
4.0e5
0.00.0
0.5 1.0 1.5 2.0 2.5 3.0 3.5 4.0 4.5
0.0 0.5 1.0 1.5 2.0 2.5 3.0 3.5 4.0 4.5
5.0e4
4.6e4
4.2e4
3.8e4
3.4e4
3.0e4
2.6e4
2.2e4
1.8e4
1.4e4
1.0e4
6000.0
2000.0
24e5
22e5
20e5
1.8e5
1.6e5
1.4e5
1.2e5
1.0e5
8.0e4
6.0e4
4.0e4
2.0e4
0.00.5 1.0 1.5 2.0 2.5 3.0 3.5 4.0 4.5 5.0 5.5 6.0 6.5 7.0 7.5 8.0 8.5 9.0 9.5
0.02
3.72 8.74 9.85
0.13
0.35
0.32
0.580.72
0.92
1.021.27
1.60
1.661.86
1.902.09
2.38
2.252.53
2.57
2.873.40
3.62
3.703.853.89
3.97
4.164.35
4.59
4.844.63
Naproxen retention time
Naproxen retention time
Naproxen retention time
Determination of naproxen using DBS | reSearch article
www.future-science.com 1509future science group
Figure 3. Representative post-column infusion profiles of extracted blanks. Profiles obtained by (A) plasma method, (B) dried blood spot method using FTA Classic Card and (C) dried blood spot method using DMPK-B card.

9
Linear profile of subject 001
Time (h)
6050403020100
0 1 2 3 4 5 6 7 8 9
Co
nce
ntr
atio
n(µ
g/m
l)
Linear profile of subject 003
Time (h)
6050403020100
0 1 2 3 4 5 6 7 8 9
Co
nce
ntr
atio
n(µ
g/m
l)
Linear profile of subject 005
Time (h)0 1 2 3 4 5 6 7 8 9
6050403020100
708090
Co
nce
ntr
atio
n(µ
g/m
l)
Linear profile of subject 007
Co
nce
ntr
atio
n(µ
g/m
l)
Time (h)0 1 2 3 4 5 6 7 8
6050403020100
7080
Linear profile of the mean
Co
nce
ntr
atio
n(µ
g/m
l)
Time (h)
50
40
30
20
10
0
60
0 1 2 3 4 5 6 7 8 9
Subject 001
DB
S c
on
cen
trat
ion
(µg
/ml)
Plasma conentration (µg/ml)
35302520151050
0 10 20 30 40 50 60
Subject 003
Plasma concentration (µg/ml)
35
30
25
20
15
10
5
00 10 20 30 40 50 60
DB
S c
on
cen
trat
ion
(µg
/ml)
Subject 005
Plasma concentration (µg/ml)
10 20 30 40 50 60 70 80 90
60
50
40
30
20
10
0
-10
DB
S c
on
cen
trat
ion
(µg
/ml)
Subject 007
Plasma concentration (µg/ml)
35302520151050
4540
10 20 30 40 60 70 8050
I
DB
S c
on
cen
trat
ion
(µg
/ml)
Concentrations - all subjectsJ
Plasma concentration (µg/ml)
60
50
40
30
20
10
010 20 30 40 50 60 70 80 900
DB
S c
on
cen
trat
ion
(µg
/ml)
reSearch article | Youhnovski, Michon, Latour et al.
Bioanalysis (2010) 2(8)1510 future science group
Figure 4. Pharmacokinetic profiles in plasma and blood spots. Profiles after a single oral dose of naproxen 440 mg from subjects (A) 001, (B) 003, (C) 005, (D) 007 and (E) average profiles. Concentrations determined by blood spots versus plasma and regression analysis of samples from (F–I) individual subjects and for (J) all subjects.

Determination of naproxen using DBS | reSearch article
www.future-science.com 1511future science group
Incurred subject samples naproxen concentration comparison: plasma versus DBSHuman plasma and DBS samples from the same randomly selected four subjects were collected during a naproxen clinical trial performed for the evaluation of two formulations of naproxen capsules. Two subjects received the reference, a 440 mg dose of the reference product (naproxen sodium 220 mg liquid gel capsules [equivalent to 200 mg naproxen] from Bayer Health Care) and two subjects received a 440 mg dose of the test product naproxen sodium 220 mg liquid gel capsules manufactured by Pharmaceutics International Inc. Collections were performed at 14 different time points from pre‑dose to 8 h post‑dose. These plasma and DBS samples were analyzed with their respective methods. The results obtained from the ana lysis of plasma samples displayed higher concentrations than those from the DBS method due to the drug distribution in a larger volume of blood than plasma. After centrifugation, whole blood is sep‑arated into plasma and red blood cells fractions. The drug can be distributed between these two fractions. As a measure for this fraction sepa‑ration the term hematocrit is introduced. The hematocrit or packed cell volume (PCV) is the proportion of blood volume that is occupied by red blood cells and (1‑hematocrit) corresponds to the proportion of blood volume that is occu‑pied by plasma. The drug can theoretically be distributed in both centrifuged blood fractions. As a measure for drug bound to the red blood cell fraction a term f
BC has to be introduced. An
analyte with a higher fBC
has a higher blood‑to‑plasma distribution ratio (c
b/p). A f
BC tends to
zero if no drug is bound to the red blood cells and conversely, if the drug is 100% bound to red blood cells, the f
BC should be 1. This means that
there is a hematocrit and fraction of an analyte bound to blood cells dependencies as discussed by Li and Tse and expressed in equation 2 [22,23]:
1 1DBS hematocrit f
plasma
analyte BC
analyte
- -
=
#^ ^h h66
6
@@
@equation 2
Where fBC
is the fraction of an analyte bound to blood cells; DBS
[analyte] and plasma
[analyte] are
analyte concentrations determined in DBS and plasma, respectively. In cases when f
BC
tends to zero, as analysis of our data shows, the equation 2 can be simplified to equation 3 where only hematocrit plays a role:
1DBS hematocrit plasmaanalyte analyte- =66 6@@ @
equation 3
The comparative graphical plots of the mean and individual concentration–time profiles of naproxen obtained by plasma and DBS methods for subjects 001, 003, 005 and 007 are presented in Figure 4a–e. These graphs show that the PK profiles found by DBS precisely follow those found by the representative plasma method.
To investigate the correlation between data obtained by both compared methods graphi‑cal plots were used where the concentrations found by plasma method are plotted on the x‑axis and on the y‑axis the corresponding DBS data. The resulting linear regressions, functions, curves and linearity factors (r2) were calculated for individual subjects (Figure 4F–i) as well as for all subjects together (Figure 4K). The equa‑tions, hematocrit, and correlation factor for each individual subject as well as for all subjects are summarized in taBle 4. The slope of the calcu‑lated curves obtained after regression analysis for each individual subject corresponds to the num‑ber obtained from (1 ‑ hematocrit) with small (±0.01) deviations. The low number of subjects investigated, as well as the low variations in sub‑ject hematocrit (0.397–0.480) do not allow more precise statistical evaluation of the hematocrit influence, but the data obtained from the ana‑lyzed subjects strongly support the relationship predicted and expressed in equation 3. After comparison and statistical evaluation of the results obtained by plasma and DBS methods, a strong correlation (correlation factors [r2] close to 1) between the concentrations obtained with both methods was observed, as demonstrated in Figure 4. This strong relationship, predicted and found experimentally, allows the assump‑tion that the results obtained by DBS method strongly correlate with the results from plasma method. Furthermore, the determination of the most important PK parameters for naproxen can
Table 4. Summary of regression analysis equations, correlation factors and hematocrit.
Subject Equation Correlation factor r2
Hematocrit (1 - hematocrit)
001 y = 0.5287× + 0.5578 0.9828 0.480 0.520
003 y = 0.5918× + 0.047 0.9946 0.397 0.603
005 y = 0.5862× - 0.4118 0.9762 0.398 0.602
007 y = 0.5945× - 0.0367 0.9877 0.398 0.602
All subjects average
y = 0.5811× - 0.0921 0.9856 0.418 0.582

reSearch article | Youhnovski, Michon, Latour et al.
Bioanalysis (2010) 2(8)1512 future science group
be performed cost‑effectively by DBS technique. This is especially valid for measurements of half‑life as well as in estimation of bioavailability, where the absolute value of compound concen‑trations has no significant influence. It should be underlined that DBS technique could be espe‑cially useful in the conduct of bi oavailability/bioequivalence studies of naproxen.
ConclusionIn conclusion, the DBS technique has been well adapted to the quantitation of naproxen. Based on the extraction data and suppression profiles, differences for FTA Classic Cards and DMPK‑B cards, it is of critical importance to validate the method with the type of filter paper that is planned to be used.
All validation parameters for the plasma and DBS method such as specificity/selectivity, preci‑sion and accuracy, matrix effect, recovery, pro‑cessed reconstituted stability, analyte and metab‑olite stability, and ISR have been successfully evaluated for the DBS method. Furthermore, the technique has been demonstrated to produce similar PK profiles and strong correlation of the data obtained by DBS and plasma quantitation methods. The usefulness of the DBS technique for PK and bioequivalence studies has been discussed and demonstrated.
Future perspectiveThe DBS technique will be more frequently used in the future as the advantages are
numerous, especially for preclinical studies where the use of multiple satellite animals is required with conventional analysis. The cost for preclinical studies will be reduced with the reduced number of animals. The advantages will also be seen in bioequivalence studies where the amount of blood drawn will be con‑siderably reduced for each volunteer, which will facilitate the recruiting of volunteers. However, the limiting factor of the DBS technique will be for products that require a low quantitation level. The low extraction volume with DBS will require a more sensitive instrument than for regular analysis.
Ethical conduct of research The authors state that they have obtained appropriate insti tutional review board approval or have followed the princi ples outlined in the Declaration of Helsinki for all human or animal experimental investigations. In addi-tion, for investi gations involving human subjects, informed consent has been obtained from the participants involved.
Financial & competing interests disclosureThe authors have no relevant affiliations or financial involvement with any organization or entity with a financial interest in or financial conflict with the subject matter or materials discussed in the manuscript. This includes employment, consultancies, honoraria, stock ownership or options, expert t estimony, grants or patents received or p ending, or royalties.
No writing assistance was utilized in the production of this manuscript.
Executive summary
n Development and validation of the dried blood spots (DBS) technique for quantitation of naproxen was successful.
n All validation requirements were met for the DBS and plasma assays.
n Naproxen and naproxen acylglucuronide are stable in blood applied on FTA® Classic Cards.
n Plasma and blood concentration showed similar pharmacokinetic profile.
n A strong correlation between plasma and blood concentration was demonstrated.
BibliographyPapers of special note have been highlighted as:n of interestnn of considerable interest
1 Guthrie R, Susi A. A simple phenylalanine method for detecting phenylketonuria in large populations of newborn infants. Pediatrics 32, 338–343 (1963).
2 Rudy JL, Rutledge JC, Lewis SL. Phenylalanine and tyrosine in serum and eluates from dried blood spots as determined by reversed‑phase liquid chromatography. Clin. Chem. 33(7), 1152–1154 (1987).
3 Barfield M, Spooner N, Lad R, Parry S, Fowles S. Application of dried blood spots combined with HPLC–MS/MS for the quantification of acetaminophen in toxicokinetic studies. J. Chromatogr. B Analyt. Technol. Biomed. Life Sci. 870(1), 32–37 (2008).
4 Beaudette P, Bateman KP. Discovery stage pharmacokinetics using dried blood spots. J. Chromatogr B Analyt. Technol. Biomed. Life Sci. 809(1), 153–158 (2004).
5 Edelbroek PM, Van Der Heijden J, Stolk LM. Dried blood spot methods in therapeutic drug
monitoring: methods, assays, and pitfalls. Ther. Drug Monit. 31(3), 327–336 (2009).
nn Assays of many medicines in dried blood spots (DBS) are reviewed. Some aspects of DBS technique standardization, quality assurance, basic research and assay development are discussed.
6 Spooner N, Lad R, Barfield M. Dried blood spots as a sample collection technique for the determination of pharmacokinetics in clinical studies: considerations for the validation of a quantitative bioanalytical method. Anal. Chem. 81(4), 1557–1563 (2009).

Determination of naproxen using DBS | reSearch article
www.future-science.com 1513future science group
n Provides and discusses important milestones of DBS method development.
7 Aburuz S, Millership J, McElnay J. Dried blood spot liquid chromatography assay for therapeutic drug monitoring of metformin. J. Chromatogr. B Analyt. Technol. Biomed. Life Sci. 832(2), 202–207 (2006).
8 Hoogtanders K, van der Heijden J, Christiaans M, van de Plas A, Van Hooff J, Stolk L. Dried blood spot measurement of tacrolimus is promising for patient monitoring. Transplantation 83(2), 237–238 (2007).
9 Janzen N, Sander S, Terhardt M, Peter M, Sander J. Fast and direct quantification of adrenal steroids by tandem mass spectrometry in serum and dried blood spots. J. Chromatogr. B Analyt. Technol. Biomed. Life Sci. 861(1), 117–122 (2008).
10 Koal T, Burhenne H, Romling R, Svoboda M, Resch K, Kaever V. Quantification of antiretroviral drugs in dried blood spot samples by means of liquid chromatography/tandem mass spectrometry. Rapid Commun. Mass Spectrom. 19(21), 2995–3001 (2005).
11 La Marca G, Malvagia S, Filippi L et al. Rapid assay of topiramate in dried blood spots by a new liquid chromatography/tandem mass spectrometric method. J. Pharm. Biomed. Anal. 48(5), 1392–1396 (2008).
12 La Marca G, Malvagia S, Filippi L, Luceri F, Moneti G, Guerrini R. A new rapid micromethod for the assay of phenobarbital from dried blood spots by LC–tandem mass spectrometry. 50(12), 2658–2662. Epilepsia (2009).
13 van der Heijden J, De Beer Y, Hoogtanders K et al. Therapeutic drug monitoring of everolimus using the dried blood spot method in combination with liquid chromatography–mass spectrometry. J. Pharm. Biomed. Anal. 50(4), 664–670 (2009).
14 Wilhelm AJ, Den Burger JC, Chahbouni A, Vos RM, Sinjewel A. Analysis of mycophenolic acid in dried blood spots using reversed phase high performance liquid chromatography. J. Chromatogr. B Analyt. Technol. Biomed. Life Sci. 877(30), 3916–3919 (2009).
15 Wilhelm AJ, Den Burger JC, Vos RM, Chahbouni A, Sinjewel A. Analysis of cyclosporin A in dried blood spots using liquid chromatography–tandem mass spectrometry. J. Chromatogr. B Analyt. Technol. Biomed. Life Sci. 877(14–15), 1595–1598 (2009).
16 Bergeron A, Furtado M, Garofolo F. Importance of using highly pure internal standards for successful liquid chromatography–tandem mass spectrometric bioanalytical assays. Rapid Commun. Mass Spectrom. 23(9), 1287–1297 (2009).
17 Shi G. Application of co‑eluting structural analog internal standards for expanded linear dynamic range in liquid chromatography/electrospray mass spectrometry. Rapid Commun. Mass Spectrom. 17(3), 202–206 (2003).
18 Matuszewski BK, Constanzer ML, Chavez‑Eng CM. Matrix effect in quantitative LC–MS/MS analyses of biological fluids: a method for determination
of finasteride in human plasma at picogram per milliliter concentrations. Anal. Chem. 70(5), 882–889 (1998).
19 Matuszewski BK, Constanzer ML, Chavez‑Eng CM. Strategies for the assessment of matrix effect in quantitative bioanalytical methods based on HPLC–MS/MS. Anal. Chem. 75(13), 3019–3030 (2003).
20 Bonfiglio R, King RC, Olah TV, Merkle K. The effects of sample preparation methods on the variability of the electrospray ionization response for model drug compounds. Rapid Commun. Mass Spectrom. 13(12), 1175–1185 (1999).
21 Côté C, Bergeron A, Mess JN, Furtado M, Garofolo F. Matrix effect elimination during LC–MS/MS bioanalytical method development. Bioana lysis 1(7), 1243–1257 (2009).
22 Li W, Tse Fl. Dried blood spot sampling in combination with LC–MS/MS for quantitative ana lysis of small molecules. Biomed. Chromatogr. 24(1), 49–65 (2010).
nn Most recent review article. Highlights some important aspects of developing and validating a rugged DBS-LC–MS/MS method for quantitative analysis of small molecules along with DBS sample collection, processing and storage.
23 Eyles D, Anderson C, Ko P et al. A sensitive LC–MS/MS assay of 25OH vitamin D3 and 25OH vitamin D2 in dried blood spots. Clin. Chim. Acta 403(1–2), 145–151 (2009).