Embed Size (px)
Citation preview

Carbohydrate Research, 247 (1993) 21-35 Elsevier Science Publishers B.V., Amsterdam
21
Determination of the pattern of methyl esterification in pectin. Distribution of continuous nonesterified residues *
Andrew J. Mort apf, Feng Qiu a and Niels 0. Maness b
Departments of a Biochemistry and Molecular Biology, and b Horticulture and Landscape Architecture, Oklahoma Agricultural Experiment Station, Oklahoma State University, Stillwater, OK 74078 (USA)
(Received October 3Oth, 1992; accepted in revised form April 13, 1993)
ABSTRACT
A method is described for determining the distribution of contiguous nonesterifted galacturonic acid residues within pectins. First, the esterified galacturonic acids are converted to galactose by reduction with sodium borohydride, then the glycosidic linkages of the resulting galactose residues are cleaved selectively by liquid HF solvolysis. Separation and quantitation of the resulting galactnronic acid containing ohgomers reveals the proportion of each stretch of contiguous nonesterified galacturonic acid residues in the original pectin. The dist~bution of noneste~~ed GalA in a pectin fraction obtained from cotton suspension culture cell wahs with _ 50% esterification appears to be far from random.
INTRODUCTION
Pectins, which have pronounced gel-forming properties, are extensively utilized in the food industry as thickening agents in food products. Prominent in pectins are homogalacturonan regions which have been implicated in gel fo~ation. The galacturonic acid (GalA) residues in the homogala~uronan regions are often esterified with methyl groups. Most commercial pectins have been extracted from fruit pulp by hot acid extraction, causing them to lose their highly branched regions. This extraction procedure may also cause a decreased degree of methyl esterification (dm). Commercial pectins of dm above N 50% form gels under conditions of acidic pH and low water activity such as found in jams and jellies. Pectins of low dm (< 50%) form gels in the presence of Cazf ions. No detailed structural model of the junction zones between high-dm pectin chains has been reported, although involvement of both hydrophobic interactions and hydrogen bonds in the formation of junction zones has been shown by Oakenfull and Scott2.
t Corresponding author. * A prefinary report of this work was presented in the symposium High-Performance Anion-Ex-
change Cbro~tography of C~~hydrates, at the 203rd American Chemical Society National Meeting and Exposition in San Francisco, CA on April 9-10, 1992. See ref 1.

22 A.J. Mart et al. / Carbohydr. Res. 247 (1993) 21-35
A well accepted model for the gelling of low-dm pectins has been proposed involving cooperative Ca2+ crossbridges between adjacent nonesterified segments of two pectin chains3. For these junction zones to be stable, it was proposed that a minimum of seven adjacent Ca2+ crossbridges are needed, which would involve 14 contiguous nonesterified GalA residues in a 2, helin3. For high- or low-dm pectins, we can be sure that the distribution of methyl esterification will have a great influence upon the ability of pectin to form gels.
The biological functions of pectin in plants are still open to discussion, but pectins do make up a large proportion ( - 30%) of the polysaccharides in cell walls of most herbaceous plants (with the exception of grassesj4. Ca2+-induced crosslinks may be involved in cell adhesion’, cell wall extensibility6, and overall tissue texture5. Despite the overall high dm of pectins in the growing parts of plants, there must be regions within the pectins capable of forming the Ca2+-induced crosslinks since Varner and Taylor’ found evidence for Ca2+-binding pectins in crosssections from stems of Bidens, and Vreeland et a1.s detected differential Ca2+-dependent adsorption of fluorescent labeled oligomers of nonesterified GalA to walls of different cell types in leaves of Dubautia and soybean nodules.
Another case in which esterification can affect the behavior of pectins is that of enzymic degradation. Plants and plant pathogens produce enzymes to degrade pectins. These enzymes are prevented from acting by (or in the case of pectin lyase require) the presence of methyl esters. In ripening fruits such as tomatoes, the induction of methyl esterases precedes the induction of endopolygalacturonase5.
Several methods have been used to investigate the pattern of esterification in pectin. Early methods have been reviewed by Taylor’. Subsequent methods involve the use of enzymes to produce characteristic oligomers as a result of the specificity of the enzymeslo,ll or involve ‘H or 13C NMR spectroscopy’2713, which allows nearest-neighbor frequencies to be determined. The results of these studies do not all agree with each other, except that acid or alkaline deesterification of pectins is random. Most of the studies, with the exception of those involving high-field 13C NMR spectroscopy 13, indicate a nonuniform distribution of methyl esters in native high-methoxyl pectins.
We are proposing a purely chemical method for producing oligosaccharides containing the contiguous nonesterified GalA residues. These can be separated and quantitated to determine the frequency of each length of contiguous stretches of nonesterified residues. The method should give a more quantitative picture than the previous methods.
RESULTS AND DISCUSSION
From previously published work we knew (1) that it was possible quantitatively to reduce esterified galacturonic acid residues in pectins to galactose without significant demethylesterification or @elimination’4, and (2) that it was likely the resulting galactosyl linkages would be very much more labile to liquid I-IF solvolysis

A.J. Mort et al. /Carbohydr. Res. 247 (1993) 21-35 23
than those of galacturonosy1 linkages *’ Thus, HF solvolysis of samples reduced in .
this way, under ideal conditions, should lead to the production of oligomers of gaIacturonic acid with galactose at their reducing end (CalA,-Gal ohgomers), which represent the contiguous stretches of GalA residues between methyl-esteri- fied residues (see Scheme 1). Separation and quantitation of these oligomers would reveal the distribution of nonesterified GalA residues within a particular pectin sample. To implement this procedure we needed to devise and prove methods for the following: (1) chromatographic separation of oligomers of GalA,- Gal, (2) complete cieavage of all galactosyl linkages with no or insignificant cleavage of GalA linkages, and (3) quantitation of the various GalA,-Gal oligomers.
The oligomers of GalA,-Gal with n = 1 to at least 10 could be well resolved
using the Dionex PA1 anion-exchange column eluted with a gradient of increasing sodium acetate concentration at pH 5.2. The oligomers could be detected by pulsed amperomet~ (in combination with postcolumn addition of sodium hydrox- ide; see Fig. 1B) or by UV absorbance (Fig. 1A) if they were derivatized with 2-aminopyridine (2-A@ prior to the chromatography. The 2-AP labeled oligomers eluted at slightly higher ionic strength than the nonlabeled oligomers. From previous work with homogalacturonan oligomers, we expected to see a regular pattern of peaks of decreasing spacing between oligomers as the oligomer length increased’““.
To assign the identities of the compounds that corresponded to the peaks in the chromatograms, an effluent splitter was instalied between the column exit and the point of sodium hydroxide addition, and N 80% of the column effluent was directed to a fraction collector. The time difference between appearance of a signal at the pulsed amperometric detector and the arrival of a sugar at the fraction collector was determined using glucose by calorimetric assay” of the fractions in the fraction collector. The materials corresponding to peaks 1, 2, and 3 in Fig. 1 were cohected and subjected to ‘H NMR and/or liquid secondary ion-mass spectrometry @SIMS).
The material in peak 1 upon LSIMS showed ions at wt/z 379.1 as would be expected for [GalA-Gal + Nal+. That from peak 2 gave ions at m/z 555.2 and 577.2 corresponding to the masses of [GalA,-Gal + Na]+ and [GalA,-Gal + 2Na
_(GalAMe),~(GaL4),,-(GalAMe)~~(GaL4),
I
NaBH,
M Imidazole pH 7
_(Gal),~(GalA),,-(Gal),;(GaL4),,-(Gal)~~(Ga~)~i(Gal)~~
1 I-IF (1% H20)
- 15°C
(n, - 1)Gal+GaL4,b-Gal+(n, -Wal+GalA,,-Gal+& -l)Gal+GalA,;Gal+(n, -l)Gal
Scheme 1.

A.J. Mart et al. / Carbohydr. Res. 247 (1993) 21-35 25
A
PPM 3
I’~‘~I~“*,~.~.I~.~~,....1....,....1..~~,.~..1~~~.,~,~~,~~~~
6 5 4 PPM 3 2 1 0
Fig. 2. A. ‘H NMR spectrum of the material in peak 1 of Fig. 1 identified as GalA-Gal. The numbered resonances are assigned as: 1, H-i of the reducing a-Gal; 2, H-l of the nonreducing a-GaL4 linked to either cr- or /S-Gal; 3, H-5 of the GalA, 4, H-l of the /?-Gal; and 5, H-4 of the GalA. B. The corresponding spectrum of the material in peak 2 identified as GalA,-Gal; 1, H-l of the reducing a-Gal; 2A, H-l of the nonreducing terminal GalA; 2, H-l of the internal GalA linked to either a- or P-Gal; 3, H-5 of GalA, 4, H-l of the p-Gal; and 5A, H-4 of the internal GalA shifted downfield relative to resonance-5 because of its linkage at this position to the nonreducing end GalA, and 5, H-4 of the nonreducing end, GaL4.
Oligomers of homogalacturonan can be generated from pectic acid by auto- clave-induced autolysis or by partial endopolygalacturonase hydrolysis”. Standard di- and tri-GalA are commercially available from Sigma Chemical Co. Thus, it is easy to identify some of the homogalacturonan series rigorously and identify the higher oligomers from the regularity of the decrease in peak spacing as the oligomers get longer (Fig. 3, peaks 6, 10, 12, and 14). As one would expect for chromatography at pH 5.2 on an anion-exchange column, the GalA,-Gal oligomers, having a lower charge-to-mass ratio, elute earlier than the GalA, oligomers.

A.J. Mart et al. /Carbohydr. Rex 247 (1993) 21-35 25
A
I’~~““‘~,“~“‘~‘~,‘~‘~‘~~~~,‘~~~‘*~.~,~~..I~~*~,....“...
6 5 4 PPM 3 2 1 0
B
,‘.~‘I’~‘~I”‘~~‘~‘~I’~‘~I”‘~~~“‘I’)”I””~””
6 5 4 PPM 3 2 1 0
Fig. 2. A. ‘H NMR spectrum of the material in peak 1 of Fig. 1 identified as GalA-Gal. The numbered resonances are assigned as: 1, H-l of the reducing a-Gal; 2, H-l of the nonreducing a-GalA linked to either a- or P-Gal; 3, H-5 of the GalA; 4, H-l of the P-Gal; and 5, H-4 of the GalA. B. The corresponding spectrum of the material in peak 2 identified as GaLA,-Gal; 1, H-l of the reducing (~-Gal; 2A, H-l of the nonreducing terminal GaL4; 2, H-l of the internal Gab4 linked to either (Y- or p-Gal, 3, H-5 of GaW, 4, H-l of the p-Gal, and 5A, H-4 of the internal GalA shifted downfield relative to resonance-5 because of its linkage at this position to the nonreducing end GaLA, and 5, H-4 of the nonreducing end, GaL4.
Oligomers of homogalacturonan can be generated from pectic acid by auto- clave-induced autolysis or by partial endopolygalacturonase hydrolysis2’. Standard di- and tri-GalA are commercially available from Sigma Chemical Co. Thus, it is easy to identify some of the homogalacturonan series rigorously and identify the higher oligomers from the regularity of the decrease in peak spacing as the oligomers get longer (Fig. 3, peaks 6, 10, 12, and 14). As one would expect for chromatography at pH 5.2 on an anion-exchange column, the GalA.-Gal oligomers, having a lower charge-to-mass ratio, elute earlier than the GalA. oligomers.

26 A.J. Mori et al. / Carbohydr. Res. 247 (1993) 21-35
1 4 23
-23°C
I I I I I I I I 1 a 10 20 30 40 50 60 70 80
Time (minutes)
Fig. 3. Chromatogram of the oligomers derived from Sigma apple pectin using PAD showing the differences between runs conducted at - 23, - 10 and - 15°C when using HF plus 1% H,O to generate the oligomers. Peak 1, galactose plus other nonadsorbed material; 2, incomplete solvolysis products, probably GalA-GaLGalA-Gal; 3, unidentified; 4, GalA-Gal; 5, GalA-Rha(l,Z’ : 1’,2-dianhydride of p-rhamnose and a-galacturonic acid)=; 6, GalA, 7, unidentified; 8, a series of incomplete solvolysis products; 9, GalA,-Gal; 10, GalA,; 11, GalA,-Gal; 12, GalA,; 13, GalA,-Gal; 14, GalA,; 15, GalA,-Gal; 16, GalA,-Gal; and * additional unidentified solvolysis products. The chromatogram of the pectin treated at - 15°C was run at a different time than those at the other temperatures and illustrates the sensitivity of retention times to the age of the column.
Being able to separate GalA,-Gal oligomers from GalA, oligomers allowed us to optimize conditions in liquid HF to minimize the cleavage of GalA linkages. Fig. 3 shows chromatograms of reduced apple pectin from Sigma treated with liquid HF (1% water) at -23, - 10, and - 15°C. Ahhough we predicted that all a-galactosyl linkages would be cleaved in liquid HF at -23°C (ref 151, we found that the reaction was not qu~titative, as indicated by the appearance of several peaks in the chromatograms. which corresponded to neither GalA,-Gal nor GalA, oligomers. Peak 2 and the cluster designated 8 represent oligomers such as GalA-Gal-Gab&Gal. These are absent at the two warmer temperatures. At “excessively” warm temperatures, e.g., - lo”C, that ensured complete Gal linkage
deavage, GalA, oligomers were produced, indicating some cleavage (albeit a small amount) of GalA linkages. An acceptably low Ieve of GalA cleavage with essen- tially complete Gal cleavage was obtained using a reaction temperature of - 15°C
A.J. &fort et al. /Carbohydr. Res. 24.7 (1993) 21-35 27
for a duration of 30 min. Interestingly, treating cotton cell walls with anhydrous HF at 0°C gives rise to quite large (up to at least 30 residues in length) GalA, oligomers (Komalaviias and Mort, unpublished work).
For quantitative estimation of the proportion of blocks of various lengths of nonesterified GalA, we must be able to quantitate the GalA,-Gal oligomers. The most convenient fractionation and quantitation would be chromatography on the Dionex PA1 column, followed by quantitation using pulsed amperometry. How- ever, since it is ~practi~al to generate pure standards for each oligomer expected, and there is evidence in the Iiterature that the PAD does not give an equimolar response for oligomers of different length in the GalA, homologous series@j, we used end labeling with 2-AP for initial quantitation. We have previously shown for 2-AP labeled oligomers in the GalA, series that integrated areas of UV ab- sorbance do give an equimolar response for oligomers in the range of from two to at least 20 residues in length 2o We presumed that the oiigomers ending in .
galactose would also give an equimolar response. To check that this pres~ption was correct, we compared the relative peak areas of the 2-AP labeled GalA,-Gal ohgomers produced from several pectins of known degree of esterification with those predicted to be obtained if the methyl esterification in the pectins were random. Several reports in the literature have suggested that fruit pectins are randomly esterified1**13.
If the methyl esters within a pectin are compIetely randomly distributed, it is possible to predict how frequently each cluster size of ~nti~ous nonesteri~ed galacturonic acid residues would occur for any partictdar degree of esterification. The probability of a nonesterified residue occurring at any particular position is [l - (dm/lOO)] which we designate as p. The probability of two occurring adjacent to each other is p2, for three together it is p3, etc. The probability of an esterified residue at any particular position is 1 -p. The products of the HF reaction after reduction of methyl-esterified GalA to Gal would begin at the nonreducing end with a GalA residue and end in a Gal residue (see Scheme 1). Obviously the sugar previous to the start of each of the oligosaccharides would have originally been galactose. The probability of obtaining, for instance, GalA,-Gal would be p2(1 -p). In the general case GalA,-Gal would occur with a probability of ~“(1 -p). If we normalize to GalA,-Gal we obtain the following expression:
probability of GalA,-Gal p”( 1 -p)
probability of GalA,-Gal = pr(l -p) =p’“-l’
.
Since the probabilities will be reflected in the proportions of oligomers produced, one can predict the relative molar ratio of each oligomer to GalA,-Gal or to any other oligomer in the series. In the case of the 2-AP labeled oligomers, normaliza- tion to GalA,-Gal is necessary, because during the purification of the labeled oligomers there is not a quantitative recovery of the GalA,-Gal oligomer. The loss of this oligomer is incurred because it does not carry a net negative charge after the 2-AP labelling and thus adsorbs to some extent to the extract clean column

28 A.J. MM et al. /Ca~~~dr. Res. 247 (1993) 21-35
0.5 ,
--h- Sigma PAD
-+ NS-2 PAD
-+- NS-2 UV
- + Sigma W
-2 -
0 1 2 3 4 5 6 7 8
”
Fig. 4. Plots of the logarithm of the normalized integrated areas from ohgomers produced from Sigma apple pectin (dm 61.54%) and MS-2 apple pectin (dm 50.87%) determined by either pulsed amperome- try or W absorption. Areas from the PAD were normalized to that of GalA-Gal. Those from the W chromatogram were normalized to GalA,-Gal. The lines drawn through the points are an equally weighted linear fit to the data.
that is used to remove the excess 2-AP before chromatography of the samples’r. For ‘2-M’ labeled oligorners, if the molar response of the UV detector is equal for all oligomers, a plot of log farea,/area,) vs. n should be linear with a slope of log p and a y intercept of -2 log p. Fig. 4 shows that for apple pectin of two different degrees of esterification such plots are linear. The slopes of these plots are - 0.40 for the Sigma pectin and - 0.32 for the pectin designated NS-2. These slopes correspond to dm values of 60 and 52%, respectively. The dm values of these pectins as determined by the gas chromatographic methodI were 61.5 and 50.9%, respectively. Plots for three other apple pectin samples also gave excellent linear fits, but with slopes different from what would be predicted from their dm values (see explanation below).
Fig. 4 also shows plots for the normalized FAD areas. These also are linear but with slightly steeper slopes. The increase in slopes is consistent with a uniform progressive decrease in sensitivity of the PAD with increasing oligomer length. We can modify the equation used to describe the plots obtained with the UV detector to take into account the decrease in response, assuming that the PAD response decreases by a factor of k for each additional residue in the oligomer. The response per mole for the PAD for the GaiA,-Gal oligomer can be predicted to be equal to the response per mole of GalA,-Gal times k@‘-l). Thus, if the normalized areas of the PAD are divided by the appropriate factor kc”-If, they should then be
A.J. Mart et al. /Carbohydr. Rex 247 (1993) 21-35 29
proportional to the relative molar ratios of the oligomers. This leads to the general relation for the PAD that
area GalA,-Gal = ( pk )(“-l) and log
area GalA,-Gal
area GalA,-Gal area GalA i-Gal = (n - 1) log(pk).
This equation predicts that the slope of a plot of the log of the relative PAD responses will be steeper than that of the UV detector results by log k. For five different pectin samples of dm from 26 to 73% the mean k was 0.93 f 0.03. Thus under our chromatographic conditions the response of the PAD falls by a factor of 0.93 for each additional residue in the oligomer. Unfortunately, k appears to change when different buffer systems (such as the sodium hydroxide-sodium acetate system often used with the PA1 column) are used for chromatography.
For cases in which the response of the PAD falls off in a geometric fashion with increasing length of oligomer in homologous series of other sugars, this relation may be useful to determine other PAD response correction factors. By comparing the relative areas of several of the 2-AP labeled members of the series by UV with their corresponding PAD areas, one should be able to determine the best k value. However, Ammeraal et al.” and van Riel and Olieman= have reported that for a-(1 + 4) linked glucan oligomers the molar PAD response increases in an irregu- lar manner with increasing dp above 3. The factor k that we determine is strictly empirical since we do not even know what reaction, or reactions, are taking place at the surface of the electrode to give the PAD response.
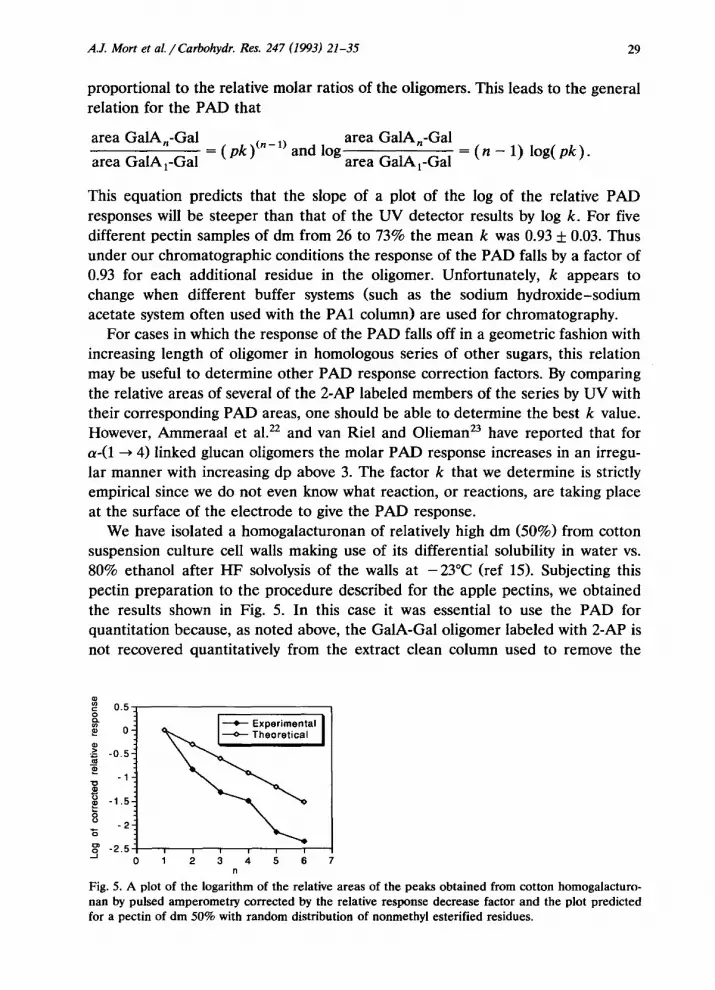
We have isolated a homogalacturonan of relatively high dm (50%) from cotton suspension culture cell walls making use of its differential solubility in water vs. 80% ethanol after HF solvolysis of the walls at -23°C (ref 15). Subjecting this pectin preparation to the procedure described for the apple pectins, we obtained the results shown in Fig. 5. In this case it was essential to use the PAD for quantitation because, as noted above, the GalA-Gal oligomer labeled with 2-AP is not recovered quantitatively from the extract clean column used to remove the
0 12 3 4 5 6 7 n
Fig. 5. A plot of the logarithm of the relative areas of the peaks obtained from cotton homogalacturo- nan by pulsed amperometIy corrected by the relative response decrease factor and the plot predicted for a pectin of dm 50% with random distribution of nonmethyl esterified residues.
30 A..I. &fort et al. / Carbohydr. Ref. 247 (1993121-35
excess unlinked 2-AP reagent and this oligomer formed u 80% of the GalA-con- taming products. The pectin isolated from cell wails of cotton suspension cultures after treatment with HF at -23°C followed by water extraction did not show a random distribution of nonesterified GalA residues (Fig. 5). Comparison of the plot of the log of the relative PAD responses for the cotton pectin with the plot expected for a random distribution of esterification within a 50% esterified pectin i~ediately shows that the charged oligomers in this pectin are far from randomly distributed. The initial slope of the cotton plot would be consistent with 85% esterification of the sample if the pattern were random. Slightly more than 80% of the GalAcontaining oligomers from this sample were GalA-Gal. If there were a strict repeating pattern of alternation between esterified and nonesterified residues, the degree of esterification would have to be 50%. Since the dm of the cotton pectin is 50%, this pattern of alternation should predominate, but there must also be small amounts of contiguous esterified residues to offset the decrease in overall dm contributed by the GalA,-Gal and higher oligomers. If the pattern of esterifi- cation is close to being alternating and the homog~acturonan chain takes on an extended ribbon conformation, all of the negative charges would be on one side of the ribbon and the esters on the other. It is possible that the Ca2+ crosslinked “eggbox” structures proposed by Powell et a1.3 could form from one side of such a homogalacturonan ribbon but not the other.
It is likely that in some cases our methods described here may not show the entire distribution of lengths of contiguous nonesterified uranic acids. Since both methods of detection (UV for 2-AP labeled oligosaccharides and PAD for noma- beled oligosa~harides) respond in a molar or submolar manner, as the oligomers get larger, for the same proportion of the mass of the initial pectin sample, the sensitivity for detection gets lower. Thus, long blocks of nonesterified GalA residues may go undetected. We are developing a postcolumn detection system (Thomas and Mort, unpublished work) which responds to sugar on a mass basis. The sodium acetate gradient described for separating the oligomers does not provide resolution above dp N 12. We are investigating the use of potassium oxalate gradientsi6, in concert with the new mass-sensitive detection system, to solve this problem.
We can envisage at least two mechanisms by which nonrandom distribution of esterification could lead to a plot predicted for a random distribution. The three apple pectin samples that provided linear plots of the log of the relative UV detector responses but with slopes not predicted by their dm values may be examples of these situations. (I) The pectin sample may contain two different domains, existing as intermixed polymers or within individual chains of the poly- mer. Pectins are known to consist of homogalacturonan regions (almost entirely GalA) and “hairy” regions24 (which probably correspond to what McNeil et a1.4 call rh~ogalacturonan I) in which rhamnose is interspersed frequently or at every second residue along the backbone with side chains often attached to them. In several different plant cell walls, the GalA-Rha repeated disaccharide in this

A.J. Mart et al. /Carbohydr. Res. 247 (1993) 21-35 31
fraction appears not to be methyl esterified =. The sample of apple pectin desig- nated Roth A gave a plot for the distribution of nonesterified GalA with a slope of -0.24, which corresponds to a dm of 42%, whereas by GLC analysis it was found to be only 25.6%. The rhamnose content for the Roth A pectin was found by GLC to be higher than the other pectin samples, and a large peak was observed in the HPLC chromatograms corresponding to the GalA-Rha dianhydride. The Roth A sample appears therefore to contain a significant content of rhamnogalacturonan I-like regions. It is likely that the GalA-Rha oligomers contribute to the total GalA content for this pectin without contributing to the methyl ester content. The dm estimated by the two different methods, one dependent on the ratio of total GalA to Gal and the other on the frequency of purified GalA,-Gal oligomers, could be expected to differ in this case. (2) DeVries et al. l1 have proposed that apple fruit pectins immediately after their synthesis might have a pattern of methyl ester distribution of [(GalAMe),-GalA],, but that the pattern becomes less precise after deesterification. If the deesterification were random, it is likely that the distribu- tion of nonesterified stretches of GalA would appear to become random sooner than the overall pattern of esterification. Thus, esterified clusters would persist. Since the esterified blocks in pectins are not accounted for in the present procedure, pectins of high degree of esterification may yield oligomers that give linear plots of the log of the relative detector responses, but with the slope expected for a lower degree of esterification. Plainly the distribution of lengths for contiguous methyl-esterified GalA residues should also be determined to obtain a complete picture of the distribution of esterification in the pectin. We are working out details of a procedure to do this in which, after the reduction of the esterified residues to galactose, residual GalA residues are destroyed using lithium metal in ethylenediamine, leaving homogalactan oligomers26y27.
Given these two means by which a linear plot of the log of the relative detector response could be obtained for nonrandom distribution of esterification, we suggest that such plots should only be taken to indicate randomness if their slopes are what would be predicted by an independently measured dm.
The more general way to look at the distribution of nonmethyl esterified oligomers for a pectin is to compare the abundance of each oligomer produced using the methods described here directly with those predicted for a random distribution. In this way even small deviations (which would be minimized by conversion to logarithmic plots) can be discerned. Table I gives comparisons between the expected and experimentally derived proportions of GalA,-Gal oligomers produced from three different pectins. For the two apple pectins, NS-2 and Sigma, whose plots gave slopes very close to those predicted for their dm values, the correspondence of oligomers is quite good and there are no obvious major deviations from the expected decrease in oligomer abundance. The decrease in oligomer abundance for Roth A apple pectin does not match the pattern expected from its dm (25%); instead, it matches more closely a pattern expected for a dm of 42%. This deviation from the expected decrease in oligomer abun-

32 A.1 Mart et al. / Carbohydr. Rex 247 (1993) 21-35
TABLE I
Comparison of relative abundance of Gal&,-Gal oligomers obtained from three pectins to those predicted for randomly esterified pectins of the same dm
NS”2 Sigma Roth A
UV a Predicted UV * Predicted W * Predicted Predicted for dm 51% b for dm 62% ’ for dm 25% b for dm 42% c
GalATGal 1 1 1 1 1 1 1 GalA,-Gaf 0.50 0.49 0.40 0.38 0.66 0.74 0.58 GalA,-Gal 0.20 0.24 0.14 0.15 0.30 0.55 0.34 Ga&-Gal 0.11 0.12 0.06 0.06 0.20 0.41 0.19 GalA,-Gal 0.05 0.06 0.026 0.022 0.11 0.31 0.11 GaL4,-Gal 0.026 0.028 0.010 0.008 0.06 0.23 0.06
’ Normalized oligomer abundance from integrated areas using UV detection. * Measured dm for this sample. ’ The dm values were deduced from the log-linear piot of this pectin.
dance for Roth A supports our hypothesis that two different domains, differing in distribution of methyl-esterified GalA, exist in this pectin,
EXPERIMENTAL
Materials.-Apple pectins were a gift from Dr. Benjamin Jones of Campbell Soup Company (Camden, NJ). Another apple pectin and imidazole were pur- chased from Sigma Chemical Co. (St. Louis, MO). Sodium borohydride and 2-aminopyridine were purchased from Aldrich Chemical Co. (Milwaukee, WI). Cell walls were prepared from cotton (Gossipium hirsutum L. cv Acala 44) suspension culture cells as previously described2’.
Pectin re~~c~~o~ .-Commercial pectin preparations and cell-wall extracts were reduced (to convert methyl-esterified galacturonic acid to galactose) using NaBH, as described previouslyX4. Reduced samples were desalted by EtOH precipitation and dried in vacua. During ~rohydride reduction methyl-esterified galacturonic acid was quantitatively converted to galactose, and the dm was calculated as the ratio of newly formed galactose to the total galacturonic acid in the unteduced sample by GLC14.
Hydrogen fzuoride soiuolysis. -Reduced samples (100 mg) were treated in Teflon vessels with liquid HF (10 mL), which was 1% (v/v> water using an apparatus described previously Is. This apparatu s keeps the highly corrosive HF completely contained until it has been rendered much less volatile and aggressive by complex- ation with Et,O. Reactions were carried out at - 15°C for 30 min. Reactions were initiated by addition of HF ~chilled in a boIding vessel to -20°C just prior to transfer) and terminated by submersion of the reaction vessel into liquid N,. The temperature of the HF holding vessel and reaction vessel was monitored using a type T thermocouple thermometer, equipped with a ffexible thermocouple probe encased in Teflon (Cole-Parmer Instrument Co., Chicago, IL). The HF was quenched by addition of dry ice cooled anhyd Et,0 (100 mI.J, allowing the frozen

A.J. Mort et aL. / Carbohydr. Res. 247 (1993) 21-35 33
HF to thaw and stir for 30 min. In preliminary experiments we found that addition of the HF at a temperature cooler than the targeted reaction temperature was necessary to avoid warming of the mixture above the targeted reaction tempera- ture upon addition of HF. Termination of reactions by first submerging the reaction vessel into liquid N, to freeze the mixture and then adding dry-ice-cooled anhyd Et,O, allowing the Et,O-HF complex to form during thawing of the mixture, avoided warming of the mixtures above the targeted reaction tempera- tures. The Et,O-HF was evaporated in vacua, and the remaining material was dissolved into 100 mM AcOH, 1 mL per 10 mg, and incubated at 80°C overnight to hydrolyze the fluoro groups from the reducing ends of the oligosaccharides. Samples were then frozen, lyophilized, and utilized for high-performance anion-ex- change separations.
High-performance anion-exchange chromatography.-Liquid chromatographic separations were carried out on a Dionex Bio-LC (Dionex Corp., Sunnyvale, CA). The system consisted of a gradient pump module, an eluant-degassing module, a pulsed amperometric detector (PAD), and a variable wavelength detector. Pulse potentials and durations used for the pulsed amperometric detector in this study were as follows: E,, 0.05 V, t,, 480 ms; E,, 0.60 V; t,, 120 ms; E, -0.60 V; t,, 60 ms. The response time for the detector was set at 1 s. Separations were carried out using a PA1 pellicular anion-exchange column (4 X 250 mm) at 1 mL min-‘. Eluant I was water, eluant 2 was M NaOAc, pH 5.2. Samples (100 pg to 1 mg) were injected into a system equilibrated at 30 mM NaOAc (97% eluant I, 3% eluant 2), and sample components were eluted after a 3 min lag period using a linear gradient of NaOAc from 30 to 200 mM over 27 min, then to 500 mM over 25 min, and after a 5 min hold, to 750 mM within 5 min, with a final 5 min hold. The system was allowed to equilibrate at initial conditions for at least 5 min prior to another injection. Chromatographic data were collected using custom built data loggers” and downloaded into a Macintosh 11x computer. Chromatographic data were viewed and quantitated using the program Analog Connection Chrom (Strawberry Tree Computer, Inc.). Peak identities were confirmed by ‘H NMR spectroscopy and by liquid secondary-ion mass spectroscopy of desalted fractions. Relative molar quantities of peaks were obtained by comparison of the pulsed amperometric response to the UV response for 2-aminopyridinylaminated sam- ples, prepared as previously described*l.
Other procedures.-Gas chromatographic analysis of trimethylsilylated sugar derivatives29 was conducted with a Varian 3300 gas chromatograph (Varian Associates, Palo Alto, CA) using a DB-1 fused silica capillary column (30 m x 0.25 mm, 0.25-pm film thickness: J&W Scientific Inc., Ranch0 Cardova, CA) and inositol as internal standard I4 ‘H NMR spectra of selected chromatographic .
fractions were recorded at 400 MHz using a Varian XL400 superconducting NMR spectrometer (Varian Associates, Palo Alto, CA) at 25°C with D,O as solvent and TSP as internal standard (0.00 ppm) on 400 MHz operating frequency. Liquid secondary-ion mass spectrometry was conducted using a VG Instruments ZAB

34 A.J. Mort et aL / Carbohydr. Rex 247 (1993)21-35
2SE mass spectrometer in the positive-ion mode using thio~ycerol as matrix, as
described by Dellm.
ACKNOWLEDGMENTS
The authors thank Dr. Jerry Merz for configuring the data acquisition system used in this study. Appreciation is also expressed to Dr. Margaret Pierce for numerous helpfu1 comments during manuscript preparation, and to Mr. Paul West for obtaining the mass spectra. This work was supported by DOE grant DE-FGO5 86ER13496, USDA grant 90-34150-5022, and the Oklahoma Agricultural Experi- ment Station. The ZAB 2SE mass spectrometer was obtained partially via NSF grant BSS-8704089, and the Varian XL+lQO NMR spectrometer in part via NSF grant CHE-8718150. This is journal article No. J-6375 of the Agricultural Experi- ment Station, Oklahoma State University, Stillwater, Oklahoma.
REFERENCES
1 N.O. Maness, F. Qiu, and A.J. Mart, Abstr. Papers Am. Chem. Sot. Natf. Meeting, 203 (1992) Abstr., CARB-94.
2 D. Oakenfull and A. Scott, J. Food Sci, 49 (1984) 1093-1098. 3 D.A. Powell, E.R. Morris, M.J. Gidley, and D.A. Rees, J. Mol. Biol., 155 (1982) 517-531. 4 M. McNeil, A.G. Darvill, S.C. Fry, and P. Albersheim, Annu. Rev. Biochem., 53 (1984) 62.5-663. 5 R.L. Fischer and A.B. Bennett, Annu. Reu. Plant Physiol. Plant Mol. Biol., 42 (1991) 675-703. 6 S.S. Virk and R.E. Cleland, Planta, 176 (1988) 60-67. 7 J.E. Vamer and R. Taylor, Plant Physiol., 91 (1989) 31-33. 8 V. Vreeland, S.R. Morse, R.H. Robichaux, K.L. Miller, ST. Hua, and W.M. Laetsch, Planta, 177
(1989) 435-446. 9 A.J. Taylor, Ca~hydr. Pofym., 2 (1982) 9-17.
10 C.E. Tuerena, AJ. Taylor, and J.R. Mitchell, Ca~hy~r. PO&~., 2 (1982) 193-203. 11 J.A. deVries, M. Hansen, J. Soderberg, P.E. Glahn, and J.K. Pedersen, Carbohydr. Polym., 6 (19861
169-176. 12 H. Grasdalen, O.E. Bakoy, and B. Larsen, Carbohydr. Res., 184 (1988) 183-191. 13 E. Westerlund, P. Aman, R.E. Andersson, and R. Andersson, Carbohydr. Pofym., 14 (1991)
179-187. 14 N.O. Maness, J.D. Ryan, and A.J. Mort, Anal. Biochem., 185 (1990) 346-352. 15 A.J. Mort, P. Komalavilas, G.L. Rorrer, and D.T.A. Lamport, in H.F. Linskens and J.F. Jackson
(Eds.), Modem Methods of Plant Analysis, Vol. 10, Springer Verlag, Heidelberg, 1989, pp 37-69. 16 A.T. Hotchkiss and K.B. Hicks, Anal. Biochem., 184 (1990) ZOO-206 17 A.J. Mart, B.M. M~r~hbacher, M.L. Pierce, and N.O. Maness, Car~ydr. Res., 215 (1991)
219-227. 18 M. Dubois, &A. Gilles, J.K. Hamilton, P-A, Rebers, and F, Smith, Awl. Chem., 28 (1956) 350-356. 19 S.B. Tjan, A.G.J. Voragen, and W. Pilnik, Carbohydr, Res., 34 (1974) 15-23. 20 N.O. Maness and A.J. Mort, Anal. Biechem., 178 (19891248-254. 21 N.O. Maness, E.T. Miranda, and A.J. Mort, J. Chromatogr., 587 (1991) 177-183. 22 R.N. Ammeraal, G.A. Delgado, F.L. Tenbarge, and R.B. Friedman, Carbohydr. Res., 215 (1991)
179-192. 23 J. van Riel and C. Olieman, Carbohydr. Res., 215 (1991) 39-46. 24 J.A. devries, F.M. Rambouts, A.G.J. Voragen, and W. Pilnik, Carbohydr. Polym., 3 (1983) 245-258. 25 P. Komalavilas and A.J. Mort, Carbohydr. Res., 189 (1989) 261-272.

A.J. Mart et al. /Carbohydr. Res. 247 (1993) 21-35 3.5
26 A.J. Mart and W.D. Bauer, J. Biol. Chem., 257 (1982) 1870-1875. 27 J.M. Lau, M. McNeil, A.G. Darvill, and P. Albersheim, Carbohydr. Rex, 168 (1987) 219-243. 28 J.M. Merz and A.J. Mort, Anal. B&hem., 207 (1992) 351-353. 29 M.F. Chaplin, Anal. Biochem., 125 (1982) 336-341. 30 A. Dell, Adv. Carbohydr. Chem. B&hem., 45 (1987) 19-72.


