Embed Size (px)
Citation preview
PRIMARY RESEARCH PAPER
Determining discharges from the Table Mountain Group(TMG) aquifer to wetlands in the Southern Cape,South Africa
W. Roets Æ Y. Xu Æ L. Raitt Æ M. El-Kahloun Æ P. Meire ÆF. Calitz Æ O. Batelaan Æ C. Anibas Æ K. Paridaens ÆT. Vandenbroucke Æ N. E. C. Verhoest Æ L. Brendonck
Received: 24 August 2007 / Revised: 10 March 2008 / Accepted: 9 April 2008 / Published online: 25 April 2008
� Springer Science+Business Media B.V. 2008
Abstract The focus of this study was to determine
whether coastal wetlands in lowland settings could be
dependent on groundwater from the deep circulating
confined Table Mountain Group (TMG) aquifer.
Groundwater interactions with wetlands are normally
perceived to be limited to primary aquifers. A
comparative study was done between two endorheic
coastal wetlands in the southern Cape. Earlier reports
stated that these groundwater dependent wetlands were
fed by discharges from the fixed dunes surrounding
them. On the basis of a three-dimensional electrical
conductivity (EC) interpolation for Groenvlei, a
hydrological link between the TMG aquifer and
Groenvlei and Van Kervelsvlei was investigated by
measuring water level and quality of groundwater and
surface water. Water quality parameters used were EC,
pH, Na+, Fe2+ and Cl-. The results from this, and an
O. Batelaan � C. Anibas
Department of Hydrology and Hydraulic Engineering,
Vrije Universiteit Brussel, Pleinlaan 2, 1050 Brussels,
Belgium
O. Batelaan
Department Geography–Geology, K.U. Leuven, Leuven,
Belgium
K. Paridaens � T. Vandenbroucke
Interuniversity Programme in Water Resources
Engineering, Vrije Universiteit Brussel–K.U. Leuven,
Brussel, Belgium
N. E. C. Verhoest
Laboratory of Hydrology and Water Management, Ghent
University, Coupure links 653, Ghent, Belgium
L. Brendonck
Laboratory of Aquatic Ecology, K.U. Leuven, Ch. de
Beriotstraat 32, 3000 Leuven, Belgium
Handling editor: D. Hamilton
The first author did the research as part of his PhD in the
Department of Earth Sciences of the University of the Western
Cape, Bellville, South Africa. Funding is quoted under
acknowledgements.
W. Roets (&)
SSI Engineers and Environmental Consultants (Pty) Ltd
(A DHV - Company), Postnet Suite #200, P/Bag X6590,
George 6530, South Africa
e-mail: [email protected]
Y. Xu
Department of Earth Sciences, University of the Western
Cape, P/Bag X17, Bellville 7535, South Africa
L. Raitt
Department of Botany, University of the Western Cape,
P/Bag X17, Bellville 7535, South Africa
M. El-Kahloun � P. Meire
Department of Biology, Ecosystem Management
Research Group, University of Antwerp, KDE
Universiteitsplein1, 2610 Antwerp, Belgium
F. Calitz
ARC Biometry Unit, P/Bag X5013, Stellenbosch 7599,
South Africa
123
Hydrobiologia (2008) 607:175–186
DOI 10.1007/s10750-008-9389-x
accompanying study, on the basis of water quality and
plant nutrient cycling assessments, indicated direct
groundwater discharges from the TMG to at least Van
Kervelsvlei, with Groenvlei receiving secondary dis-
charges from the TMG via Van Kervelslvlei. These
findings significantly affect the current knowledge on
which water balance models are based for the deter-
mination of groundwater availability for the area.
Keywords Ecohydrology � River basin
management � TMG aquifer � Groundwater dependent
wetlands � Wetland ecology � Coastal wetlands
Introduction
Many authors in different parts of the world have
highlighted the importance of wetlands (Goudie &
Viles, 1997; Davies & Day, 1998; Middleton, 1999),
because they render many free services in terms of
water quality and quantity management. Middleton
(1999) states that wetlands provide benefits to human
societies, from the direct resource potential provided
by products such as fisheries and fuel wood, to the
ecosystem value in terms of hydrology and produc-
tivity, up to a value on the global level in terms of the
role of wetlands in atmospheric processes and general
life-support. Wetlands also have an intrinsic value in
the broader environment because of the many envi-
ronmental and ecological services they supply
(Davies & Day, 1998). Unfortunately, many wetlands
worldwide have been destroyed and are currently
being degraded due to anthropogenic activities.
With the ever-increasing water demand, ground-
water use will increase and may compromise the
integrity of groundwater dependent wetlands. It is
therefore important to protect and manage wetlands
as part of the bigger hydrological cycle to ensure their
persistence. However, to achieve this we need to
understand the functioning of wetlands, from both a
hydrological and ecological perspective, including
the interactions between both. Many scientists agree
that the main driving force of a wetland is the
hydrology of the wetland, i.e. the duration and level
of inundation that can result from surface flows,
groundwater discharge and recharge, or a mixture of
both (Goudie & Viles, 1997; Davies & Day, 1998;
Colvin et al., 2002; Le Maitre et al., 2002). In order
to manage the wetlands in a sustainable way it is
important to know whether groundwater or surface
water dominates as the ecological driver.
Groundwater discharges to wetlands are a common
phenomenon (Hatton & Evans, 1998; Winter et al.,
1999), but discharges to wetlands from the semi-
confined to confined TMG aquifer in South Africa
were to date generally predicted to be associated with
seeps, wetlands and mires at higher elevation (Scott &
Le Maitre, 1998; Colvin et al., 2002; Brown et al.,
2003; Sieben, 2003). However, a conceptual model
developed by Roets et al. (2008), describes the
groundwater interface between the TMG aquifer and
aquatic ecosystems in two primary areas, namely, in
the high elevation ‘‘exposed TMG’’ recharge areas,
the so-called ‘‘TMG aquifer daylight-domain’’, and at
the discharge end of the TMG aquifer in the lowlands
in the so-called ‘‘TMG aquifer surface water inter-
face-domain’’. The discharge end of the TMG is
located far away in the lowlands resulting in deep
groundwater circulation to either hot or cold springs in
the landscape, or marine environment, a view sup-
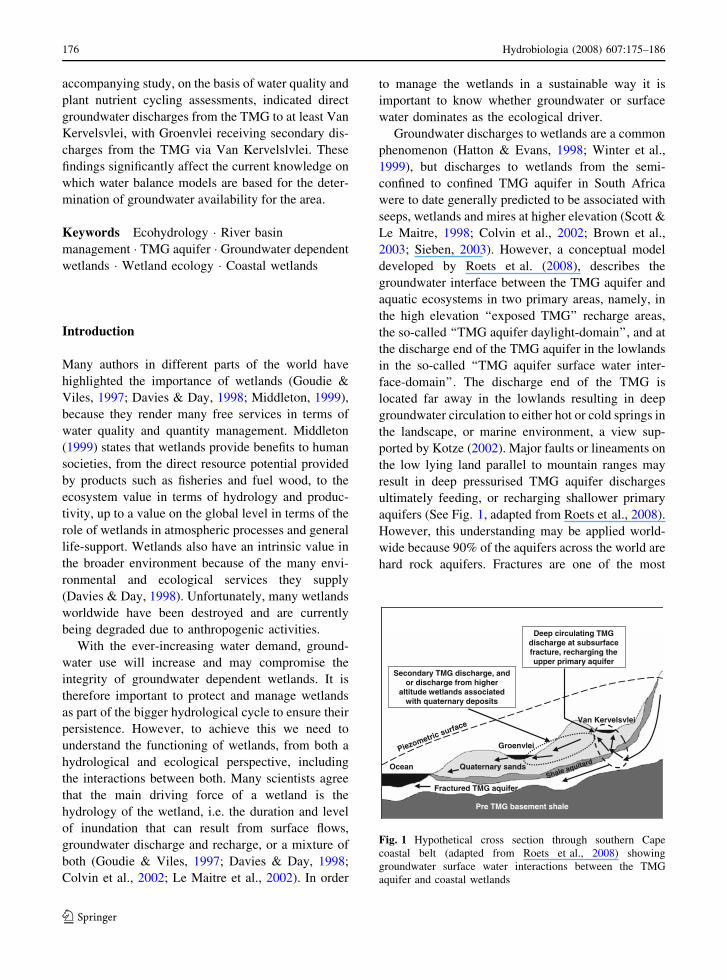
ported by Kotze (2002). Major faults or lineaments on
the low lying land parallel to mountain ranges may
result in deep pressurised TMG aquifer discharges
ultimately feeding, or recharging shallower primary
aquifers (See Fig. 1, adapted from Roets et al., 2008).
However, this understanding may be applied world-
wide because 90% of the aquifers across the world are
hard rock aquifers. Fractures are one of the most
Pre TMG basement shale
Quaternary sands
Fractured TMG aquifer
Shale aquitardOcean
Groenvlei
Van Kervelsvlei
Deep circulating TMGdischarge at subsurfacefracture, recharging theupper primary aquifer
Secondary TMG discharge, and or discharge from higher
altitude wetlands associatedwith quaternary deposits
Piezometricsurface
Fig. 1 Hypothetical cross section through southern Cape
coastal belt (adapted from Roets et al., 2008) showing
groundwater surface water interactions between the TMG
aquifer and coastal wetlands
176 Hydrobiologia (2008) 607:175–186
123
abundant structures in geology found in almost all
rocks and soils at or near the earth’s surface (Barton &
Hsieh, 1989). Goudie & Viles (1997) list many
countries around the globe where hard rock aquifers
have been affected by groundwater use.
The aim in this article is to validate the prediction
that groundwater discharges from the deep circulating
TMG aquifer to lowland wetlands are possible, on the
basis of data from a water quality study in Groenvlei
and Van Kervelsvlei. Both wetlands are located in
such an area, in the coastal zone of the southern Cape.
While previous reports stated that these wetlands are
fed by freshwater from the surrounding fixed dune
systems (Parsons, 2005a, b), the aim in this study was
to determine a connection between the deep circulat-
ing TMG aquifer and these lowland coastal wetlands,
which are associated with primary aquifers. The TMG
aquifer discharges are characterised by water quality
parameter ranges of low EC 2.6–155 mS/m, low
concentrations of cations like Na+ 7.2–232.8 mg/l,
Fe2+ concentrations of \0.1–15.4 mg/l, and low con-
centrations of anions like Cl- 4.5–395.2 mg/l (Brown
et al., 2003).
As Groenvlei and Van Kervelsvlei are both seen as
important and sensitive wetlands, from a local, national
and even international perspective, they were the focus
point of the study, and our findings will enable better
management of these valuable wetlands and inform
future groundwater development proposals. In a par-
allel study (Roobroeck et al., in press), the relationship
between vegetation and groundwater quality in Gro-
envlei and Van Kervelsvlei was assessed to determine
possible groundwater discharge gradients.
Study site
Site selection
The southern Cape is characterised by a large number
of coastal wetlands, many of which are estuarine
systems. All these wetlands are associated with a
historic embayment running parallel to the Outeniqua
Mountains fringing the coastline. Wetland sites for
this study were selected on the basis of their
endorheic nature, indicating their dependency on
groundwater, with no inflow, or outflow, or connec-
tion to the sea. These study sites had to be located in
the ‘‘TMG aquifer surface water interface-domain’’.
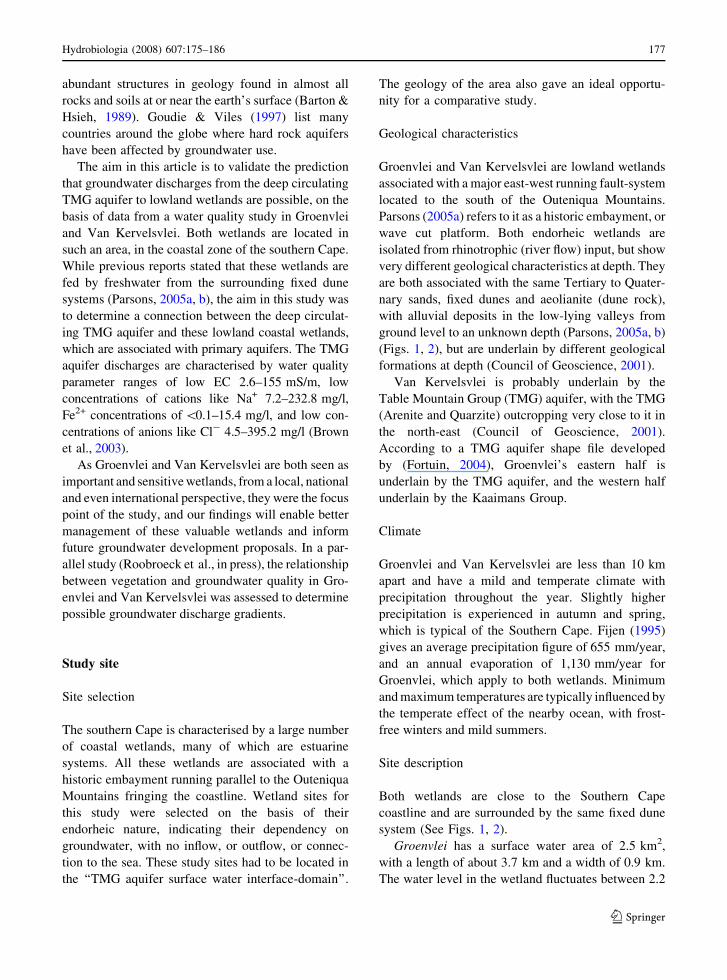
The geology of the area also gave an ideal opportu-
nity for a comparative study.
Geological characteristics
Groenvlei and Van Kervelsvlei are lowland wetlands
associated with a major east-west running fault-system
located to the south of the Outeniqua Mountains.
Parsons (2005a) refers to it as a historic embayment, or
wave cut platform. Both endorheic wetlands are
isolated from rhinotrophic (river flow) input, but show
very different geological characteristics at depth. They
are both associated with the same Tertiary to Quater-
nary sands, fixed dunes and aeolianite (dune rock),
with alluvial deposits in the low-lying valleys from
ground level to an unknown depth (Parsons, 2005a, b)
(Figs. 1, 2), but are underlain by different geological
formations at depth (Council of Geoscience, 2001).
Van Kervelsvlei is probably underlain by the
Table Mountain Group (TMG) aquifer, with the TMG
(Arenite and Quarzite) outcropping very close to it in
the north-east (Council of Geoscience, 2001).
According to a TMG aquifer shape file developed
by (Fortuin, 2004), Groenvlei’s eastern half is
underlain by the TMG aquifer, and the western half
underlain by the Kaaimans Group.
Climate
Groenvlei and Van Kervelsvlei are less than 10 km
apart and have a mild and temperate climate with
precipitation throughout the year. Slightly higher
precipitation is experienced in autumn and spring,
which is typical of the Southern Cape. Fijen (1995)
gives an average precipitation figure of 655 mm/year,
and an annual evaporation of 1,130 mm/year for
Groenvlei, which apply to both wetlands. Minimum
and maximum temperatures are typically influenced by
the temperate effect of the nearby ocean, with frost-
free winters and mild summers.
Site description
Both wetlands are close to the Southern Cape
coastline and are surrounded by the same fixed dune
system (See Figs. 1, 2).
Groenvlei has a surface water area of 2.5 km2,
with a length of about 3.7 km and a width of 0.9 km.
The water level in the wetland fluctuates between 2.2
Hydrobiologia (2008) 607:175–186 177
123
and 3.43 m (mean of 2.76 m) above mean sea level
(msl) (Parsons, 2007), and the open water has a
perimeter of 10.3 km. The average depth of the open
water is 3.7 m with a maximum depth of 6 m, and a
catchment area of 13.8 km2 (Fijen, 1995). Only three
small shoreline areas are present which limits the bird
species visiting the lake. Groenvlei is surrounded
along its entire perimeter by different reeds namely:
Phragmites angustifolia, Juncus kraussi, Typha
capensis, Cladium mariscus, Thelypteris palustris,
Hydrocotyle verticillata, Senecio helenifolia, Scirpus
sp. and Scrophulariacea (Martin, 1960; Van Der
Merwe, 1979; Goldblatt & Manning, 2000). It is one
of CapeNature’s Nature Reserves and is therefore
statutory protected and viewed as an ecologically
sensitive aquatic ecosystem being the only endorheic
coastal lake in South Africa.
The Van Kervelsvlei is one of very few and unique
Sphagnum peat wetlands in South Africa and covers
an area of about 50 hectares. Van Kervelsvlei has no
open water but the plant roots and tussocks are
permanently inundated with water. The peat is in
access of 10 m deep (Irving & Meadows, 1997). Van
Kervelsvlei is classified as a floating bog, a rare and
interesting landform in Africa, and is located in the
fossil dune fields at 34�007100 S 22�5402200 E in
the southern Cape (Irving & Meadows, 1997). The
surface is covered by a mat of sedge vegetation to a
depth of 2 m below the surface. The water body is
endorheic and isolated from rhinotrophic input. Van
Kervelsvlei is a peat wetland dominated by reeds and
sedge vegetation consisting of: Typha capensis,
Cladium mariscus, Thelypteris palustris, Juncus
kraussi and Carex clavata (Martin, 1960; Van Der
Merwe, 1979; Goldblatt & Manning, 2000). The fixed
dune system surrounding Van Kervelsvlei has been
intensively planted with pine species.
Materials and methods
Groundwater and surface water quality, and ground-
water level data, were measured at pre-selected sites
in the wetlands, to characterise the origin of ground-
water feeding these wetlands.
Pre-selected sites were determined along hypothet-
ical hydrological gradients that could indicate a link
between the TMG aquifer and both wetlands. Piezom-
eters of different depths were installed at these sites to
determine groundwater level and quality. Surface
water assessments were done at piezometer sites in
both wetlands, where it was present, to enable
comparing groundwater and surface water.
Surface water quality
The electrical conductivity (EC) profile for Groenvlei
was assessed to develop a three-dimensional (3-D)
Geology -Western CapeARENITEQUARTZITECONGLOMERATESEDIMENTARY
8 0 8 16 Kilometers
N
EW
S
Groenvlei
Van Kervelsvlei
Fig. 2 Geological components and outcrop areas, with the Arenite and Quartzite containing TMG located just north-east of Van
Kervels and Groenvlei (Council of Geoscience, 2001), indicating the close proximity of the TMG aquifer
178 Hydrobiologia (2008) 607:175–186
123
interpollation for the lake. This was achieved by
using sampling points generated in GIS (Arcview 3.3)
(ESRI, 1996), which was overlaid on digital aerial
photography of Groenvlei. The GIS grid divided the
lake into blocks by north-south (gridlines 300 m
apart) and east-west running transects (gridlines
spaced at 150 m) dissecting each other perpendicular.
At each point where transects intersected on the open
water, sampling points were selected. Measurements
were performed at each of the 53 points. At each
sampling point conductivity, temperature, pH and
depth was measured as the pre-programmed Yellow
Springs Instruments (YSI) 6600 probe was sub-
merged. The YSI 6600 probe was programmed to
measure the parameters at a two second interval. At
each site the probe was allowed to stabilise before it
was slowly lowered to required depth.
As Van Kervelsvlei did not have open water like
Groenvlei, the conductivity, temperature, pH and
depth measurements were taken at the piezometers
and free surface water where present.
Groundwater levels and water quality
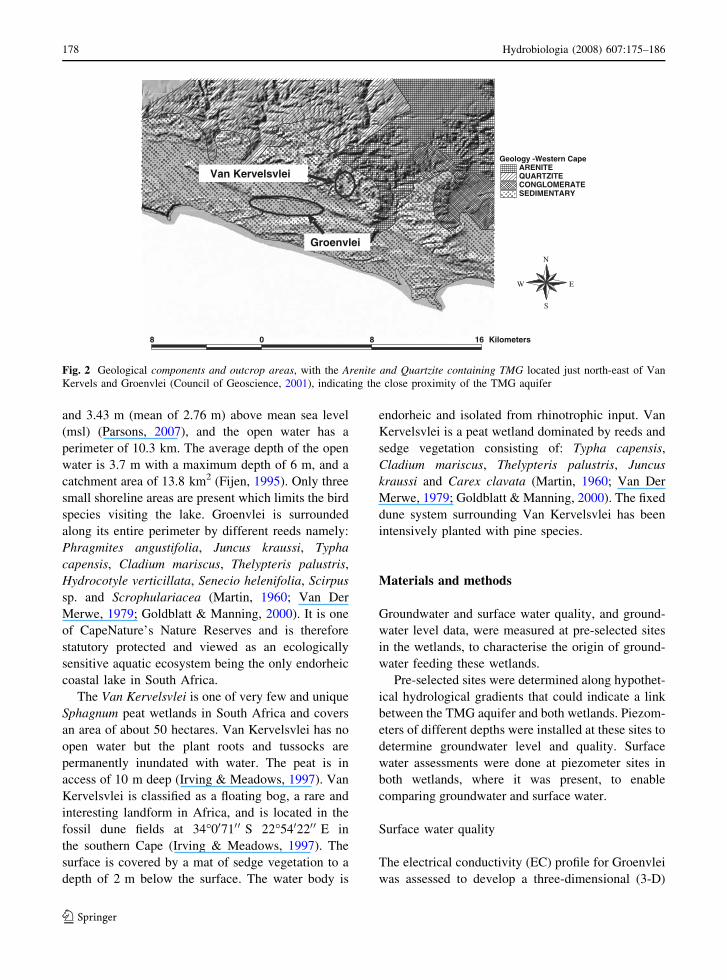
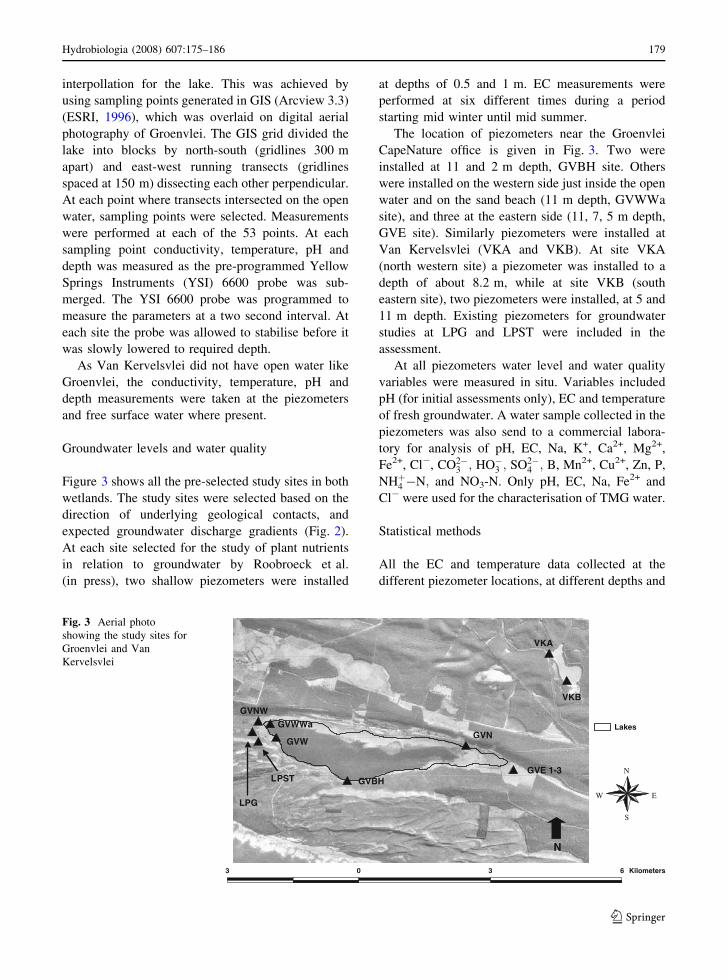
Figure 3 shows all the pre-selected study sites in both
wetlands. The study sites were selected based on the
direction of underlying geological contacts, and
expected groundwater discharge gradients (Fig. 2).
At each site selected for the study of plant nutrients
in relation to groundwater by Roobroeck et al.
(in press), two shallow piezometers were installed
at depths of 0.5 and 1 m. EC measurements were
performed at six different times during a period
starting mid winter until mid summer.
The location of piezometers near the Groenvlei
CapeNature office is given in Fig. 3. Two were
installed at 11 and 2 m depth, GVBH site. Others
were installed on the western side just inside the open
water and on the sand beach (11 m depth, GVWWa
site), and three at the eastern side (11, 7, 5 m depth,
GVE site). Similarly piezometers were installed at
Van Kervelsvlei (VKA and VKB). At site VKA
(north western site) a piezometer was installed to a
depth of about 8.2 m, while at site VKB (south
eastern site), two piezometers were installed, at 5 and
11 m depth. Existing piezometers for groundwater
studies at LPG and LPST were included in the
assessment.
At all piezometers water level and water quality
variables were measured in situ. Variables included
pH (for initial assessments only), EC and temperature
of fresh groundwater. A water sample collected in the
piezometers was also send to a commercial labora-
tory for analysis of pH, EC, Na, K+, Ca2+, Mg2+,
Fe2+, Cl-, CO2�3 ; HO�3 ; SO2�
4 ; B, Mn2+, Cu2+, Zn, P,
NHþ4 �N; and NO3-N. Only pH, EC, Na, Fe2+ and
Cl- were used for the characterisation of TMG water.
Statistical methods
All the EC and temperature data collected at the
different piezometer locations, at different depths and
Lakes
3 0 3 6 Kilometers
N
EW
S
VKA
VKB
GVE 1-3
GVN
GVBH
GVW
GVWWa
GVNW
LPG
LPST
N
Fig. 3 Aerial photo
showing the study sites for
Groenvlei and Van
Kervelsvlei
Hydrobiologia (2008) 607:175–186 179
123
at different dates were statistically analysed using
SAS statistical software (SAS, 1999). Not all the
combinations were measured on the different dates;
therefore, the data were treated as an incomplete
block design with the different dates as blocks. The
treatment design was factorial with factors 10 loca-
tions (GVBH, GVW, GVWWa, GVNW, LPG, LPST,
GVE, GVN, VKA and VKB) and 10 depths (0.5, 1, 2,
6.5, 3, 5, 6, 7, 8.2 and 11 m) replicated in 6 blocks
(30/7, Blab, 19/7, 12/10, 27/10 and 29/9). The EC and
ln(EC) transformed data were subjected to a two
factor analyses of variance. A Shapiro–Wilk test was
performed on residuals to test for deviations from
non-normality (Shapiro & Wilk, 1965). Student
t-LSD (least significant difference) was calculated
at a 5% significance level to compare means of
significant effects.
Furthermore, a multivariate cluster (using EC and
temperature means) was based on the distance
between clusters, using the centroid method. As the
distance between clusters increased the cluster group-
ings decreased.
Results
Surface water quality
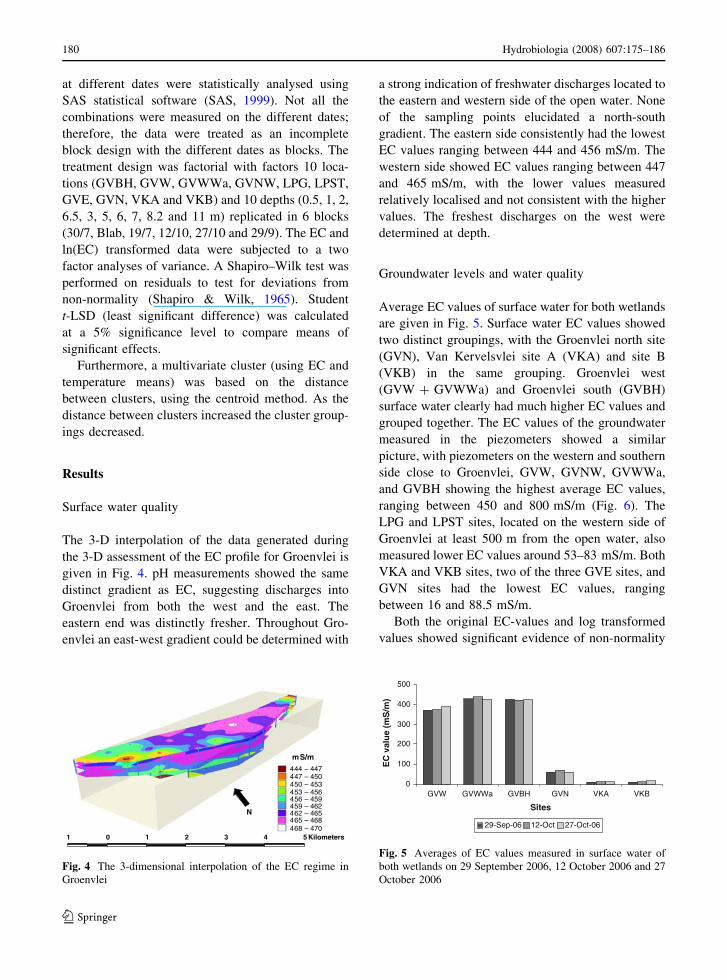
The 3-D interpolation of the data generated during
the 3-D assessment of the EC profile for Groenvlei is
given in Fig. 4. pH measurements showed the same
distinct gradient as EC, suggesting discharges into
Groenvlei from both the west and the east. The
eastern end was distinctly fresher. Throughout Gro-
envlei an east-west gradient could be determined with
a strong indication of freshwater discharges located to
the eastern and western side of the open water. None
of the sampling points elucidated a north-south
gradient. The eastern side consistently had the lowest
EC values ranging between 444 and 456 mS/m. The
western side showed EC values ranging between 447
and 465 mS/m, with the lower values measured
relatively localised and not consistent with the higher
values. The freshest discharges on the west were
determined at depth.
Groundwater levels and water quality
Average EC values of surface water for both wetlands
are given in Fig. 5. Surface water EC values showed
two distinct groupings, with the Groenvlei north site
(GVN), Van Kervelsvlei site A (VKA) and site B
(VKB) in the same grouping. Groenvlei west
(GVW + GVWWa) and Groenvlei south (GVBH)
surface water clearly had much higher EC values and
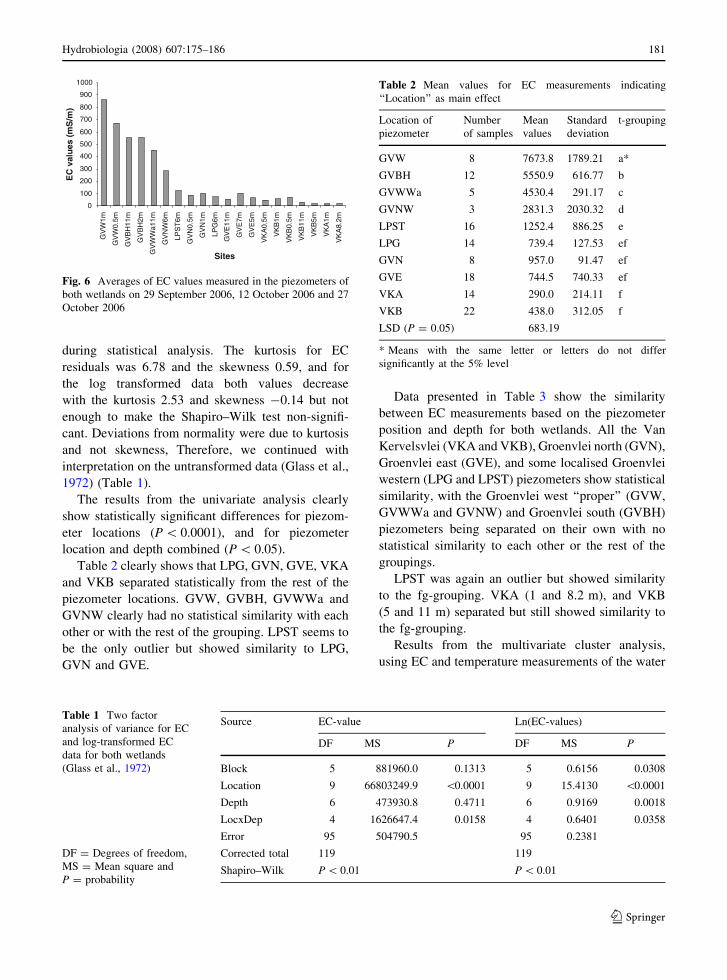
grouped together. The EC values of the groundwater
measured in the piezometers showed a similar
picture, with piezometers on the western and southern
side close to Groenvlei, GVW, GVNW, GVWWa,
and GVBH showing the highest average EC values,
ranging between 450 and 800 mS/m (Fig. 6). The
LPG and LPST sites, located on the western side of
Groenvlei at least 500 m from the open water, also
measured lower EC values around 53–83 mS/m. Both
VKA and VKB sites, two of the three GVE sites, and
GVN sites had the lowest EC values, ranging
between 16 and 88.5 mS/m.
Both the original EC-values and log transformed
values showed significant evidence of non-normality
444 – 447447 – 450450 – 453453 – 456456 – 459459 – 462462 – 465465 – 468468 – 470
N
mS/m
Kilometers1 0 1 2 3 4 5
Fig. 4 The 3-dimensional interpolation of the EC regime in
Groenvlei
0
100
200
300
400
500
GVW GVWWa GVBH GVN VKA VKB
Sites
EC
val
ue
(mS
/m)
29-Sep-06 12-Oct 27-Oct-06
Fig. 5 Averages of EC values measured in surface water of
both wetlands on 29 September 2006, 12 October 2006 and 27
October 2006
180 Hydrobiologia (2008) 607:175–186
123
during statistical analysis. The kurtosis for EC
residuals was 6.78 and the skewness 0.59, and for
the log transformed data both values decrease
with the kurtosis 2.53 and skewness -0.14 but not
enough to make the Shapiro–Wilk test non-signifi-
cant. Deviations from normality were due to kurtosis
and not skewness, Therefore, we continued with
interpretation on the untransformed data (Glass et al.,
1972) (Table 1).
The results from the univariate analysis clearly
show statistically significant differences for piezom-
eter locations (P \ 0.0001), and for piezometer
location and depth combined (P \ 0.05).
Table 2 clearly shows that LPG, GVN, GVE, VKA
and VKB separated statistically from the rest of the
piezometer locations. GVW, GVBH, GVWWa and
GVNW clearly had no statistical similarity with each
other or with the rest of the grouping. LPST seems to
be the only outlier but showed similarity to LPG,
GVN and GVE.
Data presented in Table 3 show the similarity
between EC measurements based on the piezometer
position and depth for both wetlands. All the Van
Kervelsvlei (VKA and VKB), Groenvlei north (GVN),
Groenvlei east (GVE), and some localised Groenvlei
western (LPG and LPST) piezometers show statistical
similarity, with the Groenvlei west ‘‘proper’’ (GVW,
GVWWa and GVNW) and Groenvlei south (GVBH)
piezometers being separated on their own with no
statistical similarity to each other or the rest of the
groupings.
LPST was again an outlier but showed similarity
to the fg-grouping. VKA (1 and 8.2 m), and VKB
(5 and 11 m) separated but still showed similarity to
the fg-grouping.
Results from the multivariate cluster analysis,
using EC and temperature measurements of the water
0
100
200
300
400
500
600
700
800
900
1000
GV
W1m
GV
W0.
5m
GV
BH
11m
GV
BH
2m
GV
WW
a11m
GV
NW
6m
LP
ST
6m
GV
N0.
5m
GV
N1m
LP
G6m
GV
E11
m
GV
E7m
GV
E5m
VK
A0.
5m
VK
B1m
VK
B0.
5m
VK
B11
m
VK
B5m
VK
A1m
VK
A8.
2m
Sites
EC
val
ues
(m
S/m
)
Fig. 6 Averages of EC values measured in the piezometers of
both wetlands on 29 September 2006, 12 October 2006 and 27
October 2006
Table 1 Two factor
analysis of variance for EC
and log-transformed EC
data for both wetlands
(Glass et al., 1972)
DF = Degrees of freedom,
MS = Mean square and
P = probability
Source EC-value Ln(EC-values)
DF MS P DF MS P
Block 5 881960.0 0.1313 5 0.6156 0.0308
Location 9 66803249.9 \0.0001 9 15.4130 \0.0001
Depth 6 473930.8 0.4711 6 0.9169 0.0018
LocxDep 4 1626647.4 0.0158 4 0.6401 0.0358
Error 95 504790.5 95 0.2381
Corrected total 119 119
Shapiro–Wilk P \ 0.01 P \ 0.01
Table 2 Mean values for EC measurements indicating
‘‘Location’’ as main effect
Location of
piezometer
Number
of samples
Mean
values
Standard
deviation
t-grouping
GVW 8 7673.8 1789.21 a*
GVBH 12 5550.9 616.77 b
GVWWa 5 4530.4 291.17 c
GVNW 3 2831.3 2030.32 d
LPST 16 1252.4 886.25 e
LPG 14 739.4 127.53 ef
GVN 8 957.0 91.47 ef
GVE 18 744.5 740.33 ef
VKA 14 290.0 214.11 f
VKB 22 438.0 312.05 f
LSD (P = 0.05) 683.19
* Means with the same letter or letters do not differ
significantly at the 5% level
Hydrobiologia (2008) 607:175–186 181
123
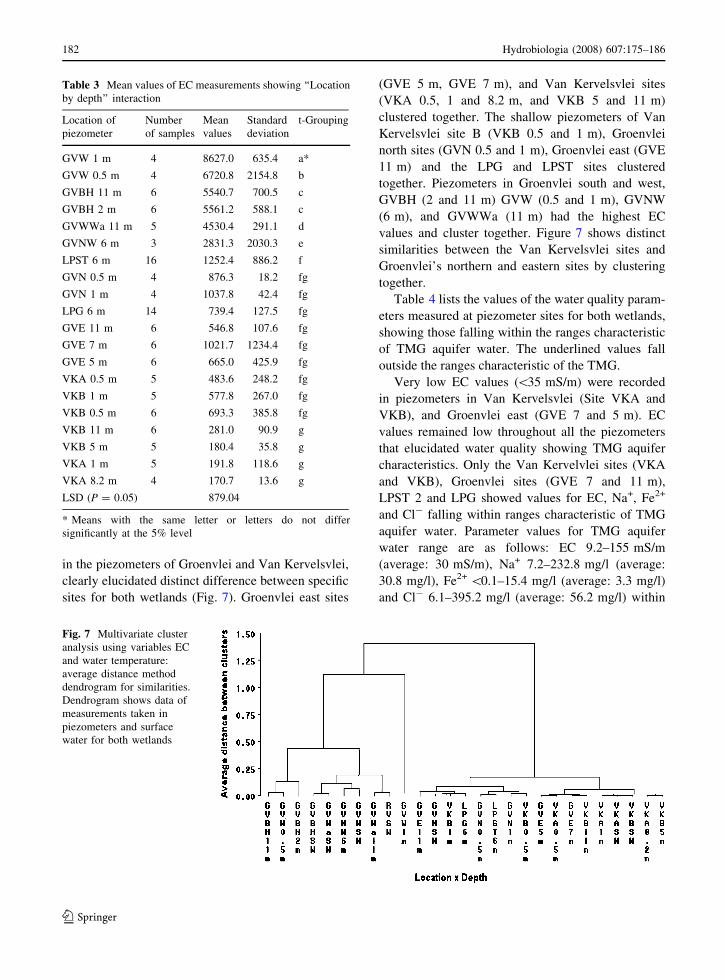
in the piezometers of Groenvlei and Van Kervelsvlei,
clearly elucidated distinct difference between specific
sites for both wetlands (Fig. 7). Groenvlei east sites
(GVE 5 m, GVE 7 m), and Van Kervelsvlei sites
(VKA 0.5, 1 and 8.2 m, and VKB 5 and 11 m)
clustered together. The shallow piezometers of Van
Kervelsvlei site B (VKB 0.5 and 1 m), Groenvlei
north sites (GVN 0.5 and 1 m), Groenvlei east (GVE
11 m) and the LPG and LPST sites clustered
together. Piezometers in Groenvlei south and west,
GVBH (2 and 11 m) GVW (0.5 and 1 m), GVNW
(6 m), and GVWWa (11 m) had the highest EC
values and cluster together. Figure 7 shows distinct
similarities between the Van Kervelsvlei sites and
Groenvlei’s northern and eastern sites by clustering
together.
Table 4 lists the values of the water quality param-
eters measured at piezometer sites for both wetlands,
showing those falling within the ranges characteristic
of TMG aquifer water. The underlined values fall
outside the ranges characteristic of the TMG.
Very low EC values (\35 mS/m) were recorded
in piezometers in Van Kervelsvlei (Site VKA and
VKB), and Groenvlei east (GVE 7 and 5 m). EC
values remained low throughout all the piezometers
that elucidated water quality showing TMG aquifer
characteristics. Only the Van Kervelvlei sites (VKA
and VKB), Groenvlei sites (GVE 7 and 11 m),
LPST 2 and LPG showed values for EC, Na+, Fe2+
and Cl- falling within ranges characteristic of TMG
aquifer water. Parameter values for TMG aquifer
water range are as follows: EC 9.2–155 mS/m
(average: 30 mS/m), Na+ 7.2–232.8 mg/l (average:
30.8 mg/l), Fe2+ \0.1–15.4 mg/l (average: 3.3 mg/l)
and Cl- 6.1–395.2 mg/l (average: 56.2 mg/l) within
Table 3 Mean values of EC measurements showing ‘‘Location
by depth’’ interaction
Location of
piezometer
Number
of samples
Mean
values
Standard
deviation
t-Grouping
GVW 1 m 4 8627.0 635.4 a*
GVW 0.5 m 4 6720.8 2154.8 b
GVBH 11 m 6 5540.7 700.5 c
GVBH 2 m 6 5561.2 588.1 c
GVWWa 11 m 5 4530.4 291.1 d
GVNW 6 m 3 2831.3 2030.3 e
LPST 6 m 16 1252.4 886.2 f
GVN 0.5 m 4 876.3 18.2 fg
GVN 1 m 4 1037.8 42.4 fg
LPG 6 m 14 739.4 127.5 fg
GVE 11 m 6 546.8 107.6 fg
GVE 7 m 6 1021.7 1234.4 fg
GVE 5 m 6 665.0 425.9 fg
VKA 0.5 m 5 483.6 248.2 fg
VKB 1 m 5 577.8 267.0 fg
VKB 0.5 m 6 693.3 385.8 fg
VKB 11 m 6 281.0 90.9 g
VKB 5 m 5 180.4 35.8 g
VKA 1 m 5 191.8 118.6 g
VKA 8.2 m 4 170.7 13.6 g
LSD (P = 0.05) 879.04
* Means with the same letter or letters do not differ
significantly at the 5% level
Fig. 7 Multivariate cluster
analysis using variables EC
and water temperature:
average distance method
dendrogram for similarities.
Dendrogram shows data of
measurements taken in
piezometers and surface
water for both wetlands
182 Hydrobiologia (2008) 607:175–186
123
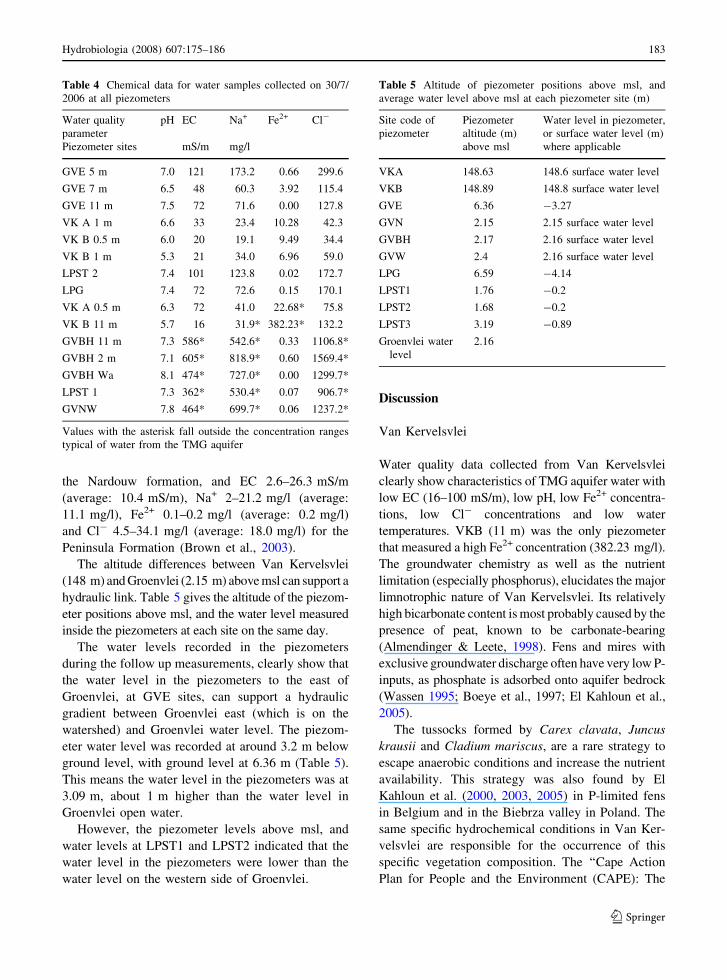
the Nardouw formation, and EC 2.6–26.3 mS/m
(average: 10.4 mS/m), Na+ 2–21.2 mg/l (average:
11.1 mg/l), Fe2+ 0.1–0.2 mg/l (average: 0.2 mg/l)
and Cl- 4.5–34.1 mg/l (average: 18.0 mg/l) for the
Peninsula Formation (Brown et al., 2003).
The altitude differences between Van Kervelsvlei
(148 m) and Groenvlei (2.15 m) above msl can support a
hydraulic link. Table 5 gives the altitude of the piezom-
eter positions above msl, and the water level measured
inside the piezometers at each site on the same day.
The water levels recorded in the piezometers
during the follow up measurements, clearly show that
the water level in the piezometers to the east of
Groenvlei, at GVE sites, can support a hydraulic
gradient between Groenvlei east (which is on the
watershed) and Groenvlei water level. The piezom-
eter water level was recorded at around 3.2 m below
ground level, with ground level at 6.36 m (Table 5).
This means the water level in the piezometers was at
3.09 m, about 1 m higher than the water level in
Groenvlei open water.
However, the piezometer levels above msl, and
water levels at LPST1 and LPST2 indicated that the
water level in the piezometers were lower than the
water level on the western side of Groenvlei.
Discussion
Van Kervelsvlei
Water quality data collected from Van Kervelsvlei
clearly show characteristics of TMG aquifer water with
low EC (16–100 mS/m), low pH, low Fe2+ concentra-
tions, low Cl- concentrations and low water
temperatures. VKB (11 m) was the only piezometer
that measured a high Fe2+ concentration (382.23 mg/l).
The groundwater chemistry as well as the nutrient
limitation (especially phosphorus), elucidates the major
limnotrophic nature of Van Kervelsvlei. Its relatively
high bicarbonate content is most probably caused by the
presence of peat, known to be carbonate-bearing
(Almendinger & Leete, 1998). Fens and mires with
exclusive groundwater discharge often have very low P-
inputs, as phosphate is adsorbed onto aquifer bedrock
(Wassen 1995; Boeye et al., 1997; El Kahloun et al.,
2005).
The tussocks formed by Carex clavata, Juncus
krausii and Cladium mariscus, are a rare strategy to
escape anaerobic conditions and increase the nutrient
availability. This strategy was also found by El
Kahloun et al. (2000, 2003, 2005) in P-limited fens
in Belgium and in the Biebrza valley in Poland. The
same specific hydrochemical conditions in Van Ker-
velsvlei are responsible for the occurrence of this
specific vegetation composition. The ‘‘Cape Action
Plan for People and the Environment (CAPE): The
Table 4 Chemical data for water samples collected on 30/7/
2006 at all piezometers
Water quality
parameter
pH EC Na+ Fe2+ Cl-
Piezometer sites mS/m mg/l
GVE 5 m 7.0 121 173.2 0.66 299.6
GVE 7 m 6.5 48 60.3 3.92 115.4
GVE 11 m 7.5 72 71.6 0.00 127.8
VK A 1 m 6.6 33 23.4 10.28 42.3
VK B 0.5 m 6.0 20 19.1 9.49 34.4
VK B 1 m 5.3 21 34.0 6.96 59.0
LPST 2 7.4 101 123.8 0.02 172.7
LPG 7.4 72 72.6 0.15 170.1
VK A 0.5 m 6.3 72 41.0 22.68* 75.8
VK B 11 m 5.7 16 31.9* 382.23* 132.2
GVBH 11 m 7.3 586* 542.6* 0.33 1106.8*
GVBH 2 m 7.1 605* 818.9* 0.60 1569.4*
GVBH Wa 8.1 474* 727.0* 0.00 1299.7*
LPST 1 7.3 362* 530.4* 0.07 906.7*
GVNW 7.8 464* 699.7* 0.06 1237.2*
Values with the asterisk fall outside the concentration ranges
typical of water from the TMG aquifer
Table 5 Altitude of piezometer positions above msl, and
average water level above msl at each piezometer site (m)
Site code of
piezometer
Piezometer
altitude (m)
above msl
Water level in piezometer,
or surface water level (m)
where applicable
VKA 148.63 148.6 surface water level
VKB 148.89 148.8 surface water level
GVE 6.36 -3.27
GVN 2.15 2.15 surface water level
GVBH 2.17 2.16 surface water level
GVW 2.4 2.16 surface water level
LPG 6.59 -4.14
LPST1 1.76 -0.2
LPST2 1.68 -0.2
LPST3 3.19 -0.89
Groenvlei water
level
2.16
Hydrobiologia (2008) 607:175–186 183
123
conservation of freshwater ecosystems in the Cape
floral Kingdom’’ (Cowling et al., 1999) reports Carex
clavata as an endemic species, relying on a threatened
habitat.
Groenvlei
Although the EC gradient elucidated in the 3-D EC
profile from west to east was not steep (varying
between 444 and 470 mS/m), it did indicate the
discharge of fresher water from the west, and even
more pronounced from the east. This was quite
surprising considering that the water-shed to the east
of Groenvlei is very close to its eastern extreme. There
is a very steep drop in the landscape from the
watershed eastwards down to the Goukamma River,
which is at sea level, showing tidal exchange under
open mouth conditions. The river level is therefore
clearly below the Groenvlei water level, which is
at 2.16 m above msl. The reason for no north-south
EC gradient could result from the wide vegetated
perimeter of the wetland in particularly the north-
eastern end. Data collected from the piezometers in the
reeds on the north-eastern end suggest lower EC values
and indicate the presence of freshwater discharges
from that end. This gradient thus exists within the reeds
outside the range of the open water sampling sites.
The thalassotrophic nature of Groenvlei water, as
explained earlier, must result from the fact that
Groenvlei is a flow-through system discharging water
to the sea (Parsons, 2007). Roobroeck et al. (in press)
found high concentrations, as well as partial molar
charge fractions, of calcium and bicarbonate in deep
piezometers, indicating a limnotrophic source. How-
ever, it is the eastern part of Groenvlei that showed
more lithotrophic conditions indicating more freshwa-
ter discharge from the north-east. The GVN showed
low EC values (between 60.6 and 88.5 mS/m) con-
firming freshwater discharges coming from the north-
east. On the southern side of Groenvlei (GVBH) no
freshwater discharges could be established. A borehole
drilled by Parsons in early 2006 on the southern side of
Groenvlei, measured a high EC around 400 mS/m, and
the water level indicated outflow of water from
Groenvlei to the sea (Parsons, 2007).
The data found at the LPG and LPST sites are
exactly in line with data collected by Parsons (1992,
2005a), showing possible fresh water discharges from
the fixed dune system on the western side of Groenvlei.
Stormwater discharges from the town of Sedgefield
close to this site could influence the freshness of the
water. The cluster analysis (Fig. 7) confirms this trend.
Parsons (2007) also found the hydraulic gradient in this
region to be very flat (0.0009).
The origin of the consistent fresh water influx from
the west that was also found by Parsons (2005a),
cannot be explained, except for the stormwater
discharges. However, slightly higher EC values were
recorded at LPST and LPG. The sites on the western
and southern side of Groenvlei (GVW and GVBH)
had the highest EC values that were close to or even
higher than the Groenvlei surface water EC values.
The 3-D interpolation generated for Groenvlei
further supports the notion that the eastern side of
Groenvlei is getting fresher water (EC values around
444 mS/m). Although not conclusive where the
fresher water is coming from, it is also pointing
towards TMG aquifer discharge from the north-east
coinciding with the geology of the area and data
presented above. Some fresh water is also discharged
from the west from the fixed dune system as was
confirmed by Parsons (2005a).
General hydrological characteristics
All the data presented, along with the 3-D interpo-
lation of EC for Groenvlei, points towards a
difference in groundwater quality, discharge regimes
and groundwater sources for both wetlands. These
distinct differences are elucidated because of the
unique characteristics resulting from the underlying
geology (Fig. 2).
The hydrochemical data of the groundwater from
this study suggest that Groenvlei and Van Kervelsvlei
are dependent on groundwater from the TMG aquifer.
Both the clustering of EC and temperature values, the
statistical differences elucidated on piezometer loca-
tion, piezometer location combined with depth, and
the potential hydraulic gradient between Van Ker-
velsvlei and Groenvlei support this view. Based on
the water quality data, the southern and south-western
side of Groenvlei is clearly more saline. The clear
clustering of EC and temperature values (Fig. 7), and
the t-test grouping of the north-eastern part of
Groenvlei and Van Kervelsvlei clearly supports a
shared groundwater source feeding both.
This link was further supported by the water quality
parameters listed in Table 4, which give values
184 Hydrobiologia (2008) 607:175–186
123
distinctive of TMG aquifer water. This grouping of
piezometers included both Van Kervelsvlei site A and
B (VKA and VKB), and the two deepest piezometers of
Groenvlei East (GVE 7, and 11 m).
Van Kervelsvlei and Groenvlei are both hydrolog-
ically isolated from rhinotrophic water. Topogenous
discharge is the only supply to their prevalent water
regime. The strong limnotrophic (groundwater) input
noted within both Van Kervelsvlei and Groenvlei also
strongly suggests a connection of these systems to the
TMG aquifer. The thalassotrophic (saline) nature of
the western and south-western side of Groenvlei could
be attributed to the fact that this is a typical ‘flow-
through’ system that got fresher after being cut off
from the sea around 5,000 years ago (Parsons, 2007).
The hydrological link between the TMG aquifer and
Groenvlei and Van Kervelsvlei is further supported by
the findings of Roobroeck et al. (in press) who found
that the GVW site showed a much higher EC compared
to those of the GVE and GVN sites. The EC of samples
taken at the GVW largely exceeded that of samples
taken from Van Kervelsvlei, while the EC measured at
the GVE and GVN levelled those of Van Kervelsvlei.
They also reported a clear difference in pH between
both locations. Samples from Van Kervelsvlei (VKA
and VKB) generally showed a lower pH than those
from Groenvlei (GVE and GVN).
Results by Roobroeck et al. (in press) on vegetation
composition showed that the vegetation composition
at the eastern side of Groenvlei was remarkably
similar to that of the southern part of Van Kervelsvlei.
They state that the hydrologic, as well as floristic assets
indicate that both Groenvlei and Van Kervelsvlei
receive water from a similar groundwater resource.
Conclusion
The similarity in hydrochemical properties and
vegetation composition between Van Kervelsvlei
and the eastern side of Groenvlei, indicate a connec-
tion between both systems. Their groundwater
dependency and the interconnection make them
sensitive to hydrological disturbance at a local and
regional scale. With the ever-increasing possibility of
intensive water abstraction in the vicinity of Groenv-
lei, it will probably have a direct local effect,
increasing its thalassotrophic state. This will also
have an indirect regional effect that could alter the
hydrological regime of Van Kervelsvlei that will
affect the valuable endemic vegetation in this
threatened habitat. With the increasing demand for
more water in the Sedgefield area, authorities should
take this into consideration when planning to use
groundwater in the Groenvlei region.
Further research on the hydrogeology of the area
will be necessary to determine the amounts of
freshwater being discharged from the TMG aquifer
to Groenvlei and Van Kervelsvlei. A better under-
standing of the groundwater flow directions and
gradients on the north-eastern side should receive
urgent attention.
The complexity of the interactions between
groundwater and surface resources highlight the
importance of an integrated approach towards water
resource planning globally. Many aquatic ecosystems
may be far more groundwater dependent than orig-
inally postulated, particularly where fractured rock
aquifers, both confined and unconfined, dominate.
Acknowledgements Special thanks are due to VLIR IUC
‘‘Flemish Interuniversity Counsel’’, VLIR NSS and Fund
Scientific Research Flanders for funding this research. I would
also like to thank all the participants from the following
Universities for their hard work and support during this study:
UWC and the teams from the Katholieke Universiteit of Leuven,
University of Antwerp, Ghent University, Vrije Universiteit
Brussel, Maxwell Batson and Tamuka Nhiwatiwa of the
University of Zimbabwe, and Dr Haili Jia from the University
of Fort Hare who helped with the generation of the 3-D
interpollation for Groenvlei. Thanks are also due to CapeNature
and P.G. Bison for allowing us free access to conduct the research
at Groenvlei and Van Kervelslvei, respectively.
References
Almendinger, J. E. & J. H. Leete, 1998. Regional and local
hydrogeology of calcareous fens in the Minnesota River
basin, USA. Wetlands 18(2): 184–202.
Barton, C. C. & H. Hsieh, 1989. Physical and Hydrological-
flow Properties of Fractures. Field trip Guidebook T385.
28th International Geological Congress. Washington D.C.
USA.
Boeye, D., B. Verhagen, V. Van Haesebroeck & R. F.
Verheyen, 1997. Nutrient limitation in species-rich
lowland fens. Journal of Vegetation Science 8: 415–424.
Brown, C., C. Colvin, C. Hartnady, R. Hay, D. Le Maitre & K.
Riemann, 2003. Ecological and environmental impacts of
large-scale groundwater development in the Table
Mountain Group (TMG) aquifer system: Water Research
Commission, South Africa. Discussion Document, WRC
Project K5/1327 (unpublished).
Hydrobiologia (2008) 607:175–186 185
123
Colvin, C., D. Le Maitre & S. Hughes, 2002. Assessing Veg-
etation Ecosystem Dependence on Groundwater. Water
Research Commission, South Africa. WRC Report 1092.
Council of Geoscience, 2001. Geology - Western Cape (EN-
PAT) WGS84 format 1:250000 Scale. 280 Pretoria St,
Silverton, Pretoria.
Cowling, R. M., R. L. Pressey, A. T. Lombard, C. E. Heijnis,
D. M. Richardson & N. Cole, 1999. Framework for a
conservation plan for the Cape Floristic Region, South
Africa. Institute for Plant Conservation, University of
Cape Town, IPC Report 9902, prepared for WWF-SA.
Davies, B. & J. Day, 1998. Vanishing Waters. UCT Press,
Cape Town, South Africa.
El Kahloun, M., D. Boeye, V. Van Haesebroeck & B. Verhagen,
2003. Differential recovery of above- and below-ground fen
vegetation following fertilization. Journal of Vegetation
Science 14: 451–458.
El Kahloun, M., D. Boeye, B. Verhagen & V. Van Haesebroek,
2000. A comparative study of nutrient status of Moliniacaerulea and neighboring vegetation in a rich fen. Belgian
Journal of Botany 133(1–2): 91–102.
El Kahloun, M., M. Gerard & P. Meire, 2005. Phosphorus and
nitrogen cycling in fen vegetation along different trophic
conditions in the Biebrza valley, Poland. Ecohydrology &
Hydrobiology 5(1): 68–79.
ESRI. 1996. ArcView 3.3 Software. Environmental Systems
Research Institute, Redlands, CA.
Fijen, A. P. M., 1995. Groenvlei Lake Catchment—Water
Management Strategy, Main Report. Water Quality
Management Series. Department of Water Affairs and
Forestry, July 1995.
Fortuin, M., 2004. A geographic information systems approach
to the identification of Table Mountain Group aquifer
‘type areas’ of ecological importance. MSc Thesis,
University of the Western Cape, Cape Town.
Glass, G. V., P. D. Peckham & J. R. Sanders, 1972. Conse-
quences of failure to meet assumptions underlying the
fixed effects analyses of variance and covariance. Review
of educational research 42(3): 237–288.
Goldblatt, P. & J. Manning, 2000. Cape plants. A conspectus of
the Cape Flora of South-Africa. Strelitzia 9, Cape Town,
South-Africa, 744 pp.
Goudie, A. & H. Viles, 1997. The Earth Transformed: An
Introduction to Human Impacts on the Environment.
Blackwell Publishers Ltd, Oxford, UK.
Hatton, T. & R. Evans, 1998. Dependence of Ecosystems on
Groundwater and its significance to Australia. Land and
Water Resources Research and Development Corporation,
CSIRO, Australia. Occasional Paper 12: 98.
Irving, S. J. E. & M. E. Meadows, 1997. Radiocarbon chro-
nology and organic matter accumulation at
Vankervelsvlei, near Knysna, South Africa. South African
Geographical Journal (Special edition): 101–105.
Kotze, J. C., 2002. Hydrogeology of the Table Mountain
Sandstone Aquifer – Klein Karoo. PhD Thesis, University
of Bloemfontein.
Le Maitre, D. C., C. Colvin & D. F. Scott, 2002. Groundwater
Dependent Ecosystems in the Fynbos Biome, and their
Vulnerability to Groundwater Abstraction. Paper in WRC
Report TT158/01: ‘A Synthesis of the Hydrogeology of
the Table Mountain Group – Formation of a Research
Strategy’, 112–117.
Martin A.R.H., 1960. The ecology of Groenvlei, a South
African fen. Journal of Ecology 48(1): 55–71.
Middleton N., 1999. Global Casino: An Introduction to
Environmental Issues. 2nd Edition. Arnold, London.
Parsons, R., 1992. The Exploitation Potential and Contamination
Hazard of the Sedgefield Primary Aquifer. Report 32/92.
Groundwater Program, Watertek, CSIR. Stellenbosch SA.
Parsons, R., 2005a. Groundwater use at Lake Pleasant Chalets
and Lodges, East of Sedgefield. Report 166/LPC-F1,
Parsons and Associates, August 2005.
Parsons, R., 2005b. Geohydrological description of the area
around Erf 1634, Myoli Beach, Sedgefield. Report 176/
PSI-DI, Parsons and Associates, October 2005.
Parsons, R., 2007. Quantify Groundwater’s role in sustaining
Groenvlei, a shallow lake in the Southern Cape region of
South Africa. Paper Presented: Groundwater Division
Conference, Geological Society, 8–10 October 2007:
Conference Proceedings, 362–375.
Roets, W., Y. Xu, L. Raitt & L. Brendonck, 2008. Groundwater
discharges to aquatic ecosystems associated with the
Table Mountain Group (TMG) Aquifer: a conceptual
model. Water SA 34(1): 77–88.
Roobroeck, D., M. El-Kahloun, W. Roets, E. De Roeck, L.
Raitt, L. Brendonck, Y. Xu & P. Meire, in press. The
occurrence of plant species in relation to groundwater
chemistry and nutrient limitation at some South African
lowland wetlands. (Submitted to Journal of Vegetation
Science).
SAS, 1999. SAS/STAT User’s Guide, Version 9, Fourth Edi-
tion, Vol. 2. SAS Institute INC, SAS Campus Drive,
CARY, NC 27513.
Scott, D. F. & D. C. Le Maitre, 1998. The interaction between
vegetation and groundwater: Research Priorities for South
Africa. Water Research Commission, South Africa, WRC
Report No. 730/1/98.
Shapiro, S. S. & M. B. Wilk, 1965. An analysis of variance test
for normality (complete samples). Biometrika 52: 591–
611.
Sieben, E. J. J., 2003. The riparian vegetation of the Hottentots
Holland Mountains, Western Cape, South Africa. PhD
Thesis, University of Stellenbosch.
Van Der Merwe, C. V., 1979. Plantekologiese aspekte en
bestuursprobleme van Goukamma-natuurreservaat. MSc
Thesis, Universiteit Pretoria.
Wassen, M. J., 1995. Hydrology, water chemistry and nutrient
accumulation in the Biebrza fens and floodplains
(Poland). Wetland Ecology and Management 3: 125–137.
SPB Academic Publishing bv, The Hague.
Winter, T. C., J. W. Harvey, O. L. Franke & W. M. Alley,
1999. Ground Water and Surface Water: A Single
Resource. U.S. Geological Survey, Denver, Colorado,
USGS Circular 1139.
186 Hydrobiologia (2008) 607:175–186
123


