Embed Size (px)
Citation preview

ELSEVIER FEMS Microbiology Ecology I8 ( I YY5) 225-235
Development of a molecular detection method for naphthalene degrading pseudomonads
Abstract
A combined polymerase chain reaction amplification and reverse dot blot assay was designed for the detection of
bacterial penes from soil and sediments. Total nucleic acids were directly extracted from soil using a lysozyme/sodium
dodecyl sulfate/freeJe-thaw method followed by rapid purification through gel electrophoresis. DNA was amplified using a
highly stringent polymerase chain reaction with primers directed against the n&K regulatory gene present in plasmid NAH7
of Psr~rtlor~~orz~ts p~rtirk G7. The resulting amplification product was detected calorimetrically by reverse dot blot with an
improved sensitivity ten-fold greater than traditional ethidium bromide staining after gel electrophoresis. A lower limit of
IO3 P. ~~rtirk~ G7 cfu (g soil)- ’ wah detected. This method was successfully employed to detect indigenous naphthalene-de-
grading bacteria from subsurface sediment collected from different locations of a naphthalene-contaminated site. Similar
approaches could be developed for other soil-borne genetic markers.
Kr~n~oa/.v: DNA detection: Reverse dot blot: Polymerase chain rwction: P.sefcc/or,forlo.c puti&: rd?R Gene
1. introduction
In the ecological analysis of indigenous microbial
populations, the polymerase chain reaction (PCR) has spurred a new generation of studies [I]. since it has been shown that conventional microbiological approaches may miss unculturable cells [Z]. PCR may provide a more complete picture of total micro bial population. and has been useful in the identifica- tion of pathogens and indicator populations from environmental samples [3], tracking of genetically
engineered microorganisms [4]. and molecular phylo- genie analysis [_5].
Many PCR-based analyses rely on ethidium bro- mide staining of the reaction products for final signal detection after electrophoretic separation in agarose or polyacrylamide gels. Even though this is a simple and rapid approach. it is not highly sensitive. since a nucleic acid fragment must contain about 5 X IO” bp (or IO”’ copies of a double stranded 500-bp fragment) for clear visibility [6]. A Southern hy- bridization would increase sensitivity and specificity, but is also more time-consuming and laborious [7]. In devising alternative methodologies, however, non-specific extensions that give rise to spurious products in the PCR reaction mixture must be taken into account [S].
Corresponding author. Tel: (607) 155 28Y6: Fax: (607) 15.5
X711: E-mail: [email protected]
’ Present address Exola Superior de Biotecnologia. Rua Dr.
Ant&io Bernardino de Almeida, 4200 Porto, Portugal.
016X-6196/YS/$OY.S0 9 1995 Federation of European Microbiological Societies. All rights reserved
WI/ 0168-6196(95)00062-3

A unique approach has been reported [9] that takes advantage of the 5’ --+ 3’ exonuclease activity of Taq polymerase. A non-extendable primer de- signed to bind internally to the target sequence is labeled at the 5’ end. In the process of extending the product, the enzyme encounters the internal primer and partially degrades it. The resulting labeled frag- ments are smaller, and can be differentiated from the original length probe by autoradiography.
Calorimetric methods have also been widely ap- plied. In a simple system, the two PCR primers are labeled with biotin and FITC (fluorescein isothio- cyanate). The resulting amplification products are captured on a streptavidin coated plate [ 10.1 I]. En- zyme linked immunodetection (with an anti-FITC antibody/horseradish peroxidase conjugate) follows, with the FITC-containing samples giving a positive signal. By using the amplification primers as the labeled probes a hybridization step is avoided, al- though false positives due to misprimings can reduce the specificity of such an assay. In a variation of this protocol, a separate set of labeled primers is utilized that nests inside an outer, unlabeled set, and is added only for the last three amplification rounds [I?]. A further modification was brought about by the intro- duction of a la&P-Gal fusion protein which is used to detect PCR product amplified using one biotiny- lated primer and another primer containing a 21 bp sequence from the lac operon [ 131.
Keller et al. [ 141 introduced a sandwich hybridiza- tion detection assay in microtiter format that by- passes the problem of misprimed products. Cloned DNA containing a sequence complementary to a portion of the PCR product is immobilized in a well and used to capture a biotin-labeled DNA fragment complementary to another part of the product em- ployed as the detection probe. The sensitivity of this technique was comparable to a Southern blot. but the additional effort involved in preparing the probes may reduce its utility.
The reverse dot blot (RDB) developed by Saiki et al. [IS] is an increasingly recommended detection method. Here a capture probe, internal to the ampli- fied product, is first enzymatically tailed with TTP and immobilized by heat fixing on a membrane. The PCR product is labeled with digoxigenin during am- plification, allowed to hybridize with the probe, and detected enzymatically. In addition to the fact that
spurious PCR products do not result in false posi- tives, this assay allows the multiple screening of each reaction with different capture probes during the same hybridization. potentially saving time.
Routine detection of microorganisms from seeded or unseeded soil has proven particularly difficult due to the highly inhibitory effect of humic substances. It has been reported that pure humic acid can suppress Taq polymerase activity at a concentration as low as IO ng per PCR reaction [ 161. When template number is not a limiting factor, inhibition can be averted by simple dilution of the sample.
The utilization of 16s rDNA primers directed against sequences conserved across specific groups or all eubacteria has allowed novel studies to be carried out on native populations [ 171. Results have confirmed the view that known bacteria are but a small fraction of the indigenous prokaryotic commu- nity. In a massive molecular ecology study. Liesack and Stackebrandt [ 181 amplified a I kb fragment of the 16s rDNA gene from DNA purified from Aus- tralian soil. A clone library was generated and I13 random clones were partially sequenced, analyzed, and phylogenetic relationships established. Not sur- prisingly. none of the organisms from which se- quences were amplified has been successfully culti- vated. In another study. a direct DNA extraction protocol involving sonication and triple column pu- rification was employed to amplify indigenous Frankia spp. from soil containing approximately 10’ genomes of Frankia per gram [ 191.
Our laboratories have been working on detection of indigenous soil populations using naphthalene degradation as a paradigm. Our objectives were to develop a combined gene amplification and detection procedure for soil and sediment that takes advantage of the RDB technique, and to apply the methodology to samples from a naphthalene contaminated site to detect n&R, a plasmid borne regulatory gene for naphthalene degradation in Pseudomonas putida G7.
2. Materials and methods
2. I. Bacterial strains. media, and culture umditions
Bacterial strains used in this work include: Liste- ria monocytogenes Scott A (obtained from R. Pe-

M.C. Silla et al. / FEMS Microbiology Ecology 18 f IYYSl 225-235 221
tran), Klebsiella pneumoniae M5al (obtained from S. Winans), Rhizobium meliloti RM102 1 (a soil isolate, obtained from S. Winans), Agrobacterium tumefaciens A348 (a soil isolate, carries Ti plasmid, obtained from S. Winans), Xanthomonas maltophilia Nl (soil isolate from WA, naphthalene degrader, obtained from W. Ghiorse), Pseudomonas jluo- rescens (soil isolate, not a naphthalene degrader, obtained from W. Ghiorse), Pseudomonas putida PAW1 (soil isolate, not a naphthalene degrader, obtained from W. Ghiorse), Pseudomonas sp. Nd9 (soil isolate, naphthalene degrader, obtained from W. Ghiorse), and Pseudomonas putida G7 (soil isolate, carries plasmid NAH7, obtained from G. Sayler). The 83 kb NAH7 plasmid contains the catabolic operon specifying naphthalene degradation and its regulatory gene, nahR. All strains were grown at 30°C in PTYGS medium (peptone, tryptone, yeast, glucose) [20] except for K. pneumoniae and L. monocytogenes which were grown at 37°C in Luria
Bertani medium 1211.
2.2. Soil characterization
Soil samples were obtained from a coal tar-con- taminated site in northeastern New York State as previously described [22], except that the peripheral coring shavings were used. Table 1 describes the samples used in this study.
2.3. Primer and probe design
The sequence of the primers designed to amplify and probe selected regions of the nahR gene [23] is detailed in Table 2. The A and T primers define a 1093 bp region from nt 152 to nt 1244 and were
Table 1
Characteristics of soil samples used in this study
used in connection with the G and C primer set in a nested PCR. The final product size was 828 bp long. Oligonucleotide B, which binds internally to the PCR product, was employed as a capture probe in the reverse dot blot detection.
2.4. DNA soil isolation
One gram sediment sample (wet weight) was
mixed well with 2 ml of 100 mM sodium phosphate buffer (pH 7.4) in Oak Ridge centrifuge tubes, and incubated at room temperature for 15 min with shak- ing. After centrifugation at 6000 X g for 10 min, the supernatant was discarded and the pellet resuspended in 2 ml of lysis solution (150 mM sodium chloride, 100 mM EDTA, pH 8.0, 15 mg lysozyme/ml). The sample was incubated at 37”CC for 2 h with agita- tion every 30 min, then 2 ml of SDS solution (100 mM sodium chloride, 0.5 M Tris-HCl, pH 8.0, 10% SDS) were added, and the tube held 5 min at room temperature. The sample was then frozen solid in liquid nitrogen and thawed in a 65°C water bath for three cycles, after which 2 ml of 7.5 M ammonium acetate was added. After centrifugation at 6000 X g
for 10 min, the supernatant was transferred to a new Oak Ridge tube containing 15 ml of ice-cold ethanol. The nucleic acids were precipitated at -70°C for 1 h, centrifuged at 10000 X g for 15 min, washed with 10 ml of 70% ethanol, air dried, and resuspended in 500 ~1 of sterile distilled water. The nucleic acids were then precipitated with 50 ~1 of 3 M sodium acetate (pH 5) and 1 ml of ice-cold 100% ethanol, held 5 min in dry ice, and centrifuged 15 min at 12 000 X g. The supematant fraction was discarded and the pellet was washed with I ml of 70% ethanol, air dried. and resuspended in 25 ~1 of TE (10 mM
Name Location Collection
date
Depth D/c Organic Mineralization
(m) matter ’ potential ‘.’
Pristine Pristine subsurface, water table level April 1989 0.6 0.69 0
Source Coal tar pit subsurface, saturated zone level August 1991 4 ND 45 Up-gradient Contaminated subsurface. 10 m from source, water table level April 1989 2.8 0.93 19 Down-gradient Contaminated subsurface, 130 m from source, water table level October 1992 3.0 1.04 34
a Data from [??I. ’ Percent of added naphthalene mineralized relative to poisoned controls.
ND, not determined.

Table 2
Sequences of primers used for amplification and probing
ATCACGCAATTGGGGGC CTGGTGAGCCAGCA
Tris-HCI. I mM EDTA. pH 8.0). The DNA solution was then applied to a I % TBE ( 100 mM Tris-boric acid, 2 mM EDTA) agarose gel and electrophoresed at 100 V for 4 h. A gel slice corresponding to DNA between 20 and 25 kb was excised with a razor blade. After melting the agarose slice at 85°C for 5 min, 300 ~1 were transferred to a new microfuge tube; 900 ~1 of a 6 M sodium iodide solution was added, and the tube was incubated at 55°C for 5 min. To the DNA/sodium iodide mix, 10 ~1 of a glass- bead suspension (United States Biochemical, Cleve- land, OH) was added, followed by a 5 min incuba- tion on ice. The glass-beads were pelleted by cen- trifugation for 30 s at 12000 X g, and washed three times in 50% ethanol 10 mM Tris-HCI (pH 7.5) 50 mM sodium chloride. 1 mM EDTA. The purified soil DNA was eluted by incubation at 55°C for 5 min with 20 ~1 of water and centrifugation for 30 s at 12000 x g.
2.5. PCR amplification
Nested PCR was carried out in a total volume of 50 ~1 plus an overlay of mineral oil using a DNA thermal cycler (Hybaid, National Labnet Co., Wood- bridge. NJ). The reaction mixture contained 50 mM potassium chloride. IO mM Tris-HCI (pH 8.0), 1.5 mM magnesium chloride, 0.1 mg bovine serum albu- min per ml. 0.05% Tween 20, 50 PM each dATP. dCTP, dGTP and TTP, 0.5 PM each primer, 2.5 U of Taq DNA polymerase (Promega Corp.. Madison, WI), and 3 PM digoxigenin-I I-dUTP (inner reac- tion only). Both the inner and outer reactions were
prepared with ‘hot-start’ adding the dNTPs after the tubes were heated to 80°C. The outer reaction in- cluded 1 ~1 of sample and was cycled I X at 95°C for 5 min; 30 X at 95°C for 1 min. 65°C for I min. 72°C for 1 min; and I X at 72°C for 5 min. For the inner amplification 5 ~1 of the outer reaction mix was used as template. Tubes were cycled I X at 95°C for 5 min: 30 X at 95°C for 1 min. 70°C for 1 mini and 1 X at 72°C for 5 min.
2.6. PCR product detectiorl
Electrophoresis of DNA was performed according to established techniques [21]. For reverse dot blot (RDB) detection, capture probe B was first tailed using terminal deoxynucleotidyl transferase (TdT. United States Biochemical. Cleveland, OH). Final reaction concentrations were 100 pmol of probe, 250 nmol of TTP, and 50 units of TdT in a 100 ~1 volume of the manufacturer’s recommended buffer. Incubation was for 2 h at 37°C followed by IO min at 70°C. The tailed capture probe was mixed 4: I with 2 M sodium hydroxide-50 mM EDTA, heated at 100°C for 5 min. then cooled immediately on ice. Zeta Probe GT membrane (BioRad, Richmond, CA) was marked with a soft pencil, soaked in distilled water, and air dried. With the membrane on 2 sheets of dry filter paper. 2.5 ~1 of the capture probe was applied for each test. The probe was immobilized by baking 30 min at 80°C. Prehybridization was for I h at 68°C with 50% formamide. 5 X SSC (standard sodium citrate. [2I]). 0.02% SDS. 0.18 N-lauroyl- sarcosine sodium salt. 5% non-fat dry milk. The membrane was then allowed to air dry. PCR samples were mixed I: 1 with hybridization solution, boiled for 5 min, then cooled on ice. Of this mixture, 5 ~1 was spotted on a membrane. After a 5 min incuba- tion at room temperature, membranes were washed twice for 5 min at room temperature with 2 X SSC 0.1% SDS. soaked twice for 15 min at 68°C with 0. I X SSC-0.1% SDS. washed briefly with buffer 1 (100 mM Tris-HCI. pH 7.5. 150 mM sodium chlo- ride). and incubated with a 1:5 000 dilution in buffer I of sheep anti-digoxigenin Fab fragment-alkaline phosphatase conjugate (Ab-AP. Boehringer Mannheim Biochemicals, Indianapolis, IN) for 30 min at room temperature with gentle shaking. After washing twice for 15 min with buffer I and 2 min

M.C. Silw rt ~1. / FEMS Microhiolo,~y Ecolog.~ 18 (199.5) 225-235 229
with buffer 3 (100 mM Tris-HCI, pH 7.5, 100 mM sodium chloride, 50 mM magnesium chloride), membranes were incubated in the dark with a color solution prepared by mixing 4.5 ~1 of NBT solution (nitroblue tetrazolium salt, 75 mg/ml in 70% dimethylformamide) and 35 /.~l of X-phosphate solu- tion (5-bromo-4-chloro-3-indolyl phosphate, 50 mg/ml in dimethylformamide) with 10 ml of buffer 3. After IO-30 min the reaction was stopped by washing in TE. As a direct RDB control, probe D was end-labeled in a reaction containing I nmol of probe, 2 nmol of digoxigenin- I I-ddUTP, and 50 units TdT in a 100 ~1 volume of manufacturer’s recommended buffer, with incubation for 2 h at 37°C followed by 10 min at 70°C.
3. Results and discussion
3. I. Detection sensitiL>ity
Mixed phase hybridization methods generally take longer than their single phase counterparts [24]. However, as optimized for this work, the RDB can be completed in 4 h. The minimum number of cells
which must be present in the PCR reaction to obtain a positive RDB signal was compared to the gel electrophoretic lower detection limit. The sensitivity limit of the RDB was tested on a serial dilution of P. putidcr G7 cells using primers A/T and G/C in a nested PCR. The same PCR samples were visualized by ethidium bromide staining after electrophoretic separation on an acrylamide gel. As shown in Fig. 1, the lower detection limit for electrophoresis is IO’ colony forming units (cfu) per PCR (lane A3), whereas a RDB will detect 10’ cfu per PCR (lanes B21, a IO-fold sensitivity improvement. This is in agreement with recent work reporting a RDB lower detection limit of 2.5-25 cfu for L. monocytogenes [25] and 10’ cfu for mycobacteria [26]. Both ethid- ium bromide staining of an acrylamide gel and the RDB calorimetric detection give a qualitative indica- tion of the relative amount of initial template in the PCR amplification by variations in signal intensity.
3.2. Detection specificity
The chances of any random DNA fragment hav- ing exactly the same sequence with the same spatial
Fig. I. Sensitivity of the RDB. Reactions were prepared with varying concentrations of P. purido G7 cells and amplified in a nested PCR
with primers A/T and G/C. (A) Ethidium bromide stain of a 6% polyacrylamide gel electrophoresis. (B) RDB. Lanes Al and B I : no cell
control; lanes A2 and B2: IO’ cfu: lanes A3 and B3: IO’ cfu; lanes A4 and B4: 10” cfu; lanes A5 and B5: IO” cfu; lane Cl: no product
control; lane C2: water control; lane C3: salmon sperm DNA control (25 pg); lane C4: unlabeled D probe control (250 pmol); lane C5:
unlabeled D probe control (2.5 pmol).

230 M.C. Sika rt al./ FEMS Microbiology Ecology I8 (19951 225-235
arrangement as the four primer binding sites used for a nested amplification of nahR are extremely low. Other factors, however, will influence false positives and negatives, including hybridization stringency, location of mismatched base pairs, and concentration of competing products [24]. The RDB technique was tested on a battery of related and unrelated bacterial cultures amplified from lo5 cfu with primers A/T and G/C in a nested PCR. The results (Fig. 2) indicate a high degree of specificity for this set of primers and reaction conditions, since only P. putida G7 gave a positive signal with either of the detection methods (lanes A10 and B 10). It is interesting to
note that two naphthalene degraders (Pseudomonas sp. Nd9, lanes A9 and B9, and Xanthomonas mal- tophilia N1, lanes A8 and B8) also failed to be amplified. These two strains have not been the object of molecular studies, and it is not known whether they carry plasmid NAH7 or the nah operon. Naph- thalene degradation by organisms that do not carry a nahR homologue have been observed (J.B. Herrick, personal communication). It must be noted that, in practice, no single molecular method will likely ever detect all naturally occurring naphthalene-degrading bacterial strains because of DNA sequence diver- gence or alternative analogous pathways. Conse-
A
Fig. 2. Specificity of the RDB. Reactions were prepared with IO5 cfu and amplified in a nested PCR with primers A/T and G/C. (A) Ethidium bromide stain of a I’% agarose gel, (B) RDB. Lane 1: size standard (1 DNA digested with EcoRI and HinDHI): lanes A2 and B2:
K. pneumoniae M5al; lanes A3 and B3: L. monocytogenes Scott A; lanes A4 and B4: P. putida PAWI; lanes A5 and B5: P. j7norescens;
lanes A6 and B6: A. tumefariens A348; lanes A7 and B7: R. mehloti RMl021: lanes A8 and BE: X. maltophilia Nl: lanes A9 and B9: Pseudomonas sp. Nd9; lanes AI0 and BIO: P. putida G7: lanes Al 1 and B 1 I: no cell control: lanes Al2 and B12: no Taq polymerase
control: lane Cl: labeled D probe control (0.5 pmol); lane C2: unlabeled D probe control (250 pmol): lane C3 salmon sperm DNA control
(25 pg); lane C4: no product control; lane 13: size standard (@X174 DNA digested with Hi&I).
M.C. Silnx et cd./ FEMS Microhiolog~ Ecology IN f IYY5J 225-235 231
quently, environmental samples may test negative for nahR while still mineralizing actively. This is a drawback intrinsic to molecular approaches.
3.3. Detection of soil-borne nahR
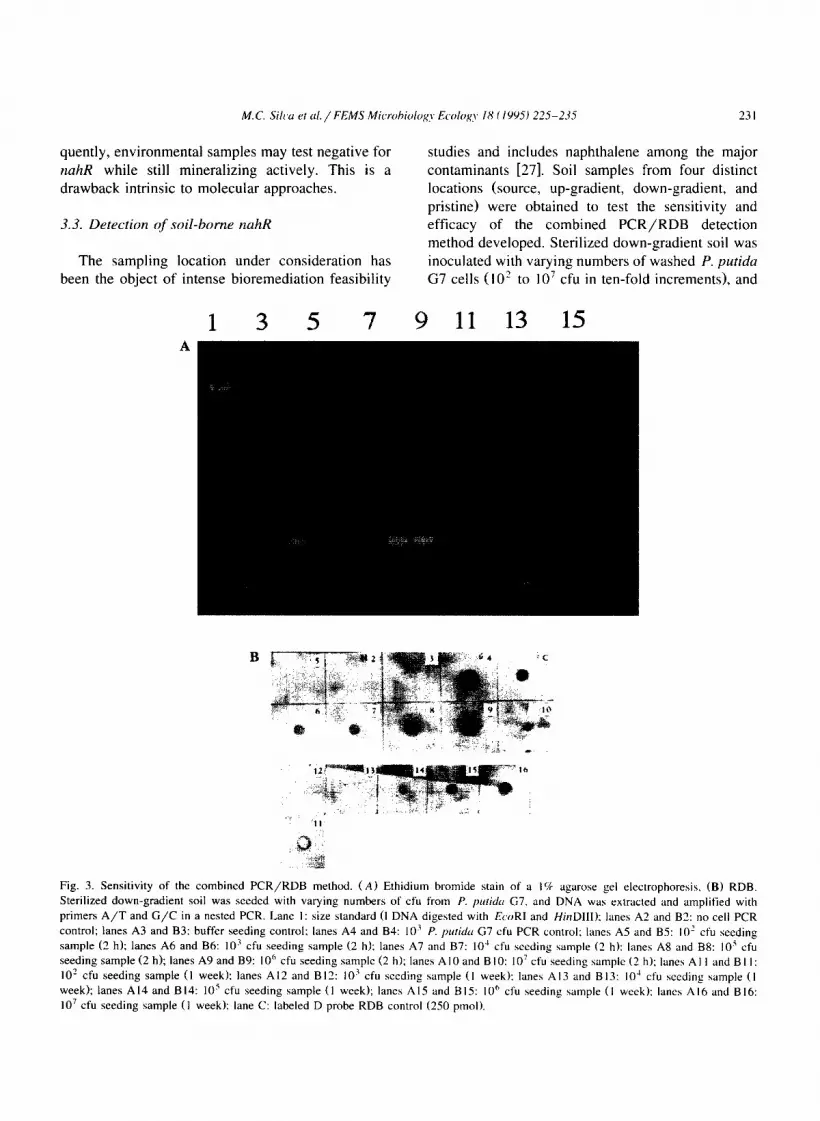
The sampling location under consideration has been the object of intense bioremediation feasibility
studies and includes naphthalene among the major contaminants [27]. Soil samples from four distinct locations (source, up-gradient, down-gradient, and pristine) were obtained to test the sensitivity and efficacy of the combined PCR/RDB detection method developed. Sterilized down-gradient soil was inoculated with varying numbers of washed P. putidu G7 cells (IO’ to IO’ cfu in ten-fold increments), and
1 3 5 7 9 11 13 15
Fig. 3. Sensitivity of the combined PCR/RDB method. (A) Ethidium bromide stain of a 1% agarose gel electrophoresis. (B) RDB.
Sterilized down-gradient soil was seeded with varying numbers of cfu from P. putidtr G7. and DNA wah extracted and amplified with
primers A/T and G/C in a nested PCR. Lane I: size standard (1 DNA digested with EcoRI and HinDHI): lanes A2 and B?: no cell PCR
control; lanes A3 and B3: buffer seeding control: lanes A4 and B4: IO’ P. ptttidrr G7 cfu PCR control; lanes A5 and B5: IO’ cfu seeding sample (2 h); lanes A6 and B6: 10’ cfu seeding sample (2 h): lanes A7 and B7: IO cfu seeding sample (2 h): lanes A8 and B8: IO5 cfu
seeding sample (2 h); lanes A9 and B9: IOh cfu seeding sample (2 h); lanes A IO and B IO: IO’ cfu seeding sample (2 h): lanes A I I and B I I : IO’ cfu seeding sample (I week): lanes Al2 and Bl?: IO3 cfu seeding sample (I week): lanes A I3 and B 13: IO’ cfu seeding sample (I week); lanes A I4 and B 14: IO5 cfu seeding sample (I week); lanes A I5 and B 15: I Oh cfu seeding sample ( I week): lanes A I6 and B 16:
IO’ cfu seeding sample (I week); lane C: labeled D probe RDB control (250 pmol).

DNA was isolated after 2 h and 7 days. In order to primed during the initial heating phase, can be achieve consistent amplification, both high annealing formed, and stringency is dramatically enhanced. As temperatures and the hot-start step had to be in- a consequence, the enzyme is not diverted towards eluded in the nested PCR procedure. By adding the spurious targets and the exponential phase of the nucleotides after the PCR mixture has been heated to PCR is prolonged [6]. With this approach the first 80°C. no random sequences, that would otherwise be reaction functions as an enrichment step before the
1 3 5 7 9 11 13 15 17 19 21 23 25 29 A
B
--
% 3” .4 2
Fig. 4. Detection of the rmhR gene in indigenous soil bacteria. (A) Ethidium bromide stain of a 1% agarose gel electrophoresis. (B) RDB.
DNA from soil of the four different locations was extracted and amplified with pl-imers A/T and G/C in a nested PCR. Spiked samples
included IO’ P. puridu G7 cfu. Lane Al: size standard (I DNA digested with E~YJRI and HiudIII); lanes A2 and B?: no cell PCR control:
lanes A3 and B3: 10’ P. puti& G7 cfu PCR control; lanes Al and B4: pristine sample. I: IO dilution: lanes AS and B5: source sample. I: IO
dilution: lanes A6 and 86: up-gmdient sample, I: IO dilution: lanes A7 and B7: down-gradient sample, I: IO dilution; lanes A8 and 88: gel
control sample, I :I0 dilution: lane A9: spiked pristine sample. I: IO dilution: lane AIO: spiked source sample. I: IO dilution: lane A I I:
spiked up-gradient sample, I : IO dilution: lane A 12: spiked down-gradient sample, I : IO dilution: lane A 13: spiked gel control sample. I : IO
dilution: lanes Al4 and BIJ: pristine sample, I: 100 dilution: lanes AIS and B 15: source sample. I :I00 dilution: lanes Al6 and B16:
up-gradient sample, I : 100 dilution; lanes A I7 and B 17: down-gradient sample. I : 100 dilution; lanes A I8 and B 18: gel control sample, I: 100
dilution; lane A19: spiked pristine sample, I:100 dilution: lane AX: spiked source sample. I:100 dilution: lane A2l: spiked up-gradient
sample. I: 100 dilution: lane A22: spiked down-gradient sample. I : 100 dilution: lane A23: spiked gel control sample. I : 100 dilution; lanes
A24 and B24: pristine sample. I: I dilution; lanes A25 and B2.5: source umple. I : I dilution: lanes A26 and B26: up-gradient sample. I : I dilution; lanes A27 and 827: down-gradient sample. I: I dilution: lane5 A78 and 828: gel control sample. I:1 dilution: lane C: labeled D
probe RDB control (250 pmol).

M.C. Silw et ~1. / FEMS Microbiology Ecolo,q I8 (lYY5) 225-235 233
actual target amplification during the second reac- tion. Fig. 3 presents the PCR products amplified from seeded down-gradient soil as detected by elec- trophoresis and ethidium bromide staining, and by RDB. A similar sterilized soil sample was also ex- tracted after seeding with buffer only as a negative control (buffer sample). When the DNA was ex- tracted 2 h after soil seeding, the PCR product was visible by ethidium bromide staining at the IO’ cfu g- ’ (lane A7) inoculation level. Detection by RDB increased the sensitivity ten-fold, with IO’ cfu 8-l giving a positive signal (lane B6). This sensitivity level cannot be compared to the 1 cell g-’ result of Steffan and Atlas [28], since these researchers ex- tracted 100 g inoculated soil samples. The RDB results presented here are, however, a ten-fold im- provement over what has been reported for nahA detection using Southern hybridization of PCR prod- ucts amplified from inoculated soil [29]. Lanes A3 and B3 show that the indigenous soil microorgan- isms did not contain n&I?-like sequences on the basis of the results obtained with sterile soil: steril- ization therefore significantly reduced the PCR de- tectable signal.
When the soil extraction and amplification took place one week after soil seeding. the amount of DNA recovered was reduced. Visualization with ethidium bromide staining of gels reveals the 522 bp product for the lo6 and IO’ cfu samples only (lanes A 15 and A I6 respectively), a marked reduction from the positive signal obtained with 10J cfu g- ’ after 2 h. Calorimetric RDB detection shows a positive signal for samples IO” to 10’ (lanes B 12 to B 14), again 10 times more sensitive than the traditional electrophoresis stain. These results suggest that the DNA extractability of cells added to sediment or the P. puridu G7 population numbers may have de- creased.
The same amplification and detection protocol was applied to unseeded soil from the same sampling locations. In spite of the soil’s complex microbial background, amplification was achieved with a high degree of specificity from all four locations as de- tected by the RDB. As shown in Fig. 4, elec- trophoretic separation of the PCR products followed by ethidium bromide staining revealed a strong posi- tive band from the up-gradient sample at the I : 10 dilution (lane A6), and weaker bands for the pristine
and source locations at the 1: 1 dilution level (lanes
A24 and A25 respectively). The RDB analysis yields further detail: the target sequence was amplified from the source sample at the 1: 1 dilution (lane B 15) and from the up-gradient sample at the 1: 10 dilution (lane B6), but also from down-gradient sample at the I : 10 dilution (lane B7) and from the pristine sample at the I:1 and I: IO dilutions (lanes Bl4 and B4).
In order to detect PCR inhibition by soil compo- nents, samples in the I : 10 and I : 100 dilutions were spiked with IO’ cfu of an overnight culture of P. putida G7. No noticeable degree of inhibition could be detected, suggesting that the DNA was not con- taminated by any inhibitory components. An addi- tional negative control was secured by excising a piece of the agarose gel from an unused lane at about the same migration distance as the soil DNA.
It is interesting to compare these results with the mineralization potential reported for soil from the same locations. Even though the strongest mineral- ization potential was exhibited by source soil (Table 2). the strongest amplification product was obtained with DNA extracted from the up-gradient location. On the other hand, the pristine soil sample, did not test positive in the mineralization assay, but the rzahR target sequence could be amplified. Such dis- crepancies can be understood in light of what the two types of assays measure. The mineralization potential determination measures naphthalene degra- dation caused by any group of microorganisms, through all degradative pathways, including comen- salism. The PCR-based detection, however. is sensi- tive to the presence of the rmhR gene or rzahR like sequences only. Hence, alternative naphthalene degradation pathways with divergent gene sequences may be responsible for the higher potential detected in the source soil.
The combined PCR/RDB method has a modular structure that makes it easily adaptable to the detec- tion of other genetic markers from soil for which sequence information is available. This approach is particularly promising for multiplex PCR, where each reaction mixture can be tested rapidly with a battery of different internal probes. Still perhaps the greatest challenge is to devise DNA extraction methods that give full representation of the microflora ideally in a quantitative fashion [30].
Current knowledge of environmental microbiol-

234 M.C. Silu et al. / FEMS Microhiolo~~y Ecology IK f IYY.5) 225-235
ogy still does not provide an adequate explanation as to why one metabolic pathway may be more preva- lent than others in a given niche. It is clear, however, that a combined PCR/RDB detection is an exquisitely sensitive and discriminating approach that can provide new insights into soil microbial activity.
Acknowledgements
This research was partially funded by a grant from the Cornell Biotechnology Program. Subsurface samples were obtained by Atlantic Environmental Services, Inc. through a joint research project of the Electric Power Research Institute. M.C.S. was sup- ported by a studentship from JNICT-Portugal. We are thankful to J.B. Herrick for fruitful discussions and to E. Madsen for providing the soil samples.
References
[II
[21
I31
[41
[51
[61
[71
I81
[91
[lOI
Mullis. K.B. (1990) The unusual origin of the polymerase
chain reaction. Sci. Am. 262, 56-66.
Atlas, R.M.. and Bartha, R. (1987) Microbial Ecology. The
Benjamin Cummings Publishing Co., Reading MA.
Atlas, R.M., Sayler, G., Burlage, R.S. and Bej. A.K. (1992)
Molecular approaches for environmental monitoring of mi-
croorganisms. BioTechn. 12. 706-717.
Amici. A., Bazzicalupo. M., Gallori, E. and Rollo. F. (1991)
Monitoring a genetically engineered bacterium in a freshwa-
ter environment by rapid enzymatic amplification of a syn-
thetic DNA ‘number plate’. Appl. Microbial. Biotechnol. 36.
222-227.
Schmidt, T.M., Delong. E.F. and Hand Pace, N.R. (1991)
Analysis of a marine picoplankton community by 16s riboso-
ma1 RNA cloning and sequencing. J. Bacterial. 173, 4371-
4378. Mullis, K.B. (I991 ) The polymerase chain reaction in an
anemic mode: how to avoid cold oligodeoxyribonuclear fu-
sion. PCR Methods Appl. I, l-4.
Southern, E. (1975) Detection of specific sequences among
DNA fragments separated by gel electrophoresis. J. Mol.
Biol. 98, 503-5 17.
Innis. M., Gelfand. D., Sninsky. J. and White, T. (1990) PCR
protocols. a guide to methods and applications. Academic Press. New York.
Holland. P.M.. Abramson. R.D., Watson, R. and Gelfand,
D.H. (1991) Detection of specific polymerase chain reaction
product by utilizing the 5’ + 3’ exonuclease activity of Ther-
mus aquaticus DNA polymerase. Proc. Nat]. Acad. Sci. USA 88. 7276-7280.
Ubukata, K.. Nakagami. S., Nitta. A.. Yamane. A..
1121
[l31
[l41
[I51
[I61
[I71
[IsI
1191
[201
[2ll
[22]
1231
1241
[251
I331
Kawakami. A., Sugiuba, M. and Konno, M. (1992) Rapid
detection of the mecA gene in methicillin-resistant staphylo-
cocci by enzymatic detection of polymerase chain reaction
products. J. Clin. Microbial. 30. 1728-1733.
Landgrdf, A., Reckmann. B. and Pingoud, A. (1991) Direct
analysis of polymerase chain reaction products using en-
zyme-linked immunosorbent assay techniques. Anal.
Biochem. 198. 86-91.
Kemp, D.J.. Smith. D.B.. Foote, S.J., Samaras. N. and
Peterson, M.G. (1989) Calorimetric detection of specific
DNA segments amplified by polymerase chain reactions.
Proc. Natl. Acad. Sci. USA 86. 2423-2427.
Hornes, E., Wasteson. Y. and Olsvik, 0. (1991) Detection of
E.dwkhia co/i heat-stable enterotoxin genes in pig stool
specimens by an immobilized, calorimetric. nested poly-
merase chain reaction. J. Clin. Microbial. 29. 2375-2379.
Keller. G.. Huang, D.-P., Shih, J. and Manak, M. (1990)
Detection of hepatitis B virus DNA in serum by polymerase
chain reaction amplification and microtiter sandwich hy-
bridization. J. Clin. Microbial. 28. 141 I-1416.
Saiki. R.K., Walsh, P.S., Levenson, C.H. and Erlich. H.A.
(I 989) Genetic analysis of amplified DNA with immobilized
sequence-specific oligonucleotide probes. Proc. Nat]. Acad.
Sci. USA 86, 6230-6234.
Saiki. R.K.. Gelfand. D.H.. Stoffel. S., Scharf, S.J., Higuchi,
R., Gorn. G.T., Mullis, K.B. and Erlich, H.A. (1988) Primer
directed enzymatic amplification of DNA with thermostable
DNA polymerase. Science 239, 487-49 I. Sayler. G. ( I99 I ) Contribution of molecular biology to biore-
mediation. J. Hazard. Mater. 28, 13-27.
Murray. V. ( 1989) Improved double-stranded DNA sequenc-
ing using the linear polymerase chain reaction. Nucleic Acids
Res. 17, 8889.
Overbeek. L.S.V.. Elsas. J.D.V., Trevors. J.T. and Starodub.
M.E. (1990) Long-term survival of and plasmid stability in
Pseudomonas and Klehsiella species and appearance of non-
culturable cells in agricultural drainage water. Microb. Ecol.
19. 239-249.
Balkwill, D.L. and Ghiorse. W.C. (1985) Characterization of
subsurface bacteria associated with two shallow aquifers in
Oklahoma. Appl. Environ, Microbial. 50, 580-588.
Sambrook, J., Fritsch, E.F. and Maniatis, T. (I 989) Molecu-
lar Cloning: a Laboratory Manual. Cold Spring Harbor Labo-
ratory Press. Cold Spring Harbor, NY.
Madsen, E.L., Sinclair, J.L. and Ghiorse, W.C. (1991) In situ biodegradation: microbiological patterns in a contaminated
aquifer. Science 252, 830-833.
You, I.-S., Ghosal. D. and Gunsalus, I.C. (1988) Nucleotide
sequence of plasmid NAH7 gene nahR and DNA binding of the nahR product. J. Bacterial. 170, 5409-5415. Wolcott, M. (1992) Advances in nucleic acid-based detection
methods. Clin. Microbial. Rev. 5, 370-386.
Bsat, N. and Batt, C. (1993) A combined modified reverse
dot blot and nested PCR assay for the specific nonradioactive
detection of Listeria wwwcytopws. Mol. Cell. Probes 7.
199-207. Fiss, E.H.. Chehab. F.F. and Brooks, G.F. (1992) DNA

M.C. Sika et al. / FEMS Microbiology Ecology 18 (lYY5) 225-235 235
amplification and reverse dot blot hybridization for detection
and identification of mycobacteria to the species level in the
clinical laboratory. _I. Clin. Microbial. 30. 1220-1224.
[27] Miller. J.. Chapman. P. and Pritchard, P. (1989) Action of
fluoranthene-utilizing bacteria1 community on polycyclic aro-
matic hydrocarbon components of creosote. Appl. Environ.
Microbial. 55. 3085-3090.
[28] Steffan, R.J. and Atlas. R.M. (1988) DNA amplification to
enhance detection of genetically engineered bacteria in envi-
ronmental samples. Appl. Environ. Microbial. 54, 2185-
2191.
[29] Herrick. J.. Madsen, E., Batt. C. and Ghiorse. W. (1993)
Polymerase chain reaction amplification of naphthalene
catabolic and 16s rRNA gene sequences from indigenous sediment bacteria. Appl. Environ. Microbial. 59. 687-694.
[30] More, M.I., Herrick, J.B., Silva, M.C.. Ghiorse. W.C. and
Madsen, E.-L. (1994) Quantitative cell lysis of indigenous
microorganisms and rapid extraction of microbial DNA from
sediment. Appl. Environ. Microbial. 60, I572- 1580.


