Embed Size (px)
Citation preview

THE JOURNAL OF CHEMICAL PHYSICS VOLUME 55, NUMBER II I DECEMBER 1971
Random Lattice Calculations on Frenkel Excitons in Disordered Molecular CrystalsIB 2u Naphthalene*
HWEI-KWAN HONG AND RAOUL KOPELMAN
Department of Chemistry, University of Michigan, Ann Arbor, Michigan 481M
(Received 28 June 1971)
Using the recently acquired exciton dispersion relations for crystalline naphthalene, we have calculated the density-of-states functions for heavily doped isotopic binary mixed crystals of naphthalenes with arbitrary compositions and various energy separations (trap depths). This constitutes the first attempt to extend the negative factor counting (NFC) method, developed originally for lattice phonons, to a real physical system of three-dimensional molecular excitons. In most calculations, a total of 1280 molecules were included. The exciton interactions, which included both the translationally equivalent and the interchange equivalent ones, involved all 16 neighbors. Calculations based on the coherent potential approximation (CPA) were also performed for comparison. It was concluded that these two sets of calculations compared very well except in the split-band limit and at low concentrations. Under these conditions the cluster or conglomerate states become important and the computer-simulated density-of-states functions revealed some fine structure, which was completely indiscernible in the density-of-states function based on CPA. This fine structure is experimentally significant. The relationship between the Green's function method and the moment trace method was investigated in the light of these new results. Particularly, some of the lower moments were calculated for the density-of-states functions and compared with those calculated from the exact expressions in our previous paper. It was shown numerically that the CPA results indeed agree with the exact moments up to the seventh order.
I. INTRODUCTION
Recently, there has been a great interest in the electronic and vibrational exciton states of disordered mo-lecular crystals. I In particular, a considerable amount of work has been done on the exciton states of isotopically mixed crystals because these systems are more amenable to theoretical treatment. Except for the heavily doped mixed crystals, which are of profound theoretical interest in their own right, most other disordered systems were studied primarily with an aim to understand the ordered systems. Such studies have, thus far, provided vital information pertaining to the density-of-states functions,2 pairwise interactions,3 and complete band structures in organic solids such as benzene and naphthalene.
In this paper, we shall be concerned mostly with the heavily doped mixed crystals. In the tight-binding approximation, the electronic and vibrational eigenstates of disordered molecular crystals can be treated in a similar way as the normal modes (phonons) of a disordered lattice. Historically, the frequency spectrum of a disordered chain was first treated by Dyson.4
Subsequent investigations on both one and multidimensional systems, for both electrons and phonons, have been numerous. Various techniques have been devised.S These include the moment trace method, the phase theory, the Green's function method, and finally the negative factor counting (NFC) method by Dean.6 Dean's works are of particular importance. In absence of a complete theoretical analysis, such numerical calculations not only offer a substitute but also give an insight into the physics of the problem. Here, for the first time, the "spiky" nature of the frequency spectrum was appreciated and so was the source of difficulties associated with a complete analytical approach.
Parallel to the development of the numerical techniques, the Green's function method has also been applied to the study of disordered systems, mostly based on Lax's7 pioneering work on the multiplescattering formulation. The exact Green's function was obtained by Yonezawa and MatsubaraB who performed the exact statistical averaging over all the possible impurity distributions. For actual applications, an approximate, k-independent self-energy was proposed by Onodera and Toyozawa9 and used in their model calculations on electrons and excitons. Such an approximation was also independently proposed by TaylorlO and by Soven," who called it the coherent potential approximation (CPA). In recent papers by Velicky et al. 12 and by Soven,13 the validity and the range of applicability of such an approximation were further examined.
For Frenkel excitons in disordered molecular crystals, Broude and Rashbal4 first treated the optical spectra, using a formulation which amounted to assuming periodic impurity distributions. Craig and PhilpottlS later took into account some random fluctuations by averaging over different impurity distributions within the "supercell." More elaborate analyses were carried out by Hong and Robinsonl6
who extended Yonezawa and Matsubara's formulation to multiple-branched exciton bands within the restricted Frenkel-Davydov limit.17 Furthermore, in the spirit of CPA, they adopted a self-energy which was both k independent and branch independent. Under this approximation, both the optical spectra and the density-of-states functions of mixed crystals depend only on the density-oj-states Junctions oj the corresponding pure crystals. Actual applications to the exciton states of IB2u naphthalene indicated that agreement between theory and experimentsl8 was quite satisfactory.
5380

F R E N K E LEX CIT 0 N S J N DIS 0 R D ERE D MOL E C U L ARC R Y S TAL S 5381
Although the pure crystal density-of-states function is completely determined19 if the pairwise exciton interactions are known, the reverse is apparently not true. Information on the pairwise interactions was not called for in a CPA calculation. However, an exact calculation does demand such knowledge. Experimental efforts to determine the exciton dispersion relation and the complete band structure in IB2u naphthalene were attempted by Hanson.3a By analyzing the "resonance pair" spectra with a first-order theory, Hanson obtained the "uncorrected" pairwise interactions directly. Subsequent refinements, involving the guesthost superexchange effect, were introduced by Hong and Kopelman.3b ,e Reliable pairwise interactions were thus obtained, which agreed with all the known experimental facts such as the pure crystal density-ofstates function, the single-impurity level, the Davydov splitting, etc. It is felt that further analysis on the density-of-states functions of mixed crystals, based on our present knowledge of pairwise interactions, should be a worthwhile endeavour.
In this paper, we report some random lattice calculations on the density-of-states functions of isotopic mixed crystals of naphthalenes, using the negative factor counting method (NFC) by Dean.6a Our aims are as follows: (1) This is the first attempt to calculate the eigenvalue distributions of a real threedimensional disordered system, with nontrivial interchange symmetry. In doing this, we hope that our results can be directly compared with physical observables in contrast to most of the other calculations which are basically model calculations. (2) We have also calculated the pure crystal density-of-states functions based on the same pairwise interactions and used the former to calculate the mixed crystal densityof-states function within the CPA. A comparison was made between the computer-simulated NFC results and those of CPA. This was done to broaden the testing ground for such an approximation to a threedimensional exciton system whereas previous calculations were mostly concerned with phonons and frequently of one or two dimensions.20 (3) In a recent paper by Hong and Kopelman,2! analytical expressions for the moments of density-of-states functions were given for both exact and CPA solutions. These theoretical results are used here in two different ways. On the one hand, moments were evaluated both from the theory and from the NFC and CPA results in order to evaluate the qualities of the latter. On the other hand, the relationship among the exact solution, the CPA solution, and the moments is discussed in detail, using the present calculations as examples. For the first part, we find that our NFC results give reasonably good moments, indicating that our particular choice of samples is statistically sound. For the second part, we find that the method of moments is quite limited in its usefulness as a method for determining the density-of-states functions. Rather,
moments are best used as criteria to test the usefulness of other methods. (4) Both qualitative and quantitative discussions are given on the nature of the localized states. "Spikes" in the density-of-states functions are identified with particular impurity dusters, using previous work on dilute systems3b
,C as guidance. Some irregular features which are familiar in the one- and two-dimensional systems are retrieved in the present three-dimensional case. Refined definitions of duster and duster state are introduced as well as the concept of conglomerate, which is convenient for the interpretation of exciton states in the shallow trap case. (5) Finally, some efforts are made to see if it is at all feasible at this stage to utilize the heavily doped mixed crystal data to gain information about interactions in ordered systems. In principle, the heavily doped mixed crystal data promise the most extensive information about such interactions. In reality, however, due to the complexity of the problem, this aspect of mixed crystal study has not reached its full potential. Even so, our calculation already indicates that we can obtain important information which would otherwise be inaccessible.
II. THEORY
A. Frenkel Exciton States in a Randomly Disordered Binary System
In the Frenkel-Davydov22 theory of excitons (the tight-binding approximation), we assume that there is a characteristic frequency of excitation (be it electronic or vibrational) associated with a site Rn in the crystal, The wavefunction of such an excitation can be written as
(1)
where the crystal function \f'* (Rn) is assumed to be a simple product of molecular wavefunctions, cf>* and cf>n's, where the latter are, respectively, the excited and ground state wavefunctions of the molecules in the site (i.e., properly adjusted for distortion due to the van der Waals or static23 interactions). The characteristic frequency which is also called the "ideal mixed crystal level"23 is simply the diagonal element of the total Hamiltonian matrix in such a localized basis set, or
Note that we have set the ground state energy to zer024
so that Hnn corresponds directly to the energy of excitation. By the same token, the excitation exchange in teractions (the dynamic in teractions23) are just the off-diagonal elements:
Hnm= ('l1*(R,,) I H I 'l1*(Rm). (3)
In ordered systems (pure crystals), we have
(4)

5382 H.-K. HONG AND R. KOPELMAN
TABLE I. Intermolecular exciton interactions in IB,u naphthalene.
Interaction
Ma Mb Me Ma+c MI ,
Position
a 8.24 b 6.00 e 8.66 a+e 7.96
5.10
Set 1 Set 2 Set 3 (em-I) (em-I) (em-I)
-0.6 -4.3 -1.2 -3.9 1.9 1.6 -3.7\" -6.1\" -8.9\"
6.1f 6.0f 6.0f 18.0 18.0 18.0
widths. Therefore, their shapes will differ and they always overlap. The consequences of such a difference on the density-of-states functions of disordered systems can be best illustrated by comparing recent calculations of Julienne and Choi6e with those of Dean6• or Payton and Visscher.6b
B. Density-of-States Functions of Disordered Systems by the Method of Negative Factor Counting
Ha+b) M12' Ha+bHe 7.89 2.0 1.0 1.0 To determine the density-of-states function of a
heavily doped mixed crystal, we have to solve the • Notice that the values for Me and Ma+c can be interchanged without secular determinant of the following formz5
affecting the pure crystal density-oi-states function. monomer or dimer energies, and mixed crystal density-of-states function; see discussions in detS(E) =0, (7) Ref. 3 (c). where
i.e., all the oscillators are in exact resonance, while in simple disordered systems (isotopically mixed crystals), we have
(5)
etc., depending on the number of components present. The Hnm's are assumed to be invariant.
In this and previous papers,16,Zl binary systems are treated, whereby the diagonal elements take up either €A or €B randomly while the concentrations of each component, CA and CB , are used as constraints. Diagonalization of such a Hamiltonian matrix will yield the desired density-of-states functions of disordered systems.
Since the similarities between this problem and the normal modes of a random lattice with two different masses have been emphasized5 in the past, it might be helpful to point out here some of the differences. For example, the normal modes of a disordered chain of atoms coupled harmonically to its nearest neighbors can be solved by the diagonalization of the matrix A defined by6a
and all other Aij=O, (6)
where mi is the mass of the ith atom and k i is the force constant between the atoms i and i+ 1. It is apparent that: (1) The introduction of impurities not only alters the diagonal elements but also the offdiagonal elements, both being dependent on mi. In the exciton case only the diagonal elements are assumed to be affected. (2) In the exciton case, the pure crystal density-of-states functions of the two components are congruent to each other. With regard to energy, they can be either overlapping or separated. In the phonon case, the density-of-states functions of both components always start from zero with different band-
SeE) = X-E.
X is the Hamiltonian matrix introduced in Eqs. (2)-(5). The density-of-states function peE) is related to the trace of the Green's function16
peE) = (N7f')-l 1m TrG(Z)
== (N7f')-l 1m L: (Z-An)-t, (8) n
where An'S are the eigenvalues and Z==E-iO+. If we introduce the integrated density-of-states function M(E), which is really the number of eigenvalues smaller than E,
M(E) = L: p(E')dE',
it IS readily shown that
M(E) = (N7f')-l 1m Tr f~ G(Z')dZ'
= (N7f')-l ImL: 10g(Z-An)
(9)
= (N7f')-l 1m log [detS(Z)]. (to)
FIG. 1. Crystal structure and intermolecular exciton interactions in the naphthalene crystal. The pairwise interactions are indicated here by arrows originating from the origin (the shaded molecule) and terminated at its neighbors. For simplicity, only one unit cell is shown. It should be noted that each molecule is coupled with all 16 neighbors, eight of them are translationally equivalent, and the rest are interchange equivalent with respect to the molecule in question. The upper right figure depicts the shape of the crystallites used in our calculations.

F R E N K E LEX CIT 0 N SIN DIS 0 R D ERE D MOL E C U L ARC R Y S TAL S 5383
FIG. 2. Density-of-states functions for mixed crystals of naphthalene-h. and -d. with various compositions. The histograms and the solid curves are, respectively, density-ofstates functions calculated from the NFC method and the CPA. Spikes marked I, II, III, I', II', III' are identified as conglomerate states shown in Table III. The upper left figure contains both the pure crystal density-of-states functions (for the B component, or naphthalene-dB) calculated from the NFC method (histogram) and from the dispersion relation ( dots) . Conglomerate states in the dilute mixed crystal are also shown in the same figure.
€A -200 cm-'
00 €s=315 cm-'
0005 CA-O Cs-1.0
CA .0.1
0.01 Cs '()·9
0005
ill Q..
If) CA ·0.2 W t- Cs=OS ~ 0.01 if)
~ 0.005
>-t- O if)
z w Cl 0.01
0.005
0. CA =0.4
0.01 CSa 0.6
0.005
0 100 200 300 100 200 300 400
ENERGY (em-') ENERGY (em-I)
In the last step we have used the equality:
detS(Z) = II (Z-An). n
(lla)
Let us assume that detS(Z) can be factorized into another form:
detS (Z) = II Qn (Z). (l1b)
From Eq. (10) we have
M(E)=(N1I")-IJmlog[IIQn(Z)]. (12) n
Alternatively, we can rewrite Eq. (12) as
M(E) =11"-1 1m fo::: P[Qn(Z) J log [Qn(Z) JdQn(Z),
(13)
where P[Qn (Z) J is the density distribution function of the quantity Qn (Z). Integrating by parts and discarding the term without an imaginary part, we have
M(E)=1I"-IJm L:="'M'(Qn) o Qn-1dQn, (14)
where
is a function similar to M for the quantity Qn'. Consequently, we have
M(E) =M'(Qn=O) = i:=o P(Qn')dQn'. (1S)
Equation (1S) states that the number of eigenvalues smaller than E is exactly equal to the number of negative Qn'S, if we can factor the determinant in the form of Eq. (11 b). This is the theorem underlying the method of NFC first proposed by Dean.6a
To achieve the factorization in Eq. (llb), Dean6&
used a method formally identical to the reduction process of Gaussian elimination.26 The NXN symmetric matrix of SeE) is first partitioned as
(16)

5384 H.-K. HONG AND R. KOPELMAN
TABLE II. Sample sizes and actual concentrations used in calculating peE) in Figs. 2-5.
'B Total Resolu- Total Resolu-(em-I) CA· fA b no,C
315 0.1 0.088 1280 0.2 0.195 1280 0.3 0.291 1280 0.4 0.399 640 0.5 0.5 640 0.6 0.613 320 0.7 0.735 320 0.8 0.845 320 0.9 0.931 320
1350 0.7 0.735 320 274 0.7 0.735 320 251 0.7 0.735 320
1350
a Nominal concentrations. b Actual concentrations.
where Xl is the upper left element of the original matrix (a submatrix of order unity) and Zl is of order N -1. YI is a row vector and YIT is its transpose, Now detS can be reduced into
detS=detXI detV2}, (17) where
(18)
Here V2) is the submatrix obtained by eliminating all but the first element of the first column of detS, using elementary determinant theory. This process is continued and a sequence of submatrices is obtained: VIl, V2), "', VN). Each time the order of the submatrix is reduced by one until finally we have VN)
which is of order unity. The formula to obtain L(j+l) from LU> is simply a generalization of Eq, (18),
(19)
where X j is, of course, the upper left element of LW. In this way a factorization of detS is obtained:
detS=detXI detX2 •• ·detXN • (20)
Since all determinations on the rhs are of order one, we have
N
detS= rrXn • (21)
As a direct consequence of the theorem proven above [Eq. (15)J, we obtain M(E) by simply counting the number of negative Xn'S in the rhs of Eq. (21). The density-of-states function peE) is then obtained by differentiation of M (E),
If molecules are numbered first along a, then b and then c, where a, b, c are crystallographic axes, we can see that the total number of computations necessary to achieve the form of Eq, (20) is roughly
tus. Nas·Nbs. Nc,
tiond CB • fB b no.C tiond
5 0.9 0.901 640 5 5 0.8 0.825 320 10 5 0.7 0.723 320 10 5 0.6 0.613 320 10
10 0.5 0.5 640 10 10 0.4 0.378 640 5 10 0.3 0.291 1280 5 10 0.2 0.194 1280 5 10 0.1 0.088 1280 5 10 0.3 0.291 1280 5 10 0.3 0.283 640 5 10 0.3 0.283 640 5
0.5 0.5 1280 5
C Total number of molecules =U XXa XNc Xllib. u, 1\"0, Sc always equal to 2, 4, 4. l\"b = 10,20, 40 when the total number equals .no, 640, 1280.
d In units of em-I,
0.01
0.005
~ 0
Q... 0.01 Cf)
w I-
0.005 <{ l-(/)
ll.. 0 0
0.01 >-!::: (/)
z 0.005 w 0
0 100
0.01
0.005
0
100
200
200
CA =0.7 C8 =0.3
EA =200 em-I E8=251 em-I
300 400 E8= 1350 em-I
1300 140.0.
FIG. 3. Density-of-states functions for 70:30 mixtures with various trap depths. The bottom one corresponds to the deep trap case. The other three are, from the top: naphthalene-hg/ad., naphthalene-hg/M., and naphthalene-h8/d., respectively. Cluster and conglomerate states are not marked here but are included in Table III.

F R E N K E LEX CIT 0 N SIN DIS 0 R D ERE D MOL E C U L ARC R Y S TAL S 5385
where Na, Nb, Nc are the numbers of unit cells along a, b, c, respectively, and u is the number of molecules within the unit cell. To reduce the cost of computation, it is common practice to choose a crystallite elongated along a particular direction, such as c in this case, so that the cost will only increase linearly with the increasing total number of molecules.
As it has been demonstrated, this method can be used for ordered systems [Eq. (4) J, disordered systems with two or more components [Eq. (5)J, and more complicated systems such as amorphous systems or liquids. In the present case the off-diagonal elements are taken from recent information of pairwise interactions3 and the diagonal elements (equal to either EA or En) are put in with the help of a random number generator (URAND), which generates random numbers between 0 and 1.0, in the University of Michigan MTS library. This process is identical to the one previously described by Dean.6a All computations were performed on the IBM 360 computer.
III. RESULTS AND DISCUSSIONS
Ao Calculations of Density-of-States Function of Isotopically Mixed Crystals of Naphthalenes
The random lattice calculations were perfomled on the heavily doped mixed crystals of naphthalenes in the IB2" excited state. The dispersion relation and the band structure of this particular exciton band has been studied recently by Hong and Kopelman.3b •c
Although three sets of interactions were obtained, as shown in Table I, most of our calculations were done on the first set because of its consistency with the octupole modeI.27 We discuss later some of our calculations with the other two sets, together with the potential use of heavily doped mixed crystal data to distinguish different models of exciton interactions.
In Fig. 1, various intermolecular exciton interactions
68= 1350 em-I
QOIO C8 =0.3
ill <:< 0005 (/) UJ >-~ (/) O~----~----~---J~~
~ >t-U) 0005 z ~
1300 1400 ENERGY (em-I)
FIG. 4. D~n~ity-of-~tates functions for a deep trap case with two compOSItions. Smce the two subbands are essentially decoupled, only one of them is shown here.
(/) w >-~ (/)
FIG. S. Conglomerate states of ~ naphthalene-h8 for 10% mixed)crystals of naphthalene-h8 in d8 ~ with various sets of exciton inter- ~ actions: (a) Set 1 (b) Set 2 (c) ~ Set 3 in Table 1.
in the naphthalene crystal are shown. It is noted that eight translationally equivalent interactions and eight interchange equivalent interactions are included in our calculations. Since our samples are of finite size, choices have to be made as to the particular axis to be elongated in order to get good results within a reasonable cost limit. As shown in Fig. 1, we finally settle for samples elongated along the b axis. Cyclic boundary conditions have been imposed only along the other two axes. That this particular choice does yield satisfactory results can be seen from Fig. 2. In the first figure (marked Cr -70, Cn~1.0) two density-of-states functions are shown: one (the histogram with 10 cm- l resolution) calculated from the NFC method for a sample of the size 2X4X4X 10=320 (uX"YaX.YcXNb ); the other (dots) calculated analytically by using the dispersion relation3c for the pure crystal of naphthalene (with 432000 molecules):
€(k±) = 2Ma cos(koa) +2Mb cos(kob) +2Mc cos(k o c)
+2Ma+c cos[k o (a+c) J± 14M12 cos(koa/2)
Xcos(k o b/2) +4M12{cos(k o c) cos(k o a/2)
Xcos(kob/2) -sin(koc) sin(k oa/2)
Xcos(kob/2)J), (22)
where the M's are the pairwise interactions listed in Table I and the signs refer to the interchange group designations. 16 Good agreement is noted. Furthermore, for Cn =0.9, it is expected that the density-of-states function for the B component should be very similar to that of the pure crystal (Cn= 1.0). Calculations for a bigger sample (2X4X4X20) show that (second figure in Fig. 2) even at higher resolution (5 em-I) NFC results agree with analytical results. In later sections, we shall show that our ~FC results also yield satisfactory moments and cluster states. We have thus ample evidence that our samples are good approximations to infinitely large crystals. Notice that, because of the large M12 term, the present three dimensional exciton actually possesses some laminar

5386 H.-K. HONG AND R. KOPELMAN
TABLE III. Conglomerate states in dilute and heavily doped mixed crystals of naphthalenes (em-I).
Naphthalene-hal ds N aphthalene-dsl hs
Assign- Assign-Dilute" mentb H.D." Dilute" mentb H.D."
213) 343]
to II to ~ II' 208 340.2 (12)+
207.5 (12)+ 338J
196.5 b- 333) 193] 332.6 c+
192.5 a- I 329.9 a+ to ~ I' 190.7 c+
to f I 328.2 (a+c)-
190.5 (a+c)- 326.5 b+ I 186.5 M 325.7 M I 183.0 (a+c)+
183J 325.0 b-
I 324.5 (a+c)+
I 182.5 c- 322.3 a- I 181.5 a+ 318.9 c+
318) 178.5 b+
173] 308.1 (12)-
to ~ III 171.5 (12)-308)
168J to III'
303
"Taken from Fig. 6 of Ref. 3 (c). b (12)+ =plus state of interchange equivalent dimer; a+ =plus state of
translationally equivalent dimer along a axis. M =monomer. etc. The conventions used here are those of Ref. 3(c).
properties. This is why, in doing actual calculations, we find that computations based on an elongated a axis are equally good, whereas those based on an elongated c axis are completely unacceptable.
In Table II we list the sizes of samples which we use in calculating the density-of-states functions in Figs. 2-5. It is noted that, because of the finite sizes of samples, the actual concentrations are not exactly equal to the nominal concentrations.6a Since fine structure is expected in the guest region, larger samples are used to obtain better resolution. This introduces errors in normalization. No corrections are made in preparing Figs. 2-5; however, renormalization is carried out when moments are calculated and compared with analytical result (vide infra), by multiplying both the density-of-states functions and the concentrations with the common factor l/(jA+fB). This process is not required in a 50:50 mixture. In this particular case, the density-of-states functions of both a given system (e.g., .. ·AABABB···) and its inverted system (i.e., " ·BBABAA···) are computed. The final density-of-states functions are taken as the average of the two and hence automatically renormalized.6a Typical computation time for the largest
N aphthalene-pd4/ hs ~ aphthalene-ad4/ ha
Assign- Assign-Dilute" mentb H.D.d Dilute" mentb H.D.-
305\ 287]
302.0 (12)+ to 284.0 (12)+ to) I 300) 282
292.0 M 276.0 M
290) 272) to to 285 267
257]
274.0 (12)- 253.0 (12)- to ~ I
270) 247)
to 265
e Heavily doped. taken from Fig. 2. d Taken from Fig. 3. EB =274 em-I. _ Taken from Fig. 3. EB =251 em-I.
samples (1280 molecules) is around 1 min for each point. Consequently, a complete scan of a density-ofstates function requires 20-30 min. To reduce the storage space, matrix elements are generated at the time they are actually called for.
Together with the NFC results, CPA results using the same interaction parameters are also given in Figs. 2-4. It should be pointed out that, contrary to the NFC method, CA and CB are now actual concentrations and the whole region is covered in a single calculation. The density-of-states function are thus automatically normalized (see later discussions on moments). The actual calculations were carried out by solving two simultaneous equations involving the CPA Green's function and the self-energy.IO.16 A trial and error method was used,28 based on Newton's iteration method described. lO •l6 The pure crystal density-of-states function used is shown in Fig. 2 (CB~1.0) with 1 cm-l resolution. Mixed crystal density-of-states functions are calculated with the same resolution. Solid curves are used for mixed crystal peE) because CPA calculations tend to smear out fluctuations which are discernible in the original pure crystal density-ofstates function.
F R E N K E LEX CIT 0 N SIN DIS 0 R D ERE D MOL E C U L ARC R Y S TAL S 5387
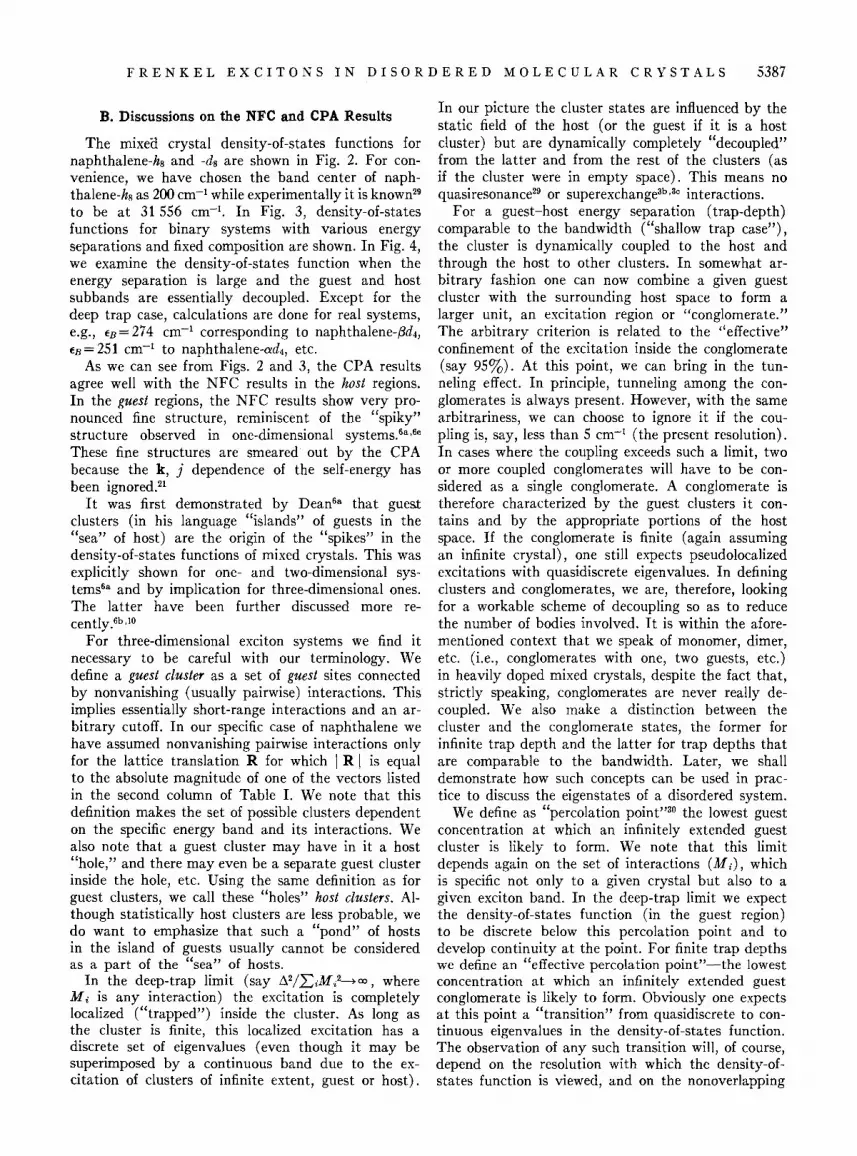
B. Discussions on the NFC and CPA Results
The mixeu crystal density-of-states functions for naphthalene-kg and -ds are shown in Fig. 2. For convenience, we have chosen the band center of naphthalene-hs as 200 cm-I while experimentally it is known29
to be at 31556 cm-I • In Fig. 3, density-of-states functions for binary systems with various energy separations and fixed composition are shown. In Fig. 4, we examine the density-of-states function when the energy separation is large and the guest and host subbands are essentially decoupled. Except for the deep trap case, calculations are done for real systems, e.g., fB=274 cm-I corresponding to naphthalene-,Bd4,
fB = 251 cm-I to naphthalene-ad4, etc. As we can see from Figs. 2 and 3, the CPA results
agree well with the NFC results in the host regions. In the guest regions, the NFC results show very pronounced fine structure, reminiscent of the "spiky" structure observed in one-dimensional systems.6a .6c
These fine structures are smeared out by the CPA because the k, j dependence of the self-energy has been ignored.21
It was first demonstrated by Dean6a that gues.t clusters (in his language "islands" of guests in the "sea" of host) are the origin of the "spikes" in the density-of-states functions of mixed crystals. This was explicitly shown for one- and two-dimensional systems6a and by implication for three-dimensional ones. The latter have been further discussed more recently.6b.l0
For three-dimensional exciton systems we find it necessary to be careful with our terminology. We define a guest cluster as a set of guest sites connected by nonvanishing (usually pairwise) interactions. This implies essentially short-range interactions and an arbitrary cutoff. In our specific case of naphthalene we have assumed nonvanishing pairwise interactions only for the lattice translation R for which I R I is equal to the absolute magnitude of one of the vectors listed in the second column of Table 1. We note that this definition makes the set of possible clusters dependent on the specific energy band and its interactions. We also note that a guest cluster may have in it a host "hole," and there may even be a separate guest cluster inside the hole, etc. Using the same definition as for guest clusters, we call these "holes" kost clusters. Although statistically host clusters are less probable, we do want to emphasize that such a "pond" of hosts in the island of guests usually cannot be considered as a part of the "sea" of hosts.
In the deep-trap limit (say !),,2jLiMi2~ro, where Mi is any interaction) the excitation is completely localized ("trapped") inside the cluster. As long as the cluster is finite, this localized excitation has a discrete set of eigenvalues (even though it may be superimposed by a continuous band due to the excitation of clusters of infinite extent, guest or host).
In our picture the cluster states are influenced by the static field of the host (or the guest if it is a host cluster) but are dynamically completely "decoupled" from the latter and from the rest of the clusters (as if the cluster were in empty space). This means no quasiresonance29 or superexchange3b .3c interactions.
For a guest-host energy separation (trap-depth) comparable to the bandwidth ("shallow trap case"), the cluster is dynamically coupled to the host and through the host to other clusters. In somewhat arbitrary fashion one can now combine a given guest cluster with the surrounding host space to form a larger unit, an excitation region or "conglomerate." The arbitrary criterion is related to the "effective" confinement of the excitation inside the conglomerate (say 95%). At this point, we can bring in the tunneling effect. In principle, tunneling among the conglomerates is always present. However, with the same arbitrariness, we can choose to ignore it if the coupling is, say, less than 5 cm-I (the present resolution). In cases where the coupling exceeds such a limit, two or more coupled conglomerates will have to be considered as a single conglomerate. A conglomerate is therefore characterized by the guest clusters it contains and by the appropriate portions of the host space. If the conglomerate is finite (again assuming an infinite crystal), one still expects pseudolocalized excitations with quasidiscrete eigenvalues. In defining clusters and conglomerates, we are, therefore, looking for a workable scheme of decoupling so as to reduce the number of bodies involved. It is within the aforementioned context that we speak of monomer, dimer, etc. (i.e., conglomerates with one, two guests, etc.) in heavily doped mixed crystals, despite the fact that, strictly speaking, conglomerates are never really decoupled. We also make a distinction between the cluster and the conglomerate states, the former for infinite trap depth and the latter for trap depths that are comparable to the bandwidth. Later, we shall demonstrate how such concepts can be used in practice to discuss the eigenstates of a disordered system.
We define as "percolation point"3o the lowest guest concentration at which an infinitely extended guest cluster is likely to form. We note that this limit depends again on the set of interactions (Mi), which is specific not only to a given crystal but also to a given exciton band. In the deep-trap limit we expect the density-of-states function (in the guest region) to be discrete below this percolation point and to develop continuity at the point. For finite trap depths we define an "effective percolation point"-the lowest concentration at which an infinitely extended guest conglomerate is likely to form. Obviously one expects at this point a "transition" from quasidiscrete to continuous eigenvalues in the density-of-states function. The observation of any such transition will, of course, depend on the resolution with which the density-ofstates function is viewed, and on the nonoverlapping

5388 H.-K. HONG A~D R. KOPELMAN
TABLE IV. Comparison between the exact moments' calculated from Eq. (23) and those of
Conc (CA ) 0.1 0.3 Trap depth" 115 cm-1 115 cm-1
Moment" E.M.d %e E.M. %
!J.o 1.0 0.04 1.0 -0.03 !J.IXlO-2 0.4600 0.20 0.2300 0.00 J.!2XlO-4 0.4726 0.19 0.4726 -0.11 !J.3XlO-6 0.3329 0.33 0.1589 -0.19 )LjXlO-8 0.3748 0.37 0.3436 -0.18 J.!5X 10⁻¹⁰ 0.3192 0.63 0.1458 -0.28 !J.6XlO-12 0.3649 0.74 0.03028 -0.20 !J.7X10-14 0.3509 1.02 0.1520 -0.33
• Calculated by using the following values for the moments of the pure crystal density-of-states function: J.!2(0) =0.142 Xl0', !J.3(0) = -0.152 X 10', !J..(0)=0.455Xl07, !J.,(O) = -0.106Xl0', !J.,(O) =0.191 X lOll, J.!7(0)= -0.649 X 10¹²• The nth moment has the dimension of (cm-1)n.
of discrete and continuous eigenvalues (quasidiscrete states may be found located inside a continuous band). In either case percolation implies an effective delocalization of the cluster or conglomerate excitation and the probable disappearance of sharp energy spikes from the density-of-states function.
The concepts of cluster and conglomerate can now be used in discussing our results in Figs. 2-4. It is apparent that in the limit of infinite dilution, all the clusters and conglomerates are completely "isolated" from each other. The corresponding cluster or conglomerate states are well defined and appear as 0 functions in p(E). At slightly higher concentrations, broadening will take place. In the case of cluster states, the broadening comes from the increase in the cluster size whereas in the case of conglomerate states the increased size of conglomerates and/or the coupling among them cause the broadening. In practice, however, such broadening is frequently so small that identification of "spikes" in peE) with the isolated cluster or conglomerate states in the dilute limit is still possible. It is exactly because of this that we find it convenient to define clusters and conglomerates in the way we did above. Conglomerate states in the very dilute (;s 1%) isotopically mixed crystals of naphthalene have been studied both theoretically3b,3C and experimentally.3a In Table III resonance pair conglomerate states for dilute mixed crystals of naphthalene are tabulated,31 together with the peaks observed in Figs. 2 and 3. It should be pointed out here that both the quasiresonance effect and the superexchange effect3b ,3c have been taken into account for monomer and dimer conglomerates. We notice that, in each case, the fine structure in the densityof-states function can be satisfactorily identified with the appropriate conglomerate states in the dilute limit. Thus the way we define clusters and conglomerates enables us to establish a 1: 1 correspondence between
0.5 0.7 115 cm-1 115 cm-1
~-~--~---------
E.M. % E.M.
1.0 -0.05 1.0 0.0 O.OOOl f -0.2300 0.4726 -0.13 0.4726
-0.01515 0.46 -0.1892 0.3426 -0.18 0.3715
-0.03560 0.20 -0.2250 0.3051 -0.20 0.3741
-0.05908 0.20 -0.2953
b Defined as fB-fA .
"The nth moment has the dimension of (cm-1 In. d Exact moments from Eq. (23).
%
-0.04 0.00
-0.08 0.16
-0.14 0.09
-0.11 0.03
clusters and conglomerates in heavily doped mixed crystals and those in the dilute mixed crystals.
It can be seen in Fig. 2 that, while we have six distinguishable resonance pairs [only five are listed in Table III, the sixth one with separation equal to H a + b ) + c can be ignored together with all other nonnearest neighbors, because of small interactions], only the interchange dimer states (peaks in Fig. 2 marked II, III, and II', III') are resolved from the main monomer peaks (marked I and I' in Fig. 2). This is so not only because of the large M12 but also because there are four identical interchange dimers [with separations: Ha+b), Ha-b), H-a+b), H - a - b)] as compared to only two for each translation pair. As a matter of fact, within the present resolution, we can redefine our clusters as consisting only of molecules coupled through the large M12 term. Thus a pair of guests connected by, say, the relatively small Ma term will be considered as two weakly coupled monomers rather than a dimer. Such a procedure, although somewhat arbitrary, does offer a satisfactory and consistent way of describing the energy in heavily doped mixed crystals. As we can see from Fig. 2, initially the presence of more guests results in the creation of more localized conglomerate states (such as monomers and dimers) rather than the enhancement of the degree of delocalization. As the guest concentration is further increased, the density-of-states function develops a continuous background, indicating that larger conglomerates are being formed. Apparently, the creation of new conglomerates and the expansion of the existing ones are two competitive processes. The competition continues until at a certain concentration all the conglomerates are coupled to form delocalized states, with the disappearance of fine structure in peE) at such a concentration, indicating that "effective percolation" (vide ultra) has been reached. Two interesting points to be noted here arc: (1) The

F R E N K E LEX CIT 0 N SIN DIS 0 R D ERE D MOL E C U L ARC R Y S TAL S 5389
the mixed crystal density-of-states functions based on the CPA (solid curves in Figs. 2-4).
0.9 0.7 0.5 0.7 0.7 115 cm-1 1150 cm-1 1150 cm-1 74 cm-1 51 cm-1
E.M. % E.M. % E.M.
1.0 -0.02 1.0 -0.07 1.0 -0.4600 -0.09 -2.300 -0.04 0.0
0.4726 -0.02 33.20 -0.06 33.20 -0.3632 -0.06 -77.04 -0.05 -0.01515
0.4305 0.07 1 114 -0.09 112 -0.4224 -0.21 -2 626 -0.04 -2.516
0.5120 0.27 37 720 -0.05 37 550 -0.5697 -0.37 -91 020 -0.08 -234.9
e Percentage error = 100 X (moment of the mixed crystal density of s.tates function-exact moment)/absolute value of exact moment.
f Differences in moments, not percentage error.
monomer peak is identifiable above the continuum even at an appreciable concentration ("-'30%) indicating that localized states persist up to such a concentration. (2) Localized states do exist inside the band, contrary to the conjecture by Economou and Cohen32 that such states only exist at the band edges. This picture actually agrees qualitatively with the experimental observations of Hong and Robinson. ls
Basically, this result is due to the fact that exciton interactions involved here are short range. Where longrange interactions such as dipole-dipole interactions are dominant, it is expected that the fine structure will be smeared out even at the lower concentrations. Finally, we notice that, at least in our present case, conglomerates based on larger clusters such as trimers, quadrumers, etc. (three or four guests coupled through the M12 interaction), do not contribute in a major way to the fine structure in p(E). A self-consistent theory which takes into account the pair effects would probably be sufficient for some purposes. Attempts have been made along this direction with some success.33
In Fig. 3, results for different energy separations (trap depths) at fixed composition are shown. From the study of dilute systems, it is well known that, with smaller energy separations, guest levels are not completely localized.34 Consequently, the radii of the excitations are extended to cover at least the nearby hosts. The fine structures of p(E) in the guest (B component) regions are now associated with the conglomerates, which are definitely larger than the clusters, due to delocalization. The net effect is that delocalized states can now be formed at comparatively lower concentrations. It can be seen from Fig. 3 that, with an energy separation of 51 cm-I, the erosion of fine structure at 30% is already apparent. Prominent peaks in Fig. 3 can also be identified with the conglomerate states in dilute systems as shown in Table III.
In Fig. 4, results in the deep trap limit (trap
---------% E.M. % E.M. %
-0.04 1.0 -0.02 1.0 -0.02 -0.00081 -0.1480 0.14 -0.1020 0.20 -0.03 0.2789 -0.25 0.2070 -0.20
-199.0- -0.09845 -0.29 -0.06523 0.29 0.27 0.1572 -0.25 0.09577 -0.19
-44.5" -0.08777 0.27 -0.04930 0.18 -0.05 0.1164 -0.34 0.05892 -0.20
-19.2" -0.08413 0.36 -0.03926 0.28
- The percentage error is largely due to the fact that the moment is a small difference of two large numbers; see text.
depth = 1150 cm- l ) are presented. The energy separation is such that the two subbands are almost decoupled and hence only one subband is shown. The density-of-states functions at two concentrations (30% and 50%) are strikingly different from those of the disordered chain6 in that most of the "spiky" structure commonly observed in the latter case is lost in the present three-dimensional case even though here the conglomerates are essentially reduced to their skeleton clusters. Although the present resolution is not very high, it seems very unlikely that conceptually different pictures would emerge from a study with improved resolution. The fact is that because of the large number of pairwise interactions actually used in our calculations, and hence the large varieties of clusters present, cluster states are more spreadout in energy than in the one-dimensional case or the multidimensional case with fewer interactions. This reduces the strength of the "spikes" and smears out the fine structure in the density-of-states function. The 50% sample is especially interesting. Results by Payton and Visscher6b show that for the same concentration all the eigenstates are localized in disordered chains consisting of two very different masses, whereas in our case delocalized states apparently exist simply because more channels are available for excitation delocalization.
Finally, we should also point out that, although many useful results have been obtained from phase theory in the case of linear chains, notably those concerning the special frequencies where the densityof-states function vanishes, its applications to disordered 3-dimensional lattices remain to be explored. At our concentrations there are hardly any places where our density-of-states function vanishes (besides the region separating the two subbands). Even in the deep-trap limit (Fig. 4), no breaks in the host or guest regions are apparent for guest concentrations

5390 H.-K. HONG AND R. KOPELMAN
TABLE V. Comparison between the exact moments' calculated from Eq. (23) and those of the
Cone. (CA)h 0.089 0.29 0.5 0.72 Trap depthh 115 cm-1 115 cm-1 115 cm-1 115 cm-1
---~---- --------- -~--------- -~-~-----
Momentc E.M.d %e E.M. %
!J.O 1.0 ••• h 1.0 !J.1XlO-2 0.4726 -0.0 0.2450 2.8 !J.2XlO-4 0.4726 -2.1 0.4726 -0.4 !J.aXlO- 6 0.3425 -2.0 0.1702 1.7 !J.4XlO-s 0.3773 -4.1 0.3447 -2.8 !J..X 10-10 0.3285 -4.7 0.1573 -1.0 !J.sX 10-12 0.3702 -7.0 0.3049 -5.3 !J.7X1Q-14 0.3617 -8.1 0.1652 -4.4
a-I See footnotes in Table IV.
higher than 30%. Part of the reason may be the fact that we are dealing with excitons rather than phonons (see Sec. II.A). The usefulness of phase theory as applied to real disordered lattices might also be somewhat limited.30
C. CPA and NFC Results vs Exact Moments of Density-of-States Functions
In a recent paper, Hong and Kopelman21 calculated a number of moments for both the spectral density and the overall density-of-states function from the exact Green's function. 16 It was also shown that the density-of-states function based on the CPA yielded the correct eight lower moments. Furthermore, as expected, these lower moments of the mixed crystal density-of-states functions are expressible in terms of moments of the pure crystal density-of-states function:
/-10= 1,
111= f,
/-12= 112/4+Jl2(0) ,
/-13= EI12/4+3fI12(0) +113(0) ,
/-14= 114/16+ (112+ 2E2) 112(0)+4EI13(0) +/-14(0) ,
/-15= fI14/16+SEI12112(0) /2+ (5112/4+5E2) 1l3(0)
+ 5E/-I4 (0) + 110 (0) ,
1l6= 116/64+ (9114/16+3E2112/2+3xyI12/-12(0» J1.2(0)
+ (9EI12/2+2E3)J1.3(O) + (3112/2+9E2)J1.4(O)
+ 6EJ1.5 (0) + /-16 (0) ,
J1.7= EI16/64+ (2IEI14/16+ 7ExyI12112(0) + 7 XyI12J1.3(0» 112(0)
+ (7114/8+ 2h2112/4) J1.3(0) + (7EI12+ 7E3) 114(0)
+ (7112/4+ 14E2) J1.5(0) + 7E/-I6(O) +l1i(O) ,
where
(23)
E.M. % E.M. %
1.0 1.0 0.0 0.00334£ -0.2488 -1.2 0.4726 -2.5 0.4726 -0.0
-0.01515 46.0" -0.2034 5.1 0.3426 -4.9 0.3752 -3.7
-0.03560 29.5" -0.2409 9.6 0.3051 -7.3 0.3828 -8.3
-0.05908 23.6" -0.3162 13.0
h Renormalizations have been done for both concentrations and
is the nth moment of the pure crystal density-of-states function p(O)(E). Also, I1=EB-EA and E=CAEA+CBEB are, respectively, the energy separation and the weighted mean of the excitation energies EA, EB. We have put CA=x and CB=y to conform with previous notation.12 ,21 Notice that Eq, (23) is valid only if the moments are evaluated about the origin H EA +EB). Therefore now E= (CB-CA)I1/2. Higher moments for the density-of-states function based on the CPA will still be expressible in terms of pure crystal moments I1n (0), but those of the exact density-of-states function will not. 36 This is expected if one considers the fact that, while the pure crystal density-of-states function is the only parameter (except for trap depth) needed in a CPA calculation, the complete dispersion relation is required in an exact calculation. Analytical expressions for some lower moments of the spectral density function were also obtained by Hong and Kopelman.21
They will be discussed in a future work on the optical spectra of mixed crystals.
To evaluate the quality of our numerical calculations, we compare the moments of mixed crystal density-of-states functions shown in Figs. 2-4 with those directly calculated from Eq. (23), Moments for p(O) (E) (shown in Fig. 2) can be determined either from Eq. (24) or directly from the intermolecular exciton interactions.3c For example, in the present case we have [put R=O in Eq, (38) of Ref. 3(c)]:
J1.2(0) = 2 (Ma2+Mb2+Mc2+Ma+c2) +4(M122+Ml2'2) ,
113(0) = 12 (MaM 122+ MbM122 + MaMcMa+c+ MbM12,2)
(25)
As shown in Table IV, the moments of our CPA density-of-states functions agree with those calculated from Eq. (23) to better than 1% in most cases, Notice that in a 50: 50 mixture with large energy separation the odd moments are differences of two larger numbers (one for each subband). This is why the percentage errors in such cases are much larger

F R E N K E LEX CIT 0 N SIN DIS 0 R D ERE D MOL E C U L ARC R Y S TAL S 5391
mixed crystal density-of-states functions calculated by the NFC method (histograms in Figs. 2-4).
0.91 0.72 0.5 0.72 0.72 115 cm-1 1150 cm-1 1150 cm-1 74 cm-1 51 cm-1
E.M. % E.M. % E.M.
1.0 1.0 1.0 -0.457 -0.6 -2.488 4.3 0.0
0.4726 -1.1 33.20 4.9 33.20 -0.3750 4.2 -83.35 3.4 -0.01515
0.4356 -6.2 1 114 4.0 112 -0.4362 9.5 -2840 2.6 -2.516
0.5240 -11.7 37 750 3.2 37 550 -0.5901 14.6 -98460 2.1 -234.9
density·of-states functions (ef. Table II).
than others. Most of the discrepancies appear to occur at the edges of the bands, where small contributions to the density-of-states function are either neglected or exaggerated in our program. This good agreement indicates that our CPA results are quite accurate. On the other hand, we have a numerical check on the validity of Eq. (23).
The comparison between the exact moments from Eq. (23) and those of our NFC density-of-states functions is shown in Table V. Notice that, while our histograms have a resolution of 5 cm-t, the moments have been calculated with 1 cm-1 increments. Notice also that renormalization has been done on both the density-of-states functions and concentrations (d. Table II) in preparing Table V. Generally, the discrepancies are roughly 1 order of magnitude larger than in Table IV. In 50: 50 mixtures, large discrepancies are again observed between the values for odd moments (even when the trap depth is only 115 cm-I )
because they are differences of larger numbers. Two sources of errors are apparent: (1) limited resolution, (2) limited size of sample. Nevertheless, because of the satisfactory agreement, we are inclined to believe that the present sizes of samples are adequate for the present resolution. This is, of course, also supported by the good agreement observed in Table III, where conglomerate states calculated from our samples (1280 molecules at most) are compared with those from a much larger sample (16000 molecules) in the dilute limit. The conclusion is that our NFC results, except for their limited resolution, are quite satisfactory. Comparison between the moments has never been done in all the previous calculations on the random lattice problem. Dean6a has shown that we cannot satisfactorily determine the density-of-states functions from known moments (the moment trace method of Domb et al.37 ). However, moments are very useful as independent criteria if density-of-states functions can be determined from other methods. Finally, we would like to point out that all the moments here are eval-
% E.M. % E.M. %
1.0 1.0 -0.000131 -0.1643 2.3 -0.1132 3.9 -0.33 0.2789 -2.6 0.2070 -3.8 -8.4'< -0.1076 10.6 -0.07074 10.9 -0.63 0.1596 -8.8 0.09713 -10.2 28. ()c -0.09533 16.5 -0.05312 15.8
-0.93 0.1204 -15.0 0.06082 -15.8 31.3' -0.09151 21.2 -0.04237 19.6
uated using the mean of fA and fB as origin. Because of this "democratic" process, moments thus obtained are more representative of hosts than of guests. A method which yields correct host states, such as the CPA method, will compare more favorably than other methods. To emphasize the guest states, it might be desirable to evaluate moments about such points as the weighted mean, namely, CAfA+CBfB.
D. NFC Results and Exciton Pairwise Interactions
The density-of-states functions of heavily doped mixed crystals are completely determined by the energy separation and the exciton pairwise interactions. Consequently, one aspect of mixed crystal studies is either to extract information concerning such interactions from the known density-of-states function, or knowing the interactions, to compare the calculated density-of-states function with experiments. One could, for example, study the mixed crystal density-of-states functions by a variation of the hot band spectroscopy2,18 and through Eq. (23) learn about various moments of pure crystal density-of-states function. Alternatively, one could study the conglomerate states in the dilute mixed crystals.3 As pointed out by Hong and Kopelman,3b,3c such a study should also include a variation of trap depths in order to monitor the superexchange effect. Investigations along this direction are being carried out in this laboratory. Here, we shall examine the feasibility of utilizing the mixed crystal data to elucidate the exciton interactions.
Although we have a slight preference for the first set of exciton interactions listed in Table I, because it can be satisfactorily fitted with octupole parameters,27 the other two sets also agree with all the known pure and mixed crystal dctta. We have performed some calculations using the other two sets as shown in Fig. 5. Only the density-of-states functions in the guest region are shown; those in the host region are quite similar to each other and are not shown. As we can see from Fig. 5, the differences are probably
5392 H.-K. HONG A~D R. KOPELMAN
less significant than the similarities. In other words, all three density-of-states functions reflect the fact that the interchange equivalent interaction (M12 ) is the predominant exciton interaction in lB2u naphthalene. Despite the fact that translationally equivalent interactions are different for different sets, little effect on the final density-of-states function can be observed because of their small magnitude. To distinguish between the three sets, refined calculations and experiments with better resolution are needed. However, it is certainly feasible at this stage to confirm the large interchange equivalent interaction from the mixed crystal band-to-band transition. Emission experiments of this kind were done by Hong and Robinson,1s except that phonon participation appeared to smear out most of the spectral fine structure at liquid nitrogen temperature. Similar fluorescence experiments,1s at helium temperature, indicated that only interchange equivalent dimer and trimer states were populated. A more sensitive method, such as the photoexcitation method recently employed by Castro and Robinson,3s might enable one to carry out the band-to-band absorption experiments at temperatures slightly above 4.2°K without demanding too thick a sample.
* Supported by NSF Grant No. 18718 and PHS Grant )lo. 2ROI NS08116.
I For the theory and experiments on dilute mixed crystals see, for example, E. R. Bernstein, S. D. Colson, R. Kopelman, and G. W. Robinson, J. Chern. Phys. 48, 5596 (1968); D. M. Hanson, R. Kopelman, and G. W. Robinson, J. Chern. Phys. 51,212 (1969); D. P. Craig and M. R. Philpott, Proc. Roy. Soc. (London) A290, 583, 602 (1966); A293, 213 (1966); B. S. Sommer and J. Jortner, J. Chern. Phys. 50, 187, 822 (1969). For heavily-doped mixed crystals, see Refs. 16 and 18.
2 S. D. Colson, D. M. Hanson, R. Kopelman, and G. W. Robinson, J. Chern. Phys. 48, 2215 (1968).
'(a) D. M. Hanson, J. Chern. Phys. 52, 3409 (1970); (b) H. K. Hong and R. Kopelman, Phys. Rev. Letters 25, 1030 (1970); (c) H. K. Hong and R. Kopelman, J. Chern. Phys. 55, 724 (1971).
4 F. J. Dyson, Phys. Rev. 92, 1331 (1953). 5 For a review and bibliographies, see J. Hori, Spectral Pro
perties of Disordered Chains and Lattices (Pergamon, Oxford, 1968) .
6 (a) P. Dean, Proc. Phys. Soc. (London) 73, 413 (1959); Proc. Roy. Soc. (London) A254,507 (1960); A260, 263 (1961); P. Dean and J. L. Martin, ibid. A259, 409 (1960); P. Dean and M. D. Bacon, ibid. A283, 64 (1965). (b) D. N. Payton III and W. M. Visscher, Phys. Rev. 154, 802 (1967); 156, 1032 (1967); 175, 1201 (1968). (c) P. S. Julienne and S.-1. Choi, J. Chern. Phys. 53, 2726 (1970).
7M. Lax, Rev. Mod. Phys. 23,287 (1951); Phys. Rev. 85, 621 (1952).
8 F. Yonezawa and T. Matsubara, Progr. Theoret. Phys. (Kyoto) 35,357 (1966); 35, 759 (1966); 37, 1346 (1967); F. Yonezawa, ibid. 40,734 (1968).
9 Y. Onodera and Y. Toyozawa, J. Phys. Soc. Japan 24, 341 (1968).
10 D. W. Taylor, Phys. Rev. 156, 1017 (1967). II P. Soven, Phys. Rev. 156, 809 (1967).
12 B. Velicky, S. Kirkpatrick, and H. Ehrenreich, Phys. Rev. 175, 747 (1968).
I'P. Soven, Phys. Rev. 178, 1136 (1969). 14 V. L. Broude and E. I. Rashba, Fiz. Tverd. Tela 3, 1941
(1961) [Sov. Phys. Solid State 3, 1415 (1962)]. 16 D. P. Craig and M. R. Philpott, Proc. Roy. Soc. (London)
A290, 602 (1966). 16 H. K. Hong and G. W. Robinson, J. Chern. Phys. 52, 825
(1970). 17 S. D. Colson, R. Kopelman, and G. W. Robinson, J. Chern.
Phys. 47, 27, 5462 (1967). 18 H. K. Hong and G. W. Robinson, J. Chern. Phys. 54, 1369
(1971). 19 J. C. Laufer and R. Kopelman, J. Chern. Phys. 53, 3674
(1970) . 20 To our knowledge, the only existing literature on the com
parison between CPA and NFC results is Taylor's paper (Ref. 10) on disordered phonons. The treatments of disordered phonons and excitons are similar but not identical. For further discussions see Sec. II.A.
21 H. K. Hong and R. Kopelman, J. Chern. Phys. 55, 3491 (1971).
22J. Frenkel, Phys. Rev. 37,17,1276 (1931); A. S. Davydov, Theory of Molecular Excitons (McGraw-Hill, New York, 1962); .\.. S. Davydov, Usp. Fiz. Nauk 82, 393 (1964) [Sov. Phys. Usp. 7, 145 (1969)]; A. S. Davydov, Theory of Molecular Excitons (Plenum, New York, 1971).
23 E. R. Bernstein, S. D. Colson, R. Kopelman, and G. W. Robinson, J. Chern. Phys. 48, 5596 (1968).
24 lInn = <n*+ '2'm<mo, where <* and <0 are the energies of excited and ground state molecules in the site, respectively. Subscripts refer to the site indices. We can rewrite IInn= «n*-enO
) + '2mf,no. Choosing the ground state of the crystal, which is '2m<mo, as energy zero, we have lInn equal to <n*-en
o, or the excitation energy.
25 The following proof is an adaptation of the one given on p. 34 of Ref. 5, except that the latter contains some misprints.
26 J. H. Wilkinson, Rounding Errors in Algebraic Processes (Her Majesty's Stationery Office, London, 1963), Chap. 3.
21 D. P. Craig and S. H. Walmsley, Mol. Phys. 4, 113 (1961). 28 When the trial and error method is used, it is found that
at the band edges, the real part of the Green's function does not vary too much with either concentrations or trap depths. It always is roughly equal to the reciprocal of half the pure crystal bandwidth (=0.02 in our case)! Consequently, the real part of the self-energy can be determined from the following equation [see Eq. (48) in Ref. 16, assuming b, d=O]:
±0.02= -c/{C[(CB-CA)tJ.+C]-CACBtJ.2j.
This value is used as the first trial value. A small imaginary part is then assigned to the self-energy so that the iterations lead to a complex Green's function.
29 D. M. Hanson, R. Kopelman, and G. W. Robinson, J. Chern. Phys. 51, 212 (1969); B. S. Sommer and J. Jortner, ibid. 50, 822 (1969).
30 H. L. Frisch, J. M. Hammersley, and D. J. A. Welsh, Phys. Rev. 126, 949 (1962); M. E. Fisher, J. Math. Phys. 2, 620 (1961) .
31 This table can be prepared from Fig. 6 of Ref. 3 (c) . 32 E. ~. Economou and M. H. Cohen, Mater. Res. Bull. 5, 577
(1970) . 33 F. Yonezawa and S. Homma, J. Phys. Soc. Japan 26, Suppl.
68 (1969) and private communication; R. N. Aiyer, R. E. Elliot, J. A. Krumhansl, and P. L. Leath, Phys. Rev. 181, 1006 (1969); for related work see also K. F. Freed and M. H. Cohen, Phys. Rev. B 3, 3400 (1971).
34 E. I. Rashba, Opt. Spektrosk. 2, 568 (1957). 35 See also p. 177 of Ref. 5. 36 See Footnote 23 in Ref. 21. 31 C. Domb, A. A. Maradudin, E. W. Montroll, and G. H. Weiss,
Phys. Rev. 115, 18, 24 (1959). as G. Castro and G. W. Robinson, J. Chern. Phys. 50, 1159
(1969) .


