Embed Size (px)
Citation preview

Development of a porcine (Sus scofa)embryo-specific microarray: array annotationand validationTsoi et al.
Tsoi et al. BMC Genomics 2012, 13:370http://www.biomedcentral.com/1471-2164/13/370 3

RESEARCH ARTICLE Open Access
Development of a porcine (Sus scofa)embryo-specific microarray: array annotationand validationStephen Tsoi1*, Chi Zhou1, Jason R Grant1, J Alexander Pasternak1, John Dobrinsky2, Philippe Rigault3,Julie Nieminen4, Marc-André Sirard4, Claude Robert4, George R Foxcroft1 and Michael K Dyck1*
Abstract
Background: The domestic pig is an important livestock species and there is strong interest in the factors thataffect the development of viable embryos and offspring in this species. A limited understanding of the molecularmechanisms involved in early embryonic development has inhibited our ability to fully elucidate these factors.Next generation deep sequencing and microarray technologies are powerful tools for delineation of molecularpathways involved in the developing embryo.
Results: Here we present the development of a porcine-embryo-specific microarray platform created from a largeexpressed sequence tag (EST) analysis generated by Roche/454 next-generation sequencing of cDNAs constructedfrom critical stages of in vivo or in vitro porcine preimplantation embryos. Two cDNA libraries constructed fromin vitro and in vivo produced preimplantation porcine embryos were normalized and sequenced using 454 Titaniumpyrosequencing technology. Over one million high-quality EST sequences were obtained and used to develop theEMbryogene Porcine Version 1 (EMPV1) microarray composed of 43,795 probes. Based on an initial probe sequenceannotation, the EMPV1 features 17,409 protein-coding, 473 pseudogenes, 46 retrotransposed, 2,359 non-codingRNA, 4,121 splice variants in 2,862 genes and a total of 12,324 Novel Transcript Regions (NTR). After re-annotation,the total unique genes increased from 11,961 to 16,281 and 1.9% of them belonged to a large olfactory receptor(OR) gene family. Quality control on the EMPV1 was performed and revealed an even distribution of ten clustersof spiked-in control spots and array to array (dye-swap) correlation was 0.97.
Conclusions: Using next-generation deep sequencing we have produced a large EST dataset to allow for theselection of probe sequences for the development of the EMPV1 microarray platform. The quality of thisembryo-specific array was confirmed with a high-level of reproducibility using current Agilent microarraytechnology. With more than an estimated 20,000 unique genes represented on the EMPV1, this platform willprovide the foundation for future research into the in vivo and in vitro factors that affect the viability of porcineembryos, as well as the effects of these factors on the live offspring that result from these embryos.
BackgroundThe domestic pig is an economically-important livestockspecies, with pork constituting 40% of the world’s meatconsumption, making it the most important meat sourceglobally [1]. However, swine are also a well-recognizedbiomedical animal model for improving human health.Recent research has focused on using the pig as a medical
model for renal transplantation [2], cardiovascular-relateddiseases [3], atherosclerosis [4] and Cystic Fibrosis [5].As well, advances in induced pluripotent stem cell(iPSCs) technologies [6-8] make the pig an attractivemodel for regenerative medicine and stem cell research.As a result, there is a strong interest in the factors thataffect the efficient production of viable embryos and off-spring in this species using either in vivo or in vitro pro-duction methods.
During the preimplantation period of embryonic dev-elopment, the mammalian embryo exhibits dramatic
* Correspondence: [email protected]; [email protected] of Agricultural, Food and Nutritional Science, University ofAlberta, Edmonton, AB T6G 2P5, CanadaFull list of author information is available at the end of the article
© 2012 Tsoi et al.; licensee BioMed Central Ltd. This is an Open Access article distributed under the terms of the CreativeCommons Attribution License (http://creativecommons.org/licenses/by/2.0), which permits unrestricted use, distribution, andreproduction in any medium, provided the original work is properly cited.
Tsoi et al. BMC Genomics 2012, 13:370http://www.biomedcentral.com/1471-2164/13/370

morphological changes and many key developmentalevents take place. Until recently, studies to determinethe effects of various factors on embryonic developmentand competence have been limited to morphological andphenotypic evaluations [9-11]. Current understanding ofthe molecular events during the development of porcinepreimplantation embryos is limited. Increased know-ledge in this area will contribute to our understanding ofbasic reproductive biology. It will also allow us to iden-tify the molecular markers related to embryonic quality,and facilitate improved maternal management as well asin vitro production and manipulation of embryos.
Powerful high-throughput genomic tools, such asmicroarray technologies and deep sequencing have beendeveloped to study gene expression at the whole genomeof domestic animals during development [12]. Deep se-quencing allows for a detailed analysis of transcriptlevels, as well as data mining and identification of tran-script isoforms. Alternatively, gene expression microar-rays allow for efficient analysis of a large number ofdifferent predetermined transcripts in several samples,but are limited by prior knowledge and gene discovery.Although there are gene expression microarray plat-forms available for various species, most are basedon somatic cell expression and it has been shown thatthe embryonic transcriptome differs significantly fromthat of somatic cells [13]. To date, the development ofembryo-specific gene-expression microarrays has onlybeen reported for cattle [14]. Although there have beenefforts to characterize the gene expression profile of thedeveloping porcine embryo [15-19], a full description ofnovel genes expressed during preimplantation develop-ment in the pig is still needed. With the on-going effortin porcine genome mapping and sequencing [20], thecapacity to achieve this endeavour is now available.
To our knowledge, this is the first complete genome-wide study using 454 pyrosequencing and microarrayanalysis during porcine preimplantation development in-volving nine specific stages; from oocytes to early blasto-cysts. Here, we report the design of an oligo-microarraycovering a total of 43,795 probes, which has been vali-dated using gene expression profiles of porcinecumulus-oocyte-complexes (COC) and pooled embryosof 2-cells, 4-cells and 8-cells developmental stages. Fur-ther annotation of all genes incorporated into thismicroarray platform will also facilitate future research todefine new pathways and the regulatory elements thatare correlated to the factors affecting embryoniccompetence.
MethodsEmbryo production and preparationPorcine embryos of in vitro origin were generated byMinitube of America, Inc. (International Biotechnology
Centre, Mt. Horeb, Wisconsin, USA). A total of120 embryos were generated from eight different stages(2-cell, 4-cell early, 4-cell mid, 4-cell late, 8-cell, morula,expanded blastocyst and hatched blastocyst), as wellas 30 oocytes at Germinal Vesicle (GV) and MII stages.A total of 15 embryos or oocytes were collected fromeach stage. Following culture and selection, five iden-tical embryos or oocytes from each stage were placedinto 50 μl of lysis buffer from ArcturusW PicoPureW
RNA Isolation kit. All samples were shipped on dry iceto the University of Alberta and stored at −80°C untilRNA extraction.
Porcine embryos of in vivo origin were generated andcollected as described by Degenstein et al.. [21]. A totalof 121 embryos and oocytes were generated at ninedifferent stages of development: Germinal vesicle (GV)(N = 16), MII (N = 15), 2-cell (N = 13), 4-cell early (N =19), 4-cell late (N = 15), 8-cell (N = 12), morula (N =18), expanded blastocyst (N = 8) and hatched blasto-cyst (N = 8). All samples were stored at −80°C untilRNA extraction.
Normalized cDNAs preparation and sequencingRNA was first extracted from pooled samples describedabove using Arcturus PicoPure RNA Isolation Kit(Applied Biosystems, Carlsbad, CA, USA). High-qualitytotal RNA was obtained after DNase treatment usingRNase-Free DNase kit according to the protocol fromQiagen (Mississauga, On, Canada). Bioanalyzer RNA6000 Pico LabChip (Agilent Technologies, Mississauga,On, Canada) was used to evaluate the total RNA quality.RNA Integrity Number (RIN) index was used as anumerical assessment of the integrity of RNA.
A yield of 25.4 (RIN =8.4) and 50 (RIN = 7.7) ngof total RNA was obtained from in vitro and in vivosamples respectively and used for first-strand cDNA syn-thesis using Super SMART PCR cDNA Synthesis Kit(Clontech, Mountain View, CA, USA) with the followingmodifications. Reverse transcription (RT) was carriedout with the SMART MMLV reverse transcriptase andthe RT reaction was extended to 90 minutes at 42°C.Following second strand amplification, 3.1 μg of purifiedcDNA was obtained using a QIAquick Mini Elute kit(Mississauga, On, Canada). The cDNA library was nor-malized according to the Trimmer Direct Kit protocol(Evrogen, Russia) to minimize differences in representa-tion of transcripts. This normalization protocol is basedon denaturing-reassociation of cDNAs, followed by di-gestion with a duplex-specific nuclease (DSN) method[22] to remove the highly-abundant cDNA fraction. Inbrief, 1 μg and 880 ng of cDNAs from in vitro andin vivo generated embryos were incubated at 98°C for2 minutes followed by incubation at 68°C for 5 hours inthe provided hybridization buffer (50 mM Hepes, pH7.5
Tsoi et al. BMC Genomics 2012, 13:370 Page 2 of 15http://www.biomedcentral.com/1471-2164/13/370

and 0.5 M NaCl). The optimal digestion was treated with1/8 units of DSN. The normalized cDNA was then amp-lified from 1 μl of DSN-treated cDNA by PCR reactions(11 cycles) involving: 95°C for 1 minute, followed by12 cycles with 95°C for 15 seconds, 64°C for 20 secondsand 72°C for 3 minutes, with a final extension of 72°Cfor five minutes and clean up with a QIAquick MiniElute PCR column (Qiagen, Mississauga, ON, Canada).
In order to improve the pyrosequencing yield, an add-itional BAL 31 nuclease digestion was carried out on aportion of the cDNAs to remove homopolymers accord-ing to the protocol provided by USB Corporation(Cleveland, OH.) . The reaction was performed at 30°Cfor 2 minutes and the nuclease activity was stopped byadding 0.5 M EGTA. The reaction mix was passedthrough QIAquick Mini Elute PCR column. The qualityof the cDNA was verified by 1% TAE agarose gel elec-trophoresis before 454 sequencing. Then 20 μg of nor-malized cDNA library was obtained and 15 μg of thissample was nebulized with the nebulization kit suppliedwith the GS Titanium Library Preparation kit (Roche/454 Life Sciences Corp., Bradford, CT, USA) as perthe protocols of the 454 sequencing Laboratory atMcGill University and Genome Quebec InnovationCentre (Montreal, QC, Canada). Sequencing runs werecarried out using high-throughput pyrosequencingGenome Sequencer FLX (454 Life Sciences Corp., Brad-ford, CT, USA). The original 454 sequencing output datawas preserved as SFF (Standard Flowgram Format) files.Sequences were deposited at the NCBI short-read arch-ive (SRA) under accession number SRA029132.1.
454 sequencing analysis and microarray fabricationInitial 454 sequence analysis and microarray probesequences design were performed by Gydle Inc. bioinfor-matics service (Quebec City, Canada, http://www.gydle.com/). Raw sequences were transformed into high-quality (HQ) sequences according to Gydle Inc.'s propri-etary sequence filtration process. This process utilizesthe sequence and quality scores of each sequence readto identify its context (presence of 5’ or 3’-end adapters,sequencing direction, detection of artefacts), to trim thesequence to a high-quality interval, and to remove bac-terial and ribosomal contaminants. EST sequences fromall sources (454 and UniGene Ssc build#39, Aug. 23,2010) were then aligned (Nuclear software, Gydle Inc.)to the available annotated porcine reference genometo characterize annotated genes and NTR’s (Novel Tran-script Regions). As the porcine genome is currently in asemi-complete, semi-annotated state, a mix of porcinegenome sources from Ensembl Genome Browser(Sscrofa_9 & pre-version of Sscrofa_10) and NCBIUniGene (Ssc build#39, Aug. 23, 2010) were used asthe porcine reference genome for the initial probe
annotation. Based on this initial analysis 60 -mer oligo-sequence probes were designed by Gydle Inc. and wereused for microarrays synthesis in situ using the AgilentSurePrint™ technology (Agilent Technologies, Missis-sauga, On, Canada) with a 4 × 44 K format. This tech-nology allows for the generation of arrays with tens ofthousands of oligonucleotides that are constructed usingan ink-jet oligonucleotide synthesizer [23]. A total of43,795 probes including positive and negative controlsrepresenting 23,148 genes appear on the EMPV1 micro-array (Additional file 1 and Additional file 2). Thecustom microarray design of the platform, including theoriginal and updated annotation has been submittedto the NCBI GEO (Gene Expression Omnibus). Theaccession number of the platform is GPL14925.
Microarray proceduresSamples collection for microarray platform validationOvaries from gilts were collected at a local slaughter-house and the cumulus–oocyte complexes (COC) wereaspirated from mature follicles and washed in saline so-lution. The COCs were used in this validation process asthey provide tissues of both somatic (cumulus) and gam-etic (oocytes) origin. Individual COC samples werestored at −80°C until RNA extraction. In vivo collectionof 2-cell, 4-cell and 8-cell stages embryos has been previ-ously described [21]. Five morphologically identicalembryos of from each stage were pooled for RNAextraction. ArcturusW PicoPureW RNA Isolation Kit(Applied Biosystems, Carlsbad, CA, USA) was used forboth single COC and pooled-embryo extraction. TotalRNA quality was evaluated with an Agilent 2100 Bioana-lyzer using RNA 6000 Pico kit (Agilent Technologies,Mississauga, ON, Canada). The RIN value of the twoCOC samples were >8. The RIN value of 2-cell, 4-celland 8-cell embryos was 5.9, 6 and 6 respectively. It shouldbe noted that there are consistently low levels of riboso-mal 28 S RNA present in 2-cell, 4-cell and 8-cell embryoswhich result in lower RIN values [24], so these sampleswere still considered suitable for RNA amplification.
RNA amplificationRiboAmp HSPlus kit (Applied Biosystems, Carlsbad, CA,USA) was used to amplify the low quantities of totalRNA isolated from the samples. Five ng of total RNAfrom the COC samples was used for amplification of ad-equate antisense RNA (aRNA) for labelling. However,only 1.5 ng to 2 ng of total RNA from pooled embryoswere utilized in amplification. Nanodrop ND-1000(NanoDrop Technologies, Wilmington, DE, USA) wasused to determine the aRNA quantity. The Agilent two-color RNA Spike-InW kit (Agilent Technologies, Missis-sauga, ON, Canada) is a mixture of 10 different viral
Tsoi et al. BMC Genomics 2012, 13:370 Page 3 of 15http://www.biomedcentral.com/1471-2164/13/370

poly-adenylated RNAs. Five ng of spiked-in RNA wasalso used for amplification.
Labelling and hybridizationTwo μg of aRNA from each sample were labelled withCy3 and Cy5 using the ULS Fluorescent Labeling Kit(Kreatech Diagnostics, Amsterdam, Netherlands). Thesame kit was used for the spiked-in aRNA except theamount for labelling was 5 μg of each, using Cy3 for Aand Cy5 for B. All the labelled probes were purifiedusing picopure RNA extraction kit (Applied Biosystems,Carlsbad, CA, USA). Concentration and labeling effi-ciencies were determined using a Nanodrop ND-1000.
Samples were labelled with alternate dyes and hybri-dized on a single EMPV1 microarray in a dye-swapmanner with the alternate dye colours used as technicalreplicates. A total of 110 μl of hybridization mixture wasprepared according to the manufacturer's instructions(Agilent Gene Expression Hybridization Kit 60-meroligo microarray protocol version 4.0). Briefly, a total of825 ng of each Cy3 and Cy5 labelled aRNA plus 2.75 μlof labelled Agilent spike (0.01X) was prepared with 25Xfragmentation and 10X blocking buffers. After incubat-ing the mixture at 60°C for 15 minutes, it was immedi-ately cooled on ice for one minute before adding anequal volume of 2X GEx hybridization buffer HI-RPM(Agilent Technologies, Mississauga, ON, Canada). Arrayhybridization was carried out for 17 hours at 65°C rotat-ing at 10 rpm in an oven. Steps for washing, stabilisationand drying as indicated in established Agilent protocolswere strictly followed.
Array data acquisition and spiked-in quality control(QC) analysisArrays were immediately scanned at 5 μm resolutionafter drying using an Axon 4200AL scanner (635 nm forCy5 and at 532 nm for Cy3) using the autoscan featurefrom the default setting and images were analysed withGene Pix Pro 6.0 software (Molecular Device, Sunnyvale,CA 94089 USA). Analysed images were manually editedfor any spots with hybridization artefacts and flagged forexclusion in further analysis. Data from spot intensity,background subtraction and normalization was saved asGenePix Results (GPR) format for further array QCanalysis. A web-based EmbryoGENE microarray QCmodule (https://www.gydle.com/embryogene/qc) wascreated by Gydle Inc and GPR files were uploaded foranalysis. Agilent spiked-in control intensities were usedto identify the best normalization procedure for eachdataset. Hybridization quality was evaluated graphicallythrough the distribution of signals generated by bothchannels, in addition to the negative and spiked-in con-trols [14]. Microarray data analysis was performed usingFlexArray (version 1.6 - http://genomequebec.mcgill.ca/
FlexArray). All the steps of the analysis were done accord-ing to Robert et al.. [14]. The limma algorithm in Flex-Array, based on the limma package in bioconductor [25]was used for the direct comparison of two COC samplesand technical replicates of pooled embryos from 2-cell, 4-cell and 8-cell stages after dye-swaps. The threshold forpositive spot selection for the COC and embryo micro-array data was calculated as the mean value of all the darkcorner spots plus twice the standard deviation [26].
Bioinformatics tools and analysisA sequence assembly program “SeqMan NGen” withinLaserGene 9.0 package (DNASTAR, Madison, WI, USA)was used to compare the EMPV1 probe sequences withporcine RefSeq RNA sequences downloaded from NCBI(Index of ftp://ftp.ncbi.nih.gov/genomes/Sus_scrofa/RNA/).The porcine RefSeq sequences was newly annotated inApril 2011 (26,189 RNA sequences) and was basedon the mixed BAC and WGS-based assembly of the por-cine genome (Sscrofa10) released by the Swine GenomeSequencing Consortium. It includes assemblies for chromo-somes 1–18, X and Y located at NCBI. The default SeqManNGen program parameters were used with some minorchanges (Additional file 3). Additional porcine transcriptswithout GS were annotated using the public Basic LocalAlignment Search Tool [BLASTW] from NCBI search withthe human RefSeq RNA (46821 sequences). The resultingunique GS lists from the EMPV1 array and Affymetrixporcine genome array [http://www.affymetrix.com/estore/index.jsp] were initially uploaded into PANTHER (http://www.pantherdb.org/genes/batchIdSearch.jsp) to identifyPANTHER-classified genes, transcripts, and proteinsrelated to the gene ontology (GO). Then the GO termswere uploaded into the PANTHER expression analysistool [27] to identify biological processes that differedfrom the reference list. The Homo sapiens genome(human) was used as a reference gene list, which allowedfor the identification of developmental-related processesfrom the GO terms that were statistically over- andunder-expressed using a binomial test.
Results and discussionConstruction of two normalized cDNA libraries andquality control of 454 sequencingThe primary goal of this research was to develop amicroarray platform to study the early developmentof porcine embryos before implantation. Porcine micro-arrays have been widely used in functional genomicsresearch; however they have not been designed speci-fically for the detection of the gene expression duringearly embryonic development. Generally, these probesequences have not been generated from preimplan-tation embryonic tissues and there has been limitedextensive deep sequencing projects related to porcine
Tsoi et al. BMC Genomics 2012, 13:370 Page 4 of 15http://www.biomedcentral.com/1471-2164/13/370

preimplantation embryonic development. From previousporcine EST studies using non-normalized cDNA fromearly embryos [18,19], only highly-expressed genes werefound. Using the Sanger sequencing method, the totalnumber of unique transcripts from these studies was low(less than 3,000 genes) and they were not able to repre-sent the expression levels of the original samples. Inorder to facilitate characterization of the porcine embry-onic transcriptome, cDNA normalization using duplex-specific nuclease (DSN) and 454 deep sequencing wereconducted to account for low abundance of mRNA tran-scripts in developing embryos produced using bothin vitro and in vivo procedures. Although the DSNmethod has been previously used to normalize cDNAlibraries from a number of animal and plant models [28],this is the first time it has been successfully applied tocDNA library construction generated from pig embryoRNA and followed by 454 sequencing.
A pilot 454 sequencing test was conducted using a 1/8plate to analyse the profile of the overall size and lengthdistribution of the transcripts. The sequencing result did
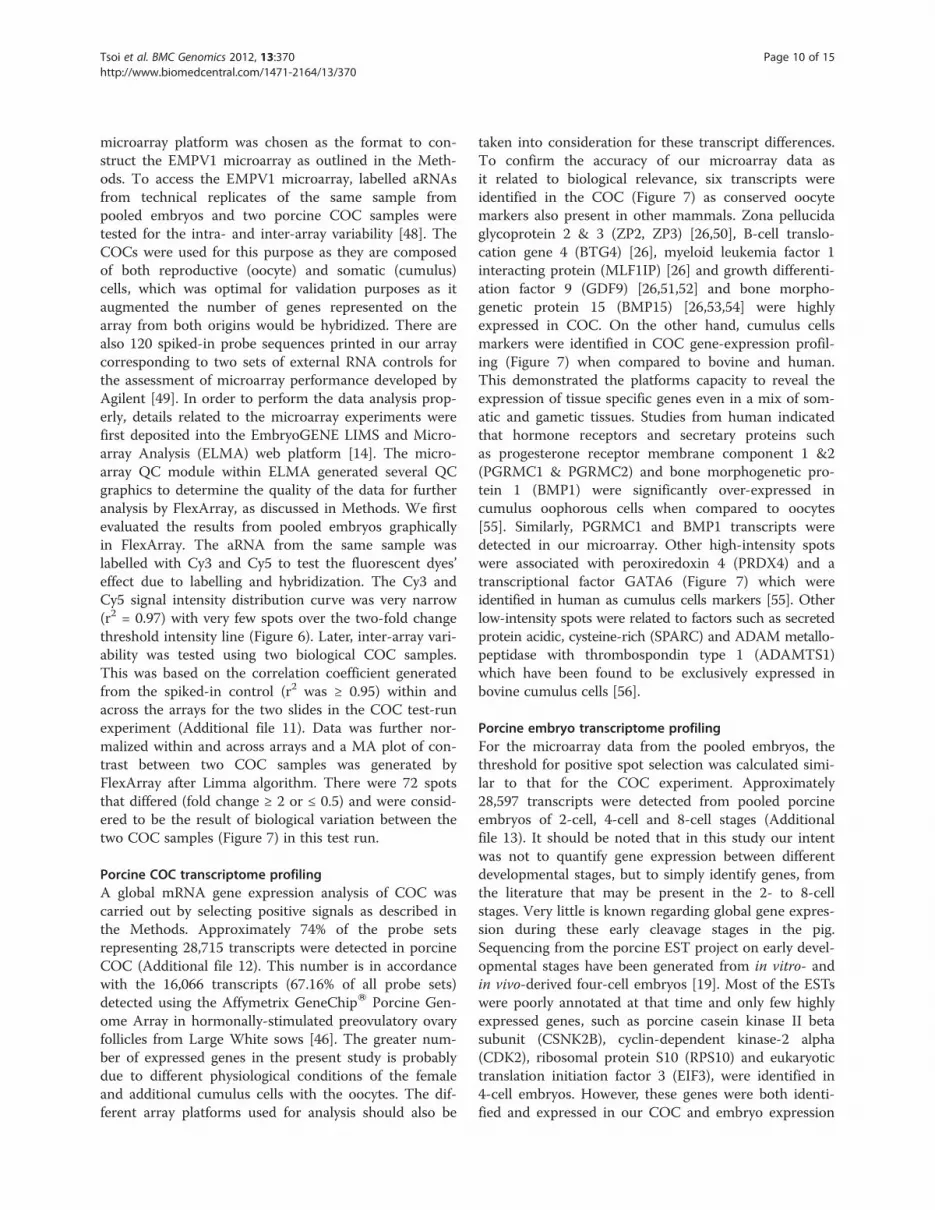
not reach the optimal yield because the number of readsfor long sequences (300–400 bp) was less than for theshort sequences (<100 bp) in cDNAs from both in vivo(IVV) and in vitro (IVT) sources (Figure 1A). Longhomopolymeric (A:T) regions in cDNA may haveresulted in sequencing reads of low quality for the 454sequencing. To address this, methods have been devel-oped using modified primers during the first strandof cDNA synthesis [29], however these methods arenot suitable for application after library synthesis. There-fore, we adopted an old nested deletion method of clon-ing [30] to improve the sequencing yield. Time-seriestesting was first performed and demonstrated that after2 minutes, there was visible fragment size changesdetected by gel electrophoresis (Figure 2). Using this ap-proach we were able to dramatically improve the 454 se-quencing quality compared to the previous results(Figure 1A). The number of sequencing reads withlonger lengths (350–450 bp) was increased in the BAL-treated IVV and IVT libraries from four to six foldrespectively (Figure 1B). In general, the total initial run
Nu
mb
er o
f lib
rary
rea
ds
A
Sequence read Length
Sequence read Length
Nu
mb
er o
f lib
rary
rea
ds
B
Figure 1 Distribution of sequence length and number of reads from 454 sequencing of two cDNA libraries before (A) and after (B) BAL31 nuclease digestion. The vertical and horizontal red line indicates the read length at 400 bp and the number of reads at 200 respectively.
Tsoi et al. BMC Genomics 2012, 13:370 Page 5 of 15http://www.biomedcentral.com/1471-2164/13/370
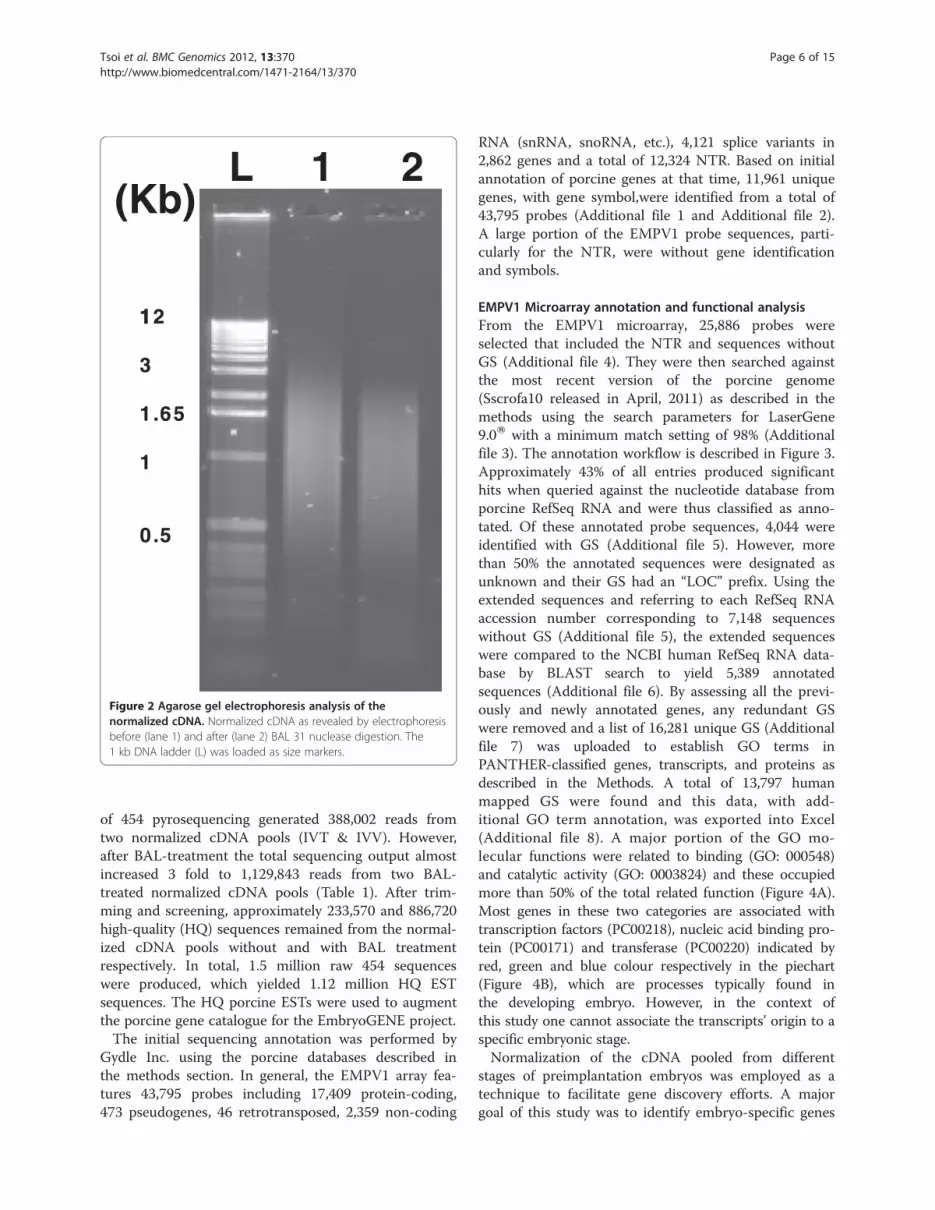
of 454 pyrosequencing generated 388,002 reads fromtwo normalized cDNA pools (IVT & IVV). However,after BAL-treatment the total sequencing output almostincreased 3 fold to 1,129,843 reads from two BAL-treated normalized cDNA pools (Table 1). After trim-ming and screening, approximately 233,570 and 886,720high-quality (HQ) sequences remained from the normal-ized cDNA pools without and with BAL treatmentrespectively. In total, 1.5 million raw 454 sequenceswere produced, which yielded 1.12 million HQ ESTsequences. The HQ porcine ESTs were used to augmentthe porcine gene catalogue for the EmbryoGENE project.
The initial sequencing annotation was performed byGydle Inc. using the porcine databases described inthe methods section. In general, the EMPV1 array fea-tures 43,795 probes including 17,409 protein-coding,473 pseudogenes, 46 retrotransposed, 2,359 non-coding
RNA (snRNA, snoRNA, etc.), 4,121 splice variants in2,862 genes and a total of 12,324 NTR. Based on initialannotation of porcine genes at that time, 11,961 uniquegenes, with gene symbol,were identified from a total of43,795 probes (Additional file 1 and Additional file 2).A large portion of the EMPV1 probe sequences, parti-cularly for the NTR, were without gene identificationand symbols.
EMPV1 Microarray annotation and functional analysisFrom the EMPV1 microarray, 25,886 probes wereselected that included the NTR and sequences withoutGS (Additional file 4). They were then searched againstthe most recent version of the porcine genome(Sscrofa10 released in April, 2011) as described in themethods using the search parameters for LaserGene9.0W with a minimum match setting of 98% (Additionalfile 3). The annotation workflow is described in Figure 3.Approximately 43% of all entries produced significanthits when queried against the nucleotide database fromporcine RefSeq RNA and were thus classified as anno-tated. Of these annotated probe sequences, 4,044 wereidentified with GS (Additional file 5). However, morethan 50% the annotated sequences were designated asunknown and their GS had an “LOC” prefix. Using theextended sequences and referring to each RefSeq RNAaccession number corresponding to 7,148 sequenceswithout GS (Additional file 5), the extended sequenceswere compared to the NCBI human RefSeq RNA data-base by BLAST search to yield 5,389 annotatedsequences (Additional file 6). By assessing all the previ-ously and newly annotated genes, any redundant GSwere removed and a list of 16,281 unique GS (Additionalfile 7) was uploaded to establish GO terms inPANTHER-classified genes, transcripts, and proteins asdescribed in the Methods. A total of 13,797 humanmapped GS were found and this data, with add-itional GO term annotation, was exported into Excel(Additional file 8). A major portion of the GO mo-lecular functions were related to binding (GO: 000548)and catalytic activity (GO: 0003824) and these occupiedmore than 50% of the total related function (Figure 4A).Most genes in these two categories are associated withtranscription factors (PC00218), nucleic acid binding pro-tein (PC00171) and transferase (PC00220) indicated byred, green and blue colour respectively in the piechart(Figure 4B), which are processes typically found inthe developing embryo. However, in the context ofthis study one cannot associate the transcripts’ origin to aspecific embryonic stage.
Normalization of the cDNA pooled from differentstages of preimplantation embryos was employed as atechnique to facilitate gene discovery efforts. A majorgoal of this study was to identify embryo-specific genes
L 1 2
112
3
1.65
1
0.5
(Kb)
Figure 2 Agarose gel electrophoresis analysis of thenormalized cDNA. Normalized cDNA as revealed by electrophoresisbefore (lane 1) and after (lane 2) BAL 31 nuclease digestion. The1 kb DNA ladder (L) was loaded as size markers.
Tsoi et al. BMC Genomics 2012, 13:370 Page 6 of 15http://www.biomedcentral.com/1471-2164/13/370

through deep sequencing after the original enrichmentprocess of rare genes from the normalized cDNA librar-ies. In order to prove that the selected EMPV1 probe setwas enhanced with genes related to developmental pro-cesses, we selected a commercially available Affymetrixporcine array for comparison using PANTHER as
described in the Methods. The Affymetrix GeneChipW
Porcine Genome Array is widely used in pig functionalgenomics research [31] and the probe set is frequentlyannotated through the human database to obtain add-itional GS [32,33]. To assess the level of incorporation ofembryo-specific genes on the EMPV1 platform, it wascompared to this popular array. After removing thecommon GSs from both arrays, the probe IDs withunique GS from the Affymetrix array and EMPV1were determined to be 5,221 and 9,425, respectively(Additional file 9). Using a gene expression tool fromPANTHER [27], GSs were mapped to the PANTHERontology and compared to a reference list. In this case,each unique list was compared to the reference list(Human) using the binomial test [34] for biological pro-cesses in PANTHER.
Within the distribution of GO in Human, 130 categor-ies of biological processes were covered (not includingthe unclassified processes), the statistical significance ofthe gene count in the EMPV1 versus Affymetrix arraysover different categories was calculated and identified.PANTHER predicated that 37 (highlighted with yellowin Additional file 10) and 23 (highlighted with greenin Additional file 10) of these were statistically signifi-cant (p value < 0.05) in EMPV1 and Affymetrix arraysrespectively. None of the Affymetrix porcine arraycategories were related to development. However, appro-ximately 1/3 of the 37 EMPV1 categories were signifi-cantly involved in development as indicated in Figure 5.This indicates an increased efficiency in gene dis-covery and an enhanced detection of genes related toearly preimplantation embryonic development using thenormalization method for cDNA construction and 454deep sequencing.
25,886 uncharacterized probe sequences
SeqMan NGen search against pigRefSeq RNA (26,189 sequences)
Obtained 11,196 annotated probe sequences
7,150 of them without Gene Symbol
MegaBlast search against humanRefSeq RNA (46,821 sequences)
Improved annotation of 5,389 probe sequences with human Gene Symbol
Combined data into Excel filefor sorting and selecting probeSequences with Gene Symbol
Obtained 9,435 annotated probe sequences with Gene Symbol
Figure 3 EMPV1 array probe sequences annotation work flow.
Table 1 Summary of 454 sequencing data before and after trimming between two normalized cDNA treated with andwithout BAL
Batch ID # of Raw sequences # of high quality sequences Library ID Description
PVT0101 49,385 14,186 PVT01 In vitro 454 library (2009)
PVT0102 45,491 20,316 PVT01 IN vitro 454 library (2009)
PVT201 113,399 86,481 PVT02 IN vitro 454 library (2010)
PVV0101 57,208 25,611 PVV01 In vitro 454 library (2009)
PVT0102 25,732 13,428 PVV01 In vitro 454 library (2009)
PVT0201 96,787 73,548 PVV02 In vitro 454 library (2010)
Sub Total 388,002 233,570
PVT0301 103,807 84,146 PVT03 IN vitro BAL-treated 454 library (2010)
PVT0302 253,539 215,845 PVT03 In vitro BAL-treated 454 library (2010)
PVT0303 241,363 205,195 PVT03 In vitro BAL-treated 454 library (2010)
PVV0301 93,020 73,307 PVV03 In vitro BAL-treated 454 library (2010)
PVV0302 438,114 308,218 PVV03 In vitro BAL-treated 454 library (2010)
Sub Total 1,129,843 886,720
Library ID with 01–02 and 03 represent cDNAs without and with BAL treatment respectively.
Tsoi et al. BMC Genomics 2012, 13:370 Page 7 of 15http://www.biomedcentral.com/1471-2164/13/370

Furthermore, PANTHER pathway analysis of GOterms related to several biological processes of interestsuch as developmental processes, system development,embryonic development, pattern specification processes,ectoderm and mesoderm development, revealed six majormolecular pathways (Figure 5). These include Wnt sig-nalling pathway, TGF-beta signalling pathway, cadherinsignalling pathway, interleukin signalling pathway, PI3kinase pathway and insulin/IGF pathway- protein kinase
B signalling cascade (Table 2). The important role ofthese six pathways and other extrinsic regulators hasbeen reviewed in mouse and human preimplantationembryonic development (PED) and stem cell relatedstudies [35,36]. The manner in which these pathwaysinfluence self-renewal, pluripotency and differentiation ofPED and embryonic stem cells is under active investiga-tion [37,38], but is not well understood in pigs. However,coupling of these pathways with their distinct expression
PANTHER Protein ClassTotal # Genes: 47994 Total # of protein class hits: 35518
GO Molecular FunctionTotal # Genes: 47994 Total # of protein class hits: 54636
(A)
(B)
Figure 4 PANTHER gene ontology of EMPV1 array probes with unique GS. Distribution of genes associated with (A) GO molecular functionand (B) PATHER protein class.
Tsoi et al. BMC Genomics 2012, 13:370 Page 8 of 15http://www.biomedcentral.com/1471-2164/13/370

patterns, the relative concentrations of pluripotency-related molecules, and timing of embryo development,along with supportive micro-environmental conditions,will need to be the subject of on-going research to deter-mine if and how these and other transcripts are relatedto porcine embryonic development [39,40].
Again, the unique GS list used for this additional path-way analysis confirms the effectiveness of the gene discov-ery techniques in this study, As well, the representationof the newly identified embryo-specific genes on ourEMPV1 microarray is expected to facilitate cost effectiveand fruitful functional genomics research related to earlyporcine embryo development in the future.
Microarray quality assessmentWith the current incompleteness of the porcine genomemap and the limited ESTs resources, RNA-sequencing
is not a cost effective tool to study the effect of in vivoand in vitro factors on the porcine embryonic model.However, using our normalized cDNA libraries for deepsequencing, we have enriched the porcine transcriptsfrom different early developmental stages to constructthe EMPV1 microarray platform. After 2005, high back-ground cDNA microarrays were generally replaced byoligo-based microarrays generated by companies such asAffymetrix and Agilent. Expression analysis studies ofArabidopsis indicated that the two microarray technolo-gies (Affymetrix and Agilent) are consistent when com-pared with each other [41]. Recently, the most popularcommercially available porcine oligo arrays from Agilentand Affymetrix have been widely used to study geneexpression related to meat quality [42], nutrition [43],disease infection [44], female reproduction [45,46] andperi-implantation embryos [47]. The Agilent two-color
Figure 5 Gene count different distributed among different categories from biological process in EMPV1 array probes with unique GS.Red bar indicated statistical significant gene count related to development.
Table 2 PANTHER pathway analysis of developmental processes
Category name (Accession) # genes Percent of gene hitagainst total # genes
Percent of gene hit againsttotal # Pathway hits
Wnt signaling pathway (P00057) 109 5.20% 8.60%
TGF-beta signaling pathway (P00052) 80 3.80% 6.30%
Interleukin signaling pathway (00012) 71 3.40% 5.60%
Insulin/IGF pathway-protein kinase B signaling cascade (P00033) 56 2.70% 4.40%
Pl3 kinase pathway (P00048) 56 2.70% 4.40%
Tsoi et al. BMC Genomics 2012, 13:370 Page 9 of 15http://www.biomedcentral.com/1471-2164/13/370
microarray platform was chosen as the format to con-struct the EMPV1 microarray as outlined in the Meth-ods. To access the EMPV1 microarray, labelled aRNAsfrom technical replicates of the same sample frompooled embryos and two porcine COC samples weretested for the intra- and inter-array variability [48]. TheCOCs were used for this purpose as they are composedof both reproductive (oocyte) and somatic (cumulus)cells, which was optimal for validation purposes as itaugmented the number of genes represented on thearray from both origins would be hybridized. There arealso 120 spiked-in probe sequences printed in our arraycorresponding to two sets of external RNA controls forthe assessment of microarray performance developed byAgilent [49]. In order to perform the data analysis prop-erly, details related to the microarray experiments werefirst deposited into the EmbryoGENE LIMS and Micro-array Analysis (ELMA) web platform [14]. The micro-array QC module within ELMA generated several QCgraphics to determine the quality of the data for furtheranalysis by FlexArray, as discussed in Methods. We firstevaluated the results from pooled embryos graphicallyin FlexArray. The aRNA from the same sample waslabelled with Cy3 and Cy5 to test the fluorescent dyes’effect due to labelling and hybridization. The Cy3 andCy5 signal intensity distribution curve was very narrow(r2 = 0.97) with very few spots over the two-fold changethreshold intensity line (Figure 6). Later, inter-array vari-ability was tested using two biological COC samples.This was based on the correlation coefficient generatedfrom the spiked-in control (r2 was ≥ 0.95) within andacross the arrays for the two slides in the COC test-runexperiment (Additional file 11). Data was further nor-malized within and across arrays and a MA plot of con-trast between two COC samples was generated byFlexArray after Limma algorithm. There were 72 spotsthat differed (fold change ≥ 2 or ≤ 0.5) and were consid-ered to be the result of biological variation between thetwo COC samples (Figure 7) in this test run.
Porcine COC transcriptome profilingA global mRNA gene expression analysis of COC wascarried out by selecting positive signals as described inthe Methods. Approximately 74% of the probe setsrepresenting 28,715 transcripts were detected in porcineCOC (Additional file 12). This number is in accordancewith the 16,066 transcripts (67.16% of all probe sets)detected using the Affymetrix GeneChipW Porcine Gen-ome Array in hormonally-stimulated preovulatory ovaryfollicles from Large White sows [46]. The greater num-ber of expressed genes in the present study is probablydue to different physiological conditions of the femaleand additional cumulus cells with the oocytes. The dif-ferent array platforms used for analysis should also be
taken into consideration for these transcript differences.To confirm the accuracy of our microarray data asit related to biological relevance, six transcripts wereidentified in the COC (Figure 7) as conserved oocytemarkers also present in other mammals. Zona pellucidaglycoprotein 2 & 3 (ZP2, ZP3) [26,50], B-cell translo-cation gene 4 (BTG4) [26], myeloid leukemia factor 1interacting protein (MLF1IP) [26] and growth differenti-ation factor 9 (GDF9) [26,51,52] and bone morpho-genetic protein 15 (BMP15) [26,53,54] were highlyexpressed in COC. On the other hand, cumulus cellsmarkers were identified in COC gene-expression profil-ing (Figure 7) when compared to bovine and human.This demonstrated the platforms capacity to reveal theexpression of tissue specific genes even in a mix of som-atic and gametic tissues. Studies from human indicatedthat hormone receptors and secretary proteins suchas progesterone receptor membrane component 1 &2(PGRMC1 & PGRMC2) and bone morphogenetic pro-tein 1 (BMP1) were significantly over-expressed incumulus oophorous cells when compared to oocytes[55]. Similarly, PGRMC1 and BMP1 transcripts weredetected in our microarray. Other high-intensity spotswere associated with peroxiredoxin 4 (PRDX4) and atranscriptional factor GATA6 (Figure 7) which wereidentified in human as cumulus cells markers [55]. Otherlow-intensity spots were related to factors such as secretedprotein acidic, cysteine-rich (SPARC) and ADAM metallo-peptidase with thrombospondin type 1 (ADAMTS1)which have been found to be exclusively expressed inbovine cumulus cells [56].
Porcine embryo transcriptome profilingFor the microarray data from the pooled embryos, thethreshold for positive spot selection was calculated simi-lar to that for the COC experiment. Approximately28,597 transcripts were detected from pooled porcineembryos of 2-cell, 4-cell and 8-cell stages (Additionalfile 13). It should be noted that in this study our intentwas not to quantify gene expression between differentdevelopmental stages, but to simply identify genes, fromthe literature that may be present in the 2- to 8-cellstages. Very little is known regarding global gene expres-sion during these early cleavage stages in the pig.Sequencing from the porcine EST project on early devel-opmental stages have been generated from in vitro- andin vivo-derived four-cell embryos [19]. Most of the ESTswere poorly annotated at that time and only few highlyexpressed genes, such as porcine casein kinase II betasubunit (CSNK2B), cyclin-dependent kinase-2 alpha(CDK2), ribosomal protein S10 (RPS10) and eukaryotictranslation initiation factor 3 (EIF3), were identified in4-cell embryos. However, these genes were both identi-fied and expressed in our COC and embryo expression
Tsoi et al. BMC Genomics 2012, 13:370 Page 10 of 15http://www.biomedcentral.com/1471-2164/13/370

data (Additional file 12 and Additional file 13). Later, thesame group using a cDNA microarray to demonstratethe mRNA expression patterns from 4-cell embryos,detected 1409 differentially expressed transcripts (with-out the Benjamini and Hochberg false-discovery-rate
multiple correction test) between the in vitro- andin vivo-produced embryos at the 4-cell stages [57]. How-ever, only four genes (DSTN, PAIP1, UBE4B, NASP)were selected and confirmed by real-time PCR. Thisgroup also established that the gene expression levels
Figure 6 A scatter plot of Cy3 and Cy5 normalized signal intensity. X and Y axis show the signal intensity after the same aRNA from pooledembryos were labelled with Cy3 and Cy5 respectively. FC = fold change.
Expression (limma(simple))
A-values (global)
M-v
alu
es (c
on
tras
t)
Red spots: 28,715Black spots: 10,278
Figure 7 MA plot for COC gene expression data. Six blue arrows pointed downward represented oocyte specific markers and six black arrowspointed upward represented cumulus cells markers. 28,715 red spots represented positive signals above background signals (10,278 black spots).
Tsoi et al. BMC Genomics 2012, 13:370 Page 11 of 15http://www.biomedcentral.com/1471-2164/13/370

from in vitro-produced embryos were very high for DSTN& PAIP1 and very low for UBE4B and NASP when com-pared to in vivo-produced 2-cell embryos. Our microarrayprofiling data for the embryos (Additional file 13) alsoidentified three of these genes (DSTN, PAIP1, UBE4B),while the spot intensity for NASP was below the detect-able threshold. Since the microarray data was obtainedfrom a pool of three different developmental stages, fur-ther data analysis may be needed to identify if DSTN,PAIP1 and UBE4B are expressed only at the 4-cell stage.
GO analysis for biological processes in porcine COC& embryosTo highlight differences in the biological processesbetween the COC and embryos, we removed the similarGS from the 28,715 COC related transcripts (Additionalfile 12) and 28,597 embryo related transcripts (Add-itional file 13). Genes expressed only in the COC orembryos were obtained after removing redundanciesfrom both data sets. There were 793 unique GS in theCOC and 4,388 in the embryos, while 7,822 appeared in
both (Additional file 14). The unique GS from COC andembryos were mapped to the PANTHER ontology andcompared to the human genome as a reference gene list.Using a similar binomial test in PANTHER as describedpreviously, the analysis indicated that only one pathwayrelated to apoptosis was found to be statistical significant(Additional file 15) in COC, but not in embryos. Studieshave shown that apoptosis is important during in vitroculture condition in bovine [58,59] and porcine [60].However, the gene count revealed additional uniquepathways which were statistically significant in the por-cine embryos. The three pathways with the highest genecounts were primarily related to biological pathwayssuch as inflammation signalling pathway (mediated bychemokine and cytokine), interleukin signalling pathwayand TGF-beta signalling (Figure 8). Of particular interestwere the interleukin-signalling pathway and TGF-betasignalling, since they may play an important role dur-ing porcine preimplantation embryonic developmentas we have discussed in the previous section. Theinflammation signalling pathway likely plays a role in the
% o
f gen
e in
the
list
Figure 8 PANTHER bar chart of gene count involved in biological pathways from early embryos. The % of gene list (Y axis) in thecategory is calculated for each testing list as: # genes for the category/ # total genes in the list * 100.
Tsoi et al. BMC Genomics 2012, 13:370 Page 12 of 15http://www.biomedcentral.com/1471-2164/13/370

establishment of pregnancy, including cellular prolifera-tion, attachment and development of the conceptus [61].
Expression of porcine OR genes in COC and earlydeveloping embryosOlfactory receptors (ORs) constitute the largest gene-family in the vertebrate genome [25,62]. InterestinglyOR genes are not only expressed in olfactory sensoryneurons [63], they are also expressed in various tissuesincluding testicular cells and the placenta [64-67]. In thepresent study, we discovered 312 genes with OR uniqueGS (Additional file 7). Comparing the microarrayexpression data for the COCs and embryos (2-4-8 cellsstages) revealed 491 array spots with an intensity higherthan background that were related to OR transcripts(Additional file 16). The majority of the OR genes (428transcripts) were only found in embryos and, in particu-lar, one gene (OR4C16) whose spot intensity was 1.5 foldhigher than the background. In addition to the embryospecific OR expression, there were 59 OR related tran-scripts found in both COC and embryos. The physio-logical significance of OR expression during earlyembryonic development has not been investigated and isquite novel. In a recent study, most of the known ORgenes expressed in murine placenta were influenced bydiet and fetal sex [67]. Based on this, one could inferthat OR gene expression in the early embryo may berelated to trophectoderm development that allows forproper placental OR protein expression in response tomolecules from different dietary compounds. Regardless,this discovery is of significant interest and will be inves-tigated further along with numerous other factors.
ConclusionsUsing the 454 deep sequencing of normalized cDNA li-braries from in vitro and in vivo produced porcineembryos we have generated 1.12 million high qualityEST sequences that provided the basis for the develop-ment of the EMPV1 microarray platform featuring43,795 probes. The quality of this embryo-specific arraywas confirmed with a high level of reproducibility that isprovided by the current Agilent microarray technology.Despite the current limitations for full NTR annotation,due to the incomplete porcine genome sequencing pro-ject, a significant number of NTRs were annotated usingthe most recent version of porcine genome and humanRefSeq RNA database to enrich the orthologous geneswith unique GSs for GO searchs. GO terms confirmedthat many are related to relevant developmental pro-cesses. The on-going effort to complete the porcinegenome sequencing project will in turn provide thenecessary information needed to address the remainingunannotated NTRs on this microarray With more than20 thousand unique genes represented on the EMPV1
microarray, this platform will provide the foundation forfuture research into the in vivo and in vitro factors thataffect the viability of the porcine embryos, as well as theeffects of these factors on the live offspring that resultfrom these embryos.
Additional files
Additional file 1: EMPV1 initial annotation. Excel file containing theresults of the probe sequences annotation with unique gene symbol.
Additional file 2: EMPV1 annotation description. A PDF filecontaining a detailed explanation of the terms used in additional file 1.
Additional file 3: Assembly parameter for gene annotation usingSeqMan NGen. Text file containing the details of the parameter set up.
Additional file 4: Probe sequences without GS selected fromEMPV1. PDF file containing the probe ID and sequences forre-annotation.
Additional file 5: Re-annotation of the probe sequences withoutGS. Excel file containing the results of porcine gene annotation withprobe ID, accession number, gene description, gene symbol (sheet 1)and LOC (sheet 2).
Additional file 6: BLAST search result from NCBI using porcinesequences. Excel file containing porcine sequences with no GS to blastsearch with human RefSeq RNA database from NCBI.
Additional file 7: All GS list from EMPV1. Excel file containing a list ofunique GS from EMPV1 after re-annotation of all the unknown probesequences. Yellow indicates olfactory receptor genes.
Additional file 8: EMPV1 PANTHER GO analysis. Excel file containinggenes with PANTHER Family/Subfamily, GO Molecular Function, GOBiological Process, GO Cellular Component and PANTHER Protein Classthat are present on EMPV1 microarray.
Additional file 9: GS list from Affymetrix and EMPV1 microarray.Excel file containing column of gene symbols only found in Affymetrixand EMPV1 microarray after removing all the common GS.
Additional file 10: PANTHER GO biological process difference inAffymetrix and EMPV1 porcine microarray. Excel file containingstatistical significance of the gene count differences between unique GSfrom EMPV1 array and Affymetrix porcine array over different categoriesof biological processes using PANTHER expression tool. Yellow indicatesgenes over-representated in EMPV1 (p-value <0.05) and Green indicatesgenes over-representated in Affymetrix (p-value <0.05).
Additional file 11: Array-array intensity correlation associated withlabelled spike-in RNA mixed with labelled COC aRNA. PDF filecontaining the correlation index from two biological COC samples. A:COC1 labelled with Cy3 and COC1 labelled with Cy5; B: COC2 labelledwith Cy3 and COC2 labelled with Cy5; C: COC1 labelled with Cy3 andCOC2 labelled with Cy5; D: COC2 labelled with Cy3 and COC1 labelledwith Cy5.
Additional file 12: Positive spot selection in COC microarray. Excelfile containing all positive signals higher than the background intensitysignal > 6.69 calculated according to Methods.
Additional file 13: Positive spots selection in embryos microarray.Excel file containing all positive signals higher than the backgroundintensity signal > 6.96 calculated according to Methods.
Additional file 14: Unique GS list from COC and embryos arraydata. Excel file containing unique GS from microarray data with genesonly found in COC, embryos and both.
Additional file 15: COC pathways. Excel file containing the result ofpathway analysis from PANTHER. Yellow indicates the p-value issignificant.)
Additional file 16: OR genes expression in COC and embryos. PDFfile containing the spot intensity values extracted from microarray data inCOC and embryos related to olfactory receptor gene symbols.
Tsoi et al. BMC Genomics 2012, 13:370 Page 13 of 15http://www.biomedcentral.com/1471-2164/13/370

AbbreviationsaRNA: Antisense ribonucleic acid; BAC: Bacterial Artificial Chromosome;BLAST: Basic Local Alignment Search Tool; cDNA: ComplementaryDeoxyribonucleic Acid; COC: Cumulus-Oocyte Complexes; DSN:Duplex-Specific Nuclease; DSTN: Destrin; EGA: Embryonic genome activation;EGTA: Ethylene Glycol Tetraacetic Acid; EmbryoGENE: LIMS and MicroarrayAnalysis; EMPV1: EMbryogene Porcine Version 1; EST: Expressed SequenceTag; GEO: Gene Expression Omnibus; GO: Gene Ontology; GPR file: GenePixResults file; GS: Gene Symbols; GV: Germinal Vesicle; iPSC: InducedPluripotent Stem Cell; IVT: In vitro; IVV: In vivo; LIMS: Laboratory InformationManagement System; MII Stage: Metaphase II stage; NGS: Next generationdeep sequencing; NTR: Novel Transcript Regions; OR: Olfactory Receptor;PANTHER: Protein ANalysis THrough Evolutionary Relationships;PCR: Polymerase Chain Reaction; PED: Preimplantation EmbryonicDevelopment; RIN: RNA Integrity Number; RNA: Nuclear Ribonucleic Acid;RT: Reverse Transcription; SFF: Standard Flowgram Format; snoRNA: Smallnucleolar ribonucleic acid; snRNA: Small nuclear ribonucleic acid; SRA:Short-Read Archive; UTR: Untranslated Region; WGS: Whole GenomeSequencing.
Competing interestsThe authors declare they have no competing interests.
Authors’ contributionsST drafted the manuscript. ST constructed normalized cDNA libraries. STperformed bioinformatic analysis of probe sequences re-annotation, COCmicroarray QC test run, the statistical analysis of the digital expression dataand PANTHER GO functional analysis. CZ did the microarray experiment andanalysis with pooled embryos. JRG managed microarray data in ELMA. JDgenerated the in vitro porcine embryos and JAP generated the in vivoembryos. PR performed 454 sequences assembly with initial annotation andoligo probes design. CR, JN, MKD and GRF designed and coordinated thestudy. All authors read and approved the final manuscript.
AcknowledgementsThe authors would like to thank Jennifer Patterson and RosemaryO’Donoghue for their help with the animal work, the COC collection as wellas samples collection from different preimplantation stages. This researchwas supported by the Natural Science and Engineering Research Council ofCanada (NSERC) to GRF, MAS, CR and MKD.
Author details1Department of Agricultural, Food and Nutritional Science, University ofAlberta, Edmonton, AB T6G 2P5, Canada. 2International Center ofBiotechnology, Minitube of America, Mt. Horeb, Wisconsin, USA. 3Gydle Inc,1363, avenue Maguire Suite 301, Québec, QC G1T 1Z2, Canada. 4Laboratoryof Functional Genomics of Early Embryonic Development, Université Laval,Quebec, QC G1T 1Z2, Canada.
Received: 6 January 2012 Accepted: 18 July 2012Published: 3 August 2012
References1. Dang-Nguyen TQ, Tich NK, Nguyen BX, Ozawa M, Kikuchi K, Manabe N,
Ratky J, Kanai Y, Nagai T: Introduction of various vietnamese indigenouspig breeds and their conservation by using assisted reproductivetechniques. J Reprod Dev 2010, 56(1):31–35.
2. Giraud S, Favreau F, Chatauret N, Thuillier R, Maiga S, Hauet T: Contributionof large pig for renal ischemia-reperfusion and transplantation studies:the preclinical model. J Biomed Biotechnol 2011, 2011:532127.
3. Zaragoza C, Gomez-Guerrero C, Martin-Ventura JL, Blanco-Colio L, Lavin B,Mallavia B, Tarin C, Mas S, Ortiz A, Egido J: Animal models ofcardiovascular diseases. J Biomed Biotechnol 2011, 2011:497841.
4. Vilahur G, Padro T, Badimon L: Atherosclerosis and thrombosis: insightsfrom large animal models. J Biomed Biotechnol 2011, 2011:907575.
5. Rogers CS, Stoltz DA, Meyerholz DK, Ostedgaard LS, Rokhlina T, Taft PJ,Rogan MP, Pezzulo AA, Karp PH, Itani OA, et al: Disruption of the CFTRgene produces a model of cystic fibrosis in newborn pigs. Science 2008,321(5897):1837–1841. New York, NY.
6. Esteban MA, Xu J, Yang J, Peng M, Qin D, Li W, Jiang Z, Chen J, Deng K,Zhong M, et al: Generation of induced pluripotent stem cell lines fromTibetan miniature pig. J Biol Chem 2009, 284(26):17634–17640.
7. Roberts RM, Telugu BP, Ezashi T: Induced pluripotent stem cells fromswine (Sus scrofa): why they may prove to be important. Cell Cycle 2009,8(19):3078–3081. Georgetown, Tex.
8. West FD, Terlouw SL, Kwon DJ, Mumaw JL, Dhara SK, Hasneen K, DobrinskyJR, Stice SL: Porcine induced pluripotent stem cells produce chimericoffspring. Stem Cells Dev 2010, 19(8):1211–1220.
9. Crosier AE, Farin PW, Dykstra MJ, Alexander JE, Farin CE: Ultrastructuralmorphometry of bovine blastocysts produced in vivo or in vitro. BiolReprod 2001, 64(5):1375–1385.
10. Fujino Y, Nakamura Y, Kobayashi H, Kikuchi K: Relationship between timeelapsed after human chorionic gonadotropin administration anddevelopmental stage in porcine embryos collected from prepubertalgilts. J Reprod Dev 2006, 52(2):267–275.
11. Hazeleger W, Bouwman EG, Noordhuizen JP, Kemp B: Effect ofsuperovulation induction on embryonic development on day 5 andsubsequent development and survival after nonsurgical embryotransfer in pigs. Theriogenology 2000, 53(5):1063–1070.
12. Niemann H, Carnwath JW, Kues W: Application of DNA array technologyto mammalian embryos. Theriogenology 2007, 68(Suppl 1):S165–S177.
13. Vallee M, Dufort I, Desrosiers S, Labbe A, Gravel C, Gilbert I, Robert C,Sirard MA: Revealing the bovine embryo transcript profiles during earlyin vivo embryonic development. Reproduction (Cambridge, England) 2009,138(1):95–105.
14. Robert C, Nieminen J, Dufort I, Gagné D, Grant JR, Cagnone G, Plourde D,Nivet AL, Fournier E, Paquet E, et al: Combining resources to obtaina comprehensive survey of the bovine embryo transcriptomethrough deep sequencing and microarrays. Mol Reprod Dev 2011,78:651–664.
15. Blomberg LA, Long EL, Sonstegard TS, Van Tassell CP, Dobrinsky JR,Zuelke KA: Serial analysis of gene expression during elongation of theperi-implantation porcine trophectoderm (conceptus). Physiol Genomics2005, 20(2):188–194.
16. Blomberg LA, Schreier LL, Talbot NC: Expression analysis of pluripotencyfactors in the undifferentiated porcine inner cell mass and epiblastduring in vitro culture. Mol Reprod Dev 2008, 75(3):450–463.
17. Blomberg LA, Zuelke KA: Serial analysis of gene expression (SAGE)during porcine embryo development. Reprod Fertil Dev 2004,16(1–2):87–92.
18. Smith TP, Fahrenkrug SC, Rohrer GA, Simmen FA, Rexroad CE, Keele JW:Mapping of expressed sequence tags from a porcine early embryoniccDNA library. Anim Genet 2001, 32(2):66–72.
19. Whitworth K, Springer GK, Forrester LJ, Spollen WG, Ries J, Lamberson WR,Bivens N, Murphy CN, Mathialagan N, Green JA, et al: Developmentalexpression of 2489 gene clusters during pig embryogenesis: anexpressed sequence tag project. Biol Reprod 2004, 71(4):1230–1243.
20. Archibald AL, Bolund L, Churcher C, Fredholm M, Groenen MA, Harlizius B,Lee KT, Milan D, Rogers J, Rothschild MF, et al: Pig genome sequence–analysis and publication strategy. BMC Genomics 2010, 11:438.
21. Degenstein KL, O'Donoghue R, Patterson JL, Beltranena E, Ambrose DJ,Foxcroft GR, Dyck MK: Synchronization of ovulation in cyclic gilts withporcine luteinizing hormone (pLH) and its effects on reproductivefunction. Theriogenology 2008, 70(7):1075–1085.
22. Zhulidov PA, Bogdanova EA, Shcheglov AS, Vagner LL, Khaspekov GL,Kozhemyako VB, Matz MV, Meleshkevitch E, Moroz LL, Lukyanov SA, et al:Simple cDNA normalization using kamchatka crab duplex-specificnuclease. Nucleic Acids Res 2004, 32(3):e37.
23. Hughes TR, Mao M, Jones AR, Burchard J, Marton MJ, Shannon KW,Lefkowitz SM, Ziman M, Schelter JM, Meyer MR, et al: Expression profilingusing microarrays fabricated by an ink-jet oligonucleotide synthesizer.Nat Biotechnol 2001, 19(4):342–347.
24. Gilbert I, Scantland S, Sylvestre EL, Gravel C, Laflamme I, Sirard MA, Robert C:The dynamics of gene products fluctuation during bovine pre-hatchingdevelopment. Mol Reprod Dev 2009, 76(8):762–772.
25. Smyth GK: Linear models and empirical bayes methods for assessingdifferential expression in microarray experiments. Stat Appl Genet Mol Biol2004, 3:1544–6115. Article3.
26. Vallee M, Gravel C, Palin MF, Reghenas H, Stothard P, Wishart DS, Sirard MA:Identification of novel and known oocyte-specific genes using
Tsoi et al. BMC Genomics 2012, 13:370 Page 14 of 15http://www.biomedcentral.com/1471-2164/13/370

complementary DNA subtraction and microarray analysis in threedifferent species. Biol Reprod 2005, 73(1):63–71.
27. Thomas PD, Kejariwal A, Guo N, Mi H, Campbell MJ, Muruganujan A,Lazareva-Ulitsky B: Applications for protein sequence-function evolutiondata: mRNA/protein expression analysis and coding SNP scoring tools.Nucleic Acids Res 2006, 34(Web Server issue):W645–W650.
28. Bogdanova EA, Shagin DA, Lukyanov SA: Normalization of full-lengthenriched cDNA. Mol Biosyst 2008, 4(3):205–212.
29. Jarvie T, Harkins T: De novo assembly and genomic structural variationanalysis with genome sequencer FLX 3 K long-tag paired end reads.Biotechniques 2008, 44(6):829–831.
30. Henriquez V, Gennaro ML: A simple strategy to generate small deletionsusing Bal31 nuclease. Nucleic Acids Res 1990, 18(22):6735–6736.
31. Tuggle CK, Wang Y, Couture O: Advances in swine transcriptomics. Int JBiol Sci 2007, 3(3):132–152.
32. Naraballobh WC S, Muràni E, Wimmers K, Ponsuksili S: Annotation and insilico localization of the Affymetrix GeneChip Porcine Genome Array.Archiv Tierzucht 2010, 53(2):230–238.
33. Tsai S, Cassady JP, Freking BA, Nonneman DJ, Rohrer GA, Piedrahita JA:Annotation of the Affymetrix porcine genome microarray. Anim Genet2006, 37(4):423–424.
34. Cho RJ, Campbell MJ: Transcription, genomes, function. Trends Genet 2000,16(9):409–415.
35. Liu N, Lu M, Tian X, Han Z: Molecular mechanisms involved in self-renewal and pluripotency of embryonic stem cells. J Cell Physiol 2007,211(2):279–286.
36. Pera MF, Tam PP: Extrinsic regulation of pluripotent stem cells. Nature2010, 465(7299):713–720.
37. Abu-Remaileh M, Gerson A, Farago M, Nathan G, Alkalay I, Zins Rousso S,Gur M, Fainsod A, Bergman Y: Oct-3/4 regulates stem cell identity and cellfate decisions by modulating Wnt/beta-catenin signalling. EMBO J 2010,29(19):3236–3248.
38. Tanaka SS, Kojima Y, Yamaguchi YL, Nishinakamura R, Tam PP: Impact ofWNT signaling on tissue lineage differentiation in the early mouseembryo. Dev Growth Differ 2011, 53(7):843–856.
39. Brevini TA, Pennarossa G, Gandolfi F: No shortcuts to pig embryonic stemcells. Theriogenology 2010, 74(4):544–550.
40. Telugu BP, Ezashi T, Roberts RM: The promise of stem cell research in pigsand other ungulate species. Stem Cell Rev 2010, 6(1):31–41.
41. Chen J, Agrawal V, Rattray M, West MA, St Clair DA, Michelmore RW,Coughlan SJ, Meyers BC: A comparison of microarray and MPSStechnology platforms for expression analysis of Arabidopsis. BMCGenomics 2007, 8:414.
42. Li Y, Xu Z, Li H, Xiong Y, Zuo B: Differential transcriptional analysisbetween red and white skeletal muscle of Chinese Meishan pigs. Int JBiol Sci 2010, 6(4):350–360.
43. Jun H, Daiwen C, Bing Y: Metabolic and transcriptomic responses ofweaned pigs induced by different dietary amylose and amylopectinratio. PLoS One 2011, 5(11):e15110.
44. Li J, Yu YJ, Feng L, Cai XB, Tang HB, Sun SK, Zhang HY, Liang JJ, Luo TR:Global transcriptional profiles in peripheral blood mononuclear cellduring classical swine fever virus infection. Virus Res 2010, 148(1–2):60–70.
45. Paczkowski M, Yuan Y, Fleming-Waddell J, Bidwell CA, Spurlock D, KrisherRL: Alterations in the transcriptome of porcine oocytes derived fromprepubertal and cyclic females is associated with developmentalpotential. J Anim Sci 2011, 89(11):3561–3571.
46. Sun X, Mei S, Tao H, Wang G, Su L, Jiang S, Deng C, Xiong Y, Li F:Microarray profiling for differential gene expression in PMSG-hCGstimulated preovulatory ovarian follicles of Chinese Taihu and LargeWhite sows. BMC Genomics 2011, 12:111.
47. Blomberg LA, Schreier L, Li RW: Characteristics of peri-implantationporcine concepti population and maternal milieu influence thetranscriptome profile. Mol Reprod Dev 2011, 77(11):978–989.
48. Lee ML, Kuo FC, Whitmore GA, Sklar J: Importance of replication inmicroarray gene expression studies: statistical methods and evidencefrom repetitive cDNA hybridizations. Proc Natl Acad Sci U S A 2000,97(18):9834–9839.
49. Zahurak M, Parmigiani G, Yu W, Scharpf RB, Berman D, Schaeffer E,Shabbeer S, Cope L: Pre-processing Agilent microarray data. BMCBioinforma 2007, 8:142.
50. Wassarman PM, Litscher ES: Mammalian fertilization: the egg'smultifunctional zona pellucida. Int J Dev Biol 2008, 52(5–6):665–676.
51. Adjaye J, Herwig R, Brink TC, Herrmann D, Greber B, Sudheer S, Groth D,Carnwath JW, Lehrach H, Niemann H: Conserved molecular portraits ofbovine and human blastocysts as a consequence of the transition frommaternal to embryonic control of gene expression. Physiol Genomics2007, 31(2):315–327.
52. McGrath SA, Esquela AF, Lee SJ: Oocyte-specific expression of growth/differentiation factor-9. Molecular endocrinology (Baltimore, Md 1995,9(1):131–136.
53. Dube JL, Wang P, Elvin J, Lyons KM, Celeste AJ, Matzuk MM: The bonemorphogenetic protein 15 gene is X-linked and expressed in oocytes.Molecular endocrinology (Baltimore, Md 1998, 12(12):1809–1817.
54. Juengel JL, Hudson NL, Heath DA, Smith P, Reader KL, Lawrence SB,O'Connell AR, Laitinen MP, Cranfield M, Groome NP, et al: Growthdifferentiation factor 9 and bone morphogenetic protein 15 areessential for ovarian follicular development in sheep. Biol Reprod 2002,67(6):1777–1789.
55. Assou S, Anahory T, Pantesco V, Le Carrour T, Pellestor F, Klein B,Reyftmann L, Dechaud H, De Vos J, Hamamah S: The human cumulus--oocyte complex gene-expression profile. Hum Reprod 2006,21(7):1705–1719.
56. Regassa A, Rings F, Hoelker M, Cinar U, Tholen E, Looft C, Schellander K,Tesfaye D: Transcriptome dynamics and molecular cross-talk betweenbovine oocyte and its companion cumulus cells. BMC Genomics 2011,12:57.
57. Whitworth KM, Agca C, Kim JG, Patel RV, Springer GK, Bivens NJ,Forrester LJ, Mathialagan N, Green JA, Prather RS: Transcriptional profilingof pig embryogenesis by using a 15-K member unigene set specific forpig reproductive tissues and embryos. Biol Reprod 2005, 72(6):1437–1451.
58. Hussein TS, Froiland DA, Amato F, Thompson JG, Gilchrist RB: Oocytesprevent cumulus cell apoptosis by maintaining a morphogenic paracrinegradient of bone morphogenetic proteins. J Cell Sci 2005,118(Pt 22):5257–5268.
59. Rubio Pomar FJ, Roelen BA, Slot KA, van Tol HT, Colenbrander B, Teerds KJ:Role of Fas-mediated apoptosis and follicle-stimulating hormone on thedevelopmental capacity of bovine cumulus oocyte complexes in vitro.Biol Reprod 2004, 71(3):790–796.
60. Tatemoto H, Sakurai N, Muto N: Protection of porcine oocytes againstapoptotic cell death caused by oxidative stress during In vitromaturation: role of cumulus cells. Biol Reprod 2000, 63(3):805–810.
61. Dyck MK, Ruvinsky A: Developmental genetics. In The genetics of the pig.2nd edition. Edited by Rothschild MF, Ruvinsky A. Wallingford, UK: CABInternational; 2011:507.
62. Gaillard I, Rouquier S, Giorgi D: Olfactory receptors. Cellular and molecularlife sciences: CMLS 2004, 61(4):456–469.
63. Touhara K, Sengoku S, Inaki K, Tsuboi A, Hirono J, Sato T, Sakano H, Haga T:Functional identification and reconstitution of an odorant receptor insingle olfactory neurons. Proc Natl Acad Sci U S A 1999, 96(7):4040–4045.
64. Asai H, Kasai H, Matsuda Y, Yamazaki N, Nagawa F, Sakano H, Tsuboi A:Genomic structure and transcription of a murine odorant receptor gene:differential initiation of transcription in the olfactory and testicular cells.Biochem Biophys Res Commun 1996, 221(2):240–247.
65. Branscomb A, Seger J, White RL: Evolution of odorant receptors expressedin mammalian testes. Genetics 2000, 156(2):785–797.
66. Goto T, Salpekar A, Monk M: Expression of a testis-specific member of theolfactory receptor gene family in human primordial germ cells. Mol HumReprod 2001, 7(6):553–558.
67. Mao J, Zhang X, Sieli PT, Falduto MT, Torres KE, Rosenfeld CS: Contrastingeffects of different maternal diets on sexually dimorphic geneexpression in the murine placenta. Proc Natl Acad Sci U S A 2010,107(12):5557–5562.
doi:10.1186/1471-2164-13-370Cite this article as: Tsoi et al.: Development of a porcine (Sus scofa)embryo-specific microarray: array annotation and validation. BMCGenomics 2012 13:370.
Tsoi et al. BMC Genomics 2012, 13:370 Page 15 of 15http://www.biomedcentral.com/1471-2164/13/370


