Embed Size (px)
Citation preview
biosensors
Article
Development of a β-Lactoglobulin Sensor Based onSPR for Milk Allergens Detection
Jon Ashley 1,2,* ID , Roberta D’Aurelio 1 ID , Monika Piekarska 1, Jeff Temblay 3,Mike Pleasants 3 ID , Linda Trinh 4, Thomas L. Rodgers 4 ID and Ibtisam E. Tothill 1,* ID
1 Advanced Diagnostics and Sensors Group, Cranfield University, Cranfield MK43 0AL, UK;[email protected] (R.D.); [email protected] (M.P.)
2 Department of Micro- and Nanotechnology, Denmark Technical University, 2800 Lyngby, Denmark3 Safety and Environmental Assurance Centre, Colworth Science Park, Unilever plc, Sharnbrook,
Bedford MK44 1LQ, UK; [email protected] (J.T.); [email protected] (M.P.)4 School of Chemical Engineering and Analytical Science, University of Manchester, Oxford Road,
Manchester M13 9PL, UK; [email protected] (L.T.); [email protected] (T.L.R.)* Correspondence: [email protected] (J.A.); [email protected] (I.E.T.); Tel.: +45-(0)50-337-775 (J.A.);
+44-(0)75-0076-6487 (I.E.T.)
Received: 21 January 2018; Accepted: 20 March 2018; Published: 27 March 2018�����������������
Abstract: A sensitive and label-free surface plasmon resonance (SPR) based sensor was developed inthis work for the detection of milk allergens. β-lactoglobulin (BLG) protein was used as the biomarkerfor cow milk detection. This is to be used directly in final rinse samples of cleaning in-place (CIP)systems of food manufacturers. The affinity assay was optimised and characterised before a standardcurve was performed in pure buffer conditions, giving a detection limit of 0.164 µg mL−1 as adirect binding assay. The detection limit can be further enhanced through the use of a sandwichassay and amplification with nanomaterials. However, this was not required here, as the detectionlimit achieved exceeded the required allergen detection levels of 2 µg mL−1 for β-lactoglobulin.The binding affinities of the polyclonal antibody for BLG, expressed by the dissociation constant (KD),were equal to 2.59 × 10⁻⁹ M. The developed SPR-based sensor offers several advantages in terms oflabel-free detection, real-time measurements, potential on-line system and superior sensitivity whencompared to ELISA-based techniques. The method is novel for this application and could be appliedto wider food allergen risk management decision(s) in food manufacturing.
Keywords: allergen; milk protein; β-lactoglobulin (BLG); surface plasmon resonance (SPR); biosensor
1. Introduction
Milk allergies have been a major concern for public health, especially in children [1]. A foodallergic reaction is defined as an immune reaction to a constituent in a food product such as a proteinthrough the production of immunoglobulin E (IgE) [2]. The body produces histamine and otherchemicals such as cytokines, which may result in several symptoms such as inflammation and in severereactions, fatal anaphylaxis. A key concern for food manufacturers is the detection of food allergencross-contamination within wider food manufacturing processes, which involves resource-intensivesteps such as swabbing food processing plants and routine testing of final products. It is known thatrelatively low levels of milk allergens can cause reactions in allergic individuals: this is indicatedby the Voluntary Incidental Trace Allergen Labelling (VITAL) framework. In particular, the VITALframework proposes that a reference dose of at least 0.1 mg of milk protein per consumer portionof product is a sufficient basis for food manufacturers to apply precautionary allergen labelling.Currently, there is a desire to develop cheap reliable on-line or at-line tests for detecting milk protein
Biosensors 2018, 8, 32; doi:10.3390/bios8020032 www.mdpi.com/journal/biosensors
Biosensors 2018, 8, 32 2 of 11
allergens in a variety of different food matrices [3] or within food manufacturing plants. Rocketimmune electrophoresis is a classic technique, which is used in the detection of casein protein althoughthe technique is largely obsolete [4].
Immunological-based tests such as lateral flow-based assays (LFAs) and enzyme-linked immunesorbent assay (ELISA) are the most widely used methods for the detection of milk allergens withseveral commercial kits being offered on the market. LFAs are a quick and simple method for detectingmilk allergens [5] and they have proven to be cost effective, but the possibility for quantitative analysisusing this type of assay is currently limited. ELISA-based assays, which use antibodies in eitherdirect or sandwich-based assays, have been demonstrated previously in the detection of a numberof milk allergens [6–9]. Recent studies have suggested large variations in milk allergen recoveriesmeasured using a number of these commercial kits, which is problematic where accurate determinationof allergens is required [10]. LC-MS has proven to be the benchmark technique for the sensitivequantitative analysis of milk allergens in a wide range of food matrices [11,12]. The technique offersgood sensitivity and precision but the lengthy sample preparation and expensive instrumentationmeans that analysis needs to be carried out in a dedicated lab. Therefore, a more rapid and efficientdetection method for traces of milk allergens in food production facilities is needed and if they areadapted for on-line analysis, then that will be highly beneficial for food manufacturers.
Biosensors are an attractive alternative to traditional techniques and offer comparable sensitivitiesand selectivity while allowing for on-line and real-time detection [13–15]. Several studies havedemonstrated the use of biosensors in the detection of milk proteins [16–20]. Ito et al. demonstratedthe analysis of β-lactoglobulin using a flow-based QCM sensor with a detection limit down to 1 ppm [21].Billakanti et al. [22], described a surface plasmon resonance (SPR) biosensor (ProteOn XPR36, Bio-Rad)for the simultaneous detection of five milk proteins in dairy products reporting different detectionranges. Indyk and Filonzi [23] and Muller-Renaud et al. [24] used SPR biosensors for lactoferrinand α-s1-casein in a variety of milk products and gave a Limit of Detection (LOD) of 19.9 mg mL−1
and 0.87 mg mL−1, respectively. Recently, an SPR sensor was developed in our previous work forthe detection of α-casein protein as an allergen detection in wash samples from cleaning in-place systems(CIP) of the food manufacturing process, achieving an LOD of 58 ng mL−1 and adequate samplerecoveries [25]. However, whey proteins cannot be detected using a casein-based sensor. Therefore,the development of a β-lactoglobulin sensor is important for whey proteins allergen detection.
In the current work, an immunoassay-based SPR sensor was developed and optimised forthe detection of β-lactoglobulin for future application in cleaning in place (CIP) final-rinse watersamples. SPR sensors offer distinct advantages for this application in that they are fully automated,versatile, flexible, and provide rapid and real-time analysis. The sensors also have the potential toprovide on-line or at-line analysis for multiple samples. β-lactoglobulin is a significant fraction ofmilk protein and the detection of β-lactoglobulin would be a useful marker for monitoring levels ofmilk as well as milk whey fraction during the CIP process in combination with other known allergensampling methods such as surface swabbing. The developed sensor showed sub ppm sensitivity, goodselectivity and was able to detect β-lactoglobulin levels. The sensor can be combined with the caseinsensor for the complete detection of milk and whey fraction allergens when these are used separatelyin food manufacturing processes.
2. Materials and Methods
2.1. Materials and Equipment
Phosphate-buffered saline (PBS), β-lactoglobulin (BLG) from bovine milk, bovine serumalbumin (BSA), sodium acetate, 11-mercaptoundecanoic acid 95% (MUDA), and sulphuricacid 95.0–98.0% were purchased from Sigma Aldrich (Saint Louis, MO, USA). Sodiumchloride (NaCl), sodium hydroxide (NaOH), 2-(N-morpholino)ethanesulfonic acid (MES), HEPES(4-(2-hydroxyethyl)-1-piperazineethanesulfonic acid), HBS-EP = 10 mM Hepes, 150 mM NaCl,
Biosensors 2018, 8, 32 3 of 11
3.4 mM EDTA, 0.005% Tween-20) were supplied by Fischer Scientific UK (Loughborough, UK).N-hydroxysuccinimide (NHS) and 1-ethyl-3-(3-dimethylaminopropyl) carbodiimide (EDC) werepurchased from Thermo Scientific (Waltham, MA, USA). Ethanolamine and ethanol were boughtfrom Fluka analytical (Buchs, Switzerland). Hydrogen peroxide 35% was supplied by Acros Organics(Geel, Belgium) and ethylenediaminetetraacetic acid (EDTA) by BOH. Ultrapure water was obtainedfrom a Milli-Q-water system. Oxygen-free nitrogen was bought from BOC (Manchester, UK). Sheepanti-bovine β-lactoglobulin B polyclonal antibody (BLG Ab) was purchased from AbD Serotec(Kidlington, UK). Mouse IgG (mouse IgG) was supplied by Abcam (Cambridge, UK). All obtainedchemicals were of analytical grade and were used without further purification.
All the SPR experiments were performed using the SPR 2/4 instrument and SPR affinity sensorchips obtained from Sierra Sensors (Hamburg, Germany).
2.2. Preparation of the Sensor Surface
Bare sensor chips were cleaned by treating with piranha solution (3:1 H2SO4 and H2O2).A self-assembly monolayer (SAM) was then formed by submerging the gold chip in a degassedsolution of 5 mM solution of 11-mercaptoundecanoic acid 95% (MUDA), in ethanol (50 mL) for at least24 h. Subsequently, the chips were removed from the solution and rinsed with water and ethanolbefore drying in nitrogen. The dry chips were then used to develop the immunoassay on the sensorsurface and stored at 4 ◦C until use. A dry chip was docked into the SPR instrument ready for use.The flow rate of the SPR was set at 25 µL min−1 with 10 mM PBS pH 7.4, and the temperature kept at25 ◦C. The sensor surface was activated by injecting a mixture of 0.1 M NHS/0.4 M EDC for 2 min.The polyclonal BLG antibody was then injected over spot 1 for 4 min followed by injection of the controlantibody (mouse IgG) on spot 2 using the optimised pH and concentration of the antibodies. Spots 1and 2 were blocked by injecting 50 µg mL−1 of BSA onto both spots for 4 min followed by a 4 mininjection of 1 M Ethanolamine.
2.3. Optimisation of Immobilisation Conditions
Optimisation studies were carried out to find the best pH for antibody immobilisation as wellas to establish the optimal antibodies concentration (from 50 µg mL−1 up to 500 µg mL−1). In orderto establish the ideal pH value, sodium-acetate buffer at the following pH values: 4.0, 4.5, and 5.0was used. PBS buffer at pH 7.4 was also tested to examine the effect of higher pH on the antibodyimmobilisation. Buffers with pHs over 7.4 were not tested due to their detrimental effect on antibodyimmobilisation performance due to a decrease in electrostatic interactions between the sensor surfaceand the antibody. The anti-BLG Ab was suspended in each pH-adjusted buffer, while its concentrationwas kept constant. The different anti-BLG Ab suspensions were injected onto the activated sensorsurface and the signal was recorded to establish the highest readings. The SPR response (expressed inresonance unit, RU) was evaluated to select the best pH condition.
Following this, the optimal pH condition was used to establish the best antibody concentration.Specifically, several anti-BLG Ab concentrations (50 µg mL−1, 75 µg mL−1, 100 µg mL−1, 150 µg mL−1,500 µg mL−1) were tested for their immobilisation efficiency and the one that yielded the highest SPRresponse (RU) was selected for further testing within this study.
2.4. BLG Cumulative Binding Assay Optimisation
For the cumulative binding assay, anti-BLG Ab were immobilised on spot 1 (active) according tothe optimised protocol. Mouse IgG at a concentration of 70 µg mL−1 was immobilised on spot 2 andused as a control. In all the experiments, the active and control biosensor-array surfaces (Spots 1 and 2,respectively) were blocked by injecting 50 µg mL−1 of BSA onto both spots for 4 min, followed by a4 min injection of 1 M ethanolamine.
An optimisation study was carried out to reveal the best pH condition and buffer compositionto carry out the cumulative binding assays. Specifically, several buffer compositions with different
Biosensors 2018, 8, 32 4 of 11
pH values (from 4.0 to 7.4) with or without additive concentrations were explored, as summarised inTable 1.
Table 1. Buffers investigated for the cumulative assay optimisation study.
Buffer Concentration (mM) pH Additives
Sodium acetate 100 mM 4 -Glycine-HCl 100 mM 3.0 -
PBS 10 mM 7.4 -HEPES 10 mM 6.8 -
HBS-EP 10 mM 7.4150 mM NaCl3.4 mM EDTA,
0.005% Tween® 20MES 10 mM 5.5 -MES 10 mM 5.5 NaCl (50 mM, 100 mM, 150 mM)MES 10 mM 5.5 0.05% Tween® 20
PBS = Phosphate-buffered saline; HEPES = (4-(2-hydroxyethyl)-1-piperazineethanesulfonic acid); HBS-EP = 10 mMHepes, 150 mM NaCl, 3.4 mM EDTA, 0.005% Tween-20); MES = 2-(N-Morpholino) ethanesulfonic acid.
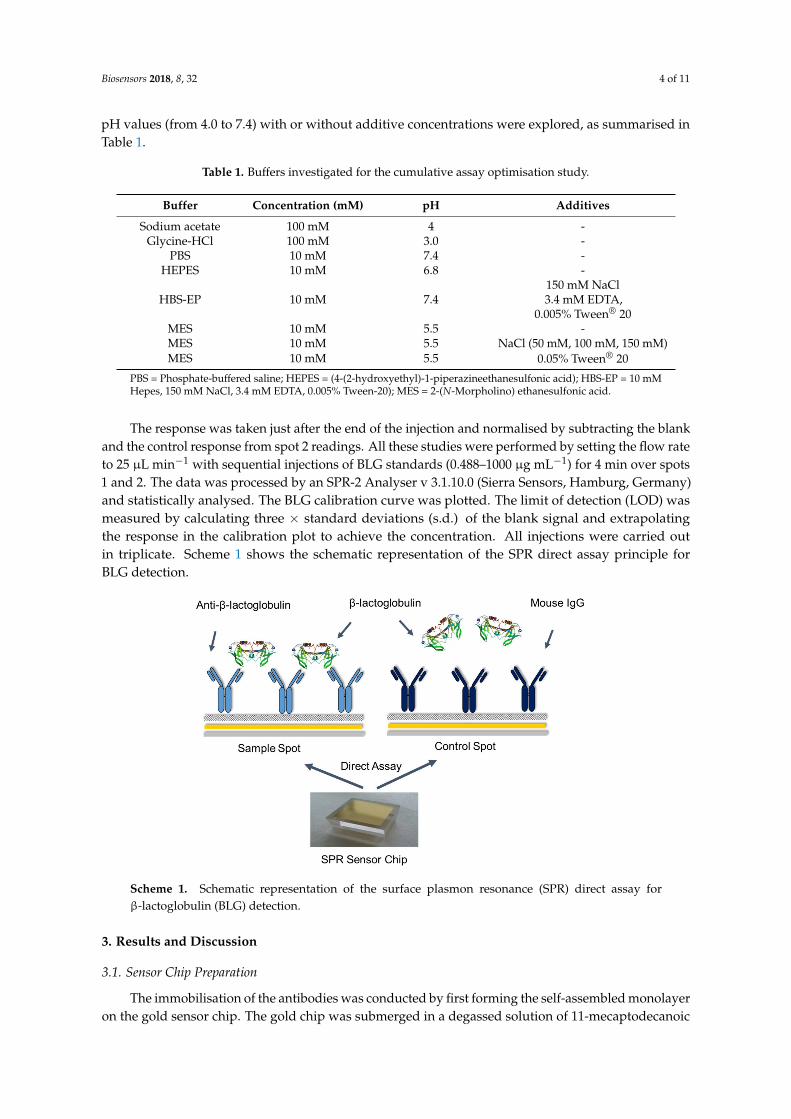
The response was taken just after the end of the injection and normalised by subtracting the blankand the control response from spot 2 readings. All these studies were performed by setting the flow rateto 25 µL min−1 with sequential injections of BLG standards (0.488–1000 µg mL−1) for 4 min over spots1 and 2. The data was processed by an SPR-2 Analyser v 3.1.10.0 (Sierra Sensors, Hamburg, Germany)and statistically analysed. The BLG calibration curve was plotted. The limit of detection (LOD) wasmeasured by calculating three × standard deviations (s.d.) of the blank signal and extrapolatingthe response in the calibration plot to achieve the concentration. All injections were carried outin triplicate. Scheme 1 shows the schematic representation of the SPR direct assay principle forBLG detection.
Scheme 1. Schematic representation of the surface plasmon resonance (SPR) direct assay forβ-lactoglobulin (BLG) detection.
3. Results and Discussion
3.1. Sensor Chip Preparation
The immobilisation of the antibodies was conducted by first forming the self-assembled monolayeron the gold sensor chip. The gold chip was submerged in a degassed solution of 11-mecaptodecanoic
Biosensors 2018, 8, 32 5 of 11
acid dissolved in ethanol for at least 24 h, as the presence of oxygen can be detrimental tothe formation of the SAM layer. The optimised conditions required for producing the highest degreeof immobilisation was studied at different pH values (4.0, 4.5, 5.0, 7.4) using sodium-acetate bufferand PBS with the same antibody concentration. These pH values were used to maximise the degree ofimmobilisation of antibodies and to encourage electrostatic interactions between the activated estergroup on the surface of the sensor and the antibodies. As the isoelectric point (pI) values of antibodiesare around 7–9, pH values above 7.4 were not tested as the expected net negative charge of the antibodywould act to impede the immobilisation process in this case.
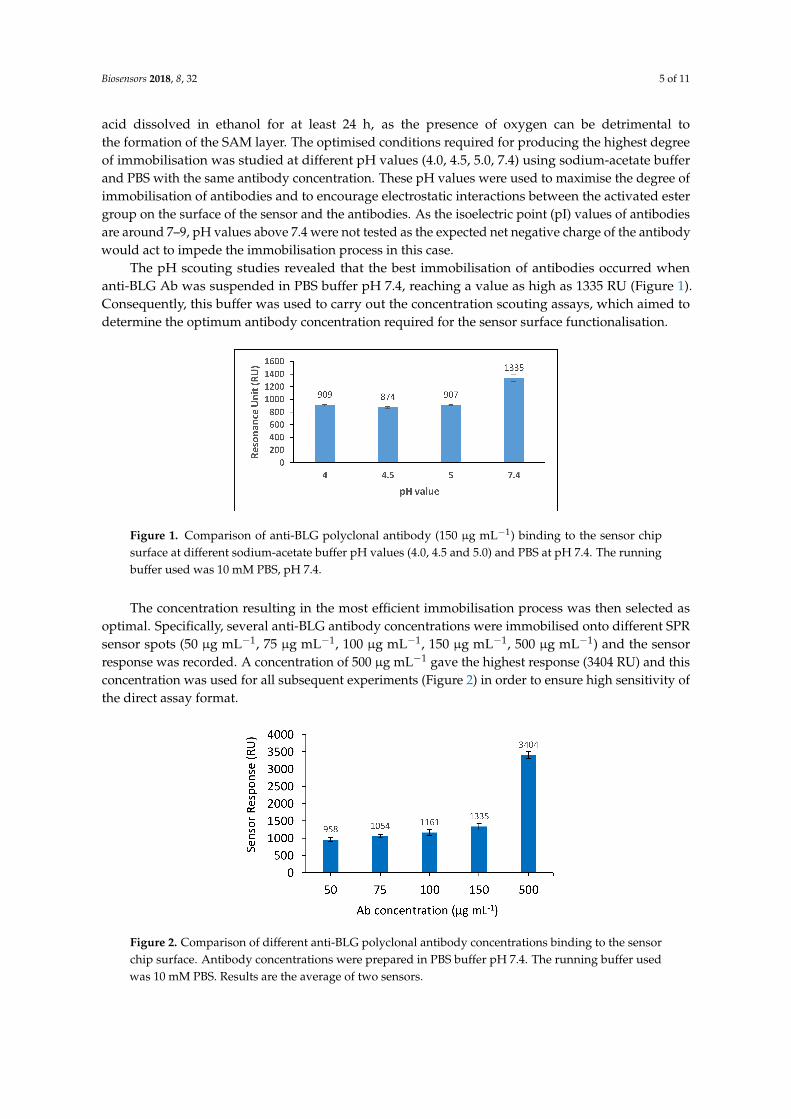
The pH scouting studies revealed that the best immobilisation of antibodies occurred whenanti-BLG Ab was suspended in PBS buffer pH 7.4, reaching a value as high as 1335 RU (Figure 1).Consequently, this buffer was used to carry out the concentration scouting assays, which aimed todetermine the optimum antibody concentration required for the sensor surface functionalisation.
Figure 1. Comparison of anti-BLG polyclonal antibody (150 µg mL−1) binding to the sensor chipsurface at different sodium-acetate buffer pH values (4.0, 4.5 and 5.0) and PBS at pH 7.4. The runningbuffer used was 10 mM PBS, pH 7.4.
The concentration resulting in the most efficient immobilisation process was then selected asoptimal. Specifically, several anti-BLG antibody concentrations were immobilised onto different SPRsensor spots (50 µg mL−1, 75 µg mL−1, 100 µg mL−1, 150 µg mL−1, 500 µg mL−1) and the sensorresponse was recorded. A concentration of 500 µg mL−1 gave the highest response (3404 RU) and thisconcentration was used for all subsequent experiments (Figure 2) in order to ensure high sensitivity ofthe direct assay format.
Figure 2. Comparison of different anti-BLG polyclonal antibody concentrations binding to the sensorchip surface. Antibody concentrations were prepared in PBS buffer pH 7.4. The running buffer usedwas 10 mM PBS. Results are the average of two sensors.
Biosensors 2018, 8, 32 6 of 11
A concentration above 500 µg mL−1 was not explored, as this concentration was considered to bethe highest possible concentration in terms of cost/benefit ratio of the sensor development.
3.2. β-lactoglobulin Binding Assay
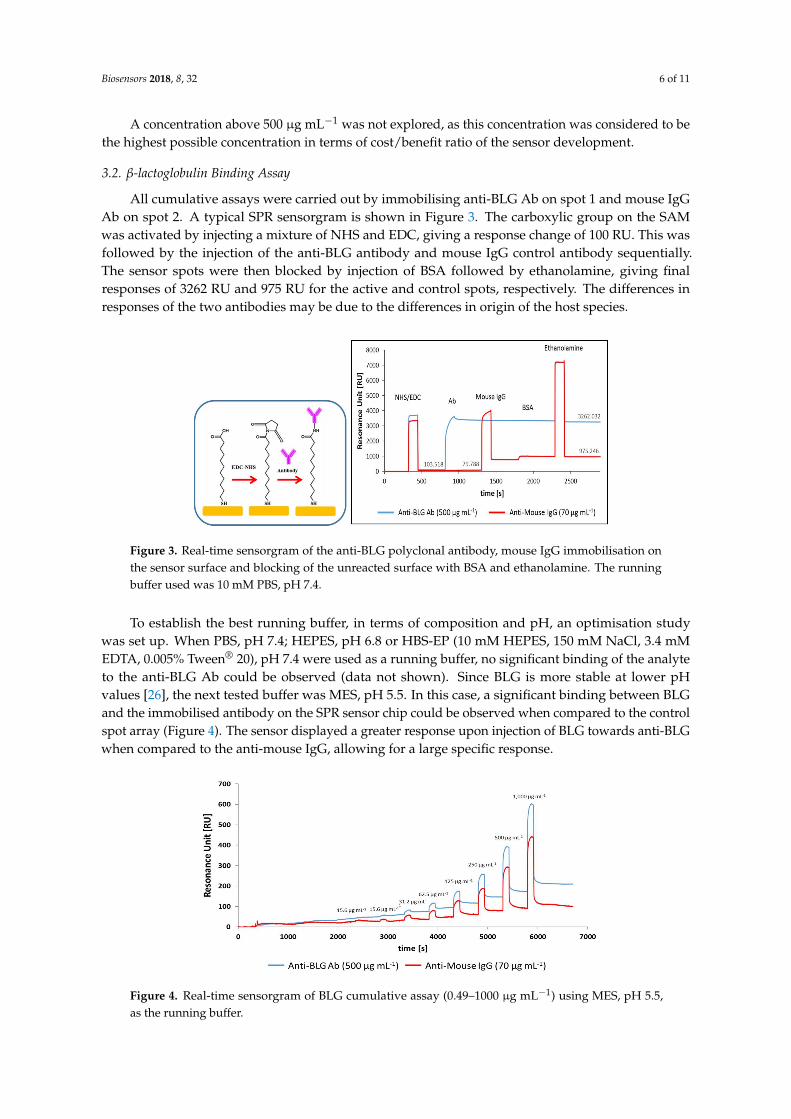
All cumulative assays were carried out by immobilising anti-BLG Ab on spot 1 and mouse IgGAb on spot 2. A typical SPR sensorgram is shown in Figure 3. The carboxylic group on the SAMwas activated by injecting a mixture of NHS and EDC, giving a response change of 100 RU. This wasfollowed by the injection of the anti-BLG antibody and mouse IgG control antibody sequentially.The sensor spots were then blocked by injection of BSA followed by ethanolamine, giving finalresponses of 3262 RU and 975 RU for the active and control spots, respectively. The differences inresponses of the two antibodies may be due to the differences in origin of the host species.
Figure 3. Real-time sensorgram of the anti-BLG polyclonal antibody, mouse IgG immobilisation onthe sensor surface and blocking of the unreacted surface with BSA and ethanolamine. The runningbuffer used was 10 mM PBS, pH 7.4.
To establish the best running buffer, in terms of composition and pH, an optimisation studywas set up. When PBS, pH 7.4; HEPES, pH 6.8 or HBS-EP (10 mM HEPES, 150 mM NaCl, 3.4 mMEDTA, 0.005% Tween® 20), pH 7.4 were used as a running buffer, no significant binding of the analyteto the anti-BLG Ab could be observed (data not shown). Since BLG is more stable at lower pHvalues [26], the next tested buffer was MES, pH 5.5. In this case, a significant binding between BLGand the immobilised antibody on the SPR sensor chip could be observed when compared to the controlspot array (Figure 4). The sensor displayed a greater response upon injection of BLG towards anti-BLGwhen compared to the anti-mouse IgG, allowing for a large specific response.
Figure 4. Real-time sensorgram of BLG cumulative assay (0.49–1000 µg mL−1) using MES, pH 5.5,as the running buffer.
Biosensors 2018, 8, 32 7 of 11
The following buffers with even lower pH were also examined to enhance binding: 0.1 M sodiumacetate, pH 4.0, and 0.1 M Glycine-HCl, pH 3.0. Nevertheless, a decrease of binding was observed.Buffers with pH values over 8 were not investigated since BLG conformational changes occurringat a pH range from 8 to 10 have been proven to decrease the immuno-reactivity of the BLG, due tothe neutralisation of Lys in position 69. This residue has been considered crucial for the bond betweenthe monoclonal antibody and BLG [27]. To decrease the signal on the control spot, two additives (NaCland Tween® 20) were tested. Even in this case, no improvement has been achieved (data not shown).Therefore, it can be concluded that MES 10 mM, pH 5.5 was the ideal running buffer.
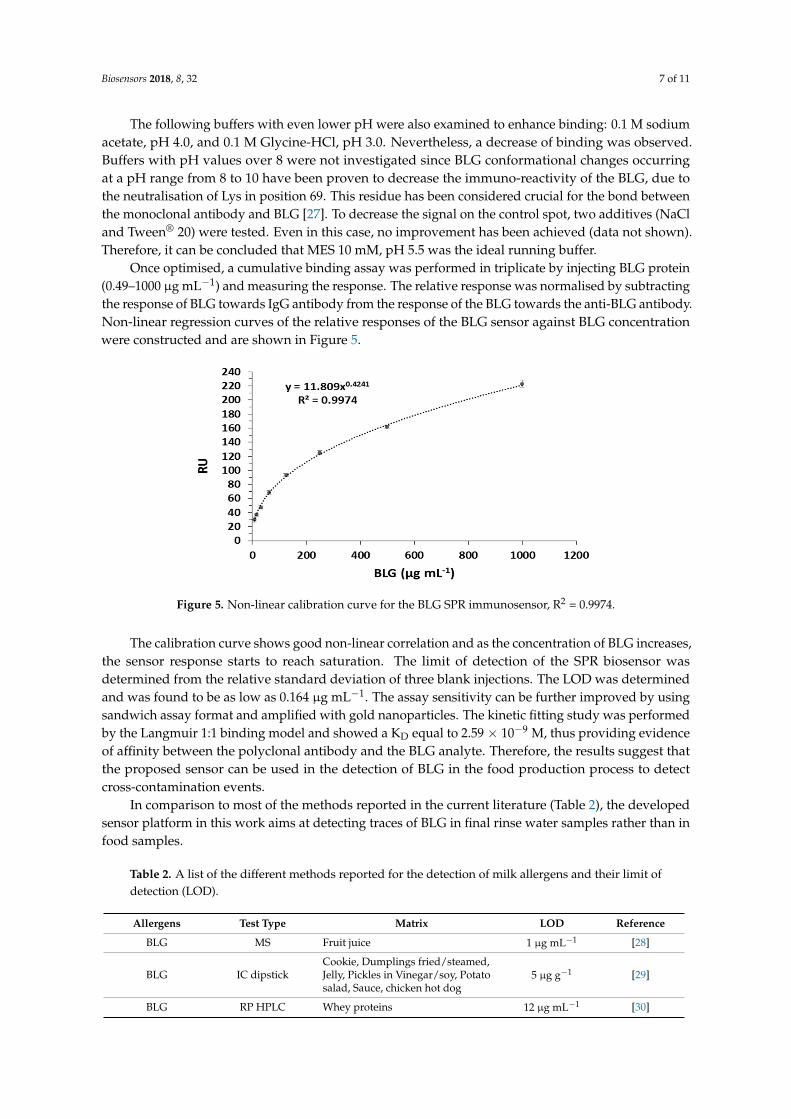
Once optimised, a cumulative binding assay was performed in triplicate by injecting BLG protein(0.49–1000 µg mL−1) and measuring the response. The relative response was normalised by subtractingthe response of BLG towards IgG antibody from the response of the BLG towards the anti-BLG antibody.Non-linear regression curves of the relative responses of the BLG sensor against BLG concentrationwere constructed and are shown in Figure 5.
Figure 5. Non-linear calibration curve for the BLG SPR immunosensor, R2 = 0.9974.
The calibration curve shows good non-linear correlation and as the concentration of BLG increases,the sensor response starts to reach saturation. The limit of detection of the SPR biosensor wasdetermined from the relative standard deviation of three blank injections. The LOD was determinedand was found to be as low as 0.164 µg mL−1. The assay sensitivity can be further improved by usingsandwich assay format and amplified with gold nanoparticles. The kinetic fitting study was performedby the Langmuir 1:1 binding model and showed a KD equal to 2.59 × 10⁻⁹ M, thus providing evidenceof affinity between the polyclonal antibody and the BLG analyte. Therefore, the results suggest thatthe proposed sensor can be used in the detection of BLG in the food production process to detectcross-contamination events.
In comparison to most of the methods reported in the current literature (Table 2), the developedsensor platform in this work aims at detecting traces of BLG in final rinse water samples rather than infood samples.
Table 2. A list of the different methods reported for the detection of milk allergens and their limit ofdetection (LOD).
Allergens Test Type Matrix LOD Reference
BLG MS Fruit juice 1 µg mL−1 [28]
BLG IC dipstickCookie, Dumplings fried/steamed,Jelly, Pickles in Vinegar/soy, Potatosalad, Sauce, chicken hot dog
5 µg g−1 [29]
BLG RP HPLC Whey proteins 12 µg mL−1 [30]
Biosensors 2018, 8, 32 8 of 11
Table 2. Cont.
Allergens Test Type Matrix LOD Reference
Whey proteins SPR Milk and other milk products - [22]
BLG SPR - 5.54 ng mL−1 [31]
CASs and BLG IC-dipstick
Chicken meatball or burger, cookie,Dumplings fried/steamed, sauce,jelly, Potato salad, Pickles inVinegar/soy
5 µg g−1 [29]
Whey proteins(ALA, BLG) Mass Spectrometry Fruit juice 1 µg mL−1 [28]
MS = Mass Spectrometry; IC dipstick = Immunochromatographic dipstick; RP HPLC = Reversed-phase highperformance liquid chromatography; SPR = Surface plasmon resonance.
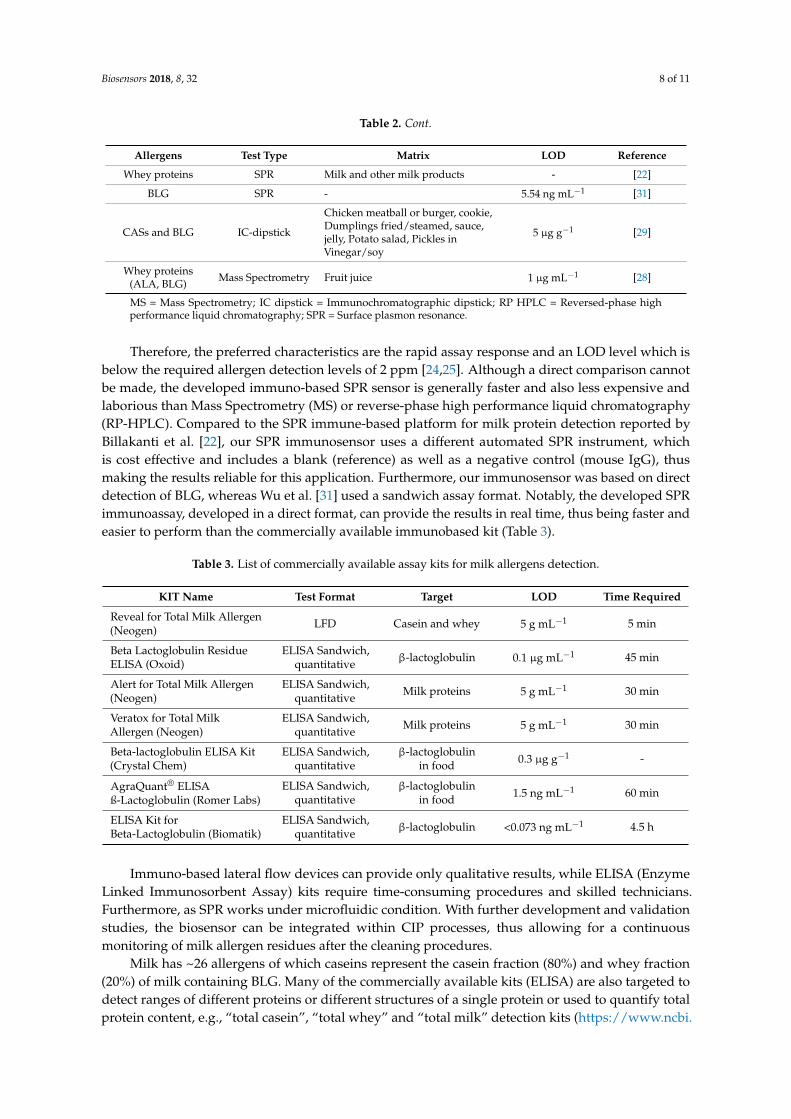
Therefore, the preferred characteristics are the rapid assay response and an LOD level which isbelow the required allergen detection levels of 2 ppm [24,25]. Although a direct comparison cannotbe made, the developed immuno-based SPR sensor is generally faster and also less expensive andlaborious than Mass Spectrometry (MS) or reverse-phase high performance liquid chromatography(RP-HPLC). Compared to the SPR immune-based platform for milk protein detection reported byBillakanti et al. [22], our SPR immunosensor uses a different automated SPR instrument, whichis cost effective and includes a blank (reference) as well as a negative control (mouse IgG), thusmaking the results reliable for this application. Furthermore, our immunosensor was based on directdetection of BLG, whereas Wu et al. [31] used a sandwich assay format. Notably, the developed SPRimmunoassay, developed in a direct format, can provide the results in real time, thus being faster andeasier to perform than the commercially available immunobased kit (Table 3).
Table 3. List of commercially available assay kits for milk allergens detection.
KIT Name Test Format Target LOD Time Required
Reveal for Total Milk Allergen(Neogen) LFD Casein and whey 5 g mL−1 5 min
Beta Lactoglobulin ResidueELISA (Oxoid)
ELISA Sandwich,quantitative β-lactoglobulin 0.1 µg mL−1 45 min
Alert for Total Milk Allergen(Neogen)
ELISA Sandwich,quantitative Milk proteins 5 g mL−1 30 min
Veratox for Total MilkAllergen (Neogen)
ELISA Sandwich,quantitative Milk proteins 5 g mL−1 30 min
Beta-lactoglobulin ELISA Kit(Crystal Chem)
ELISA Sandwich,quantitative
β-lactoglobulinin food 0.3 µg g−1 -
AgraQuant® ELISAß-Lactoglobulin (Romer Labs)
ELISA Sandwich,quantitative
β-lactoglobulinin food 1.5 ng mL−1 60 min
ELISA Kit forBeta-Lactoglobulin (Biomatik)
ELISA Sandwich,quantitative β-lactoglobulin <0.073 ng mL−1 4.5 h
Immuno-based lateral flow devices can provide only qualitative results, while ELISA (EnzymeLinked Immunosorbent Assay) kits require time-consuming procedures and skilled technicians.Furthermore, as SPR works under microfluidic condition. With further development and validationstudies, the biosensor can be integrated within CIP processes, thus allowing for a continuousmonitoring of milk allergen residues after the cleaning procedures.
Milk has ~26 allergens of which caseins represent the casein fraction (80%) and whey fraction(20%) of milk containing BLG. Many of the commercially available kits (ELISA) are also targeted todetect ranges of different proteins or different structures of a single protein or used to quantify totalprotein content, e.g., “total casein”, “total whey” and “total milk” detection kits (https://www.ncbi.
Biosensors 2018, 8, 32 9 of 11
nlm.nih.gov/pubmed/20735137). Allergen detection kits are also specifically modified to these sameallergens during food processing–partial hydrolysis, heat treatment, denaturation/aggregation (https://www.ncbi.nlm.nih.gov/pubmed/19641908). As our work currently only looks at the detection ofnaturally-occurring BLG, the issue of what range of target analytes should be targeted for industrialuse in commercially available kits will also apply to biosensor development. Hence, further work isneeded to investigate the above points for the final sensor design for BLG analysis. Sample handlingprocedures and sensor surface blocking optimisation also require thorough investigation before thissensor can be applied for real CIP samples analysis.
4. Conclusions
In this paper, we successfully demonstrated the use of an SPR biosensor in the detection ofβ-lactoglobulin. The main parameters, such as antibody concentration, pH and the contents ofthe running buffer were optimised, thus providing an insight into further BLG biosensors development.The optimised SPR-based sensor was successfully fabricated and tested, showing good sensitivity, withan LOD of 0.164 µg mL−1. Compared to conventional methods currently in use, this SPR biosensoroffers a real-time method based on a direct assay format and performed in an automated microfluidicsystem, thus reducing time and human labor cost. Due to these advantages, the developed BLG-SPRbiosensor can be considered a valuable analytical tool for the monitoring of BLG cross-contaminationevents in different manufacturing processes required for food, medicine and cosmetics. Thus, the milkallergen SPR biosensor could be used as a tool to support milk allergen safety risk managementby industry.
Further work will look at utilising the same technology to generate antibody-based SPR to detectother sources of food allergens that are of interest to food manufacturing processes, e.g., peanut, egg,etc. It would also be of interest to test the sensor’s ability to detect the absence of residual proteinin a CIP validation study, as conducted by [32]. It is also clear from the literature that milk proteinstandards need to be standardised.
Acknowledgments: The authors would like to thank Innovate UK for partial funding of this work (Projectno: 34312-241239).
Author Contributions: Jon Ashley, Monika Piekarska and Roberta D’Aurelio performed all the experimental workand wrote the draft of the paper; Jeff Temblay and Mike Pleasants supported the research and provided industrialinput on legislations and experimental design; Linda Trinh and Thomas L. Rodgers provided collaborative inputon the research; Ibtisam E. Tothill supervised and directed the research and finalized the paper.
Conflicts of Interest: The authors declare no conflict of interest.
References
1. Lifschitz, C.; Szajewska, H. Cow’s milk allergy: Evidence-based diagnosis and management forthe practitioner. Eur. J. Pediatr. 2015, 174, 141–150. [CrossRef] [PubMed]
2. Huby, R.; Dearman, R.; Kimber, I. Why are some proteins allergens? Toxicol. Sci. 2000, 55, 235–246. [CrossRef][PubMed]
3. Council of the European Union. Council Regulation No 428/2009 of 5 May 2009 Setting up a CommunityRegime for the Control of Exports, Transfer, Brokering and Transit of Dual-Use Items (Recast). Availableonline: https://eur-lex.europa.eu/legal-content/EN/TXT/?uri=CELEX%3A32009R0428 (accessed on27 March 2018).
4. Ylitalo, L.; Mäkinen-Kiljunen, S.; Turjanmaa, K.; Palosuo, T.; Reunala, T. Cow’s milk casein, a hidden allergenin natural rubber latex gloves. J. Allergy Clin. Immunol. 1999, 104, 177–180. [CrossRef]
5. Courtney, R.C.; Taylor, S.L.; Baumert, J.L. Evaluation of Commercial Milk-Specific Lateral Flow Devices.J. Food Prot. 2016, 79, 1767–1774. [CrossRef] [PubMed]
6. Monaci, L.; Brohée, M.; Tregoat, V.; van Hengel, A. Influence of baking time and matrix effects on the detectionof milk allergens in cookie model food system by ELISA. Food Chem. 2011, 127, 669–675. [CrossRef] [PubMed]
Biosensors 2018, 8, 32 10 of 11
7. Monaci, L.; Visconti, A. Immunochemical and DNA-based methods in food allergen analysis and qualityassurance perspectives. Trends Food Sci. Technol. 2010, 21, 272–283. [CrossRef]
8. Schubert-Ullrich, P.; Rudolf, J.; Ansari, P.; Galler, B.; Führer, M.; Molinelli, A.; Baumgartner, S.Commercialized rapid immunoanalytical tests for determination of allergenic food proteins: An overview.Anal. Bioanal. Chem. 2009, 395, 69–81. [CrossRef] [PubMed]
9. Cho, C.Y.; Nowatzke, W.; Oliver, K.; Garber, E.A.E. Multiplex detection of food allergens and gluten.Anal. Bioanal. Chem. 2015, 407, 4195–4206. [CrossRef] [PubMed]
10. Johnson, P.E.; Rigby, N.M.; Dainty, J.R.; Mackie, A.R.; Immer, U.U.; Rogers, A.; Titchener, P.; Shoji, M.;Ryan, A.; Mata, L.; et al. A multi-laboratory evaluation of a clinically-validated incurred quality controlmaterial for analysis of allergens in food. Food Chem. 2014, 148, 30–36. [CrossRef] [PubMed]
11. Morgan, F.; Bouhallab, S.; Mollé, D.; Henry, G.; Maubois, J.; Léonil, J. Lactolation of β-LactoglobulinMonitored by Electrospray Ionisation Mass Spectrometry. Int. Dairy J. 1998, 8, 95–98. [CrossRef]
12. Croote, D.; Quake, S.R.; Schmidt, A.; Aebersold, R.; MacCoss, M.J. Food allergen detection by massspectrometry: The role of systems biology. NPJ Syst. Biol. Appl. 2016, 2, 16022. [CrossRef] [PubMed]
13. Ashley, J.; Shahbazi, M.; Kant, K.; Chidambara, V.A.; Wolff, A.; Bang, D.D.; Sun, Y. MolecularlyImprinted Polymers for Sample Preparation and Biosensing in Food analysis: Progress and Perspectives.Biosens. Bioelectron. 2017, 91, 606–615. [CrossRef] [PubMed]
14. Salam, F.; Uludag, Y.; Tothill, I.E. Real-time and sensitive detection of Salmonella Typhimurium using anautomated quartz crystal microbalance (QCM) instrument with nanoparticles amplification. Talanta 2013,115, 761–767. [CrossRef] [PubMed]
15. Tothill, I.E. Biosensors and nanomaterials and their application for mycotoxin determination. World MycotoxinJ. 2011, 4, 361–374. [CrossRef]
16. Yman, I.M.; Eriksson, A.; Johansson, M.A.; Hellenäs, K. Food allergen detection with biosensorimmunoassays. J. AOAC Int. 2006, 89, 856–861. [PubMed]
17. Raz, S.R.; Liu, H.; Norde, W.; Bremer, M.G.E.G. Food allergens profiling with an imaging surface plasmonresonance-based biosensor. Anal. Chem. 2010, 82, 8485–8491. [CrossRef]
18. Vasilescu, A.; Nunes, G.; Hayat, A.; Latif, U.; Marty, J. Electrochemical Affinity Biosensors Based onDisposable Screen-Printed Electrodes for Detection of Food Allergens. Sensors 2016, 16, 1863. [CrossRef][PubMed]
19. Inaba, I.; Kuramitz, H.; Sugawara, K. Electrochemical Sensing of Casein Based on the Interaction between ItsPhosphate Groups and a Ruthenium (III) Complex. Anal. Sci. 2016, 32, 853–859. [CrossRef] [PubMed]
20. Murray, B.; Deshaires, C. Monitoring Protein Fouling of Metal Surfaces via a Quartz Crystal Microbalance.J. Colloid Interface Sci. 2000, 227, 32–41. [CrossRef] [PubMed]
21. Ito, T.; Aoki, N.; Tsuchiya, A.; Kaneko, S.; Suzuki, K. Sequential Analysis of β-Lactoglobulin for AllergenCheck Using QCM with a Passive Flow System. Chem. Lett. 2015, 44, 981–983. [CrossRef]
22. Billakanti, J.M.; Fee, C.J.; Lane, F.R.; Kash, A.S.; Fredericks, R. Simultaneous, quantitative detection of fivewhey proteins in multiple samples by surface plasmon resonance. Int. Dairy J. 2010, 20, 96–105. [CrossRef]
23. Indyk, H.E.; Filonzi, E.L. Council of the European Determination of lactoferrin in bovine milk, colostrumand infant formulas by optical biosensor analysis. Int. Dairy J. 2005, 15, 429–438. [CrossRef]
24. Muller-Renaud, S.; Dupont, D.; Dulieu, P. Development of a biosensor immunoassay for the quantificationof αS1-casein in milk. J. Dairy Res. 2005, 72, 57–64. [CrossRef] [PubMed]
25. Ashley, J.; Piekarska, M.; Segers, C.; Trinh, L.; Rodgers, T.; Willey, R.; Tothill, I.E. An SPR based sensor forallergens detection. Biosens. Bioelectron. 2017, 88, 109–113. [CrossRef] [PubMed]
26. Qin, B.Y.; Bewley, M.C.; Creamer, L.K.; Baker, H.M.; Baker, E.N.; Jameson, G.B. Structural basis of the Tanfordtransition of bovine β-lactoglobulin. Biochemistry 1998, 37, 14014–14023. [CrossRef] [PubMed]
27. Chun, Y.S.; Wen, L.C.; Ming, C.Y.; Jen, P.H.; Mao, S.J.T. Epitope mapping of a monoclonal antibody specificto bovine dry milk: Involvement of residues 66-76 of strand D in thermal denatured ß-Lactoglobulin. J. Biol.Chem. 2005, 280, 3574–3582.
28. Monaci, L.; van Hengel, A.J. Development of a method for the quantification of whey allergen traces inmixed-fruit juices based on liquid chromatography with mass spectrometric detection. J. Chromatogr. A 2008,1192, 113–120. [CrossRef] [PubMed]
Biosensors 2018, 8, 32 11 of 11
29. Morishita, N.; Akiyama, E.; Arikawa, N.; Iida, T.; Tase, K.; Hamaji, M.; Hiraoka, S.; Shiroyanagi, R.;Kamijou, S.; Matsumoto, T.; et al. Evaluation of immunochromatographic test kits for food allergens usingprocessed food models, Shokuhin Eiseigaku zasshi. J. Food Hyg. Soc. Jpn. 2006, 47, 66–75. [CrossRef]
30. Kong, X.; Wang, J.; Tang, Y.; Li, D.; Zhang, N.; Jiang, J.; Liu, N. HPLC Analysis of α-lactalbumin andβ-lactoglobulin in Bovine Milk with C 4 and C 18 Column. J. Northeast Agric. Univ. 2012, 19, 76–82.
31. Wu, X.; Li, Y.; Liu, B.; Feng, Y.; He, W.; Liu, Z.; Liu, L.; Wang, Z.; Huang, H. Two-Site AntibodyImmunoanalytical Detection of Food Allergens by Surface Plasmon Resonance. Food Anal. Methods 2015.[CrossRef]
32. Stephan, O.; Weisz, N.; Vieths, S.; Weiser, T.; Rabe, B.; Vatterott, W. Protein quantification, sandwich ELISA,and real-time PCR used to monitor industrial cleaning procedures for contamination with peanut and celeryallergens. J. AOAC Int. 2004, 87, 1448–1457. [PubMed]
© 2018 by the authors. Licensee MDPI, Basel, Switzerland. This article is an open accessarticle distributed under the terms and conditions of the Creative Commons Attribution(CC BY) license (http://creativecommons.org/licenses/by/4.0/).


![[Development of the theoretical orientation of psychotherapists. SPR Collaborative Research Network]](https://img.pdfslide.net/doc/110x75/634b62613093119e280b09d6/development-of-the-theoretical-orientation-of-psychotherapists-spr-collaborative.jpg)


