Embed Size (px)
Citation preview

An Anionic Porphyrin Binds b-Lactoglobulin A at a SuperficialSite Rich in Lysine Residues
Ivan Silva Æ Samuel Sansone Æ Lorenzo Brancaleon
Published online: 6 January 2009
� Springer Science+Business Media, LLC 2008
Abstract Binding of small ligands to globular proteins
remains a major research topic in biophysics. We have
studied the binding of several photoactive dyes to b-lacto-
globulin (BLG), as a model to investigate the photoinduced
effects of porphyrins on proteins. A combination of optical
spectroscopies (fluorescence, circular dichroism) and
molecular docking simulations were used to estimate the
pH-dependence of the binding parameters and the docking
location for meso-tetrakis(sulfonatophenyl)-porphyrin
(TPPS). We have observed that the binding of TPPS is not
modulated by the pH-mediated conformational transition of
the protein (i.e., Tanford transition). Binding of TPPS
appears to occur with some degree of negative cooperativ-
ity. Moreover, TPPS remains bound even upon partial
denaturation of the protein. These results are consistent with
a superficial binding site at a location removed from the
aperture of the interior b-barrel. Binding occurs through
electrostatic interactions between the negative SO3- groups
of TPPS and positively charged Lys and Arg residues. This
is the first study that explores the interaction of an anionic
porphyrin with BLGA in a pH range that spans across the
Tanford transition. Establishing the location of the binding
site will enable us to explain the photoinduced conforma-
tional effects mediated by TPPS on BLG.
Keywords Lactoglobulin � Porphyrin �Fluorescence spectroscopy � Binding �Photodynamic therapy (PDT)
Abbreviations
PPIX Protoporphyrin IX
b-lg b-Lactoglobulin
GI Gastrointestinal tract
DMSO Dimethylsulfoxide
KI Potassium iodide
S–V Stern–Volmer
Trp Tryptophan
TPPS4 Meso-tetrakis(sulfonatophenyl)-porphine
ANS 1-Anilinonaphthalene-8-sulfonate
FRET Fluorescence resonance energy transfer
CD Circular dichroism
1 Introduction
Because of its small size (162 amino acids) and its well
characterized structure [1, 2], b-lactoglobulin (BLG) rep-
resents a viable protein model for the investigation of the
effects of photoactive ligands (such as porphyrins) on
globular proteins. Following our study on the binding of
protoporphyrin IX (PPIX) to BLG [3], we have recently
shown that irradiation of the porphyrin in the PPIX/BLG
complex induces partial unfolding of the protein [4].
Light-induced processes have been extensively applied
to study the dynamic structure of proteins [5, 6]. The direct
photoinduced, porphyrin-mediated conformational effects
[4] could also have consequences for biomedical applica-
tions since porphyrins have been used as experimental and/
or clinically useful [7, 8] photosensitizing drugs in photo-
dynamic therapy (PDT). The direct targeting of proteins in
Electronic supplementary material The online version of thisarticle (doi:10.1007/s10930-008-9158-8) contains supplementarymaterial, which is available to authorized users.
I. Silva � S. Sansone � L. Brancaleon (&)
Department of Physics and Astronomy, University of Texas at
San Antonio, One UTSA Circle, San Antonio, TX 78249, USA
e-mail: [email protected]
123
Protein J (2009) 28:1–13
DOI 10.1007/s10930-008-9158-8
PDT has been historically overlooked despite the mounting
evidence that proteins are indeed directly targeted during
cell irradiation in the presence of various photosensitizers
[9–11] and that such damage is not confined to membrane
proteins [10, 12]. Understanding light-induced, porphyrin-
mediated conformational changes of model globular pro-
teins will therefore be useful to understand some of the
mechanisms that produce protein damage during PDT, but
also provide a new approach that could intentionally target
specific proteins, thus providing a potential paradigm shift
in the PDT protocol.
A fundamental element in the study of photoinduced,
porphyrin-mediated conformational changes of proteins is
establishing the location of the binding site for the porphyrin.
Binding of meso-tetrakis(sulfonatophenyl)-porphine
(TPPS) to BLG has been investigated near neutral and
acidic pH values [13] where the porphyrin is a tetra-anion
(TPPS4-) and a di-anion (TPPS2-), respectively. In the
acidic regime where BLG is a monomer and TPPS2- tends
to form J-dimers, it was found that the protein itself can
induce the formation of J-aggregates [13]. Near neutral pH
where BLG is dimerized and TPPS4- is monodispersed the
signature band of the bound J-aggregate disappeared [13].
The study, however, did not include a wider pH range that
could probe the effects of the conformational changes of
BLG (the so-called Tanford transition) [14].
We analyzed the binding of TPPS4- to b-lactoglobulin
variant A (BLGA) at 6 B pH B 9. In such pH range BLGA
is a dimer and each monomer undergoes a conformational
transition near pH 7.5 [14, 15]. In this range the presence of
TPPS2- or its J-aggregates is negligible [16]. The com-
bined used of emission spectroscopy, fluorescence lifetime
measurements, circular dichroism spectroscopy (CD) and
computational docking simulations, provided a likely sce-
nario for the binding site of TPPS4- to BLGA and revealed
the docking to a superficial protein location stabilized by
electrostatic interactions between the negatively charged
SO3- groups of TPPS4- and positively charged amino acid
residues. This superficial binding site is in agreement with
what had been suggested previously [13].
2 Materials and Methods
2.1 Chemicals
TPPS and bovine lactoglobulin (genetic variant A, BLGA)
were purchased from Sigma–Aldrich (St. Louis, MO) and
used without further purification. Electrophoretic analysis
of BLGA under denaturing conditions revealed [99%
purity. In addition we analyzed the BLG sequence using
capillary liquid chromatography/mass spectrometry (LC/
MS) which confirmed the purity of the protein and revealed
a mass of 18,278 Da for BLG which is within 1 Da of
the NCBI sequence gi|6729725. This sequence differs from
the expected BLGA sequence for eight amino acids in the
C-terminal region of the protein.
2.1.1 Buffers
Aqueous phosphate buffers were prepared using deionized
water. One tablet of phosphate buffered saline tablets
(Sigma–Aldrich) was dissolved in 200 mL of water to pro-
duce a 10 mM buffer at pH 7.4. Buffers were subsequently
adjusted to the correct pH by addition of small aliquots of a
0.5 M solution of HCl or a 0.1 M solution of NaOH. In order
to investigate the effects of the BLGA conformational
transition [14] on the porphyrin binding, the pH of the buffer
was adjusted from 6 to 9 at increments of one pH unit.
2.2 Sample Preparation
2.2.1 TPPS UV–Vis Absorption and Fluorescence
The porphyrin was dissolved directly in buffer and the
concentration adjusted to 0.5 lM using absorption
spectroscopy, assuming e413 = 5.10 9 105 M-1 cm-1 in
aqueous solution [17]. The fluorescence of TPPS was
recorded with excitation at 413 nm and emission in the
580–750 nm range. A stock solution of BLGA at the same
pH as the porphyrin solution was prepared at a concentration
of 30 lM by dissolving it directly in buffer. The concen-
tration of the protein in solution was always determined by
spectrophotometric analysis assuming e280 = 1.76 9 104
M-1 cm-1. The LC/MS data did not detect any aromatic
impurity in our sample, therefore we assumed that the
content in aromatic amino acids (Tyr ? Trp) was identical
to the one expected for other BLG molecules whose molar
extinction coefficient, e280, is the one shown above [13, 18].
Increasing aliquots (from 10 to 100 lL) of the protein
solution were added directly into 1.5 mL of the aqueous
solution of TPPS. The fluorescence spectrum of TPPS was
recorded after each addition of the protein. The absorption
spectra of the same solutions were also recorded from 250 to
500 nm and used to correct for sample dilution and to nor-
malize the emission spectra [3] but also to survey the
possible formation of J- or other aggregates.
2.2.2 BLGA Fluorescence Quenching
The solutions for the TPPS-induced quenching of BLGA
contained 7 lM of the protein (OD295 & 0.1) [19]. Exci-
tation of protein fluorescence was carried out at 295 nm
which selectively excites the Trp residues of BLGA. A
20 lM stock solution of TPPS in buffer was prepared and
added at increasing aliquots to a 1.5 mL volume of the
2 I. Silva et al.
123
BLGA solution. The intrinsic fluorescence of the protein
was recorded between 300 and 450 nm after each por-
phyrin addition. Absorption values at the excitation
wavelength were recorded for all samples and used to
normalize the emission spectra of the protein and correct
for the dilution of the sample [3].
2.2.3 FRET, Fluorescence Anisotropy and Circular
Dichroism Spectroscopy
All these experiments were carried out at a single
BLGA:TPPS molar ratio where the fluorescence spectra
indicated the maximum shift of the emission (thus binding
saturation). FRET experiments were carried out using
steady state and time resolved fluorescence.
2.3 Instrumentation
Absorption spectra were recorded on a dual beam spectro-
photometer (Evolution 300, Thermo Scientific, Waltham,
MA). All spectra were recorded at a rate of 240 nm/min and
a spectral resolution of 2 nm. Appropriate baseline and
reference cells were used for each scan. Circular Dichroism
(CD) experiments were carried out using a J-810 spectro-
polarimeter (Jasco Inc., Easton, MD).
Steady state fluorescence and fluorescence anisotropy
were recorded using a double-monochromator fluorimeter
(AB2, Thermo Scientific, Waltham, MA). Spectra were
recorded at a speed of 1 nm/s and spectral resolution of
4 nm in both emission and excitation.
Fluorescence lifetime was carried out using an IBH
5000U instrument (Horiba JobinYvon, Edison, NJ). The
fluorescence decay of TPPS was recorded upon excitation
with a pulsed diode laser at 405 nm (NanoLED-405L,
pulsewidth * 150 ps); the fluorescence decay of BLGA
was recorded upon excitation with an LED source at 295 nm
(NanoLED-295, pulsewidth & 750 ps). Both sources are
manufactured by IBH Ltd. (Glasgow, UK) and are operated
at a repetition rate of 1 MHz.
2.4 Methods
2.4.1 Fluorescence of TPPS
The fluorescence spectra of the porphyrin as a function of
the addition of the protein were analyzed using Gaussian
fitting of the spectra as reported in detail in a previous
manuscript [17]. In summary, each spectrum of the tetra-
anion TPPS4- was analyzed according to.
IðkÞ ¼ Afe�ðk�Kf Þ2
Df þ Abe�ðk�KbÞ2
Db þX
j
Aje�ðk�KjÞ2
Dj ð1Þ
where I(k) is the overall fluorescence spectrum, Af and Ab are
proportional to the concentration and the emission quantum
yield of the free and bound porphyrin, respectively, and Kf
and Kb are the peak position of the free and bound Gaussian,
respectively [17], calculated for the Q0(0,0) peak [20, 21]
(Fig. 1). The last summation of Eq. 1 fits the region of the
Q0(0,1) peak [20, 21] (Fig. 1), which is less sensitive to the
binding of porphyrins to proteins and is produced by an
unknown number of bands. This assumption enabled us to fit
the emission spectra with a minimum number of Gaussian
components [17]. The quality of the fitting was determined
by visual inspection and by using the value of the reduced v2.
The amplitude of each Gaussian yields the products
Uf[porphyrin]f and Ub[porphyrin]b [17].
In order to determine the binding parameters we
assumed the modified Hill model [13] which after the
introduction of the Gaussian fitting becomes [17]
½TSPP�b½TSPP�Tot
¼ cðK½BLGA�Þn
1þ ðK½BLGA�Þn ð2Þ
where the parameter n represents the Hill coefficient [24,
25], [TPPS]b and [TPPS]Tot are the concentrations of bound
and the maximum concentration of bound TPPS4-,
respectively, under the conditions of the experiments, K is
the equilibrium binding constant and c is a function of the
emission quantum yield for free and bound ligands. The
non-linear fitting of Eq. 2 yields the values of K and n, c.
2.4.2 Stern–Volmer (S–V) analysis
We assumed that quenching of BLGA fluorescence by
TPPS4- is due to the binding between the two molecules;
thus static quenching is responsible for the decrease of
protein fluorescence upon addition of TPPS4-. Stern–
Volmer analysis for static quenching predicts that the ratio
F0/F between the fluorescence of BLGA in the absence of
TPPS (F0) and the fluorescence of BLGA in the presence of
TPPS (F), is, for small amounts of quencher, a linear
function of the concentration of the ligand [26]
F0
F¼ 1þ K½TSPP� ð3Þ
where both F0 and F are corrected for the absorption at the
excitation wavelength as well as the potential filter effects
with the equation [26]
F ¼ 10AexþAem
2 Fraw ð4Þ
In this case Fraw is the uncorrected emission intensity and
Aex and Aem are the optical densities of the sample at the
excitation and the maximum of the emission wavelength,
respectively.
The slope obtained from the linear regression of F0/F vs.
[TPPS] provides the static quenching constant, K, which in
An Anionic Porphyrin Binds b-Lactoglobulin A 3
123

the case of ground state quenching reduces to the equilib-
rium binding constant. However, since the BLGA dimer is
a multi-Trp complex (two residues per BLGA monomer), it
is necessary to establish the fraction of fluorescence
quenching induced by binding of TPPS4- in order to cor-
rect the values of F0 and F in Eq. 3. Static quenching
theory assumes that the formation of a chromophore-
quencher ground state complex eliminates the fluorescence
contribution of the complex from the fluorescence signal
[26]. If the fluorescent molecule is a multi-Trp protein,
binding of a ligand may quench some but not all of the Trp
residues in the protein. Thus a residual fluorescence is left
from the protein-quencher complex that, if unaccounted,
would lead to an underestimate of the binding constant
[27]. The fraction of BLGA fluorescence quenched by
binding of TPPS4- was retrieved by applying and
extending the classic method introduced by [28] since,
formally, the linearity of Eq. 3 is true for both static and
dynamic quenching. In this case we have considered m
independent Trp residues each contributing F0i, to the
overall emission intensity, proportional to the quantum
yield U0i. Therefore, the fluorescence quantum yield in the
absence of quencher (TPPS4-) can be written as
U0 ¼1
m
Xm
i¼1
U0i ð5Þ
Upon addition of the quencher (Q), the fluorescence
detected is [28]
U ¼ 1
m
Xm
i¼1
U0i
1þ KiðQÞð6Þ
where Ki is the static quenching constant for each Trp
residue. From Eqs. 5 and 6
U0 � U ¼ DU ¼ 1
m
Xm
i¼1
U0iKiðQÞ1þ KiðQÞ
ð7Þ
and
U0
DU¼Xm
i¼1
1þ KiðQÞU0iKiðQÞ
ð8Þ
So if we assume that the BLGA–TPPS4- complex
quenches only a fraction of accessible Trp residues (i.e.,
Trp residues in close proximity to the porphyrin), then for
those Trp residues that are not quenched Ki = 0 and Eq. 8
can be simplified to [28]
0
0.2
0.4
0.6
0.8
1
600 650 700 750
Wavelength (nm)
Q'(0,0)Q'(0,0)
Q'(0,1)
0
0.2
0.4
0.6
0.8
1
Wavelength (nm)
0
0.2
0.4
0.6
0.8
1
Wavelength (nm)
0
0.2
0.4
0.6
0.8
1
Wavelength (nm)
600 650 700 750
600 650 700 750
No
rmal
ized
Flu
ore
scen
ce In
ten
sity
No
rmal
ized
Flu
ore
scen
ce In
ten
sity
No
rmal
ized
Flu
ore
scen
ce In
ten
sity
No
rmal
ized
Flu
ore
scen
ce In
ten
sity
600 650 700 750
(a) (b)
(d)(c)
Fig. 1 Fluorescence of TPPS4-
and Gaussian fitting of the
spectra upon addition of BLGA.
Solid black corrected emission
spectrum; dashed red fitting
from Eq. 1; dotted blackGaussian of free TPPS4-; solidred Gaussian of bound TPPS4-;
dotted green, dotted orange,
dotted blue Gaussians of the last
term of Eq. 1. a pH 6,
[BLGA] = 0.13 lM; b pH 6,
[BLGA] = 2.30 lM; c pH 9,
[BLGA] = 0.13 lM; a pH 9,
[BLGA] = 2.30 lM. The plot
shows that at increased
concentration of BLGA the
Gaussian associated with bound
TPPS4- increases relative to the
one associated with the free
porphyrin. The increase is
similar at pH 6 and 9 thus, it is
not affected by the
conformational transition of the
protein. In (a) the two emission
peaks are labeled according to
Refs. [22, 23]
4 I. Silva et al.
123

U0
DU¼ 1
aKQðQÞþ 1
að9Þ
where a is the fraction of Trp residues proximal (quenched)
to the bound TPPS4- and KQ is the quenching constant
assumed to be identical for all Trp residues. In multi-Trp
proteins this assumption may be often considered an
oversimplification; however, in BLG this condition may be
realistic. Of the two Trp residues in each monomer, it has
been shown that Trp61 does not contribute to the fluores-
cence of the protein, likely because of its proximity to the
Cys66–Cys160 disulfide bond [19, 29]. Therefore, in each
monomer only Trp19 contributes to the emission which
implies that only two Trp resides contribute to the fluo-
rescence in each dimer.
Since U and the corrected fluorescence of Eq. 4 are related
by an instrumental multiplication constant which cancels out
in the left-hand side ratio of Eq. 9, this equation can be
employed to obtain the corrected fluorescence of Eq. 3 as
F0
aF¼ 1þ K½TSPP� ð10Þ
where a operates as a correction factor due to the fact that
the BLGA/TPPS4- complex may retain residual fluores-
cence. As a result, without the correction by a the
fluorescence F would be overestimated and the value of K
would be underestimated.
2.4.3 Fluorescence Resonance Energy Transfer
The occurrence of fluorescence resonance energy transfer
between Trp and TPPS4- was probed qualitatively, using
fluorescence excitation and emission spectroscopy [3], as
well as quantitatively, using fluorescence lifetime to
establish FRET efficiency [30]. Because of the artifact
introduced by static quenching in the emission and exci-
tation spectra [3], fluorescence lifetime is more reliable in
establishing FRET efficiency.
2.4.4 Fluorescence Anisotropy
Steady-state fluorescence anisotropy was recorded by
selecting the excitation light and the emitted fluorescence
with manually rotating polarizers and recording the emis-
sion spectra of TPPS and the BLGA/TPPS complex at
various temperatures. The anisotropy was calculated
according to [31]
r ¼ IVV � GIVH
IVH � 2GIVH
ð11Þ
where I is the intensity of the emission (integral of the
spectrum) and the subscripts indicate, in spatial order, the
orientation of the excitation and emission polarizers
(V, vertical, H, horizontal). G is the factor that accounts
for the differential sensitivity of the instrument to light
polarized parallel and perpendicular, and is calculated as
G ¼ IHV
IHH
ð12Þ
Each value of intensity was calculated as the average of
three spectra. By varying the temperature of the sample
(using a circulating water bath connected to the water-
jacketed sample holder of the fluorimeter) we retrieved
data for the Perrin equation
1
r¼ 1
r0
þ sRT
gVr0
ð13Þ
which yields the value of the limiting anisotropy (r0) and
the hydrodynamic volume of the rotating molecule (V),
when plotting 1/r vs. T/g ratio between the temperature of
the solution and the viscosity of the medium [26]. R is the
gas constant. The Perrin equation was used to retrieve V
and establish, whether BLGA formed aggregates (larger
than the dimer) either alone or induced by the binding of
TPPS4-.
2.4.5 Effects of Urea
The effects of TPPS on the stability of BLGA was inves-
tigated using the dissociation coupled unfolding model
(DCU) proposed for BLG [32]. According to the model the
free energy of denaturation is calculated as DGDCU =
- RT ln KDCU, where KDCU is given by
KDCU ¼ 4½BLGA� F2D
1� FD
ð14Þ
and FD is the fraction of denaturated protein calculated as
FDEN ¼Y � Ymin
Ymax � Ymin
ð15Þ
where Y is an observed property of the protein [32] which
in this case is the position of the emission maximum, as a
function of urea. The standard free energy of denaturation
extrapolated at zero urea concentration is derived from the
equation
DGDCU ¼ DG0DCU � m½urea] ð16Þ
where m is the denaturant index [33].
2.4.6 Docking Simulations
Docking simulations were carried out using the software
package Arguslab 4.0 (Planaria Software Inc., Seattle,
WA). The TPPS4- structure, generated and optimized with
Chimera (University of California San Francisco) [34], was
docked to one of the available structures of BLG dimers
An Anionic Porphyrin Binds b-Lactoglobulin A 5
123

obtained from the Protein Data Bank (1BEB.pdb). The
protein was stripped of the water molecules encoded in the
structure. The porphyrin ligand was ‘‘manually’’ brought
into the vicinity of a possible binding site and the docking
computation was carried out using different initial orien-
tations of TPPS4-. Several possible binding sites on each
monomer as well as at the monomer/monomer interface
were probed.
3 Results
3.1 Absorption Spectroscopy
At all pH values the addition of BLGA to a stock solution
of TPPS4- produces a small bathochromic shift of the
Soret band (from 413 to 416 nm) and simultaneous hypo-
chromicity (Fig. 2). The same effect occurs at every pH
probed in this study. In agreement with what was suggested
by previous results [13] there is no evidence for the for-
mation of J-aggregates of TPPS4- (appearance of a band
near 490 nm) either before or after the addition of the
protein. Moreover, there is no clear shift of the Q-bands
induced by the presence of BLGA [16].
3.2 Fluorescence of TPPS4- bound to BLGA
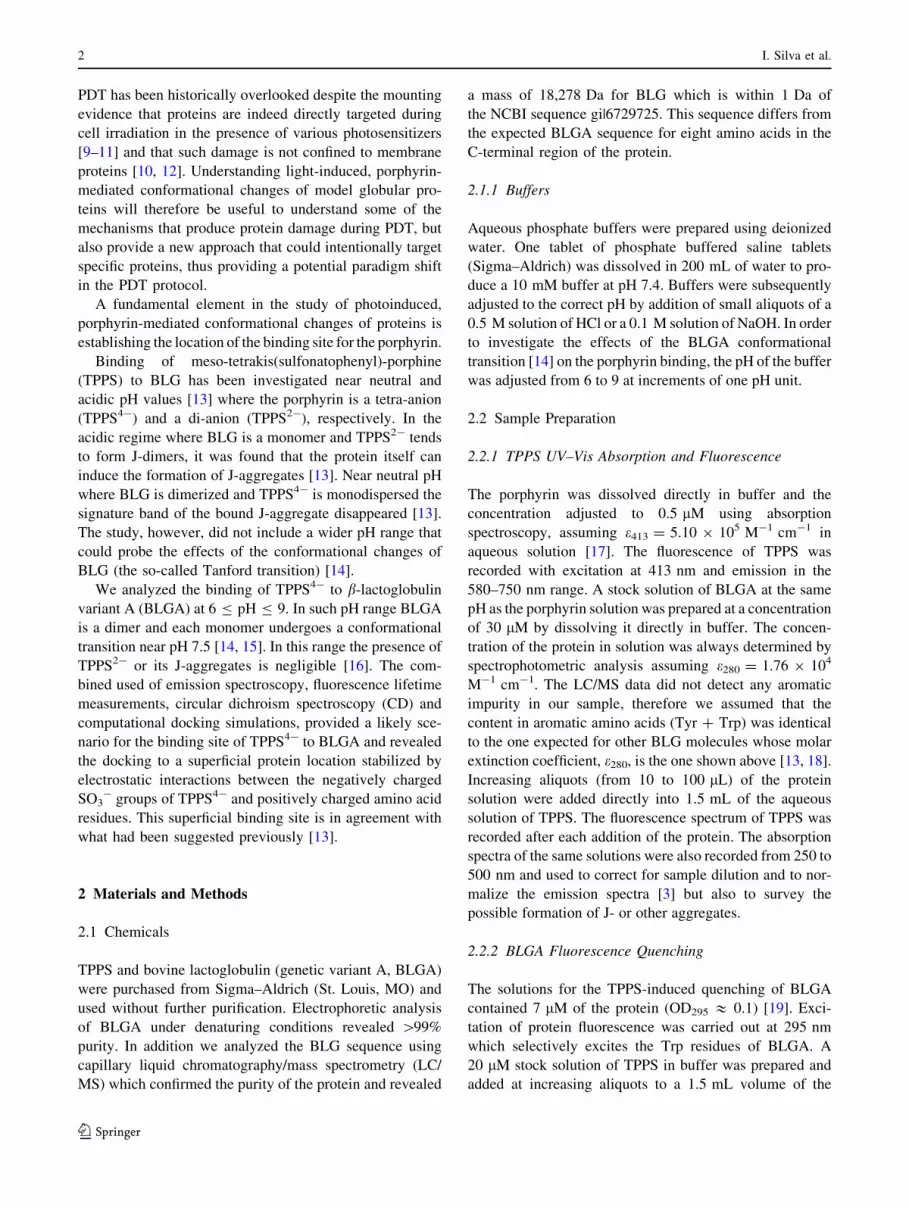
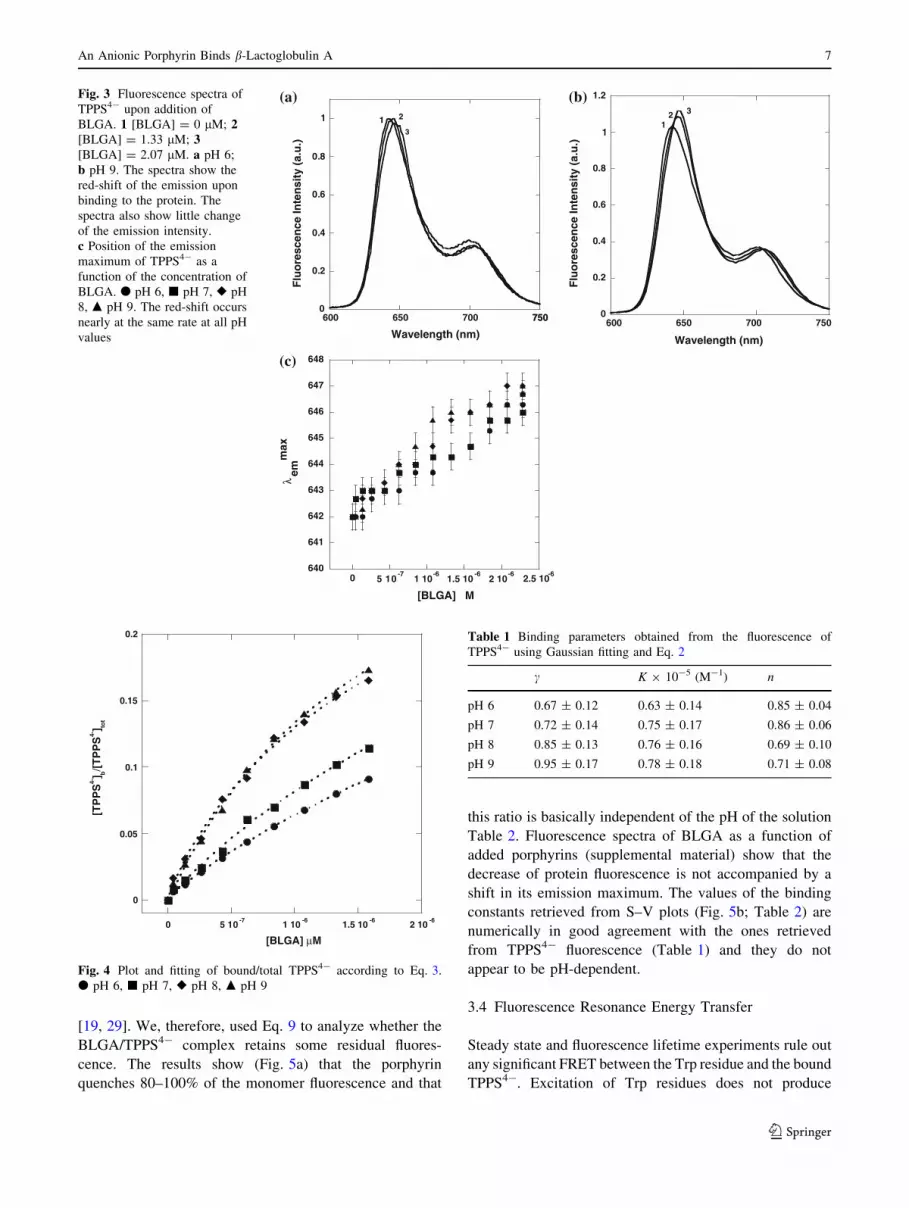
At all pH values the addition of BLGA prompts a shift of
the emission maximum to longer wavelengths (Fig. 3a, b).
Such shift is larger ([4 nm) and occurs much earlier than
the one observed in absorption (Fig. 2). The red-shift is
more pronounced at higher pH values (Fig. 3c).
However, Fig. 3a, b also show that the normalized and
corrected intensity of the TPPS4- emission, changes only
slightly in the presence of BLGA. Such small change
would not allow the application of fluorescence intensity
methods to establish the amount of bound porphyrin [35,
36]. Therefore, the contribution of free and bound por-
phyrin to the emission spectrum must be retrieved via
Gaussian analysis of the emission spectra with Eq. 1
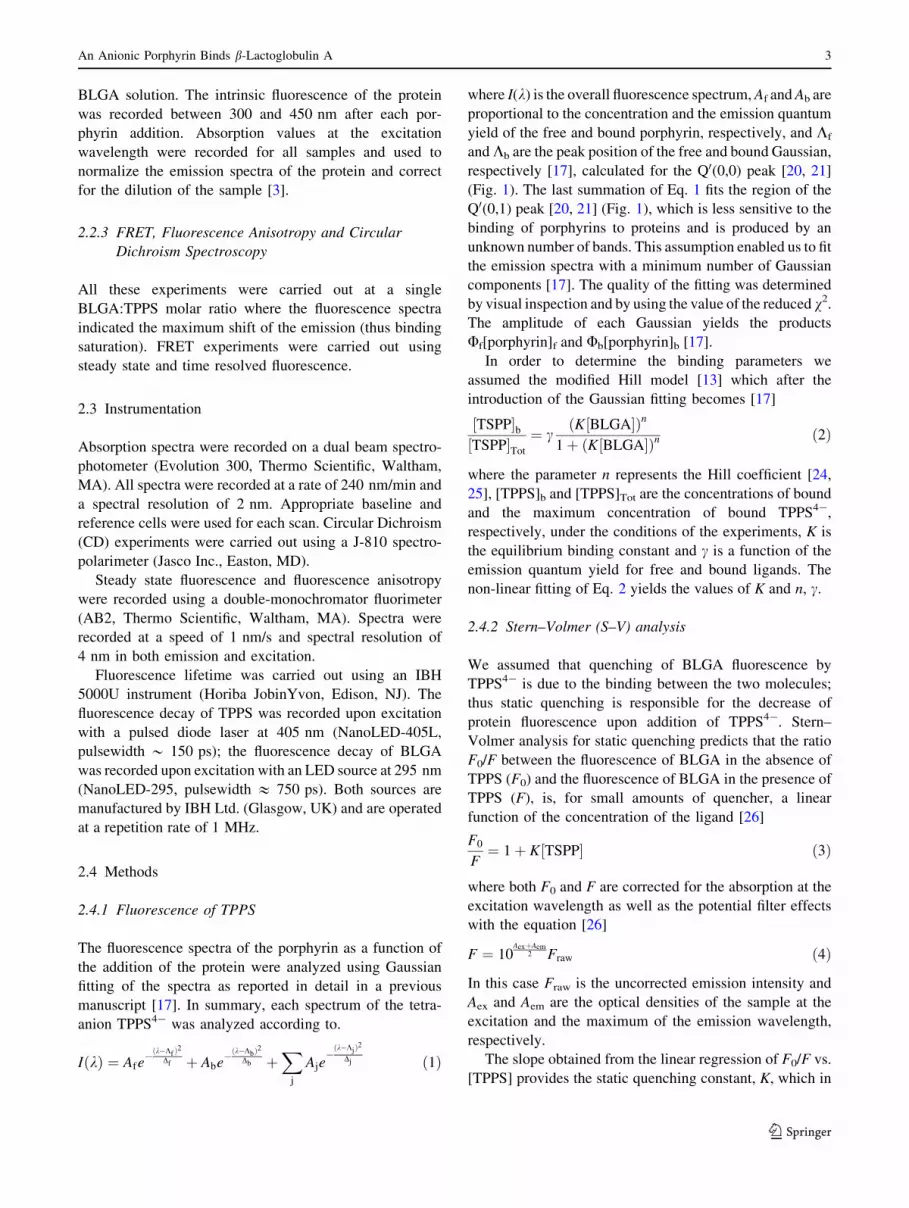
(Fig. 1). The plots of [TPPS4-]b/[TPPS4-]Tot vs. [BLGA]
obtained from the Gaussian fitting show the relative
increase of the fraction of bound porphyrin (Fig. 4). The
range of protein and TPPS concentration has to be kept
relatively low because of the restriction on the optical
density (O.D.) of the samples imposed by the fluorescence
method; in particular, signal linearity requirements impose
that the O.D. at the excitation wavelength be \0.2. Nev-
ertheless, fitting of the isotherms in Fig. 4 with Eq. 2,
yields an estimate of the binding constant, K, the coeffi-
cient n, and the factor c, which are summarized in Table 1.
The data show that the binding constant increases by
approximately 20% with increasing pH. The value of n
remains \1 at all pH values, indicating a negative coop-
erativity, and decreases by about 16% as the pH increases.
A student’s t-test analysis reveals that differences in the
value of K between pH are not statistically significant
(p-value C 0.2). Similarly, an analysis of the value of n
reveals that, although its decrease with increasing pH is
consistent with electrostatic surface binding of TPPS4 [37],
the differences in its value at various pH are not statisti-
cally significant (p-value C 0.1). Thus we are led to
conclude that that approximately one TPPS molecule binds
to each BLGA unit and that the binding constant is
approximately constant across the range of pH.
A large increase with the pH occurs in the value of c(Table 1). This factor depends on the emission quantum
yields for bound and free TPPS4-. Individual quantum
yields for free and bound porphyrins at various pH values
could not be experimentally calculated and are not avail-
able from the literature; therefore, our fitting only indicates
that the large change in the binding isotherm of Fig. 4 is
due to changes of the emission quantum yields of the free
and bound porphyrin at the different pH values.
3.3 Quenching of BLGA by TPPS
Each BLGA monomer has two Trp residues, thus each
BLGA dimer has potentially four Trp residues that can be
quenched. The contribution of each residue to BLGA
fluorescence is still under debate but some convincing
studies suggested that only Trp19 at the bottom of the
interior barrel contributes to the fluorescence of the protein
0
0.05
0.1
0.15
0.2
350 400 450 500
Wavelength (nm)
Op
tica
l Den
sity
Fig. 2 Absorption spectra of TPPS4- upon addition of BLGA. Black[BLGA] = 0 lM; Red [BLGA] = 0.73 lM; Blue [BLGA] =
2.48 lM; Green [BLGA] = 4.02 lM; Yellow [BLGA] = 5.5 lM
6 I. Silva et al.
123
[19, 29]. We, therefore, used Eq. 9 to analyze whether the
BLGA/TPPS4- complex retains some residual fluores-
cence. The results show (Fig. 5a) that the porphyrin
quenches 80–100% of the monomer fluorescence and that
this ratio is basically independent of the pH of the solution
Table 2. Fluorescence spectra of BLGA as a function of
added porphyrins (supplemental material) show that the
decrease of protein fluorescence is not accompanied by a
shift in its emission maximum. The values of the binding
constants retrieved from S–V plots (Fig. 5b; Table 2) are
numerically in good agreement with the ones retrieved
from TPPS4- fluorescence (Table 1) and they do not
appear to be pH-dependent.
3.4 Fluorescence Resonance Energy Transfer
Steady state and fluorescence lifetime experiments rule out
any significant FRET between the Trp residue and the bound
TPPS4-. Excitation of Trp residues does not produce
0
0.2
0.4
0.6
0.8
1
600 650 700 750
Wavelength (nm)
11 2
3
0
0.2
0.4
0.6
0.8
1
1.2
12 3
Wavelength (nm)
640
641
642
643
644
645
646
647
648
0 5 10-7
750
1 10-6
1.5 10-6
2 10-6
2.5 10-6
[BLGA] M
Flu
ore
scen
ce In
ten
sity
(a.
u.)
Flu
ore
scen
ce In
ten
sity
(a.
u.)
600 650 700 750
emm
axλ
(a) (b)
(c)
Fig. 3 Fluorescence spectra of
TPPS4- upon addition of
BLGA. 1 [BLGA] = 0 lM; 2[BLGA] = 1.33 lM; 3[BLGA] = 2.07 lM. a pH 6;
b pH 9. The spectra show the
red-shift of the emission upon
binding to the protein. The
spectra also show little change
of the emission intensity.
c Position of the emission
maximum of TPPS4- as a
function of the concentration of
BLGA. d pH 6, j pH 7, r pH
8, m pH 9. The red-shift occurs
nearly at the same rate at all pH
values
0
0.05
0.1
0.15
0.2
0 5 10 -7 1 10 -6 1.5 10 -6 2 10 -6
[BLGA] µM
[TP
PS
4-] b
/[T
PP
S4-] to
t
Fig. 4 Plot and fitting of bound/total TPPS4- according to Eq. 3.
d pH 6, j pH 7, r pH 8, m pH 9
Table 1 Binding parameters obtained from the fluorescence of
TPPS4- using Gaussian fitting and Eq. 2
c K 9 10-5 (M-1) n
pH 6 0.67 ± 0.12 0.63 ± 0.14 0.85 ± 0.04
pH 7 0.72 ± 0.14 0.75 ± 0.17 0.86 ± 0.06
pH 8 0.85 ± 0.13 0.76 ± 0.16 0.69 ± 0.10
pH 9 0.95 ± 0.17 0.78 ± 0.18 0.71 ± 0.08
An Anionic Porphyrin Binds b-Lactoglobulin A 7
123

emission by the ligands and, likewise, excitation spectra
recorded at the maximum of the emission wavelength of the
porphyrin do not show any contribution from Trp. Fluo-
rescence decay experiments also reveal that there is no
change in BLGA emission lifetime upon addition of
TPPS4-. Such result is also in strong support of the occur-
rence of static quenching due to binding of the porphyrin to
the protein. Lack of FRET is consistent with what had been
observed in other systems [3, 17] and is a direct consequence
of the very small overlap between the emission spectrum of
BLGA and the absorption spectrum of TPPS4-.
3.5 Circular Dichroism
At all pH values, CD experiments in the region of the Soret
band did not show any optical activity of TPPS4- which
indicates that binding to BLGA does not distort the struc-
ture of the porphyrin ring.
At the same time the binding of the porphyrin did not
produce any change in the dichroic signal of BLGA either
in the region of the aromatic amino acids (260–320 nm) or
in the region of the amide (180–250 nm).
3.6 Effects of Urea
In order to probe whether the porphyrin binds to sites at the
monomer/monomer interface we studied the effects of the
addition of urea to solutions containing the BLGA/TPPS4-
non-covalent complex. It is known that, within a certain
range of urea concentrations, which depends on the pH of
the solution [32], BLGA dimers dissociate without any
appreciable change in the tertiary structure of the individual
monomers [32]. Thus if TPPS4- binds to the dimer at the
interface between the two monomers, the addition of urea
may cause the porphyrin to return in solution upon disso-
ciation of the dimers. This in turn would cause the emission
maximum of the porphyrin to blue-shift towards the position
of free TPPS4-. Our results, however, show (Fig. 6) that
addition of urea up to 8 M (a concentration where urea is
known to partially unfold the monomeric form of BLGA
[32, 38]) does not cause any shift of fluorescence of BLGA-
bound TPPS4-. Addition of the same aliquots of urea to
solutions containing only TPPS produced only a slight
(2 nm) red-shift of the emission of the porphyrin, probably
due to the sequestration of water molecules by urea. Since
the red-shift resulting from binding to BLG is 7 nm, the lack
of blue-shift of BLG-bound TPPS upon addition of urea
indicates that TPPS4- remains attached to the protein even
when this is partially unfolded.
The dissociation and unfolding of BLGA at increasing
urea concentration was probed by the red-shift and the
increase in intensity of the intrinsic fluorescence of the
protein [19] (supplemental material).
The comparison of urea-induced denaturation of BLGA
alone and BLGA in the protein/porphyrin complex shows
that the presence of bound TPPS4- stabilizes BLGA, as the
sigmoidal transition to the unfolded state appears to be
delayed (Fig. 7a, b). Calculation of DG0DCU and m with
Eq. 16 produces the values shown in Table 3. By com-
parison with the data obtained in the absence of TPPS4- it
can be seen that while the denaturant index, m, remains
virtually unchanged, DG0DCU of the BLGA/porphyrin
complex increases, at all pH values. The increased stability
2
4
6
8
10
2 105
4 105
6 105
8 105
1 106
1/[TPPS] M-1
1
1.2
1.4
1.6
1.8
0 1 10-6 2 10-6 3 10-6 4 10-6 5 10-6 6 10-6 7 10-6
[TPPS] M
F0/∆
F
F0/F
(a) (b)Fig. 5 a Plot F0/DF according
to Eq. 10 (model of
fractional quenching of [32]).
b Stern–Volmer plot of BLGA
fluorescence corrected
according to Eq. 11. d pH 6,
j pH 7, r pH 8, m pH 9
Table 2 BLGA fluorescence quenching. Fraction of quenched fluo-
rescence and binding constant obtained from Eqs. 9 and 10
a K 9 10-5 (M-1)
pH 6 0.89 ± 0.09 1.56 ± 0.33
pH 7 1.10 ± 0.05 1.10 ± 0.25
pH 8 0.91 ± 0.03 1.37 ± 0.29
pH 9 0.96 ± 0.08 1.14 ± 0.18
8 I. Silva et al.
123

against denaturation induced by binding of TPPS4- is
larger at smaller pH (Fig. 7c).
3.7 Fluorescence Anisotropy
Perrin plots from Eq. 13 are linear and show, as expected, a
steeper slope for free TPPS than for the BLGA/TPPS
complex at all pH (Fig. 8a, b). From the slope of the plot
and upon measurements of free and bound TPPS fluores-
cence lifetime (9.8 and 11 ns, respectively) we estimated
the radius of the free ligand to be\1 nm and the radius of
the complex to be 2.5–3 nm. The radius of the BLGA/
TPPS complex is in excellent agreement with the size of
the BLGA dimer reported by others [39, 40]. This in turn
confirms that in the pH and concentration range investi-
gated, binding of TPPS4- does not induce aggregation of
BLGA.
3.8 Docking Simulations
A survey of the BLGA dimer structure (PDB file 1BEB.pdb)
provides several potential binding sites for TPPS4-. There
are several Lys and Arg residues on the surface as well as in
0
0.5
1
1.5
600 650 700 750
Wavelength (nm)
[urea] = 0 M
[urea] = 2 M
[urea] = 4 M
[urea] = 6 M
[urea] = 8 M
Flu
ore
scen
ce In
ten
sity
Fig. 6 Fluorescence of TPPS4- in the protein/porphyrin complex as
a function of urea concentration. The spectra are normalized and
offset with respect to each other to show that the emission maximum
of bound TPPS4- is not affected by the addition of up to 8 M urea
0
0.2
0.4
0.6
0.8
1
-2 0 2 4 6 8 10
[urea] M
1
1.1
1.2
1.3
1.4
1.5
5.5 6 6.5 7 7.5 8 8.5 9 9.5
pH
0
0.2
0.4
0.6
0.8
1
-2 0 2 4 6 8 10
[urea] M
FD
EN
FD
EN
∆G0 D
CU(B
LG
A/T
PP
S4-
)/∆G
0 DC
U(B
LG
A)
(a)
(c)
(b)Fig. 7 Denaturation curves.
FDEN calculated according to
Eq. 18 using the wavelength of
the emission maximum as the
parameter Y. a pH 7: d BLGA/
TPPS4- complex, s BLGA
alone; b pH 9: d BLGA/
TPPS4- complex, s BLGA
alone. The data are
representative of the trend at the
other pH values. c Relative
increase of DGDCU induced by
the presence of bound TPPS4-
as a function of pH
An Anionic Porphyrin Binds b-Lactoglobulin A 9
123

the grove formed between the 3-turn helix and the outside of
the b-barrel [14, 22, 41]. In addition we investigated the
docking at intradimeric sites on the side of the 3-turn helices
as well as on the side of the aperture of the barrel [42]. We
attempted the docking to all these locations by approaching
TPPS4- at different orientations to each site. Our results
show that there is no stable binding configuration for either
the interior of the b-barrel or the outside grove. In addition,
docking at the monomer-monomer interface did not yield
stable binding configurations.
Our docking computation revealed that the most likely
binding site for TPPS4- is on the surface of BLGA at a
location which involves a near interdigitation of three of
the four SO3- groups of TPPS4- and the positively charged
side chains of Lys14, Lys47, Lys100 and Arg124 (Fig. 9a).
This location also places the ligand in proximity (*7.2 A´
)
of the fluorescent Trp19 residue (Fig. 9b) which would
explain the static quenching produced by the binding of
TPPS4- to BLGA. Thus, the computed binding site
involves regions that include the N-terminus, the B-strand,
the FG-loop, and the loop between strand I and the 3-turn
a-helix [14, 41]. Because of the large number of surface
Arg and Lys it is likely that other surface regions may also
offer docking sites to the porphyrin.
Table 3 Thermodynamic
parameters for the urea-induced
unfolding of BLGA in the
complex with TPPS4- and alone
at different pH values
m BLGA/TPPS4-
complex
m BLGA alone DG0DCU (kJ/mol)
BLGA/TPPS4- complex
DG0DCU (kJ/mol)
BLGA alone
pH 6 6.38 ± 0.52 4.44 ± 0.91 74.4 ± 4.1 51.1 ± 5.1
pH 7 4.46 ± 0.78 2.86 ± 0.40 53.3 ± 4.5 38.0 ± 4.3
pH 8 3.38 ± 0.42 2.79 ± 0.27 45.3 ± 4.3 35.8 ± 4.5
pH 9 2.53 ± 0.61 2.53 ± 0.22 40.1 ± 4.0 34.8 ± 5.0
3.2
3.4
3.6
3.8
4
4.2
4.4
2.5 104
3 104
3.5 104
4 104
4.5 104
5 104
5.5 104
6 104
6.5 104
pH 9
3.2
3.4
3.6
3.8
4
4.2
4.4
4.6
4.8
2.5 104
3 104
3.5 104
4 104
4.5 104
5 104
5.5 104
6 104
6.5 104
T/η (K/Pa) T/η (K/Pa)
1/r
1/r
(a) (b)Fig. 8 Perrin plots of the steady
state fluorescence anisotropy
(Eq. 16). a pH 6: d BLGA/
TPPS4- complex, j TPPS4-
alone; b pH 9: d BLGA/
TPPS4- complex, j TPPS4-
alone. The data are
representative of the trend at the
other pH values and show a
larger slope for TPPS alone than
for the porphyrin bound to the
proteins
Fig. 9 Simulation of the
docking of TPPS4- to BLGA. aThe most stable docking
configuration produces TPPS4-
(red) laying flat on the surface
of BLGA with its four SO3-
groups interacting with Lys
(yellow) and Arg (blue)
positively charged residues. bDifferent view of the same
binding site which shows that
TPPS4- (red) is \8 A´
away
from the indole ring of Trp19
(blue)
10 I. Silva et al.
123

4 Discussion
Despite its solubility in aqueous solutions, it had been
previously established that TPPS is able to bind small
globular proteins such as BLG and tubulin [13, 17]. This
investigation introduces, however, the analysis of the
effects of the pH-dependent conformational changes of
BLG [14, 15] on the binding of TPPS4- and establishes a
possible location for the docking of the porphyrin.
Assuming that the contribution of TPPS2- is negligible in
the pH range investigated (the pKa for TPPS is \4.5 [16,
43]), we considered TPPS4- as the only significant ligand.
First of all our results show that for 6 B pH B 9 there is
no formation of the porphyrin J-aggregate either before
binding or induced by BLGA.
The binding parameters obtained from the fluorescence
of the porphyrin and the quenching of the protein
(Tables 1, 2) show that the numerical values of K
retrieved from S–V plots (Fig. 5b) is higher than the one
obtained from the curves of Fig. 4. If the data obtained
with the two methods are compared with a student’s
t-test, the analysis reveals that 0.05 B p B 0.09. Although
the difference can be considered somewhat statistically
significant, one has to consider the very small sampling
associated with our measurements which makes the dif-
ferences between the values of K retrieved with the two
methods, difficult to interpret. Therefore, we can assume
that the data obtained from TPPS fluorescence and BLGA
quenching (with Eqs. 2, 10, respectively) yield the same
qualitative results that the affinity of the porphyrin for
BLGA does not change with the pH of the solution. Since
across the pH range probed with this study, BLGA
undergoes a major conformational change that involves
the access to the interior protein pocket (b-barrel) [14],
our results rule out that the pocket, or its proximity,
represents a binding site for the porphyrin. This is
somewhat expected since the insertion of one or more
SO3- substituents into the hydrophobic pocket would
carry a very unfavorable entropic contribution [14, 44].
The unsuitability of this site as a binding location for
TPPS4- is also confirmed by the absence of stable
binding configurations in our docking simulations inside
or in proximity of the interior pocket of the protein.
Possible alternative binding sites could be present on
both sides of the ‘‘seam’’ at the monomer/monomer inter-
face of the BLGA dimer [42]. However, our experimental
and computational data rule this site out. Urea experiments
show (Fig. 6) that even upon substantial denaturation of the
protein, the porphyrin remains attached to BLGA, thus
ruling out that the separation of the two monomers deta-
ches the porphyrin from the protein. In agreement with this,
computational docking did not yield any stable binding
conformation at the monomer/monomer interface.
All our experimental results instead seem to point in the
direction of a superficial site. The fact that the pH does not
affect binding constant of TPPS4- is in agreement with
such model. Because of the small size of BLGA, if the
binding site is not inside or in proximity of the aperture of
the interior barrel, then the binding possibilities for a rel-
atively large ligand, such as TPPS4- (Fig. 9), is limited.
Since our computational docking simulations rule out
binding to the grove formed between the outside of the
barrel and the 3-turn a-helix, the remaining binding sites
are on the surface of the protein. A superficial binding site
is also consistent with the lack of dichroic signal from the
porphyrin. The lack of CD signal signifies that the ring of
the porphyrin remains substantially undistorted as it would
if the whole porphyrin laid on the surface of the protein.
The urea data (Fig. 6) also support a superficial binding site
since even extensive (albeit not total [32, 45]) unfolding of
BLGA does not prompt the release of TPPS4- in solution.
Such an effect would be unlikely if the porphyrin was
bound to a ‘‘fold’’ or a pocket of the protein through non-
Coulombic interactions.
How would TPPS4- bind to the surface of BLGA? In
fact, why should a water soluble porphyrin such as TPPS4-
bind to a protein in the first place? We have shown that the
same porphyrin binds another, larger, globular protein
(tubulin) also at the surface [17] and that such interaction is
stabilized by the Coulombic interaction between one of the
SO3- groups and positively charged amino acids (His and
Arg in that case [17]). Thus we suggest that the interaction
between TPPS4- and BLGA occurs through Coulombic
interactions between the positively charged amino acids on
the surface of the protein and the negatively charged
groups on the porphyrins. Such interaction would substitute
the weaker ion-dipole interaction between the SO3- groups
and water molecule (solvation), thus explaining why a
water-soluble ligand would bind a protein in aqueous
solution. Even a substantial denaturation of the protein
would still keep the porphyrin ‘‘sticking’’ to the surface of
the protein since urea does not affect the protonation of
amino acid residues.
This scenario would also explain why the fitting with
Eq. 2 yields values of n \ 1. BLGA is not a specific
‘‘receptor’’ for TPPS thus, one would expect a set of n-
independent, non-interacting binding sites for the porphyrin
(i.e., there is no reason, and no CD evidence that BLGA
changes its conformation upon binding of one TPPS mol-
ecule to accommodate or inhibit the binding of additional
porphyrin molecules). One would expect a value of n = 1
according to the Hill theory of cooperative binding [46]. A
value of n \ 1, however, indicates some degree of coop-
erativity but because there is no evidence to support the
presence of interacting sites for TPPS4-, a likely explana-
tion for the values of n is that the binding of one porphyrin
An Anionic Porphyrin Binds b-Lactoglobulin A 11
123

molecule to the surface of the protein leads to a decrease of
the available surface charges and effectively reduces the
probability of binding of additional TPPS4- molecules.
Finally, the superficial binding is confirmed by our
docking simulations (Fig. 9a) which place the negative
groups of the porphyrin in close proximity (in fact almost
perfectly interdigitated) with positively charged amino
acids such as Lys and Arg residues. Although, as explained
above at the pH values of our experiments both molecules
carry an excess of negative charge, it is very likely that
many of the basic amino acids, Lys and Arg in particular,
still carry a net positive charge [23] making the interaction
with TPPS4- possible.
According to our anisotropy data (Fig. 8) the electro-
static ‘‘shielding’’ provided by the binding of TPPS4- is
not sufficient to cause aggregation of BLGA as seen
instead for other proteins [47].
Finally a superficial binding site such as the one sug-
gested in this work would explain also the stabilization
effect that TPPS4- produces on BLGA. The delay in the
urea-dependent unfolding and the higher free energy of
unfolding (Fig. 7) can be explained by the fact that TPPS4-
could act like ‘‘glue’’, linking different domains of the
protein [e.g., the N-terminus, the B-strand, the FG-loop,
and the loop between strand I and the 3-turn a-helix
(Fig. 9)]. The Coulombic interactions between the negative
porphyrin and the positive amino acid residues would
stabilize this region and as a consequence the whole protein
against urea denaturation. At lower pH values the anionic
porphyrin would be more effective in stabilizing the pro-
tein as the surface of the polypeptide contains a larger
number of positively charged residues. As shown by the
data in Table 3 the increase in DG0 between the BLGA/
TPPS complex and BLGA alone is larger at smaller pH.
The difference in the values of DG0 between complex and
protein alone is statistically significant (p-value B 0.01) at
pH 6 and 7 while it becomes smaller and statistically
insignificant at pH 8 and 9 (p-value C 0.05). Thus is fur-
ther indication of the stabilization effect that tetra-anionic
TPPS produces on BLGA at low pH.
Acknowledgments The research was supported by the 2006 Faculty
Research Award of the University of Texas at San Antonio (to L.B.)
and by the AFRL/HE grant # FA8650-07-1-6850 (to L.B.). The
author would also like to thank Dr. Markandeswar Panda for the use
of the CD spectrometer.
References
1. Kuwata K, Hoshino M, Forge V, Era S, Batt CA, Goto Y (1999)
Prot Sci 8:2541–2545
2. Oliveira KMG, Valente-Mesquita VL, Botelho MM, Sawyer L,
Ferreira ST, Polikarpov I (2001) Eur J Biochem 268:477–484
3. Tian F, Johnson K, Lesar AE, Moseley H, Ferguson J, Samuel
IDW, Mazzini A, Brancaleon L (2005) Biochim Biophys Acta
1760:38–46
4. Fernandez NF, Sansone S, Mazzini A, Brancaleon L (2008)
J Phys Chem B 112:7592–7600
5. Kubelka J, Hofrichter J, Eaton WA (2004) Curr Opin Struct Biol
14:76–88
6. Lee CT Jr, Smith KA, Hatton TA (2005) Biochemistry 44:
524–536
7. Dougherty TJ, Gomer CJ, Henderson BW, Jori G, Kessel D,
Korbelik M, Moan J, Peng Q (1998) J Nat Canc Inst 90:889–905
8. Pope AJ, Bown SG (1991) Br J Urol 68:1–9
9. Castelli M, Reiners JJ, Kessel D (2004) Cell Death Differ
11:906–914
10. Tsaytler PA, O’Flaherty MC, Sakharov DV, Krijgsveld J,
Egmond MR (2008) J Proteome Res 7:3868–3878
11. Usuda J, Chiu SM, Murphy ES, Lam M, Nieminen AL, Oleinick
NL (2003) J Biol Chem 278:2021–2029
12. Kessel D (2002) Photochem Photobiol Sci 1:837–840
13. Andrade SM, Costa SMB (2002) Biophys J 82:1607–1619
14. Qin BY, Bewley MC, Creamer LK, Baker HM, Baker EN,
Jameson GB (1998) Biochemistry 37:14014–14023
15. Tanford C, Bunville LG, Nozaki Y (1959) J Am Chem Soc
81:4032–4036
16. Maiti NC, Ravikanth M, Mazumdar S, Periasamy N (1995)
J Phys Chem 99:17192–17197
17. Tian F, Johnson EM, Zamarripa M, Sansone S, Brancaleon L
(2007) Biomacromol 8:3767–3778
18. D’Alfonso L, Collini M, Baldini G (2002) Biochemistry 41:
326–333
19. Harvey BJ, Bell E, Brancaleon L (2007) J Phys Chem B
111:2610–2620
20. Bilsel O, Buchler JW, Hammerschmitt P, Rodriguez J, Holten D
(1991) Chem Phys Lett 182:415–421
21. Lang K, Mosinger J, Wagnerova DM (2004) Coord Chem Rev
248:321–350
22. Folgolari F, Ragona L, Zetta L, Romagnoli S, De Kruif KG,
Molinari H (1998) FEBS Lett 436:149–154
23. Fukamizo T, Juffer AH, Voge HJ, Honda Y, Tremblay H, Bou-
cher I, Neugebauer WA, Brzezinski R (2000) J Biol Chem
275:25633–25640
24. Coval ML (1970) J Biol Chem 245:6335–6336
25. Weiss JN (1997) FASEB J 11:835–841
26. Lakowicz JR (2006) Principles of Fluorescence spectroscopy, 3rd
edn. Springer, New York
27. Tatikolov AS, Costa SM (2004) Photochem Photobiol 80:250–256
28. Lehrer SS (1971) Biochemistry 10:3254–3263
29. Cho Y, Batt CA, Sawyer L (1994) J Biol Chem 269:11102–11107
30. Wu P, Brand L (1994) Anal Biochem 218:1–13
31. Chuang TJ, Eisenthal KB (1972) J Chem Phys 57:5094–5097
32. Galani D, Apenten RKO (1999) Food Res Internat 32:93–100
33. Eftink MR (1994) Biophys J 66:482–501
34. Pettersen EF, Goddard TD, Huang CC, Couch GS, Greenbl-
att DM, Meng EC, Ferrin TE (2004) J Comput Chem 25:1605–
1612
35. Collini M, D’Alfonso L, Baldini G (2000) Prot Sci 9:1968–1974
36. Horowitz P, Prasad V, Luduena RF (1984) J Biol Chem
259:14647–14650
37. Tulp A, Verwoerd D, Hard AA (1997) Electrophoresis 18:767–773
38. Hamada D, Dobson CM (2002) Protein Sci 11:2417–2426
39. Capron I, Nicolai T, Durand D (1999) Food Hydrocoll 13:1–5
40. Gottschalk M, Nilsson H, Roos H, Halle B (2003) Protein Sci
12:2404–2411
41. Brownlow S, Morais Cabral JH, Cooper R, Flower DR, Yewdall
SJ, Polikarpov I, North ACT, Sawyer L (1997) Structure 5:
481–495
12 I. Silva et al.
123

42. Fessas D, Iametti S, Schiraldi A, Bonomi F (2001) Eur J Biochem
268:5439–5448
43. Kelbauskas L, Bagdonas S, Dietel W, Rotomskis R (2003)
J Luminesc 101:253–262
44. Jameson GB, Adams JJ, Creamer LK (2002) Int Dairy J 12:
319–329
45. Busti P, Scarpeci S, Gatti C, DeLorenzi N (2002) Food Res
Internat 35:871–877
46. Dahlquist FW (1978) Methods Enzymol 48:270–299
47. Tominaga TT, Yushimanov VE, Borissevitch IE, Imasato H,
Tabak M (1997) J Inorg Biochem 65:235–244
An Anionic Porphyrin Binds b-Lactoglobulin A 13
123


