Embed Size (px)
Citation preview

Development of an Inlet Pressure Sensor for Control in a LeftVentricular Assist Device
Bryan Fritz*, Joshua Cysyk*, Ray Newswanger*, William Weiss*, and Gerson Rosenberg** The Pennsylvania State University, College of Medicine, Department of Surgery, Division ofArtificial Organs, Hershey, PA 17033
AbstractA Tesla type continuous flow left ventricular assist device (VAD) has been designed by Penn Stateand Advanced Bionics, Inc. (ABI). When a continuous flow device is employed, care must be takento limit low pressures in the ventricle that can produce an obstruction to the inlet cannula or triggerarrhythmias. Design of an inexpensive, semi-conductor strain gage inlet pressure sensor to detectsuction has been completed. The research and design analysis included finite element modeling ofthe sensing region. Sensitivity, step-response, temperature dependence and hysteresis tests have beenperformed on prototype units. All sensors were able to withstand the maximum expected strain of82 μin/in at 500 mmHg internal pressure. Average sensitivity was 0.52 ±0.24 μV/mmHg with 0.5 Vexcitation (n=5 units). Step response time for a 0 to 90 mmHg step change averaged 22 milliseconds.Hysteresis was measured by applying and holding 75mmHg internal pressure for 4 hours, followedby a zero pressure measurement, and ranged from -15 mmHg to 4.1 mmHg (n=3 units). Offset driftvaried between 180 and -140 mmHg over a four week period. (n=2 units). Span temperaturesensitivity ranged from 18 to -21 μV/°C (n=5 units). Gain temperature sensitivity ranged from -7.4to 4.9 μV/°C (n=5 units). With the inherent drift, it is currently not possible to use the transducer tomeasure actual pressures, but it can easily be used to measure pressure changes throughout the cardiaccycle. This signal can then be used in the control system to avoid ventricular suction events.
KeywordsLVAD; Pressure Sensor; Control
IntroductionHeart failure currently occurs in over 500,000 patients per year.1 While a heart transplant is aviable option for some of these patients, there are currently over 40,000 heart transplant eligiblecandidates and less than 2,200 hearts available.2 Today, a relatively common treatmentincludes implantation of a left ventricular assist device (LVAD) as either a bridge to transplantor as end destination therapy. According to The Interagency Registry for MechanicallyAssisted Circulatory Support (INTERMACS), 483 LVADs were implanted at ninety-fourdifferent centers over a two year span.3 This number is expected to increase as more devices
Corresponding Author: Gerson Rosenberg, Ph.D. C. McCollister Evarts, M.D., Professor in Artificial Organs Chief, Division of ArtificialOrgans The Pennsylvania State University College of Medicine 500 University Drive, H151 P. O. Box 850 Hershey, PA 17033 Tel #:717-531-6301 Fax #: 717-531-4464.Publisher's Disclaimer: This is a PDF file of an unedited manuscript that has been accepted for publication. As a service to our customerswe are providing this early version of the manuscript. The manuscript will undergo copyediting, typesetting, and review of the resultingproof before it is published in its final citable form. Please note that during the production process errors may be discovered which couldaffect the content, and all legal disclaimers that apply to the journal pertain.
NIH Public AccessAuthor ManuscriptASAIO J. Author manuscript; available in PMC 2011 May 1.
Published in final edited form as:ASAIO J. 2010 ; 56(3): 180–185. doi:10.1097/MAT.0b013e3181d2a56e.
NIH
-PA Author Manuscript
NIH
-PA Author Manuscript
NIH
-PA Author Manuscript

are approved, and more centers are incorporated into the database. Many of these implantedpumps are of a continuous flow scheme. By their design, axial, centrifugal, and mixedcontinuous flow pumps can create suction at the pump inlet, and care must be taken to avoidnegative pressures during decompression of the left ventricle, since it can produce anobstruction to the inlet cannula. Suction on the inlet to the device can potentially triggermalignant arrhythmias, and even cause death.4 An inlet pressure control system with anintegrated pressure sensor that can detect potential suction and signal the device controller totake corrective actions is required for these devices to operate at peak efficiencies. Other groupshave used other means to estimate pressure including measuring displacement of the rotor5and investigating pulsatility in the flow.4, 6 One study used a similar technique as the oneemployed here with good results.7
To facilitate the design of the control scheme, design of an inexpensive, semi-conductor straingage inlet pressure sensor to detect suction in the inlet of a Tesla style continuous flow devicehas been completed. The Tesla style pump is unique as compared to other LVADs in that it isa shear flow pump that uses a series of rapidly rotating disc to impart momentum to the fluid.8-10 The transducer is incorporated into the lumen of the titanium inlet connector of the VAD.
Here, we describe in detail the design and evaluation of the sensor, as well as how it may beutilized to monitor pressure changes during the cardiac cycle and control the LVAD. Analyticalanalysis and finite element modeling of the sensing region has been completed. Sensitivity,step-response, temperature dependence and hysteresis tests have been performed on prototypeunits. Discussion regarding the end use of the signal will also be introduced.
DescriptionThe sensor body is manufactured from 6Al-4V titanium. This material was chosen for its easeof machining, our prior experience utilizing this material, and biological response of the bodyto the material which has been well documented. Two diaphragm areas located 180° apart,where the sensor gages are mounted, are produced by wet grinding across the outside of thepart, tangential to the inside lumen of the inlet cap to the pump. The diaphragm is a flat onlyon the outside of the sensor body; a non-obstructed circular path remains through the entireinlet to the device, thereby not disturbing the flow field in any manner. A mandrel is placedinside the inlet cap of the device to give mechanical support to the thin region during themanufacturing process. Once grinding has been completed, a thin region in the shape of anoval and tangential to the axis of rotation and inlet of the device is produced. It is intended thatthis region be no more than 0.001 inches thick in an area that lies along the central axis of thepump. Once fabrication of the inlet cap diaphragms is complete, the inside is polished to amirror like finish. This eliminates any need for a coating to be applied to alleviate potentialbiological depositions. A picture of the prototype inlet cap may be seen in Figure 1 with theoval indicating the general shape of the diaphragm region. The long side of the oval is alongthe axis of flow through the sensor. Two strain gages are mounted on each side of the inlet ofthe device oriented 180° apart, one each along and transverse to the central axis of the device.The four gages on each sensor are cross wired in a Wheatstone bridge configuration to helpcompensate for bending in the inlet. It can be seen in the figure that as the inlet of the deviceis bent, a gage on one side of the inlet is in compression, while the other side will be in tension.When this occurs, one gage will exhibit an increase in resistance and the corresponding gageon the opposite side of the device will exhibit a decrease in resistance, thereby canceling oneanother in the output signal.
Fritz et al. Page 2
ASAIO J. Author manuscript; available in PMC 2011 May 1.
NIH
-PA Author Manuscript
NIH
-PA Author Manuscript
NIH
-PA Author Manuscript
Materials and MethodsGeneral Instrumentation
Instrumentation used with the pressure sensors remained fixed for all experiments, except asnoted. Each bridge on the inlet pressure sensors was connected to a National InstrumentsCorporation (Austin, TX, USA, model SC-2345) data acquisition system (NI-DAQ). The NI-DAQ system had SCC-SG04 modules installed to acquire the output signal from the device.An external variable voltage source (Hewlett-Packard, Palo Alto, CA, USA Model #3630ADC) was set at 0.50 V to provide excitation to the bridge. Ambient temperature of thesurrounding air was monitored using an Omega Chromega/Alomega Type-J thermocouple(Omega Engineering Incorporated, Stamford, CT, USA, model #5TC-TT-K-30-36) andconnected to the NI-DAQ system using a SCC-TC01 Thermocouple Module. All modulescontained a differential amplifier providing a gain of 100 with an error of ±0.8% full scale inthe nominal temperature range (23° ± 2° C). The thermocouple module also includes a dual-pole 2 Hz filter onboard. Unless otherwise noted, all experiments were conducted in thenominal temperature range. For all tests, data were sampled at 1000 Hz for one second usinga custom developed LabVIEW program. The lengths of time between data samplings variedfor each experiment. Each of the sampling files was then averaged to compile a single datapoint.
Finite Element AnalysisFinite element analysis (FEA) was run on SolidWorks Cosmos Simulation Software (DassaultSystèmes SolidWorks Corporation, Concord, MA, USA). Several different scenarios were runon the solid model of the inlet cap to the LVAD. During all FEA analysis, the mesh for thesimulation was tightly controlled in the region of the diaphragm. A close-up view of the meshcontrol may be seen in Figure 2. For all analyses, the large round cross sections in each figurewere fixed and internal pressures of 10, 25 and 500 mmHg were applied. The rigidly mountedsetup is similar to the arrangement that will be seen in the final clinical device. The 10 and 25mmHg pressures were intended to simulate physiological conditions expected to be seen priorto a suction event, and FEA analysis indicated that negative pressures inside the device yieldedidentical results. The 500 mmHg pressure was intended for design purposes only. Fatigue lifefor the thin diaphragm region was considered using the FEA generated stress values at themaximum design criteria. The resultant von Mises stress of 1542 psi is well below the yieldstrength of the titanium material. As a result, at this stress level, the fatigue life of the diaphragmis assumed infinite.
Sensitivity TestingAll sensitivity data were acquired with five sensors connected in series by silicone tubing(Figure 3). An Argon Medical (Athen, TX, USA) CDXpress disposable pressure transducerwas calibrated using a certified digital pressure manometer (Sper Scientific, Scottsdale, AZ,USA). An initial reading of each sensor output with zero pressure applied was acquired. Afterthe initial reading, a small internal pressure (approximately 5 mmHg) was applied using astopcock and syringe set-up as seen on the left side of in Figure 3. This process of adding 5mmHg increments of pressure to the system was repeated until the overall internal pressurereading was 75 ± 5 mmHg. These tests were repeated at both room temperature (23 ± 2°C) andphysiological body temperature (37 ± 1°C) for all five sensor prototypes.
Drift TestingTwo sensor units were placed under a plastic tub to maintain consistent atmospheric conditions,absent large fluctuations in temperature due to air currents. The sensors were allowed to remain
Fritz et al. Page 3
ASAIO J. Author manuscript; available in PMC 2011 May 1.
NIH
-PA Author Manuscript
NIH
-PA Author Manuscript
NIH
-PA Author Manuscript

undisturbed for a period of 4 weeks. Temperature was monitored using the Omega Chromega/Alomega Type-J thermocouple and data were taken for one second in half-hour intervals.
Hysteresis TestingThe experimental set-up for hysteresis testing was similar to the one that was used during thesensitivity testing described earlier and shown in Figure 3. Three of the prototype sensors wereconnected in series and run through two types of hysteresis tests. The first test involved holding75 mmHg of internal pressure (relative to atmospheric pressure) for a prescribed period oftime, and then allowing the system to return to zero pressure. The length of time that the systemremained pressurized varied for each test. The holding times tested were one minute, fifteenminutes, one hour, and four hours. For all test conditions, an initial reading was taken with nopressure; the system was pressurized, and a reading was taken after 15-20 seconds. The systemwas allowed to remain pressurized for the prescribed time; another reading was captured, andthe pressure was released. After another 15-20 second stabilization period, the final readingwas taken with zero pressure in the system. For the two longer tests (one and four hour), anintermediate reading was also taken at the half-way point. For the second hysteresis test, theinternal pressure applied to the gages was incrementally increased in 5 to 7 mmHg steps untila pressure of 75 mmHg was reached. Each reading was held for 15-20 seconds, allowed tostabilize, and data were then recorded. For each of the second type tests, at least 10 data pointswere taken on the way up to 75 mmHg and during the return to zero pressure.
Step TestingTesting of pressure gages typically includes step testing, in which a pressure or load is suddenlyapplied to or removed from the gage. A standard type of step test for pressure sensors is thepop test.11 The pressure sensors were connected in series with an Argon pressure transducerand a standard 60cc Luer lock medical syringe (Figure 3) attached to the system via a 3-waystopcock. A negative pressure of -95 ± 5 mmHg was pulled onto the system using the syringe.The syringe rubber plunger was ‘popped’ free and removed from its housing allowing ambientpressure to rush into the system, creating the step input.
In Vitro TestingResponse of the sensor to detect potential suction events was also tested in vitro. On a PennState mock circulatory loop, the Tesla type LVAD was plumbed in series with a Thoratecpneumatic VAD (which simulated the native ventricle). The custom pressure sensor was placedbetween the two devices, as was a fitting to allow the connection of an Argon commercialpressure transducer. Figure 4 shows the loop set-up for this test.
In Vivo TestingA five-hour in vivo study using the Tesla type VAD with an inlet pressure sensor was conductedon a 105 kg calf. To compensate for baseline drift, the pressure trace was detrended bysubtracting a 1 hour moving average of the input signal. The detrended inlet pressure signalwas input to a custom control algorithm to automatically vary the pump speed. Suction wasdetected as a large drop in inlet pressure (-dP/dt). When a suction event was recognized, thecontrol algorithm instructed the pump to reduce the set speed of the device.
Results and DiscussionFEA estimated strain for the 10 and 25 mmHg internal pressure on the inlet cap was 1.6 and3.5 μm/m, respectively. Estimated strain at the design maxima criterion of 500 mmHg was 82μm/m. FEA estimated pictorial representations of strain for the operating pressures may be
Fritz et al. Page 4
ASAIO J. Author manuscript; available in PMC 2011 May 1.
NIH
-PA Author Manuscript
NIH
-PA Author Manuscript
NIH
-PA Author Manuscript

seen in Figure 5a and b where the internal pressure was fixed at 10 mmHg (Figure 5a) and 25mmHg (Figure 5b).
Drift tests revealed that offset (zero pressure) drift varied from -180 to 140 mmHg over a fourweek period (n = 2 units). Drift of this magnitude precludes the use of the sensor to measuretrue pressure at the VAD inlet (i.e., gage pressure relative to intrathoracic pressure). Low driftversions of these sensors of this type are available, and need to be investigated. Also, the useof a different approach to sensor gage bonding in which the gage is molecularly bonded to thediaphragm is currently being explored.
Average sensitivity for the prototype devices were 0.52 ± 0.24 μV/mmHg with 0.5 V excitation(n = 5 units). Larger values of excitation voltage were experimented with; however, this causedself heating of the gages and led to very erratic drift behavior. A custom dual-stageamplification box was also made for each sensor utilizing a commercially purchased low-driftprecision amplifier (LT1013, Linear Technology, Milpitas, California, USA). The gain appliedto each signal was approximately 10,000. Once this amplification was added to the set-up, theamplified NI module (SCC-SG04) was removed from the system and replaced by a voltagefeed-through module (SCC-FT01). A comparison of the sensitivity tests at two temperatures(23 ± 2°C and 37 ± 1°C) yielded the gain drift for the sensors of -8.1 to 4.2 ± 45.3 μV/°C (n =5 units).
Pulsatile waveforms were also introduced to the sensors to measure span drift at multipletemperatures, room temperature (23 ± 2°C) and physiological body temperature (37 ± 1°C).The physiological temperature was introduced to the sensor through the use of a heated waterbath and warmed fluid circulating through the devices. Comparing the two pulsatilewaveforms, it was observed that maximum span drift ranged from 18 to -21 ± 19.7 μV/°C (n= 5 units).
Step response time for a 0 to 90 mmHg step change averaged 22 milliseconds (n = 5 units).The resulting unfiltered output signal from the two sensors may be seen in Figure 6. Theremaining three sensors were not shown for clarity; however all remaining sensors exhibitedsimilar response characteristics. As can be seen in Figure 6, the sensor responds almostinstantaneously to the step input, similar to the Argon control transducer.
Hysteresis ranged from -15 mmHg to 4.1 mmHg (n = 3 units). These values were measuredfrom the four hour test, during which the three sensors exhibited their most hysteresis.Hysteresis was not statistically significant during the shorter duration tests. While the exactcause of the hysteresis was not determined, it was speculated that the problem derives fromthe use of an epoxy to hold the gages to the diaphragm.
Transient response of the sensor appears to adequately detect impending suction events. InFigure 7, the top trace is the custom pressure sensor, while the bottom trace indicates the Argoncontrol. A suction event was determined to be occurring through visual observation of the bloodsac in the pneumatic Thoratec device (Figure 4). During a suction event, the blood sac wouldocclude the inlet to the ABI device and a simultaneous zero flow reading would result. As canbe observed, three suction events occur in the first nine seconds of the experiment and bothdevices successfully register these events. After approximately 10 seconds, the suction eventsare fully resolved. Both sensors then return to “normal” trace. The negative pressure spikes arethe result of rapid flow deceleration during the occlusion of the inlet cannula.
As can be seen in Figure 8, the inlet pressure sensor can also adequately detect suction on theinlet cannula during an in vivo experiment. Pressure sensor drift did not occur over time scalesless than 1 hour, and therefore, deviations in the pressure trace on a beat-to-beat basis weredue to physiologic changes in pressure and not due to baseline drift. The output signal from
Fritz et al. Page 5
ASAIO J. Author manuscript; available in PMC 2011 May 1.
NIH
-PA Author Manuscript
NIH
-PA Author Manuscript
NIH
-PA Author Manuscript

the inlet pressure sensor will be used in active control of the device. As a suction event isdetected, the control algorithm reduces pump speed until the suction event has resolved.
ConclusionAn inexpensive, custom pressure sensor has been developed to detect potential suction eventsin the inlet to a new type of VAD. Drift currently remains an issue and alternative methods ofgaging the system are being investigated. If drift in the system can be stabilized, a duplicatetype of device may be placed on the outlet of the device to help in flow estimation. While thegoal to measure physiological blood pressure may not have been achieved, the output is stillindicative of pressure inside the lumen to the inlet of the device. This output signal will be fedinto the control algorithm to determine if a suction event is occurring and reduce pump speedas necessary. Although at the present time the drift of the sensor limits pressure measurements,the signal is quite satisfactory as a control signal to reduce/eliminate ventricular suction events.
AcknowledgmentsDisclosure: Work was supported by NIH Grant # R01HL81119, Development of an Innovatively Suspended TESLAPump LVAD
References1. Cardiovascular disease statistics. 2005 [June 1, 2009].
http://www.americanheart.org/presenter.jhtml?identifier=4478.2. Trends in hospitalization for heart failure by age group, 1979 - 2004, United States. 2006 [May 25,
2009]. http://www.cdc.gov/DHDSP/library/fs_heart_failure.htm.3. Holman WL, Pae WE, Teutenberg JJ, et al. INTERMACS: interval analysis of registry data. J Am Coll
Surg 2009;208:755–761. [PubMed: 19476831]4. Vollkron M, Voitl P, Ta J, Wieselthaler G, Schima H. Suction events during left ventricular support
and ventricular arrhythmias. J Heart Lung Transplant 2007;26:819–825. [PubMed: 17692786]5. Hetzer R, Weng Y, Potapov EV, et al. First experiences with a novel magnetically suspended axial
flow left ventricular assist device. Eur J Cardiothorac Surg 2004;25:964–970. [PubMed: 15144996]6. Vollkron M, Schima H, Huber L, Benkowski R, Morello G, Wieselthaler G. Development of a reliable
automatic speed control system for rotary blood pumps. J Heart Lung Transplant 2005;24:1878–1885.[PubMed: 16297795]
7. Bullister E, Reich S, D'Entremont P, Silverman N, Sluetz J. A blood pressure sensor for long-termimplantation. Artif Organs 2001;25:376–379. [PubMed: 11403667]
8. Tesla, N. Inventor. Turbine.. US patent 1,061,20619139. Izraelev, V. Inventor. Blood pump having rotor with internal bore for fluid flow.. US patent
5,938,412199710. Izraelev V, Weiss WJ, Fritz B, et al. A passively suspended Tesla pump left ventricular assist device.
ASAIO J 2009;55:556–561. [PubMed: 19770799]11. Nichols, WW.; O'Rourke, MF. McDonald's blood flow in arteries: theoretic, experimental and clinical
principles. Hodder Arnold; London, UK: 1998.
Fritz et al. Page 6
ASAIO J. Author manuscript; available in PMC 2011 May 1.
NIH
-PA Author Manuscript
NIH
-PA Author Manuscript
NIH
-PA Author Manuscript

Figure 1.Thin region of the diaphragm as shown in the solid model representation of the inlet cap to theLVAD.
Fritz et al. Page 7
ASAIO J. Author manuscript; available in PMC 2011 May 1.
NIH
-PA Author Manuscript
NIH
-PA Author Manuscript
NIH
-PA Author Manuscript

Figure 2.Close-up view of the controlled mesh for the FEA analyses.
Fritz et al. Page 8
ASAIO J. Author manuscript; available in PMC 2011 May 1.
NIH
-PA Author Manuscript
NIH
-PA Author Manuscript
NIH
-PA Author Manuscript
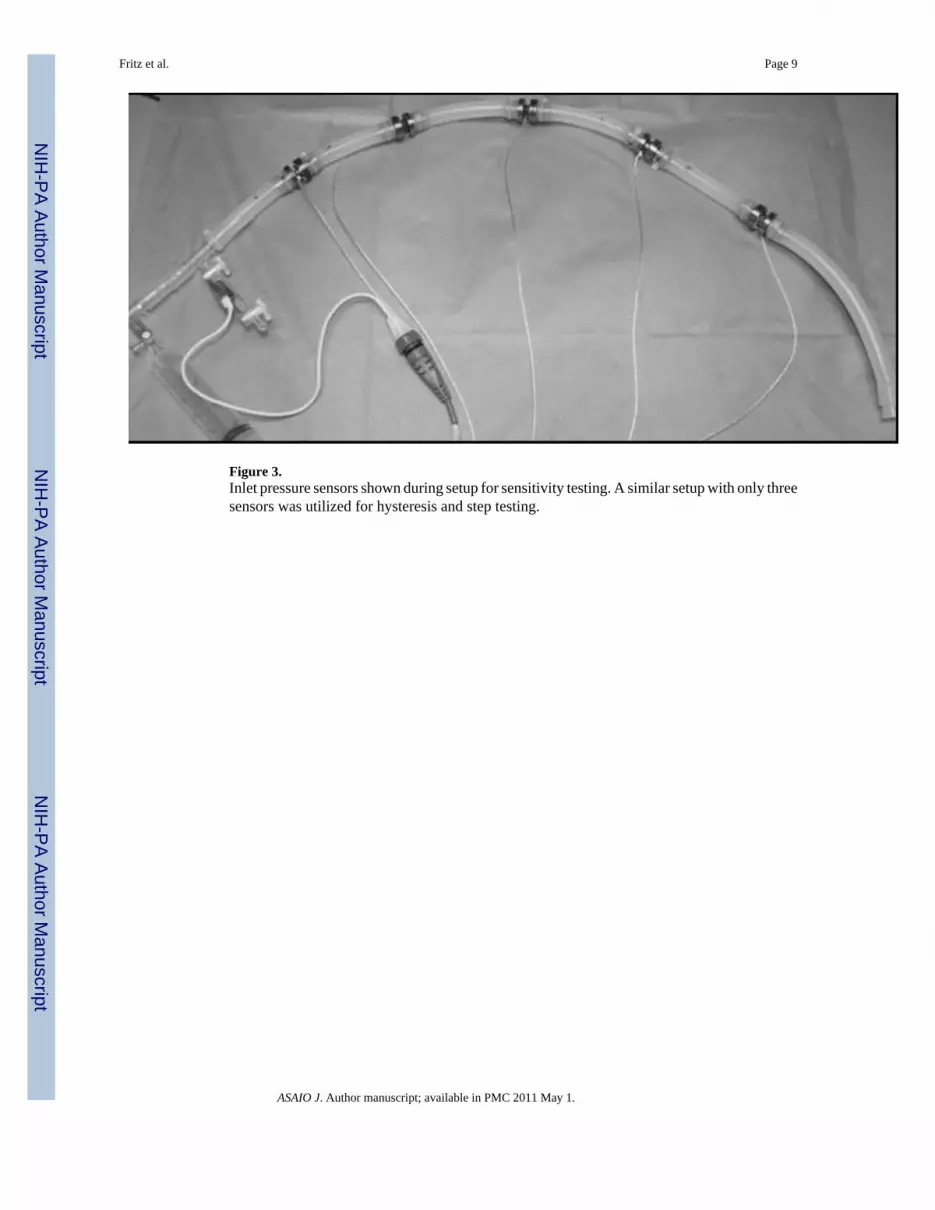
Figure 3.Inlet pressure sensors shown during setup for sensitivity testing. A similar setup with only threesensors was utilized for hysteresis and step testing.
Fritz et al. Page 9
ASAIO J. Author manuscript; available in PMC 2011 May 1.
NIH
-PA Author Manuscript
NIH
-PA Author Manuscript
NIH
-PA Author Manuscript

Figure 4.Loop setup for in vitro testing.
Fritz et al. Page 10
ASAIO J. Author manuscript; available in PMC 2011 May 1.
NIH
-PA Author Manuscript
NIH
-PA Author Manuscript
NIH
-PA Author Manuscript

Figure 5.a) FEA model showing predicted strain at 10 mm Hg, and b) FEA model showing predictedstrain at 25 mm Hg.
Fritz et al. Page 11
ASAIO J. Author manuscript; available in PMC 2011 May 1.
NIH
-PA Author Manuscript
NIH
-PA Author Manuscript
NIH
-PA Author Manuscript

Figure 6.Graph of pressure versus time for two prototype sensors and the Argon Medical controltransducer during the step test.
Fritz et al. Page 12
ASAIO J. Author manuscript; available in PMC 2011 May 1.
NIH
-PA Author Manuscript
NIH
-PA Author Manuscript
NIH
-PA Author Manuscript

Figure 7.Graph showing the output trace from the custom pressure sensor (top) and the Argon transducer(bottom) during in-vitro testing. Both devices detect the potential impending suction eventsadequately.
Fritz et al. Page 13
ASAIO J. Author manuscript; available in PMC 2011 May 1.
NIH
-PA Author Manuscript
NIH
-PA Author Manuscript
NIH
-PA Author Manuscript

Figure 8.Pressure traces from the integrated inlet pressure sensor during an acute in-vivo experiment ina calf. Suction events (right trace) caused a sharp negative transient in the pressure duringdiastole. The pressure trace is shown detrended by the long term average inlet pressure in orderto compensate for sensor drift.
Fritz et al. Page 14
ASAIO J. Author manuscript; available in PMC 2011 May 1.
NIH
-PA Author Manuscript
NIH
-PA Author Manuscript
NIH
-PA Author Manuscript


