Embed Size (px)
Citation preview

J A C C : C A R D I O V A S C U L A R I M A G I N G V O L . 4 , N O . 3 , 2 0 1 1
© 2 0 1 1 B Y T H E A M E R I C A N C O L L E G E O F C A R D I O L O G Y F O U N D A T I O N I S S N 1 9 3 6 - 8 7 8 X / $ 3 6 . 0 0
P U B L I S H E D B Y E L S E V I E R I N C . D O I : 1 0 . 1 0 1 6 / j . j c m g . 2 0 1 0 . 1 0 . 0 1 2
O R I G I N A L R E S E A R C H
Echocardiographic Predictors of AdverseOutcomes After Continuous Left VentricularAssist Device ImplantationYan Topilsky, MD,* Jae K. Oh, MD,* Dipesh K. Shah, MD,† Barry A. Boilson, MD,*John A. Schirger, MD,* Sudhir S. Kushwaha, MD,* Naveen L. Pereira, MD,*Soon J. Park, MD†
Rochester, Minnesota
O B J E C T I V E S The purpose of the study was to identify echocardiographic predictors of adverse
outcome in patients implanted with continuous-flow left ventricular assist devices (LVAD).
B A C K G R O U N D Continuous flow LVAD have become part of the standard of care for the treatment
of advanced heart failure. However, knowledge of echocardiographic predictors of outcome after LVAD
are lacking.
M E T H O D S Overall, 83 patients received continuous-flow LVAD (HeartMate II, Thoratec Corporation,
Pleasanton, California) from February 2007 to June 2010. The LVAD database, containing various echocar-
diographic parameters, was examined to analyze their influence on in-hospital mortality, a compound cardiac
event (in-hospital mortality or acute right ventricular [RV] dysfunction), and long-term mortality.
R E S U L T S Eight patients died before discharge (operative mortality 9.6%), and another 15 patients were
considered to have acute RV dysfunction immediately after surgery. Patients with relatively small left
ventricular end-diastolic diameters (�63 mm) had significantly higher risk for in-hospital mortality (odds ratio
[OR]: 0.9; 95% confidence interval [CI]: 0.83 to 0.99; p � 0.04) or occurrence of the compound cardiac event
(OR: 0.89; 95% CI: 0.84 to 0.95; p � 0.001). The most significant predictor of outcome was the decreased
timing interval between the onset and the cessation of tricuspid regurgitation flow corrected for heart rate
(TRDc), a surrogate for early systolic equalization of RV and right atrial pressure. Short TRDc predicted
in-hospital mortality (OR: 0.85; 95% CI: 0.74 to 0.97; p � 0.01) and the compound cardiac event (OR: 0.83; 95%
CI: 0.74 to 0.91; p � 0.0001). Multivariate analysis based on a logistic regression model demonstrated that the
accuracy of predicting the 30-day compound adverse outcome was improved with the addition of
echocardiographic variables when added to the commonly used hemodynamic or clinical scores. TRDc
predicted long-term survival, with adjusted risk ratios of 0.89 for death from any cause (95% CI: 0.83 to 0.96;
p � 0.003) and 0.88 for cardiac-related death (95% CI: 0.77 to 0.98; p � 0.03).
C O N C L U S I O N S The presence of either a relatively small left ventricle (�63 mm) or early systolic
equalization of RV and right atrial pressure (short TRDc) demonstrated by echocardiography is
associated with increased 30-day morbidity and mortality. Prediction of early adverse outcomes by
echocardiographic parameters is additive to laboratory or hemodynamic variables. (J Am Coll Cardiol
Img 2011;4:211–22) © 2011 by the American College of Cardiology Foundation
From the *Division of Cardiovascular Diseases, Mayo Clinic, Rochester, Minnesota; and the †Division of CardiovascularSurgery, Mayo Clinic, Rochester, Minnesota. The authors have reported that they have no relationships to disclose.
Manuscript received July 8, 2010; revised manuscript received October 21, 2010, accepted October 25, 2010.

LrsfmLsthLs
ctasfagu
ddp(dbR
heart rate
J A C C : C A R D I O V A S C U L A R I M A G I N G , V O L . 4 , N O . 3 , 2 0 1 1
M A R C H 2 0 1 1 : 2 1 1 – 2 2
Topilsky et al.
Echocardiographic Predictors of LVAD Outcome
212
eft ventricular (LV) assist device (LVAD) ther-apy for patients with advanced heart failure hasbeen proven to improve survival over medical
therapy (1). Continuous-flow LVAD haveeplaced pulsatile LVAD because they have beenhown to have better patient survival and less deviceailure (2,3). However, there is still significantorbidity and mortality in patients treated withVAD. It is important to identify risk factors for
uch adverse outcomes and modify current practiceo reduce them (4). Pre-operative echocardiographyas a major role in the management of patients withVAD and is frequently used to assist in patient
election for LVAD therapy. Because LVAD ther-apy is effective in replacing LV function,we postulated that variables related to LVfunction may not be predictive of adverseoutcomes after surgery. In contrast, otherfactors, especially those related to LVdimensions or to right ventricular (RV)function, may have a strong influence. Weexamined various pre-operative echocar-diographic, hemodynamic, and clinicalvariables for their impact on mortality andRV dysfunction after surgery. We alsoexamined different clinical scores (5–7) todetermine whether they were additive tothe echocardiographic parameters for theprediction of clinical outcomes.
M E T H O D S
Patient population. We identified all 83consecutive patients who received theHeartMate II continuous-flow LVAD(Thoratec Corporation, Pleasanton, Cali-fornia) for either destination or bridge totransplant therapy between February 2007and June 2010. We defined operative mor-tality as death within 30 days of LVAD
implantation or during the index hospitalizationand acute right-heart failure as a need for an RVassist device or inotropic support for more than 7days post-operatively.Clinical and demographic data. Pre-operative clini-al, echocardiographic, hemodynamic, and labora-ory data as well as data concerning post-operativedverse events, right-heart failure, length of stay, andhort-term and long-term mortality were abstractedrom the medical records. Laboratory evaluations werell performed within 24 h before surgery. Echocardio-raphic examinations were performed in all patients,
t
t
d-
-
for
sually within the month before surgery (median 16
ays, 25th and 75 percentiles 7 and 36 days). Hemo-ynamic catheterizations were performed in 80 of 83atients (96.4%), usually within a week before surgerymedian 4 days, 25th and 75th percentiles 2 and 9ays). The study protocol was reviewed and approvedy the institutional review board at the Mayo Clinic inochester, Minnesota.
Echocardiographic measurements. Two-dimensionaltransthoracic echocardiography was performed in astandard manner. LV diameters and ejection frac-tion were measured as recommended (8). Rightatrial (RA) pressure was estimated by the inferiorvena cava diameter and its response to inspiration(9). RV function and tricuspid regurgitation (TR)and mitral regurgitation (MR) severity were quali-tatively graded using a 4-point scale (normal, mild,moderate, or severe) using all views. The severity ofTR was assessed using color flow imaging and venacontracta width (10). MR was quantitatively as-sessed using the proximal isovelocity surface areamethod whenever it was considered to be more thanmild (11). RV function was assessed using tissueDoppler assessment of lateral tricuspid annular mo-tion (12), systolic TR duration (13), and the rightindex of myocardial performance (RIMP) (14).
We corrected the time intervals of RV ejectiontime and the time between the onset and thecessation of TR flow (13) for heart rate using thecorrection formula time of TR flow corrected forheart rate (TRDc) � TR flow time/�RR, aspreviously suggested by others (Fig. 1C) (14,15).Interobserver and intraobserver variability. Interob-server variability was determined by a second inde-pendent blinded observer who measured the echo-cardiographic variables in 15 randomly selectedpatients. Intraobserver variability was determinedby having the first observer who measured the datain all patients remeasure the timing intervals in 15patients at least 3 months apart. Interobserver andintraobserver variability were assessed using theBland-Altman method and the within-subject coef-ficient of variation. The within-subject coefficient ofvariation (calculated as the ratio of the standarddeviation of the measurement difference to the meanvalue of all measurements) provides a scale-free, unit-less estimate of variation expressed as a percentage.We measured intraobserver and interobserver repro-ducibility for TRDc, RV ejection time corrected forheart rate, and RIMP and expressed them using thecoefficient of variation. Values of p � 0.05 wereconsidered statistically significant.Statistical analysis. Unless otherwise specified, data
A B B R E V I A T I O N S
A N D A C R O N YM S
CI � confidence interval
EROA � effective regurgitan
orifice area
LV � left ventricular
LVAD � left ventricular assis
device
LVEDD � left ventricular en
diastolic diameter
LVESD � left ventricular end
systolic diameter
MR � mitral regurgitation
NYHA � New York Heart
Association
OR � odds ratio
RA � right atrial
RIMP � right index of
myocardial performance
RV � right ventricular
TR � tricuspid regurgitation
TRDc � time of tricuspid
regurgitation flow corrected
are presented as mean � SD or as percentages.

TsotwsRbrtcpcmpfiwtdtwdeRodampwwiuN
J A C C : C A R D I O V A S C U L A R I M A G I N G , V O L . 4 , N O . 3 , 2 0 1 1
M A R C H 2 0 1 1 : 2 1 1 – 2 2
Topilsky et al.
Echocardiographic Predictors of LVAD Outcome
213
Comparisons between groups were performed usinganalysis of variance, Student t test, or the chi-squaretest as appropriate. To analyze independent determi-nants of the compound 30-day adverse event (in-hospital mortality or RV dysfunction), multivariateanalysis based on a logistic regression model (with thecombined end point as the dependent variable and thedifferent echocardiographic variables as independentvariables) was performed. Variables assessing echocar-diographic predictors were entered first, and thosemeasuring right-heart catheterization measurementsor the different clinical scores were added consecu-tively to the models. The first entry criterion in themultivariate analysis was a univariate p value �0.05.
o correct for possible overfitting of the model con-idering that we observed only 23 events, we selectednly variables that supported our stated hypothesishat variables related to LV function or filling pressureould not be predictive of adverse outcomes after
urgery but that factors related to LV dimensions or toV function might have a strong influence. On theasis of those assumptions, we excluded MR effectiveegurgitant orifice area (EROA) and TR velocity fromhe model. To detect multicollinearity, we first usedorrelation factor analyses to determine if any pairs ofredictor variables were highly correlated (correlationoefficients over 0.9) and therefore likely to result inulticollinearity. If any such pairs were found, 1 of the
redictor variables was selected for inclusion in thenal analysis and the other was ignored. The variableith the lowest p value was chosen to be included in
he analysis. We then proceeded with multicollinearityiagnostic statistics and examined the variance infla-ion factor. Variance inflation factors exceeding 10ere regarded as indicating multicollinearity and wereropped from the model. Using these procedures, wexcluded LV systolic diameter, RIMP, and TR minusV ejection time from the model and were left withnly 2 echocardiographic variables (LV end-diastoliciameter [LVEDD] and TRDc). Actuarial survivalnalysis was performed using the Kaplan-Meierethod, and the results were compared between the
re-specified groups using log-rank analysis. Patientsere censored for heart transplantation. All p valuesere 2 sided, and p values �0.05 were considered to
ndicate statistical significance. All data were analyzedsing JMP version 8.0 (SAS Institute Inc., Cary,orth Carolina).
R E S U L T S
Baseline characteristics. Table 1 shows the baseline
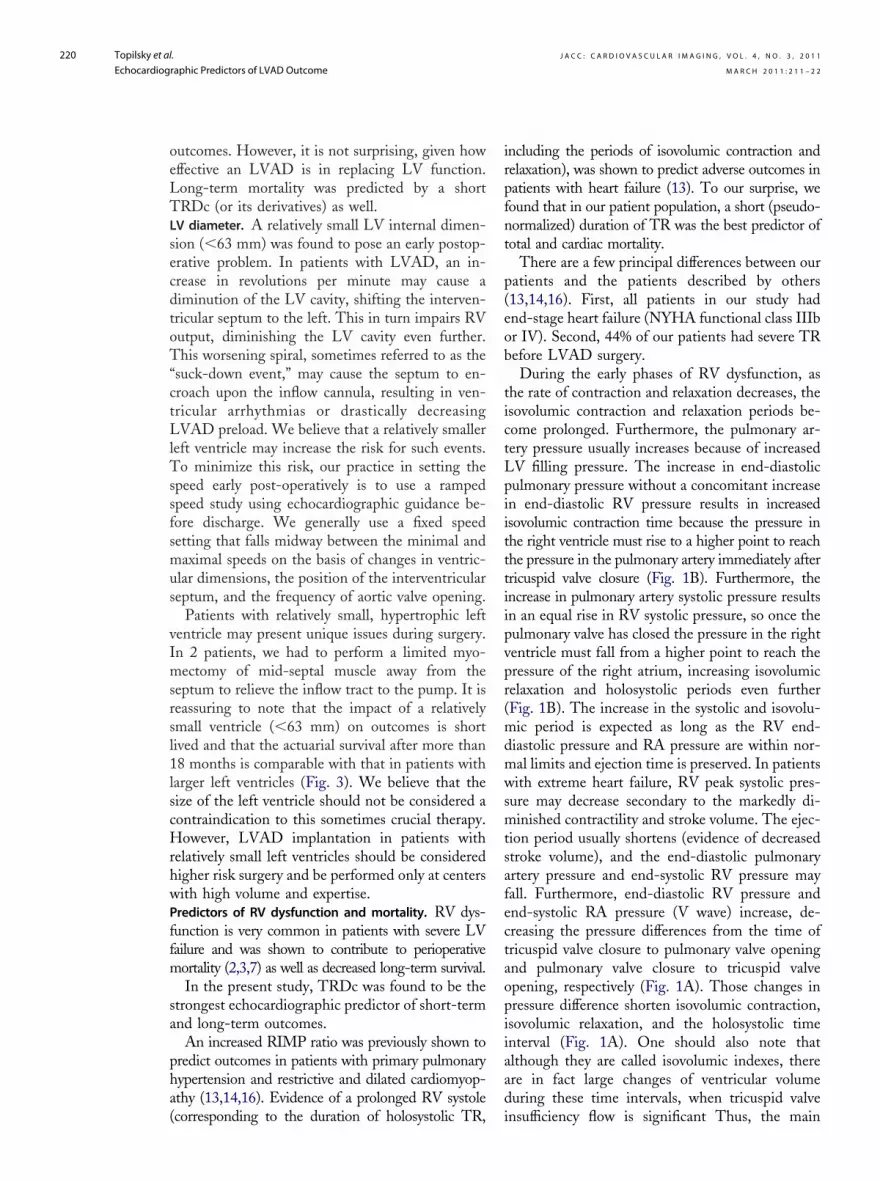
characteristics of the patients enrolled, both overallFigure 1. Duration of the TR Signal on Continuous-Wave Doppler
(A) A patient with short tricuspid regurgitation (TR) duration. The increased right
atrial (RA) pressure causes the tricuspid valve to open earlier, on the steeper curve
of the ventricular relaxation curve, thereby shortening the isovolumic relaxation
(IVR) interval and TR flow duration. Furthermore, a reduction in diastolic pulmonary
artery (PA) to end-diastolic right ventricular (RV) pressure difference shortens the
“isovolumic contraction (IVC) time.” (B) Prolonged TR duration in another patient
with end-stage dilated cardiomyopathy. The TR signal has a higher peak velocity
and systolic RV pressure. The pressure in the right ventricle at the time of pulmo-
nary valve closure must fall from a higher point to reach the pressure of the right
atrium, lengthening the IVR period. Furthermore, the increase in diastolic pulmonary
pressure to end-diastolic RV pressure difference lengthens the IVC period. Note that
the TR signal ends with a concave, prolonged contour consistent with a markedly
delayed relaxation of the right ventricle. (C) Calculation of TR duration corrected for
heart rate (TRDc). We first measured the time interval of the duration of the TR sig-
nal in milliseconds (red arrow � 450 ms). We then measured the RR interval in sec-
onds using the electrocardiographic tracing (yellow arrow � 0.9 seconds). We then
used the formula TRDc � TR duration/�RR interval (450/�0.9 � 473 ms).

J A C C : C A R D I O V A S C U L A R I M A G I N G , V O L . 4 , N O . 3 , 2 0 1 1
M A R C H 2 0 1 1 : 2 1 1 – 2 2
Topilsky et al.
Echocardiographic Predictors of LVAD Outcome
214
Table 1. Baseline Characteristics of All Patients and Divided by Those With and Without Adverse 30-Day Cardiac Outcomes (In-Hospital Mortality, Needfor RVAD, or Post-Operative Inotropic Support >168 H) Before LVAD Implantation
All PatientsAdverse Cardiac 30-Day
Outcome Normal 30-Day Outcome
Characteristic (n � 83) (n � 23) (n � 60) p Value
Age (yrs) 62.9 � 12.0 60.4 � 10.0 64.2 � 13.0 0.10
Men/women (%) 80.7/19.3 88/12 80/20 0.40
NYHA functional class 0.02
IIb 40% 26% 45%
IV 60% 74% 55%
Prior sternotomy (%) 51 48 53 0.60
Pre-operative IABP (%) 31 56 25 0.008
Pre-operative inotropic use (%) 74 65 68 0.40
Destination therapy (%) 67 52 70 0.04
Type of cardiomyopathy 0.006†
Ischemic heart disease 54% 31% 63%
Dilated cardiomyopathy 34% 48% 32%
Restrictive heart disease 10% 17% 7%
Other 2% 4% 8%
Heart rate (beats/min) 77.1 � 14.0 78.9 � 15.0 76.4 � 15.0 0.50
Systolic blood pressure (mm Hg) 99.4 � 14.0 102.2 � 18.0 98.4 � 13.0 0.30
Diastolic blood pressure (mm Hg) 62.4 � 10.0 65.7 � 10.0 63.7 � 11.0 0.50
Hemoglobin (g/dl) 11.8 � 2.0 11.5 � 1.0 12.0 � 2.0 0.30
Bilirubin (mg/dl) 1.2 � 0.7 1.2 � 0.9 1.2 � 0.6 0.70
BUN (mg/dl) 31.0 � 16.0 34.2 � 19.0 29.7 � 15.0 0.30
Creatinine (mg/dl) 1.4 � 0.5 1.5 � 0.6 1.4 � 0.5 0.30
NT-BNP (pg/ml) 5,673 � 5,229 6,570 � 6,704 5,270 � 4,499 0.50
Lietz-Miller score 9.7 � 5.7 12.5 � 6.5 8.5 � 5.0 0.005
Matthews score 1.1 � 2.2 2.0 � 3.0 0.8 � 1.7 0.03
Kormos score 1.8 � 1.9 2.7 � 2.4 1.4 � 1.5 0.005
Echocardiography
LV diastolic diameter (mm) 67.2 � 9.0 61.2 � 9.0 69.4 � 9.0 0.0003
LV systolic diameter (mm) 60.8 � 9.0 54.7 � 9.0 63.2 � 8.0 0.0006
Septal thickness (mm) 10.2 � 2.0 11.3 � 3.0 10.2 � 3.0 0.20
Posterior wall thickness (mm) 9.8 � 2.0 9.8 � 1.0 10.0 � 2.0 0.60
Ejection fraction (%) 19.7 � 7.0 19.1 � 11.0 20.1 � 8.0 0.70
Cardiac output (l/min) 4.1 � 1.0 4.0 � 1.0 4.1 � 1.0 0.80
Cardiac index (l/min/m2) 2.2 � 0.8 2.2 � 1.0 2.2 � 0.7 0.80
LA volume (cm3) 133.0 � 49.0 134.0 � 34.0 132.6 � 54.0 0.90
LA volume index (cm3/m2) 68.2 � 27.0 66.9 � 19.0 68.7 � 30.0 0.80
E/e= ratio* 27.5 � 12.0 23.6 � 10.0 28.8 � 12.0 0.10
Deceleration time# 135.9 � 30.0 126.8 � 27.0 138.7 � 31.0 0.20
TR velocity (m/s) 3.0 � 0.6 2.8 � 0.7 3.1 � 0.6 0.03
Estimated RA pressure¶ (mm Hg) 14.9 � 5.0 15.0 � 5.0 14.8 � 5.0 0.90
Tricuspid valve lateral annular velocity (m/s) 0.08 � 0.03 0.08 � 0.03 0.08 � 0.03 0.80
RV dysfunction � moderate 67% 68% 66% 0.90
RIMP 0.57 � 0.2 0.43 � 0.2 0.61 � 0.2 0.003
TRDc‡ (ms) 466 � 69 416 � 56 486 � 64 �0.0001
RV ejection time corrected� (ms) 302 � 39 296 � 40 306 � 38 0.40
TR � RV ejection time§ (ms) 150 � 56 109.6 � 44.0 165.4 � 53.0 0.0002
MR 0.02
None 8% 8% 8%
Mild 30% 42% 26%
(Continued on next page)

o
a
J A C C : C A R D I O V A S C U L A R I M A G I N G , V O L . 4 , N O . 3 , 2 0 1 1
M A R C H 2 0 1 1 : 2 1 1 – 2 2
Topilsky et al.
Echocardiographic Predictors of LVAD Outcome
215
and divided into 2 groups, those (23 patients)positive for the 30-day compound adverse outcome(operative mortality or acute RV dysfunction) andthose (60 patients) considered to have normal30-day outcomes. The mean age was 62.9 � 12.4years, and 80.7% were men. We calculated andincluded the clinical scores proposed by Lietz et al.(7), Matthews et al. (5), and Kormos et al. (6) for allpatients (Table 1).
The parameters estimating LV systolic functionand LV filling pressures were not different between
Table 1. Continued
Al
Characteristic (
Moderate
Severe
MR EROA (PISA) (cm2) 0.
TR
None
Mild
Moderate
Severe
TR vena contracta width (mm) 4
Hemodynamic parameters
Mean RA pressure (mm Hg) 15
Mean PA pressure (mm Hg) 36
PVR (Wood units) 4
RV dP/dt 4
Mean wedge pressure (mm Hg) 23
Cardiac output (l/min) 3
Cardiac index (l/min/m2) 1
Matching for NYHA functional class, destination therapy,type of cardiomyopathy, Lietz-Miller score, andmean RA pressure
Age (yrs) 60
Men/women 8
NYHA functional class
IIIb
IV
Destination therapy
Type of cardiomyopathy
Ischemic heart disease
Dilated cardiomyopathy
Restrictive heart disease
Other
Lietz-Miller score 12
Mean RA pressure (mm Hg) 18
Data are expressed as mean � SD or as (%). *Ratio of E velocity of mitral inflow tdisease. ‡Interval between cessation and onset of TR flow divided by the squaand cessation of RV outflow divided by the square root of the RR interval. ¶EsBUN � blood urea nitrogen; EROA � effective regurgitant orifice area; IABP � i
regurgitation; NT-BNP � N-terminal brain natriuretic peptide; NYHA � New Yorresistance; RA � right atrial; RIMP � right index of myocardial performance;regurgitation duration corrected for heart rate.
the groups. LVEDD and left ventricular end-
systolic diameter (LVESD) (61.2 � 8.7 mm vs.69.4 � 8.8 mm, p � 0.0003, and 54.7 � 9.3 mm vs.63.2 � 8.5 mm, p � 0.0006, respectively) weresmaller in patients with adverse 30-day outcomes.TR was worse (TR vena contracta width 4.9 � 2.5mm vs. 3.7 � 2.4 mm, p � 0.05), but the EROAof MR was smaller (0.23 � 0.05 cm2 vs. 0.37 �0.16 cm2, p � 0.05) in patients with adverseutcomes.TRDc was significantly shorter in patients with
dverse outcomes (416 � 56 ms vs. 486 � 64 ms,
tientsAdverse Cardiac 30-Day
Outcome Normal 30-Day Outc
83) (n � 23) (n � 60)
29% 22%
21% 44%
0.15 0.23 � 0.05 0.37 � 0.16
6% 22%
23% 37%
18% 12%
53% 29%
2.0 4.9 � 3.0 3.7 � 2.0
7.0 18.6 � 8.0 14.1 � 5.0
9.0 33.6 � 9.0 37.0 � 9.0
3.0 3.5 � 3.0 4.4 � 3.0
207 442 � 219 499 � 202
7.0 23.5 � 7.0 23.5 � 7.0
1.0 4.0 � 1.0 3.8 � 1.0
0.5 2.0 � 0.5 1.9 � 0.5
11.5 59.8 � 10.4 60.3 � 12.8
15% 87%/13% 83%/17%
23% 23%
77% 77%
% 52.1% 60.8%
22% 39%
48% 44%
17% 9%
13% 8%
5.2 12.4 � 6.5 12.4 � 3.6
6.8 18.6 � 8.3 17.6 � 5.0
rly diastolic relaxation tissue velocity of medial annulus. †P value for the differenceot of the RR interval. §Difference between TR flow time and RV ejection time. �Inion of RA pressure using the inferior vena cava method. #Deceleration time of eaortic balloon pump; LA � left atrial; LV � left ventricular; LVAD � left ventricularrt Association; PA � pulmonary artery; PISA � proximal isovelocity surface area; Pright ventricular; RVAD � right ventricular assist device; TR � tricuspid regurg
l Pa ome
n � p Value
23%
39%
35 � 0.05
0.03
9%
34%
13%
44%
.0 � 0.05
.4 � 0.007
.0 � 0.15
.2 � 0.20
83 � 0.30
.5 � 0.90
.9 � 0.40
.9 � 0.60
.0 � 0.90
5%/ 0.70
1.00
23%
77%
56.5 0.20
0.50
30%
46%
13%
10%
.4 � 0.90
.1 � 0.60
o ea in ratio of ischemic heartre ro terval between the onsettimat arly mitral inflow.ntra- assist device; MR � mitralk Hea VR � pulmonary vascularRV � itation; TRDc � tricuspid
p � 0.0001). The RV ejection period corrected for

mdv0
cmpth(
pio(ic
bbio7d7Lmpfns
J A C C : C A R D I O V A S C U L A R I M A G I N G , V O L . 4 , N O . 3 , 2 0 1 1
M A R C H 2 0 1 1 : 2 1 1 – 2 2
Topilsky et al.
Echocardiographic Predictors of LVAD Outcome
216
heart rate was not different between the groups, sothe derived sum of RV isovolumetric contractiontime and isovolumetric relaxation time (calculatedby subtracting RV ejection time from TR flowduration) was significantly shorter in patients withadverse outcomes (109.6 � 44 ms vs. 165.4 � 53
s, p � 0.0002). The RIMP ratio was significantlyecreased (pseudonormalized) in patients with ad-erse outcomes (0.43 � 0.2 vs. 0.61 � 0.2, p �.003).The only difference in hemodynamic baseline
haracteristics was higher RA pressure (18.6 � 8.3m Hg vs. 14.1 � 5.5 mm Hg, p � 0.007) in
atients with adverse 30-day outcomes. Lietz, Mat-hews, and Kormos scores (5–7) were significantlyigher in patients with adverse outcomes as wellTable 1).Thirty-day post-operative outcomes. Table 2 shows
ost-operative outcomes in all patients and dividednto patients with and without 30-day adverseutcomes. Eight patients died before dischargeoperative mortality 9.6%). The causes of deathncluded multiple-organ failure in 2 patients, un-ontrolled right-heart failure in 2, hyperperfusion
Table 2. Post-Operative 30-Day Outcomes and Hospital CoursesAdverse 30-Day Outcomes
All Patients A
Outcome (n � 83)
Operative mortality (%) 9.6
Cardiopulmonary bypass time (min) 103.3 � 34.0
Post-operative red blood cell transfusion (U) 10.5 � 10.0
Need for RVAD (%) 3.6
Infection (%)† 49
Bleeding (%)* 68
Prolonged intubation (%)# 23
Arrhythmia (%)¶ 20
Acute renal failure (%)‡ 16
Acute cerebral event (%)� 12
Hepatic dysfunction (%)§ 18
Thromboembolic event (%)** 11
Dialysis (%) 10
Mean RA pressure (mm Hg)†† 12.8 � 5.4
Mean PA pressure (mm Hg)†† 26.8 � 7.2
Pump flow (l/min)‡‡ 5.1 � 0.7
LOS (days) 17 (11, 27)
Duration of inotropic support (h) 114 (66, 166)
RV failure (%) 24
LOS � 30 days (%) 17
Data are expressed as (%), as mean � SD, or as median (25th percentile, 75threquiring intravenous antibiotics. ‡Renal failure requiring dialysis or increase inbilirubin � 5.0 mg/dl after surgery. �Any stroke, brain hemorrhage, or hyperpe#Mechanical ventilation for �1 week or need for tracheostomy. **Any embolictaking out the pulmonary artery catheter. ‡‡Pump flow by the LVAD monitor
LOS � length of stay; other abbreviations as in Table 1.rain injury in 2, sepsis in 1, and uncontrollableleeding after argatroban treatment for heparin-nduced thrombocytopenia in 1. The median lengthf stay after LVAD surgery was 17.5 days (25th and5th percentiles 11 and 27.5 days), and the medianuration of inotropic support was 114.5 h (25th and5th percentiles 66.5 and 166.5 h). Post-operativeVAD flow (before discharge or death) and pul-onary artery pressure tended to be lower, but RA
ressure (the last hemodynamic measurement be-ore taking out the Swan-Ganz catheter) was sig-ificantly higher in patients with adverse outcomes,uggestive of RV dysfunction.Echocardiographic predictors of adverse outcomes.Univariate analysis (Table 3) showed that none ofthe parameters related to LV function or fillingpressure influenced the compound event or earlymortality. Patients with relatively small ventricleshad significantly higher risk for the compoundevent (prolonged inotropic support or death):LVEDD (odds ratio [OR]: 0.89; 95% confidenceinterval [CI]: 0.84 to 0.95) and LVESD (OR: 0.89;95% CI: 0.83 to 0.95), p � 0.001 for both. A smallventricle was also associated with increased risk for
All Patients and Divided by Patients With and Without
rse 30-Day Outcome Normal 30-Day Outcome
(n � 23) (n � 60) p Value
35.0 0.0 �0.0001
116.7 � 33.0 98.0 � 33.0 0.03
15.9 � 15.0 8.5 � 6.0 0.002
13.0 0.0 0.004
74 38 0.001
77 65 0.30
73 5 �0.0001
36 13 0.02
36 8 0.004
32 5 0.002
41 10 0.002
14 10 0.60
37 2 �0.0001
16.2 � 5.4 11.6 � 4.8 0.003
29.6 � 9.4 25.7 � 5.8 0.06
4.8 � 0.7 5.2 � 0.7 0.07
33 (23, 41) 15 (10, 23) �0.0001
372 (247, 696) 76 (54, 120) �0.0001
87 0 �0.0001
57 10 0.0002
centile). *Bleeding requiring blood transfusion �24 h after surgery. †Infectionatinine to �2 mg/dl or by �50% from baseline. §Liver enzymes � 300 U/l orn injury. ¶Hemodynamically significant arrhythmia or requiring cardioversion.nt after surgery. ††Hemodynamic data represent the last measurement beforee discharge or death.
of
dve
percre
rfusioeve
befor

bcrL(L7
aceado2q
J A C C : C A R D I O V A S C U L A R I M A G I N G , V O L . 4 , N O . 3 , 2 0 1 1
M A R C H 2 0 1 1 : 2 1 1 – 2 2
Topilsky et al.
Echocardiographic Predictors of LVAD Outcome
217
in-hospital mortality (OR: 0.9; 95% CI: 0.83 to0.99; and OR: 0.9; 95% CI: 0.81 to 0.98), for everyincrease in LVEDD and LVESD (p � 0.05 foroth). To define which LV diameter should beonsidered relatively small and carrying increasedisk after LVAD surgery, we dichotomizedVEDD at the 25th (LVEDD � 60 mm), 33rd
60 mm � LVEDD � 63 mm), 50th (63 mm �VEDD � 67 mm), 66th (67 mm � LVEDD �
Table 3. Univariate Analysis of Predictors of Short-Term MortalLVAD Implantation
Variable (Death or RV F
EchocardiographyLV diastolic diameter (mm) 0.89 (0.84–0LV systolic diameter (mm) 0.89 (0.83–0Septal thickness (mm) 1.1 (0.94–1Posterior wall thickness (mm) 0.94 (0.71–1Ejection fraction (%) 0.98 (0.92–1Cardiac output (l/min) 0.96 (0.62–1Cardiac index (l/min/m2) 0.93 (0.41–1LA volume (cc) 1.0 (0.99–1LA volume index (cc/m2) 0.99 (0.97–1E/e= ratio* 0.95 (0.89–1Deceleration time§ 0.98 (0.96–1TR velocity (m/sec) 0.4 (0.16–0Estimated RA pressure¶ 1.0 (0.91–1Tricuspid lateral annular velocity (m/sec) 0.97 (0.79–1RV dysfunction � moderate 1.1 (0.6–1.8RIMP (0.1 increase) 0.63 (0.44–0TRDc† for 10 ms 0.83 (0.74–0RV ejection time� 0.99 (0.97–1TR � RV ejection time‡ 0.78 (0.66–0MR EROA (PISA) 0.38 (0.1–0.9TR vena contracta width 1.2 (0.95–1
Clinical and demographicAge 0.97 (0.94–1Gender (male) 1.7 (0.7–2.8NYHA functional class IV 2.7 (0.92–9Pre-operative IABP 2.0 (1.2–3.3Hemoglobin 0.86 (0.66–1Bilirubin 1.1 (0.6–2.2BUN 1.0 (0.98–1Creatinine 1.6 (0.6–4.3NT-BNP (per 100 pg/ml) 1.0 (0.98–1Lietz-Miller score 1.1 (1.04–1Matthews score 1.24 (1.01–1Kormos score 1.5 (1.1–2.1Right-heart catheterizationMean RA pressure (mm Hg) 1.1 (1.02–1Mean PA pressure (mm Hg) 0.96 (0.91–1PVR (WU) 0.88 (0.72–1RV dP/dt 0.99 (0.99–1Mean wedge pressure (mm Hg) 0.99 (0.93–1Cardiac index (lit/min/m2) 1.3 (0.5–3.5
Univariate analysis in the matched groupLV diastolic diameter (mm) 0.88 (0.8–0.9LV systolic diameter (mm) 0.89 (0.82–0RIMP (0.1 increase) 0.64 (0.4–0.9TRDc† for 10 ms 0.82 (0.69–0TR � RV ejection time‡ 0.97 (0.95–0
*Ratio of E velocity of mitral inflow to early diastolic relaxation tissue velocity osquare root of the RR interval. ‡Difference between TR flow time and RV ejecticessation of RV outflow divided by the square root of the RR interval. ¶EstimatCI � confidence interval; OR � odds ratio; other abbreviations as in Table 1.
1 mm), 75th (67 mm � LVEDD � 74 mm), and i
bove (LVEDD � 74 mm) percentiles. We thenalculated the risk for the compound cardiacvent for each group. We found that the risk fordverse outcomes almost tripled when LVEDDecreased below 63 mm (the risk for adverseutcomes was 64%, 60%, 25%, 13%, 14%, and0%, respectively, from the smallest to the largestuartile; p � 0.005).In contrast, the EROA of MR had a positive
r Compound 30-Day Adverse Event in Patients Undergoing
OR (95% CI)
re) p Value Early Mortality p Value
0.0003 0.9 (0.83–0.99) 0.040.0007 0.9 (0.81–0.98) 0.010.20 1.05 (0.77–1.33) 0.700.60 0.87 (0.6–1.3) 0.500.70 0.93 (0.81–1.03) 0.200.80 1.14 (0.62–1.9) 0.600.80 0.91 (0.25–2.3) 0.900.90 1.0 (0.98–1.02) 0.900.80 1.0 (0.96–1.03) 0.900.10 1.03 (0.95–1.12) 0.400.20 1.01 (0.98–1.05) 0.400.03 0.6 (0.2–2.1) 0.400.90 1.02 (0.9–1.2) 0.800.80 0.96 (0.65–1.3) 0.900.80 0.5 (0.1–1.25) 0.150.001 0.86 (0.57–1.2) 0.40
�0.0001 0.85 (0.74–0.97) 0.010.30 0.97 (0.96–1.00) 0.056
�0.0001 0.85 (0.72–1.0) 0.050.03 0.42 (0.08–1.16) 0.100.10 1.2 (0.87–1.7) 0.30
0.10 1.02 (0.96–1.11) 0.400.40 1.6 (0.5–5.6) 0.600.07 0.77 (0.26–1.5) 0.400.007 1.9 (0.9–4.3) 0.080.30 0.82 (0.54–1.22) 0.300.70 1.08 (0.3–2.7) 0.800.30 1.05 (1.01–1.1) 0.0040.30 5.1 (1.3–22.8) 0.020.50 1.03 (1.01–1.06) 0.0030.005 1.05 (0.92–1.2) 0.400.04 1.25 (0.94–1.6) 0.100.006 1.4 (1.0–2.1) 0.04
0.007 1.07 (0.96–1.2) 0.200.10 0.97 (0.89–1.06) 0.600.20 0.78 (0.5–1.08) 0.150.300.90 1.01 (0.9–1.13) 0.800.60 1.5 (0.33–6.6) 0.60
0.0007 1.07 (0.98–1.19) 0.090.003 1.08 (0.99–1.19) 0.060.02 1.0 (0.65–1.56) 0.900.001 1.14 (0.99–1.36) 0.060.001 1.12 (0.94–1.36) 0.20
dial annulus. †Interval between cessation and onset of TR flow divided by theme. §Deceleration time of early mitral inflow. �Interval between the onset andf RA pressure using the inferior vena cava method.
ity o
ailu
.95)
.95)
.34)
.2)
.04)
.42)
.9)
.01)
.02)
.01)
.01)
.92)
.11)
.15)).85).91).0).89)).5)
.0)).0)).12)).04)).01).25).55))
.2)
.01)
.06)
.0)
.07))
5).96)3).93).99)
f meon tiion o
mpact on outcome (OR: 0.38; 95% CI: 0.1 to 0.9;

sadeeRprst(oi3ha
sd
ap
J A C C : C A R D I O V A S C U L A R I M A G I N G , V O L . 4 , N O . 3 , 2 0 1 1
M A R C H 2 0 1 1 : 2 1 1 – 2 2
Topilsky et al.
Echocardiographic Predictors of LVAD Outcome
218
p � 0.03 for every increase in EROA by 1 cm2).The most significant predictor of the clinical out-come was TRDc. Short TRDc was predictive of thecompound 30-day outcome (OR: 0.83; 95% CI:0.74 to 0.91; p � 0.0001) and in-hospital mortality(OR: 0.85; 95% CI: 0.74 to 0.97; p � 0.01).
The derivatives of TR flow time, including theshortened sum of isovolumic contraction and relax-ation, and RIMP were all predictors of worstcompound 30-day outcome but not of early mor-tality (Table 3).
Multivariate analysis based on logistic regressionusing only echocardiographic parameters demon-strated that the accuracy of predicting the 30-daycompound adverse outcome was maximal whenincorporating LVEDD and TRDc (Table 4). RApressure and all the clinical scores were predictive ofthe combined event on univariate analysis (Table 3)and marginally increased the C-index of the echo-cardiographic logistic model (from 0.81 for echo-cardiography alone to 0.83) (Table 4).
To further evaluate whether the proposed echo-cardiographic variables retained their predictivevalue after adjusting for the other baseline differ-ences between the groups (New York Heart Asso-ciation [NYHA] functional class, the percentageof destination therapy, etiology of heart disease,Lietz-Miller score, and right-heart pressure), wematched each subject in the group positive for the30-day compound adverse outcome with a patientfrom the group considered to have normal 30-dayoutcomes for age, gender, and all baseline differ-ences (Table 1).
We found that the predictive value of LVEDD(OR: 0.88; 95% CI: 0.8 to 0.95; p � 0.0007),LVESD (OR: 0.89; 95% CI: 0.82 to 0.96; p �
Table 4. Multivariate Analysis of Predictors of Compound 30-DaProlonged Inotropic Support) in Patients Undergoing LVAD Imp
EchocardiographyAlone
Adjusted for RAPressure
LV diastolic diameter 0.06 0.06
TRDc* 0.001 0.006
RA pressure 0.6
Lietz-Miller score
Matthews score
Kormos score
p Value �0.0001 �0.0001
Hosmer-Lemeshow 0.98 0.97
C-index 0.81 0.83
*Interval between onset and cessation of TR flow divided by the square root o
Abbreviations as in Table 1.0.003), TRDc (OR: 0.82; 95% CI: 0.69 to 0.93;p � 0.001), TR � RV ejection time (OR: 0.97;95% CI: 0.95 to 0.99; p � 0.001), and RIMP (OR:0.64; 95% CI: 0.4 to 0.93; p � 0.02) for thecombined 30-day adverse end point remained sig-nificant (Table 3) even after the matching process.Intraobserver and interobserver variability. Compari-on of intraobserver timing intervals showed goodgreement between measurements: TRDc (meanifference 0.71 � 15.4 ms, r � 0.97, p � 0.86), RVjection time corrected for heart rate (mean differ-nce �0.1 � 9.8 ms, r � 0.98, p � 0.97), andIMP (mean difference 0.003 � 0.066, r � 0.95,� 0.86). The Bland-Altman plot showed a
andom scatter of points around 0, indicating noystematic bias or measurement error proportionalo the measurement value. Measurement variabilitywithin-subject coefficient of variation and 95% CIf the Bland-Altman method) for measurements ofntraobserver differences was as follows: TRDc,.3% and �8.9 ms; RV ejection time corrected foreart rate, 3.2% and �5.6 ms; and RIMP, 10.1%nd �0.04.
Comparison of interobserver timing intervalshowed good agreement as well: TRDc (meanifference �3.7 � 25.6 ms, r � 0.92, p � 0.60), RV
ejection time corrected for heart rate (mean differ-ence 5.0 � 10.0 ms, r � 0.97, p � 0.10), and RIMP(mean difference �0.04 � 0.12, r � 0.84, p �0.30). Measurement variability for measurements ofinterobserver differences was as follows: TRDc, 5.0%and �14.8 ms; RV ejection time corrected for heartrate, 3.3% and �5.8 ms; and RIMP, 17% and �0.06.Long-term mortality. The mean follow-up durationfter surgery was 270.1 � 262.8 days. Eighteenatients (21.7%) died and 11 patients had their
dverse Event (In-Hospital Mortality, Need for RVAD, ortation
Adjusted for Lietz-MillerScore
Adjusted forMatthews Score
Adjusted forKormos Score
0.05 0.08 0.08
0.005 0.001 0.01
0.09
0.2
0.6
�0.0001 0.0001 0.0001
0.5 0.7 0.7
0.83 0.83 0.83
RR interval.
y Alan
f the

r
J A C C : C A R D I O V A S C U L A R I M A G I N G , V O L . 4 , N O . 3 , 2 0 1 1
M A R C H 2 0 1 1 : 2 1 1 – 2 2
Topilsky et al.
Echocardiographic Predictors of LVAD Outcome
219
LVAD explanted for heart transplantation duringthe follow-up period. The causes of death in pa-tients surviving the index hospitalization were trau-matic head injury in 3, hemorrhagic stroke in 2, andunexplained sudden death in 2; 1 patient decided towithdraw support. The actuarial survival rate was77.4 � 5.5% and 62.6 � 9.2% at 1 and 2 years,espectively.
TRDc and its derivative RV ejection time � TRflow time were the only echocardiographic predic-tors of long-term survival, with adjusted risk ratiosfor death from any cause of 0.89 (95% CI: 0.83 to0.96; p � 0.003) and 0.9 (95% CI: 0.82 to 0.99; p �0.03), respectively. Of note, neither RA pressurenor any of the clinical scores predicted long-termmortality in our models. We defined cardiovascularmortality as mortality related to intractable heartfailure or arrhythmic death. TRDc was predictive ofcardiac-related death (OR: 0.88; 95% CI: 0.77 to0.98; p � 0.03) but not of noncardiac causes ofdeath (OR: 0.92; 95% CI: 0.82 to 1.04; p � 0.20).
The echocardiographic parameters were first di-chotomized at the 10th, 25th, 33rd, 50th, 66th,75th, and 90th percentiles, and the percentile valuewith the lowest p value was chosen as the thresholdfor the Kaplan-Meier analyses.
The dichotomization took place at the 50thpercentile for TRDc (461 ms). TRDc �461 ms wasa strong predictor of mortality, with an adjusted ORof 2.3 (95% CI: 1.3 to 4.9; p � 0.03) compared witha longer TRDc. The 2-year survival rate was sig-nificantly lower in those with TRDc �461 ms (28.8� 21.1%) compared with patients with longerTRDc (85.7 � 8.5%) (Fig. 2). We comparedNYHA functional class and 6-min walking distance3 months after LVAD surgery in patients withprolonged or short TRDc before surgery. Morepatients were in NYHA functional class III or IV 3months after surgery among those with TRDc�461 ms before surgery compared with patientswith prolonged TRDc (58.8% vs. 19.2%, p �0.008). There was a trend for decreased 6-minwalking distance in patients with pre-operativeTRDc �461 ms (278 vs. 366.2 m, p � 0.10) 3months after surgery.
The dichotomization for LVEDD took place atthe 33rd percentile (63 mm), and we classifiedpatients as having relatively small left ventricles(LVEDD � 63 mm) or larger left ventricles(LVEDD � 63 mm). Although a small increase inmortality could be appreciated, the survival curves
coalesced after 18 months (Fig. 3).D I S C U S S I O N
This study is among the first to report echocardio-graphic predictors of outcomes after LVAD sur-gery. We found that early adverse events werepredicted by the presence of a relatively small leftventricle and shorter TR flow duration at the timeof LVAD therapy. It was interesting to note thatnone of the LV functional parameters influenced
Figure 2. Kaplan-Meier Estimates of the Mean � SE Rates of OvPatients After LVAD Surgery According to the TRDc
The 1-year and 2-year survival rates were low in patients with tricuduration corrected for heart rate (TRDc) �461 ms and markedly imwith longer TRDc. Values in parentheses are survival rates at 1 andventricular assist device.
Figure 3. Kaplan-Meier Estimates of the Mean � SE Rates of OvPatients After LVAD Surgery According to LV Diameter
Although an increase in early mortality could be appreciated, the scoalesced after 18 months. Values are survival rates at 1 year. LV �
erall Survival Among
spid regurgitationproved in patients2 years. LVAD � left
erall Survival Among
urvival curvesleft ventricular;
LVAD � left ventricular assist device.
secdtoT“ctLlTssfsmus
ffm
sa
pha(
irpfnt
p(eob
tictLpiitttiipvpr(mdmwsmtsafectaopiiaad
J A C C : C A R D I O V A S C U L A R I M A G I N G , V O L . 4 , N O . 3 , 2 0 1 1
M A R C H 2 0 1 1 : 2 1 1 – 2 2
Topilsky et al.
Echocardiographic Predictors of LVAD Outcome
220
outcomes. However, it is not surprising, given howeffective an LVAD is in replacing LV function.Long-term mortality was predicted by a shortTRDc (or its derivatives) as well.LV diameter. A relatively small LV internal dimen-ion (�63 mm) was found to pose an early postop-rative problem. In patients with LVAD, an in-rease in revolutions per minute may cause aiminution of the LV cavity, shifting the interven-ricular septum to the left. This in turn impairs RVutput, diminishing the LV cavity even further.his worsening spiral, sometimes referred to as the
suck-down event,” may cause the septum to en-roach upon the inflow cannula, resulting in ven-ricular arrhythmias or drastically decreasingVAD preload. We believe that a relatively smaller
eft ventricle may increase the risk for such events.o minimize this risk, our practice in setting the
peed early post-operatively is to use a rampedpeed study using echocardiographic guidance be-ore discharge. We generally use a fixed speedetting that falls midway between the minimal andaximal speeds on the basis of changes in ventric-
lar dimensions, the position of the interventriculareptum, and the frequency of aortic valve opening.
Patients with relatively small, hypertrophic leftventricle may present unique issues during surgery.In 2 patients, we had to perform a limited myo-mectomy of mid-septal muscle away from theseptum to relieve the inflow tract to the pump. It isreassuring to note that the impact of a relativelysmall ventricle (�63 mm) on outcomes is shortlived and that the actuarial survival after more than18 months is comparable with that in patients withlarger left ventricles (Fig. 3). We believe that thesize of the left ventricle should not be considered acontraindication to this sometimes crucial therapy.However, LVAD implantation in patients withrelatively small left ventricles should be consideredhigher risk surgery and be performed only at centerswith high volume and expertise.Predictors of RV dysfunction and mortality. RV dys-unction is very common in patients with severe LVailure and was shown to contribute to perioperativeortality (2,3,7) as well as decreased long-term survival.In the present study, TRDc was found to be the
trongest echocardiographic predictor of short-termnd long-term outcomes.
An increased RIMP ratio was previously shown toredict outcomes in patients with primary pulmonaryypertension and restrictive and dilated cardiomyop-thy (13,14,16). Evidence of a prolonged RV systole
corresponding to the duration of holosystolic TR, including the periods of isovolumic contraction andelaxation), was shown to predict adverse outcomes inatients with heart failure (13). To our surprise, weound that in our patient population, a short (pseudo-ormalized) duration of TR was the best predictor ofotal and cardiac mortality.
There are a few principal differences between ouratients and the patients described by others13,14,16). First, all patients in our study hadnd-stage heart failure (NYHA functional class IIIbr IV). Second, 44% of our patients had severe TRefore LVAD surgery.During the early phases of RV dysfunction, as
he rate of contraction and relaxation decreases, thesovolumic contraction and relaxation periods be-ome prolonged. Furthermore, the pulmonary ar-ery pressure usually increases because of increasedV filling pressure. The increase in end-diastoliculmonary pressure without a concomitant increasen end-diastolic RV pressure results in increasedsovolumic contraction time because the pressure inhe right ventricle must rise to a higher point to reachhe pressure in the pulmonary artery immediately afterricuspid valve closure (Fig. 1B). Furthermore, thencrease in pulmonary artery systolic pressure resultsn an equal rise in RV systolic pressure, so once theulmonary valve has closed the pressure in the rightentricle must fall from a higher point to reach theressure of the right atrium, increasing isovolumicelaxation and holosystolic periods even furtherFig. 1B). The increase in the systolic and isovolu-ic period is expected as long as the RV end-
iastolic pressure and RA pressure are within nor-al limits and ejection time is preserved. In patientsith extreme heart failure, RV peak systolic pres-
ure may decrease secondary to the markedly di-inished contractility and stroke volume. The ejec-
ion period usually shortens (evidence of decreasedtroke volume), and the end-diastolic pulmonaryrtery pressure and end-systolic RV pressure mayall. Furthermore, end-diastolic RV pressure andnd-systolic RA pressure (V wave) increase, de-reasing the pressure differences from the time ofricuspid valve closure to pulmonary valve openingnd pulmonary valve closure to tricuspid valvepening, respectively (Fig. 1A). Those changes inressure difference shorten isovolumic contraction,sovolumic relaxation, and the holosystolic timenterval (Fig. 1A). One should also note thatlthough they are called isovolumic indexes, therere in fact large changes of ventricular volumeuring these time intervals, when tricuspid valve
nsufficiency flow is significant Thus, the main
m
s3cow
rfifipIvpitsda
nftscGrvwRtrnmut
J A C C : C A R D I O V A S C U L A R I M A G I N G , V O L . 4 , N O . 3 , 2 0 1 1
M A R C H 2 0 1 1 : 2 1 1 – 2 2
Topilsky et al.
Echocardiographic Predictors of LVAD Outcome
221
determinant of “isovolumic relaxation time” maycease to be the rate of ventricular relaxation(14,16,17) but may be determined by the end-systolic RA pressure (V wave), causing the tricuspidvalve to open earlier, on the steeper curve ofventricular relaxation, thereby shortening the “iso-volumic” relaxation interval and the derived holo-systolic period even further (Fig. 1A).
To analyze the significance of each of the Dopplertime events, we compared them with the hemody-namic indexes in 20 patients in whom the echocar-diographic and hemodynamic evaluations were per-formed �48 h apart (Table 5). A short TR flowduration was correlated with high RA pressure and alow RV to RA pressure difference, implying markedlyincreased RA pressure and reduced systolic pressuregeneration, consistent with a right ventricle workingon the “flat portion” of its Frank-Starling curve andadvanced RV diastolic dysfunction (Table 5).
In conclusion, we believe that the TRDc is aU-shaped risk factor in patients with right-heartdisease. Increased duration is a risk factor in theearly stages of disease (evidence of impaired relax-ation), but a “pseudonormalized” TRDc, reflectingincreased RV filling pressure, implies advanced RVfailure and predicts the worst outcome. Of interest, wehave shown that patients after LVAD surgery withprolonged TR duration have excellent 2-year survival(85.7 � 8.5%) and 3-month functional outcomes,
ost probably related to the recovery of RV function.Increase in Lietz-Miller, Matthews, and Kormos
cores were associated with a higher prevalence of0-day mortality or severe RV dysfunction. This isonsistent with previous studies (7,18–21). Ourverall Lietz-Miller, Matthews, and Kormos scoresere 9.7 � 5.7, 1.1 � 2.2, and 1.8 � 1.9,
Table 5. Correlation of Hemodynamic Parameters With Echocar
HemodynamicVariable
Correlation WithTRDc
Correlation With RVTime Correcte
RA V-wave �0.39 �0.2
RA A-wave �0.2 �0.37
RA mean pressure �0.46* 0.03
RV systolic pressure 0.51* �0.39
RV diastolic pressure 0.02 �0.41
PA mean pressure 0.39 0.02
RV dP/dt �0.05 �0.13
Stroke volume 0.18 0.68‡
RV PP 0.72‡ �0.36
PVR 0.45* �0.37
PAP-RA mean 0.74‡ 0.01
*p � 0.05; †p � 0.01; ‡p � 0.001.
PAP � pulmonary artery pressure; PP � pulse pressure; other abbreviations as inespectively, with only a minority of patients strati-ed as high risk. This is probably one of the reasonsor our low perioperative mortality. It also seems tomply a progress in our patient selection process,ositively influenced by the introduction of the scores.mportantly, echocardiographic analysis has addedalue to clinical and hemodynamic risk assessment inatients requiring LVAD. We believe that the mostmportant factor in reducing the morbidity and mor-ality of LVAD therapy may be a timely institution ofurgery before the development of profound RVysfunction, evidenced by early equalization of RVnd RA pressure.Study limitations. Because of the relatively small
umber of patients, some potentially important riskactors might not have been entered into the mul-ivariate analysis model. The results of the presenttudy were based on a retrospective analysis, whicharries limitations associated with the data source.iven the exploratory nature of the results and the
elatively limited number of patients in the multi-ariate model, validation in larger patient samplesill be required. Our use of TR flow to define theV holosystolic period includes the time equivalent
o the sum of isovolumic contraction, isovolumicelaxation periods, and ventricular contraction, butot the electromechanical delay. Regurgitant floway end before tricuspid valve closure, thereby
nderestimating the duration of systole. However,his is likely not a substantial phenomenon.
C O N C L U S I O N S
Early mortality and need for prolonged inotropicsupport after LVAD surgery seem to be predomi-nantly determined by a relatively smaller left ven-
raphic Doppler–Derived Time Variables
tion Correlation WithRIMP
Correlation With TR Time � RVEjection Time
Co
�0.55† �0.71‡
�0.3 �0.6†
�0.54* �0.67‡
0.52* 0.23
0.16 �0.003
0.22 0.08
�0.36 �0.48*
�0.15 0.2
0.85‡ 0.83‡
0.64† 0.42
0.65† 0.62†
diog
Ejecd
rrelation With PeakTR Velocity
0.02
0.13
�0.06
0.71‡
0.14
0.61†
0.5‡
0.25
0.83‡
0.46*
0.68‡
Table 1.

apcPR
MG
J A C C : C A R D I O V A S C U L A R I M A G I N G , V O L . 4 , N O . 3 , 2 0 1 1
M A R C H 2 0 1 1 : 2 1 1 – 2 2
Topilsky et al.
Echocardiographic Predictors of LVAD Outcome
222
tricle (�63 mm) and the degree of RV dysfunction,reflected by rapid equalization of RV and RApressure (TRDc � 461 ms). Prediction of earlydverse outcomes is improved by echocardiographicarameters when added to the previously suggestedlinical scores or invasive hemodynamic variables.atients with no evidence of early equalization ofV and RA pressure during systole are expected to
8. Lang RM, Bierig M, Devereux RB, etal. Recommendations for chamber
1
1
1
1
1
ular function. J Am1996;9:838–47.
after LVAD surgery. Given the extensive modeland exploratory nature of the results, validation inlarger patient samples is required.
Reprint requests and correspondence: Dr. Soon J. Park,ayo Clinic, St. Mary’s Hospital, 2nd Street SW,O-138SE, Rochester, Minnesota 55902. E-mail:
have excellent short-term and long-term outcome [email protected].
R E F E R E N C E S
1. Rose EA, Gelijns AC, Moskowitz AJ,et al. Long-term mechanical left ven-tricular assistance for end-stage heart fail-ure. N Engl J Med 2001;345:1435–43.
2. Slaughter MS, Rogers JG, MilanoCA, et al. Advanced heart failuretreated with continuous-flow left ven-tricular assist device. N Engl J Med2009;361:2241–51.
3. Miller LW, Pagani FD, Russell SD,et al. Use of a continuous-flow devicein patients awaiting heart transplanta-tion. N Engl J Med 2007;357:885–96.
4. Miller LW, Nelson KE, Bostic RR,Tong K, Slaughter MS, Long JW.Hospital costs for left ventricular assistdevices for destination therapy: lowercosts for implantation in the post-REMATCH era. J Heart LungTransplant 2006;25:778–84.
5. Matthews JC, Koelling TM, PaganiFD, Aaronson KD. The right ventric-ular failure risk score a pre-operativetool for assessing the risk of rightventricular failure in left ventricularassist device candidates. J Am CollCardiol 2008;51:2163–72.
6. Kormos RL, Teuteberg JJ, PaganiFD, et al. Right ventricular failure inpatients with the HeartMate IIcontinuous-flow left ventricular assistdevice: incidence, risk factors, and ef-fect on outcomes. J Thorac CardiovascSurg 2010;139:1316–24.
7. Lietz K, Long JW, Kfoury AG, et al.Outcomes of left ventricular assist de-vice implantation as destination ther-apy in the post-REMATCH era: im-plications for patient selection.Circulation 2007;116:497–505.
quantification: a report from theAmerican Society of Echocardiogra-phy’s Guidelines and Standards Com-mittee and the Chamber Quantifica-tion Writing Group, developed inconjunction with the European Asso-ciation of Echocardiography, a branchof the European Society of Cardiol-ogy. J Am Soc Echocardiogr 2005;18:1440–63.
9. Kircher BJ, Himelman RB, SchillerNB. Noninvasive estimation of rightatrial pressure from the inspiratorycollapse of the inferior vena cava.Am J Cardiol 1990;66:493–6.
0. Zoghbi WA, Enriquez-Sarano M,Foster E, et al. Recommendations forevaluation of the severity of nativevalvular regurgitation with two-dimensional and Doppler echocardi-ography. J Am Soc Echocardiogr2003;16:777–802.
1. Enriquez-Sarano M, Avierinos JF,Messika-Zeitoun D, et al. Quantita-tive determinants of the outcome ofasymptomatic mitral regurgitation.N Engl J Med 2005;352:875–83.
2. Hammarstrom E, Wranne B, PintoFJ, Puryear J, Popp RL. Tricuspidannular motion. J Am Soc Echocar-diogr 1991;4:131–9.
3. Friedberg MK, Silverman NH. Thesystolic to diastolic duration ratio inchildren with hypoplastic left heartsyndrome: a novel Doppler index ofright ventricular function. J Am SocEchocardiogr 2007;20:749–55.
4. Tei C, Dujardin KS, Hodge DO, etal. Doppler echocardiographic indexfor assessment of global right ventric-
Soc Echocardiogrl
15. Kligfield P, Lax KG, Okin PM. QTinterval-heart rate relation during ex-ercise in normal men and women:definition by linear regression analysis.J Am Coll Cardiol 1996;28:1547–55.
16. Tei C, Nishimura RA, Seward JB,Tajik AJ. Noninvasive Doppler-derived myocardial performance in-dex: correlation with simultaneousmeasurements of cardiac catheteriza-tion measurements. J Am Soc Echo-cardiogr 1997;10:169–78.
17. Dambrauskaite V, Delcroix M, ClausP, et al. The evaluation of pulmonaryhypertension using right ventricularmyocardial isovolumic relaxation time.J Am Soc Echocardiogr 2005;18:1113–20.
18. Lietz K, Miller LW. Patient selectionfor left-ventricular assist devices. CurrOpin Cardiol 2009;24:246–51.
19. Miller LW, Lietz K. Candidate selec-tion for long-term left ventricular as-sist device therapy for refractory heartfailure. J Heart Lung Transplant2006;25:756–64.
20. Oz MC, Goldstein DJ, Pepino P, etal. Screening scale predicts patientssuccessfully receiving long-term im-plantable left ventricular assist devices.Circulation 1995;92:II169–73.
21. Rao V, Oz MC, Flannery MA, Cata-nese KA, Argenziano M, Naka Y.Revised screening scale to predict sur-vival after insertion of a left ventricularassist device. J Thorac CardiovascSurg 2003;125:855–62.
Key Words: echocardiography y
eft ventricular assist device.


