Embed Size (px)
Citation preview
HAL Id: tel-01275833https://tel.archives-ouvertes.fr/tel-01275833
Submitted on 18 Feb 2016
HAL is a multi-disciplinary open accessarchive for the deposit and dissemination of sci-entific research documents, whether they are pub-lished or not. The documents may come fromteaching and research institutions in France orabroad, or from public or private research centers.
L’archive ouverte pluridisciplinaire HAL, estdestinée au dépôt et à la diffusion de documentsscientifiques de niveau recherche, publiés ou non,émanant des établissements d’enseignement et derecherche français ou étrangers, des laboratoirespublics ou privés.
Development of copolymer based nanocarriers forimaging and therapy
Alexandra Arranja
To cite this version:Alexandra Arranja. Development of copolymer based nanocarriers for imaging and therapy. Other.Université de Strasbourg, 2015. English. �NNT : 2015STRAE031�. �tel-01275833�
UNIVERSITÉ DE STRASBOURG
ÉCOLE DOCTORALE DE PHYSIQUE ET CHIMIE-PHYSIQUE
Institut Charles Sadron
THÈSE présentée par:
Alexandra ARRANJA
soutenue le: 20 Novembre 2015
pour obtenir le grade de: de Strasbourg
Discipline/ Spécialité: Physique et Chimie-Physique
Développement de nanovéhicules à base de copolymères pour
l'imagerie et la thérapie
THÈSE dirigée par :
M. SCHOSSELER François Directeur de thèse, Université de Strasbourg
M. MENDES Eduardo Codirecteur de thèse, TUDelft
RAPPORTEURS :
M. TILLEMENT Olivier Rapporteur externe, Université Claude Bernard
M. CHASSENIEUX Christophe Rapporteur externe, Université du Maine
AUTRES MEMBRES DU JURY :
M. SCHAAF Pierre Examinateur interne, Université de Strasbourg
M. LAMMERS Twan Examinateur, RWTH Aachen University Clinic
Alexandra ARRANJA
Développement de nanovéhicules à base de copolymères pour
l'imagerie et la thérapie
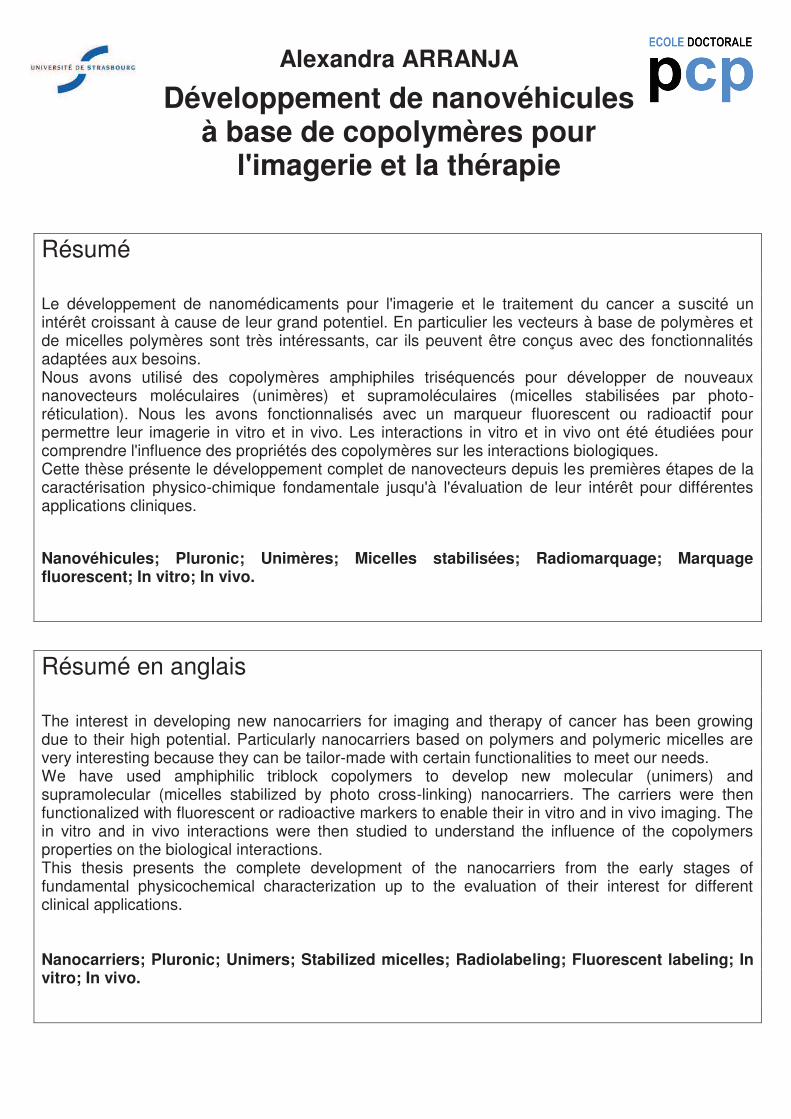
Résumé
Le développement de nanomédicaments pour l'imagerie et le traitement du cancer a suscité un intérêt croissant à cause de leur grand potentiel. En particulier les vecteurs à base de polymères et de micelles polymères sont très intéressants, car ils peuvent être conçus avec des fonctionnalités adaptées aux besoins. Nous avons utilisé des copolymères amphiphiles triséquencés pour développer de nouveaux nanovecteurs moléculaires (unimères) et supramoléculaires (micelles stabilisées par photo-réticulation). Nous les avons fonctionnalisés avec un marqueur fluorescent ou radioactif pour permettre leur imagerie in vitro et in vivo. Les interactions in vitro et in vivo ont été étudiées pour comprendre l'influence des propriétés des copolymères sur les interactions biologiques. Cette thèse présente le développement complet de nanovecteurs depuis les premières étapes de la caractérisation physico-chimique fondamentale jusqu'à l'évaluation de leur intérêt pour différentes applications cliniques.
Nanovéhicules; Pluronic; Unimères; Micelles stabilisées; Radiomarquage; Marquage fluorescent; In vitro; In vivo.
Résumé en anglais
The interest in developing new nanocarriers for imaging and therapy of cancer has been growing due to their high potential. Particularly nanocarriers based on polymers and polymeric micelles are very interesting because they can be tailor-made with certain functionalities to meet our needs. We have used amphiphilic triblock copolymers to develop new molecular (unimers) and supramolecular (micelles stabilized by photo cross-linking) nanocarriers. The carriers were then functionalized with fluorescent or radioactive markers to enable their in vitro and in vivo imaging. The in vitro and in vivo interactions were then studied to understand the influence of the copolymers properties on the biological interactions. This thesis presents the complete development of the nanocarriers from the early stages of fundamental physicochemical characterization up to the evaluation of their interest for different clinical applications. Nanocarriers; Pluronic; Unimers; Stabilized micelles; Radiolabeling; Fluorescent labeling; In vitro; In vivo.
Development of copolymer-based
nanocarriers for imaging and therapy
Alexandra ARRANJA
Master of Science in Pharmaceutical Sciences,
Faculty of Pharmacy, University of Lisbon, Portugal

This research has been funded by the People Programme (Marie Curie Actions) of
(FP7/2007-2013) under the REA
grant agreement no. PITN-GA-2012-
The research leading to these results has been carried out in the following institutions:

1
Table of Contents
Acknowledgments ................................................................................................... 5
General overview of the thesis and outline ........................................................... 7
Outline scheme ........................................................................................................ 9
1 Background and Introduction ............................................................................ 11
1.1 Nanocarriers for biomedical applications ............................................................ 11
1.1.1 Nanocarriers for imaging and therapy ............................................................................... 13
1.1.2 Strategies exploited by nanocarriers for tumor targeting ............................................... 13
1.1.2.1 Active targeting ....................................................................................................... 14
1.1.2.2 Passive targeting ...................................................................................................... 14
1.1.3 Biophysical barriers to nanocarriers delivery ..................................................................... 15
1.1.4 Remaining challenges and limitations ................................................................................ 17
1.2 Imaging modalities ................................................................................................. 18
1.3 Nuclear Imaging ..................................................................................................... 19
1.3.1 Radioisotopes .......................................................................................................................... 20
1.3.2 Positron Emission Tomography (PET) .................................................................................... 23
1.3.3 Single Photon Emission Computed tomography (SPECT) ............................................... 24
1.3.4 111Indium .................................................................................................................................... 25
1.3.5 Complexation of isotopes ..................................................................................................... 25
1.4 General aspects of block copolymers .................................................................. 27
1.5 Pluronic block copolymers ..................................................................................... 28
1.5.1 Properties and applications .................................................................................................. 28
1.5.2 Micellization and phase transitions ...................................................................................... 29
1.5.3 Micelles stability ....................................................................................................................... 31
1.5.4 Dynamics and kinetics of Pluronic micelles ....................................................................... 32
1.6 Dynamic Light Scattering ........................................................................................ 34
1.6.1 Multi-angle analysis ................................................................................................................. 38
1.6.2 Guinier and out of Guinier regimens ................................................................................... 39
1.6.3 Semi-dilute range .................................................................................................................... 41
1.6.4 Polydispersity effects............................................................................................................... 42
2 Lack of a unique kinetic pathway in the growth and decay of Pluronic micelles .................................................................................................... 43
2.1 Introduction ............................................................................................................. 45
2.2 Experimental section .............................................................................................. 47
2.2.1 Polymers purification and characterization ....................................................................... 47
2.2.2 Samples preparation .............................................................................................................. 48
2.2.3 Dynamic Light Scattering ...................................................................................................... 48
2.2.4 Data analysis ............................................................................................................................ 49
2
2.3 Results and Discussion ............................................................................................ 51
2.3.1 Polymers characterization ..................................................................................................... 51
2.3.1.1 Size exclusion chromatography and purification ............................................. 51
2.3.1.2 1H-NMR ....................................................................................................................... 52
2.3.1.3 Micro Differential Scanning Calorimetry (MicroDSC) ....................................... 54
2.3.2 Micellar growth and decay stability of Pluronic micelles................................................ 58
2.3.2.1 Total scattered intensity ......................................................................................... 59
2.3.2.2 Analysis of the Intensity Correlation Functions (ICFs) ........................................ 59
2.3.2.3 Stability after temperature decrease .................................................................. 64
2.3.3 General remarks about crossover artefacts ...................................................................... 64
2.3.4 Kinetic pathways of micellar growth ................................................................................... 66
2.3.5 Stability of micellar structures after temperature decrease ........................................... 70
2.3.6 Comparison with previous studies ....................................................................................... 71
2.4 Conclusions ............................................................................................................. 75
3 Development and functionalization of Pluronic nanocarriers ........................ 77
3.1 Introduction ............................................................................................................. 79
3.1.1 Molecular and supramolecular nanocarriers .................................................................... 79
3.1.2 Stabilization strategies of dynamic micelles ...................................................................... 79
3.1.3 Stabilization of Pluronic micelles ........................................................................................... 80
3.1.4 Functionalization of nanocarriers ......................................................................................... 82
3.2 Experimental section .............................................................................................. 83
3.2.1 Preparation of pure polymer solutions ................................................................................ 83
3.2.2 Stabilization of Pluronic micelles by core cross-linking ..................................................... 83
3.2.3 Physicochemical characterization ...................................................................................... 84
3.2.4 Stability of Pluronic cross-linked micelles ............................................................................ 85
3.2.5 Loading of cross-linked micelles with hydrophobic dye ................................................. 86
3.2.6 Functionalization of Pluronic unimers with p-SCN-Bn-DTPA and FITC ........................... 86
3.2.7 Conjugation efficiency of p-SCN-Bn-DTPA to Pluronic unimers ..................................... 88
3.2.8 Preparation of functionalized cross-linked micelles ......................................................... 88
3.2.9 Radiolabeling of Pluronic nanocarriers with 111In and purification ............................... 89
3.2.10 Radiostability in mouse serum and PBS ............................................................................ 89
3.3 Results and Discussion ............................................................................................ 91
3.3.1 Stabilization of Pluronic micelles by core cross-linking ..................................................... 91
3.3.2 Physicochemical characterization of Pluronic nanocarriers .......................................... 94
3.3.3 Stability of Pluronic cross-linked micelles .......................................................................... 101
3.3.4 Loading of cross-linked micelles with a hydrophobic dye ........................................... 103
3.3.5 Functionalization of nanocarriers with FITC and p-SCN-Bn-DTPA ................................ 105
3.3.6 Radiolabeling of Pluronic nanocarriers with 111Indium .................................................. 109
3.3.6.1 Chelation speed of DTPA-111In ............................................................................ 110
3.3.6.2 Conjugation efficiency of p-SCN-Bn-DTPA to Pluronic unimers ................... 111
3.3.6.3 Radiolabeling efficiency of Pluronic nanocarriers .......................................... 112
3.3.6.4 Purification of radiolabeled cross-linked Pluronic micelles............................ 114
3.3.7 Radiostability in mouse serum and buffer ........................................................................ 115
3.5 Conclusions ............................................................................................................117
3
4 In vitro investigation of Pluronic nanocarriers ................................................ 119
4.1 Introduction ............................................................................................................121
4.2 Experimental section .............................................................................................123
4.2.1 Cell culture conditions ......................................................................................................... 123
4.2.2 Generation of fibroblasts growth curves .......................................................................... 123
4.2.3 In vitro cytotoxicity of Pluronic nanocarriers .................................................................... 124
4.2.4 Internalization of Nile Red-loaded stabilized Pluronic micelles and co-localization
with the mitochondria ................................................................................................................... 125
4.2.5 Internalization and intracellular localization of FITC-labelled nanocarriers and co-
localization with the lysosomes .................................................................................................... 126
4.2.6 Cellular uptake and exocytosis .......................................................................................... 126
4.2.7 Clonogenic assay ................................................................................................................. 127
4.2.8 Spheroids penetration and toxicity ................................................................................... 127
4.3 Results and Discussion ...........................................................................................129
4.3.1 In vitro 2D studies .................................................................................................129
4.3.1.1 Optimization of NIH/3T3 cell culture ............................................................................... 129
4.3.1.2 Cytotoxicity of Pluronic nanocarriers ............................................................................. 132
4.3.1.3 Internalization of stabilized micelles loaded with Nile Red and co-localization with
mitochondria in NIH/3T3 fibroblasts ............................................................................................. 137
4.3.1.4 Internalization of FITC-labeled nanocarriers and co-localization with lysosomes in
HeLa and U87 cells ......................................................................................................................... 140
4.3.1.5 Cellular uptake and exocytosis in HeLa Cells............................................................... 145
4.3.1.6 Clonogenic assay .............................................................................................................. 148
4.3.2 In vitro 3D studies .................................................................................................150
4.3.2.1 Penetration of F127-based nanocarriers in tumor spheroids ..................................... 152
4.3.2.2 Spheroids toxicity in the presence P94 and SPM-P94 ................................................. 155
4.4 Conclusions ............................................................................................................157
5 Biodistribution of Pluronic nanocarriers ........................................................... 159
5.1 Introduction ............................................................................................................161
5.2 Experimental section .............................................................................................164
5.2.1 Preparation of radiolabeled nanocarriers ....................................................................... 164
5.2.2 Animal handling .................................................................................................................... 164
5.2.3 SPECT/CT imaging and data analyzing ............................................................................ 165
5.3 Results and Discussion ...........................................................................................167
5.3.1 Biodistribution in healthy mice ............................................................................................ 167
5.3.2 Dynamic scan of F127-DTPA-111In ....................................................................................... 176
5.4 Conclusions ............................................................................................................179
General conclusions and future perspectives .................................................. 181
Appendix I: DLS data analysis ............................................................................................................... 185
Appendix II: Trials to stabilize wormlike micelles ................................................................................ 193
Appendix III: Cross-linking efficiency .................................................................................................... 197
References ............................................................................................................ 199
Resumé en Français ............................................................................................. 211

4
5
Acknowledgments
It is a pleasure to thank to the many people who made this thesis possible.
I have been indebted in the development and preparation of this thesis to my
supervisor, Dr. François Schosseler, who made me feel always welcome, and
whose experience, wise words and availability enabled a critical and positive
discussion of the work. My supervisor gave me the support and
encouragement to overcome the main challenges and difficulties, which was
definitely preponderate for my career progression and life experience.
I would like to gratefully acknowledge the co-supervision of Prof. Dr. Eduardo
Mendes. His vast academic experience and creative ideas were essential to
ensure the success of this work.
I would also like to acknowledge the contribution of the many collaborators at
the Institut Charles Sadron, the Reactor Institut Delft and the ChemE/TUDelft,
whose help in the laboratory work and scientific discussions were important for
the progress of this thesis. A special thanks to Gilles Waton, Adrie Laan, Astrid
van der Meer, Marcel Bus, André Schroder, Mark Schmutz, Philippe Mesini,
Yves Guilbert, Catherine Foussat, Mélanie Legros and Jean-philippe Lamps.
greatly motivated the success of this thesis. I would like to particularly
acknowledge Dr. Antonia Denkova for her patient, supervision during my
secondment in Delft, and fruitful scientific discussions.
The colleagues and ultimately friends that I have made during these 3 years in
France and in The Netherlands were a crucial part for the development of this
thesis and myself. A special thanks to Laurence Jennings, Frank Paulus, Paul
Rouster, Maria Alice Witt, Yasmine Micheletto, Alliny Naves, Heveline
Follmann, Christiane Davi, Pierre Ayoub, Vallín Cruz, Robin De Kruyff and
Laura Bogers.
I also want to thank the informal support of my friends from Portugal which
has been invaluable to me.
Lastly, and most importantly, I wish to thank my family. They have been a
constant source of support (emotional and moral) and encouragement to
achieve my goals. To them I dedicate this thesis.

6
7
General overview of the thesis and outline
This thesis project was funded by the People Programme (Marie Curie Actions)
of the European Union's Seventh Framework Programme (FP7/2007-2013)
project. This Initial Training
Network combines academic and industrial partners from different countries
with a great variety of complementary expertise.
The work reported in this thesis is a result of 3 years research mainly
performed in Strasbourg (Institute Charles Sadron, University of Strasbourg),
including 6 months abroad in Delft (Reactor Institute Delft, Technical
University of Delft) and in Utrecht (MILabs). The fruitful discussions from the
collaboration between the different partners, the research periods abroad, and
the intense multi-disciplinary training were crucial for the completion of this
thesis.
The mains objectives of th project are to produce
radionuclides for nuclear imaging and/or radionuclide therapy, their
incorporation in newly designed polymeric molecular and supramolecular
carriers, and their preclinical evaluation.
In the context of this project, the main goal of this thesis is the development,
characterization and preclinical evaluation of molecular and supramolecular
polymeric nanocarriers with different physicochemical properties.
General overview of the thesis and outline
8
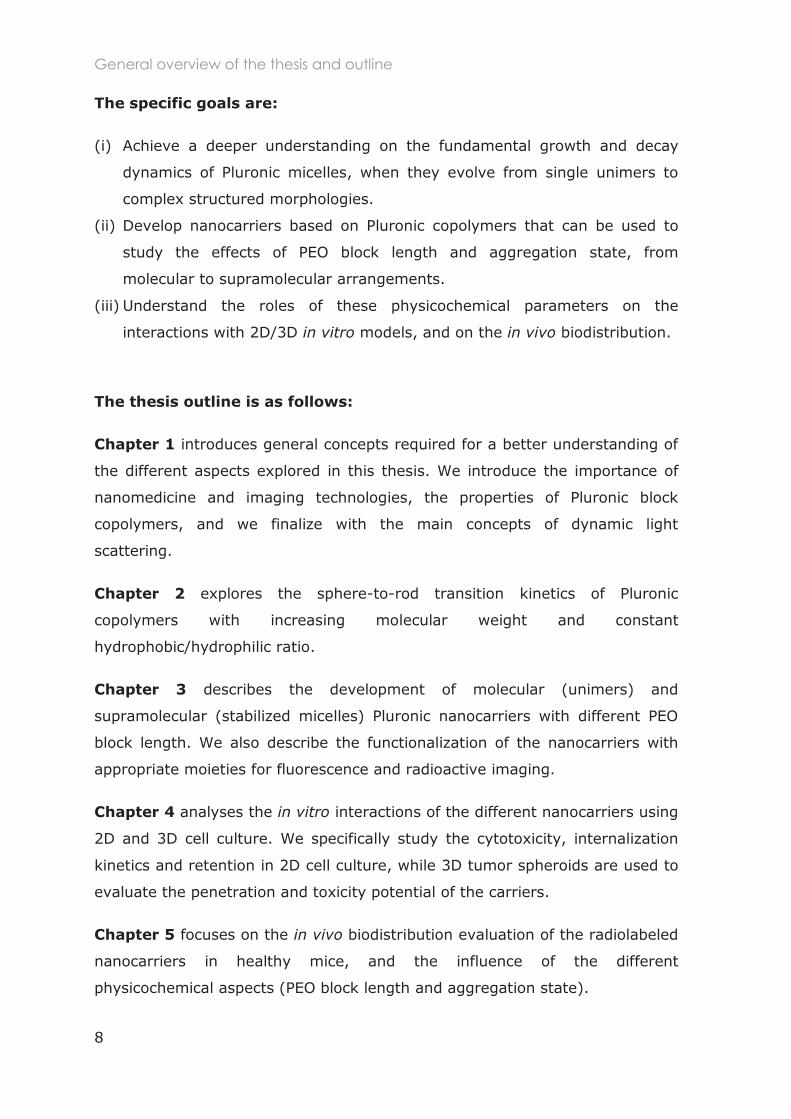
The specific goals are:
(i) Achieve a deeper understanding on the fundamental growth and decay
dynamics of Pluronic micelles, when they evolve from single unimers to
complex structured morphologies.
(ii) Develop nanocarriers based on Pluronic copolymers that can be used to
study the effects of PEO block length and aggregation state, from
molecular to supramolecular arrangements.
(iii) Understand the roles of these physicochemical parameters on the
interactions with 2D/3D in vitro models, and on the in vivo biodistribution.
The thesis outline is as follows:
Chapter 1 introduces general concepts required for a better understanding of
the different aspects explored in this thesis. We introduce the importance of
nanomedicine and imaging technologies, the properties of Pluronic block
copolymers, and we finalize with the main concepts of dynamic light
scattering.
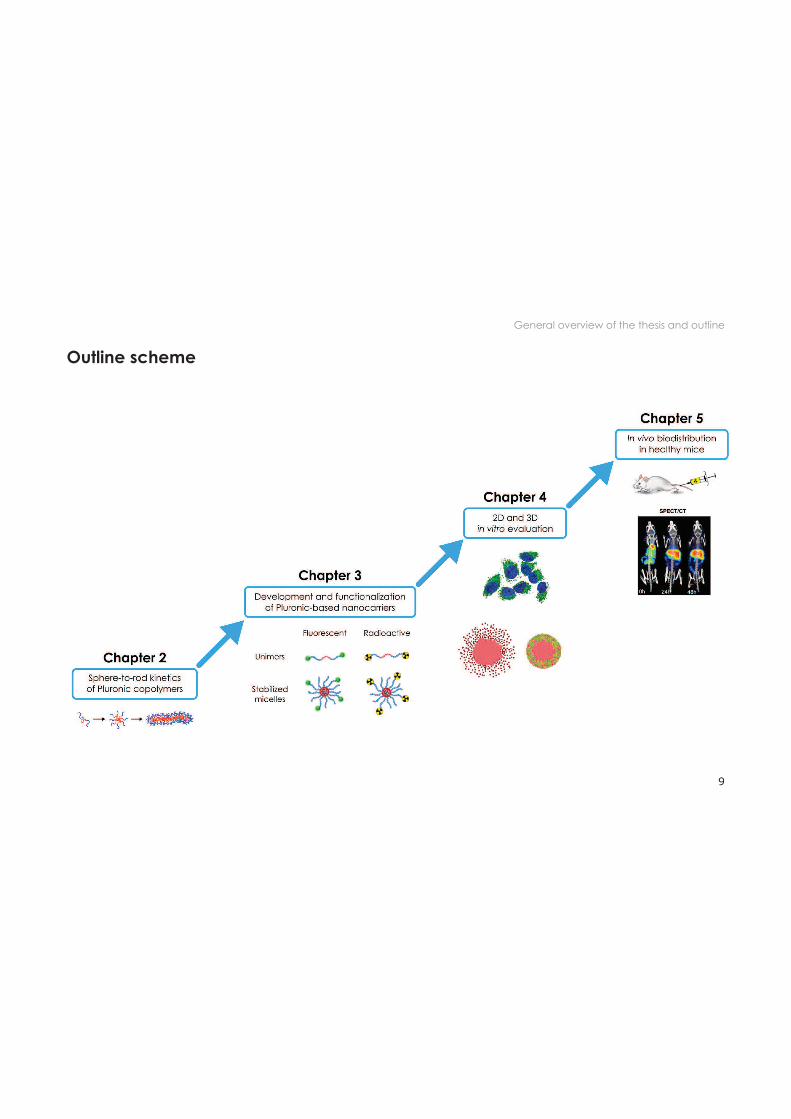
Chapter 2 explores the sphere-to-rod transition kinetics of Pluronic
copolymers with increasing molecular weight and constant
hydrophobic/hydrophilic ratio.
Chapter 3 describes the development of molecular (unimers) and
supramolecular (stabilized micelles) Pluronic nanocarriers with different PEO
block length. We also describe the functionalization of the nanocarriers with
appropriate moieties for fluorescence and radioactive imaging.
Chapter 4 analyses the in vitro interactions of the different nanocarriers using
2D and 3D cell culture. We specifically study the cytotoxicity, internalization
kinetics and retention in 2D cell culture, while 3D tumor spheroids are used to
evaluate the penetration and toxicity potential of the carriers.
Chapter 5 focuses on the in vivo biodistribution evaluation of the radiolabeled
nanocarriers in healthy mice, and the influence of the different
physicochemical aspects (PEO block length and aggregation state).
General overview of the thesis and outline
9
Outline scheme

10
11
CHAPTER 1
Background and Introduction
1.1 Nanocarriers for biomedical applications
There is a continuing interest in the use of nanocarriers for diagnostics and
therapy of diseases, particularly in the field of oncology.
The conventional chemotherapeutic drugs present several disadvantages due
to their low molecular weight and general high hydrophobicity. First, they
display a fast clearance from the body and suffer enzymatic degradation after
intravenous (i.v.) administration. Second, they have a high volume of
distribution which leads to high accumulation and toxicity in healthy tissues,
and low accumulation in the target sites.1 In Figure 1 (left) this effect can be
visualized through the distribution of the chemotherapeutic drugs within the
whole body with low specificity for the tumor site. Moreover, the clearance of
the drugs from the body occurs very fast (Table 1) which reduces the
efficiency of the treatment, while still presenting serious side effects.
To overcome these major drawbacks, a great variety of higher molecular
weight carriers including polymers, micelles, liposomes and metallic
nanoparticles have been proposed and are currently being investigated.2
Chapter 1. Nanocarriers for biomedical applications
12
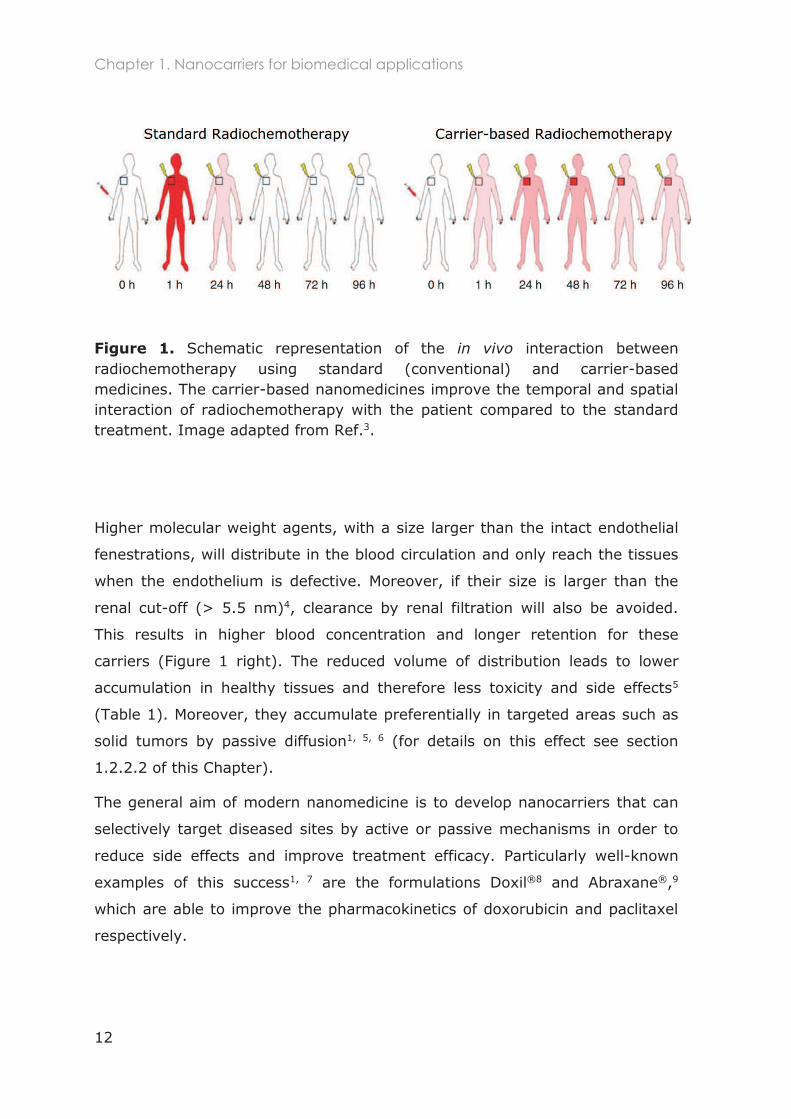
Figure 1. Schematic representation of the in vivo interaction between radiochemotherapy using standard (conventional) and carrier-based medicines. The carrier-based nanomedicines improve the temporal and spatial interaction of radiochemotherapy with the patient compared to the standard treatment. Image adapted from Ref.3.
Higher molecular weight agents, with a size larger than the intact endothelial
fenestrations, will distribute in the blood circulation and only reach the tissues
when the endothelium is defective. Moreover, if their size is larger than the
renal cut-off (> 5.5 nm)4, clearance by renal filtration will also be avoided.
This results in higher blood concentration and longer retention for these
carriers (Figure 1 right). The reduced volume of distribution leads to lower
accumulation in healthy tissues and therefore less toxicity and side effects5
(Table 1). Moreover, they accumulate preferentially in targeted areas such as
solid tumors by passive diffusion1, 5, 6 (for details on this effect see section
1.2.2.2 of this Chapter).
The general aim of modern nanomedicine is to develop nanocarriers that can
selectively target diseased sites by active or passive mechanisms in order to
reduce side effects and improve treatment efficacy. Particularly well-known
examples of this success1, 7 are the formulations Doxil®8 and Abraxane®,9
which are able to improve the pharmacokinetics of doxorubicin and paclitaxel
respectively.
Chapter 1. Nanocarriers for biomedical applications
13
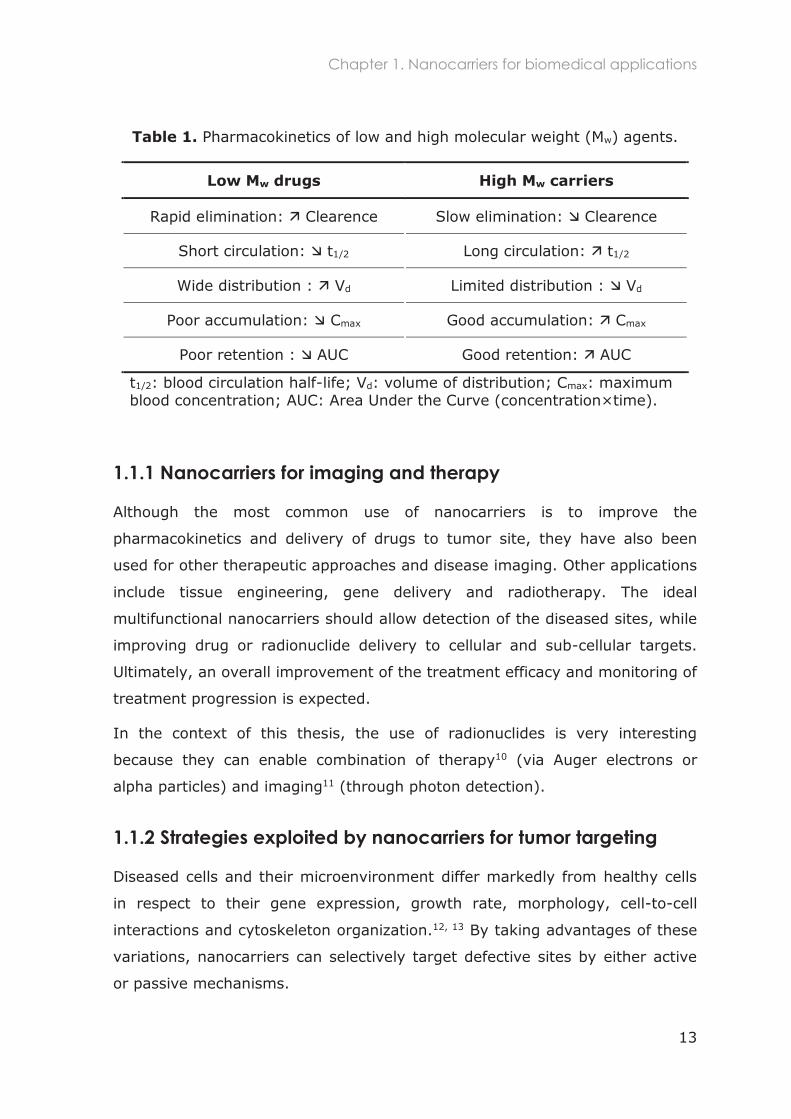
Table 1. Pharmacokinetics of low and high molecular weight (Mw) agents.
Low Mw drugs High Mw carriers
Rapid elimination: Clearence Slow elimination: Clearence
Short circulation: t1/2 Long circulation: t1/2
Wide distribution : Vd Limited distribution : Vd
Poor accumulation: Cmax Good accumulation: Cmax
Poor retention : AUC Good retention: AUC
t1/2: blood circulation half-life; Vd: volume of distribution; Cmax: maximum blood concentration; AUC: Area Under the Curve (concentration×time).
1.1.1 Nanocarriers for imaging and therapy
Although the most common use of nanocarriers is to improve the
pharmacokinetics and delivery of drugs to tumor site, they have also been
used for other therapeutic approaches and disease imaging. Other applications
include tissue engineering, gene delivery and radiotherapy. The ideal
multifunctional nanocarriers should allow detection of the diseased sites, while
improving drug or radionuclide delivery to cellular and sub-cellular targets.
Ultimately, an overall improvement of the treatment efficacy and monitoring of
treatment progression is expected.
In the context of this thesis, the use of radionuclides is very interesting
because they can enable combination of therapy10 (via Auger electrons or
alpha particles) and imaging11 (through photon detection).
1.1.2 Strategies exploited by nanocarriers for tumor targeting
Diseased cells and their microenvironment differ markedly from healthy cells
in respect to their gene expression, growth rate, morphology, cell-to-cell
interactions and cytoskeleton organization.12, 13 By taking advantages of these
variations, nanocarriers can selectively target defective sites by either active
or passive mechanisms.
Chapter 1. Nanocarriers for biomedical applications
14
1.1.2.1 Active targeting
In active targeting, a natural or synthetic molecule is used as a ligand to
target specific components expressed in diseased cells, normally surface
receptors. A great number of molecules have been developed, including
protein ligands, synthetic peptides, carbohydrates, antibodies, antibody
fragments and aptamers,14 and have received approval for clinical
therapy.15, 16 The use of molecules that bind surface receptors can be used to
directly block surface receptors (such as Herceptin)17 or to promote the
binding and internalization of drugs or nanocarriers.18 It has been shown that
their incorporation in nanocarriers does not increase their concentration in the
targeted sites,19 but only improves the cellular internalization and retention.
Therefore, the higher costs of the production of actively targeted nanocarriers
will most likely not justify their implementation in the clinical practice.
1.1.2.2 Passive targeting
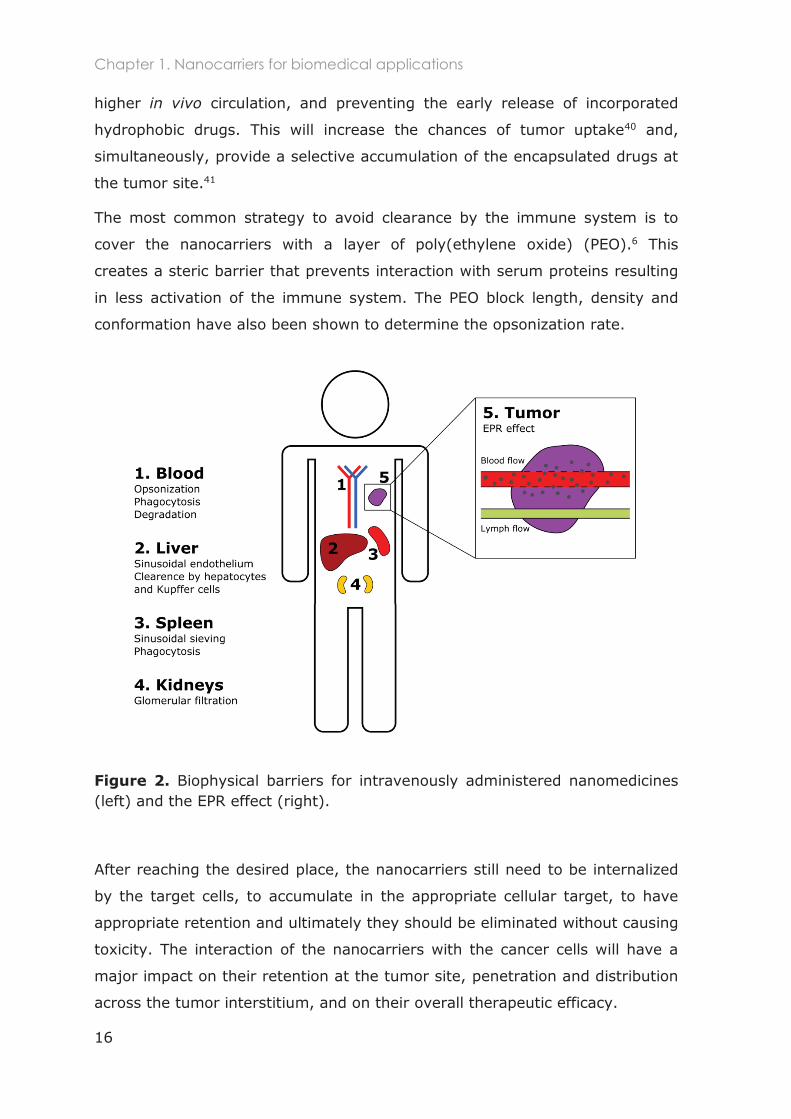
The most important factor for the success of the nanocarriers is based on a
passive mechanism inherent to the characteristics of the tumor cells and the
microenvironment. Cancer cells grow at a much faster rate than healthy cells,
which requires the formation of new blood vessels (angiogenesis) to supply
the demanding oxygen and nutrients. Due to the abrupt vasculature
formation, the new blood vessels are immature and highly permeable with a
poor line of smooth muscle and a discontinuous endothelial cell layer
(Figure 2).20 Therefore, holes in the vasculature are created which enable the
passive convection of nano-sized materials with sizes below the fenestrations
cut-off.21 Moreover, due to the excessive disorganization of the cellular
growth, the lymphatic drainage is also impaired which causes the retention of
the nanocarriers in the tumor site. The combination of both mechanisms is
known as the Enhanced Permeability and Retention (EPR) effect.18, 20
The reliance of the nanocarriers on this passive effect is very limiting because
of the high variation of the EPR phenomenon. This heterogeneity has been
observed in different tumor types, and even between patients with the same
tumor. On the one hand, sarcomas,22 glioblastomas23 and head and neck24
tumors have demonstrated high EPR effect with high retention of various
nanocarriers in these tumors. On the other hand, due to the stromal nature of
Chapter 1. Nanocarriers for biomedical applications
15
breast tissue, breast cancer has shown low EPR effect.24 In these cases, the
use of nanocarriers to deliver drugs has only shown to be advantageous in
reducing the side effects by decreasing the drug accumulation in healthy
tissues, while the drug concentration in the tumor remains the same as
compared to injection of the free drug. The differences in the EPR effect have
been mostly related to the tumor type and the microenvironment, particularly
the angiogenesis, hypervascularity, irregularity of blood flow, vascular
permeability, abnormal lymphatic drainage and tissue inflammation.24-26
The EPR effect in animal models has also been studied by some groups.27-30
The angiogenesis, anatomical and functional evaluation of tumor vasculature,
and the size of endothelial fenestrations have been assessed with several
tumor types.
1.1.3 Biophysical barriers to nanocarriers delivery
As discussed, the mechanism used to target nanocarriers to the tumor site is
based on the EPR effect. However, to achieve the EPR effect, a critical
requirement is a prolonged blood circulation of the nanocarriers. The
circulation half-life time and tissue distribution is largely influenced by the
biophysical barriers encountered, which include anatomical, physiological,
chemical and clinical barriers.31-33 The most important hurdles that
nanocarriers face when injected intravenously are exemplified in Figure 2.
The primary barrier is the blood circulation where nanomaterials are exposed
to the blood components (e.g. albumin) and opsonins that can bind to their
surface (opsonisation). This will activate the complement system and increase
their clearance mechanisms. Therefore, high accumulation of the nanocarriers
in the main clearance organs (liver and spleen) is often observed. The high
accumulation of nanocarriers in these organs is also related to the EPR effect
inherent to these organs, since they possess endothelial holes for blood
filtration and elimination of pathogens from the circulation.6, 34
Some of these barriers can be overcome by changing the physicochemical
properties of the nanocarriers such as composition, size, surface charge and
shape.6, 35-39 For instance, one of the interests of using larger nanocarriers (like
micelles and nanoparticles) is to avoid rapid kidney clearance thus achieving
Chapter 1. Nanocarriers for biomedical applications
16
higher in vivo circulation, and preventing the early release of incorporated
hydrophobic drugs. This will increase the chances of tumor uptake40 and,
simultaneously, provide a selective accumulation of the encapsulated drugs at
the tumor site.41
The most common strategy to avoid clearance by the immune system is to
cover the nanocarriers with a layer of poly(ethylene oxide) (PEO).6 This
creates a steric barrier that prevents interaction with serum proteins resulting
in less activation of the immune system. The PEO block length, density and
conformation have also been shown to determine the opsonization rate.
Figure 2. Biophysical barriers for intravenously administered nanomedicines (left) and the EPR effect (right).
After reaching the desired place, the nanocarriers still need to be internalized
by the target cells, to accumulate in the appropriate cellular target, to have
appropriate retention and ultimately they should be eliminated without causing
toxicity. The interaction of the nanocarriers with the cancer cells will have a
major impact on their retention at the tumor site, penetration and distribution
across the tumor interstitium, and on their overall therapeutic efficacy.
Chapter 1. Nanocarriers for biomedical applications
17
This interaction occurs firstly by their attachment to the cell surface, followed
by internalization through specific pathways (endocytic or non-endocytic),
trafficking inside the cells, and finally their intracellular retention or
exocytosis.42-45 The cellular interaction mechanisms of the nanocarriers can
also be modulated according to the intended application by varying their
physicochemical properties.46-48 For example, associating targeting moieties on
the nanocarriers surface (as described in section 1.2.2.1 of this chapter) will
activate specific tumor-associated cell surface receptors which will increase the
internalization of the nanocarriers, their subcellular localization and ultimately
their retention inside the cell. Varying other properties such as size,
aggregation state,49, 50 composition51, 52 and cross-linking,53, 54 also influence
their uptake and intracellular trafficking, leading to distinct subcellular
localizations and retention. For instance, if a nuclear localization of the
nanocarriers is intended, they should be designed in order to be able to escape
endosomal trapping and possess appropriate targeting peptides to be
transported to the nucleus.55
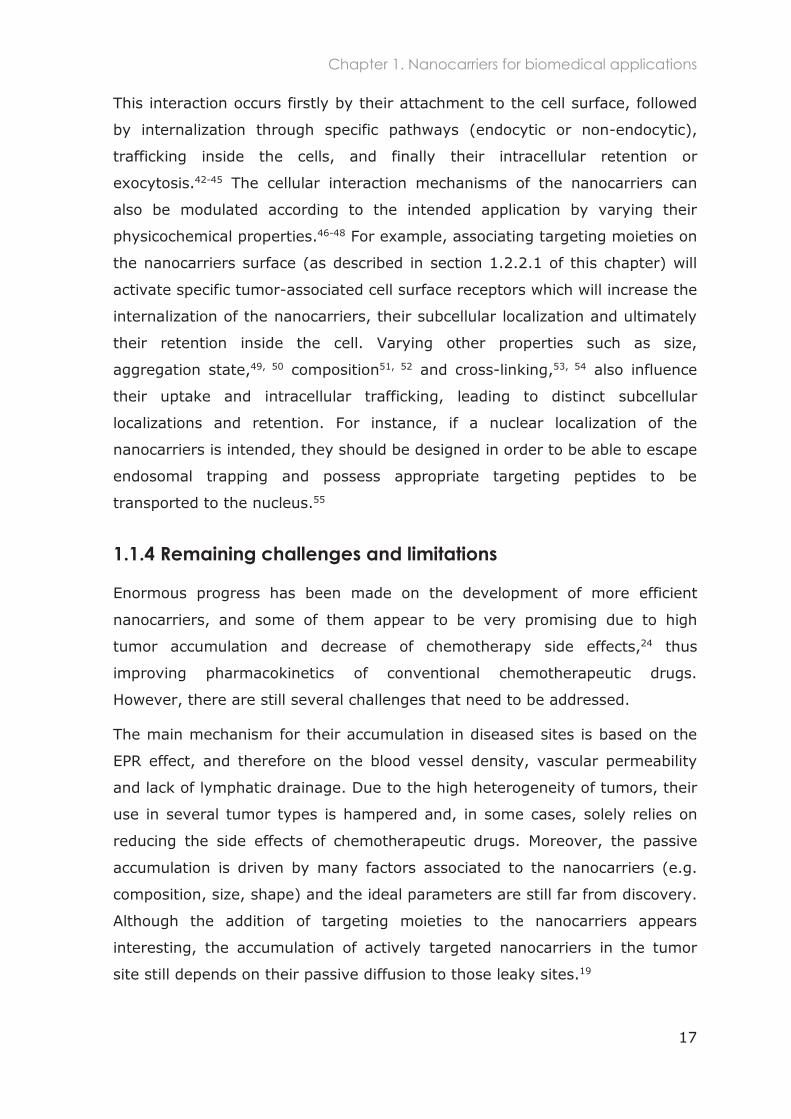
1.1.4 Remaining challenges and limitations
Enormous progress has been made on the development of more efficient
nanocarriers, and some of them appear to be very promising due to high
tumor accumulation and decrease of chemotherapy side effects,24 thus
improving pharmacokinetics of conventional chemotherapeutic drugs.
However, there are still several challenges that need to be addressed.
The main mechanism for their accumulation in diseased sites is based on the
EPR effect, and therefore on the blood vessel density, vascular permeability
and lack of lymphatic drainage. Due to the high heterogeneity of tumors, their
use in several tumor types is hampered and, in some cases, solely relies on
reducing the side effects of chemotherapeutic drugs. Moreover, the passive
accumulation is driven by many factors associated to the nanocarriers (e.g.
composition, size, shape) and the ideal parameters are still far from discovery.
Although the addition of targeting moieties to the nanocarriers appears
interesting, the accumulation of actively targeted nanocarriers in the tumor
site still depends on their passive diffusion to those leaky sites.19
Chapter 1. Nanocarriers for biomedical applications
18
Another issue is the evaluation of their potential through the development of
appropriate imaging modalities that should enable the visualization of their
biodistribution and the eventually encapsulated drugs. Commonly, researchers
analyze the biodistribution of the incorporated drugs rather than the
nanocarriers themselves resulting in their inability to track the nanocarriers
biodistribution and verify the in vivo drug release. The most efficient technique
to perform this qualitative and quantitative determination is nuclear
imaging.33, 56, 57 However, exposure to radiation and instability of the metal
complexation in the blood circulation are also limitations of this technique.
Finally, the biggest challenges of nanomedicines remain their interactions with
the biological barriers. Overcoming or limiting these encounters before
reaching the desired target place is the main goal of nanomedicine. Few
strategies have been proposed to reduce these interactions. Specifically,
reducing the clearance by the main organs of the immune system (liver and
spleen) is still the major challenge.
1.2 Imaging modalities
The most widely used imaging technologies for disease detection are based on
anatomic and functional imaging, which are most of the times nonspecific and
detect the diseases at late stages. The direct detection of diseases with
specific imaging probes has a great potential because they enable earlier
detection and a more precise diagnostics. This will allow an efficient
monitoring of the disease progression, and the controlled detection of the
therapies effects.
With the progress of nanomedicines, there is an emergent need to develop
new imaging technologies that can non-invasively detect and monitor the
circulation and biodistribution of the nanomedicines. This will primarily assess
their potential use as effective and safe nanomedicines using animal models
(pre-clinical), and ultimately monitor their use in humans (clinical).
Imaging modalities include Computed Tomography (CT), Magnetic Resonance
Imaging (MRI), Optical Molecular Imaging (OMI), Ultrasound (US), Positron
Emission Tomography (PET) and Single Photon Emission Computed
tomography (SPECT). These modalities differ in terms of spatial and temporal
Chapter 1. Imaging modalities
19
resolution, sensitivity in probe detection, resolution and signal penetration
depth. Each modality has its own advantages and disadvantages, and the
choice of the appropriate imaging system will depend on the type of
information required. For example, CT relies on the photoelectric absorption of
x-rays to provide high spatial resolution. However, the x-rays absorption is
very sensitive to the atomic number of the absorbing material. Therefore, this
technique often requires the use of contracts agents to image the liver,
vasculature, spleen, kidney, intestine and bladder, while other organs do not
require (bone, lean tissue, fat and lung). Due to the low sensitivity for ligand
detection of the most used imaging techniques (CT, MRI and US), they are
commonly combined with nuclear imaging techniques and co-registered in
multi-modal imaging.
Multi-modality imaging combines two or more modalities with images being
registered in space and in time to provide anatomic, functional and molecular
imaging information. The combination of OMI with MRI, and SPECT or PET with
CT has represented major clinical advances in oncology, cardiology,
orthopedics and metabolic diseases. In particular, pre-clinical PET/CT and
SPECT/CT have been critical for the understanding of pathological processes,
nanomedicines development (pharmacokinetics and pharmacodynamics) and
for the assessment of treatment responses. The full exploitation of image
information requires a series of complex computing tasks such as image
registration, image segmentation, tracking and motion analysis, quantitative
image analysis and image visualization and fusion.
1.3 Nuclear Imaging
The advantages of the non-nuclear techniques are that they are non-invasive
procedures that do not require exposure to ionizing radiation, while providing
high spatial resolution and anatomic information. However, they have a very
low sensitivity for ligand detection. Therefore, molecular imaging technologies
with high sensitivity for ligand detection have been developed and represent
one of the most emerging technologies.
Positron Emission Tomography (PET) and Single Photon Emission Computed
tomography (SPECT) are the most used nuclear imaging techniques. Both rely
on the use of radioelements that emit radiation in specific ranges to enable
Chapter 1. Nuclear Imaging
20
their detection. These radioelements are often conjugated to ligands (called
tracers) like (deoxy)glucose, hormones, vitamins, RGD, VEGF-R, amino acids,
polymers and nanoparticles, according to the desired target and application
(imaging or therapy). The advantages of these techniques are the non-
invasiveness, the ability to perform 3D whole-body scans and the high
quantification sensitivity (pM-nM). Disadvantages are the poor spatial
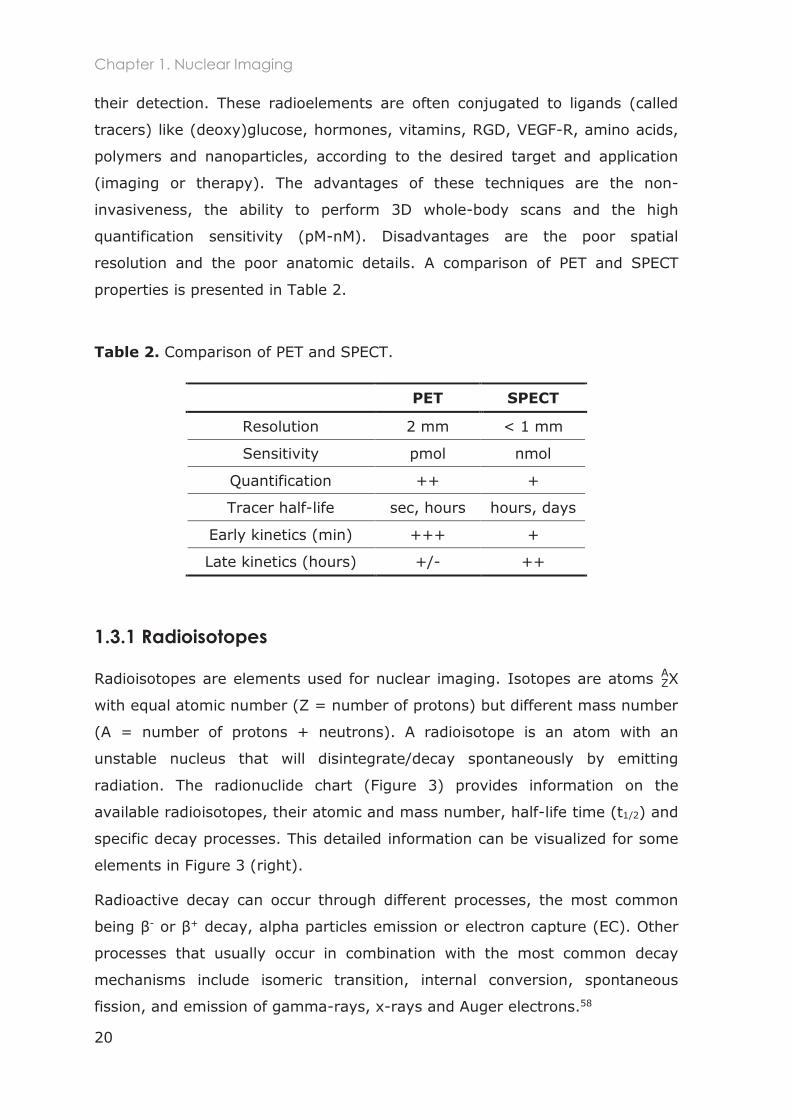
resolution and the poor anatomic details. A comparison of PET and SPECT
properties is presented in Table 2.
Table 2. Comparison of PET and SPECT.
PET SPECT
Resolution 2 mm < 1 mm
Sensitivity pmol nmol
Quantification ++ +
Tracer half-life sec, hours hours, days
Early kinetics (min) +++ +
Late kinetics (hours) +/- ++
1.3.1 Radioisotopes
Radioisotopes are elements used for nuclear imaging. Isotopes are atoms
with equal atomic number (Z = number of protons) but different mass number
(A = number of protons + neutrons). A radioisotope is an atom with an
unstable nucleus that will disintegrate/decay spontaneously by emitting
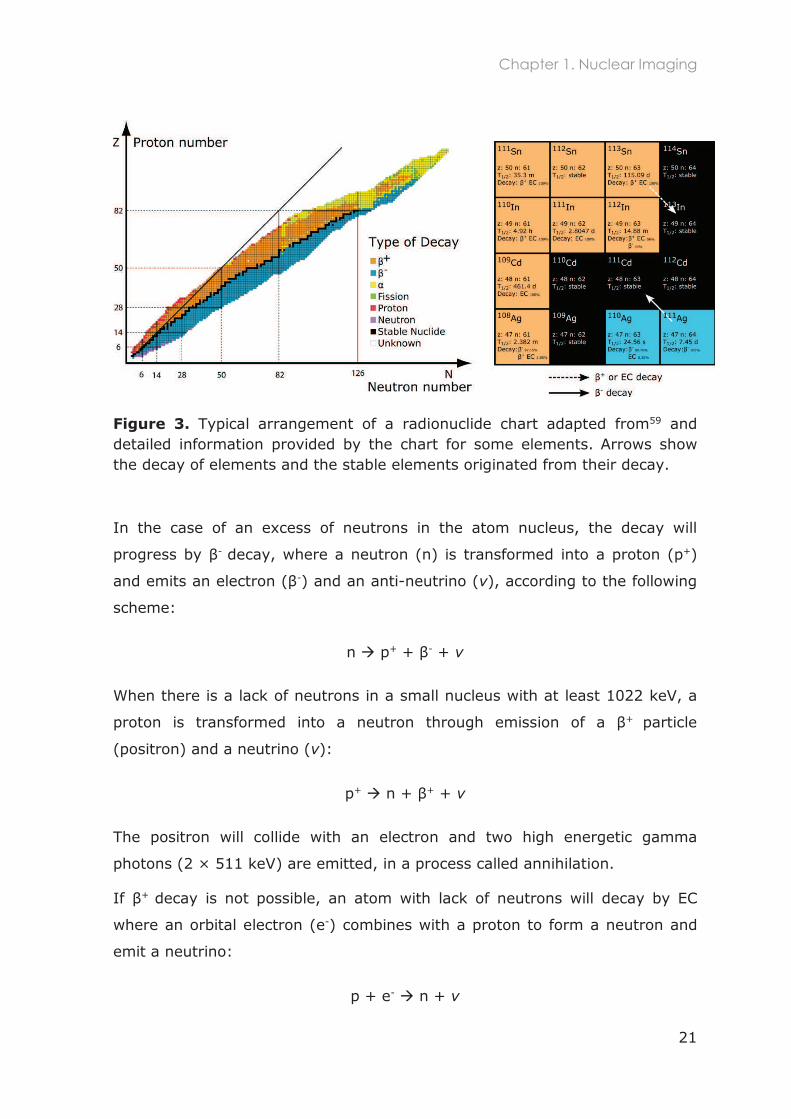
radiation. The radionuclide chart (Figure 3) provides information on the
available radioisotopes, their atomic and mass number, half-life time (t1/2) and
specific decay processes. This detailed information can be visualized for some
elements in Figure 3 (right).
Radioactive decay can occur through different processes, the most common
being - or + decay, alpha particles emission or electron capture (EC). Other
processes that usually occur in combination with the most common decay
mechanisms include isomeric transition, internal conversion, spontaneous
fission, and emission of gamma-rays, x-rays and Auger electrons.58
Chapter 1. Nuclear Imaging
21
Figure 3. Typical arrangement of a radionuclide chart adapted from59 and detailed information provided by the chart for some elements. Arrows show the decay of elements and the stable elements originated from their decay.
In the case of an excess of neutrons in the atom nucleus, the decay will
progress by - decay, where a neutron (n) is transformed into a proton (p+) -) and an anti-neutrino ( ), according to the following
scheme:
n p+ - +
When there is a lack of neutrons in a small nucleus with at least 1022 keV, a
proton is transformed into a neutron through emission of a + particle
(positron) and a neutrino ( ):
p+ + +
The positron will collide with an electron and two high energetic gamma
photons (2 × 511 keV) are emitted, in a process called annihilation.
If + decay is not possible, an atom with lack of neutrons will decay by EC
where an orbital electron (e-) combines with a proton to form a neutron and
emit a neutrino:
p + e- n +
Chapter 1. Nuclear Imaging
22
Disintegration of the isotopes via decay and EC are often accompanied by
the emission of gamma radiation that can be detected for imaging purposes.
Atoms with lack of neutrons can also decay via emission of alpha particles,
which are in fact helium nucleus, but this only occurs in atoms with heavy
nuclei. Alpha particles have a very short path and quickly lose their energy in
a short distance, which means that several MeV are deposited in a small
volume of material. This results in a high damage potential particularly to the
DNA strands via double-strand breaks or clustered damage.58 Isotopes can
also emit Auger electrons, which are very similar to alpha particles in terms of
ability to damage DNA.60 Although they have much lower energy (<25 keV),
their path-length is much shorter and thus their linear energy transfer (LET)
approaches that of alpha particles. Therefore, to be effective, the nuclides
emitting Auger electrons need to be as close as possible (nm-µm) to the
nuclear DNA.61 The use of Auger electron emitters (like 111Indium) has been
proposed for in situ radiotherapy of cancer using monoclonal antibodies and
peptides.62, 63 However, delivering Auger electrons to the cancer cell nucleus
remains a big challenge.64
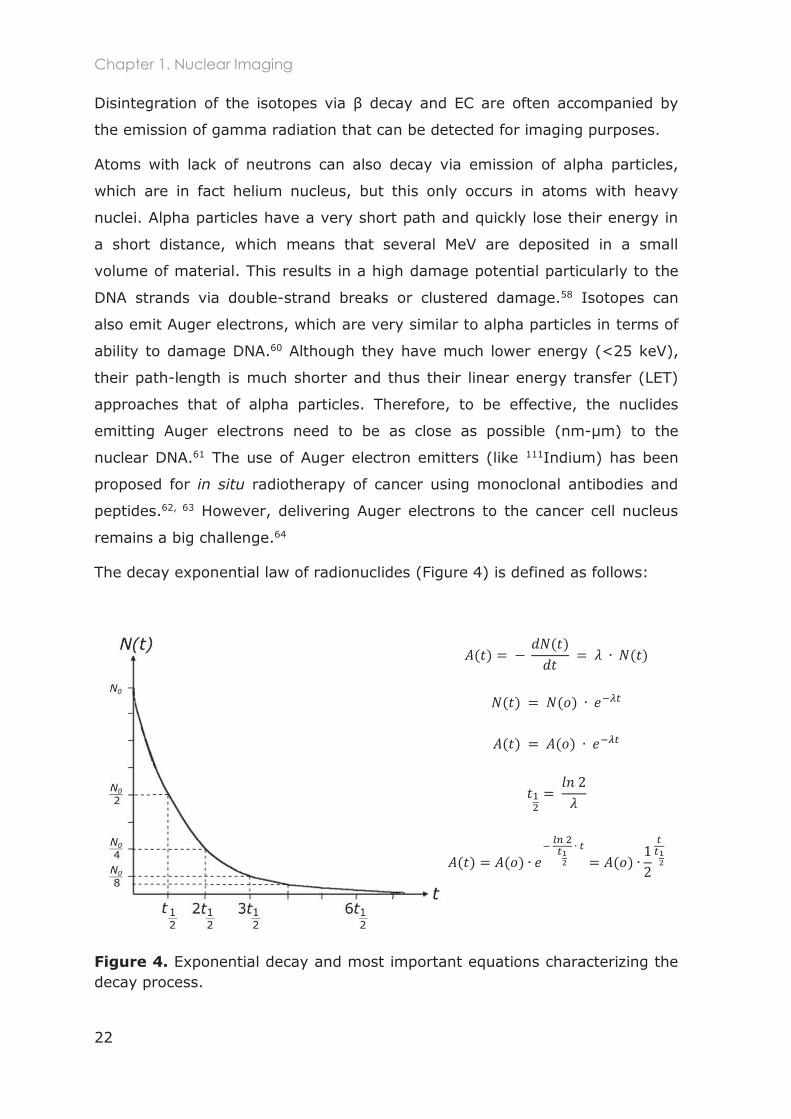
The decay exponential law of radionuclides (Figure 4) is defined as follows:
Figure 4. Exponential decay and most important equations characterizing the decay process.
Chapter 1. Nuclear Imaging
23
where is the number of unstable nuclei at a specific moment (s),
corresponds to the change in the number of unstable nuclei overtime,
and is the exponential decay constant (s-1).
The activity is commonly expressed in Bequerel (Bq) and corresponds to
the decay rate: it is the number of atoms that disintegrate per second (dps) at
a moment . The t1/2 is specific for each isotope and is defined as the time
required for its activity to reduce to half of its initial value (Figure 4).
Radionuclides are produced in a reactor (using neutrons) or in a cyclotron
(using charged particles like protons). In the cyclotron, protons are in a
magnetic field and are used to `bombard´ targets like 18O(p,n)18F, 16 13N
or 69Ga(p,2n)68Ga.
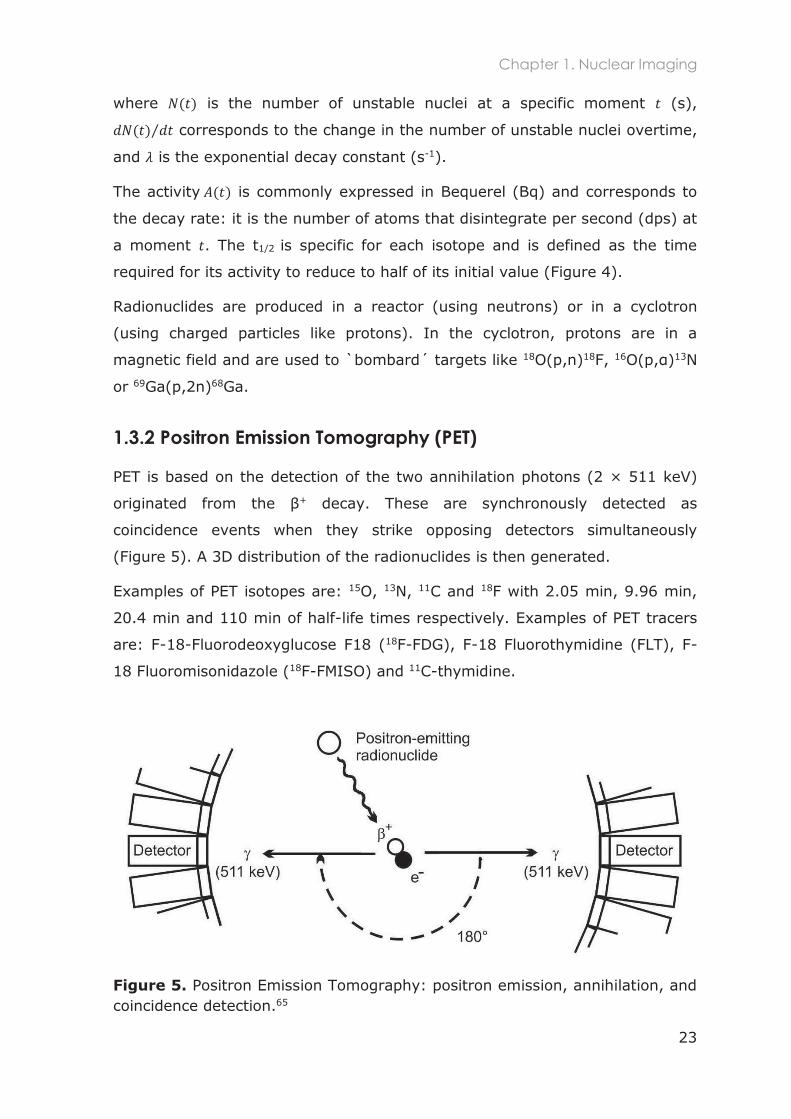
1.3.2 Positron Emission Tomography (PET)
PET is based on the detection of the two annihilation photons (2 × 511 keV)
originated from the + decay. These are synchronously detected as
coincidence events when they strike opposing detectors simultaneously
(Figure 5). A 3D distribution of the radionuclides is then generated.
Examples of PET isotopes are: 15O, 13N, 11C and 18F with 2.05 min, 9.96 min,
20.4 min and 110 min of half-life times respectively. Examples of PET tracers
are: F-18-Fluorodeoxyglucose F18 (18F-FDG), F-18 Fluorothymidine (FLT), F-
18 Fluoromisonidazole (18F-FMISO) and 11C-thymidine.
Figure 5. Positron Emission Tomography: positron emission, annihilation, and coincidence detection.65
Chapter 1. Nuclear Imaging
24
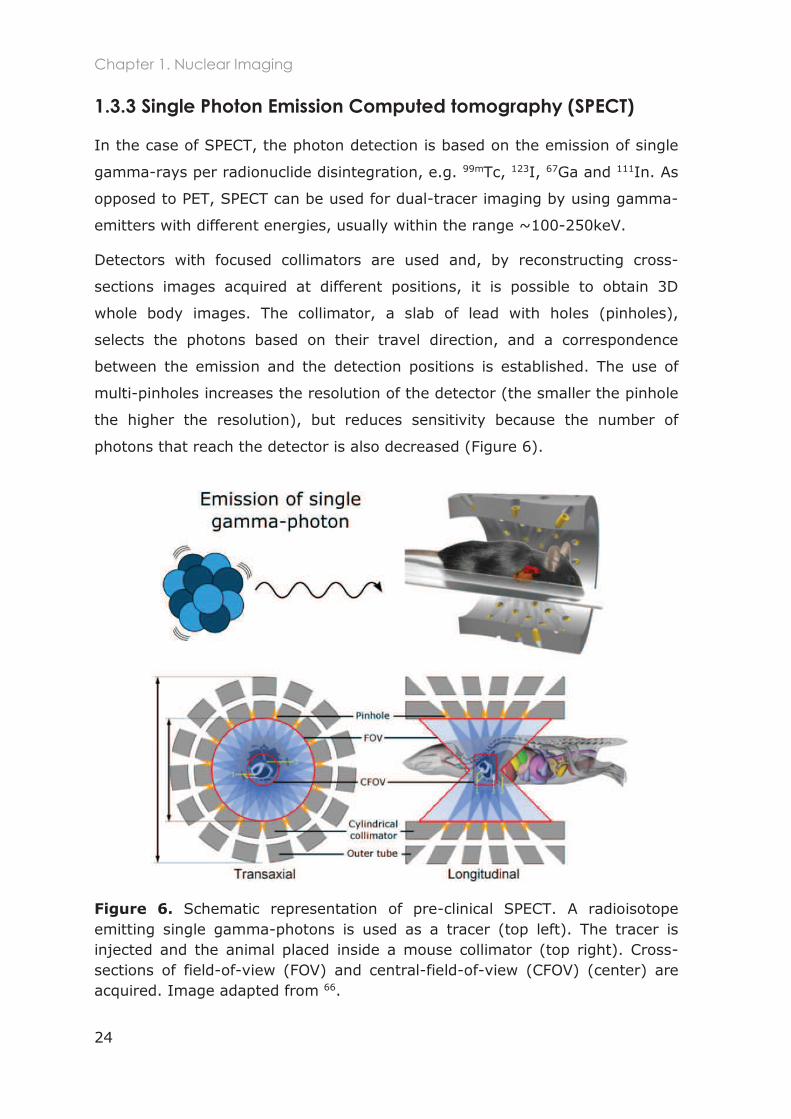
1.3.3 Single Photon Emission Computed tomography (SPECT)
In the case of SPECT, the photon detection is based on the emission of single
gamma-rays per radionuclide disintegration, e.g. 99mTc, 123I, 67Ga and 111In. As
opposed to PET, SPECT can be used for dual-tracer imaging by using gamma-
emitters with different energies, usually within the range ~100-250keV.
Detectors with focused collimators are used and, by reconstructing cross-
sections images acquired at different positions, it is possible to obtain 3D
whole body images. The collimator, a slab of lead with holes (pinholes),
selects the photons based on their travel direction, and a correspondence
between the emission and the detection positions is established. The use of
multi-pinholes increases the resolution of the detector (the smaller the pinhole
the higher the resolution), but reduces sensitivity because the number of
photons that reach the detector is also decreased (Figure 6).
Figure 6. Schematic representation of pre-clinical SPECT. A radioisotope emitting single gamma-photons is used as a tracer (top left). The tracer is injected and the animal placed inside a mouse collimator (top right). Cross-sections of field-of-view (FOV) and central-field-of-view (CFOV) (center) are acquired. Image adapted from 66.
Chapter 1. Nuclear Imaging
25
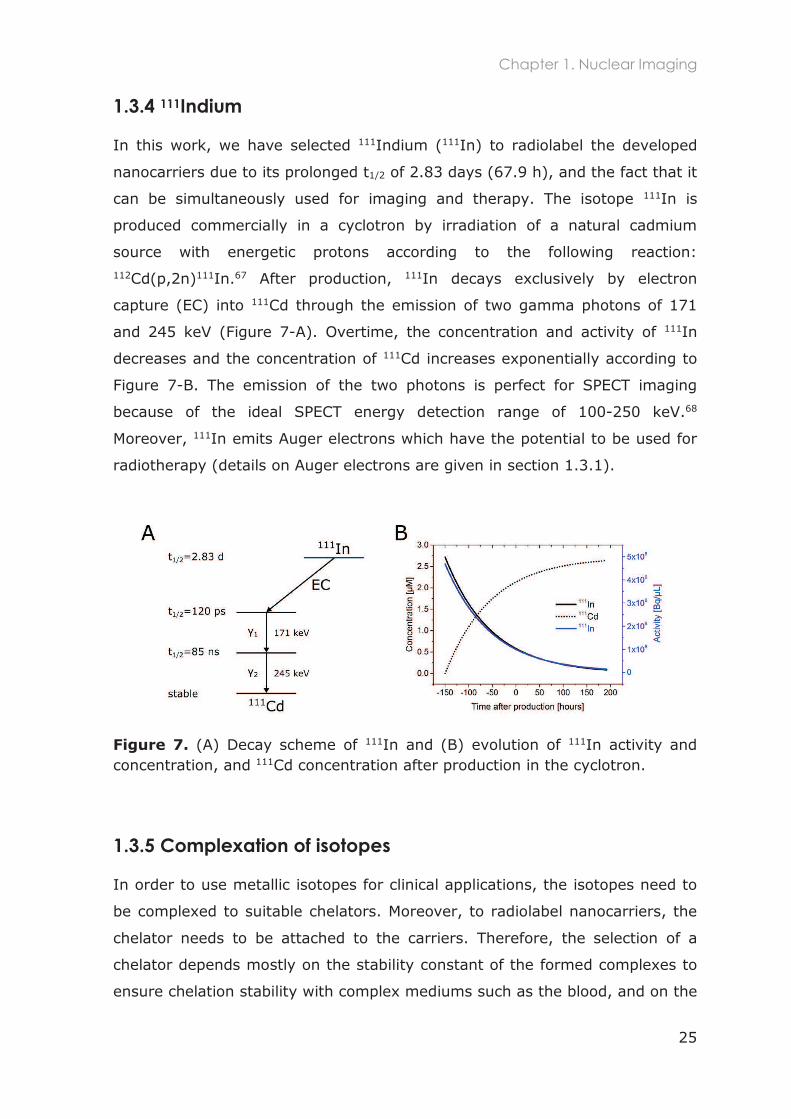
1.3.4 111Indium
In this work, we have selected 111Indium (111In) to radiolabel the developed
nanocarriers due to its prolonged t1/2 of 2.83 days (67.9 h), and the fact that it
can be simultaneously used for imaging and therapy. The isotope 111In is
produced commercially in a cyclotron by irradiation of a natural cadmium
source with energetic protons according to the following reaction: 112Cd(p,2n)111In.67 After production, 111In decays exclusively by electron
capture (EC) into 111Cd through the emission of two gamma photons of 171
and 245 keV (Figure 7-A). Overtime, the concentration and activity of 111In
decreases and the concentration of 111Cd increases exponentially according to
Figure 7-B. The emission of the two photons is perfect for SPECT imaging
because of the ideal SPECT energy detection range of 100-250 keV.68
Moreover, 111In emits Auger electrons which have the potential to be used for
radiotherapy (details on Auger electrons are given in section 1.3.1).
Figure 7. (A) Decay scheme of 111In and (B) evolution of 111In activity and concentration, and 111Cd concentration after production in the cyclotron.
1.3.5 Complexation of isotopes
In order to use metallic isotopes for clinical applications, the isotopes need to
be complexed to suitable chelators. Moreover, to radiolabel nanocarriers, the
chelator needs to be attached to the carriers. Therefore, the selection of a
chelator depends mostly on the stability constant of the formed complexes to
ensure chelation stability with complex mediums such as the blood, and on the

Chapter 1. Nuclear Imaging
26
possibility to attach it to the nanocarriers which often requires functionalized
chelators.69 The most used chelators are diethylene triamine pentaacetic acid
(DTPA) and tetraazacyclododecane-tetraacetic acid (DOTA), and a great
variety of functionalized versions of these chelators to attach to nanocarriers
are commercially available. For example, in this thesis, we use active ester
derivatives (p-SCN-Bn-DTPA and p-SCN-Bn-DOTA) that readily react with
amine functionalized polymers through covalent bonding.
The metallic complexes formed by DOTA have higher thermodynamic stability
compared to the ones formed with DTPA. However, while complexation with
DTPA occurs rapidly at room temperature, complexation with DOTA is slow
and difficult requiring usually a heating step,70 which can represent a problem
for the nanocarriers stability.
The chelator DTPA has high affinity to metal cations and is a potential
octadentate ligand due to eight available positions for coordination (three
center nitrogens and five COO- groups). For detailed structure of DTPA see
Figure 42.
In the case of 111In, the only stable aqueous oxidation state is +3. Due to its
large size (62-95 pm), it presents common coordination numbers (CN) of
4-8.68 DTPA is able to form complexes with 111In with a CN of 7 forming a
pentagonal bipyramid with a log KML = 29.5 (KML= [ML]/[M][L], where
M=metal=111In and L=ligand=DTPA)68 (Figure 8).
Figure 8. Complexation geometry of DTPA-111In.68
Chapter 1. General aspects of block copolymers
27
1.4 General aspects of block copolymers
Nanocarriers composed by amphiphilic block copolymers have shown to be
promising nanosystems for tumor imaging and drug delivery applications.71, 72
Block copolymers consist of at least two covalently bonded polymer blocks
with chemically different monomers.73 They are generally composed by two
blocks A-B (diblock) or three blocks A-B-A (triblock) arranged linearly. Most
polymers of different nature tend to be incompatible and to segregate for large
enough molecular weights. With copolymers, the macroscopic segregation is
prevented by the covalent bond between the blocks and segregation can only
occur locally through the formation of self-assembled supramolecular
structures with different morphologies such as spheres or rods.74-79 In the
context of this thesis, it is important to define some parameters that govern
the aggregation and dynamics of block copolymers in a solvent.
The solvent quality determines the conformation that a polymer assumes in
solution, which is related to the strength of the interactions between the
polymer segments and the solvent molecules. This has been assessed by the
Flory parameter ( ). The smaller the value, the more favorable are the
interactions between the polymer and the solvent. When the solvent is good
for one of the blocks but poor for the other, it is said to be a selective solvent
of one of the blocks.80 Amphiphilic block copolymers built with hydrophilic and
hydrophobic blocks are an important class of block copolymers because they
can form in water supramolecular assemblies with hydrophobic core and
hydrophilic corona structures, which can be potentially used as nanocarriers
for pharmaceutical applications.
The kinetic stability of the structures formed depends largely on the glass
transition temperature (Tg) of the hydrophobic block as it directly influences
the mobility of the block in the micellar structures. In the case of
poly(styrene), the Tg is ~100ºC which makes the hydrophobic block kinetically
frozen below this temperature. For poly(propylene oxide) (PPO), the value is
much lower (~ -60ºC).81 When the temperature of the solution is above the Tg
of the hydrophobic block, the structures formed are in thermodynamic
equilibrium, which means they can disassemble and reassemble continuously
according to the solution properties. However, this does not mean that the
Chapter 1. General aspects of block copolymers
28
formed structures are in equilibrium. The polymerization index (P) and the
Flory parameter of the insoluble block ( B) are key parameters that govern the
dynamics. Thermodynamic equilibrium can be achieved only for not too large
values of the product BPB that determines the precipitation of the insoluble
block. Also large values of PB increase dramatically the characteristic time for
the equilibration of the micellar core. The incompatibility between the two
components, as measured by ABPAPB plays also a major role in the dynamics.82
Here, AB is the interaction parameter between the two components. Thus, by
varying all these parameters, a continuum of behaviors can be obtained
between polymer micelles at full thermodynamic equilibrium and frozen
micelles that can be assembled only through progressive solvent exchange.83
1.5 Pluronic block copolymers
1.5.1 Properties and applications
Among the several block copolymers tested for the development of polymer-
based nanocarriers, Pluronics are probably the most broadly investigated and
have superior advantages over other systems.84-86 Pluronics are amphiphilic
triblock copolymers composed of PEO-PPO-PEO, where PEO stands for
poly(ethylene oxide) and PPO denotes poly(propylene oxide).73 They are
widely studied and used because of their low-cost and commercial availability
in a very broad composition and molecular weight range (from 1000 to
15000 Da and from 10 to 80 wt% of PEO). They have been primarily used as
surfactants in different industries73 and, after the assessment of their in vivo
low toxicity profile,87 their use in the design of pharmaceutical and cosmetic
products has emerged.88 Some of them are even approved by the Food and
Drug Administration (FDA) for use in i.v. pharmaceutical formulations.89
Due to their amphiphilic nature, Pluronic unimers aggregate and self-assemble
into supramolecular structures (micelles) composed by a hydrophobic PPO
core and a hydrophilic hydrated PEO corona.85 The self-assembling mechanism
and dynamics depend on many parameters such as the solution temperature,
composition (e.g. salts and proteins) and the polymer concentration. Above a
certain critical micelle temperature (cmT) and/or a critical micelle
concentration (cmc), unimers aggregate and micelles are formed. The core of
Chapter 1. Pluronic block copolymers
29
the micelles has shown to be able to incorporate hydrophobic anticancer drugs
which cannot be administrated intravenously due to their water insolubility. An
increase of their solubility and improvement of the in vivo drug bioavailability
has been observed when they are incorporated in Pluronic micelles.85, 86, 90-94 At
the same time, the PEO corona contributes to the micelles stability and
prevents unwanted opsonization by serum proteins, thus avoiding recognition
of the nanocarriers by the immune system. Pluronic copolymers have also
shown to induce significant sensitizing effects in multidrug resistant (MDR)
cancer cells,95-97 which have shown to depend mainly on the PEO and PPO
composition of the copolymers and were well-established in previous
studies.84, 96-103
All of these advantages offer great potential for the development of improved
nanomedicines based on Pluronics for oncology applications. However, due to
the dynamic nature of Pluronic micelles (see section 1.5.3), further studies
dedicated to micellization and to the development of innovative strategies for
micelles stabilization are required.
1.5.2 Micellization and phase transitions
An important feature of Pluronic solutions is their temperature dependent
self-assembling and thermo-gelling behavior. Concentrated aqueous solutions
of Pluronic copolymers are liquid at low temperature and form a gel at higher
temperature in a reversible process. The transitions that occur in these
systems depend on the polymer composition (molecular weight and PEO/PPO
molar ratio), and have been extensively studied in the past.79, 104-106 Different
phase diagrams have been constructed for most of the Pluronics by using a
great variety of experimental techniques (e.g. SAXS, DSC, viscosity, light
scattering).
Typical phase diagrams of Pluronic copolymers are given in Figure 9. In the
given examples, we can observe that at low temperatures and concentrations
(below cmT and cmc) individual block copolymers (unimers) are present in
solution. Above these values, aggregation of individual unimers occurs in a
process called micellization. This aggregation is driven by the dehydration of
the hydrophobic PPO block that becomes progressively less soluble as the
polymer concentration or temperature increases.107 It is associated with a
Chapter 1. Pluronic block copolymers
30
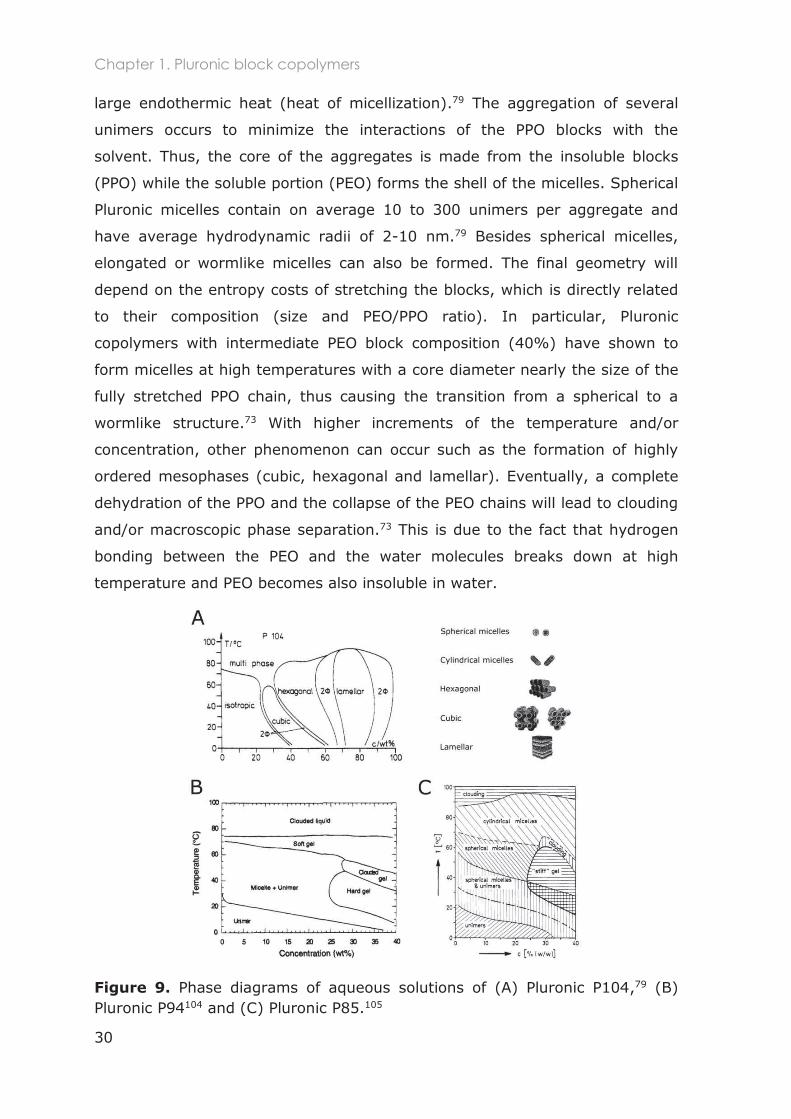
large endothermic heat (heat of micellization).79 The aggregation of several
unimers occurs to minimize the interactions of the PPO blocks with the
solvent. Thus, the core of the aggregates is made from the insoluble blocks
(PPO) while the soluble portion (PEO) forms the shell of the micelles. Spherical
Pluronic micelles contain on average 10 to 300 unimers per aggregate and
have average hydrodynamic radii of 2-10 nm.79 Besides spherical micelles,
elongated or wormlike micelles can also be formed. The final geometry will
depend on the entropy costs of stretching the blocks, which is directly related
to their composition (size and PEO/PPO ratio). In particular, Pluronic
copolymers with intermediate PEO block composition (40%) have shown to
form micelles at high temperatures with a core diameter nearly the size of the
fully stretched PPO chain, thus causing the transition from a spherical to a
wormlike structure.73 With higher increments of the temperature and/or
concentration, other phenomenon can occur such as the formation of highly
ordered mesophases (cubic, hexagonal and lamellar). Eventually, a complete
dehydration of the PPO and the collapse of the PEO chains will lead to clouding
and/or macroscopic phase separation.73 This is due to the fact that hydrogen
bonding between the PEO and the water molecules breaks down at high
temperature and PEO becomes also insoluble in water.
Figure 9. Phase diagrams of aqueous solutions of (A) Pluronic P104,79 (B) Pluronic P94104 and (C) Pluronic P85.105
Chapter 1. Pluronic block copolymers
31
The phase transitions can also be largely influenced by the use of additives
such as salts108-113 and alcohols.109, 114-117 The interactions with salts are related
to their ability to act as water structure makers (salting-out) or water
structure breakers (salting-in). Salting-out salts increase the self-hydration of
water through hydrogen bonding and reduce the hydration of the copolymers,
thus reducing the cmc and cmT. Salting-in electrolytes reduce the water
self-hydration and increase the polymer hydration, therefore increasing the
cmc and cmT.118 The different salts have been categorized by the Hofmeister
or lyotropic series - .119 For anions the
series is: CO32- > SO4
2- > H2PO4- > F- > Cl- > Br- > NO3
- > I- > SCN-.120, 121
The simultaneous use of a salt (NaCl) and an alcohol (butan-1-ol) has even
recently been shown to induce sphere-to-rod transitions of the highly
hydrophilic Pluronic F127.122 Addition of other additives such as methyl
paraben to Pluronic P105 and P104 solutions induced the sphere-to-rod
transition, while butyl paraben avoided the sphere-to-rod transition and
aggregates of spherical micelles were observed.123 In other studies, addition of
ibuprofen to Pluronic P104124 and salicylic acid to Pluronic P85125 also induced
the sphere-to-rod transition.
1.5.3 Micelles stability
Pluronic-based nanosystems have shown to successfully enhance the
anti-tumor efficacy of anticancer drugs through their incorporation in the
micellar core. Particularly, a combination of two types of Pluronic (F127 and
L61 in a ratio 1:8) designed to deliver doxorubicin showed superior anti-tumor
activity in vitro and in vivo compared to the free drug.126, 127 This formulation
(SP1049C) has completed Phase II clinical trials128-130 for the treatment of
advanced adenocarcinoma of the esophagus and gastroesophageal junction,
and has shown improved efficacy as a single-therapy agent and an acceptable
safety profile.126, 127
micelles composed from Pluronic block copolymers are thermodynamically
leads to their disassembly upon variations in
concentration and/or temperature. The formulation SP1049C contains micelles
that are not stabilized which means that there is a constant thermodynamic
Chapter 1. Pluronic block copolymers
32
equilibrium between the single polymer chains and the micelles. Therefore,
once the system is extremely diluted in the bloodstream, a fast release of the
encapsulated doxorubicin can occur. The observed overall blood concentration
of incorporated doxorubicin was similar to that of free drug hinting at in vivo
micelles dissociation and premature release of the drug.129
Therefore, the main concern regarding the clinical use of these polymeric
micelles is the extreme dilution they undergo once they are in the
bloodstream. This dilution can easily reach a total concentration below the
cmc, which will result in micelles dissociation into unimers in vivo.85, 90-93, 96, 131,
132
Due to this micellar instability, the in vitro and in vivo studies of Pluronic
micelles as supramolecular carriers have been limited. However, through the
use of different concentrations of polymer solution (in order to be below or
above the cmc), researchers have shown that the association state, unimers
versus micelles, has a very important effect on the circulation half-time life,
biodistribution and intracellular fate of the carriers.42, 56, 96, 98, 131
Therefore, in order to use Pluronic micelles for in vivo applications, further
stabilization strategies are needed to prevent dissociation caused by severe
dilution in the bloodstream after i.v.. To this goal, one can imagine either to
slow down the dissociation with an appropriate choice of the Pluronic
characteristics, or to freeze the micelles via chemical routes, like cross-linking
of their core or their shell.
1.5.4 Dynamics and kinetics of Pluronic micelles
The stability and morphology of the nanomedicines has shown to largely
influence their efficacy.133-135 Due to the wide range of biomedical applications
of Pluronic copolymers and the growing interest in stable systems with
different morphologies, understanding the dynamics of micellization and
kinetics of shape transformation is crucial. This might open new opportunities
to develop Pluronic-based system with varying morphologies and increased
stability.
Chapter 1. Pluronic block copolymers
33
There have been many studies dedicated to investigate the dynamics and
kinetics of Pluronic micelles. However, the complexity of these phenomena
makes it a controversial topic.136-141
The mechanisms on the micellization at equilibrium have been particularly
analyzed, and two relaxation times are involved in this process: (1) the first
and fastest (in the microseconds range) corresponds to the unimers exchange
between micelles and the bulk solution and follows the Aniansson-Wall
model142 (step-by-step insertion and expulsion of single polymer chains), and
(2) the second and much slower one (in the millisecond range) is attributed to
the formation and breakdown of whole micellar units leading to the final
micellar size equilibration.136-141
The sphere-to-rod transition and its kinetics have been much less
investigated.141, 143 The mechanisms involved in the shape transformation are
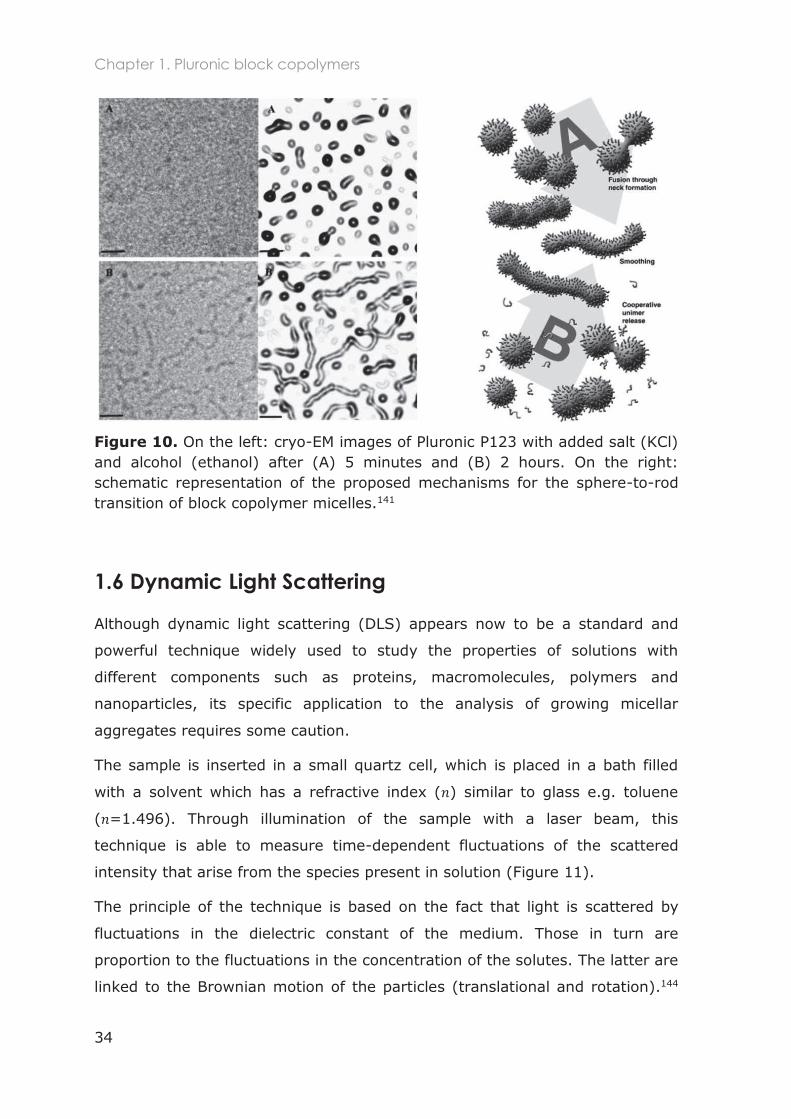
different compared to the dynamics of micellization. Figure 10 shows two
proposed mechanisms for the sphere-to-rod transitions of block copolymer
micelles, in which the micellar growth can occur by (A) fusion/fragmentation of
micelles or (B) concomitant fusion/fragmentation of micelles and unimer
exchange, followed by smoothing of the rod-like structures.141
The life-time of the micelles and the time to reach system equilibration has
shown to vary a lot, taking days or even month before equilibrium is
reached.109, 140 The dominant mechanisms are expected to depend on many
parameters such as the length of both the hydrophilic and hydrophobic blocks,
the PEO/PPO ratio, the affinity for the solvent, and the swelling degree of the
core.141 In particular, the effects of the copolymer length have not been
investigated so far. By modulating these parameters, one can expect to
increase or decrease the kinetic stability of the structures formed.
However, due to the large variety of experimental settings between the
different studies (measurement technique, equilibration time scales, polymer
composition, concentration and the use of additives), a consensus has been
difficult to achieve. Dynamic light scattering is a characterization technique
that provides the means to analyze the kinetics and mechanisms of these
structural transitions. Details on this technique are given in the following
section.
Chapter 1. Pluronic block copolymers
34
Figure 10. On the left: cryo-EM images of Pluronic P123 with added salt (KCl) and alcohol (ethanol) after (A) 5 minutes and (B) 2 hours. On the right: schematic representation of the proposed mechanisms for the sphere-to-rod transition of block copolymer micelles.141
1.6 Dynamic Light Scattering
Although dynamic light scattering (DLS) appears now to be a standard and
powerful technique widely used to study the properties of solutions with
different components such as proteins, macromolecules, polymers and
nanoparticles, its specific application to the analysis of growing micellar
aggregates requires some caution.
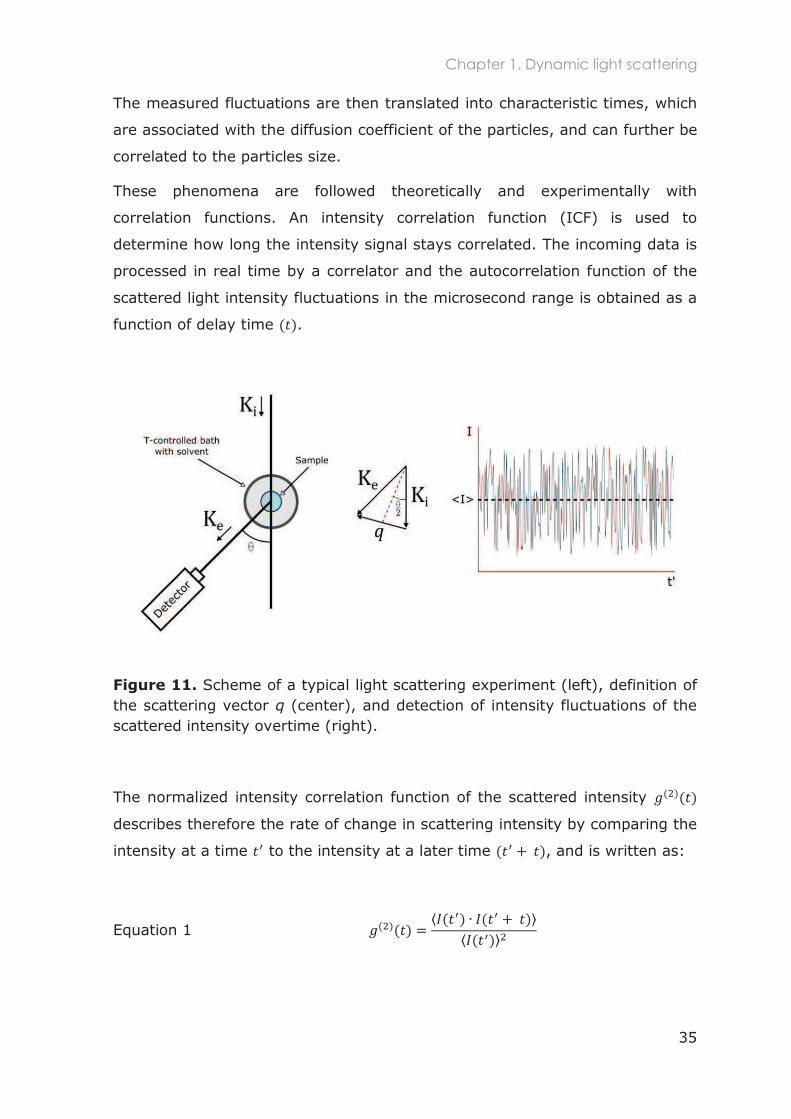
The sample is inserted in a small quartz cell, which is placed in a bath filled
with a solvent which has a refractive index ( ) similar to glass e.g. toluene
( =1.496). Through illumination of the sample with a laser beam, this
technique is able to measure time-dependent fluctuations of the scattered
intensity that arise from the species present in solution (Figure 11).
The principle of the technique is based on the fact that light is scattered by
fluctuations in the dielectric constant of the medium. Those in turn are
proportion to the fluctuations in the concentration of the solutes. The latter are
linked to the Brownian motion of the particles (translational and rotation).144
Chapter 1. Dynamic light scattering
35
The measured fluctuations are then translated into characteristic times, which
are associated with the diffusion coefficient of the particles, and can further be
correlated to the particles size.
These phenomena are followed theoretically and experimentally with
correlation functions. An intensity correlation function (ICF) is used to
determine how long the intensity signal stays correlated. The incoming data is
processed in real time by a correlator and the autocorrelation function of the
scattered light intensity fluctuations in the microsecond range is obtained as a
function of delay time .
Figure 11. Scheme of a typical light scattering experiment (left), definition of the scattering vector q (center), and detection of intensity fluctuations of the scattered intensity overtime (right).
The normalized intensity correlation function of the scattered intensity
describes therefore the rate of change in scattering intensity by comparing the
intensity at a time to the intensity at a later time , and is written as:
Equation 1
Chapter 1. Dynamic light scattering
36
The autocorrelation function of the scattered electric field is defined
similarly as:
Equation 2
The and are related through the Siegert equation:
Equation 3
where is a numerical factor close to unity that depends on geometry of
detection.144
The analysis of the data is then processed using the cumulant method or the
CONTIN fitting for monomodal or polymodal systems respectively.
In monodisperse systems, decays in a single exponential:
Equation 4
where is the decay rate and the inverse of correlation time, and is the
translational diffusion coefficient determined for each single object with a
defined mass center and undergoing Brownian motion.
Chapter 1. Dynamic light scattering
37
The hydrodynamic radius can then be determined using the Stokes-Einstein
equation which determines the diameter of a sphere with the same as the
measured particles:
Equation 5
where is the Boltzmann constant, is the absolute temperature, and is
the solvent viscosity.
For polydisperse systems, there is a distribution of relaxation times . The
can then be written as the integral over the exponential decay with
as the distribution function of the relaxation times. Formally, is the
Laplace transform of as follows:
Equation 6
Equation 7
Due to data noise, trying to numerically inverse Laplace transform of to
obtain is not possible without very large numerical errors. A different
approach has been proposed by S.W. Provencher using the CONTIN method,
by discretizing the pseudo-distribution of relaxation times on a number of
grid point values:
Equation 8
Chapter 1. Dynamic light scattering
38
The resolution of this equation by least squares minimization is an ill-posed
problem and demands the use of a regularizer that puts high penalties on
unphysical solutions. The solution provided by the CONTIN method is only
likely and must always be checked for consistency with a priori knowledge
about the physical system under investigation. It is still sensitive to
experimental noise and its robustness should be checked by repeated
measurements and analysis.
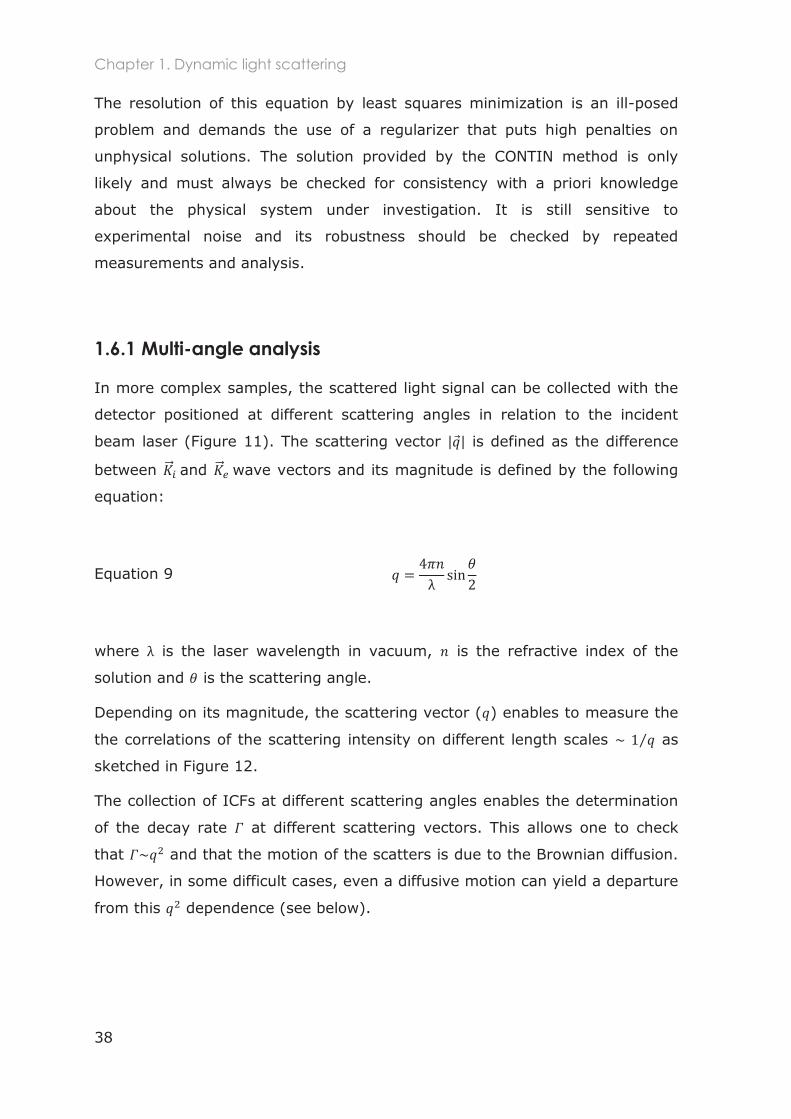
1.6.1 Multi-angle analysis
In more complex samples, the scattered light signal can be collected with the
detector positioned at different scattering angles in relation to the incident
beam laser (Figure 11). The scattering vector is defined as the difference
between and wave vectors and its magnitude is defined by the following
equation:
Equation 9
where is the laser wavelength in vacuum, is the refractive index of the
solution and is the scattering angle.
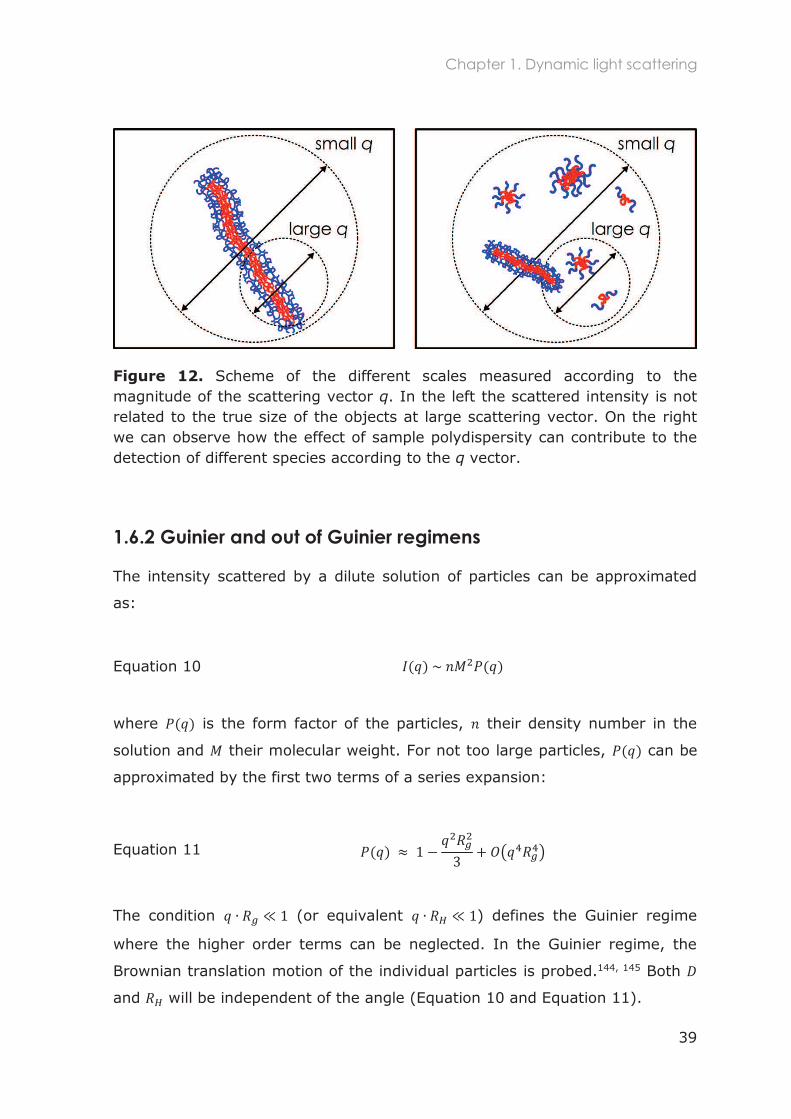
Depending on its magnitude, the scattering vector ( ) enables to measure the
the correlations of the scattering intensity on different length scales as
sketched in Figure 12.
The collection of ICFs at different scattering angles enables the determination
of the decay rate at different scattering vectors. This allows one to check
that and that the motion of the scatters is due to the Brownian diffusion.
However, in some difficult cases, even a diffusive motion can yield a departure
from this dependence (see below).
Chapter 1. Dynamic light scattering
39
Figure 12. Scheme of the different scales measured according to the magnitude of the scattering vector q. In the left the scattered intensity is not related to the true size of the objects at large scattering vector. On the right we can observe how the effect of sample polydispersity can contribute to the detection of different species according to the q vector.
1.6.2 Guinier and out of Guinier regimens
The intensity scattered by a dilute solution of particles can be approximated
as:
Equation 10
where is the form factor of the particles, their density number in the
solution and their molecular weight. For not too large particles, can be
approximated by the first two terms of a series expansion:
Equation 11
The condition (or equivalent ) defines the Guinier regime
where the higher order terms can be neglected. In the Guinier regime, the
Brownian translation motion of the individual particles is probed.144, 145 Both
and will be independent of the angle (Equation 10 and Equation 11).
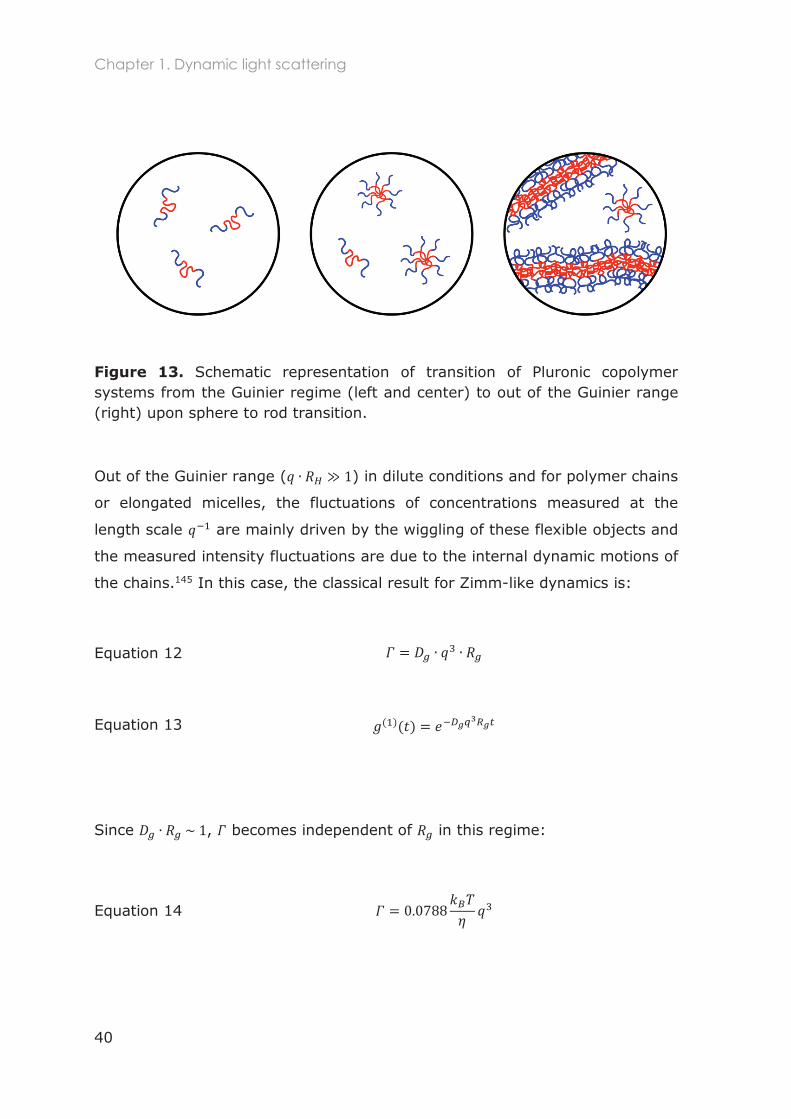
Chapter 1. Dynamic light scattering
40
Figure 13. Schematic representation of transition of Pluronic copolymer systems from the Guinier regime (left and center) to out of the Guinier range (right) upon sphere to rod transition.
Out of the Guinier range ( ) in dilute conditions and for polymer chains
or elongated micelles, the fluctuations of concentrations measured at the
length scale are mainly driven by the wiggling of these flexible objects and
the measured intensity fluctuations are due to the internal dynamic motions of
the chains.145 In this case, the classical result for Zimm-like dynamics is:
Equation 12
Equation 13
Since , becomes independent of in this regime:
Equation 14
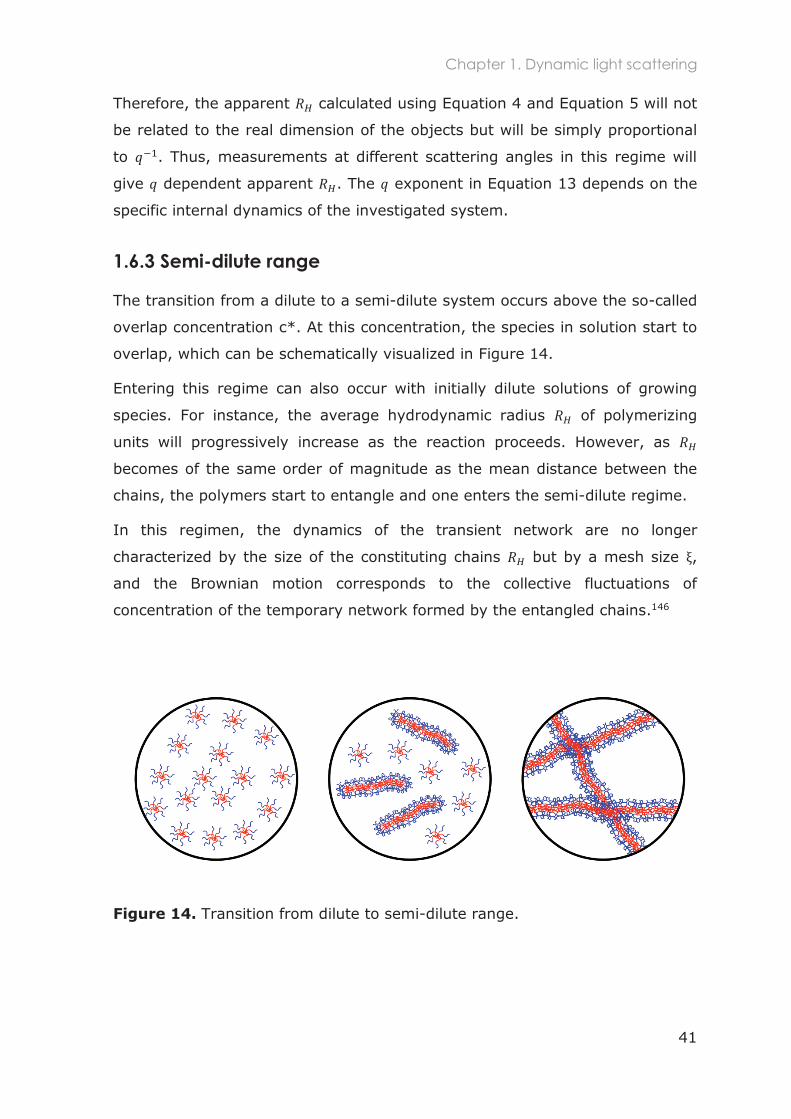
Chapter 1. Dynamic light scattering
41
Therefore, the apparent calculated using Equation 4 and Equation 5 will not
be related to the real dimension of the objects but will be simply proportional
to . Thus, measurements at different scattering angles in this regime will
give dependent apparent . The exponent in Equation 13 depends on the
specific internal dynamics of the investigated system.
1.6.3 Semi-dilute range
The transition from a dilute to a semi-dilute system occurs above the so-called
overlap concentration c*. At this concentration, the species in solution start to
overlap, which can be schematically visualized in Figure 14.
Entering this regime can also occur with initially dilute solutions of growing
species. For instance, the average hydrodynamic radius of polymerizing
units will progressively increase as the reaction proceeds. However, as
becomes of the same order of magnitude as the mean distance between the
chains, the polymers start to entangle and one enters the semi-dilute regime.
In this regimen, the dynamics of the transient network are no longer
characterized by the size of the constituting chains but by a mesh size ,
and the Brownian motion corresponds to the collective fluctuations of
concentration of the temporary network formed by the entangled chains.146
Figure 14. Transition from dilute to semi-dilute range.
Chapter 1. Dynamic light scattering
42
The corresponding collective diffusion coefficient is then related to the
characteristic mesh size of the entangled solution and no longer to the
molecular dimensions of the entangled chains.
During the polymerization or the growth transition of polymer micelles, there
will be a crossover from the dilute regime ( ) to the semi-dilute
regime, where becomes a constant depending on the polymer
concentration. Thus, there will be an apparent levelling of the apparent
even if the micellar growth is still occurring.
1.6.4 Polydispersity effects
One peculiar and often neglected aspect of dynamic light scattering is the fact
that the contribution of species to the fluctuations of the scattering intensity is
weighted by their contribution (Equation 10) to the average scattering
intensity. This means that the relative contribution of species with widely
different sizes will be weighted differently depending on the scattering angle
(Figure 12). In particular, the contribution of large aggregates will be smaller
at larger scattering vectors and the contribution of small aggregates will be
dwarfed by that of large aggregates, especially at small scattering vectors.
Therefore, the distribution of relaxation times or in Equation 6 and
Equation 8 is in principle dependent.
For small size polydispersities, this is often unnoticeable. However, for large
polydispersities, the intensity correlation function is not measured with a
constant when is varied. This can yield a departure from the
dependence expected for the measured < >, and to apparent values
depending on the scattering angle. In this case, only the values obtained by
extrapolation to keep a precise meaning during the growth process.
To conclude, while investigating the growth of micellar aggregates, any
dependence of the apparent hydrodynamic radius on the scattering vector
should ring a bell and warn us that we are no longer measuring the size of the
growing aggregates in a meaningful way.
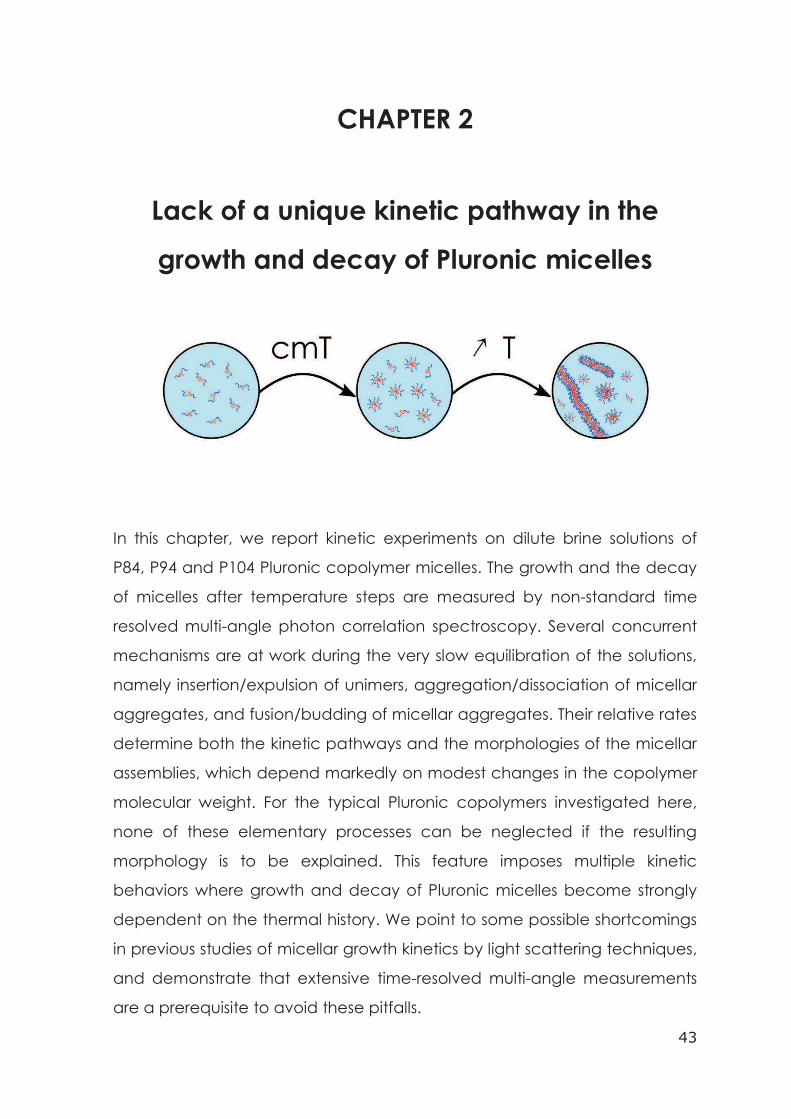
43
CHAPTER 2
Lack of a unique kinetic pathway in the
growth and decay of Pluronic micelles
In this chapter, we report kinetic experiments on dilute brine solutions of
P84, P94 and P104 Pluronic copolymer micelles. The growth and the decay
of micelles after temperature steps are measured by non-standard time
resolved multi-angle photon correlation spectroscopy. Several concurrent
mechanisms are at work during the very slow equilibration of the solutions,
namely insertion/expulsion of unimers, aggregation/dissociation of micellar
aggregates, and fusion/budding of micellar aggregates. Their relative rates
determine both the kinetic pathways and the morphologies of the micellar
assemblies, which depend markedly on modest changes in the copolymer
molecular weight. For the typical Pluronic copolymers investigated here,
none of these elementary processes can be neglected if the resulting
morphology is to be explained. This feature imposes multiple kinetic
behaviors where growth and decay of Pluronic micelles become strongly
dependent on the thermal history. We point to some possible shortcomings
in previous studies of micellar growth kinetics by light scattering techniques,
and demonstrate that extensive time-resolved multi-angle measurements
are a prerequisite to avoid these pitfalls.

44
Chapter 2. Introduction
45
2.1 Introduction
The dynamics of block copolymer micelles in selective solvent of one block (A)
has been the subject of intensive work in the past two decades.141, 147, 148
At thermodynamic equilibrium, there is a fast exchange of unimers between
micelles and the bulk solution through insertion/expulsion steps like in short
surfactant solutions.142 In comparison, fusion/fission of micelles are relatively
much slower and play also a role in equilibrium dynamics.149-151
After small temperature jumps, the concentration of free surfactant molecules
(cmc) goes to a new value and the size and number of copolymer micelles
achieve new average values. The cmc is equilibrated rapidly through the fast
exchange of unimers between the bulk solution and the micelles.
The equilibration of the average number density of micelles is slower by two or
three orders of magnitude and its mechanism was the subject of many
discussions.136-138, 150, 152-159 Two different routes based on the equilibrium
dynamics have been proposed: step by step association of individual unimers
or successive fusion/fission steps between micellar aggregates.
For appropriate block length ratios, spherical micelles can grow reversibly into
wormlike micelles upon changes in temperature112, 140, 143, 160-165 or solvent
composition.166, 167 The equilibration times vary widely in the range 1-100 h
with experimental conditions and various kinetic pathways were proposed for
the growth transition: fusion/fission coexisting with unimer exchange,143
random fusion/fragmentation of spherical and rodlike micelles,140 or
aggregation of spherical micelles followed by transformation into smooth
cylinders.166 The worm-to-sphere decay transition is consistently faster than
the growth160, 163, 166 and facilitated by higher polymer concentration.163
Mechanisms proposed for the decay transition were either a sequential
budding at rod ends followed by spherical micelles release growth163, 166 or fast
random fragmentation followed by equilibration through unimer exchange.148
While each of these mechanisms has been proposed and validated for specific
systems, only few systematic variations of molecular parameters, like e.g.
molecular weight or composition, have been performed to determine how the
latter affect the relative importance of these mechanisms. Moreover, some
Chapter 2. Introduction
46
light scattering studies did not separate properly the growth kinetics from the
crossover to the entangled regime and/or out of the Guinier regime for the
growing micelles. Therefore, conclusions, e.g. about concentration effects on
the kinetics, could be strongly biased by these approximations.
In this chapter we address these issues by studying the growth kinetics of
dilute Pluronic micelles with multi-angle light scattering experiments. We start
by characterizing the copolymers, particularly their purity and composition,
and we also determine their critical micelle temperature (cmT) at a fixed
copolymer concentration in 2M NaCl. Then, we study specifically the effect of
the total molecular weight of the copolymers, while keeping their PEO/PPO
composition constant. We started by performing large temperature jumps
(T-jumps) but verified that the evolution of the systems was very complex.
Therefore, we carried out small T-jumps in the transition region where the
spherical micelles start to grow into elongated cylinders before entering the
semi-dilute range or out of the Guinier regimen.
The main goal was to verify if, by varying the molecular weight of the
copolymers, (1) different morphologies are obtained and (2) if it is possible to
modulate their stability for their use as nanomedicines.
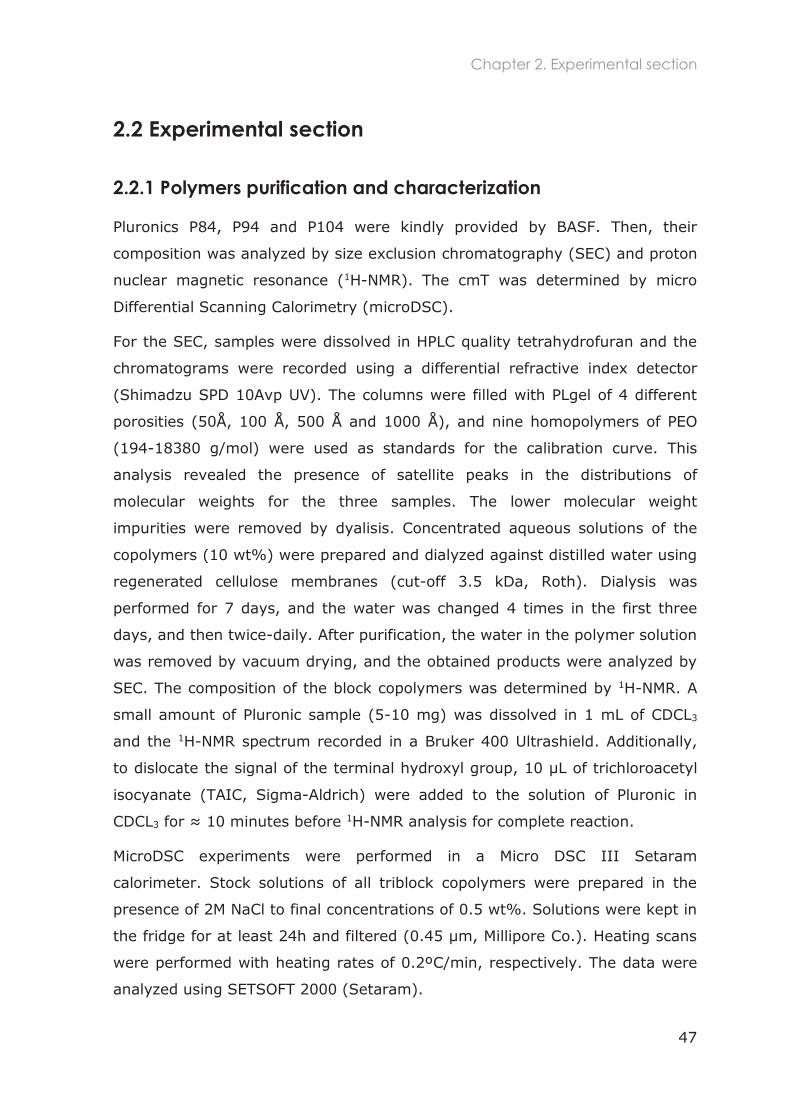
Chapter 2. Experimental section
47
2.2 Experimental section
2.2.1 Polymers purification and characterization
Pluronics P84, P94 and P104 were kindly provided by BASF. Then, their
composition was analyzed by size exclusion chromatography (SEC) and proton
nuclear magnetic resonance (1H-NMR). The cmT was determined by micro
Differential Scanning Calorimetry (microDSC).
For the SEC, samples were dissolved in HPLC quality tetrahydrofuran and the
chromatograms were recorded using a differential refractive index detector
(Shimadzu SPD 10Avp UV). The columns were filled with PLgel of 4 different
porosities (50Å, 100 Å, 500 Å and 1000 Å), and nine homopolymers of PEO
(194-18380 g/mol) were used as standards for the calibration curve. This
analysis revealed the presence of satellite peaks in the distributions of
molecular weights for the three samples. The lower molecular weight
impurities were removed by dyalisis. Concentrated aqueous solutions of the
copolymers (10 wt%) were prepared and dialyzed against distilled water using
regenerated cellulose membranes (cut-off 3.5 kDa, Roth). Dialysis was
performed for 7 days, and the water was changed 4 times in the first three
days, and then twice-daily. After purification, the water in the polymer solution
was removed by vacuum drying, and the obtained products were analyzed by
SEC. The composition of the block copolymers was determined by 1H-NMR. A
small amount of Pluronic sample (5-10 mg) was dissolved in 1 mL of CDCL3
and the 1H-NMR spectrum recorded in a Bruker 400 Ultrashield. Additionally,
to dislocate the signal of the terminal hydroxyl group, 10 µL of trichloroacetyl
isocyanate (TAIC, Sigma-Aldrich) were added to the solution of Pluronic in
CDCL3 for 10 minutes before 1H-NMR analysis for complete reaction.
MicroDSC experiments were performed in a Micro DSC III Setaram
calorimeter. Stock solutions of all triblock copolymers were prepared in the
presence of 2M NaCl to final concentrations of 0.5 wt%. Solutions were kept in
the fridge for at least 24h and filtered (0.45 µm, Millipore Co.). Heating scans
were performed with heating rates of 0.2ºC/min, respectively. The data were
analyzed using SETSOFT 2000 (Setaram).
Chapter 2. Experimental section
48
2.2.2 Samples preparation
Solutions were prepared at polymer concentration cp = 0.5 g/L by weighing
purified polymer in 2M NaCl brine prepared with MilliQ water. Gentle manual
shaking was applied to facilitate dispersion and samples were immediately put
in the fridge (ca. 4ºC) before use.
2.2.3 Dynamic Light Scattering
All samples were filtered (Millipore hydrophilic PTFE 0.45mm) in the cylindrical
scattering cells (diameter 20 mm) prior to the DLS experiments, which were
performed with a compact ALV/CGS-8 goniometer system equipped with an
He-Ne laser (14 mW, ALV-7002/USB-25
autocorrelator and an automatic attenuator driven by the proprietary ALV
software. The temperature of the matching index fluid (toluene) was controlled
with a circulating water bath (Huber) and measured with a Pt probe.
Temperature was stable within ±0.1ºC and temperature jumps were achieved
after about two minutes. Measurements were done by looping repeatedly on
nine scattering angles (20º 120º) and measuring the intensity
correlation function (ICF) and the average scattering intensity for
typically 180 s at each angle. The effective incident intensity was measured
by a diode placed after the attenuator. For very strong scattering intensities,
the incident intensity was attenuated further by neutral filters with known
transmission values . The total scattering intensities were calculated as
and further normalized with respect to the average intensity
scattered by a toluene standard. All intensities are given and plotted in these
units.
Kinetics were investigated for typically 1 day up to 20 days at a given
temperature. Unless otherwise specified, samples were kept in place for the
whole duration of the experiment. Therefore most gaps in the data are only
due to random unattended crash of the acquisition software during
measurements, with no consequence on the thermal regulation of the sample.
Total duration for a complete thermal history lasted typically a few weeks.
Chapter 2. Experimental section
49
2.2.4 Data analysis
Each ICF was analyzed with CONTIN software. In most cases, one or two
decay modes were obtained that were very well described by log-normal
curves. Thus the peaks in the distributions of relaxation times could be easily
fitted and deconvoluted. Peak areas were then calculated and gave the relative
contribution of each decay mode to the decay of the ICF and to .168-170
The position of each peak maximum was used as the value of the
corresponding relaxation time . The latter was converted into an apparent
hydrodynamic radius (AHR) with the Stokes-Einstein relationship (see
Equation 5 in Chapter 1) to factor out any trivial temperature dependence due
to the Boltzmann factor and to the solvent viscosity. This relation also ensures
q-independent AHRs for diffusive decay modes. However, this is not always
the tru in some specials conditions like e.g. out of the Guinier regime when
and internal dynamic modes come into play for long wormlike micelles,
or when the size polydispersity is large (see Chapter 1 section 1.6 for further
details on these effects). The results of the deconvolution were checked by
biexponential fits when the overlap of decay modes was important. Further
details on data analysis and on peaks identification and sorting are given in
Appendix I.

50
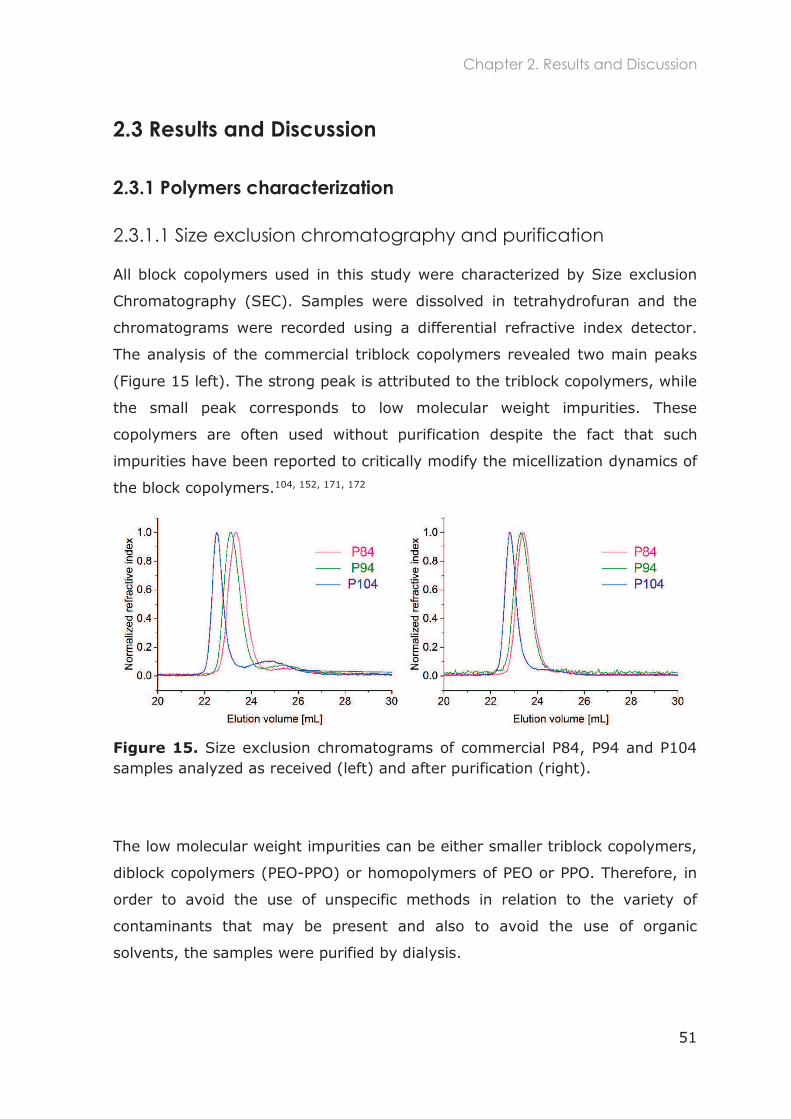
Chapter 2. Results and Discussion
51
2.3 Results and Discussion
2.3.1 Polymers characterization
2.3.1.1 Size exclusion chromatography and purification
All block copolymers used in this study were characterized by Size exclusion
Chromatography (SEC). Samples were dissolved in tetrahydrofuran and the
chromatograms were recorded using a differential refractive index detector.
The analysis of the commercial triblock copolymers revealed two main peaks
(Figure 15 left). The strong peak is attributed to the triblock copolymers, while
the small peak corresponds to low molecular weight impurities. These
copolymers are often used without purification despite the fact that such
impurities have been reported to critically modify the micellization dynamics of
the block copolymers.104, 152, 171, 172
Figure 15. Size exclusion chromatograms of commercial P84, P94 and P104 samples analyzed as received (left) and after purification (right).
The low molecular weight impurities can be either smaller triblock copolymers,
diblock copolymers (PEO-PPO) or homopolymers of PEO or PPO. Therefore, in
order to avoid the use of unspecific methods in relation to the variety of
contaminants that may be present and also to avoid the use of organic
solvents, the samples were purified by dialysis.
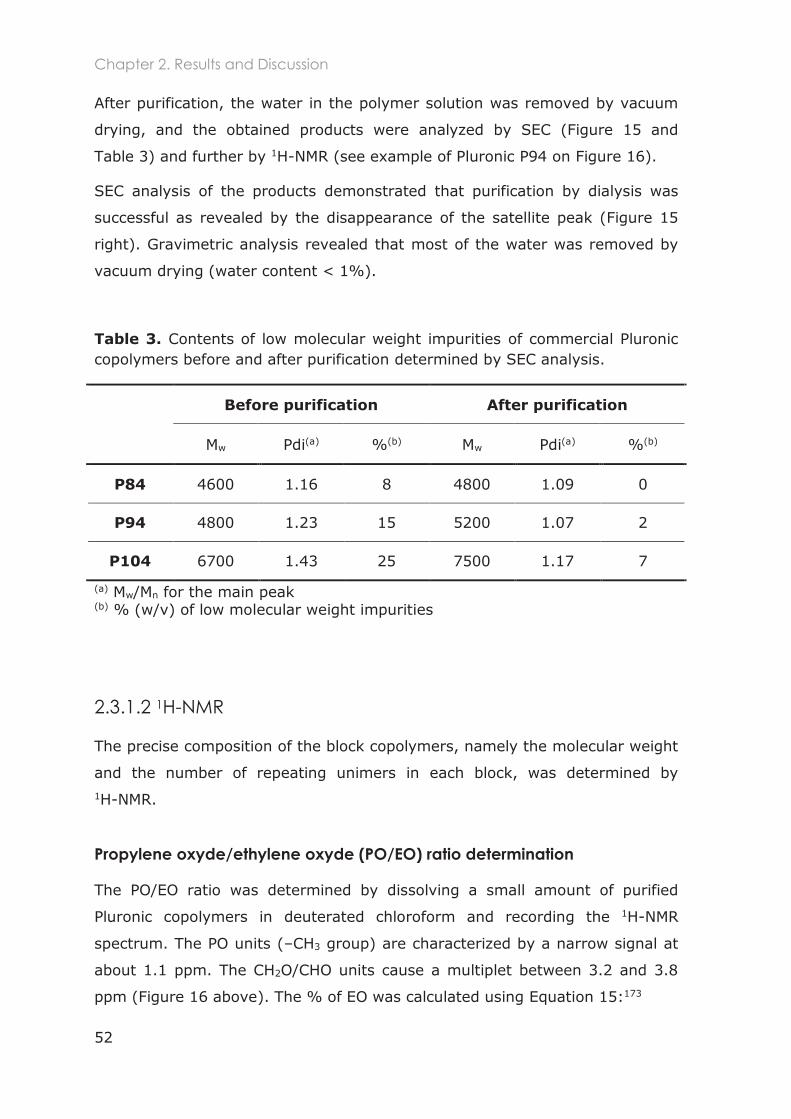
Chapter 2. Results and Discussion
52
After purification, the water in the polymer solution was removed by vacuum
drying, and the obtained products were analyzed by SEC (Figure 15 and
Table 3) and further by 1H-NMR (see example of Pluronic P94 on Figure 16).
SEC analysis of the products demonstrated that purification by dialysis was
successful as revealed by the disappearance of the satellite peak (Figure 15
right). Gravimetric analysis revealed that most of the water was removed by
vacuum drying (water content < 1%).
Table 3. Contents of low molecular weight impurities of commercial Pluronic copolymers before and after purification determined by SEC analysis.
Before purification After purification
Mw Pdi(a) %(b) Mw Pdi(a) %(b)
P84 4600 1.16 8 4800 1.09 0
P94 4800 1.23 15 5200 1.07 2
P104 6700 1.43 25 7500 1.17 7
(a) Mw/Mn for the main peak (b) % (w/v) of low molecular weight impurities
2.3.1.2 1H-NMR
The precise composition of the block copolymers, namely the molecular weight
and the number of repeating unimers in each block, was determined by 1H-NMR.
Propylene oxyde/ethylene oxyde (PO/EO) ratio determination
The PO/EO ratio was determined by dissolving a small amount of purified
Pluronic copolymers in deuterated chloroform and recording the 1H-NMR
spectrum. The PO units ( CH3 group) are characterized by a narrow signal at
about 1.1 ppm. The CH2O/CHO units cause a multiplet between 3.2 and 3.8
ppm (Figure 16 above). The % of EO was calculated using Equation 15:173
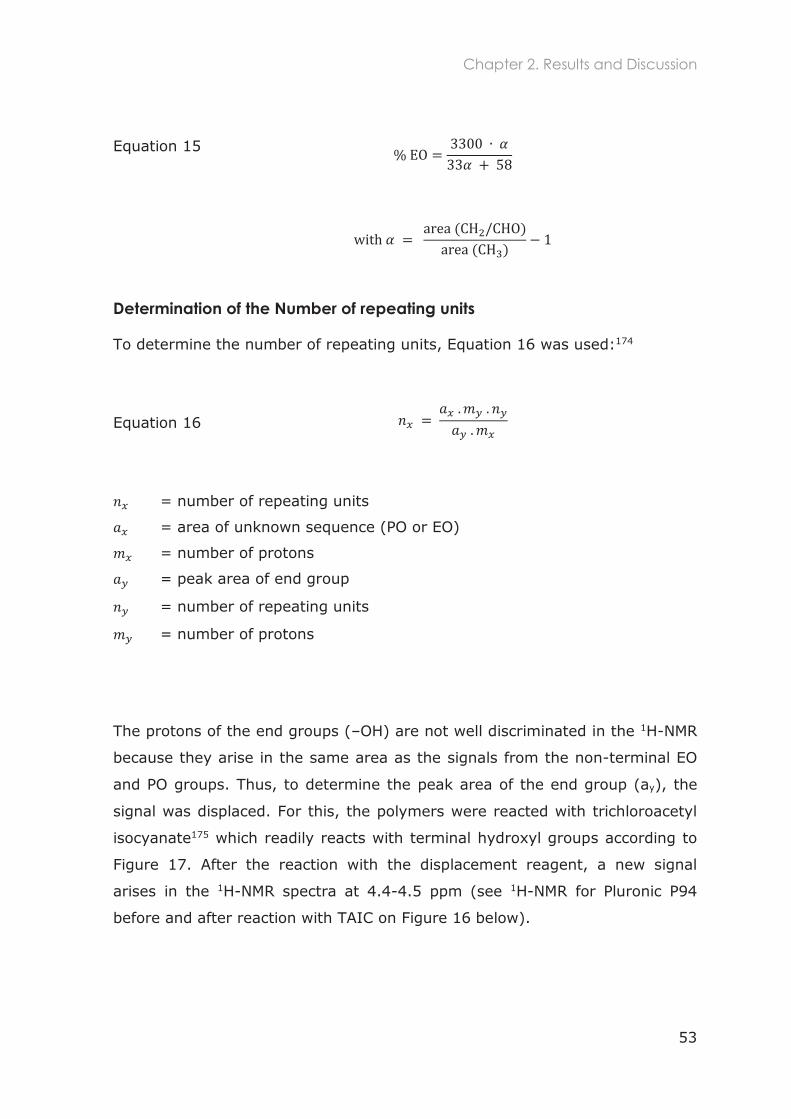
Chapter 2. Results and Discussion
53
Equation 15
Determination of the Number of repeating units
To determine the number of repeating units, Equation 16 was used:174
Equation 16
= number of repeating units
= area of unknown sequence (PO or EO)
= number of protons
= peak area of end group
= number of repeating units
= number of protons
The protons of the end groups ( OH) are not well discriminated in the 1H-NMR
because they arise in the same area as the signals from the non-terminal EO
and PO groups. Thus, to determine the peak area of the end group ( ), the
signal was displaced. For this, the polymers were reacted with trichloroacetyl
isocyanate175 which readily reacts with terminal hydroxyl groups according to
Figure 17. After the reaction with the displacement reagent, a new signal
arises in the 1H-NMR spectra at 4.4-4.5 ppm (see 1H-NMR for Pluronic P94
before and after reaction with TAIC on Figure 16 below).
Chapter 2. Results and Discussion
54
Molecular weight determination
The total molecular weight was determined using the respective number of
repeating units (nPPO and nPEO) determined using Equation 16, the molecular
mass of each unit, and the molecular mass of the end groups.
The results obtained from the 1H-NMR are represented in Table 4 along with
the information provided by the manufacturer. Similar results to ours were
obtained before using 1H and 13C NMR for Pluronic P94104 and MALDI-TOF MS
for Pluronic P104124 which also differ from the information provided by the
manufacturer.
2.3.1.3 Micro Differential Scanning Calorimetry (MicroDSC)
Figure 18 presents the MicroDSC heating scans of 0.5% solution of Pluronic
P84, P94 and P104 in 2M NaCl. The first and fairly broad peak is assigned to
the aggregation of unimers into micelles (micellization). The cmT was
determined after integration of the peaks and it decreases as the molecular
weight increases as expected. The cmT values are 10, 9 and 2oC for Pluronic
P84, P94 and P104 respectively.
The following transitions with much smaller amplitude are probably related to
the sphere-to-rod transition. Different behaviors were observed with all the
copolymers: with P84 we observed a small transition at around 31oC after
micellization has ended, with P94 the micellization does not end and several
steps of transition are observed, and with the P104 almost no transition was
observed.
According to the slow kinetics of micellar growth described in the sections
below, the MicroDSC technique is not suitable for the micellar growth
analyses. The heating scans lasted in general 5 hours, which is not enough
time to observe the slow transitions. The last abrupt transition corresponds to
the beginning of a phase separation process which is not complete at these
temperatures, and does not start for the P104 copolymer
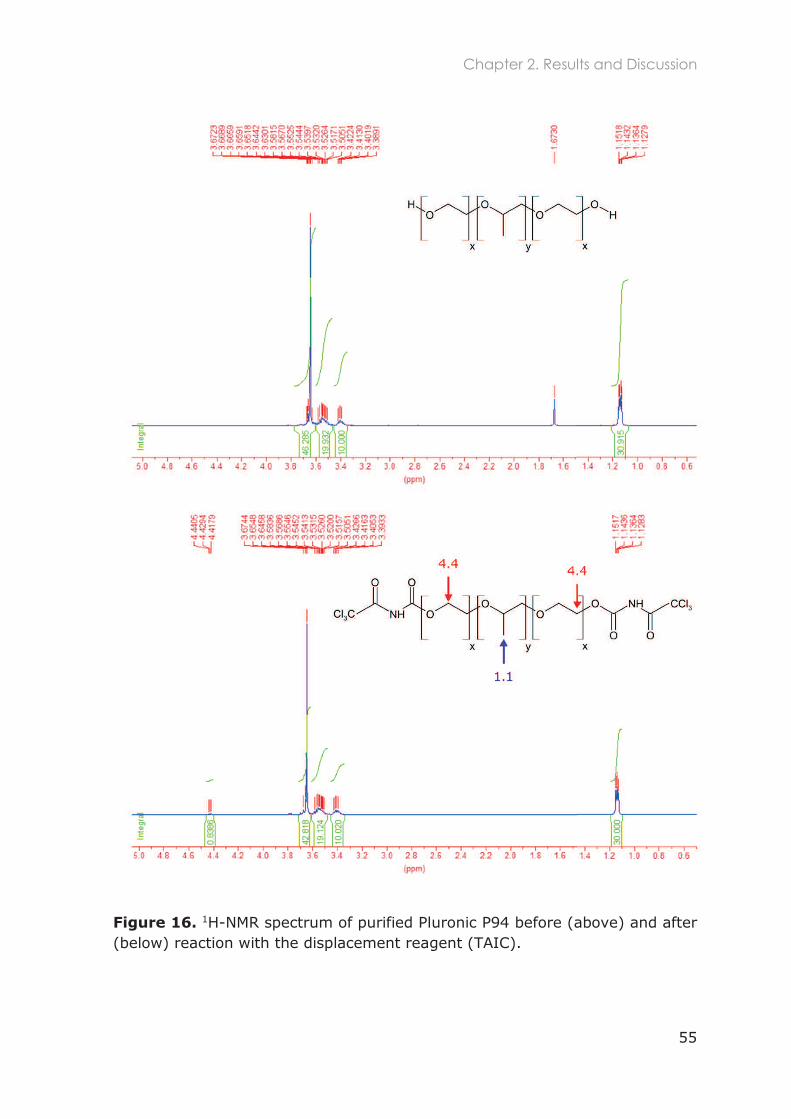
Chapter 2. Results and Discussion
55
Figure 16. 1H-NMR spectrum of purified Pluronic P94 before (above) and after (below) reaction with the displacement reagent (TAIC).
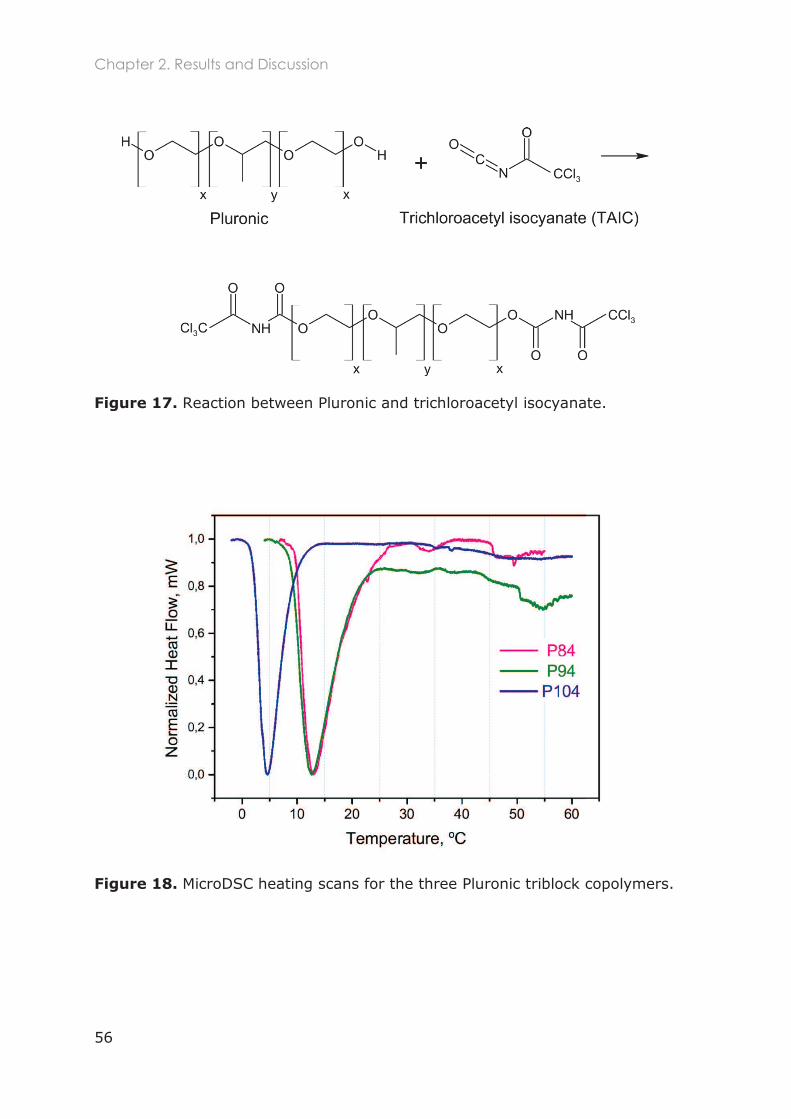
Chapter 2. Results and Discussion
56
Figure 17. Reaction between Pluronic and trichloroacetyl isocyanate.
Figure 18. MicroDSC heating scans for the three Pluronic triblock copolymers.
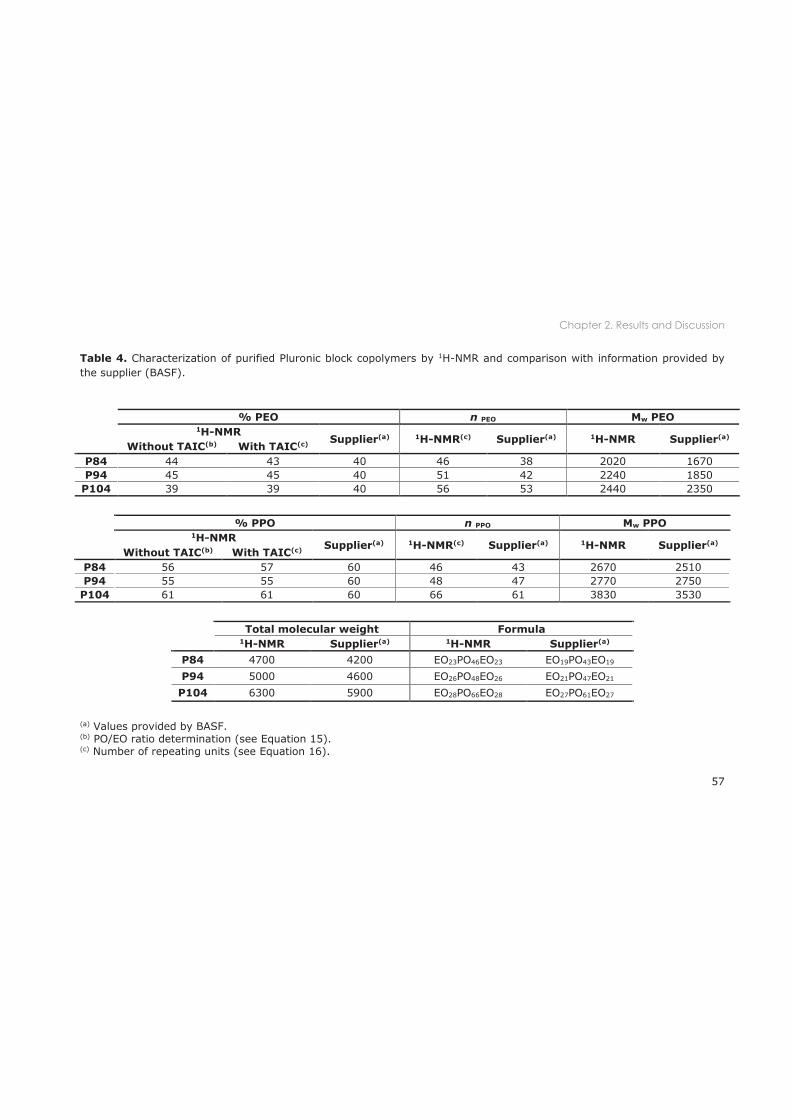
Chapter 2. Results and Discussion
57
Table 4. Characterization of purified Pluronic block copolymers by 1H-NMR and comparison with information provided by the supplier (BASF).
% PEO n PEO Mw PEO
1H-NMR Supplier(a) 1H-NMR(c) Supplier(a) 1H-NMR Supplier(a)
Without TAIC(b) With TAIC(c)
P84 44 43 40 46 38 2020 1670 P94 45 45 40 51 42 2240 1850
P104 39 39 40 56 53 2440 2350
% PPO n PPO Mw PPO
1H-NMR Supplier(a) 1H-NMR(c) Supplier(a) 1H-NMR Supplier(a)
Without TAIC(b) With TAIC(c)
P84 56 57 60 46 43 2670 2510 P94 55 55 60 48 47 2770 2750
P104 61 61 60 66 61 3830 3530
Total molecular weight Formula
1H-NMR Supplier(a) 1H-NMR Supplier(a)
P84 4700 4200 EO23PO46EO23 EO19PO43EO19
P94 5000 4600 EO26PO48EO26 EO21PO47EO21
P104 6300 5900 EO28PO66EO28 EO27PO61EO27
(a) Values provided by BASF. (b) PO/EO ratio determination (see Equation 15). (c) Number of repeating units (see Equation 16).
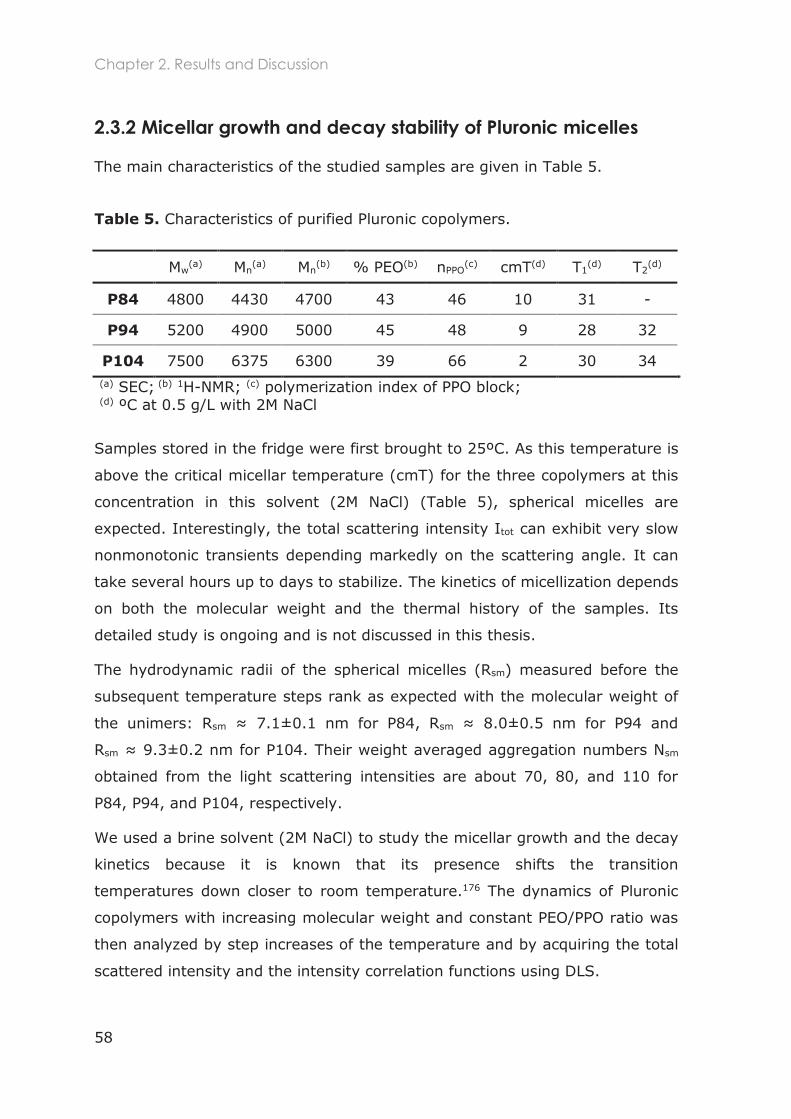
Chapter 2. Results and Discussion
58
2.3.2 Micellar growth and decay stability of Pluronic micelles
The main characteristics of the studied samples are given in Table 5.
Table 5. Characteristics of purified Pluronic copolymers.
Mw(a) Mn
(a) Mn(b) % PEO(b) nPPO
(c) cmT(d) T1(d) T2
(d)
P84 4800 4430 4700 43 46 10 31 -
P94 5200 4900 5000 45 48 9 28 32
P104 7500 6375 6300 39 66 2 30 34 (a) SEC; (b) 1H-NMR; (c) polymerization index of PPO block; (d) ºC at 0.5 g/L with 2M NaCl
Samples stored in the fridge were first brought to 25ºC. As this temperature is
above the critical micellar temperature (cmT) for the three copolymers at this
concentration in this solvent (2M NaCl) (Table 5), spherical micelles are
expected. Interestingly, the total scattering intensity Itot can exhibit very slow
nonmonotonic transients depending markedly on the scattering angle. It can
take several hours up to days to stabilize. The kinetics of micellization depends
on both the molecular weight and the thermal history of the samples. Its
detailed study is ongoing and is not discussed in this thesis.
The hydrodynamic radii of the spherical micelles (Rsm) measured before the
subsequent temperature steps rank as expected with the molecular weight of
the unimers: Rsm sm
Rsm for P104. Their weight averaged aggregation numbers Nsm
obtained from the light scattering intensities are about 70, 80, and 110 for
P84, P94, and P104, respectively.
We used a brine solvent (2M NaCl) to study the micellar growth and the decay
kinetics because it is known that its presence shifts the transition
temperatures down closer to room temperature.176 The dynamics of Pluronic
copolymers with increasing molecular weight and constant PEO/PPO ratio was
then analyzed by step increases of the temperature and by acquiring the total
scattered intensity and the intensity correlation functions using DLS.
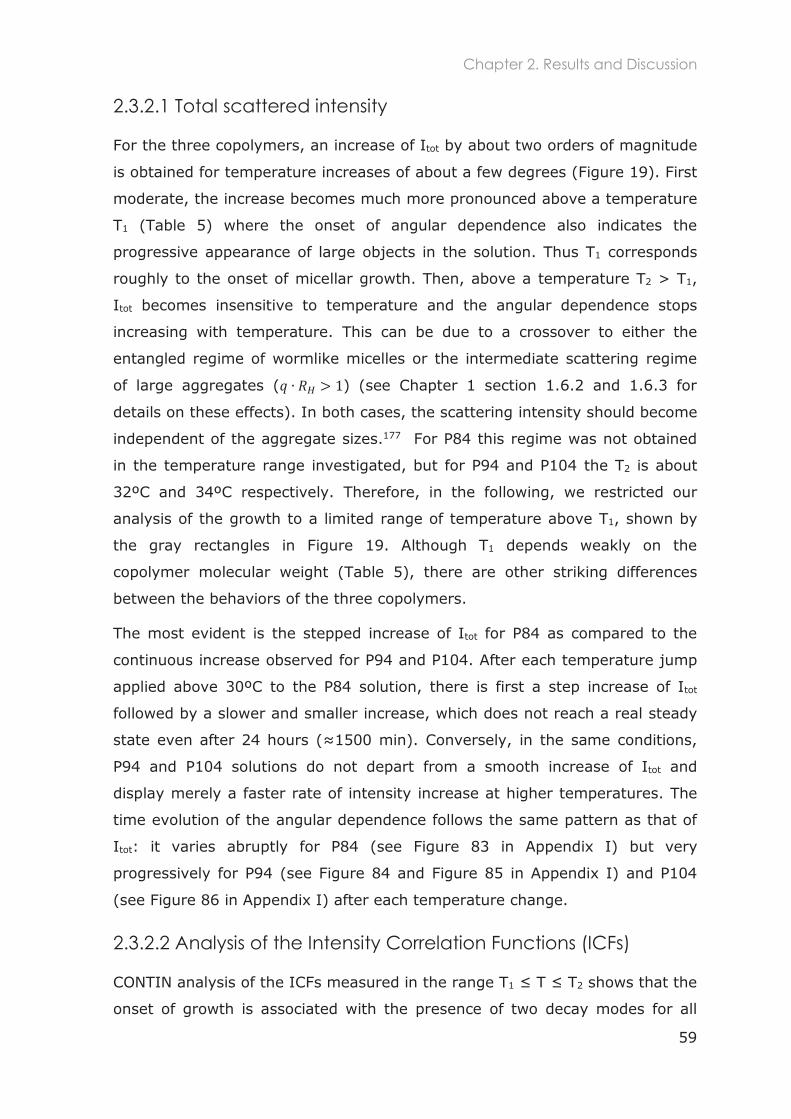
Chapter 2. Results and Discussion
59
2.3.2.1 Total scattered intensity
For the three copolymers, an increase of Itot by about two orders of magnitude
is obtained for temperature increases of about a few degrees (Figure 19). First
moderate, the increase becomes much more pronounced above a temperature
T1 (Table 5) where the onset of angular dependence also indicates the
progressive appearance of large objects in the solution. Thus T1 corresponds
roughly to the onset of micellar growth. Then, above a temperature T2 > T1,
Itot becomes insensitive to temperature and the angular dependence stops
increasing with temperature. This can be due to a crossover to either the
entangled regime of wormlike micelles or the intermediate scattering regime
of large aggregates ( ) (see Chapter 1 section 1.6.2 and 1.6.3 for
details on these effects). In both cases, the scattering intensity should become
independent of the aggregate sizes.177 For P84 this regime was not obtained
in the temperature range investigated, but for P94 and P104 the T2 is about
32ºC and 34ºC respectively. Therefore, in the following, we restricted our
analysis of the growth to a limited range of temperature above T1, shown by
the gray rectangles in Figure 19. Although T1 depends weakly on the
copolymer molecular weight (Table 5), there are other striking differences
between the behaviors of the three copolymers.
The most evident is the stepped increase of Itot for P84 as compared to the
continuous increase observed for P94 and P104. After each temperature jump
applied above 30ºC to the P84 solution, there is first a step increase of Itot
followed by a slower and smaller increase, which does not reach a real steady
state even after 24 hours ( 1500 min). Conversely, in the same conditions,
P94 and P104 solutions do not depart from a smooth increase of Itot and
display merely a faster rate of intensity increase at higher temperatures. The
time evolution of the angular dependence follows the same pattern as that of
Itot: it varies abruptly for P84 (see Figure 83 in Appendix I) but very
progressively for P94 (see Figure 84 and Figure 85 in Appendix I) and P104
(see Figure 86 in Appendix I) after each temperature change.
2.3.2.2 Analysis of the Intensity Correlation Functions (ICFs)
CONTIN analysis of the ICFs measured in the range T1 T T2 shows that the
onset of growth is associated with the presence of two decay modes for all
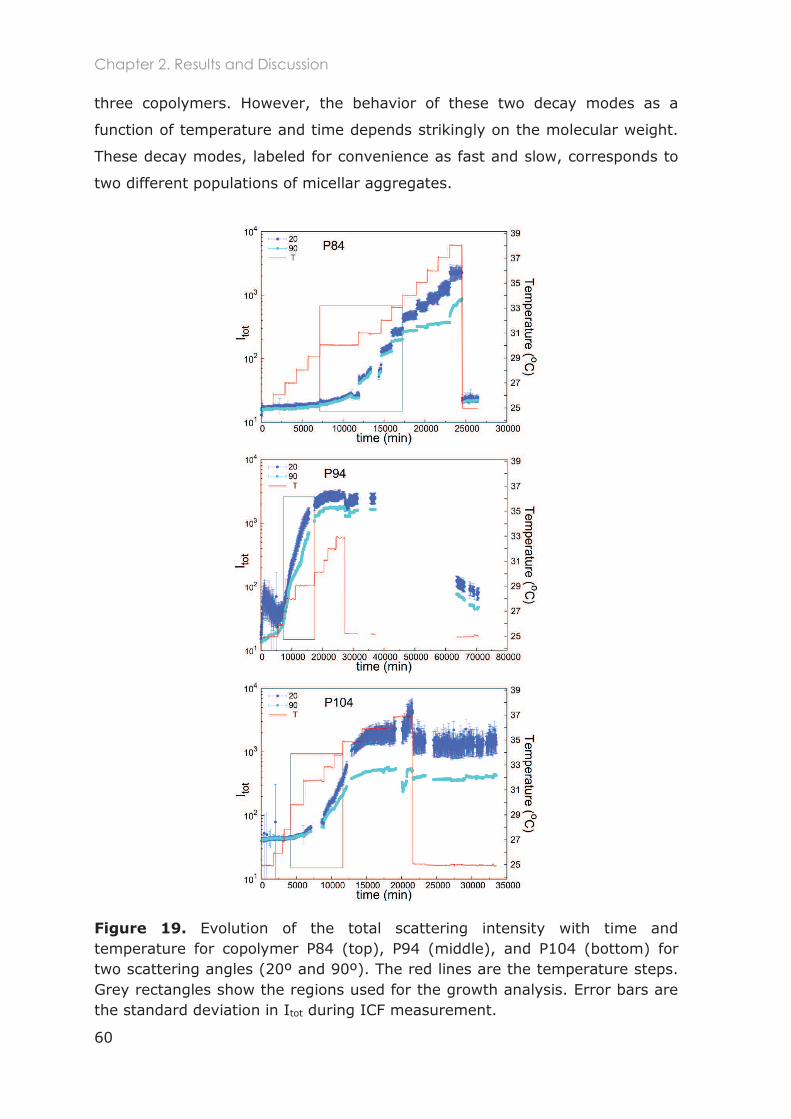
Chapter 2. Results and Discussion
60
three copolymers. However, the behavior of these two decay modes as a
function of temperature and time depends strikingly on the molecular weight.
These decay modes, labeled for convenience as fast and slow, corresponds to
two different populations of micellar aggregates.
Figure 19. Evolution of the total scattering intensity with time and temperature for copolymer P84 (top), P94 (middle), and P104 (bottom) for two scattering angles (20º and 90º). The red lines are the temperature steps. Grey rectangles show the regions used for the growth analysis. Error bars are the standard deviation in Itot during ICF measurement.
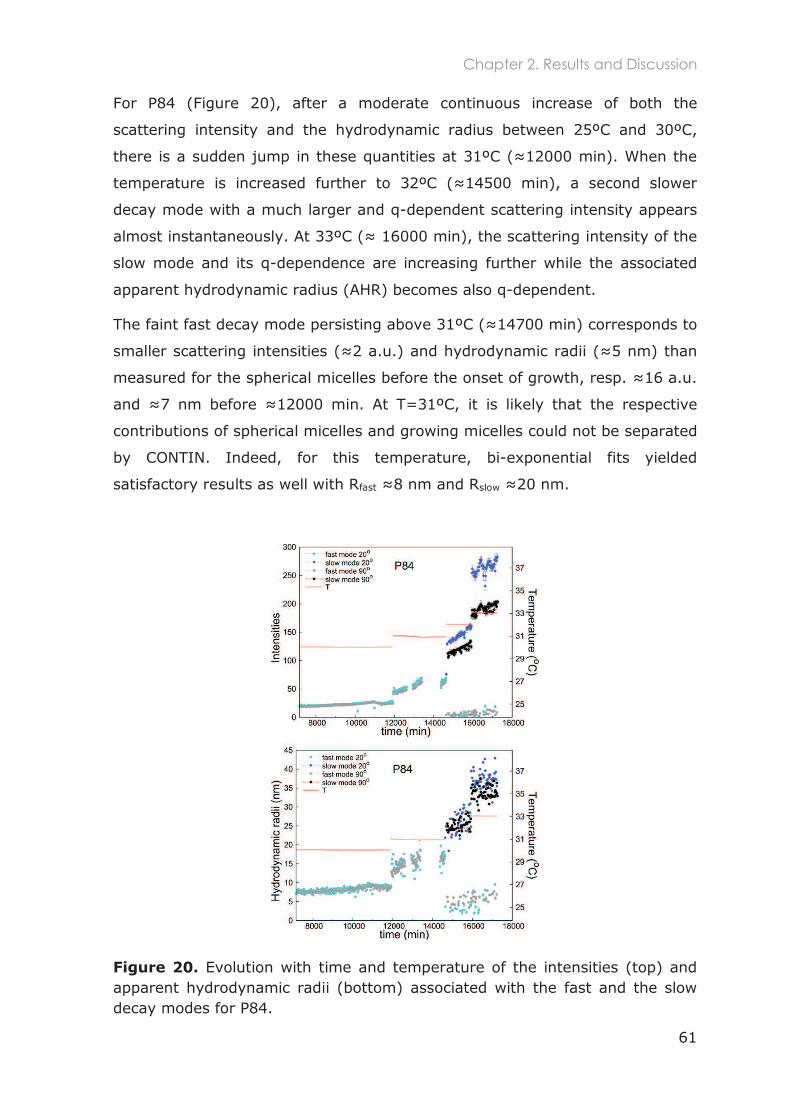
Chapter 2. Results and Discussion
61
For P84 (Figure 20), after a moderate continuous increase of both the
scattering intensity and the hydrodynamic radius between 25ºC and 30ºC,
there is a sudden jump in these quantities at 31ºC ( 12000 min). When the
temperature is increased further to 32ºC ( 14500 min), a second slower
decay mode with a much larger and q-dependent scattering intensity appears
almost instantaneously. At 33ºC ( intensity of the
slow mode and its q-dependence are increasing further while the associated
apparent hydrodynamic radius (AHR) becomes also q-dependent.
The faint fast decay mode persisting above 31ºC ( 14700 min) corresponds to
smaller scattering intensities ( 2 a.u.) and hydrodynamic radii ( 5 nm) than
measured for the spherical micelles before the onset of growth, resp. 16 a.u.
and 7 nm before 12000 min. At T=31ºC, it is likely that the respective
contributions of spherical micelles and growing micelles could not be separated
by CONTIN. Indeed, for this temperature, bi-exponential fits yielded
satisfactory results as well with Rfast 8 nm and Rslow 20 nm.
Figure 20. Evolution with time and temperature of the intensities (top) and apparent hydrodynamic radii (bottom) associated with the fast and the slow decay modes for P84.
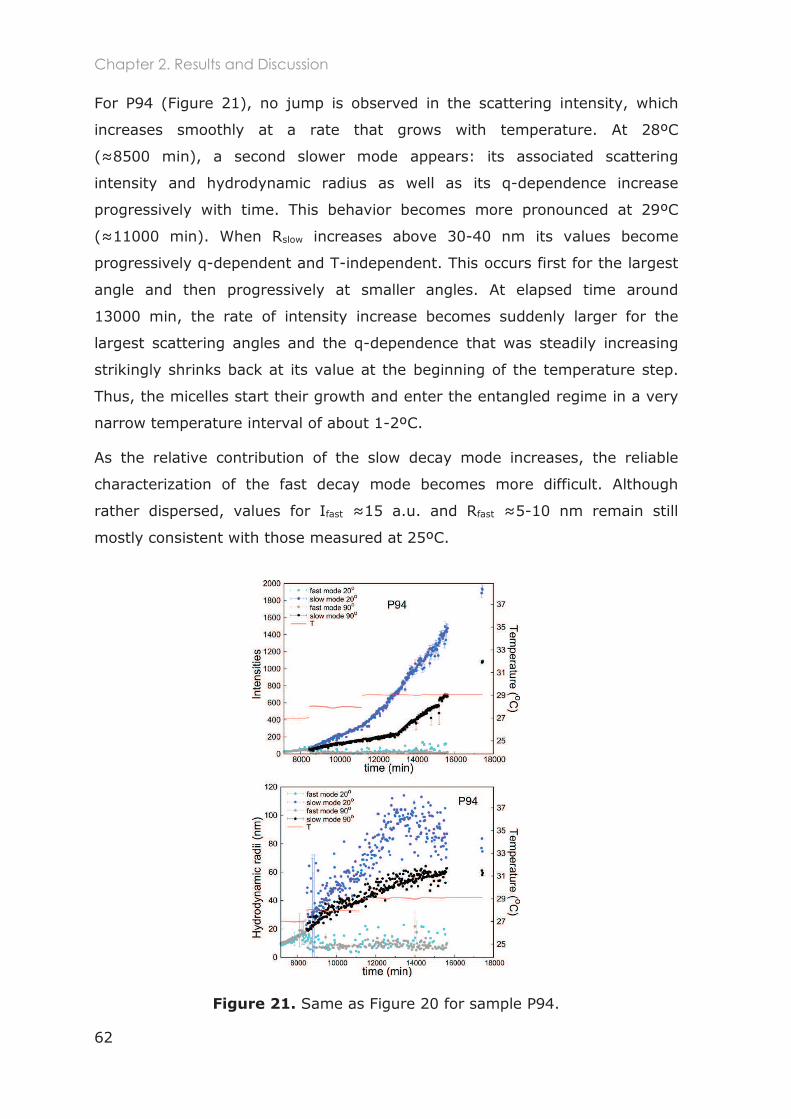
Chapter 2. Results and Discussion
62
For P94 (Figure 21), no jump is observed in the scattering intensity, which
increases smoothly at a rate that grows with temperature. At 28ºC
( 8500 min), a second slower mode appears: its associated scattering
intensity and hydrodynamic radius as well as its q-dependence increase
progressively with time. This behavior becomes more pronounced at 29ºC
( 11000 min). When Rslow increases above 30-40 nm its values become
progressively q-dependent and T-independent. This occurs first for the largest
angle and then progressively at smaller angles. At elapsed time around
13000 min, the rate of intensity increase becomes suddenly larger for the
largest scattering angles and the q-dependence that was steadily increasing
strikingly shrinks back at its value at the beginning of the temperature step.
Thus, the micelles start their growth and enter the entangled regime in a very
narrow temperature interval of about 1-2ºC.
As the relative contribution of the slow decay mode increases, the reliable
characterization of the fast decay mode becomes more difficult. Although
rather dispersed, values for Ifast 15 a.u. and Rfast 5-10 nm remain still
mostly consistent with those measured at 25ºC.
Figure 21. Same as Figure 20 for sample P94.
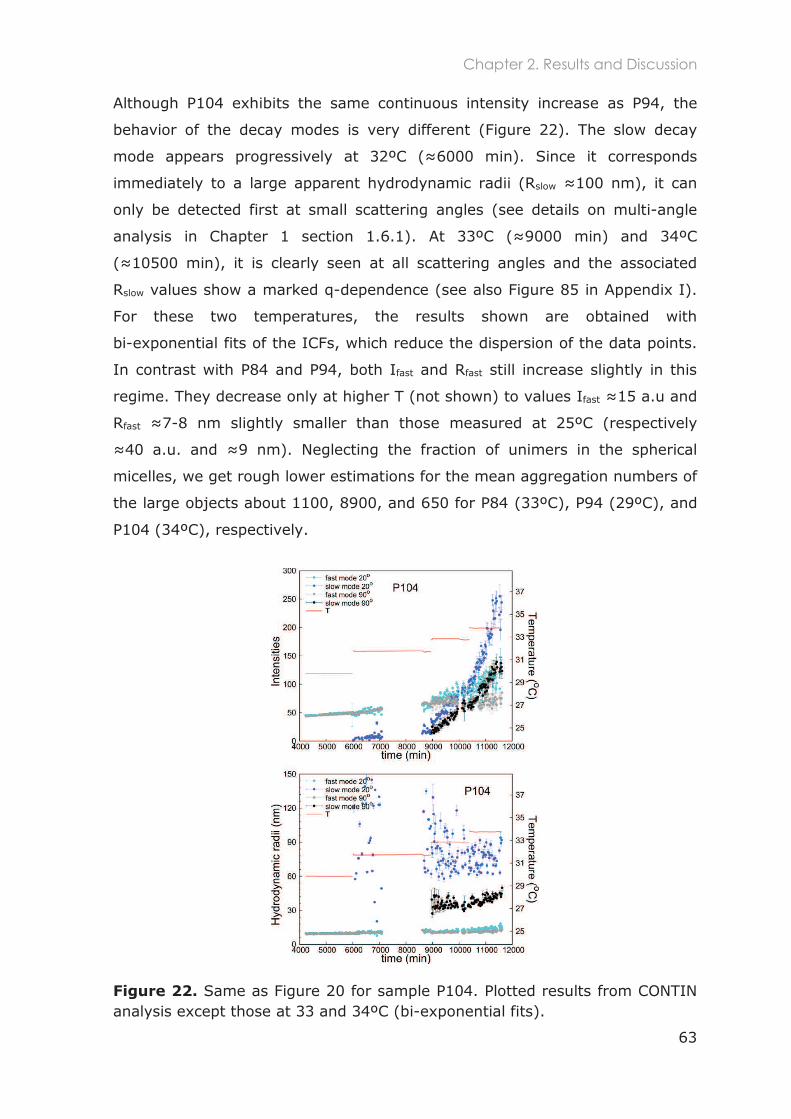
Chapter 2. Results and Discussion
63
Although P104 exhibits the same continuous intensity increase as P94, the
behavior of the decay modes is very different (Figure 22). The slow decay
mode appears progressively at 32ºC ( 6000 min). Since it corresponds
immediately to a large apparent hydrodynamic radii (Rslow 100 nm), it can
only be detected first at small scattering angles (see details on multi-angle
analysis in Chapter 1 section 1.6.1). At 33ºC ( 9000 min) and 34ºC
( 10500 min), it is clearly seen at all scattering angles and the associated
Rslow values show a marked q-dependence (see also Figure 85 in Appendix I).
For these two temperatures, the results shown are obtained with
bi-exponential fits of the ICFs, which reduce the dispersion of the data points.
In contrast with P84 and P94, both Ifast and Rfast still increase slightly in this
regime. They decrease only at higher T (not shown) to values Ifast 15 a.u and
Rfast 7-8 nm slightly smaller than those measured at 25ºC (respectively
40 a.u. and 9 nm). Neglecting the fraction of unimers in the spherical
micelles, we get rough lower estimations for the mean aggregation numbers of
the large objects about 1100, 8900, and 650 for P84 (33ºC), P94 (29ºC), and
P104 (34ºC), respectively.
Figure 22. Same as Figure 20 for sample P104. Plotted results from CONTIN analysis except those at 33 and 34ºC (bi-exponential fits).
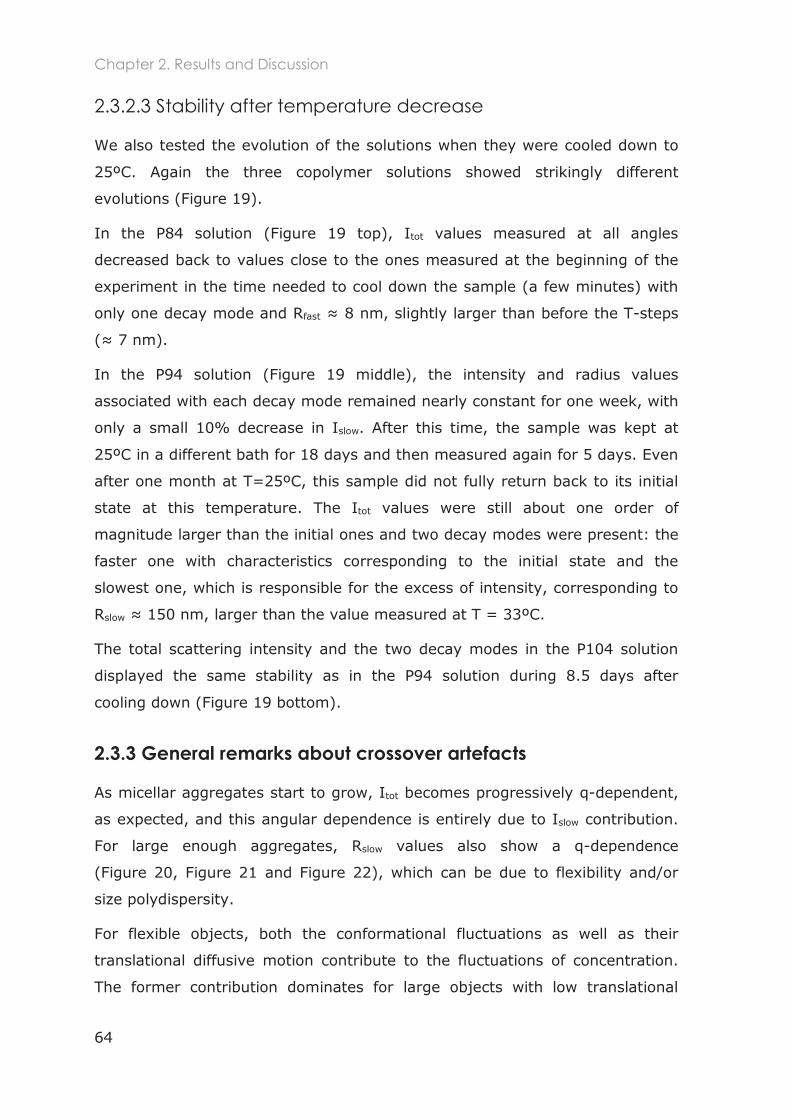
Chapter 2. Results and Discussion
64
2.3.2.3 Stability after temperature decrease
We also tested the evolution of the solutions when they were cooled down to
25ºC. Again the three copolymer solutions showed strikingly different
evolutions (Figure 19).
In the P84 solution (Figure 19 top), Itot values measured at all angles
decreased back to values close to the ones measured at the beginning of the
experiment in the time needed to cool down the sample (a few minutes) with
only one decay mode and Rfast 8 nm, slightly larger than before the T-steps
( 7 nm).
In the P94 solution (Figure 19 middle), the intensity and radius values
associated with each decay mode remained nearly constant for one week, with
only a small 10% decrease in Islow. After this time, the sample was kept at
25ºC in a different bath for 18 days and then measured again for 5 days. Even
after one month at T=25ºC, this sample did not fully return back to its initial
state at this temperature. The Itot values were still about one order of
magnitude larger than the initial ones and two decay modes were present: the
faster one with characteristics corresponding to the initial state and the
slowest one, which is responsible for the excess of intensity, corresponding to
Rslow 150 nm, larger than the value measured at T = 33ºC.
The total scattering intensity and the two decay modes in the P104 solution
displayed the same stability as in the P94 solution during 8.5 days after
cooling down (Figure 19 bottom).
2.3.3 General remarks about crossover artefacts
As micellar aggregates start to grow, Itot becomes progressively q-dependent,
as expected, and this angular dependence is entirely due to Islow contribution.
For large enough aggregates, Rslow values also show a q-dependence
(Figure 20, Figure 21 and Figure 22), which can be due to flexibility and/or
size polydispersity.
For flexible objects, both the conformational fluctuations as well as their
translational diffusive motion contribute to the fluctuations of concentration.
The former contribution dominates for large objects with low translational
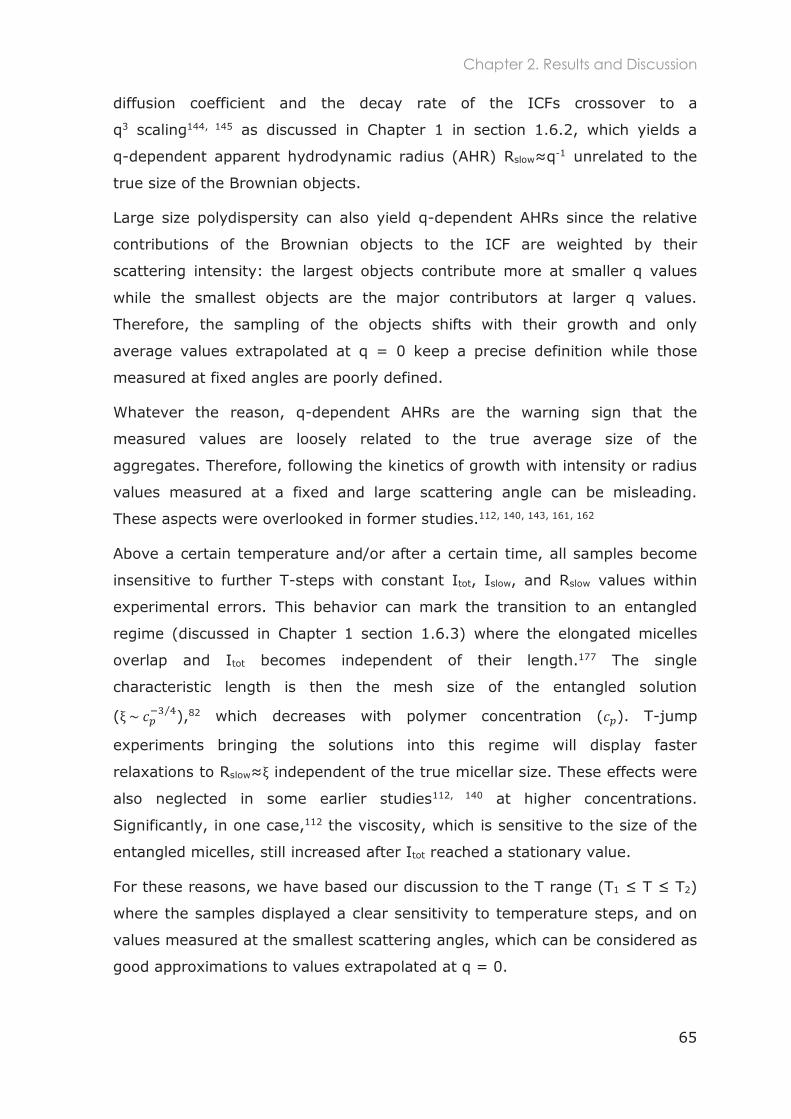
Chapter 2. Results and Discussion
65
diffusion coefficient and the decay rate of the ICFs crossover to a
q3 scaling144, 145 as discussed in Chapter 1 in section 1.6.2, which yields a
q-dependent apparent hydrodynamic radius (AHR) Rslow q-1 unrelated to the
true size of the Brownian objects.
Large size polydispersity can also yield q-dependent AHRs since the relative
contributions of the Brownian objects to the ICF are weighted by their
scattering intensity: the largest objects contribute more at smaller q values
while the smallest objects are the major contributors at larger q values.
Therefore, the sampling of the objects shifts with their growth and only
average values extrapolated at q = 0 keep a precise definition while those
measured at fixed angles are poorly defined.
Whatever the reason, q-dependent AHRs are the warning sign that the
measured values are loosely related to the true average size of the
aggregates. Therefore, following the kinetics of growth with intensity or radius
values measured at a fixed and large scattering angle can be misleading.
These aspects were overlooked in former studies.112, 140, 143, 161, 162
Above a certain temperature and/or after a certain time, all samples become
insensitive to further T-steps with constant Itot, Islow, and Rslow values within
experimental errors. This behavior can mark the transition to an entangled
regime (discussed in Chapter 1 section 1.6.3) where the elongated micelles
overlap and Itot becomes independent of their length.177 The single
characteristic length is then the mesh size of the entangled solution
( ),82 which decreases with polymer concentration ( ). T-jump
experiments bringing the solutions into this regime will display faster
relaxations to Rslow independent of the true micellar size. These effects were
also neglected in some earlier studies112, 140 at higher concentrations.
Significantly, in one case,112 the viscosity, which is sensitive to the size of the
entangled micelles, still increased after Itot reached a stationary value.
For these reasons, we have based our discussion to the T range (T1 T T2)
where the samples displayed a clear sensitivity to temperature steps, and on
values measured at the smallest scattering angles, which can be considered as
good approximations to values extrapolated at q = 0.
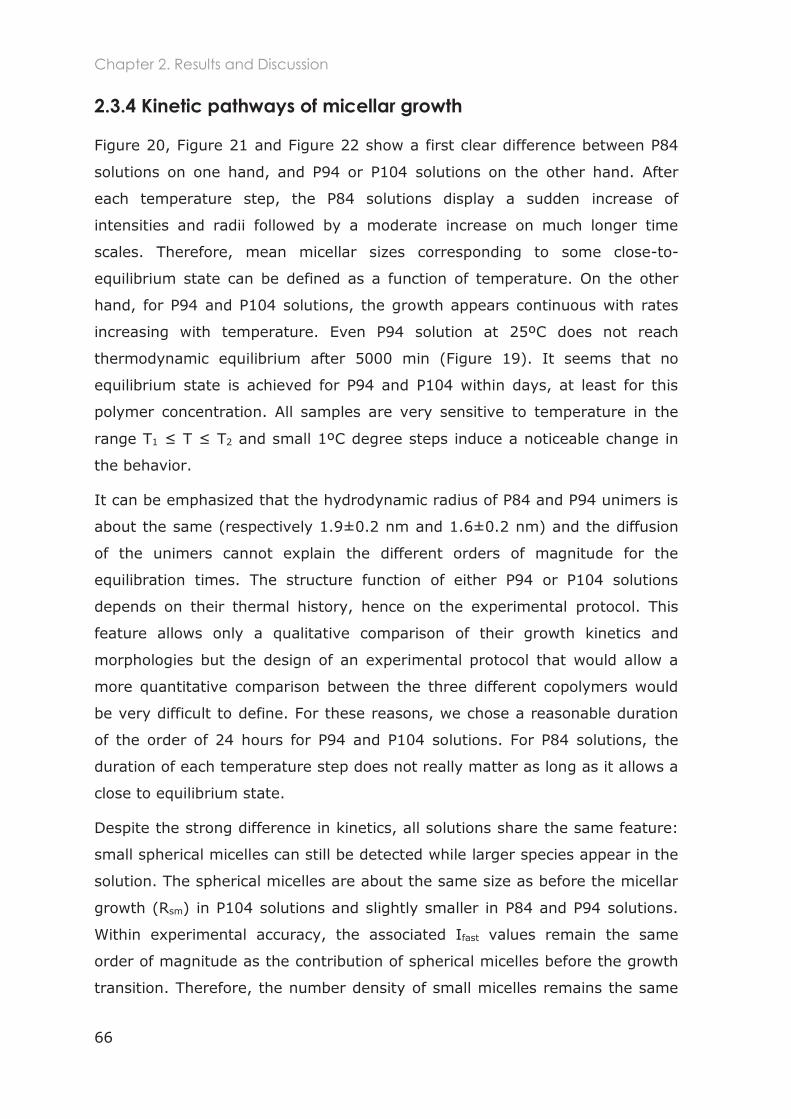
Chapter 2. Results and Discussion
66
2.3.4 Kinetic pathways of micellar growth
Figure 20, Figure 21 and Figure 22 show a first clear difference between P84
solutions on one hand, and P94 or P104 solutions on the other hand. After
each temperature step, the P84 solutions display a sudden increase of
intensities and radii followed by a moderate increase on much longer time
scales. Therefore, mean micellar sizes corresponding to some close-to-
equilibrium state can be defined as a function of temperature. On the other
hand, for P94 and P104 solutions, the growth appears continuous with rates
increasing with temperature. Even P94 solution at 25ºC does not reach
thermodynamic equilibrium after 5000 min (Figure 19). It seems that no
equilibrium state is achieved for P94 and P104 within days, at least for this
polymer concentration. All samples are very sensitive to temperature in the
range T1 T T2 and small 1ºC degree steps induce a noticeable change in
the behavior.
It can be emphasized that the hydrodynamic radius of P84 and P94 unimers is
about the same (respectively 1.9±0.2 nm and 1.6±0.2 nm) and the diffusion
of the unimers cannot explain the different orders of magnitude for the
equilibration times. The structure function of either P94 or P104 solutions
depends on their thermal history, hence on the experimental protocol. This
feature allows only a qualitative comparison of their growth kinetics and
morphologies but the design of an experimental protocol that would allow a
more quantitative comparison between the three different copolymers would
be very difficult to define. For these reasons, we chose a reasonable duration
of the order of 24 hours for P94 and P104 solutions. For P84 solutions, the
duration of each temperature step does not really matter as long as it allows a
close to equilibrium state.
Despite the strong difference in kinetics, all solutions share the same feature:
small spherical micelles can still be detected while larger species appear in the
solution. The spherical micelles are about the same size as before the micellar
growth (Rsm) in P104 solutions and slightly smaller in P84 and P94 solutions.
Within experimental accuracy, the associated Ifast values remain the same
order of magnitude as the contribution of spherical micelles before the growth
transition. Therefore, the number density of small micelles remains the same
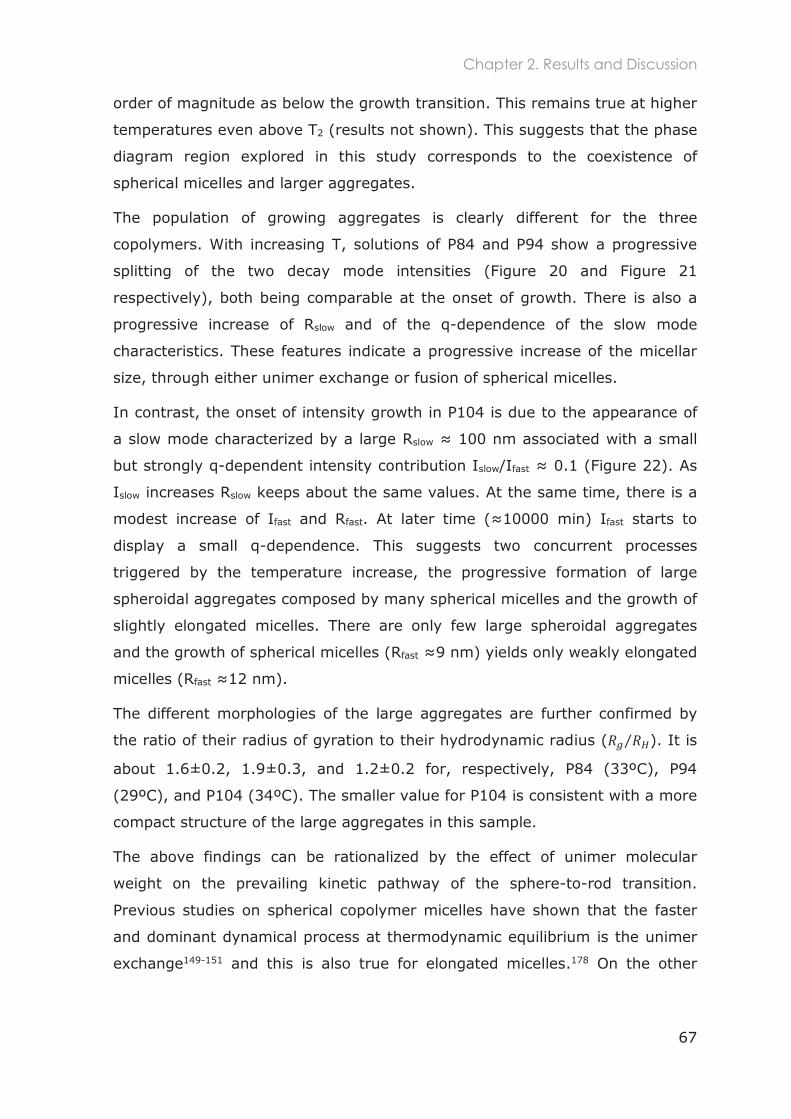
Chapter 2. Results and Discussion
67
order of magnitude as below the growth transition. This remains true at higher
temperatures even above T2 (results not shown). This suggests that the phase
diagram region explored in this study corresponds to the coexistence of
spherical micelles and larger aggregates.
The population of growing aggregates is clearly different for the three
copolymers. With increasing T, solutions of P84 and P94 show a progressive
splitting of the two decay mode intensities (Figure 20 and Figure 21
respectively), both being comparable at the onset of growth. There is also a
progressive increase of Rslow and of the q-dependence of the slow mode
characteristics. These features indicate a progressive increase of the micellar
size, through either unimer exchange or fusion of spherical micelles.
In contrast, the onset of intensity growth in P104 is due to the appearance of
a slow mode characterized by a large Rslow 100 nm associated with a small
but strongly q-dependent intensity contribution Islow/Ifast 0.1 (Figure 22). As
Islow increases Rslow keeps about the same values. At the same time, there is a
modest increase of Ifast and Rfast. At later time ( 10000 min) Ifast starts to
display a small q-dependence. This suggests two concurrent processes
triggered by the temperature increase, the progressive formation of large
spheroidal aggregates composed by many spherical micelles and the growth of
slightly elongated micelles. There are only few large spheroidal aggregates
and the growth of spherical micelles (Rfast 9 nm) yields only weakly elongated
micelles (Rfast 12 nm).
The different morphologies of the large aggregates are further confirmed by
the ratio of their radius of gyration to their hydrodynamic radius ( ). It is
about 1.6±0.2, 1.9±0.3, and 1.2±0.2 for, respectively, P84 (33ºC), P94
(29ºC), and P104 (34ºC). The smaller value for P104 is consistent with a more
compact structure of the large aggregates in this sample.
The above findings can be rationalized by the effect of unimer molecular
weight on the prevailing kinetic pathway of the sphere-to-rod transition.
Previous studies on spherical copolymer micelles have shown that the faster
and dominant dynamical process at thermodynamic equilibrium is the unimer
exchange149-151 and this is also true for elongated micelles.178 On the other
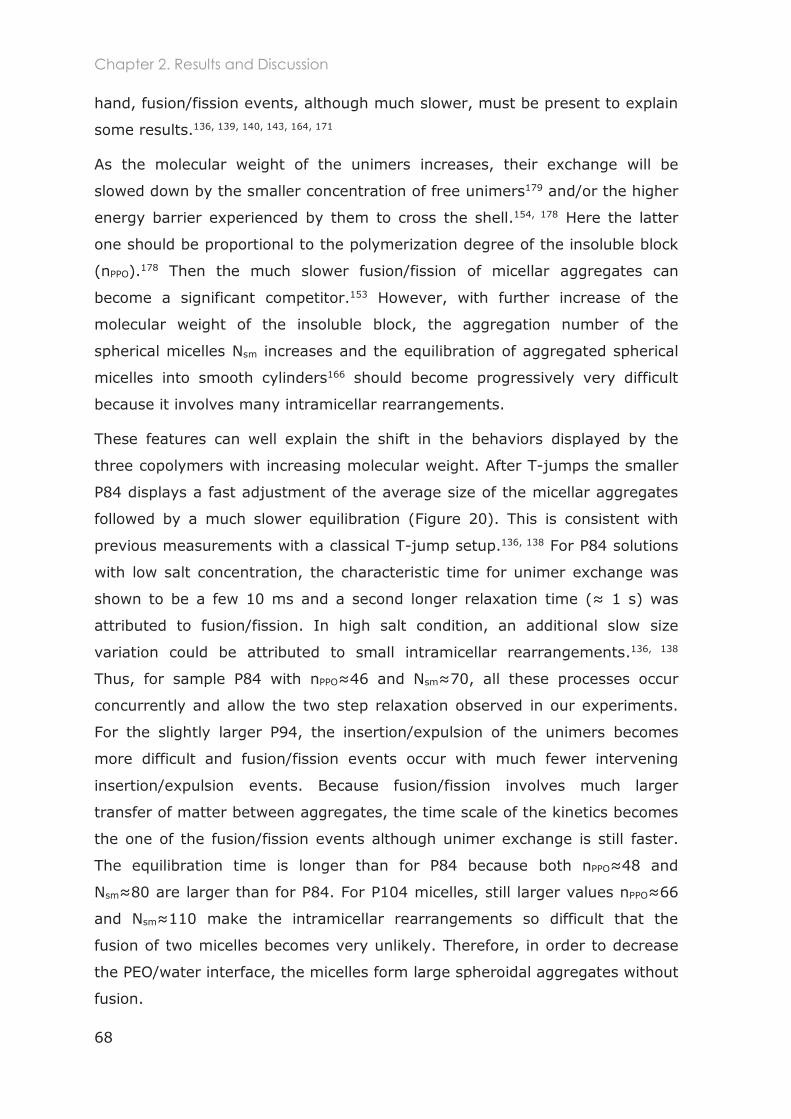
Chapter 2. Results and Discussion
68
hand, fusion/fission events, although much slower, must be present to explain
some results.136, 139, 140, 143, 164, 171
As the molecular weight of the unimers increases, their exchange will be
slowed down by the smaller concentration of free unimers179 and/or the higher
energy barrier experienced by them to cross the shell.154, 178 Here the latter
one should be proportional to the polymerization degree of the insoluble block
(nPPO).178 Then the much slower fusion/fission of micellar aggregates can
become a significant competitor.153 However, with further increase of the
molecular weight of the insoluble block, the aggregation number of the
spherical micelles Nsm increases and the equilibration of aggregated spherical
micelles into smooth cylinders166 should become progressively very difficult
because it involves many intramicellar rearrangements.
These features can well explain the shift in the behaviors displayed by the
three copolymers with increasing molecular weight. After T-jumps the smaller
P84 displays a fast adjustment of the average size of the micellar aggregates
followed by a much slower equilibration (Figure 20). This is consistent with
previous measurements with a classical T-jump setup.136, 138 For P84 solutions
with low salt concentration, the characteristic time for unimer exchange was
shown to be a few 10 ms and a second longer relaxation time ( 1 s) was
attributed to fusion/fission. In high salt condition, an additional slow size
variation could be attributed to small intramicellar rearrangements.136, 138
Thus, for sample P84 with nPPO sm all these processes occur
concurrently and allow the two step relaxation observed in our experiments.
For the slightly larger P94, the insertion/expulsion of the unimers becomes
more difficult and fusion/fission events occur with much fewer intervening
insertion/expulsion events. Because fusion/fission involves much larger
transfer of matter between aggregates, the time scale of the kinetics becomes
the one of the fusion/fission events although unimer exchange is still faster.
The equilibration time is longer than for P84 because both nPPO 48 and
Nsm 80 are larger than for P84. For P104 micelles, still larger values nPPO 66
and Nsm 110 make the intramicellar rearrangements so difficult that the
fusion of two micelles becomes very unlikely. Therefore, in order to decrease
the PEO/water interface, the micelles form large spheroidal aggregates without
fusion.
Chapter 2. Results and Discussion
69
In parallel, only a modest and very slow increase in the size of the small
spherical micelles can be obtained after a long time through slowed down
unimer exchange.
Thus, several concurrent mechanisms are at work during the equilibration of
the solutions and their relative rates determine both the kinetic pathways and
the morphologies of the micellar assemblies. Figure 23 summarizes the
evolution of the kinetic pathways as a function of increasing unimer molecular
weight. The corresponding kinetic equations should therefore consider both
unimer exchange and fusion/fission, as proposed in Ref. 140, but should further
distinguish the two steps in a fusion event: collision/aggregation and fusion
itself, as well as in a fission event: budding of micellar aggregates and
separation of aggregated buds. This complexifies considerably the model and
its resolution since, as argued here, there are only few experimental cases
where some mechanisms can be neglected, like for polymer micelles at
thermodynamic equilibrium where unimer exchange is the dominant
process.178, 180-188 The full set of coupled equations should be solved with
longer time series for a meaningful analysis of the present systems. This is out
of the scope of this thesis.
Figure 23. Schematic representation of the concurrent mechanism and resulting kinetic pathway for increasing unimer molecular weight.
Chapter 2. Results and Discussion
70
2.3.5 Stability of micellar structures after temperature decrease
The surprising stability of wormlike morphologies after a decrease of the
temperature back in the spherical micelles regime has already been reported
for Pluronic P123 in the presence of salt.109, 170 Here, the elongated micelles of
P84 return back to their spherical morphology in a time shorter than the
experimental resolution, which confirms that the fast unimer exchange plays
also a role in the equilibration kinetics of P84 after temperature decrease.
On the other hand, the elongated micelles of P94 take much longer times to
decay to their spherical shapes. After dilution of P94 samples following specific
procedures,112, 161 this stability is still present but for shorter times. Only when
the samples were diluted to a polymer concentration lower than the cmc at the
given temperature and salt concentration did the long micelles disappear very
rapidly (results not shown). These features are consistent with the much
slower fusion/fission process being the prevailing mechanism for P94.
Finally the large spheroidal aggregates of spherical micelles formed in P104
solutions appear to be very stable after temperature decrease and do not
redisperse easily at low T once formed at high T. This might be due to the
difficulty for water to repermeate the spheroids and to rehydrate the collapsed
PEO shells.
It is worth noticing that the kinetic pathways involved in the T-jump from high
to low temperature for P104 and P94 are likely to depend on the structure of
the micellar aggregates achieved during their thermal history. For P104
aggregates, the peculiar structure deduced from the analysis of their growth
introduces a new parameter, i.e. the permeation of water inside the spheroidal
aggregates. The permeability of these spheroids depends on their
compactness and thus on the PEO dehydration state achieved at a given high
temperature. One might expect that these spheroidal aggregates would be
less stable if formed at a lower temperature and/or for shorter duration. For
the wormlike aggregates formed by P94, this is not as likely since rehydration
of the PEO corona can be achieved more easily. In this case, our results are
consistent with a slow expulsion of the unimers from the core and rare fission
events hindered by the lower mobility of the unimers in the core but more
Chapter 2. Results and Discussion
71
experiments would be needed to clarify the effect of the thermal history on
their decay.
Finally P84 wormlike aggregates can decay very rapidly because a new
equilibrium can be achieved rapidly through the fast escape of individual
unimers from the core. In this case the involved cooperativity is smaller than
the one necessary to create two micellar caps in a fission event and the faster
process dominates the followed kinetic pathway.
2.3.6 Comparison with previous studies
Such a comparison is not straightforward since many experimental aspects are
different.
Growth kinetics for Pluronic micelles have been reported for copolymers
P103,112, 140, 162 P104,162 P123,143, 161, 162 or F127162 that have equal or larger
PPO nominal block length than the samples investigated here. Therefore, only
our P104 sample has been studied before. However, in all previous studies,
samples were used as received despite the fact that impurities have been
known for a long time to have an effect on the aggregation of these
copolymers. Since our P104 sample had the largest amount of smaller
molecular weight impurities that was almost completely eliminated in our
purification process (see section 2.3.1.1 of this Chapter), a direct comparison
is not possible even in this case.
Almost all previous studies were performed in the presence of added
salt112, 143, 161 and/or added alcohol,143, 162 with the exception of Ref. 140 that
was done in pure water solutions. Qualitatively, all previous results converge
to the conclusion that the growth proceeds faster for higher alcohol
content143, 162 and lower salt content,112 with the nature of salt being an
important parameter.112
Our measurements techniques differ also from those in previous studies. Here
we used a combination of static and dynamic multi-angle light scattering
measurements. While dynamic light scattering technique, mostly at a single
scattering angle, was also used previously,112, 140, 143, 161, 162 only small angle
neutron scattering intensities have been performed in Refs. 112, 161, 162 i.e. in a
scattering vector range where the growth of large objects cannot be
Chapter 2. Results and Discussion
72
measured. Only Ref. 140 has reported light scattering intensities but mostly at
a single scattering angle.
Analysis of dynamic light scattering data was previously done by
cumulants140, 143 or modified cumulants method112, 161 although partial checks
with CONTIN methods revealed in some cases140, 143, 162 two decay modes in
the intensity correlation functions. In Ref. 162, a forced bi-exponential fit was
used. This contrasts with our approach where the number of decay modes was
systematically checked for all angles and all times, thanks to extensive
software writing. As explained above, a priori assumptions on the number of
decay modes can easily yield biased results.
For the above technical reasons, no experimental evidence for systematic
coexistence between small spherical micelles and larger aggregates was
provided by any of these previous studies. Here we show that during the
growth transition of samples P84, P94, and P104, spherical micelles always
coexist with larger aggregates although they can be very difficult to detect,
especially at small scattering angles, due to the large intensity scattered by
the larger aggregates. Moreover there is a clear size gap in the size
distributions except in the very vicinity of the transition temperature.
Only one previous study140 attempted a detailed mechanistic description of the
growth with analytical kinetic models. The growth of P103 in pure water was
reported by static and dynamic light scattering measurements at a single
scattering angle. Consistently with their cumulants analysis used a priori, the
authors concluded that the growth mechanism was random fusion-
fragmentation, yielding an exponential size distribution with no gaps, clearly
inconsistent with our data. A second striking difference is the very large
scattering intensity increases measured during the growth in our systems
compared to a mere factor 5 measured for P103.140 Although part of the
difference can be assigned to intensity measurements performed at 90º
scattering angle in the latter case, this suggests that P103 aggregates might
be more similar to the ones formed by P104 than to the true elongated
micelles formed by P84 and P94.
Chapter 2. Results and Discussion
73
The previous studies have reported much faster relaxations to equilibrium
after T-jumps in the growth regime.112, 140, 143, 161, 162
Several features could explain our findings:
a. As detailed above, our copolymer samples have a different composition and
have been purified from low molecular weight impurities.
b. Our experiments are performed at high NaCl concentration with no added
alcohol, conditions that slow down the kinetics. Also our samples were not
stirred like in some previous studies.140, 143
c. Sometimes higher polymer concentrations140, 143, 161 have likely made the
leveling of intensity and AHR faster due to the transition to the entangled
regime as discussed above. This feature calls for increased caution when
characterizing the kinetic constants as a function of copolymer
concentration, as attempted in Ref. 140.
d. Also the AHR of large aggregates, either flexible or with a large size
polydispersity, cannot be measured accurately out of the Guinier regime
and the erroneous values show a misleading apparent saturation. Some
previous results might have been affected by this effect,112, 140 which starts
to show up for AHRs about 30 nm at q = 90º with our experimental setup.
To conclude this comparison, there is convincing evidence that copolymer
micelles made from P84, P94, P104, P103, P123, and even F127, can form at
high temperature larger aggregates in appropriate conditions of added salt
and/or alcohol. However the lack of homogeneity in the experimental
conditions and in the analysis methods prevents any definitive comparisons
between the exact morphologies of these aggregates. Based on our results,
we suspect however that some diversity in the kinetic pathways and in the
resulting morphologies are hidden behind the generic features, e.g. increased
viscosity, light scattered intensity or apparent hydrodynamic radius reported
so far. This diversity can only be unraveled by detailed measurements with the
methods reported here.

74
Chapter 2. Conclusions
75
2.4 Conclusions
We studied the effect of copolymer molecular weight on the kinetics of growth
and decay of Pluronic micelles after T-jumps using time-resolved multi-angle
photon correlation spectroscopy.
Our results demonstrate that increasing by a factor less than two the length of
the insoluble PPO block at fixed PEO/PPO composition has dramatic effects on
both the kinetics of equilibration and the morphologies of resulting aggregates
after a T-jump in the growth regime: while P84 can form equilibrium wormlike
micelles, the wormlike micelles formed by P94 are likely never at full
equilibrium on the time scale of our experiments. With P104, only large
spheroidal aggregates of spherical micelles and, on longer time scales, slightly
elongated micelles are obtained.
Upon cooling the solutions down to the spherical micelles regime, wormlike
micelles made from P84 return very rapidly to spherical micelles while P94
solutions stay for very long times in their high temperature state. The large
spheroidal aggregates formed in P104 solutions do not redisperse easily at low
temperature. For all copolymers, spherical micelles are still present at all
temperatures and their concentration remains of the same order of magnitude
as below the growth transition.
These results are explained by several elementary processes working
concurrently to equilibrate the population of micellar assemblies after a
T-jump, namely insertion/expulsion of unimers, aggregation/dissociation of
micellar aggregates, and fusion/budding of micellar aggregates. The rates of
these elementary processes depend markedly on the copolymer molecular
weight at a fixed polymer concentration. In the cases investigated here, none
of these processes can be safely neglected when attempting to solve the
corresponding set of coupled kinetic equations, if the resulting morphology is
to be taken into account. We suspect that this might also hold true for
previous studies where the morphology of the micellar aggregates was not
investigated thoroughly enough to distinguish a possible departure from the
assumed wormlike morphology. Extensive time-resolved multi-angle
measurements are a prerequisite for this purpose.
Chapter 2. Conclusions
76
Our results also point to some possible shortcomings in studies of micellar
growth kinetics where the crossover to the entangled semi-dilute regime
and/or out of the Guinier regime might yield an apparent saturation of the
total scattering intensity or the hydrodynamic radius. Moreover, analysis of
intensity correlation functions with a priori assumed number of decay modes is
bound to produce unreliable results.
Owing to the marked effect of modest molecular weight changes on the kinetic
pathways, consensus about the equilibration mechanisms of copolymer
micelles has been difficult to achieve on the grounds of results obtained from
copolymers with different natures, compositions, architectures and molecular
weights. This reflects the nature of a system that laks a unique kinetic
-jump protocol
that will capture all the features (mechanisms) of the growth or decay of
Pluronics or equivalent systems cannot be easily carriers out.
Based on these results, a series of trials were performed to form and stabilize
Pluronic wormlike micelles. Details on these attempts are described in
Appendix II.
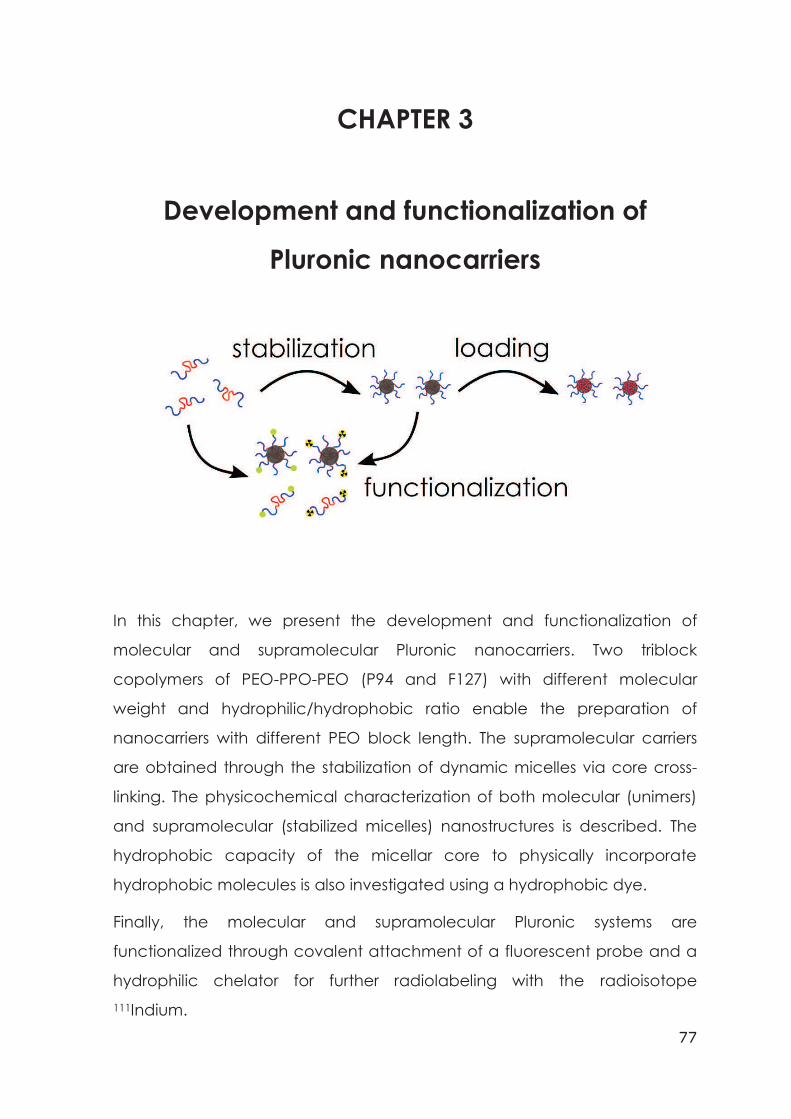
77
CHAPTER 3
Development and functionalization of
Pluronic nanocarriers
In this chapter, we present the development and functionalization of
molecular and supramolecular Pluronic nanocarriers. Two triblock
copolymers of PEO-PPO-PEO (P94 and F127) with different molecular
weight and hydrophilic/hydrophobic ratio enable the preparation of
nanocarriers with different PEO block length. The supramolecular carriers
are obtained through the stabilization of dynamic micelles via core cross-
linking. The physicochemical characterization of both molecular (unimers)
and supramolecular (stabilized micelles) nanostructures is described. The
hydrophobic capacity of the micellar core to physically incorporate
hydrophobic molecules is also investigated using a hydrophobic dye.
Finally, the molecular and supramolecular Pluronic systems are
functionalized through covalent attachment of a fluorescent probe and a
hydrophilic chelator for further radiolabeling with the radioisotope
111Indium.

78
Chapter 3. Introduction
79
3.1 Introduction
3.1.1 Molecular and supramolecular nanocarriers
We selected Pluronic triblock copolymers to create molecular and
supramolecular nanocarriers. Due to the dynamic nature of these copolymers,
they can be used as both molecular (unimers) and supramolecular (micelles)
nanocarriers within an acceptable temperature range. In terms of
nanocarriers, this will ultimately provide valuable information on the effects of
important parameters such as the aggregation state and composition, while
keeping the same triblock copolymer structure.
As molecular nanocarriers, they were chosen taking into account the selection
criteria of polymers for biomedical applications, which include controlled
stability, biocompatibility, aqueous solubility and availability to attach chemical
groups that can be used for targeting, imaging or therapy.189, 190 They are
available in a wide range of molecular weight and PEO/PPO ratio, thus
enabling comparison of different properties.
Regarding the supramolecular carriers (micelles), they are not stable against
temperature and dilution (see Chapter 1 section 1.5.3). Therefore, in this
chapter we address the stabilization of the micelles structure, crucial for the
biological evaluation performed in Chapters 4 and 5. The stabilization and
consequent freezing of the nano-sized structure is expected to prevent
unimers disassociation caused by dilution in the bloodstream after intravenous
injection. This will delay the release of the hydrophobic entrapped molecules
and improve the chances of reaching the tumor site by the EPR effect.
3.1.2 Stabilization strategies of dynamic micelles
A key point on choosing a strategy to stabilize the micelles structure is to
assure the integrity of PEO corona. In a first stage, this will provide colloidal
stability to the system. In a later stage, the shielding properties of the PEO
corona will prevent in vivo unwanted interactions such as opsonization and
uptake by the reticuloendothelial system (RES).90, 91, 191
Chapter 3. Introduction
80
The stabilization of micelles through the cross-linking of the corona involves
the chemical introduction of cross-linkable groups in the hydrophilic portions of
the copolymers. Since the cross-linking chemistry is on the shell, the
individual micelles need to be sufficiently far from each other so that cross-
linking occurs only within the same micelle. Hence, they require high dilution
conditions, which often results in very low efficiency. Moreover, the chemical
groups added to the polymer may contribute to increased toxicity, affect
micelles formation and stability, and also hinder the further functionalization
with active moieties in the corona.192-194 Therefore, the ideal stabilization
strategy should be confined to the micelles core without compromising the
structure and flexibility of the PEO corona.
Core cross-linking involves the creation of a matrix in the hydrophobic micellar
core, which can simultaneously stabilize the micelles structure and entrap a
drug. For this strategy, we can either have cross-linkable groups in the
hydrophobic blocks, or use a non-covalent interpenetrating polymer network
(IPN). Such an approach is very interesting because the integrity of the
hydrophilic shell is kept rendering micelle stability and availability of the
terminal groups for the attachment of functionalization groups like chelators or
targeting agents.192, 194
3.1.3 Stabilization of Pluronic micelles
The stabilization of micelles based on Pluronic copolymers has been addressed
by different groups in the last years. To our knowledge, Rapoport and co-
workers were the first to explore three different mechanisms to stabilize
Pluronic micelles: direct radical crosslinking of the micelle core with a
hydrophobic radical initiator (benzoyl peroxide), introduction of low
concentrations of a vegetable oil, and formation of an IPN.191 The third route
was the most successful and was based on the polymerization of a
temperature-responsive low critical solution temperature (LCST) hydrogel (N-
isopropylacrylamide, NiPAAm) inside the micelles core. The diameters of the
micelles ranged from 30 to 400 nm depending on the Pluronic P105
concentration. This formulation was named Plurogel®.191
Chapter 3. Introduction
81
Pruitt et al. in collaboration with Rapoport used the same principle to
polymerize N,N-diethylacrylamide (NNDEA) in the Pluronic P105 micelles core.
The size of the stabilized micelles depended on the Pluronic concentration and
temperature. The diameters ranged from 120 to 490 nm at 25ºC, and from
50 to 390 nm at 37ºC.195 The major problems of this cross-linking method are
related to the toxicity of the acrylamide derivatives, the toxic potential of the
other cross-linking agents and radical initiators used, the large increase in the
micellar size compared to the pure Pluronic micelles, and the limited stability
of the obtained micelles (days to weeks).93, 191, 196, 197
More recently, Petrov et al. 2005 used the same approach to create an IPN of
poly(pentaerythritol tetraacrylate) (PETA) in the micelle core.198 Stabilized
micelles of Pluronic F68 had average diameters ranging from 32 to 50 nm
depending on the concentration of Pluronic and cross-linking temperature.
Yoncheva et al. in collaboration with Petrov also stabilized Pluronic F38
micelles using the same approach to deliver the anticancer hydrophobic drug
Paclitaxel. In this study, the micelles diameters obtained were considerably
larger (180 nm).199
Other groups have focused on the chemical modification of the PEO101, 200-204 or
PPO205, 206 blocks in order to covalently cross-link the micelle structure.
However, in some of these studies, the introduction of chemical modifications
appears to influence the micellization properties of Pluronics, since the
reported sizes are much larger than the pure micelles, which is inconsistent
with the structure of a core/shell Pluronic micelle.
In this chapter, we present a non-covalent approach to cross-link the core of
Pluronic micelles by adapting the protocol developed by Petrov et al..198 Two
copolymers with different molecular weight and different PEO/PPO composition
were chosen (Pluronics F127 and P94). Pluronic F127 was selected due to its
known biocompatibility, wide use in pharmaceutical formulations and FDA
approval for intravenous use in humans. Pluronic P94 has a lower molecular
weight due to a shorter PEO block length and a much higher PPO content than
Pluronic F127. In this way, the applicability of the cross-linking process on
stabilizing Pluronic micelles with different molecular weight and PPO/PEO
composition was assessed. The efficiency of the cross-linking technique was
Chapter 3. Introduction
82
evaluated by studying the physical stability of the cross-linked micelles below
the cmT and cmc, in the presence of serum proteins, and upon freeze-drying.
The potential of the stabilized micelles to load and deliver a hydrophobic
anticancer drug was also evaluated by loading pre-stabilized micelles with a
highly hydrophobic fluorescent dye (Nile Red).
3.1.4 Functionalization of nanocarriers
A prerequisite for the evaluation of the nanocarriers performance and their
future clinical utilization is the development of strategies and methods to
conjugate chemical moieties to the nanocarriers. This will enable their
pharmaceutical and biomedical application especially for tumor detection and
therapy.
In this chapter, two general approaches were developed to enable labeling of
the nanocarriers with fluorescence and gamma-emission. The modification
strategies were applied to the molecular polymeric unimers and to the
supramolecular stabilized micelles. Both functionalities were introduced in the
terminal hydroxyl groups of the PEO blocks.
In the case of the fluorescent probe, this strategy was chosen as the
supramolecular carriers need to be modified after their stabilization due to
degradation of the fluorescent probe in the micelles stabilization process.
Moreover, the hydrophilic shell is more readily available for the post-chemical
reaction.
In the case of the modification with the chelator, this can be achieved at
different block positions such as the hydrophilic terminal block,207, 208 the block
junction209 or the hydrophobic block.210 The introduction of the chelator in the
block junction and hydrophobic block raises problems regarding the orientation
of the chelator which are critical for complexation with the radioisotopes.
Moreover, the accessibility of the radioisotopes to the chelator will be hindered
by the PEO shell. The attachment of the chelator to the hydrophilic block
avoids these problems but will most likely result in a lower stability of the
complexes formed due to higher interactions with the surrounding fluids.
Chapter 3. Experimental Section
83
3.2 Experimental section
3.2.1 Preparation of pure polymer solutions
Purification of Pluronic F127 (Mw=11700 g/mol) and P94 (Mw=5000 g/mol)
from low molecular weight impurities was performed by Dean Stark distillation
in toluene and by dialysis (described in section Chapter 2 section 2.2.1)
respectively.
For the preparation of pure polymer solutions, aqueous solution of 2.5% (w/v)
of purified Pluronic P94 or F127 (BASF) were prepared and stored for at least
48h in the fridge in order to be below the cmT for this polymer concentration.
Upon increasing the temperature, unimers self-assembled into micelles above
the critical micelle temperature (cmT), or remained as unimers below the cmT.
3.2.2 Stabilization of Pluronic micelles by core cross-linking
To prepare core cross-linked micelles, an aqueous solution of 2.5% Pluronic
P94 or F127 was mixed with a small amount of pentaerythritol tetraacrylate
(PETA, Sigma-Aldrich) below the cmT. PETA was dissolved in acetone
(50 mg/mL) before mixing with the Pluronic aqueous solution, and was added
to achieve a 6% weight ratio relative to the amount of Pluronic.
To promote the solubilisation of PETA in the micelles core, the temperature of
the solution was increased well-above the cmT (60ºC) for 1 hour. This solution
was then degassed with nitrogen for 1 hour, and PETA was polymerized
through irradiation with a full spectrum UV light for 1 hour in a closed reactor
with a cooling system under a constant nitrogen flow.
The sample was stirred at approximately 100 rpm during all the procedure.
The quartz glass cooling pipe, the UV lamp (Medium Pressure Mercury Lamp
TQ 150 W) and the power supply were acquired from UV-Consulting Peschl
(Heraeus). The reactor vessel was tailor-made by Verlabo 2000.
Chapter 3. Experimental Section
84
3.2.3 Physicochemical characterization
Samples were filtered through membrane filters with a pore size of 0.45µm
(Millex LCR hydrophilic, Millipore Co.) before the physicochemical
characterization. Moreover, samples containing cross-linked micelles were
purified from free remaining unimers by diafiltration at 5oC using Amicon®
Ultra-4 30K devices (Millipore).
Dynamic Light Scattering (DLS)
The average size of pure polymer solutions and cross-linked micelles was
determined by DLS as described in Chapter 2 section 2.2.3.
Zeta potential
The superficial charge of the stabilized micelles was measured through the
zeta potential (mV) determination (Zetasizer Nano ZS, Malvern Instruments,
UK).
Fourier Transformed Infrared Spectroscopy (FT-IR)
Raw polymers, functionalized unimers with primary amines and cross-linked
micelles were freeze-dried and analyzed by FT-IR (Vertex 70, Bruker).
Cryo-Transmission Electron microscopy (Cryo-TEM)
Samples of stabilized P94 or F127 Pluronic micelles were vitrified before
observation. The vitrification of the samples was prepared in our home-made
vitrification system. The chamber was held at 22 °C and at a relative humidity
of 80%. A 5 µl drop of the sample was deposited onto a lacey carbon film
covered grid (Ted Pella) rendered hydrophilic using a ELMO glow discharge
unit (Cordouan Technologies). The grid was automatically blotted to form a
thin film which is plunged in liquid ethane hold at -190°C by liquid nitrogen. In
that way, a vitrified film is obtained in which the native structure of the
assemblies is preserved. The grid was mounted onto a cryo holder
(Gatan 626) and observed under low dose conditions in a Tecnai G2
microscope (FEI) at 200 kV. Images were acquired using a Eagle slow scan
CCD camera (FEI). Average core diameters were determined from the images
using ImageJ software.
Chapter 3. Experimental Section
85
Scanning Electron microscopy (SEM)
Pluronic unimers and purified cross-linked Pluronic micelles were also
visualized by SEM. The samples were diluted in water to a final concentration
of 0.25% and a droplet of each solution was placed on 5x5 mm silicon chips
previously washed with ethanol and treated with plasma, and the solution was
vacuum dried. Then, the silicon chips were imaged using a SU8000 UHR
Cold-Emission FE-SEM Scanning Electron Microscope (Hitachi, Japan). The
samples were imaged at 1kV acceleration voltage and without the addition of a
conductive coating.
Atomic force microscopy (AFM)
The morphology and homogeneity of cross-linked Pluronic micelles were
analyzed by AFM using a NTMDT Ntegra AFM in tapping mode. The samples
were diluted in water to final concentrations of 0.05% (SPM-F127) and 0.25%
(SPM-P94) and a droplet of each solution was placed on silicon chips
previously washed with ethanol and treated with plasma. To obtain thin films
of micelles, the chips with the sample droplet were placed in a IBIS spin coater
at 3000 rpm for 1 minute.
3.2.4 Stability of Pluronic cross-linked micelles
The stability of cross-linked micelles was evaluated below and above the cmT,
below the cmc, in the presence of serum proteins, and upon freeze-drying.
The size distribution at different temperatures near the cmT (15, 25 and 37ºC)
was analyzed by DLS.
The stability below the cmc was analyzed by DLS after dilution in water and
compared with the pure polymer solutions.
For the evaluation of the serum proteins effect, a small amount of micelle
solution was diluted in freshly prepared cell culture medium (DMEM)
supplemented with 10% NCS to a final polymer concentration of 0.5% (w/v).
The obtained solution was incubated at 37ºC for approximately 72 hours. The
hydrodynamic size distribution was analyzed by DLS continuously during the
incubation period. Contributions from the medium components and from the
Chapter 3. Experimental Section
86
stabilized micelles were distinguished by the use of CONTIN analysis and of
the methods described in in Chapter 2 section 2.2.3.
Finally, the stability of cross-linked micelles was analyzed after freeze-drying
solutions containing 2.5% SPM-P94 or SPM-F127 in a FreeZone 4.5L
lyophilizer. From the obtained powder, solutions of 0.5% were prepared from
both cross-linked micelles in water, acetone, tetrahydrofuran and chloroform,
and the hydrodynamic size distribution was recorded by DLS.
3.2.5 Loading of cross-linked micelles with hydrophobic dye
Pre-stabilized micelles were loaded with a lipophilic dye (Nile Red) through
non-covalent interactions. A concentrated stock solution of Nile Red in ethanol
was prepared (1mg/mL) and a small amount of this solution was added to the
aqueous solutions containing 2.5% (w/v) of stabilized Pluronic micelles. The
concentration of fluorescent probe in relation to the concentration of Pluronic
was 0.25% (w/w). The obtained mixture was stirred at 300 rpm at room
temperature for 24 hours.
After the loading period, the fluorescently stabilized micelles were separated
from the non-incorporated Nile red: the solution was firstly filtered (0.45µm,
Millex LCR hydrophilic, Millipore Co.) to remove the precipitated Nile Red, and
secondly purified by size exclusion chromatography (SEC) using prepacked
PD10 columns (GE Healthcare). To determine the eluted fractions containing
the loaded micelles, volumes of 500µl from the chromatographic column were
collected and the scattered intensity of each fraction was analyzed by DLS. A
solution containing free Nile Red was also eluted.
3.2.6 Functionalization of Pluronic unimers with p-SCN-Bn-DTPA
and FITC
The purified copolymers were modified with 1,1-carbodiimidazole
(CDI-Pluronic) followed by primary amines (F127-NH2 and P94-NH2) using a
procedure similar to the one reported by Lu et al. for Pluronic F68.211 For the
CDI activation, the purified Pluronic (P94 or F127) was dissolved in dry THF
(8 mM) and added dropwise during one hour in a 1:10 molar ratio to a
solution of CDI in dry THF (0.08 mM) at room temperature under argon
Chapter 3. Experimental Section
87
atmosphere. The reaction mixture was stirred overnight. The solution was
concentrated to 2 mL under vacuum and added to 30 mL of diethyl ether. The
precipitate was isolated via filtration and redissolved in THF, followed by
precipitation in an excess amount of diethyl ether. This process was repeated
three times to remove unreacted CDI. The CDI-activated Pluronics
(Pluronic-CDI) were obtained as white powders after drying under vacuum at
room temperature.
For the amine modification, the Pluronic-CDI was dissolved in dry THF (4 mM),
and added dropwise to ethylenediamine (1:394 ratio) at room temperature
during one hour. The mixture was left to react overnight. The unreacted
ethylenediamine was removed by vacuum distillation and the residue was
dissolved in water and dialyzed against water using a membrane with a 1 kDa
molecular weight cut-off to yield the amine-terminated triblock copolymers
(Pluronic-NH2) as white powders after freeze-drying.
The purification of Pluronic F127 and amine modification of the copolymers
were performed by the project partners in the University of Ghent (Polymer
Chemistry and Biomaterials Group).
The reactive isothiocyanate groups in the chelator p-SCN-Bn-DTPA (S-2-4-
isothiocyanatobenzyl-diethylenetriamine pentaacetic acid, Macrocyclics) and in
the fluorescent FITC (Fluorescein Isothiocyanate, Life Technologies) were then
conjugated to the amine terminated copolymers (F127-NH2 or P94-NH2) as
previously reported for the diblock PEG-PCL.212 The p-SCN-Bn-DTPA or FITC
were dissolved in DMSO (50 mg/mL) and added in a 1:1 molar ratio to a
25 mg/mL solution of F127-NH2 or P94-NH2 in sodium bicarbonate buffer
(0.1 M, pH 8.5) or MilliQ respectively. The solutions were stirred at room
temperature for at least 4 hours. Purification from unreacted p-SCN-Bn-DTPA
and FITC was performed by SEC using prepacked PD10 columns and MilliQ
water as the eluent. After purification, aqueous solutions containing Pluronic
unimers modified with the chelator p-SCN-Bn-DTPA (F127-DTPA and
P94-DTPA) and FITC (F127-FITC and P94-FITC) were obtained.
Characterization of the raw and amine modified copolymers was performed by
FT-IR as described in section 3.2.3.
Chapter 3. Experimental Section
88
3.2.7 Conjugation efficiency of p-SCN-Bn-DTPA to Pluronic
unimers
The conjugation efficiency of p-SCN-Bn-DTPA to the amine-terminated
polymers was determined by thin layer chromatography (TLC) before
purification by SEC. The nanocarriers F127-DTPA and P94-DTPA diluted in PBS
were labelled with 1 MBq of 111InCl3 and incubated for 30 min at room
temperature. The radioactive isotope 111InCl3 (111In-chloride) was provided by
IDB Holland.
TLC was done using a stationary phase of aluminum sheets of silica gel 60 and
a mobile phase of sodium acetate buffer (0.1 M, pH 5.8). A spot (5 µL) with
the radiolabeled samples was placed in the bottom of a TLC strip (1×10 cm)
and developed in the buffer. After elution, the TLC strips were imaged with a
Storage Phosphor system (Cyclone, Packard), which enabled an appropriate
sectioning of the TLC strip for the quantitative analysis through gamma-
scintillation counting (2480 Wizard2 Automatic Gamma Counter, Perkin Elmer).
3.2.8 Preparation of functionalized cross-linked micelles
Stabilized polymeric micelles containing the chelator p-SCN-Bn-DTPA in the
corona were prepared from a mixture of DTPA functionalized copolymers
(P94-DTPA or F127-DTPA) with regular copolymers (P94 or F127), using 10%
of F127-DTPA and 3.65% of P94-DTPA to a final copolymers concentration of
2.5% w/w. Then, the Pluronic micelles were cross-linked as previously
described in section 3.2.2).
Functionalization of the stabilized micelles with FITC was performed after
micelles stabilization. Aqueous solutions with 10% of F127-NH2 and 3.65% of
P94-NH2 were prepared, and self-assembled micelles with amine groups in the
corona were cross-linked as described above (see section 3.2.2). After cross-
linking, a solution of FITC in DMSO (10 mg/mL) was added to the cross-linked
micelles at room temperature for reaction with the primary amine in the
micelles surface. Purification from free p-SCN-Bn-DTPA or FITC was performed
by SEC using prepacked PD10 columns and MilliQ water as the eluent.
Chapter 3. Experimental Section
89
3.2.9 Radiolabeling of Pluronic nanocarriers with 111In and
purification
We assessed the speed of complexation of DTPA-111In in PBS at room
temperature. Analysis was performed by TLC using the mobile phase of
sodium acetate buffer (0.1 M, pH 5.8). Then, radiolabeling of the Pluronic
nanocarriers was performed by diluting the carriers in PBS buffer (pH 7.4) and
adding an appropriate activity of 111InCl3 according to their further application,
and incubation at room temperature for 30 minutes.
Labelling efficiency was verified using SEC columns (1cmx50 cm) filled with
Sephadex G25 (1x30 cm). Radiochemical purity was evaluated by TLC using a
mixture of EDTA and NH4Ac (1:1) (v:v) (0.1 M, pH 5.5) as the eluent. Samples
that presented a labeling efficiency of more than 95 percent (F127-DTPA and
P94-DTPA) were used without further purification, while samples with a
coupling efficiency less than 95 percent (SPM-F127-DTPA and SPM-P94-DTPA)
were further purified.
Purification was achieved by adding free DTPA and subsequent purification
over a prepacked PD10 column using PBS 1X as the eluent. Elution profiles of
free 111In and DTPA-111In were performed with both columns to optimize the
purification procedure.
3.2.10 Radiostability in mouse serum and PBS
Radiostability of F127-DTPA-111In, P94-DTPA-111In, SPM-F127-DTPA-111In and
SPM-P94-DTPA-111In was measured in vitro by incubation of 50µL of
radiolabeled samples with 350µL of PBS or mouse serum at 37oC for 72 h. At
of TLC strips and developed in the EDTA:NH4Ac (1:1) (v:v) (0.1 M, pH 5.5)
eluent to evaluate the dissociation of 111In from the samples. In this system, it
is possible to assess transchelation to serum proteins as the Retention factor
(Rf) [Pluronic-DTPA-111In]=0.0, Rf [Proteins-111In]=0.5 and Rf [free 111In]=1.0.
Free 111In and p-SCN-Bn-DTPA-111In were used as controls.

90
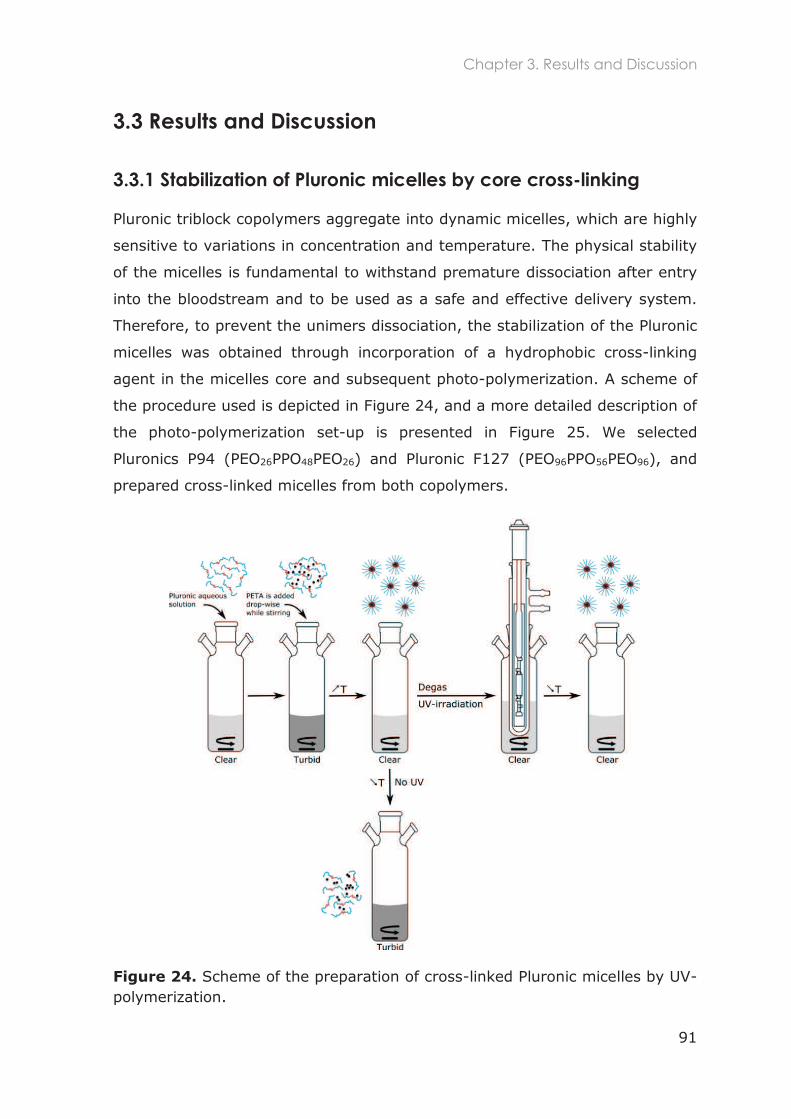
Chapter 3. Results and Discussion
91
3.3 Results and Discussion
3.3.1 Stabilization of Pluronic micelles by core cross-linking
Pluronic triblock copolymers aggregate into dynamic micelles, which are highly
sensitive to variations in concentration and temperature. The physical stability
of the micelles is fundamental to withstand premature dissociation after entry
into the bloodstream and to be used as a safe and effective delivery system.
Therefore, to prevent the unimers dissociation, the stabilization of the Pluronic
micelles was obtained through incorporation of a hydrophobic cross-linking
agent in the micelles core and subsequent photo-polymerization. A scheme of
the procedure used is depicted in Figure 24, and a more detailed description of
the photo-polymerization set-up is presented in Figure 25. We selected
Pluronics P94 (PEO26PPO48PEO26) and Pluronic F127 (PEO96PPO56PEO96), and
prepared cross-linked micelles from both copolymers.
Figure 24. Scheme of the preparation of cross-linked Pluronic micelles by UV-polymerization.
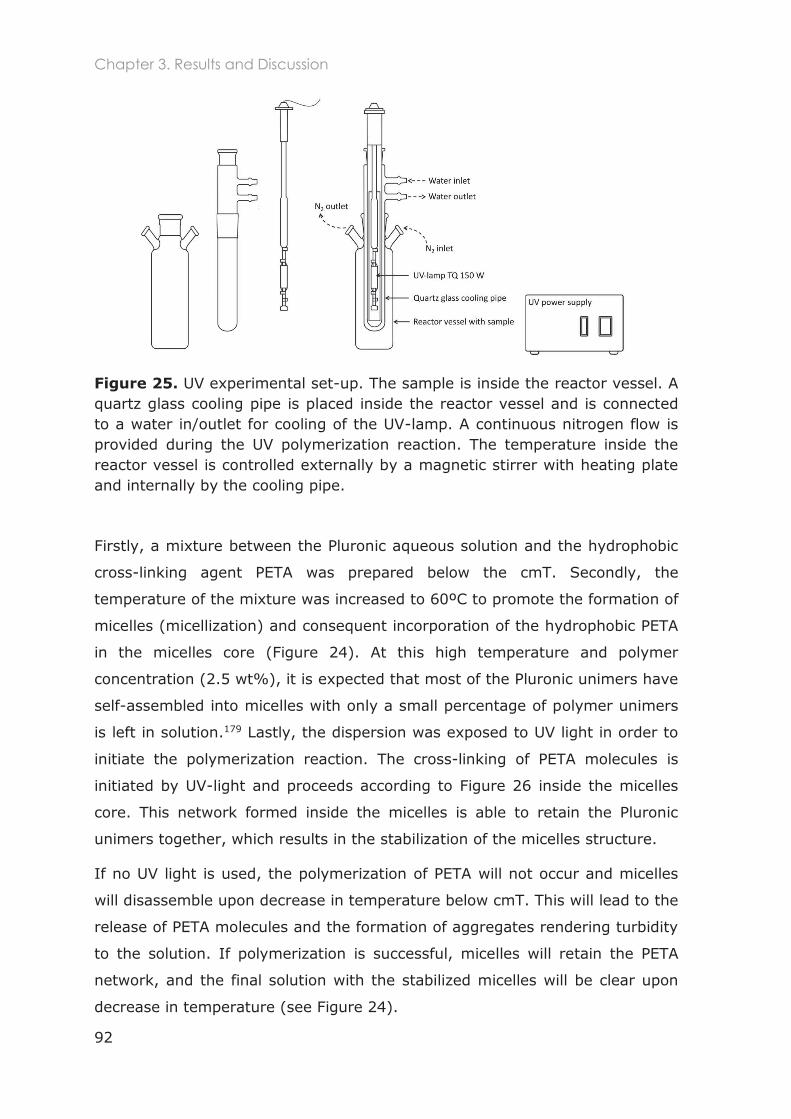
Chapter 3. Results and Discussion
92
Figure 25. UV experimental set-up. The sample is inside the reactor vessel. A quartz glass cooling pipe is placed inside the reactor vessel and is connected to a water in/outlet for cooling of the UV-lamp. A continuous nitrogen flow is provided during the UV polymerization reaction. The temperature inside the reactor vessel is controlled externally by a magnetic stirrer with heating plate and internally by the cooling pipe.
Firstly, a mixture between the Pluronic aqueous solution and the hydrophobic
cross-linking agent PETA was prepared below the cmT. Secondly, the
temperature of the mixture was increased to 60ºC to promote the formation of
micelles (micellization) and consequent incorporation of the hydrophobic PETA
in the micelles core (Figure 24). At this high temperature and polymer
concentration (2.5 wt%), it is expected that most of the Pluronic unimers have
self-assembled into micelles with only a small percentage of polymer unimers
is left in solution.179 Lastly, the dispersion was exposed to UV light in order to
initiate the polymerization reaction. The cross-linking of PETA molecules is
initiated by UV-light and proceeds according to Figure 26 inside the micelles
core. This network formed inside the micelles is able to retain the Pluronic
unimers together, which results in the stabilization of the micelles structure.
If no UV light is used, the polymerization of PETA will not occur and micelles
will disassemble upon decrease in temperature below cmT. This will lead to the
release of PETA molecules and the formation of aggregates rendering turbidity
to the solution. If polymerization is successful, micelles will retain the PETA
network, and the final solution with the stabilized micelles will be clear upon
decrease in temperature (see Figure 24).
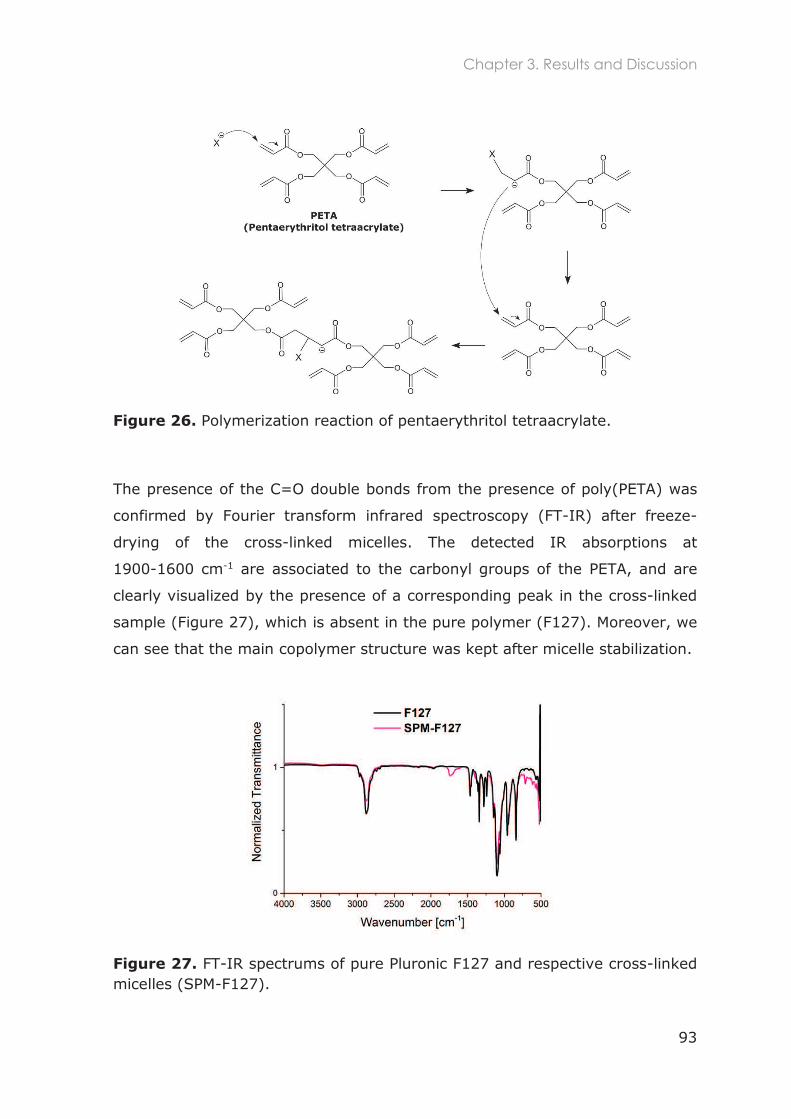
Chapter 3. Results and Discussion
93
Figure 26. Polymerization reaction of pentaerythritol tetraacrylate.
The presence of the C=O double bonds from the presence of poly(PETA) was
confirmed by Fourier transform infrared spectroscopy (FT-IR) after freeze-
drying of the cross-linked micelles. The detected IR absorptions at
1900-1600 cm-1 are associated to the carbonyl groups of the PETA, and are
clearly visualized by the presence of a corresponding peak in the cross-linked
sample (Figure 27), which is absent in the pure polymer (F127). Moreover, we
can see that the main copolymer structure was kept after micelle stabilization.
Figure 27. FT-IR spectrums of pure Pluronic F127 and respective cross-linked micelles (SPM-F127).
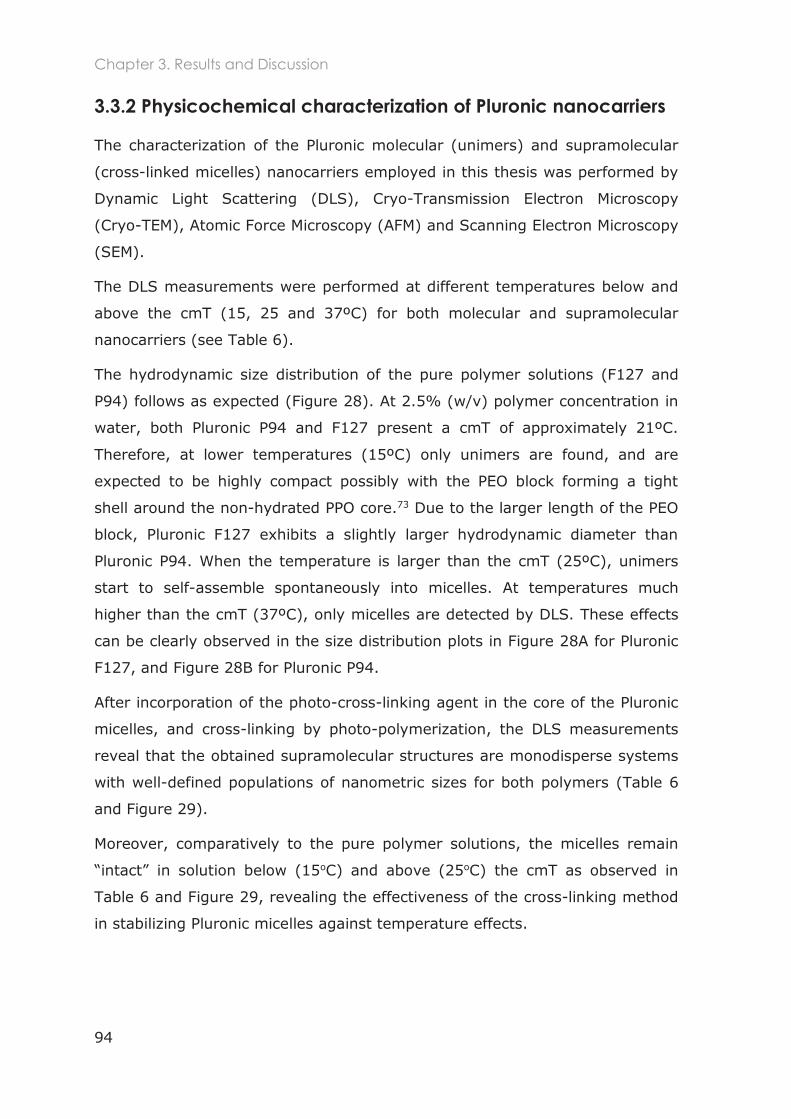
Chapter 3. Results and Discussion
94
3.3.2 Physicochemical characterization of Pluronic nanocarriers
The characterization of the Pluronic molecular (unimers) and supramolecular
(cross-linked micelles) nanocarriers employed in this thesis was performed by
Dynamic Light Scattering (DLS), Cryo-Transmission Electron Microscopy
(Cryo-TEM), Atomic Force Microscopy (AFM) and Scanning Electron Microscopy
(SEM).
The DLS measurements were performed at different temperatures below and
above the cmT (15, 25 and 37ºC) for both molecular and supramolecular
nanocarriers (see Table 6).
The hydrodynamic size distribution of the pure polymer solutions (F127 and
P94) follows as expected (Figure 28). At 2.5% (w/v) polymer concentration in
water, both Pluronic P94 and F127 present a cmT of approximately 21ºC.
Therefore, at lower temperatures (15ºC) only unimers are found, and are
expected to be highly compact possibly with the PEO block forming a tight
shell around the non-hydrated PPO core.73 Due to the larger length of the PEO
block, Pluronic F127 exhibits a slightly larger hydrodynamic diameter than
Pluronic P94. When the temperature is larger than the cmT (25ºC), unimers
start to self-assemble spontaneously into micelles. At temperatures much
higher than the cmT (37ºC), only micelles are detected by DLS. These effects
can be clearly observed in the size distribution plots in Figure 28A for Pluronic
F127, and Figure 28B for Pluronic P94.
After incorporation of the photo-cross-linking agent in the core of the Pluronic
micelles, and cross-linking by photo-polymerization, the DLS measurements
reveal that the obtained supramolecular structures are monodisperse systems
with well-defined populations of nanometric sizes for both polymers (Table 6
and Figure 29).
Moreover, comparatively to the pure polymer solutions, the micelles remain oC) and above (25oC) the cmT as observed in
Table 6 and Figure 29, revealing the effectiveness of the cross-linking method
in stabilizing Pluronic micelles against temperature effects.
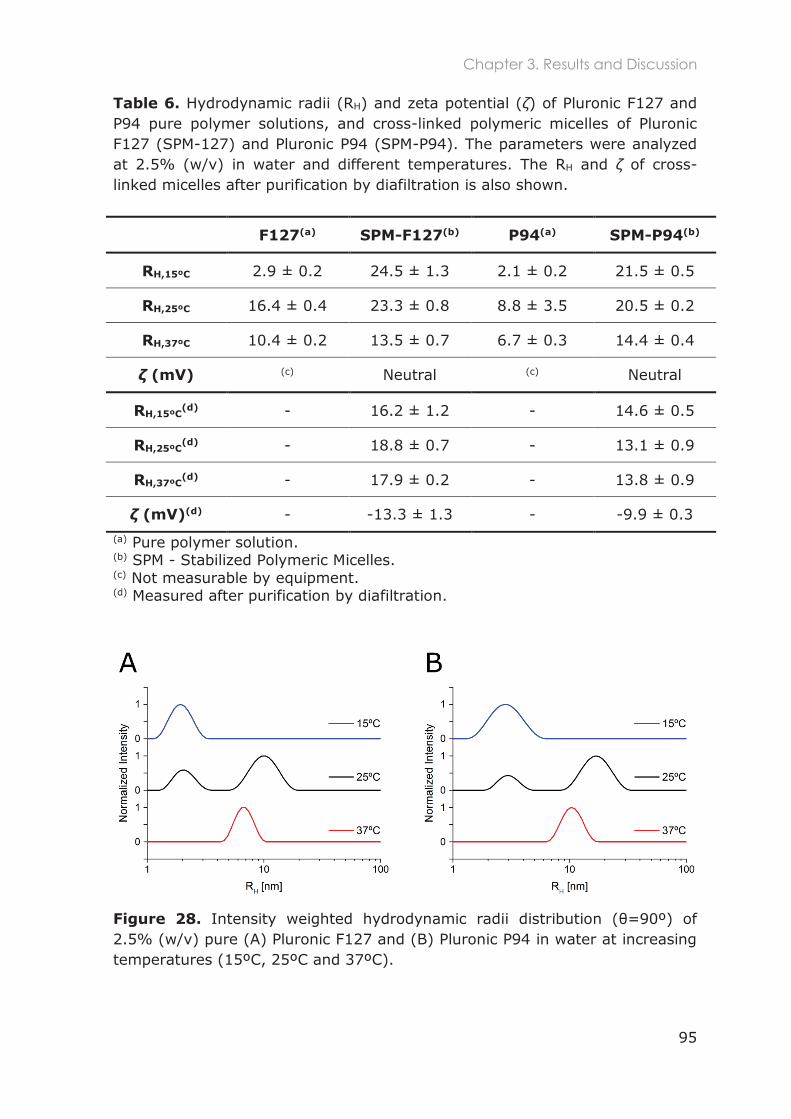
Chapter 3. Results and Discussion
95
Table 6. Hydrodynamic radii (RH) and zeta potential ( ) of Pluronic F127 and P94 pure polymer solutions, and cross-linked polymeric micelles of Pluronic F127 (SPM-127) and Pluronic P94 (SPM-P94). The parameters were analyzed at 2.5% (w/v) in water and different temperatures. The RH and of cross-linked micelles after purification by diafiltration is also shown.
Figure 28.
2.5% (w/v) pure (A) Pluronic F127 and (B) Pluronic P94 in water at increasing temperatures (15ºC, 25ºC and 37ºC).
F127(a) SPM-F127(b) P94(a) SPM-P94(b)
RH,15ºC 2.9 ± 0.2 24.5 ± 1.3 2.1 ± 0.2 21.5 ± 0.5
RH,25ºC 16.4 ± 0.4 23.3 ± 0.8 8.8 ± 3.5 20.5 ± 0.2
RH,37ºC 10.4 ± 0.2 13.5 ± 0.7 6.7 ± 0.3 14.4 ± 0.4
(mV) (c) Neutral (c) Neutral
RH,15ºC(d) - 16.2 ± 1.2 - 14.6 ± 0.5
RH,25ºC(d) - 18.8 ± 0.7 - 13.1 ± 0.9
RH,37ºC(d) - 17.9 ± 0.2 - 13.8 ± 0.9
(mV)(d) - -13.3 ± 1.3 - -9.9 ± 0.3
(a) Pure polymer solution. (b) SPM - Stabilized Polymeric Micelles. (c) Not measurable by equipment. (d) Measured after purification by diafiltration.
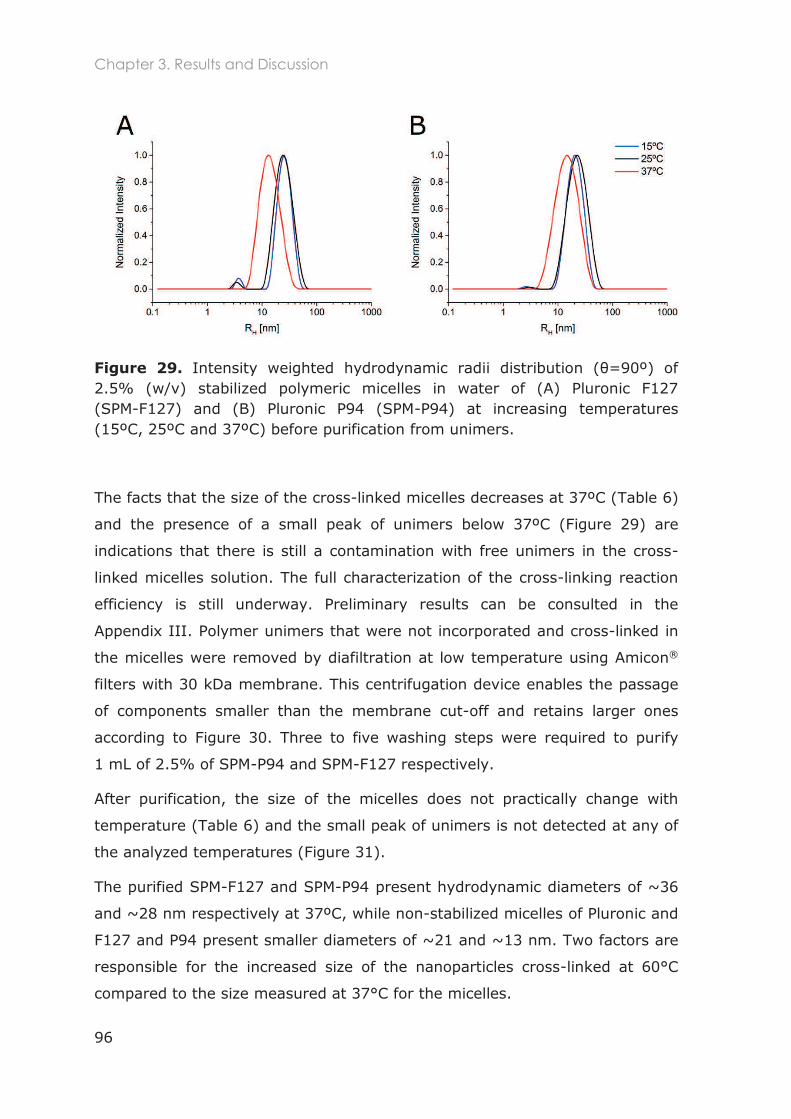
Chapter 3. Results and Discussion
96
Figure 29.
2.5% (w/v) stabilized polymeric micelles in water of (A) Pluronic F127 (SPM-F127) and (B) Pluronic P94 (SPM-P94) at increasing temperatures (15ºC, 25ºC and 37ºC) before purification from unimers.
The facts that the size of the cross-linked micelles decreases at 37ºC (Table 6)
and the presence of a small peak of unimers below 37ºC (Figure 29) are
indications that there is still a contamination with free unimers in the cross-
linked micelles solution. The full characterization of the cross-linking reaction
efficiency is still underway. Preliminary results can be consulted in the
Appendix III. Polymer unimers that were not incorporated and cross-linked in
the micelles were removed by diafiltration at low temperature using Amicon®
filters with 30 kDa membrane. This centrifugation device enables the passage
of components smaller than the membrane cut-off and retains larger ones
according to Figure 30. Three to five washing steps were required to purify
1 mL of 2.5% of SPM-P94 and SPM-F127 respectively.
After purification, the size of the micelles does not practically change with
temperature (Table 6) and the small peak of unimers is not detected at any of
the analyzed temperatures (Figure 31).
The purified SPM-F127 and SPM-P94 present hydrodynamic diameters of ~36
and ~28 nm respectively at 37ºC, while non-stabilized micelles of Pluronic and
F127 and P94 present smaller diameters of ~21 and ~13 nm. Two factors are
responsible for the increased size of the nanoparticles cross-linked at 60°C
compared to the size measured at 37°C for the micelles.
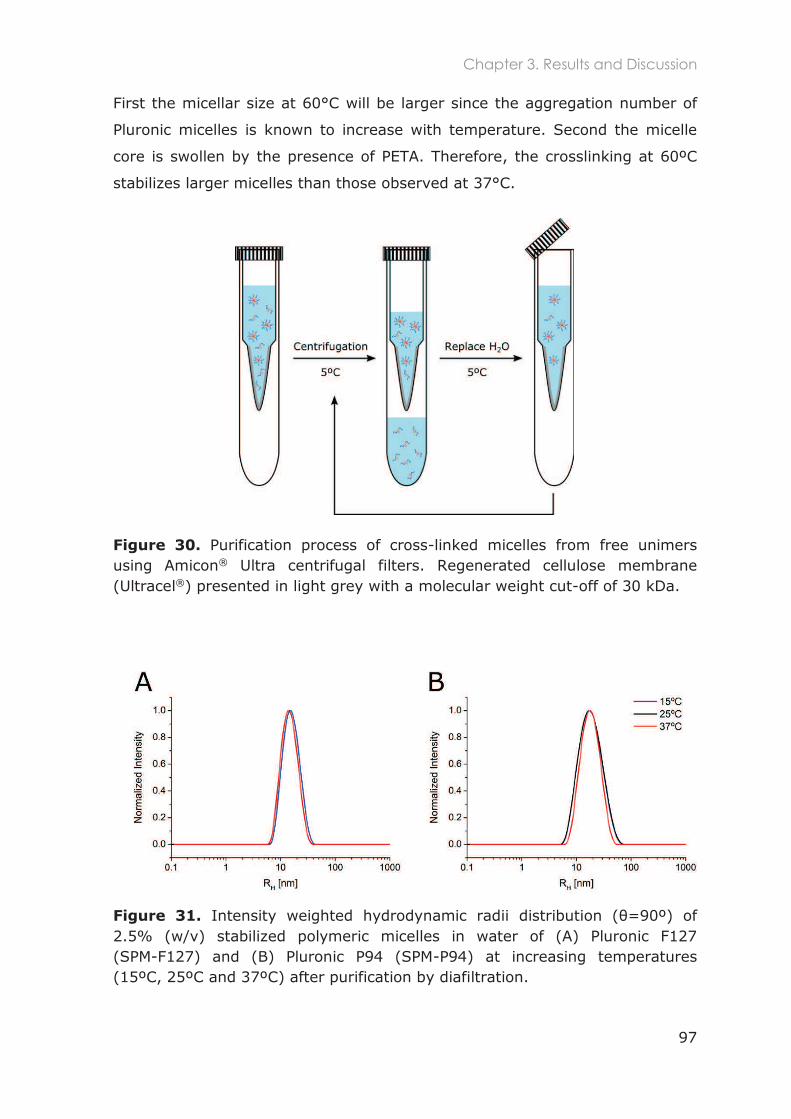
Chapter 3. Results and Discussion
97
First the micellar size at 60°C will be larger since the aggregation number of
Pluronic micelles is known to increase with temperature. Second the micelle
core is swollen by the presence of PETA. Therefore, the crosslinking at 60ºC
stabilizes larger micelles than those observed at 37°C.
Figure 30. Purification process of cross-linked micelles from free unimers using Amicon® Ultra centrifugal filters. Regenerated cellulose membrane (Ultracel®) presented in light grey with a molecular weight cut-off of 30 kDa.
Figure 31. 2.5% (w/v) stabilized polymeric micelles in water of (A) Pluronic F127 (SPM-F127) and (B) Pluronic P94 (SPM-P94) at increasing temperatures (15ºC, 25ºC and 37ºC) after purification by diafiltration.
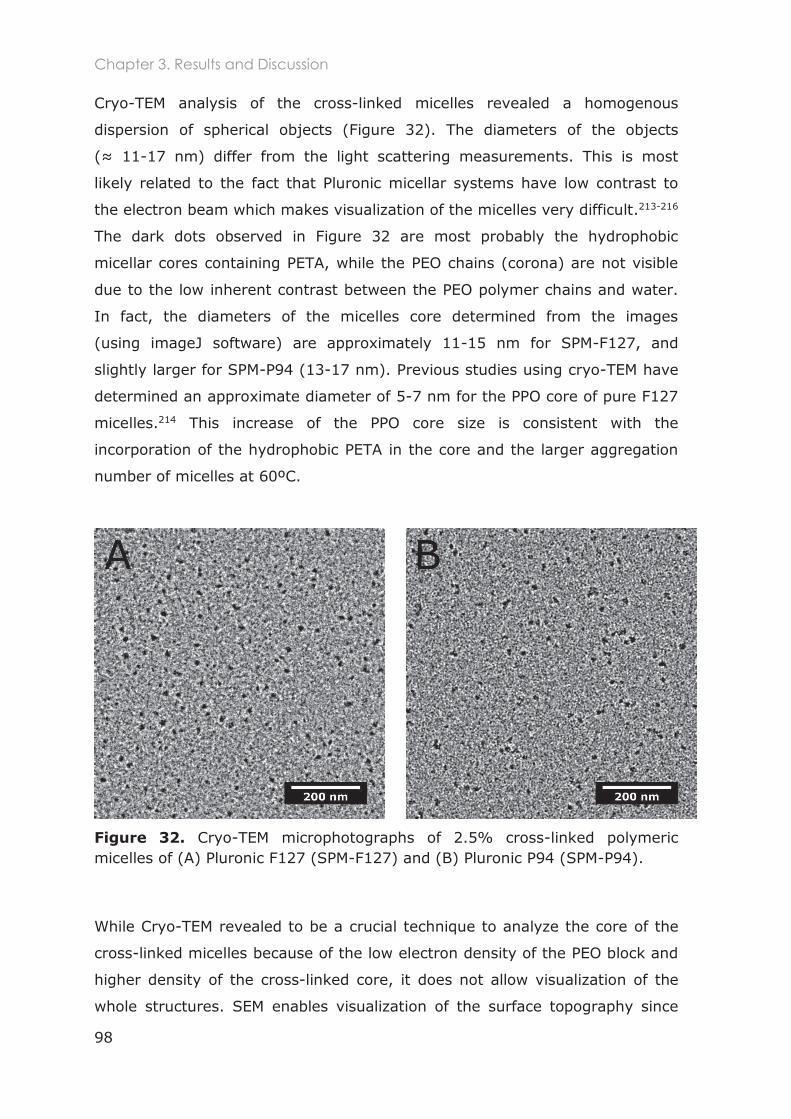
Chapter 3. Results and Discussion
98
Cryo-TEM analysis of the cross-linked micelles revealed a homogenous
dispersion of spherical objects (Figure 32). The diameters of the objects
-17 nm) differ from the light scattering measurements. This is most
likely related to the fact that Pluronic micellar systems have low contrast to
the electron beam which makes visualization of the micelles very difficult.213-216
The dark dots observed in Figure 32 are most probably the hydrophobic
micellar cores containing PETA, while the PEO chains (corona) are not visible
due to the low inherent contrast between the PEO polymer chains and water.
In fact, the diameters of the micelles core determined from the images
(using imageJ software) are approximately 11-15 nm for SPM-F127, and
slightly larger for SPM-P94 (13-17 nm). Previous studies using cryo-TEM have
determined an approximate diameter of 5-7 nm for the PPO core of pure F127
micelles.214 This increase of the PPO core size is consistent with the
incorporation of the hydrophobic PETA in the core and the larger aggregation
number of micelles at 60ºC.
Figure 32. Cryo-TEM microphotographs of 2.5% cross-linked polymeric micelles of (A) Pluronic F127 (SPM-F127) and (B) Pluronic P94 (SPM-P94).
While Cryo-TEM revealed to be a crucial technique to analyze the core of the
cross-linked micelles because of the low electron density of the PEO block and
higher density of the cross-linked core, it does not allow visualization of the
whole structures. SEM enables visualization of the surface topography since
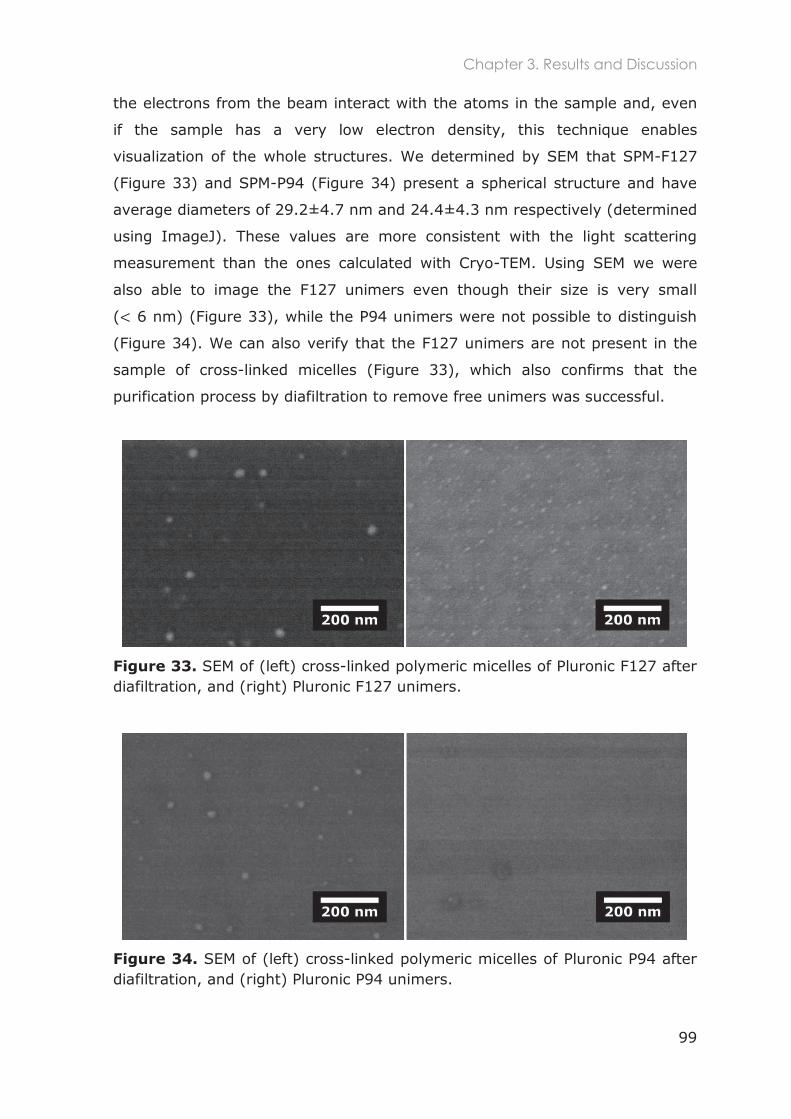
Chapter 3. Results and Discussion
99
the electrons from the beam interact with the atoms in the sample and, even
if the sample has a very low electron density, this technique enables
visualization of the whole structures. We determined by SEM that SPM-F127
(Figure 33) and SPM-P94 (Figure 34) present a spherical structure and have
average diameters of 29.2±4.7 nm and 24.4±4.3 nm respectively (determined
using ImageJ). These values are more consistent with the light scattering
measurement than the ones calculated with Cryo-TEM. Using SEM we were
also able to image the F127 unimers even though their size is very small
( 6 nm) (Figure 33), while the P94 unimers were not possible to distinguish
(Figure 34). We can also verify that the F127 unimers are not present in the
sample of cross-linked micelles (Figure 33), which also confirms that the
purification process by diafiltration to remove free unimers was successful.
Figure 33. SEM of (left) cross-linked polymeric micelles of Pluronic F127 after diafiltration, and (right) Pluronic F127 unimers.
Figure 34. SEM of (left) cross-linked polymeric micelles of Pluronic P94 after diafiltration, and (right) Pluronic P94 unimers.
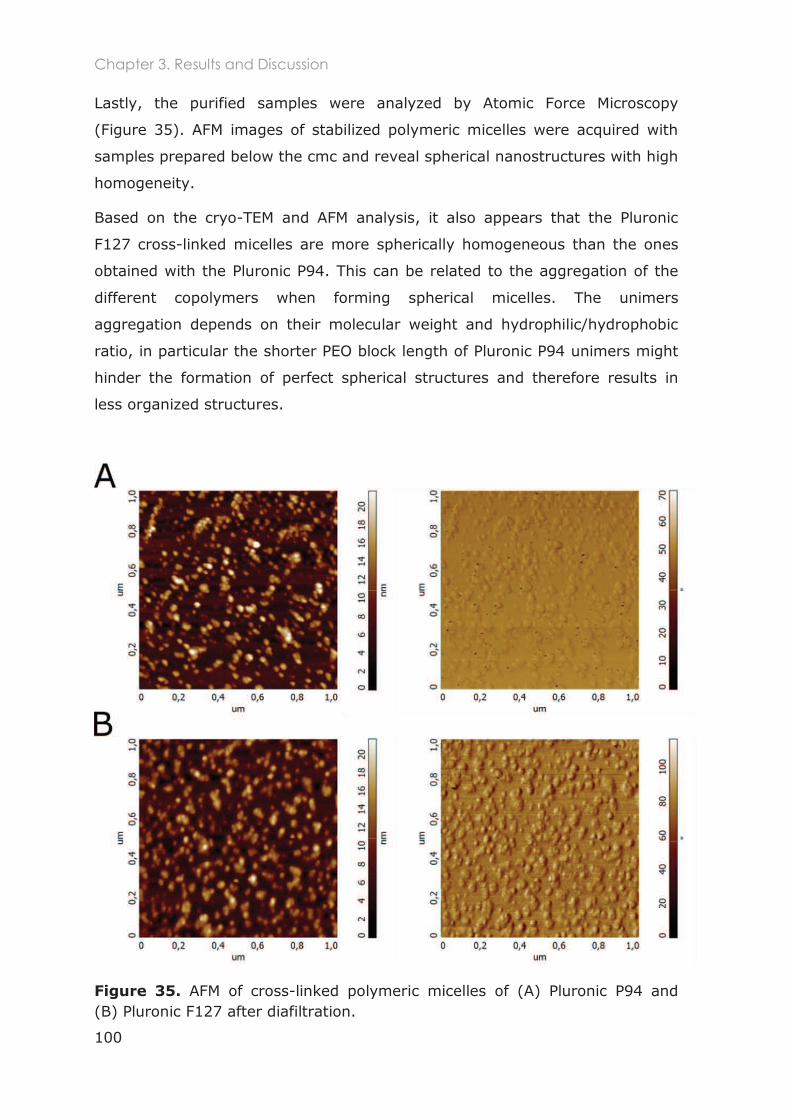
Chapter 3. Results and Discussion
100
Lastly, the purified samples were analyzed by Atomic Force Microscopy
(Figure 35). AFM images of stabilized polymeric micelles were acquired with
samples prepared below the cmc and reveal spherical nanostructures with high
homogeneity.
Based on the cryo-TEM and AFM analysis, it also appears that the Pluronic
F127 cross-linked micelles are more spherically homogeneous than the ones
obtained with the Pluronic P94. This can be related to the aggregation of the
different copolymers when forming spherical micelles. The unimers
aggregation depends on their molecular weight and hydrophilic/hydrophobic
ratio, in particular the shorter PEO block length of Pluronic P94 unimers might
hinder the formation of perfect spherical structures and therefore results in
less organized structures.
Figure 35. AFM of cross-linked polymeric micelles of (A) Pluronic P94 and (B) Pluronic F127 after diafiltration.
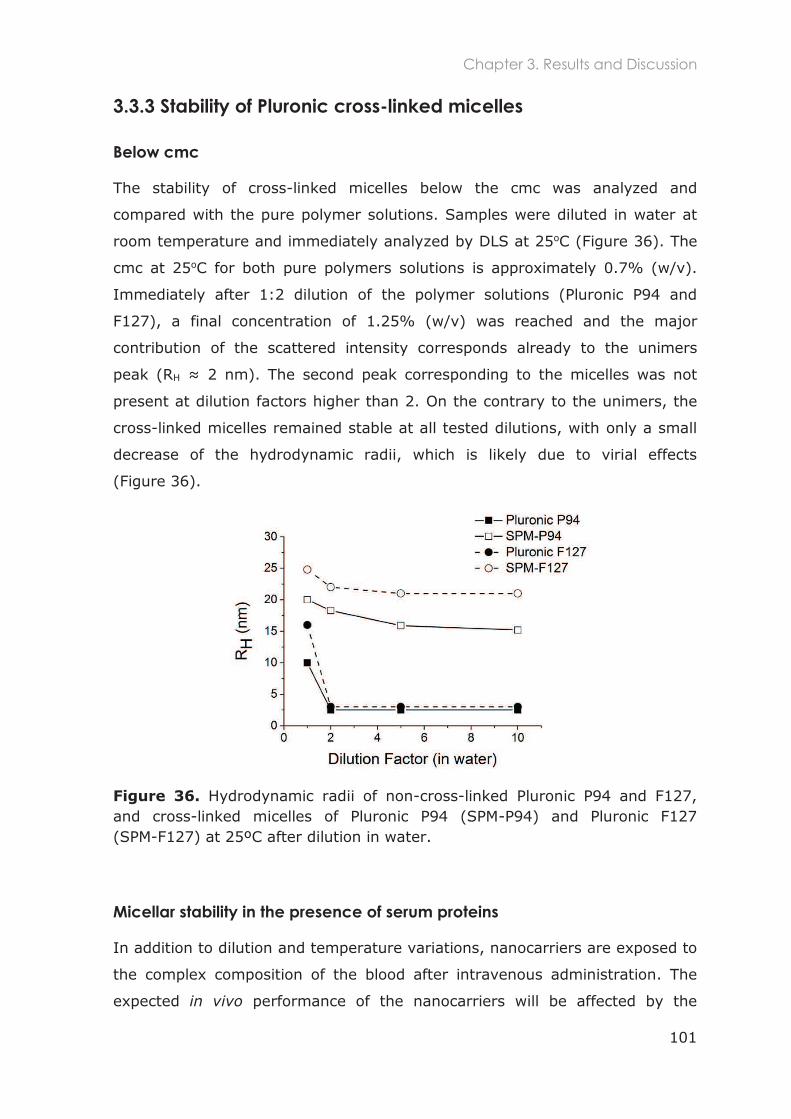
Chapter 3. Results and Discussion
101
3.3.3 Stability of Pluronic cross-linked micelles
Below cmc
The stability of cross-linked micelles below the cmc was analyzed and
compared with the pure polymer solutions. Samples were diluted in water at
room temperature and immediately analyzed by DLS at 25oC (Figure 36). The
cmc at 25oC for both pure polymers solutions is approximately 0.7% (w/v).
Immediately after 1:2 dilution of the polymer solutions (Pluronic P94 and
F127), a final concentration of 1.25% (w/v) was reached and the major
contribution of the scattered intensity corresponds already to the unimers
peak (RH
present at dilution factors higher than 2. On the contrary to the unimers, the
cross-linked micelles remained stable at all tested dilutions, with only a small
decrease of the hydrodynamic radii, which is likely due to virial effects
(Figure 36).
Figure 36. Hydrodynamic radii of non-cross-linked Pluronic P94 and F127, and cross-linked micelles of Pluronic P94 (SPM-P94) and Pluronic F127 (SPM-F127) at 25ºC after dilution in water.
Micellar stability in the presence of serum proteins
In addition to dilution and temperature variations, nanocarriers are exposed to
the complex composition of the blood after intravenous administration. The
expected in vivo performance of the nanocarriers will be affected by the
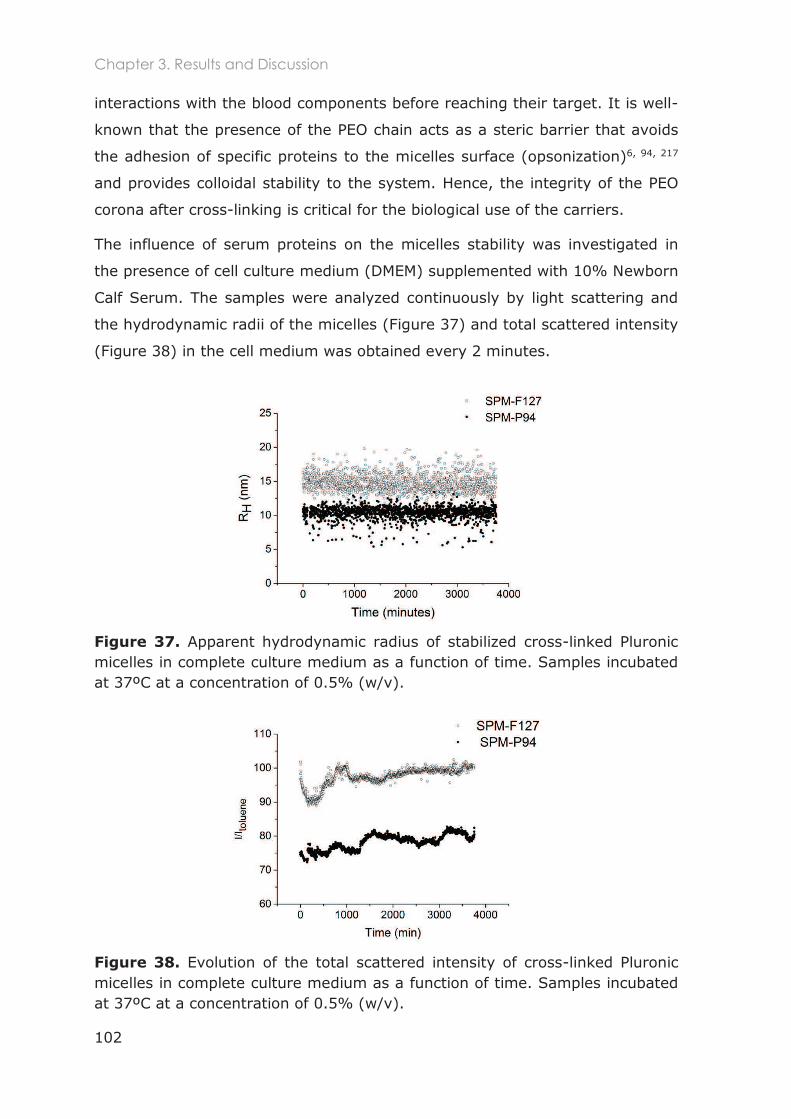
Chapter 3. Results and Discussion
102
interactions with the blood components before reaching their target. It is well-
known that the presence of the PEO chain acts as a steric barrier that avoids
the adhesion of specific proteins to the micelles surface (opsonization)6, 94, 217
and provides colloidal stability to the system. Hence, the integrity of the PEO
corona after cross-linking is critical for the biological use of the carriers.
The influence of serum proteins on the micelles stability was investigated in
the presence of cell culture medium (DMEM) supplemented with 10% Newborn
Calf Serum. The samples were analyzed continuously by light scattering and
the hydrodynamic radii of the micelles (Figure 37) and total scattered intensity
(Figure 38) in the cell medium was obtained every 2 minutes.
Figure 37. Apparent hydrodynamic radius of stabilized cross-linked Pluronic micelles in complete culture medium as a function of time. Samples incubated at 37ºC at a concentration of 0.5% (w/v).
Figure 38. Evolution of the total scattered intensity of cross-linked Pluronic micelles in complete culture medium as a function of time. Samples incubated at 37ºC at a concentration of 0.5% (w/v).
Chapter 3. Results and Discussion
103
No significant change in the micelles radii (Figure 37) was observed, which
indicates that no adsorption of serum proteins on the micelles corona
occurred. Moreover, no significant variations of the total scattered intensity
(Figure 38) were observed revealing that the number of cross-linked micelles
remained stable during the assay without the formation of aggregates. This
stability effect is consistent with the importance of the PEO chain to maintain
the steric hindrance and reduce the formation of aggregates with serum
proteins.
Upon freeze-drying and dispersion in water and organic solvents
Cross-linked micelles were freeze-dried and a very fine white powder was
obtained for both SPM-F127 and SPM-P94. Then, the obtained powders were
dispersed in aqueous and organic solvents (water, acetone, tetrahydrofuran
and chloroform), and the hydrodynamic size distribution was determined by
DLS. This allowed the assessment of the stability of cross-linked micelles in
different solvents, which is particularly interesting as it opens new possibilities
for their post-modification via chemical reactions. Moreover, this test is
determinant in evaluating the effectiveness of the cross-linking method as the
cross-linking agent is soluble in most of these solvents. An immediate
dissolution of the powders was observed in all the tested solvents without the
requirement of stirring. Moreover, after analysis by DLS, we observed that
micelles remained intact in all the tested solvents.
3.3.4 Loading of cross-linked micelles with a hydrophobic dye
Several studies have been conducted to develop more efficient delivery
systems, especially for the delivery of poorly water soluble anticancer drugs.
On designing these systems, the nanocarriers should be capable of
incorporating hydrophobic molecules and, at the same time, possess
characteristics that favor the delivery of the drug to the cancer site.
The ability of the cross-linked micelles to incorporate a hydrophobic molecule
in their core and transport it across the cellular membrane was assessed by
loading the stabilized micelles with a small photo-stable lipophilic dye (Nile
Red, Mw=318.37g/mol). Nile Red dissolved in ethanol was added to the
aqueous solutions containing 2.5% of stabilized Pluronic micelles
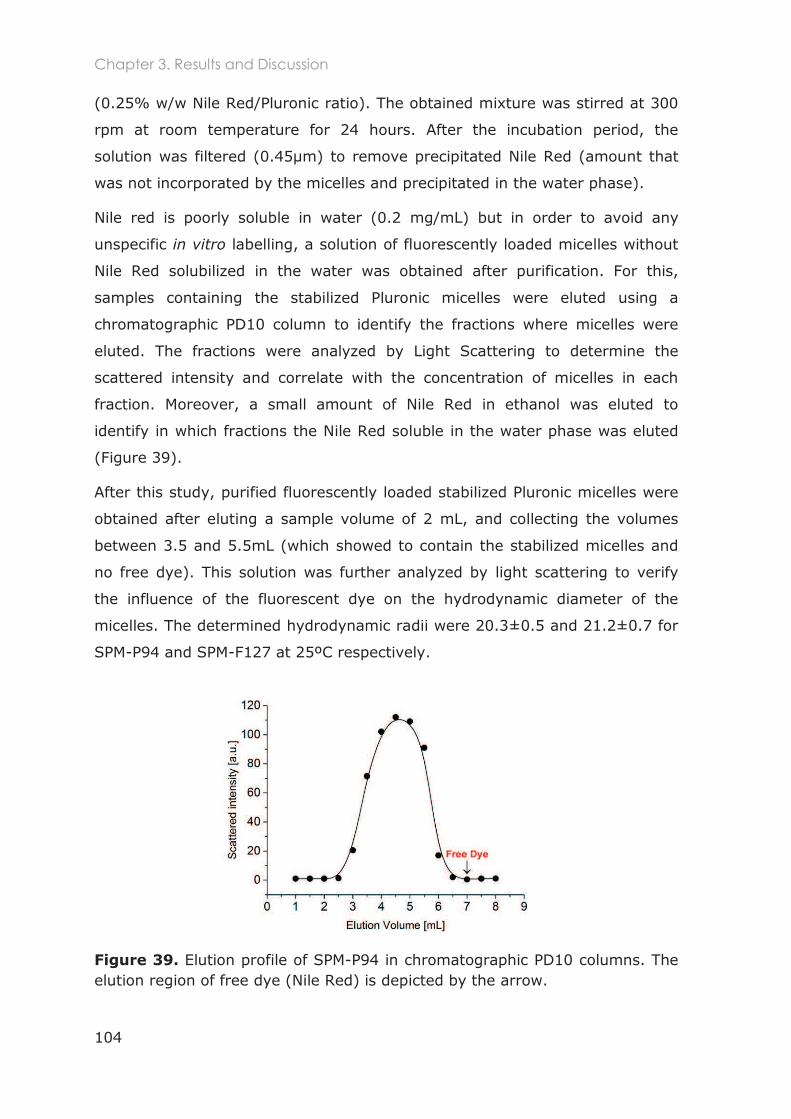
Chapter 3. Results and Discussion
104
(0.25% w/w Nile Red/Pluronic ratio). The obtained mixture was stirred at 300
rpm at room temperature for 24 hours. After the incubation period, the
solution was filtered (0.45µm) to remove precipitated Nile Red (amount that
was not incorporated by the micelles and precipitated in the water phase).
Nile red is poorly soluble in water (0.2 mg/mL) but in order to avoid any
unspecific in vitro labelling, a solution of fluorescently loaded micelles without
Nile Red solubilized in the water was obtained after purification. For this,
samples containing the stabilized Pluronic micelles were eluted using a
chromatographic PD10 column to identify the fractions where micelles were
eluted. The fractions were analyzed by Light Scattering to determine the
scattered intensity and correlate with the concentration of micelles in each
fraction. Moreover, a small amount of Nile Red in ethanol was eluted to
identify in which fractions the Nile Red soluble in the water phase was eluted
(Figure 39).
After this study, purified fluorescently loaded stabilized Pluronic micelles were
obtained after eluting a sample volume of 2 mL, and collecting the volumes
between 3.5 and 5.5mL (which showed to contain the stabilized micelles and
no free dye). This solution was further analyzed by light scattering to verify
the influence of the fluorescent dye on the hydrodynamic diameter of the
micelles. The determined hydrodynamic radii were 20.3±0.5 and 21.2±0.7 for
SPM-P94 and SPM-F127 at 25ºC respectively.
Figure 39. Elution profile of SPM-P94 in chromatographic PD10 columns. The elution region of free dye (Nile Red) is depicted by the arrow.
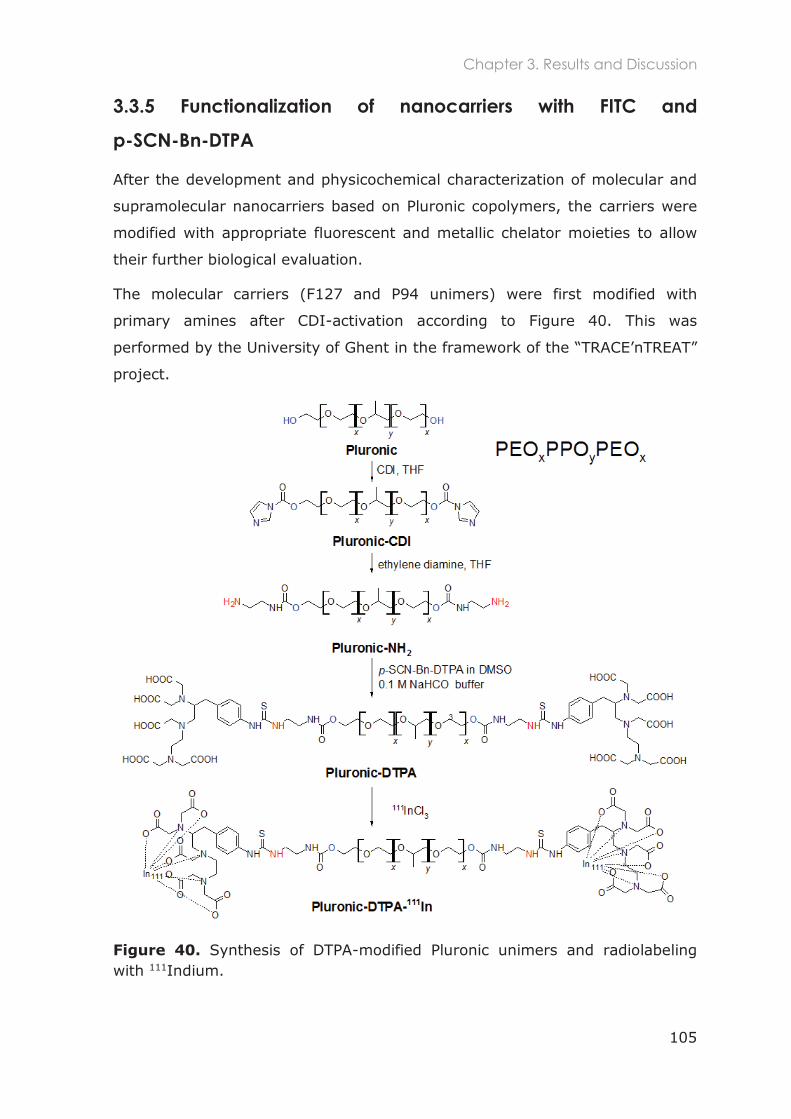
Chapter 3. Results and Discussion
105
3.3.5 Functionalization of nanocarriers with FITC and
p-SCN-Bn-DTPA
After the development and physicochemical characterization of molecular and
supramolecular nanocarriers based on Pluronic copolymers, the carriers were
modified with appropriate fluorescent and metallic chelator moieties to allow
their further biological evaluation.
The molecular carriers (F127 and P94 unimers) were first modified with
primary amines after CDI-activation according to Figure 40. This was
performed by the University of Ghent in the framework of the
project.
Figure 40. Synthesis of DTPA-modified Pluronic unimers and radiolabeling with 111Indium.
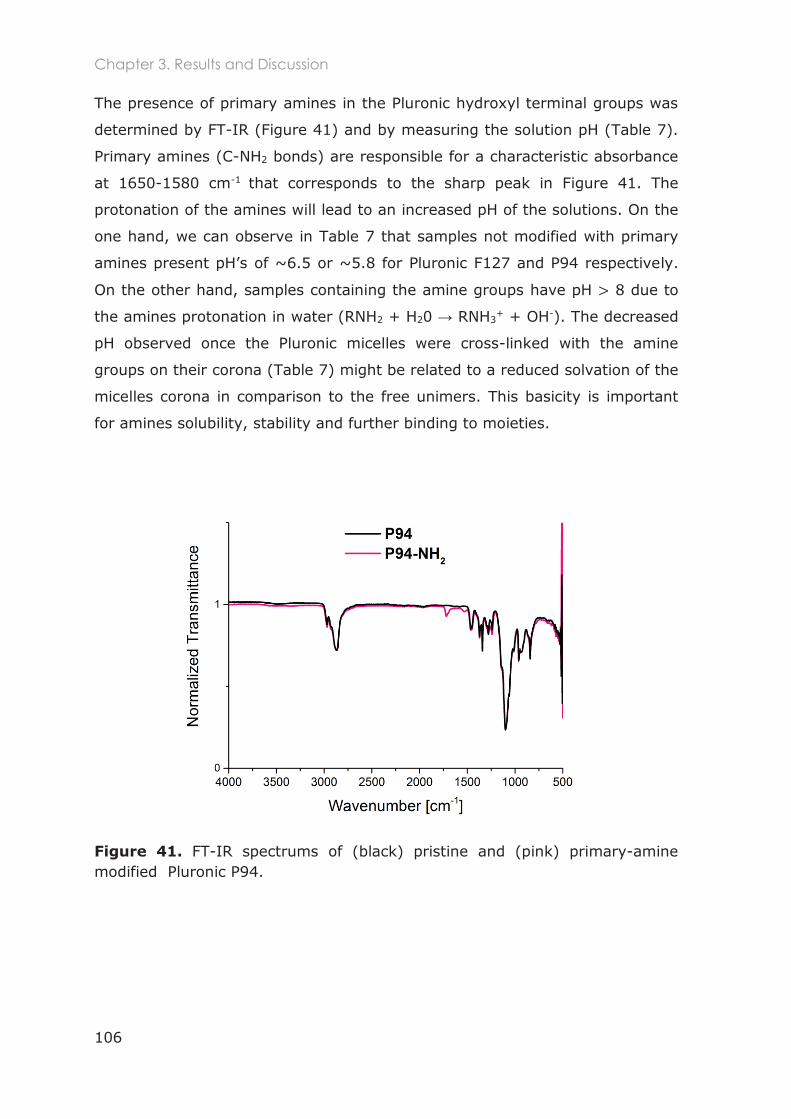
Chapter 3. Results and Discussion
106
The presence of primary amines in the Pluronic hydroxyl terminal groups was
determined by FT-IR (Figure 41) and by measuring the solution pH (Table 7).
Primary amines (C-NH2 bonds) are responsible for a characteristic absorbance
at 1650-1580 cm-1 that corresponds to the sharp peak in Figure 41. The
protonation of the amines will lead to an increased pH of the solutions. On the
one hand, we can observe in Table 7 that samples not modified with primary
ly.
On the other hand, samples containing the amine groups have pH 8 due to
the amines protonation in water (RNH2 + H20 RNH3+ + OH-). The decreased
pH observed once the Pluronic micelles were cross-linked with the amine
groups on their corona (Table 7) might be related to a reduced solvation of the
micelles corona in comparison to the free unimers. This basicity is important
for amines solubility, stability and further binding to moieties.
Figure 41. FT-IR spectrums of (black) pristine and (pink) primary-amine modified Pluronic P94.
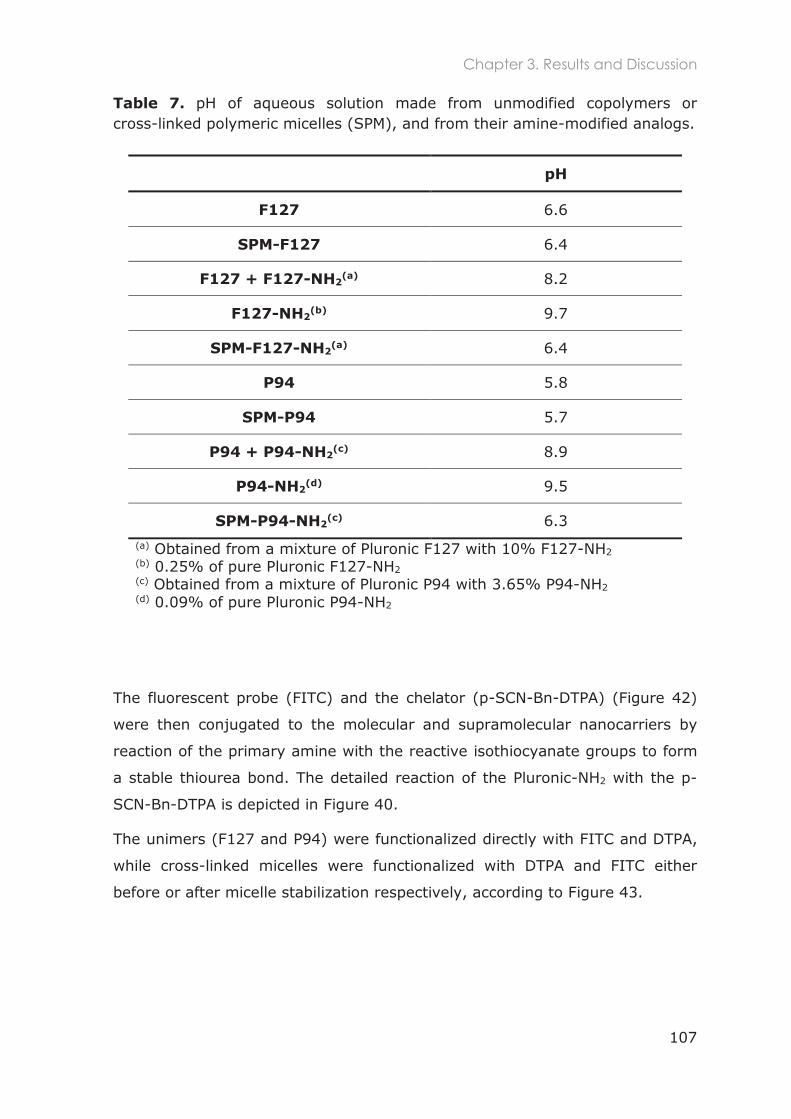
Chapter 3. Results and Discussion
107
Table 7. pH of aqueous solution made from unmodified copolymers or cross-linked polymeric micelles (SPM), and from their amine-modified analogs.
The fluorescent probe (FITC) and the chelator (p-SCN-Bn-DTPA) (Figure 42)
were then conjugated to the molecular and supramolecular nanocarriers by
reaction of the primary amine with the reactive isothiocyanate groups to form
a stable thiourea bond. The detailed reaction of the Pluronic-NH2 with the p-
SCN-Bn-DTPA is depicted in Figure 40.
The unimers (F127 and P94) were functionalized directly with FITC and DTPA,
while cross-linked micelles were functionalized with DTPA and FITC either
before or after micelle stabilization respectively, according to Figure 43.
pH
F127 6.6
SPM-F127 6.4
F127 + F127-NH2(a) 8.2
F127-NH2(b) 9.7
SPM-F127-NH2(a) 6.4
P94 5.8
SPM-P94 5.7
P94 + P94-NH2(c) 8.9
P94-NH2(d) 9.5
SPM-P94-NH2(c) 6.3
(a) Obtained from a mixture of Pluronic F127 with 10% F127-NH2 (b) 0.25% of pure Pluronic F127-NH2 (c) Obtained from a mixture of Pluronic P94 with 3.65% P94-NH2 (d) 0.09% of pure Pluronic P94-NH2
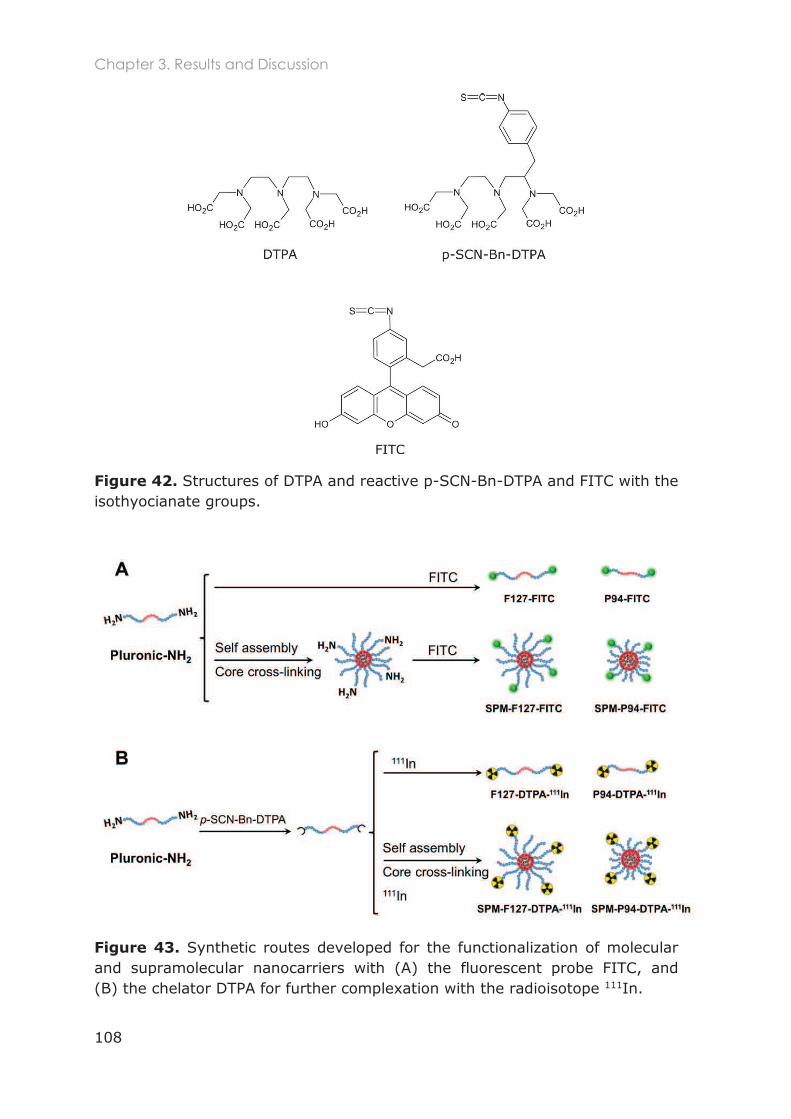
Chapter 3. Results and Discussion
108
Figure 42. Structures of DTPA and reactive p-SCN-Bn-DTPA and FITC with the isothyocianate groups.
Figure 43. Synthetic routes developed for the functionalization of molecular and supramolecular nanocarriers with (A) the fluorescent probe FITC, and (B) the chelator DTPA for further complexation with the radioisotope 111In.
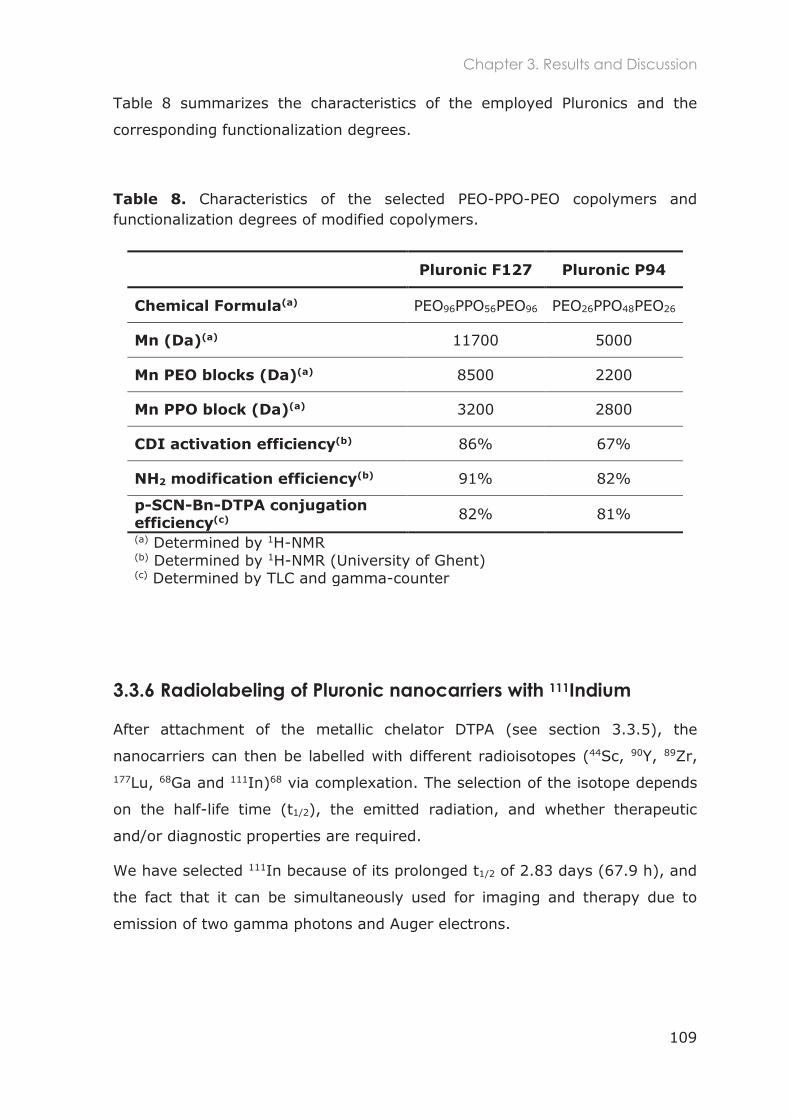
Chapter 3. Results and Discussion
109
Table 8 summarizes the characteristics of the employed Pluronics and the
corresponding functionalization degrees.
Table 8. Characteristics of the selected PEO-PPO-PEO copolymers and functionalization degrees of modified copolymers.
3.3.6 Radiolabeling of Pluronic nanocarriers with 111Indium
After attachment of the metallic chelator DTPA (see section 3.3.5), the
nanocarriers can then be labelled with different radioisotopes (44Sc, 90Y, 89Zr, 177Lu, 68Ga and 111In)68 via complexation. The selection of the isotope depends
on the half-life time (t1/2), the emitted radiation, and whether therapeutic
and/or diagnostic properties are required.
We have selected 111In because of its prolonged t1/2 of 2.83 days (67.9 h), and
the fact that it can be simultaneously used for imaging and therapy due to
emission of two gamma photons and Auger electrons.
Pluronic F127 Pluronic P94
Chemical Formula(a) PEO96PPO56PEO96 PEO26PPO48PEO26
Mn (Da)(a) 11700 5000
Mn PEO blocks (Da)(a) 8500 2200
Mn PPO block (Da)(a) 3200 2800
CDI activation efficiency(b) 86% 67%
NH2 modification efficiency(b) 91% 82%
p-SCN-Bn-DTPA conjugation efficiency(c)
82% 81%
(a) Determined by 1H-NMR (b) Determined by 1H-NMR (University of Ghent) (c) Determined by TLC and gamma-counter
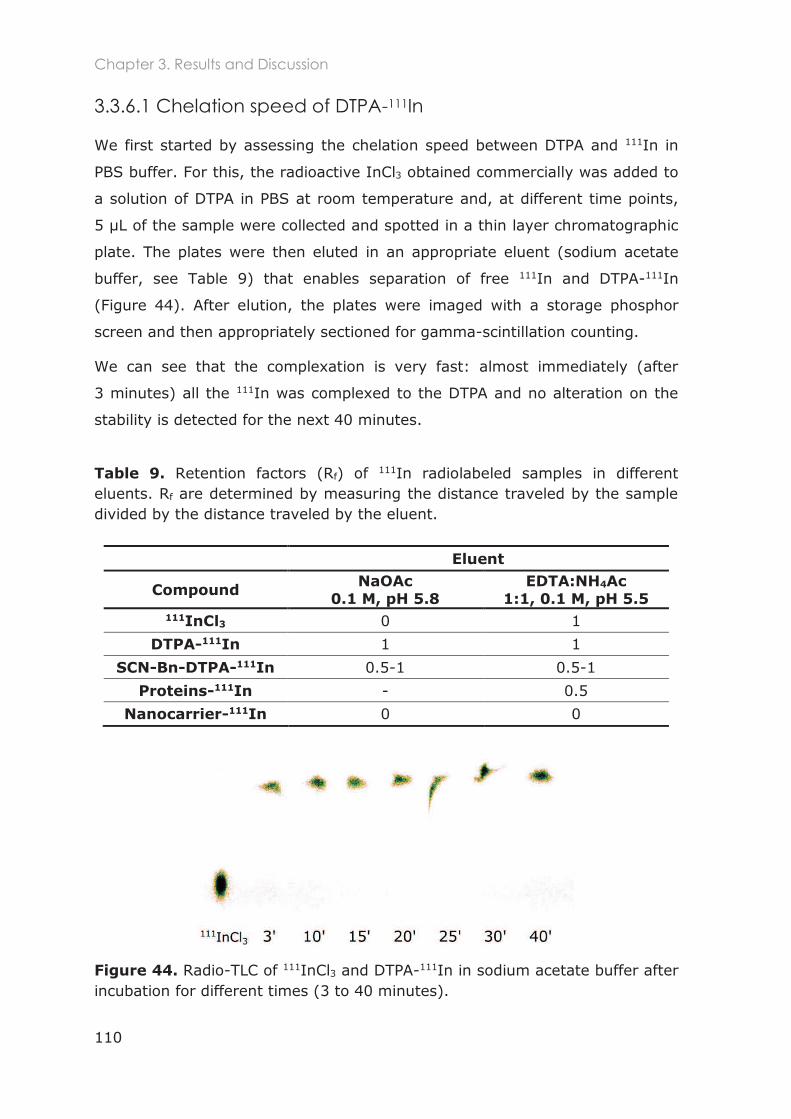
Chapter 3. Results and Discussion
110
3.3.6.1 Chelation speed of DTPA-111In
We first started by assessing the chelation speed between DTPA and 111In in
PBS buffer. For this, the radioactive InCl3 obtained commercially was added to
a solution of DTPA in PBS at room temperature and, at different time points,
5 µL of the sample were collected and spotted in a thin layer chromatographic
plate. The plates were then eluted in an appropriate eluent (sodium acetate
buffer, see Table 9) that enables separation of free 111In and DTPA-111In
(Figure 44). After elution, the plates were imaged with a storage phosphor
screen and then appropriately sectioned for gamma-scintillation counting.
We can see that the complexation is very fast: almost immediately (after
3 minutes) all the 111In was complexed to the DTPA and no alteration on the
stability is detected for the next 40 minutes.
Table 9. Retention factors (Rf) of 111In radiolabeled samples in different eluents. Rf are determined by measuring the distance traveled by the sample divided by the distance traveled by the eluent.
Figure 44. Radio-TLC of 111InCl3 and DTPA-111In in sodium acetate buffer after incubation for different times (3 to 40 minutes).
Eluent
Compound NaOAc
0.1 M, pH 5.8 EDTA:NH4Ac
1:1, 0.1 M, pH 5.5 111InCl3 0 1
DTPA-111In 1 1
SCN-Bn-DTPA-111In 0.5-1 0.5-1
Proteins-111In - 0.5
Nanocarrier-111In 0 0
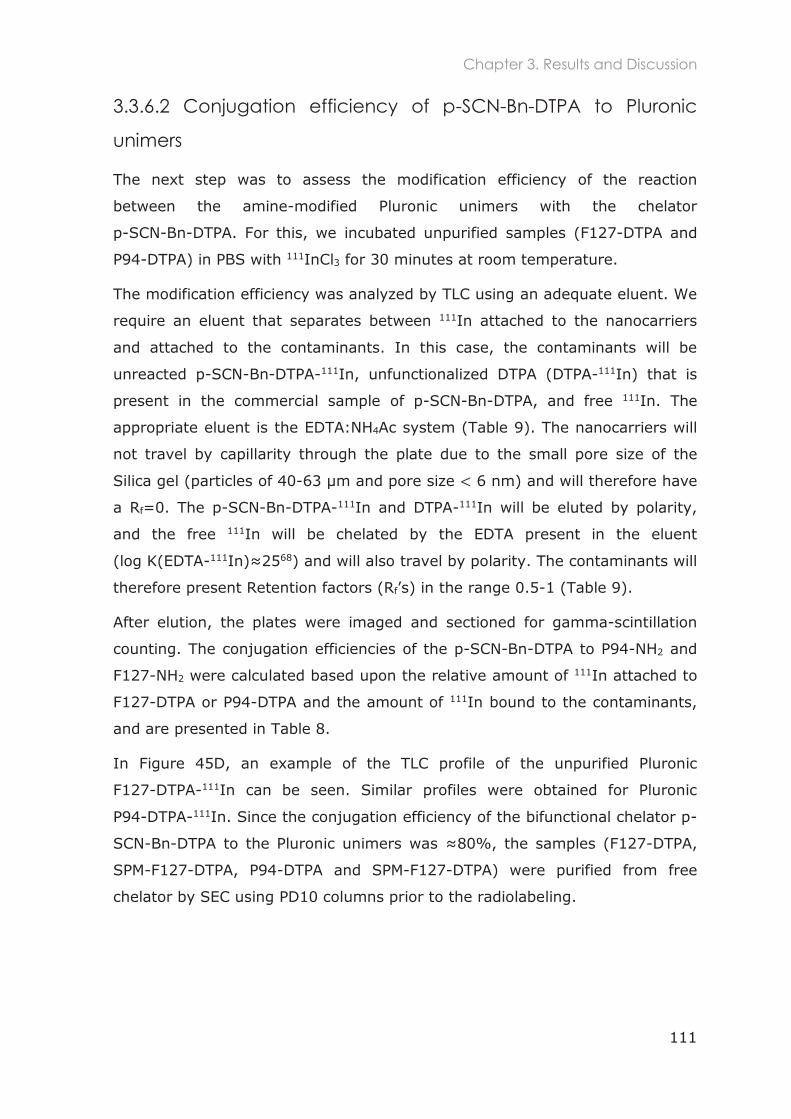
Chapter 3. Results and Discussion
111
3.3.6.2 Conjugation efficiency of p-SCN-Bn-DTPA to Pluronic
unimers
The next step was to assess the modification efficiency of the reaction
between the amine-modified Pluronic unimers with the chelator
p-SCN-Bn-DTPA. For this, we incubated unpurified samples (F127-DTPA and
P94-DTPA) in PBS with 111InCl3 for 30 minutes at room temperature.
The modification efficiency was analyzed by TLC using an adequate eluent. We
require an eluent that separates between 111In attached to the nanocarriers
and attached to the contaminants. In this case, the contaminants will be
unreacted p-SCN-Bn-DTPA-111In, unfunctionalized DTPA (DTPA-111In) that is
present in the commercial sample of p-SCN-Bn-DTPA, and free 111In. The
appropriate eluent is the EDTA:NH4Ac system (Table 9). The nanocarriers will
not travel by capillarity through the plate due to the small pore size of the
Silica gel (particles of 40-63 and pore size 6 nm) and will therefore have
a Rf=0. The p-SCN-Bn-DTPA-111In and DTPA-111In will be eluted by polarity,
and the free 111In will be chelated by the EDTA present in the eluent
(log K(EDTA-111 68) and will also travel by polarity. The contaminants will
therefore present Retention factors (Rf ) in the range 0.5-1 (Table 9).
After elution, the plates were imaged and sectioned for gamma-scintillation
counting. The conjugation efficiencies of the p-SCN-Bn-DTPA to P94-NH2 and
F127-NH2 were calculated based upon the relative amount of 111In attached to
F127-DTPA or P94-DTPA and the amount of 111In bound to the contaminants,
and are presented in Table 8.
In Figure 45D, an example of the TLC profile of the unpurified Pluronic
F127-DTPA-111In can be seen. Similar profiles were obtained for Pluronic
P94-DTPA-111In. Since the conjugation efficiency of the bifunctional chelator p-
SCN-Bn-DTPA to the Pluronic unimers , the samples (F127-DTPA,
SPM-F127-DTPA, P94-DTPA and SPM-F127-DTPA) were purified from free
chelator by SEC using PD10 columns prior to the radiolabeling.
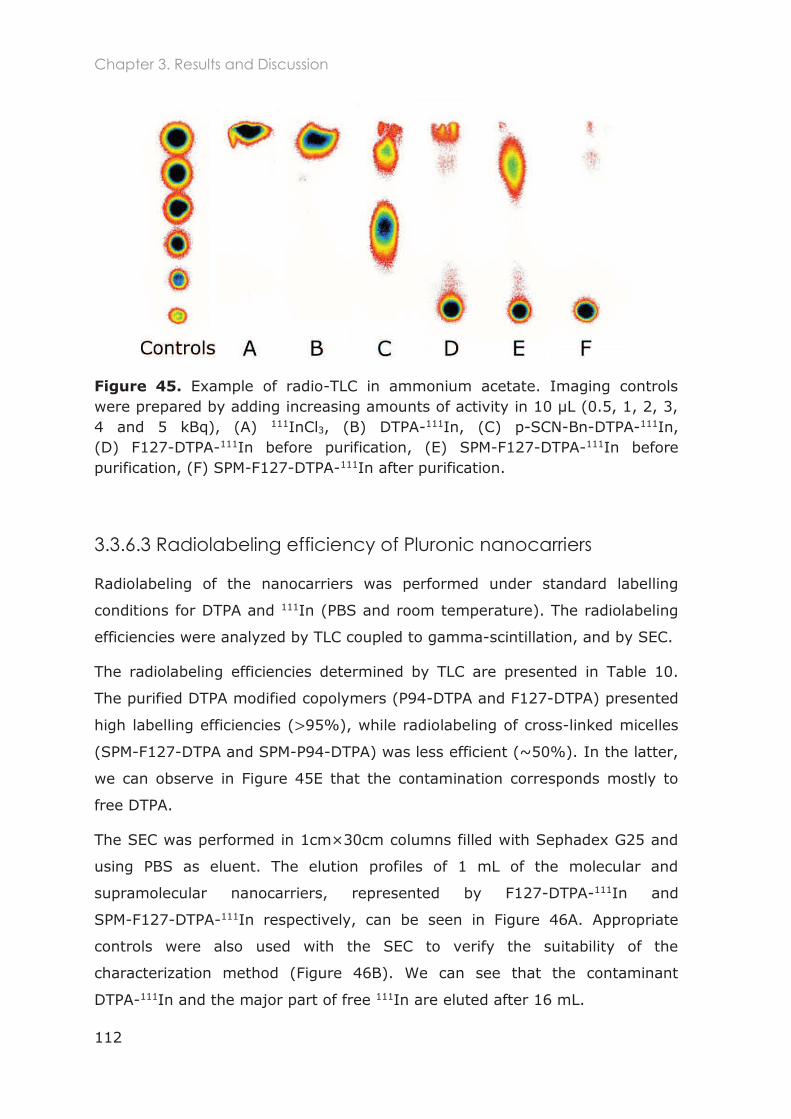
Chapter 3. Results and Discussion
112
Figure 45. Example of radio-TLC in ammonium acetate. Imaging controls were prepared by adding increasing amounts of activity in 10 µL (0.5, 1, 2, 3, 4 and 5 kBq), (A) 111InCl3, (B) DTPA-111In, (C) p-SCN-Bn-DTPA-111In, (D) F127-DTPA-111In before purification, (E) SPM-F127-DTPA-111In before purification, (F) SPM-F127-DTPA-111In after purification.
3.3.6.3 Radiolabeling efficiency of Pluronic nanocarriers
Radiolabeling of the nanocarriers was performed under standard labelling
conditions for DTPA and 111In (PBS and room temperature). The radiolabeling
efficiencies were analyzed by TLC coupled to gamma-scintillation, and by SEC.
The radiolabeling efficiencies determined by TLC are presented in Table 10.
The purified DTPA modified copolymers (P94-DTPA and F127-DTPA) presented
high labelling efficiencies ( 95%), while radiolabeling of cross-linked micelles
(SPM-F127-DTPA and SPM-P94-DTPA) was less efficient (~50%). In the latter,
we can observe in Figure 45E that the contamination corresponds mostly to
free DTPA.
The SEC was performed in 1cm×30cm columns filled with Sephadex G25 and
using PBS as eluent. The elution profiles of 1 mL of the molecular and
supramolecular nanocarriers, represented by F127-DTPA-111In and
SPM-F127-DTPA-111In respectively, can be seen in Figure 46A. Appropriate
controls were also used with the SEC to verify the suitability of the
characterization method (Figure 46B). We can see that the contaminant
DTPA-111In and the major part of free 111In are eluted after 16 mL.
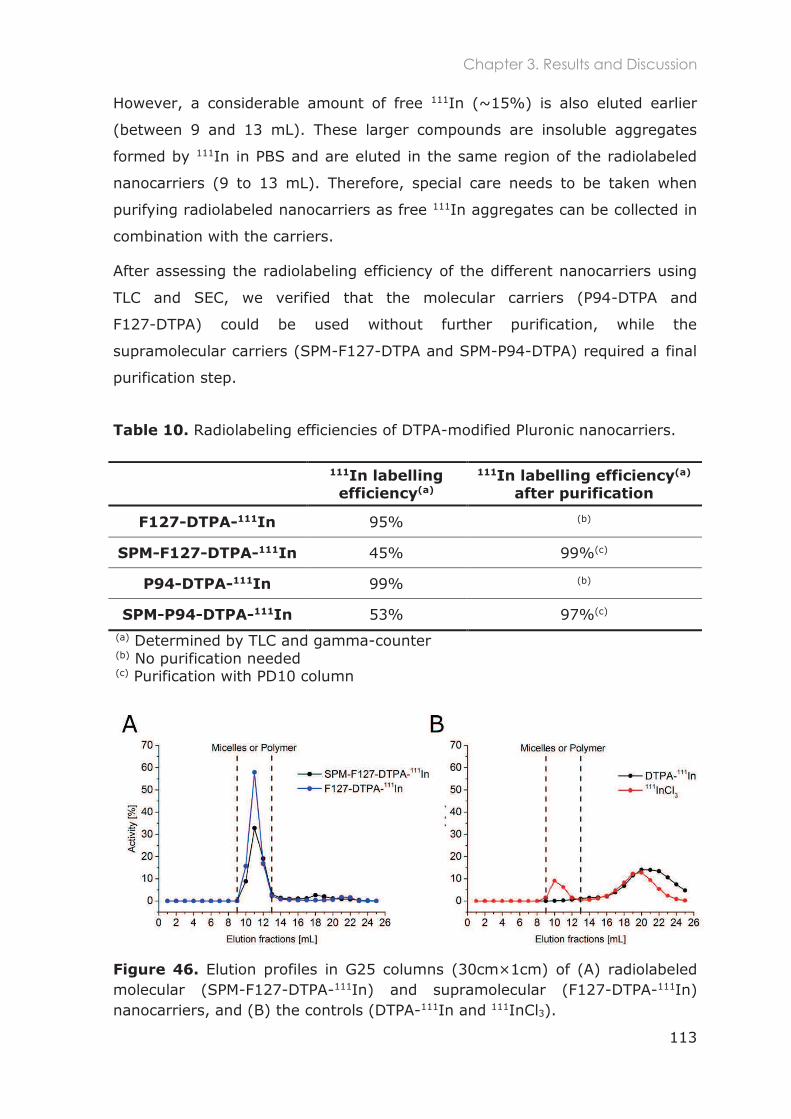
Chapter 3. Results and Discussion
113
However, a considerable amount of free 111In (~15%) is also eluted earlier
(between 9 and 13 mL). These larger compounds are insoluble aggregates
formed by 111In in PBS and are eluted in the same region of the radiolabeled
nanocarriers (9 to 13 mL). Therefore, special care needs to be taken when
purifying radiolabeled nanocarriers as free 111In aggregates can be collected in
combination with the carriers.
After assessing the radiolabeling efficiency of the different nanocarriers using
TLC and SEC, we verified that the molecular carriers (P94-DTPA and
F127-DTPA) could be used without further purification, while the
supramolecular carriers (SPM-F127-DTPA and SPM-P94-DTPA) required a final
purification step.
Table 10. Radiolabeling efficiencies of DTPA-modified Pluronic nanocarriers.
Figure 46. Elution profiles in G25 columns (30cm×1cm) of (A) radiolabeled molecular (SPM-F127-DTPA-111In) and supramolecular (F127-DTPA-111In) nanocarriers, and (B) the controls (DTPA-111In and 111InCl3).
111In labelling efficiency(a)
111In labelling efficiency(a) after purification
F127-DTPA-111In 95% (b)
SPM-F127-DTPA-111In 45% 99%(c)
P94-DTPA-111In 99% (b)
SPM-P94-DTPA-111In 53% 97%(c) (a) Determined by TLC and gamma-counter (b) No purification needed (c) Purification with PD10 column
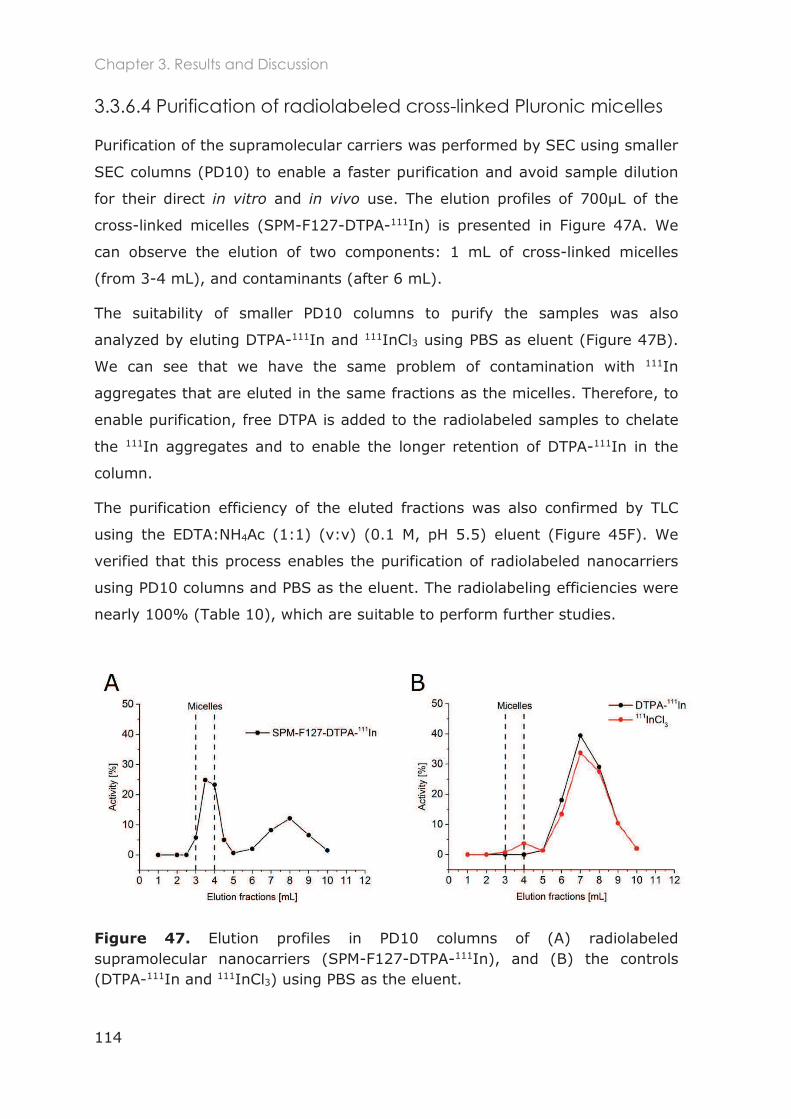
Chapter 3. Results and Discussion
114
3.3.6.4 Purification of radiolabeled cross-linked Pluronic micelles
Purification of the supramolecular carriers was performed by SEC using smaller
SEC columns (PD10) to enable a faster purification and avoid sample dilution
for their direct in vitro and in vivo use. The elution profiles of 700µL of the
cross-linked micelles (SPM-F127-DTPA-111In) is presented in Figure 47A. We
can observe the elution of two components: 1 mL of cross-linked micelles
(from 3-4 mL), and contaminants (after 6 mL).
The suitability of smaller PD10 columns to purify the samples was also
analyzed by eluting DTPA-111In and 111InCl3 using PBS as eluent (Figure 47B).
We can see that we have the same problem of contamination with 111In
aggregates that are eluted in the same fractions as the micelles. Therefore, to
enable purification, free DTPA is added to the radiolabeled samples to chelate
the 111In aggregates and to enable the longer retention of DTPA-111In in the
column.
The purification efficiency of the eluted fractions was also confirmed by TLC
using the EDTA:NH4Ac (1:1) (v:v) (0.1 M, pH 5.5) eluent (Figure 45F). We
verified that this process enables the purification of radiolabeled nanocarriers
using PD10 columns and PBS as the eluent. The radiolabeling efficiencies were
nearly 100% (Table 10), which are suitable to perform further studies.
Figure 47. Elution profiles in PD10 columns of (A) radiolabeled supramolecular nanocarriers (SPM-F127-DTPA-111In), and (B) the controls (DTPA-111In and 111InCl3) using PBS as the eluent.
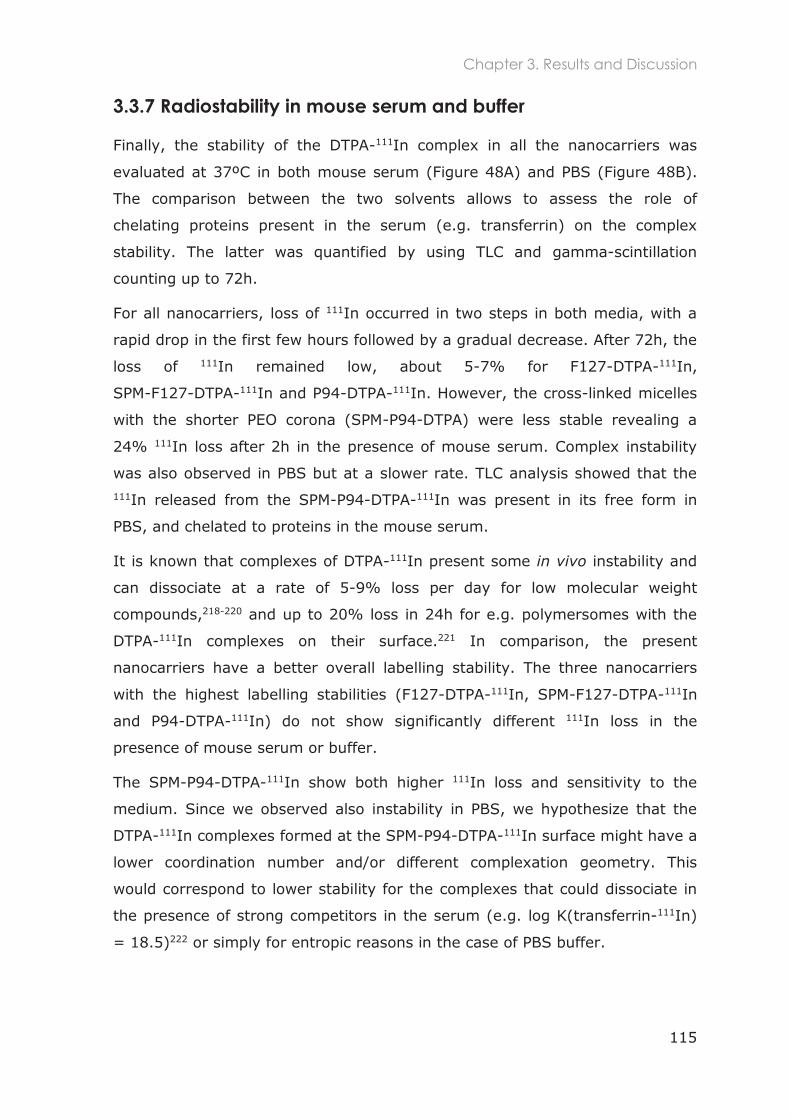
Chapter 3. Results and Discussion
115
3.3.7 Radiostability in mouse serum and buffer
Finally, the stability of the DTPA-111In complex in all the nanocarriers was
evaluated at 37ºC in both mouse serum (Figure 48A) and PBS (Figure 48B).
The comparison between the two solvents allows to assess the role of
chelating proteins present in the serum (e.g. transferrin) on the complex
stability. The latter was quantified by using TLC and gamma-scintillation
counting up to 72h.
For all nanocarriers, loss of 111In occurred in two steps in both media, with a
rapid drop in the first few hours followed by a gradual decrease. After 72h, the
loss of 111In remained low, about 5-7% for F127-DTPA-111In,
SPM-F127-DTPA-111In and P94-DTPA-111In. However, the cross-linked micelles
with the shorter PEO corona (SPM-P94-DTPA) were less stable revealing a
24% 111In loss after 2h in the presence of mouse serum. Complex instability
was also observed in PBS but at a slower rate. TLC analysis showed that the 111In released from the SPM-P94-DTPA-111In was present in its free form in
PBS, and chelated to proteins in the mouse serum.
It is known that complexes of DTPA-111In present some in vivo instability and
can dissociate at a rate of 5-9% loss per day for low molecular weight
compounds,218-220 and up to 20% loss in 24h for e.g. polymersomes with the
DTPA-111In complexes on their surface.221 In comparison, the present
nanocarriers have a better overall labelling stability. The three nanocarriers
with the highest labelling stabilities (F127-DTPA-111In, SPM-F127-DTPA-111In
and P94-DTPA-111In) do not show significantly different 111In loss in the
presence of mouse serum or buffer.
The SPM-P94-DTPA-111In show both higher 111In loss and sensitivity to the
medium. Since we observed also instability in PBS, we hypothesize that the
DTPA-111In complexes formed at the SPM-P94-DTPA-111In surface might have a
lower coordination number and/or different complexation geometry. This
would correspond to lower stability for the complexes that could dissociate in
the presence of strong competitors in the serum (e.g. log K(transferrin-111In)
= 18.5)222 or simply for entropic reasons in the case of PBS buffer.
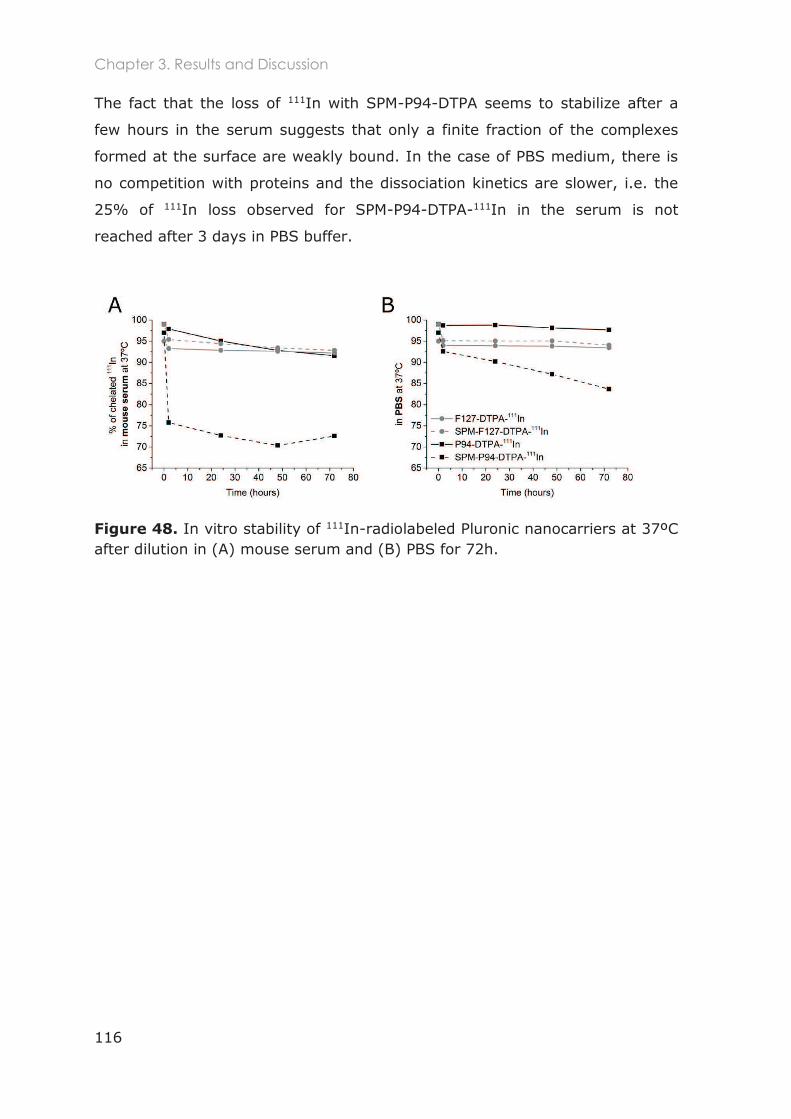
Chapter 3. Results and Discussion
116
The fact that the loss of 111In with SPM-P94-DTPA seems to stabilize after a
few hours in the serum suggests that only a finite fraction of the complexes
formed at the surface are weakly bound. In the case of PBS medium, there is
no competition with proteins and the dissociation kinetics are slower, i.e. the
25% of 111In loss observed for SPM-P94-DTPA-111In in the serum is not
reached after 3 days in PBS buffer.
Figure 48. In vitro stability of 111In-radiolabeled Pluronic nanocarriers at 37ºC after dilution in (A) mouse serum and (B) PBS for 72h.
Chapter 3. Conclusions
117
3.5 Conclusions
We developed molecular and supramolecular nanocarriers based on Pluronic
block copolymers. Molecular unimers present average diameters of ~4 to 6 nm
with increasing PEO block masses (1100 and 4250 g/mol) and a constant PPO
block mass of ~3000 g/mol.
Due to the dynamic nature of supramolecular Pluronic assemblies, we
developed an easy and effective strategy to prevent the disintegration of
Pluronic micelles into unimers by incorporating a hydrophobic cross-linking
agent in the micelles core. Photo-polymerization of the cross-linking agent
resulted in the creation of an interpenetrating polymer network of poly(PETA).
After purification of the cross-linked solutions from free unimers, the obtained
stabilized micelles present hydrodynamic diameters ranging from 26 to 38 nm
for PEO masses of 1100 or 4250 g/mol. The obtained sizes are within the
appropriate range to avoid both rapid clearance of the nanocarriers by the
kidneys and retention in the liver.6, 223 The cross-linked micelles were stable
below and above the cmT, below the cmc, in the presence of serum proteins,
and upon freeze-drying and dispersion in aqueous and organic solvents.
Moreover, this method could retain the micelle structure in a much longer time
scale than the stabilization procedures developed by other groups.191, 195 This
stability is most likely related to the presence of the unaltered PEO block in
their corona, which demonstrates that this stabilization strategy seems
promising on maintaining the in vivo stealth properties of PEO-PPO-PEO
micelles. To test the ability of the PPO core in incorporating hydrophobic
molecules, cross-linked micelles were also loaded with a hydrophobic
fluorescent dye.
We also described strategies to functionalize the molecular and supramolecular
Pluronic nanocarriers with fluorescent probes and hydrophilic metallic
chelators. Functionalization with the fluorescent probes enables their
visualization, while attachment of the chelator enabled the complexation with
radioisotopes. We used the radionuclide 111In to obtain radiolabeled
nanocarriers that can be further used for imaging, therapy or quantification
purposes. In the following chapters, the in vitro (Chapter 4) and in vivo
(Chapter 5) interactions of the nanocarriers herein developed are evaluated.

118
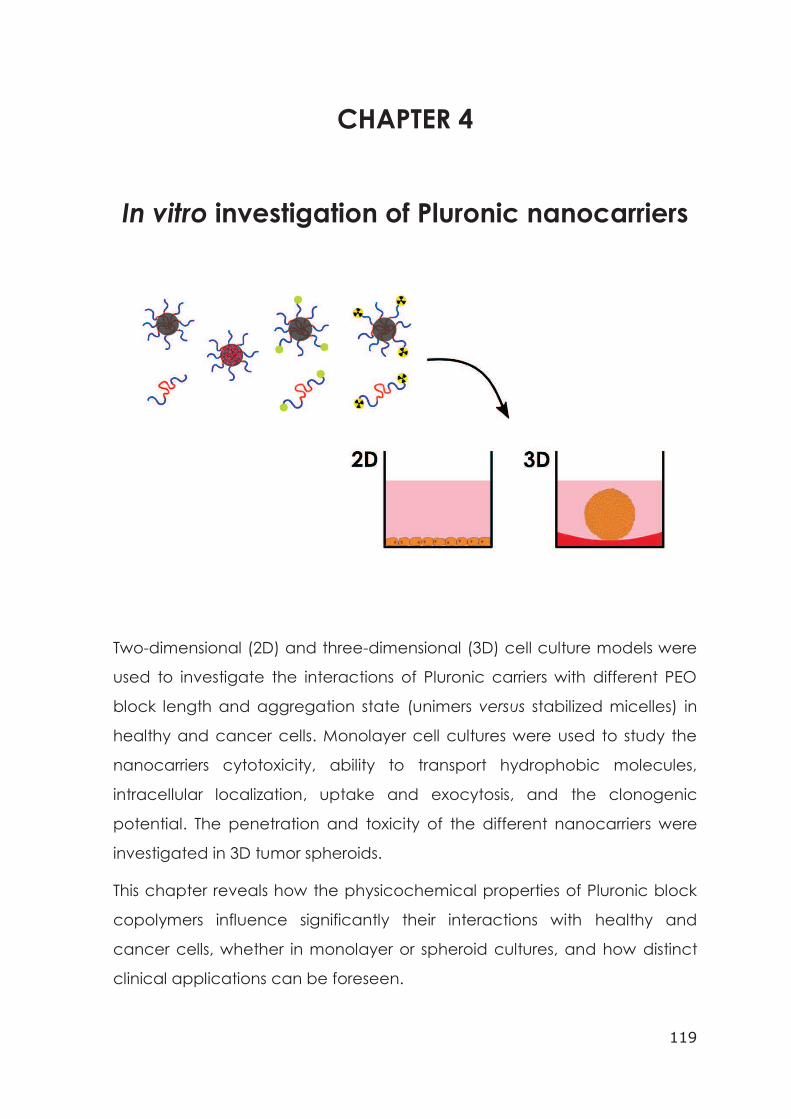
119
CHAPTER 4
In vitro investigation of Pluronic nanocarriers
Two-dimensional (2D) and three-dimensional (3D) cell culture models were
used to investigate the interactions of Pluronic carriers with different PEO
block length and aggregation state (unimers versus stabilized micelles) in
healthy and cancer cells. Monolayer cell cultures were used to study the
nanocarriers cytotoxicity, ability to transport hydrophobic molecules,
intracellular localization, uptake and exocytosis, and the clonogenic
potential. The penetration and toxicity of the different nanocarriers were
investigated in 3D tumor spheroids.
This chapter reveals how the physicochemical properties of Pluronic block
copolymers influence significantly their interactions with healthy and
cancer cells, whether in monolayer or spheroid cultures, and how distinct
clinical applications can be foreseen.

120
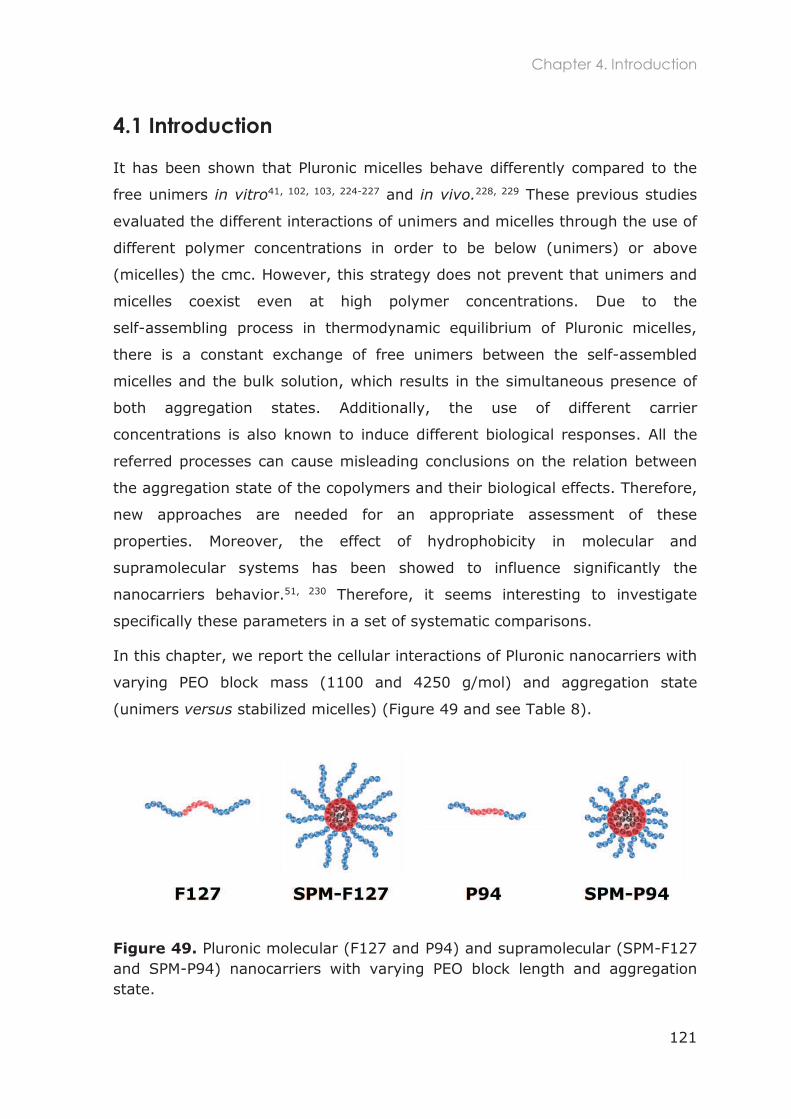
Chapter 4. Introduction
121
4.1 Introduction
It has been shown that Pluronic micelles behave differently compared to the
free unimers in vitro41, 102, 103, 224-227 and in vivo.228, 229 These previous studies
evaluated the different interactions of unimers and micelles through the use of
different polymer concentrations in order to be below (unimers) or above
(micelles) the cmc. However, this strategy does not prevent that unimers and
micelles coexist even at high polymer concentrations. Due to the
self-assembling process in thermodynamic equilibrium of Pluronic micelles,
there is a constant exchange of free unimers between the self-assembled
micelles and the bulk solution, which results in the simultaneous presence of
both aggregation states. Additionally, the use of different carrier
concentrations is also known to induce different biological responses. All the
referred processes can cause misleading conclusions on the relation between
the aggregation state of the copolymers and their biological effects. Therefore,
new approaches are needed for an appropriate assessment of these
properties. Moreover, the effect of hydrophobicity in molecular and
supramolecular systems has been showed to influence significantly the
nanocarriers behavior.51, 230 Therefore, it seems interesting to investigate
specifically these parameters in a set of systematic comparisons.
In this chapter, we report the cellular interactions of Pluronic nanocarriers with
varying PEO block mass (1100 and 4250 g/mol) and aggregation state
(unimers versus stabilized micelles) (Figure 49 and see Table 8).
Figure 49. Pluronic molecular (F127 and P94) and supramolecular (SPM-F127 and SPM-P94) nanocarriers with varying PEO block length and aggregation state.
Chapter 4. Introduction
122
We started by assessing the cytotoxicity of the nanocarriers in a healthy cell
line of mouse fibroblasts. Then, pre-stabilized micelles were loaded with the
fluorescent Nile Red to mimic the incorporation of a poorly water-soluble drug.
After loading, the internalization and intracellular localization of Nile red was
studied by confocal microscopy at different incubation times.
The chemically modified nanocarriers with the fluorescent probe and the
chelator were used to evaluate more specific interactions with HeLa and U87
cancer cells. The functionalization of the carriers with FITC enabled the
visualization of the nanocarriers themselves by confocal microscopy. The use
of common molecular biology techniques to label cellular organelles along with
the fluorescently labelled nanocarriers provided valuable information for their
potential clinical use. The nanocarriers modified with the chelator DTPA were
radiolabeled with the radioisotope 111In and also evaluated in vitro. This
radionuclide is very interesting for the in vitro
potential due to its prolonged half-life of 2.8 days, and simultaneous emission
of gamma-radiation and Auger electrons. On the one hand, the long half-life
and the emission of gamma radiation provide a substantial advantage since it
allows the use of low radiation doses and to quantitatively determine the
uptake and exocytosis of the nanocarriers by scintillation. On the other hand,
this radio-metal can also be used for therapy due to the emission of Auger
electrons (see Chapter 1 section 1.3.1). The therapeutic effect of 111In has not
yet been widely explored when associated to nanocarriers. In this work, we
also evaluated the clonogenic potential of the nanocarriers, particularly the
P94-DTPA-111In unimers.
For the complete in vitro assessment of the developed Pluronic nanocarriers,
different cell culture conditions were used. 2D monolayer cell culture systems
were used for the evaluation of their cytotoxicity, internalization kinetics and
clonogenic potential. This system was particularly useful to study single cell
interactions and to discover potential intracellular targets. 3D multicellular
tumor spheroids were generated to investigate more complex interactions
such as the penetration and toxicity of the nanocarriers into multicellular
aggregates. This system provides a realistic approach to predict the clinical
efficacy of the carriers for solid tumor therapy, since it mimics the
pathophysiological conditions of tumors in vivo.231-234
Chapter 4. Experimental Section
123
4.2 Experimental section
4.2.1 Cell culture conditions
NIH/3T3 mouse embryonic fibroblast cells were obtained from ATCC and
cultured in Dulbecco
10% Newborn Calf Serum (NCS) and 0.5% (v/v) Penicillin-Streptomycin. HeLa
with 10% Fetal Bovine Serum (FBS) and 0.5% (v/v) Penicillin-Streptomycin.
ted with 10% FBS and 0.5%
(v/v) Penicillin-Streptomycin.
For the experimental studies, cell cultures were prepared from deep-frozen
stock vials and seeded in 25 cm2 (HeLa and U87) or 75 cm2 (NIH/3T3) culture
bottles (Cellstar, Greigner bio-one). Cells were incubated under standard cell
culture conditions (37ºC, 5% CO2 and 95% humidity) and maintained until
sub-confluence was reached (70-80%).
4.2.2 Generation of fibroblasts growth curves
To determine the optimal seeding density for cell culture and sub-culture, the
growth profile of NIH/3T3 fibroblasts was determined. Cells in 75 cm2 culture
bottles were trypsinized, counted with a hemocytometer, and seeded in
24-well plates (1.9 cm2/well) at two different seeding densities (2.6×10³ and
5.3×10³ cells/cm2). Cells were allowed to attach overnight and the cell culture
medium was renovated every 2 days. The cell density in each well was
determined using the MTT colorimetric assay and a calibration curve during a
total period of 8 days. The calibration curve was also obtained using the MTT
colorimetric assay. For this, cells were trypsinized, counted and seeded at
increasing concentrations from 2.5×10³ to 1×10⁶ cells. On the following day,
0.2 mg/ml of MTT reagent were added to each well and incubated for 4 hours
at 37ºC. Then, the solution containing unreacted MTT was carefully removed
from each well. The remaining blue formazan crystals formed by living cells
were solubilized with 500 µL of isopropanol. The reaction was
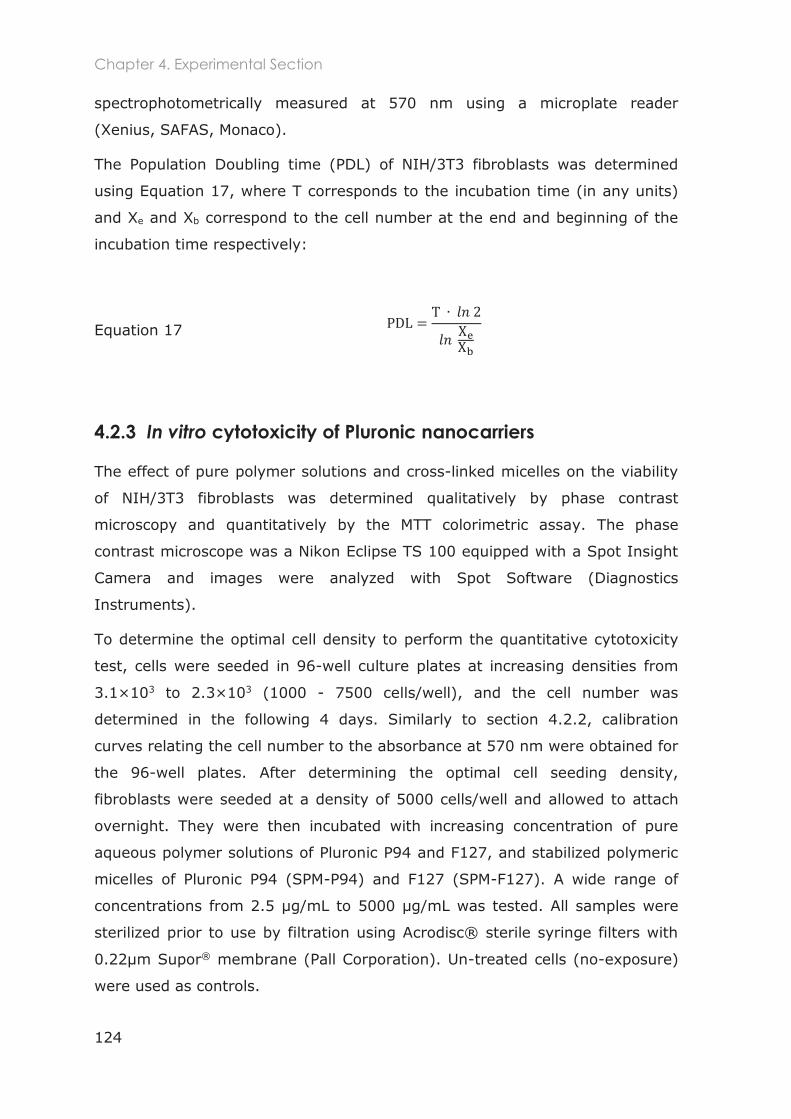
Chapter 4. Experimental Section
124
spectrophotometrically measured at 570 nm using a microplate reader
(Xenius, SAFAS, Monaco).
The Population Doubling time (PDL) of NIH/3T3 fibroblasts was determined
using Equation 17, where T corresponds to the incubation time (in any units)
and Xe and Xb correspond to the cell number at the end and beginning of the
incubation time respectively:
Equation 17
4.2.3 In vitro cytotoxicity of Pluronic nanocarriers
The effect of pure polymer solutions and cross-linked micelles on the viability
of NIH/3T3 fibroblasts was determined qualitatively by phase contrast
microscopy and quantitatively by the MTT colorimetric assay. The phase
contrast microscope was a Nikon Eclipse TS 100 equipped with a Spot Insight
Camera and images were analyzed with Spot Software (Diagnostics
Instruments).
To determine the optimal cell density to perform the quantitative cytotoxicity
test, cells were seeded in 96-well culture plates at increasing densities from
3.1×10³ to 2.3×10³ (1000 - 7500 cells/well), and the cell number was
determined in the following 4 days. Similarly to section 4.2.2, calibration
curves relating the cell number to the absorbance at 570 nm were obtained for
the 96-well plates. After determining the optimal cell seeding density,
fibroblasts were seeded at a density of 5000 cells/well and allowed to attach
overnight. They were then incubated with increasing concentration of pure
aqueous polymer solutions of Pluronic P94 and F127, and stabilized polymeric
micelles of Pluronic P94 (SPM-P94) and F127 (SPM-F127). A wide range of
concentrations from 2.5 µg/mL to 5000 µg/mL was tested. All samples were
sterilized prior to use by filtration using Acrodisc® sterile syringe filters with
0.22µm Supor® membrane (Pall Corporation). Un-treated cells (no-exposure)
were used as controls.
Chapter 4. Experimental Section
125
After the exposure period (24 or 48 hours), the medium was removed and
100 µL of DMEM (without phenol red and serum) with 0.2 mg/ml of MTT
reagent were added to each well and incubated for 4 hours at 37ºC. After the
incubation period with the MTT reagent, the medium was carefully removed,
100 µL of isopropanol were added to each well and the absorbance was
measured at 570 nm. Cell viability was determined using Equation 18:
Equation 18
Results are expressed as the mean viability percentage ± standard error
mean. Experiments were performed in quadriplicate. The statistical analysis of
the results was carried out by one-way ANOVA (*p<0.05, **p<0.001) using
Origin 9 software.
4.2.4 Internalization of Nile Red-loaded stabilized Pluronic
micelles and co-localization with the mitochondria
Cells were seeded at a density of 2×10⁴ cells/cm2 in 12 mm coverslips placed
in a 24-well plate and cells were allowed to attach overnight. Then, Nile Red-
loaded stabilized micelles of either Pluronic P94 or F127 were added at a
concentration of 0.025% (w/v) in 500 µL of complete cell culture medium. The
cells were incubated with the stabilized micelles for different periods (30 min
and 1, 2 and 4h). After the incubation period, cells were washed once with
DMEM without phenol red. Then, cells were fixed with pre-warmed 3.7%
formaldehyde in PBS for 10 min. Cells were washed again with PBS followed
by incubation with 2 µg/mL of Hoescht 33342 solution in PBS for 15 min at
room temperature. Then, the cells were washed three times with PBS and
mounted with aqueous mounting medium.
For cell imaging, we used an inverted TE 2000 microscope (Nikon, Japan),
equipped with a 60x Water Immersion 1.2 NA Plan Apo DIC objective. We
performed confocal laser scanning imaging (Nikon C1 scanhead), and images
were captured using EZ-C1 software (Nikon, version 3.50). All confocal images
were taken with a unique set of the following parameters: laser power
Chapter 4. Experimental Section
126
(one specific power for each of the excitation wavelength mentioned above),
PMT amplification (one specific gain for each of the two emission wavelength
ranges mentioned above), pinhole size, pixel dwell, image size and number of
pixels per image. Therefore, qualitative comparison in terms of fluorescence
emission intensity between images could be performed throughout the whole
study.
To determine the co-localization of Nile Red-loaded stabilized micelles with the
mitochondria, we used a green-fluorescent mitochondrial stain (MitoTracker®
Green FM, Life Technologies). After incubation with each of the stabilized
micelles for 4 h, cells were further incubated for 30 min at 37ºC with a 100 nM
solution of MitoTracker® in complete DMEM. Then, cells were fixed and imaged
as previously described.
4.2.5 Internalization and intracellular localization of FITC-
labelled nanocarriers and co-localization with the lysosomes
For the internalization experiments, 1×10⁵ of HeLa or U87 cells were seeded
on 20×20 mm borosilicate glass slides placed inside 6-well plates (Corning)
and cells were allowed to attach overnight. Then, FITC-labelled unimers and
stabilized micelles of either Pluronic P94 or F127 were added at a
concentration of 250 µg/mL in 2 mL of cell culture medium. After 4 h
incubation, the lysosomes were labelled with a 50nM solution of LysoTracker®
Red DND-99 in complete cell culture medium for 45 min at 37oC. Then, cells
were washed twice with PBS and fixed with 3.7% formaldehyde in PBS for
15 min. Cells were washed again thrice with PBS and mounted with DAPI
Vectashield (Vector Laboratories) for confocal microscopy. Images were
captured with a Carl Zeiss LSM710 microscope using a Fluar 40x/1.30 Oil M27
objective and were superimposed to determine the co-localization of the
nanocarriers with the lysosomes. Experiments were performed in triplicate.
4.2.6 Cellular uptake and exocytosis
HeLa cells were seeded in 96-StripwellTM plates (TC treated, flat bottom) at a
density of 5000 cells/well and allowed to attach overnight. Then, cells were
incubated with 111In radiolabeled compounds at a concentration of 25 µg/mL.
Chapter 4. Experimental Section
127
For the exocytosis experiments, cells were incubated with the radiolabeled
samples for 24 h. After this period, the medium containing the samples was
removed, the wells cleaned twice with PBS, and new medium was added to
each well.
At different time points, the wells were stripped, the medium was removed
from each well, and the wells containing the HeLa cells attached were rinsed
twice with PBS. The activity in the medium and the cleaning PBS (activity not
internalized), and in the wells (activity internalized by the cells) was counted
through gamma-scintillation counting (2480 Wizard2 Automatic Gamma
Counter, Perkin Elmer).
4.2.7 Clonogenic assay
The clonogenic potential of Pluronic P94 was determined by the colony-forming
assay to evaluate the ability of single cells to replicate and form colonies
(>50 cells). Diluted HeLa cell suspensions were plated in 6-well plates at a
density of 1000 cells/well in 2 mL of culture medium. Cells were allowed to
attached overnight and, on the following day, 0.1, 1 and 10 MBq of
P94-DTPA-111In were added to each well (200 µL of sample + 1.8 mL of cell
culture medium). PBS, non-radioactive P94-DTPA and 0.1, 1 and 10 MBq of
DTPA-111In (free chelator) were used as controls. The samples P94-DTPA-111In
and P94-DTPA were added to a final concentration of 25 µg/mL of modified
polymer, and a concentration of DTPA-111In of 5.77 M.
After incubation with the samples for 6 days, the cell medium was removed
and the formed cell colonies were washed with PBS. Then, they were fixed and
colored with coomassie blue solution for 5 min. The staining solution was
removed and the wells were rinsed under a slow streaming of demineralized
water. The wells were air dried and images of the wells and colonies were
acquired with optical microscopy.
4.2.8 Spheroids penetration and toxicity
Spheroids of HeLa and U87 cells were prepared using the agarose method.
Briefly, the wells of a 96-well plate (flat bottom) were coated with a heated
(60ºC) 1.5% agarose solution in complete DMEM (50 µL/well) to provide a
Chapter 4. Experimental Section
128
nonadhesive surface. The coating also provides a concave bottom which forces
cells to accumulate in the center of the well and increases cell-to-cell
interactions.
To the agarose-coated wells, 200µL of cells suspension containing 7500 U87
cells or 5000 HeLa cells was added per well. After 4 days, well-defined single
spheroids with approximately 500-600 µm in diameter were obtained and
further studies were conducted.
The morphology of the spheroids was analyzed by optical and confocal
microscopy (Carl Zeiss LSM710). The cell nuclei were labelled with 20 µg/mL
of Hoescht 33342 solution in complete cell culture medium during 1 h. To
observe the cell density in the spheroids, the confocal images of the nuclei
stain were analyzed by ImageJ software using the Shape Index Map.
The penetration of F127 unimers and SPM-F127 was evaluated by incubation
with the FITC-labelled carriers for different incubation times at a concentration
of 2500 µg/mL.
For confocal imaging, the tumor spheroids were collected, rinsed with PBS
twice, transferred to perfusion chambers (CoverWellTM, Grace Bio-Labs) and
then analyzed by confocal microscopy (Carl Zeiss LSM710) at a penetration
depth of 80-100 µm and a section thickness of 10 µm. Considering the
average size of the spheroids (500 µm), the confocal images correspond to a
cross section that does not intersect the center of the spheroids. All images
were acquired in the same conditions to allow a quantitative comparison of
fluorescence intensities. The penetration depth into the tumor spheroids was
measured using ImageJ software and the plugin Radial Profile Angle. A section
of the spheroids was selected and the radial fluorescence intensity profiles
were obtained.
The toxicity of P94 unimers and SPM-P94 micelles in the tumor spheroids was
evaluated by incubating the spheroids with toxic concentrations of the samples
(2500 µg/mL) (see Chapter 4 section 4.3.1.2). Growth inhibition was
monitored by measuring the size of the U87 tumor spheroids by optical
microscopy. Images of the spheroids were acquired and the spheroid volume
was calculated using the formula: . Experiments were performed
in quadruplicate.
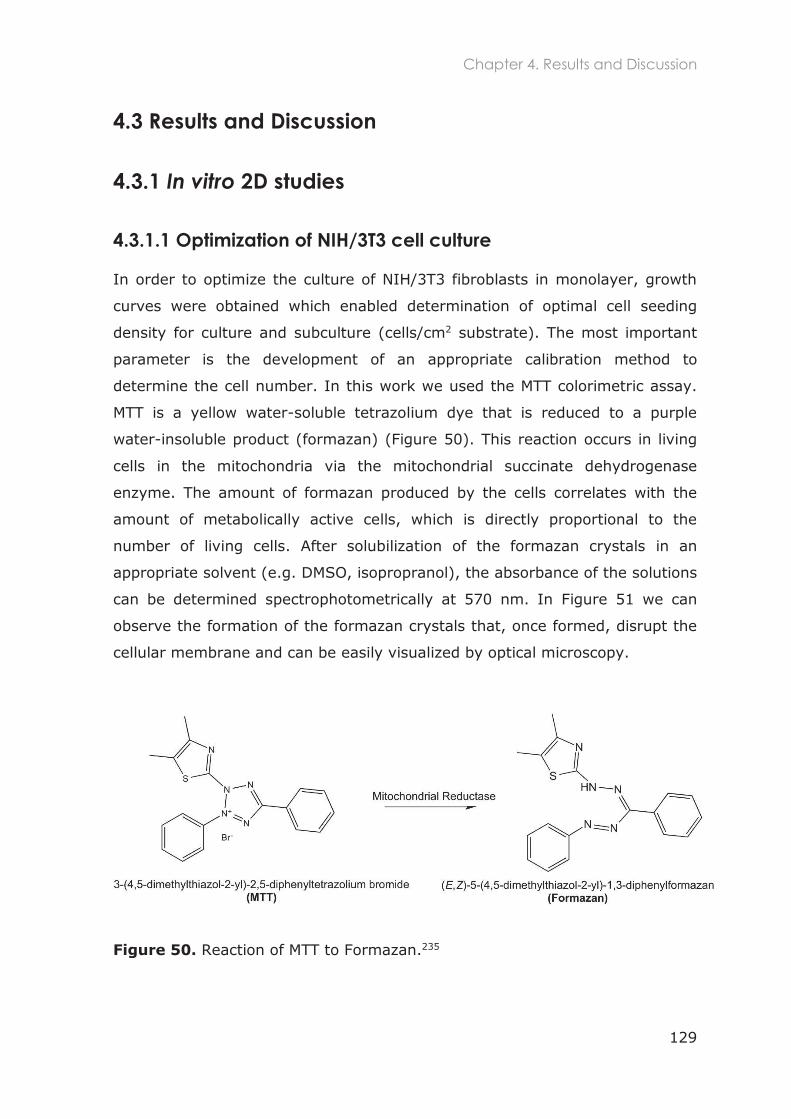
Chapter 4. Results and Discussion
129
4.3 Results and Discussion
4.3.1 In vitro 2D studies
4.3.1.1 Optimization of NIH/3T3 cell culture
In order to optimize the culture of NIH/3T3 fibroblasts in monolayer, growth
curves were obtained which enabled determination of optimal cell seeding
density for culture and subculture (cells/cm2 substrate). The most important
parameter is the development of an appropriate calibration method to
determine the cell number. In this work we used the MTT colorimetric assay.
MTT is a yellow water-soluble tetrazolium dye that is reduced to a purple
water-insoluble product (formazan) (Figure 50). This reaction occurs in living
cells in the mitochondria via the mitochondrial succinate dehydrogenase
enzyme. The amount of formazan produced by the cells correlates with the
amount of metabolically active cells, which is directly proportional to the
number of living cells. After solubilization of the formazan crystals in an
appropriate solvent (e.g. DMSO, isopropranol), the absorbance of the solutions
can be determined spectrophotometrically at 570 nm. In Figure 51 we can
observe the formation of the formazan crystals that, once formed, disrupt the
cellular membrane and can be easily visualized by optical microscopy.
Figure 50. Reaction of MTT to Formazan.235
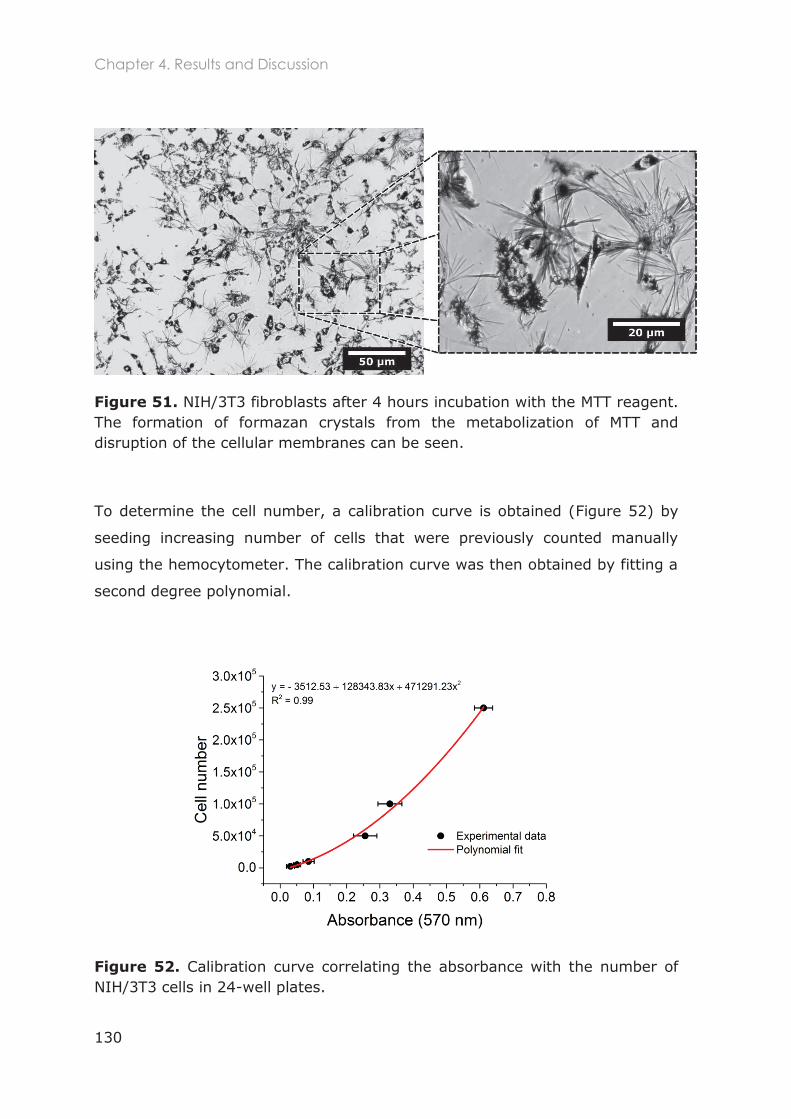
Chapter 4. Results and Discussion
130
Figure 51. NIH/3T3 fibroblasts after 4 hours incubation with the MTT reagent. The formation of formazan crystals from the metabolization of MTT and disruption of the cellular membranes can be seen.
To determine the cell number, a calibration curve is obtained (Figure 52) by
seeding increasing number of cells that were previously counted manually
using the hemocytometer. The calibration curve was then obtained by fitting a
second degree polynomial.
Figure 52. Calibration curve correlating the absorbance with the number of NIH/3T3 cells in 24-well plates.
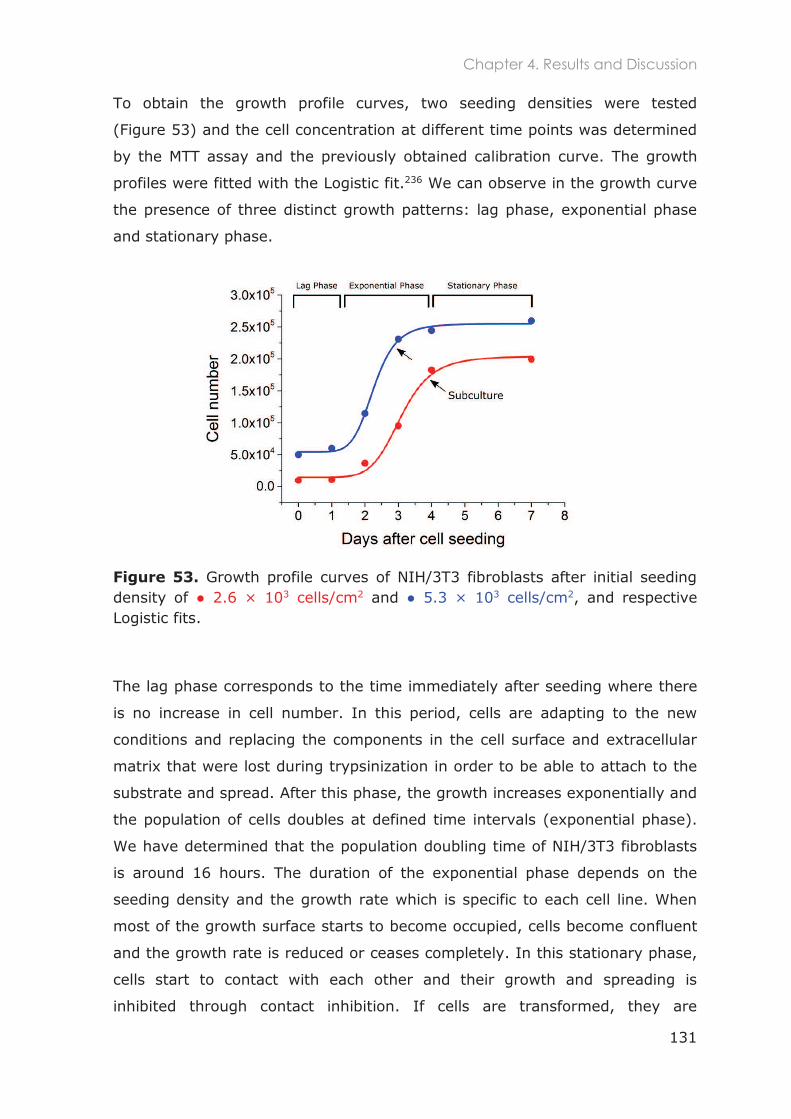
Chapter 4. Results and Discussion
131
To obtain the growth profile curves, two seeding densities were tested
(Figure 53) and the cell concentration at different time points was determined
by the MTT assay and the previously obtained calibration curve. The growth
profiles were fitted with the Logistic fit.236 We can observe in the growth curve
the presence of three distinct growth patterns: lag phase, exponential phase
and stationary phase.
Figure 53. Growth profile curves of NIH/3T3 fibroblasts after initial seeding density of 3 cells/cm2 and 3 cells/cm2, and respective Logistic fits.
The lag phase corresponds to the time immediately after seeding where there
is no increase in cell number. In this period, cells are adapting to the new
conditions and replacing the components in the cell surface and extracellular
matrix that were lost during trypsinization in order to be able to attach to the
substrate and spread. After this phase, the growth increases exponentially and
the population of cells doubles at defined time intervals (exponential phase).
We have determined that the population doubling time of NIH/3T3 fibroblasts
is around 16 hours. The duration of the exponential phase depends on the
seeding density and the growth rate which is specific to each cell line. When
most of the growth surface starts to become occupied, cells become confluent
and the growth rate is reduced or ceases completely. In this stationary phase,
cells start to contact with each other and their growth and spreading is
inhibited through contact inhibition. If cells are transformed, they are
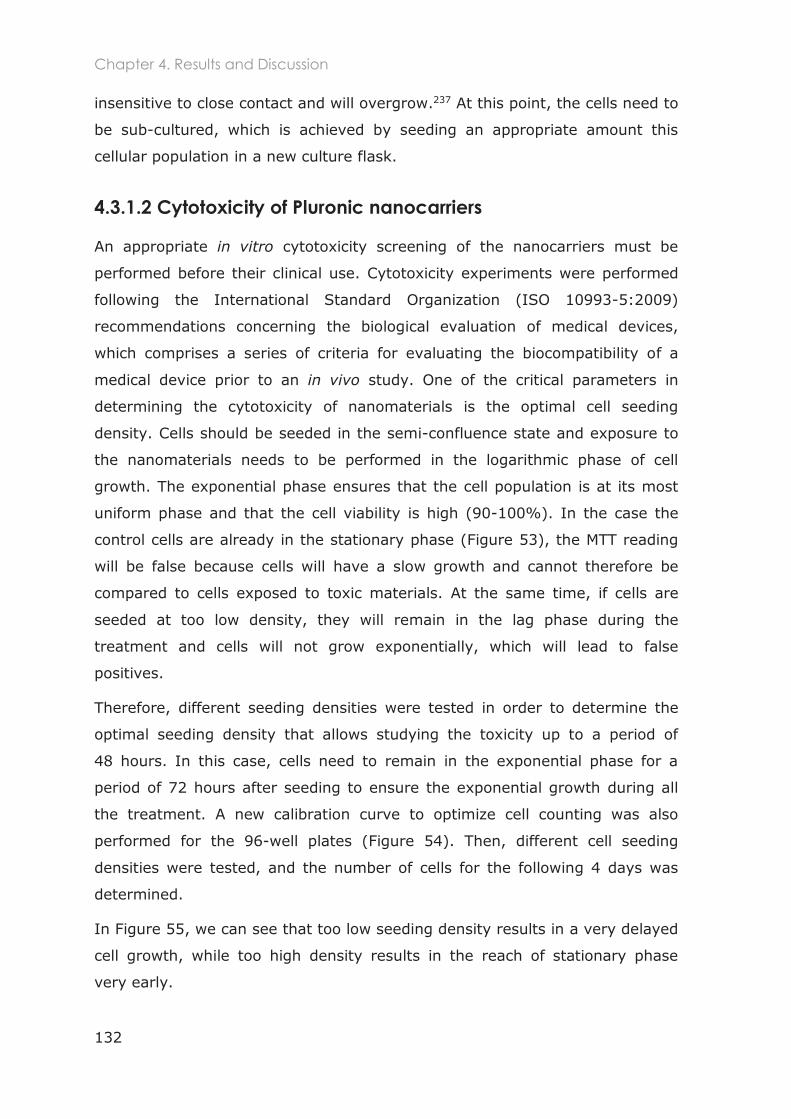
Chapter 4. Results and Discussion
132
insensitive to close contact and will overgrow.237 At this point, the cells need to
be sub-cultured, which is achieved by seeding an appropriate amount this
cellular population in a new culture flask.
4.3.1.2 Cytotoxicity of Pluronic nanocarriers
An appropriate in vitro cytotoxicity screening of the nanocarriers must be
performed before their clinical use. Cytotoxicity experiments were performed
following the International Standard Organization (ISO 10993-5:2009)
recommendations concerning the biological evaluation of medical devices,
which comprises a series of criteria for evaluating the biocompatibility of a
medical device prior to an in vivo study. One of the critical parameters in
determining the cytotoxicity of nanomaterials is the optimal cell seeding
density. Cells should be seeded in the semi-confluence state and exposure to
the nanomaterials needs to be performed in the logarithmic phase of cell
growth. The exponential phase ensures that the cell population is at its most
uniform phase and that the cell viability is high (90-100%). In the case the
control cells are already in the stationary phase (Figure 53), the MTT reading
will be false because cells will have a slow growth and cannot therefore be
compared to cells exposed to toxic materials. At the same time, if cells are
seeded at too low density, they will remain in the lag phase during the
treatment and cells will not grow exponentially, which will lead to false
positives.
Therefore, different seeding densities were tested in order to determine the
optimal seeding density that allows studying the toxicity up to a period of
48 hours. In this case, cells need to remain in the exponential phase for a
period of 72 hours after seeding to ensure the exponential growth during all
the treatment. A new calibration curve to optimize cell counting was also
performed for the 96-well plates (Figure 54). Then, different cell seeding
densities were tested, and the number of cells for the following 4 days was
determined.
In Figure 55, we can see that too low seeding density results in a very delayed
cell growth, while too high density results in the reach of stationary phase
very early.
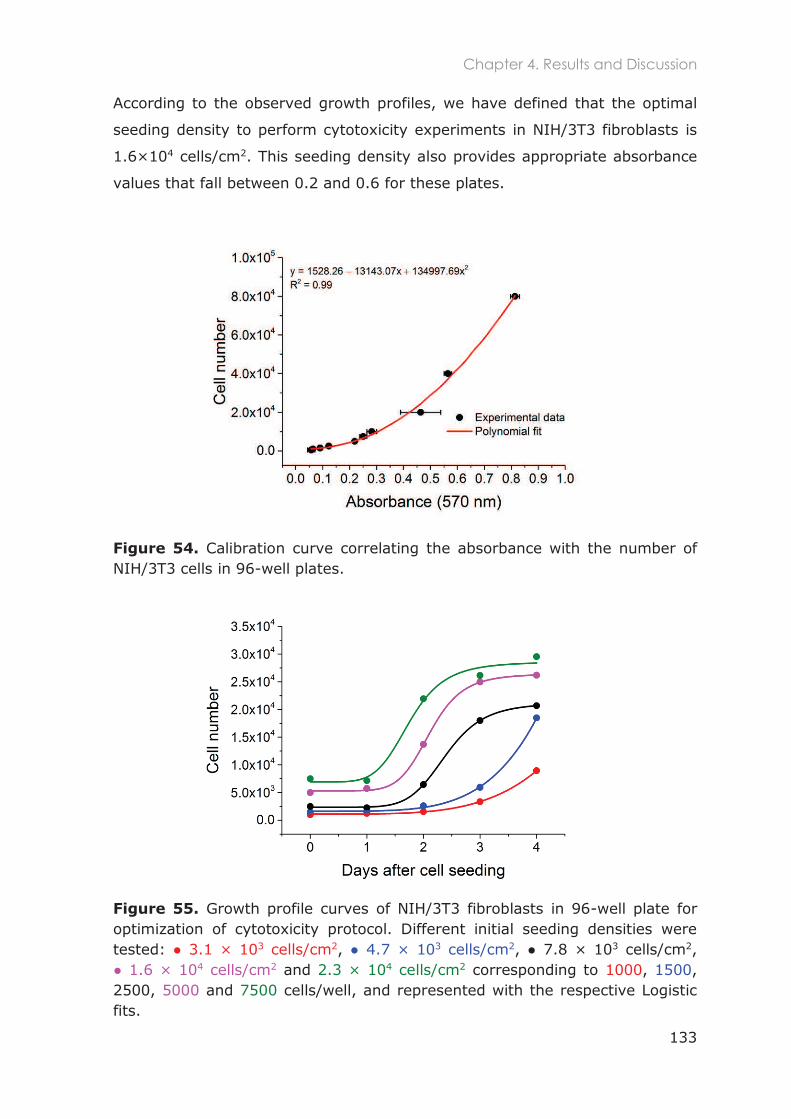
Chapter 4. Results and Discussion
133
According to the observed growth profiles, we have defined that the optimal
seeding density to perform cytotoxicity experiments in NIH/3T3 fibroblasts is
1.6×10⁴ cells/cm2. This seeding density also provides appropriate absorbance
values that fall between 0.2 and 0.6 for these plates.
Figure 54. Calibration curve correlating the absorbance with the number of NIH/3T3 cells in 96-well plates.
Figure 55. Growth profile curves of NIH/3T3 fibroblasts in 96-well plate for optimization of cytotoxicity protocol. Different initial seeding densities were tested: 3.1 × 10³ cells/cm2, 4.7 × 10³ cells/cm2 .8 × 103 cells/cm2,
4 cells/cm2 and 2.3 × 10⁴ cells/cm2 corresponding to 1000, 1500, 2500, 5000 and 7500 cells/well, and represented with the respective Logistic fits.
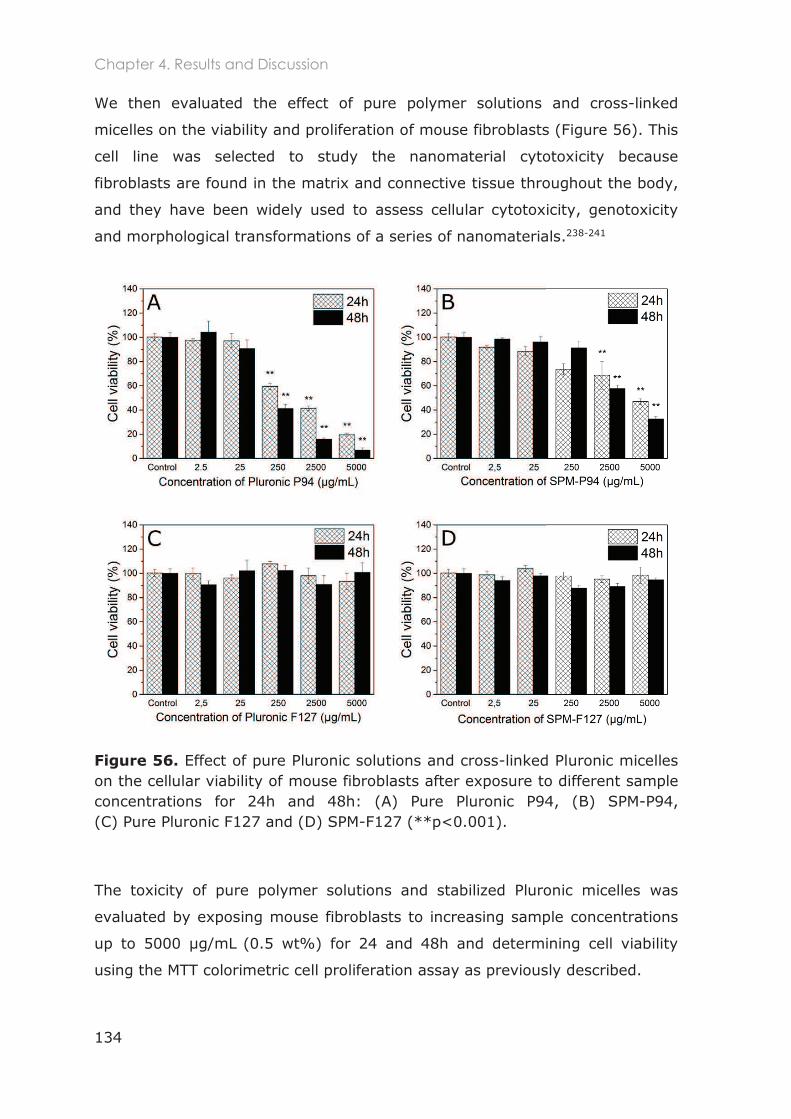
Chapter 4. Results and Discussion
134
We then evaluated the effect of pure polymer solutions and cross-linked
micelles on the viability and proliferation of mouse fibroblasts (Figure 56). This
cell line was selected to study the nanomaterial cytotoxicity because
fibroblasts are found in the matrix and connective tissue throughout the body,
and they have been widely used to assess cellular cytotoxicity, genotoxicity
and morphological transformations of a series of nanomaterials.238-241
Figure 56. Effect of pure Pluronic solutions and cross-linked Pluronic micelles on the cellular viability of mouse fibroblasts after exposure to different sample concentrations for 24h and 48h: (A) Pure Pluronic P94, (B) SPM-P94, (C) Pure Pluronic F127 and (D) SPM-F127 (**p<0.001).
The toxicity of pure polymer solutions and stabilized Pluronic micelles was
evaluated by exposing mouse fibroblasts to increasing sample concentrations
up to 5000 µg/mL (0.5 wt%) for 24 and 48h and determining cell viability
using the MTT colorimetric cell proliferation assay as previously described.
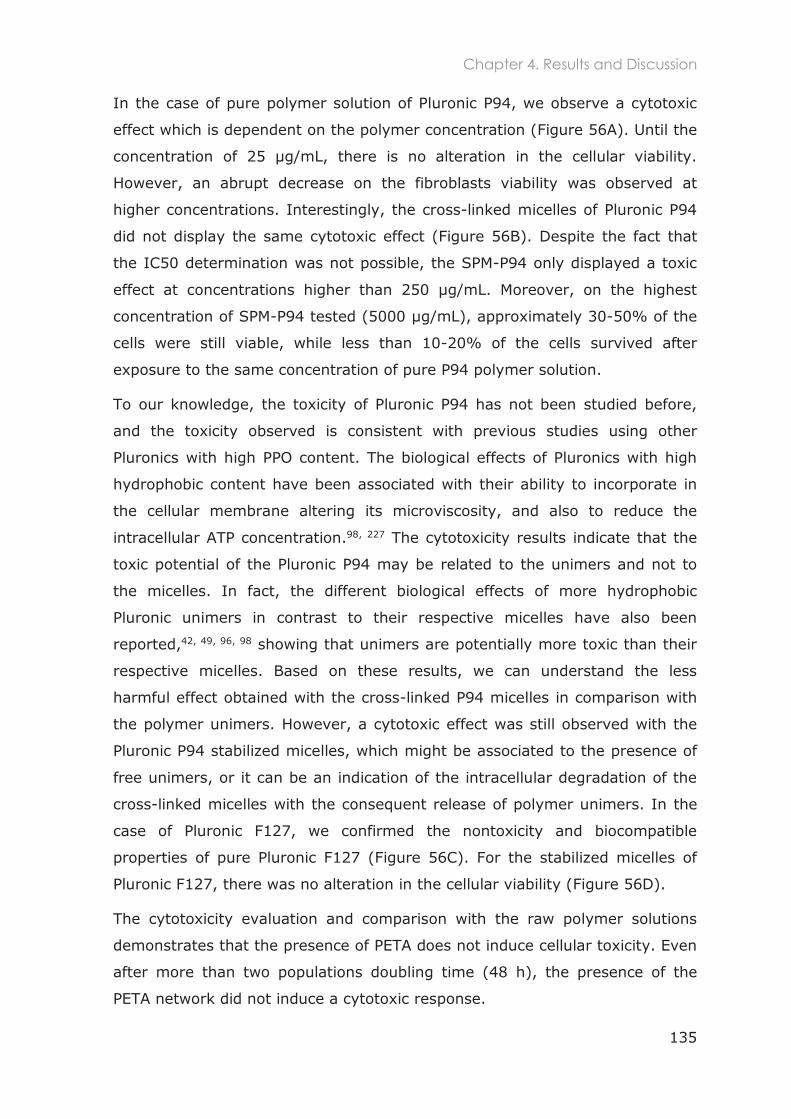
Chapter 4. Results and Discussion
135
In the case of pure polymer solution of Pluronic P94, we observe a cytotoxic
effect which is dependent on the polymer concentration (Figure 56A). Until the
concentration of 25 µg/mL, there is no alteration in the cellular viability.
However, an abrupt decrease on the fibroblasts viability was observed at
higher concentrations. Interestingly, the cross-linked micelles of Pluronic P94
did not display the same cytotoxic effect (Figure 56B). Despite the fact that
the IC50 determination was not possible, the SPM-P94 only displayed a toxic
effect at concentrations higher than 250 µg/mL. Moreover, on the highest
concentration of SPM-P94 tested (5000 µg/mL), approximately 30-50% of the
cells were still viable, while less than 10-20% of the cells survived after
exposure to the same concentration of pure P94 polymer solution.
To our knowledge, the toxicity of Pluronic P94 has not been studied before,
and the toxicity observed is consistent with previous studies using other
Pluronics with high PPO content. The biological effects of Pluronics with high
hydrophobic content have been associated with their ability to incorporate in
the cellular membrane altering its microviscosity, and also to reduce the
intracellular ATP concentration.98, 227 The cytotoxicity results indicate that the
toxic potential of the Pluronic P94 may be related to the unimers and not to
the micelles. In fact, the different biological effects of more hydrophobic
Pluronic unimers in contrast to their respective micelles have also been
reported,42, 49, 96, 98 showing that unimers are potentially more toxic than their
respective micelles. Based on these results, we can understand the less
harmful effect obtained with the cross-linked P94 micelles in comparison with
the polymer unimers. However, a cytotoxic effect was still observed with the
Pluronic P94 stabilized micelles, which might be associated to the presence of
free unimers, or it can be an indication of the intracellular degradation of the
cross-linked micelles with the consequent release of polymer unimers. In the
case of Pluronic F127, we confirmed the nontoxicity and biocompatible
properties of pure Pluronic F127 (Figure 56C). For the stabilized micelles of
Pluronic F127, there was no alteration in the cellular viability (Figure 56D).
The cytotoxicity evaluation and comparison with the raw polymer solutions
demonstrates that the presence of PETA does not induce cellular toxicity. Even
after more than two populations doubling time (48 h), the presence of the
PETA network did not induce a cytotoxic response.
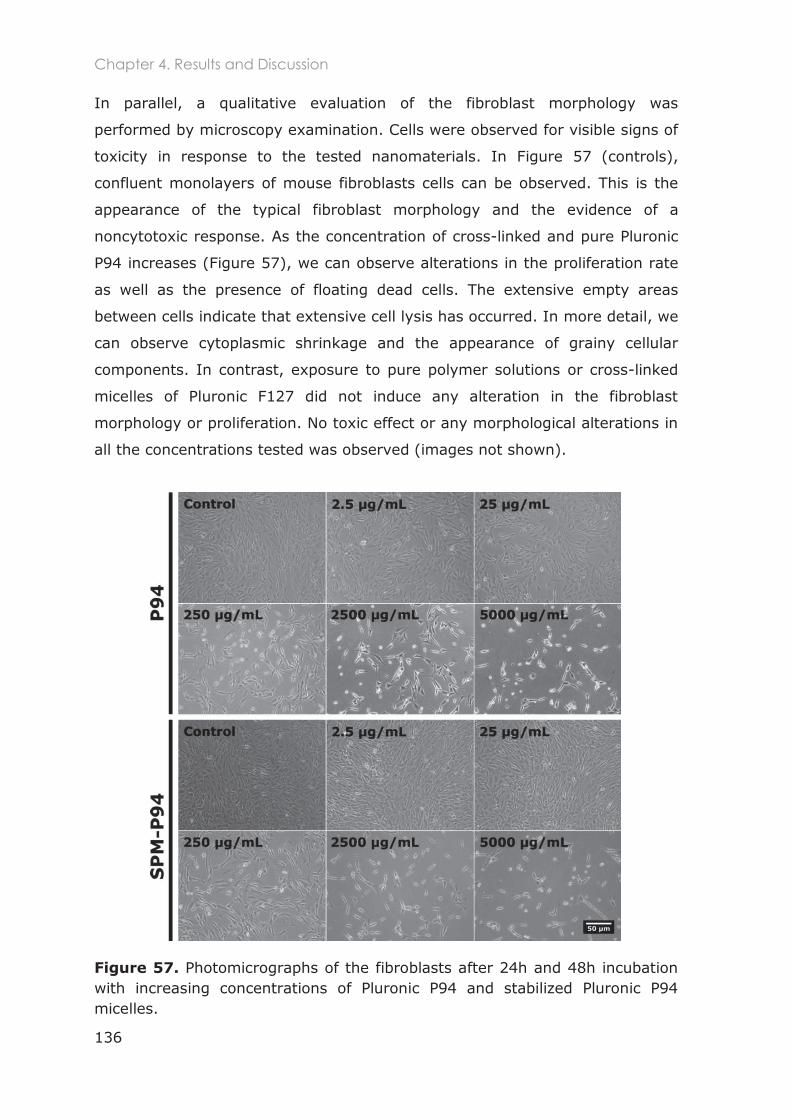
Chapter 4. Results and Discussion
136
In parallel, a qualitative evaluation of the fibroblast morphology was
performed by microscopy examination. Cells were observed for visible signs of
toxicity in response to the tested nanomaterials. In Figure 57 (controls),
confluent monolayers of mouse fibroblasts cells can be observed. This is the
appearance of the typical fibroblast morphology and the evidence of a
noncytotoxic response. As the concentration of cross-linked and pure Pluronic
P94 increases (Figure 57), we can observe alterations in the proliferation rate
as well as the presence of floating dead cells. The extensive empty areas
between cells indicate that extensive cell lysis has occurred. In more detail, we
can observe cytoplasmic shrinkage and the appearance of grainy cellular
components. In contrast, exposure to pure polymer solutions or cross-linked
micelles of Pluronic F127 did not induce any alteration in the fibroblast
morphology or proliferation. No toxic effect or any morphological alterations in
all the concentrations tested was observed (images not shown).
Figure 57. Photomicrographs of the fibroblasts after 24h and 48h incubation with increasing concentrations of Pluronic P94 and stabilized Pluronic P94 micelles.
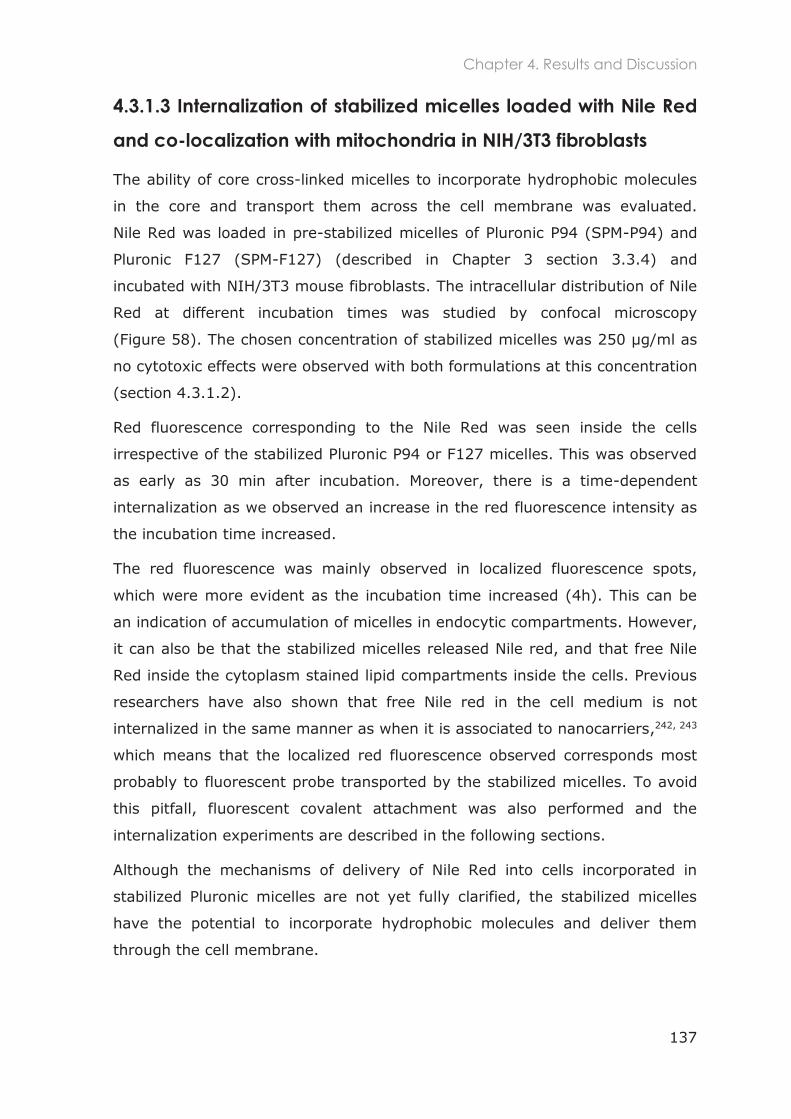
Chapter 4. Results and Discussion
137
4.3.1.3 Internalization of stabilized micelles loaded with Nile Red
and co-localization with mitochondria in NIH/3T3 fibroblasts
The ability of core cross-linked micelles to incorporate hydrophobic molecules
in the core and transport them across the cell membrane was evaluated.
Nile Red was loaded in pre-stabilized micelles of Pluronic P94 (SPM-P94) and
Pluronic F127 (SPM-F127) (described in Chapter 3 section 3.3.4) and
incubated with NIH/3T3 mouse fibroblasts. The intracellular distribution of Nile
Red at different incubation times was studied by confocal microscopy
(Figure 58). The chosen concentration of stabilized micelles was 250 µg/ml as
no cytotoxic effects were observed with both formulations at this concentration
(section 4.3.1.2).
Red fluorescence corresponding to the Nile Red was seen inside the cells
irrespective of the stabilized Pluronic P94 or F127 micelles. This was observed
as early as 30 min after incubation. Moreover, there is a time-dependent
internalization as we observed an increase in the red fluorescence intensity as
the incubation time increased.
The red fluorescence was mainly observed in localized fluorescence spots,
which were more evident as the incubation time increased (4h). This can be
an indication of accumulation of micelles in endocytic compartments. However,
it can also be that the stabilized micelles released Nile red, and that free Nile
Red inside the cytoplasm stained lipid compartments inside the cells. Previous
researchers have also shown that free Nile red in the cell medium is not
internalized in the same manner as when it is associated to nanocarriers,242, 243
which means that the localized red fluorescence observed corresponds most
probably to fluorescent probe transported by the stabilized micelles. To avoid
this pitfall, fluorescent covalent attachment was also performed and the
internalization experiments are described in the following sections.
Although the mechanisms of delivery of Nile Red into cells incorporated in
stabilized Pluronic micelles are not yet fully clarified, the stabilized micelles
have the potential to incorporate hydrophobic molecules and deliver them
through the cell membrane.
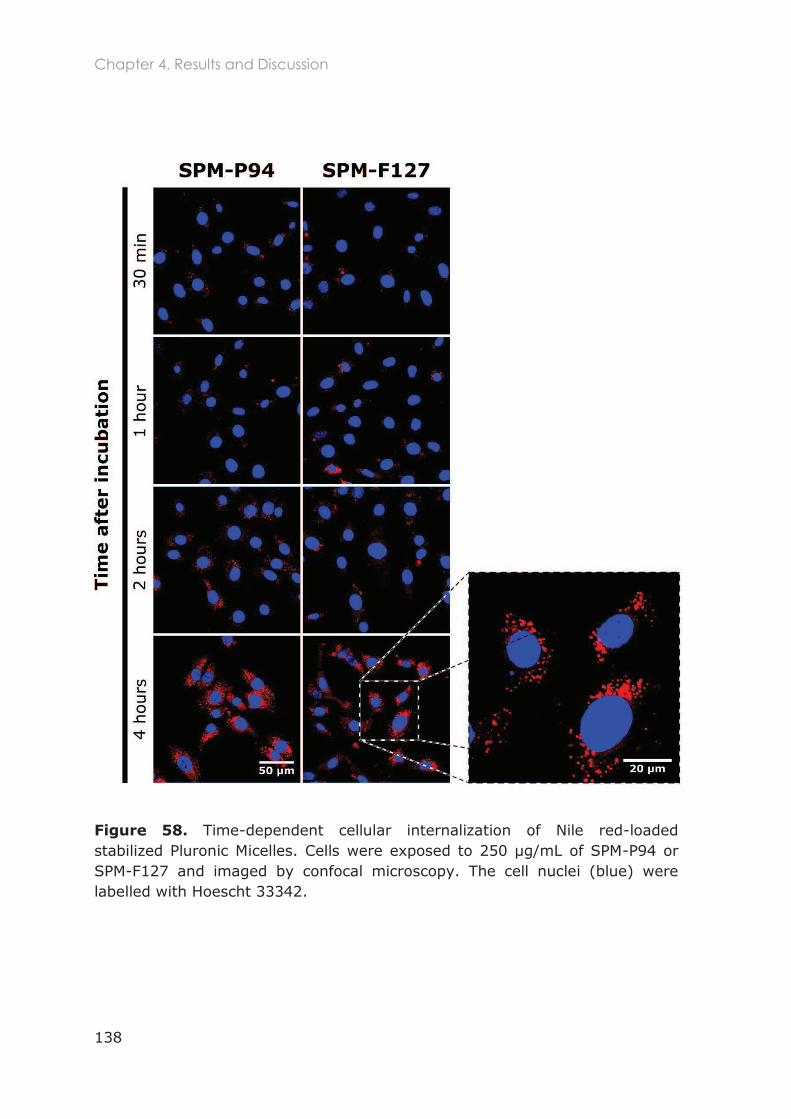
Chapter 4. Results and Discussion
138
Figure 58. Time-dependent cellular internalization of Nile red-loaded stabilized Pluronic Micelles. Cells were exposed to 250 µg/mL of SPM-P94 or SPM-F127 and imaged by confocal microscopy. The cell nuclei (blue) were labelled with Hoescht 33342.
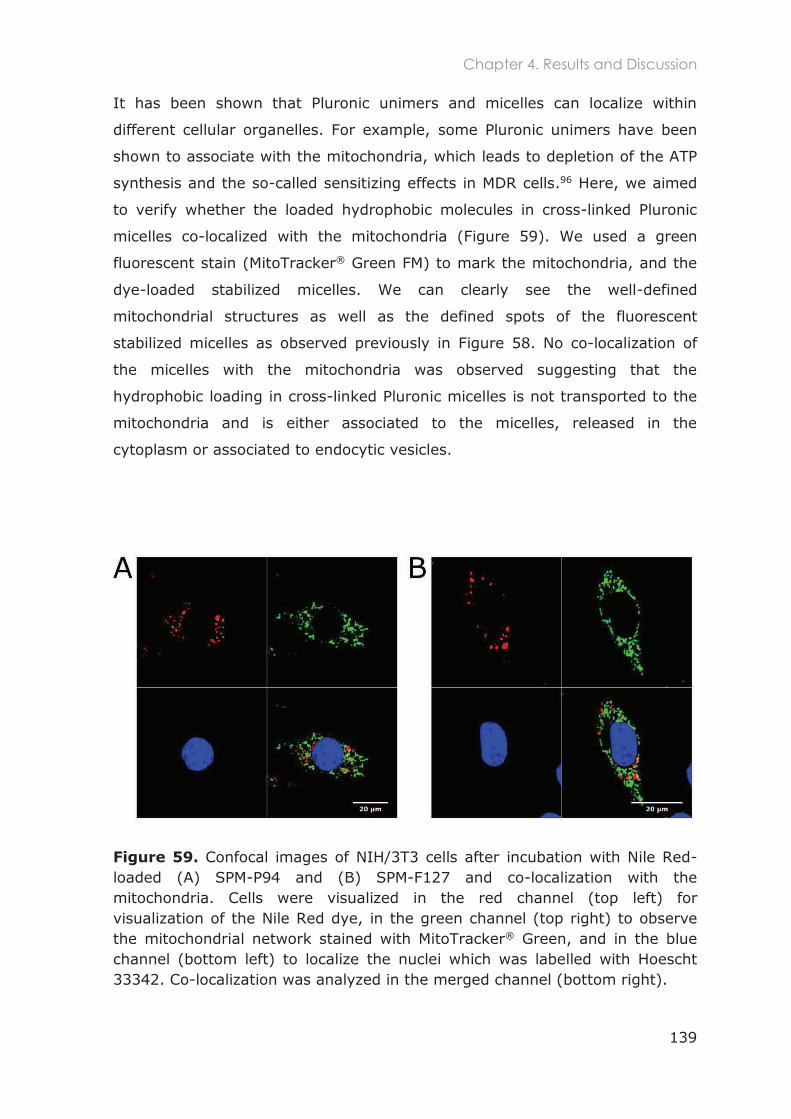
Chapter 4. Results and Discussion
139
It has been shown that Pluronic unimers and micelles can localize within
different cellular organelles. For example, some Pluronic unimers have been
shown to associate with the mitochondria, which leads to depletion of the ATP
synthesis and the so-called sensitizing effects in MDR cells.96 Here, we aimed
to verify whether the loaded hydrophobic molecules in cross-linked Pluronic
micelles co-localized with the mitochondria (Figure 59). We used a green
fluorescent stain (MitoTracker® Green FM) to mark the mitochondria, and the
dye-loaded stabilized micelles. We can clearly see the well-defined
mitochondrial structures as well as the defined spots of the fluorescent
stabilized micelles as observed previously in Figure 58. No co-localization of
the micelles with the mitochondria was observed suggesting that the
hydrophobic loading in cross-linked Pluronic micelles is not transported to the
mitochondria and is either associated to the micelles, released in the
cytoplasm or associated to endocytic vesicles.
Figure 59. Confocal images of NIH/3T3 cells after incubation with Nile Red-loaded (A) SPM-P94 and (B) SPM-F127 and co-localization with the mitochondria. Cells were visualized in the red channel (top left) for visualization of the Nile Red dye, in the green channel (top right) to observe the mitochondrial network stained with MitoTracker® Green, and in the blue channel (bottom left) to localize the nuclei which was labelled with Hoescht 33342. Co-localization was analyzed in the merged channel (bottom right).
Chapter 4. Results and Discussion
140
4.3.1.4 Internalization of FITC-labeled nanocarriers and co-
localization with lysosomes in HeLa and U87 cells
The internalization mechanisms and intracellular distribution in cervical cancer
HeLa and glioblastoma U87 cancer cells were investigated for both Pluronic
unimers and cross-linked micelles. Figure 60 and Figure 61 show the confocal
images of HeLa and U87 cells respectively after incubation with FITC-labelled
Pluronic unimers (F127 and P94) and cross-linked micelles (SPM-F127 and
SPM-P94). After 4 hours incubation, a strong green fluorescence was observed
intracellularly for all the nanocarriers studied showing that both Pluronic
unimers and stabilized micelles were internalized by both cell types.
Figure 60. Internalization and intracellular localization of FITC-labelled Pluronic unimers (F127 and P94) and cross-linked micelles (SPM-F127 and SPM-P94) after incubation with U87 cells for 4 hours at a concentration of 250 µg/mL. The lysosomes were marked with LysoTracker Red and the nuclei were stained with DAPI. Scale bar is 20µm.
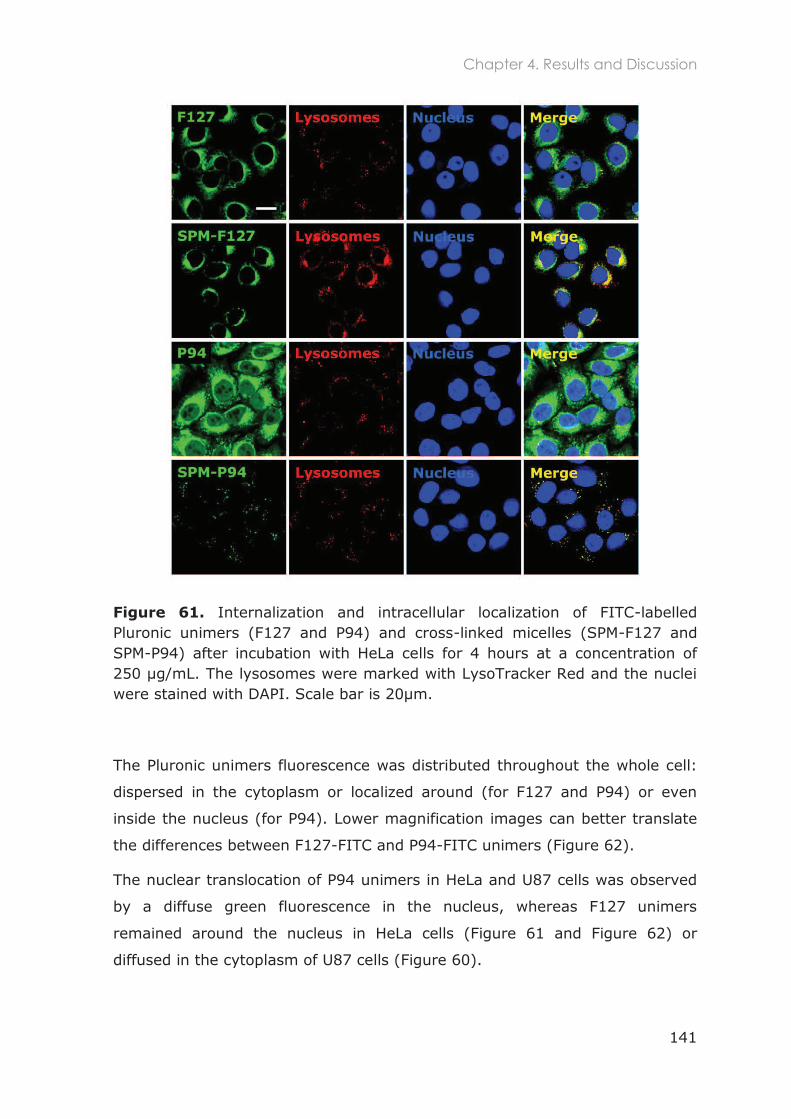
Chapter 4. Results and Discussion
141
Figure 61. Internalization and intracellular localization of FITC-labelled Pluronic unimers (F127 and P94) and cross-linked micelles (SPM-F127 and SPM-P94) after incubation with HeLa cells for 4 hours at a concentration of 250 µg/mL. The lysosomes were marked with LysoTracker Red and the nuclei were stained with DAPI. Scale bar is 20µm.
The Pluronic unimers fluorescence was distributed throughout the whole cell:
dispersed in the cytoplasm or localized around (for F127 and P94) or even
inside the nucleus (for P94). Lower magnification images can better translate
the differences between F127-FITC and P94-FITC unimers (Figure 62).
The nuclear translocation of P94 unimers in HeLa and U87 cells was observed
by a diffuse green fluorescence in the nucleus, whereas F127 unimers
remained around the nucleus in HeLa cells (Figure 61 and Figure 62) or
diffused in the cytoplasm of U87 cells (Figure 60).
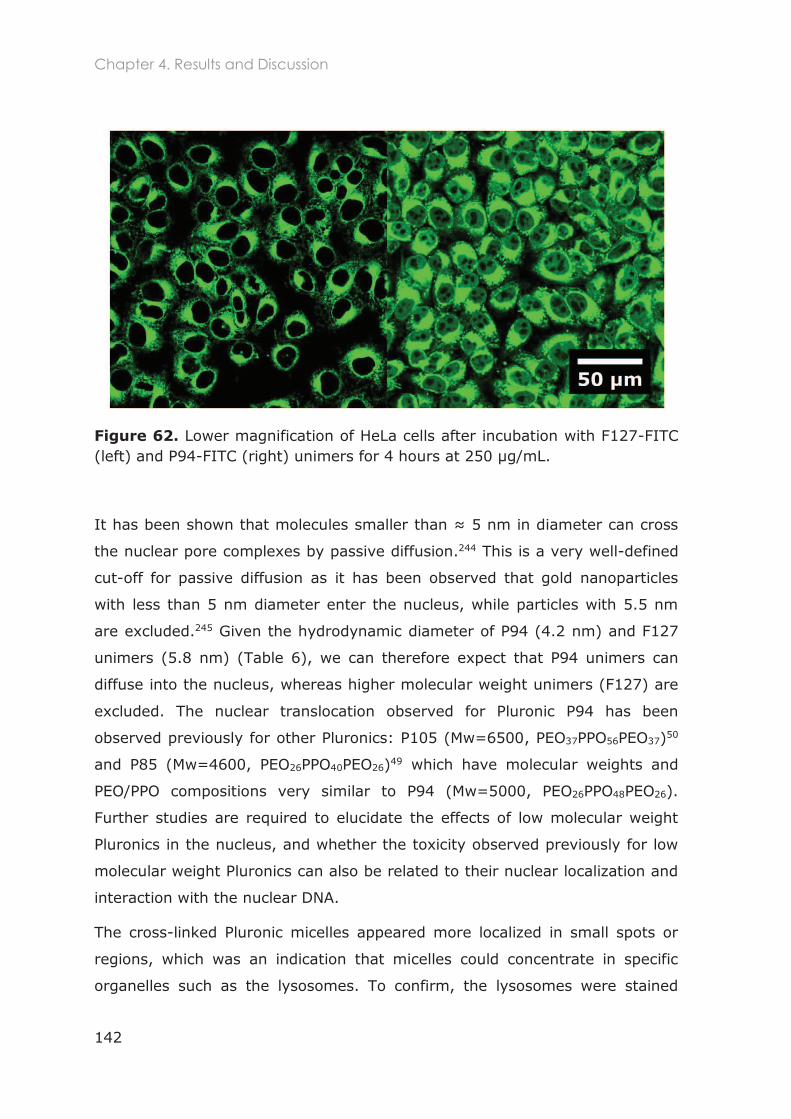
Chapter 4. Results and Discussion
142
Figure 62. Lower magnification of HeLa cells after incubation with F127-FITC (left) and P94-FITC (right) unimers for 4 hours at 250 µg/mL.
the nuclear pore complexes by passive diffusion.244 This is a very well-defined
cut-off for passive diffusion as it has been observed that gold nanoparticles
with less than 5 nm diameter enter the nucleus, while particles with 5.5 nm
are excluded.245 Given the hydrodynamic diameter of P94 (4.2 nm) and F127
unimers (5.8 nm) (Table 6), we can therefore expect that P94 unimers can
diffuse into the nucleus, whereas higher molecular weight unimers (F127) are
excluded. The nuclear translocation observed for Pluronic P94 has been
observed previously for other Pluronics: P105 (Mw=6500, PEO37PPO56PEO37)50
and P85 (Mw=4600, PEO26PPO40PEO26)49 which have molecular weights and
PEO/PPO compositions very similar to P94 (Mw=5000, PEO26PPO48PEO26).
Further studies are required to elucidate the effects of low molecular weight
Pluronics in the nucleus, and whether the toxicity observed previously for low
molecular weight Pluronics can also be related to their nuclear localization and
interaction with the nuclear DNA.
The cross-linked Pluronic micelles appeared more localized in small spots or
regions, which was an indication that micelles could concentrate in specific
organelles such as the lysosomes. To confirm, the lysosomes were stained
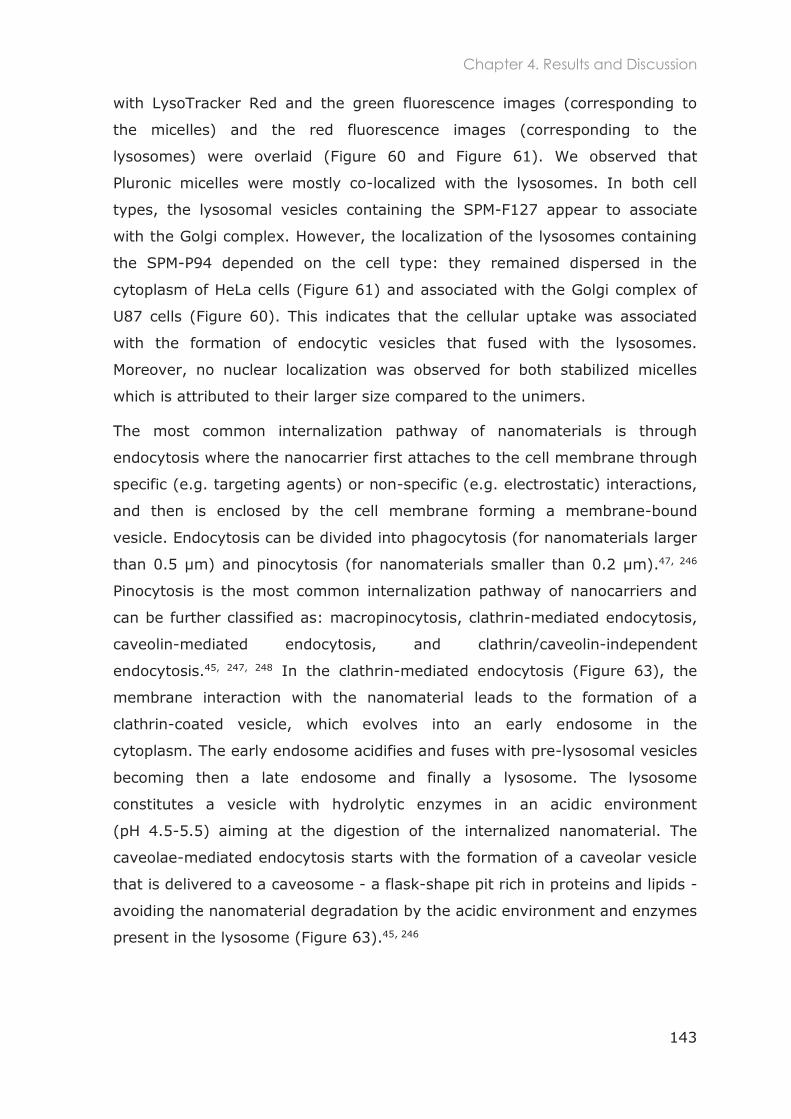
Chapter 4. Results and Discussion
143
with LysoTracker Red and the green fluorescence images (corresponding to
the micelles) and the red fluorescence images (corresponding to the
lysosomes) were overlaid (Figure 60 and Figure 61). We observed that
Pluronic micelles were mostly co-localized with the lysosomes. In both cell
types, the lysosomal vesicles containing the SPM-F127 appear to associate
with the Golgi complex. However, the localization of the lysosomes containing
the SPM-P94 depended on the cell type: they remained dispersed in the
cytoplasm of HeLa cells (Figure 61) and associated with the Golgi complex of
U87 cells (Figure 60). This indicates that the cellular uptake was associated
with the formation of endocytic vesicles that fused with the lysosomes.
Moreover, no nuclear localization was observed for both stabilized micelles
which is attributed to their larger size compared to the unimers.
The most common internalization pathway of nanomaterials is through
endocytosis where the nanocarrier first attaches to the cell membrane through
specific (e.g. targeting agents) or non-specific (e.g. electrostatic) interactions,
and then is enclosed by the cell membrane forming a membrane-bound
vesicle. Endocytosis can be divided into phagocytosis (for nanomaterials larger
than 0.5 µm) and pinocytosis (for nanomaterials smaller than 0.2 µm).47, 246
Pinocytosis is the most common internalization pathway of nanocarriers and
can be further classified as: macropinocytosis, clathrin-mediated endocytosis,
caveolin-mediated endocytosis, and clathrin/caveolin-independent
endocytosis.45, 247, 248 In the clathrin-mediated endocytosis (Figure 63), the
membrane interaction with the nanomaterial leads to the formation of a
clathrin-coated vesicle, which evolves into an early endosome in the
cytoplasm. The early endosome acidifies and fuses with pre-lysosomal vesicles
becoming then a late endosome and finally a lysosome. The lysosome
constitutes a vesicle with hydrolytic enzymes in an acidic environment
(pH 4.5-5.5) aiming at the digestion of the internalized nanomaterial. The
caveolae-mediated endocytosis starts with the formation of a caveolar vesicle
that is delivered to a caveosome - a flask-shape pit rich in proteins and lipids -
avoiding the nanomaterial degradation by the acidic environment and enzymes
present in the lysosome (Figure 63).45, 246
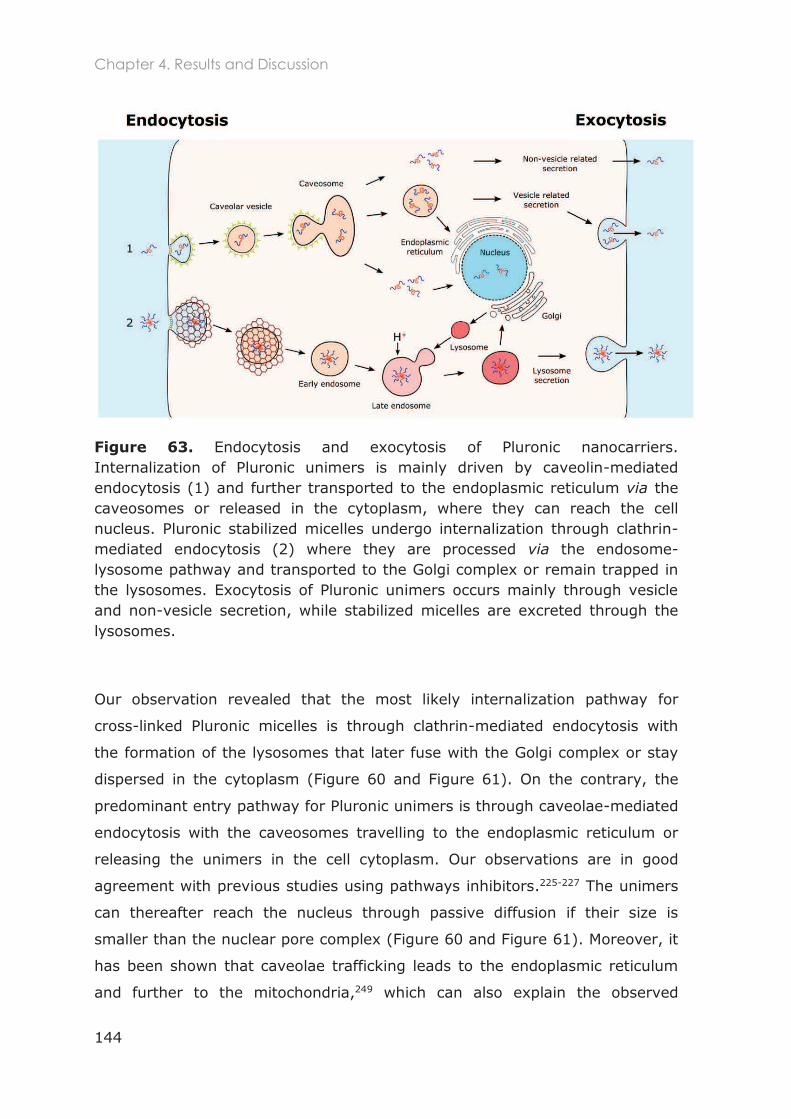
Chapter 4. Results and Discussion
144
Figure 63. Endocytosis and exocytosis of Pluronic nanocarriers. Internalization of Pluronic unimers is mainly driven by caveolin-mediated endocytosis (1) and further transported to the endoplasmic reticulum via the caveosomes or released in the cytoplasm, where they can reach the cell nucleus. Pluronic stabilized micelles undergo internalization through clathrin-mediated endocytosis (2) where they are processed via the endosome-lysosome pathway and transported to the Golgi complex or remain trapped in the lysosomes. Exocytosis of Pluronic unimers occurs mainly through vesicle and non-vesicle secretion, while stabilized micelles are excreted through the lysosomes.
Our observation revealed that the most likely internalization pathway for
cross-linked Pluronic micelles is through clathrin-mediated endocytosis with
the formation of the lysosomes that later fuse with the Golgi complex or stay
dispersed in the cytoplasm (Figure 60 and Figure 61). On the contrary, the
predominant entry pathway for Pluronic unimers is through caveolae-mediated
endocytosis with the caveosomes travelling to the endoplasmic reticulum or
releasing the unimers in the cell cytoplasm. Our observations are in good
agreement with previous studies using pathways inhibitors.225-227 The unimers
can thereafter reach the nucleus through passive diffusion if their size is
smaller than the nuclear pore complex (Figure 60 and Figure 61). Moreover, it
has been shown that caveolae trafficking leads to the endoplasmic reticulum
and further to the mitochondria,249 which can also explain the observed
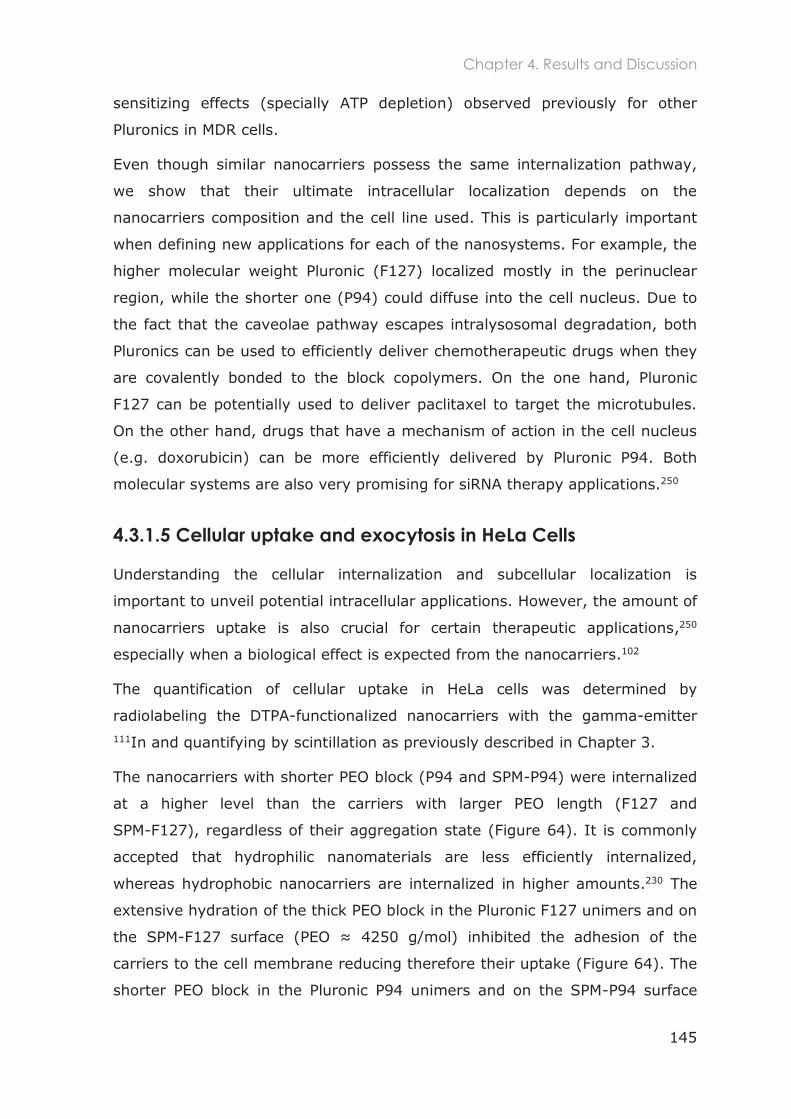
Chapter 4. Results and Discussion
145
sensitizing effects (specially ATP depletion) observed previously for other
Pluronics in MDR cells.
Even though similar nanocarriers possess the same internalization pathway,
we show that their ultimate intracellular localization depends on the
nanocarriers composition and the cell line used. This is particularly important
when defining new applications for each of the nanosystems. For example, the
higher molecular weight Pluronic (F127) localized mostly in the perinuclear
region, while the shorter one (P94) could diffuse into the cell nucleus. Due to
the fact that the caveolae pathway escapes intralysosomal degradation, both
Pluronics can be used to efficiently deliver chemotherapeutic drugs when they
are covalently bonded to the block copolymers. On the one hand, Pluronic
F127 can be potentially used to deliver paclitaxel to target the microtubules.
On the other hand, drugs that have a mechanism of action in the cell nucleus
(e.g. doxorubicin) can be more efficiently delivered by Pluronic P94. Both
molecular systems are also very promising for siRNA therapy applications.250
4.3.1.5 Cellular uptake and exocytosis in HeLa Cells
Understanding the cellular internalization and subcellular localization is
important to unveil potential intracellular applications. However, the amount of
nanocarriers uptake is also crucial for certain therapeutic applications,250
especially when a biological effect is expected from the nanocarriers.102
The quantification of cellular uptake in HeLa cells was determined by
radiolabeling the DTPA-functionalized nanocarriers with the gamma-emitter 111In and quantifying by scintillation as previously described in Chapter 3.
The nanocarriers with shorter PEO block (P94 and SPM-P94) were internalized
at a higher level than the carriers with larger PEO length (F127 and
SPM-F127), regardless of their aggregation state (Figure 64). It is commonly
accepted that hydrophilic nanomaterials are less efficiently internalized,
whereas hydrophobic nanocarriers are internalized in higher amounts.230 The
extensive hydration of the thick PEO block in the Pluronic F127 unimers and on
the SPM- 4250 g/mol) inhibited the adhesion of the
carriers to the cell membrane reducing therefore their uptake (Figure 64). The
shorter PEO block in the Pluronic P94 unimers and on the SPM-P94 surface
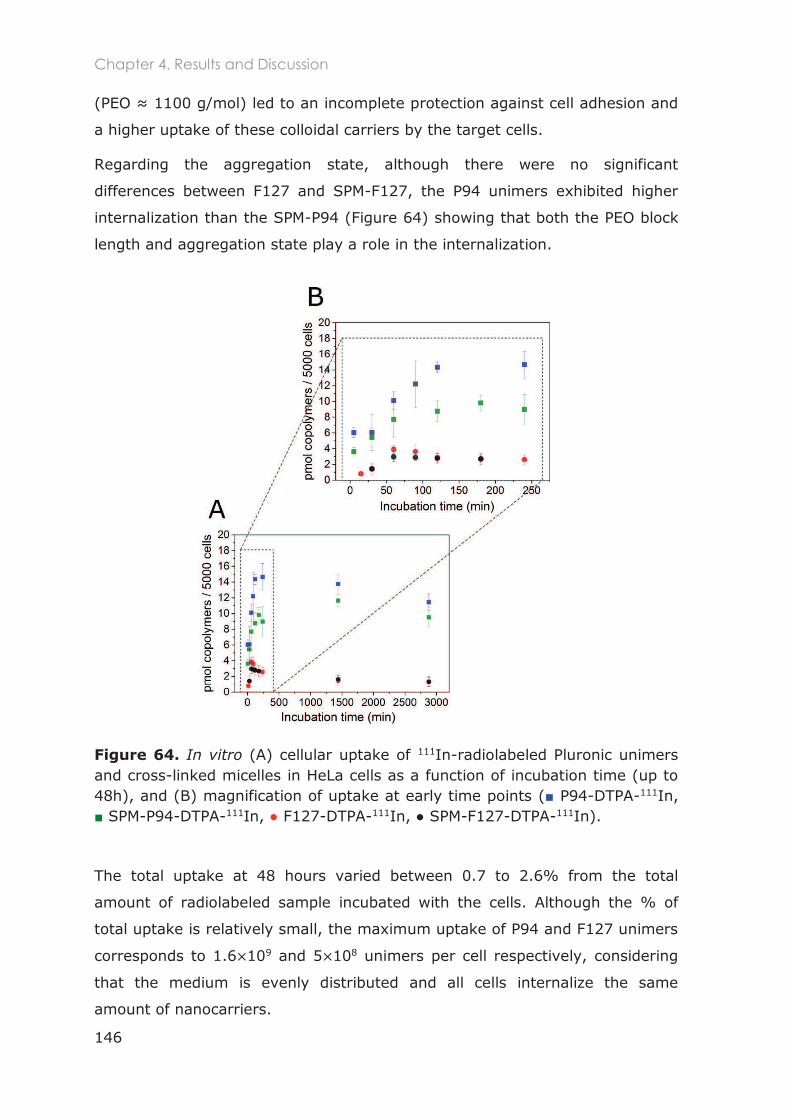
Chapter 4. Results and Discussion
146
1100 g/mol) led to an incomplete protection against cell adhesion and
a higher uptake of these colloidal carriers by the target cells.
Regarding the aggregation state, although there were no significant
differences between F127 and SPM-F127, the P94 unimers exhibited higher
internalization than the SPM-P94 (Figure 64) showing that both the PEO block
length and aggregation state play a role in the internalization.
Figure 64. In vitro (A) cellular uptake of 111In-radiolabeled Pluronic unimers and cross-linked micelles in HeLa cells as a function of incubation time (up to 48h), and (B) magnification of uptake at early time points ( P94-DTPA-111In, SPM-P94-DTPA-111In, F127-DTPA-111 -F127-DTPA-111In).
The total uptake at 48 hours varied between 0.7 to 2.6% from the total
amount of radiolabeled sample incubated with the cells. Although the % of
total uptake is relatively small, the maximum uptake of P94 and F127 unimers
corresponds to 1.6 109 and 5 108 unimers per cell respectively, considering
that the medium is evenly distributed and all cells internalize the same
amount of nanocarriers.
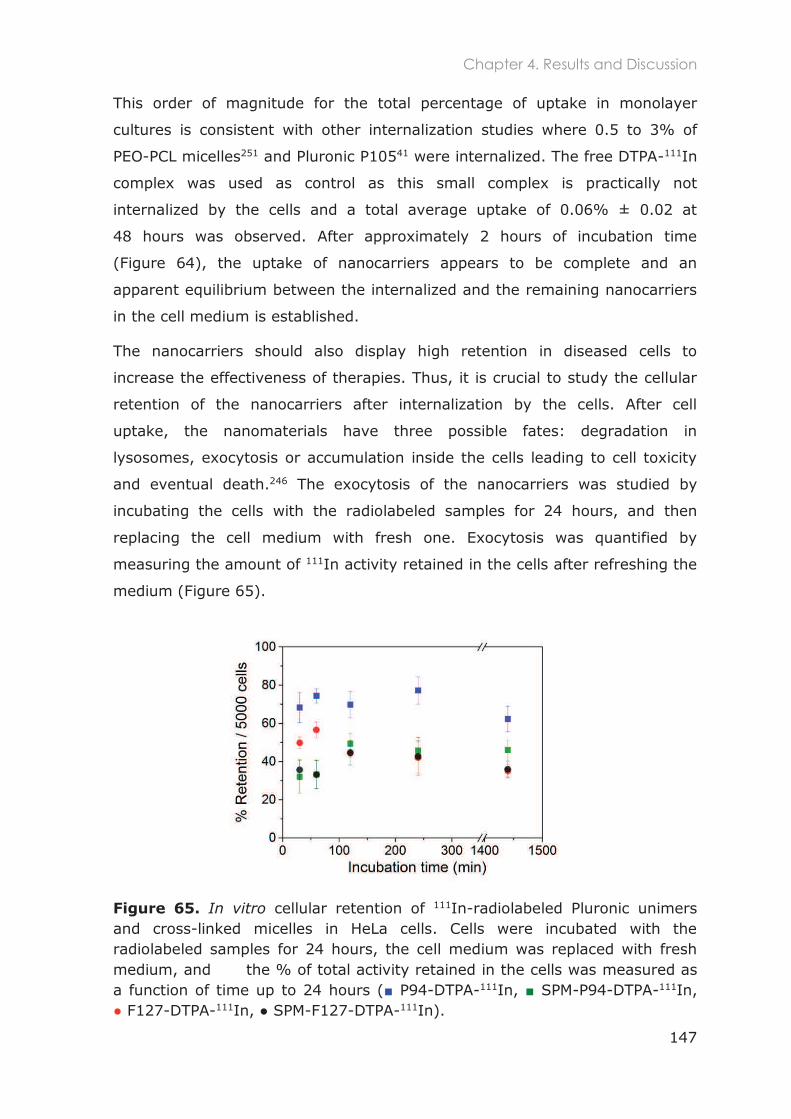
Chapter 4. Results and Discussion
147
This order of magnitude for the total percentage of uptake in monolayer
cultures is consistent with other internalization studies where 0.5 to 3% of
PEO-PCL micelles251 and Pluronic P10541 were internalized. The free DTPA-111In
complex was used as control as this small complex is practically not
internalized by the cells and a total average uptake of 0.06% ± 0.02 at
48 hours was observed. After approximately 2 hours of incubation time
(Figure 64), the uptake of nanocarriers appears to be complete and an
apparent equilibrium between the internalized and the remaining nanocarriers
in the cell medium is established.
The nanocarriers should also display high retention in diseased cells to
increase the effectiveness of therapies. Thus, it is crucial to study the cellular
retention of the nanocarriers after internalization by the cells. After cell
uptake, the nanomaterials have three possible fates: degradation in
lysosomes, exocytosis or accumulation inside the cells leading to cell toxicity
and eventual death.246 The exocytosis of the nanocarriers was studied by
incubating the cells with the radiolabeled samples for 24 hours, and then
replacing the cell medium with fresh one. Exocytosis was quantified by
measuring the amount of 111In activity retained in the cells after refreshing the
medium (Figure 65).
Figure 65. In vitro cellular retention of 111In-radiolabeled Pluronic unimers and cross-linked micelles in HeLa cells. Cells were incubated with the radiolabeled samples for 24 hours, the cell medium was replaced with fresh medium, and the % of total activity retained in the cells was measured as a function of time up to 24 hours ( P94-DTPA-111In, SPM-P94-DTPA-111In, F127-DTPA-111 -F127-DTPA-111In).
Chapter 4. Results and Discussion
148
We observed that the nanocarriers were released from the cells into the new
medium, and that exocytosis is a very fast process - within 30 minutes
equilibrium between the intracellular and extracellular radioactivity is reached.
As verified in the uptake experiments (Figure 64), the nanocarrier with shorter
PEO block (P94) was also retained more efficiently by the HeLa cells,
i.e. 70% of the internalized Pluronic P94 unimers were retained. For all the
other nanocarriers the retention was approximately 40%, within the level of
experimental accuracy.
While the exocytosis of SPM-P94 was higher than P94 unimers, the exocytosis
of F127 based nanocarriers was similar in both aggregation states (F127 and
SPM-F127). Although we did not observe a direct effect of the aggregation
state, the P94 unimers displayed a higher retention capacity over all the
nanocarriers studied. Since the major exocytosis mechanisms are related to
lysosome secretion, vesicle-related secretion, and non-vesicle-related
secretion252 (Figure 63), the less efficient exocytosis of P94 unimers can be
related to their nuclear localization (Figure 60 and Figure 61). The reported
toxicity253 and the MDR effects observed previously with short and relatively
hydrophobic Pluronics227 can also be related to their higher cellular retention.
4.3.1.6 Clonogenic assay
Since internalization studies with Pluronic P94-FITC unimers revealed the
nuclear translocation of this polymer, we investigated the potential use of
Pluronic P94 for therapy using the Augers electrons emitted by the 111In decay
(see Chapter 1 section 1.3.1 for details on these effects). The radiolabeled
P94-DTPA-111In was incubated with HeLa cells and its clonogenic potential
assessed by the colony-forming assay (Figure 66). While a cell may still
reproduce a few times after exposure to toxic nanomaterials, they are
considered dead if they can only go through one or two mitoses. A healthy cell
that is not reproductively dead will proliferate and form a large colony of cells
in a few days.62 The clonogenic cell survival assay allows this evaluation
because it tests the ability of a single cell to proliferate and to grow into a
colony that can be visualized with the naked eye.
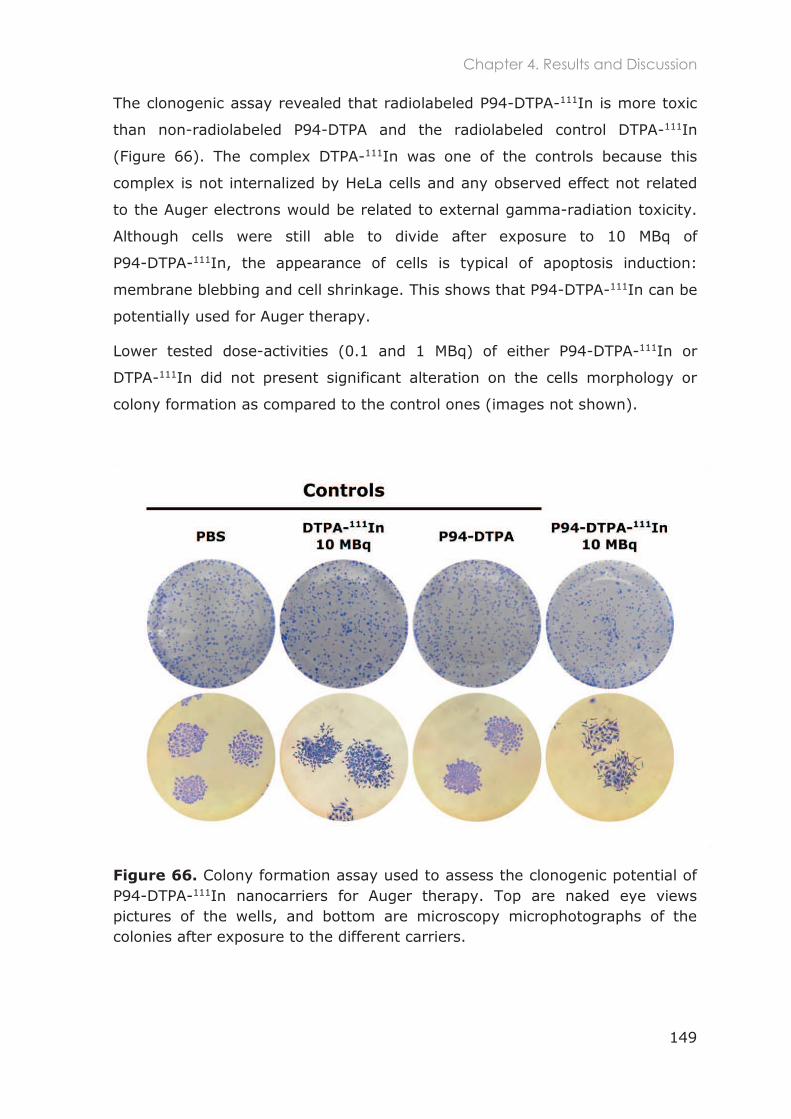
Chapter 4. Results and Discussion
149
The clonogenic assay revealed that radiolabeled P94-DTPA-111In is more toxic
than non-radiolabeled P94-DTPA and the radiolabeled control DTPA-111In
(Figure 66). The complex DTPA-111In was one of the controls because this
complex is not internalized by HeLa cells and any observed effect not related
to the Auger electrons would be related to external gamma-radiation toxicity.
Although cells were still able to divide after exposure to 10 MBq of
P94-DTPA-111In, the appearance of cells is typical of apoptosis induction:
membrane blebbing and cell shrinkage. This shows that P94-DTPA-111In can be
potentially used for Auger therapy.
Lower tested dose-activities (0.1 and 1 MBq) of either P94-DTPA-111In or
DTPA-111In did not present significant alteration on the cells morphology or
colony formation as compared to the control ones (images not shown).
Figure 66. Colony formation assay used to assess the clonogenic potential of P94-DTPA-111In nanocarriers for Auger therapy. Top are naked eye views pictures of the wells, and bottom are microscopy microphotographs of the colonies after exposure to the different carriers.
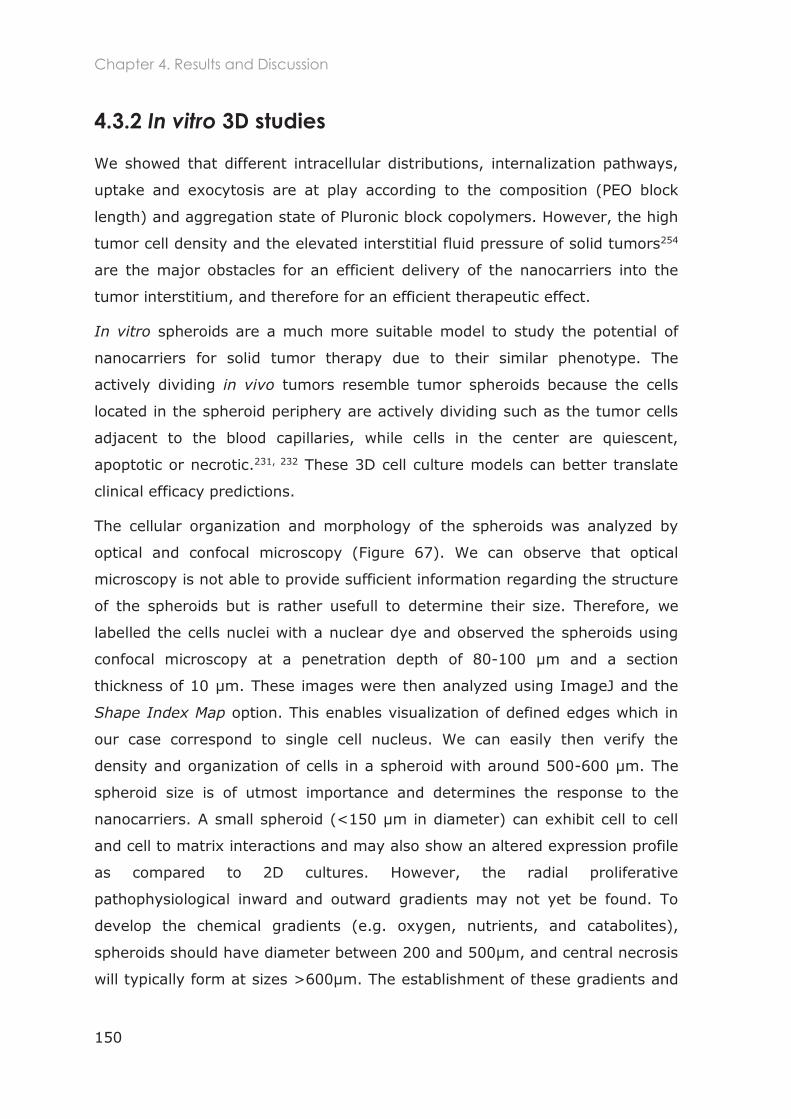
Chapter 4. Results and Discussion
150
4.3.2 In vitro 3D studies
We showed that different intracellular distributions, internalization pathways,
uptake and exocytosis are at play according to the composition (PEO block
length) and aggregation state of Pluronic block copolymers. However, the high
tumor cell density and the elevated interstitial fluid pressure of solid tumors254
are the major obstacles for an efficient delivery of the nanocarriers into the
tumor interstitium, and therefore for an efficient therapeutic effect.
In vitro spheroids are a much more suitable model to study the potential of
nanocarriers for solid tumor therapy due to their similar phenotype. The
actively dividing in vivo tumors resemble tumor spheroids because the cells
located in the spheroid periphery are actively dividing such as the tumor cells
adjacent to the blood capillaries, while cells in the center are quiescent,
apoptotic or necrotic.231, 232 These 3D cell culture models can better translate
clinical efficacy predictions.
The cellular organization and morphology of the spheroids was analyzed by
optical and confocal microscopy (Figure 67). We can observe that optical
microscopy is not able to provide sufficient information regarding the structure
of the spheroids but is rather usefull to determine their size. Therefore, we
labelled the cells nuclei with a nuclear dye and observed the spheroids using
confocal microscopy at a penetration depth of 80-100 µm and a section
thickness of 10 µm. These images were then analyzed using ImageJ and the
Shape Index Map option. This enables visualization of defined edges which in
our case correspond to single cell nucleus. We can easily then verify the
density and organization of cells in a spheroid with around 500-600 µm. The
spheroid size is of utmost importance and determines the response to the
nanocarriers. A small spheroid (<150 µm in diameter) can exhibit cell to cell
and cell to matrix interactions and may also show an altered expression profile
as compared to 2D cultures. However, the radial proliferative
pathophysiological inward and outward gradients may not yet be found. To
develop the chemical gradients (e.g. oxygen, nutrients, and catabolites),
spheroids should have diameter between 200 and 500µm, and central necrosis
will typically form at sizes >600µm. The establishment of these gradients and
Chapter 4. Results and Discussion
151
the development of central necrosis varies with the cell line but is comparable
to avascular tumors, micro-metastases and micro-regions of solid tumors.233
The generation of appropriate 3D multicellular aggregates of HeLa and U87
cells enabled then the study of the penetration and toxicity of the different
nanocarriers.
Figure 67. Tumor spheroids of (A) HeLa and (B) U87 cells labelled with Hoescht 33342. From left to right: optical microscope images, confocal images and analyzes of the confocal images using imageJ.
The biocompatible F127-based nanocarriers (F127 and SPM-F127)253 were
used to study the effect of copolymers aggregation state on the tumor
penetration. The cytotoxicity exhibited by the P94-based nanocarriers
(P94 and SPM-P94)253 did not allow the study of their penetration due to the
disintegration of the spheroids during their transfer to the confocal analysis
chambers. Instead, the potential of P94-based nanocarriers to induce spheroid
cytotoxicity was investigated.
Chapter 4. Results and Discussion
152
4.3.2.1 Penetration of F127-based nanocarriers in tumor
spheroids
The penetrating capacity of F127 unimers and SPM-F127 was observed after
incubation of the FITC-functionalized samples with HeLa (Figure 68) and U87
(Figure 69) spheroids for different periods. Both nanocarriers penetrated the
tumor spheroids, yet the penetrating and internalization capacity depended
considerably on the aggregation state of the copolymers. The cross-linked
micelles (SPM-F127) penetrated the spheroids more efficiently than the
unimers (F127). Considering 20 µm as the average diameter of a HeLa cell
(as measured by confocal microscopy), we observed that the penetration of
F127 unimers was limited to three cell layers in HeLa spheroids (Figure 68)
and five cell layers in U87 spheroids (Figure 69), while SPM-F127 reached up
to seven cell layers in both spheroids types. Moreover, the area under the
fluorescence curves showed that also the quantity of SPM-F127 that
penetrated the spheroids was higher than the F127 unimers, and increased
considerably overtime.
It has been reported that the penetration of molecules into the tumor
interstitium is directly related to their diffusion coefficient, which decreases as
the molecular weight increases.255 Since the diffusion coefficient of the F127
unimers is higher than SPM-F127 due to their smaller size, the above results
show that mere diffusion in the extracellular matrix (ECM) is not the dominant
mechanism. This suggests that the penetration into the spheroids depends
mainly on intracellular mechanisms. The internalization and subsequent
exocytosis of the nanocarriers (transcellular transport) from one cell layer to
another appear to be the mechanisms governing the penetration depth of the
carriers. Very recently, Lu et al. showed that cross-linked p(HPMA-co-MAA)-b-
PMMA micelles penetrated deeper into pancreatic spheroids compared to the
uncross-linked micelles. The same group used collagen micro-spheroids to
evaluate micelle diffusion ability in collagen to mimic the ECM and observed
that the maximum penetration of micelles was limited to 20-30 µm.256 Our
results suggest that this mechanism of transcellular transport of the
nanocarriers to reach the spheroids interstitium appears to be independent of
nanocarriers composition.
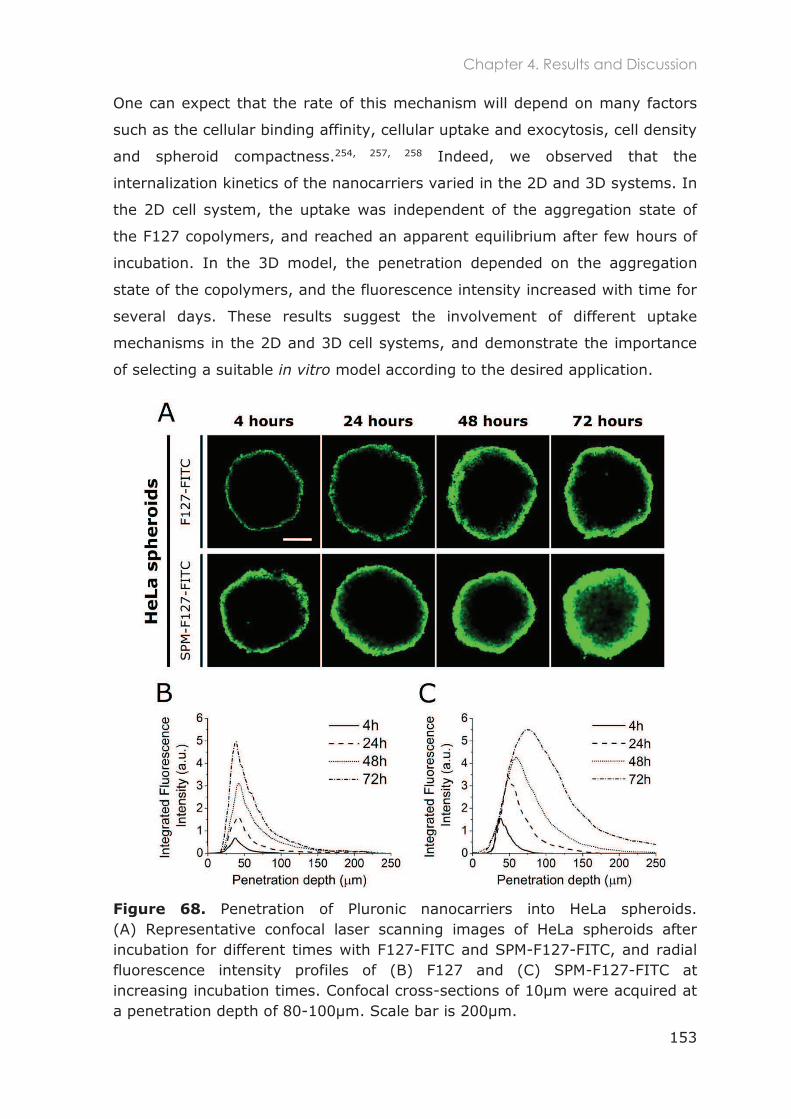
Chapter 4. Results and Discussion
153
One can expect that the rate of this mechanism will depend on many factors
such as the cellular binding affinity, cellular uptake and exocytosis, cell density
and spheroid compactness.254, 257, 258 Indeed, we observed that the
internalization kinetics of the nanocarriers varied in the 2D and 3D systems. In
the 2D cell system, the uptake was independent of the aggregation state of
the F127 copolymers, and reached an apparent equilibrium after few hours of
incubation. In the 3D model, the penetration depended on the aggregation
state of the copolymers, and the fluorescence intensity increased with time for
several days. These results suggest the involvement of different uptake
mechanisms in the 2D and 3D cell systems, and demonstrate the importance
of selecting a suitable in vitro model according to the desired application.
Figure 68. Penetration of Pluronic nanocarriers into HeLa spheroids. (A) Representative confocal laser scanning images of HeLa spheroids after incubation for different times with F127-FITC and SPM-F127-FITC, and radial fluorescence intensity profiles of (B) F127 and (C) SPM-F127-FITC at increasing incubation times. Confocal cross-sections of 10µm were acquired at a penetration depth of 80-100µm. Scale bar is 200µm.
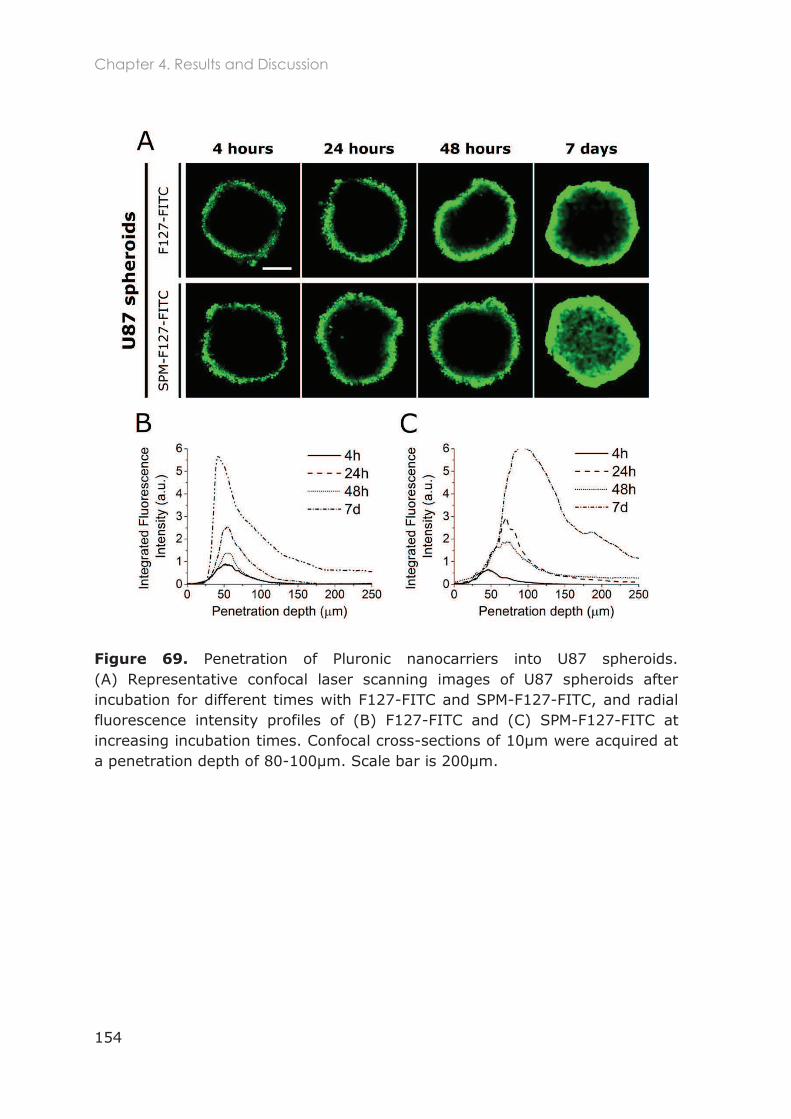
Chapter 4. Results and Discussion
154
Figure 69. Penetration of Pluronic nanocarriers into U87 spheroids. (A) Representative confocal laser scanning images of U87 spheroids after incubation for different times with F127-FITC and SPM-F127-FITC, and radial fluorescence intensity profiles of (B) F127-FITC and (C) SPM-F127-FITC at increasing incubation times. Confocal cross-sections of 10µm were acquired at a penetration depth of 80-100µm. Scale bar is 200µm.
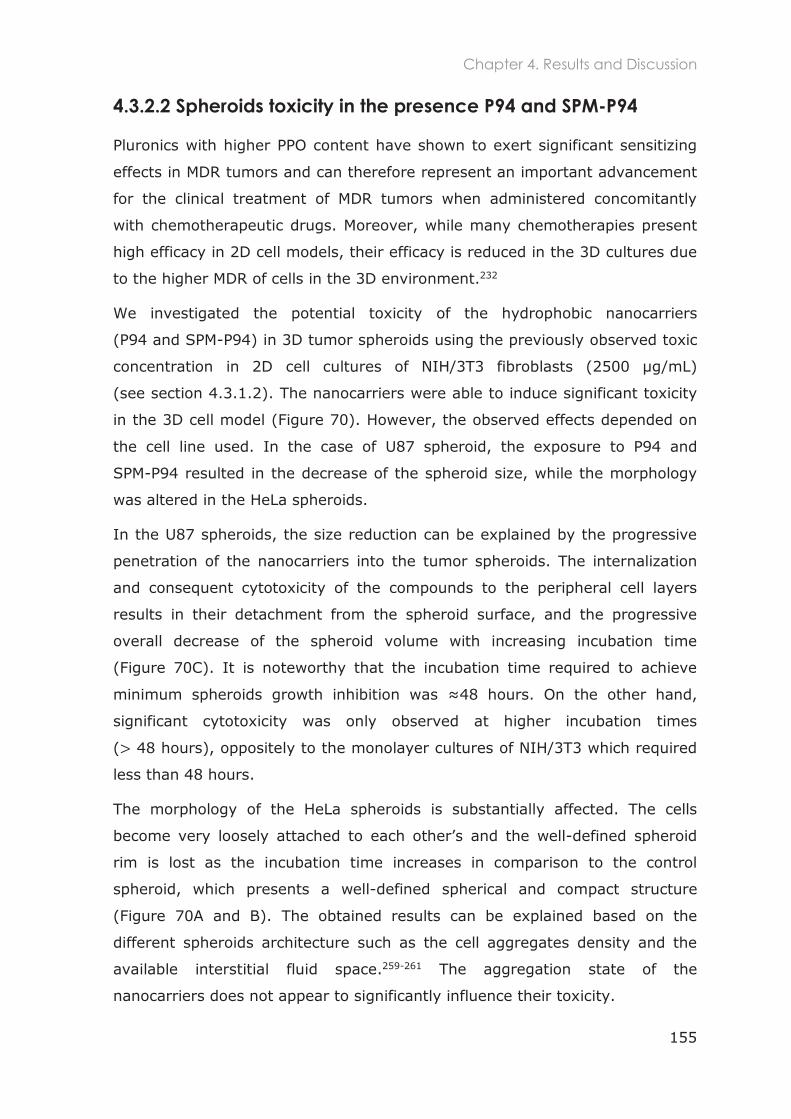
Chapter 4. Results and Discussion
155
4.3.2.2 Spheroids toxicity in the presence P94 and SPM-P94
Pluronics with higher PPO content have shown to exert significant sensitizing
effects in MDR tumors and can therefore represent an important advancement
for the clinical treatment of MDR tumors when administered concomitantly
with chemotherapeutic drugs. Moreover, while many chemotherapies present
high efficacy in 2D cell models, their efficacy is reduced in the 3D cultures due
to the higher MDR of cells in the 3D environment.232
We investigated the potential toxicity of the hydrophobic nanocarriers
(P94 and SPM-P94) in 3D tumor spheroids using the previously observed toxic
concentration in 2D cell cultures of NIH/3T3 fibroblasts (2500 µg/mL)
(see section 4.3.1.2). The nanocarriers were able to induce significant toxicity
in the 3D cell model (Figure 70). However, the observed effects depended on
the cell line used. In the case of U87 spheroid, the exposure to P94 and
SPM-P94 resulted in the decrease of the spheroid size, while the morphology
was altered in the HeLa spheroids.
In the U87 spheroids, the size reduction can be explained by the progressive
penetration of the nanocarriers into the tumor spheroids. The internalization
and consequent cytotoxicity of the compounds to the peripheral cell layers
results in their detachment from the spheroid surface, and the progressive
overall decrease of the spheroid volume with increasing incubation time
(Figure 70C). It is noteworthy that the incubation time required to achieve
minimum spheroids growth inhibition was 48 hours. On the other hand,
significant cytotoxicity was only observed at higher incubation times
( 48 hours), oppositely to the monolayer cultures of NIH/3T3 which required
less than 48 hours.
The morphology of the HeLa spheroids is substantially affected. The cells
-defined spheroid
rim is lost as the incubation time increases in comparison to the control
spheroid, which presents a well-defined spherical and compact structure
(Figure 70A and B). The obtained results can be explained based on the
different spheroids architecture such as the cell aggregates density and the
available interstitial fluid space.259-261 The aggregation state of the
nanocarriers does not appear to significantly influence their toxicity.
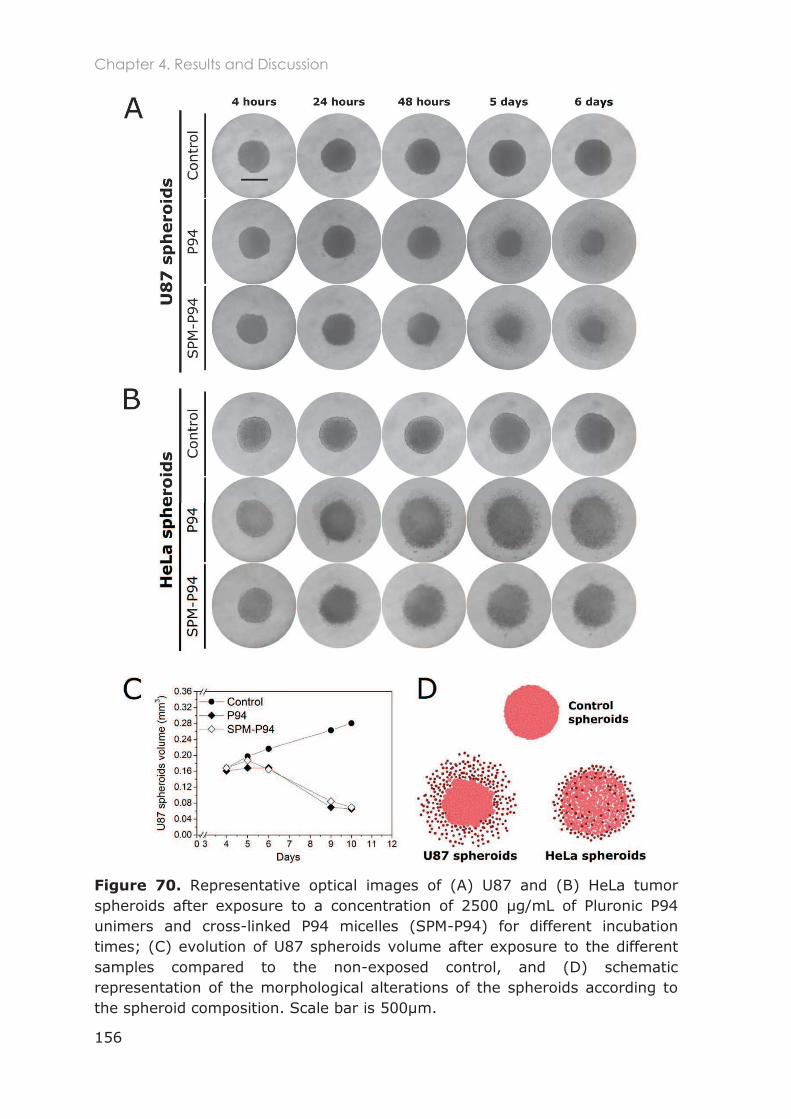
Chapter 4. Results and Discussion
156
Figure 70. Representative optical images of (A) U87 and (B) HeLa tumor spheroids after exposure to a concentration of 2500 µg/mL of Pluronic P94 unimers and cross-linked P94 micelles (SPM-P94) for different incubation times; (C) evolution of U87 spheroids volume after exposure to the different samples compared to the non-exposed control, and (D) schematic representation of the morphological alterations of the spheroids according to the spheroid composition. Scale bar is 500µm.
Chapter 4. Conclusions
157
4.4 Conclusions
Unmodified Pluronic unimers and cross-linked micelles were evaluated in vitro
with healthy NIH/3T3 fibroblasts in relation to their cytotoxicity, and ability to
load hydrophobic molecules and transport them across the cellular membrane.
These cytotoxicity experiments demonstrated that the presence of PETA in the
micelles core does not induce cellular toxicity in comparison to the respective
pure polymer solutions. Furthermore, stabilized micelles of Pluronic P94 were
shown to be less toxic than the polymer itself, and the biocompatibility
properties of Pluronic F127 were kept after micelle stabilization.
The internalization studies with NIH/3T3 mouse fibroblasts revealed that the
stabilized micelles were able to physically incorporate hydrophobic molecules
(e.g. Nile Red), and deliver the hydrophobic components across the cellular
membrane. Moreover, we showed that the encapsulated components are
dispersed in the cytoplasm (either free or associated to endocytic vesicles) and
do not associate with the mitochondria. Overall, these results indicate that
Pluronic micelles stabilized by core cross-linking are capable of delivering
hydrophobic components physically entrapped in the micelles, thus making
them a potential candidate as a delivery platform for cancer therapy.
The chemical functionalized Pluronic unimers and cross-linked micelles with a
fluorescent probe (FITC) and hydrophilic chelator (DTPA) linked to the PEO
end group were used to visualize and quantify the nanocarriers in cancer cells.
Particularly, the tracking of the nanocarriers with FITC and the cellular
labelling of the lysosomes and nuclei allowed to accurately monitor their
internalization and to probe their internalization pathways and intracellular
localization. Our results revealed that the internalization pathways and
ultimate cellular localization of the Pluronic nanocarriers depended largely on
both the PEO block length and aggregation state of the block copolymers. On
the one hand, Pluronic unimers presented distinct intracellular distribution
patterns being dispersed in the cytoplasm, and around or even inside the
nucleus. On the other hand, the cross-linked micelles were retained in the
endolysosomal compartments as visualized by co-localization with the
lysosomes. The nuclear translocation observed with the low molecular weight
Pluronic P94 suggests that low molecular weight unimers can be potentially
Chapter 4. Conclusions
158
used for Auger or gene-therapy applications. The clonogenic potential of
P94-DTPA-111In for Auger-therapy was therefore analyzed and significant
alteration in the cells morphology and on the colonies was observed. Pluronic
P94 unimers might be therefore very promising for radiation therapy,
particularly when considering intratumoral therapy.
The radiolabeling of the carriers with 111In also enabled the quantification of
their uptake and exocytosis kinetics. The carriers with shorter PEO length
(P94 and SPM-P94), and therefore relatively more hydrophobic, were
internalized in higher amounts by HeLa cells. Particularly, the smallest
nanocarriers (P94 unimers, RH~2 nm) displayed the highest cellular uptake
and retention.
3D tumor spheroids of HeLa and U87 cells were used to study the penetration
capacity and toxicity potential of the nanocarriers. Results revealed that
cross-linked F127 micelles penetrated deeper and were therefore delivered
more efficiently across the tumor spheroids compared to the corresponding
F127 unimers. The results also suggest that the transcellular transport of the
nanocarriers (endocytosis and exocytosis) governs their penetration depth.
Finally, the remarkable toxicity of Pluronic P94-based nanocarriers (both
unimers and cross-linked micelles) observed in the tumor spheroids endows
great potential of these formulations for tumor therapy applications. However,
the toxic effect is significantly influenced by the spheroid cellular type.
In this chapter we showed that by varying the physicochemical properties of
Pluronics copolymers, such as the PEO block length, relative hydrophobicity
and aggregation state, it is possible to activate different internalization
pathways, reach distinct intracellular compartments, tune and optimize the
uptake and exocytosis, and ultimately increase tissue penetration and toxicity.
We also demonstrate how nanocarriers display different behaviors depending
on the 2D and 3D nature of the in vitro model.
Understanding the effects of the physicochemical properties of the
nanocarriers on the cellular interactions is essential in the design and
development of nanoengineered polymeric nanocarriers to target specific
diseases.
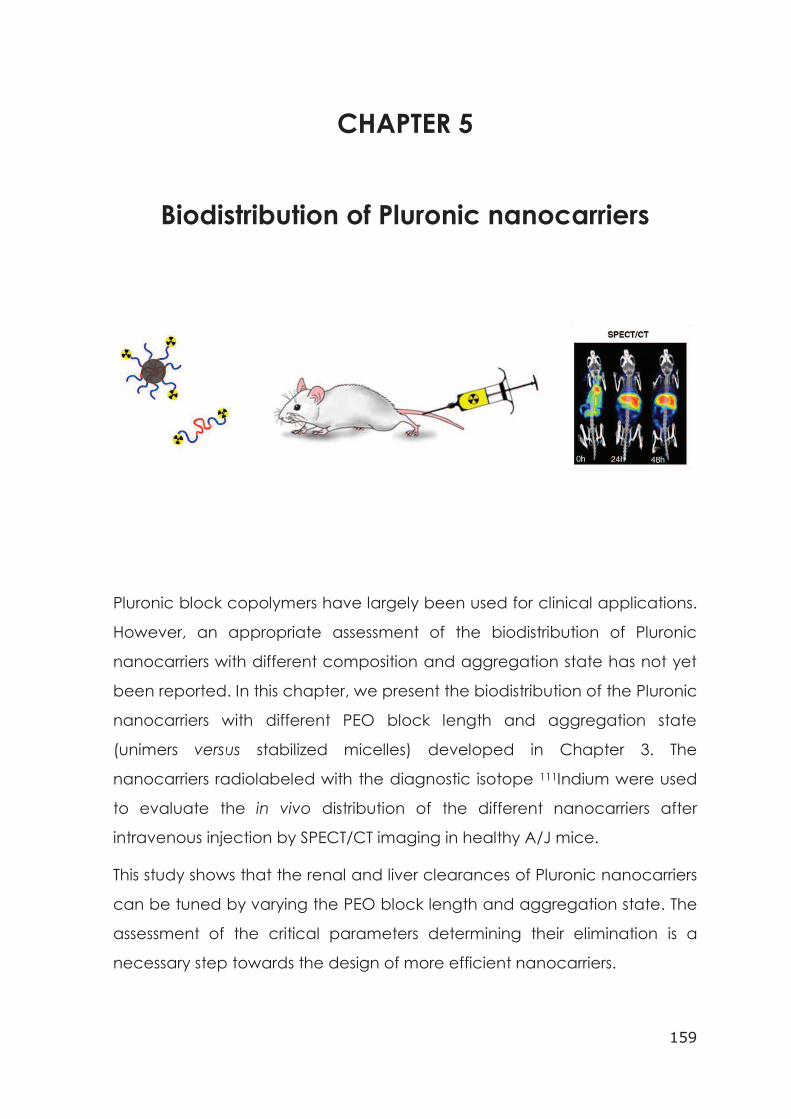
159
CHAPTER 5
Biodistribution of Pluronic nanocarriers
Pluronic block copolymers have largely been used for clinical applications.
However, an appropriate assessment of the biodistribution of Pluronic
nanocarriers with different composition and aggregation state has not yet
been reported. In this chapter, we present the biodistribution of the Pluronic
nanocarriers with different PEO block length and aggregation state
(unimers versus stabilized micelles) developed in Chapter 3. The
nanocarriers radiolabeled with the diagnostic isotope 111Indium were used
to evaluate the in vivo distribution of the different nanocarriers after
intravenous injection by SPECT/CT imaging in healthy A/J mice.
This study shows that the renal and liver clearances of Pluronic nanocarriers
can be tuned by varying the PEO block length and aggregation state. The
assessment of the critical parameters determining their elimination is a
necessary step towards the design of more efficient nanocarriers.

160
Chapter 5. Introduction
161
5.1 Introduction
To our knowledge, despite the broad use of Pluronics in pharmaceutical
formulations, most in vivo studies carried out so far have evaluated the
pharmacokinetics of the drugs incorporated in the nanocarriers rather than the
biodistribution of the nanocarriers themselves. Moreover, drugs can rapidly
disassociate from the nanocarriers once in circulation if they are not covalently
attached and the pharmacokinetics might reflect poorly the biodistribution of
the nanocarriers. Therefore, the design of more efficient nanocarriers requires
specific studies dedicated to the evaluation of their biodistribution prior to their
functionalization.
Very few groups have studied the in vivo biodistribution of Pluronic
nanocarriers.56, 229, 262, 263 Kabanov et al. studied the effect of the aggregation
state on the biokinetics of Pluronic 3H-P85 (Mn=4600 g/mol, PEO26PPO40PEO26)
using different polymer doses. They showed that the biodistribution between
unimers and micelles did not differ significantly, and renal filtration was the
main clearance mechanism for both systems. However, the circulation time
depended on the aggregation state varying from 60-70 hours for the low
concentrations (0.02%) and up to 90h for the highest concentrations (1%).56
The biodistribution of Pluronics F68229, 262 (Mn=8400, PEO76PPO29PEO76) and
F38263 (Mn=4700, PEO19PPO17PEO19) showed a fast initial renal clearance
( f the ID was recovered after 24 hours in the urine of dogs) followed
by a gradual decrease of the Pluronic concentration in the blood. The tissues
with the highest concentration of 14C-F68 were the kidneys, liver, spleen,
bladder, gastrointestinal tract and lungs.229 They also reported maximum
uptake of Pluronic 3H-F68 in the liver and bile 24 hours post-injection.262 In
rats, 94% ID of Pluronic 14C-F38 was excreted in the urine in 3 days, and the
remaining 6% appeared in the feces.263 Previous studies have also shown that
Pluronics accumulate mostly in the kidneys and liver but do not induce any
nephro- or hepato-toxicity.229, 264
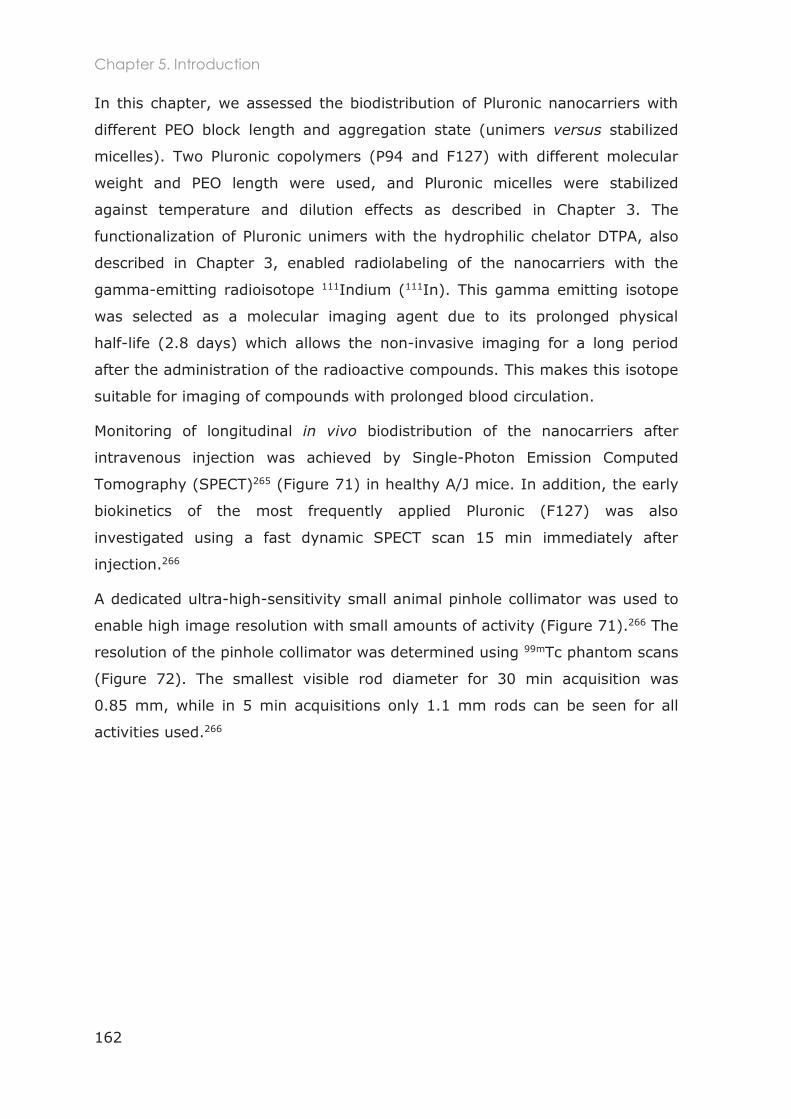
Chapter 5. Introduction
162
In this chapter, we assessed the biodistribution of Pluronic nanocarriers with
different PEO block length and aggregation state (unimers versus stabilized
micelles). Two Pluronic copolymers (P94 and F127) with different molecular
weight and PEO length were used, and Pluronic micelles were stabilized
against temperature and dilution effects as described in Chapter 3. The
functionalization of Pluronic unimers with the hydrophilic chelator DTPA, also
described in Chapter 3, enabled radiolabeling of the nanocarriers with the
gamma-emitting radioisotope 111Indium (111In). This gamma emitting isotope
was selected as a molecular imaging agent due to its prolonged physical
half-life (2.8 days) which allows the non-invasive imaging for a long period
after the administration of the radioactive compounds. This makes this isotope
suitable for imaging of compounds with prolonged blood circulation.
Monitoring of longitudinal in vivo biodistribution of the nanocarriers after
intravenous injection was achieved by Single-Photon Emission Computed
Tomography (SPECT)265 (Figure 71) in healthy A/J mice. In addition, the early
biokinetics of the most frequently applied Pluronic (F127) was also
investigated using a fast dynamic SPECT scan 15 min immediately after
injection.266
A dedicated ultra-high-sensitivity small animal pinhole collimator was used to
enable high image resolution with small amounts of activity (Figure 71).266 The
resolution of the pinhole collimator was determined using 99mTc phantom scans
(Figure 72). The smallest visible rod diameter for 30 min acquisition was
0.85 mm, while in 5 min acquisitions only 1.1 mm rods can be seen for all
activities used.266
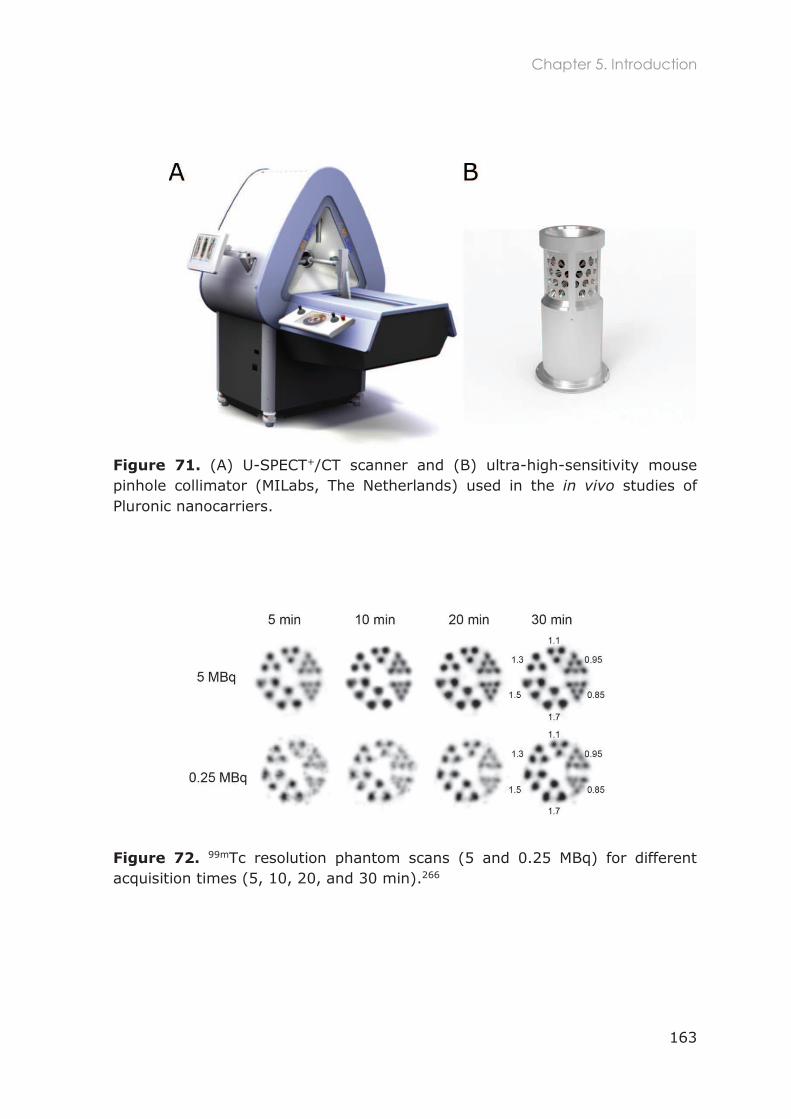
Chapter 5. Introduction
163
Figure 71. (A) U-SPECT+/CT scanner and (B) ultra-high-sensitivity mouse pinhole collimator (MILabs, The Netherlands) used in the in vivo studies of Pluronic nanocarriers.
Figure 72. 99mTc resolution phantom scans (5 and 0.25 MBq) for different acquisition times (5, 10, 20, and 30 min).266
Chapter 5. Experimental Section
164
5.2 Experimental section
5.2.1 Preparation of radiolabeled nanocarriers
Functionalized Pluronic unimers (F127-DTPA and P94-DTPA) and stabilized
micelles (SPM-F127-DTPA and SPM-P94-DTPA) were radiolabeled by diluting in
1X PBS buffer (pH 7.4) and adding 75 MBq of 111InCl3 to each sample at room
temperature and incubating for 30 min. Quality control of radiochemical purity
was evaluated by TLC using EDTA:NH4Ac (1:1) (v:v) (0.1 M, pH 5.5) as the
eluent (see Chapter 3 section 3.3.6).
Samples presenting a labelling efficiency of more than 95% were used without
further purification (P94 and F127). Samples with a lower coupling efficiency
(SPM-P94 and SPM-F127) were further purified by addition of free DTPA to the
labelling mixtures and by subsequent elution through a prepacked PD10
column using 1X PBS as the eluent as described in in Chapter 3 section
3.3.6.4. The purification efficiency for the eluted fractions was also evaluated
by TLC. After radiolabeling and purification when required, all samples
presented 95% of radiochemical purity.
5.2.2 Animal handling
Animal experiments were performed with A/J mice according to protocols
approved by the Animal Ethical Committee of the UMC Utrecht and in
accordance with Dutch Law on Animal experimentation.
SPECT/CT imaging was used as a noninvasive method to access circulation
dynamics and tissue deposition of 111In-labelled compounds. Eight mice were
divided into four study groups of 2 animals and assigned for imaging with
F127-DTPA-111In, SPM-F127-DTPA-111In, P94-DTPA-111In and
SPM-P94-DTPA-111In. All animals were anesthetized with isoflurane and
injected with the radioactive compounds in the tail vein. Average injected
activities were 3.6 MBq and 0.014 g/kg of compound. In detail, 2.2 MBq of
F127-DTPA-111In (220 µg, 0.008 g/kg), 3.5 MBq of SPM-F127-DTPA-111In
(480 µg, 0.017 g/kg), 5.2 MBq of P94-DTPA-111In (450 µg, 0.016 g/kg) and
3.6 MBq of SPM-P94-DTPA-111In (420 µg, 0.015 g/kg) were injected.
Chapter 5. Experimental Section
165
Total body SPECT/CT scans of 30 minutes were acquired at 0 (immediately
after injection), 24 and 48 hours post-injection (p.i.). Early stage dynamics of
F127-DTPA-111In and detailed information on late-stage biodistribution of the
compounds in the abdominal area and liver of the animals were obtained
following specific protocols.
For the early stage dynamics of F127-DTPA-111In, one mouse from the
F127-DTPA-111In study group was anesthetized and a tail vein catheter was
applied. The animal was injected with the compound just after the start of the
dynamic SPECT acquisition with 15-second frames.
After the end of the 48 hours p.i. total body scans, an additional 30 minutes
scan was performed focusing on the abdominal area to acquire information on
late-stage biodistribution in the spleen and liver. After the end of imaging
sequence, all animals were sacrificed via cervical dislocation.
5.2.3 SPECT/CT imaging and data analyzing
Animals were imaged in U-SPECT+/CT scanner (MILabs, the Netherlands)
(Figure 71). This system is equipped with three stationary scintillator detectors
that are arranged in triangular setup and an integrated X-ray micro-CT
scanner.265
The SPECT scans were acquired in list-mode data format. An ultra-high-
sensitivity mouse pinhole collimator was used.266 After this, SPECT image
reconstructions were carried out with a Pixel-based Order-Subset Expectation
Maximization (POSEM)267 algorithm that included resolution recovery and
compensation for distance-dependent pinhole sensitivity.268 All reconstructions
were performed with the use of 4 subsets, 12 iterations and an isotropic
0.4-mm-voxel grid. Triple-energy-window based Compton scatter correction
according to King et al.269 with 4% background windows and a 20% photo-
peak energy window centered at 171 keV was performed. Effects of gamma-
attenuation in the animal and bed were corrected, after which absolute
quantification of SPECT images was enabled using a scaling factor that was
obtained from scanning a small 111In source with known activity.270
Chapter 5. Experimental Section
166
Corresponding total body CT scans were acquired with a tube setting of 55 kV
and 615 µA. In total 2 frames of 182 projections over 360° were acquired in
step and shoot rotation mode. The acquired CT projection data was
reconstructed using SkyScan NRecon software to generate a 3D CT image on
0.1693x0.1693x0.1695mm voxel grid. After this, reconstructed SPECT images
were co-registered to CT images (U-reg-v1.26c, MILabs, The Netherlands).
To calculate the uptake of radiolabeled micelles in the organs of interest, the
registered and quantitative 3D SPECT images were analyzed using biomedical
image analyzing software (PMOD 3.6, Zurich, Switzerland). A 3D region-of-
interest (ROI) was manually drawn to encompass the radioactivity uptake in
the organ whose boundary was delineated in the 3D CT images. Separate
eft
and right kidneys, and lungs. The % of injected dose (ID) per mL of tissue
volume (ID/mL) value was calculated for every imaging time point using
Equation 19:
Equation 19
For visual representation in the text, reconstructed volumes were filtered with
1.2 mm FWHM 3D Gaussian filter, after what maximal intensity projections
(MIPs) were generated. Bladder of the animal was manually cropped out from
the early stage SPECT scans (0 hours post injection time point) of all animals.
Time-activity curves (TACs) derived from dynamic SPECT scans were
generated from manually drawn 3D ROI , using decay-corrected but
otherwise unprocessed images, reconstructed as a dynamic frame sequence.
In vivo imaging was performed as a hands-on formation to SPECT supervised
by the project partner O. Ivashchenko at MILabs (Utrecht, The Netherlands)
reconstruction was also performed by the project partner.
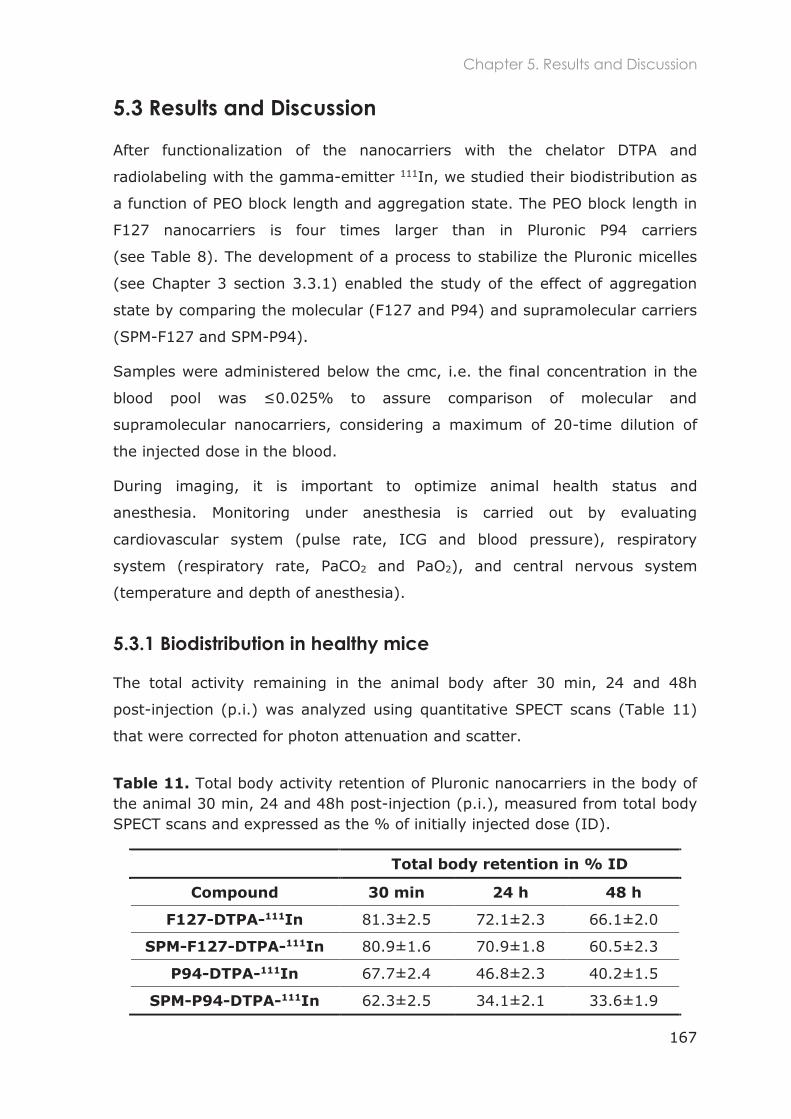
Chapter 5. Results and Discussion
167
5.3 Results and Discussion
After functionalization of the nanocarriers with the chelator DTPA and
radiolabeling with the gamma-emitter 111In, we studied their biodistribution as
a function of PEO block length and aggregation state. The PEO block length in
F127 nanocarriers is four times larger than in Pluronic P94 carriers
(see Table 8). The development of a process to stabilize the Pluronic micelles
(see Chapter 3 section 3.3.1) enabled the study of the effect of aggregation
state by comparing the molecular (F127 and P94) and supramolecular carriers
(SPM-F127 and SPM-P94).
Samples were administered below the cmc, i.e. the final concentration in the
supramolecular nanocarriers, considering a maximum of 20-time dilution of
the injected dose in the blood.
During imaging, it is important to optimize animal health status and
anesthesia. Monitoring under anesthesia is carried out by evaluating
cardiovascular system (pulse rate, ICG and blood pressure), respiratory
system (respiratory rate, PaCO2 and PaO2), and central nervous system
(temperature and depth of anesthesia).
5.3.1 Biodistribution in healthy mice
The total activity remaining in the animal body after 30 min, 24 and 48h
post-injection (p.i.) was analyzed using quantitative SPECT scans (Table 11)
that were corrected for photon attenuation and scatter.
Table 11. Total body activity retention of Pluronic nanocarriers in the body of the animal 30 min, 24 and 48h post-injection (p.i.), measured from total body SPECT scans and expressed as the % of initially injected dose (ID).
Total body retention in % ID
Compound 30 min 24 h 48 h
F127-DTPA-111In 81.3±2.5 72.1±2.3 66.1±2.0
SPM-F127-DTPA-111In 80.9±1.6 70.9±1.8 60.5±2.3
P94-DTPA-111In 67.7±2.4 46.8±2.3 40.2±1.5
SPM-P94-DTPA-111In 62.3±2.5 34.1±2.1 33.6±1.9
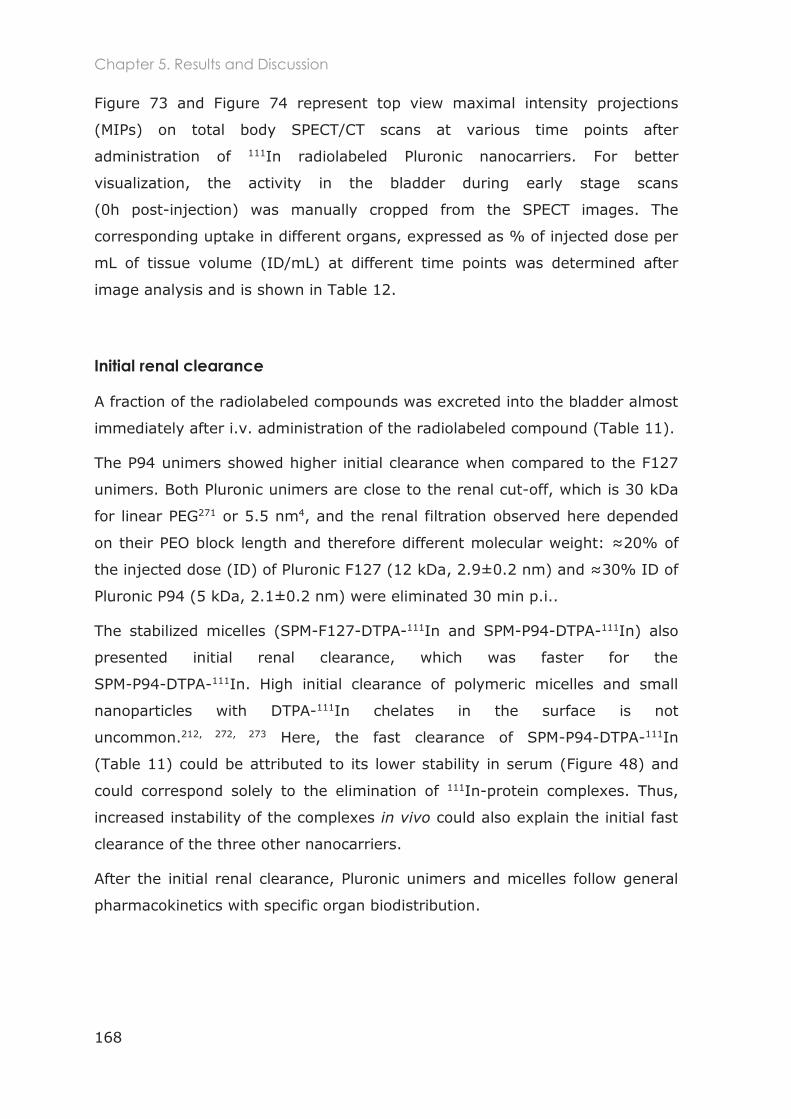
Chapter 5. Results and Discussion
168
Figure 73 and Figure 74 represent top view maximal intensity projections
(MIPs) on total body SPECT/CT scans at various time points after
administration of 111In radiolabeled Pluronic nanocarriers. For better
visualization, the activity in the bladder during early stage scans
(0h post-injection) was manually cropped from the SPECT images. The
corresponding uptake in different organs, expressed as % of injected dose per
mL of tissue volume (ID/mL) at different time points was determined after
image analysis and is shown in Table 12.
Initial renal clearance
A fraction of the radiolabeled compounds was excreted into the bladder almost
immediately after i.v. administration of the radiolabeled compound (Table 11).
The P94 unimers showed higher initial clearance when compared to the F127
unimers. Both Pluronic unimers are close to the renal cut-off, which is 30 kDa
for linear PEG271 or 5.5 nm4, and the renal filtration observed here depended
on their PEO block length and therefore different molecular weight: of
the injected dose (ID) of Pluronic F127 (12 kDa, 2.9±0.2 nm
Pluronic P94 (5 kDa, 2.1±0.2 nm) were eliminated 30 min p.i..
The stabilized micelles (SPM-F127-DTPA-111In and SPM-P94-DTPA-111In) also
presented initial renal clearance, which was faster for the
SPM-P94-DTPA-111In. High initial clearance of polymeric micelles and small
nanoparticles with DTPA-111In chelates in the surface is not
uncommon.212, 272, 273 Here, the fast clearance of SPM-P94-DTPA-111In
(Table 11) could be attributed to its lower stability in serum (Figure 48) and
could correspond solely to the elimination of 111In-protein complexes. Thus,
increased instability of the complexes in vivo could also explain the initial fast
clearance of the three other nanocarriers.
After the initial renal clearance, Pluronic unimers and micelles follow general
pharmacokinetics with specific organ biodistribution.
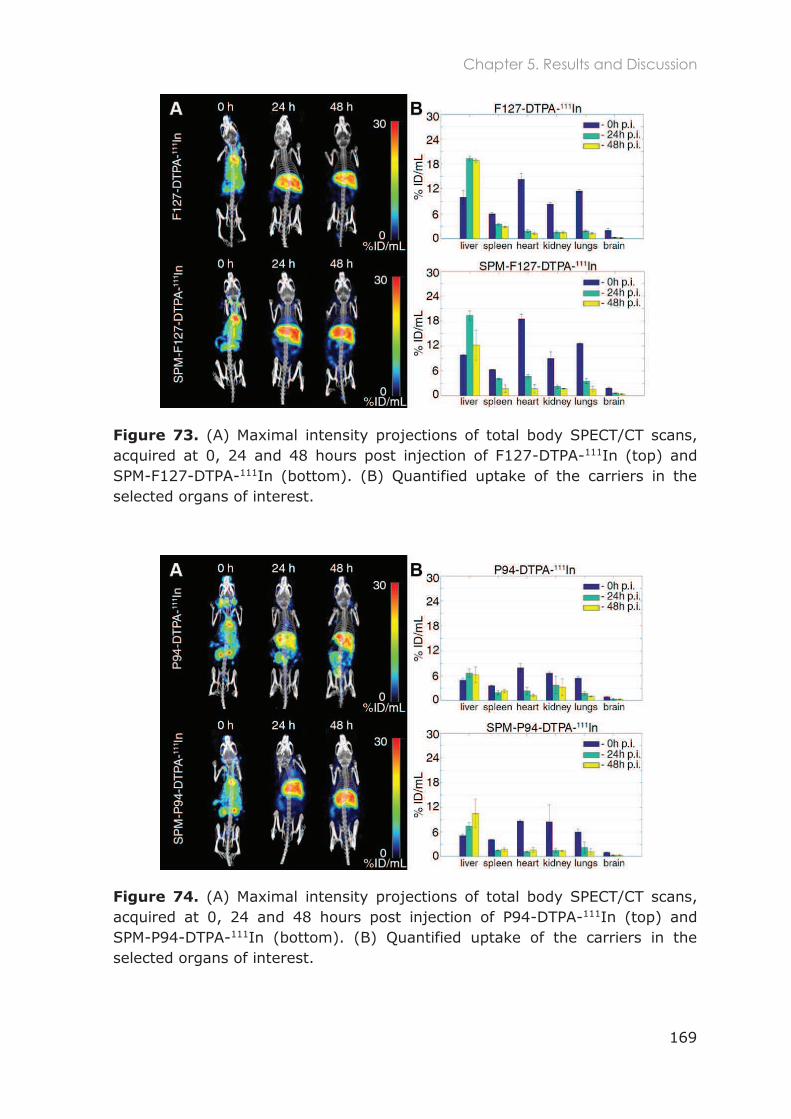
Chapter 5. Results and Discussion
169
Figure 73. (A) Maximal intensity projections of total body SPECT/CT scans, acquired at 0, 24 and 48 hours post injection of F127-DTPA-111In (top) and SPM-F127-DTPA-111In (bottom). (B) Quantified uptake of the carriers in the selected organs of interest.
Figure 74. (A) Maximal intensity projections of total body SPECT/CT scans, acquired at 0, 24 and 48 hours post injection of P94-DTPA-111In (top) and SPM-P94-DTPA-111In (bottom). (B) Quantified uptake of the carriers in the selected organs of interest.
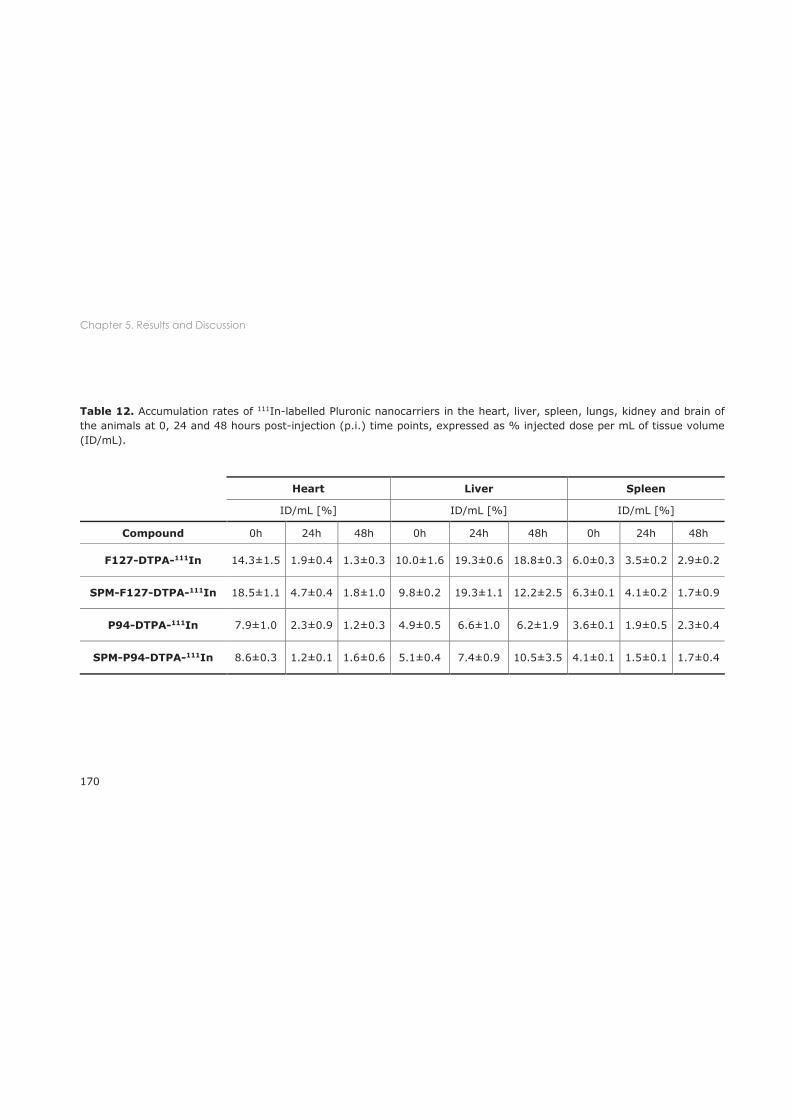
Chapter 5. Results and Discussion
170
Table 12. Accumulation rates of 111In-labelled Pluronic nanocarriers in the heart, liver, spleen, lungs, kidney and brain of the animals at 0, 24 and 48 hours post-injection (p.i.) time points, expressed as % injected dose per mL of tissue volume (ID/mL).
Heart Liver Spleen
ID/mL [%] ID/mL [%] ID/mL [%]
Compound 0h 24h 48h 0h 24h 48h 0h 24h 48h
F127-DTPA-111In 14.3±1.5 1.9±0.4 1.3±0.3 10.0±1.6 19.3±0.6 18.8±0.3 6.0±0.3 3.5±0.2 2.9±0.2
SPM-F127-DTPA-111In 18.5±1.1 4.7±0.4 1.8±1.0 9.8±0.2 19.3±1.1 12.2±2.5 6.3±0.1 4.1±0.2 1.7±0.9
P94-DTPA-111In 7.9±1.0 2.3±0.9 1.2±0.3 4.9±0.5 6.6±1.0 6.2±1.9 3.6±0.1 1.9±0.5 2.3±0.4
SPM-P94-DTPA-111In 8.6±0.3 1.2±0.1 1.6±0.6 5.1±0.4 7.4±0.9 10.5±3.5 4.1±0.1 1.5±0.1 1.7±0.4
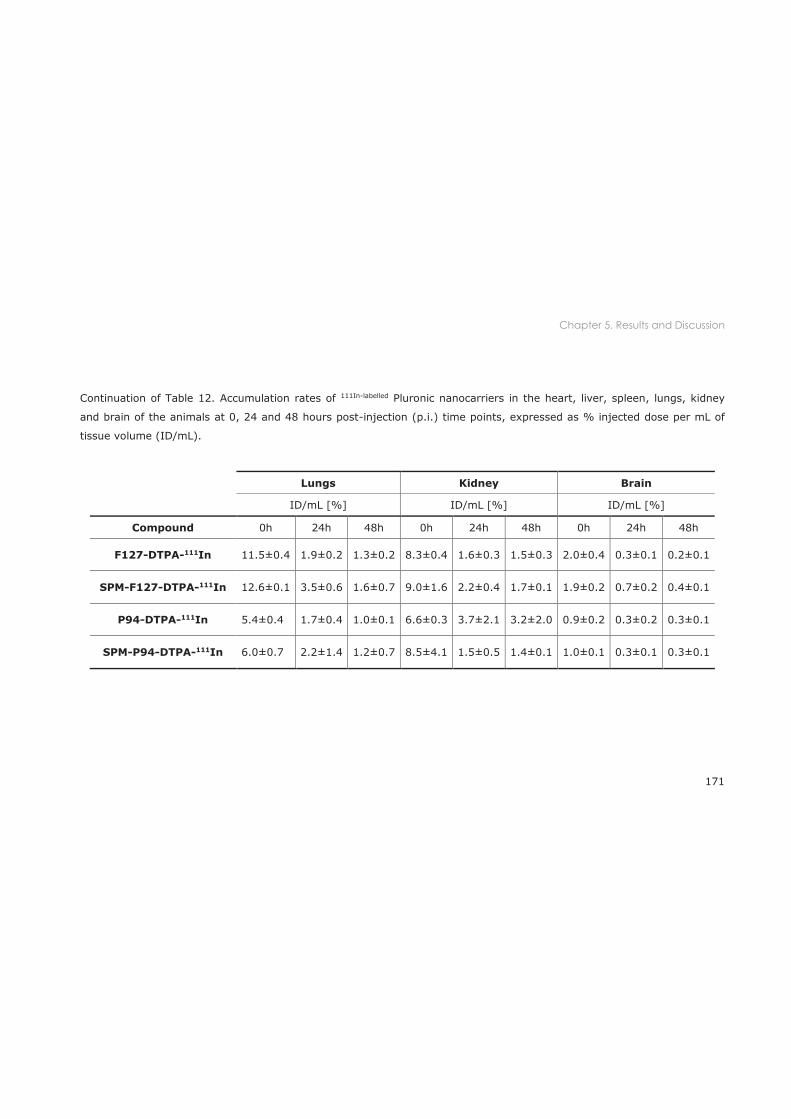
Chapter 5. Results and Discussion
171
Continuation of Table 12. Accumulation rates of 111In-labelled Pluronic nanocarriers in the heart, liver, spleen, lungs, kidney
and brain of the animals at 0, 24 and 48 hours post-injection (p.i.) time points, expressed as % injected dose per mL of
tissue volume (ID/mL).
Lungs Kidney Brain
ID/mL [%] ID/mL [%] ID/mL [%]
Compound 0h 24h 48h 0h 24h 48h 0h 24h 48h
F127-DTPA-111In 11.5±0.4 1.9±0.2 1.3±0.2 8.3±0.4 1.6±0.3 1.5±0.3 2.0±0.4 0.3±0.1 0.2±0.1
SPM-F127-DTPA-111In 12.6±0.1 3.5±0.6 1.6±0.7 9.0±1.6 2.2±0.4 1.7±0.1 1.9±0.2 0.7±0.2 0.4±0.1
P94-DTPA-111In 5.4±0.4 1.7±0.4 1.0±0.1 6.6±0.3 3.7±2.1 3.2±2.0 0.9±0.2 0.3±0.2 0.3±0.1
SPM-P94-DTPA-111In 6.0±0.7 2.2±1.4 1.2±0.7 8.5±4.1 1.5±0.5 1.4±0.1 1.0±0.1 0.3±0.1 0.3±0.1
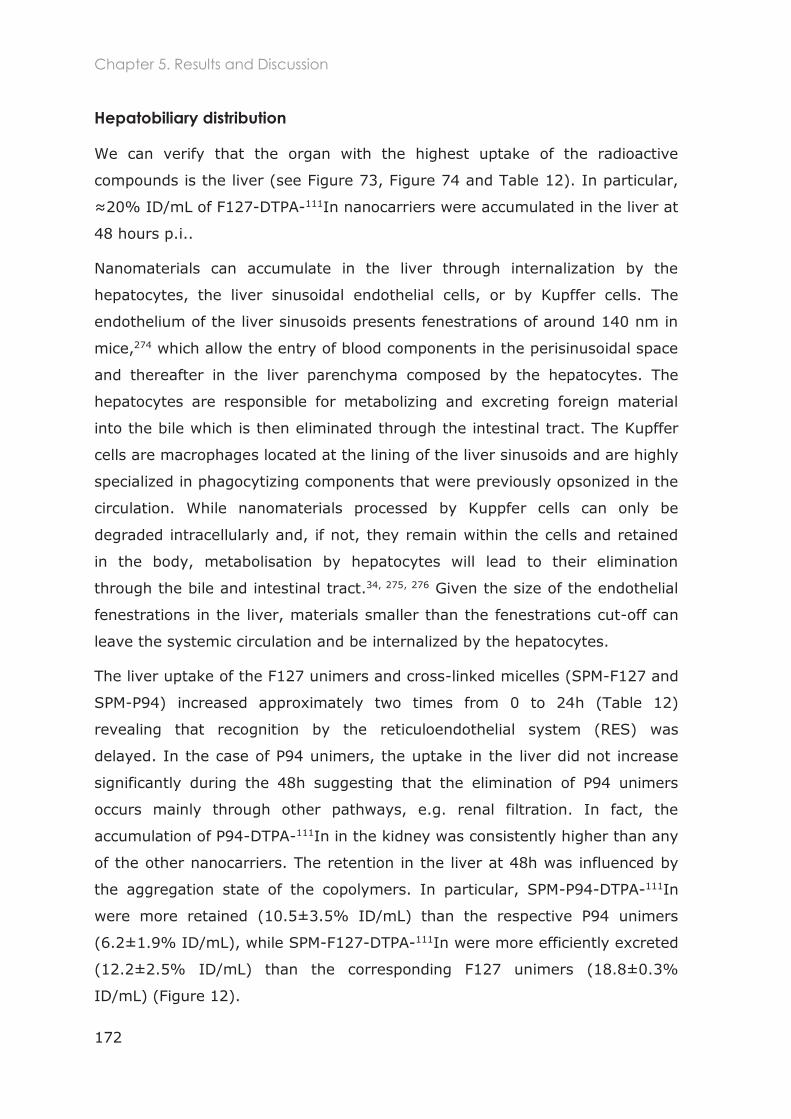
Chapter 5. Results and Discussion
172
Hepatobiliary distribution
We can verify that the organ with the highest uptake of the radioactive
compounds is the liver (see Figure 73, Figure 74 and Table 12). In particular,
20% ID/mL of F127-DTPA-111In nanocarriers were accumulated in the liver at
48 hours p.i..
Nanomaterials can accumulate in the liver through internalization by the
hepatocytes, the liver sinusoidal endothelial cells, or by Kupffer cells. The
endothelium of the liver sinusoids presents fenestrations of around 140 nm in
mice,274 which allow the entry of blood components in the perisinusoidal space
and thereafter in the liver parenchyma composed by the hepatocytes. The
hepatocytes are responsible for metabolizing and excreting foreign material
into the bile which is then eliminated through the intestinal tract. The Kupffer
cells are macrophages located at the lining of the liver sinusoids and are highly
specialized in phagocytizing components that were previously opsonized in the
circulation. While nanomaterials processed by Kuppfer cells can only be
degraded intracellularly and, if not, they remain within the cells and retained
in the body, metabolisation by hepatocytes will lead to their elimination
through the bile and intestinal tract.34, 275, 276 Given the size of the endothelial
fenestrations in the liver, materials smaller than the fenestrations cut-off can
leave the systemic circulation and be internalized by the hepatocytes.
The liver uptake of the F127 unimers and cross-linked micelles (SPM-F127 and
SPM-P94) increased approximately two times from 0 to 24h (Table 12)
revealing that recognition by the reticuloendothelial system (RES) was
delayed. In the case of P94 unimers, the uptake in the liver did not increase
significantly during the 48h suggesting that the elimination of P94 unimers
occurs mainly through other pathways, e.g. renal filtration. In fact, the
accumulation of P94-DTPA-111In in the kidney was consistently higher than any
of the other nanocarriers. The retention in the liver at 48h was influenced by
the aggregation state of the copolymers. In particular, SPM-P94-DTPA-111In
were more retained (10.5±3.5% ID/mL) than the respective P94 unimers
(6.2±1.9% ID/mL), while SPM-F127-DTPA-111In were more efficiently excreted
(12.2±2.5% ID/mL) than the corresponding F127 unimers (18.8±0.3%
ID/mL) (Figure 12).
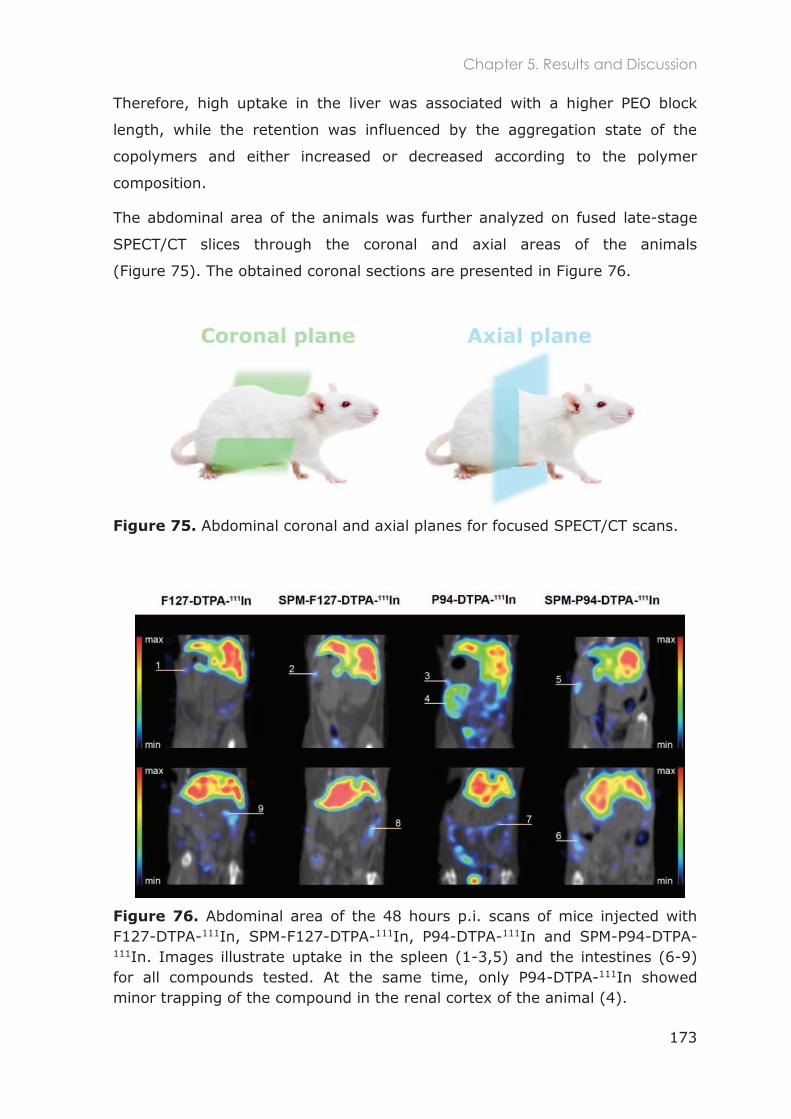
Chapter 5. Results and Discussion
173
Therefore, high uptake in the liver was associated with a higher PEO block
length, while the retention was influenced by the aggregation state of the
copolymers and either increased or decreased according to the polymer
composition.
The abdominal area of the animals was further analyzed on fused late-stage
SPECT/CT slices through the coronal and axial areas of the animals
(Figure 75). The obtained coronal sections are presented in Figure 76.
Figure 75. Abdominal coronal and axial planes for focused SPECT/CT scans.
Figure 76. Abdominal area of the 48 hours p.i. scans of mice injected with F127-DTPA-111In, SPM-F127-DTPA-111In, P94-DTPA-111In and SPM-P94-DTPA-111In. Images illustrate uptake in the spleen (1-3,5) and the intestines (6-9) for all compounds tested. At the same time, only P94-DTPA-111In showed minor trapping of the compound in the renal cortex of the animal (4).
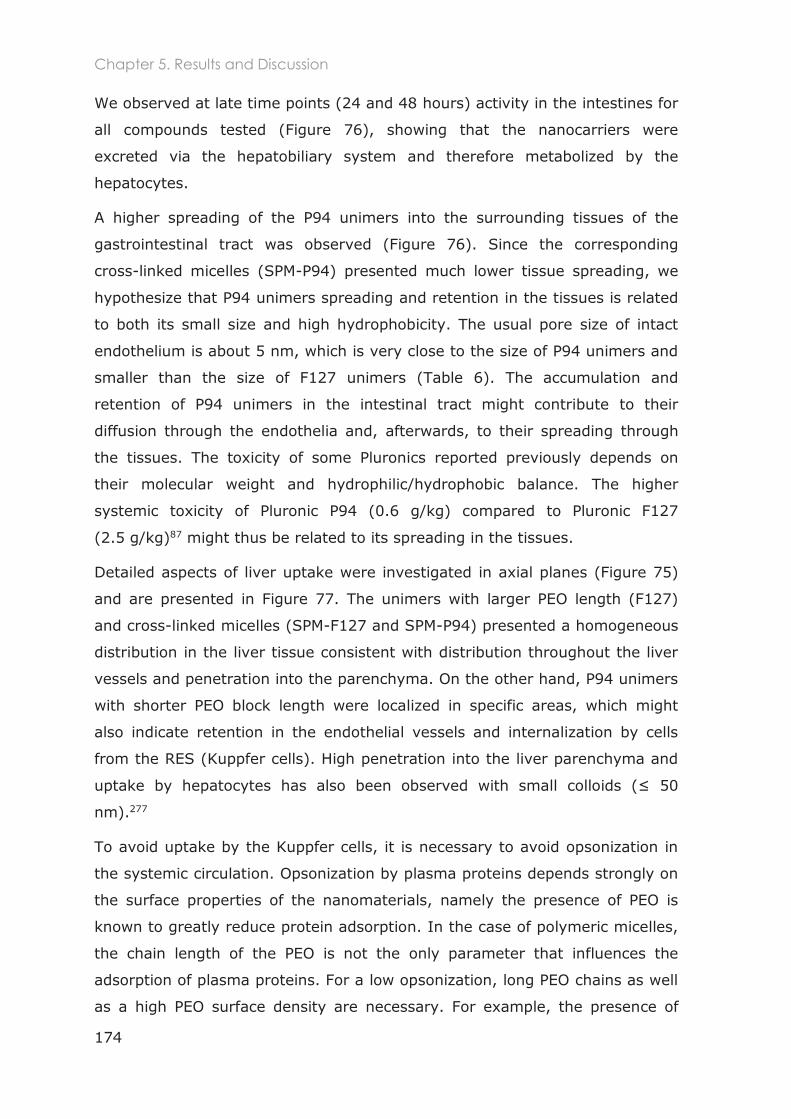
Chapter 5. Results and Discussion
174
We observed at late time points (24 and 48 hours) activity in the intestines for
all compounds tested (Figure 76), showing that the nanocarriers were
excreted via the hepatobiliary system and therefore metabolized by the
hepatocytes.
A higher spreading of the P94 unimers into the surrounding tissues of the
gastrointestinal tract was observed (Figure 76). Since the corresponding
cross-linked micelles (SPM-P94) presented much lower tissue spreading, we
hypothesize that P94 unimers spreading and retention in the tissues is related
to both its small size and high hydrophobicity. The usual pore size of intact
endothelium is about 5 nm, which is very close to the size of P94 unimers and
smaller than the size of F127 unimers (Table 6). The accumulation and
retention of P94 unimers in the intestinal tract might contribute to their
diffusion through the endothelia and, afterwards, to their spreading through
the tissues. The toxicity of some Pluronics reported previously depends on
their molecular weight and hydrophilic/hydrophobic balance. The higher
systemic toxicity of Pluronic P94 (0.6 g/kg) compared to Pluronic F127
(2.5 g/kg)87 might thus be related to its spreading in the tissues.
Detailed aspects of liver uptake were investigated in axial planes (Figure 75)
and are presented in Figure 77. The unimers with larger PEO length (F127)
and cross-linked micelles (SPM-F127 and SPM-P94) presented a homogeneous
distribution in the liver tissue consistent with distribution throughout the liver
vessels and penetration into the parenchyma. On the other hand, P94 unimers
with shorter PEO block length were localized in specific areas, which might
also indicate retention in the endothelial vessels and internalization by cells
from the RES (Kuppfer cells). High penetration into the liver parenchyma and
nm).277
To avoid uptake by the Kuppfer cells, it is necessary to avoid opsonization in
the systemic circulation. Opsonization by plasma proteins depends strongly on
the surface properties of the nanomaterials, namely the presence of PEO is
known to greatly reduce protein adsorption. In the case of polymeric micelles,
the chain length of the PEO is not the only parameter that influences the
adsorption of plasma proteins. For a low opsonization, long PEO chains as well
as a high PEO surface density are necessary. For example, the presence of
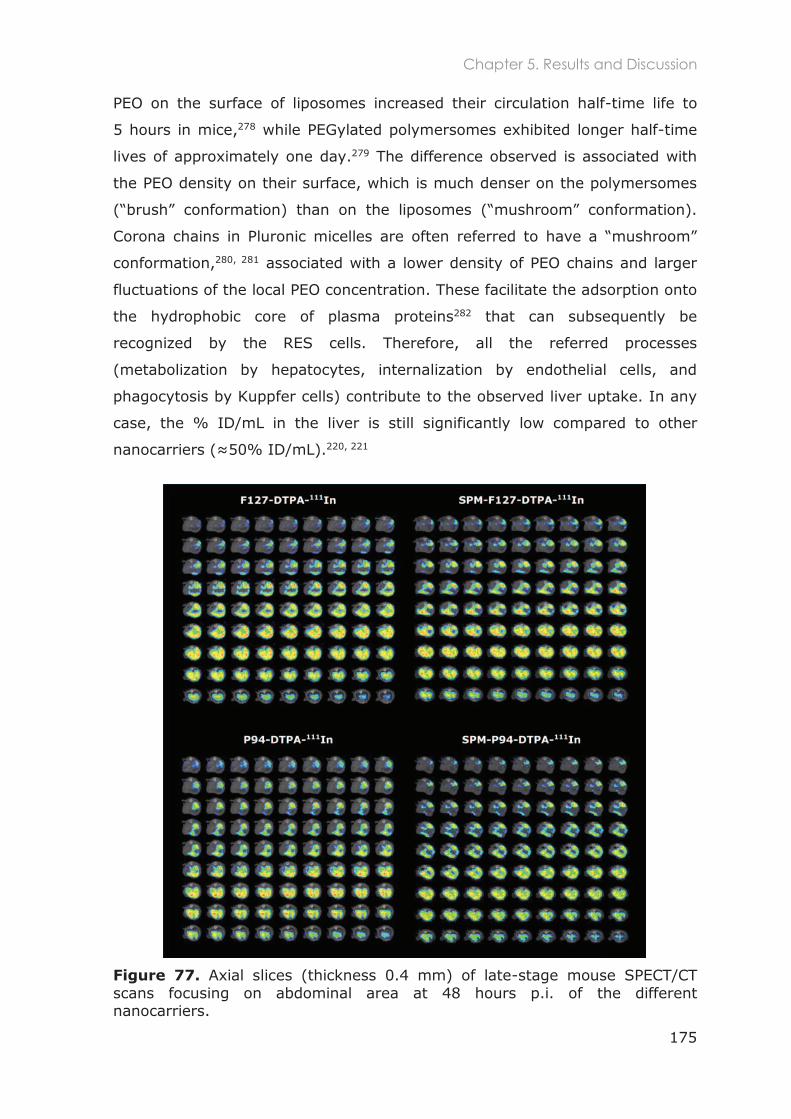
Chapter 5. Results and Discussion
175
PEO on the surface of liposomes increased their circulation half-time life to
5 hours in mice,278 while PEGylated polymersomes exhibited longer half-time
lives of approximately one day.279 The difference observed is associated with
the PEO density on their surface, which is much denser on the polymersomes
conformation,280, 281 associated with a lower density of PEO chains and larger
fluctuations of the local PEO concentration. These facilitate the adsorption onto
the hydrophobic core of plasma proteins282 that can subsequently be
recognized by the RES cells. Therefore, all the referred processes
(metabolization by hepatocytes, internalization by endothelial cells, and
phagocytosis by Kuppfer cells) contribute to the observed liver uptake. In any
case, the % ID/mL in the liver is still significantly low compared to other
nanocarriers 220, 221
Figure 77. Axial slices (thickness 0.4 mm) of late-stage mouse SPECT/CT scans focusing on abdominal area at 48 hours p.i. of the different nanocarriers.
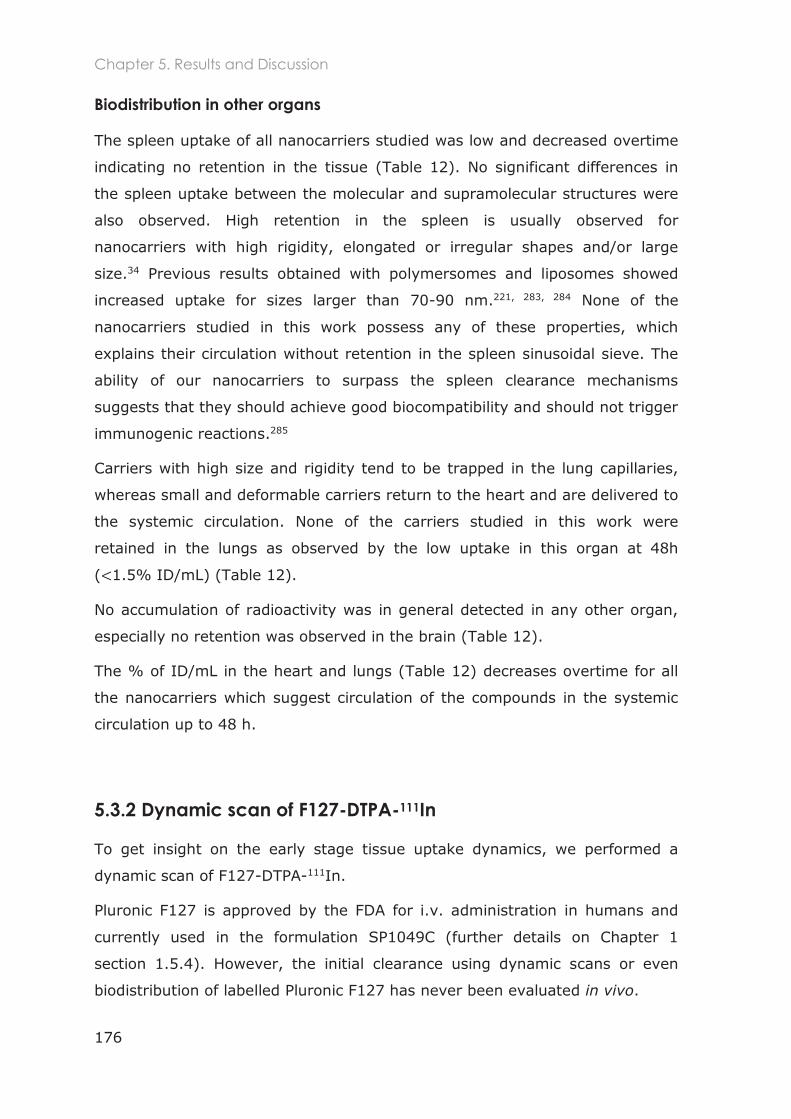
Chapter 5. Results and Discussion
176
Biodistribution in other organs
The spleen uptake of all nanocarriers studied was low and decreased overtime
indicating no retention in the tissue (Table 12). No significant differences in
the spleen uptake between the molecular and supramolecular structures were
also observed. High retention in the spleen is usually observed for
nanocarriers with high rigidity, elongated or irregular shapes and/or large
size.34 Previous results obtained with polymersomes and liposomes showed
increased uptake for sizes larger than 70-90 nm.221, 283, 284 None of the
nanocarriers studied in this work possess any of these properties, which
explains their circulation without retention in the spleen sinusoidal sieve. The
ability of our nanocarriers to surpass the spleen clearance mechanisms
suggests that they should achieve good biocompatibility and should not trigger
immunogenic reactions.285
Carriers with high size and rigidity tend to be trapped in the lung capillaries,
whereas small and deformable carriers return to the heart and are delivered to
the systemic circulation. None of the carriers studied in this work were
retained in the lungs as observed by the low uptake in this organ at 48h
( 1.5% ID/mL) (Table 12).
No accumulation of radioactivity was in general detected in any other organ,
especially no retention was observed in the brain (Table 12).
The % of ID/mL in the heart and lungs (Table 12) decreases overtime for all
the nanocarriers which suggest circulation of the compounds in the systemic
circulation up to 48 h.
5.3.2 Dynamic scan of F127-DTPA-111In
To get insight on the early stage tissue uptake dynamics, we performed a
dynamic scan of F127-DTPA-111In.
Pluronic F127 is approved by the FDA for i.v. administration in humans and
currently used in the formulation SP1049C (further details on Chapter 1
section 1.5.4). However, the initial clearance using dynamic scans or even
biodistribution of labelled Pluronic F127 has never been evaluated in vivo.
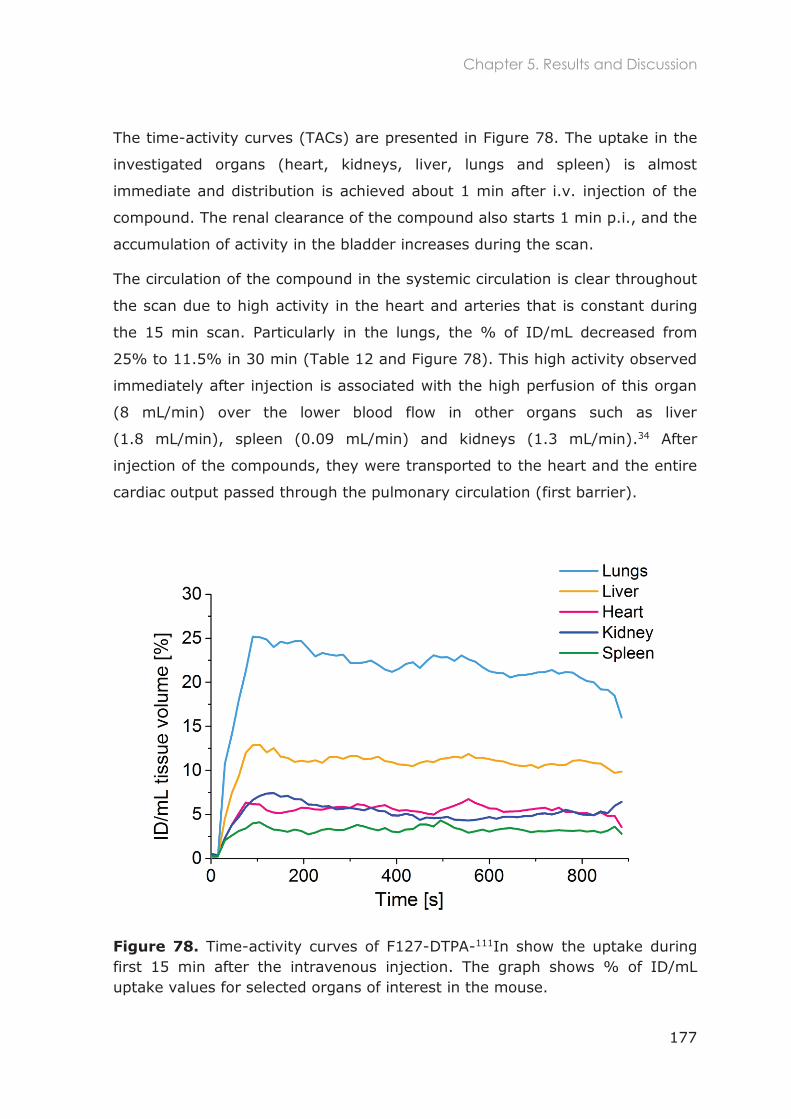
Chapter 5. Results and Discussion
177
The time-activity curves (TACs) are presented in Figure 78. The uptake in the
investigated organs (heart, kidneys, liver, lungs and spleen) is almost
immediate and distribution is achieved about 1 min after i.v. injection of the
compound. The renal clearance of the compound also starts 1 min p.i., and the
accumulation of activity in the bladder increases during the scan.
The circulation of the compound in the systemic circulation is clear throughout
the scan due to high activity in the heart and arteries that is constant during
the 15 min scan. Particularly in the lungs, the % of ID/mL decreased from
25% to 11.5% in 30 min (Table 12 and Figure 78). This high activity observed
immediately after injection is associated with the high perfusion of this organ
(8 mL/min) over the lower blood flow in other organs such as liver
(1.8 mL/min), spleen (0.09 mL/min) and kidneys (1.3 mL/min).34 After
injection of the compounds, they were transported to the heart and the entire
cardiac output passed through the pulmonary circulation (first barrier).
Figure 78. Time-activity curves of F127-DTPA-111In show the uptake during first 15 min after the intravenous injection. The graph shows % of ID/mL uptake values for selected organs of interest in the mouse.

178
Chapter 5. Conclusions
179
5.4 Conclusions
We developed a new strategy that enabled the in vivo comparison of molecular
and core-stabilized supramolecular nanocarriers based on Pluronics. This new
approach eliminates the recurrent limitation associated with the dynamic
nature of copolymer micelles and allows us to use similar concentrations of
both types of nanocarriers, which yields a more meaningful comparison of
their biodistribution. After labelling the nanocarriers with the gamma-emitter 111In (Chapter 3 section 3.2.10), their biodistribution was evaluated in healthy
mice using SPECT/CT imaging. The effects of varying the PEO block length and
aggregation state of Pluronic copolymers were then assessed.
All tested nanocarriers showed fast uptake in the studied organs (heart,
kidneys, liver, lungs and spleen) followed by a steady elimination mainly
through the hepatobiliary tract and renal filtration. The uptake in the different
organs was found to decrease in two steps. The first one occurred in short
times of the order of 1h and can be mostly attributed to the molecular weight
in the case of the unimers, and to the transchelation of 111In to serum proteins
and renal elimination of the complexes for the cross-linked micelles. The
second step was observed on time scales of the order of several hours and
contributes to the significant decrease of the uptake at 24h p.i. in all studied
organs, except the liver. This second step is mainly associated with
metabolization of the nanocarriers in the liver followed by elimination through
the hepatobiliary tract, with an additional direct renal clearance for the
smallest P94-DTPA-111In carriers. Retention of the nanocarriers in the liver at
late-stage was influenced by the aggregation state of the carriers. Thus, we
can conclude that the PEO block length affected the initial renal clearance and
the uptake of the nanocarriers in the liver, while the aggregation state
influenced the retention of the carriers in the liver.
Our results suggest that varying the PEO block length, molecular weight and
aggregation state can lead to significant variations in the biodistribution profile
of Pluronic copolymers. Further work is in progress to evaluate their
theranostic potential in EPR-based cancer therapies.

180
General conclusions and future perspectives
181
General conclusions and future perspectives
This work was performed in the framework of the project
whose objective was to develop new molecular technology for nuclear imaging
and radionuclide therapy. In this context, we aimed at designing better
nanocarriers based on copolymer self-assembly.
In Chapter 1, general concepts were introduced to enable a clear
understanding of the different subjects explored in this thesis. We focused on
the importance of developing higher molecular weight agents (nanocarriers)
than the conventional low molecular weight drugs. However, many parameters
affect the nanocarriers performance and their optimum physicochemical
properties (e.g. molecular weight, size, shape, hydrophobic/hydrophilic ratio,
blocks size, charge) are still far from being completely understood.
We have selected well-known triblock copolymers of PEO-PPO-PEO (Pluronics)
which have been extensively used in academic studies as well as for
biomedical applications. These copolymers can be used as single polymer
chains, or they can aggregate and be used as spherical or elongated micelles.
Therefore, they provide a versatile platform for the development of molecular
and supramolecular nanostructures, and for the comparison of their biological
effects among other many possibilities.
We started by the fundamental study of the sphere-to-rod transition kinetics
of Pluronic copolymers with constant PEO (40%) and modest increases of the
molecular weight (Chapter 2). The cmT was decreased to room temperature
using a water structure maker salt (NaCl), and the kinetics of transformation
from spherical to elongated morphology were tracked using non-standard
time-resolved multiangle dynamic light scattering. This allowed us to identify
multiple competing kinetic pathways for the sphere-to-rod transformation and
eventual morphological control in various formulations.
The main new conclusion is that, in most experimental conditions, none of
these kinetic pathways can be neglected if one wants to understand the final
General conclusions and future perspectives
182
morphology of the aggregates. Moreover, even for modest increases of
molecular weight in the Pluronic series, equilibration of the micelles population
becomes very difficult on the time scale of weeks, and the structure of the
solutions becomes dependent on the specific thermal history of the sample.
These results helped us to better select the Pluronic composition if a spherical
or elongated morphology is intended. Moreover, this kinetic study showed the
necessity to stabilize the core-shell structure of the micelles to allow them to
withstand their dilution in the blood flow.
In Chapter 3, we presented new methods for the development and
functionalization of molecular (unimers) and supramolecular (spherical
micelles) nanocarriers based on Pluronic copolymers. We showed how
stabilization of Pluronic spherical micelles can be achieved by the incorporation
of a interpenetrated network composed of poly(PETA). Although this strategy
was not successful to stabilize the wormlike micelles, it revealed to be very
effective to stabilize spherical micelles and prevent their disassembly below
the cmc and cmT. It also stabilized the micelles in the presence of serum
proteins, and upon freeze-drying and redispersion in organic and aqueous
solvents. Moreover, it still allowed incorporation of hydrophobic molecules in
the micelles core after micelles stabilization.
We then developed innovative approaches to functionalize the molecular and
supramolecular systems with fluorescent probes and metallic chelators by
covalent attachment. We further discussed the radiolabeling of the
nanocarriers and the different aspects that need to be taken into account
when characterizing the radiolabeling efficiency and purification of the
radiolabeled carriers. We established the corresponding protocols for the
preparation and purification of samples ready for in vitro and in vivo use.
Moreover, the new strategies and techniques herein described can be
generalized to create a great versatility of nanocarriers with other
functionalities by combining appropriate molecular modifications and/or load.
This lets envision the coupling of specific active targets to the molecular
nanocarriers. For instance, this can include targeting of extracellular receptors
like hormones (e.g. somatostatin), neuropeptides and growth factors, or
intracellular targets such as specific metabolic pathways or the DNA/RNA. On
General conclusions and future perspectives
183
the other hand, the supramolecular nanocarriers can be very useful to deliver
hydrophobic drugs through their incorporation in the micelles core. This
incorporation can be achieved via electrostatic interactions, by covalent linking
to the copolymer using biodegradable bonds, or can even be through
incorporation in the cross-linked interpenetrated network of poly(PETA). The
latter can eventually provide a controlled drug release as micelles are
metabolized by the lysosomes.
Chapter 4 was dedicated to the assessment of the in vitro interactions of the
nanocarriers using 2D and 3D cell cultures. The aim of this research was to
investigate the influence of the PEO block length and aggregation state
parameters on the interactions with healthy and cancer cells. We concluded
that the presence of the interpenetrating polymer network of poly(PETA) does
not increase cytotoxicity, and delivering physically incorporated hydrophobic
content is still possible.
By varying the nanocarriers properties, different internalization pathways were
activated, which ultimately lead to different intracellular localization. The
molecular nanocarriers entered via caveolae-mediated endocytosis and, if they
were smaller than the nuclear pore complexes
enter the nucleus by passive diffusion. The supramolecular carriers were
processes by the clathrin-mediated pathway and were therefore retained in
acidic compartments as verified by co-localization with the lysosomes. The
uptake and exocytosis kinetics profiles were also influenced by the
physicochemical properties of the carriers, with a higher internalization and
retention associated to the molecular nanocarriers with the shortest PEO block
length. As far as we know, this is the first demonstration of the possibility to
select the intracellular localization by tuning simple molecular parameters of
the Pluronic copolymers without changing their chemical nature.
In this chapter we also concluded that cross-linked nanocarriers penetrate
more efficiently into cellular aggregates, and nanocarriers composed by
hydrophobic Pluronic copolymers can significantly alter the morphology of
tumor spheroids. All these features open new possibilities for the clinical
applications of Pluronic-based nanocarriers such as the delivery of
chemotherapeutic drugs and/or gene therapy.
General conclusions and future perspectives
184
Chapter 5 focused on the in vivo behavior of the developed nanocarriers in
healthy mice. Radiolabeling of the nanocarriers with 111In allowed the
non-invasive in vivo monitoring of the nanocarriers and the preclinical
assessment of their efficacy. A more thorough understanding of the key
parameters that determine the in vivo fate of the carriers was therefore
obtained. Both the PEO block length and the aggregation state influenced the
biodistribution, and the early and late clearances of the carriers. A higher PEO
block length was associated to higher liver uptake, and the retention in the
liver was influenced by the aggregation state of the copolymers. We also
observed that the stability of the DTPA-111In complexes in the nanocarriers
surface can be affected by the interactions with the biological fluids, which can
compromise the assessment of the nanocarriers biodistribution. Likewise, the
functionalization with other moieties can have a significant influence on their
biodistribution.
The results from this thesis demonstrate that a rational design needs to be
performed for the development of Pluronic nanocarriers, including fundamental
studies from the kinetics of micelles formation up to a thorough in vitro and
in vivo evaluation. Varying the physicochemical properties and
functionalization moieties can be used to limit the interactions with the
biological barriers, target specific intracellular organelles, enhance the
nanocarriers uptake and exocytosis kinetics, and/or increase the penetration
and toxicity into tumors.
We observed that predicting the optimal characteristics of an ideal nanocarrier
is not straightforward, and balancing the copolymer composition for efficient
delivery while keeping low toxicity profile is challenging. Moreover, following
the rational design, additional fine-tuning is required to balance the benefits
and drawbacks of each additional chemical modification.
Further work is in progress by the project partners to evaluate the potential
use of the herein developed systems on cancer theranostics based on the EPR
effect. The approach, the methods and protocols developed in this work can be
applied as well to a large variety of amphiphilic block copolymers based on
PEO, and can further allow the future design of advanced nanomedicines.
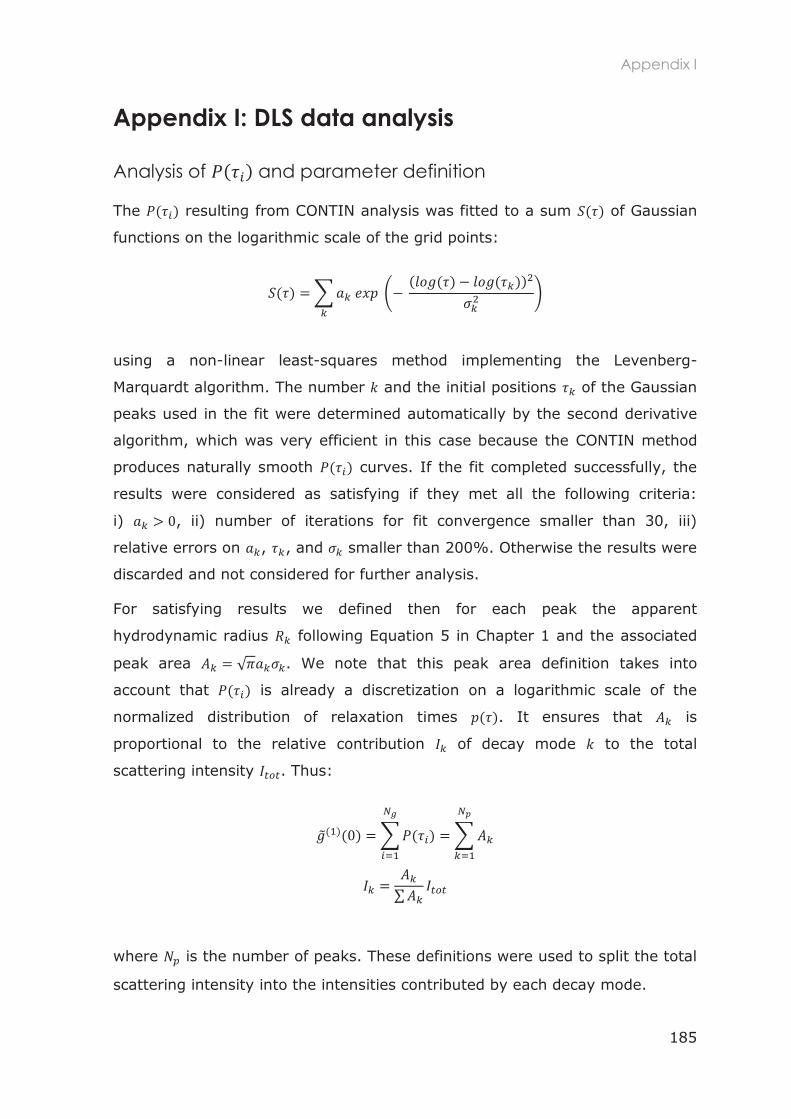
Appendix I
185
Appendix I: DLS data analysis
Analysis of and parameter definition
The resulting from CONTIN analysis was fitted to a sum of Gaussian
functions on the logarithmic scale of the grid points:
using a non-linear least-squares method implementing the Levenberg-
Marquardt algorithm. The number and the initial positions of the Gaussian
peaks used in the fit were determined automatically by the second derivative
algorithm, which was very efficient in this case because the CONTIN method
produces naturally smooth curves. If the fit completed successfully, the
results were considered as satisfying if they met all the following criteria:
i) , ii) number of iterations for fit convergence smaller than 30, iii)
relative errors on , , and smaller than 200%. Otherwise the results were
discarded and not considered for further analysis.
For satisfying results we defined then for each peak the apparent
hydrodynamic radius following Equation 5 in Chapter 1 and the associated
peak area . We note that this peak area definition takes into
account that is already a discretization on a logarithmic scale of the
normalized distribution of relaxation times . It ensures that is
proportional to the relative contribution of decay mode to the total
scattering intensity . Thus:
where is the number of peaks. These definitions were used to split the total
scattering intensity into the intensities contributed by each decay mode.
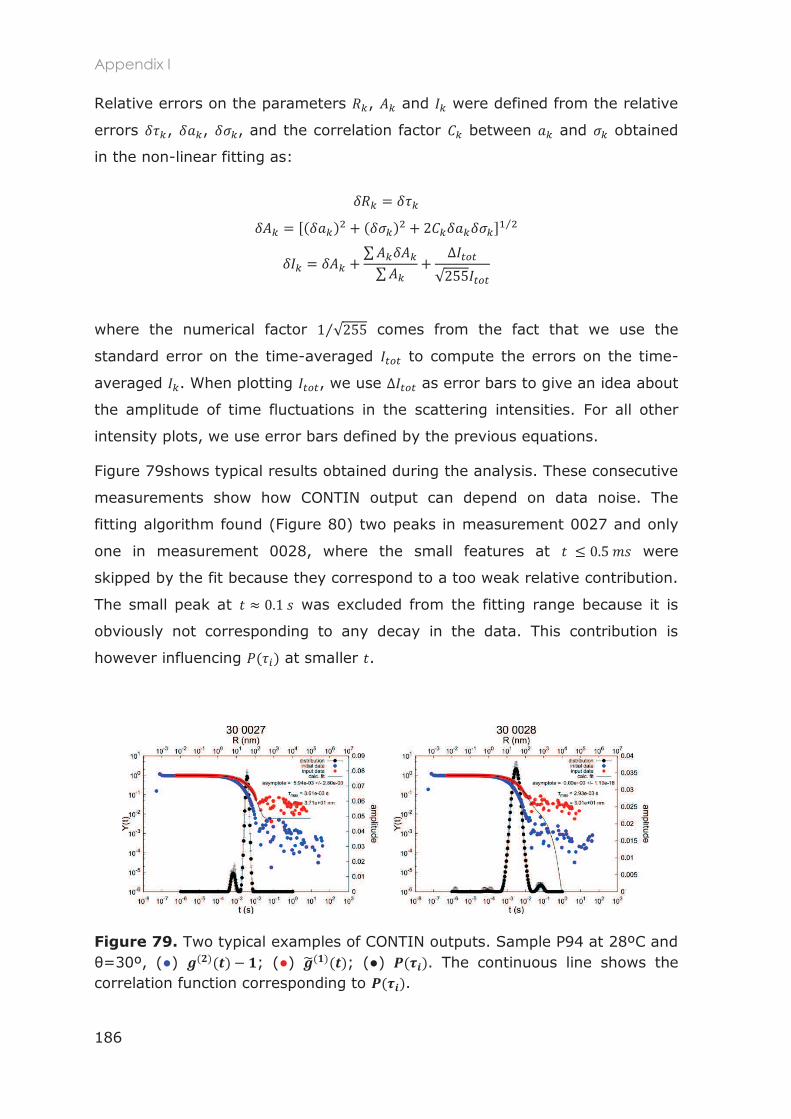
Appendix I
186
Relative errors on the parameters , and were defined from the relative
errors , , , and the correlation factor between and obtained
in the non-linear fitting as:
where the numerical factor comes from the fact that we use the
standard error on the time-averaged to compute the errors on the time-
averaged . When plotting , we use as error bars to give an idea about
the amplitude of time fluctuations in the scattering intensities. For all other
intensity plots, we use error bars defined by the previous equations.
Figure 79shows typical results obtained during the analysis. These consecutive
measurements show how CONTIN output can depend on data noise. The
fitting algorithm found (Figure 80) two peaks in measurement 0027 and only
one in measurement 0028, where the small features at were
skipped by the fit because they correspond to a too weak relative contribution.
The small peak at was excluded from the fitting range because it is
obviously not corresponding to any decay in the data. This contribution is
however influencing at smaller .
Figure 79. Two typical examples of CONTIN outputs. Sample P94 at 28ºC and ) ; ( ) ; ( ) . The continuous line shows the
correlation function corresponding to .
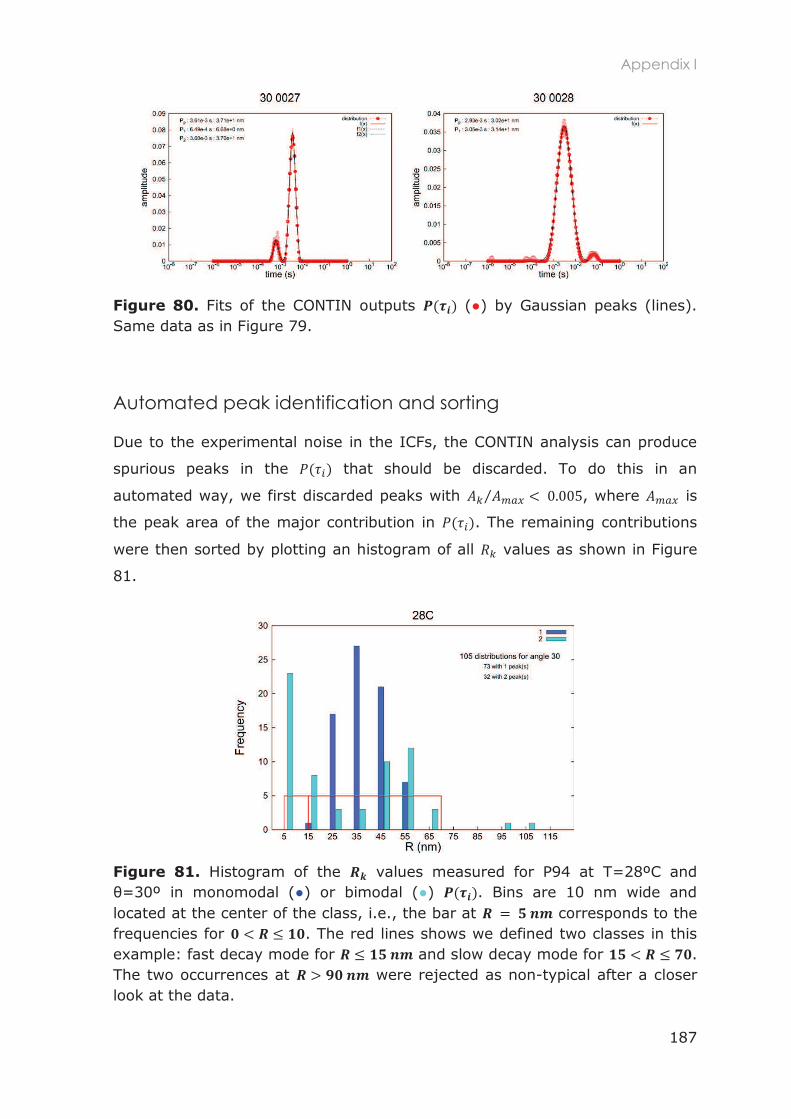
Appendix I
187
Figure 80. Fits of the CONTIN outputs ( ) by Gaussian peaks (lines). Same data as in Figure 79.
Automated peak identification and sorting
Due to the experimental noise in the ICFs, the CONTIN analysis can produce
spurious peaks in the that should be discarded. To do this in an
automated way, we first discarded peaks with , where is
the peak area of the major contribution in . The remaining contributions
were then sorted by plotting an histogram of all values as shown in Figure
81.
Figure 81. Histogram of the values measured for P94 at T=28ºC and =30º in monomodal ( ) or bimodal ( ) . Bins are 10 nm wide and
located at the center of the class, i.e., the bar at corresponds to the frequencies for . The red lines shows we defined two classes in this example: fast decay mode for and slow decay mode for . The two occurrences at were rejected as non-typical after a closer look at the data.
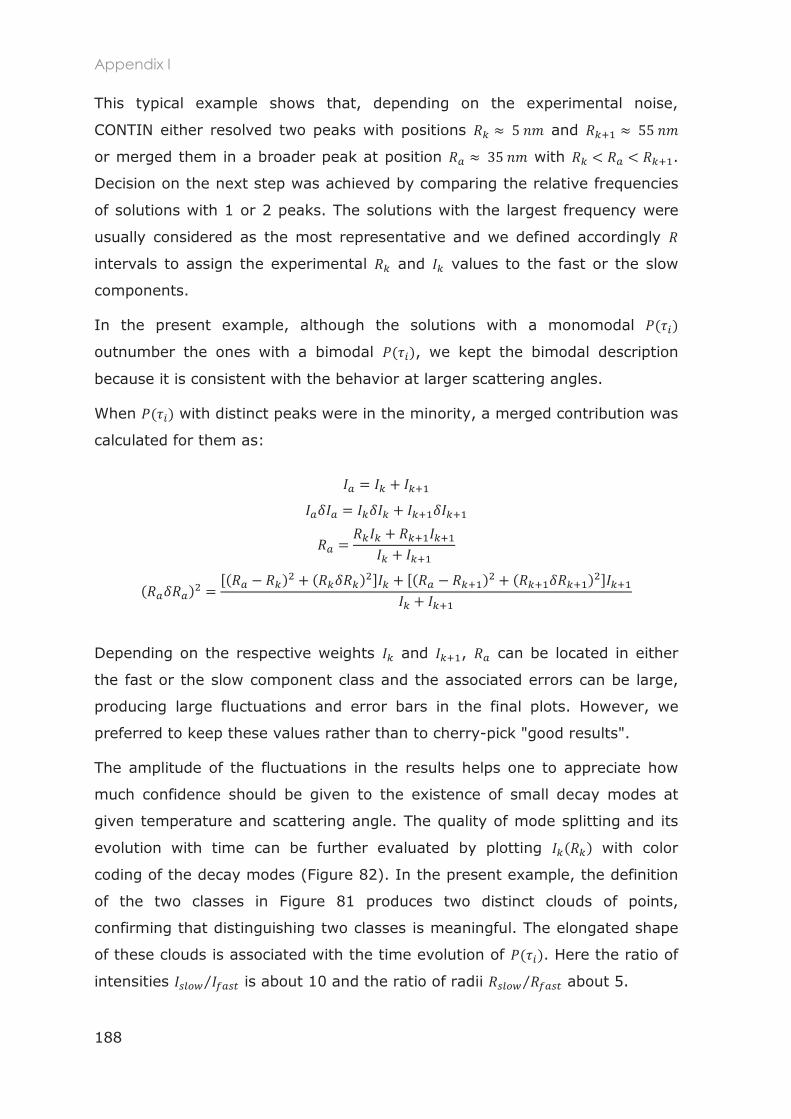
Appendix I
188
This typical example shows that, depending on the experimental noise,
CONTIN either resolved two peaks with positions and
or merged them in a broader peak at position with .
Decision on the next step was achieved by comparing the relative frequencies
of solutions with 1 or 2 peaks. The solutions with the largest frequency were
usually considered as the most representative and we defined accordingly
intervals to assign the experimental and values to the fast or the slow
components.
In the present example, although the solutions with a monomodal
outnumber the ones with a bimodal , we kept the bimodal description
because it is consistent with the behavior at larger scattering angles.
When with distinct peaks were in the minority, a merged contribution was
calculated for them as:
Depending on the respective weights and , can be located in either
the fast or the slow component class and the associated errors can be large,
producing large fluctuations and error bars in the final plots. However, we
preferred to keep these values rather than to cherry-pick "good results".
The amplitude of the fluctuations in the results helps one to appreciate how
much confidence should be given to the existence of small decay modes at
given temperature and scattering angle. The quality of mode splitting and its
evolution with time can be further evaluated by plotting with color
coding of the decay modes (Figure 82). In the present example, the definition
of the two classes in Figure 81 produces two distinct clouds of points,
confirming that distinguishing two classes is meaningful. The elongated shape
of these clouds is associated with the time evolution of . Here the ratio of
intensities is about 10 and the ratio of radii about 5.
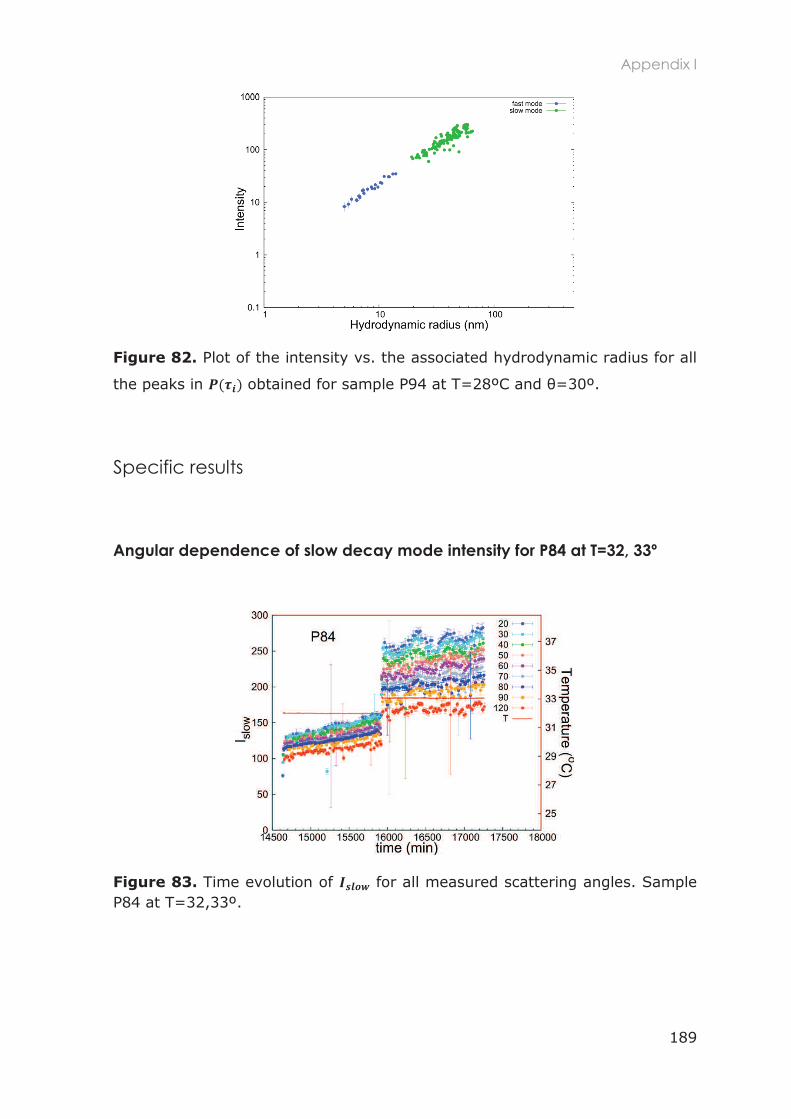
Appendix I
189
Figure 82. Plot of the intensity vs. the associated hydrodynamic radius for all
the peaks in obtained for sample P94 at T=28ºC and
Specific results
Angular dependence of slow decay mode intensity for P84 at T=32, 33º
Figure 83. Time evolution of for all measured scattering angles. Sample P84 at T=32,33º.
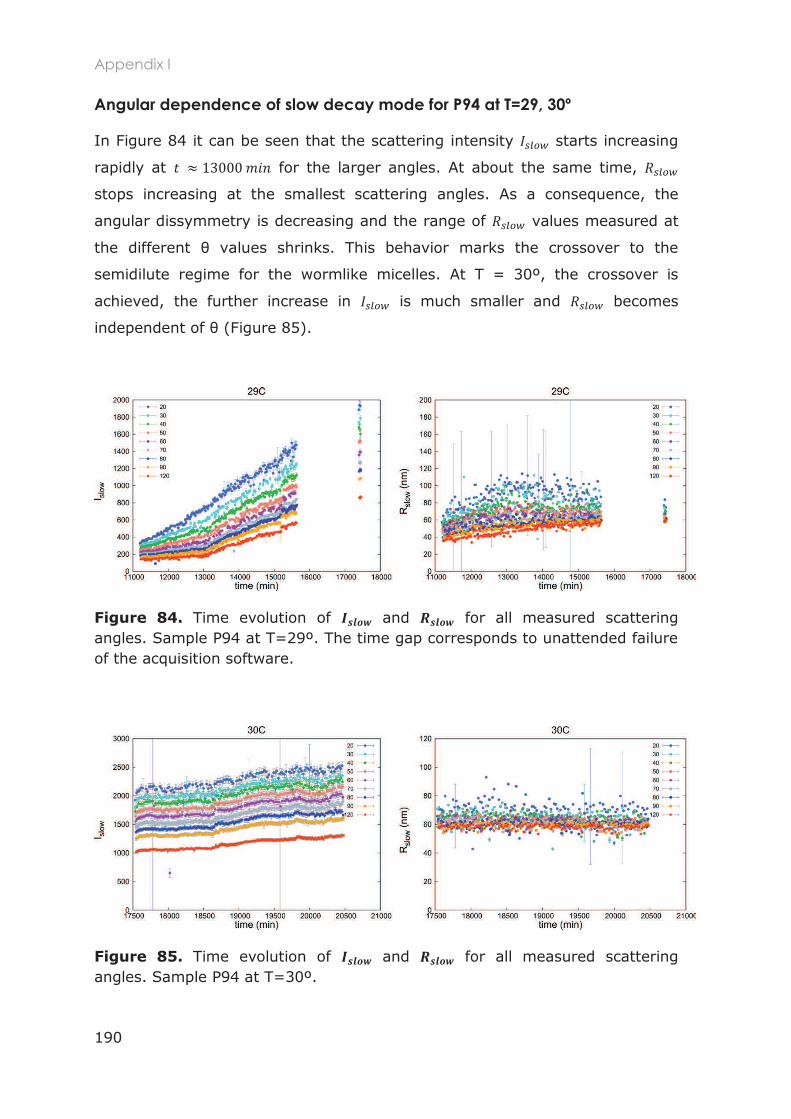
Appendix I
190
Angular dependence of slow decay mode for P94 at T=29, 30º
In Figure 84 it can be seen that the scattering intensity starts increasing
rapidly at for the larger angles. At about the same time,
stops increasing at the smallest scattering angles. As a consequence, the
angular dissymmetry is decreasing and the range of values measured at
the different
semidilute regime for the wormlike micelles. At T = 30º, the crossover is
achieved, the further increase in is much smaller and becomes
independent of (Figure 85).
Figure 84. Time evolution of and for all measured scattering angles. Sample P94 at T=29º. The time gap corresponds to unattended failure of the acquisition software.
Figure 85. Time evolution of and for all measured scattering angles. Sample P94 at T=30º.
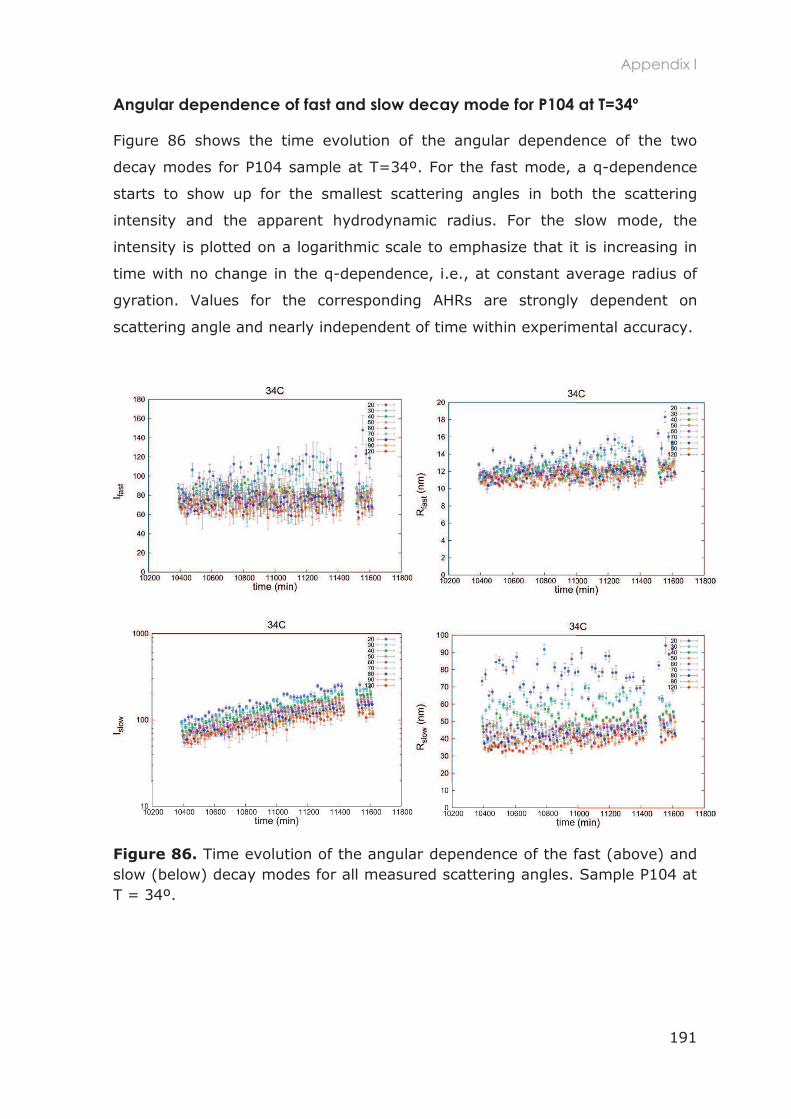
Appendix I
191
Angular dependence of fast and slow decay mode for P104 at T=34º
Figure 86 shows the time evolution of the angular dependence of the two
decay modes for P104 sample at T=34º. For the fast mode, a q-dependence
starts to show up for the smallest scattering angles in both the scattering
intensity and the apparent hydrodynamic radius. For the slow mode, the
intensity is plotted on a logarithmic scale to emphasize that it is increasing in
time with no change in the q-dependence, i.e., at constant average radius of
gyration. Values for the corresponding AHRs are strongly dependent on
scattering angle and nearly independent of time within experimental accuracy.
Figure 86. Time evolution of the angular dependence of the fast (above) and slow (below) decay modes for all measured scattering angles. Sample P104 at T = 34º.

192
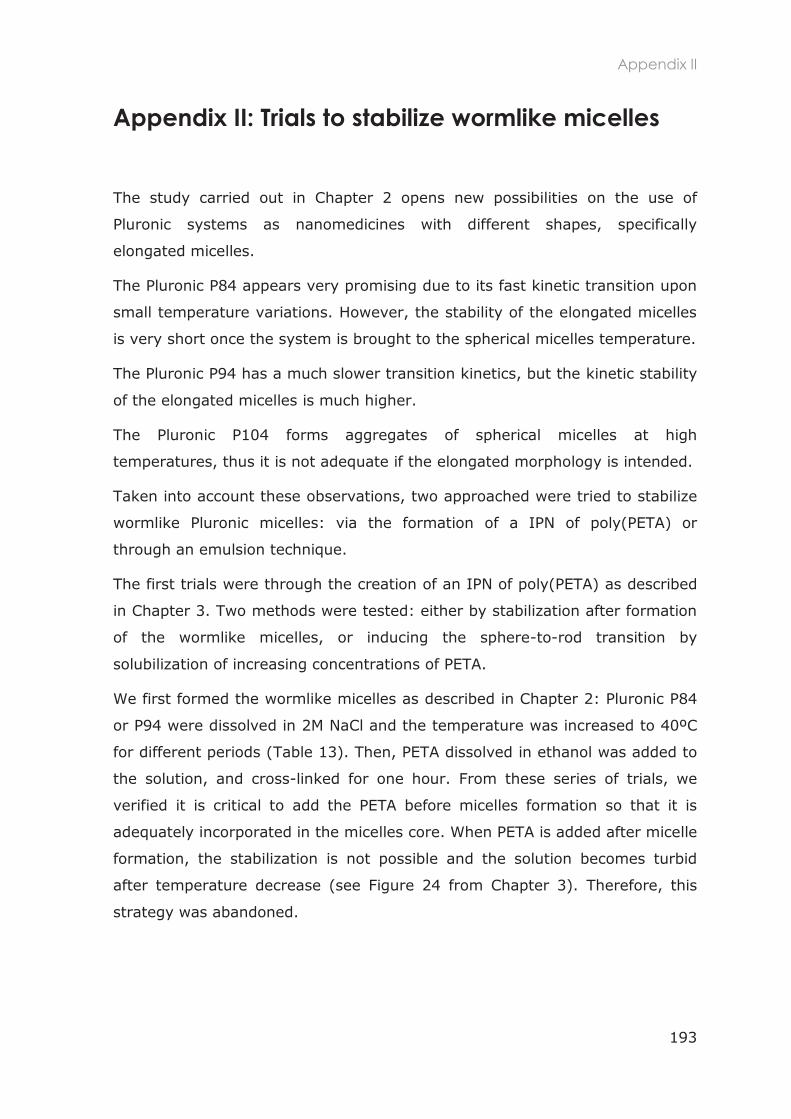
Appendix II
193
Appendix II: Trials to stabilize wormlike micelles
The study carried out in Chapter 2 opens new possibilities on the use of
Pluronic systems as nanomedicines with different shapes, specifically
elongated micelles.
The Pluronic P84 appears very promising due to its fast kinetic transition upon
small temperature variations. However, the stability of the elongated micelles
is very short once the system is brought to the spherical micelles temperature.
The Pluronic P94 has a much slower transition kinetics, but the kinetic stability
of the elongated micelles is much higher.
The Pluronic P104 forms aggregates of spherical micelles at high
temperatures, thus it is not adequate if the elongated morphology is intended.
Taken into account these observations, two approached were tried to stabilize
wormlike Pluronic micelles: via the formation of a IPN of poly(PETA) or
through an emulsion technique.
The first trials were through the creation of an IPN of poly(PETA) as described
in Chapter 3. Two methods were tested: either by stabilization after formation
of the wormlike micelles, or inducing the sphere-to-rod transition by
solubilization of increasing concentrations of PETA.
We first formed the wormlike micelles as described in Chapter 2: Pluronic P84
or P94 were dissolved in 2M NaCl and the temperature was increased to 40ºC
for different periods (Table 13). Then, PETA dissolved in ethanol was added to
the solution, and cross-linked for one hour. From these series of trials, we
verified it is critical to add the PETA before micelles formation so that it is
adequately incorporated in the micelles core. When PETA is added after micelle
formation, the stabilization is not possible and the solution becomes turbid
after temperature decrease (see Figure 24 from Chapter 3). Therefore, this
strategy was abandoned.
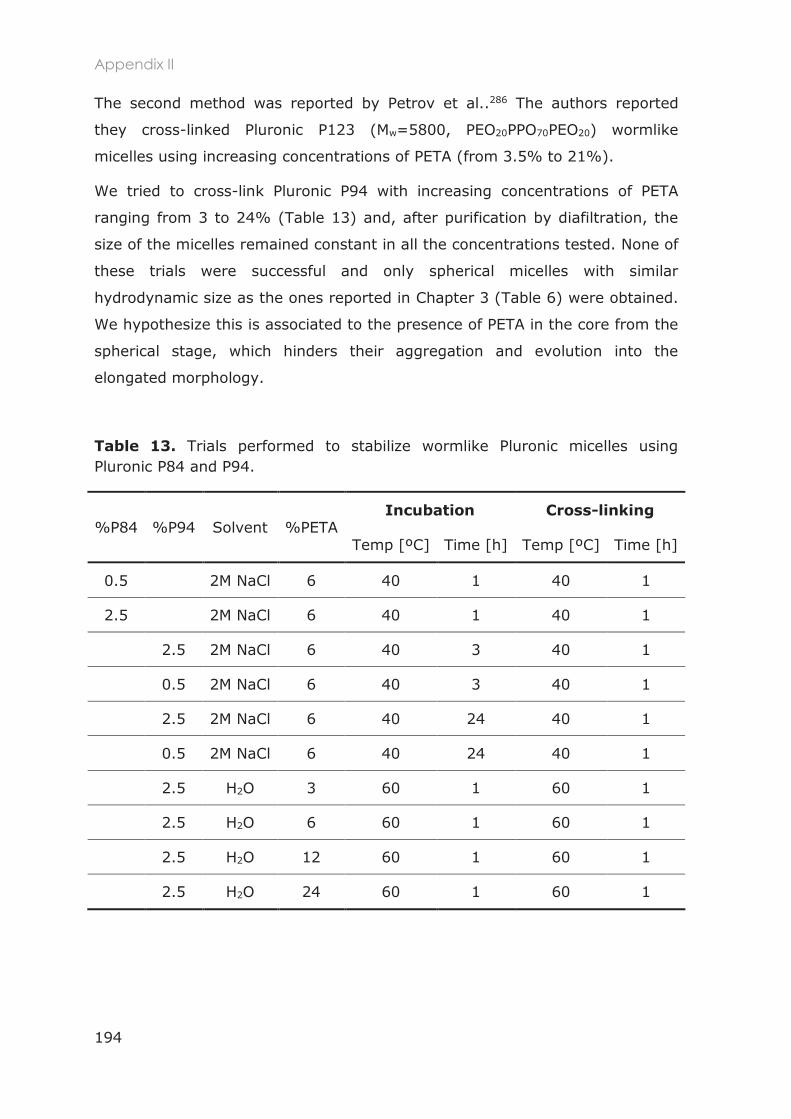
Appendix II
194
The second method was reported by Petrov et al..286 The authors reported
they cross-linked Pluronic P123 (Mw=5800, PEO20PPO70PEO20) wormlike
micelles using increasing concentrations of PETA (from 3.5% to 21%).
We tried to cross-link Pluronic P94 with increasing concentrations of PETA
ranging from 3 to 24% (Table 13) and, after purification by diafiltration, the
size of the micelles remained constant in all the concentrations tested. None of
these trials were successful and only spherical micelles with similar
hydrodynamic size as the ones reported in Chapter 3 (Table 6) were obtained.
We hypothesize this is associated to the presence of PETA in the core from the
spherical stage, which hinders their aggregation and evolution into the
elongated morphology.
Table 13. Trials performed to stabilize wormlike Pluronic micelles using Pluronic P84 and P94.
%P84 %P94 Solvent %PETA Incubation Cross-linking
Temp [ºC] Time [h] Temp [ºC] Time [h]
0.5 2M NaCl 6 40 1 40 1
2.5 2M NaCl 6 40 1 40 1
2.5 2M NaCl 6 40 3 40 1
0.5 2M NaCl 6 40 3 40 1
2.5 2M NaCl 6 40 24 40 1
0.5 2M NaCl 6 40 24 40 1
2.5 H2O 3 60 1 60 1
2.5 H2O 6 60 1 60 1
2.5 H2O 12 60 1 60 1
2.5 H2O 24 60 1 60 1
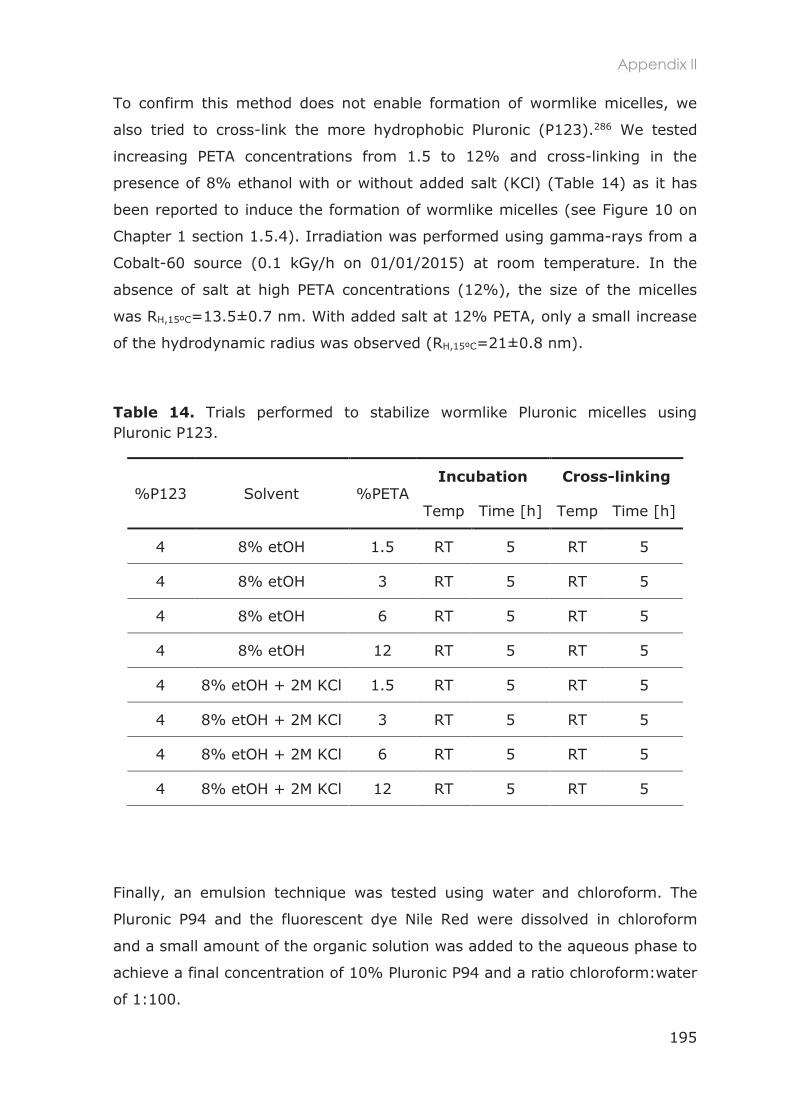
Appendix II
195
To confirm this method does not enable formation of wormlike micelles, we
also tried to cross-link the more hydrophobic Pluronic (P123).286 We tested
increasing PETA concentrations from 1.5 to 12% and cross-linking in the
presence of 8% ethanol with or without added salt (KCl) (Table 14) as it has
been reported to induce the formation of wormlike micelles (see Figure 10 on
Chapter 1 section 1.5.4). Irradiation was performed using gamma-rays from a
Cobalt-60 source (0.1 kGy/h on 01/01/2015) at room temperature. In the
absence of salt at high PETA concentrations (12%), the size of the micelles
was RH,15ºC=13.5±0.7 nm. With added salt at 12% PETA, only a small increase
of the hydrodynamic radius was observed (RH,15ºC=21±0.8 nm).
Table 14. Trials performed to stabilize wormlike Pluronic micelles using Pluronic P123.
%P123 Solvent %PETA Incubation Cross-linking
Temp Time [h] Temp Time [h]
4 8% etOH 1.5 RT 5 RT 5
4 8% etOH 3 RT 5 RT 5
4 8% etOH 6 RT 5 RT 5
4 8% etOH 12 RT 5 RT 5
4 8% etOH + 2M KCl 1.5 RT 5 RT 5
4 8% etOH + 2M KCl 3 RT 5 RT 5
4 8% etOH + 2M KCl 6 RT 5 RT 5
4 8% etOH + 2M KCl 12 RT 5 RT 5
Finally, an emulsion technique was tested using water and chloroform. The
Pluronic P94 and the fluorescent dye Nile Red were dissolved in chloroform
and a small amount of the organic solution was added to the aqueous phase to
achieve a final concentration of 10% Pluronic P94 and a ratio chloroform:water
of 1:100.
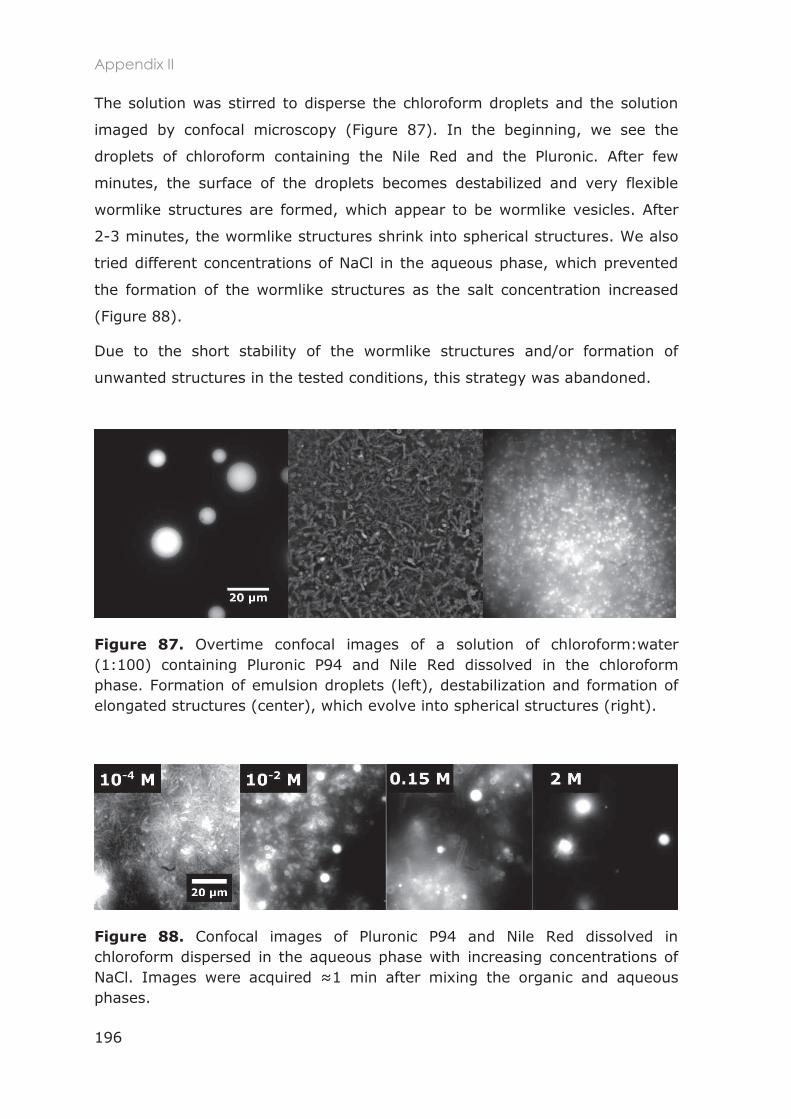
Appendix II
196
The solution was stirred to disperse the chloroform droplets and the solution
imaged by confocal microscopy (Figure 87). In the beginning, we see the
droplets of chloroform containing the Nile Red and the Pluronic. After few
minutes, the surface of the droplets becomes destabilized and very flexible
wormlike structures are formed, which appear to be wormlike vesicles. After
2-3 minutes, the wormlike structures shrink into spherical structures. We also
tried different concentrations of NaCl in the aqueous phase, which prevented
the formation of the wormlike structures as the salt concentration increased
(Figure 88).
Due to the short stability of the wormlike structures and/or formation of
unwanted structures in the tested conditions, this strategy was abandoned.
Figure 87. Overtime confocal images of a solution of chloroform:water (1:100) containing Pluronic P94 and Nile Red dissolved in the chloroform phase. Formation of emulsion droplets (left), destabilization and formation of elongated structures (center), which evolve into spherical structures (right).
Figure 88. Confocal images of Pluronic P94 and Nile Red dissolved in chloroform dispersed in the aqueous phase with increasing concentrations of NaCl. the organic and aqueous phases.
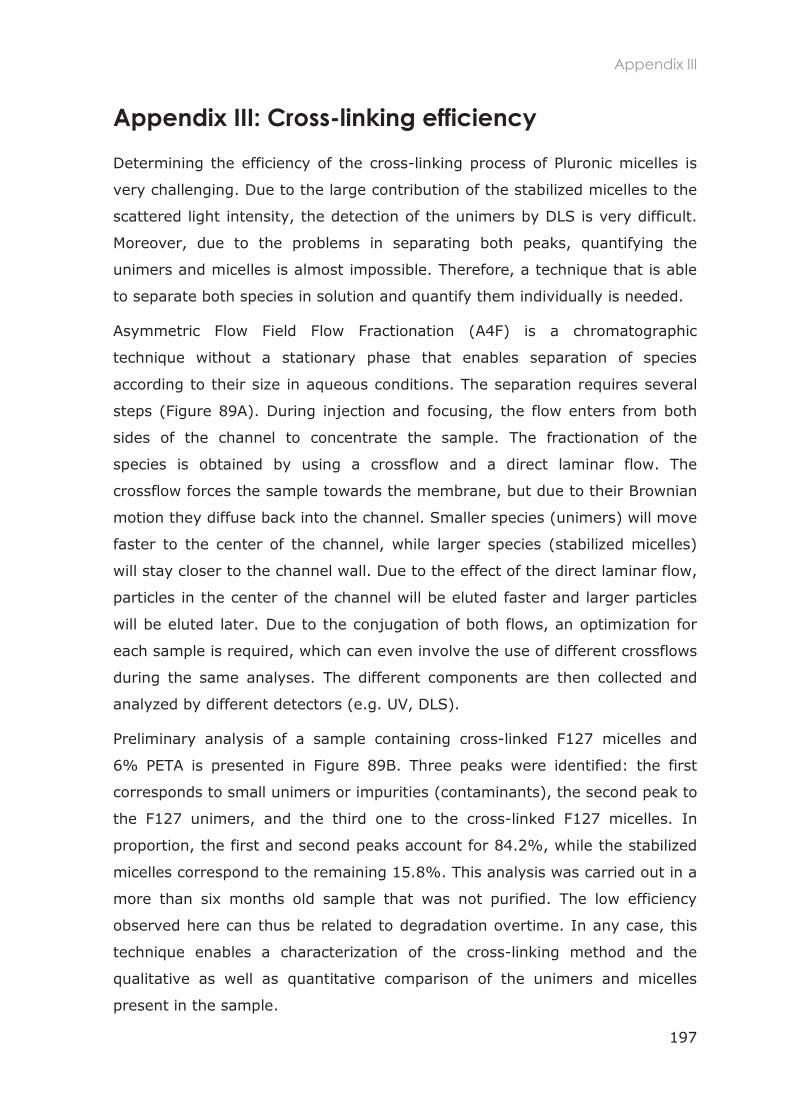
Appendix III
197
Appendix III: Cross-linking efficiency
Determining the efficiency of the cross-linking process of Pluronic micelles is
very challenging. Due to the large contribution of the stabilized micelles to the
scattered light intensity, the detection of the unimers by DLS is very difficult.
Moreover, due to the problems in separating both peaks, quantifying the
unimers and micelles is almost impossible. Therefore, a technique that is able
to separate both species in solution and quantify them individually is needed.
Asymmetric Flow Field Flow Fractionation (A4F) is a chromatographic
technique without a stationary phase that enables separation of species
according to their size in aqueous conditions. The separation requires several
steps (Figure 89A). During injection and focusing, the flow enters from both
sides of the channel to concentrate the sample. The fractionation of the
species is obtained by using a crossflow and a direct laminar flow. The
crossflow forces the sample towards the membrane, but due to their Brownian
motion they diffuse back into the channel. Smaller species (unimers) will move
faster to the center of the channel, while larger species (stabilized micelles)
will stay closer to the channel wall. Due to the effect of the direct laminar flow,
particles in the center of the channel will be eluted faster and larger particles
will be eluted later. Due to the conjugation of both flows, an optimization for
each sample is required, which can even involve the use of different crossflows
during the same analyses. The different components are then collected and
analyzed by different detectors (e.g. UV, DLS).
Preliminary analysis of a sample containing cross-linked F127 micelles and
6% PETA is presented in Figure 89B. Three peaks were identified: the first
corresponds to small unimers or impurities (contaminants), the second peak to
the F127 unimers, and the third one to the cross-linked F127 micelles. In
proportion, the first and second peaks account for 84.2%, while the stabilized
micelles correspond to the remaining 15.8%. This analysis was carried out in a
more than six months old sample that was not purified. The low efficiency
observed here can thus be related to degradation overtime. In any case, this
technique enables a characterization of the cross-linking method and the
qualitative as well as quantitative comparison of the unimers and micelles
present in the sample.
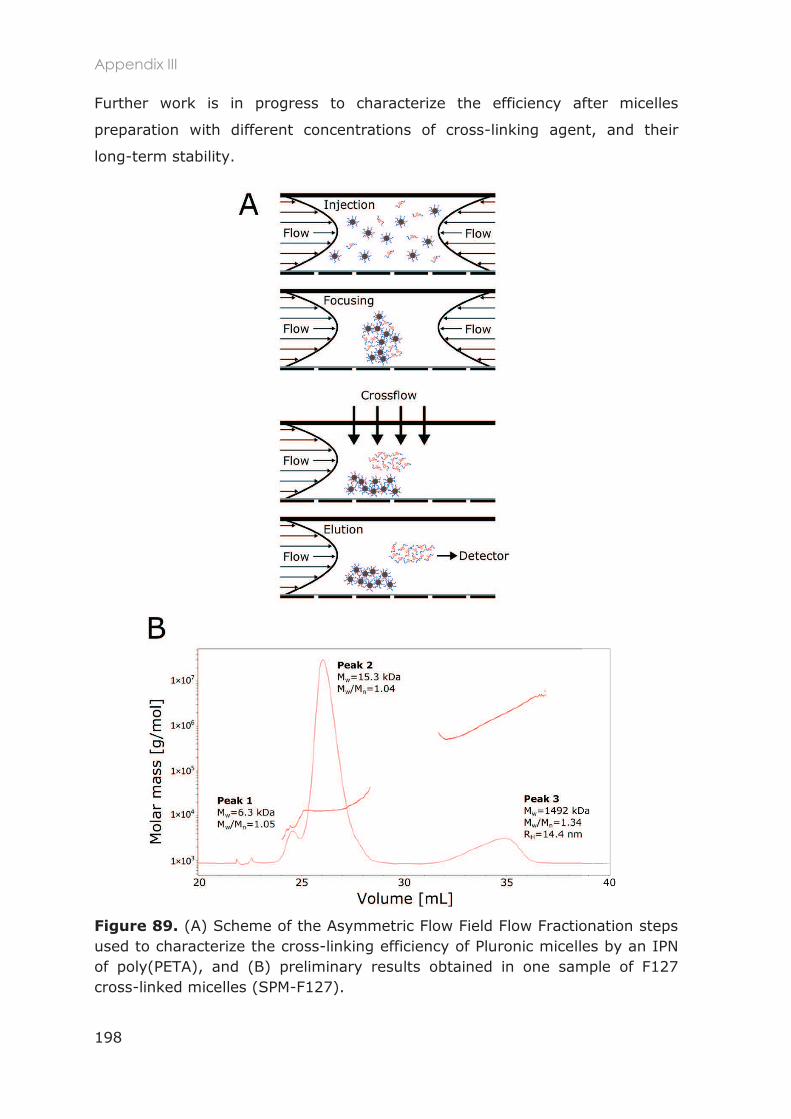
Appendix III
198
Further work is in progress to characterize the efficiency after micelles
preparation with different concentrations of cross-linking agent, and their
long-term stability.
Figure 89. (A) Scheme of the Asymmetric Flow Field Flow Fractionation steps used to characterize the cross-linking efficiency of Pluronic micelles by an IPN of poly(PETA), and (B) preliminary results obtained in one sample of F127 cross-linked micelles (SPM-F127).
References
199
References
1. T. Lammers, F. Kiessling, W. E. Hennink and G. Storm, J Control Release, 2012, 161, 175-187.
2. R. Duncan and R. Gaspar, Mol Pharm, 2011, 8, 2101-2141.
3. T. Lammers, V. Subr, P. Peschke, R. Kühnlein, W. E. Hennink, K. Ulbrich, F. Kiessling, M. Heilmann, J. Debus, P. E. Huber and G. Storm, Br J Cancer, 2008, 99, 900-910.
4. H. Soo Choi, W. Liu, P. Misra, E. Tanaka, J. P. Zimmer, B. Itty Ipe, M. G. Bawendi and J. V. Frangioni, Nat Biotech, 2007, 25, 1165-1170.
5. T. Lammers, W. E. Hennink and G. Storm, Br J Cancer, 2008, 99, 392-397.
6. X. Duan and Y. Li, Small, 2013, 9, 1521-1532.
7. lva, H. F. Florindo and R. S. Gaspar, Biochem Biophys Res Commun, 2015.
8. A. Gabizon, H. Shmeeda and Y. Barenholz, Clin Pharmacokinet, 2003, 42, 419-436.
9. S. Nakamura, H. Iwata, Y. Funato, K. Ito and Y. Ito, Gan To Kagaku Ryoho, 2015, 42, 447-455.
10. S. Sofou, Int J Nanomedicine, 2008, 3, 181-199.
11. A. B. de Barros, A. Tsourkas, B. Saboury, V. N. Cardoso and A. Alavi, EJNMMI
Res, 2012, 2, 2-39.
12. M. R. Stratton, P. J. Campbell and P. A. Futreal, Nature, 2009, 458, 719-724.
13. J. M. Irish, N. Kotecha and G. P. Nolan, Nat Rev Cancer, 2006, 6, 146-155.
14. R. Liu, B. K. Kay, S. Jiang and S. Chen, MRS Bulletin, 2009, 34, 432-440.
15. P. P. Di Fiore, J. H. Pierce, T. P. Fleming, R. Hazan, A. Ullrich, C. R. King, J. Schlessinger and S. A. Aaronson, Cell, 1987, 51, 1063-1070.
16. L. E. Kelemen, Int J Cancer, 2006, 119, 243-250.
17. J. Albanell, J. Codony, A. Rovira, B. Mellado and P. Gascon, Adv Exp Med Biol, 2003, 532, 253-268.
18. F. Danhier, O. Feron and V. Preat, J Control Release, 2010, 148, 135-146.
19. D. B. Kirpotin, D. C. Drummond, Y. Shao, M. R. Shalaby, K. Hong, U. B. Nielsen, J. D. Marks, C. C. Benz and J. W. Park, Cancer Res, 2006, 66, 6732-6740.
20. D. W. Siemann, Cancer Treat Rev, 2011, 37, 63-74.
21. H. Maeda, H. Nakamura and J. Fang, Adv Drug Deliv Rev, 2013, 65, 71-79.
22. M. I. Koukourakis, S. Koukouraki, A. Giatromanolaki, S. Kakolyris, V. Georgoulias, A. Velidaki, S. Archimandritis and N. N. Karkavitsas, Acta Oncol, 2000, 39, 207-211.
23. M. I. Koukourakis, S. Koukouraki, I. Fezoulidis, N. Kelekis, G. Kyrias, S. Archimandritis and N. Karkavitsas, Br J Cancer, 2000, 83, 1281-1286.
24. K. J. Harrington, S. Mohammadtaghi, P. S. Uster, D. Glass, A. M. Peters, R. G. Vile and J. S. Stewart, Clin Cancer Res, 2001, 7, 243-254.
25. J. Fang, H. Nakamura and H. Maeda, Adv Drug Deliv Rev, 2011, 63, 136-151.
References
200
26. M. K. Danquah, X. A. Zhang and R. I. Mahato, Adv Drug Deliv Rev, 2011, 63, 623-639.
27. J. Ehling, B. Theek, F. Gremse, S. Baetke, D. Mockel, J. Maynard, S. A. Ricketts, H. Grull, M. Neeman, R. Knuechel, W. Lederle, F. Kiessling and T. Lammers, Am J
Pathol, 2014, 184, 431-441.
28. S. K. Hobbs, W. L. Monsky, F. Yuan, W. G. Roberts, L. Griffith, V. P. Torchilin and R. K. Jain, Proc Natl Acad Sci U S A, 1998, 95, 4607-4612.
29. F. Yuan, M. Dellian, D. Fukumura, M. Leunig, D. A. Berk, V. P. Torchilin and R. K. Jain, Cancer Res, 1995, 55, 3752-3756.
30. B. Theek, F. Gremse, S. Kunjachan, S. Fokong, R. Pola, M. Pechar, R. Deckers, G. Storm, J. Ehling, F. Kiessling and T. Lammers, J Control Release, 2014, 182, 83-89.
31. T. Lammers, Adv Drug Deliv Rev, 2010, 62, 203-230.
32. K. Riehemann, S. W. Schneider, T. A. Luger, B. Godin, M. Ferrari and H. Fuchs, Angew Chem Int Ed Engl, 2009, 48, 872-897.
33. W. R. Sanhai, J. H. Sakamoto, R. Canady and M. Ferrari, Nat Nano, 2008, 3, 242-244.
34. N. Bertrand and J. C. Leroux, J Control Release, 2012, 161, 152-163.
35. P. Decuzzi, B. Godin, T. Tanaka, S. Y. Lee, C. Chiappini, X. Liu and M. Ferrari, J Control Release, 2010, 141, 320-327.
36. E. A. Simone, T. D. Dziubla and V. R. Muzykantov, Expert Opin Drug Deliv, 2008, 5, 1283-1300.
37. H. S. Choi, B. I. Ipe, P. Misra, J. H. Lee, M. G. Bawendi and J. V. Frangioni, Nano
Lett, 2009, 9, 2354-2359.
38. Y. Geng, P. Dalhaimer, S. Cai, R. Tsai, M. Tewari, T. Minko and D. E. Discher, Nat
Nano, 2007, 2, 249-255.
39. X. Huang, L. Li, T. Liu, N. Hao, H. Liu, D. Chen and F. Tang, ACS Nano, 2011, 5, 5390-5399.
40. J. Fang, H. Nakamura and H. Maeda, Adv. Drug Delivery Rev., 2011, 63, 136-151.
41. N. Rapoport, A. Marin, Y. Luo, G. D. Prestwich and M. D. Muniruzzaman, J Pharm
Sci, 2002, 91, 157-170.
42. G. Sahay, D. Y. Alakhova and A. V. Kabanov, J Control Release, 2010, 145, 182-195.
43. N. Oh and J. H. Park, Int J Nanomedicine, 2014, 1, 51-63.
44. R. Sakhtianchi, R. F. Minchin, K.-B. Lee, A. M. Alkilany, V. Serpooshan and M. Mahmoudi, Adv Colloid Interface Sci, 2013, 201 202, 18-29.
45. H. Hillaireau and P. Couvreur, Cell Mol Life Sci, 2009, 66, 2873-2896.
46. S. E. A. Gratton, P. A. Ropp, P. D. Pohlhaus, J. C. Luft, V. J. Madden, M. E. Napier and J. M. DeSimone, Proc Natl Acad Sci U S A, 2008, 105, 11613-11618.
47. M. Zhu, G. Nie, H. Meng, T. Xia, A. Nel and Y. Zhao, Acc Chem Res, 2013, 46, 622-631.
48. Z. Mao, X. Zhou and C. Gao, Biomater Sci, 2013, 1, 896-911.
49. G. Sahay, E. V. Batrakova and A. V. Kabanov, Bioconjug Chem, 2008, 19, 2023-2029.
References
201
50. M. Muniruzzaman, A. Marin, Y. Luo, G. D. Prestwich, W. G. Pitt, G. Husseini and N. Y. Rapoport, Colloids Surf B Biointerfaces, 2002, 25, 233-241.
51. A. Mahmud and A. Lavasanifar, Colloids Surf B Biointerfaces, 2005, 45, 82-89.
52. Z. Zhang, Q. Qu, J. Li and S. Zhou, Macromol Biosci, 2013, 13, 789-798.
53. Y. Kim, M. H. Pourgholami, D. L. Morris, H. Lu and M. H. Stenzel, Biomater Sci, 2013, 1, 265-275.
54. Y. Kim, M. H. Pourgholami, D. L. Morris and M. H. Stenzel, Biomacromolecules, 2012, 13, 814-825.
55. B. Hoang, R. M. Reilly and C. Allen, Biomacromolecules, 2012, 13, 455-465.
56. E. V. Batrakova, S. Li, Y. Li, V. Y. Alakhov, W. F. Elmquist and A. V. Kabanov, J Control Release, 2004, 100, 389-397.
57. J. Liu, F. Zeng and C. Allen, Eur J Pharm Biopharm, 2007, 65, 309-319.
58. J. van den Eijnde and M. Schouwenburg, Practical Radiation Protection, Syntax Media, Utrecht, 2013.
59. https://de.wikipedia.org/wiki/Nuklidkarte, (accessed 06-09-2015).
60. F. Buchegger, F. Perillo-Adamer, Y. M. Dupertuis and A. B. Delaloye, Eur J Nucl
Med Mol Imaging, 2006, 33, 1352-1363.
61. T. M. Behr, M. Behe, M. Lohr, G. Sgouros, C. Angerstein, E. Wehrmann, K. Nebendahl and W. Becker, Eur J Nucl Med, 2000, 27, 753-765.
62. J. Wang, P. Chen, Z.-F. Su, K. Vallis, J. Sandhu, R. Cameron, A. Hendler and R. M. Reilly, Nucl Med Biol, 2001, 28, 895-902.
63. L. Bodei, A. I. Kassis, S. J. Adelstein and G. Mariani, Cancer Biother Radiopharm, 2003, 18, 861-877.
64. C. A. Boswell and M. W. Brechbiel, J Nucl Med, 2005, 46, 1946-1947.
65. I. Verel, G. W. Visser and G. A. van Dongen, J Nucl Med, 2005, 46, 164S-171S.
66. W. Branderhorst, F. van der Have, B. Vastenhouw, M. A. Viergever and F. J. Beekman, Phys Med Biol, 2012, 57, 717-732.
67. F. M. Nortier, S. J. Mills and G. F. Steyn, Appl Radiat Isot, 1990, 41, 1201-1208.
68. T. J. Wadas, E. H. Wong, G. R. Weisman and C. J. Anderson, Chem Rev, 2010, 110, 2858-2902.
69. C. F. Meares, M. J. McCall, D. T. Reardan, D. A. Goodwin, C. I. Diamanti and M. McTigue, Anal Biochem, 1984, 142, 68-78.
70. M. S. Cooper, E. Sabbah and S. J. Mather, Nat. Protocols, 2006, 1, 314-317.
71. M. L. Adams, A. Lavasanifar and G. S. Kwon, J Pharm Sci, 2003, 92, 1343-1355.
72. S. Movassaghian, O. M. Merkel and V. P. Torchilin, Wiley Interdiscip Rev Nanomed
Nanobiotechnol, 2015.
73. P. Alexandridis and T. Alan Hatton, Colloids Surf A Physicochem Eng Asp, 1995, 96, 1-46.
74. Y. Yu and A. Eisenberg, J Am Chem Soc, 1997, 119, 8383-8384.
75. L. Liu, X. Gao, Y. Cong, B. Li and Y. Han, Macromol Rapid Commun, 2006, 27, 260-265.
76. H. Shen and A. Eisenberg, Macromolecules, 2000, 33, 2561-2572.
77. S. Jain and F. S. Bates, Macromolecules, 2004, 37, 1511-1523.
References
202
78. T. Ohta and K. Kawasaki, Macromolecules, 1986, 19, 2621-2632.
79. G. Wanka, H. Hoffmann and W. Ulbricht, Macromolecules, 1994, 27, 4145-4159.
80. W. Loh, Journal, 2002.
81. J. A. Faucher, J Polym Sci, Part B: Polym Phys 1965, 3, 143-145.
82. P. G. de Gennes, Solid State Physics, Academic Press, New York, 1978.
83. L. Zhang and A. Eisenberg, Science, 1995, 268, 1728-1731.
84. D. Y. Alakhova and A. V. Kabanov, Mol Pharm, 2014, 11, 2566-2578.
85. D. A. Chiappetta and A. Sosnik, Eur J Pharm Biopharm, 2007, 66, 303-317.
86. A. Pitto-Barry and N. P. E. Barry, Polym Chem, 2014, 3291 3297.
87. S. C. Rodriguez and E. J. Singer, in Nonionic Surfactants: Polyoxyalkylene Block
Copolymers, ed. V. M. Nace, CRC Press, New York, 1996, vol. 60, pp. 211-241.
88. A. V. Kabanov and V. Y. Alakhov, Crit Rev Ther Drug Carrier Syst, 2002, 19, 1-72.
89. A. V. Kabanov, E. V. Batrakova and V. Y. Alakhov, J Control Release, 2002, 82, 189-212.
90. V. P. Torchilin, Adv Drug Deliv Rev, 2006, 58, 1532-1555.
91. V. P. Torchilin, J Control Release, 2001, 73, 137-172.
92. G. Gaucher, M.-H. Dufresne, V. P. Sant, N. Kang, D. Maysinger and J.-C. Leroux, J Control Release, 2005, 109, 169-188.
93. N. Rapoport, W. G. Pitt, H. Sun and J. L. Nelson, J Control Release, 2003, 91, 85-95.
94. R. A. Petros and J. M. DeSimone, Nat Rev Drug Discov, 2010, 9, 615-627.
95. E. Batrakova, S. Lee, S. Li, A. Venne, V. Alakhov and A. Kabanov, Pharm Res, 1999, 16, 1373-1379.
96. E. V. Batrakova and A. V. Kabanov, J Control Release, 2008, 130, 98-106.
97. E. V. Batrakova, S. Li, W. F. Elmquist, D. W. Miller, V. Y. Alakhov and A. V. Kabanov, Br J Cancer, 2001, 85, 1987-1997.
98. A. V. Kabanov, E. V. Batrakova and V. Y. Alakhov, Adv Drug Deliv Rev, 2002, 54, 759-779.
99. S. Kunjachan, B. Rychlik, G. Storm, F. Kiessling and T. Lammers, Adv Drug Deliv
Rev, 2013, 65, 1852-1865.
100. T. Demina, I. Grozdova, O. Krylova, A. Zhirnov, V. Istratov, H. Frey, H. Kautz and N. Melik-Nubarov, Biochemistry, 2005, 44, 4042-4054.
101. T. F. Yang, C. N. Chen, M. C. Chen, C. H. Lai, H. F. Liang and H. W. Sung, Biomaterials, 2007, 28, 725-734.
102. E. V. Batrakova and A. V. Kabanov, J. Controlled Release, 2008, 130, 98-106.
103. D. W. Miller, E. V. Batrakova and A. V. Kabanov, Pharm Res, 1999, 16, 396-401.
104. S. Hvidt, E. B. Joergensen, W. Brown and K. Schillen, J Phys Chem, 1994, 98, 12320-12328.
105. O. Glatter, G. Scherf, K. Schillen and W. Brown, Macromolecules, 1994, 27, 6046-6054.
106. K. Mortensen, W. Brown and B. Nordén, Phys Rev Lett, 1992, 68, 2340-2343.
107. K. Mortensen, J Phys Condens Matter, 1996, 8, A103.
References
203
108. R. Ganguly, V. K. Aswal and P. A. Hassan, J Colloid Interface Sci, 2007, 315, 693-700.
109. A. G. Denkova, E. Mendes and M. O. Coppens, J Phys Chem B, 2008, 112, 793-801.
110. J. P. Mata, P. R. Majhi, C. Guo, H. Z. Liu and P. Bahadur, J Colloid Interface Sci, 2005, 292, 548-556.
111. Y. L. Su, X. F. Wei and H. Z. Liu, J Colloid Interface Sci, 2003, 264, 526-531.
112. Y. Kadam, R. Ganguly, M. Kumbhakar, V. K. Aswal, P. A. Hassan and P. Bahadur, J Phys Chem B, 2009, 113, 16296-16302.
113. E. B. Jørgensen, S. Hvidt, W. Brown and K. Schillén, Macromolecules, 1997, 30, 2355-2364.
114. L. Guo, R. H. Colby and P. Thiyagarajan, Physica B: Condensed Matter, 2006, 385 386, Part 1, 685-687.
115. V. Patel, J. Dey, R. Ganguly, S. Kumar, S. Nath, V. K. Aswal and P. Bahadur, Soft
Matter, 2013, 9, 7583-7591.
116. B. Bharatiya, C. Guo, J. H. Ma, P. A. Hassan and P. Bahadur, Eur Polym J, 2007, 43, 1883-1891.
117. P. Parekh, K. Singh, D. G. Marangoni and P. Bahadur, J Mol Liq, 2012, 165, 49-54.
118. K. Nakashima and P. Bahadur, Adv Colloid Interface Sci, 2006, 126, 75-96.
119. P. Alexandridis, V. Athanassiou and T. A. Hatton, Langmuir, 1995, 11, 2442-2450.
120. Y. Zhang and P. S. Cremer, Curr Opin Chem Biol, 2006, 10, 658-663.
121. Z. Yang, J Biotechnol 2009, 144, 12-22.
122. J. Dey, S. Kumar, S. Nath, R. Ganguly, V. K. Aswal and K. Ismail, J Colloid
Interface Sci, 2014, 415, 95-102.
123. M. Khimani, R. Ganguly, V. K. Aswal, S. Nath and P. Bahadur, J Phys Chem B, 2012, 116, 14943-14950.
124. B. Foster, T. Cosgrove and B. Hammouda, Langmuir, 2009, 25, 6760-6766.
125. P. Parekh, R. Ganguly, V. K. Aswal and P. Bahadur, Soft Matter, 2012, 8, 5864-5872.
126. D. Y. Alakhova, Y. Zhao, S. Li and A. V. Kabanov, PLoS One, 2013, 8.
127. V. Alakhov, E. Klinski, S. Li, G. Pietrzynski, A. Venne, E. Batrakova, T. Bronitch and A. Kabanov, Colloids Surf B, 1999, 16, 113-134.
128. S. E. Jin, H. E. Jin and S. S. Hong, Biomed Res Int, 2014, 2014, 814208.
129. S. Danson, D. Ferry, V. Alakhov, J. Margison, D. Kerr, D. Jowle, M. Brampton, G. Halbert and M. Ranson, Br J Cancer, 2004, 90, 2085-2091.
130. J. W. Valle, A. Armstrong, C. Newman, V. Alakhov, G. Pietrzynski, J. Brewer, S. Campbell, P. Corrie, E. K. Rowinsky and M. Ranson, Invest New Drugs, 2011, 29, 1029-1037.
131. D. Sutton, N. Nasongkla, E. Blanco and J. Gao, Pharm Res, 2007, 24, 1029-1046.
132. M. Talelli, C. J. F. Rijcken, W. E. Hennink and T. Lammers, Curr Opin Solid State
Mater Sci, 2012, 16, 302-309.
133. D. A. Christian, S. Cai, O. B. Garbuzenko, T. Harada, A. L. Zajac, T. Minko and D. E. Discher, Mol Pharm, 2009, 6, 1343-1352.
References
204
134. N. Nishiyama, Nat Nano, 2007, 2, 203-204.
135. S. C. Owen, D. P. Y. Chan and M. S. Shoichet, Nano Today, 2012, 7, 53-65.
136. G. Waton, B. Michels and R. Zana, J Colloid Interface Sci, 1999, 212, 593-596.
137. G. Waton, J Phys Chem B, 1997, 101, 9727-9731.
138. G. Waton, B. Michels and R. Zana, Macromolecules, 2001, 34, 907-910.
139. Y. Rharbi, Macromolecules, 2012, 45, 9823-9826.
140. G. Landazuri, V. V. A. Fernandez, J. F. A. Soltero and Y. Rharbi, J Phys Chem B, 2012, 116, 11720-11727.
141. A. G. Denkova, E. Mendes and M.-O. Coppens, Soft Matter, 2010, 6, 2351-2357.
142. E. A. G. Aniansson and S. N. Wall, J Phys Chem, 1974, 78, 1024-1030.
143. A. G. Denkova, E. Mendes and M. O. Coppens, J Phys Chem B, 2009, 113, 989-996.
144. B. J. Berne and R. Pecora, Dynamic Light Scattering with Applications to
Chemistry, Biology, and Physics, Wiley Interscience, New York, 1976.
145. M. Doi and S. F. Edwards, The Theory of Polymer Dynamics, Oxford University Press, Oxford, 1986.
146. P. Lindner and T. Zemb, Neutrons, X-rays and Light: Scattering Methods Applied
to Soft Condensed Matter, 2002.
147. T. Nicolai, O. Colombani and C. Chassenieux, Soft Matter, 2010, 6, 3111-3118.
148. R. Lund, L. Willner and D. Richter, in Controlled Polymerization and Polymeric
Structures, eds. A. Abe, K. S. Lee, L. Leibler and S. Kobayashi, Springer International Publishing, 2013, vol. 259, pp. 51-158.
149. M. Kahlweit, Pure Appl Chem, 1981, 53, 2069-2081.
150. B. Michels, G. Waton and R. Zana, Langmuir, 1997, 13, 3111-3118.
151. M. Kahlweit, J Colloid Interf Sci, 1982, 90, 92-99.
152. M. J. Kositza, C. Bohne, P. Alexandridis, T. A. Hatton and J. F. Holzwarth, Langmuir, 1998, 15, 322-325.
153. E. E. Dormidontova, Macromolecules, 1999, 32, 7630-7644.
154. R. Zana, C. Marques and A. Johner, Adv Colloid Interface Sci, 2006, 123 126, 345-351.
155. M. J. Kositza, C. Bohne, P. Alexandridis, T. A. Hatton and J. F. Holzwarth, Macromolecules, 1999, 32, 5539-5551.
156. T. Thurn, S. Couderc-Azouani, D. M. Bloor, J. F. Holzwarth and E. Wyn-Jones, Langmuir, 2003, 19, 4363-4370.
157. A. Halperin and S. Alexander, Macromolecules, 1989, 22, 2403-2412.
158. E. Hecht and H. Hoffmann, Colloids Surf A Physicochem Eng Asp, 1995, 96, 181-197.
159. I. Goldmints, J. F. Holzwarth, K. A. Smith and T. A. Hatton, Langmuir, 1997, 13, 6130-6134.
160. I. LaRue, M. Adam, M. Pitsikalis, N. Hadjichristidis, M. Rubinstein and S. S. Sheiko, Macromolecules, 2006, 39, 309-314.
161. R. Ganguly, M. Kumbhakar and V. K. Aswal, J Phys Chem B, 2009, 113, 9441-9446.
References
205
162. R. Ganguly, K. Kuperkar, P. Parekh, V. K. Aswal and P. Bahadur, J Colloid Interf
Sci, 2012, 378, 118-124.
163. L. A. Fielding, J. A. Lane, M. J. Derry, O. O. Mykhaylyk and S. P. Armes, J Am
Chem Soc, 2014, 136, 5790-5798.
164. M. Duval, G. Waton and F. Schosseler, Langmuir, 2005, 21, 4904-4911.
165. K. Mortensen and W. Brown, Macromolecules, 1993, 26, 4128-4135.
166. S. E. Burke and A. Eisenberg, Langmuir, 2001, 17, 8341-8347.
167. R. Lund, L. Willner, D. Richter, P. Lindner and T. Narayanan, ACS Macro Letters, 2013, 2, 1082-1087.
168. I. Echavarri Franco, P. Lorchat, J. P. Lamps, M. Schmutz, A. Schröder, J. M. Catala, J. Combet and F. Schosseler, Langmuir, 2012, 28, 4815-4828.
169. Z. Zhou, B. Chu and D. G. Peiffer, Macromolecules, 1993, 26, 1876-1883.
170. R. Klucker, J. P. Munch and F. Schosseler, Macromolecules, 1997, 30, 3839-3848.
171. V. V. Fernandez, J. F. Soltero, J. E. Puig and Y. Rharbi, J Phys Chem B, 2009, 113, 3015-3023.
172. Z. Zhou and B. Chu, Macromolecules, 1987, 20, 3089-3091.
173. U. Holzgrabe, B. W. Diehl and I. Wawer, J Pharm Biomed Anal, 1998, 17, 557-616.
174. J. U. Izunobi and C. L. Higginbotham, J Chem Educ, 2011, 88, 1098-1104.
175. A. Postma, T. P. Davis, A. R. Donovan, G. Li, G. Moad, R. Mulder and M. S. O'Shea, Polymer, 2006, 47, 1899-1911.
176. S. Saeki, N. Kuwahara, M. Nakata and M. Kaneko, Polymer, 1977, 18, 1027-1031.
177. P. G. de Gennes, Scaling Concepts in Polymer Physics, Cornell University Press, Ithaca, New York, 1979.
178. R. Lund, L. Willner, V. Pipich, I. Grillo, P. Lindner, J. Colmenero and D. Richter, Macromolecules, 2011, 44, 6145-6154.
179. P. Alexandridis, J. F. Holzwarth and T. A. Hatton, Macromolecules, 1994, 27, 2414-2425.
180. L. Willner, A. Poppe, J. Allgaier, M. Monkenbusch and D. Richter, EPL (Europhysics
Letters), 2001, 55, 667.
181. Y.-Y. Won, H. T. Davis and F. S. Bates, Macromolecules, 2003, 36, 953-955.
182. R. Lund, L. Willner, D. Richter and E. E. Dormidontova, Macromolecules, 2006, 39, 4566-4575.
183. R. Lund, L. Willner, J. Stellbrink, P. Lindner and D. Richter, Phys Rev Lett, 2006, 96, 15.
184. R. Lund, L. Willner, D. Richter, H. Iatrou, N. Hadjichristidis and P. Lindner, J Appl
Crystallogr 2007, 40, s327-s331.
185. S.-H. Choi, T. P. Lodge and F. S. Bates, Phys Rev Lett, 2010, 104, 047802.
186. R. Lund, L. Willner, J. Stellbrink, P. Lindner and D. Richter, Phys Rev Lett, 2010, 104, 049902.
187. T. Zinn, L. Willner, R. Lund, V. Pipich and D. Richter, Soft Matter, 2012, 8, 623-626.
188. J. Lu, F. S. Bates and T. P. Lodge, ACS Macro Letters, 2013, 2, 451-455.
References
206
189. N. R. B. Boase, I. Blakey and K. J. Thurecht, Polym Chem, 2012, 3, 1384-1389.
190. T. Krasia-Christoforou and T. K. Georgiou, J Mater Chem B, 2013, 1, 3002-3025.
191. N. Rapoport, Colloids Surf B, 1999, 16, 93-111.
192. C. F. van Nostrum, Soft Matter, 2011, 7, 3246-3259.
193. E. S. Read and S. P. Armes, Chem Commun, 2007, 3021-3035.
194. R. K. O'Reilly, C. J. Hawker and K. L. Wooley, Chem Soc Rev, 2006, 35, 1068-1083.
195. J. D. Pruitt, G. Husseini, N. Rapoport and W. G. Pitt, Macromolecules, 2000, 33, 9306-9309.
196. G. A. Husseini, D. A. Christensen, N. Y. Rapoport and W. G. Pitt, J Control
Release, 2002, 83, 303-305.
197. J. L. Nelson, B. L. Roeder, J. C. Carmen, F. Roloff and W. G. Pitt, Cancer Res, 2002, 62, 7280-7283.
198. P. Petrov, M. Bozukov and C. B. Tsvetanov, J Mater Chem, 2005, 15, 1481.
199. K. Yoncheva, P. Calleja, M. Agüeros, P. Petrov, I. Miladinova, C. Tsvetanov and J. M. Irache, Int J Pharm, 2012, 436, 258-264.
200. G. Niu, A. B. Djaoui and D. Cohn, Polymer, 2011, 52, 2524-2530.
201. J.-Y. Kim, W. I. Choi, Y. H. Kim, G. Tae, S.-Y. Lee, K. Kim and I. C. Kwon, J
Control Release, 2010, 147, 109-117.
202. W. I. Choi, G. Tae and Y. H. Kim, J Mater Chem, 2008, 18, 2769-2774.
203. K. H. Bae, Y. Lee and T. G. Park, Biomacromolecules, 2007, 8, 650-656.
204. M. Di Biase, P. de Leonardis, V. Castelletto, I. W. Hamley, B. Derby and N. Tirelli, Soft Matter, 2011, 7, 4928-4937.
205. N. Abdullah Al, H. Lee, Y. S. Lee, K. D. Lee and S. Y. Park, Macromol Biosci, 2011, 11, 1264-1271.
206. D. H. Nguyen, J. W. Bae, J. H. Choi, J. S. Lee and K. D. Park, J Bioact Compat
Polym, 2013, 28, 341-354.
207. R. P. Brinkhuis, K. Stojanov, P. Laverman, J. Eilander, I. S. Zuhorn, F. P. J. T. Rutjes and J. C. M. van Hest, Bioconjugate Chem, 2012, 23, 958-965.
208. B. Hoang, H. Lee, R. M. Reilly and C. Allen, Mol Pharm, 2009, 6, 581-592.
209. A. Arranja, A. Schroder, M. Schmutz, G. Waton, F. Schosseler and E. Mendes, J
Control Release, 2014, 13, 87-95.
210. Z. Lu and T. Hirt, 2012, US Patent 2012/0121518A1.
211. H. F. Lu, W. S. Lim, J. Wang, Z. Q. Tang, P. C. Zhang, K. W. Leong, S. M. Chia, H. Yu and H. Q. Mao, Biomaterials, 2003, 24, 4893-4903.
212. B. Hoang, H. Lee, R. M. Reilly and C. Allen, Mol Pharm, 2009, 6, 581-592.
213. Y.-Y. Won, A. K. Brannan, H. T. Davis and F. S. Bates, J Phys Chem B, 2002, 106, 3354-3364.
214. K. Mortensen and Y. Talmon, Macromolecules, 1995, 28, 8829-8834.
215. X. Ye, J. Zhang, H. Chen, X. Wang and F. Huang, ACS Appl Mater Interfaces, 2014.
216. H. Tan, N. S. Liu, B. He, S. Y. Wong, Z.-K. Chen, X. Li and J. Wang, Chem
Commun, 2009, 6240-6242.
References
207
217. S. M. Moghimi, A. C. Hunter and J. C. Murray, Pharmacol Rev, 2001, 53, 283-318.
218. M. N. Lub-de Hooge, J. G. W. Kosterink, P. J. Perik, H. Nijnuis, L. Tran, J. Bart, A. J. H. Suurmeijer, S. de Jong, P. L. Jager and E. G. E. de Vries, Br J Pharmacol, 2004, 143, 99-106.
219. D. J. Hnatowich, Int J Rad Appl Instrum B, 1986, 13, 353-358.
220. R. R. Patil, J. Yu, S. R. Banerjee, Y. Ren, D. Leong, X. Jiang, M. Pomper, B. Tsui, D. L. Kraitchman and H.-Q. Mao, Mol Ther, 2011, 19, 1626-1635.
221. R. P. Brinkhuis, K. Stojanov, P. Laverman, J. Eilander, I. S. Zuhorn, F. P. J. T. Rutjes and J. C. M. van Hest, Bioconjug Chem, 2012, 23, 958-965.
222. W. R. Harris, Y. Chen and K. Wein, Inorg Chem, 1994, 33, 4991-4998.
223. J. Fang, H. Nakamura and H. Maeda, Adv Drug Deliv Rev, 2011, 63, 136-151.
224. G. Sahay, D. Y. Alakhova and A. V. Kabanov, J. Controlled Release, 2010, 145, 182-195.
225. G. Sahay, E. V. Batrakova and A. V. Kabanov, Bioconjugate Chem., 2008, 19, 2023-2029.
226. M. Muniruzzaman, A. Marin, Y. Luo, G. D. Prestwich, W. G. Pitt, G. Husseini and N. Y. Rapoport, Colloids Surf., B, 2002, 25, 233-241.
227. E. V. Batrakova, S. Li, V. Y. Alakhov, D. W. Miller and A. V. Kabanov, J Pharmacol
Exp Ther, 2003, 304, 845-854.
228. E. V. Batrakova, S. Li, Y. Li, V. Y. Alakhov, W. F. Elmquist and A. V. Kabanov, J. Controlled Release, 2004, 100, 389-397.
229. J. M. Grindel, T. Jaworski, O. Piraner, R. M. Emanuele and M. Balasubramanian, J Pharm Sci, 2002, 91, 1936-1947.
230. N. S. Melik-Nubarov, O. O. Pomaz, T. Y. Dorodnych, G. A. Badun, A. L. Ksenofontov, O. B. Schemchukova and S. A. Arzhakov, FEBS Lett., 1999, 446, 194-198.
231. F. Hirschhaeuser, H. Menne, C. Dittfeld, J. West, W. Mueller-Klieser and L. A. Kunz-Schughart, J Biotechnol, 2010, 148, 3-15.
232. N. R. Patel, B. S. Pattni, A. H. Abouzeid and V. P. Torchilin, Adv Drug Deliv Rev, 2013, 65, 1748-1762.
233. J. Friedrich, R. Ebner and L. A. Kunz-Schughart, Int J Radiat Biol, 2007, 83, 849-871.
234. T. Lammers, F. Kiessling, W. E. Hennink and G. Storm, J. Controlled Release, 2012, 161, 175-187.
235. https://en.wikipedia.org/wiki/MTT_assay, (accessed 06-09-2015).
236. M. Kahm, G. Hasenbrink, H. Lichtenberg-Frate, J. Ludwig and M. Kschischo, J Stat
Softw, 2010, 33(7), 1-21.
237. R. I. Freshney, Culture of Animal Cells: A Manual of Basic Technique and
Specialized Applications, John Wiley & Sons, Inc., 2010.
238. R. Coradeghini, S. Gioria, C. P. García, P. Nativo, F. Franchini, D. Gilliland, J. Ponti and F. Rossi, Toxicol Lett, 2013, 217, 205-216.
239. D. M. Ridolfi, P. D. Marcato, D. Machado, R. A. Silva, G. Z. Justo and N. Durán, J Phys Conf Se, 2011, 304, 012032.
240. M. Safi, H. Sarrouj, O. Sandre, N. Mignet and J. F. Berret, Nanotechnology, 2010, 21, 145103.
References
208
241. J. Ponti, F. Broggi, V. Mariani, L. De Marzi, R. Colognato, P. Marmorato, S. Gioria, D. Gilliland, C. Pascual Garcia, S. Meschini, A. Stringaro, A. Molinari, H. Rauscher and F. Rossi, Nanotoxicology, 2013, 7, 221-233.
242. R. Sun, Q. Luo, C. Gao, Y. Wang, L. Gao, H. Du, Y. Huang, X. Li, Z. Shen and W. Zhu, Polym Chem, 2014, 5, 4879-4883.
243. S. L. Demento, N. Bonafe, W. Cui, S. M. Kaech, M. J. Caplan, E. Fikrig, M. Ledizet and T. M. Fahmy, J Immunol, 2010, 185, 2989-2997.
244. R. Kapon, B. Naim, D. Zbaida, R. Nevo, O. Tsabari and Z. Reich, Nucleus, 2010, 1, 475-480.
245. E. Oh, J. B. Delehanty, K. E. Sapsford, K. Susumu, R. Goswami, J. B. Blanco-Canosa, P. E. Dawson, J. Granek, M. Shoff, Q. Zhang, P. L. Goering, A. Huston and I. L. Medintz, ACS Nano, 2011, 5, 6434-6448.
246. Z. Mao, X. Zhou and C. Gao, Biomater. Sci., 2013, 1, 896-911.
247. C. Brandenberger, C. Muhlfeld, Z. Ali, A. G. Lenz, O. Schmid, W. J. Parak, P. Gehr and B. Rothen-Rutishauser, Small, 2010, 6, 1669-1678.
248. S. D. Conner and S. L. Schmid, Nature, 2003, 422, 37-44.
249. K. A. McMahon, M. Zhu, S. W. Kwon, P. Liu, Y. Zhao and R. G. Anderson, Proteomics, 2006, 6, 143-152.
250. M. Videira, A. Arranja, D. Rafael and R. Gaspar, Nanomedicine, 2014, 10, 689-702.
251. A. Mahmud and A. Lavasanifar, Colloids Surf., B, 2005, 45, 82-89.
252. N. Oh and J. H. Park, Int. J. Nanomed., 2014, 1, 51-63.
253. A. Arranja, A. Schroder, M. Schmutz, G. Waton, F. Schosseler and E. Mendes, J. Controlled Release, 2014, 13, 87-95.
254. C. L. Waite and C. M. Roth, CRC Crit Rev Bioeng, 2012, 40, 21-41.
255. A. Pluen, Y. Boucher, S. Ramanujan, T. D. McKee, T. Gohongi, E. di Tomaso, E. B. Brown, Y. Izumi, R. B. Campbell, D. A. Berk and R. K. Jain, Proc Natl Acad Sci U S
A, 2001, 98, 4628-4633.
256. H. Lu, R. H. Utama, U. Kitiyotsawat, K. Babiuch, Y. Jiang and M. H. Stenzel, Biomater Sci, 2015.
257. F. Yuan, A. Krol and S. Tong, Ann Biomed Eng, 2001, 29, 1150-1158.
258. R. K. Jain, Adv Drug Deliv Rev, 2001, 46, 149-168.
259. A. S. Mikhail, S. Eetezadi, S. N. Ekdawi, J. Stewart and C. Allen, Int J Pharm, 2014, 464, 168-177.
260. R. Grantab, S. Sivananthan and I. F. Tannock, Cancer Res, 2006, 66, 1033-1039.
261. S. McGuire and F. Yuan, Nanomedicine, 2012, 8, 1088-1095.
262. M. L. Willcox, M. M. Newman and B. C. Paton, J Surg Res, 1978, 25, 349-356.
263. Z. Y. Wang and I. J. Stern, Drug Metab Dispos, 1975, 3, 536-542.
264. E. V. Batrakova, Y. Zhang, Y. Li, S. Li, S. V. Vinogradov, Y. Persidsky, V. Y. Alakhov, D. W. Miller and A. V. Kabanov, Pharm Res, 2004, 21, 1993-2000.
265. F. van der Have, B. Vastenhouw, R. M. Ramakers, W. Branderhorst, J. O. Krah, C. Ji, S. G. Staelens and F. J. Beekman, J Nucl Med, 2009, 50, 599-605.
266. O. Ivashchenko, F. van der Have, M. C. Goorden, R. M. Ramakers and F. J. Beekman, J Nucl Med, 2015, 56, 470-475.
References
209
267. W. Branderhorst, B. Vastenhouw and F. J. Beekman, Phys Med Biol, 2010, 55, 2023-2034.
268. F. van der Have, B. Vastenhouw, M. Rentmeester and F. J. Beekman, IEEE Trans
Med Imaging, 2008, 27, 960-971.
269. M. A. King, S. J. Glick, P. Hendrik Pretorius, R. Glenn Wells, H. C. Gifford, M. V. Narayanan and T. Farncombe, in Emission Tomography, ed. M. N. W. N. Aarsvold, Academic Press, San Diego, 2004, pp. 473-498.
270. C. Wu, J. R. de Jong, H. A. Gratama van Andel, F. van der Have, B. Vastenhouw, P. Laverman, O. C. Boerman, R. A. Dierckx and F. J. Beekman, Phys Med Biol, 2011, 56, N183-193.
271. T. Yamaoka, Y. Tabata and Y. Ikada, J Pharm Sci, 1994, 83, 601-606.
272. A. I. Jensen, T. Binderup, P. Kumar Ek, A. Kjær, P. H. Rasmussen and T. L. Andresen, Biomacromolecules, 2014, 15, 1625-1633.
273. Z. Yang, S. Zheng, W. J. Harrison, J. Harder, X. Wen, J. G. Gelovani, A. Qiao and C. Li, Biomacromolecules, 2007, 8, 3422-3428.
274. E. Wisse, F. Jacobs, B. Topal, P. Frederik and B. De Geest, Gene Ther, 2008, 15, 1193-1199.
275. H. Soo Choi, W. Liu, P. Misra, E. Tanaka, J. P. Zimmer, B. Itty Ipe, M. G. Bawendi and J. V. Frangioni, Nat Biotechnol, 2007, 25, 1165-1170.
276. M. Longmire, P. L. Choyke and H. Kobayashi, Nanomedicine (Lond), 2008, 3, 703-717.
277. K.-i. Ogawara, M. Yoshida, K. Higaki, K. Toshikiro, K. Shiraishi, M. Nishikawa, Y. Takakura and M. Hashida, J Control Release, 1999, 59, 15-22.
278. A. L. Klibanov, K. Maruyama, V. P. Torchilin and L. Huang, FEBS Lett, 1990, 268, 235-237.
279. D. E. Discher and F. Ahmed, Annu Rev Biomed Eng, 2006, 8, 323-341.
280. J. Bhattacharjee, G. Verma, V. K. Aswal, V. Patravale and P. A. Hassan, RSC Adv, 2013, 3, 23080-23089.
281. S. M. Moghimi, FEBS Lett, 2003, 540, 241-244.
282. D. E. Owens, 3rd and N. A. Peppas, Int J Pharm, 2006, 307, 93-102.
283. H. Harashima and H. Kiwada, Adv Drug Deliv Rev, 1996, 19, 425-444.
284. D. C. Litzinger, A. M. J. Buiting, N. van Rooijen and L. Huang, Biochim Biophys
Acta, 1994, 1190, 99-107.
285. M. A. Dobrovolskaia and S. E. McNeil, Nat Nanotechnol, 2007, 2, 469-478.
286. P. Petrov, J. Yuan, K. Yoncheva, A. H. E. Müller and C. B. Tsvetanov, J Phys Chem
B, 2008, 112, 8879-8883.

210

211
Résumé en Français

212
213
Plan de Thèse
Ce projet de thèse a été financé par le People Programme (Marie Curie Actions) du
septième programme-cadre de l'Union européenne (FP7/2007-2013) dans le cadre
du projet "TRACE'nTREAT". Ce réseau de formation initiale regroupe plusieurs
partenaires académiques et industriels de différents pays avec une grande variété
d'expertises complémentaires.
Le travail présenté dans cette thèse est le résultat de trois années de recherche
réalisée principalement à Strasbourg (Institut Charles Sadron, Université de
Strasbourg), mais aussi pendant 6 mois à l'étranger à Delft (Réacteur Institut de
Delft, de l'Université technique de Delft) et à Utrecht (MILabs). Les discussions
fructueuses de la collaboration entre les différents partenaires, les périodes de
recherche à l'étranger, et la formation pluridisciplinaire intense étaient cruciales
pour l'élaboration de cette thèse.
Les objectifs principaux du projet "TRACE'nTREAT" sont la production de
radionucléides pour l'imagerie nucléaire et/ou la radiothérapie, leur incorporation
dans des nouveaux véhicules moléculaires et supramoléculaires polymériques, et
leur évaluation préclinique.
Dans le cadre de ce projet, l'objectif principal de cette thèse est le développement,
moléculaires et supramoléculaires. Ces véhicules sont élaborés à partir de
copolymères triséquencés commerciaux de type Pluronic
Les objectifs spécifiques de cette thèse sont:
(i) Acquérir une meilleure compréhension fondamentale des phénomènes de
croissance et de décroissance des micelles de Pluronic, quand ils évoluent à partir
des unimères simples à des morphologies structurées complexes.
(ii) Développer des nanovéhicules à partir des copolymères de Pluronic. Ces
copolymères seront fonctionnalisés par des marqueurs fluorescents ou radioactifs
et utilisés sous forme d'unimères dissociés ou sous forme de micelles stabilisées
par réticulation. Nous varierons également le poids moléculaire et la composition
des copolymères utilisés.
214
(iii) Comprendre l e ces paramètres physico-chimiques sur les interactions
cellulaires avec les modèles in vitro 2D et 3D, et sur la biodistribution in vivo.
La thèse est organisée comme suit:
Le Chapitre 1 présente les concepts généraux nécessaires à une meilleure
compréhension des différents aspects abordés dans cette thèse. Nous introduisons
l'importance de la nanomédecine et des technologies d'imagerie, les propriétés des
copolymères séquencés à base de Pluronics, et nous terminons avec quelques
concepts utiles sur la diffusion de lumière dynamique.
Le Chapitre 2 explore la cinétique de la transition de la forme sphérique à la forme
cylindrique des copolymères Pluronic avec un poids moléculaire croissant et un
ratio hydrophobe/hydrophile constant.
Le Chapitre 3 décrit le développement des nanovéhicules moléculaires (unimères)
et supramoléculaires (micelles stabilisées) avec différentes longueurs du bloc de
PEO. Nous décrivons aussi la fonctionnalisation des véhicules avec un marqueur
fluorescent et un chélatant appropriés pour l'imagerie et la quantification.
Le Chapitre 4 analyse les interactions in vitro des différents véhicules en utilisant
la culture cellulaire 2D et 3D. On étudie spécifiquement la cytotoxicité, la cinétique
d'internalisation et la rétention dans les cultures cellulaires 2D, tandis que les
sphéroïdes de tumeur 3D sont utilisés pour évaluer la pénétration et la toxicité
potentielle des véhicules.
Le chapitre 5 se concentre sur l'évaluation in vivo de la biodistribution des
évaluation de l'influence
des différents aspects physico-chimiques (longueur du bloc de PEO et l'état
d'agrégation).
Un résumé général des conclusions dans chaque phase du projet et les
perspectives futures sont présentés à la fin de la thèse.
215
Chapitre 1
Introduction
Le développement de nanomédicaments a suscité un intérêt croissant à cause de
leur potentiel pour l'imagerie, le diagnostic et le traitement de plusieurs maladies,
en particulier dans le domaine de l'oncologie. Les premières générations d'agents
chimio-thérapeutiques présentent plusieurs inconvénients en raison de leur faible
poids moléculaire et de leur forte hydrophobie. Ces caractères entraînent leur
élimination rapide du corps et leur dégradation enzymatique, en même temps que
leur distribution généralisée dans le corps associe toxicité pour les tissus sains et
faible accumulation dans les sites ciblés.
Pour surmonter ces obstacles, d'autres véhicules à base de polymères, micelles,
liposomes, ou nanoparticules ont été développés. Ils ont un volume de distribution
réduit conduisant à une accumulation plus faible dans les tissus sains et générant
zones qui présentent un endothélium vasculaire poreux et un drainage
lymphatique défectueux, comme les tumeurs solides. Cet effet de perméabilité et
de rétent Enhanced
Permeability and Retention.
Le développement de véhicules à base de polymères (3-10 nm) et de micelles
polymères (10-80 nm) est particulièrement intéressant, car ils peuvent être conçus
avec des fonctionnalités adaptées aux besoins et ainsi délivrer plus efficacement
leur contenu.
Malgré ces avantages, l'administration intraveineuse de véhicules de poids
moléculaire plus élevé présente également plusieurs limitations dues à une série
de barrières biophysiques. Le principal obstacle est la circulation sanguine où les
nanomatériaux sont exposés aux composants spécifiques du sang (opsonines) qui
peuvent se lier à leur surface (opsonisation). Cela permettra d'activer le système
immunitaire et augmenter leurs mécanismes Par conséquent, une
forte accumulation des nanovéhicules dans les principaux organes
(foie et rate) est souvent observée.
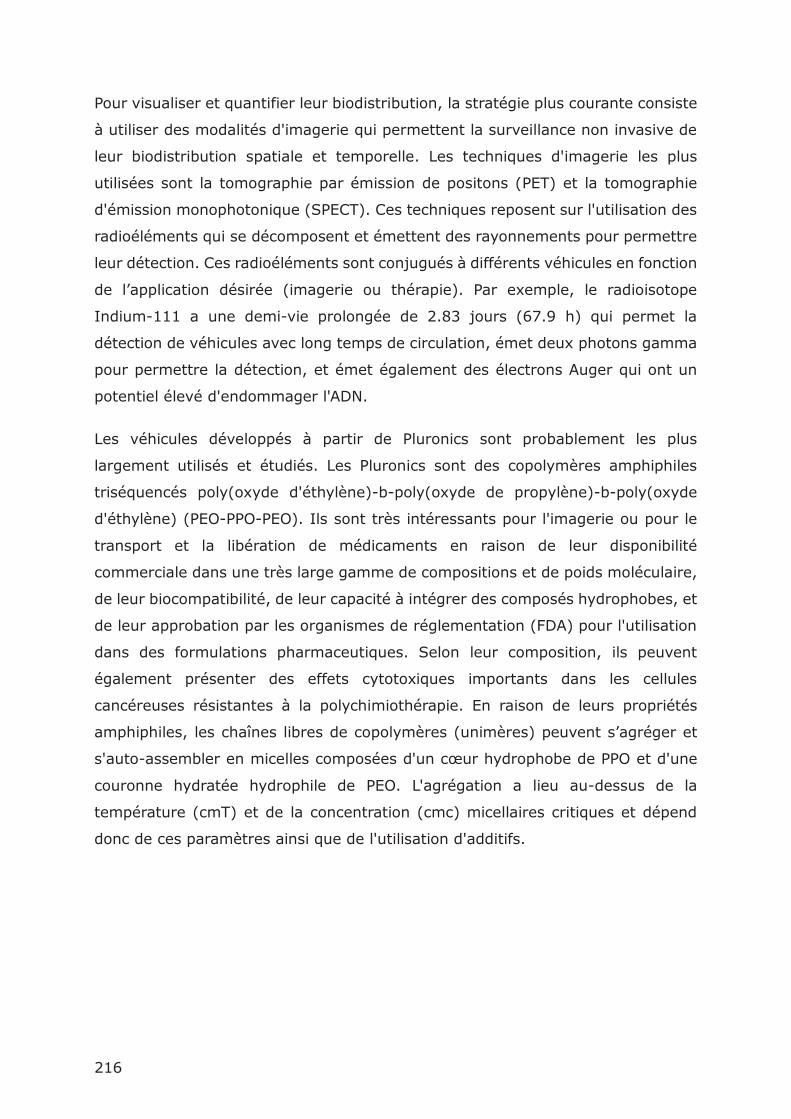
216
Pour visualiser et quantifier leur biodistribution, la stratégie plus courante consiste
à utiliser des modalités d'imagerie qui permettent la surveillance non invasive de
leur biodistribution spatiale et temporelle. Les techniques d'imagerie les plus
utilisées sont la tomographie par émission de positons (PET) et la tomographie
d'émission monophotonique (SPECT). Ces techniques reposent sur l'utilisation des
radioéléments qui se décomposent et émettent des rayonnements pour permettre
leur détection. Ces radioéléments sont conjugués à différents véhicules en fonction
Indium-111 a une demi-vie prolongée de 2.83 jours (67.9 h) qui permet la
détection de véhicules avec long temps de circulation, émet deux photons gamma
pour permettre la détection, et émet également des électrons Auger qui ont un
potentiel élevé d'endommager l'ADN.
Les véhicules développés à partir de Pluronics sont probablement les plus
largement utilisés et étudiés. Les Pluronics sont des copolymères amphiphiles
triséquencés poly(oxyde d'éthylène)-b-poly(oxyde de propylène)-b-poly(oxyde
d'éthylène) (PEO-PPO-PEO). Ils sont très intéressants pour l'imagerie ou pour le
transport et la libération de médicaments en raison de leur disponibilité
commerciale dans une très large gamme de compositions et de poids moléculaire,
de leur biocompatibilité, de leur capacité à intégrer des composés hydrophobes, et
de leur approbation par les organismes de réglementation (FDA) pour l'utilisation
dans des formulations pharmaceutiques. Selon leur composition, ils peuvent
également présenter des effets cytotoxiques importants dans les cellules
cancéreuses résistantes à la polychimiothérapie. En raison de leurs propriétés
amphiphiles, les chaînes libres de copolymères (unimères) er et
s'auto-assembler en micelles composées hydrophobe de PPO et d'une
couronne hydratée hydrophile de PEO. L'agrégation a lieu au-dessus de la
température (cmT) et de la concentration (cmc) micellaires critiques et dépend
donc de ces paramètres ainsi que de l'utilisation d'additifs.
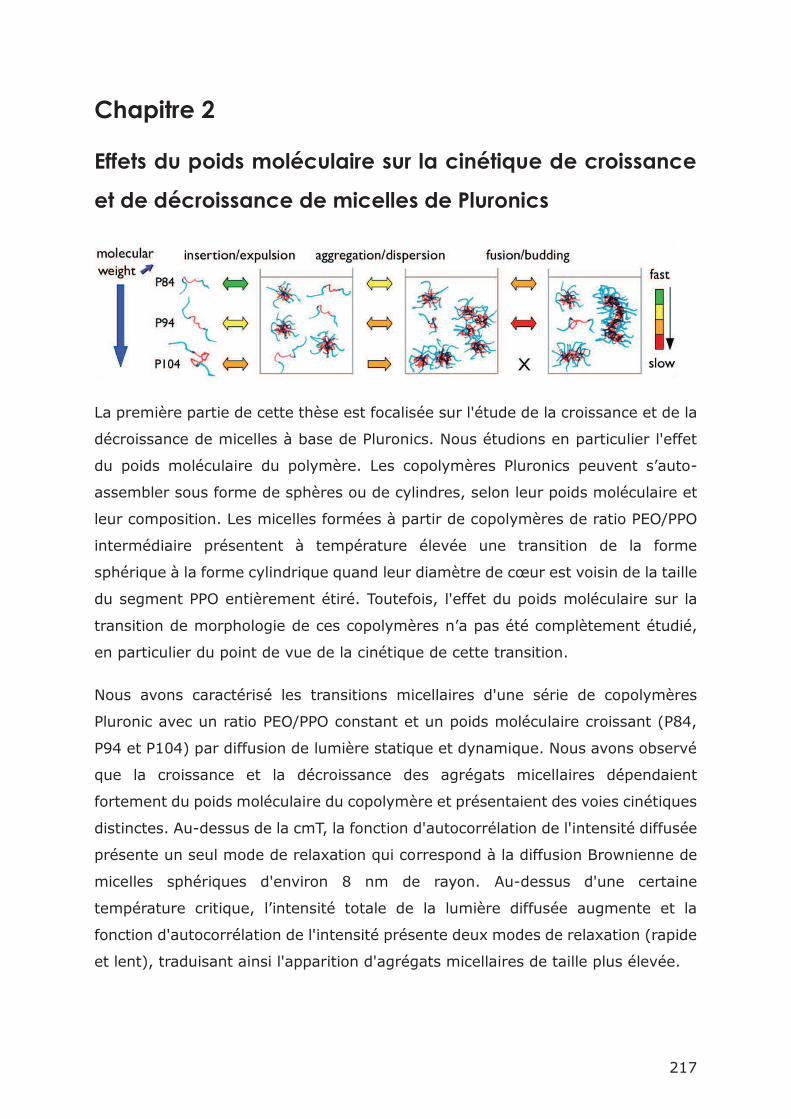
217
Chapitre 2
Effets du poids moléculaire sur la cinétique de croissance
et de décroissance de micelles de Pluronics
La première partie de cette thèse est focalisée sur l'étude de la croissance et de la
décroissance de micelles à base de Pluronics. Nous étudions en particulier l'effet
-
assembler sous forme de sphères ou de cylindres, selon leur poids moléculaire et
leur composition. Les micelles formées à partir de copolymères de ratio PEO/PPO
intermédiaire présentent à température élevée une transition de la forme
sphérique à la forme cylindrique quand de la taille
du segment PPO entièrement étiré. Toutefois, l'effet du poids moléculaire sur la
transition de morphologie
en particulier du point de vue de la cinétique de cette transition.
Nous avons caractérisé les transitions micellaires d'une série de copolymères
Pluronic avec un ratio PEO/PPO constant et un poids moléculaire croissant (P84,
P94 et P104) par diffusion de lumière statique et dynamique. Nous avons observé
que la croissance et la décroissance des agrégats micellaires dépendaient
fortement du poids moléculaire du copolymère et présentaient des voies cinétiques
distinctes. Au-dessus de la cmT, la fonction d'autocorrélation de l'intensité diffusée
présente un seul mode de relaxation qui correspond à la diffusion Brownienne de
micelles sphériques d'environ 8 nm de rayon. Au-dessus d'une certaine
fonction d'autocorrélation de l'intensité présente deux modes de relaxation (rapide
et lent), traduisant ainsi l'apparition d'agrégats micellaires de taille plus élevée.
218
Nous avons suivi l'évolution de ces deux modes de relaxation en fonction du temps
écoulé pour caractériser la cinétique de croissance et de décroissance des agrégats
micellaires après des sauts de température.
Le polymère P84 montre un ajustement rapide de la taille micellaire en deux étapes
après chaque saut de température (T-steps) et forme des cylindres allongés à
l'équilibre thermodynamique. Cette croissance micellaire traduit un échange rapide
des unimères et des mécanismes de fusion/fission facilités par le faible poids
moléculaire du P84. Pour le copolymère P94, de poids moléculaire plus important,
ces processus sont ralentis et une croissance continue d'agrégats micellaires
allongés est observée. La cinétique de croissance est dominée par une
fusion/fission bien plus lente, qui rend l'équilibre thermodynamique
problématique. Finalement, dans le cas du Pluronic P104, les processus de
fusion/fission deviennent tellement difficiles que les agrégats de micelles ne se
transforment plus en micelles cylindriques et restent sous forme sphéroïdale. On
observe seulement une très faible croissance des micelles sphériques par le
processus d'échange des unimères. Pour tous les copolymères, on observe une
coexistence de micelles sphériques avec les agrégats de plus grande taille.
Après refroidissement des solutions vers le régime des micelles sphériques, les
micelles allongées de P84 reviennent très rapidement à leur état de micelles
sphériques, tandis que les agrégats micellaires de P94 et P104 restent plusieurs
jours dans l'état atteint à haute température, micelles allongées pour le P94 et
sphéroïdes pour le P104.
Ces résultats sont expliqués par plusieurs processus élémentaires qui fonctionnent
simultanément pour équilibrer la population des assemblages micellaires après une
augmentation de la température, à savoir l'insertion/l'expulsion des unimères,
l'agrégation/dissociation des agrégats micellaires, et la fusion/bourgeonnement
des agrégats micellaires. Les cinétiques de ces processus élémentaires dépendent
fortement du poids moléculaire du copolymère. Ces résultats ont motivé le choix
du P94 comme polymère de base pour la conception de nos nanovéhicules.
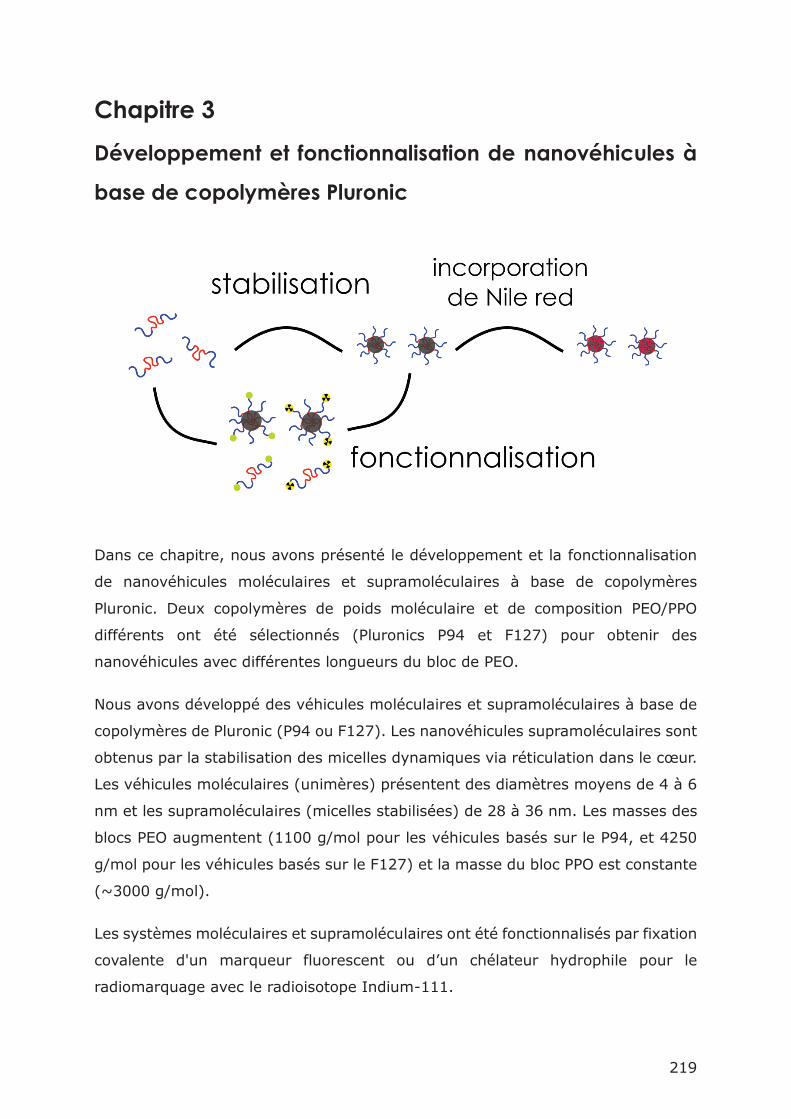
219
Chapitre 3
Développement et fonctionnalisation de nanovéhicules à
base de copolymères Pluronic
Dans ce chapitre, nous avons présenté le développement et la fonctionnalisation
de nanovéhicules moléculaires et supramoléculaires à base de copolymères
Pluronic. Deux copolymères de poids moléculaire et de composition PEO/PPO
différents ont été sélectionnés (Pluronics P94 et F127) pour obtenir des
nanovéhicules avec différentes longueurs du bloc de PEO.
Nous avons développé des véhicules moléculaires et supramoléculaires à base de
copolymères de Pluronic (P94 ou F127). Les nanovéhicules supramoléculaires sont
obtenus par la stabilisation des micelles dynamiques via réticulation dans le .
Les véhicules moléculaires (unimères) présentent des diamètres moyens de 4 à 6
nm et les supramoléculaires (micelles stabilisées) de 28 à 36 nm. Les masses des
blocs PEO augmentent (1100 g/mol pour les véhicules basés sur le P94, et 4250
g/mol pour les véhicules basés sur le F127) et la masse du bloc PPO est constante
(~3000 g/mol).
Les systèmes moléculaires et supramoléculaires ont été fonctionnalisés par fixation
covalente d'un marqueur fluorescent un chélateur hydrophile pour le
radiomarquage avec le radioisotope Indium-111.
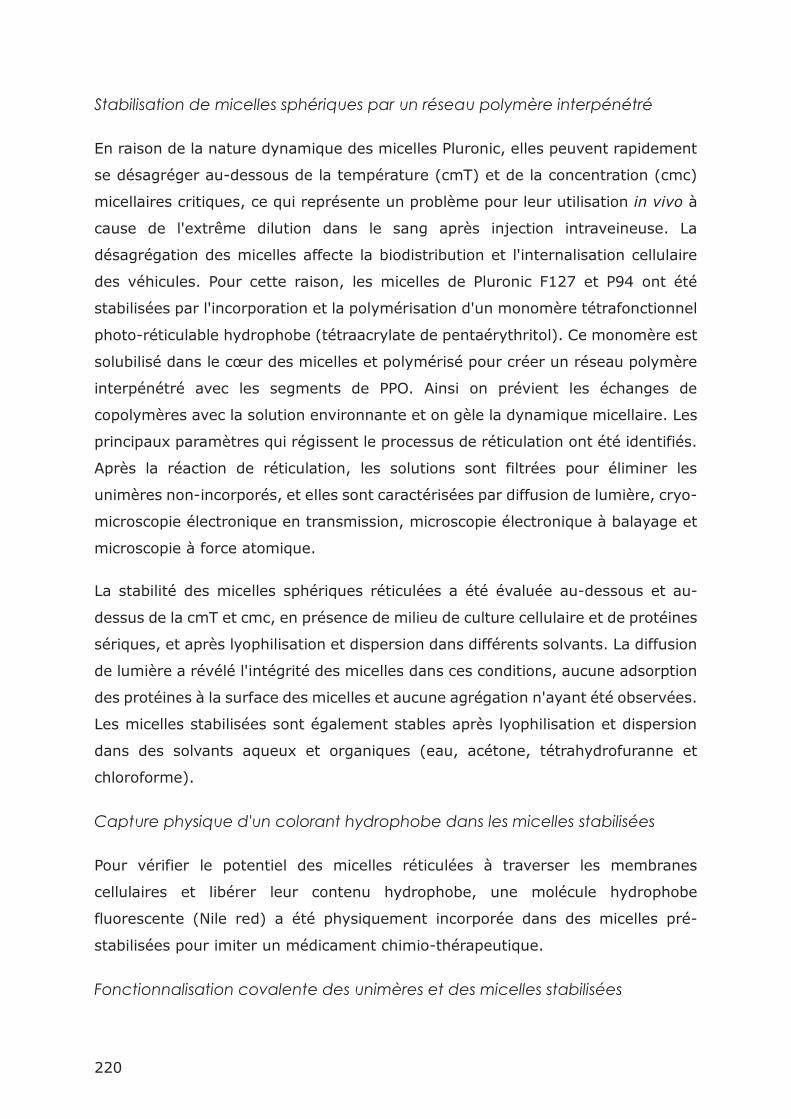
220
Stabilisation de micelles sphériques par un réseau polymère interpénétré
En raison de la nature dynamique des micelles Pluronic, elles peuvent rapidement
se désagréger au-dessous de la température (cmT) et de la concentration (cmc)
micellaires critiques, ce qui représente un problème pour leur utilisation in vivo à
cause de l'extrême dilution dans le sang après injection intraveineuse. La
désagrégation des micelles affecte la biodistribution et l'internalisation cellulaire
des véhicules. Pour cette raison, les micelles de Pluronic F127 et P94 ont été
stabilisées par l'incorporation et la polymérisation d'un monomère tétrafonctionnel
photo-réticulable hydrophobe (tétraacrylate de pentaérythritol). Ce monomère est
solubilisé dans le des micelles et polymérisé pour créer un réseau polymère
interpénétré avec les segments de PPO. Ainsi on prévient les échanges de
copolymères avec la solution environnante et on gèle la dynamique micellaire. Les
principaux paramètres qui régissent le processus de réticulation ont été identifiés.
Après la réaction de réticulation, les solutions sont filtrées pour éliminer les
unimères non-incorporés, et elles sont caractérisées par diffusion de lumière, cryo-
microscopie électronique en transmission, microscopie électronique à balayage et
microscopie à force atomique.
La stabilité des micelles sphériques réticulées a été évaluée au-dessous et au-
dessus de la cmT et cmc, en présence de milieu de culture cellulaire et de protéines
sériques, et après lyophilisation et dispersion dans différents solvants. La diffusion
de lumière a révélé l'intégrité des micelles dans ces conditions, aucune adsorption
des protéines à la surface des micelles et aucune agrégation n'ayant été observées.
Les micelles stabilisées sont également stables après lyophilisation et dispersion
dans des solvants aqueux et organiques (eau, acétone, tétrahydrofuranne et
chloroforme).
Capture physique d'un colorant hydrophobe dans les micelles stabilisées
Pour vérifier le potentiel des micelles réticulées à traverser les membranes
cellulaires et libérer leur contenu hydrophobe, une molécule hydrophobe
fluorescente (Nile red) a été physiquement incorporée dans des micelles pré-
stabilisées pour imiter un médicament chimio-thérapeutique.
Fonctionnalisation covalente des unimères et des micelles stabilisées
221
Les véhicules moléculaires (unimères) et supramoléculaires (micelles réticulées)
de Pluronics P94 et F127 ont également été modifiés chimiquement avec une sonde
fluorescente hydrophile (isothiocyanate de fluorescéine: FITC) ou un chélateur (S-
2-(4-benzyl isothiocyanate) pentaacétique-diéthylènetriamine: p-SCN-Bn-DTPA).
Pour cela, les copolymères ont été d'abord modifiés avec des amines primaires sur
les groupes terminaux des séquences PEO par les partenaires du projet. La
fonctionnalisation a ensuite été obtenue par réaction des amines primaires avec
les groupes isothiocyanate réactifs dans le FITC et le p-SCN-Bn-DTPA pour former
des complexes de thiourée très stables.
Le chélateur fixé aux nanovéhicules fonctionnalisés a été complexé avec le
radioisotope Indium-111. L'efficacité de la conjugaison du chélateur aux
nanovéhicules et du radiomarquage des nanovéhicules moléculaires et
supramoléculaires a été déterminée par la radio-TLC après le radiomarquage par
l'indium-111. La purification des micelles stabilisées a été réalisée pour obtenir
une haute pureté radiochimique appropriée pour les études in vitro et in vivo.
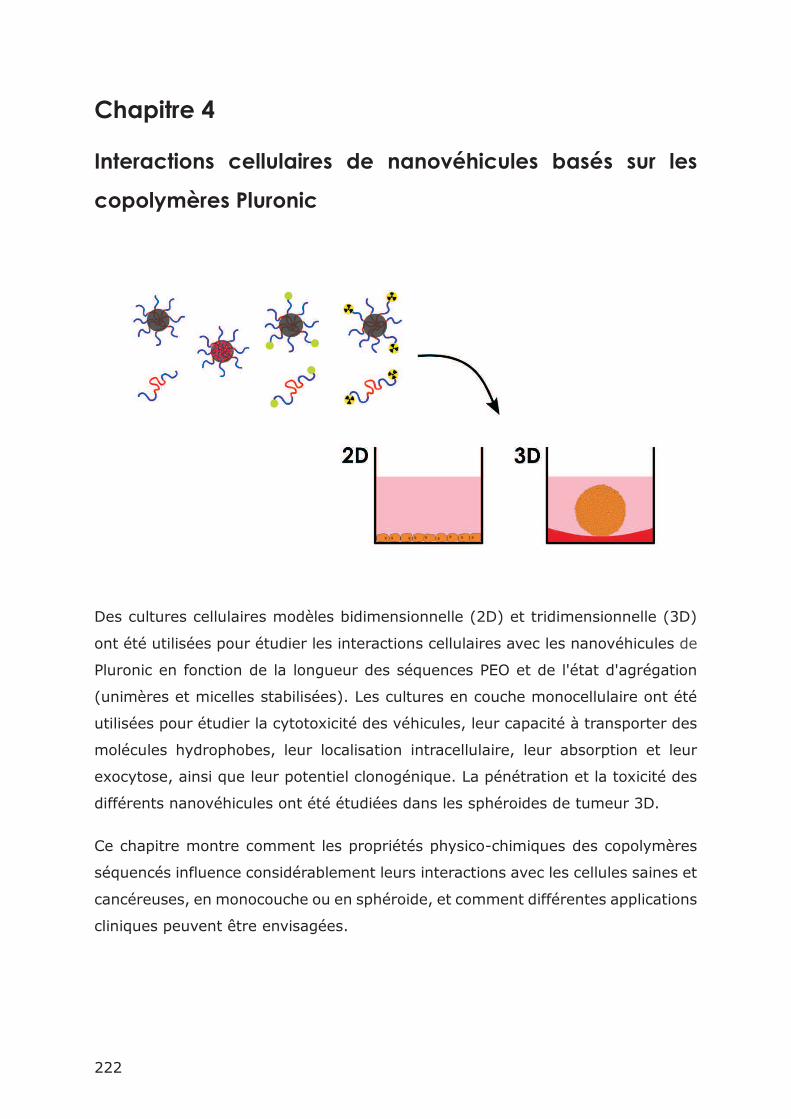
222
Chapitre 4
Interactions cellulaires de nanovéhicules basés sur les
copolymères Pluronic
Des cultures cellulaires modèles bidimensionnelle (2D) et tridimensionnelle (3D)
ont été utilisées pour étudier les interactions cellulaires avec les nanovéhicules de
Pluronic en fonction de la longueur des séquences PEO et de l'état d'agrégation
(unimères et micelles stabilisées). Les cultures en couche monocellulaire ont été
utilisées pour étudier la cytotoxicité des véhicules, leur capacité à transporter des
molécules hydrophobes, leur localisation intracellulaire, leur absorption et leur
exocytose, ainsi que leur potentiel clonogénique. La pénétration et la toxicité des
différents nanovéhicules ont été étudiées dans les sphéroides de tumeur 3D.
Ce chapitre montre comment les propriétés physico-chimiques des copolymères
séquencés influence considérablement leurs interactions avec les cellules saines et
cancéreuses, en monocouche ou en sphéroide, et comment différentes applications
cliniques peuvent être envisagées.
223
Etudes in vitro 2D d'unimères et de micelles stabilisées
Cytotoxicité
La cytotoxicité des micelles réticulées a été évaluée in vitro avec une lignée de
cellules saines (fibroblastes NIH/3T3) et comparée avec les copolymères bruts par
le test MTT. La culture cellulaire de NIH/3T3 fibroblastes a été optimisée en vue de
de la cytotoxicité de nanovéhicules. La viabilité cellulaire après
exposition à différentes concentrations d'échantillon pendant 24h ou 48h a montré
que les micelles réticulées ne sont pas plus toxiques que les copolymères bruts.
De plus, nous avons observé une toxicité du P94 à des concentrations élevées,
tandis que le F127 à toutes les concentrations testées.
Internalisation de micelles stabilisées avec un colorant hydrophobe (Nile red)
et colocalisation avec les mitochondries
Les fibroblastes NIH/3T3 ont été incubés avec les micelles réticulées fluorescentes.
Une fluorescence correspondant au colorant a été vue à l'intérieur des cellules pour
les deux types de micelles stabilisées (SPM-P94 ou SPM-F127). Ceci montre que
restent associés aux micelles,
des vésicules d'endocytose. dans
les mitochondries. Ces résultats démontrent que ces nanoparticules peuvent
incorporer des molécules hydrophobes et les libérer à travers la membrane
cellulaire.
Internalisation
La fonctionnalisation avec FITC a permis de visualiser la localisation intracellulaire
de P94-FITC, F127-FITC, SPM-P94-FITC et SPM-F127-FITC dans des cellules
cancéreuses (cellules d'adénocarcinome cervical HeLa et de glioblastome U87) par
microscopie confocale. Les résultats montrent que les unimères ne sont pas
retenus dans les lysosomes, et se distribuent dans toute la cellule: dispersés dans
le cytoplasme, et autour (F127) ou même à l'intérieur (P94) du noyau. Au
contraire, les micelles stabilisées sont plus localisées en petites taches à l'intérieur
du cytoplasme de la cellule.
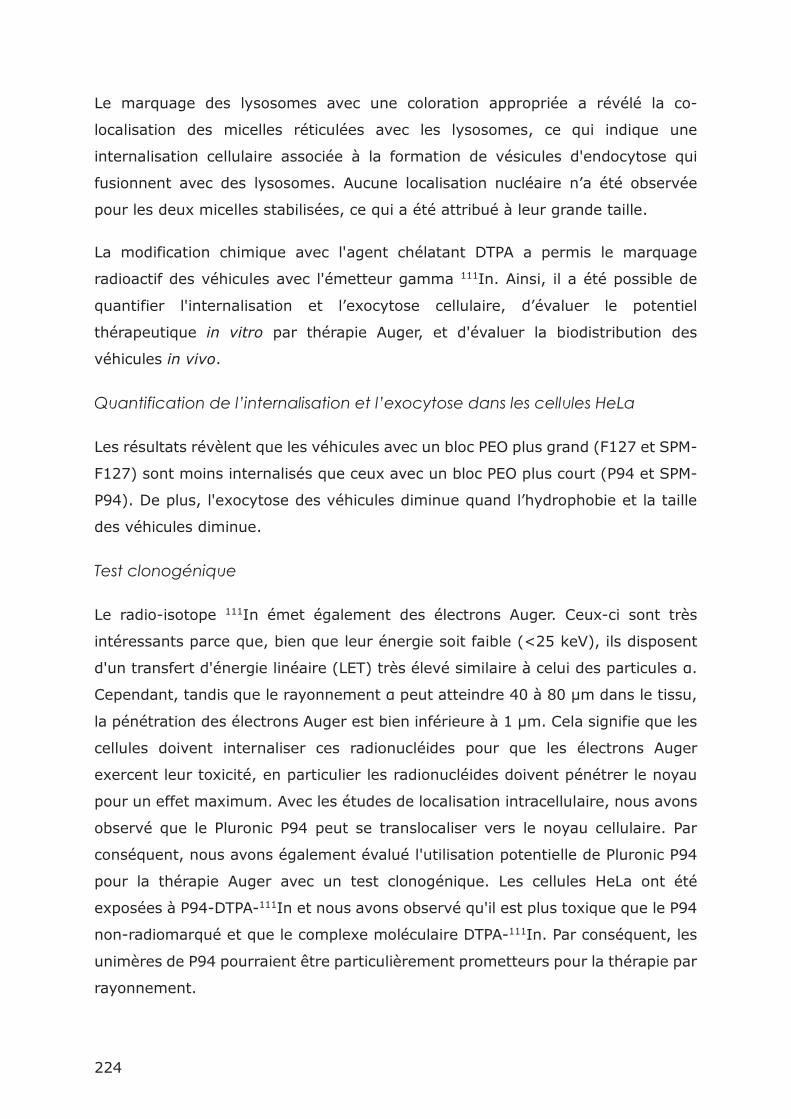
224
Le marquage des lysosomes avec une coloration appropriée a révélé la co-
localisation des micelles réticulées avec les lysosomes, ce qui indique une
internalisation cellulaire associée à la formation de vésicules d'endocytose qui
fusionnent avec des lysosomes. Aucune localisation nucléaire a été observée
pour les deux micelles stabilisées, ce qui a été attribué à leur grande taille.
La modification chimique avec l'agent chélatant DTPA a permis le marquage
radioactif des véhicules avec l'émetteur gamma 111In. Ainsi, il a été possible de
quantifier l'internalisation et exocytose évaluer le potentiel
thérapeutique in vitro par thérapie Auger, et d'évaluer la biodistribution des
véhicules in vivo.
nternalisation et exocytose dans les cellules HeLa
Les résultats révèlent que les véhicules avec un bloc PEO plus grand (F127 et SPM-
F127) sont moins internalisés que ceux avec un bloc PEO plus court (P94 et SPM-
P94). De plus, l'exocytose des véhicules
des véhicules diminue.
Test clonogénique
Le radio-isotope 111In émet également des électrons Auger. Ceux-ci sont très
intéressants parce que, bien que leur énergie soit faible (<25 keV), ils disposent
d'un transfert d'énergie linéaire (LET) très élevé similaire à celui des particules .
Cependant, tandis que le rayonnement peut atteindre 40 à 80 µm dans le tissu,
la pénétration des électrons Auger est bien inférieure à 1 µm. Cela signifie que les
cellules doivent internaliser ces radionucléides pour que les électrons Auger
exercent leur toxicité, en particulier les radionucléides doivent pénétrer le noyau
pour un effet maximum. Avec les études de localisation intracellulaire, nous avons
observé que le Pluronic P94 peut se translocaliser vers le noyau cellulaire. Par
conséquent, nous avons également évalué l'utilisation potentielle de Pluronic P94
pour la thérapie Auger avec un test clonogénique. Les cellules HeLa ont été
exposées à P94-DTPA-111In et nous avons observé qu'il est plus toxique que le P94
non-radiomarqué et que le complexe moléculaire DTPA-111In. Par conséquent, les
unimères de P94 pourraient être particulièrement prometteurs pour la thérapie par
rayonnement.
225
Etudes in vitro 3D d'unimères et de micelles stabilisées
Le développement de sphéroïdes tumoraux tridimensionnels des cellules HeLa et
des cellules U87 a permis une autre approche de la pénétration et de la toxicité
des unimères et des micelles réticulées. Ces agrégats multicellulaires imitent le
contexte cellulaire et les gradients physiopathologiques de tumeurs in vivo et on
s'attend donc à ce que le comportement des véhicules in vitro en présence de ces
sphéroïdes tumoraux reflète mieux le comportement in vivo que les études in vitro
sur cultures monocouches bidimensionnelles classiques. Les résultats obtenus par
microscopie confocale ont révélé que les micelles réticulées (SPM-F127-FITC) sont
capables de pénétrer plus profondément dans la tumeur in vitro que les unimères
(F127-FITC). Les véhicules plus hydrophobes (SPM-P94 et P94) ont induit une
toxicité vérifiée par microscopie optique. Cette toxicité se traduit par la diminution
de la taille des sphéroïdes (U87) et des changements de leur morphologie (HeLa).
Ce sont donc des véhicules prometteurs pour les applications d'imagerie et de
thérapie.
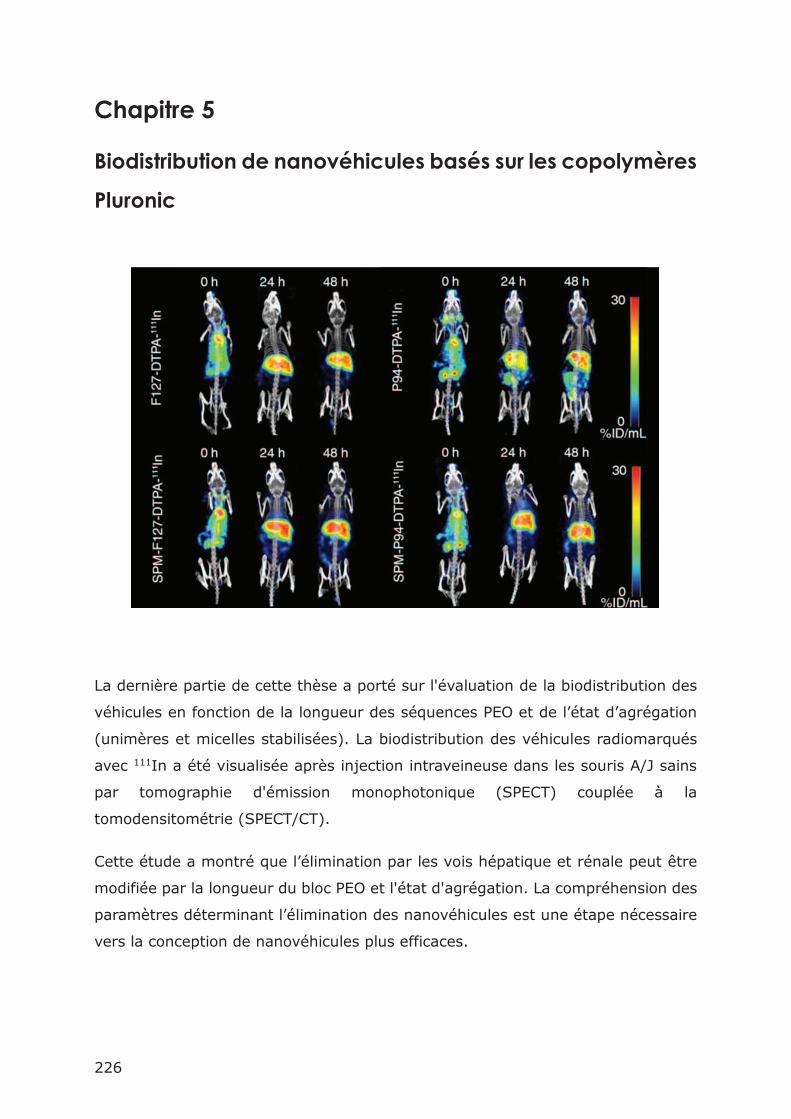
226
Chapitre 5
Biodistribution de nanovéhicules basés sur les copolymères
Pluronic
La dernière partie de cette thèse a porté sur l'évaluation de la biodistribution des
véhicules
(unimères et micelles stabilisées). La biodistribution des véhicules radiomarqués
avec 111In a été visualisée après injection intraveineuse dans les souris A/J sains
par tomographie d'émission monophotonique (SPECT) couplée à la
tomodensitométrie (SPECT/CT).
Cette étude a montré que l être
modifiée par la longueur du bloc PEO et l'état d'agrégation. La compréhension des
paramètres déterm ne étape nécessaire
vers la conception de nanovéhicules plus efficaces.
227
Les nanovéhicules à base de Pluronic F127 ont montré une accumulation plus
importante dans le foie, tandis que les véhicules à base de Pluronic P94 avaient
une élimination rénale initiale plus élevée. Contrairement à la majorité des
véhicules supramoléculaires développés jusqu'ici, pour lesquels une accumulation
importante dans les tissus non ciblés (foie et rate) est souvent observée, les
micelles réticulées de Pluronics ne s'accumulent pas dans la rate.
L'état d'agrégation a influencé principalement la rétention des véhicules dans le
foie où les micelles stabilisées à base du Pluronic plus hydrophobe (SPM-P94) ont
été retenues plus longtemps que les unimères correspondants (P94). Par ailleurs,
les micelles stabilisées préparées avec le polymère plus hydrophile (SPM-F127) ont
été éliminés de manière plus efficace que les unimères correspondants (F127).
Nos résultats montrent la nécessité de choisir avec plus de précautions les
paramètres qui déterminent la biodistribution des nanovéhicules (composition,
longueur de séquence PEO, état d'agrégation) et comment de petites variations
peuvent aboutir à des effets biologiques très différents.
228
Conclusions et perspectives
Dans le cadre du projet "TRACE'nTREAT" dont l'objectif était de développer de
nouvelles technologies moléculaires pour l'imagerie moléculaire nucléaire et la
thérapie par radionucléides, nous avons développé des nanovéhicules à partir de
copolymères séquencés, auto- nimères.
Nous avons caractérisé la cinétique de formation, de croissance et de décroissance
des micelles formées à partir d'une série de copolymères séquencés de poids
moléculaires différents et de composition PEO/PPO constante. Cela nous a permis
d'identifier plusieurs voies cinétiques concurrentes pour la transition de la forme
sphérique à la forme cylindrique. La principale conclusion est que, dans ces
conditions expérimentales, aucune des voies cinétiques ne peut être négligée si on
veut comprendre la morphologie finale des agrégats. De plus, l'équilibrage de la
population des micelles devient très difficile sur emaine
même pour de légères augmentations de poids moléculaire des copolymères, et la
structure des solutions devient dépendante de l'histoire thermique spécifique de
l'échantillon.
En raison de l'effet marqué du poids moléculaire sur le poids respectif des voies
cinétiques, nous comprenons pourquoi un consensus sur les mécanismes
d'équilibrage de micelles de copolymère a été difficile à réaliser
partir de résultats obtenus avec des copolymères de nature, composition,
architecture ou poids moléculaire différents.
A partir de cette étude cinétique, nous avons choisi les Pluronics P94 et F127 pour
le développement de nouveaux nanovéhicules et cette étude a montré aussi la
nécessité de stabiliser la structure des micelles pour éviter leur désintégration dans
le flux sanguin. En raison de la nature dynamique des micelles de Pluronics, les
auto-assemblages supramoléculaires ont été photo-réticulés par incorporation
Les monomères
et les micelles stabilisées ont été caractérisés et, en particulier, nous avons vérifié
la très bonne stabilité des micelles dans différentes conditions.
229
Nous avons développé de nouvelles méthodes pour fonctionnaliser les systèmes
moléculaires et supramoléculaires avec des marqueurs fluorescents ou des
chélateurs pour permettre leur imagerie in vitro et in vivo. Nous avons discuté le
radiomarquage des nanovéhicules et les différents aspects qui doivent être pris en
compte pour la caractérisation de l'efficacité de radiomarquage. Nous avons établi
les protocoles correspondants pour la préparation et la purification d'échantillons
prêts à leur utilisation in vitro et in vivo. Les nouvelles stratégies et techniques
décrites ici peuvent être généralisées pour créer de nouveaux nanovéhicules
polyvalents avec d'autres fonctionnalités, en combinant des modifications et/ou
des molécules appropriées.
La cytotoxicité et la capacité d'incorporation de molécules hydrophobes ont été
évaluées in vitro. La localisation intracellulaire, la et
exocytose cellulaire, la pénétration et la toxicité dans des sphéroides tumoraux
et le potentiel thérapeutique par des électrons Auger ont été testés in vitro avec
deux lignées de cellules tumorales. Enfin, la biodistribution in vivo des
nanovéhicules radiomarqués a été évaluée dans des souris saines par imagerie
SPECT/CT.
Ces résultats ont montré que la longueur du bloc de PEO et l'état d'agrégation
modifient les interactions avec les cellules et la biodistribution. En particulier,
différentes voies d'internalisation ont été activées in vitro, et initiale
et finale par voies rénale et hépatique des véhicules varie avec ces paramètres.
Une plus grande longueur du bloc de PEO est associée à l'augmentation de
l'absorption dans le foie, et la rétention dans cet organe dépend également de
l'état d'agrégation des copolymères.
Les résultats de cette thèse démontrent qu'une approche rationnelle est nécessaire
à l'élaboration des nanomédicaments, depuis l fondamentale de la cinétique
de formation des micelles jusqu'aux études approfondies in vitro et in vivo. La
variation des propriétés physico-chimiques et des fonctionnalités peut être utilisés
pour limiter les interactions avec les barrières biologiques, cibler des organites
intracellulaires spécifiques, améliorer la cinétique d'absorption et exocytose,
et/ou augmenter la pénétration et la toxicité dans les tumeurs.
230
Globalement, cette thèse présente le développement complet de nanovéhicules
composés de copolymères Pluronics depuis les premières étapes de la
caractérisation physico-chimique fondamentale jusqu'à l'évaluation de leur intérêt
pour les applications d'imagerie et de thérapie.


