Embed Size (px)
Citation preview

DEVELOPMENT OF MULTISENSORY REWEIGHTING FORPOSTURE CONTROL IN CHILDREN
Woei-Nan Bair1, Tim Kiemel1, John J. Jeka1,2,3, and Jane E. Clark1,21Department of Kinesiology, University of Maryland, College Park College Park, MD 20742- 2611,USA2Program in Neuroscience and Cognitive Science, University of Maryland, College Park CollegePark, MD 20742- 2611, USA3Program in Bioengineering, University of Maryland, College Park College Park, MD 20742- 2611,USA
AbstractReweighting to multisensory inputs adaptively contributes to stable and flexible upright stancecontrol. However, few studies have examined how early a child develops multisensory reweightingability, or how this ability develops through childhood. The purpose of the study was to characterizea developmental landscape of multisensory reweighting for upright postural control in children 4 to10 years of age. Children were presented with simultaneous small-amplitude somatosensory andvisual environmental movement at 0.28 and 0.2 Hz, respectively, within five conditions thatindependently varied the amplitude of the stimuli. The primary measure was body sway amplituderelative to each stimulus: touch gain and vision gain. We found that children can reweight tomultisensory inputs from 4 years on. Specifically, intra-modal reweighting was exhibited by childrenas young as 4 years of age; however, inter-modal reweighting was only observed in the older children.The amount of reweighting increased with age indicating development of a better adaptive ability.Our results rigorously demonstrate the development of simultaneous reweighting to two sensoryinputs for postural control in children. The present results provide further evidence that thedevelopment of multisensory reweighting contributes to more stable and flexible control of uprightstance which ultimately serves as the foundation for functional behaviors such as locomotion andreaching.
Keywordsdevelopment; children; posture; multisensory integration; sensory reweighting
IntroductionChildren, like adults, use information from multiple sensory systems to maintain their uprightposture. Studies on postural development have shown age-related changes in the use of visionto control posture in infants (Bertenthal and Bai, 1989; Bertenthal and Bai, 1997; Foster et al.,1996; Lee and Aronson, 1974) and in children (Foster et al., 1996; Kim, 2004; Schmuckler,1997). Similarly, studies have demonstrated age-related trends in postural development whensomatosensory inputs are manipulated in infants (Barela et al., 1999; Metcalfe and Clark,
Corresponding author: Jane E. Clark University of Maryland - Department of Kinesiology College Park, MD 20742-2611 e-mail: E-mail: [email protected] PHONE: 301-405-2450 FAX: 301-405-5578.
NIH Public AccessAuthor ManuscriptExp Brain Res. Author manuscript; available in PMC 2009 August 4.
Published in final edited form as:Exp Brain Res. 2007 December ; 183(4): 435–446. doi:10.1007/s00221-007-1057-2.
NIH
-PA Author Manuscript
NIH
-PA Author Manuscript
NIH
-PA Author Manuscript

2000; Metcalfe et al., 2005a, 2005b) and in children (Barela et al., 2003). While themanipulation of single sensory inputs has contributed greatly to our understanding of posturalcontrol development in infants and children, far less is known about how multiple sensoryinputs are integrated and used in postural development.
The importance of sensory “integration” to postural development was first recognized byForssberg and Nashner in their 1982 seminal paper (Forssberg and Nashner, 1982). Althoughthe authors suggested that children below the age of 7.5 years were unable to adaptively`reweight' multiple sensory inputs, few have followed up on this suggestion and those whohave examined children's postural responses to more than one sensory input have not employedexperimental procedures that would permit systematic examination of sensory weighting orreweighting. A recent experimental technique, however, has been developed that resolves thisproblem by presenting simultaneous sinusoidal sensory inputs at different frequencies and withdiffering amplitudes revealing the system's ability to reweight sensory input dependent on inputamplitude (Oie, Kiemel et al., 2002;Allison, Kiemel et al., 2006). The present study uses thistechnique to examine how early a child develops multisensory reweighting ability and howthis ability develops through childhood. We tested children 4 to 10 years old to quantitativelycharacterize a `developmental landscape' of multisensory integration for postural control.
Previous studies that have explored postural control by varying a single sensory input (e.g.,vision or somatosensory inputs) have shown that postural control develops gradually andimproves with increased motor experience. Infants sway or even fall backwards with anapproaching visual scene in early sitting (Bertenthal and Bai, 1989) or standing (Lee andAronson, 1974). With increased experience in sitting and standing, children are less likely tofall, exhibit directionally appropriate postural responses and sway less than infants (Foster etal., 1996). When the visual scene oscillates, infants respond to the motion more consistentlywith increased age (Bertenthal and Bai, 1997), while 3- to 6-year-old children exhibit a phaselag that increases with driving frequency (Schmuckler, 1997). For 4- to 8-year-old childrenlightly touching an oscillating surface with their finger tip, phase lag also increases withfrequency and gain (sway amplitude divided by stimulus amplitude) exhibits a peak atintermediate frequencies (Barela et al., 2003).
The pattern of gain and phase across frequency in these latter two studies is qualitatively similarto adults. However, such a pattern does not necessarily indicate an adult-like ability to adaptto multisensory information. Even in a linear non-adaptive system, gain and phase change withstimulus frequency (Glad and Ljung, 2000). Therefore, varying stimulus frequency does notdirectly probe the critical ability to adaptively reweight different sensory modalities whensensory conditions change. A more direct way of studying sensory reweighting is by measuringgain changes across different stimulus amplitudes at the same frequency. Such amplitude-dependent gain changes indicate some type of nonlinearity, for example, adaptation. In adults,amplitude-dependent gain changes have been reported for visual scene motion (Peterka andBenolken, 1995) and have been reproduced in models with sensory reweighting (Carver et al.,2005; van der Kooij et al., 2001). This amplitude-dependent gain change has importantfunctional significance. If stimulus amplitude is too large, the postural system needs todownweight this information. Likewise, if individuals were to remain strongly coupled to avisual scene whose amplitude increased, they might sway too much or potentially fall. In otherwords, a constant gain to a change in stimulus amplitude is nonadaptive for a control system.
To our knowledge, only one study has reported similar amplitude-dependent gain changes tosystematically manipulated changes in sinusoidal visual input in 4- and 6-year-old children(Kim, 2004). In children, we hypothesize, as did Forssberg and Nashner (1982), thatimprovements in postural control with development may be due in part to increases in sensoryreweighting. For example, the fact that children fall less often than infants in a visual moving
Bair et al. Page 2
Exp Brain Res. Author manuscript; available in PMC 2009 August 4.
NIH
-PA Author Manuscript
NIH
-PA Author Manuscript
NIH
-PA Author Manuscript

room (Foster et al., 1996) may be because they more effectively downweight visual informationwhen the room begins to move, something that the infants are not able to do (Lee and Aronson,1974).
Individuals are confronted with multiple sensory changes in everyday life. A change in onesensory modality does not always correspond to changes in other sensory modalities. Forexample, when standing on a sandy shoreline watching trees blown by the breeze, wave actiondetermines how fast the sand is washed away under your feet (and how much somatosensoryinformation changes) whereas wind speed determines how much visual information changesproduced by the movements of leaves. Ambiguity may occur because of incongruent sensoryinformation from different sources (e.g. waves and leaves do not move in synchronization).Nevertheless, the central nervous system has the ability to integrate multisensory informationadaptively to solve the ambiguity produced by physical stimuli and to establish a coherentinternal percept. This multisensory fusion ability has been proposed to be critical for posturalcontrol (Jeka et al., 2000; Peterka, 2002).
In adults, multisensory reweighting in posture control has been studied by Oie et al. using aparadigm that systematically manipulates the amplitudes of simultaneous visual scene andtouch bar oscillations across trials (Oie et al., 2002). Gain to each individual sensory modalitydepends not only on that specific modality's amplitude but also on the amplitude of the othersimultaneously presented modality. For example, the dependence of vision gain on visualmovement amplitude is interpreted as intra-modal reweighting; whereas the dependence ofvision gain on touch bar amplitude is interpreted as inter-modal reweighting. Analogously, thedependence of touch gain on touch bar movement is interpreted as intra-modal reweighting,whereas the dependence of touch gain on visual movement amplitude is interpreted as inter-modal reweighting. In children, Foster et al. (1996) proposed that the inability to switch froman unreliable to a reliable source of perceptual information may explain why young infants fallmore frequently than older children in the visual moving room. However, there are no studiesthat report sensory weights when two sensory inputs are simultaneously oscillating. Insummary, currently there is only limited evidence demonstrating that children reweight tosensory input amplitude adaptively for postural control. Moreover, the evidence is limited toa single sensory modality, vision (Kim, 2004).
In this study, we implement the same protocol as Oie et al. (2002) with children 4 to 10 yearsof age. The purpose is to characterize the development of multisensory reweighting for posturalcontrol. Specifically, we ask these questions: 1). Do children reweight to multiple sensoryinputs? 2).Do children exhibit both intra- and inter-modal reweighting to two simultaneouslyoscillating sensory inputs? 3). Does reweighting increase with age?
MethodSubjects
Forty-one typically developing children (20 girls and 21 boys) were recruited to participate inthis study. Their age ranged from 4.2 to10.8 years old with a mean age of 7.5 years. The ageof the participants was distributed evenly across the age range (see data distribution along ageaxis in Figure 4). All subjects were given oral instructions and explanations. Both an informedconsent and videotaping agreements were signed by parents. The guidelines approved by theInternal Review Board at the University of Maryland were followed. Each child was tested onMovement Assessment Battery for Children (MABC) (Henderson and Sugden, 1992) to screentheir current motor ability in manual dexterity, ball skills and balance for participationeligibility. Subjects with MABC below 20th percentile were excluded from the study.
Bair et al. Page 3
Exp Brain Res. Author manuscript; available in PMC 2009 August 4.
NIH
-PA Author Manuscript
NIH
-PA Author Manuscript
NIH
-PA Author Manuscript
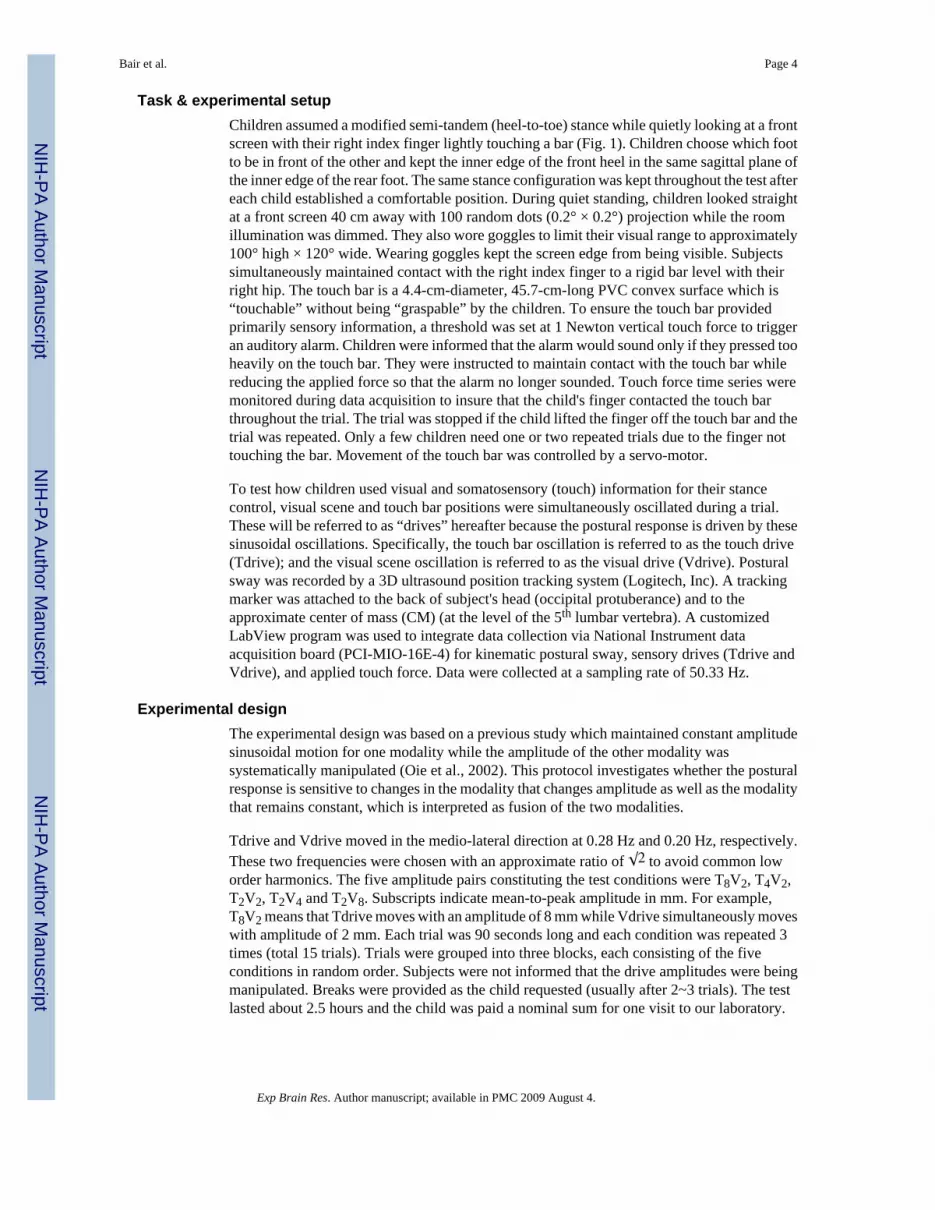
Task & experimental setupChildren assumed a modified semi-tandem (heel-to-toe) stance while quietly looking at a frontscreen with their right index finger lightly touching a bar (Fig. 1). Children choose which footto be in front of the other and kept the inner edge of the front heel in the same sagittal plane ofthe inner edge of the rear foot. The same stance configuration was kept throughout the test aftereach child established a comfortable position. During quiet standing, children looked straightat a front screen 40 cm away with 100 random dots (0.2° × 0.2°) projection while the roomillumination was dimmed. They also wore goggles to limit their visual range to approximately100° high × 120° wide. Wearing goggles kept the screen edge from being visible. Subjectssimultaneously maintained contact with the right index finger to a rigid bar level with theirright hip. The touch bar is a 4.4-cm-diameter, 45.7-cm-long PVC convex surface which is“touchable” without being “graspable” by the children. To ensure the touch bar providedprimarily sensory information, a threshold was set at 1 Newton vertical touch force to triggeran auditory alarm. Children were informed that the alarm would sound only if they pressed tooheavily on the touch bar. They were instructed to maintain contact with the touch bar whilereducing the applied force so that the alarm no longer sounded. Touch force time series weremonitored during data acquisition to insure that the child's finger contacted the touch barthroughout the trial. The trial was stopped if the child lifted the finger off the touch bar and thetrial was repeated. Only a few children need one or two repeated trials due to the finger nottouching the bar. Movement of the touch bar was controlled by a servo-motor.
To test how children used visual and somatosensory (touch) information for their stancecontrol, visual scene and touch bar positions were simultaneously oscillated during a trial.These will be referred to as “drives” hereafter because the postural response is driven by thesesinusoidal oscillations. Specifically, the touch bar oscillation is referred to as the touch drive(Tdrive); and the visual scene oscillation is referred to as the visual drive (Vdrive). Posturalsway was recorded by a 3D ultrasound position tracking system (Logitech, Inc). A trackingmarker was attached to the back of subject's head (occipital protuberance) and to theapproximate center of mass (CM) (at the level of the 5th lumbar vertebra). A customizedLabView program was used to integrate data collection via National Instrument dataacquisition board (PCI-MIO-16E-4) for kinematic postural sway, sensory drives (Tdrive andVdrive), and applied touch force. Data were collected at a sampling rate of 50.33 Hz.
Experimental designThe experimental design was based on a previous study which maintained constant amplitudesinusoidal motion for one modality while the amplitude of the other modality wassystematically manipulated (Oie et al., 2002). This protocol investigates whether the posturalresponse is sensitive to changes in the modality that changes amplitude as well as the modalitythat remains constant, which is interpreted as fusion of the two modalities.
Tdrive and Vdrive moved in the medio-lateral direction at 0.28 Hz and 0.20 Hz, respectively.These two frequencies were chosen with an approximate ratio of to avoid common loworder harmonics. The five amplitude pairs constituting the test conditions were T8V2, T4V2,T2V2, T2V4 and T2V8. Subscripts indicate mean-to-peak amplitude in mm. For example,T8V2 means that Tdrive moves with an amplitude of 8 mm while Vdrive simultaneously moveswith amplitude of 2 mm. Each trial was 90 seconds long and each condition was repeated 3times (total 15 trials). Trials were grouped into three blocks, each consisting of the fiveconditions in random order. Subjects were not informed that the drive amplitudes were beingmanipulated. Breaks were provided as the child requested (usually after 2~3 trials). The testlasted about 2.5 hours and the child was paid a nominal sum for one visit to our laboratory.
Bair et al. Page 4
Exp Brain Res. Author manuscript; available in PMC 2009 August 4.
NIH
-PA Author Manuscript
NIH
-PA Author Manuscript
NIH
-PA Author Manuscript

AnalysisPre-processing—Customized MatLab programs were implemented for data analysis. Allraw signals were mean subtracted and filtered by a zero-phase digital filtering using filtfiltfunction in Matlab. A 4th order Butterworth filter with low pass frequency at 5 Hz was usedto filter the signals in both the forward and reverse directions. Figure 2 shows the time seriesfor two drives and CM postural sway for a T4V2 trial. Only medio-lateral postural sway isillustrated here and analyzed hereafter as this was the direction of the visual scene and touchbar motions.
Transfer functions (TFs) with gains and phases—The transfer function (TF) at thedriving frequency was used to quantify the postural response to the drive. One TF is calculatedfor the postural sway recorded by each marker (head or CM) to each drive (Tdrive or Vdrive).The TF is a complex number that characterizes the response strength (gain) and the responsetiming (phase). Gain is calculated as the magnitude of the postural response divided by themagnitude of the drive. The phase describes the temporal relationship between postural swayand the drive. A positive phase indicates that the postural response leads the driving stimulus.The TF was computed for the last 75-second segment of the drive and sway signals using theWelch's method with 25-second windows and 50% overlap. The first 15 seconds of the signalwas not analyzed so as to exclude transient postural responses to the drives' onset. The 25-second window was chosen because it is an integer multiple of the drives' periods. TFs wereaveraged across the 3 trials for each subject and condition.
Statistical analysis—For all statistical tests, condition was treated as within-subjectrepeated factor, and age as inter-subject non-repeated factor; p<0.05 was considered significantand p<0.1 was considered marginally significant.
Nonlinear multivariate regression modelA separate nonlinear multivariate regression analysis was conducted for the postural responserecorded from each marker (head and CM) to each drive (Tdrive and Vdrive). The nonlinearmultivariate regression model was:
(1)
where n = 41 is the number of subjects, K = 5 is the number of conditions, ai is the age of thei-th subject, and Tik is the TF of the i-th subject in the k-th condition. The TFs dependence onage and condition were described by group gain gk(a) and group phase ϕk(a), the absolutevalue and argument of the mean TF in condition k at age a, respectively. We assumed thatgroup gain and phase were polynomial functions of age:
(2)
where m is the regression order, gjk are gain coefficients, and ϕjk are phase coefficients (j=0,…,m and k=1,…,K). For the i-th subject, random variation of TFs is described by the vectorvi = (δi1, …, δiK, εi1, …, εiK) of random variables, which was assumed to come from a zero-mean multivariate normal distribution. The covariance of vi was assumed to be the same forall subjects.
An alternative approach to model (1) would be to regress the individual subject gains andphases directly on age. We chose the approach of model (1) because estimates of TFs are
Bair et al. Page 5
Exp Brain Res. Author manuscript; available in PMC 2009 August 4.
NIH
-PA Author Manuscript
NIH
-PA Author Manuscript
NIH
-PA Author Manuscript

unbiased (Bendat and Piersol, 2000), consistent with the way that random variation is specifiedin model (1). When true gain is low, gains estimated from individual subjects have a positivebias, which would lead to a bias in the fitted gain curves in the alternative approach. Also, thefact that phase is a circular variable (Fisher, 1995) is naturally incorporated into model (1), butnot the alternative approach. This distinction is important when phase values are not tightlyclustered, as occurred in some cases in our data (Fig 4B).
Model fitting and hypothesis testingStatistical analysis of our data based on model (1) was performed using custom Matlabprograms using the optimization and statistical toolboxes. Model (1) has 2K(m+1) parameters:the gain coefficients gjk and the phase coefficients ϕjk (j=0,…,m and k=1,…,K). Parameterswere fit based on the empirical TFs by maximizing the model's concentrated log-likelihood(Seber and Wild, 2003). The fitted parameters were then used to compute the fitted gain andphase curves gk(a) and ϕk(a) of Eqns. (2). The approximate standard errors of gk(a) and ϕk(a)
were computed as , where wk(a) is the gradient vector of gk(a) or ϕk(a)with respect to model parameters and D is the matrix of second derivatives of the concentratedlog-likelihood with respect to model parameters, evaluated at the fitted parameters.
To test a null hypothesis H about model parameters, we fit the model with parametersconstrained by the null hypothesis. We then compared the maximum concentrated log-likelihood for the constrained model, MH, to the maximum concentrated log-likelihood of theunconstrained model, M, using either a likelihood ratio test applied to R = 2(M - MH) (Seberand Wild, 2003) or a F-test applied to Wilks' Λ = exp(-R/n) (Seber, 1984;Polit, 1996). The F-test is somewhat more accurate, whereas the likelihood ratio test has the flexibility to test anynull hypothesis.
Various hypotheses about the model were tested. First, regression orders m of 0, 1, 2 and 3were compared using Wilks' Λ. This comparison led to the selection of the model with m = 1(gain and phase are linear functions of age) as appropriate for further analysis (see Results).Next, we tested the selected 1st order model for an overall dependence on condition to addressour primary question whether children demonstrate reweighting across amplitude conditions.
To describe our data's dependence on age and condition in more detail, we focused on the threeconditions in which visual-scene and touch-bar motions were at their highest or lowestamplitudes: T8V2, T2V2 and T2V8. Since gain and phase were modeled as linear functions ofage, fitted lines for gain and phase could be fully specified by their end points at the minimumage (4.2 years) and maximum age (10.8 years) of our subjects. For each pair of conditions, wecompared the fitted gain curves at both age ends. The following changes in gain betweenconditions were interpreted as reweighting. Intra-modal reweighting is an increase in touchgain from T8V2 to T2V2 or a decrease in vision gain from T2V2 to T2V8. Inter-modalreweighting is an increase in touch gain from T2V2 to T2V8 or a decrease in vision gain fromT8V2 to T2V2. Total reweighting (sum of intraand inter-modal reweighting) is an increase intouch gain or a decrease in vision gain from T8V2 to T2V8 (conditions between which stimulusamplitudes are most different). We tested for total reweighting because it increased our powerto detect reweighting if both intra- and inter-modal reweighting were small. Given theseinterpretations, an increase (or decrease) of re-weighting with age corresponds to the gaindifference between two conditions increasing (or decreasing) with age. We tested for such age-dependent reweighting for each pair of conditions by testing for an age-by-conditioninteraction.
In summary, nine tests involving gain were performed (three condition pairs compared atminimum age, at maximum age, and tested for an age-by-condition interaction). Tests were
Bair et al. Page 6
Exp Brain Res. Author manuscript; available in PMC 2009 August 4.
NIH
-PA Author Manuscript
NIH
-PA Author Manuscript
NIH
-PA Author Manuscript

conducted using likelihood ratio tests and were based on model (1) reduced to three condition(K = 3). A closed testing procedure (Hochberg and Tamhane, 1987) was used to adjust p-valuesto control the familywise Type I error rate for the nine tests. The same tests were also performedon phase.
ResultsExemplar: TFs, gains and phases from a 10-year-old child
Figure 3 shows the TFs, gains and phases from a 10-year-old child, illustrating the posturalresponse distribution in the complex plane, and how gains and phases are extracted from TFs.As would be expected for segments higher up the kinematic chain, the postural response islarger for the head than for the CM. Transfer functions plotted for the head in Figure 3A arefurther from the origin than those for the CM in Figure 3D. Likewise, the head gains in Figure3B are larger than those for the CM in Figure 3E.
Gains across conditions for each modality are not constant, indicating both intra-modality andinter-modal reweighting. Intra-modal reweighting is signified by an increase in touch gainfrom T8V2 to T2V2; and a decrease in vision gain from T2V2 to T2V8. Inter-modalreweighting is signified by an increase in touch gain from T2V2 to T2V8; and a decrease invision gain from T8V2 to T2V2. Thus, both intra- and inter-modal reweighting patterns wereobserved in this child. Phase was relatively constant across conditions (Fig. 3C, D).
Fitted gain and phase curvesFor each marker (head and CM) and modality (touch and vision), we modeled gain and phaseas being either constant, linear functions of age, quadratic functions of age, or cubic functionsof age (Eqns. 2 with m = 0,…,3). For each model, we simultaneously fit gain and phase curvesusing the TFs from all five conditions (see Methods). Figure 4 shows an example of one suchmodel fit. Here linear gain and phase functions were fit based on head touch TFs from eachsubject and condition. The individual gains and phases shown in Fig. 4 were computed fromthese TFs.
For each marker and modality, the linear model fit the data significantly better than the constantmodel, indicating that postural responses changed with age (head touch: Wilks' Λ = 0.49,F10,30 = 3.08, p = 0.008; head vision: Λ = 0.47, F10,30 = 3.32, p = 0.005; CM touch: Λ = 0.41,F10,30 = 4.26, p = 0.001; CM vision: Λ = 0.52, F10,30 = 2.76, p = 0.015). Also, the quadraticand cubic models were not significantly better than the linear model (p>0.05). Therefore, weconclude that the model with linear gain and phase functions provides an adequate descriptionof age-dependent changes for our data set. Condition effects were highly significant for thismodel (head touch: Λ = 0.16, F16,64 = 6.06, p < 0.0001; head vision: Λ = 0.09, F16,64 = 9.17,p < 0.0001; CM touch: Λ = 0.08, F16,64 = 10.07, p < 0.0001; CM vision: Λ = 0.11, F16,64 =8.15, p < 0.0001).
Gain—Since gain and phase were modeled as linear functions of age, each fitted line in Fig.4 is completely specified by its endpoint values at the minimum age (4.2 years) and maximumage (10.8 years) of our subjects. For the five fitted gain lines, these endpoint values are plottedin Fig. 5A. Thus, Fig. 5A is simply a concise way of representing the five fitted gain lines ofFig. 4. Since they come from fitted gain lines, each gain value in Fig. 5A is based on the TFsof all subjects. Along with touch gain for the head, Fig. 5 also uses endpoint values to specifythe linear fitted gain curves for vision gain for the head, touch gain for the CM, and vision gainfor the CM. In what follows we will refer to Fig. 5 when testing certain hypotheses concerninggain. It is important to remember that each statement concerning Fig. 5 corresponds to anequivalent statement about the fitted gain lines. For example, testing whether fitted gain values
Bair et al. Page 7
Exp Brain Res. Author manuscript; available in PMC 2009 August 4.
NIH
-PA Author Manuscript
NIH
-PA Author Manuscript
NIH
-PA Author Manuscript
for two conditions are the same at the minimum age is equivalent to testing whether thecorresponding two fitted gain lines intersect at minimum age. Also, testing whether an age-by-condition interaction exists for two conditions is equivalent to testing whether the slopes ofthe two fitted gain curves are different.
Interpreting gain changes across conditions as reweightingIf subjects reweight sensory modalities across conditions, we expect touch gain (Fig. 5A,C) toincrease from left to right, since touch should be downweighted when the touch amplitudeincreases (intra-modal reweighting) and upweighted when the visual amplitude increases(inter-modal reweighting). Similarly, we expect vision gain (Fig. 5B,D) to decrease from leftto right. To check whether the condition dependence matched these expected patterns forreweighting, we made pairwise comparisons between conditions at the minimum andmaximum ages. For touch gain, we defined intra-modal reweighting as an increase in gain fromT8V2 to T2V2, inter-modal reweighting as an increase in gain from T2V2 to T2V8, and total(sum of intra- and inter-modal) reweighting as an increase in gain from T8V2 to T2V8. Forvision gain, we defined reweighting in the analogous way. Using these pairwise comparisons,we tested for each type of reweighting at both the minimum and maximum age. We also testedwhether the amount of reweighting changed across age by testing for age-by-conditioninteractions.
Touch gain (Fig. 5A, C) shows evidence of total and intra-modal reweighting. Totalreweighting is significant at both age endpoints for the head and the CM (p<0.05 for head andp<0.01 for CM at minimum; p<0.001 for head and p<0.0001 for CM at maximum). Intra-modalreweighting is significant only at the maximum age (p<0.0001 for head; p<0.001 for CM) witha significant age_by_condition interaction for head (p<0.05). There is no evidence of inter-modal reweighting for touch gain either for the head or the CM. Vision gain (Fig. 5B,D) showsevidence of total reweighting and both intra- and inter-modal reweighting. Total reweightingis significant at both age endpoints for the head and the CM (p<0.001 for head and p<0.05 forCM at minimum; p<0.0001 at maximum for both head and CM). Total reweighting for CMshows a significant age_by_condition interaction (p<0.01). This indicates that even thoughtotal reweighting is demonstrated at both the youngest and oldest age between the CM and theVdrive, the amount of total reweighting increases with age. Intra-modal reweighting issignificant at both age endpoints for the head and CM (all p<0.0001) with a marginallysignificant ageby-condition interaction for CM (p<0.1). As for the inter-modal reweighting, itis only significant at the maximum age (p<0.1 for head and p<0.01 for CM) with a significantage_by_condition interaction for CM (p<0.05). Because the age_by_condition interaction forinter-modal reweighting is not significant for head, multiple interpretations are provided (seeDiscussion).
Phase—Generally, changes in phase across conditions are in the opposite direction ofpredicted changes in gain (see reweighting interpretation of gain changes above). For allsignificant changes in touch phase, phase decreases from left to right (Fig. 6A,C). Analogously,for all significant changes in vision phase, phase increases from left to right (Fig. 6B,D).Specifically, at maximum age touch phase decreases from left to right (Fig. 6A.C), while touchgain increases (Fig. 5A.C) across total and intra-modal reweighting conditions (p<0.01 forhead, p<0.001 for CM). Touch phase does not depend significantly on condition at minimumage. The condition dependence of touch phase generally increases with age, supported by asignificant age-by-condition interactions (p<0.05 for intra-modal conditions for head and CMand total reweighting conditions for CM). The vision phase of head increases from left to rightacross total reweighting conditions (p<0.1) and inter-modal reweighting conditions (p<0.05)at minimum age (Fig. 6B). Vision phase for CM (Fig. 6D) shows a marginally significantincrease from left to right across total reweighting conditions at maximum age (p<0.1).
Bair et al. Page 8
Exp Brain Res. Author manuscript; available in PMC 2009 August 4.
NIH
-PA Author Manuscript
NIH
-PA Author Manuscript
NIH
-PA Author Manuscript

DiscussionWe implemented a multisensory paradigm with simultaneously oscillating visual scene andtouch bar to characterize the developmental profile of adaptive multisensory reweighting inchildren. We found that children even as young as 4 years old can reweight to multisensoryinputs. Specifically, intra-modal reweighting was exhibited by children as young as 4 years ofage; however, inter-modal reweighting was only observed in the older children. Inter-modalreweighting is interpreted as the adaptive fusion of two sensory modalities, because the posturalresponse to one modality depends on the amplitude of the other modality (Oie et al., 2002).For example, from condition T8V2 to T2V2, the vision gain in older children decreased eventhough the visual scene amplitude remained constant, indicating the adaptive fusion of touchand vision inputs. Thus, it is suggested that fusing sensory information from differentmodalities may be a key ingredient of flexible, adult-like control of upright stance. Moreover,we also found that the amount of reweighting increased with age indicating development of abetter adaptive ability.
Does inter-modal reweighting develop later in childhood?Our results show that children from 4 to 10 years old demonstrate reweighting to both sensoryinputs between conditions when stimulus amplitudes are most different (i.e. T8V2 to T2V8).We provide direct evidence confirming Forssberg and Nashner's (1982) suggestion on the roleof sensory reweighting for the development of postural control. Moreover, we show thatchildren as young as 4 years old can reweight to multisensory inputs, which is lower than theage of 7.5 years that Forssberg and Nashner reported. Furthermore, we found a developmentaldifference for different modes of reweighting. Specifically, there is evidence of intra-modalreweighting for children 4 to 10 years old. However, no touch inter-modal reweighting wasobserved. A previous study using the same protocol with young adults also did not showsignificant touch inter-modal reweighting (Oie et al., 2002). As for vision inter-modalreweighting, it was only observed in older children. We propose two possibilities for thedevelopment of vision inter-modal reweighting. One possibility is that the two reweightingmodes may not develop concurrently; inter-modal reweighting may develop only later inchildhood. It may be that younger children can reweight adaptively to sensory inputs, but theyadapt less optimally, emphasizing a developmental process. A second possibility is that thetwo reweighting modes (intra- & inter-) develop concurrently but inter-modal reweighting inyounger children is less detectable due to its smaller effect size.
Unlike gain, our reweighting hypothesis makes no specific predictions about phase. However,our results show a consistent pattern of condition dependence for both touch and vision phase.Specifically, phase decreases across conditions where gain is expected to increase. Thiscondition dependence of phase was not reported in adults using the same protocol (Oie et al.,2002). However, a similar pattern of phase increasing while gain decreases was reported withan oscillating-translational visual display movement in young adults (Ravaioli et al., 2005) andthe elderly (Jeka et al., 2006). The source of this phase dependency on condition, whichindicates a nonlinear process, is unknown (Ravaioli et al., 2005; Jeka et al., 2006).
Developmentally, the condition dependence of touch phase increases with age and is onlysignificant at the maximum age. Like gain, this may indicate that the condition dependence iseither absent or small at the minimum age. Metcalfe et al. (2005) showed that infants 1 monthbefore to 9 months after walking onset, when touching an oscillating surface with their hand,show increased temporal consistency between touch bar movement and postural sway. If thetouch phase is more variable for younger children in the present multisensory paradigm as itis more variable for younger infants in the touch bar movement paradigm, then the high phasevariability at a younger age may make the condition dependence less likely to be detected.
Bair et al. Page 9
Exp Brain Res. Author manuscript; available in PMC 2009 August 4.
NIH
-PA Author Manuscript
NIH
-PA Author Manuscript
NIH
-PA Author Manuscript

Multisensory reweighting increases with age in childrenChildren's multisensory ability for postural control has been conceptualized in different ways.For example, visual dominance has been proposed as the mechanism through which youngchildren resolve sensory conflict (Shumway-Cook and Woollacott, 1985; Woollacott et al.,1987). Comparing support surface perturbations with eyes open and closed, these authors foundpostural responses to be far more variable without vision. They concluded that vision isdominant in early childhood, with 4- to 6-years being a transitional age. Children then developmore adult-like dependence on multiple sources of sensory information after this transitionalperiod (Shumway-Cook and Woollacott, 1985; Woollacott et al., 1987).
The contrasting view emphasizes “sensory integration” rather than the dominance of anyparticular modality (Forssberg and Nashner, 1982). However, very few studies have quantified“sensory integration” in children. One such study used the Sensory Organization Test (SOT)to examine children's ability to integrate multiple sensory inputs for postural control (Foudriatet al., 1993). In the SOT, a subject stands on a surface that is either fixed or rotates to maintainthe body angle constant with respect to surface as the subject sways, a technique called sway-referencing that makes ankle proprioception unreliable. The visual surround can be sway-referenced as well. The most difficult SOT condition is when the support surface and visualscene are sway-referenced simultaneously, leaving primarily vestibular information for theestimation of body dynamics. Children as young as three years old are capable of keepingbalance when the support surface and visual surround are sway-referenced. Their performanceimproves with age and the development rate is context specific, i.e. development rate differsfor each condition in the SOT, with the visual and support surface sway referencing conditionimproving more slowly than other less-challenging conditions.
Even though Foudriat et al. (1993) provided important information on postural development,the SOT is not designed to quantify the sensory fusion process. It quantifies decrements inperformance when sensory information is attenuated. In this study, we show that childrenreweight to both touch bar and visual display movements even at the minimum age (4.2 yearsold), but such reweighting is primarily intra-modal. At the oldest age (10.8 years old), childrenalso reweight in an inter-modal manner. The development of inter-modal reweighting with ageis functionally important, suggesting that sensory information is now fused together andreflecting the reality that the stimulation rarely acts upon a single modality. As Lackner(1992, p: 308) states, “In virtually any terrestrial circumstance involving natural movements,changes in peripheral vestibular activity will be accompanied by changes in the activity ofsomatosensory, proprioceptive, visual and auditory receptors. Consequently, it is difficult toferret out a specifically vestibular contribution to orientation.” Thus, older children are able toadjust sensory weights in response to changes both within and across modalities, suggesting amore integrated and mature internal model capable of flexibly downweighting unreliablesensory input and upweighting reliable input.
We view the visual dominance hypothesis as a special case of the reweighting hypothesis. Theconcept of visual dominance stems from early “visual capture” perceptual studies (e.g., Hayet al., 1965, Rock and Harris, 1967). The current view, however, is that “visual dominance” iscaused by a number of factors, including the forced decision design generally imposed in suchstudies as well as parameters influencing the salience of the stimuli (e.g., ambient light level,noise level). For example, the noise level of the visual and haptic modalities has been foundto influence how multisensory information is integrated in a statistically optimal fashion (Ernstand Banks, 2002). When visual noise level is high, haptic information determines the percept.Visual dominance only occurs when the variance associated with visual modality is lower thanthe variance associated with the haptic estimate.
Bair et al. Page 10
Exp Brain Res. Author manuscript; available in PMC 2009 August 4.
NIH
-PA Author Manuscript
NIH
-PA Author Manuscript
NIH
-PA Author Manuscript

A similar phenomenon exists in our protocol in which subjects attempt to estimate their self-motion based on the motion of sensory inputs. Lower gain is associated with larger amplitudewhich provides less reliable information about self-motion. Taking vision as an example, visionis downweighted when visual movement amplitude increases across conditions (e.g. fromT2V2 to T2V8 condition), reflecting intra-modal reweighting. Vision is also downweighted inresponse to upweighted touch gain when touch bar movement decreases across conditions (e.g.,from T8V2 to T2V2), reflecting inter-modal reweighting. Reweighting depends on theamplitudes of both sensory inputs and vision does not always dominate.
Amplitude-dependent gain changes reflect sensory reweightingTo interpret amplitude-dependent gain changes, we consider postural control as consisting oftwo processes: state estimation and control (Carver et al., 2005; Kiemel et al., 2002; Kuo,1995, 2005; van der Kooij et al., 1999, 2001). In state estimation (sensory fusion), an internalmodel and noisy sensory measurements are used to continually estimate relevant state variables(Kiemel et al., 2002) and adjust the sensory weights adaptively (Carver et al., 2005; van derKooij et al., 2001). In the control process, the state estimates are used to specify appropriatemotor commands to stabilize upright posture. Thus, two alternative interpretations for theobserved amplitude-dependent gain changes exist. One is that they reflect changes in thecontrol parameters. The second interpretation attributes the gain changes to sensorymechanisms.
In adults, Oie et al. (2002) used time series models to measure changes in sway dynamics acrossthe same five sensory conditions used in this study. Finding little change in parametersassociated with control, they concluded that changes in gain were most consistent with changesin sensory weights. Sensory reweighting in postural control has been modeled using adaptivecontrol models by van der Kooij et al. (2001) and Carver et al. (2005). The latter model hasbeen extended (Jeka et al., 2005) and shown to qualitatively reproduce both the intra- and inter-modal amplitude-dependent gain changes observed in this study. An alternative explanationfor amplitude-dependent postural gain changes has been proposed by Mergner et al. (2003).They developed a model with thresholds in central sensory processing that reproduces observedgain changes when the amplitude of a force perturbation is varied. Further study is needed todetermine if such central thresholds can also explain our observed intra- and inter-modal gainchanges in response to sensory perturbations.
In children, we reason that new constraints posed by the gradually changing physical propertiesalong the developmental time line can be solved by a mechanism similar to optimal control.However, the physical properties of each individual subject do not change across amplitudeconditions in current study. Furthermore, the amplitude-dependent gain change occurs in atime scale much shorter than developmental time scale. It requires a more rapid adaptationmechanism, such as sensory reweighting, to account for the observed gain changes acrossamplitude conditions. In summary, we consider sensory reweighting (adaptive state estimation)rather than a change in control process a more plausible explanation for the observed amplitude-dependent gain change.
ConclusionIn summary, we conclude that adaptive multisensory reweighting exists in early childhood andit develops gradually. The increased reweighting with age supports a more adaptivereweighting mechanism in older children with the possibility that inter-modal reweightingdevelops later in childhood. Mature sensory reweighting uses information from all sensorymodalities simultaneously, reflecting the fact that a change in one sensory input leads tochanges in response to all sensory inputs. The challenge for the developing child is todistinguish changes that are externally generated from changes due to their own self-motion,
Bair et al. Page 11
Exp Brain Res. Author manuscript; available in PMC 2009 August 4.
NIH
-PA Author Manuscript
NIH
-PA Author Manuscript
NIH
-PA Author Manuscript

requiring a sophisticated internal model that can predict the sensory consequences of self-motion. The present results provide further evidence that the development of multisensoryreweighting is an important property of this internal model, leading to more stable and flexiblecontrol of upright stance which ultimately serves as the foundation for functional behaviorssuch as locomotion and reaching.
AcknowledgementsThis project is supported by NIH HD42527 to Dr. Jane E. Clark and a scholarship from the Taiwan Ministry ofEducation to Woei-Nan Bair
References1. Allison LK, Kiemel T, Jeka JJ. Multisensory reweighting of vision and touch is intact in healthy and
fall-prone older adults. Experimental Brain Research 2006;175:342–352.2. Barela JA, Jeka JJ, Clark JE. The use of somatosensory information during the acquisition of
independent upright stance. Infant Behavior and Development 1999;22:87–102.3. Barela JA, Jeka JJ, Clark JE. Postural control in children - Coupling to dynamic somatosensory
information. Experimental Brain Research 2003;150:434–442.4. Bendat, JS.; Piersol, AG. Random data: analyis and measurement procedures. Wiley; New York: 2000.5. Bertenthal BI, Bai DL. Infants' sensitivity to optical flow for controlling posture. Developmental
Psychology 1989;25:936–945.6. Bertenthal BI, Bai DL. Perception-action coupling in the development of visual control of posture.
Journal of Experimental Psychology: Human Perception and Performance 1997;23:1631–1643.[PubMed: 9425672]
7. Carver S, Kiemel T, van der Kooij H, Jeka JJ. Comparing internal models of the dynamics of the visualenvironment. Biological Cybernetics 2005;92:147–163. [PubMed: 15703940]
8. Ernst MO, Banks MS. Humans integrate visual and haptic information in a statistically optimal fashion.Nature 2002;415:429–433. [PubMed: 11807554]
9. Fisher, NI. Statistical analysis of circular data. Cambridge University Press; Cambridge England: 1995.10. Forssberg H, Nashner LM. Ontogenetic development of postural control in man: adaptation to altered
support and visual conditions during stance. Journal of Neuroscience 1982;2:545–552. [PubMed:7077364]
11. Foster EC, Sveistrup H, Woollacott MH. Transitions in Visual Proprioception: A Cross-SectionalDevelopmental Study of the Effect of Visual Flow on Postural Control. Journal of Motor Behavior1996;28:101–112. [PubMed: 12529212]
12. Foudriat BA, Di Fabio RP, Anderson JH. Sensory organization of balance responses in children 3-6years of age: a normative study with diagnostic implications. International Journal of PediatricOtorhinolaryngology 1993;27:255–71. [PubMed: 8270364]
13. Glad, T.; Ljung, L. Control theory: multivariable and nonlinear methods. Taylor & Francis; London:2000.
14. Hay JC, Pick HL, Ikeda K. Visual capture produced by prism spectacles. Psychonomic Science1965;2:215–216.
15. Henderson, SE.; Sugden, D. Movement Assessment Battery for Children. The PsychologicalCorporation; London: 1992.
16. Hochberg, Y.; Tamhane, AC. Multiple comparison procedures. Wiley; New York: 1987.17. Jeka J, Oie KS, Kiemel T. Multisensory information for human postural control: integrating touch
and vision. Experimental Brain Research 2000;134:107–125.18. Jeka, J.; Carver, S.; Allison, L.; Kiemel, T. Dynamics of sensory reweighting: Time scales, transient
and asymptotic dynamics. IV Conference on Motor control MCC2005 - From Basic Motor Controlto Functional Recovery; Sofia, Bulgaria. 2005.
19. Jeka J, Allison L, Saffer M, Zhang Y, Carver S, Kiemel T. Sensory reweighting with translationalvisual stimuli in young and elderly adults: the role of state-dependent noise. Experimental BrainResearch 2006;174:517–527.
Bair et al. Page 12
Exp Brain Res. Author manuscript; available in PMC 2009 August 4.
NIH
-PA Author Manuscript
NIH
-PA Author Manuscript
NIH
-PA Author Manuscript
20. Kiemel T, Oie KS, Jeka JJ. Multisensory fusion and the stochastic structure of postural sway.Biological Cybernetics 2002;87:262–277. [PubMed: 12386742]
21. Kim, S. Master Thesis. University of Maryland; College Park: 2004. The use of vision in children'spostural control.
22. Kuo AD. An optimal-control model for analyzing human postural balance. IEEE Transactions onBiomedical Engineering 1995;42:87–101. [PubMed: 7851935]
23. Kuo AD. An optimal state estimation model of sensory integration in human postural balance. Journalof Neural Engineering 2005;2:S235–S249. [PubMed: 16135887]
24. Lackner JR. Multimodal and motor influences on orientation: implications for adapting to weightlessand virtual environments. Journal of Vestibular Research 1992;2:307–322. [PubMed: 1342405]
25. Lee DN, Aronson E. Visual proprioceptive control of standing in human infants. Perception andPsychophysics 1974;15:529–532.
26. Mergner T, Maurer C, Peterka RJ. A multisensory posture control model of human upright stance.Prog.Brain Res 2003;142:189–201. [PubMed: 12693262]
27. Metcalfe JS, Clark JE. Somatosensory information affords the exploration of posture in newly walkinginfants and toddlers. Infant Behavior and Development 2000;23:391–405.
28. Metcalfe JS, Chen LC, Chang TY, McDowell K, Jeka JJ, Clark JE. The temporal organization ofposture changes during the first year of independent walking. Experimental Brain Research 2005a;161:405–416.
29. Metcalfe JS, McDowell K, Chang TY, Chen LC, Jeka JJ, Clark JE. Development of somatosensory-motor integration: an event-related analysis of infant posture in the first year of independent walking.Development Psychobiology 2005b;46:19–35.
30. Oie KS, Kiemel T, Jeka JJ. Multisensory fusion: simultaneous re-weighting of vision and touch forthe control of human posture. Cognitive Brain Research 2002;14:164–176. [PubMed: 12063140]
31. Peterka RJ, Benolken MS. Role of Somatosensory and Vestibular Cues in Attenuating VisuallyInduced Human Postural Sway. Experimental Brain Research 1995;105:101–110.
32. Peterka RJ. Sensorimotor integration in human postural control. Journal of Neurophysiology2002;88:1097–1118. [PubMed: 12205132]
33. Polit, DF. Data analysis & statistics for nursing research. Appleton & Lange; Stamford, Conn: 1996.34. Ravaioli E, Oie KS, Kiemel T, Chiari L, Jeka JJ. Nonlinear postural control in response to visual
translation. Experimental Brain Research 2005;160:450–459.35. Rock I, Harris CS. Vision and Touch. Scientific American 1967;216:96–104. [PubMed: 6042536]36. Schmuckler MA. Children's postural sway in response to low- and highfrequency visual information
for oscillation. Journal of Experimental Psychology: Human Perception and Performance1997;23:528–545. [PubMed: 9104008]
37. Seber, GAF. Multivariate observations. Wiley; New York: 1984.38. Seber, GAF.; Wild, CJ. Nonlinear regression. Wiley-Interscience; Hoboken, NJ: 2003.39. Shumway-Cook A, Woollacott MH. The growth of stability: Postural control from a developmental
perspective. Journal of Motor Behavior 1985;17:131–147. [PubMed: 15140688]40. van der Kooij H, Jacobs R, Koopman B, Grootenboer H. A multisensory integration model of human
stance control. Biological Cybernetics 1999;80:299–308. [PubMed: 10365423]41. van der Kooij H, Jacobs R, Koopman B, van der HF. An adaptive model of sensory integration in a
dynamic environment applied to human stance control. Biological Cybernetics 2001;84:103–115.[PubMed: 11205347]
42. Woollacott MH, Debû B, Mowatt M. Neuromuscular control of posture in the infant and child: Isvision dominant? Journal of Motor Behavior 1987;19:167–186. [PubMed: 14988057]
Bair et al. Page 13
Exp Brain Res. Author manuscript; available in PMC 2009 August 4.
NIH
-PA Author Manuscript
NIH
-PA Author Manuscript
NIH
-PA Author Manuscript

FIGURE 1.Experimental set-up in which a child is performing the multisensory posture task (roomillumination not dimmed for illustrative purposes; fewer dots are plotted for a clear view ofchild's posture).
Bair et al. Page 14
Exp Brain Res. Author manuscript; available in PMC 2009 August 4.
NIH
-PA Author Manuscript
NIH
-PA Author Manuscript
NIH
-PA Author Manuscript
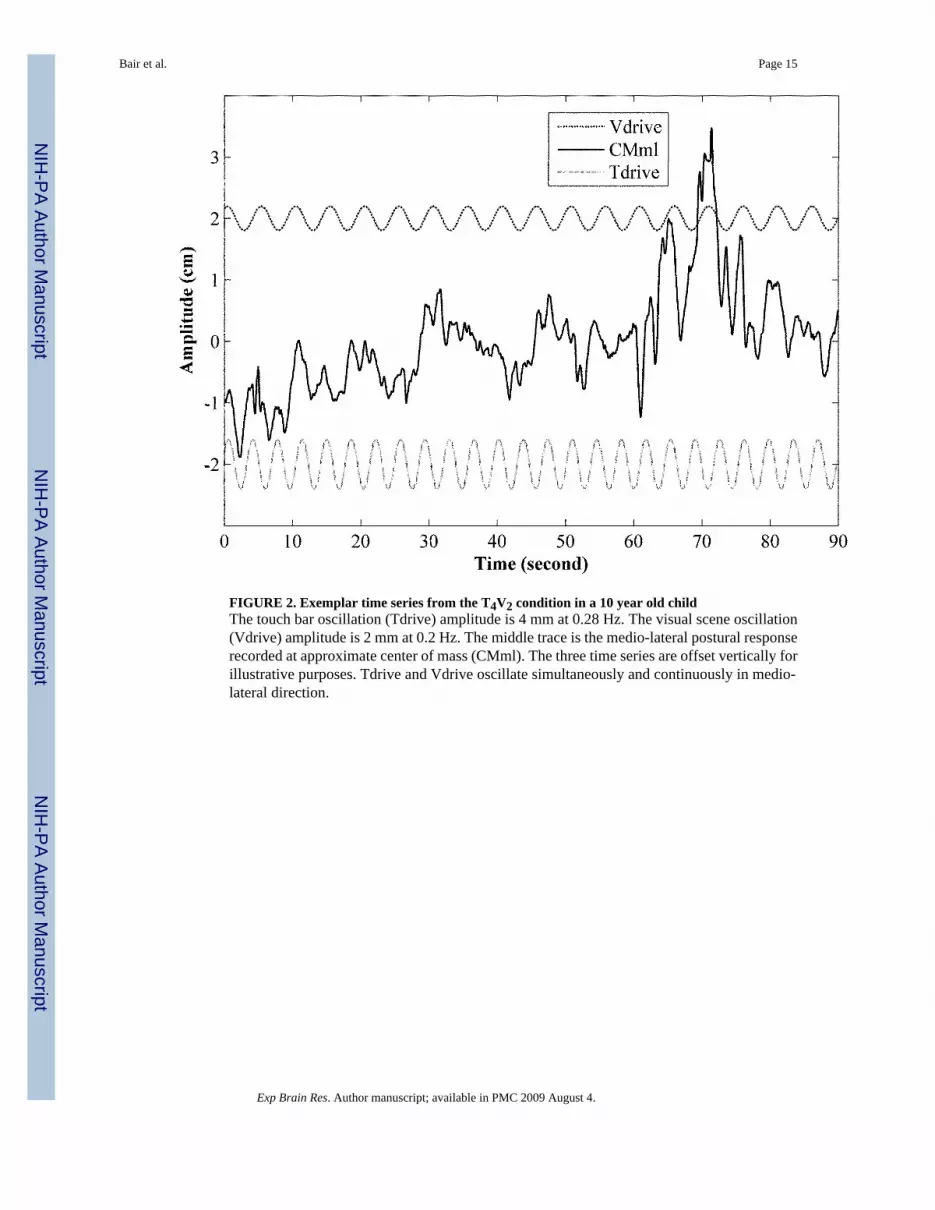
FIGURE 2. Exemplar time series from the T4V2 condition in a 10 year old childThe touch bar oscillation (Tdrive) amplitude is 4 mm at 0.28 Hz. The visual scene oscillation(Vdrive) amplitude is 2 mm at 0.2 Hz. The middle trace is the medio-lateral postural responserecorded at approximate center of mass (CMml). The three time series are offset vertically forillustrative purposes. Tdrive and Vdrive oscillate simultaneously and continuously in medio-lateral direction.
Bair et al. Page 15
Exp Brain Res. Author manuscript; available in PMC 2009 August 4.
NIH
-PA Author Manuscript
NIH
-PA Author Manuscript
NIH
-PA Author Manuscript

FIGURE 3. Transfer functions (TFs), gains, and phases from a 10-year-old subjectUpper graphs (A-C) show responses of the head to the touch and visual drives. Lower graphs(D-F) show responses of the approximate center of mass (CM) to the drives. In A and D, theaverage TFs across the three trials are shown in the complex plane. The length of the line fromeach TF to the origin (denoted as ×) represents the gain (plotted in B and E). Phase is the anglebetween this line and the positive real axis (plotted in C and F). Postural response is larger forthe head than for the CM. This shows in the TFs (greater distances from the origin in A thanD) and in gain (larger values in B than E). Both intra- and inter-modal reweighting patternsare observed for head (B) and CM (E).
Bair et al. Page 16
Exp Brain Res. Author manuscript; available in PMC 2009 August 4.
NIH
-PA Author Manuscript
NIH
-PA Author Manuscript
NIH
-PA Author Manuscript

FIGURE 4.Gains and phases from all individual subjects with fitted gain lines and fitted phase lines fromhead response to touch input. In upper row, each graph illustrates the gains from the 41individual subjects and fitted gain lines with associated standard error. Similar plots for phaseare illustrated in lower row. Graphs in each column are for the indicated condition. These fittedgain lines and fitted phase lines (total 10 lines) were simultaneously fitted using a multivariatestatistical model. Note that the phases in our data were not always tightly clustered.
Bair et al. Page 17
Exp Brain Res. Author manuscript; available in PMC 2009 August 4.
NIH
-PA Author Manuscript
NIH
-PA Author Manuscript
NIH
-PA Author Manuscript

FIGURE 5. Fitted gains at minimum and maximum agesFrom each graph in Fig. 4, the fitted gains with associated standard errors at age endpoints areextracted from the corresponding fitted lines. Fitted gains from 5 conditions are plotted in the(A) to summarize intra-, inter-modal and total reweighting of head touch gains. Similarly, fittedgains for other marker and modality are extracted and plotted in (B, C, D). To summarize, (A)is the fitted touch gain for head for minimum age (△) and maximum age (▲). (B) is the fittedvision gain for head for minimum age (ο) and maximum age (●). Similarly, fitted touch gainfor CM is plotted in (C), and fitted vision gain for CM in (D).★ indicates significant conditioneffect (★★★★★for p<0.0001, ★★★★for p<0.001, ★★★for p<0.01, ★★for p<0.05, and ★for marginal significance with p<0.1). The solid bracket symbol ( ) indicates which twoconditions are being compared. For example, the larger solid bracket is for the total reweightingbetween T8V2, and T2V8. The smaller bracket is for T8V2 & T2V2 condition pair, or T2V2 &T2V8 condition pair. Symbols associated with the brackets are to indicate fitted touch gain atminimal age (△), fitted touch gain at maximal age (▲), fitted vision gain at minimal age (ο)and fitted vision gain at maximal age (●). The age-by-condition interaction is indicated by abracket symbol with the text (By Age).
Bair et al. Page 18
Exp Brain Res. Author manuscript; available in PMC 2009 August 4.
NIH
-PA Author Manuscript
NIH
-PA Author Manuscript
NIH
-PA Author Manuscript

FIGURE 6. Fitted phases at minimum and maximum agesSimilar to Fig. 5, this figure shows the fitted phases at two age endpoints. Symbol notations,legends for statistical significance are the same as in Fig. 5.
Bair et al. Page 19
Exp Brain Res. Author manuscript; available in PMC 2009 August 4.
NIH
-PA Author Manuscript
NIH
-PA Author Manuscript
NIH
-PA Author Manuscript


