Embed Size (px)
Citation preview

Healthcare 2022, 10, 505. https://doi.org/10.3390/healthcare10030505 www.mdpi.com/journal/healthcare
Article
Development of the Japanese Version of the Infertility Stigma
Scale: Examination of Its Reliability and Validity
Rie Yokota 1,*, Hiroko Okada 2, Tsuyoshi Okuhara 2, Eiko Goto 2, Emi Furukawa 1, Ritsuko Shirabe 1,
Keiko Sakakibara 3 and Takahiro Kiuchi 2
1 Department of Health Communication, Graduate School of Medicine, The University of Tokyo,
Tokyo 113‐8655, Japan; efurukawa‐[email protected] (E.F.); rshirabe‐[email protected] (R.S.) 2 Department of Health Communication, School of Public Health, The University of Tokyo,
Tokyo 113‐8655, Japan; okadahiroko‐[email protected] (H.O.); okuhara‐[email protected] (T.O.);
gotoue‐[email protected] (E.G.); tak‐[email protected] (T.K.) 3 Department of Social Psychology, Faculty of Sociology, Toyo University, Tokyo 112‐8606, Japan;
* Correspondence: yokotarie‐[email protected]; Tel.: +81‐3‐5800‐6549
Abstract: The stigma of infertility negatively affects health, resulting in mental distress and poor
quality of life. An appropriate scale is essential to examine the stigma experienced by infertile
women and provide adequate interventions. Therefore, we developed a Japanese version of the In‐
fertility Stigma Scale (ISS). After examining the content validity of this scale, we conducted an online
survey of women undergoing fertility treatment to test the scale’s structural validity, internal con‐
sistency, intra‐rater reliability, known‐groups validity, convergent validity, and discriminant valid‐
ity. A total of 254 participants were included in the analysis. The results of confirmatory factor anal‐
ysis of four factors based on the original scale revealed the optimal fit. Cronbach’s alpha was 0.95
for the total score. Concerning test–retest analysis, the total score of the ISS and subscale had a high
Spearman correlation coefficient (ρ = 0.61–0.88, p < 0.001). For convergent validity, the association
between the ISS and social support, self‐esteem, and family functioning was significantly negatively
correlated. The results of the multitrait scaling analysis scale showed that correlations of all items
exceeded 0.40, and scaling errors (7/81, 8.6%) were few. The Japanese version of the ISS was con‐
firmed to have acceptable reliability and validity.
Keywords: infertility; stigma; women; infertility stigma scale; reliability; validity; health
communication
1. Introduction
Infertility is defined as the failure to conceive after 12 months despite unprotected
sexual intercourse [1]. In Japan, 18.2% of couples have undergone (or are currently under‐
going) infertility testing or treatment: 1 in 5.5 of all couples [2]. In 2017, 56,617 babies were
born in Japan through assisted reproductive technology, such as in vitro fertilization and
intra‐cytoplasmic sperm injection [3]. This is about 6.0% of the 946,065 total births in Japan
[4]. In 2017, about 450,000 treatments were given, placing Japan among the top countries
globally for administration of fertility treatments [5]. More than half (55%) of women un‐
dergoing advanced fertility treatment experience more than mild depression [5].
Despite the advances in fertility treatment, studies in other countries have indicated
that the stigma of infertility has negative health consequences, including high psycholog‐
ical distress, poor quality of life, and social isolation [6–12]. Stigma refers to the process of
labeling a group of individuals as having socially undesirable attributes, and these indi‐
viduals are devalued by ’a whole and usual person‘ because of attributes and behaviors
Citation: Yokota, R.; Okada, H.;
Okuhara, T.; Goto, E.; Furukawa, E.;
Shirabe, R.; Sakakibara, K.; Kiuchi, T.
Development of the Japanese
Version of the Infertility Stigma
Scale: Examination of Its Reliability
and Validity. Healthcare 2022, 10, 505.
https://doi.org/10.3390/
healthcare10030505
Academic Editor: Charalampos
Siristatidis
Received: 10 February 2022
Accepted: 7 March 2022
Published: 9 March 2022
Publisher’s Note: MDPI stays neu‐
tral with regard to jurisdictional
claims in published maps and institu‐
tional affiliations.
Copyright: © 2022 by the authors. Li‐
censee MDPI, Basel, Switzerland.
This article is an open access article
distributed under the terms and con‐
ditions of the Creative Commons At‐
tribution (CC BY) license (https://cre‐
ativecommons.org/licenses/by/4.0/).

Healthcare 2022, 10, 505 2 of 21
that are considered socially ’deeply discrediting‘ [13]. That is, stigma is when society neg‐
atively labels people who deviate from socially shared beliefs (i.e., a person should behave
in a certain way at a certain time), so‐called social norms and social expectations [14].
People in Japan who want a child but cannot conceive one may be viewed as ‘deviant’
and in a social minority [15,16]. There is a stigma against infertility in society, with dis‐
course and images suggesting that ‘once married, a couple should have children’ and ‘a
couple becomes a full‐fledged couple when they have a child’. In many cases, women
have internalized these values [17]. In fact, in a 2018 survey, 24.7% of women who had
been married responded that couples are socially accepted only after having a child [18].
In a 2015 survey, 75.4% of never‐married men and 67.4% of never‐married women re‐
sponded that they should have a child after marriage [2]. Thus, in Japan, there is a deep‐
rooted belief that the purpose of marriage is to bear a child, and a woman’s role is to
produce children. Being infertile, therefore, presents many challenges for women in Japan
[19], and many women who are infertile have internalized these traditional social norms
[17]. Thus, the stigma regarding infertility needs to be examined in Japan.
Several studies have already examined the stigma of infertility by adapting com‐
monly used tools such as the Adapted Stigma Consciousness Questionnaire, the Stigma
of Fertility Problems Scale, and the Perceived Stigma Scale [6,10,20,21]. In addition, a fe‐
male infertility stigma instrument is currently under development [22]. However, none of
these scales have been examined for reliability and validity, and no Japanese tool exists to
measure the stigma of infertility. The Infertility Stigma Scale was developed in China in
2015, and its reliability and validity were examined in China and Turkey [23,24]. This
study examines the reliability and validity of the Japanese version of the Infertility Stigma
Scale. This is because it is necessary to use reliable, valid, and effective measures of con‐
cepts in each culture and language in order to provide quality patient care [25]. In partic‐
ular, since this study is focused on stigma, its reliability and validity may vary due to
cultural bias. In other words, social norms and social expectations may vary from country
to country. Therefore, it is necessary to examine the reliability and validity of the Japanese
version of the Infertility Stigma Scale.
2. Materials and Methods
2.1. Scale Development
2.1.1. The Infertility Stigma Scale
In this study, the Japanese version of the Infertility Stigma Scale (ISS) was targeted
for development. The ISS was developed by Fu et al. in 2015 to assess the inner world of
women living with infertility [23]: personal perception of stigma (perceived stigma) and
feelings of loss of self‐esteem, shame, and guilt (self‐stigma). This scale consists of 27 items
and four subscales: self‐devaluation (7 items), social withdrawal (5 items), public stigma
(9 items), and family stigma (6 items). Each item is rated on a 5‐point Likert scale from
totally disagree (1 point) to totally agree (5 points). The total score obtained from the scale
ranges from 27 to 135. The Cronbach’s alpha coefficients of the original Chinese scale and
the Turkish version [24] are 0.94 and 0.93, respectively. The Cronbach’s alpha coefficients
of each subscale of the original scale were 0.86 for self‐devaluation, 0.77 for social with‐
drawal, 0.92 for public stigma, and 0.84 for family stigma.
2.1.2. Translation Process
After obtaining permission from the original authors of the ISS to translate and vali‐
date the instrument into Japanese, the Japanese version of the scale was generated follow‐
ing guidelines [26,27]. The translation process was conducted using a team approach with
the aim of mitigating the subjective nature of translation and text‐based translation eval‐
uation. [28,29] The English version of this scale was translated into Japanese by one re‐
searcher who had no medical or clinical background and two researchers in the healthcare
field. There was no significant difference between the three translations. After the forward

Healthcare 2022, 10, 505 3 of 21
translation, the reconciliation meeting was held with the three translators and one obste‐
trician/gynecologist (reviewer). Three translators plus a reviewer discussed their transla‐
tions and wording, and also created translations that were more suitable for Japanese cul‐
ture. Afterward, two experts in linguistics who did not have a medical background trans‐
lated the scale back to English. After the back translation, the expert committee consisting
of three doctors, two nurses, and three researchers was held. At the expert committee,
three forward translations, a translation created after the reconciliation meeting, and two
back translations, were discussed in terms of semantic, idiomatic, experimental, and con‐
ceptual equivalence. In particular, for items that cannot be assumed to relate to infertility,
we referred to the Chinese version and added the phrase ‘because of infertility’. After
these modifications were made, the members of the expert committee were asked to rate
the Japanese translation of instructions, each item, response options, and each subheading
on a 5‐point scale from completely disagree to completely agree; 87.5–100% of the mem‐
bers agreed or completely agreed with each translation. Thus, the consensus was formed.
2.1.3. Content Validity through Expert Panel
After the expert committee of the translation, the assessment of content validity was
performed by the expert panel following guidelines and previous research [30–35]. An
expert panel consisting of three doctors, two nurses, and three researchers provided opin‐
ions about the scale.
The word ‘stigma’ was used in some of the subscales, but might be difficult for the
Japanese public to understand. The following sentence was thus added to the instructions:
‘The term ‘stigma’ appears in the questionnaire. This refers to the negative perception of
an individual as being socially different from others.’ In addition, because reproductive
medicine is available to common‐law partners in Japan, the following sentence was
added: ‘In addition, some of the items use the term “husband”. If you are in a common‐
law marriage, please read this as “partner” when you answer the questions.’ Item 5 is
about family stigma: ’My family, especially my mother‐in‐law, are always trying to make
trouble for me.’ China has a high rate of coresidence with parents‐in‐law, but due to the
low coresidence rate in Japan, the phrase ’especially my mother‐in‐law‘ was deleted.
After the expert panel discussion, panel members were asked to rate the essentiality,
relevance, and clarity of each item. They also rated the comprehensiveness of each dimen‐
sion and the entire instrument. Then, the content validity ratio (CVR), item‐level‐content
validity index (I‐CVI) for relevance, I‐CVI for clarity, and modified kappa were calculated
as a content validity indicator for each item to assess experts’ agreement on the need for
the item. We also calculated the scale‐level content validity index/average (S‐CVI/Ave),
scale‐level content validity index/universal agreement (S‐CVI/UA), and proportion of
comprehensiveness as a content validity indicator for each dimension and the entire scale.
The results of CVR, I‐CVI, S‐CVI/UA, S‐CVI/Ave, and modified kappa are shown in Ta‐
bles A1 and A2. The CVR of each item exceeded 0.75, indicating that all items should
remain [36]. I‐CVI for relevance and clarity of each item was higher than 0.88, indicating
that all items are relevant and clear [33]. Modified kappa of each item exceeded 0.87, in‐
dicating that interpretation criteria were excellent [30]. S‐CVI/Ave and S‐CVI/UA for rel‐
evance were 0.99 and 0.93, respectively. S‐CVI/Ave and S‐CVI/UA for clarity were 1.00
and 0.96, respectively. The proportions for agreement of comprehensiveness for each di‐
mension and for the entire instrument were 87.5% and 100.0%, respectively. No items
needed to be removed based on Polit’s approach [33].
After the evaluation by the expert panel, the Japanese version of the ISS was revised,
back‐translated, and confirmed as acceptable by the author of the original scale. We veri‐
fied that the newly adapted scale did not differ significantly from the original authors’
intentions.

Healthcare 2022, 10, 505 4 of 21
2.1.4. Content Validity through Cognitive Interviews
As a pilot application and following empirical literature, the scale was administered
to eight married women with no children [37,38]. Before the interviews, an interview
guide was developed by referring to previous studies [32,39–43] (Table A3). The inter‐
views were conducted online to prevent COVID‐19 infection. The interviews were not
conducted in groups but individually to manage the sensitive subject of stigma. The mean
age of the participants was 37.4 years (SD 7.3 years). The educational background of the
participants was 25.0% (2/8) with a two‐year college degree and 75.0% (6/8) with a univer‐
sity degree or higher. In terms of employment status, four were full‐time (50.0%), three
were part‐time (37.5%), and one was not working (12.5%). Because of the lack of epidemi‐
ological studies of infertile patients, the overall trend in Japan is not known [5], but when
compared with the sociodemographic profile of the participants in the previous study [5],
the mean age and the proportions of employment status were very similar, but the partic‐
ipants in this study had a higher educational background. All participants were inter‐
viewed after responding to the questionnaire. The mean interview time was about 30 min,
and it took participants approximately 2 min 10 s to complete the ISS. All participants
indicated that they felt no psychological stress when completing this scale. In the inter‐
view, participants were asked about general impressions of the scale, comprehensibility,
relevance to infertile women’s experience, comprehensiveness of the scale, and appropri‐
ateness of response options. The percentage of agreement for comprehensibility and rele‐
vance is shown in Table A4. Regarding comprehensiveness, some participants found it
difficult to understand the subheadings of ‘social withdrawal’ and ‘public stigma’. They
were confused about the differences between social and public. We, therefore, changed
the terms to ‘withdrawal in interpersonal relationships’ and ‘stigma in relation to people
around them’ to reflect the intentions of the original author’s work. Apart from these
changes, there were no major modifications, although some wording was altered. After
interviews, the final draft was validated by the members of the expert panel.
2.2. Scale Validation
2.2.1. Participants and Recruitment Procedure
To examine the validity and reliability of this scale, a web‐based survey of women
undergoing infertility treatment in Japan was conducted as a cross‐sectional study in De‐
cember 2021. We recruited women undergoing fertility treatment who were registered as
monitors with a Japanese research company, and sent the survey questionnaire by e‐mail
through the research company.
The inclusion criteria were (1) women between 20 and 59 years old, (2) undergoing
infertility treatment, (3) childless, (4) native Japanese speaking and living in Japan, (5)
married (including common‐law marriage), and (6) gave consent to participate in this
study. Exclusion criteria were (1) women undergoing fertility testing, (2) having a back‐
ground or experience in healthcare, and (3) diagnosed with mental illness.
When adapting a scale for different cultures, the sample size needs to be between five
and ten times as large as the number of items in the scale [24,32]. Thus, the sample size
was determined to be 254 women meeting the study criteria.
2.2.2. Data Collection
Participants who consented to be enrolled in the study completed the questionnaire
on the internet. To examine the Japanese version of the ISS, data were collected regarding
three main variables: basic demographic information, infertility characteristics, and three
validated measurements.
Basic demographic information included: age, duration of marriage, education, an‐
nual household income, occupation, and whether the couple lives alone or with their par‐
ents. Infertility characteristics included: duration of infertility, duration of infertility treat‐
ment, causes of infertility, and treatment for infertility.

Healthcare 2022, 10, 505 5 of 21
The following three measures were used to examine convergent validity: the Multi‐
dimensional Scale of Perceived Social Support, the Rosenberg Self‐esteem Scale, and the
Family APGAR (as explained in greater detail in Section examination of the known‐
groups, convergent, and discriminant validity).
The Multidimensional Scale of Perceived Social Support was developed by Zimet
(1988). This scale was designed to measure perceptions of social support adequacy from
three sources: family, significant other, and friends [44,45]. This scale consists of 12 items,
with each item graded on a 7‐point rating scale from very strongly disagree (1 point) to
very strongly agree (7 point). The mean of total and subscale scores ranged from 1 to 7,
with higher scores indicating a higher perception of social support. The Japanese version
of this scale for middle‐aged and older people was developed by Iwasa et al. in 2007 [46].
Cronbach’s alpha coefficients of the Japanese version were calculated as 0.91 for the total
score, 0.94 for family support, 0.88 for significant other, and 0.90 for friend support. The
Cronbach’s alpha coefficient of the scale in this study was 0.93 for total score, 0.90 for
family support, 0.88 for significant other, and 0.93 for friend support.
The Rosenberg Self‐esteem Scale was developed by Rosenberg in 1965. It assesses
global positive and negative attitudes towards the self [47]. This scale consists of 10 items,
with each item of the scale graded on a 4‐point Likert scale ranging from strongly disagree
to strongly agree. The total scores range from 10 to 40, with higher scores indicating a
higher level of self‐esteem. The Japanese version of this scale was developed by Mimura
and Griffiths in 2007 and validated by Uchida and Ueno in 2010 [48,49]. Cronbach’s alpha
coefficients of the Japanese version were calculated as 0.81, and the Cronbach’s alpha for
the scale developed in this present study was 0.90.
The Family APGAR was developed by Smilkstein in 1978 to assess subjective satis‐
faction with family functions [50,51]. This scale consists of five items covering family ad‐
aptation, partnership, growth, affection, and resolve. Each item of the scale is graded on
a 3‐point Likert scale ranging from hardly ever (0 point) to almost always (2 point). The
total score ranges from 0 to 10, with higher scores indicating higher satisfaction with fam‐
ily functioning. The Japanese version of this scale was developed by Kokubu and Ka‐
mibeppu [52]. The Cronbach’s alpha coefficient of the Japanese version was 0.93 for
adults, and the alpha value of the scale in this study was 0.89.
2.2.3. Data Analysis
Data analysis was performed using R version 4.1.1. A p‐value of < 0.05 was consid‐
ered statistically significant. For the basic sociodemographic data and infertility charac‐
teristics data, the mean or percentage and standard deviation (SD) were calculated as the
descriptive statistics.
Item Exclusion Criteria
Items were consideration for deletion based on examination of the ceiling/floor effect.
Item‐total and item‐remainder correlations less than 0.4 or more than 0.85 were consid‐
ered for deletion. An exploratory factor analysis was also conducted in which items were
excluded if they had a factor loading of less than 0.4.
Examination of the Structural Validity
To assess the structural validity of the scale, exploratory factor analysis was con‐
ducted using the generalized least squares and varimax rotation after confirming factor
numbers by a scree plot. In addition, based on confirmatory factor analysis, the factor
structure of the ISS was examined in a theory‐driven framework. Based on the original
version of the ISS, a four‐factor model was examined. Diagonal weighted least squares
(DWLS) was used following Toyoda’s [53] recommendation. According to Toyoda, the
results of Mardia’s kurtosis test for multivariate normality indicate that when a z value
exceeds 3, the results may be inaccurate if the maximum likelihood estimation method is

Healthcare 2022, 10, 505 6 of 21
applied [53]. Thus, DWLS was chosen because the z value in this study exceeded 3 (z =
17.54) and included variables that were skewed distributions of continuous variables [53].
To evaluate the fit of the model, the chi‐square statistic, chi‐square statistic/degree of free‐
dom (χ2/df), goodness of fit index (GFI), comparative fit index (CFI), Tucker–Lewis index
(TLI), adjusted goodness of fit index (AGFI), normed fit index (NFI), root mean square
error of approximation (RMSEA), and standardized root mean square residual (SRMR)
were used [54]. A χ2/df value of 3 or lower is appropriate [55]. GFI, CFI, TLI, AGFI, and
NFI of 0.95 or higher, and RMSEA and SRMR of 0.05 or lower refer to a good fit [24,56].
Examination of Reliability
Cronbach’s alpha coefficients, item‐total and item‐remainder score correlations were
used to assess internal consistency. Cronbach’s alpha is suitable when it is ≥0.70 [57]. To
assess the intra‐rater reliability, retests were conducted three days after the initial survey.
Following Cosmin’s criteria [32], retests were administered to 56 participants. After the
survey, the test–retest reliability was estimated using the Spearman correlation coefficient,
following the Turkish version [24].
Examination of the Known‐Groups, Convergent, and Discriminant Validity
To assess known‐groups validity, an independent Mann–Whitney U test was per‐
formed on duration of infertility. The scores were assumed to be higher when the duration
of infertility was more than three years [8]. To examine convergent validity, Spearman’s
correlation coefficient was calculated using the Multidimensional Scale of Perceived So‐
cial Support, the Rosenberg Self‐esteem Scale, and the Family APGAR [46,48,52]. Previous
studies have shown that social support, self‐esteem, and family functioning are intimately
related to stigma and similar scales were used in the original study [10,23,58,59]. A multi‐
trait scaling analysis was performed to examine convergent and discriminant validity
[60,61]. The convergent validity item was determined as a correlation ≥0.40 with the item
and its own scale (adjusted for overlap). The discriminant validity item was sustained if
the correlation of the item with its hypothesized scale (adjusted for overlap) was signifi‐
cantly higher than the correlation with any other scale. Convergent and discriminant va‐
lidity were examined for each scale using the Spearman correlation coefficient. A scaling
error was defined as when the item had a significantly lower correlation with its own scale
(adjusted for overlap) than with another scale.
2.2.4. Ethical Considerations
This study was conducted with the approval of the Ethics Committee of the Univer‐
sity of Tokyo (approval number: 2021128NI), and informed consent was obtained from all
participants.
3. Results
The participant characteristics are shown in Table 1. The mean (SD) age of partici‐
pants was 35.9 (5.6) years. The mean (SD) of duration of infertility was 3.3 (2.9) years and
the average (SD) duration of infertility treatment was 2.3 (2.4) years. More than two‐thirds
(69.6%) had a college degree or above, and 47.2% of the participants had undergone in
vitro fertilization or microinsemination.

Healthcare 2022, 10, 505 7 of 21
Table 1. Participant characteristics (N = 254).
Mean SD a
Age (years) 35.93 5.55
Duration of marriage (years) 4.67 3.78
Duration of infertility (years) 3.32 2.88
Duration of infertility treatment (years) 2.27 2.44 n %
Education
Less than high school 1 0.4
High school graduate 43 16.9
Vocational school graduate 33 13.0
Junior colleges or technical colleges 44 17.3
University graduate 125 49.2
Graduate school graduate 8 3.1
Annual household income
Less than JPY 2,000,000 12 4.7
JPY 2,000,000 to JPY 4,000,000 38 15.0
JPY 4,000,000 to JPY 6,000,000 72 28.3
JPY 6,000,000 to JPY 8,000,000 59 23.2
JPY 8,000,000 to JPY 10,000,000 33 13.0
More than JPY 10,000,000 40 15.7
Occupation
Office worker (regular employee) 87 34.3
Office worker (contract employee) 11 4.3
Public officer 10 3.9
Self‐employed 13 5.1
Part‐time worker 53 20.9
Housemaker 79 31.1
Unemployed 1 0.4
Living with parents
Yes 15 5.9
No 239 94.1
Causes of infertility
Male factor 15 5.9
Female factor 84 33.1
Both male and female factors 38 15.0
Unexplained factor 117 46.1
Treatment for infertility
Timing therapy 74 29.1
Artificial insemination (AIH) 56 22.0
In vitro fertilization (IVF) 64 25.2
Microinsemination (ICSI) 56 22.0
Other 4 1.6 a SD, standard deviation.
3.1. Item Score Distribution
The mean values and standard deviations of each item were calculated. The ceiling
effect of one item and the floor effect of four items were observed. The mean (SD) of the
total score of the ISS in this study was 73.6 (20.9).
Healthcare 2022, 10, 505 8 of 21
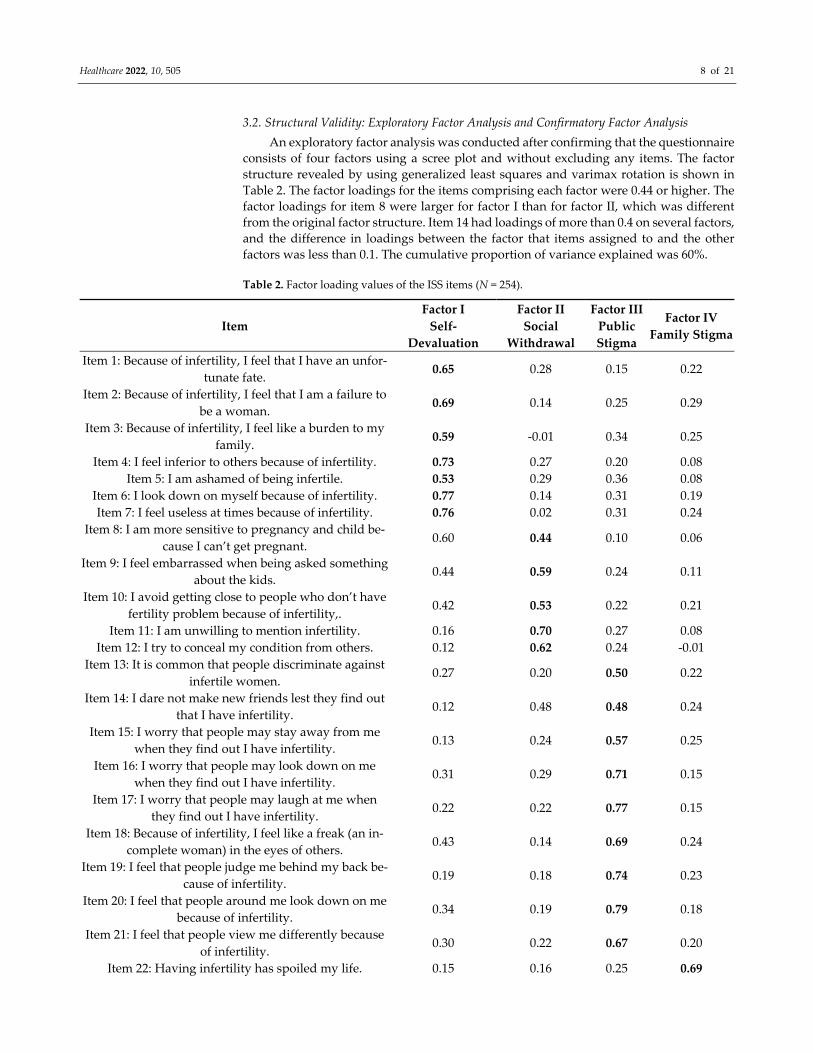
3.2. Structural Validity: Exploratory Factor Analysis and Confirmatory Factor Analysis
An exploratory factor analysis was conducted after confirming that the questionnaire
consists of four factors using a scree plot and without excluding any items. The factor
structure revealed by using generalized least squares and varimax rotation is shown in
Table 2. The factor loadings for the items comprising each factor were 0.44 or higher. The
factor loadings for item 8 were larger for factor I than for factor II, which was different
from the original factor structure. Item 14 had loadings of more than 0.4 on several factors,
and the difference in loadings between the factor that items assigned to and the other
factors was less than 0.1. The cumulative proportion of variance explained was 60%.
Table 2. Factor loading values of the ISS items (N = 254).
Item
Factor I
Self‐
Devaluation
Factor II
Social
Withdrawal
Factor III
Public
Stigma
Factor IV
Family Stigma
Item 1: Because of infertility, I feel that I have an unfor‐
tunate fate. 0.65 0.28 0.15 0.22
Item 2: Because of infertility, I feel that I am a failure to
be a woman. 0.69 0.14 0.25 0.29
Item 3: Because of infertility, I feel like a burden to my
family. 0.59 ‐0.01 0.34 0.25
Item 4: I feel inferior to others because of infertility. 0.73 0.27 0.20 0.08
Item 5: I am ashamed of being infertile. 0.53 0.29 0.36 0.08
Item 6: I look down on myself because of infertility. 0.77 0.14 0.31 0.19
Item 7: I feel useless at times because of infertility. 0.76 0.02 0.31 0.24
Item 8: I am more sensitive to pregnancy and child be‐
cause I can’t get pregnant. 0.60 0.44 0.10 0.06
Item 9: I feel embarrassed when being asked something
about the kids. 0.44 0.59 0.24 0.11
Item 10: I avoid getting close to people who don’t have
fertility problem because of infertility,. 0.42 0.53 0.22 0.21
Item 11: I am unwilling to mention infertility. 0.16 0.70 0.27 0.08
Item 12: I try to conceal my condition from others. 0.12 0.62 0.24 ‐0.01
Item 13: It is common that people discriminate against
infertile women. 0.27 0.20 0.50 0.22
Item 14: I dare not make new friends lest they find out
that I have infertility. 0.12 0.48 0.48 0.24
Item 15: I worry that people may stay away from me
when they find out I have infertility. 0.13 0.24 0.57 0.25
Item 16: I worry that people may look down on me
when they find out I have infertility. 0.31 0.29 0.71 0.15
Item 17: I worry that people may laugh at me when
they find out I have infertility. 0.22 0.22 0.77 0.15
Item 18: Because of infertility, I feel like a freak (an in‐
complete woman) in the eyes of others. 0.43 0.14 0.69 0.24
Item 19: I feel that people judge me behind my back be‐
cause of infertility. 0.19 0.18 0.74 0.23
Item 20: I feel that people around me look down on me
because of infertility. 0.34 0.19 0.79 0.18
Item 21: I feel that people view me differently because
of infertility. 0.30 0.22 0.67 0.20
Item 22: Having infertility has spoiled my life. 0.15 0.16 0.25 0.69

Healthcare 2022, 10, 505 9 of 21
Item 23: I worry that the relationship with my husband
would be worse. 0.24 0.02 0.02 0.80
Item 24: I am afraid my husband would divorce with
me. 0.15 0.00 0.10 0.77
Item 25: I feel that my family does not take care for me
as much as before because of infertility. 0.01 0.14 0.31 0.65
Item 26: Because of infertility, my family was always
trying to make trouble for me. 0.14 0.16 0.31 0.63
Item 27: I am afraid my remarriage would be affected,
once people know my situation. 0.25 0.01 0.17 0.55
Proportion of variance explained 0.18 0.10 0.19 0.13
Cumulative proportion of variance explained 0.60
KMO value 0.93
Bartlett’s test chi‐squared 4712.64, p < 0.001
The results of confirmatory factor analysis using DWLS, categorized into 27 items
with four factors, showed the optimal fit. The model fit indices were as follows: χ2 = 312.26,
df = 318, χ2/df = 0.98, p = 0.58, CFI = 1.00, GFI = 0.98, TLI = 1.00, AGFI = 0.98, NFI = 0.98,
RMSEA < 0.001 (90%CL, 0.00–0.02), SRMR = 0.06. The standardized factor loadings are
shown in Figure 1.

Healthcare 2022, 10, 505 10 of 21
Figure 1. Standardized factor loadings for the ISS.
3.3. Internal Consistency and Intra‐Rater Reliability
The Cronbach’s alpha of the ISS and subscales was 0.95 for the total scale, 0.91 for
self‐devaluation, 0.83 for social withdrawal, 0.93 for public stigma, and 0.86 for family
stigma (Table 3). The Cronbach’s alpha for each scale was 0.77–0.93 when each item was
excluded (Table 4), lower than the values for each scale when any item was not excluded.
The item‐total correlations were 0.45–0.80 and item‐remainder correlation 0.40–0.78 (Table
4). No items with weak or strong correlations were identified.
Table 3. Cronbach’s α of the ISS (N = 254).
Item Number Mean SD Cronbach’s α
Total (ISS) 27 73.62 20.87 0.95
Self‐devaluation 7 22.79 6.82 0.91
Social withdrawal 5 16.74 4.77 0.83
Public stigma 9 21.89 8.50 0.93
Family stigma 6 12.20 5.21 0.86

Healthcare 2022, 10, 505 11 of 21
Table 4. Internal consistency of the ISS (N = 254).
Item
Number Mean SD
Item‐Total
Correlation a
Item‐Remainder
Correlation a
α
if Item
Deleted
Self‐devaluation
Item 1 3.26 1.14 0.65 0.62 0.90
Item 2 3.10 1.23 0.71 0.68 0.89
Item 3 3.13 1.25 0.64 0.61 0.90
Item 4 3.84 1.14 0.66 0.63 0.90
Item 5 2.92 1.19 0.66 0.62 0.90
Item 6 3.35 1.20 0.73 0.70 0.89
Item 7 3.18 1.28 0.72 0.68 0.89
Social withdrawal
Item 8 3.94 1.10 0.58 0.54 0.81
Item 9 3.74 1.18 0.68 0.64 0.77
Item 10 2.87 1.34 0.68 0.64 0.80
Item 11 3.05 1.26 0.56 0.51 0.78
Item 12 3.14 1.28 0.45 0.40 0.82
Public stigma
Item 13 2.87 1.17 0.63 0.60 0.93
Item 14 2.21 1.10 0.65 0.62 0.93
Item 15 2.07 1.07 0.65 0.61 0.93
Item 16 2.60 1.18 0.77 0.74 0.92
Item 17 2.19 1.09 0.74 0.71 0.92
Item 18 2.67 1.29 0.80 0.78 0.92
Item 19 2.15 1.14 0.73 0.70 0.92
Item 20 2.49 1.25 0.80 0.78 0.92
Item 21 2.65 1.28 0.74 0.71 0.92
Family stigma
Item22 2.06 1.09 0.58 0.55 0.84
Item 23 2.37 1.33 0.50 0.46 0.83
Item 24 1.80 1.03 0.48 0.45 0.83
Item 25 1.71 0.89 0.51 0.48 0.85
Item 26 2.01 1.11 0.60 0.56 0.84
Item 27 2.25 1.23 0.54 0.49 0.86 a Item‐total correlation and item‐remainder correlation were calculated using the Spearman correla‐
tion coefficient.
To examine inter‐rater reliability, Spearman’s correlation coefficient was estimated
for 56 participants who responded to a questionnaire administered three days after the
initial administration (average age = 35.0 years). The Spearman correlation coefficient was
0.87 for the total score, 0.86 for self‐devaluation, 0.88 for social withdrawal, 0.80 for public
stigma and 0.61 for family stigma (Table 5).

Healthcare 2022, 10, 505 12 of 21
Table 5. ISS test–retest analysis (N = 56).
Test–Retest Application Spearman Correlation
Coefficient
Total (ISS) 0.87 *
Self‐devaluation 0.86 *
Social withdrawal 0.88 *
Public stigma 0.80 *
Family Stigma 0.61 *
* p < 0.001.
3.4. Known‐Groups Validity
A known‐groups comparison was performed using the Mann–Whitney U test to ex‐
amine clinical validity. The scale was feasibly able to discriminate between patients with
different periods of infertility (Table 6). Patients with a longer duration of infertility (more
than three years) tended to obtain a high score on the total score of the ISS (p = 0.004), self‐
devaluation (p = 0.006), social withdrawal (p = 0.044), public stigma (p = 0.006), and family
stigma (p = 0.023).
Table 6. Comparison between the ISS scores and duration of infertility (N = 254).
Duration of Infertility (years) ≤3 (n = 148) >3 (n = 106) U p‐Value
Median IQR a Median IQR a
Total (ISS) 71.0 28.20 81.0 28.80 6180.0 0.004 **b
Self‐devaluation 22.0 9.25 25.0 9.00 6247.5 0.006 **b
Social withdrawal 17.0 6.00 18.0 6.00 6683.5 0.044 *b
Public stigma 20.0 12.00 25.0 13.00 6247.5 0.006 **b
Family Stigma 11.0 8.00 12.5 9.00 6539.0 0.023 *b
* p < 0.05, ** p < 0.01; a Interquartile range; b Mann–Whitney U‐test.
3.5. Convergent Validity
To assess convergent validity, Spearman’s correlation coefficient was estimated be‐
tween the ISS and the Multidimensional Scale of Perceived Social Support, the Rosenberg
Self‐esteem Scale, and the Family APGAR (Table 7). Higher total scores and scores on the
subscales of the ISS were associated with lower scores on the Multidimensional Scale of
Perceived Social Support, the Rosenberg Self‐esteem Scale, and the Family APGAR.
Table 7. Correlation of the ISS with the Multidimensional Scale of Perceived Social Support, the
Rosenberg Self‐esteem Scale, and the Family APGAR (N = 254).
Total (ISS) Self‐
Devaluation
Social
Withdrawal
Public
Stigma
Family
Stigma
Multidimensional Scale of Perceived Social Support Family −0.36 ** −0.22 ** −0.22 ** −0.31 ** −0.48 ** Significant other −0.36 ** −0.23 ** −0.20 * −0.30 ** −0.47 ** Friends −0.37 ** −0.28 ** −0.29 ** −0.33 ** −0.29 ** Total score −0.43 ** −0.29 ** −0.29 ** −0.38 ** −0.46 **
Rosenberg Self‐esteem Scale −0.51 ** −0.57 ** −0.33 ** −0.36 ** −0.36 **
Family APGAR −0.32 ** −0.23 ** −0.12 −0.25 ** −0.44 **
* p < 0.01, ** p < 0.001.
3.6. Convergent and Discriminant Validity: Multitrait Scaling Analysis
To assess convergent and discriminant validity, multitrait analysis was conducted
(Table 8). All of the items’ own correlations adjusted for overlap exceeded 0.40. Most of
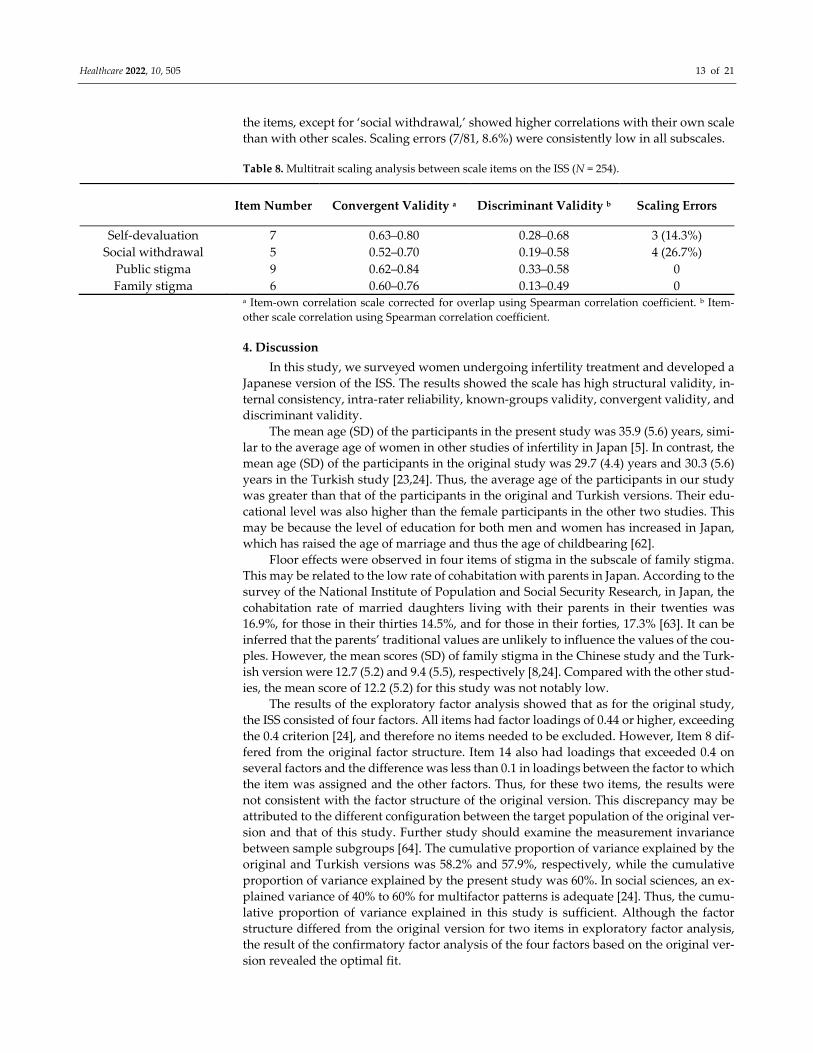
Healthcare 2022, 10, 505 13 of 21
the items, except for ‘social withdrawal,’ showed higher correlations with their own scale
than with other scales. Scaling errors (7/81, 8.6%) were consistently low in all subscales.
Table 8. Multitrait scaling analysis between scale items on the ISS (N = 254).
Item Number Convergent Validity a Discriminant Validity b Scaling Errors
Self‐devaluation 7 0.63–0.80 0.28–0.68 3 (14.3%)
Social withdrawal 5 0.52–0.70 0.19–0.58 4 (26.7%)
Public stigma 9 0.62–0.84 0.33–0.58 0
Family stigma 6 0.60–0.76 0.13–0.49 0 a Item‐own correlation scale corrected for overlap using Spearman correlation coefficient. b Item‐
other scale correlation using Spearman correlation coefficient.
4. Discussion
In this study, we surveyed women undergoing infertility treatment and developed a
Japanese version of the ISS. The results showed the scale has high structural validity, in‐
ternal consistency, intra‐rater reliability, known‐groups validity, convergent validity, and
discriminant validity.
The mean age (SD) of the participants in the present study was 35.9 (5.6) years, simi‐
lar to the average age of women in other studies of infertility in Japan [5]. In contrast, the
mean age (SD) of the participants in the original study was 29.7 (4.4) years and 30.3 (5.6)
years in the Turkish study [23,24]. Thus, the average age of the participants in our study
was greater than that of the participants in the original and Turkish versions. Their edu‐
cational level was also higher than the female participants in the other two studies. This
may be because the level of education for both men and women has increased in Japan,
which has raised the age of marriage and thus the age of childbearing [62].
Floor effects were observed in four items of stigma in the subscale of family stigma.
This may be related to the low rate of cohabitation with parents in Japan. According to the
survey of the National Institute of Population and Social Security Research, in Japan, the
cohabitation rate of married daughters living with their parents in their twenties was
16.9%, for those in their thirties 14.5%, and for those in their forties, 17.3% [63]. It can be
inferred that the parents’ traditional values are unlikely to influence the values of the cou‐
ples. However, the mean scores (SD) of family stigma in the Chinese study and the Turk‐
ish version were 12.7 (5.2) and 9.4 (5.5), respectively [8,24]. Compared with the other stud‐
ies, the mean score of 12.2 (5.2) for this study was not notably low.
The results of the exploratory factor analysis showed that as for the original study,
the ISS consisted of four factors. All items had factor loadings of 0.44 or higher, exceeding
the 0.4 criterion [24], and therefore no items needed to be excluded. However, Item 8 dif‐
fered from the original factor structure. Item 14 also had loadings that exceeded 0.4 on
several factors and the difference was less than 0.1 in loadings between the factor to which
the item was assigned and the other factors. Thus, for these two items, the results were
not consistent with the factor structure of the original version. This discrepancy may be
attributed to the different configuration between the target population of the original ver‐
sion and that of this study. Further study should examine the measurement invariance
between sample subgroups [64]. The cumulative proportion of variance explained by the
original and Turkish versions was 58.2% and 57.9%, respectively, while the cumulative
proportion of variance explained by the present study was 60%. In social sciences, an ex‐
plained variance of 40% to 60% for multifactor patterns is adequate [24]. Thus, the cumu‐
lative proportion of variance explained in this study is sufficient. Although the factor
structure differed from the original version for two items in exploratory factor analysis,
the result of the confirmatory factor analysis of the four factors based on the original ver‐
sion revealed the optimal fit.

Healthcare 2022, 10, 505 14 of 21
Cronbach’s alpha was 0.83 or more, higher than the original and Turkish versions
[23,24]. Cronbach’s alpha when each item was excluded was 0.77–0.93, and there were no
cases when the items were excluded when Cronbach’s alpha exceeded that of the com‐
plete scale. The item‐total and the item‐remainder correlations were 0.45–0.80 and 0.40–
0.78, respectively. The item‐total correlation of the Turkish version was 0.38–0.80 [24]. No
items in this study were found to be inconsistent. Therefore, we decided not to exclude
any items from this scale because there were no items that lacked internal consistency.
To measure time invariance, the test–retest method was performed. The Spearman
correlation coefficient was used to examine the relationship between the two measure‐
ments. In the current study, the total score of the ISS and subscales for two measures ex‐
hibited a positive and high correlation (ρ= 0.61–0.88), and the correlation between the two
measures was significant (p < 0.001).
When comparing the means of the groups with infertility duration of fewer than
three years to those with infertility duration of more than three years, the scores of the
four subscales were significantly higher in the group with infertility for more than three
years. This indicates that the scores on this scale are linked to similar external criteria.
The association between the ISS and social support, self‐esteem, and family function‐
ing was significantly negatively correlated as in the original version. This indicates good
convergent validity.
The results of the multitrait scaling analysis scale showed that (1) all the item‐own
correlations exceeded 0.40, and (2) scaling errors (7/81, 8.6%) were few. This suggests that,
with some exceptions, convergent and discriminant validity of the ISS are good.
The mean total score on the ISS (SD) in this study was 73.6 (20.9). These scores were
higher than infertile women undergoing in vitro fertilization (embryo transfer) in the Chi‐
nese study (mean 62.6, SD 21.6) and the participants in the Turkish study (mean 51.7, SD
23.0) [8,24]. This may be because secondary infertility was excluded in this study. The
reasons for not including secondary infertility in this study were: (1) it is known that the
level of stigma is higher for primary infertility than for secondary infertility [6]; (2) studies
in developed countries typically use only primary infertility as an inclusion criterion [10];
and (3) it was difficult to consider secondary infertility as a societally deviant behavior in
Japanese society because the total fertility rate in Japan is low at 1.36 in 2019 [65]. In addi‐
tion, participants in the original and Turkish studies were recruited at medical institu‐
tions, while participants in the present study were recruited online. This may have re‐
duced the social desirability bias and resulted in higher mean scores in the present study.
The average score for stigma of mental illness was slightly higher than in China [66,67].
This shows that, despite the differences in inclusion criteria and recruitment, the level of
stigma among our Japanese study participants was high. Being stigmatized is a reflection
of Japan’s Gender Gap Index [68], which is low among developed countries (ranked 120th
out of 156 countries), as it depends on the availability of social, economic, and political
power [69]. Previous research has mentioned that: (1) in developed countries, voluntary
childlessness is a more viable and legitimate option; (2) childless women are considered
voluntarily childless; and (3) stigma of infertile women is high in developing countries
[70]. Our study result is important because it reveals that stigma experienced by infertile
women is high, even in developed countries.
There are several limitations to this study. First, the cognitive interviews in this study
included participants who had not undergone fertility treatment. This was because the
timing of the cognitive interviews coincided with the COVID‐19 pandemic. To prevent
infection, recruitment of participants at hospitals and clinics was abandoned, and snow‐
ball sampling was adopted. Regarding the representativeness of the sample, the partici‐
pants in this study were similar to the participants in the previous study in terms of age
and employment status, but differed in terms of education background [5]. Second, we
did not test the reliability and validity of this scale on childless women who were not
undergoing fertility treatment. The cognitive interviews suggested that women undergo‐
ing fertility treatment and childless women who have not undergone fertility treatment

Healthcare 2022, 10, 505 15 of 21
may have similar self‐stigma and perceived stigma. As pointed out in the original version
[23], there is the possibility of a scale that could be adapted for childless women not re‐
ceiving fertility treatment in Japanese culture, but this has not been verified. Third, this
scale did not include perceived stigma in medical situations. The participants who under‐
went infertility treatment indicated in the cognitive interviews that stigma may be per‐
ceived when they come into contact with pregnant women in the waiting rooms of hospi‐
tals and clinics. This point may be specifically related to the medical situation in Japan.
Fourth, the Japanese version of the Multidimensional Scale of Perceived Social Support,
which was used to verify the convergent validity of this study, was a scale that was exam‐
ined for reliability and validity for middle‐aged and older Japanese people, but it was not
examined for reliability and validity for infertile women. Despite these limitations, this
study is the first in the developed countries to test the reliability and validity of a measure
of stigma among infertile women.
5. Conclusions
The Japanese version of the ISS was found to have acceptable reliability in terms of
internal consistency, item‐total and item‐remainder correlation, and intra‐rater reliability.
Together with the results of the item analysis, it can be concluded that the Japanese ver‐
sion of the ISS has sufficient reliability to be used in intervention studies, and its content
validity, construct validity, known‐groups validity, and convergent and discriminant va‐
lidity were acceptable. Although some items have been modified to fit the Japanese cul‐
ture, the results of studies using this scale can be compared with Japanese efforts to reduce
stigma among infertile women, and with those of other countries, helping to examine
ways to reduce stigma.
Author Contributions: Conceptualization, R.Y., H.O. and T.O.; methodology, R.Y., H.O., T.O. and
K.S.; validation, R.Y; formal analysis, R.Y, H.O., T.O., E.G., E.F., R.S. and T.K.; investigation, R.Y.;
resources, T.O. and T.K.; data curation, R.Y.; writing—original draft preparation, R.Y.; writing—
review and editing, H.O., T.O., E.G., E.F., R.S., K.S. and T.K.; visualization, R.Y.; supervision, T.K.;
project administration, R.Y.; funding acquisition, T.O. All authors have read and agreed to the pub‐
lished version of the manuscript.
Funding: This research was funded by JSPS KAKENHI, grant number 19K10615 Grant‐in‐Aid for
Scientific Research (C). The APC was funded by JSPS KAKENHI, grant number 19K10615 Grant‐in‐
Aid for Scientific Research (C).
Institutional Review Board Statement: The study was conducted according to the guidelines of the
Declaration of Helsinki and approved by the ethical review committee at the Graduate School of
Medicine, The University of Tokyo (number 2021128NI, 27 July 2021).
Informed Consent Statement: Informed consent was obtained from all participants involved in the
study.
Data Availability Statement: The data that support the findings of this study are available from the
corresponding author, R.Y., upon reasonable request. The data are not publicly available due to
ethical aspect.
Acknowledgments: The authors would like to thank Penny Nakanishi for performing the back
translation. We also would like to thank Hajime Shinjo, Yasuyoshi Mori, Yumi Kagawa, and Reina
Iye for the assistance in recruiting participants for the cognitive interviews. We thank Michelle Pas‐
coe, PhD for editing a draft of this manuscript.
Conflicts of Interest: The authors declare no conflict of interest.

Healthcare 2022, 10, 505 16 of 21
Appendix A
Table A1. Content validity ratio for the ISS through the expert panel (N = 8).
Item Ne a CVR b Interpretation c
Item 1 8 1.00 Remained
Item 2 8 1.00 Remained
Item 3 8 1.00 Remained
Item 4 8 1.00 Remained
Item 5 8 1.00 Remained
Item 6 8 1.00 Remained
Item 7 8 1.00 Remained
Item 8 8 1.00 Remained
Item 9 8 1.00 Remained
Item 10 7 0.75 Remained
Item 11 8 1.00 Remained
Item 12 8 1.00 Remained
Item 13 7 0.75 Remained
Item 14 8 1.00 Remained
Item 15 8 1.00 Remained
Item 16 8 1.00 Remained
Item 17 8 1.00 Remained
Item 18 7 0.75 Remained
Item 19 8 1.00 Remained
Item 20 8 1.00 Remained
Item 21 8 1.00 Remained
Item 22 7 0.75 Remained
Item 23 8 1.00 Remained
Item 24 8 1.00 Remained
Item 25 8 1.00 Remained
Item 26 7 0.75 Remained
Item 27 7 0.75 Remained a Ne: number of experts that evaluated essentiality of items. b CVR (content validity ratio) was com‐
puted using the formula: CVR = (Ne‐N/2)/(N/2) with eight experts. c Interpretation criteria for CVR:
Remained = CVR ≥ 0.75; Eliminated = CVR < 0.75.
Appendix B
Table A2. Content validity index of item relevance and clarity, and modified kappa agreement for
the ISS through the expert panel (N = 8).
Item Relevance Clarity
Interpretation d Agreement I‐CVI a Pc b K c Agreement I‐CVI a Pc b K c
Item 1 8/8 1.00 <0.01 1.00 8/8 1.00 <0.01 1.00 Excellent
Item 2 8/8 1.00 <0.01 1.00 8/8 1.00 <0.01 1.00 Excellent
Item 3 8/8 1.00 <0.01 1.00 8/8 1.00 <0.01 1.00 Excellent
Item 4 8/8 1.00 <0.01 1.00 8/8 1.00 <0.01 1.00 Excellent
Item 5 8/8 1.00 <0.01 1.00 8/8 1.00 <0.01 1.00 Excellent
Item 6 8/8 1.00 <0.01 1.00 8/8 1.00 <0.01 1.00 Excellent
Item 7 8/8 1.00 <0.01 1.00 8/8 1.00 <0.01 1.00 Excellent
Item 8 8/8 1.00 <0.01 1.00 8/8 1.00 <0.01 1.00 Excellent
Item 9 8/8 1.00 <0.01 1.00 8/8 1.00 <0.01 1.00 Excellent
Item 10 8/8 1.00 <0.01 1.00 8/8 1.00 <0.01 1.00 Excellent

Healthcare 2022, 10, 505 17 of 21
Item 11 8/8 1.00 <0.01 1.00 8/8 1.00 <0.01 1.00 Excellent
Item 12 8/8 1.00 <0.01 1.00 8/8 1.00 <0.01 1.00 Excellent
Item 13 8/8 1.00 <0.01 1.00 8/8 1.00 <0.01 1.00 Excellent
Item 14 7/8 0.88 0.03 0.87 8/8 1.00 <0.01 1.00 Excellent
Item 15 8/8 1.00 <0.01 1.00 8/8 1.00 <0.01 1.00 Excellent
Item 16 8/8 1.00 <0.01 1.00 8/8 1.00 <0.01 1.00 Excellent
Item 17 8/8 1.00 <0.01 1.00 8/8 1.00 <0.01 1.00 Excellent
Item 18 8/8 1.00 <0.01 1.00 8/8 1.00 <0.01 1.00 Excellent
Item 19 8/8 1.00 <0.01 1.00 8/8 1.00 <0.01 1.00 Excellent
Item 20 8/8 1.00 <0.01 1.00 8/8 1.00 <0.01 1.00 Excellent
Item 21 8/8 1.00 <0.01 1.00 8/8 1.00 <0.01 1.00 Excellent
Item 22 7/8 0.88 0.03 0.87 8/8 1.00 <0.01 1.00 Excellent
Item 23 8/8 1.00 <0.01 1.00 7/8 0.88 0.03 0.87 Excellent
Item 24 8/8 1.00 <0.01 1.00 8/8 1.00 <0.01 1.00 Excellent
Item 25 8/8 1.00 <0.01 1.00 8/8 1.00 <0.01 1.00 Excellent
Item 26 8/8 1.00 <0.01 1.00 8/8 1.00 <0.01 1.00 Excellent
Item 27 8/8 1.00 <0.01 1.00 8/8 1.00 <0.01 1.00 Excellent
S‐CVI/Ave e 0.99 1.00
S‐CVI/UA f 0.93 0.96 a I‐CVI (item‐level content validity index) was computed using the formula: A/N where A = number
of raters who agree that the item is relevant or clear and N = number of raters. b Pc (probability of a
chance occurrence) was computed using the formula: Pc = [N!/A!(N‐A)] 0.5N. c K (modified kappa)
was computed using the formula: K = (I‐CVI‐Pc)/(1‐Pc). d Interpretation criteria for kappa: Fair = K
of 0.40 to 0.59; Good = K of 0.60 to 0.74; Excellent = K > 0.74. e S‐CVI/Ave: Scale‐level content validity
index/Average. f S‐CVI/UA: Scale‐level content validity index/Universal agreement.
Appendix C
Table A3. Semistructured cognitive debriefing interview guide.
Topics Probing Question
General impression of the scale What were your feelings when you were answering the questionnaire?
Did you experience any psychological distress while completing the questionnaire?
Comprehensibility
How comprehensible was the instructional text to you?
How comprehensible was item X to you?
How comprehensible were the response options to you?
Are there any questions that would be better phrased in a more specific way?
Relevance Does item X relate to the situation of infertile women?
Are there any questions that are duplicated, repeated, or very similar?
Comprehensiveness
Is there anything missing from this questionnaire regarding the feeling that infertile
women are socially different compared with others?
To what extent did you feel that the content of this questionnaire covered the sense
of infertile women that you just described?
Is the grouping of questions appropriate?
Response options Are the response options appropriate?
Suggestions for improvement Do you have any suggestions on how to improve the questionnaire?

Healthcare 2022, 10, 505 18 of 21
Appendix D
Table A4. The percentage of agreement of comprehensibility and relevance through cognitive de‐
briefing (N = 8, %).
Item Comprehensibility Relevance
Instruction 87.5
Item 1 100.0 100.0
Item 2 100.0 100.0
Item 3 87.5 87.5
Item 4 100.0 100.0
Item 5 87.5 100.0
Item 6 100.0 100.0
Item 7 75.0 100.0
Item 8 100.0 100.0
Item 9 87.5 100.0
Item 10 100.0 100.0
Item 11 100.0 100.0
Item 12 100.0 100.0
Item 13 100.0 100.0
Item 14 87.5 100.0
Item 15 100.0 100.0
Item 16 100.0 100.0
Item 17 100.0 100.0
Item 18 87.5 100.0
Item 19 87.5 100.0
Item 20 100.0 100.0
Item 21 100.0 100.0
Item 22 75.0 100.0
Item 23 100.0 100.0
Item 24 100.0 100.0
Item 25 100.0 75.0
Item 26 100.0 100.0
Item 27 62.5 100.0
Response options 87.5
References
1. Anderson, K.; Norman, R.J.; Middleton, P. Preconception lifestyle advice for people with subfertility. Cochrane Database Syst.
Rev. 2010, Cd008189. https://doi.org/10.1002/14651858.CD008189.pub2.
2. National Institute of Population and Social Security Research. Basic Survey on Social Security and Population Problems 2015
Marriage and Childbirth in Japan Today: The Fifteenth Japanese National Fertility Survey, 2015 (Results of Singles and Married
Couples Survey) 2017. Available online: http://www.ipss.go.jp/ps‐doukou/j/doukou15/NFS15_reportALL.pdf (accessed on 7
December 2021).
3. Ishihara, O.; Jwa, S.C.; Kuwahara, A.; Katagiri, Y.; Kuwabara, Y.; Hamatani, T.; Harada, M.; Ichikawa, T. Assisted reproductive
technology in Japan: A summary report for 2017 by the Ethics Committee of the Japan Society of Obstetrics and Gynecology.
Reprod. Med. Biol. 2020, 19, 3–12. https://doi.org/10.1002/rmb2.12307.
4. Ministry of Health Labour and Welfare. Summary of Demographic Statistics for 2017. Available online:
https://www.mhlw.go.jp/toukei/saikin/hw/jinkou/kakutei17/dl/03_h1.pdf (accessed on 7 December 2021).
5. Kato, T.; Sampei, M.; Saito, K.; Morisaki, N.; Urayama, K.Y. Depressive symptoms, anxiety, and quality of life of Japanese
women at initiation of ART treatment. Sci. Rep. 2021, 11, 7538. https://doi.org/10.1038/s41598‐021‐87057‐6.
6. Donkor, E.S.; Sandall, J. The impact of perceived stigma and mediating social factors on infertility‐related stress among women
seeking infertility treatment in Southern Ghana. Soc. Sci. Med. 2007, 65, 1683–1694.
https://doi.org/10.1016/j.socscimed.2007.06.003.

Healthcare 2022, 10, 505 19 of 21
7. Fang, M.; Li, G.; Kang, X.; Hou, F.; Lv, G.; Xu, X.; Kong, L.; Li, P. The role of gender and self‐esteem as moderators of the
relationship between stigma and psychological distress among infertile couples. Psychol. Health Med. 2021, 26, 1181–1194.
https://doi.org/10.1080/13548506.2020.1808233.
8. Jing, X.; Gu, W.; Xu, X.; Yan, C.; Jiao, P.; Zhang, L.; Li, X.; Wang, X.; Wang, W. Stigma predicting fertility quality of life among
Chinese infertile women undergoing in vitro fertilization‐embryo transfer. J. Psychosom. Obs. Gynaecol. 2020, 1–7.
https://doi.org/10.1080/0167482x.2020.1778665.
9. Miles, L.M.; Keitel, M.; Jackson, M.; Harris, A.; Licciardi, F. Predictors of distress in women being treated for infertility. J. Reprod.
Infant. Psychol. 2009, 27, 238–257. https://doi.org/10.1080/02646830802350880.
10. Slade, P.; O’Neill, C.; Simpson, A.J.; Lashen, H. The relationship between perceived stigma, disclosure patterns, support and
distress in new attendees at an infertility clinic. Hum. Reprod. 2007, 22, 2309–2317. https://doi.org/10.1093/humrep/dem115.
11. Yilmaz, E.; Kavak, F. The effect of stigma on depression levels of Turkish women with infertility. Perspect. Psychiatr. Care 2019,
55, 378–382. https://doi.org/10.1111/ppc.12319.
12. Öztürk, R.; Bloom, T.L.; Li, Y.; Bullock, L.F.C. Stress, stigma, violence experiences and social support of US infertile women. J
Reprod. Infant. Psychol. 2021, 39, 205–217. https://doi.org/10.1080/02646838.2020.1754373.
13. Goffman, E. Stigma: Notes on the Management of Spoiled Identity; Prentice Hall: Englewood Criffs, NJ, USA, 1963.
14. Ainlay, S.C.; Becker, G.; Coleman, L.M. The Dilemma of Difference; Plenum: New York, NY, USA, 1986.
15. Araki, A. The problem of the reproductive medicine due to infertility psychology‐ A problem to hide behind in the relationship
do not treat by medical care that interface submits. Ritsumeikan J. Hum. Sci. 2008, 16, 81–94.
16. Takeya, K. Choice and loss in infertility experience: Reanalysis of a narrative text through dialogic reflexivity. Kyoto Univ. Res.
Stud. Educ. 2009, 55, 351–363.
17. Yasuda, Y. Life Choices of Infertility Patients: A Narrative Approach to Capturing Life Stories; Shinyosya: Tokyo, Japan, 2012.
18. National Institute of Population and Social Security Research. Summary of the results of the 6th National Survey on Household
Trends, 2018. Available online: http://www.ipss.go.jp/ps‐katei/j/NSFJ6/Kohyo/NSFJ6_gaiyo.pdf (accessed on 19 December
2021).
19. Takeya, K. The narratives of women who received infertility treatment: The choice of a life as a woman without children. Qual.
Res. Psychol. Jpn J. Qual. Psychol. 2008, 7, 118–137.
20. Justo, J. M. R. M.; Paris Vieira, C. F. S.; Veiga Costa, E. Stigma consciousness and self‐efficacy in infertile couples; Correlation
and gender differences. Int. J. Dev. Educ. Psychol. 2010, 2, 17–24.
21. McCarthy, M.P.; Chiu, S.H. Differences in womenʹs psychological well‐being based on infertility treatment choice and outcome.
J. Midwifery Womens Health 2011, 56, 475–480. https://doi.org/10.1111/j.1542‐2011.2011.00047.x.
22. Taebi, M.; Kariman, N.; Montazeri, A.; Majd, H.A. Development and psychometric evaluation of the female infertility stigma
instrument (ISI‐F): Protocol for a mixed method study. Reprod Health 2020, 17, 70. https://doi.org/10.1186/s12978‐020‐0904‐5.
23. Fu, B.; Qin, N.; Cheng, L.; Tang, G.; Cao, Y.; Yan, C.; Huang, X.; Yan, P.; Zhu, S.; Lei, J. Development and validation of an
Infertility Stigma Scale for Chinese women. J. Psychosom. Res. 2015, 79, 69–75. https://doi.org/10.1016/j.jpsychores.2014.11.014.
24. Çapık, A.; Aksoy, M.; Yılmaz, E.; Yılmaz, F. Infertility stigma scale: A psychometric study in a Turkish sample. Perspect Psychiatr.
Care 2019, 55, 328–335. https://doi.org/10.1111/ppc.12360.
25. Sousa, V.D.; Rojjanasrirat, W. Translation, adaptation and validation of instruments or scales for use in cross‐cultural health
care research: A clear and user‐friendly guideline. J. Eval. Clin. Pr. 2011, 17, 268–274. https://doi.org/10.1111/j.1365‐
2753.2010.01434.x.
26. Beaton, D.E.; Bombardier, C.; Guillemin, F.; Ferraz, M.B. Guidelines for the process of cross‐cultural adaptation of self‐report
measures. Spine 2000, 25, 3186–3191. https://doi.org/10.1097/00007632‐200012150‐00014.
27. Wild, D.; Grove, A.; Martin, M.; Eremenco, S.; McElroy, S.; Verjee‐Lorenz, A.; Erikson, P. Principles of good practice for the
translation and cultural adaptation process for Patient‐Reported Outcomes (PRO) Measures: Report of the ISPOR Task Force
for Translation and Cultural Adaptation. Value Health 2005, 8, 94–104. https://doi.org/10.1111/j.1524‐4733.2005.04054.x.
28. Jowell, R.; Roberts, C.; Fitzgerald, R.; Eva, G. Measuring Attitudes Cross‐Nationally: Lesson from the European Social Survey; Sage:
Los Angeles, CA, USA, 2007. https://doi.org/10.4135/9781849209458.
29. Behr, D. Assessing the use of back translation: The shortcomings of back translation as a quality testing method. Int. J. Soc. Res.
Methodol. 2017, 20, 573–584. https://doi.org/10.1080/13645579.2016.1252188.
30. Almanasreh, E.; Moles, R.; Chen, T.F. Evaluation of methods used for estimating content validity. Res. Soc. Adm. Pharm. 2019,
15, 214–221. https://doi.org/10.1016/j.sapharm.2018.03.066.
31. Caruso, R.; Arrigoni, C.; Groppelli, K.; Magon, A.; Dellafiore, F.; Pittella, F.; Grugnetti, A.M.; Chessa, M.; Yorke, J. Italian version
of Dyspnoea‐12: Cultural‐linguistic validation, quantitative and qualitative content validity study. Acta Biomed. 2018, 88, 426–
434. https://doi.org/10.23750/abm.v88i4.6341.
32. Mokkink, L.B.; Prinsen, C.A.C.; Patrick, D.L.; Alonso, J.; Bouter, L.M.; de Vet, H.C.W.; Terwee, C.B. COSMIN Study Design
Checklist for Patient‐Reported Outcome Measurement Instruments. 2019. Available online: https://www.cosmin.nl/wp‐con‐
tent/uploads/COSMIN‐study‐designing‐checklist_final.pdf (accessed on 20 December 2021).
33. Polit, D.F.; Beck, C.T. The content validity index: Are you sure you know whatʹs being reported? Critique and recommendations.
Res. Nurs. Health 2006, 29, 489–497. https://doi.org/10.1002/nur.20147.

Healthcare 2022, 10, 505 20 of 21
34. Rodrigues, I.B.; Adachi, J.D.; Beattie, K.A.; MacDermid, J.C. Development and validation of a new tool to measure the facilitators,
barriers and preferences to exercise in people with osteoporosis. BMC Musculoskelet. Disord. 2017, 18, 540.
https://doi.org/10.1186/s12891‐017‐1914‐5.
35. Zamanzadeh, V.; Ghahramanian, A.; Rassouli, M.; Abbaszadeh, A.; Alavi‐Majd, H.; Nikanfar, A.R. Design and implementation
content validity study: Development of an instrument for measuring patient‐centered communication. J. Caring Sci. 2015, 4,
165–178. https://doi.org/10.15171/jcs.2015.017.
36. Lawshe, C.H. A quantitative approach to content validity. Pers. Psychol. 1975, 28, 563–575. https://doi.org/10.1111/J.1744‐
6570.1975.TB01393.X.
37. Schwarz, N.; Sudman, S. Answering Questions: Methodology for Determining Cognitive and Communicative Processes in Survey Re‐
search; Jossey‐Bass Pub: San Francisco, CA, USA, 1996.
38. Willis, G.B. Cognitive Interviewing: A Tool for Improving Questionnaire Design; Sage; Thousand Oaks, CA, USA, 2005.
39. Apfelbacher, C.J.; Jones, C.J.; Frew, A.; Smith, H. Validity of three asthma‐specific quality of life questionnaires: The patientsʹ
perspective. BMJ Open 2016, 6, e011793. https://doi.org/10.1136/bmjopen‐2016‐011793.
40. Collins, D. Pretesting survey instruments: An overview of cognitive methods. Qual. Life Res. 2003, 12, 229–238.
https://doi.org/10.1023/a:1023254226592.
41. Gabes, M.; Tischer, C.; Herrmann, A.; Howells, L.; Apfelbacher, C. The German RECAP questionnaire: Linguistic validation
and cognitive debriefing in German adults with self‐reported atopic eczema and parents of affected children. J. Patient Rep.
Outcomes 2021, 5, 13. https://doi.org/10.1186/s41687‐021‐00285‐2.
42. Irwin, D.E.; Varni, J.W.; Yeatts, K.; DeWalt, D.A. Cognitive interviewing methodology in the development of a pediatric item
bank: A patient reported outcomes measurement information system (PROMIS) study. Health Qual. Life Outcomes 2009, 7, 3.
https://doi.org/10.1186/1477‐7525‐7‐3.
43. Tse, E.T.Y.; Lam, C.L.K.; Wong, C.K.H.; Chin, W.Y.; Etz, R.S.; Zyzanski, S.J.; Stange, K.C. Cultural adaptation and content va‐
lidity of a Chinese translation of the Person‐Centered Primary Care Measure: Findings from cognitive debriefing. Fam. Med.
Commun. Health 2020, 8, e000621. https://doi.org/10.1136/fmch‐2020‐000621.
44. Zimet, G.D.; Dahlem, N.W.; Zimet, S.G.; Frley, G.K. The multidimensional scale of perceived social support. J. Pers. Assess 1988,
52, 30–41. https://doi.org/10.1207/s15327752jpa5201_2.
45. Zimet, G.D.; Powell, S.S.; Farley, G.K.; Werkman, S.; Berkoff, K.A. Psychometric characteristics of the multidimensional scale of
perceived social support. J. Pers. Assess. 1990, 55, 610–617. https://doi.org/10.1080/00223891.1990.9674095.
46. Iwasa, H.; Gondo, Y.; Masui, Y.; Inagaki, H.; Kawai, C.; Ootsuka, R.; Ogawa, M.; Takayama, M.; Imuta, H.; Suzuki, T. Reliability
and validity of the Japanese version of the Social Support Scale: A study of middle‐aged and older adults. J. Health Welf. Stat.
2007, 54, 26–33.
47. Rosenberg, M. Society and Adolescent Self‐Image; Princeton University Press: Princeton, NJ, USA, 1965.
48. Mimura, C.; Griffiths, P. A Japanese version of the Rosenberg Self‐Esteem Scale: Translation and equivalence assessment. J.
Psychosom. Res. 2007, 62, 589–594. https://doi.org/10.1016/j.jpsychores.2006.11.004.
49. Uchida, T.; Ueno, T. Reliability and validity of the Rosenberg Self Esteem Scale: Using the Japanese version of the RSES by
Mimura & Griffiths (2007). Annu. Rep. Grad. Sch. Educ. Tohoku Univ. 2010, 58, 257–266.
50. Smilkstein, G. The family APGAR: A proposal for a family function test and its use by physicians. J. Fam. Pr. 1978, 6, 1231–1239.
51. Smilkstein, G.; Ashworth, C.; Montano, D. Validity and reliability of the family APGAR as a test of family function. J. Fam. Pr.
1982, 15, 303–311.
52. Kokubu M.; Kamibeppu, K. Development of a family functioning scale: The Japanese version of Family APGAR. Establish‐
ment of family nursing skills and liaison systems between hospitals and other social resources to realize abuse prevention
from the perinatal period (principal researcher: Kamibeppu, K). Working Report of Grant‐in‐Aid for Scientific Research in
2009–2011, 2013. Available online: https://kaken.nii.ac.jp/file/KAKENHI‐PROJECT‐21390589/21390589seika.pdf (accessed on 7
December 2021).
53. Toyoda, H. Covariance Structure Analysis—Structural Equation Modeling Using R; TokyoTosho Co., Ltd.: Tokyo, Japan, 2014.
54. Toyoda, H. Covariance Structure Analysis [Q&A]—Structural Equation Modeling; Asakura Publishing Co., Ltd.: Tokyo, Japan, 2003.
55. Kwon, M.Y.; Kim, N.Y. Validity and reliability of a Korean version of the ConCom Safety Management Scale. Int. J. Environ. Res.
Public Health 2021, 18, 12514. https://doi.org/10.3390/ijerph182312514.
56. Asano, H.; Suzuki, T.; Kojima, T. Introduction to Covariance Structure Aanalysis in Practice; Kodansha Ltd.: Tokyo, Japan, 2005.
57. Terwee, C.B.; Bot, S.D.M.; de Boer, M.R.; van der Windt, D.A.W. M.; Knol, D.L.; Dekker, J.; Bouter, L.M.; de Vet, H.C.W. Quality
criteria were proposed for measurement properties of health status questionnaires. J. Clin. Epidemiol. 2007, 60, 34–42.
https://doi.org/10.1016/j.jclinepi.2006.03.012.
58. Papreen, N.; Sharma, A.; Sabin, K.; Begum, L.; Ahsan, S.K.; Baqui, A.H. Living with infertility: Experiences among Urban slum
populations in Bangladesh. Reprod. Health Matters 2000, 8, 33–44. https://doi.org/10.1016/s0968‐808090004‐1.
59. Remennick, L. Childless in the land of imperative motherhood: Stigma and coping among infertile Israeli women. Sex Roles
2000, 43, 821–841. https://doi.org/10.1023/A:1011084821700.
60. Araya, L.T.; Gebretekle, G.B.; Gebremariam, G.T.; Fenta, T.G. Reliability and validity of the Amharic version of European Or‐
ganization for Research and Treatment of cervical Cancer module for the assessment of health related quality of life in women
with cervical cancer in Addis Ababa, Ethiopia. Health Qual. Life Outcomes 2019, 17, 13. https://doi.org/10.1186/s12955‐019‐1089‐
x.

Healthcare 2022, 10, 505 21 of 21
61. Goo, A.J.; Shin, D.W.; Yang, H.K.; Park, J.H.; Kim, S.Y.; Shin, J.Y.; Kim, Y.A.; Kim, C.; Hong, N.S.; Min, Y.J.; et al. Cross‐cultural
application of the Korean version of the EORTC QLQ‐ELD14 questionnaire for elderly patients with cancer. J. Geriatr. Oncol.
2017, 8, 271–276. https://doi.org/10.1016/j.jgo.2017.03.001.
62. Okui, T. Marriage and fertility rates of Japanese women according to employment status: An age‐period‐cohort analysis. Nihon
Koshu Eisei Zasshi 2020, 67, 892–903. https://doi.org/10.11236/jph.67.12_892.
63. National Institute of Population and Social Security Research. The 6th National Survey on Household Trends in Japan, 2018. Avail‐
able online: https://www.ipss.go.jp/ps‐katei/j/NSFJ6/Mhoukoku/Mhoukoku.pdf (accessed on 28 December 2021).
64. Davidov, E.; Meuleman, B.; Cieciuch, J.; Schmidt, P.; Billiet, J. Measurement equivalence in cross‐national research. Annu. Rev.
Sociol. 2014, 40, 55–75. https://doi.org/10.1146/annurev‐soc‐071913‐043137.
65. Ministry of Health Labour and Welfare. Figure 1.1.7 Trends in the number of births and total fertility rate. Available online:
https://www.mhlw.go.jp/stf/wp/hakusyo/kousei/19/backdata/index.html (accessed on 28 December 2021).
66. Tanabe, Y.; Hayashi, K.; Ideno, Y. The Internalized Stigma of Mental Illness (ISMI) scale: Validation of the Japanese version.
BMC Psychiatry 2016, 16, 116. https://doi.org/10.1186/s12888‐016‐0825‐6.
67. Lv, Y.; Wolf, A.; Wang, X. Experienced stigma and self‐stigma in Chinese patients with schizophrenia. Gen. Hosp. Psychiatry
2013, 35, 83–88. https://doi.org/10.1016/j.genhosppsych.2012.07.007.
68. Gender Equality Bureau Cabinet Office. World Economic Forum releases Gender Gap Index 2021. Available online:
https://www.gender.go.jp/public/kyodosankaku/2021/202105/202105_05.html (accessed on 28 December 2021).
69. Link, B.G.; Phelan, J.C. Conceptualizing stigma. Annu. Rev. Sociol. 2001, 27, 363‐385. https://doi.org/10.1146/annurev.soc.27.1.363.
70. Greil, A.L.; Slauson‐Blevins, K.; McQuillan, J. The experience of infertility: A review of recent literature. Sociol. Health Illn. 2010,
32, 140–162. https://doi.org/10.1111/j.1467‐9566.2009.01213.x.


