Embed Size (px)
Citation preview

DEVELOPMENTAL ASSESSMENT CENTERS 1
Predicting Supervisor and Student Competency Ratings from a Developmental Assessment Center: A Longitudinal Validation Study
Vanessa L. Sturre, Jeromy Anglim, Kathryn von Treuer, Tess Knight, Arlene Walker
Abstract * The current study examined the ability of a developmental assessment center
to support and predict professional competency development in a vocational education context. A longitudinal study was conducted where graduate organizational psychology students (N = 157 students and 501 placements) completed a developmental assessment center at the beginning of their degree, along with measures of Big Five personality and self-efficacy. Their performance was then assessed throughout the degree in three or four separate work placements using student and placement supervisor ratings. Both assessment center and placement ratings assessed students on seven work-relevant competencies. Competence developed linearly over placements with student-rated competency lower than supervisor-rated competency at the first placement but with these differences disappearing by the final placement. Consistent with the students undergoing a period of rapid professional development and principles of dynamic validity, the predictive validity of assessment center performance declined over time. The research also presents a rich picture of how competency ratings converge across raters and develop at different rates. The research provides novel longitudinal evidence regarding how objective competence and self-confidence are developed in a professional educational setting. It also shows how developmental assessment centers can be implemented within professional educational training to support career development.
Keywords: developmental assessment center, work placements, competence, performance, longitudinal, dynamic validity
Introduction Professional vocational education is concerned with developing competencies
that enable graduates to effectively transition into the workplace (e.g. Deane et al., 2018; Passarelli et al., 2018). In many professions, this competency development is supported by work placements (Deane et al., 2018). However, compared to conventional class-room teaching, learning on placements is often less structured and subject to organizational and supervisory variation (Jackson, 2018). One promising approach for supporting student learning in this context is the developmental assessment center. This approach provides a standardized assessment of work-related competencies (Brodersen & Thornton III, 2011) that can support the provision of
* Please cite as (check for updated year, volume and page numbers): Sturre, V. L., Anglim, J., von Treuer, K., Knight, T., & Walker, A. (2021). Predicting supervisor and student
competency ratings from a developmental assessment center: A longitudinal validation study. Journal of Vocational Behavior, 103666. https://doi.org/10.1016/j.jvb.2021.103666
Vanessa L. Sturre, Jeromy Anglim, Arlene Walker: School of Psychology, Deakin University, Geelong, Australia; Kathryn von Treuer: The Cairnmillar Institute, Australia and The School of Medicine, Deakin University, Geelong, Australia; Tess Knight: The Cairnmillar Institute, Australia. Correspondence concerning this article should be addressed to Vanessa L. Sturre, School of Psychology, Deakin University, Locked Bag 20001, Geelong, 3220 Australia. Email: [email protected]

DEVELOPMENTAL ASSESSMENT CENTERS 2
formative feedback and professional development aligned to employability. Despite the popularity of developmental assessment centers in industry, much
less is known about their validity in professional education settings. Numerous assumptions have yet to be assessed about the effectiveness of developmental assessment centers to predict and support competency development. In particular, research on vocational education has rarely examined the degree to which an initial developmental assessment center predicts both supervisor and student ratings of competence across a series work placements. By obtaining both placement supervisor and student perspectives, a deeper understanding can be obtained for how both self-confidence and objective competence develops and how this is related to baseline competency assessment in a developmental assessment center. As such, the current study sought to longitudinally examine the development of professional competence for graduate training of business-related professionals and assess the potential of a developmental assessment center to support and predict this development.
Competence Development and Performance Competencies refer to latent domain-specific abilities, and performance refers
to an instance of evaluated behavior (for discussion, see Bashook, 2005; Rethans et al., 2002). Competency frameworks are commonly used by educators to support student learning and by organizations to inform a range human resource functions including training, performance appraisal, promotion, and career planning (Chen & Naquin, 2006). Training and experience generally lead to the development of competence which manifests in improved performance (Ackerman, 2007). While simple tasks show the greatest improvements early in the skill acquisition process (Ackerman et al., 2011; Yeo & Neal, 2004), expertise in more complex domains often accumulates over many years (Farrington-Darby & Wilson, 2006). In particular, professional competencies developed through placements and workplace experience represent an example of the latter (Humphreys et al., 2017).
Despite these theoretical propositions, few studies have examined competency development in professional placement settings (for discussion see Hitzeman et al., 2020; Humphreys et al., 2017; Larkin & Morris, 2015). A few studies, mostly in clinical psychology, have found that students improve their performance most rapidly in the early stages of placement experiences (Deane et al., 2018; Gonsalvez et al., 2015; Larkin & Morris, 2015). Nonetheless, this research has limitations including (a) small sample sizes, (b) reliance on cross-sectional rather than longitudinal designs, (c) absence of simultaneous student and supervisor ratings, and (d) narrow applications of competency measurement and associated developmental initiatives. More generally, little longitudinal research has assessed competency development in broader professional settings, and how to reliably improve, predict and sustain such changes. The inherent variability in work placement experiences and the dynamic nature of performance provide additional challenges; however, one promising method in this area is the developmental assessment center.
Assessment Centers Assessment centers involve the standardized evaluation of performance on
multiple assessment exercises that simulate important workplace activities (International Taskforce on Assessment Center Guidelines, 2015). They are commonly used by organizations to support employee selection or professional

DEVELOPMENTAL ASSESSMENT CENTERS 3
development (Buckett et al., 2020; International Taskforce on Assessment Center Guidelines, 2015). When used for developmental purposes, they are typically labelled developmental assessment centers. Assessment centers are particularly effective at measuring work-related competencies including interpersonal, problem-solving, decision-making, and communication skills. They involve multiple assessors that are trained to rate participant performance. Simulations are modelled on relevant work experiences including role-plays (e.g., meeting with a customer, peer, or manager), group discussions (e.g., team meetings), or informational tasks (e.g., responding to an inbox of emails or preparing business reports).
Several meta-analyses suggest that, overall, assessment center ratings are effective in predicting job performance and career progression outcomes such as promotions and future salary (e.g. Gaugler et al., 1987; Hermelin et al., 2007). Several studies suggest that assessment centers provide incremental prediction of these outcomes over and above personality and cognitive ability (e.g. Meriac et al., 2008; Sackett et al., 2017). Nonetheless, the exact reasons for their effectiveness are less well understood (Klimoski & Brickner, 1987). While competency dimensions are of primary interest (Buckett et al., 2020), studies typically find that it is the exercises that shape most what is assessed (Kuncel & Sackett, 2014).
Researchers have also considered the degree to which the predictive validity of assessment centers change over time (Jansen & Stoop, 2001; Jansen & Vinkenburg, 2006). While assessment centers are often able to predict future workplace performance (e.g., Blair et al., 2016; Garavan, 2007; Jansen & Vinkenburg, 2006), some longitudinal research has found that correlations decline over time (Tziner et al., 1993). This finding is consistent with the broader assessment literature, whereby validity tends to decline over time as a result of a person gradually changing (Keil & Cortina, 2001). Such declines in validity are likely to be amplified in educational settings where students enter programs with varying levels of baseline competencies and undergo intensive periods of professional development. Specifically, individual differences in trajectories of competency development amplify the general tendency of predictive validity to decline over time (Keil & Cortina, 2001; Murphy, 1989).
Developmental Assessment Centers in Educational Settings The use of assessment centers for development has increased over recent years
(Brodersen & Thornton III, 2011). Several studies suggest that developmental assessment centers enhance job performance and motivation of participants (e.g. Brodersen & Thornton III, 2011; McDowall & Mabey, 2008). However, developmental assessment centers have rarely been the subject of robust long-term evaluation, particularly in educational settings. For instance, Bieri and Schuler (2011) used an assessment center as part of selecting and developing student teachers with a small follow-up sample, and Rotthoff et al. (2014) evaluated the ability of an assessment center in a small sample of medical students to predict subsequent clinical performance. Nonetheless, little research has examined how such centers can be integrated into a sustained program of professional development and performance assessment.
The potential benefits of developmental assessment centers suggest that they should be prevalent, however, their sustained use in education settings remains uncommon (Rotthoff et al., 2014; Sturre et al., 2020). This is particularly surprising

DEVELOPMENTAL ASSESSMENT CENTERS 4
given that academic pedagogy continues to acknowledge the need for approaches that reliably contribute to student employability and professional competence. While the complexity of the process may partially explain the scarcity of use (Sturre et al., 2020), the method is generally regarded as financially worthwhile (Brits et al., 2013; Meriac et al., 2008) and is supported by clear usage guidelines (International Taskforce on Assessment Center Guidelines, 2015), suggesting that the overall lack of application may be related to limited exposure and evaluation in education settings.
The Current Study The current study aimed to examine the ability of a developmental assessment
center to support and predict professional competency development in a vocational education context. To achieve this aim, we conducted a longitudinal study of competency development in students in a graduate organizational psychology program. Organizational psychologists typically operate in business environments with the aim of improving workplace culture, employee performance and well-being. While possessing fundamental psychological skills, they also share similarities with a range of business professionals in management, human resources, and consulting. Students completed a developmental assessment center at the beginning of their educational program, which provided a baseline assessment of seven work-related competencies that informed plans for subsequent development. These seven competencies included competencies related to discipline specific knowledge, communication skills, team working, and decision making. Then, as part of their training, students completed coursework, research, and at least three work placements at different organizations. At the end of each placement, student and placement supervisor ratings of performance aligned to the competencies were obtained. To provide additional feedback to students, personality was assessed. This inclusion also permitted examination of the dynamic validity of personality (Lievens et al., 2009) and the incremental prediction of assessment centers over and above personality. To examine the relative importance of self-efficacy on student and supervisor ratings and the degree to which self-efficacy changed over the course, student self-efficacy was also measured before commencing placements and at the conclusion of placements.
We had several expectations. First, because the assessment center was designed to assess professional competencies aligned with workplace performance, we expected that assessment center ratings would be positively associated with student and supervisor ratings of placement performance. Second, through the combination of the developmental assessment center, coursework, and placement experiences, student placement performance was expected to improve over time. Third, given that the study covers a period of rapid professional development, it was likely that underlying competencies would improve over time and that the rate of change would vary between students. Thus, the ability of the developmental assessment center ratings to predict placement performance as rated by supervisors and students, was expected to decline over time.
We also sought to better understand the nature of competency measurement and development. First, we assessed the degree to which individual competency ratings from the development assessment center converged with both student and supervisor placement ratings. Existing research suggests that competencies are correlated and that rater biases related to leniency or halo effects are likely to inflate

DEVELOPMENTAL ASSESSMENT CENTERS 5
correlations between competencies within a given rater type (e.g., Beehr et al., 2001; Chiaburu et al., 2010; Wolf, 2015). However, to the extent that the competencies are distinct and observable, we also expected to see evidence of convergent correlations across raters (Atkins & Wood, 2002). Second, we sought to examine the extent to which competencies varied in their developmental trajectories. Our understanding of the literature suggests that competencies are more developable when competencies are narrower in focus, competencies are aligned to training, participants have not already acquired the competencies, participants have the underlying ability to acquire the competencies, and participants are motivated to acquire the competencies (e.g., Rupp, Snyder, et al., 2006; Salas & Cannon-Bowers, 2001). In the present context, all students were selected into the program based on having a strong motivation to achieve in the course, high levels of general academic achievement, and acceptable levels of interpersonal effectiveness and professional maturity. Thus, while we expected all competencies to improve over the course of the degree, we expected those related to discipline-specific knowledge to show greater improvement.
Finally, we also sought to examine how the trajectories of competency development and the predictive validity of assessment center ratings varied across student and supervisor ratings. In particular, the student perspective embodies a combination of self-confidence and actual competence and is likely to respond to feedback provided both in the developmental assessment center and from placement experiences. In contrast, supervisor ratings reflect an independent assessment of student competencies and the predictive validity of assessment center ratings. In addition to the primary focus on building objective competence, the educational program also sought to build confidence to support effort and persistence (Jacobs et al., 1984). Understanding the effects of these dynamics has implications for theories of individual development such as control theory (Demerouti et al., 2011; Gregory et al., 2011). A key premise of such theories is that self-regulation is influenced by individuals comparing performance feedback with performance expectations. As such, it is valuable from a research perspective to examine the extent to which competence is perceived to develop over time from both student and supervisor perspectives.
Method Participants
Participants were drawn from the commencing cohorts for the Master of Organizational Psychology degree at an Australian university from 2011 to 2019. Entry into the degree is competitive and requires the completion of an accredited four-year undergraduate sequence in psychology. The Master’s degree is typically completed across two years full-time or four years part-time and involves approximately equal parts coursework, research thesis, and work placements. During their degree, students were required to complete 1,000 hours across three (59% of students) or four (41% of students) work placements commencing from semester 2 in their first year for full-time students. To ensure breadth of experience, students needed to complete each placement at a different organization. As a result, students almost always had different supervisors for each of their placements (for detail on placement allocation processes, see the online supplement). The current study received ethics approval from the Faculty of Health Human Ethics Advisory Group at the first author's university.
DEVELOPMENTAL ASSESSMENT CENTERS 6
Students (N = 157; 63% female; 94% domestic students) completed the developmental assessment center and consented for their data to be used for research purposes. Most students entered the Master’s degree shortly after completing their undergraduate studies (69%), while the remainder were classified as mature age. Mature age students typically had several years of relevant work experience that aligned with the aims of the degree. Overall, sample sizes were 157 for analyses of the assessment center data, 152 for analyses involving assessment center data and at least one placement, and 141 for analyses involving assessment center and complete placement data. The sample of 152 students, which was used for multilevel analysis, completed a total of 501 placements. This included 152 different organizations. Only 14 organizations were used more than 11 times. The most any organization was used was 27 times. Organizations included small (15%), medium (27%), and large (10%) corporate consulting firms as well as organizations with in-house organizational psychology roles in the following sectors: financial/insurance organizations (9%), education and training (9%), health care and social assistance (7%), public administration and safety (6%), arts and recreation services (4.2%), information media and telecommunications (3%), and transport, postal and warehousing (3%). Placements were supervised by 214 different supervisors, and only 12 supervisors supervised 8 or more students overall.
Procedure Our overall approach to student development was informed by Intentional
Change Theory (Boyatzis, 2008; Leonard, 2008; Passarelli et al., 2018) which asserts that professional development involves (a) understanding the ideal self, (b) comparing the actual and ideal self to identify strengths and weaknesses, (c) creating a learning plan to address these disparities, (d) obtaining experience to develop the required competencies, and (e) leveraging trusted relationships to support and foster each step in the process (Leonard, 2008). Consistent with the theory, we sought to provide accurate feedback from both the developmental assessment center and placements to facilitate self-awareness, feedback acceptance, engagement with learning goals, and targeted learning experiences.
Students completed the developmental assessment center and personality assessment at the beginning of the Master's degree. The personality assessment provided a measure of work-related preferences aligned to the developmental purpose of the initiative and was used as a supplementary tool for discussion and reflection in feedback sessions. The dimensions in the personality assessment were mapped to the competencies to provide further focus. Following the center, students received detailed feedback from the placement coordinators on their results during an individual session of approximately two hours. These sessions involved an explanation of the competencies assessed, a debrief of the individual’s performance aligned to both the competencies and exercises used, a debrief of their personality scores, and a discussion of strengths and areas for development. These discussions culminated in the design of plans to inform competency development for work placements. During this session students completed a pre-placement competency assessment and rated their self-efficacy. Finally, students completed a short anonymous survey evaluating the developmental assessment center (see Table S3 in the online supplement for details). Results were very positive (e.g., mean of 4.7 on 1

DEVELOPMENTAL ASSESSMENT CENTERS 7
to 5 scale for the item about recommending the developmental assessment center to other students).
Over the remainder of the degree, students completed three or four work placements. In correlational analyses that examine performance across time, we focus on the first, second, and final placements, but in multilevel analyses we use all placement data. Each placement was conducted in a different organization and almost always with a different supervisor. At the end of each placement, students and supervisors completed competency assessments of the student. Students also completed a measure of self-efficacy after their final placement.
Materials Developmental Assessment Center Procedure
The developmental assessment center was managed by the placement coordinators who are part of the academic teaching team for the degree. The center comprised four exercises that simulated problems commonly experienced by organizational psychologists. Up to eight participants attended each day. The exercises were designed to assess seven competencies: Deciding and Initiating Action, Interpersonal Effectiveness, Organizational Alignment and Awareness, Oral Communication, Planning and Organizing, Problem Solving and Analysis, and Written Communication. Each competency was assessed by two exercises yielding 14 competency component ratings (i.e., 7 * 2 = 14). The competencies had previously been identified as essential for successful transition into the workplace via a pilot study (Keele et al., 2010). The pilot informed minor refinements in the current study and a detailed list of the updated competencies, and their definitions are provided in Table 1. For a detailed explanation of the development of this assessment center see Keele et al. (2010) and Sturre et al. (2020).
Assessors rated student performance on each exercise in terms of 3 or 4 competencies. The 14 competency components were each measured using 4 to 10 items. These items were rated on a scale from 1 = Very strong evidence of negative behavior to 5 = Very strong evidence of positive behavior, or ‘Not Applicable’ if there was insufficient evidence. Competency component ratings were the mean of the relevant items, after excluding any ‘not applicable’ responses. Competency ratings were the average of the two relevant competency components. Overall assessment center performance scores were obtained by averaging the competency ratings. To separate exercise and competency effects, we also calculated residualized competency scores that were the residuals obtained from a regression model predicting the relevant unadjusted competency score from the average of any other competency ratings obtained from the same exercises (see online supplement for technical details).
Assessors were individuals with organizational psychology experience including placement coordinators, other academic staff, and industry volunteers. Assessors undertook two hours of training that included practical exercises. For each student, one assessor was assigned to score them in each exercise, ensuring that assessors did not measure the same competency twice. Scores for the developmental assessment center were reviewed via a data integration session in which assessors discussed and moderated their ratings. The four exercises were as follows:
In-Tray. This exercise required students to step into the role of a Senior Organizational Development Consultant who was away indefinitely. Students were

DEVELOPMENTAL ASSESSMENT CENTERS 8
instructed to prioritize and group items contained within the in-tray as well as identify the importance and urgency of these groupings along with associated actions. Students were also required to decide about two issues from the in-tray and then write a brief synopsis of results and implications of a Leadership Development Program for the organization's staff newsletter. This exercise assessed written communication, planning and organising, decision making and problem-solving skills.
Role-Play. Building on materials from the In-Tray, the student was required to meet with and present to a member of the Executive Committee (role played by an assessor). The Executive Team Member was concerned about a contentious issue relating to the upcoming Leadership Development Program. The student was required to prepare for and meet with this person to uncover relevant information to subsequently present a plan to deal with the issues of concern and answer any questions on their proposed plan. This exercise assessed oral communication, interpersonal effectiveness, decision making and organizational psychology application.
Executive Report. Using materials from the In-Tray as a basis, students were asked to prepare a written report for an Executive Committee regarding justification of the continuation of the Leadership Development Program. This exercise assessed written communication, problem solving and organizational psychology application.
Group Discussion. Students were required to work as a team under time pressure to identify the best candidate for a leadership role from an applicant shortlist and present their decision and justification to the Managing Director. Groups comprised up to eight participants. Students were given candidate information to review and discuss. This exercise assessed oral communication, planning and organizing and interpersonal skills.
Placement Performance: Student and Supervisor Ratings Placement performance was assessed using a seven-item scale where each item
corresponded to the competency definitions assessed in the developmental assessment center and as outlined in Table 1 using a 7-point scale ranging from 1 = Very poor to 7 = Exceptional. These 7-items were averaged to provide an overall assessment of competency. Students completed a pre-placement assessment after receiving feedback on their assessment center performance. They also completed the competency assessment at the end of each placement. At the completion of each placement, placement supervisors scored student performance on each of the seven competencies as perceived at the ‘start’ and the ‘end’ of the work placement. We focus on the ‘end’ of placement ratings, but ‘start’ of placement ratings are presented in the online supplement (see Table S8). While we mostly focus on individual placements, in some instances we examine overall placement ratings, which is the average of the available placements.
Personality Personality was measured using the 206-item Saville Wave (Saville
Consulting, 2012). To align with the academic literature, the 36 Wave dimensions were mapped to the Big Five personality constructs using data contained in the Saville Wave technical manual (Saville Consulting, 2012). See online supplement for details.
Student Self-Efficacy Self-efficacy was measured as the average of the 8-item New General Self-

DEVELOPMENTAL ASSESSMENT CENTERS 9
Efficacy Scale (Chen et al., 2001), where items were rated on a scale from 1 = Strongly Disagree to 5 = Strongly Agree.
Data Analytic Approach Informed by recommendations by Rupp, Mitchell Gibbons, et al. (2006), the
validity of the developmental assessment center was assessed by examining student evaluations, the internal factor structure and reliability of the assessment center, and the capacity of the center to predict placement performance. Multilevel modelling was used to assess the predictive validity of the assessment center, (b) the improvement in placement performance over time, and (c) the decline in predictive validity over time.
Results
Psychometric Properties of the Developmental Assessment Centre Descriptive statistics, reliability, intercorrelations, and factor analytic
information for each of the 14 competency components (i.e., the two sources of exercise evidence linked to each of the seven competencies) are presented in the online supplement (see Table S1 and S2). Cronbach alphas for the competency components were good (mean alpha was .81). The average correlation between competencies was 0.31 for the same competencies across exercises, 0.69 for different competencies in the same exercises, and 0.24 for different competencies in different exercises. Exploratory factor analysis of the 14 competency components using maximum likelihood extraction and Promax rotation was conducted. The percentage of variance explained by the first seven unrotated factors were 37.2%, 15.6%, 13.0%, 11.1%, 4.2%, 3.6%, and 3.0%. The pattern of factor loadings (see Table S1 in the online supplement) shows how the four exercises largely explain the competency component scores.
To further examine the degree to which there were competency and exercise effects, a confirmatory factor analysis was performed. The model of the 14 competency components as indicator variables was estimated where each indicator loaded on two latent variables: an exercise factor and a competency factor. To ensure identifiability, all parameters within an exercise were constrained to be equal and all competency loadings were constrained to be equal (see Figure S1 in the online supplement for details). Exercise factors were also allowed to correlate. Overall, the model provided a good fit to the data (χ2 = 110.6, df = 80, CFI = .98, RMSEA = .050, SRMR = .04). In general, both the competency and the exercise effects were statistically significant (p < .001). Average squared loadings indicated that exercises accounted for 68% of variance and competencies explained 4% of variance. Consistent with the broader assessment center literature, these results suggest that there was a large general performance factor. Exercise effects were also moderately large. While competency effects were present, exercises were also designed to measure specific competencies (e.g., the role play and the group discussion both capture the competency of Oral Communication), so some of the exercise effects overlap with competencies (see explanatory notes with Figure S1 in the online supplement for further discussion of this matter).
Correlations To examine the ability of the assessment center to predict placement
performance, descriptive statistics and correlations between individual difference and
DEVELOPMENTAL ASSESSMENT CENTERS 10
placement outcomes were examined (see Table 2). In relation to predicting placement performance generally, several important results emerged. First, in terms of performance outcomes, student and supervisor ratings were moderate to large (r = .44). Second, consistent with expectations, assessment center performance showed a relatively strong correlation with both student and supervisor-rated placement performance. Third, higher levels of prior experience, as indexed by being a mature-age student, were positively associated with assessment center performance (r = .27) and student and supervisor rated performance on the first placement (r = .25 and .29 respectively). Third, females tended to have higher supervisor-rated performance (r = .23), but interestingly this was not reflected in the student self-ratings (r = -.10). Fourth, personality was only weakly related to assessment center and supervisor-rated performance. Finally, while pre- and post-placement self-efficacy measures correlated with student-rated performance, they were relatively unrelated to supervisor-rated performance.
To examine the predictive validity of the assessment center and student and supervisor-rated performance across time, correlations with pre-placement (students only), first, second, and final placement were examined (see Table 2). In line with expectations, student ratings increased over time, consistent with a combination of growing confidence and capability. More importantly, supervisor-rated placement performance also increased with each placement (M = 5.48, 5.57, 5.70). Relative to supervisors, student's self-ratings increased more substantially with each subsequent placement (M = 4.87, 5.21, 5.64), and pre-placement competency ratings (M = 4.18) were well below first-placement ratings. In general, student ratings of placement performance were lower than supervisor ratings for all but the final placement. Student self-efficacy ratings also increased from the start to the end of the degree (d = 1.2, p < .001).
There were also several interesting patterns in correlations of performance over time and across raters. First, student ratings correlated most with supervisor ratings for corresponding placements. Second, student pre-placement ratings correlated only modestly with supervisor and student performance. Third, the stability of performance ratings from first to final placement showed a common longitudinal pattern whereby placements closer in time (1 with 2; 2 with 3) correlated more highly than those further apart (i.e., 1 with 3). Fourth, overall, correlations across time were higher for student ratings than for supervisor ratings.
Multilevel Models Multilevel models were estimated to further investigate the effect of
assessment center performance, time, and the time by assessment center performance interaction on placement performance (see also Table S4 in the online supplement for regression models predicting overall placement ratings). Separate models were estimated predicting student and supervisor ratings, and for each rater type, models were estimated with and without covariates (i.e., gender, prior experience, personality, and pre-placement self-efficacy). Time was coded 0, 0.5, 1 for students with three placements and 0, 0.33, 0.67, 1 for students with four placements, and thus captures an estimate of linear change from the first to last placement. Student and supervisor placement performance was z-score standardized using supervisor mean and standard deviation. Gender (0 = Male; 1 = Female) and prior experience (0 = Direct entry; 1 =

DEVELOPMENTAL ASSESSMENT CENTERS 11
Mature Age) were binary coded. Other numeric predictors were z-score standardized. To examine whether the predictive validity of the assessment center changed over time, the time by assessment center performance interaction was included.
Results of the multilevel models predicting overall student and supervisor rated placement performance are presented in Table 3. As expected, there was a significant linear effect of time indicating that performance improved over time. Larger increases in performance were observed for student ratings than for supervisor ratings. Consistent with original expectations, assessment center performance predicted placement performance. Further, the predictive validity of the assessment center declined over time as indicated by the negative value for the time by assessment center performance interaction parameter. In general, the inclusion of covariates did not alter the time effect and led to only a slight reduction in the estimate of the effect of the assessment center. Consistent with their additional professional experience, mature age students received higher supervisor ratings. Interestingly, females received higher supervisor ratings, but this was not reflected in self-ratings. It is also interesting to see that self-efficacy predicted student ratings but not supervisor ratings.
Given the potential for supervisor bias, additional analyses were conducted (see online supplement Table S9). The inclusion of rater effects slightly reduced the prediction of the assessment center, however, a mix of rater bias and underlying differences in student performance is likely to have impacted here. Given that supervisor rater effects are largely unrelated to the effects of interest (i.e., time and assessment center performance), it seems likely that most of the slight reduction in time and assessment center effects is due to removing systematic variance in performance.
Competency-Level Analysis To assess the extent to which students and supervisors agreed on the specific
profile of competencies across placements, we compared the average of the seven corresponding correlations between student and supervisor ratings to the average of the 42 correlations of different competencies between student and supervisor ratings (see Table S5 in the online supplement for the complete correlation matrix). Consistent with convergent validity, student–supervisor agreement was significantly larger for corresponding competencies (mean r =.37) than for different competencies (mean r = .22): Δr = .15, 95% CI [.13, .17] using bootstrap confidence intervals.
To examine the relationship between competencies measured in the developmental assessment center and on subsequent placements, analyses were undertaken at the competency level. Table 4 presents the average correlations for corresponding and different competencies for student and supervisor ratings for pre-placement ratings (students only) and for first, second and final placements (see Table S6 in the online supplement for a detailed breakdown). This includes correlations for both unadjusted and residualized competencies (i.e., with exercise effects partialled out). The differential pattern of correlations was clearest for the pre-placement student ratings where average correlations were much larger for corresponding than for different competencies, and this pattern was even clearer when using residualized competency ratings.
Table 5 presents the multilevel model predicting placement performance by
DEVELOPMENTAL ASSESSMENT CENTERS 12
rater type and competency from time, assessment scores, and the interaction. It shows several trends. First, it reiterates the general trends of (a) improvement over time, (b) assessment center scores predicted performance, (c) the predictive validity of assessment center scores declined over time, and (d) students rated their performance lower initially but performance increased more over time. More specifically, performance ratings and trajectories varied across competencies. In general, competencies that started lower, rose more (see Table S7 in the online supplement for competency means and standard deviations). Deciding and Initiating Action and Organizational Alignment and Awareness started with the lowest ratings but rose the most for both student and supervisor ratings.
Discussion The current study investigated the potential of a developmental assessment
center to support and predict professional competency development in a vocational education context. Several important findings emerged. First, the developmental assessment center was well received by students and demonstrated acceptable construct and predictive validity. Developmental assessment center ratings were a good predictor of initial supervisor-rated placement performance. Second, student competence generally improved across placements as rated by both the students themselves and the placement supervisors. While both student and supervisor ratings of placement performance improved over time, student ratings started lower and improved more rapidly over time to converge with supervisor ratings. Third, consistent with theories of dynamic validity, the predictive validity of developmental assessment center ratings declined over time as competency growth occurred. Fourth, competency ratings showed strong convergence across student and supervisor placement ratings, but convergence was more modest with assessment center ratings. Fifth, competencies varied in the extent to which they showed improvement over time with competencies associated with applying domain-specific knowledge and demonstrating independence showing the greatest improvement. Findings have implications for understanding the nature of professional competency development and the potential role of developmental assessment centers in supporting career development within educational settings.
Competency Development over Time Results showed that when independently assessed by placement supervisors,
overall student competence improved over time. There are several reasons to expect that these differences reflect objective improvements in student performance rather than rater biases such as leniency and halo bias (Wolf, 2015). First, each placement involved a different supervisor, such that each rating was made independently. Second, supervisors receive extensive training and are bound by ethical and professional standards. More generally, supervisors often engage with the placement program through a desire to contribute to and protect the integrity of the profession. These factors are likely to increase the motivation and ability to provide accurate ratings. Third, debriefings between university placement coordinators and supervisors indicate that whether a student was on a first, second, or final placement, was not a salient factor when supervisors provided their ratings. Rather, supervisors were focused on providing an accurate rating of observed competence independent of course stage. Finally, placements involve daily supervision and multiple activities to

DEVELOPMENTAL ASSESSMENT CENTERS 13
provide adequate opportunity to observe student behavior. Given each placement involved different organizations and different responsibilities, the performance improvements also appear to reflect generalizable competency development. This development likely reflects the cumulative effects of various elements of the students' graduate studies including placement experiences, formal coursework, and other professional development activities including the developmental assessment center.
Interestingly, students rated their own competency on their first placement lower than did supervisors, but this discrepancy disappeared by the final placement. Student competency ratings at the end of the first placement were also much higher than those obtained prior to the commencement of any placements. This contrasts with the relative leniency of self-ratings often seen in research in workplace settings (Heidemeier & Moser, 2009). Students were probably more aware of their own need for professional development at the commencement of the Master’s degree and the developmental assessment center assisted in identifying and accepting their areas for development. Students may also be particularly mindful of how their competence develops over time using their past-selves as one benchmark (Beehr et al., 2001). The motivational context of formative assessments embodied by the developmental assessment center may also make students more comfortable with being self-critical at the beginning of their educational journey. More generally, in addition to improving competence, placement and other educational experiences also provide opportunities for increasing confidence (Ackerman et al., 1995; Hitzeman et al., 2020). Despite the discrepancy of mean ratings between students and supervisors declining over time, there was no obvious change in the correlation between student and supervisor ratings over placements. If anything, the correlations between student and supervisor ratings were slightly larger for placement two and slightly lower for the final placement. This suggests that the discrepancy in means is driven by a broader difference in frame-of-reference.
While competencies generally improved over time, the magnitude of improvement varied across competencies. In general, the patterns of competency growth were broadly consistent with the idea that competencies that were lowest initially had the greatest scope for improvement. Although this finding can partially be understood in terms of differing levels of range restriction, the lower initial levels for some competencies reflect substantive differences. For instance, large improvements were seen for competencies related to working independently (i.e., Deciding and Initiating Action) and smaller improvements were seen for more entry-level skills related to teamwork and consulting others (i.e., Interpersonal Effectiveness). This likely reflects the higher levels of discipline-specific expertise, experience, and confidence required to operate independently. Similarly, competence in applying discipline-specific theoretical frameworks to workplace tasks (i.e., Organizational Alignment and Awareness) also started relatively low in the first placement and grew substantially across placements. Development of skills in applying domain-specific knowledge reflects a primary focus of the course, and students are also less likely to have developed such skills prior to commencing the course (Rupp, Snyder, et al., 2006). Interestingly, although students were harsher when rating their initial competency levels, the above-mentioned variation in the magnitude of development across competencies was consistent across student and supervisor ratings. Importantly,

DEVELOPMENTAL ASSESSMENT CENTERS 14
students and supervisors showed clear evidence of convergent validity in competency assessments with an average corresponding competency correlation (r = .42) higher than the .22 meta-analytic correlation reported in Heidemeier and Moser (2009).
Utility of Developmental Assessment Centers Results provided a rich picture of how the developmental assessment center
assessed student competencies that could inform and predict placement performance. Overall, the correlation between the developmental assessment center rating and supervisor-rated placement performance on the first placement (r = 0.29) and overall (r = 0.20) is consistent with meta-analytic estimates reported in the literature for assessment centers generally (e.g., uncorrected r = .17, Hermelin et al., 2007). Consistent with the developmental context and principles of dynamic validity (e.g. Keil & Cortina, 2001; Murphy, 1989), the ability of developmental assessment center ratings to predict supervisor-rated performance declined over time. Although some research suggests that assessment centers can maintain their predictive validity (Blair et al., 2016), declining validities seem more likely when participants are engaged in an intensive period of professional development. Students in advanced professional placement settings vary in the competencies they bring to the program, and their developmental and motivational trajectories. The culmination of these processes leads to performance measures closer in time to correlate more. This general finding was seen in the individual placement ratings, whereby performance in placement one correlated more with placement two than placement one did with the final placement. This pattern of correlations is common to many psychological processes, and is amplified when learning is occurring and the rate of improvement varies between people (Browne, 1992; Jansen & Stoop, 2001).
Interestingly, the predictive validity of developmental assessment center ratings declined more rapidly for student-assessed competencies compared with supervisor-assessed competencies. The large correlation between assessment center performance and pre-placement ratings may have been driven in part by the recency of feedback provided to students about competencies after completing the assessment center. In contrast, the supervisor-ratings may reflect the actual correlations of the competencies. Furthermore, because the supervisor for each placement varied, supervisors were unlikely to be aware of student developmental improvements outside of the specific placement. Students receive feedback from various sources over the period of their studies, including coursework assessment, informal placement feedback, and formal placement assessments that will gradually override the developmental assessment center feedback. It also seems likely, given the predictive validity of self-efficacy, that broad aspects of a students' self-concept might influence subjective biases in self-ratings.
With respect to internal structure and construct validity of the developmental assessment center, our results were consistent with previous research that has demonstrated that exercise-effects explain most of the variance and that competency-effects are small (e.g. Bowler & Woehr, 2006; Woehr & Arthur Jr, 2003). From this perspective, it is critical to choose exercises that provide a balanced representation of the desired competency domain. Finally, correlations of assessment center and placement competency ratings showed some convergence (i.e., higher correlations for corresponding competencies). This was very clear for pre-placement student ratings,

DEVELOPMENTAL ASSESSMENT CENTERS 15
which is likely explained by both the proximity in time between the measurements and feedback effects. This convergent validity became more subtle over time and was less obvious for supervisor ratings.
Practical Implications The current findings suggest that developmental assessment centers, typically
used in industry, can be effectively applied in academic settings to support professional student training. They can be well received by students and offer a high-fidelity experience that can emulate work-relevant expectations and competencies. They appear to be particularly effective when competency assessment is integrated into an ongoing process of student and supervisor rated assessment of the same competencies on placement. This ongoing delivery of feedback supports professional development and individual change. Compared to coursework subjects, learning on placements is less structured and varies based on the setting (Winchester-Seeto et al., 2010). While placements are clearly effective, accurate and consistent competency assessment is likely to increase the learning that is obtained and provide a valuable way to accommodate individual goals. Such efforts are critical given the high investment and effort involved in such programs as well as the reputational risks involved when students are externally representing a university on placement.
Limitations and Future Research Several limitations and suggestions for future research should be noted. First,
the study did not have a control group and as such the effect of the developmental assessment center on student outcomes cannot be disentangled from other elements of the Master’s degree. Nonetheless, it was well received by students and the correlations between the developmental assessment center and placement performance broadly support the validity of the feedback provided. Second, while the sample size was large given the longitudinal nature of the research, even larger samples would be beneficial. Nonetheless, data collection took place over nine years of student cohorts and the sustained use of a best-practice developmental assessment center over this time was a major undertaking. Furthermore, the longitudinal data combined with measures of both student and supervisor-rated placement performance across multiple organizations is a major strength. Third, personality assessment was mapped to the Big Five from the Saville Wave scales, which is not the same as using a standard Big Five inventory. Fourth, given the developmental focus, general intelligence was not assessed, and the improvement in competency scores over time suggests that the competencies were developable rather than stable like intelligence. Also, entry into the graduate course is highly competitive, thus cognitive ability is likely to be quite range restricted. Nonetheless, intelligence may explain some of the predictive validity of the assessment center, and it would be interesting for future research to include measures of cognitive ability. Fifth, while the current study provided a nuanced picture of how student and supervisor rated competencies developed, it would be valuable for future research to further explore the self-regulation processes related to feedback acceptance and goal setting. Finally, the study is grounded in the context of graduate organizational psychology. It shares many similarities with a range of other business-related contexts and professional training in other areas that incorporate internships. It is also analogous to the experience of some graduate programs whereby graduates are rotated around various roles in an organization. Future research could explore the

DEVELOPMENTAL ASSESSMENT CENTERS 16
applicability of the present findings to these other settings. Conclusion
The current study illustrates how competencies improve with training and experience, including the importance of high-fidelity assessment and learning experiences aligned with workplace expectations. The longitudinal examination of a baseline assessment, in combination with subsequent student and supervisor-rated competency across multiple placements, was a major strength of the current study. The research also showed how a developmental assessment center can be integrated into a professional training program and instill much needed feedback consistency and reliability into the placement curriculum. Such centers can be well received by students and can predict initial placement performance. Beyond practical measurement advantages, when integrated within the broader placement program, a developmental assessment center can support a holistic approach to student development. The current study also answers the call (e.g. Brodersen & Thornton III, 2011; Rupp, Snyder, et al., 2006) for more rigorous evaluation of assessment centers outside the traditional context of employee selection.
References Ackerman, P. L. (2007). New developments in understanding skilled performance. Current Directions in Psychological Science,
16(5), 235-239. Ackerman, P. L., Kanfer, R., & Goff, M. (1995). Cognitive and noncognitive determinants and consequences of complex skill
acquisition. Journal of Experimental Psychology: Applied, 1(4), 270-304. Ackerman, P. L., Shapiro, S., & Beier, M. E. (2011). Subjective estimates of job performance after job preview: Determinants of
anticipated learning curves. Journal of Vocational Behavior, 78(1), 31-48. Atkins, P. W., & Wood, R. E. (2002). Self-versus others' ratings as predictors of assessment center ratings: validation evidence
for 360-degree feedback programs. Personnel Psychology, 55(4), 871-904. Bashook, P. G. (2005). Best practices for assessing competence and performance of the behavioral health workforce.
Administration and Policy in Mental Health and Mental Health Services Research, 32(5-6), 563-592. Beehr, T. A., Ivanitskaya, L., Hansen, C. P., Erofeev, D., & Gudanowski, D. M. (2001). Evaluation of 360 degree feedback
ratings: Relationships with each other and with performance and selection predictors. Journal of Organizational Behavior: The International Journal of Industrial, Occupational and Organizational Psychology and Behavior, 22(7), 775-788.
Bieri, C., & Schuler, P. (2011). Cross‐curricular competencies of student teachers: a selection model based on assessment centre admission tests and study success after the first year of teacher training. Assessment & Evaluation in Higher Education, 36(4), 399-415.
Blair, C. A., Hoffman, B. J., & Ladd, R. T. (2016). Assessment centers vs situational judgment tests: longitudinal predictors of success. Leadership & Organization Development Journal, 37(7), 899-911.
Bowler, M. C., & Woehr, D. J. (2006). A meta-analytic evaluation of the impact of dimension and exercise factors on assessment center ratings. Journal of applied psychology, 91(5), 1114-1124.
Boyatzis, R. E. (2008). Leadership development from a complexity perspective. Consulting Psychology Journal: Practice and Research, 60(4), 298-313.
Brits, N. M., Meiring, D., & Becker, J. R. (2013). Investigating the construct validity of a development assessment centre. SA Journal of Industrial Psychology, 39(1), 1-11.
Brodersen, D. A., & Thornton III, G. C. (2011). An investigation of alpha, beta, and gamma change in developmental assessment center participants. Performance Improvement Quarterly, 24(2), 25-48.
Browne, M. W. (1992). Circumplex models for correlation matrices. Psychometrika, 57(4), 469-497. Buckett, A., Becker, J. R., Melchers, K. G., & Roodt, G. (2020). How Different Indicator-Dimension Ratios in Assessment
Center Ratings Affect Evidence for Dimension Factors. Frontiers in Psychology, 11, 1-15. Chen, G., Gully, S. M., & Eden, D. (2001). Validation of a new general self-efficacy scale. Organizational research methods,
4(1), 62-83. Chen, H.-C., & Naquin, S. S. (2006). An integrative model of competency development, training design, assessment center, and
multi-rater assessment. Advances in Developing Human Resources, 8(2), 265-282. Chiaburu, D. S., Sawyer, K. B., & Thoroughgood, C. N. (2010). Transferring more than learned in training: employees' and
managers'(over) generalization of skills. International Journal of Selection and Assessment, 18(4), 380-393. Deane, F. P., Gonsalvez, C., Joyce, C., & Britt, E. (2018). Developmental trajectories of competency attainment amongst clinical
psychology trainees across field placements. Journal of clinical psychology, 74(9), 1641-1652.

DEVELOPMENTAL ASSESSMENT CENTERS 17
Demerouti, E., van Eeuwijk, E., Snelder, M., & Wild, U. (2011). Assessing the effects of a “personal effectiveness” training on psychological capital, assertiveness and self‐awareness using self‐other agreement. Career development international.
Farrington-Darby, T., & Wilson, J. R. (2006). The nature of expertise: A review. Applied ergonomics, 37(1), 17-32. Garavan, T. N. (2007). Using assessment centre performance to predict subjective person-organisation (PO) fit: A longitudinal
study of graduates. Journal of Managerial Psychology, 22(2), 150-167. Gaugler, B. B., Rosenthal, D. B., Thornton, G. C., & Bentson, C. (1987). Meta-analysis of assessment center validity. Journal of
applied psychology, 72(3), 493-511. Gonsalvez, C. J., Deane, F. P., Blackman, R., Matthias, M., Knight, R., Nasstasia, Y., Shires, A., Nicholson Perry, K., Allan, C.,
& Bliokas, V. (2015). The hierarchical clustering of clinical psychology practicum competencies: A multisite study of supervisor ratings. Clinical Psychology: Science and Practice, 22(4), 390-403.
Gregory, J. B., Beck, J. W., & Carr, A. E. (2011). Goals, feedback, and self-regulation: Control theory as a natural framework for executive coaching. Consulting Psychology Journal: Practice and Research, 63(1), 26.
Heidemeier, H., & Moser, K. (2009). Self–other agreement in job performance ratings: A meta-analytic test of a process model. Journal of applied psychology, 94(2), 353.
Hermelin, E., Lievens, F., & Robertson, I. T. (2007). The validity of assessment centres for the prediction of supervisory performance ratings: A meta‐analysis. International Journal of Selection and Assessment, 15(4), 405-411.
Hitzeman, C., Gonsalvez, C. J., Britt, E., & Moses, K. (2020). Clinical psychology trainees' self versus supervisor assessments of practitioner competencies. Clinical Psychologist, 24(1), 18-29.
Humphreys, L., Crino, R., Wilson, I., & Hannan, T. (2017). A preliminary analysis of a competence assessment tool for postgraduate training programmes in clinical and forensic psychology. Clinical Psychologist, 21(3), 165-173.
International Taskforce on Assessment Center Guidelines. (2015). Guidelines and ethical considerations for assessment center operations. Journal of Management, 41(4), 1244-1273.
Jackson, D. (2018). Challenges and strategies for assessing student workplace performance during work-integrated learning. Assessment & Evaluation in Higher Education, 43(4), 555-570.
Jacobs, B., Prentice-Dunn, S., & Rogers, R. W. (1984). Understanding persistence: An interface of control theory and self-efficacy theory. Basic and Applied Social Psychology, 5(4), 333-347.
Jansen, P. G., & Stoop, B. A. (2001). The dynamics of assessment center validity: Results of a 7-year study. Journal of applied psychology, 86(4), 741-753.
Jansen, P. G., & Vinkenburg, C. J. (2006). Predicting management career success from assessment center data: A longitudinal study. Journal of Vocational Behavior, 68(2), 253-266.
Keele, S. M., Sturre, V. L., von Treuer, K., & Feenstra, F. (2010). Evaluation of the use of assessment centre methodology to enhance development planning, work placement outcomes and work readiness for postgraduate students-a pilot. Journal of teaching and learning for graduate employablity, 1(1), 45-64.
Keil, C. T., & Cortina, J. M. (2001). Degradation of validity over time: a test and extension of Ackerman's model. Psychological bulletin, 127(5), 673-697.
Klimoski, R., & Brickner, M. (1987). Why do assessment centers work? The puzzle of assessment center validity. Personnel Psychology, 40(2), 243-260.
Kuncel, N. R., & Sackett, P. R. (2014). Resolving the assessment center construct validity problem (as we know it). Journal of applied psychology, 99(1), 38-47.
Larkin, K. T., & Morris, T. L. (2015). The process of competency acquisition during doctoral training. Training and Education in Professional Psychology, 9(4), 300.
Leonard, D., C. (2008). The impact of learning goals on emotional, social, and cognitive intelligence competency development. Journal of Management Development, 27(1), 109-128.
Lievens, F., Ones, D. S., & Dilchert, S. (2009). Personality scale validities increase throughout medical school. Journal of applied psychology, 94(6), 1514.
McDowall, A., & Mabey, C. (2008). Developing a framework for assessing effective development activities. Personnel Review, 37(6), 629-646.
Meriac, J. P., Hoffman, B. J., Woehr, D. J., & Fleisher, M. S. (2008). Further evidence for the validity of assessment center dimensions: A meta-analysis of the incremental criterion-related validity of dimension ratings. Journal of applied psychology, 93(5), 1042-1052.
Murphy, K. R. (1989). Is the relationship between cognitive ability and job performance stable over time? Human Performance, 2(3), 183-200.
Passarelli, A. M., Boyatzis, R. E., & Wei, H. (2018). Assessing leader development: lessons from a historical review of MBA outcomes. Journal of Management Education, 42(1), 55-79.
Rethans, J. J., Norcini, J., Baron‐Maldonado, M., Blackmore, D., Jolly, B., LaDuca, T., Lew, S., Page, G., & Southgate, L. (2002). The relationship between competence and performance: implications for assessing practice performance. Medical education, 36(10), 901-909.
Rotthoff, T., Ostapczuk, M. S., Kröncke, K. D., Zimmerhofer, A., Decking, U., Schneider, M., & Ritz-Timme, S. (2014). Criterion validity of a competency-based assessment center in medical education–a 4-year follow-up study. Medical education online, 19(1), 1-10.

DEVELOPMENTAL ASSESSMENT CENTERS 18
Rupp, D. E., Mitchell Gibbons, A., Baldwin, A. M., Snyder, L. A., Spain, S. M., Eun Woo, S., Brummel, B. J., Sims, C. S., & Kim, M. (2006). An initial validation of developmental assessment centers as accurate assessments and effective training interventions. The Psychologist-Manager Journal, 9(2), 171-200.
Rupp, D. E., Snyder, L. A., Mitchell Gibbons, A., & Thornton III, G. C. (2006). What should developmental assessment centers be developing? The Psychologist-Manager Journal, 9(2), 75-98.
Sackett, P. R., Shewach, O. R., & Keiser, H. N. (2017). Assessment centers versus cognitive ability tests: Challenging the conventional wisdom on criterion-related validity. Journal of applied psychology, 102(10), 1435-1447.
Salas, E., & Cannon-Bowers, J. A. (2001). THE SCIENCE OF TRAINING: A Decade of Progress [Article]. Annual Review of Psychology, 471.
Saville Consulting. (2012). Wave Professional Styles Handbook Version 2.0. Sturre, V. L., von Treuer, K. M., Knight, T., & Walker, A. (2020). Using assessment centres to develop student competence:
Nine steps to success and better partnerships. Innovations in Education and Teaching International, 1-11. Tziner, A., Ronen, S., & Hacohen, D. (1993). A four‐year validation study of an assessment center in a financial corporation.
Journal of Organizational Behavior, 14(3), 225-237. Winchester-Seeto, T., Mackaway, J., Coulson, D., & Harvey, M. (2010). 'But how do we assess it?'An analysis of assessment
strategies for learning through participation (LTP). International Journal of Work-Integrated Learning, 11(3), 67-91. Woehr, D. J., & Arthur Jr, W. (2003). The construct-related validity of assessment center ratings: A review and meta-analysis of
the role of methodological factors. Journal of Management, 29(2), 231-258. Wolf, K. (2015). Leniency and halo bias in industry-based assessments of student competencies: A critical, sector-based analysis.
Higher Education Research & Development, 34(5), 1045-1059. Yeo, G. B., & Neal, A. (2004). A multilevel analysis of effort, practice, and performance: effects; of ability, conscientiousness,
and goal orientation. Journal of applied psychology, 89(2), 231-247. Bjørndal, C. R. (2020). Student teachers’ responses to critical mentor feedback: A study of face-saving strategies in teaching
placements. Teaching and Teacher Education, 91, 103047. Clynes, M. P., & Raftery, S. E. (2008). Feedback: an essential element of student learning in clinical practice. Nurse Education in
practice, 8(6), 405-411. Gonsalvez, C. J., & Freestone, J. (2007). Field supervisors' evaluations of clinical trainees: Are they reliable and valid?
Australian Psychologist, 42(1), 23-32.

DEVELOPMENTAL ASSESSMENT CENTERS 19
Table 1
List of Developmental Assessment Center Competencies, Definitions and Behavioral Descriptors Competency and Definition Behavioral Descriptors Deciding and Initiating Action: Ability to take initiative, make decisions, commit to and sustain action.
- Takes initiative and works under own direction when required - Takes responsibility for own decisions and actions - Makes decisions that may include tough choices or considered risks - Makes decisions under pressure - Initiates and sustains activity
Interpersonal Effectiveness: Ability to adapt to, understand and work with others.
- Consults others and communicates proactively when working in multi-disciplinary teams - Understands team dynamics and can adapt to different roles within a team - Builds an effective network of contacts inside and outside the organization - Manages disagreements and conflict with tact and diplomacy - Builds rapport easily - Adapts style to suit the audience and setting - Actively listens and relates to people at all levels - Demonstrates an interest in and understanding of others
Organizational Alignment and Awareness: Ability to understand organizations and how to effectively apply organizational psychology theories/ideas
- Understands the mindset of organizations and business in terms of bottom-line goals - Acts in alignment with relevant ethical frameworks and professional standards - Demonstrates an understanding of how single issues may be relevant to broader systemic issues - Aligns organizational psychology theory and practice to business outcomes - Seeks opportunities for organizational improvement - Considers the organizational context in making recommendations - Demonstrates an understanding of organizations and how they operate - Works in a way to best advance business strategy within an organization
Planning and Organizing: Effective management of time, responsibilities, and projects.
- Sets clearly defined objectives - Plans activities and projects in advance taking into account possible changing circumstances - Identifies and organizes resources needed to accomplish tasks - Meets deadlines - Manages time effectively - Prioritizes tasks effectively
Oral Communication: Communicating orally with impact and credibility.
- Speaks fluently, using appropriate language and grammar - Expresses oneself clearly when communicating opinions with colleagues and clients - Responds positively and appropriately to the reactions and feedback of others - Portrays credibility when discussing relevant information - Makes presentations with skill and confidence in all settings
Problem Solving and Analysis: Ability to solve problems by understanding, gathering, and analyzing information
- Considers the practical issues related to implementing different solutions - Considers all stakeholders/points of influence in determining and solving problems - Produces a range of workable solutions that meet the demands of the situation - Considers evidence based/best practice methods when approaching problems - Produces new ideas, approaches or insights to problems and solutions - Looks for causes of problems as well as identifying problems themselves - Breaks information into component parts, patterns, and relationships - Probes for further information and greater understanding of the problem - Makes rational judgements from the available information
Written Communication: Writing with impact and credibility.
- Avoids the unnecessary use of jargon or complicated language - Structures information to meet the needs and understanding of the intended audience - Writes convincingly in an engaging and expressive manner - Writes clearly, succinctly and in a fluent manner - Uses correct spelling and grammar

DEVELOPMENTAL ASSESSMENT CENTERS 20
Table 2
Means, Standard Deviations, and Correlations between Individual Difference and Placement Outcomes
Variable M SD 1 2 3 4 5 6 7 8 9 10 11 12 13 14 15 16 17 18 1. AC Overall Performance 3.25 .50 2. Mature Age .26 .44 .27 3. Female .63 .48 -.03 .02 4. Neuroticism -7.07 2.15 -.07 -.11 .18 5. Extraversion 10.82 2.54 .00 -.25 .04 -.34 6. Openness 1.67 1.98 .07 .28 -.38 -.26 -.01 7. Agreeableness -3.78 4.07 .01 -.16 .33 .13 -.04 -.28 8. Conscientiousness 8.66 2.79 -.14 -.23 .26 .28 -.07 -.50 .04 9. Pre-Placement Self-Efficacy 4.01 0.37 .29 .01 -.05 -.28 .19 .13 -.06 -.08 10. Post-Placement Self-Efficacy 4.46 0.39 .14 .06 .01 -.17 .12 -.05 -.01 .16 .44 Student Competency Ratings 11. Pre-Placement 4.18 0.68 .42 .24 -.06 -.20 .09 .24 -.14 -.08 .45 .26 12. Overall 5.25 0.47 .18 .19 -.10 -.17 .08 .09 -.16 .02 .31 .47 .45 13. Placement 1 4.87 0.66 .31 .25 -.19 -.13 .02 .18 -.20 -.08 .23 .25 .41 .72 14. Placement 2 5.21 0.63 .06 .09 -.04 -.15 .15 .09 -.12 -.03 .24 .34 .35 .84 .50 15. Final Placement 5.64 0.61 .02 .06 -.01 -.17 .03 -.02 -.06 .07 .22 .48 .26 .72 .20 .49 Supervisor Competency Ratings 16. Overall 5.58 0.47 .20 .21 .23 -.03 .12 -.12 .11 -.02 .00 .10 .14 .44 .27 .39 .30 17. Placement 1 5.48 0.69 .29 .29 .13 -.13 -.04 .07 -.06 -.11 -.04 .03 .17 .31 .39 .21 .09 .65 18. Placement 2 5.57 0.74 .07 .11 .17 .05 .10 -.05 .15 -.13 .05 .09 .05 .36 .13 .47 .27 .76 .30 19. Final Placement 5.70 0.71 .06 .05 .16 .04 .05 -.31 .13 .14 -.06 .08 .06 .25 .05 .11 .37 .59 .08 .30
Note. N = 141. Mature age is coded 0 = Direct entry and 1 = Mature age; Female is coded 0 = Male, 1 = Female. AC = Assessment Center. Overall student competency rating is the average of student placement ratings, which excludes pre-placement ratings. Absolute correlations greater than or equal to .17, .22, and .28 are significant at .05, .01, and .001 respectively.

DEVELOPMENTAL ASSESSMENT CENTERS 21
Table 3
Multilevel Models Predicting Student and Supervisor Rated Placement Performance Student Rated Performance Supervisor Rated Performance
Parameter Model 1 Model 2 Model 3 Model 4
Fixed Effects: B (SE) Intercept -0.95* (0.06) -1.00* (0.10) -0.14 (0.07) -0.43* (0.11)
Time (0 = First to 1 = Last) 1.01* (0.08) 1.02* (0.08) 0.30* (0.10) 0.31* (0.10) AC Performance (z-score) 0.27* (0.06) 0.20* (0.07) 0.28* (0.07) 0.25* (0.08) Time by AC Performance -0.28* (0.08) -0.28* (0.08) -0.26* (0.10) -0.25* (0.10) Mature Age (0 = Direct, 1 = Mature)
0.26 (0.13)
0.32* (0.14)
Female (0 = Male, 1 = Female)
-0.05 (0.12)
0.30* (0.12) Neuroticism (z-score)
-0.04 (0.06)
-0.01 (0.06)
Extraversion (z-score)
0.04 (0.06)
0.08 (0.06) Openness (z-score)
0.03 (0.06)
-0.06 (0.06)
Agreeableness (z-score)
-0.04 (0.06)
0.03 (0.06) Conscientiousness (z-score)
0.08 (0.06)
-0.04 (0.06)
Self-efficacy Pre-Placement (z-score)
0.15* (0.06)
-0.03 (0.06) Random Effects
Intercept (SD) 0.52 0.49 0.43 0.39 Residual (SD) 0.67 0.67 0.88 0.88 Note. Data was based on 501 placements from 152 students. AC = Assessment Center. For ease of interpretation student and supervisor performance ratings were z-score standardized using the supervisor mean and standard deviation. * p < .05

DEVELOPMENTAL ASSESSMENT CENTERS 22
Table 4
Average Correlations between Assessment Center Competencies and Placement Competency Ratings for Corresponding and Different Competencies and for Student and Supervisor Placement Ratings Pre First Second Final Student
Corresponding Competencies .42 (.28) .23 (.10) .08 (.07) .04 (.02) Different Competencies .16 (.00) .16 (.03) .02 (.00) .00 (-.01) Supervisor
Corresponding Competencies — .22 (.10) .08 (.06) .07 (.03) Different Competencies — .20 (.05) .03 (.01) .03 (.01) Note. Each cell consists of correlations using (a) unadjusted assessment competency ratings, and (b) residualized competency ratings (in parentheses).

DEVELOPMENTAL ASSESSMENT CENTERS 23
Table 5
Multilevel Models Predicting Placement Competency Ratings from Time and Assessment Center Performance Fixed Effects Random Effects
Intercept Time AC Time By AC
Intercept Residual
Outcome Variable B (SE) B (SE) B (SE) B (SE) SD SD Student Rating
Deciding & Initiating Action 4.63* (0.07) 0.88* (0.09) 0.27* (0.07) -0.30* (0.09)
0.54 0.79 Interpersonal Effectiveness 5.23* (0.07) 0.61* (0.08) 0.12 (0.07) -0.14 (0.08)
0.60 0.71
Org. Alignment & Awareness 4.67* (0.07) 0.93* (0.09) 0.24* (0.07) -0.22* (0.09)
0.50 0.78 Oral Communication 4.85* (0.06) 0.63* (0.07) 0.30* (0.06) -0.23* (0.07)
0.49 0.65
Planning & Organizing 4.96* (0.08) 0.67* (0.09) 0.12 (0.08) -0.19* (0.09)
0.68 0.75 Problem Solving & Analysis 4.94* (0.07) 0.79* (0.08) 0.22* (0.07) -0.25* (0.08)
0.50 0.73
Written Communication 4.87* (0.06) 0.67* (0.07) 0.09 (0.06) -0.08 (0.07) 0.51 0.62 Supervisor Rating
Deciding & Initiating Action 5.33* (0.07) 0.33* (0.10) 0.31* (0.07) -0.35* (0.10)
0.46 0.90 Interpersonal Effectiveness 5.73* (0.07) 0.16 (0.09) 0.18* (0.07) -0.14 (0.09)
0.42 0.78
Org. Alignment & Awareness 5.36* (0.06) 0.33* (0.09) 0.20* (0.06) -0.19* (0.09)
0.22 0.83 Oral Communication 5.40* (0.06) 0.19* (0.09) 0.24* (0.06) -0.14 (0.09)
0.33 0.78
Planning & Organizing 5.51* (0.07) 0.13 (0.10) 0.16* (0.07) -0.19 (0.11)
0.42 0.92 Problem Solving & Analysis 5.57* (0.06) 0.20* (0.10) 0.24* (0.06) -0.25* (0.10)
0.23 0.83
Written Communication 5.39* (0.06) 0.20* (0.09) 0.14* (0.06) -0.08 (0.09)
0.25 0.82 Note. AC = Assessment Center Performance; Org. = Organizational. Time is coded 0 = first placement to 1 = final placement. Assessment center performance is z-score standardized. Performance ratings are on the original 1 to 7 scale.

DEVELOPMENTAL ASSESSMENT CENTERS 24
Online Supplement for: Predicting Supervisor and Student Competency Ratings from a Developmental Assessment
Center: A Longitudinal Validation Study
Details on How Students are Allocated to Placements In general, although students seek general input and guidance from the
university placement coordinators (particularly for their first placement), students mostly self-select the placements they would like to undertake. During the individual feedback sessions following the developmental assessment center, placement coordinators encourage students to be self-driven including formulating a development plan tailored to their preferred individual learning approach/style. As part of preparing the development plan, students are encouraged to decide on whether leveraging strengths, targeting weaknesses or combination of both ideas is most appropriate for them. A placement coordinator reviews the draft plan prepared by each student and offers constructive feedback as part of quality assurance and finalizing the plan and associated ideas for placements.
With their development plan in hand, students then usually choose from a range of available placements on offer and can shortlist up to 3 to apply for. Following submission of these applications, placement organizations apply their own selection processes to choose the successful student for each placement. In this sense, placements can sometimes be competitive. However, usually there is an even distribution of placement applications across the students and many organizations often set up a waitlist for student applications so that those who may not be successful at first can attend a later placement or reapply later.
The development plan helps the student in making these application decisions, for example, choosing a placement that clearly aligns with the development plan. However, in practice, the development plan becomes especially important when students are setting up their placement work and goals in the initial weeks of their secured placement. The plan helps the student and placement supervisor shape and prioritize tasks and goals to align with the development areas required. Thus, development opportunities are then built into the placement rather than students looking for specific placements that align with their developmental areas.

DEVELOPMENTAL ASSESSMENT CENTERS 25
Details on Scoring Big Five Personality from Saville Wave Absolute correlations of greater than or equal to .35 between the Wave and the
NEO-PI R Big Five dimensions were used to assign weightings for the calculation of scores. Using these identified correlations, scores for the Big Five dimensions were computed by multiplying each corresponding WAVE dimension with the correlation value. Using this as a basis, the following formulas were applied to calculate scores for Neuroticism (-.47 x Composed, -.49 x Positive, -.44 x Change Oriented), Extraversion (+.54 x Interactive, +.59 x Engaging, +.35 x Articulate, +.37 x Positive), Openness (+.39 x Inventive, +.40 x Abstract, -.45 x Conforming), Agreeableness (-.53 x Convincing, -.51 x Challenging, -.36 x Purposeful, +.44 x Involving, +.62 x Accepting, -.35 x Dynamic, -.42 x Enterprising), and Conscientiousness (+.49 x Reliable, +.49 x Meticulous, +.61 x Organized).
Psychometric Properties of the Developmental Assessment Center
Table S1
Means, Standard Deviations, Cronbach’s Alphas and Factor Loadings for the Developmental Assessment Center Competency Components Competency Component M SD ɑ Fac1 Fac2 Fac3 Fac4 In-tray Exercise 1. Written Communication 3.19 0.72 0.88 -.05 .75 .01 .10 2. Planning & Organizing 2.90 0.80 0.85 .06 .82 .02 -.04 3. Deciding & Initiating Action 2.91 0.77 0.83 .00 .80 -.04 -.01 4. Problem Solving & Analysis 3.07 0.66 0.86 .00 .86 .04 -.02 Role-play Exercise 5. Oral Communication 3.70 0.85 0.93 .87 .04 -.02 .06 6. Interpersonal Effectiveness 3.63 0.78 0.88 .85 -.02 -.01 .05 7. Deciding & Initiating Action 3.49 0.92 0.87 .87 .02 -.03 -.06 8. Org. Alignment & Awareness 3.27 0.85 0.86 .84 -.03 .07 -.05 Executive Report Exercise 9. Written Communication 3.29 0.78 0.81 -.03 .12 .60 -.02 10. Problem Solving & Analysis 3.16 0.76 0.92 .01 -.04 1.0 -.04 11. Org. Alignment & Awareness 3.04 0.91 0.82 .02 -.03 .82 .06 Group Discussion Exercise 12. Oral Communication 3.62 0.80 0.91 .10 -.07 -.04 .82 13. Planning & Organizing 2.99 0.93 0.75 -.04 .09 -.04 .68 14. Interpersonal Effectiveness 3.38 0.78 0.88 -.06 .00 .07 .83 Note. N = 157.

DEVELOPMENTAL ASSESSMENT CENTERS 26
Table S2
Correlations within the Exercises and Between the Developmental Assessment Center Competencies (Monomethod-Heterotrait Correlations) 1 2 3 4 5 6 7 8 9 10 11 12 13 In-tray Exercise 1. Written Communication 2. Planning & Organizing .61 3. Deciding & Initiating Action .58 .70 4. Problem Solving & Analysis .70 .75 .71 Role-play Exercise 5. Oral Communication .28 .34 .29 .33 6. Interpersonal Effectiveness .24 .29 .23 .26 .81 7. Deciding & Initiating Action .19 .29 .28 .27 .74 .69 8. Org. Alignment & Awareness .20 .23 .18 .24 .73 .70 .75 Executive Report 9. Written Communication .28 .25 .22 .26 .23 .20 .13 .18 10. Problem Solving & Analysis .20 .23 .18 .24 .28 .27 .24 .31 .61 11. Org. Alignment & Awareness .16 .21 .19 .24 .29 .28 .23 .32 .52 .82 Group Discussion 12. Oral Communication .25 .15 .17 .19 .47 .41 .33 .34 .10 .14 .19 13. Planning & Organizing .23 .22 .19 .18 .28 .28 .28 .24 .19 .10 .17 .62 14. Interpersonal Effectiveness .22 .16 .20 .19 .34 .33 .22 .22 .12 .17 .24 .74 .60 Note. N = 157. Common competency correlations denoted in bold. Absolute correlations greater than or equal to .16, .21, and .27 are significant at .05, .01, and .001 respectively.

DEVELOPMENTAL ASSESSMENT CENTERS 27
Figure S1
Confirmatory Factor Analytic Model of 14 Competency Components
Note. Values are standardized coefficients.
Discussion of Exercise and Competency Variance Partitioning Despite the model presented in Figure S1 providing good fit to the data, we
acknowledge the inherent limitations in attempting to partition general aptitude, competency, and exercise-specific variance in assessment centers. In general, our understanding is that general aptitude, competency, and exercise performance are correlated. For instance, people with more general aptitude will also tend to on average have higher competency levels. Likewise, people with more general aptitude and higher competency levels relevant to an exercise will tend to do better on a given exercise (e.g., performance on a presentation task is informed by communication skills and general ability). Given that they are correlated, this creates a challenge of how to partition the variance in an orthogonal way (i.e., to assign a specific amount of variance to exercises or competencies). In our design, the exercises were designed to measure certain competencies. So, some of the exercise-specific variance reflects performance on an exercise that is relevant to a certain set of competencies (e.g., the group discussion was designed to elicit skills relating to oral communication, planning and organizing and interpersonal effectiveness).
Residualized Competency Scoring Procedure The following note provides details on how scores for residualized

DEVELOPMENTAL ASSESSMENT CENTERS 28
competencies were obtained. The general approach was, for each competency, to obtain the residual of a regression predicting the focal unadjusted competency scores from the average of the other competency ratings obtained from the two exercises used for scoring the focal competency. The following provides an example:
1. Obtain: Unadjusted WC = ((WC: In-Tray) + (WC: Executive Report)) / 2 2. Obtain: Exercise Correction WC = ((PO: In-Tray) + (DIA: In-Tray) +
(PSA: In-Tray) + (PSA: Executive Report) + (OAA: Executive Report) ) / 5 3. Fit: Regression model predicting Unadjusted WC from Exercise Correction WC
4. Residualized WC is the residuals of the regression model from Step 3. The above scoring algorithm was applied to all seven competencies (albeit
with the appropriate competency components) to produce the residualized competency scores.

DEVELOPMENTAL ASSESSMENT CENTERS 29
Student Evaluation of the Developmental Assessment Center Results of the student evaluations of the developmental assessment center are
presented in Table S3 (n = 115; response rate 73%). Ratings across all questions were favorable with all item means greater than 4.0 on the 1 to 5 scale. Qualitative comments suggested that students particularly appreciated the feedback and development opportunities. Sample comments include: “I can't speak highly enough of the feedback session following the [assessment center], it sparked in me a passion for reflective discussion”; “[It was] fantastic to get that level of detailed one-on-one feedback. I feel that it has really increased my self-awareness”; “[The assessment center] is a great opportunity to cement which areas to focus on”; and “[It] pushed [me] out of my comfort zone. [I] learned the competencies that are critical for success as an [organizational psychologist]”.
Table S3
Student Evaluation Results Following Developmental Assessment Centre
Item Text N M SD 1. How would you rate the general communication, administration, and
organization of the DAC process prior to the assessment day? 115 4.36 0.69
2. How would you rate the administration and organization of the DAC on the assessment day?
115 4.47 0.53
3. How would you rate the feedback/coaching session you had following the DAC?
114 4.58 0.66
4. Rate the relevance of the activities completed to your placements 115 4.29 0.75 5. How effective were the activities at providing evidence of the relevant
competencies? 115 4.24 0.77
6. How effective was the DAC process as a form of preparation/awareness building prior to starting placements?
79 4.37 0.75
7. How engaged do you feel to the development goals discussed and recorded in your Work Readiness Plan?
80 4.41 0.69
8. The DAC helped to identify specific areas which I need to focus attention on during my placements
114 4.38 0.70
9. Overall response to being involved in the DAC? 115 4.35 0.58 10. Would you recommend the DAC to other students undertaking
placements as part of their course? 113 4.65 0.65
Note. DAC = Developmental Assessment Center; Q6 and Q7 were introduced from 2013 onwards. For Q1 and Q2 responses ranged from 1 = Poor to 5 = Excellent. For Q3 and Q6 responses ranged from 1 = Not at all effective to 5 = Very effective. For Q4 and Q5 responses ranged from 1 = Not all relevant to 5 = Highly relevant. Q7, Q8 and Q10 were rated on a scale from 1 = Not at all to 5 = To a significant extent. Q9 was rated on a scale from 1 = Extremely negative to 5 = Extremely positive.

DEVELOPMENTAL ASSESSMENT CENTERS 30
Predicting Overall Placement Performance To generally examine whether assessment center performance provided
incremental prediction of placement performance, regression models were estimated predicting student- and supervisor-rated placement performance from level of experience (i.e., mature age or direct entry), gender, personality, self-efficacy, and assessment center performance. Results are presented in Table S4. Both models were statistically significant with adjusted R2 values of 12% for student-rated performance and 11% for supervisor-rated performance.
Both models highlight the importance of being a mature-age student in predicting placement performance. In the current course, being a mature age student is generally indicative of having many years of work experience that is often related to the course. Thus, it is unsurprising that mature age students commence the course with higher levels of baseline professional competence than students who are entering the program directly from their undergraduate studies and whose work experience is often limited to part-time jobs while studying and internships. This pattern can be seen in the correlation between being a mature age student and assessment center scores (r = .27). It is also interesting to note that the correlation between mature age status and performance declines over placements in similar ways to assessment center scores.
The models also suggest that self-efficacy predicts higher levels of student-rated performance but not supervisor-rated performance. Results are consistent with self-efficacy capturing student bias in how they view their own effectiveness combined with elements of self-confidence. Thus, students with high levels of self-efficacy appear to rate their own performance higher, but this appears not to be reflecting objectively assessed performance.
In the regression model predicting supervisor-rated performance, it is useful to consider why assessment center performance is no longer a significant predictor of placement performance.
First, it should be noted that the inclusion of other predictors had only a marginal effect on the strength of the association between assessment center scores and placement performance. Specifically, the bivariate correlation was .20, while the standardized beta in the regression model with covariates was only slightly lower at .16. The inclusions just happened to move the coefficient slightly below the .05 statistical significance threshold. Thus, a plausible conclusion is that the mature age effect explains a small to moderate amount of the predictive validity of the assessment center on placement performance.
Second, the regression model shown in Table S4 is focused on predicting overall performance, yet the assessment center was much better at predicting performance on the first placement compared to second and final placements. So, by aggregating across placements where the first placement is predicted well and the second and final placements are predicted weakly and non-significantly, the size of the overall effect is reduced.
Third, assessment center ratings are meant to be predicted by other participant characteristics. In particular, we expected other indicators of professional competence to correlate with assessment center scores and to explain some or all of the prediction by assessment center scores of placement performance. Mature age status appears to be a good correlate in this regard. Thus, the fact that the inclusion of mature age as a

DEVELOPMENTAL ASSESSMENT CENTERS 31
variable slightly attenuates the predictive validity of the assessment center does not detract from the validity of the assessment center. Rather, both mature age status and the assessment center are both informative measures of baseline competence.
Table S4
Standardized Regression Coefficients for Regression Models Predicting Average Student- and Supervisor-Rated Placement Performance Predictor Student-Rated
Performance Supervisor-Rated
Performance Standardized Beta (SE) Assessment Center Performance 0.06 (0.09) 0.16 (0.09) Mature Age (0, 1) 0.21* (0.09) 0.25** (0.09) Female (0, 1) -0.09 (0.09) 0.15 (0.09) Neuroticism -0.07 (0.09) 0.00 (0.09) Extraversion 0.07 (0.09) 0.19* (0.09) Openness -0.01 (0.10) -0.15 (0.10) Agreeableness -0.08 (0.09) 0.06 (0.09) Conscientiousness 0.14 (0.10) -0.04 (0.10) Pre-placement Self-Efficacy 0.26** (0.09) -0.06 (0.09) Adjusted R-Squared 0.12** 0.11** Note. N = 141. * p < .05; ** p < .01; *** p < .001

DEVELOPMENTAL ASSESSMENT CENTERS 32
Placement Competency Correlations Table S5 presents the correlations between student and supervisor ratings for
the 501 placements by competency. To assess the extent to which students and supervisors agreed on the specific profile of competencies, we compared the average of the 7 corresponding correlations between students and supervisors (i.e., .42, .44, .29, etc.) to the average of the 42 correlations of different competencies between students and supervisors. Student–supervisor agreement was significantly larger for corresponding competencies (mean r = .37) than for different competencies (mean r = .22): Δr = .15, 95% CI [.13, .17] using bootstrap confidence intervals.
Table S5
Correlations between Student and Supervisor-Rated Placement Competency Ratings
Variable 1 2 3 4 5 6 7 8 9 10 11 12 13 Student Rating
1. Deciding & Initiating Action 2. Interpersonal Effectiveness .47
3. Org. Alignment & Awareness .50 .42 4. Oral Communication .47 .55 .52
5. Planning & Organizing .52 .38 .37 .38 6. Problem Solving & Analysis .56 .43 .54 .47 .38
7. Written Communication .38 .32 .34 .41 .38 .48 Supervisor Rating
8. Deciding & Initiating Action .42 .33 .26 .20 .41 .25 .17 9. Interpersonal Effectiveness .26 .44 .18 .25 .27 .19 .14
.62 10. Org. Alignment & Awareness .24 .27 .29 .21 .21 .26 .22
.57 .57
11. Oral Communication .23 .30 .20 .30 .25 .15 .18
.57 .64 .57 12. Planning & Organizing .29 .21 .15 .15 .46 .13 .17
.68 .54 .50 .54
13. Problem Solving & Analysis .30 .24 .21 .17 .26 .34 .21
.66 .56 .64 .54 .58 14. Written Communication .21 .19 .14 .14 .24 .15 .32 .50 .51 .58 .61 .53 .55
Note. N = 501 placements. Bold correlations represent corresponding competencies. Absolute correlations greater than or equal to .09, .12, and .15 are significant at .05, .01, and .001 respectively.
Developmental Assessment Center and Placement Competency Correlations We also sought to examine whether assessment center competency ratings
aligned with student and supervisor competency ratings. Table S6 presents a detailed breakdown of the correlations for corresponding and different competencies for student and supervisor ratings for pre-placement ratings (students only) and for first, second and final placements.

DEVELOPMENTAL ASSESSMENT CENTERS 33
Table S6
Correlations of Assessment Center Competency Ratings and Student and Supervisor-Rated Placement Competency Ratings for Pre-Placement and First, Second, and Final Placements. DIA IE OAA OC PO PSA WC Student Rating Pre-Placement
Deciding & Initiating Action .39 .12 .24 .19 .26 .17 .11 Interpersonal Effectiveness .16 .42 .14 .34 .18 .02 .04 Organizational Alignment & Awareness .23 .30 .50 .31 .16 .33 .22 Oral Communication .30 .45 .27 .59 .25 .08 .14 Planning & Organizing .16 -.01 .04 .02 .25 .18 .09 Problem Solving & Analysis .10 .05 .20 .11 .11 .29 .18 Written Communication .11 .00 .11 -.04 .11 .36 .53 Student Rating First Placement
Deciding & Initiating Action .21 .22 .27 .21 .24 .18 .09 Interpersonal Effectiveness .11 .11 .07 .17 .07 .01 .02 Organizational Alignment & Awareness .14 .24 .34 .24 .11 .16 .13 Oral Communication .21 .31 .32 .42 .20 .23 .23 Planning & Organizing .13 .15 .24 .12 .14 .25 .10 Problem Solving & Analysis .15 .18 .19 .22 .17 .14 .09 Written Communication .05 .08 .03 .03 .11 .20 .27 Supervisor Rating First Placement
Deciding & Initiating Action .21 .29 .28 .30 .30 .27 .21 Interpersonal Effectiveness .10 .17 .20 .20 .13 .28 .19 Organizational Alignment & Awareness .06 .22 .19 .22 .15 .25 .23 Oral Communication .19 .24 .17 .34 .21 .30 .22 Planning & Organizing .10 .17 .15 .18 .12 .26 .11 Problem Solving & Analysis .10 .22 .13 .25 .24 .24 .16 Written Communication .09 .24 .05 .29 .16 .21 .27 Student Rating Second Placement
Deciding & Initiating Action .07 .10 .05 .18 .10 -.05 -.02 Interpersonal Effectiveness .00 .06 .02 .08 .03 -.02 .13 Organizational Alignment & Awareness .04 .10 .14 .08 .03 -.02 .00 Oral Communication .10 .18 .14 .21 .12 .06 .12 Planning & Organizing -.18 -.10 -.22 -.09 .00 -.12 -.12 Problem Solving & Analysis -.01 .09 .12 .10 .08 .03 .07 Written Communication -.10 .02 -.14 -.03 .05 -.10 .07 Supervisor Rating Second Placement
Deciding & Initiating Action .00 .02 -.05 .05 .08 .03 -.02 Interpersonal Effectiveness .00 .10 -.03 .09 .10 -.03 -.02 Organizational Alignment & Awareness .00 .12 .03 .11 .08 .05 -.06 Oral Communication .07 .23 .08 .20 .21 .06 .09 Planning & Organizing -.03 .02 -.16 .00 .11 -.02 -.11 Problem Solving & Analysis .01 .19 .07 .10 .18 .13 .06 Written Communication -.04 .02 -.17 .06 .02 -.06 .01 Student Rating Final Placement
Deciding & Initiating Action -.11 -.07 -.10 -.03 .19 -.08 -.04 Interpersonal Effectiveness -.08 -.01 -.08 .02 .03 -.16 -.05 Organizational Alignment & Awareness .04 .02 .10 .08 .09 -.04 .05 Oral Communication .01 .13 -.01 .16 .24 -.06 .02 Planning & Organizing -.05 .01 -.03 .00 .18 -.06 -.03 Problem Solving & Analysis -.01 -.04 -.04 -.04 .14 -.08 -.05 Written Communication -.03 .04 -.01 -.01 .14 -.02 .05 Supervisor Rating Final Placement
Deciding & Initiating Action -.07 .01 -.10 -.02 .13 .05 .05 Interpersonal Effectiveness -.06 .13 .06 .02 .01 .04 .07 Organizational Alignment & Awareness -.01 .05 -.05 .03 .08 .02 .09 Oral Communication -.01 .19 .01 .16 .16 .02 .07 Planning & Organizing -.09 .02 -.14 -.04 .12 .00 .08 Problem Solving & Analysis -.11 -.07 -.11 -.04 .10 .03 .10 Written Communication .06 .15 .04 .15 .10 .14 .20

DEVELOPMENTAL ASSESSMENT CENTERS 34
Descriptive Statements for Placement Competency Ratings Table S7 provides descriptive statistics for student and supervisor competency
ratings across placements. Table S7
Means and Standard Deviations of Student and Supervisor Competency Ratings Across Placements
First Placement
M (SD) Second Placement
M (SD) Final Placement
M (SD) Student Rating Deciding & Initiating Action 4.63 (1.03) 5.00 (0.99) 5.54 (0.91) Interpersonal Effectiveness 5.23 (1.02) 5.53 (0.92) 5.88 (0.85) Organizational Alignment & Awareness 4.63 (1.08) 5.17 (0.92) 5.61 (0.82) Oral Communication 4.84 (0.89) 5.17 (0.82) 5.49 (0.79) Planning & Organizing 4.95 (1.03) 5.27 (1.04) 5.64 (1.01) Problem Solving & Analysis 4.96 (1.06) 5.25 (0.86) 5.78 (0.77) Written Communication 4.87 (0.82) 5.17 (0.84) 5.55 (0.75) Supervisor Rating Deciding & Initiating Action 5.36 (1.05) 5.43 (1.00) 5.69 (1.02) Interpersonal Effectiveness 5.73 (0.89) 5.83 (0.88) 5.88 (0.88) Organizational Alignment & Awareness 5.37 (0.93) 5.53 (0.79) 5.69 (0.83) Oral Communication 5.43 (0.82) 5.45 (0.89) 5.61 (0.86) Planning & Organizing 5.51 (0.97) 5.62 (1.07) 5.66 (1.01) Problem Solving & Analysis 5.59 (0.95) 5.64 (0.85) 5.80 (0.81) Written Communication 5.39 (0.87) 5.52 (0.86) 5.57 (0.85)
Supervisor Start and End of Placement Ratings
Table S8 presents descriptive statistics and correlations for the start of placement ratings (supervisors only) and compares these to end of placement ratings. It shows how supervisor ratings for start and end of placement were very high (r's = .78, .84, .78, respectively). Supervisor-rated performance was also substantially higher at the end of a given placement compared to the beginning of that placement and ratings generally increased over the course of placements; the interaction between these two effects was small. This was assessed by conducting a 2 (stage: start versus end of placement) by 3 (time: placement 1, 2, or final) repeated measures ANOVA which showed a significant main effect of stage, F (1, 138) = 923.7, p < .001, and a linear effect of time, F (1, 138) = 12.4, p < .001, and an interaction of linear time and stage p = .045.
In summary, supervisor ratings of placement performance increased much more within placements than across placements. Specifically, the improvement in supervisor ratings within each placement comparing initial and final ratings was large (approximately d = 1.0), whereas the improvement from the first placement to the final placement was moderate (approximately d = .30). Presumably, when supervisors rate initial and final student performance on a given placement, they focus more on the role-specific improvements that occur. This finding could be linked to supporting placement processes. For example, at the start of any placement, the student, placement supervisor and university placement coordinator always meet to discuss,
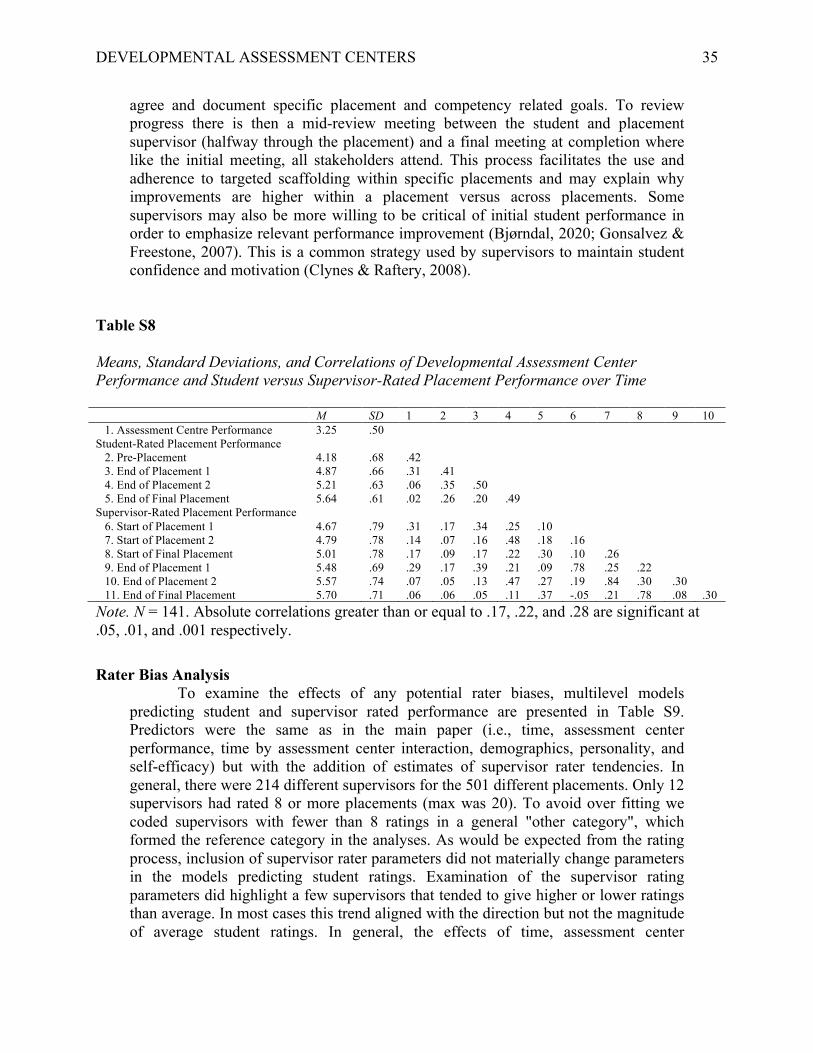
DEVELOPMENTAL ASSESSMENT CENTERS 35
agree and document specific placement and competency related goals. To review progress there is then a mid-review meeting between the student and placement supervisor (halfway through the placement) and a final meeting at completion where like the initial meeting, all stakeholders attend. This process facilitates the use and adherence to targeted scaffolding within specific placements and may explain why improvements are higher within a placement versus across placements. Some supervisors may also be more willing to be critical of initial student performance in order to emphasize relevant performance improvement (Bjørndal, 2020; Gonsalvez & Freestone, 2007). This is a common strategy used by supervisors to maintain student confidence and motivation (Clynes & Raftery, 2008).
Table S8
Means, Standard Deviations, and Correlations of Developmental Assessment Center Performance and Student versus Supervisor-Rated Placement Performance over Time M SD 1 2 3 4 5 6 7 8 9 10 1. Assessment Centre Performance 3.25 .50 Student-Rated Placement Performance 2. Pre-Placement 4.18 .68 .42 3. End of Placement 1 4.87 .66 .31 .41 4. End of Placement 2 5.21 .63 .06 .35 .50 5. End of Final Placement 5.64 .61 .02 .26 .20 .49 Supervisor-Rated Placement Performance 6. Start of Placement 1 4.67 .79 .31 .17 .34 .25 .10 7. Start of Placement 2 4.79 .78 .14 .07 .16 .48 .18 .16 8. Start of Final Placement 5.01 .78 .17 .09 .17 .22 .30 .10 .26 9. End of Placement 1 5.48 .69 .29 .17 .39 .21 .09 .78 .25 .22 10. End of Placement 2 5.57 .74 .07 .05 .13 .47 .27 .19 .84 .30 .30 11. End of Final Placement 5.70 .71 .06 .06 .05 .11 .37 -.05 .21 .78 .08 .30 Note. N = 141. Absolute correlations greater than or equal to .17, .22, and .28 are significant at .05, .01, and .001 respectively.
Rater Bias Analysis To examine the effects of any potential rater biases, multilevel models
predicting student and supervisor rated performance are presented in Table S9. Predictors were the same as in the main paper (i.e., time, assessment center performance, time by assessment center interaction, demographics, personality, and self-efficacy) but with the addition of estimates of supervisor rater tendencies. In general, there were 214 different supervisors for the 501 different placements. Only 12 supervisors had rated 8 or more placements (max was 20). To avoid over fitting we coded supervisors with fewer than 8 ratings in a general "other category", which formed the reference category in the analyses. As would be expected from the rating process, inclusion of supervisor rater parameters did not materially change parameters in the models predicting student ratings. Examination of the supervisor rating parameters did highlight a few supervisors that tended to give higher or lower ratings than average. In most cases this trend aligned with the direction but not the magnitude of average student ratings. In general, the effects of time, assessment center

DEVELOPMENTAL ASSESSMENT CENTERS 36
performance, and the time by assessment center prediction were slightly reduced in magnitude in this analysis when including rater effects. Given the relatively small numbers of ratings, it seems likely that this would reflect a mix of rater bias and underlying differences in student performance. Given that supervisor rater effects are largely random effects, it seems likely that most of the reduction in time and assessment center effects is due to removing systematic variance.

DEVELOPMENTAL ASSESSMENT CENTERS 37
Table S9
Multilevel Models Predicting Student and Supervisor Rated Placement Performance Student Rated Performance Supervisor Rated Performance Parameter Model 1 Model 2 Model 3 Model 4 Fixed Effects: B (SE)
Intercept -0.92* (0.07) -0.98* (0.10) -0.06 (0.08) -0.38* (0.11) Time (0 = First to 1 = Last) 0.96* (0.08) 0.96* (0.08) 0.20* (0.10) 0.20* (0.10) AC Performance (z-score) 0.26* (0.06) 0.19* (0.07) 0.27* (0.07) 0.23* (0.07) Time by AC Performance -0.27* (0.08) -0.27* (0.08) -0.20* (0.10) -0.19* (0.10) Mature Age (0 = Direct, 1 = Mature)
0.27* (0.13)
0.33* (0.13)
Female (0 = Male, 1 = Female)
-0.03 (0.12)
0.34* (0.12) Neuroticism (z-score)
-0.03 (0.06)
-0.02 (0.06)
Extraversion (z-score)
0.03 (0.06)
0.07 (0.06) Openness (z-score)
0.03 (0.06)
-0.03 (0.06)
Agreeableness (z-score)
-0.04 (0.06)
0.04 (0.06) Conscientiousness (z-score)
0.08 (0.06)
-0.01 (0.06)
Self-efficacy Pre-Placement (z-score)
0.16* (0.06)
-0.02 (0.06) Supervisor 1 -0.19 (0.24) -0.18 (0.24) -1.32* (0.28) -1.33* (0.28) Supervisor 2 -0.05 (0.26) -0.04 (0.26) 0.62* (0.32) 0.59 (0.32) Supervisor 3 -0.04 (0.24) 0.01 (0.24) 0.31 (0.29) 0.35 (0.29) Supervisor 4 -0.16 (0.19) -0.17 (0.19) -0.28 (0.22) -0.28 (0.22) Supervisor 5 -0.18 (0.21) -0.19 (0.21) 0.24 (0.25) 0.25 (0.25) Supervisor 6 0.36 (0.23) 0.37 (0.23) 0.91* (0.28) 0.97* (0.28) Supervisor 7 0.18 (0.23) 0.19 (0.23) 0.38 (0.28) 0.36 (0.28) Supervisor 8 -0.14 (0.23) -0.17 (0.23) -0.66* (0.27) -0.66* (0.27) Supervisor 9 -0.26 (0.17) -0.25 (0.17) -0.68* (0.20) -0.69* (0.20) Supervisor 10 0.36 (0.22) 0.36 (0.22) -0.37 (0.26) -0.29 (0.26) Supervisor 11 0.14 (0.22) 0.18 (0.22) 0.45 (0.26) 0.45 (0.26) Supervisor 12 0.00 (0.27) 0.01 (0.27) -0.44 (0.32) -0.47 (0.32) Random Effects
Intercept (SD) 0.53 0.50 0.46 0.42 Residual (SD) 0.67 0.67 0.82 0.82 Note. 501 placements, 152 students. AC = Assessment Center Performance. For ease of interpretation student and supervisor performance ratings were z-score standardized using the supervisor mean and standard deviation. * p < .05


