Embed Size (px)
Citation preview
.
Dharmapuri District Central Co-operative Bank,
Dharmapuri,
Tamil Nadu .
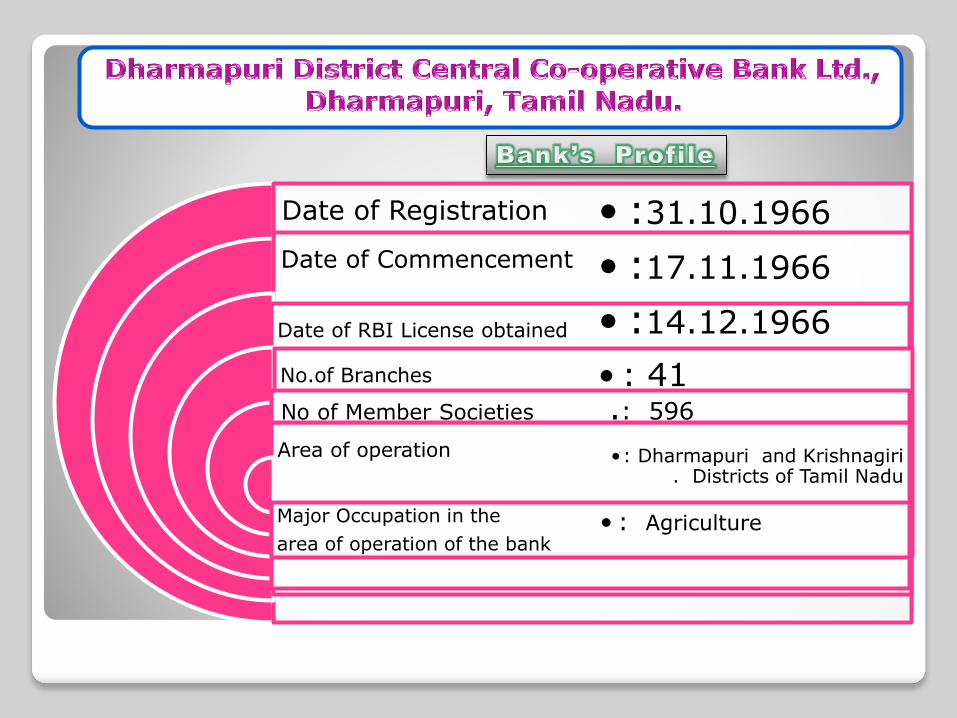
Date of Registration
Date of Commencement
Date of RBI License obtained
No.of Branches
Area of operation
Major Occupation in the
area of operation of the bank
• :31.10.1966
• :17.11.1966
• :14.12.1966
• : 41
•: Dharmapuri and Krishnagiri . Districts of Tamil Nadu
• : Agriculture
No of Member Societies .: 596
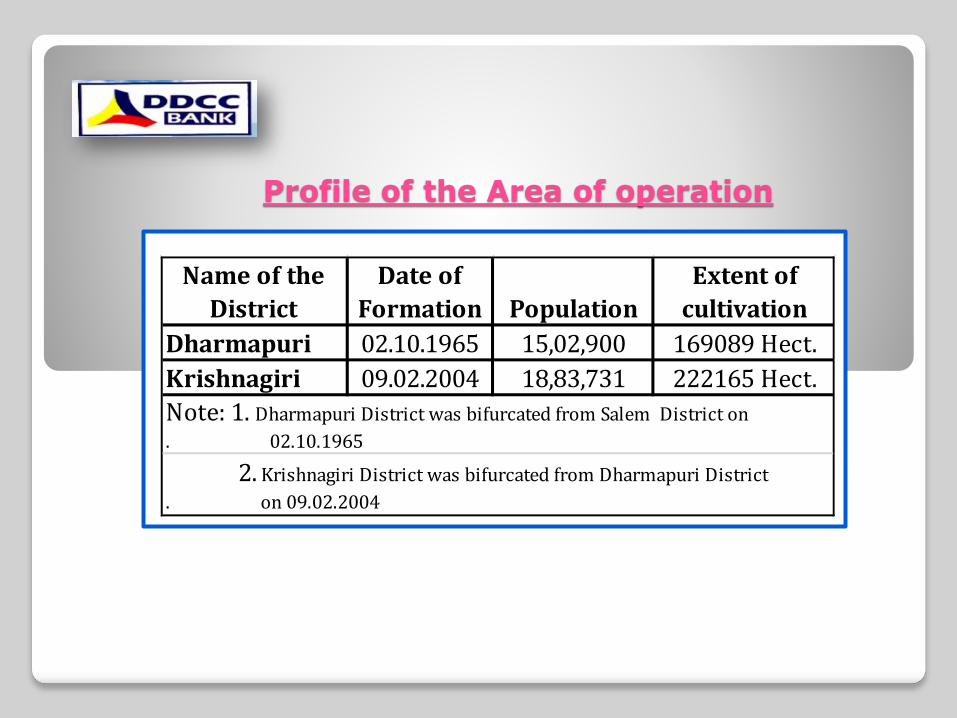
Profile of the Area of operation
Name of the
District
Date of
Formation Population
Extent of
cultivation
Dharmapuri 02.10.1965 15,02,900 169089 Hect.
Krishnagiri 09.02.2004 18,83,731 222165 Hect.
Note: 1. Dharmapuri District was bifurcated from Salem District on
. 02.10.1965
2. Krishnagiri District was bifurcated from Dharmapuri District
. on 09.02.2004
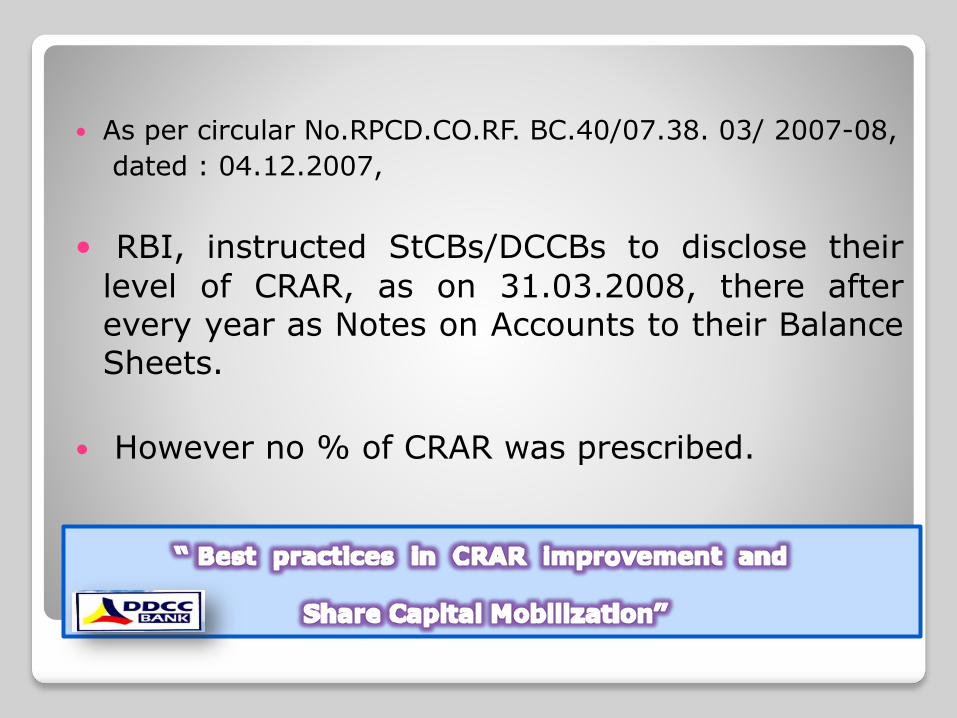
As per circular No.RPCD.CO.RF. BC.40/07.38. 03/ 2007-08,
dated : 04.12.2007,
RBI, instructed StCBs/DCCBs to disclose their
level of CRAR, as on 31.03.2008, there afterevery year as Notes on Accounts to their BalanceSheets.
However no % of CRAR was prescribed.
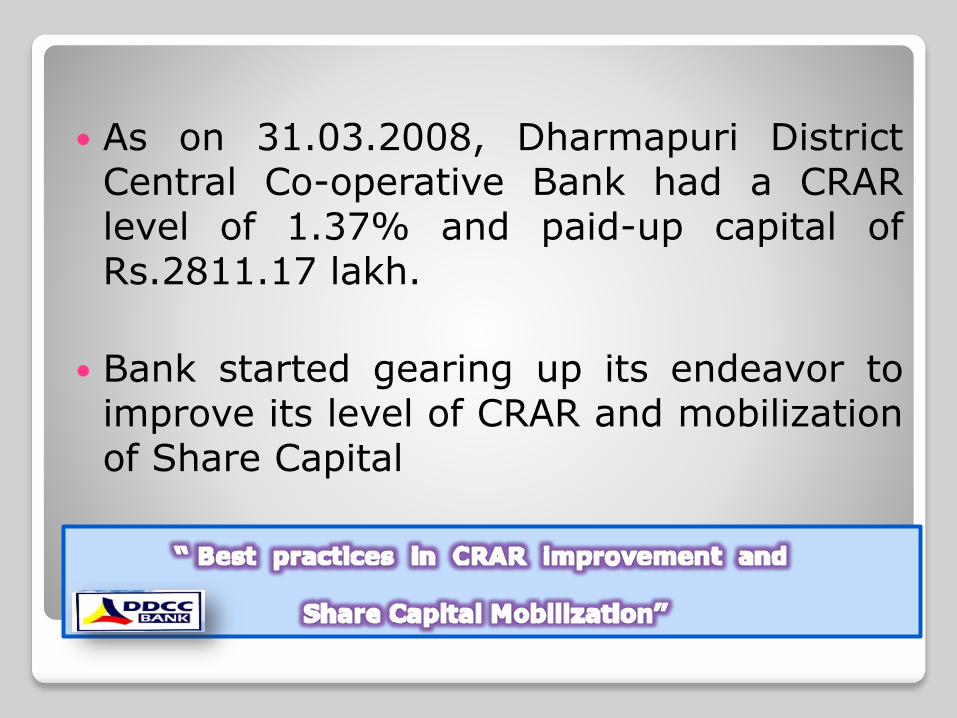
As on 31.03.2008, Dharmapuri DistrictCentral Co-operative Bank had a CRARlevel of 1.37% and paid-up capital ofRs.2811.17 lakh.
Bank started gearing up its endeavor toimprove its level of CRAR and mobilizationof Share Capital
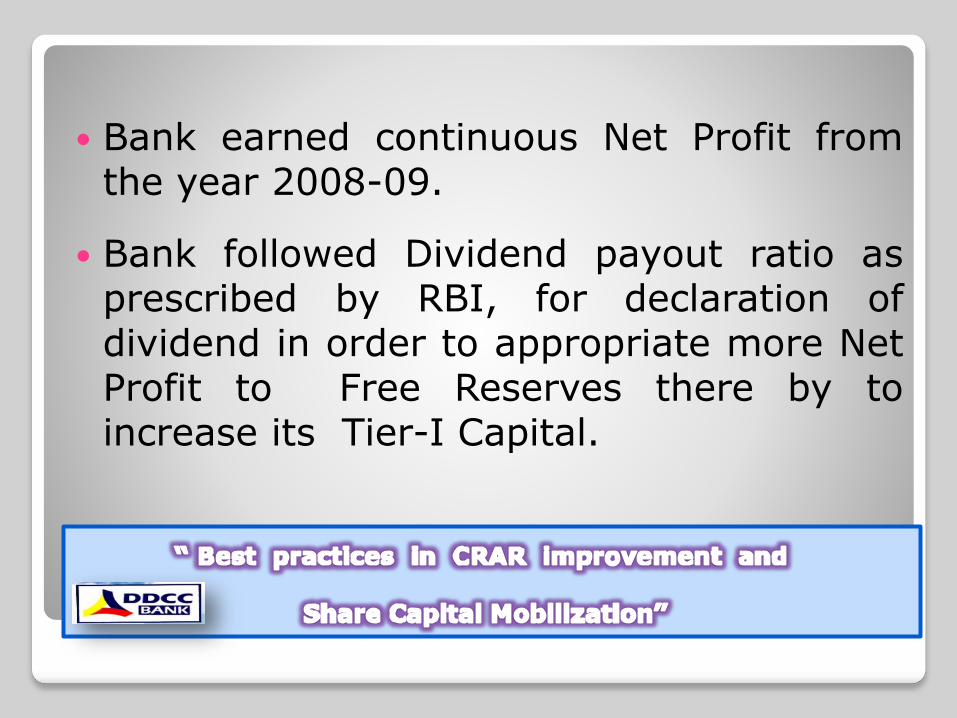
Bank earned continuous Net Profit fromthe year 2008-09.
Bank followed Dividend payout ratio asprescribed by RBI, for declaration ofdividend in order to appropriate more NetProfit to Free Reserves there by toincrease its Tier-I Capital.
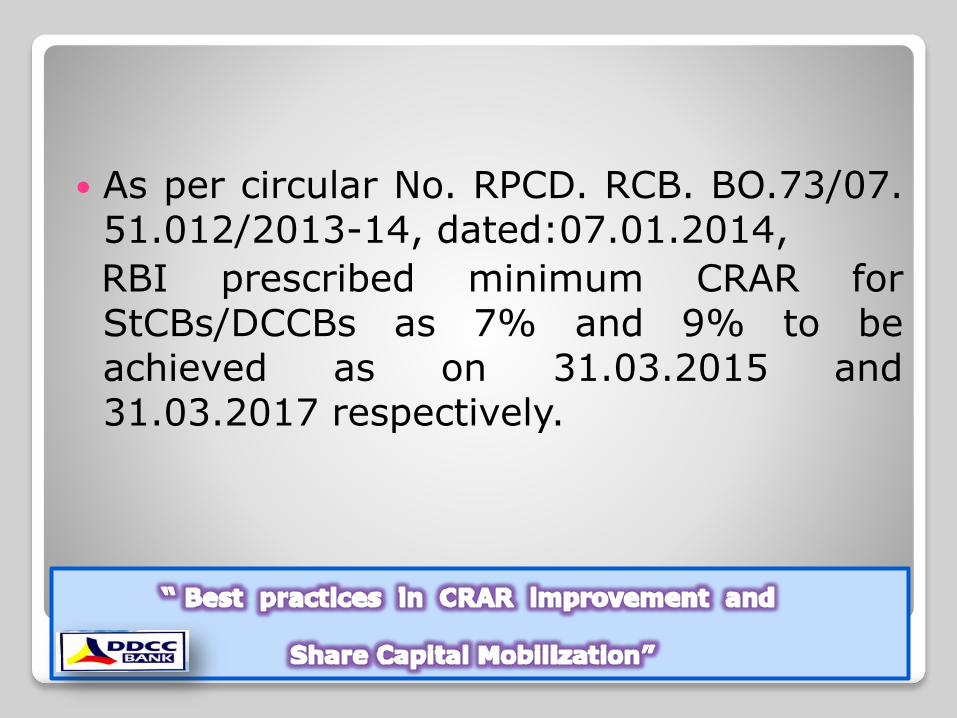
As per circular No. RPCD. RCB. BO.73/07.51.012/2013-14, dated:07.01.2014,
RBI prescribed minimum CRAR forStCBs/DCCBs as 7% and 9% to beachieved as on 31.03.2015 and31.03.2017 respectively.
Dharmapuri DCC Bank’s
Success Story
1.Under STCCS revival package, asimplemented by Govt. of India, Bank’sshare of loss Rs. 1253.62 lakh, as arrivedat, in the Special Audit carried out for thispurpose was debited to Profit and Lossaccount and appropriated to capitalaccount to improve the Tier-I capital ofthe Bank.
2. Share linking to borrowings of PACSs from thebank was enhanced from 6.00% to 8.33% toaccelerate the mobilization of Share Capital.Thus, Share Capital of Rs.1748.96 lakh asmobilized from PACSs up to 31.03.2008 hadincreased to Rs.2895.01 lakhs as on 31.03.2017.
3. Similarly Associate member fee of Rs.5/-collected from individuals to avail various loansfrom the bank was enhanced to Rs.50/- and thesame was capitalized instead of treating them asmiscellaneous income, as it was accounted in theprevious years.
4. Keeping major portion of CRR in the formof cash in chest, instead of keeping in currentaccount of other banks, to minimize Riskweight on the portion of Bank balances.
5. Total required SLR investments made inthe form of Govt. securities, to minimize Riskweight on the other form of investments, likeFixed deposits in scheduled banks.
6. Bank had diversified its lending portfolio toNon-Farm Sector (NFS), especially issuedmore loans to Employees Thrift & CreditSocieties (EMPCS). Hence, the Share Capitalof Rs.737.33 lakhs mobilized from EMPCS upto 31.03.2008, had increased to Rs.4230.27lakh as on 31.03.2017.
7. Issued more jewel loans to the loan valueof below Rs.1.00 lakh to assign 50% Riskweight on the jewel loan exposure.
..2.-2-
8. Bank used only 20% of its Net Profit fordeclaration of dividend in order to controlthe quantum of distributed profit with aview to preserve/appropriate majorportion of Net Profit in the Free Reservesof the Bank, so as to increase the level ofTier-1 Capital.
..2.-2-
0
1000
2000
3000
4000
5000
6000
7000
8000
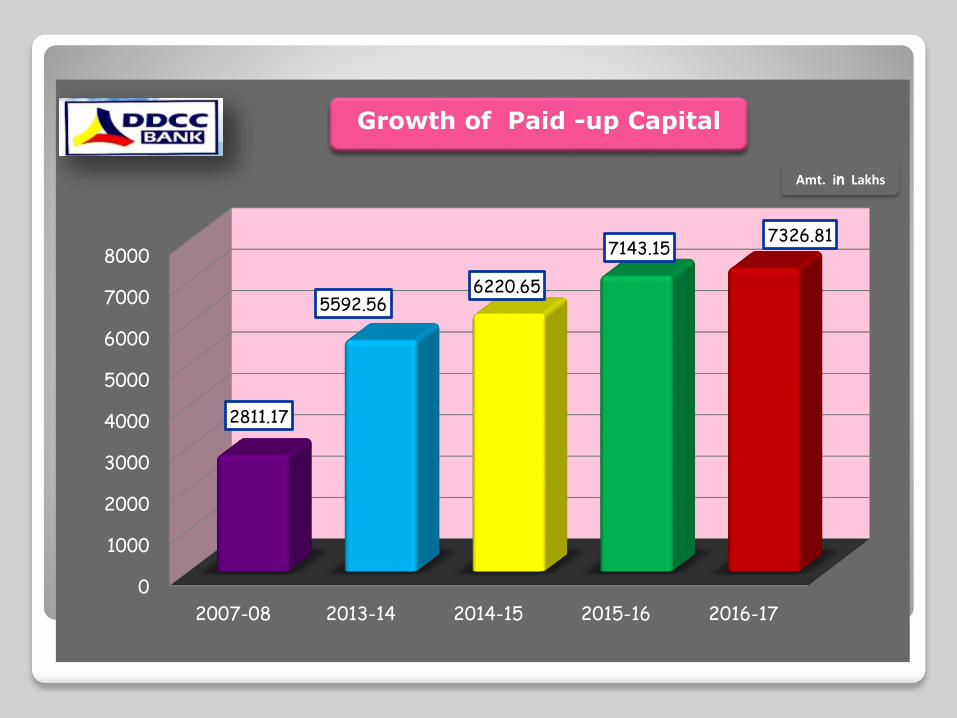
2007-08 2013-14 2014-15 2015-16 2016-17
2811.17
5592.566220.65
7143.157326.81
Growth of Paid -up Capital
Amt. in Lakhs
0
2000
4000
6000
8000
10000
12000
14000
16000
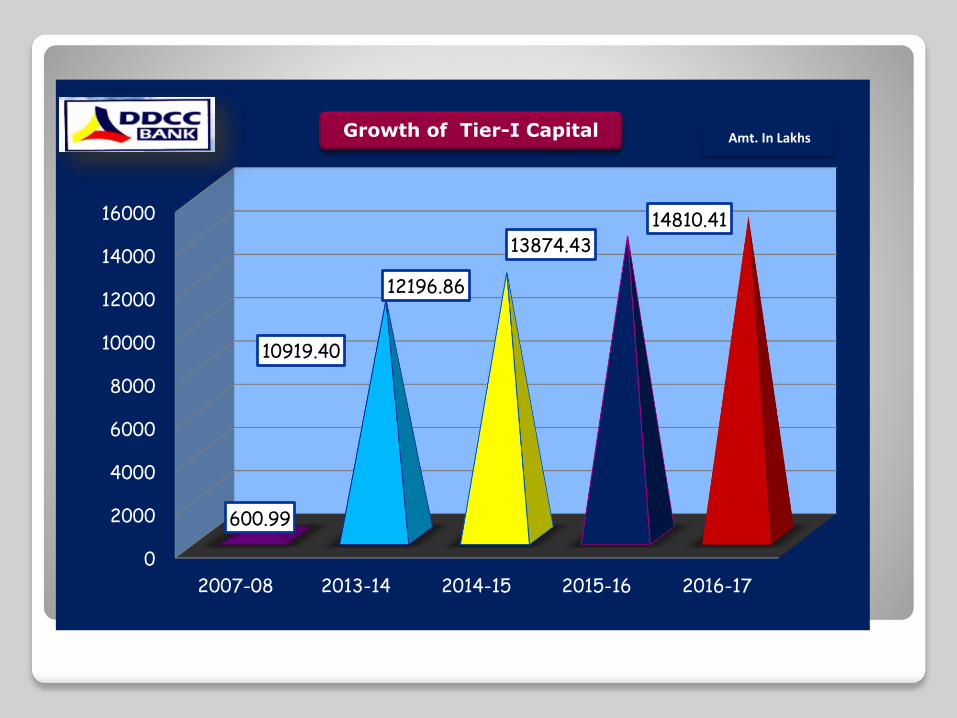
2007-08 2013-14 2014-15 2015-16 2016-17
600.99
10919.40
12196.86
13874.4314810.41
Growth of Tier-I Capital Amt. In Lakhs
0
200
400
600
800
1000
1200
1400
1600
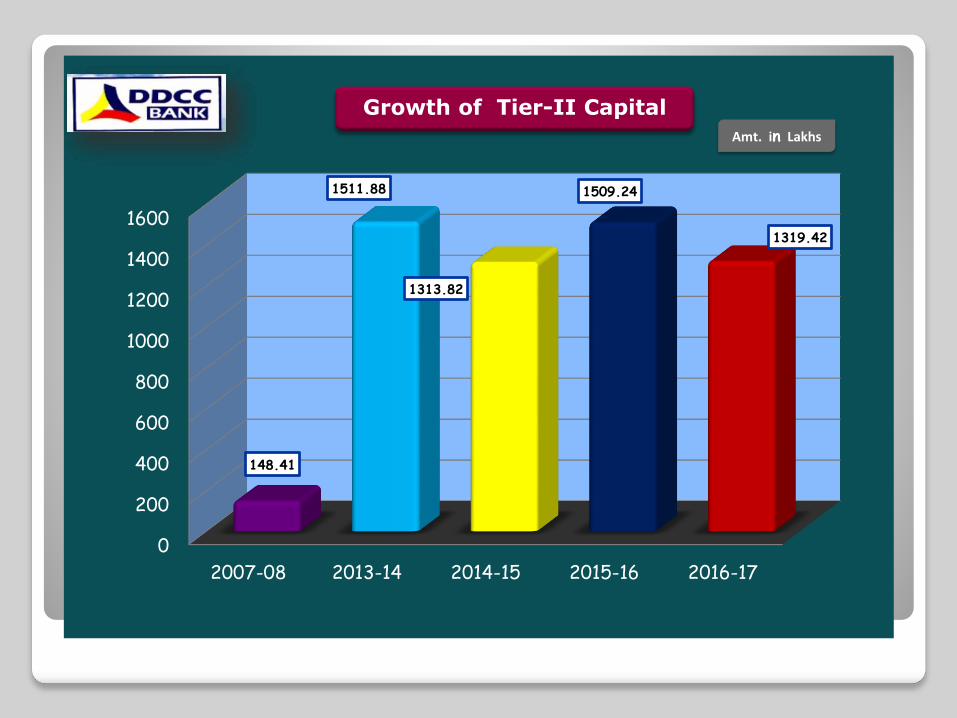
2007-08 2013-14 2014-15 2015-16 2016-17
148.41
1511.88
1313.82
1509.24
1319.42
Growth of Tier-II Capital
Amt. in Lakhs
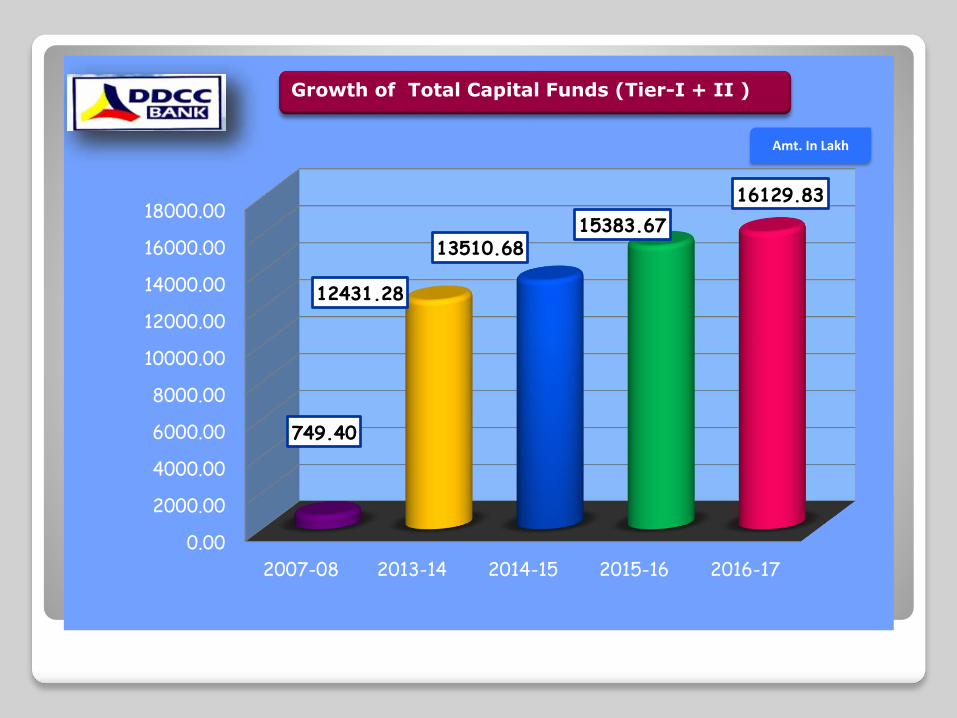
0.00
2000.00
4000.00
6000.00
8000.00
10000.00
12000.00
14000.00
16000.00
18000.00
2007-08 2013-14 2014-15 2015-16 2016-17
749.40
12431.28
13510.6815383.67
16129.83
Growth of Total Capital Funds (Tier-I + II )
Amt. In Lakh
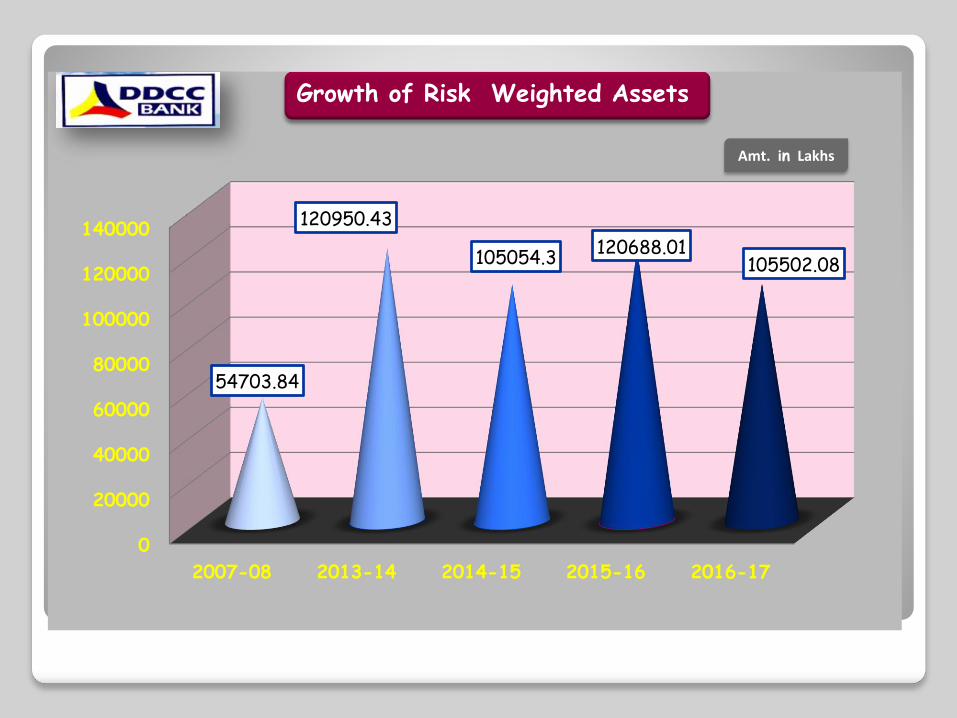
0
20000
40000
60000
80000
100000
120000
140000
2007-08 2013-14 2014-15 2015-16 2016-17
54703.84
120950.43
105054.3120688.01
105502.08
Growth of Risk Weighted Assets
Amt. in Lakhs
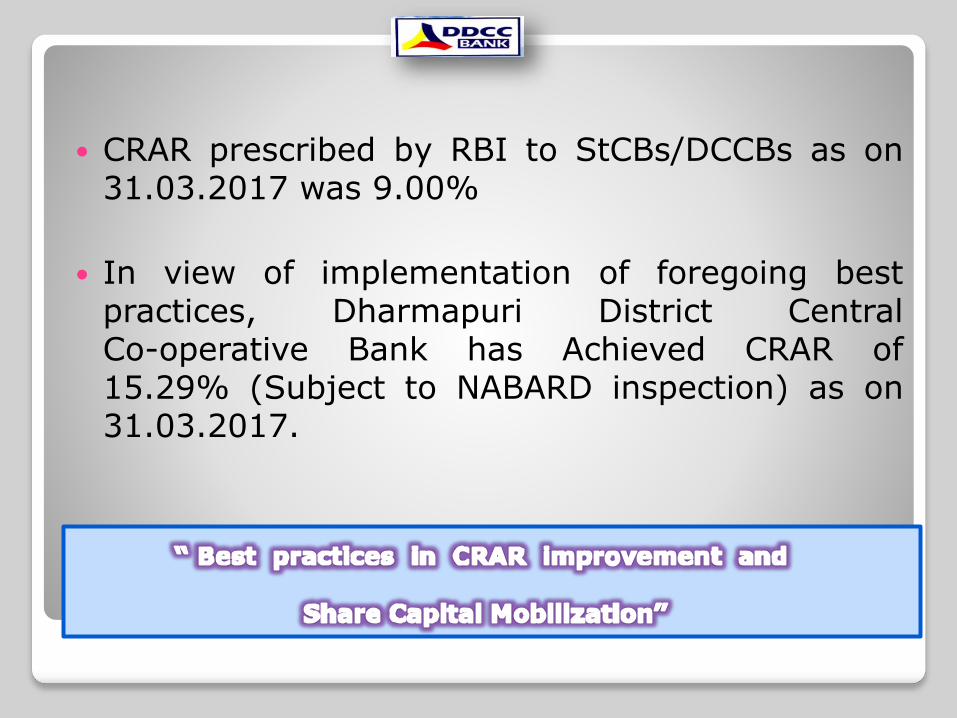
CRAR prescribed by RBI to StCBs/DCCBs as on31.03.2017 was 9.00%
In view of implementation of foregoing bestpractices, Dharmapuri District CentralCo-operative Bank has Achieved CRAR of15.29% (Subject to NABARD inspection) as on31.03.2017.
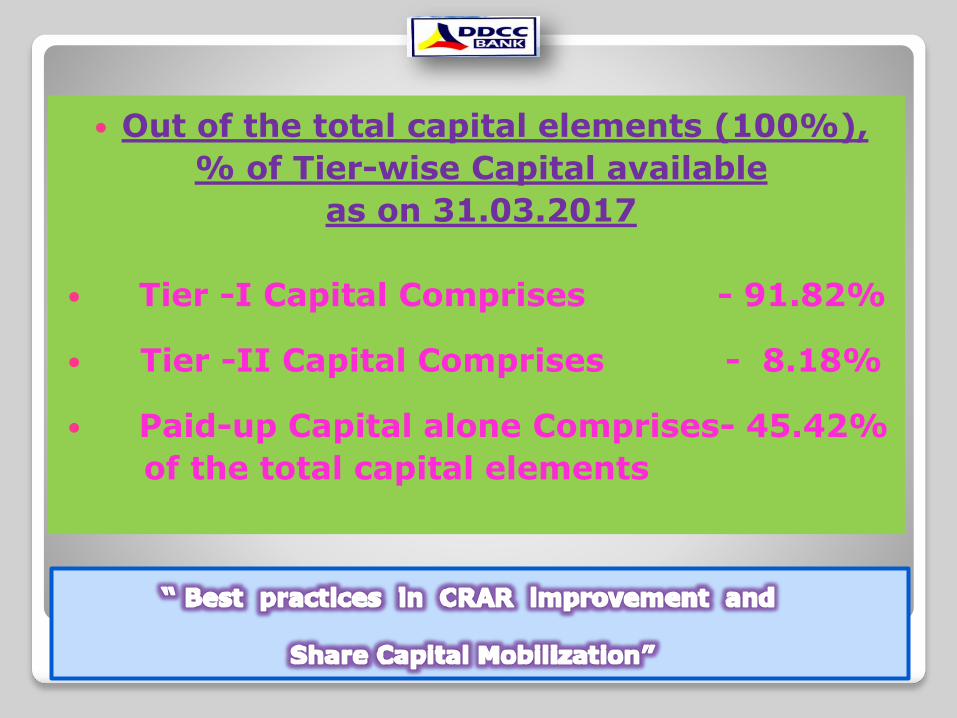
Out of the total capital elements (100%),
% of Tier-wise Capital available
as on 31.03.2017
Tier -I Capital Comprises - 91.82%
Tier -II Capital Comprises - 8.18%
Paid-up Capital alone Comprises- 45.42%
of the total capital elements
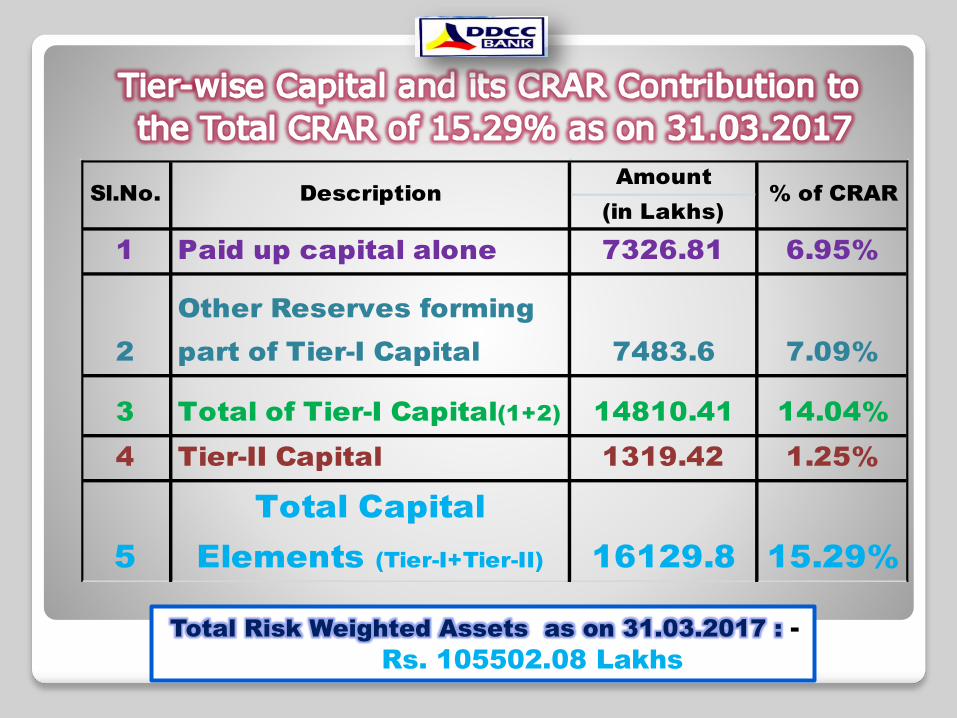
Amount
(in Lakhs)
1 Paid up capital alone 7326.81 6.95%
2
Other Reserves forming
part of Tier-I Capital 7483.6 7.09%
3 Total of Tier-I Capital(1+2) 14810.41 14.04%
4 Tier-II Capital 1319.42 1.25%
5
Total Capital
Elements (Tier-I+Tier-II) 16129.8 15.29%
Sl.No. Description % of CRAR
Total Risk Weighted Assets as on 31.03.2017 : -
Rs. 105502.08 Lakhs
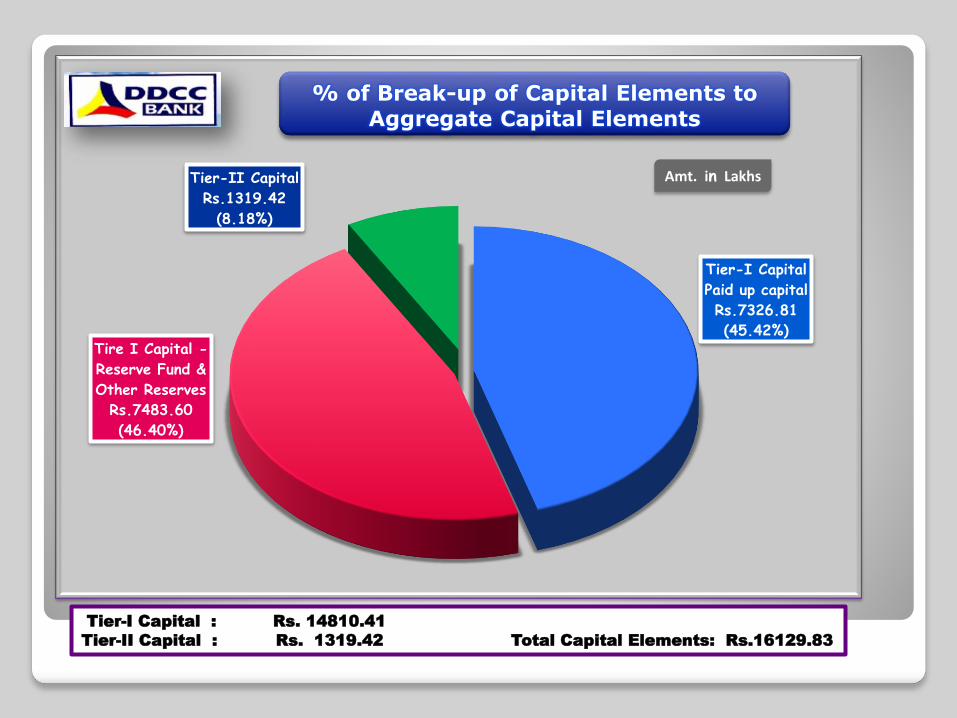
Tier-I Capital
Paid up capital
Rs.7326.81
(45.42%)Tire I Capital -
Reserve Fund &
Other Reserves
Rs.7483.60
(46.40%)
Tier-II Capital
Rs.1319.42
(8.18%)
% of Break-up of Capital Elements to Aggregate Capital Elements
Amt. in Lakhs
Tier-I Capital : Rs. 14810.41
Tier-II Capital : Rs. 1319.42 Total Capital Elements: Rs.16129.83
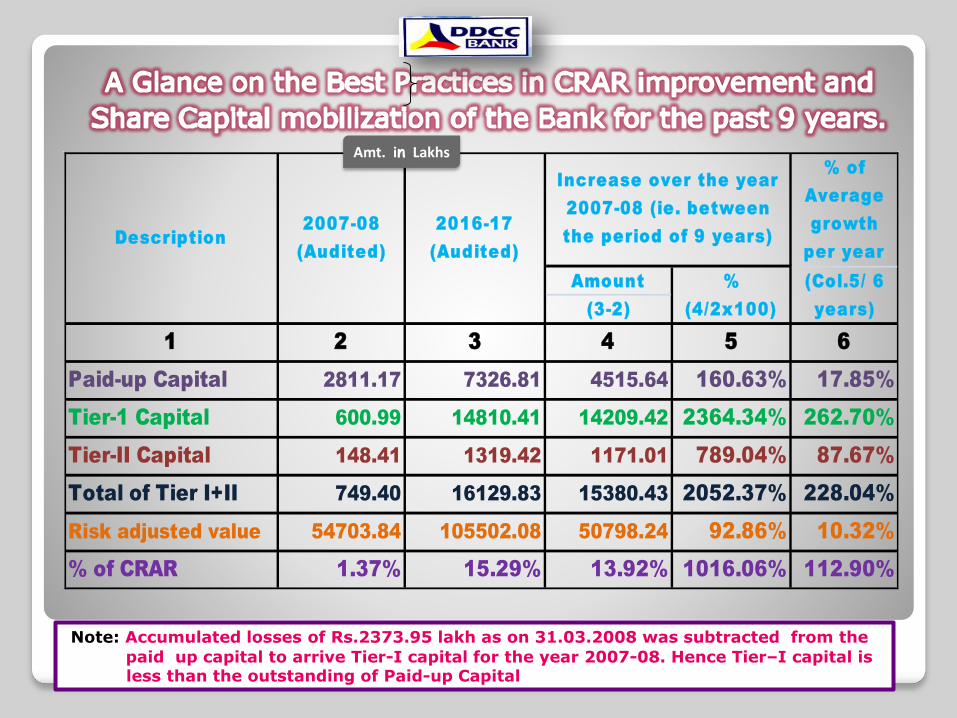
Note: Accumulated losses of Rs.2373.95 lakh as on 31.03.2008 was subtracted from the .
paid up capital to arrive Tier-I capital for the year 2007-08. Hence Tier–I capital is. less than the outstanding of Paid-up Capital
% of
Average
growth
per year
Amount
(3-2)
1 2 3 4 5 6
Paid-up Capital 2811.17 7326.81 4515.64 160.63% 17.85%
Tier-1 Capital 600.99 14810.41 14209.42 2364.34% 262.70%
Tier-II Capital 148.41 1319.42 1171.01 789.04% 87.67%
Total of Tier I+II 749.40 16129.83 15380.43 2052.37% 228.04%
Risk adjusted value 54703.84 105502.08 50798.24 92.86% 10.32%
% of CRAR 1.37% 15.29% 13.92% 1016.06% 112.90%
(Col.5/ 6
years)
Description
2007-08
(Audited)
2016-17
(Audited)
Increase over the year
2007-08 (ie. between
the period of 9 years)
%
(4/2x100)
Amt. in Lakhs
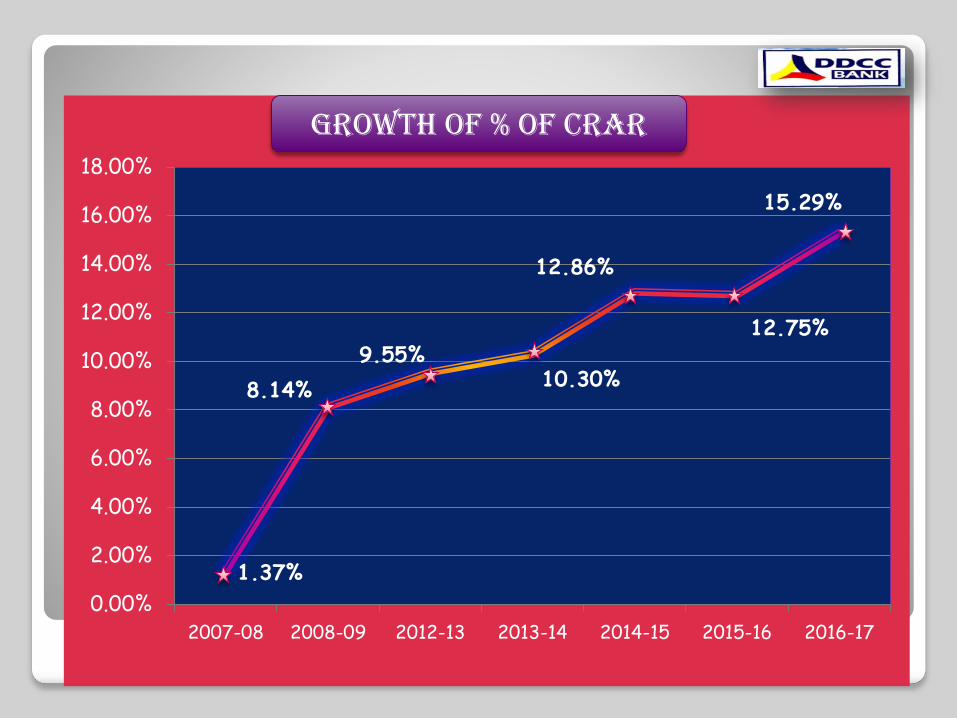
1.37%
8.14%
9.55%10.30%
12.86%
12.75%
15.29%
0.00%
2.00%
4.00%
6.00%
8.00%
10.00%
12.00%
14.00%
16.00%
18.00%
2007-08 2008-09 2012-13 2013-14 2014-15 2015-16 2016-17
GROWTH OF % OF CRAR
Thank You!
Dharmapuri District CentralCo-operative Bank Ltd.,Dharmapuri - 636 701,
Tamil Nadu.


