Embed Size (px)
Citation preview
Journal Hepatology 1999; 31: 10441052 Printed in Denmark . All rights reserved Munksgaard. Copenhagen
Copyright 6 European Association for the Study of the Liver 1999
Journal of Hepatology ISSNO168-8278
Diagnosis and grading of intrapuhnonary vascular dilatation in cirrhotic patients with contrast transesophageal echocardiography
Rocio Aller, Jose L. Maya’, Victor Moreira, Albert0 Garcia-Lledo’, Antonio L. Sanromhn, Carlos Paino2
and Daniel Boixeda
Hospital Ramdn y Cajal, Gastroenterology, ‘Cardiology and ‘Biochemistry Departments, Madrid, Spain
Background/Aims: The use of transesophageal con- trast echocardiography (TOCE) in the diagnosis of intrapuhnonary vascular dilatation (IVD) and hepato- pulmonary syndrome (HPS) needs to be studied. We tested the specificity of TOCE using traditional cri- teria and the value of a new method based on TOCE, a grading scale and a selected contrast. Methods: 1) Several solutions were tested and two were selected: 20% mannitol and 0.9% saline. 2) 71 cirrhotic patients and 20 controls were studied. Left atrium opacitication with contrast was classified into 6 degrees by TOCE. Mild and significant IVD were considered in relation to results in controls. Patients were studied with saline and mannitol-TOCE. Results were compared to transthoracic contrast echocardio- graphy (TTCE), to gas exchange abnormalities and to Child class. Results: The reproducibility of TOCE grading was excellent, (Kappa BO.9). IVD detection using TTCE, mannitol-TOCE and saline-TOCE was 29.5%, 55% (25% mild and 30% significant), and 45% (38% mild and 7% significant), respectively. The best agreement with TTCE (reference method) was obtained with manmtol-TOCE, using significant IVD as the cut point. By this criterion, 18% reached the criteria of
H EPATOPULMONARY syndrome (HPS) is defined by a clinical triad including chronic liver disease,
abnormally high alveolar-arterial oxygen difference (AaP02) and the demonstration of intrapulmonary vascular dilatation, in the absence of chronic cardiac or pulmonary disease (1,2). It is characterized by a generalized precapillary and capillary vasodilatation of
Received 8 January; revised 12 May: accepted 17 May 1999
Correspondence: Jod Luis Moya, Ramon y Cajal Hospi- tal (Cardiology Dpt), Ctra Colmenar K9100, E 28034 Madrid, Spain. Tel: 34 1 3368259. Fax: 34 1 3368259.
HPS using TTCE and 22% using mannitol-TOCE. Patients with IVD by TTCE had non-significant changes in gas exchange determinations. Patients with significant IVD by saline TOCE had lower mean PaOz levels (67.3214 vs. 79.5211 mmHg, ~~0.05) than patients without IVD. Patients with significant IVD by manmtol TOCE had higher mean AaPOz (29.3214 vs 19.729 mmHg; p<O.O05) and lower mean PaC02 levels (30.124.4 vs: 33.424.8 mmHg; ~~0.05) than patients without IVD. Severity of IVD by TOCE correlated to Child class (r=O.43;p<O.O01). Conclusions: The presence of contrast in the left atrium cannot be a criterion of IVD when TOCE is used. Our semi-quantitative scale has proved to be feasible and reproducible, presenting a good agree- ment with TTCE, and has shown better correlation with gas exchange abnormalities and Child class. Sa- line TOCE appears to be more specific in the detec- tion of hypoxemic patients with IVD, but mannitol TOCE adds sensitivity.
Key words: Cirrhosis; Contrast echocardiography; Hepatopuhnonary syndrome; Pulmonary vasodilat- ation.
the pulmonary bed (3), affecting gas exchange level. Pulmonary capillaries increase their diameter up to 50- 150 pm, from their normal range of 5 to 15 pm. This intrapulmonary vascular dilatation leads to a quick passage of blood from arteries to the venous compart- ment, thus hampering the process of its oxygenation.
The methods used to demonstrate IVD are based on solutions containing microbubbles or particles with a larger diameter than that described for normal pul- monary capillaries. At present, transthoracic contrast echocardiography (TTCE) (4-8) and Tc99m-labeled macroaggregated albumin pulmonary scanning
1044
(MAA) (9-12) are the two diagnostic tests most used in this setting. Both are based on the detection of com- paratively large particles traversing the dilated pul- monary vascular bed. Traditionally, iv injection of agi- tated or sonicated normal 0.9% saline has been used as a contrast in TTCE. It generates particles measuring 24-180 pm in diameter (4), which can be detected in the left atrium by TTCE (4-7) when the pulmonary capillaries are dilated. The established criterion for di- agnosis of HPS is the appearance of microbubbles (MB) in the left-sided cardiac chambers, but the num- ber of MB has not been quantified. MAA generates smaller MB, from 20 to 60 pm in diameter, detected in the lung using a gamma camera. This second method is more expensive and uses radioactivity. Abrams et al. (9) have demonstrated that TTCE is more sensitive than MAA for the diagnosis of IVD, and suggested its use as a screening procedure. However, the use of TTCE is limited by the quality of imaging, and several authors thought that the use of better echographic techniques such as transesophageal contrast echocar- diography (TOCE), could improve the diagnosis of in- trapulmonary vascular dilatation (IVD) and HPS (10,13,14), avoiding false negatives. The use of this new approach to the diagnosis of IVD has to be considered with caution, because the very good image quality of TOCE allows the detection of very small and very few MB in the left atrium, thus leading to the possibility of false-positive results, making the practical use of this technique difficult. Better sensitivity can also show smaller degrees of vasodilatation, with a possible con- tinuous spectrum of IVD in mild to severe degrees of liver disease. With the methods in use, we can only con- sider if IVD is or is not present, based on the detection or not of MB in the left cardiac chambers.
The aim of this study was to analyze the impact of new imaging techniques on the diagnosis of IVD, re- garding to the specificity of the use of TOCE, the use of other contrast agents, and the possibility of describ- ing a scale of IVD based on the quantification of con- trast passage to the left atrium.
Intrapulmonary vascular dilatation in cirrhosis
Materials and Methods Preliminary in vitro
one loaded with 5 ml fluid and 0.5 ml room air. This mixture was then manually pumped from one syringe to the other, repeating this maneuver 20 times, always by the same operator. A drop of the agitated fluid was immediately observed under a light microscope (20X). Five randomly selected fields were photographed. Microbubbles were measured with a micrometer, and the diameter was expressed as the mean of all measurements.
The echogenic intensity of these solutions was estimated using a mathematical approach. Microbubble size was calculated as the mean diameter of bubbles contained in each field. Microbubble echogenic intensity, as a function of bubble size, was equal to the cube of the diameter. Contrast echogenic intensity per field, that takes into ac- count both bubble size and number, was expressed as the product of MB echogenic intensity and bubble number per field. Finally, left atrium echogenic intensity produced for each substance was deter- mined as a function of the proportion of microbubbles that were able to cross pulmonary capillaries of different diameters.
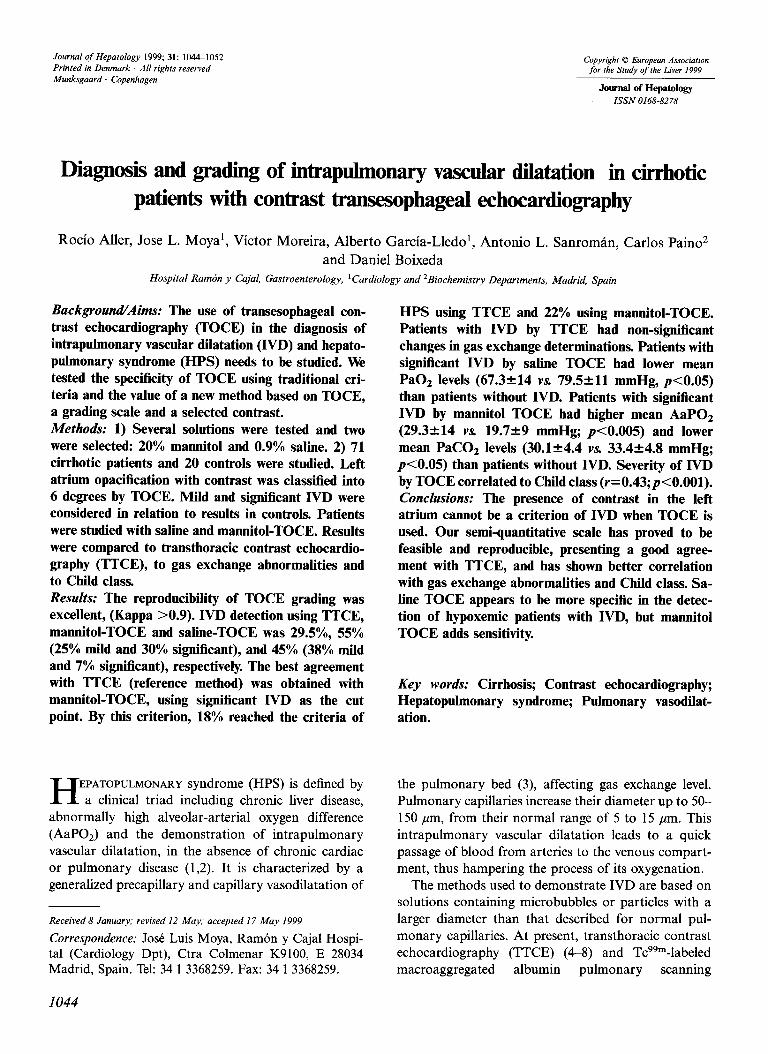
After examining the size of microbubbles generated by manual agi- tation, we obtained the following values (mean?SD): normal 0.9% saline, 35-+15 pm; 5% glucose, 33212 q; 50% glucose, 21?9 pm; 20% mannitol, 2029 pm; 50% sorbitol, 18.4210 pm; 70% sorbitol, 17.4’12 ,em; polygeline, 25?12 q; dextran 45517 pm. Character- istics of microbubbles generated by agitation of three substances are shown in Table 1 and Fig. 1. For similar IVD, saline should produce less echogenic intensity in the left atrium than mannitol or polygeline. Considering the results of this preliminary study, we selected 20% mannitol for clinical study on the theoretical basis of a better contrast than saline. Other solutions, like polygeline, should produce similar results.
In vivo study: study population Study group: Seventy-one cirrhotic patients were randomly recruited, from both the Gastroenterology Ward and the Gastroenterology Out- patients. The inclusion criteria were the following: l Diagnosis of liver cirrhosis (65% with histological diagnosis, and
35% diagnosed by conventional clinical, ultrasound and biochem- ical criteria, and clinical presentations of portal hypertension).
l Absence of cardiac or pulmonary disease able to reproduce investi- gated alterations.
l Absence of pulmonary vascular abnormalities not related to liver disease.
Control group: Twenty patients admitted to the Gastroenterology Ward were randomly recruited, according to the following criteria:
TABLE 1
Characteristics of microbubbles
Substance Size in microns Bubble echogenic intensity Number of microbubbles Contrast echogenic intensity (diameter in microns3) per field per field
0.9% saline 35?15* 72499296922 25215 18X lo5 20% mannitol 2029 12590+12600 52221 6x10’ Polygeline 25-r-12 29788238951 65229 19.5x10⁵
The echogenic intensity of a contrast is a function of the bubble size and the number of bubbles. 0.9% Saline forms large bubbles with high echogenic intensity. Polygeline forms smaller bubbles but in greater quantity. In different ways, both obtain similar echogenic intensity. * Values represent meanstSD.
1045
R Aller et al.
0 20 26 a0 36 40
Intlap- vascular size (lnicrons)
~msnnitol +rsline + potygpallna
Fig. 1. Echogenic intensity in the left atrium, as a function of intrapulmonary vascular dilatation. Contrast echogenic intensity was expressed as the product of microbubble echo- genie intensity (diameteti) and the number of bubbles that were able to cross pulmonary vessels of dtfferen t sizes. Final values are only used as a description of the behavior of dtf- ferent contrast substances in this setting. For similar vessel sizes, saline (S) should produce less echogenic intensity in the left atrium than mannitol (M) or polygeline (P), since its larger bubbles cannot cross small vessels.
Normal liver function as shown by normal liver function tests (nor- mal AST, ALT, gamma glutamyl transpeptidase and bilirubin levels) and normal abdominal ultrasound to demonstrate absence of morphological changes suggestive of liver disease or signs of portal hypertension. Absence of risk factors for liver disease (significant ethanol use, serological evidence of HBV or HCV infection, history of previous liver disease). Similar age and sex distribution to the study group. Patients and controls were informed about the intended procedures
and the aim of the study, and consent was obtained in every case, according to the specifications of the local Ethics Committee. The study protocol conformed to the ethical guidelines of the 1975 Dec- laration of Helsinki. Afterwards, TICE and TOCE were performed on each cirrhotic and control patient.
Contrast echocardiography: description of procedure We used a standard echocardiograph (Ultramarck 9, ATL, USA), with a 3.5 MHz transthoracic probe and a 5 MHz transesophageal probe. Studies were recorded on videotape for further analysis.
TOCE was performed following the standard protocol of our echo- lab. After insertion of the esophageal probe, a four-chamber view was selected, zooming on the atria1 area, and registering simultaneously bidimensional and M-mode images. Saline and mannitol were pre- pared following the previously described protocol, and then sequen- tially injected through a peripheral indwelling 20-gauge cannula. A 5- ml mannitol bolus was injected. Later, using the same amount of saline, the cycle was repeated a second time. A few seconds after each injection, echogenicity increased in the right atrium. The left atrium was then closely observed during at least five heartbeats, monitoring the early appearance of microbubbles to rule out interatrial defects. In intracardiac right-to-left shunt, the bubbles appear in the left heart chambers within three heartbeats after their appearance in the right heart chambers, whereas the interval is four to six in intrapulmonary shunts. This criterion was used to avoid intracardiac shunts. Two pa- tients were excluded due to the appearance of contrast in the left heart within less than three heartbeats. Analysis was then started. Each injection was repeated twice, once the contrast had been cleared from the left and right chambers. In case of disagreement between
the results of the two injections, the injection resulting in a more intense pass of microbubbles was considered to analysis.
For TTCE, a previously published method (4-7) was closely fol- lowed. A four-chamber apical image was obtained through a trans- thoracic approach. Then, 10 ml of saline with 0.5 ml room air, pre- pared as described before, were injected through the iv line. A second and a third injection followed. A positive result was considered when- ever microbubbles were observed in the left atrium in one or more of the three injections. Results were compared to those obtained by TOCE, in cirrhotic patients as well as in controls.
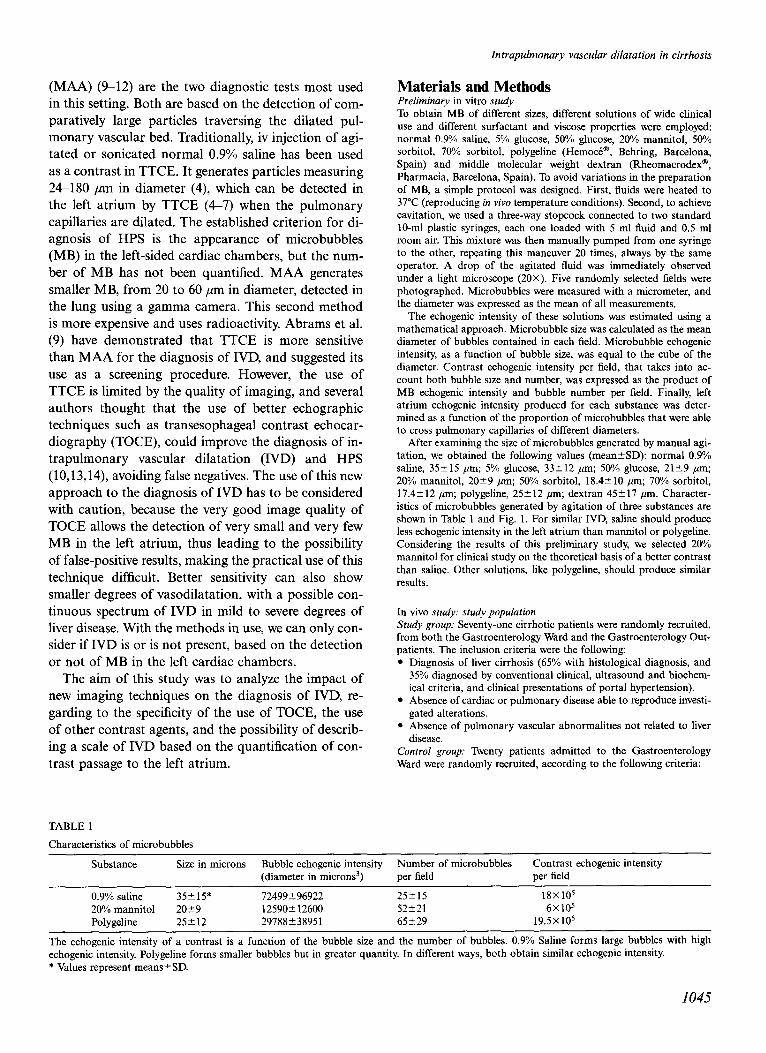
Method for grading intrapulmonary vascular dilatation Description. A numerical scale was designed, according to the inten- sity of the echographic register obtained during the maximal intensi- fication of left atria1 echogenicity, as compared to the simultaneous right atria1 image (Fig. 2). The evaluation of echogenicity in cardiac chambers was subjective. The method used to describe the degrees of echogenicity was made by considering: the number of MB and the intensity of gray scale originated by the contrast in the left atrium: Grade 1, no microbubbles in the left atrium. Grade 2, a few isolated bubbles without changes in the echogenicity of the atrium. Grade 3, a sizeable number of isolated bubbles without changes in the echogenicity of the atrium. Grade 4, a large amount of bubbles that result in a local change of left atria1 chamber echogenicity. Grade 5, extensive bubbles changing left atria1 echogenicity, but with a less dense signal than in the right atrium. Grade 6, the same amount of MB in both atria. Echogenicity of both atria reaches an equilibrium. Percentile 85 in the group of controls was employed to define mild IVD and percentile 95 to define significant IVD.
The value used to diagnose HPS was the one that agreed best with the result of TTCE.
Validation. The grading method, as described above, was validated by examination of its reproducibility. First, the intrinsic reproducibil- ity was examined by comparing the results obtained after the first and the second injection of each substance. Second, intraobserver repro- ducibility was measured by assessing the concordance resulting from a two-step blind review of each register performed by the same ob- server. Third, interobserver reproducibility was assessed by blind comparison of the results obtained by both observers in the interpre- tation of each register. We did not compare two studies of the same patient performed at different times for ethical reasons.
Arterial blood gas (ABG) A sample of arterial blood was obtained in each patient at the time of the echocardiographic study by puncture of the radial artery of the left arm, following the standard technique, in supine position and breathing room air. PaOz, PaCOz were determined by selective elec- trodes (IL 16/40 ph/blood gas analyzer. Instrumentation laboratory SpA, Milano, Italy). The AaP02 was calculated using the following equation: AaP02=((BP-47)XFiOa)-(PaCOs/R)+FiOs(l-R) (PaCOz/R))-PaOz where FiOz is the Oa inspiratory fraction, BP is barometric pressure, PaCOz is alveolar PCOs assumed to be equal to PaCOa, and R is the respiratory exchange ratio determined from measured O2 uptake and CO* production values (8). An AaPOz greater than normal, detined by [10+0.43 (age in years -2011 was considered abnormal (9). PaOa <SO mmHg was considered as hypox- emia (10). PaCOz (35 mmHg was considered as hypocapnia (10).
Diagnosis of HPS Using saline-TTCE, we considered HPS to be present in cases with AaP02 greater than normal and with bubbles in left cardiac chambers. With saline or mannitol TOCE, we considered HPS to be present in cases with AaPO* greater than normal and a degree of left atrium opacification equal or superior to the value obtaining the best agreement with the results of ITCE.
1046
Intrapulmonary vascular dilatation in cirrhosis
Fig. 2. Transesophageal contrast echocardiography register in dtjferent cases, showing appearance at level 1 to 6, according to our grading system. Levels I and 2 are similar, but in level 0 there are no bubbles. In levels 3 and 4 we can see mamy bubbles, but in level 4 the bubbles aggregate and produce local changes in left atrium echogenicity. In levels 5 and 6, the bubbles change the whole left atria echogenicity, but in level 6 left atrium echogenicity is similar to right atrium echogenicity. LA: left atrium. RA: right atrium. Ao: aorta. 20: two-dimensional mode. M-mode: mono-dimensional mode.
Statistical analysis Estimation of Kappa heavy index allowed determination of the repro- ducibility of the procedure and intra- and interobserver variability. Wilcoxon’s test was chosen to compare results of TOCE and TTCE, and correlation between ordinal variables was determined by Spear- man’s test. Correlation between continuous and ordinal variables was determined by ANOVA and post-hoc test (Bonferroni). The limit of significance was set at a p<O.O5. For analysis purposes, we used the SPSS Statistic Pack.
Results Transesophageal contrast echocardiography and TTCE were satisfactorily performed in the 71 cirrhotic patients (65 males, mean age 56.82 11.2 years) as well as in the 20 controls (15 males, 55.35 10.3 years).
The origin of liver cirrhosis was alcoholic in 32 (45%), HCV infection in 13 (18.3%), HBV infection in four (5.6%), autoimmune liver disease in three (4.2%) and mixed (alcohol and HCV infection) in 19 (26.7%). According to their functional state, patients were as- signed to the different Child-Pugh classes as follows: class A, 23 (32.3%) class B, 26 (36.6%) and class C, 22 (30.9%). Forty patients were smokers (42.9%). In patients, FEVl (% ref) was 89.5224.2; FVC (% ref)
91.2% 19.7 and FEVl/FVC 78.5+ 10.6. Eight controls were smokers (40%). In the control group, FEVl (% ref) was 99.2~23.4; FVC (% ref) 102.8+ 18 and the FEVUFVC 78.3211.6.
Validation of the ZVD grading method
The reproducibility of the grading scale between the first and second injections showed a value of KHI of 0.92. The interobserver variability of the method, con- sidering the values assigned by two blinded observers for the same image, demonstrated a KHI of 0.97. The intraobserver variability, considering the same injec- tion twice by the same observer, reached a KHI of 0.95.
Results in controls: values in a healthy population
(Fig. 3; Table 2)
When TTCE was performed, none of the controls showed passage of contrast to the left atrium. Thus, the specificity of TTCE was 100%.
When TOCE was performed with saline solution,
1047
R. Aller et al.
% 702
60-, W CONTROL
q CIRRHOTICS
20% manaitol
123456123456
1 to 6 represent the degrees of lett atrium echogenicity by TOCE.
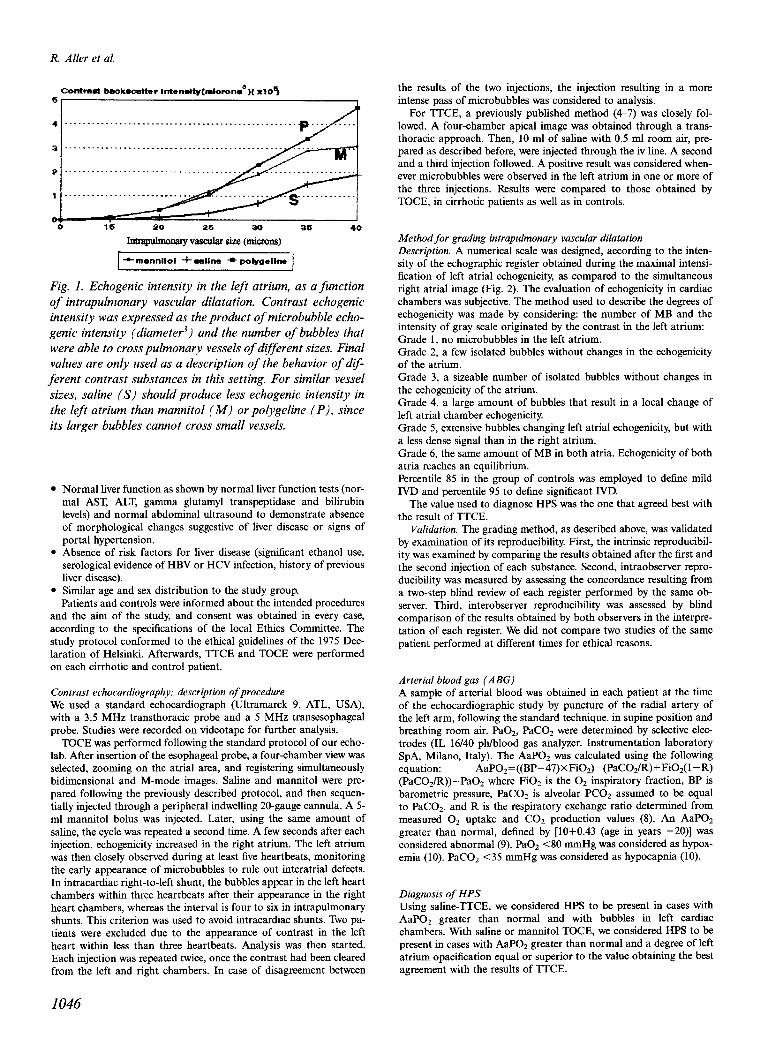
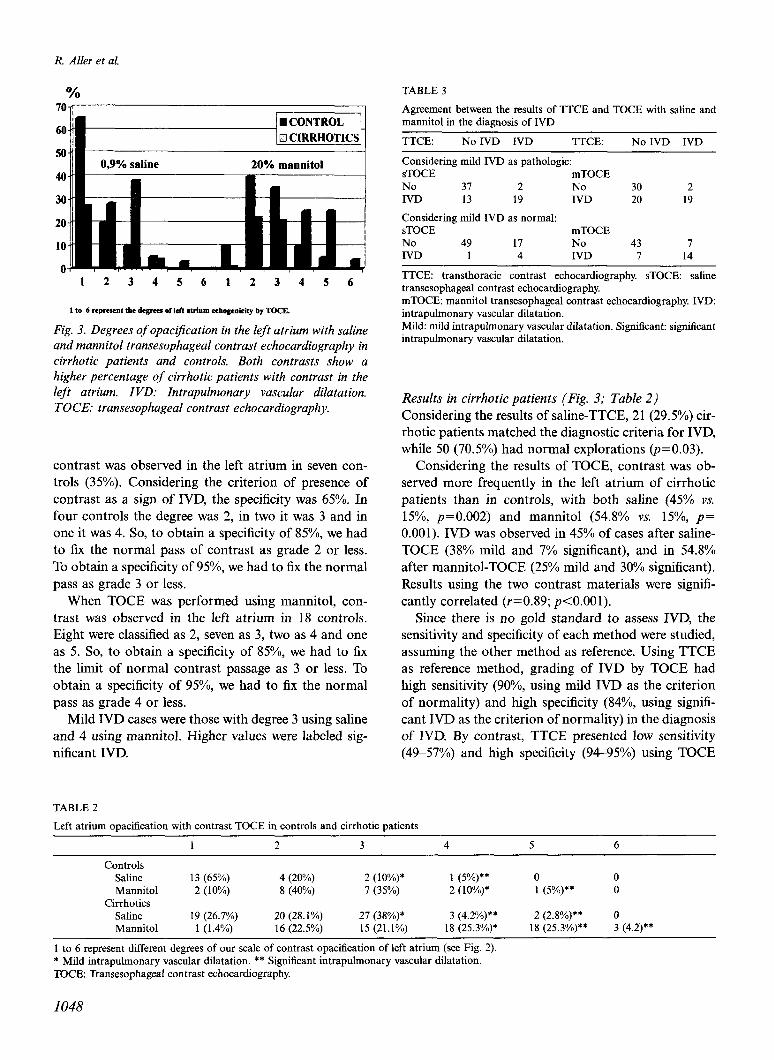
Fig. 3. Degrees of opacification in the left atrium with saline and mannitol transesophageal contrast echocardiography in cirrhotic patients and controls. Both contrasts show a higher percentage of cirrhotic patients with contrast in the left atrium. IVD: Intrapulmonary vascular dilatation. TOCE: transesophageal contrast echocardiography.
contrast was observed in the left atrium in seven con- trols (35%). Considering the criterion of presence of contrast as a sign of IVD, the specificity was 65%. In four controls the degree was 2, in two it was 3 and in one it was 4. So, to obtain a specificity of 85%, we had to fix the normal pass of contrast as grade 2 or less. To obtain a specificity of 95%, we had to fix the normal pass as grade 3 or less.
When TOCE was performed using mannitol, con- trast was observed in the left atrium in 18 controls. Eight were classified as 2, seven as 3, two as 4 and one as 5. So, to obtain a specificity of 85%, we had to fix the limit of normal contrast passage as 3 or less. To obtain a specificity of 95%, we had to fix the normal pass as grade 4 or less.
Mild IVD cases were those with degree 3 using saline and 4 using mannitol. Higher values were labeled sig- nificant IVD.
TABLE 3
Agreement between the results of TTCE and TOCE with saline and mannitol in the diagnosis of IVD
TTCE: No IVD IVD TTCE: No IVD IVD
Considering mild IVD as pathologic: sTOCE mTOCE No 31 2 No 30 2 IVD 13 19 IVD 20 19
Considering mild IVD as normal: sTOCE mTOCE No 49 17 No 43 I IVD 1 4 IVD 7 14
TTCE: transthoracic contrast echocardiography. sTOCE: saline transesophageal contrast echocardiography. mTOCE: mannitol transesophageal contrast echocardiography. IVD: intrapuhnonary vascular dilatation. Mild: mild intrapuhnonary vascular dilatation. Significant: significant intrapulmonary vascular dilatation.
Results in cirrhotic patients (Fig. 3; Table 2)
Considering the results of saline-TTCE, 21 (29.5%) cir- rhotic patients matched the diagnostic criteria for IVD, while 50 (70.5%) had normal explorations (p=O.O3).
Considering the results of TOCE, contrast was ob- served more frequently in the left atrium of cirrhotic patients than in controls, with both saline (45% KS. 15%, p=O.O02) and mannitol (54.8% vs. 15%, p=
0.001). IVD was observed in 45% of cases after saline- TOCE (38% mild and 7% significant), and in 54.8% after mannitol-TOCE (25% mild and 30% significant). Results using the two contrast materials were signifi- cantly correlated (r=0.89; p<O.OOl).
Since there is no gold standard to assess IVD, the sensitivity and specificity of each method were studied, assuming the other method as reference. Using TTCE as reference method, grading of IVD by TOCE had high sensitivity (90%, using mild IVD as the criterion of normality) and high specificity (84%, using signifi- cant IVD as the criterion of normality) in the diagnosis of IVD. By contrast, TTCE presented low sensitivity (49-57%) and high specificity (9495%) using TOCE
TABLE 2
Left atrium opacification with contrast TOCE in controls and cirrhotic patients
1 2 3 4 5 6
Controls Saline 13 (65%) 4 (20%) 2 (lo%)* 1 (5%)** 0 0 Manmtol 2 (10%) 8 (40%) I (35%) 2 (lo%)* 1 (so/)** 0
Cirrhotics Saline 19 (26.7%) 20 (28.1%) 27 (38%)* 3 (4.2%)** 2 (2.8%)** 0 Mannitol 1 (1.4%) 16 (22.5%) 15 (21.1%) 18 (25.30/o)* 18 (25.3%)** 3 (4.2)**
1 to 6 represent different degrees of our scale of contrast opacification of left atrium (see Fig. 2). * Mild intrapuhnonary vascular dilatation. ** Significant intrapulmonary vascular dilatation.
TOCE: Transesophageal contrast echocardiography.
1048
Intrapulmonary vascular dilatation in cirrhosis
TABLE 4
Gas exchange parameters of cirrhotics with and without IVD
n AaPO* (mmHg) Pa% (mmHg) PaCOz (mmHg)
TTCE
No IVD 50 21.9 (10.9) 79.5 (11.3)
IVD 21 24.3 (12.3) 77 (12.5)
sTOCE (Considering as pathologic both mild and significant IVD)
No IVD 39 20.8 (9.6) 79.2 (10.3)
IVD 32 25 (13.2) 78.2 (13.3)
sTOCE (Considering as pathologic only significant IVD)
No IVD 66 21.3 (10.1) 79.5 (10.9)
IVD 5 36.3 (18.5) 67.3 (14.1)’
mTOCE (Considering as pathologic both mild and significant IVD)
No IVD 32 19.2 (9.4) 80.6 (10.2)
IVD 39 25.5 (12.3)* 77.2 (12.6)
mTOCE (Considering as pathologic only significant IVD)
No IVD 50 19.7 (9.3) 80.2 (9.7) IVD 21 29.3 (13.7)** 74.6 (14.6)
32.2 (4.5) 32.2 (3.7)
33.3 (4.5) 30.7 (4.2)*
32.6 (4.8) 30.4 (5.8)
33.4 (4.8) 31.1 (4)*
33.4 (4.8) 30.1 (4.4)*
Values represent mean (*SD). TTCE: transthoracic contrast echocardiography. sTOCE: saline transesophageal contrast echocardiography. mTO- CE: mannitol transesophageal contrast echocardiography. IVD: intrapulmonary vascular dilatation. * p<O.Ol between patients with and without IVD. ** p<O.O05 between patients with and without IVD.
with mannitol and saline as the reference method, re- spectively, but TTCE sensitivity improved using sig- nificant IVD with TOCE as reference (67-80%). The agreement between the results of the different methods is represented in Table 3.
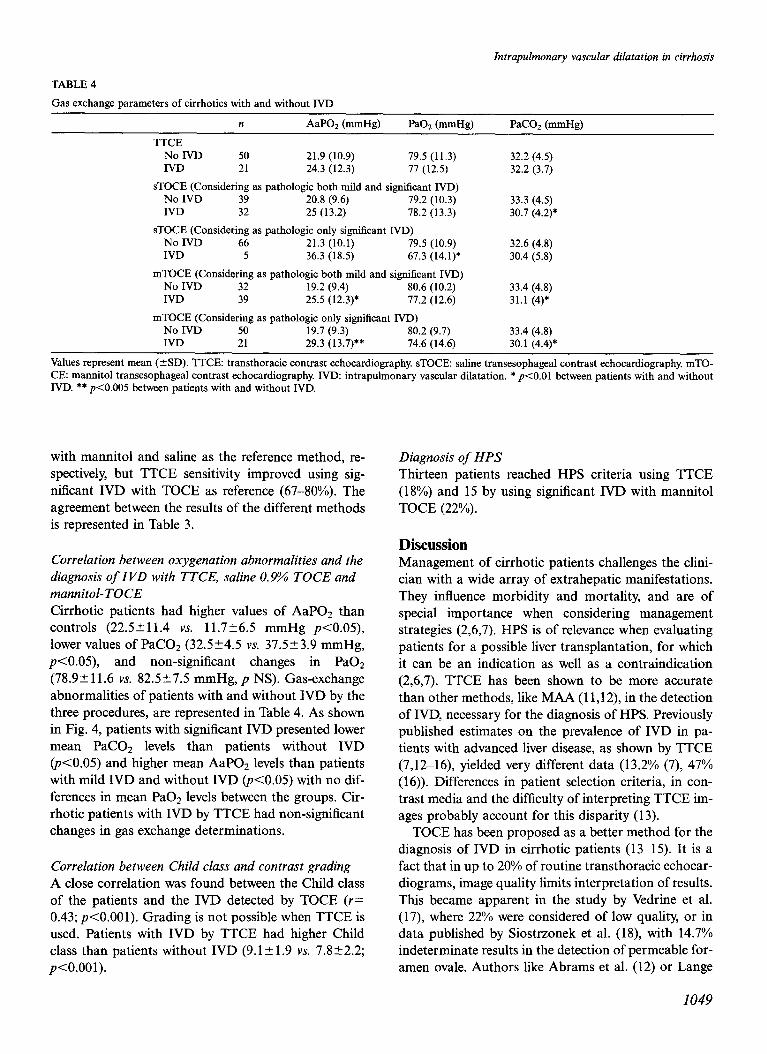
Correlation between oxygenation abnormalities and the diagnosis of IVD with TTCE, saline 0.9% TOCE and mannitol-TOCE Cirrhotic patients had higher values of AaP02 than controls (22.5511.4 vs. 11.726.5 mmHg p<O.O5), lower values of PaC02 (32.524.5 vs. 37.5k3.9 mmHg, p<O.O5), and non-significant changes in PaOZ (78.9+ 11.6 vs. 82.5k7.5 mmHg, p NS). Gas-exchange abnormalities of patients with and without IVD by the three procedures, are represented in Table 4. As shown in Fig. 4, patients with significant IVD presented lower mean PaC02 levels than patients without IVD (pcO.05) and higher mean AaPOz levels than patients with mild IVD and without IVD ($0.05) with no dif- ferences in mean PaOz levels between the groups. Cir- rhotic patients with IVD by TTCE had non-significant changes in gas exchange determinations.
Correlation between Child class and contrast grading A close correlation was found between the Child class of the patients and the IVD detected by TOCE (r= 0.43; p<O.OOl). Grading is not possible when TTCE is used. Patients with IVD by TTCE had higher Child class than patients without IVD (9.12 1.9 vs. 7.822.2; p<O.OOl).
Diagnosis of HPS Thirteen patients reached HPS criteria using TTCE (18%) and 15 by using significant IVD with mannitol TOCE (22%).
Discussion Management of cirrhotic patients challenges the clini- cian with a wide array of extrahepatic manifestations. They influence morbidity and mortality, and are of special importance when considering management strategies (2,6,7). HPS is of relevance when evaluating patients for a possible liver transplantation, for which it can be an indication as well as a contraindication (2,6,7). TTCE has been shown to be more accurate than other methods, like MAA (11,12), in the detection of IVD, necessary for the diagnosis of HPS. Previously published estimates on the prevalence of IVD in pa- tients with advanced liver disease, as shown by TTCE (7,12-16) yielded very different data (13.2% (7), 47% (16)). Differences in patient selection criteria, in con- trast media and the difficulty of interpreting TTCE im- ages probably account for this disparity (13).
TOCE has been proposed as a better method for the diagnosis of IVD in cirrhotic patients (13-15). It is a fact that in up to 20% of routine transthoracic echocar- diograms, image quality limits interpretation of results. This became apparent in the study by Vedrine et al. (17), where 22% were considered of low quality, or in data published by Siostrzonek et al. (18), with 14.7% indeterminate results in the detection of permeable for- amen ovale. Authors like Abrams et al. (12) or Lange
1049
R Aller et al.
Gi4c ** I
z $3c
5
% I
(v 2c G I I
4,, No IVD Mild IVDSignificant IVD
36
I
No IVD Mild IVDSignificant IVD
55 I
E 9c z
0 1 I
B
% 7c cu 1
G
465 No IVD Mild IVDSignificant IVD
Fig. 4. Gas exchange determinations and severity of IVD with mannitol TOCE in cirrhotic patients. IVD: intrapul- monary vascular dilatation. *p<O.O.5 compared to mild IVD. **p<O.O5 compared to no IVD.
et al. (13) suggested that TOCE could increase the sen- sitivity of the detection of IVD (and HPS) in cirrhotic patients. Only recently, Vedrine et al. (17) published a first study, stating that TOCE performs better in this
1050
situation, detecting 19% more cases of IVD than TTCE in a group of cirrhotic patients.
The idea of achieving a better diagnosis by using better imaging techniques is logical and attractive, but has to be approached with caution. Up to now, the specificity of TOCE had not been tested. The existence of MB in the left atrium in normal controls (35% in our study) invalidates TOCE as a method for the diag- nosis of IVD if the criteria used for TTCE are con- sidered. The high sensitivity in detecting MB shown by TOCE led us to design a scale of contrast opacification in order to define a cut-off of positivity for this test, and with the further purpose of comparing the poss- ible grading of IVD with the different parameters of severity of the cirrhotic disease. On first impression, the proposed scale of 6 grades may seem bizarre. How- ever, if we consider that it is based on two factors (number of MB and change of echogenicity of the atrium), it is not difficult to use in practice, as the test of reproducibility has shown.
If cirrhosis is considered as a spectrum of disease, following Child class, it is attractive to consider that IVD may also be an associated alteration of advanced liver disease. Thus, we tested the hypothesis of the existence of a correlation between the grading of con- trast opacification of the atrium and the Child class of patients, obtaining a significant value of r=0.43. This result supports the importance of a scale of contrast opacification as a reference for the degree of IVD in cirrhosis.
The utility of TOCE is supported by the correlation found between ABG results and the different degrees of atria1 contrast opacification. If we consider that the abnormalities found in ABG samples are secondary to IVD, TTCE does not seem to be a very good method to detect IVD, since no significant differences in ABG were found in patients with and without IVD criteria by this method. The correlation found between the ABG abnormalities and the degree of IVD described by TOCE supports the use of TOCE in the diagnosis of IVD, if a grading scale is used. The prevalence of hypoxemia increases when IVD is demonstrated by mannitol-TOCE. These results confirm that mannitol- TOCE is the more sensitive method in selecting pa- tients with IVD, validating the grading method of TOCE and showing its clinical utility. Thus, we believe that mannitol-TOCE is the preferred method in the screening of HPS, but saline-TOCE is more specific in detecting hypoxemic patients with IVD. Whether pa- tients with IVD without hypoxemia develop gas ex- change abnormalities in their evolution is unknown. Our findings showed that patients with a greater IVD assessed by TOCE showed more alterations in arterial
Intrapulmonary vascular dilatation in cirrhosis
blood gases. However, as shown in Fig. 4, there is an important overlap between the three groups of IVD respecting the results of arterial blood gases. In cir- rhotic patients, these alterations do not only depend on IVD. Other factors such as ventilation/perfusion mismatch and O2 diffusion limitation can affect them (19,20). These other factors could justify the overlap- ping mentioned above. Lung disease remains a possible contributing factor, even while IVD are shown to exist. We report an improvement in a tool (echocardiogra- phy) used for a better understanding of the complexity of gas exchange abnormalities in cirrhotic patients.
Ultrasonographic detection of microbubbles de- pends on image quality and resolution of the probe, but also on the contrast’s echogenic intensity. Contrast material has been an important confounding factor in previous studies. Different fluids have been employed, like indocyanine green (7) (which generates bubbles measuring up to 90 pm), normal saline (16) (24-180 pm) and gelatine (17) (2-22 ,um). Further, the method of bubble generation strongly influences the final size, with different values for the same substance after sonication and after manual agitation. Awareness of these differences did not preclude the application of a constant criterion to define IVD: appearance of micro- bubbles in the left heart chambers (4-7).
The echogenic intensity of the contrast depends on the cube of the microbubble diameter, and is also pro- portional to bubble concentration (21,22). The size of the pulmonary vessels defines which and how many bubbles will enter the left heart chambers, and it is their echogenicity that determines the intensity of the signal to be detected (Fig. 1). When saline 0.9% is used as a contrast, its echogenicity depends mainly on larger bubbles (>60 pm), which do not easily traverse the pulmonary capillary bed, even in the presence of IVD. The final signal will not be intense. Mannitol and poly- geline both generate more and smaller microbubbles. In the presence of IVD, these will readily cross the pul- monary capillaries, and the left chamber signal will be more intense and easier to analyze.
We further intended to define normality criteria by using TOCE. Our study, unlike previous studies (17,23,24), included a control group. By using our score, we have determined two cut-offs to define nor- mality: mild and significant IVD. We believe that pa- tients exhibiting mild IVD have an early stage of IVD with lesser gas exchange abnormalities than patients with significant IVD. Prospective study of these pa- tients will allow us to determine if these patients de- velop hypoxemia in their evolution. Transthoracic con- trast echocardiography results present better corre- lation with significant IVD by mannitol-TOCE.
Mannitol-TOCE seems to be more sensitive, de- tecting IVD in 55% of cases, while saline-TOCE diag- nosed IVD in only 45% of them. Nevertheless, both substances similarly reflect the presence of IVD, with good correlation between their results. Saline offers a less intense echogenic signal, and discriminates the de- gree of vasodilatation less (a majority of cases are clus- tered in grade 3).
The 15% discrepant cases between TOCE and TTCE could be considered false positives for TOCE due to its 85% specificity (results in control group). The remaining differences should be considered as false negatives of TTCE, due to its low sensitivity in detecting mild IVD. On the other hand, TTCE also seems to be subject to false-positive examinations. In two cases of our series with a positive TTCE, TOCE was not able to detect IVD (grades 2 with saline- TOCE and 3 with mannitol-TOCE). A possible expla- nation is that the positivity criterion for TTCE is the observation of microbubbles in the left heart chambers. TOCE has allowed us to discover that this indeed happens in 35% of normal subjects. When im- age quality is excellent, TTCE might be able to detect even those scattered small microbubbles. False nega- tives of TOCE are another possibility, although in view of the agreement between mannitol-TOCE and TTCE, it is less possible.
From a clinical point of view, in our opinion, if we want a precise study of IVD, TOCE should be the pre- ferred method. If we only want to diagnose HPS we need only study patients with gasometric criteria of HPS. If the TTCE study is conclusive, TOCE is not necessary, but if TTCE is of low quality or shows a result discrepant with clinical and gasometric studies, a TOCE is desirable.
Our hospital is not a reference center for HPS and our cases are not selected. This is the reason why we have few cases with severe IVD and severe HPS. These cases should reach degrees 5 and 6 on our initial score.
The lack of a gold standard is an important hin- drance when trying to validate any diagnostic pro- cedure. Excellent reproducibility and limited intra- and interobserver variability support the accuracy of our results, as does the agreement between results obtained with two different contrast fluids. The control group is perhaps too small, but TOCE is of only limited appli- cability in the study of normal volunteers. Anyway, this study is the first to employ controls in the diagnosis of IVD with TOCE.
TOCE could be considered an invasive procedure, but it was well tolerated by our patients without com- plications in the first week after the procedure. In pa- tients with esophageal varices, no episodes of gastroin-
1051
R. Aller et al.
testinal hemorrhage were observed during a l-week follow-up.
Although the method is highly reproducible, it could be limited by its subjective and semi-quantitative nature. The ideal method for this is proper quantifi- cation of the echodensity of the left atrium The evolv- ing ultrasonography technology will allow us a straight quantitative estimation of echographic signal in the left atrium (25). Furthermore, the development of more homogeneous contrast fluids will further improve the results. Meanwhile, however, the proposed semi-quan- titative approach can play a role in the diagnosis of different degrees of IVD for different stages of liver disease.
In summary, the procedures currently used in the di- agnosis of IVD in cirrhotic patients make its diagnosis difficult. The natural history of IVD and HPS is not currently understood (7). New data on IVD should be available with this diagnostic approach. In our study, 20% mannitol-TOCE performed better than other methods, detecting IVD in 55% of a non-selected group of cirrhotic patients. Semi-quantification allows the classification of 30% of the total as significant IVD. The relation between the severity of IVD and gas ex- change abnormalities validates TOCE as a better method in diagnosis and grading of IVD. We believe that our work opens new perspectives to future studies on the pathogenesis, prognosis, treatment and reversi- bility of IVD and HPS. TOCE could facilitate under- standing of the evolution of HPS and its reversibility after liver transplantation.
Acknowledgement We greatly appreciate the valuable help of Victor Ab- raira (Department of Biostatistics).
References 1. Sherlock S. Disorders of the Liver and the Biliary System, 8th
ed. Oxford: Blackwell Scientific; 1989. p. 82-9. 2. Rodriguez-Roisin R. Sindrome hepatopulmonar: un nuevo con-
cepto. Un tratamiento nuevo? Med Clin (Bare) 1995; 105: 269- 74.
3. Berthelot E Walker JG, Sherlock S, Reid L. Arterial changes in the lungs in cirrhosis of the lower-lung spider nevi. N Engl J Med 1966; 274: 291-8.
4. Hind CR, Wong CM. Detection of pulmonary arteriovenous fis-
tulae in patients with cirrhosis by contrast 2D echocardiography. Gut 1981; 22: 1042-5.
5. Krowka MJ, Cortese DA. Severe hypoxemia associated with liver disease: Mayo Clinic experience and the experimental use of al- mitrine bismesylate. Mayo Clin Proc. 1987; 62: 164-73.
6. Krowka MJ, Cortese DA. Hepatopulmonary syndrome (edi- torial). Chest 1990; 98: 10534.
7. Krowka MJ, Tajik AJ, Dickson ER, Wiesner RH, Cortese DA. Intrapulmonary vascular dilatations (IIVDD) in liver transplant candidates. Screening by two-dimensional contrast-enhanced echocardiography. Chest 1990; 97: 1165-70.
8. Rodriguez-Roisin, Rota J, Agusti AG, Mastai R, Wagner PD, Bosch J. Gas exchange and pulmonary vascular reactivity in pa- tients with liver cirrhosis. Am Rev Respir Dis 1987; 135: 1085- 92.
9. Abrams GA, Nanda NC, Duvovsky EV, Krowka MJ, Fallon MB. Use of macroaggregated albumin lung perfusion scan to diagnose hepatopulmonary syndrome: a new approach. Gastroenterology 1998; 114: 305-10.
10. Battaglia SE, Jeffrey J, Irving LB, Jones RB, Angus PW. Resol- ution of gas exchange abnormalities and intrapulmonary shunt- ing following liver transplantation. Hepatology 1997; 25: 1228- 32.
11. Genovesi MG, Tierney DF, Taplan GV, Eisemberg H. An intra- venous radionuclide method to evaluate hypoxemia caused by ab- normal alveolar vessels: limitation of conventional techniques. Am Rev Resp Dis 1976; 114: 59-65.
12. Abrams GA, Jaffe CC, Hoffer PB, Binder HJ. Diagnostic utility of contrast echocardiography and lung perfusion scan in patients with hepatopulmonary syndrome. Gastroenterol 1995; 109: 1283-8.
13. Lange PA, Stoller JK. The hepatopulmonary syndrome. Ann In- tern Med 1995; 122: 521-9.
14. Krowka MJ, Cortese DA. Hepatopulmonary syndrome: an evolving perspective in the era of liver transplantation. Hep- atology 1990; 11: 13842.
15. Rodriguez-Roisin R. The hepatopulmonary syndrome: new name, old complexities (editorial). Thorax 1992; 47: 1787-8.
16. Hopkins WE, Waggoner AD, Barzilai B. Frequency and sianifi- cance of intrapulmonary right-to-left shunting in end-stage he- oatic disease. Am J Cardiol 1992: 70: 5169. 1
17. Vedrine JM, Duperret S, Bizollon T, Magnin C, Motin J, Trepo C, et al. Comparison of transesophageal and transthoracic con- trast echocardiography for detection of a intrapulmonary shunt in liver disease. Chest 1997; 111: 123640.
18. Siostrzonek E Zangeneh M, G&singer H. Comparison of trans- esophageal and transthoracic contrast echocardiography for de- tection of a patent foramen ovale. Am J Cardiol 1991; 68: 1247- 9.
19. Wagner PD. Impairment of gas exchange in liver cirrhosis. Eur Respir J 1995; 8: 199335.
20. Herd P, Lebrec D, Brenot F, Simoneau G, Humbert M, Sitbon 0, et al. Pulmonary vascular disorders in portal hypertension. Eur Respir J 1998; 11: 1153-66. Jayaweera AR, Skyba DM, Kaul S. Technical factors that influ- ence the determination of microbubble transit rate during con- trast echocardiography. J Am Sot Echocardiogr 1995; 8: 198- 206.
21.
22.
23.
24.
25.
Heidenreich PA, Wiencek JG, Zaroff JG, Aronson S, Segil LJ, Harper IVD, et al. In vitro calculation of flow by use of contrast ultrasonography. J Am Sot Echocardiogr 1993; 6: 51-61. Nemec JJ, Davison MB, Marwick TH, Chimowitz MI, Stroller JK, Klein AL, et al. Detection and evaluation of intrapulmonary vascular shunt with “contrast Doppler” transesophageal echocar- diography. J Am Sot Echo 1991; 4: 79-83. Pearson AC, Labowitz AJ, Tatinemi S. Superiority of transeso- phageal echocardiography in detecting cardiac source of em- bolism in patients with cerebral ischemia of uncertain etiology. J Am Cardiol 1991; 17: 6672. Schwarz KQ, Bezante GE Chen X, Schlief R. Quantitative echo contrast concentration measurement by Doppler sonography. Ul- trasound Med Biol 1993; 19: 289-97.
1052


![[Transesophageal cardiac stimulation: properties of esophageal electrodes with ring and point-direction poles. I]](https://img.pdfslide.net/doc/110x75/635cf2701b1c1ace2608cd54/transesophageal-cardiac-stimulation-properties-of-esophageal-electrodes-with-ring.jpg)


