Embed Size (px)
Citation preview
ShwbhcisEsldus
C
H
ltstbdirBot
Up
r
nsai
6
REVIEW ARTICLE
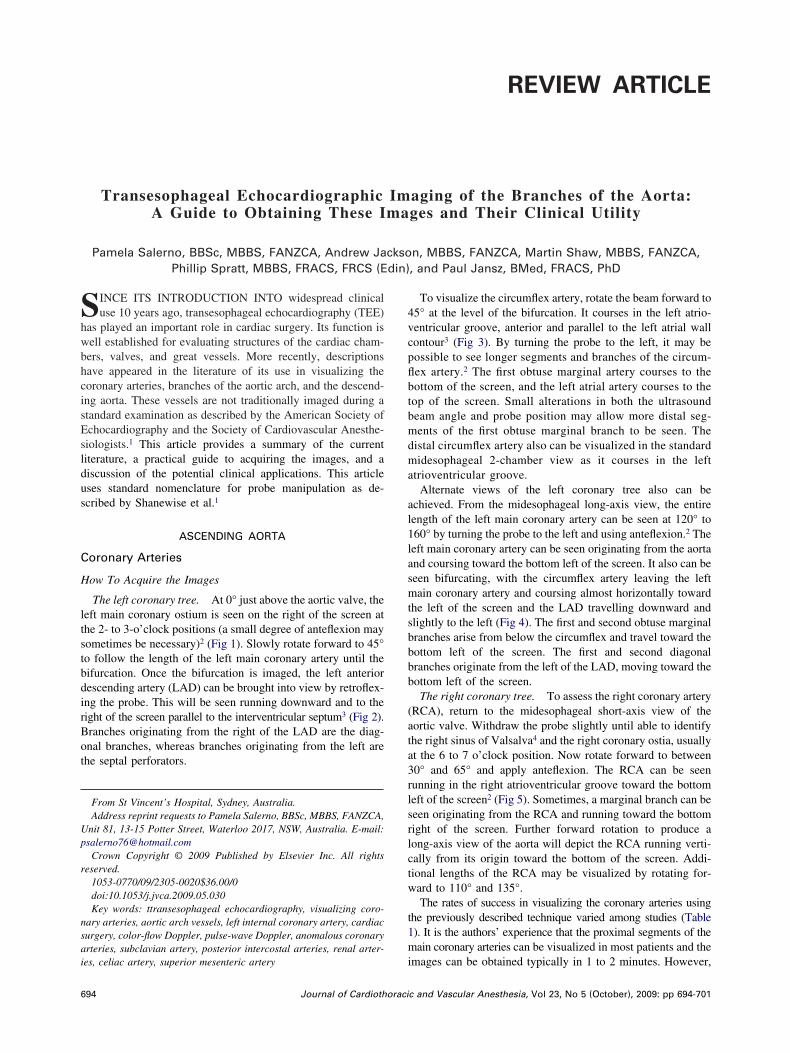
Transesophageal Echocardiographic Imaging of the Branches of the Aorta:A Guide to Obtaining These Images and Their Clinical Utility
Pamela Salerno, BBSc, MBBS, FANZCA, Andrew Jackson, MBBS, FANZCA, Martin Shaw, MBBS, FANZCA,
Phillip Spratt, MBBS, FRACS, FRCS (Edin), and Paul Jansz, BMed, FRACS, PhD4vcpflbtbmdma
al1lasmtsbbbb
(ata3rlsrlctw
t1m
INCE ITS INTRODUCTION INTO widespread clinicaluse 10 years ago, transesophageal echocardiography (TEE)
as played an important role in cardiac surgery. Its function isell established for evaluating structures of the cardiac cham-ers, valves, and great vessels. More recently, descriptionsave appeared in the literature of its use in visualizing theoronary arteries, branches of the aortic arch, and the descend-ng aorta. These vessels are not traditionally imaged during atandard examination as described by the American Society ofchocardiography and the Society of Cardiovascular Anesthe-iologists.1 This article provides a summary of the currentiterature, a practical guide to acquiring the images, and aiscussion of the potential clinical applications. This articleses standard nomenclature for probe manipulation as de-cribed by Shanewise et al.1
ASCENDING AORTA
oronary Arteries
ow To Acquire the Images
The left coronary tree. At 0° just above the aortic valve, theeft main coronary ostium is seen on the right of the screen athe 2- to 3-o’clock positions (a small degree of anteflexion mayometimes be necessary)2 (Fig 1). Slowly rotate forward to 45°o follow the length of the left main coronary artery until theifurcation. Once the bifurcation is imaged, the left anteriorescending artery (LAD) can be brought into view by retroflex-ng the probe. This will be seen running downward and to theight of the screen parallel to the interventricular septum3 (Fig 2).ranches originating from the right of the LAD are the diag-nal branches, whereas branches originating from the left arehe septal perforators.
From St Vincent’s Hospital, Sydney, Australia.Address reprint requests to Pamela Salerno, BBSc, MBBS, FANZCA,
nit 81, 13-15 Potter Street, Waterloo 2017, NSW, Australia. E-mail:[email protected] Copyright © 2009 Published by Elsevier Inc. All rights
eserved.1053-0770/09/2305-0020$36.00/0doi:10.1053/j.jvca.2009.05.030Key words: ttransesophageal echocardiography, visualizing coro-
ary arteries, aortic arch vessels, left internal coronary artery, cardiacurgery, color-flow Doppler, pulse-wave Doppler, anomalous coronaryrteries, subclavian artery, posterior intercostal arteries, renal arter-
ies, celiac artery, superior mesenteric artery
94 Journal of Cardiothoraci
To visualize the circumflex artery, rotate the beam forward to5° at the level of the bifurcation. It courses in the left atrio-entricular groove, anterior and parallel to the left atrial wallontour3 (Fig 3). By turning the probe to the left, it may beossible to see longer segments and branches of the circum-ex artery.2 The first obtuse marginal artery courses to theottom of the screen, and the left atrial artery courses to theop of the screen. Small alterations in both the ultrasoundeam angle and probe position may allow more distal seg-ents of the first obtuse marginal branch to be seen. The
istal circumflex artery also can be visualized in the standardidesophageal 2-chamber view as it courses in the left
trioventricular groove.Alternate views of the left coronary tree also can be
chieved. From the midesophageal long-axis view, the entireength of the left main coronary artery can be seen at 120° to60° by turning the probe to the left and using anteflexion.2 Theeft main coronary artery can be seen originating from the aortand coursing toward the bottom left of the screen. It also can beeen bifurcating, with the circumflex artery leaving the leftain coronary artery and coursing almost horizontally toward
he left of the screen and the LAD travelling downward andlightly to the left (Fig 4). The first and second obtuse marginalranches arise from below the circumflex and travel toward theottom left of the screen. The first and second diagonalranches originate from the left of the LAD, moving toward theottom left of the screen.The right coronary tree. To assess the right coronary artery
RCA), return to the midesophageal short-axis view of theortic valve. Withdraw the probe slightly until able to identifyhe right sinus of Valsalva4 and the right coronary ostia, usuallyt the 6 to 7 o’clock position. Now rotate forward to between0° and 65° and apply anteflexion. The RCA can be seenunning in the right atrioventricular groove toward the bottomeft of the screen2 (Fig 5). Sometimes, a marginal branch can beeen originating from the RCA and running toward the bottomight of the screen. Further forward rotation to produce aong-axis view of the aorta will depict the RCA running verti-ally from its origin toward the bottom of the screen. Addi-ional lengths of the RCA may be visualized by rotating for-ard to 110° and 135°.The rates of success in visualizing the coronary arteries using
he previously described technique varied among studies (Table). It is the authors’ experience that the proximal segments of theain coronary arteries can be visualized in most patients and the
mages can be obtained typically in 1 to 2 minutes. However,
c and Vascular Anesthesia, Vol 23, No 5 (October), 2009: pp 694-701

tui
C
ic2iTitcFdpnltdfl
i
cflhticpsbtaa3mivers
t
T
i
a
s
695TEE IMAGING OF THE AORTA
he more distal segments take considerably longer (5-10 min-tes), require more experience, and frequently cannot bemaged.
linical Utility
Assessing the degree of stenosis. The presence of stenosisn the coronary arteries should be assessed with 2-dimensional,olor-flow Doppler (CFD) and pulse-wave Doppler (PWD). InD, coronary artery stenosis is suggested by an area of local-zed echo density seen to impinge on the lumen of the vessel.5
o estimate the degree of stenosis, zoom in on the area ofnterest and freeze the image. Using the calliper, measure bothhe width of the lumen immediately before the stenosis andompare this with the smallest diameter at the point of stenosis.or ostial lesions, measure the luminal width immediatelyistal to the narrowing instead. The degree of stenosis is ex-ressed as a percent and is considered hemodynamically sig-ificant when greater than or equal to 50%. To define theocation of the stenosis, measure its distance from the origin ofhe coronary ostia for the left main artery and RCA or theistance from the bifurcation in the case of LAD and circum-ex artery lesions.When these estimations are complete, apply CFD to the
mage. Set the Nyquist limit to 50 cm/s when examining the left
Fig 1. The left main coronary artery can be seen originating from
he left coronary sinus at the 2- to 3-o’clock positions.
Fig 2. The left anterior descending artery (LAD) is highlighted.
he left main coronary artery can also be seen. The circumflex artery
s not visible.
o
v
oronary tree and 20 cm/s for the right coronary tree.6 Normalow in proximal coronary arteries is laminar and biphasic, withigher velocities in diastole than in systole (Fig 6). Evidence ofurbulent flow, depicted by aliasing, is the hallmark of signif-cant upstream stenosis.7 Next, apply PWD to each of theoronary arteries by placing the sample volume in the proximalart of each artery and just distal to any areas of suspectedtenosis (from 2-dimensional and CFD). Note that the angleetween the ultrasound beam and the vessel is often greaterhan 20° (Table 2). Normal flow velocities in the coronaryrteries are left main coronary artery 36 � 11 cm/s in systolend 71 � 19 cm/s in diastole, left anterior descending artery1 � 11 cm/s in systole and 67 � 19 cm/s in diastole, and rightain coronary artery 25 � 8 cm/s in systole and 39 � 12 cm/s
n diastole.6 These normal values, however, have not beenalidated for the anesthetized patient. The maximal-to-prest-notic velocity ratio for each lesion may also be calculated. Aatio greater than or equal to 2 is suggestive of significanttenosis.
Fig 3. The circumflex artery is highlighted. The left main and left
nterior descending arteries are not visible.
Fig 4. The left main (LM), left main bifurcation, left anterior de-
cending artery (LAD), and circumflex artery (Cx) can be seen. Some
ther structures are labelled to aid orientation of this nonstandard
iew: LA, left atrium; Ao, aorta; RVOT, right ventricular outflow tract.

m
w
emfcssw
car
dTotau
dcrbaaci
ddiiogctmct
on
s
t
696 SALERNO ET AL
Identification of stenoses also may be accomplished using aodified continuity equation7:
stenosis (%) � 100 � (1 � prestenotic VTId) ⁄ (stenotic VTId)
here VTId is the diastolic velocity integral.Vrublevsky et al7 found that the success of the continuity
quation for identification of stenosis was 88% for the leftain coronary, 96% for the left anterior descending (100%
or occlusions), 95% for the left circumflex (100% for oc-lusions), and 83% of right coronary artery (84% for occlu-ions) (Table 3). The authors also found that the degree oftenosis calculated using the continuity equation correlatedell with those concluded by angiography. The correlation
Fig 5. The right coronary artery is highlighted. The extended
egment seen in this patient is not routinely visible.
Table 1. Success Rates (%) for the Visualization of Coronary Arteries
Kasprzak4 Vreblevsky7 Samdarshi5 Tardif2
Left mainOrigin 100Proximal course 99.5 100 93 100Entire length 100
LADOrigin 96Proximal 96.7 77 93 69Mid 31Distal 16
DiagonalsD1 25D2 16
CircumflexProximal 98.6 77 93 80Mid 51Distal 20
Obtuse marginalsOM1 18OM2 11
Right coronary arteryOrigin 65 72 49 84Proximal 16Mid 11
Distaloefficients were 0.82 for the left main, 0.84 for the leftnterior descending, 0.85 for the circumflex, and 0.84 for theight coronary artery.
In addition, the authors determined a simplified method foriagnosing hemodynamically significant (�50%) stenoses.hey noted that peak diastolic velocity increases as the degreef stenosis increases. They determined the following valueshat correlated with stenosis of �50%: left main �1.4 m/s, leftnterior descending �0.9 m/s, and circumflex �1.1 m/s. Val-es for the right coronary artery could not be determined.Coronary angiography will remain the gold standard for
iagnosing coronary artery stenosis, but TEE can be useful inases in which angiography has not been performed. Oneeported case described a severe left main stenosis diagnosedy TEE (later confirmed by angiography) during an openbdominal aortic aneurysm repair.6 A second case describednother severe left main stenosis diagnosed by TEE (also lateronfirmed by angiography) before a double-valve replacementn a younger patient.8
Anomalous coronary arteries. Transesophageal echocar-iographic imaging of the coronary arteries may be useful inelineating the origin, proximal course, and flow character-stics in anomalous coronary arteries.9 Congenital abnormal-ties of the coronary tree are identified in approximately 1%f patients undergoing coronary angiography.3 Because an-iography does not always allow precise delineation of theourse of anomalous coronary vessels or define their ana-omic relationship with the aorta and pulmonary trunk, TEEay not only provide complementary information to the
oronary angiogram, but it also may become an investigativeool in its own right.
TEE can accurately identify 3 clinically significant patternsf anomalous coronary arteries.9 First, the passage of a coro-ary artery between the aorta and the pulmonary artery (the
Fig 6. Pulse-wave Doppler image of a normal circumflex artery. In
his case, blood flow is clearly diastolic-dominant.
Table 2. Success Rates (%) of Reported Studies of Performing
Pulse-Wave Doppler Analysis of the Coronary Arteries
Kasprzak4 Vreblevsky7 Tardif2
Left main 88 97 82LAD 85 96 77Circumflex 58 69 53
RCA 65 48 58
saiai
mflsgTsleuu
A
H
v
tivClcoi
swwovtcfsvtb
b
c
t
i
697TEE IMAGING OF THE AORTA
o-called intermediate course) may be seen. Second, an acutengle of takeoff from the aorta may be seen. Third, it maydentify the origin of the coronary artery from the pulmonaryrtery. These patterns are associated with acute myocardialnfarction and sudden death.
An interesting finding with PWD in patients with inter-ediate course and acute angle of takeoff was that bloodow was systolic-dominant.9 This suggests impaired dia-tolic flow may be the mechanism by which these anomaliesive rise to symptoms. A previous case showed the utility ofEE in this area. Intraoperative TEE in a 64-year-old womancheduled for aortic valve replacement found an anomalouseft main with intermediate course (not diagnosed on preop-rative angiography).10 As a result of this finding, she alsonderwent grafting of the LIMA to LAD and made anneventful recovery.
AORTIC ARCH
rch Vessels
ow To Acquire the Images
Select a depth of 6 cm then obtain the standard long-axisiew of the aortic arch at 0°. Slowly withdraw the probe until
Fig 7. The aortic arch vessels are highlighted (LCCA, left common
arotid artery; LSCA, left subclavian artery). Note that the origin of
Table 3. Sensitivity and Specificity of TEE in th
Vreblevsky7
PWD Overall If Visualized (2D)
SensitivityLeft main 80% 88 96LAD 32 97 79Circumflex 50 95 75RCA * 83 100
SpecificityLeft main 97 98 99LAD 92 67 99Circumflex 92 92 100RCA * 97 100
*Could not be calculated because of the prevalence of occlusion.
he innominate artery as seen here is not routinely visible, and the
nnominate vein is unusually prominent.
s
i
he arch vessels begin to appear in the short axis. Anteflexions often needed to obtain a clear view. Delineation of theessels is greatly aided by using CFD (the authors routinely useFD over the entire field with a Nyquist limit of 20 cm/s). The
eft subclavian artery appears on the right of the screen, the leftommon carotid artery in the center, and the innominate arteryn the left (Fig 7). Occasionally, flexing to the left improvesmaging of the arch vessels.
Next, turn the probe to the left to center the image on the leftubclavian artery. Keeping the depth at 6 cm and the CFD on,ithdraw the probe until the vessel appears in the long axis (itill be slightly convex to the right of the screen). Anteflexionften aids imaging of the vessel and its branches. The leftertebral artery is the first branch. It arises from the vessel onhe right, upper part of the screen. In some patients, the costo-ervical and thyrocervical trunks also can be imaged arisingrom the left subclavian artery and running to the right of thecreen. The left internal mammary artery (LIMA) is the onlyessel that arises from the left subclavian artery to the left ofhe screen. Imaging of the LIMA is detailed separately laterecause of its clinical significance.The left common carotid artery and left internal jugular vein can
e imaged in the short-axis view by withdrawing the probe and
Fig 8. The bifurcation of the common carotid artery (CCA) can be
gnosis of Significant Coronary Artery Stenosis
Samdarshi5
Tardif2 2Derall If Visualized (colour flow) Overall
96 92 92 10048 64 48 8067 75 67 8937 43 37 82
99 100 100 10099 86 84 10000 84 83 10000 81 75 100
e Dia
Ov
11
een (ECA, external carotid artery; ICA, internal carotid artery; IJV,
nternal jugular vein). (Color version of figure is available online.)

tplFlidrfain
vrstAptriacca
ordvp
saagrv
ist19ga
L
H
saNv
c
b
a
t
e
a
698 SALERNO ET AL
urning it to keep the vessels in the center of the screen. With therobe at the level of the left common carotid artery bifurcation, aong-axis view can be obtained by rotating forward to 90° (Fig 8).rom the long-axis view, PWD measurements can be made in the
eft common carotid artery, left external carotid artery, and leftnternal carotid artery. The left internal carotid artery can beistinguished from the left external carotid artery by its low-esistance flow pattern and its location on the screen furthestrom the probe. It is important to note that the probe will bebove the level of the upper esophageal sphincter when imag-ng the carotid bifurcation, and the safety of this maneuver hasot been formally established.To visualize the right-sided vessels, return to the long-axis
iew of the left subclavian artery. Then, turn the probe to theight until the right-sided images begin to appear. This takesome practice because all landmarks are initially lost whenhe trachea is interposed between the probe and the vessels.nteflexion and right flexion improve the image in someatients. Between the vertebra on the left of the screen andhe trachea on the right, the right common carotid artery,ight subclavian artery, and the internal jugular vein appearn sequence. Follow the right common carotid artery ceph-lad to its bifurcation into the right internal and externalarotid arteries by withdrawing the probe.11 The right sub-lavian artery and its branches can be imaged and appear asmirror image of the left subclavian artery described earlier.Flow characteristics of the aortic arch vessels also can be
btained. Blood flow in the subclavian arteries has a high-esistance pattern with systolic antegrade flow, short earlyiastolic reversal, and no antegrade diastolic flow.12 Con-ersely, the carotid and vertebral arteries have a low-resistanceattern with antegrade flow in systole and diastole.12,13
Success rates for imaging of aortic arch branches arecarcely quoted in the literature. Earlier studies quote rates ofbout 70% for the left subclavian artery, left common carotidrtery, and left vertebral artery.12,13 A later study indicatedreater success, with rates of greater than 90% for the left andight subclavian arteries, right and left common carotid, and leftertebral artery.11
Fig 9. The left internal mammary artery (LIMA) and the left sub-
lavian artery (LSCA) are highlighted. Note that the LIMA is the only
ranch of the LSCA that courses to the left of the screen.
(
p
The authors conducted a prospective audit of the ability tomage branches of the aortic arch in 50 consecutive cardiacurgical patients undergoing LIMA-to-LAD grafting. The au-hors found the following success rates: left subclavian artery,00%; left vertebral artery, 100%; LIMA post-grafting to LAD,0%; left common carotid artery, 98%; innominate artery ori-in, 26%; innominate artery bifurcation, 68%; right subclavianrtery, 62%; and right common carotid artery, 70%.
eft Internal Mammary Artery
ow To Acquire the Images
To image the LIMA, start from the long-axis view of the leftubclavian artery as described above. Keep the depth at 6 cmnd rotation at 0°, and use CFD over the entire screen with ayquist limit of 20 cm/s. As noted earlier, the LIMA is the onlyessel that arises from the left subclavian artery to the left of
Fig 10. Pulse-wave Doppler image of the left internal mammary
rtery (LIMA) pregrafting to the left anterior descending artery. In
his case, the LIMA shows a high-resistance flow pattern with almost
ntirely systolic flow.
Fig 11. Pulse-wave Doppler image of the left internal mammary
rtery (LIMA) after grafting to the left anterior descending artery
LAD). In a normal LIMA-LAD graft as shown here, the blood flow
attern is analogous to a coronary artery (ie, diastolic-dominant).
tgtsa
tctecab
wcasa
C
aivcvas
aarsuLa
Lbnvgtid
P
H
tbipCT
p9l
caishgitaa
C
a
R
gpio1sttbls
T
oc
699TEE IMAGING OF THE AORTA
he screen (Fig 9). This is an important clinical point andreatly aids identification of the vessel. The LIMA appears inhe long axis, coursing to the left of the screen toward the leftubclavian vein (it then passes inferior to the vein). Slightnteflexion is often useful in imaging the LIMA.
To measure blood flow velocity, place the sample volume inhe artery, at least a few millimeters distal to the origin to avoidollecting the signal from the left subclavian artery. Normally,he LIMA shows a high-resistance flow pattern with almostntirely systolic flow (Fig 10). When the LIMA is used as aonduit and grafted to the left anterior descending coronaryrtery, the flow characteristics change. Blood flow in the LIMAecomes diastolic-dominant (Fig 11).The authors have found that there is a steep learning curve
hen imaging the LIMA, but with practice a high success ratean be achieved. Successful imaging of the LIMA waschieved in 90% of patients studied by Orihashi et al.14 Thisuccess rate was the same as that found by the authors in theirudit described earlier.
linical Utility
Transesophageal echocardiographic assessment of the aorticrch and its branches has numerous clinical applications. First,t can be used to diagnose dissection and malperfusion of archessels before or after cardiopulmonary bypass. It also canonfirm cannula position and assess flow. During surgery in-olving the aortic arch, TEE can confirm flow in the carotidrteries.11 TEE also can be used to assess perfusion afterurgical reconstruction of the aortic arch.
Second, TEE can diagnose LSCA stenosis as described inprevious case report.15 LSCA stenosis can lead to recurrent
ngina after in situ LIMA-to-LAD grafting because of ret-ograde blood flow from the LIMA into the LSCA. LSCAtenosis is present in around 1% of patients undergoingltrasound examination.15 In the presence of significantSCA stenosis (or occluded LSCA), the LIMA can be useds a free graft.
Finally, TEE can be used to assess the flow pattern in theIMA after grafting to the LAD. The flow pattern shouldecome that of a coronary artery (Fig 6) (ie, diastolic-domi-ant). Diastolic-dominant flow is defined as a ratio of diastolicelocity time integral-to-systolic velocity time integral ofreater than 1.14 This ratio has been shown to be highly sensi-ive and specific for adequate graft perfusion.13 Systolic dom-nant flow or equivalent systolic-to-diastolic flow may be in-icative of graft stenosis or occlusion.
DESCENDING THORACIC AORTA
osterior Intercostal Arteries
ow To Acquire the Images
Advance the probe into the stomach, and turn the probe untilhe aorta is seen in short axis. Note that the abdominal aorta cane differentiated from the descending thoracic aorta by anncrease in distance between the probe and the aorta once therobe passes below the diaphragm and into the stomach. PlaceFD on the screen, and start withdrawing the probe slowly.
he first branch arising from the aorta should be the last costerior intercostal artery. When identified, rotate forward to0° so that the artery can be visualized in both the short- andong-axis view.16
Continue withdrawing the probe slowly. The posterior inter-ostal arteries will appear in sequence. Identify both the rightnd left intercostal artery at each level. In the longitudinal view,t is possible to image 2 to 3 posterior intercostal arteriesimultaneously. Use PWD to characterize flow. There will be aigh-resistance flow pattern with prominent and sharp ante-rade systolic flow and little or no flow in diastole. Dopplernterrogation will assist in distinguishing the posterior intercos-al arteries from other branches of the abdominal and thoracicorta. The celiac, superior mesenteric, renal, and bronchialrteries all show low-resistance flow patterns.16
linical Utility
Currently, there are no known clinical applications for im-ging of the posterior intercostal arteries.
ABDOMINAL AORTA
enal Arteries
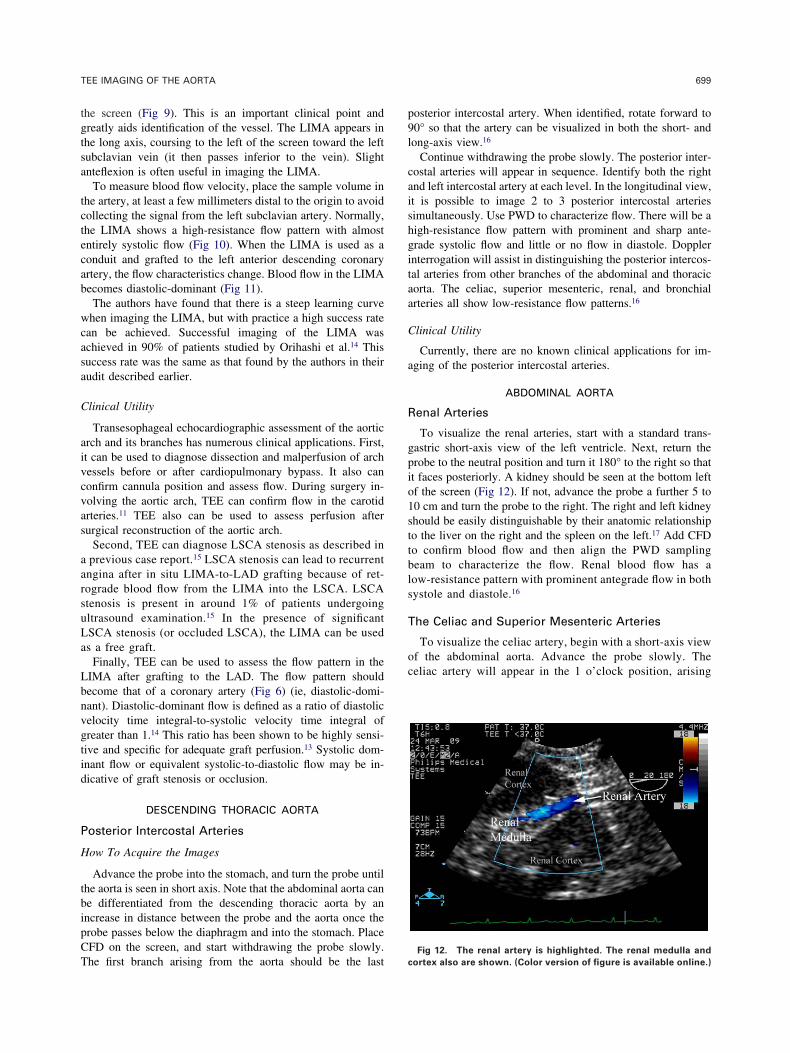
To visualize the renal arteries, start with a standard trans-astric short-axis view of the left ventricle. Next, return therobe to the neutral position and turn it 180° to the right so thatt faces posteriorly. A kidney should be seen at the bottom leftf the screen (Fig 12). If not, advance the probe a further 5 to0 cm and turn the probe to the right. The right and left kidneyhould be easily distinguishable by their anatomic relationshipo the liver on the right and the spleen on the left.17 Add CFDo confirm blood flow and then align the PWD samplingeam to characterize the flow. Renal blood flow has aow-resistance pattern with prominent antegrade flow in bothystole and diastole.16
he Celiac and Superior Mesenteric Arteries
To visualize the celiac artery, begin with a short-axis viewf the abdominal aorta. Advance the probe slowly. Theeliac artery will appear in the 1 o’clock position, arising
Fig 12. The renal artery is highlighted. The renal medulla and
ortex also are shown. (Color version of figure is available online.)

fdfts
vfagtBlr
C
ists
trma
ttcmT
cbuitbflrefasn
pasiqipcib
ltoete1
lg
dc
pe1
c
v
700 SALERNO ET AL
rom the aorta (Fig 13). The celiac artery should be seenividing into branches almost immediately and moving awayrom the aorta.18 PWD interrogation will show a low-resis-ance flow pattern with prominent antegrade flow in bothystole and diastole.16
The superior mesenteric artery should be sought afterisualization of the celiac artery. Advance the probe slowlyrom the level of the celiac artery. The superior mesentericrtery should appear at the 3 o’clock position. It is distin-uishable from the celiac by the fact that it remains adjacento the aorta in its course rather than moving away from it.18
lood flow in the superior mesenteric artery also shows aow-resistance pattern.16 Alternate views of the celiac and supe-ior mesenteric arteries can be obtained by rotating forward to 90°.
linical Utility
Garwood et al17 found that it was possible to detect changesn renal blood flow patterns during coronary artery bypass grafturgery. PWD recordings were made of the renal arteries andhen repeated after the initiation of a dopamine infusion. Pul-
Fig 13. The abdominal aorta and celiac artery are highlighted. The
eliac artery courses away from the aorta and has an early branch
isible. (Color version of figure is available online.)
atility and resistive indices were calculated. Reductions in s
REN
50, 2000
li
st3
ma2
en
Dac
hese indices were indicative of a reduction in renal vascularesistance. Garwood et al suggested that renal artery imagingay be useful for measuring renal blood flow in the perioper-
tive period.Intraoperative detection of atherosclerotic embolization to
he renal artery already has been described.18 Renal dysfunc-ion is a common problem in the population presenting forardiac surgery and brings with it significant morbidity andortality. Further research may find an increasing role forEE as an intraoperative monitor of renal blood flow.TEE can be used to assess dissection and atheroma in the
eliac and superior mesenteric arteries and to assess blood flowefore and after surgery of these arteries.18 TEE can also besed to diagnose mesenteric ischemia. Fiore et al19 used TEEntraoperatively to measure blood flow in the superior mesen-eric artery of 19 patients undergoing off-pump coronary arteryypass graft surgery, showing that the measurement of bloodow distribution to splanchnic viscera was feasible and notingeduced flow during cardiac displacement. Similarly, Orihashit al20 in a small study of patients with acute aortic dissectionound imaging of the superior mesenteric and celiac arties to belmost 100% successful and the information gained to be 100%ensitive and specific in diagnosing clinically apparent intesti-al ischemia.
CONCLUSION
TEE is a minimally invasive and reliable diagnostic tool,roviding anatomic and functional information of the heartnd great vessels. The scope of this imaging technique haslowly broadened to include the branches of the aorta. Prox-mal segments of the coronary arteries can be visualizeduite consistently. The extent of dissection in the aorta andts branches can be assessed accurately. The blood flowattern in the LIMA after grafting to the LAD can beharacterized. With increasing experience among users andmproving quality of TEE probes, evaluation of the aorticranches may become a more routine component of the
tandard TEE examination.REFE
1. Shanewise JS, Cheung AT, Aronson S, et al: ASE/SCA guide-ines for performing a comprehensive intraoperative multiplaneransesophageal echocardiography examination: Recommendationsf the American Society of Echocardiography Council for Intraop-rative Echocardiography and the Society of Cardiovascular Anes-hesiologists Task Force for Certification in Perioperative Trans-sophageal Echocardiography. J Am Soc Echocardiogr 12:884-900,999
2. Tardif JC, Vannan MA, Taylor K, et al: Delineation of extendedengths of coronary arteries by multiplane transesophageal echocardio-raphy. J Am Coll Cardiol 24:909-919, 1994
3. Kasprzak JD, Kratochwil D, Peruga JZ, et al: Coronary anomaliesiagnosed with transesophageal echocardiography: Complementarylinical value in adults. Int J Cardiac Imaging 14:89-95, 1998
4. Kasprzak JD, Drozdz J, Peruga JZ, et al: Definition of flowarameters in proximal nonstenotic coronary arteries using trans-sophageal Doppler echocardiography. Echocardiography 17:141-
CES
5. Samdarshi TE, Nanda NC, Gatewood RP, et al: Usefulness andimitations of transesophageal echocardiography in the assessment of prox-mal coronary artery stenosis. J Am Coll Cardiol 19:572-580, 1992
6. Theunissen T, Coddens J, Foubert L, et al: Intraoperativeeverity assessment of coronary artery stenosis in patients at risk:he role of transesophageal echocardiography. Anesth Analg 102:66-368, 2006
7. Vrublevsky AV, Boshchenko AA, Karpov RS: Diagnostics ofain coronary artery stenoses and occlusions: Multiplane transesoph-
geal Doppler echocardiographic assessment. Eur J Echocardiography:170-177, 2001
8. Firstenberg MS, Greenberg NL, Lin SS, et al: Transesophagealchocardiography assessment of severe ostial left main coronary ste-osis. J Am Soc Echocardiogr 13:696-698, 2000
9. Dawn B, Talley JD, Prince CR, et al: Two-dimensional andoppler transesophageal echocardiographic delineation and flow char-
cterization of anomalous coronary arteries in adults. J Am Soc Echo-
ardiogr 16:1274-1286, 2003
e2
an2
it9
cd
gd
es
da
uA
vo
br
m
701TEE IMAGING OF THE AORTA
10. Tolley PM, Bolsin SN: Diagnostic dilemmas in intraoperativechocardiography. J Cardiothorac Vasc Anaesth 15:793-794,001
11. Orihashi K, Matsuura Y, Sueda T, et al: Aortic arch branchesre no longer a blind zone for transesophageal echocardiography: Aew eye for aortic surgeons. J Thorac Cardiovasc Surg 120:466-472,000
12. Katz ES, Konecky N, Tunick PA, et al: Visualization anddentification of left common carotid and left subclavian arteries: Aransesophageal echocardiographic approach J Am Soc Echocardiogr:58-61, 1996
13. Nanda NC, Thakur AC, Thakur D, et al: Transesophageal echo-ardiographic examination of left subclavian artery branches. Echocar-iography 16:271-77, 1999
14. Orihashi K, Sueda T, Okada K, et al: Left internal thoracic arteryraft assessed by means of intraoperative transesophageal echochar-
iography. Ann Thorac Surg 79:580-584, 2005 c15. Mukhtar OM, Miller AP, Nanda N, et al: Transesophagealchocardiographic identification of left subclavian artery stenosis withteal phenomenon. Echocardiography 17:197-200, 2000
16. Ravi BS, Nanda NC, Htay T, et al: Transesophageal echocar-iographic identification of normal and stenosed posterior intercostalrteries. Echocardiography 20:609-615, 2003
17. Garwood S, Davis E, Harris SN: Intraoperative transesophagealltrasonography can measure renal blood flow. J Cardiothorac Vascnaesth 15:65-71, 200118. Orihashi K, Matsuura Y, Sueda T, et al: Abdominal aorta and
isceral arteries visualized with transesophageal echocardiography duringperations on the aorta. J Thorac Cardiovasc Surg 115:945-947, 1998
19. Fiore G, Brienza N, Cicala P, et al: Superior mesenteric arterylood flow modifications during off-pump coronary surgery. Ann Tho-ac Surg 82:62-68, 2006
20. Orihashi K, Sueda T, Okada K, et al: Perioperative diagnosis ofesenteric ischemia in acute aortic dissection by tranesophageal echo-
ardiography. Eur J Cardiothorac Surg 28:871-876, 2005


