Embed Size (px)
Citation preview
Univers
ity of
Cap
e Tow
n
Dissertation submitted in fulfilment of the degree of
MASTER OF SCIENCE IN ENGINEERING
Department of Mechanical Engineering
University of Cape Town
August 2013
THERMAL AND CHEMICAL ANALYSIS OF CARBONACEOUS MATERIALS: DIESEL SOOT AND
DIESEL FUEL REACTOR DEPOSITS
Irénée Kaminuza
Supervised by
Chris Woolard
The copyright of this thesis vests in the author. No quotation from it or information derived from it is to be published without full acknowledgement of the source. The thesis is to be used for private study or non-commercial research purposes only.
Published by the University of Cape Town (UCT) in terms of the non-exclusive license granted to UCT by the author.
Univers
ity of
Cap
e Tow
n

Univers
ity of
Cap
e Tow
n

Univers
ity of
Cap
e Tow
n
PLAGIARISM DECLARATION|2013
i
Plagiarism declaration
1. I know that plagiarism is wrong. Plagiarism is using another’s work and to pretend that it is one’s own.
2. This dissertation is my own work. 3. I acknowledge that pretending that someone else's work, or part of it, is my own is
wrong, and declare that this is my own work. 4. I have used the IEEE 2006 referencing style as the convention for citation and
referencing. Each significant contribution to, and quotation in, this dissertation from the work, or works of other people has been attributed and referenced.
__________________
Irénée Kaminuza

Univers
ity of
Cap
e Tow
n
ACKNOWLEDGEMENTS|2013
ii
Acknowledgements
“Gratitude is not only the greatest of virtues, but the parent of all others.”-Cicero
I would like thank the following persons or organisations for aiding me throughout my MSc studies:
1. First and foremost, I would like to thank my sponsors, Sasol Technology Fuels Technology, and Canon Collins Trust, as funding is the lifeblood of every student. I was fortunate to have such generous patronage from both sponsors during my MSc degree and I thank them for investing in my future.
2. I would like thank my supervisor, Dr Chris Woolard, for recruiting me and introducing the world of petroleum science engineering at the Sasol Advanced Fuels Laboratory (SAFL). I appreciated his guidance and empathy. I also thank him for welcoming me to his home for the end of year functions and for introducing Journal Club to the chemists in the research group. It was a great way to learn and engage with others. I really appreciate the amount of time and dedication he put into assisting me in interpreting my data. Furthermore I would like to express my gratitude towards him for arranging me funding during this past year.
3. I would like to express a great deal of appreciation towards Dr. Stefan De Goede for being an exemplary mentor throughout my MSc. Like Dr Woolard, Stefan is an incredibly busy man, which is why I felt privileged as he spent a great deal of his time assisting me. From providing me with relevant literature material, organising my samples, exposing me to several analytical facilities, reading and offering input into the written aspect of my thesis, organising formal and informal discussions or just emailing me to inquire about my progress, Stefan went well and beyond the call of duty.
4. A big thank you goes to Mrs Miranda Waldron and Dr François Cummings of the Electron Microscope Unit at UCT for helping me to image my samples. Their warmth and assistance is greatly appreciated.
5. I would like to thank Ms Shanielle Botha for her help with the GC-MS. 6. Mr Ross Burnham deserves a big thank you. His help around the laboratory is much
appreciated. He acquainted me with many of the analytical equipment 7. To Mr Victor Burger and Mr Gerhard Lourens, I thank you for your help around the
laboratory. Thank you for demystifying an engineering workshop. 8. Ms Beverley Glass deserves a mention. Her assistance with quotes and bursary
payments is appreciated. In addition I want to thank her for the office humour and for being a wonderful colleague and friend.
9. Deep appreciation goes to Ms Jeanri Coetzee for being such a great help around the laboratory. I appreciate the trouble she went through in organising quartz crystal

Univers
ity of
Cap
e Tow
n
ACKNOWLEDGEMENTS|2013
iii
microbalance experiments for me and for keeping the laboratory in order. I would also like to thank her for her incredible friendship. I will miss her.
10. To Uyuenendiwannyi Mandavha, thanks for being a wonderful friend and colleague, my days at SAFL were brightened because of you.
11. To Mr Keenan Heynes and Mr Wesley Neutt. I really appreciate the energy and enthusiasm you brought to the lab and assisting me tremendously during vacation work at SAFL. For the first time as SAFL the flow reactor worked properly, and it was due to you guys. Thank you for your friendship.
12. I would like to thank Mr Lucky Mokwena from the Central Analytical Facility (CAF) at the University of Stellenbosch for performing GC-MS on some of my soot samples while the GC-MS at SAFL was faulty.
13. A word of thanks goes to Mr Fletcher Hiten (from the CAF) for performing ESI-MS on my fuel samples as well as ICP-MS on my soot sample.
14. I would like to thank Ian Scott, Gary McFarlane, Rudi Russouw, Warren Randall, Chris Scully, Washington Mudenha, Timothy King, Marlan Perumal, Dylan Smit, Dirren Govender, Leanne Robertson, René Laryea-Goldsmith, Gareth Floweday, Aiden Ehrenreich, Mariam Ajam, Andrew Winstanly, Hundzukani Vukeya and Toby Rockstroh for being wonderful friends and colleagues.
15. Thanks also go out to my friends outside my research group for lifting my spirits during the tough times. A special mention goes to Juliette Dusabe, Natalie Hendrickse, Jason Cottle, Graham Morrison, Khanyisa Mubunda, Lisa Williams, Bianca Kriel, Ncediwe Ndlulwa and Sabina Yusuf Shaik. Thank you for your assistance throughout this journey.
16. To Stacey-Leigh Titus, my fantastic dance partner, I truly appreciated your encouragement and support particularly during the last stretch of my thesis.
17. Finally I would like to thank my family for their support. To my parents, I thank them for their genes and for providing me with a warm and loving living environment. I want to thank my siblings, Patrick, Celestine and Fabrice, for providing me with the motivation to do better and grow. I also want to thank them for their friendships.
Univers
ity of
Cap
e Tow
n
TABLE OF CONTENTS|2013
iv
Table of Contents
Plagiarism declaration ................................................................................................................. i
Acknowledgements .................................................................................................................... ii
List of figures ......................................................................................................................... viii
List of tables ........................................................................................................................... xiii
List of abbreviations ................................................................................................................ xv
Abstract .................................................................................................................................. xvii
1 Introduction ........................................................................................................................ 1
1.1 Subject and motivation for this study .......................................................................... 1
1.1.1 Diesel particulate matter (PM) ............................................................................. 1
1.1.2 Diesel deposits ..................................................................................................... 2
1.2 Limitations and scope of the study .............................................................................. 3
1.2.1 Diesel particulate matter ...................................................................................... 3
1.2.2 Diesel deposits ..................................................................................................... 3
1.3 Plan of development .................................................................................................... 4
2 Literature Review ............................................................................................................... 5
2.1 Diesel fuel ................................................................................................................... 5
2.1.1 Source and composition of diesel fuel ................................................................. 5
2.2 Fuel and engine oil additives ....................................................................................... 6
2.3 Diesel PM emissions ................................................................................................... 7
2.3.1 Components of diesel PM .................................................................................... 8
2.3.2 Composition of the SOF and its effects on biological systems ........................... 9
2.4 Thermo-oxidative stability of middle distillate fuels ................................................ 12
2.4.1 Diesel injector deposits ...................................................................................... 12
2.4.2 Mechanism of deposit formation ....................................................................... 13
2.4.3 Fuel deposit production...................................................................................... 16
2.4.4 Deposit characterisation techniques ................................................................... 18
3 Experimental methods ...................................................................................................... 28
3.1 Diesel soot ................................................................................................................. 28
3.1.1 Source of soot .................................................................................................... 28
3.1.2 Analytical techniques and protocol adopted ...................................................... 29
3.1.3 Gas Chromatography - Mass Spectrometry (GC-MS)....................................... 32
Univers
ity of
Cap
e Tow
n
TABLE OF CONTENTS|2013
v
3.2 Diesel fuel deposits ................................................................................................... 34
3.2.1 Materials ............................................................................................................ 34
3.2.2 Flask Reactor conditions .................................................................................... 36
3.2.3 Sampling methodology for reactor deposits ...................................................... 44
3.2.4 Techniques employed to characterise fuel deposits ........................................... 45
4 Chemical and physical characterisation of soot ............................................................... 49
4.1 The effect of extraction solvent on the quantity of the SOF ..................................... 49
4.2 Chemical speciation of SOF derived diesel soot ....................................................... 50
4.2.1 n-Hexane extract ................................................................................................ 50
4.2.2 Cyclohexane extract ........................................................................................... 51
4.2.3 Toluene extract................................................................................................... 52
4.2.4 Acetone extract .................................................................................................. 53
4.2.5 Methanol extract ................................................................................................ 54
4.2.6 Dichloromethane extract .................................................................................... 55
4.3 Thermogravimetric analysis of soot .......................................................................... 57
4.4 Electron microscopy of diesel bus soot ..................................................................... 61
4.5 Comparison of the extraction potential and specificity of a variety of solvents ....... 62
4.6 Comparison of the analysis of SOF and VOF ........................................................... 66
4.7 Conclusions ............................................................................................................... 68
5 Evaluation of depositing propensity of diesel fuels .......................................................... 70
5.1 QCM measurements .................................................................................................. 70
5.2 Discussion ................................................................................................................. 72
5.3 Conclusions ............................................................................................................... 73
6 Analysis of flask reactor deposits ..................................................................................... 74
6.1 Visual observations ................................................................................................... 74
6.2 Transmission electron microscopy ............................................................................ 75
6.3 TGA-MS analysis of flask reactor diesel deposits .................................................... 78
6.3.1 Thermal analysis of unstressed and stressed diesel fuels in nitrogen ................ 78
6.3.2 Oxidative TGA of stressed fuels ........................................................................ 82
6.4 FTIR investigation of the fuels.................................................................................. 86
6.5 ESI-MS evaluation of soluble precursor deposits ..................................................... 89
6.5.1 Unstressed commercial diesel ............................................................................ 89
6.5.2 Stressed commercial diesel ................................................................................ 91
Univers
ity of
Cap
e Tow
n
TABLE OF CONTENTS|2013
vi
6.5.3 Unstressed EN590 diesel ................................................................................... 94
6.5.4 Stressed EN590 diesel........................................................................................ 96
6.5.5 Unstressed RME20 ............................................................................................ 98
6.5.6 Stressed RME20............................................................................................... 101
6.5.7 SME20 unstressed ............................................................................................ 104
6.5.8 SME20 stressed ................................................................................................ 107
6.6 Discussion ............................................................................................................... 110
6.7 Conclusions ............................................................................................................. 114
7 Closed bomb reactor deposits ......................................................................................... 115
7.1 Results and discussion ............................................................................................. 115
7.2 Visual observations ................................................................................................. 115
7.2.1 Commercial diesel ........................................................................................... 115
7.2.2 EN590 diesel .................................................................................................... 116
7.2.3 RME20 and SME20 ......................................................................................... 116
7.3 Transmission electron microscopy .......................................................................... 117
7.4 TGA-MS.................................................................................................................. 120
7.4.1 Deposit oxidation ............................................................................................. 120
7.5 Discussion ............................................................................................................... 124
7.6 Conclusions ............................................................................................................. 125
8 Fuel degradation in a flow reactor .................................................................................. 127
8.1 Results and discussion ............................................................................................. 127
8.2 Conclusions ............................................................................................................. 129
9 Conclusions .................................................................................................................... 130
10 Recommendations and further work ........................................................................... 133
10.1 Further work ............................................................................................................ 133
11 List of references......................................................................................................... 136
12 Appendices .................................................................................................................. 145
12.1 APPENDIX A – Soot extracts ................................................................................ 145
12.1.1 SOF data........................................................................................................... 145
12.2 APPENDIX B – FAME composition...................................................................... 165
12.3 Appendix C – Flask reactor stressing ...................................................................... 166
12.3.1 Thermal analysis repeatability ......................................................................... 166
12.3.2 Methanol extracts ............................................................................................. 167

Univers
ity of
Cap
e Tow
n
TABLE OF CONTENTS|2013
vii
12.3.3 ESI-MS ............................................................................................................ 168
12.4 Appendix D - Cellulose vs glass thimbles for efficient Soxhlet extraction ............ 169
12.5 Appendix E – TGA of Munktell filter paper ........................................................... 170
Univers
ity of
Cap
e Tow
n
LIST OF FIGURES|2013
viii
List of figures
Figure 2.1: Heteroatomic species found in diesel fuel. Left to right: dibenzothiophene, carbazole and phenol ...................................................................................................... 5
Figure 2.2: Trans-esterification reaction used to produce FAME ............................................. 6 Figure 2.3: Functional groups of lubricity additives. Left to right: carboxylic acid, carboxylic
acid ester and carboxylic acid amide ............................................................................. 7 Figure 2.4: TEM images depicting the shape and internal structure of a primary soot particle
(spherule) as component of a larger agglomerate, reproduced from [33] ...................... 8 Figure 2.5: Clean (left) and fouled (right) injector, reproduced from [47] .............................. 13 Figure 2.6: Reactions showing oxidation of hydrocarbon by free-radical chain reactions [45]
...................................................................................................................................... 14 Figure 2.7: Condensation and polymerisation reactions of primary oxidation products,
reproduced from [45] .................................................................................................. 14 Figure 2.8: Scheme by which SMORS are formed [49] .......................................................... 15 Figure 2.9: Proposed reaction scheme for the thermo-oxidative degradation of methyl
linoleate [59]. ............................................................................................................... 16 Figure 2.10: TEM at image of a deposit sample from a field filter [46] .................................. 18 Figure 2.11: TEM image of deposits from an HPDI (high pressure diesel injector) at
increasing magnifications [10] ..................................................................................... 19 Figure 2.12: HRTEM images of particle deposits obtained from an HPDI [10] ..................... 19 Figure 2.13: TEM images of deposits formed from thermal oxidative degradation of
n-hexadecane at 10°C and 31bar for 2.5h [10] ............................................................ 20 Figure 2.14: TG analysis for the oxidation of cylinder deposits in air [62]. The numbers in the
legend reflect the combined diesel and biodiesel content of the fuels ......................... 21 Figure 2.15: Oxidative DSC profiles of diesel carbon deposit derived from diesel-water
emulsions with varying amounts of water [62] ............................................................ 22 Figure 2.16: CO2 and H2O evolution profiles for the oxidation of carbon and hydrogen
species in HPDI deposits in an air atmosphere [10]. ................................................... 23 Figure 2.17: Evolved CO2 and H2O profiles for the oxidation in air of solid deposits formed
from n-hexadecane degradation [10] ........................................................................... 24 Figure 2.18: Pneumatically assisted electrospray, reproduced from [71] ................................ 25 Figure 3.1: Schematic of the flask reactor setup ...................................................................... 37 Figure 3.2: Schematic of the fluidised sand bath used to degrade fuel.................................... 39 Figure 3.3: Schematic of the closed reactor bomb/vessel used to degrade fuel ...................... 40 Figure 3.4: Schematic of the flow reactor set up used in this study ........................................ 42 Figure 4.1: The mean SOF values obtained by Soxhlet extraction of commuter bus soot with
six different solvents. Each bar graph represents the average of 5 discrete experiments. The error bars indicate the 95% confidence interval. .................................................. 49
Univers
ity of
Cap
e Tow
n
LIST OF FIGURES|2013
ix
Figure 4.2: Class distribution of molecules extracted from commuter bus soot by n-hexane, as determined by GC-MS ................................................................................................. 51
Figure 4.3: Class distribution of molecules extracted from commuter bus soot by cyclohexane, as determined by GC-MS ....................................................................... 52
Figure 4.4: Class distribution of molecules extracted from commuter bus soot by toluene, as determined by GC-MS ................................................................................................. 53
Figure 4.5: Class distribution of molecules extracted from commuter bus soot by acetone, as determined by GC-MS ................................................................................................. 54
Figure 4.6: Class distribution of molecules extracted from commuter bus soot by methanol, as determined by GC-MS ................................................................................................. 55
Figure 4.7: Class distribution of molecules extracted from commuter bus soot by dichloromethane, as determined by GC-MS (own analysis) ....................................... 56
Figure 4.8: Class distribution of molecules extracted from commuter bus soot by dichloromethane, as determined by GC-MS (University of Stellenbosch analysis) .... 57
Figure 4.9: TGA thermograms of commuter bus soot when exposed to nitrogen and air. Solid lines = mass loss; dashed lines = derivative ................................................................. 58
Figure 4.10: CO2 and mass loss curves of as received commuter soot which was heated from ambient to 700°C at 10°C/min in flowing synthetic air ............................................... 59
Figure 4.11: CO2 and mass loss curves of as received commuter soot which was heated from ambient to 700ºC at 10°C/min in flowing nitrogen. Full scale on the CO2 axis is 1 x 10⁻⁶bar .......................................................................................................................... 60
Figure 4.12: Electron micrographs of commuter bus soot in a) scanning mode and b) EBSD mode ............................................................................................................................. 61
Figure 4.13: Relationship between quantity of SOF extracted and solvent polarity ............... 63 Figure 4.14: TGA thermograms of commuter bus soot in nitrogen in the original (red)
condition and after acetone extraction. Mass loss curves are solid lines, derivatives are dashed ........................................................................................................................... 68
Figure 5.1: QCM traces of four diesel fuels which were exposed to reactor conditions of 140°C and 1 bar of synthetic air for 15 h. The plots indicate mass (deposit) accumulation (dashed lines) and oxygen consumption (solid lines) ............................ 70
Figure 5.2: Dependence of ln pO2 on time for the thermo-oxidative stressing of RME20. Solid curve = natural logarithm of oxygen pressure; dashed curve = temperature ............... 71
Figure 6.1: Four neat fuels and their corresponding stressed versions: 1) Neat commercial diesel, 2) stressed commercial diesel, 3) neat EN590 diesel 4) stressed EN590 diesel 5) neat SME20, 6) stressed SME20, 7) neat RME20 8) stressed RME20 ................... 74
Figure 6.2: Stressed fuel deposits investigated by TEM: a) Commercial diesel, b) EN590 diesel, c) RME20 .......................................................................................................... 75
Figure 6.3: TEM images of deposits formed from SME20. The images are shown in order of increasing magnification .............................................................................................. 77
Univers
ity of
Cap
e Tow
n
LIST OF FIGURES|2013
x
Figure 6.4: Thermograms of stressed (red) and unstressed (blue) commercial diesel. Experiments were conducted under nitrogen at a heating rate of 10oC/min. Solid lines – mass loss curves; dashed lines – derivatives ............................................................. 78
Figure 6.5: Thermograms of the two layers of stressed (red (bottom) and green (top)) and unstressed (blue) EN590 diesel. Experiments were conducted under nitrogen at a heating rate of 10oC/min. Solid lines – mass loss curves; dashed lines – derivatives . 79
Figure 6.6: Thermograms of the two layers of stressed (red (bottom) and blue (top)) and unstressed (green) RME20, compared with unstressed RME20. Experiments were conducted under nitrogen at a heating rate of 10oC/min .............................................. 80
Figure 6.7: Thermograms of unstressed (green) and stressed (red) SME20. Experiments were conducted under nitrogen at a heating rate of 10oC/min .............................................. 81
Figure 6.8: Mass loss, DTG and CO2 evolution curves of stressed commercial diesel. Experiments were conducted under air at a heating rate of 10oC/min ......................... 83
Figure 6.9: Mass loss, DTG and CO2 evolution curves of stressed EN590 diesel (lower layer). Experiments were conducted under air at a heating rate of 10oC/min ......................... 84
Figure 6.10: Mass loss, DTG and CO2 evolution curves of stressed RME20 diesel (lower layer). Experiments were conducted under air at a heating rate of 10oC/min.............. 85
Figure 6.11: Mass loss, DTG and CO2 evolution curves of stressed RME20 diesel (lower layer). Experiments were conducted under air at a heating rate of 10oC/min.............. 85
Figure 6.12: FTIR spectra of neat commercial diesel and stressed commercial diesel ........... 86 Figure 6.13: FTIR spectra of neat EN590 diesel and the two layers of stressed EN590 diesel
...................................................................................................................................... 87 Figure 6.14: FTIR spectra of neat RME20 diesel and stressed RME20 (top and bottom layers)
...................................................................................................................................... 88 Figure 6.15: FTIR spectra of neat SME20 diesel and stressed SME20 ................................... 89 Figure 6.16: ESI (+) MS in the m/z 100-1000 for the methanol fraction of unstressed
commercial diesel......................................................................................................... 90 Figure 6.17: ESI (+) MS in the m/z 100-1000 of the methanol fraction of stressed commercial
diesel ............................................................................................................................ 92 Figure 6.18: ESI (+) MS profile in the m/z 100-1000 of the methanol fraction of unstressed
EN590 diesel. ............................................................................................................... 95 Figure 6.19: ESI (+) MS profile in the m/z 100-1000 for the methanol fraction of stressed
EN590 diesel ................................................................................................................ 97 Figure 6.20: Expanded positive ESI-MS profile in the range m/z 100-1000 for unstressed
RME20 methanol fraction ............................................................................................ 99 Figure 6.21: ESI (+) MS spectrum of unstressed neat RME in the range of m/z 100-1000 .. 100 Figure 6.22: ESI (+) MS profile in the m/z 100-1000 for methanol fraction of stressed
RME20 ....................................................................................................................... 102 Figure 6.23: ESI (+) MS spectrum of stressed neat RME in the range of m/z 100-1000 ...... 103
Univers
ity of
Cap
e Tow
n
LIST OF FIGURES|2013
xi
Figure 6.24: ESI (+) MS in the m/z 100-1000 for the methanol fraction of unstressed SME20. .................................................................................................................................... 105
Figure 6.25: ESI (+) MS spectrum of unstressed neat SME in the range of m/z100-1000 ... 106 Figure 6.26: ESI (+) MS in the m/z 100-1000 for methanol fraction of stressed SME20 ..... 108 Figure 6.27: ESI (+) MS spectrum of stressed neat SME in the range of m/z100-1000 ....... 109 Figure 6.28: Comparison of the thermograms to various stressed fuels. Experiments were
conducted under nitrogen at a heating rate of 10oC/min ............................................ 110 Figure 6.29: Comparison of the FTIR spectra of stressed fuels ............................................ 113 Figure 7.1: Deposits derived from closed bomb degradation of commercial diesel at 250 °C
for 24h at a pressure of 10bar: left) the reactor lid vessel body and b) the reactor lid .................................................................................................................................... 115
Figure 7.2: Deposits derived from closed bomb degradation of EN590 diesel at 250 °C for 24h at a pressure of 10bar: left) the reactor lid vessel body and b) the reactor lid .... 116
Figure 7.3: Deposits derived from closed bomb degradation of RME20 at 250 °C for 24h at a pressure of 10bar: left) the reactor lid vessel body and b) the reactor lid .................. 117
Figure 7.4: Deposits derived from closed bomb degradation of SME20 at 250 °C for 24h at a pressure of 10bar: left) the reactor lid vessel body and b) the reactor lid .................. 117
Figure 7.5: TEM micrographs of deposits formed from stressing commercial diesel in a closed bomb reactor; left) lower magnification image and right) higher magnification image .......................................................................................................................... 118
Figure 7.6: TEM micrographs of deposits formed from stressing EN590 diesel in a closed bomb reactor; left) lower magnification image and right) higher magnification image .................................................................................................................................... 118
Figure 7.7: TEM micrographs of deposits formed from stressing RME20 in a closed bomb reactor; left) lower magnification image and right) higher magnification image ...... 119
Figure 7.8: TEM micrographs of deposits formed from stressing SME20 in a closed bomb reactor; left) lower magnification image and right) higher magnification image ...... 119
Figure 7.9: Oxidative mass loss, and H2O and CO2 profiles of fuel deposits derived from thermo-oxidative stressing of commercial diesel inside the reactor bombs charged with 10 bar oxygen pressure and at 250°C for 24h .................................................... 121
Figure 7.10: Oxidative mass loss, and H2O and CO2 profiles of fuel deposits derived from thermo-oxidative stressing of EN590 diesel inside the reactor bombs charged with 10 bar oxygen pressure and at 250°C for 24h ................................................................. 122
Figure 7.11: Oxidative mass loss, and H2O and CO2 profiles of fuel deposits derived from thermo-oxidative stressing of RME20 inside the reactor bombs charged with 10 bar oxygen pressure and at 250°C for 24h ....................................................................... 123
Figure 7.12: Oxidative mass loss, and H2O and CO2 profiles of fuel deposits derived from thermo-oxidative stressing of SME20 inside the reactor bombs charged with 10 bar oxygen pressure and at 250°C for 24h ....................................................................... 124
Univers
ity of
Cap
e Tow
n
LIST OF FIGURES|2013
xii
Figure 8.1: Digital microscope image of sectioned flow reactor tubes which contained (a) (white arrow) SME20 doped with 10ppm zinc and (b) (blue arrow) EN590 diesel and were stressed for 24 hours in a flow reactor at 250°C with fuel line pressure of 10 bar .................................................................................................................................... 128
Figure 8.2: Mass loss and CO2 evolution of reactor tube exposed to EN590 diesel doped with 10 ppm zinc ................................................................................................................ 128
Figure 12.1: Repeat thermograms for the evaporation/decomposition of neat EN590 diesel and RME20 and stressed EN590 diesel (top layer). Experiments were conducted under nitrogen at a heating rate of 10oC/min. ............................................................ 166
Figure 12.2: Methanol fractions of stressed and unstressed fuel. Methanol was added to both unstressed and stressed fuels (at a ratio of fuel: methanol of 5:2) in order to facilitate extraction of the polar fractions. (1) unstressed RME20, (2) stressed RME20, (3) unstressed EN590 diesel, (4) stressed EN590 diesel, (5) unstressed commercial diesel, (6) stressed commercial diesel, (7) unstressed SME20 and (8) stressed SME20. ..... 167
Figure 12.3: Expanded positive ESI-MS spectrum profile in the m/z 100-1000 range for a blank injection ............................................................................................................ 168
Figure 12.4: (left) Cellulose thimble; (right) glass thimble ................................................... 169 Figure 12.5: Oxidative TGA-profile curve of the glass fibre filter used to collect sand bath
reactor deposits........................................................................................................... 170
Univers
ity of
Cap
e Tow
n
LIST OF TABLES|2013
xiii
List of tables
Table 1.1: Techniques employed for the characterisation of diesel PM .................................... 3 Table 2.1: List of 16 PAHs on the USEPA’s priority list, adapted from [3] ........................... 10 Table 2.2: Chemical components in exhaust PM, adapted from [4] ........................................ 11 Table 3.1: Engine characteristics of the commuter bus from which soot was sampled .......... 28 Table 3.2: Lubricating oil properties, used by the commuter bus from which soot was
sampled ........................................................................................................................ 29 Table 3.3: Solvents used for soot extraction ............................................................................ 31 Table 3.4: GC and MS parameters employed in the determination of the SOF ...................... 33 Table 3.5: Properties of the fuels used ..................................................................................... 35 Table 3.6: Gases used and their quality grade ......................................................................... 35 Table 3.7: Flask reactor conditions .......................................................................................... 36 Table 3.8: Experimental conditions used in reactor flask studies ............................................ 38 Table 3.9: Degradation conditions in the fluidised sand bath experiments ............................. 40 Table 3.10: Experimental conditions and flow reactor tube characteristics ............................ 42 Table 3.11: Set of conditions that fuels were subjected during QCM experiments ................ 44 Table 3.12: Experimental conditions adopted for analysis of diesel soot in the TGA ............ 45 Table 3.13: MS instrument information and experimental parameters for analysis of diesel
deposits ......................................................................................................................... 46 Table 3.14: FTIR instrument description and experimental parameters .................................. 46 Table 3.15: Instrument employed in the acquisition of ESI-MS data...................................... 48 Table 4.1: ICP-MS elemental analysis of commuter bus soot (excluding carbon and oxygen)
...................................................................................................................................... 62 Table 4.2: The polarity index of the solvents used in this study, adapted from [68]. Hansen
solubility parameters (HSPs) are from [72] ................................................................. 63 Table 4.3: Percentage of soot extracted by chemical class and extraction solvent .................. 64 Table 5.1: Summary statistics for QCM thermo-oxidative stressing ....................................... 72 Table 6.1: Possible homologous series in pre-stress commercial diesel ................................. 91 Table 6.2: Possible homologous series in post-stress commercial diesel ................................ 93 Table 6.3: Possible homologous series (identified by 14 m/z (-CH2-) increments) in
unstressed EN590 diesel .............................................................................................. 94 Table 6.4: Possible homologous series, by (identified by 14 m/z (-CH2-) increments)
increments, of post-stressed EN590 ............................................................................. 96 Table 6.5: Possible homologous series in unstressed RME20 ................................................. 98 Table 6.6: Possible homologous series that were found in stressed RME20......................... 101 Table 6.7: Possible homologous series in unstressed SME20 ............................................... 104 Table 6.8: Possible homologous series in unstressed SME20 ............................................... 107 Table 6.9: Summary statistics decomposition/evaporation of stressed fuels in nitrogen ...... 111
Univers
ity of
Cap
e Tow
n
LIST OF TABLES|2013
xiv
Table 8.1: Fuels tested and deposit character ........................................................................ 127 Table 12.1: The mean SOF of six solvents and their corresponding standard deviations (N=5)
.................................................................................................................................... 145 Table 12.2: Chemical speciation of the hexane extract of commuter bus soot ...................... 146 Table 12.3: Chemical speciation of the cyclohexane extract of commuter bus soot ............. 150 Table 12.4: Chemical speciation of the toluene extract of commuter bus soot ..................... 154 Table 12.5: Chemical speciation of the acetone extract of commuter bus soot ..................... 157 Table 12.6: Chemical speciation of the methanol extract of commuter bus diesel soot ........ 160 Table 12.7: Chemical speciation of the dichloromethane extract of commuter bus diesel soot
(own analysis) ............................................................................................................ 162 Table 12.8: Instrumental parameters used for GC-MS analysis at the University of
Stellenbosch ............................................................................................................... 164 Table 12.9: Fatty acid composition of rapeseed oil and soybean oil [78] ............................. 165
Univers
ity of
Cap
e Tow
n
LIST OF ABBREVIATIONS|2013
xv
List of abbreviations
AMU atomic mass unit avg average B20 diesel which contains 20% fatty acid methyl ester (v/v) B100 100% FAME (biodiesel) CCD charge-coupled device CDPF catalysed diesel particulate filter CFPP cold filter plugging point DCA deposit control additive DOC diesel oxidation catalyst DPF diesel particulate filter DRIFTS diffuse reflectance infrared Fourier- transform spectrometry DSC differential scanning calorimetry DTG differential thermogravimetry dyno. dynamometer EBSD electron backscattered detection EDS energy dispersive spectroscopy EGA evolved gas analysis EGR exhaust gas recirculation EI electron ionisation EMU Electron Microscope Unit EN590 European Union automotive diesel fuel quality specification eng engine ESI-MS electrospray ionisation - mass spectrometry ESI (+) MS positive electrospray ionisation - mass spectrometry EU European Union FAME fatty acid methyl ester FTIR Fourier transform infrared spectroscopy GC-MS gas chromatography - mass spectrometry GIF Gatan image filter HACA hydrogen abstraction – carbon addition HFRR high frequency reciprocating rig HPDI high pressure diesel injector HPLC high performance liquid chromatography HRTEM high-resolution transmission electron microscopy HSP Hansen solubility parameter ICP-MS inductively coupled plasma – mass spectrometry Jet A-1 civil aviation turbine fuel used outside the United States of America
Univers
ity of
Cap
e Tow
n
LIST OF ABBREVIATIONS|2013
xvi
MALDI-MS matrix-assisted laser desorption/ionisation – mass spectrometry max. maximum m/z mass to charge ratio NMR nuclear magnetic resonance NOx nitrogen oxides PAH polyaromatic hydrocarbon POME palm oil methyl ester PM particulate matter QCM quartz crystal microbalance RME rapeseed methyl ester RME20 rapeseed methyl esters, blended with 80% EN590 diesel (v/v) rpm revolutions per minute SAFL Sasol Advanced Fuels Laboratory SEM scanning electron microscopy SFAC Sasol Fuels Application Centre SL-Bocle sliding load Bocle SME soybean methyl ester SME20 soybean methyl esters, blended with 80% EN590 diesel (v/v) SMORS soluble macromolecular oxidatively reactive species SOF soluble organic fraction SOx sulfur oxides syn air synthetic air TEM transmission electron microscopy TGA-MS thermogravimetric analysis - mass spectrometry TIC total ion count TIGF teflon impregnated glass fibre TOD thermo-oxidative deposit TOS thermo-oxidative stability TPO temperature programmed oxidation UCT University of Cape Town USEPA United States Environmental Protection Agency wt% mass (or weight) per cent
Univers
ity of
Cap
e Tow
n
ABSTRACT|2013
xvii
Abstract
Methods for the characterisation of fuel-derived carbonaceous materials were assessed. These methods were applied to two such materials, viz. diesel soot and diesel fuel deposits.
Diesel soot
Diesel soot, sampled from a commuter bus, was characterised using an array of analytical techniques. Physical and chemical characterisation of diesel soot was conducted with particular interest in the component of soot known as the soluble organic fraction (SOF). The SOF represents adsorbed chemical species and is traditionally obtained via Soxhlet extraction of soot using an organic solvent. Chemical speciation of the SOF was performed using GC-MS analysis.
Five solvents (hexane, cyclohexane, toluene, methanol and acetone) were compared with dichloromethane, the most extensively used solvent for the extraction of soot with respect to their ability to extract a variety of species, including polyaromatic hydrocarbons (PAHs) and potential endocrine disrupting molecules, e.g. phthalates.
Extraction results suggest that the SOF quantity depends significantly on the extraction solvent. For the soots analysed, SOF ranged between 1.0 and 4.8 wt%, depending on the solvent used. Moreover, it was shown that polar solvents extracted a greater SOF than non-polar solvents. For PAH extraction the order of efficiency was acetone > methanol > > toluene > hexane > cyclohexane while for esters, including endocrine disrupting phthalates, the order in efficiency was methanol > dichloromethane >acetone > toluene > > hexane > cyclohexane> n-hexane. A suggestion is made that to maximise SOF, sequential extraction should be made.
Thermogravimetric analysis revealed a discrepancy between VOF and SOF which was ascribed to the presence of sulfurous and sulfuric acid which were not extracted by the organic solvents investigated
Fuel deposits
Fuel was degraded in three reaction vessels, viz. a continuous flow reactor, open glass flasks and closed metal reactors (bombs) in an attempt to synthesise carbonaceous deposits, analogous to those found in diesel injectors. The degradation of four diesel fuels, viz. an EN590 reference diesel, a commercial diesel and two B20 biodiesel blends (rapeseed and soybean methyl esters blended with EN590 diesel), was investigated in the thermo-oxidative temperature regime, i.e. below 300°C.
Univers
ity of
Cap
e Tow
n
ABSTRACT|2013
xviii
The depositing propensity of the fuels was investigated using a quartz crystal microbalance (QCM). Data from the QCM indicated that the test fuels had different deposition propensities under stress conditions of 140ºC for 15 h with headspace air. The deposition for the test fuels was as follows: 1.3 µg/cm2 (EN590 diesel), 6.4 µg/cm2 (B20, RME), 11.9 µg/cm2 (B20, SME) and 0.1 µg/cm2 (commercial diesel). These trends were in agreements with TEM and TGA-MS results of both flask reaction and reactor bomb deposits where the biodiesel blends exhibited greater degradation than EN590 diesel and commercial diesel. The low deposition propensity of commercial diesel was ascribed to the presence of additives such as deposit control additives.
The test fuels degraded to different extents under flask reactor conditions (140ºC, 15 h and 50 m flowing synthetic air). Mixtures of gums and carbonaceous deposits were produced. Thermogravimetric analysis, with mass spectrometric analysis of the evolved gases (TGA-MS), of mixture deposits showed that the carbonaceous deposits therein had lower thermal oxidative stability (combustion of deposits was complete by 550ºC) than diesel injector deposits (complete combustion occurs around 750ºC), reported elsewhere. The higher oxidative reactivity of flask reactor deposits was attributed to their association with oxygen moieties and amorphous structure, as shown by transmission electron microscopy (TEM). ESI-MS and FTIR confirmed the formation of oxygen-containing species and high molecular weight species. The formation of high molecular weight species was found to be consistent with the formation of a low volatility component as observed by TGA.
Experiments in closed metal reactors also produced gums and carbonaceous deposits. TEM micrographs showed that these deposits were amorphous and lacked regular interference patterns, typical of graphitic structures with the exception of deposits formed from SME20 at 240oC in a closed bomb. In both reactor systems, biodiesel blends degraded to a greater extent than petroleum diesels. TGA-MS demonstrated a strong correlation between differential thermogravimetry and CO2 evolution. Each fuel formed deposits with a variety of H:C ratios. Components that burnt at higher temperatures had lower H:C ratios.
No discernible deposits were formed in the flow reactor under the conditions studied. It was consequently recommended that flow reactors be modified with recirculation loops to better mimic common rail diesel injector systems.
Univers
ity of
Cap
e Tow
n
CHAPTER 1|INTRODUCTION|2013
1
1 Introduction
“Begin, be bold, and venture to be wise.”-Horace
1.1 Subject and motivation for this study
This dissertation is a study in two parts which concerns the characterisation of two fuel-derived carbonaceous materials: diesel soot and diesel fuel deposits. This study not only makes use of conventional analytical techniques such as Soxhlet extraction and electron microscopy but also less applied techniques such as thermogravimetric analysis (TGA) with identification of the evolved gases by mass spectrometry (MS).
1.1.1 Diesel particulate matter (PM)
Diesel particulate matter (PM) or soot is a nano-structured, carbonaceous, solid material that results from incomplete combustion of hydrocarbon fuels that is found in in diesel engine exhaust emissions [1]. There is increasing interest in diesel PM by toxicologists, environmental scientists, local governments and the automotive industry because it can contain potentially high levels of carcinogenic compounds such as polyaromatic hydrocarbons (PAHs) as well as other molecules, predominately phthalates, some of which have been implicated as endocrine disruptors [2, 3, 4]. While PAHs are primarily a by-product of fuel combustion in the engine, phthalates are typically derived from engine lubricating oil [4, 5]. During engine exhaust gas cooling PAHs and other molecules, which adsorb onto the soot matrix, become associated with the soluble organic fraction (SOF) of soot, i.e. the component of soot that is solvent extractable.
A number of studies have partially addressed the characterisation of the soluble organic fraction (SOF) of diesel soot. Most are concerned with PAHs rather than potential endocrine disruptors. Few studies address the influence of the extraction solvent has on the quantity and types of molecules that are extracted. In the case of endocrine disruptors, no studies have been conducted which address the effect the solvent type has on the extraction of such molecules from soot.
Consequently, the objectives of this study were:
1. to investigate the influence of solvent nature, particularly polarity, on the nature (quantity and composition) of the fraction extracted from soot,
2. to ascertain the efficiency of different solvents at extracting PAHs and potential endocrine disruptors
3. to apply thermogravimetric techniques to the characterisation of soot.
Univers
ity of
Cap
e Tow
n
CHAPTER 1|INTRODUCTION|2013
2
1.1.2 Diesel deposits
Fuel instability, i.e. the tendency of a fuel to undergo physical and chemical transformations prior to combustion, is of concern to fuel and vehicle manufacturers [6]. Fuel stability is often referred to as the resistance to decomposition at elevated temperatures which leads to the formation of solid deposits [7]. During diesel engine operation, fuel instability can lead to the formation of carbonaceous deposits and gums in various parts of the fuel system, e.g. fuel filters and injectors, as the fuel is exposed to elevated temperatures and pressures as well as an oxygenated environment [8]. Deposits can lead to increased maintenance costs, decreased reliability, decreased fuel economy, increased exhaust emissions and in severe cases engine failure [6].
Many studies on diesel fuel deposits have used two approaches to sampling deposits: either simulations are performed, using test bed engines, until deposits are formed on vehicle components, primarily injectors [9], or deposits are sampled from those formed in field vehicles [10]. The synthesis of deposits via degradation of diesel fuel using laboratory reactors is an approach that currently hasn’t been well explored although a significant literature exists for the application of such techniques to jet fuel [11, 12] where deposits, similar to those found in aviation fuel systems, have been produced. This study also serves as one of the first to produce deposits from biodiesel blends in the thermo-oxidative (130-300oC) regime rather than the oxidative regime (<120oC).
The following objectives were set for the study of diesel deposits:
1. to ascertain the depositing propensity of a set of test diesel fuels (a commercial diesel, an EN590 diesel (reference fuel), EN590 diesel (80% by volume) with rapeseed methyl ester (biodiesel) and EN590 diesel (80% by volume) with soybean methyl ester (biodiesel) using a quartz crystal microbalance (QCM) reactor,
2. to synthesise fuel deposits by degrading diesel fuel within the thermo-oxidative regime (130-300°C) in three reactors, which are often used for thermo-oxidative stability (TOS) studies, viz. a continuous flow reactor, open glass flasks and closed metal reactors, using the four different diesel fuels to enable comparison between deposits of different diesel fuels,
3. to assess the morphology of these deposits using electron microscopy and compare them to deposits found in vehicles and test bed engines,
4. to analyse the deposits with thermogravimetric analysis coupled with mass spectrometry, and
5. to use electrospray ionisation mass spectrometry (ESI-MS) and Fourier transform infrared (FTIR) spectroscopy to investigate the formation of deposit precursors.
Univers
ity of
Cap
e Tow
n
CHAPTER 1|INTRODUCTION|2013
3
1.2 Limitations and scope of the study
1.2.1 Diesel particulate matter
Only one source of diesel particulate matter (PM) is reported in this study: the exhaust pipe of a commuter bus, although methods were developed using a wide range. The intention of this study was not to assess the impact of different engine conditions on soot properties, but rather to develop methodologies for the characterisation of soot.
A commuter bus provided sufficient sample size to enable characterisation using all analytical techniques. Table 1.1 features the techniques that were used to examine diesel PM.
Table 1.1: Techniques employed for the characterisation of diesel PM
Analytical technique Feature of PM studied
Scanning electron microscopy (SEM) Soot morphology and structure
Transmission electron microscopy (TEM) Soot particle size, morphology, crystallinity and structure
Soxhlet extraction Soluble organic fraction (SOF) size
Gas chromatography – mass spectrometry (GC-MS) Thermogravimetric analysis (TGA) with evolved gas analysis (EGA)
SOF chemical speciation Oxidative reactivity, SOF quantification
1.2.2 Diesel deposits
Because the emphasis was on the development of characterisation methods, a restricted set of stressing conditions were adopted for each set of reactor experiments. Fuel was degraded using four reactors, viz. a continuous flow reactor, open glass flasks, closed metal reactors and a quartz crystal microbalance (QCM). Four fuels were used: a commercial diesel, an EN590 reference diesel and two 20% biodiesel blends, i.e. a first blend of 20% (v/v) of rapeseed methyl ester (RME) with 80% (v/v) EN590 diesel and a second blend of 20% (v/v) of soybean methyl ester (SME) with 80% (v/v) EN590 diesel. Testing in all reactors was conducted at temperatures ranging from 140-250°C, which are temperatures that lie within the thermo-oxidative regime (130-300°C) in the presence of dissolved or excess air. The fuel deposits were analysed using electron microscopy (TEM) and thermogravimetric analysis with evolved gas detection by mass spectrometry (TGA-MS) while fuel precursor deposits, restricted to those obtained from flask reactions, were evaluated using ESI-MS. Because limited deposit samples were obtained with some reactors, e.g. flow reactor, less
Univers
ity of
Cap
e Tow
n
CHAPTER 1|INTRODUCTION|2013
4
comprehensive characterisation was performed. This applied particularly to analytical techniques that require large quantities of samples.
1.3 Plan of development
This thesis is constructed in two parts, each addressing characterisation of a different fuel-derived carbonaceous material: diesel soot and thermo-oxidative deposits. It commences with Chapter 2, a literature review, covering both types of materials. Chapter 3 encompasses the materials used and methods that were involved to characterise diesel PM. In part 2 of Chapter 3, the synthesis conditions and characterisation protocols for diesel fuel deposits are highlighted. Chapter 4 addresses the application of a variety of characterisation methods to soot. Chapter 5 investigates the deposit forming propensity of the four test fuels, using data obtained from a quartz crystal microbalance. Chapters 6, 7 and 8 address the characterisation of fuel-derived deposits. These deposits were produced in open flask reactors, closed bomb reactors and a continuous flow reactor. Chapter 9 provides general conclusions while Chapter 10 covers general recommendations for future studies.
Univers
ity of
Cap
e Tow
n
CHAPTER 2|LITERATURE REVIEW|2013
5
2 Literature Review
“The only true wisdom is in knowing you know nothing.” -Socrates
2.1 Diesel fuel
Diesel is a liquid fuel that powers compression ignition engines [13] which is widely used in Europe where it fuels 53% of passenger vehicles and, increasingly, elsewhere in the world. Its use has been rising because compression ignition engines’ superior efficiency, translates into higher fuel economy [14]. Typically, a 25-40% better fuel efficiency is obtained in comparison to an equivalent spark ignition (petrol) engine [13, 15].
2.1.1 Source and composition of diesel fuel
2.1.1.1 Petroleum diesel
Petroleum diesel is derived from a middle distillate, distilled from crude oil at temperatures between approximately 160°C and 360°C. It is a complex mixture of hydrocarbons, with carbon numbers ranging from C9 to C20 [16]. Typical classes of compounds that are found in diesel include iso and n-paraffins, aromatics, naphthenes (i.e. cycloalkanes) and mixed aromatic cycloalkanes, e.g. tetralin [16, 17].
Aromatic compounds form an important class of molecules which are primary soot precursors. Of these precursors, most significant are those where the aromatics are composed of multiple aromatic rings. These compounds are termed polycyclic aromatic hydrocarbons (PAHs), some of which, e.g. benzo( )pyrene, have been shown to be carcinogens [17, 18].
S NH
OH
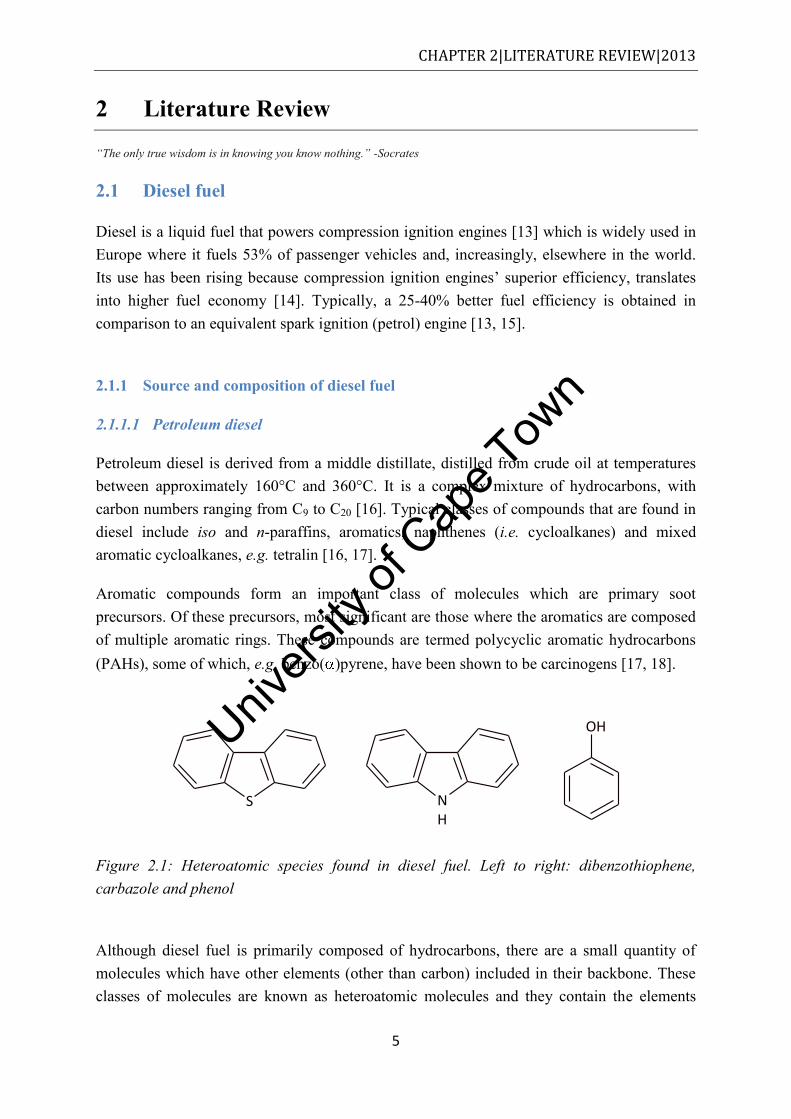
Figure 2.1: Heteroatomic species found in diesel fuel. Left to right: dibenzothiophene, carbazole and phenol
Although diesel fuel is primarily composed of hydrocarbons, there are a small quantity of molecules which have other elements (other than carbon) included in their backbone. These classes of molecules are known as heteroatomic molecules and they contain the elements
Univers
ity of
Cap
e Tow
n
CHAPTER 2|LITERATURE REVIEW|2013
6
sulfur (e.g. in dibenzothiophene), nitrogen (e.g. in carbazole) and oxygen (e.g. in phenol). These are illustrated in Figure 2.1. Even though these heteroatomic molecules occur in minor quantities in diesel fuel, they have a significant influence on the properties of the fuel [17].
A number of grades of diesel may be produced [19]. A number of region-specific classification systems exist for diesel fuel. The USA, for example, classifies diesel into three categories denoted 1-D, 2-D and 4-D. Further sub-classifications, e.g. based on sulfur content, may exist [16, 20]. The European Union (EU) has its own automotive diesel fuel quality specification, EN590, which also contains sub-classifications which differ in cold filter plugging point (CFPP) values [21].
2.1.1.2 Biodiesel
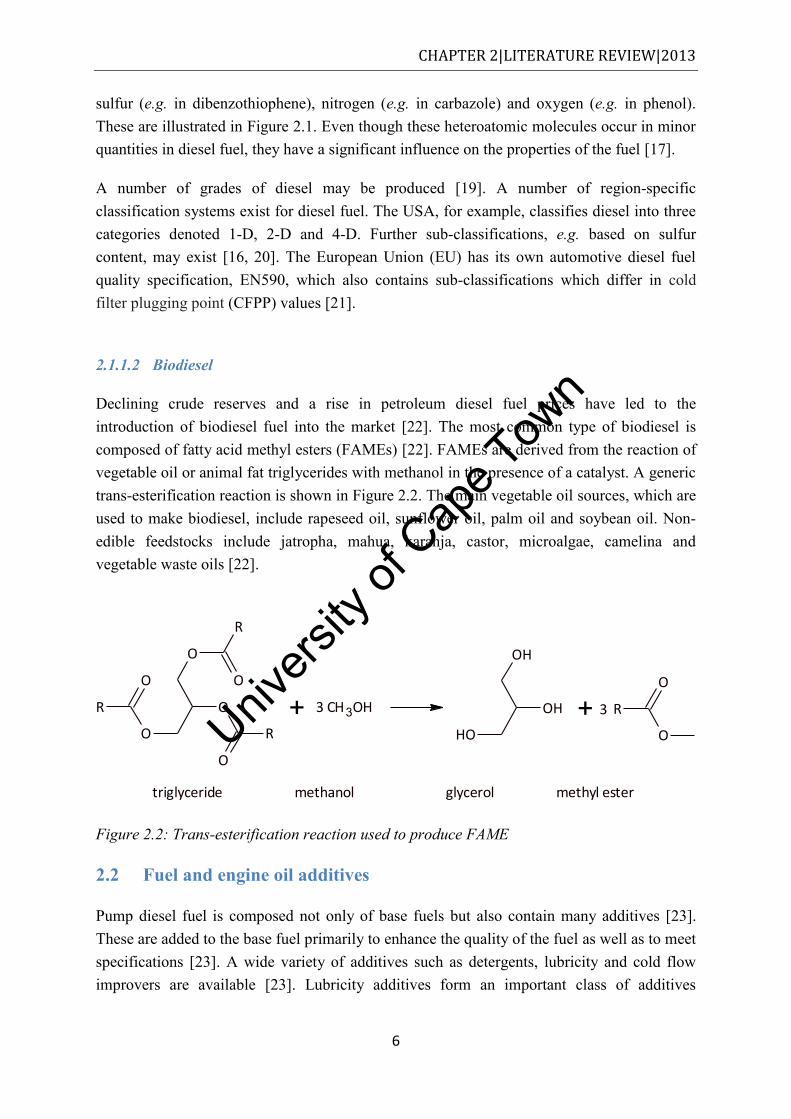
Declining crude reserves and a rise in petroleum diesel fuel prices have led to the introduction of biodiesel fuel into the market [22]. The most common type of biodiesel is composed of fatty acid methyl esters (FAMEs) [22]. FAMEs are derived from the reaction of vegetable oil or animal fat triglycerides with methanol in the presence of a catalyst. A generic trans-esterification reaction is shown in Figure 2.2. The main vegetable oil sources, which are used to make biodiesel, include rapeseed oil, sunflower oil, palm oil and soybean oil. Non-edible feedstocks include jatropha, mahua, karanja, castor, microalgae, camelina and vegetable waste oils [22].
O
O
O
O
O
O
R
R
R
+ 3 CH3OH OH
OH
OH
+ 3 R
O
O
triglyceride methanol glycerol methyl ester Figure 2.2: Trans-esterification reaction used to produce FAME
2.2 Fuel and engine oil additives
Pump diesel fuel is composed not only of base fuels but also contain many additives [23]. These are added to the base fuel primarily to enhance the quality of the fuel as well as to meet specifications [23]. A wide variety of additives such as detergents, lubricity and cold flow improvers are available [23]. Lubricity additives form an important class of additives
Univers
ity of
Cap
e Tow
n
CHAPTER 2|LITERATURE REVIEW|2013
7
primarily because they have helped alleviate the adverse effects of hydrotreatment (a process that is employed in the production of low sulfur fuels) [24]. Removal of sulfur compounds in fuels negatively affects the lubricating abilities of the fuel and usage of unadditised ultra low sulfur diesel (< 20 ppm) can result in drivability and pump failures which arise from excessive wear on components comprising fuel injector pumps [25]. Together with the base fuel, these additives may contribute to the formation of diesel emissions.
Aside from fuel, engine oil may also contribute to soot. It is estimated that about 10% of lubricating oils produced are fully synthetic [26]. These synthetic oils which are composed of saturated olefin oligomers lack lubricating properties and consequently lubricity additives are added into the oils to meet specification [26].
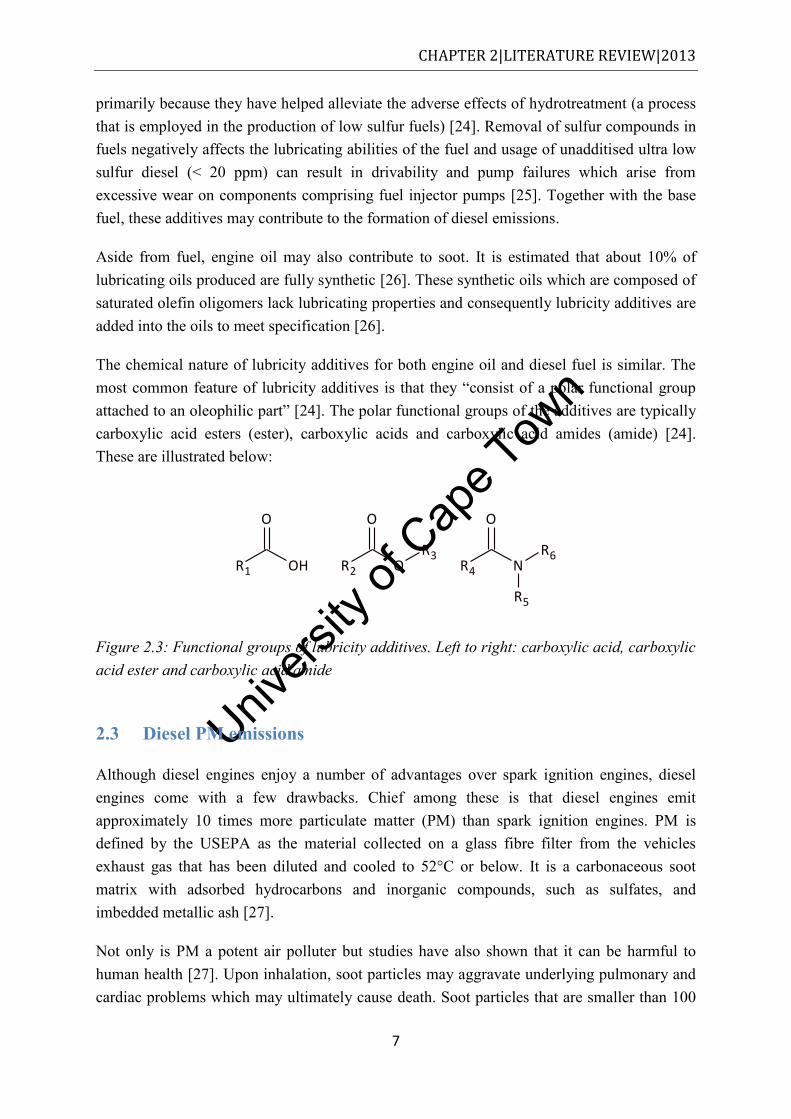
The chemical nature of lubricity additives for both engine oil and diesel fuel is similar. The most common feature of lubricity additives is that they “consist of a polar functional group attached to an oleophilic part” [24]. The polar functional groups of the additives are typically carboxylic acid esters (ester), carboxylic acids and carboxylic acid amides (amide) [24]. These are illustrated below:
R1 OH
O
R2 O
O
R3R4 N
O
R6
R5 Figure 2.3: Functional groups of lubricity additives. Left to right: carboxylic acid, carboxylic acid ester and carboxylic acid amide
2.3 Diesel PM emissions
Although diesel engines enjoy a number of advantages over spark ignition engines, diesel engines come with a few drawbacks. Chief among these is that diesel engines emit approximately 10 times more particulate matter (PM) than spark ignition engines. PM is defined by the USEPA as the material collected on a glass fibre filter from the vehicles exhaust gas that has been diluted and cooled to 52°C or below. It is a carbonaceous soot matrix with adsorbed hydrocarbons and inorganic compounds, such as sulfates, and imbedded metallic ash [27].
Not only is PM a potent air polluter but studies have also shown that it can be harmful to human health [27]. Upon inhalation, soot particles may aggravate underlying pulmonary and cardiac problems which may ultimately cause death. Soot particles that are smaller than 100
Univers
ity of
Cap
e Tow
n
CHAPTER 2|LITERATURE REVIEW|2013
8
nm in size (ultra-fine particles) cannot be filtered by the respiratory tract. Long term exposure can lead to cancer and/or asthma [28, 29].
2.3.1 Components of diesel PM
2.3.1.1 Carbonaceous soot
Carbonaceous soot is the largest component of diesel PM and forms the matrix of exhaust PM onto which several species are adsorbed [27]. Soot is primarily composed of fixed carbon with varying degrees of hydrogen [30]. Soot particles exist as agglomerates (cluster or chain-like aggregates) with primary particles 15-30 nm in diameter [27, 31]. The basic building units of the fixed carbon are graphene segments which are polyaromatic structures [32].
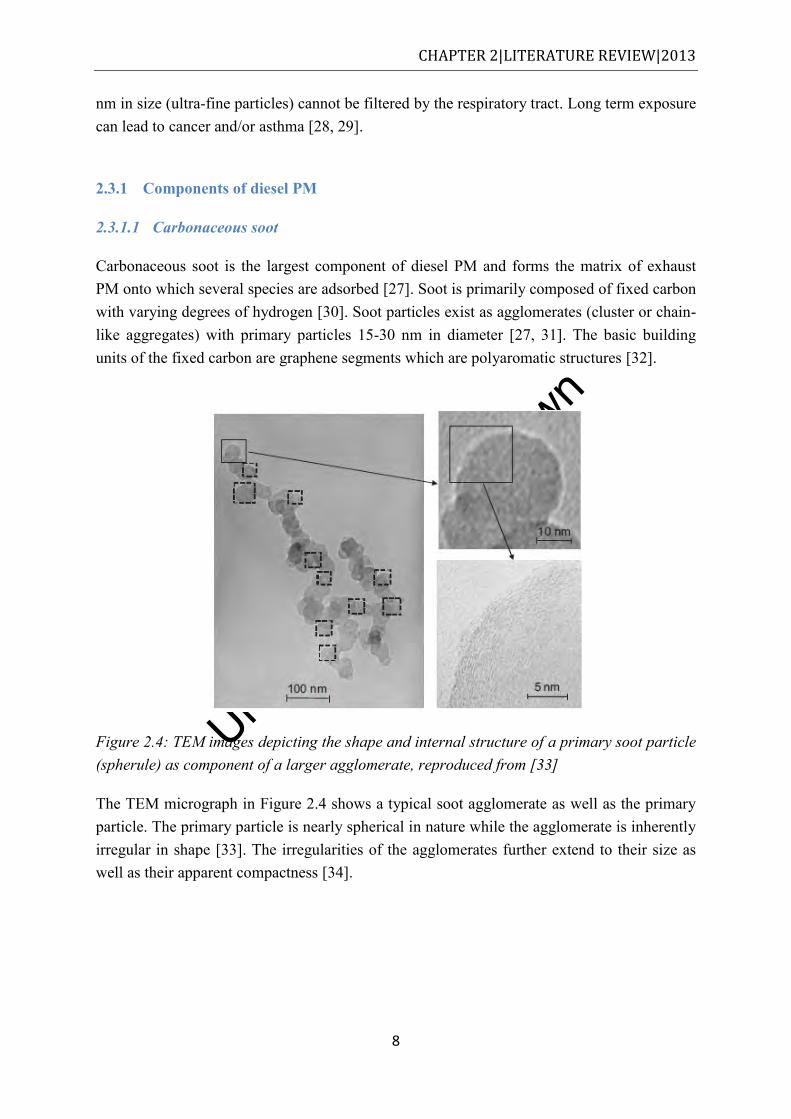
Figure 2.4: TEM images depicting the shape and internal structure of a primary soot particle (spherule) as component of a larger agglomerate, reproduced from [33]
The TEM micrograph in Figure 2.4 shows a typical soot agglomerate as well as the primary particle. The primary particle is nearly spherical in nature while the agglomerate is inherently irregular in shape [33]. The irregularities of the agglomerates further extend to their size as well as their apparent compactness [34].
Univers
ity of
Cap
e Tow
n
CHAPTER 2|LITERATURE REVIEW|2013
9
2.3.1.2 Adsorbed hydrocarbon species
Soot acts as matrix for several adsorbed hydrocarbons which when extracted form a component known as the soluble organic fraction (SOF). The chemical speciation and quantity of the SOF depends on a number of factors including engine performance, mode of operation, fuel and lubricating oil quality [35]. Traditionally, the SOF is composed of paraffins, aromatic species and oxygenated compounds. The quantity of SOF has been shown to vary significantly between 5 and 60% of total PM mass [35].
2.3.2 Composition of the SOF and its effects on biological systems
2.3.2.1 Polyaromatic hydrocarbons (PAHs)
The adverse effects of the SOF on biological systems have been known for over 30 years. By 1981 several studies had shown that soot extracts from light-diesel engines could cause mutations in bacteria and mammalian cells [36].
Yu and Hites conducted comprehensive gas chromatography-mass spectrometry (GC-MS) on several diesel soot extracts to identify possible mutagenic species [36]. Despite analysing the SOF of diesel soot using several different solvents, Yu and Hites presented only GC-MS spectra of the hexane/toluene and toluene fractions as previous had demonstrated that these fractions were the most mutagenic. The hexane/toluene fraction was found to be composed entirely of polyaromatic hydrocrabons (PAHs) while the toluene fraction was composed of oxygenated PAHs and and ketones [36].
A range of studies to characterise diesel soot SOF and, in particular PAHs, have been conducted [2, 3, 35, 37, 38, 39, 40, 41]. More than 32 PAHs have been classified in diesel engine emmisions by the US Environmental Protections Agency (USEPA). 16 of these have been added to a priority list, due to their carcinogenic potential. These compounds are listed in Table 2.1.
Univers
ity of
Cap
e Tow
n
CHAPTER 2|LITERATURE REVIEW|2013
10
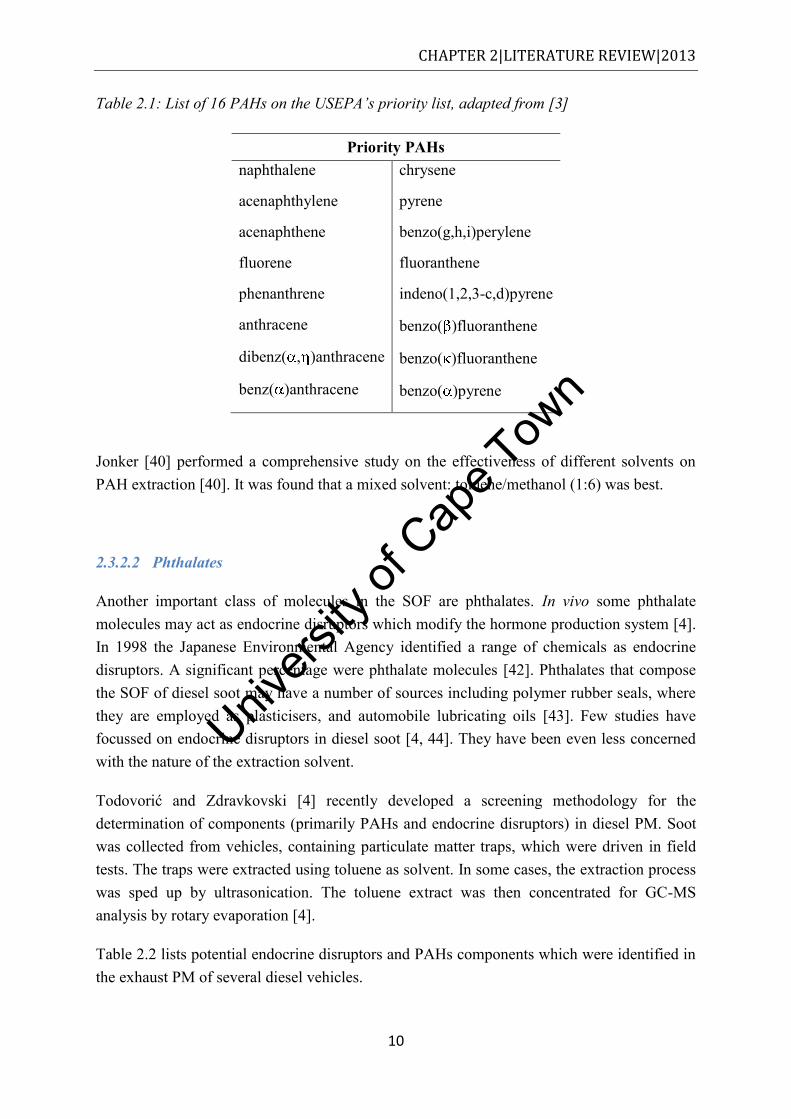
Table 2.1: List of 16 PAHs on the USEPA’s priority list, adapted from [3]
Priority PAHs naphthalene
acenaphthylene
acenaphthene
fluorene
phenanthrene
anthracene
dibenz( , )anthracene
benz( )anthracene
chrysene
pyrene
benzo(g,h,i)perylene
fluoranthene
indeno(1,2,3-c,d)pyrene
benzo( )fluoranthene
benzo( )fluoranthene
benzo( )pyrene
Jonker [40] performed a comprehensive study on the effectiveness of different solvents on PAH extraction [40]. It was found that a mixed solvent: toluene/methanol (1:6) was best.
2.3.2.2 Phthalates
Another important class of molecules in the SOF are phthalates. In vivo some phthalate molecules may act as endocrine disruptors which modify the hormone production system [4]. In 1998 the Japanese Environmental Agency identified a range of chemicals as endocrine disruptors. A significant percentage were phthalate molecules [42]. Phthalates that compose the SOF of diesel soot may have a number of sources including polymer rubber seals, where they are employed as plasticisers, and automobile lubricating oils [43]. Few studies have focussed on endocrine disruptors in diesel soot [4, 44]. They have been even less concerned with the nature of the extraction solvent.
Todovorić and Zdravkovski [4] recently developed a screening methodology for the determination of components (primarily PAHs and endocrine disruptors) in diesel PM. Soot was collected from vehicles, containing particulate matter traps, which were driven in field tests. The traps were extracted using toluene as solvent. In some cases, the extraction process was sped up by ultrasonication. The toluene extract was then concentrated for GC-MS analysis by rotary evaporation [4].
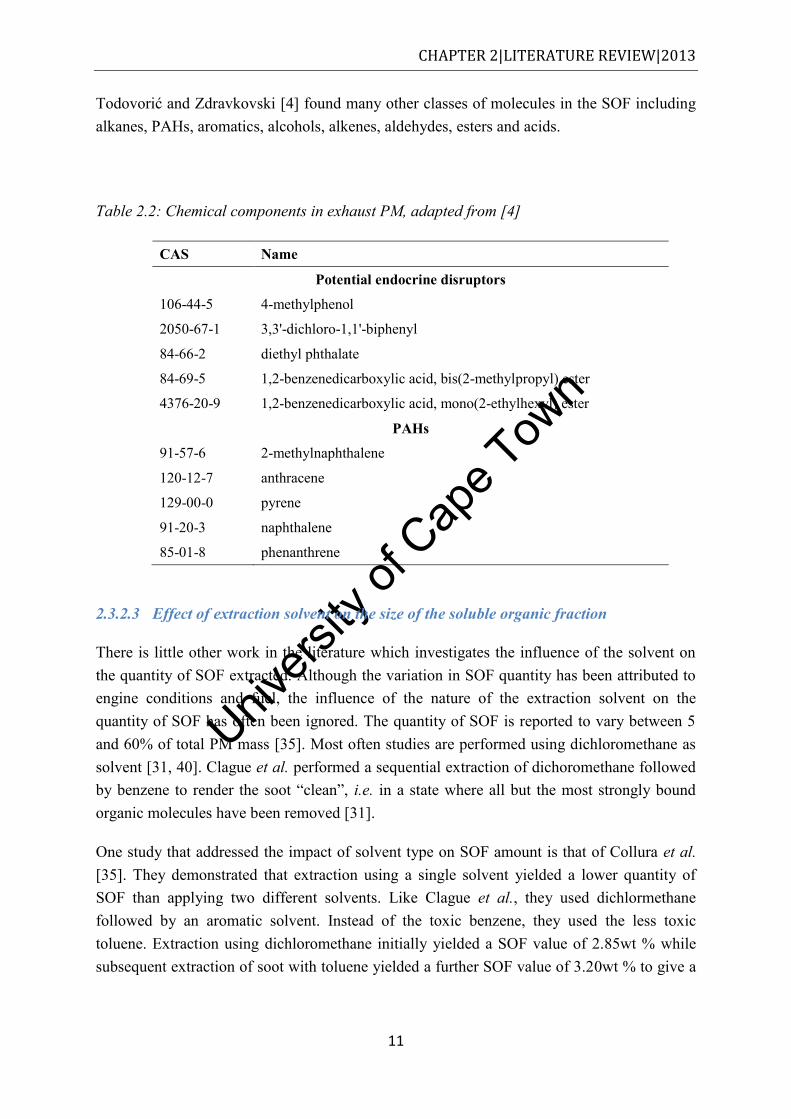
Table 2.2 lists potential endocrine disruptors and PAHs components which were identified in the exhaust PM of several diesel vehicles.
Univers
ity of
Cap
e Tow
n
CHAPTER 2|LITERATURE REVIEW|2013
11
Todovorić and Zdravkovski [4] found many other classes of molecules in the SOF including alkanes, PAHs, aromatics, alcohols, alkenes, aldehydes, esters and acids.
Table 2.2: Chemical components in exhaust PM, adapted from [4]
CAS Name
Potential endocrine disruptors
106-44-5 4-methylphenol
2050-67-1 3,3'-dichloro-1,1'-biphenyl
84-66-2 diethyl phthalate
84-69-5 1,2-benzenedicarboxylic acid, bis(2-methylpropyl) ester
4376-20-9 1,2-benzenedicarboxylic acid, mono(2-ethylhexyl) ester
PAHs
91-57-6 2-methylnaphthalene
120-12-7 anthracene
129-00-0 pyrene
91-20-3 naphthalene
85-01-8 phenanthrene
2.3.2.3 Effect of extraction solvent on the size of the soluble organic fraction
There is little other work in the literature which investigates the influence of the solvent on the quantity of SOF extracted. Although the variation in SOF quantity has been attributed to engine conditions and fuel, the influence of the nature of the extraction solvent on the quantity of SOF has often been ignored. The quantity of SOF is reported to vary between 5 and 60% of total PM mass [35]. Most often studies are performed using dichloromethane as solvent [31, 40]. Clague et al. performed a sequential extraction of dichoromethane followed by benzene to render the soot “clean”, i.e. in a state where all but the most strongly bound organic molecules have been removed [31].
One study that addressed the impact of solvent type on SOF amount is that of Collura et al. [35]. They demonstrated that extraction using a single solvent yielded a lower quantity of SOF than applying two different solvents. Like Clague et al., they used dichlormethane followed by an aromatic solvent. Instead of the toxic benzene, they used the less toxic toluene. Extraction using dichloromethane initially yielded a SOF value of 2.85wt % while subsequent extraction of soot with toluene yielded a further SOF value of 3.20wt % to give a
Univers
ity of
Cap
e Tow
n
CHAPTER 2|LITERATURE REVIEW|2013
12
total SOF of 6.05wt. %. This illustrates the importance of extraction solvent on the quantity of SOF which served as a motivation for the first part of the current investigation.
While there is little work on the influence of solvent type on the size of the SOF, even less work has been done on the effect of the solvent on the chemical speciation of the SOF.
2.4 Thermo-oxidative stability of middle distillate fuels
Thermo-oxidative deposit formation results from fuel exposure to elevated temperature in the presence of oxygen. In diesel vehicles, deposits may be found in a number of engine components such diesel injectors, fuel filters and cylinders [45, 46].
2.4.1 Diesel injector deposits
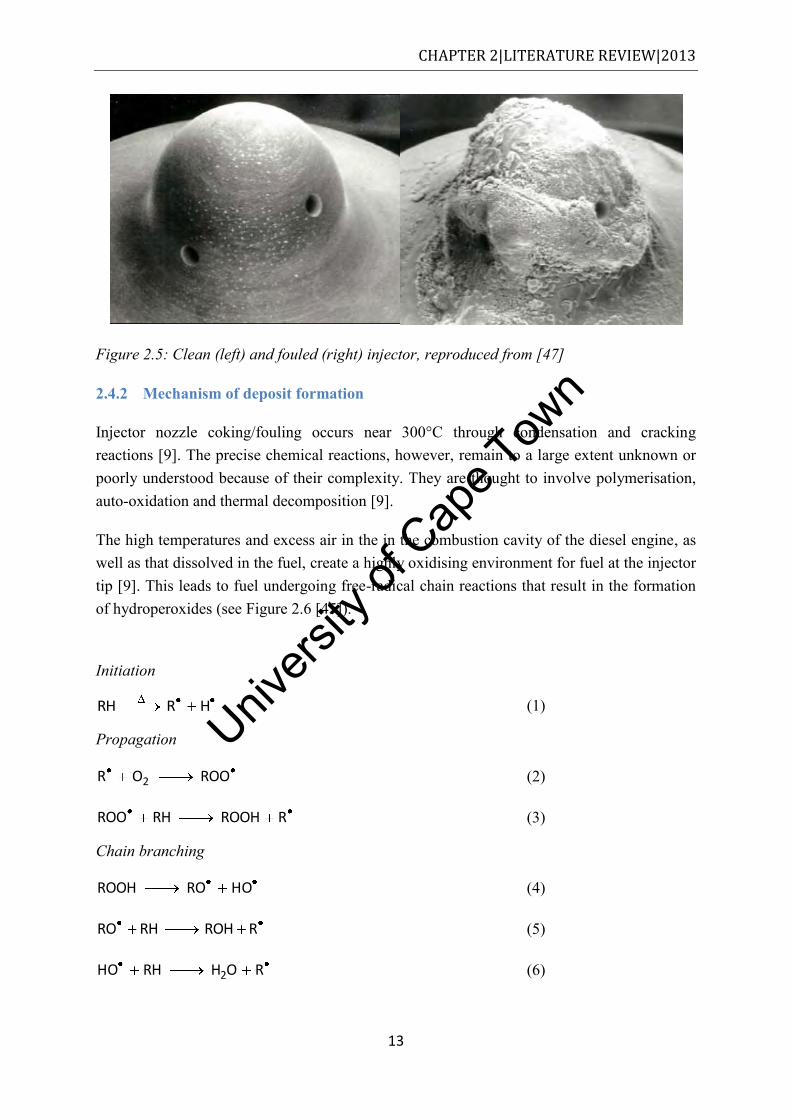
To combat relatively high PM emissions from diesel engines, stringent emission legislations have been introduced in many countries [13]. In order to meet emission legislations automotive manufacturers have had to develop improved engine technology, including fuel injection equipment [47]. Developments have meant a reduction in nozzle orifice diameters and increased injection pressures [48]. The reduction in nozzle diameters has made injectors more sensitive to deposit formation which blocks exit holes [48].
The exposure of diesel fuel to high temperatures can cause deposits in the nozzle area of injectors (see Figure 2.5). Deposit formation depends on many factors including fuel and lubricant composition, engine design and operating conditions. Deposit build-up in injectors affects the fuel flow patterns which reduces fuel economy and increases emissions of soot and unburned hydrocarbons [8].
Univers
ity of
Cap
e Tow
n
CHAPTER 2|LITERATURE REVIEW|2013
13
Figure 2.5: Clean (left) and fouled (right) injector, reproduced from [47]
2.4.2 Mechanism of deposit formation
Injector nozzle coking/fouling occurs near 300°C through condensation and cracking reactions [9]. The precise chemical reactions, however, remain to a large extent unknown or poorly understood because of their complexity. They are thought to involve polymerisation, auto-oxidation and thermal decomposition [9].
The high temperatures and excess air in the in the combustion cavity of the diesel engine, as well as that dissolved in the fuel, create a highly oxidising environment for fuel at the injector tip [9]. This leads to fuel undergoing free-radical chain reactions that result in the formation of hydroperoxides (see Figure 2.6 [45]).
Initiation
HRRH (1)
Propagation
ROOOR 2 (2)
RROOHRHROO (3)
Chain branching
HOROROOH (4)
RROHRHRO (5)
ROHRHHO 2 (6)
Univers
ity of
Cap
e Tow
n
CHAPTER 2|LITERATURE REVIEW|2013
14
acids, ketones, esters, alcohols etc.
Termination
RRRR
RROO
ROOROO
RRO
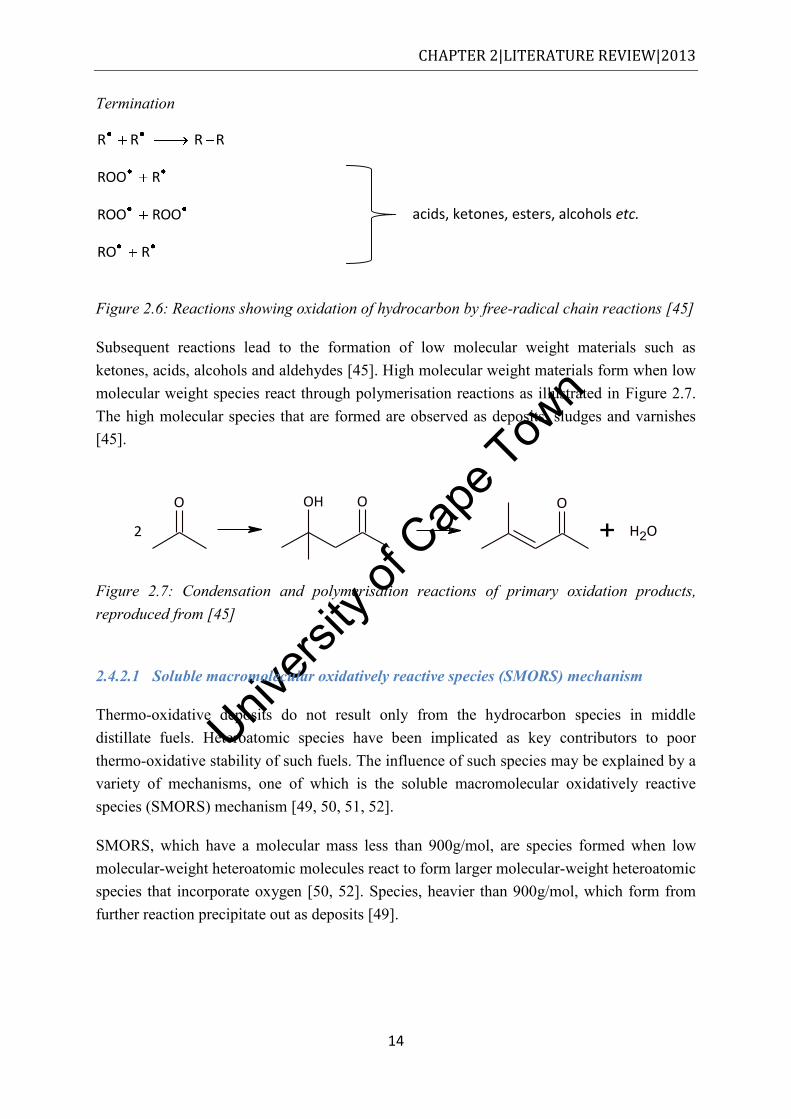
Figure 2.6: Reactions showing oxidation of hydrocarbon by free-radical chain reactions [45]
Subsequent reactions lead to the formation of low molecular weight materials such as ketones, acids, alcohols and aldehydes [45]. High molecular weight materials form when low molecular weight species react through polymerisation reactions as illustrated in Figure 2.7. The high molecular species that are formed are observed as deposits, sludges and varnishes [45].
O
2
OH O O
+ H2O
Figure 2.7: Condensation and polymerisation reactions of primary oxidation products, reproduced from [45]
2.4.2.1 Soluble macromolecular oxidatively reactive species (SMORS) mechanism
Thermo-oxidative deposits do not result only from the hydrocarbon species in middle distillate fuels. Heteroatomic species have been implicated as key contributors to poor thermo-oxidative stability of such fuels. The influence of such species may be explained by a variety of mechanisms, one of which is the soluble macromolecular oxidatively reactive species (SMORS) mechanism [49, 50, 51, 52].
SMORS, which have a molecular mass less than 900g/mol, are species formed when low molecular-weight heteroatomic molecules react to form larger molecular-weight heteroatomic species that incorporate oxygen [50, 52]. Species, heavier than 900g/mol, which form from further reaction precipitate out as deposits [49].
Univers
ity of
Cap
e Tow
n
CHAPTER 2|LITERATURE REVIEW|2013
15
OH
+ O2
O
O
O
OR trimethylcarbazole
NH
OH
OH
SMORS
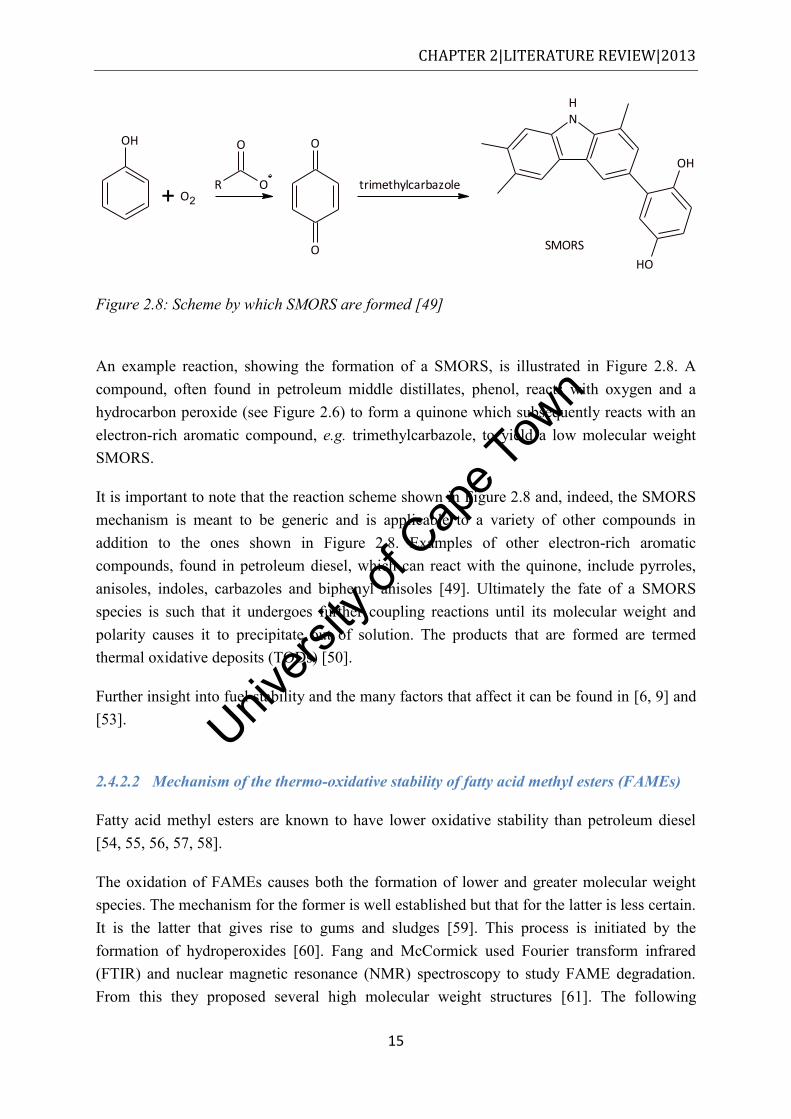
Figure 2.8: Scheme by which SMORS are formed [49]
An example reaction, showing the formation of a SMORS, is illustrated in Figure 2.8. A compound, often found in petroleum middle distillates, phenol, reacts with oxygen and a hydrocarbon peroxide (see Figure 2.6) to form a quinone which subsequently reacts with an electron-rich aromatic compound, e.g. trimethylcarbazole, to yield a low molecular weight SMORS.
It is important to note that the reaction scheme shown in Figure 2.8 and, indeed, the SMORS mechanism is meant to be generic and is applicable to a variety of other compounds in addition to the ones shown in Figure 2.8. Examples of other electron-rich aromatic compounds, found in petroleum diesel, which can react with the quinone, include pyrroles, anisoles, indoles, carbazoles and biphenyl anisoles [49]. Ultimately the fate of a SMORS species is such that it undergoes further coupling reactions until its molecular weight and polarity causes it to precipitate out of solution. The products that are formed are termed thermal oxidative deposits (TODs) [50].
Further insight into fuel stability and the many factors that affect it can be found in [6, 9] and [53].
2.4.2.2 Mechanism of the thermo-oxidative stability of fatty acid methyl esters (FAMEs)
Fatty acid methyl esters are known to have lower oxidative stability than petroleum diesel [54, 55, 56, 57, 58].
The oxidation of FAMEs causes both the formation of lower and greater molecular weight species. The mechanism for the former is well established but that for the latter is less certain. It is the latter that gives rise to gums and sludges [59]. This process is initiated by the formation of hydroperoxides [60]. Fang and McCormick used Fourier transform infrared (FTIR) and nuclear magnetic resonance (NMR) spectroscopy to study FAME degradation. From this they proposed several high molecular weight structures [61]. The following
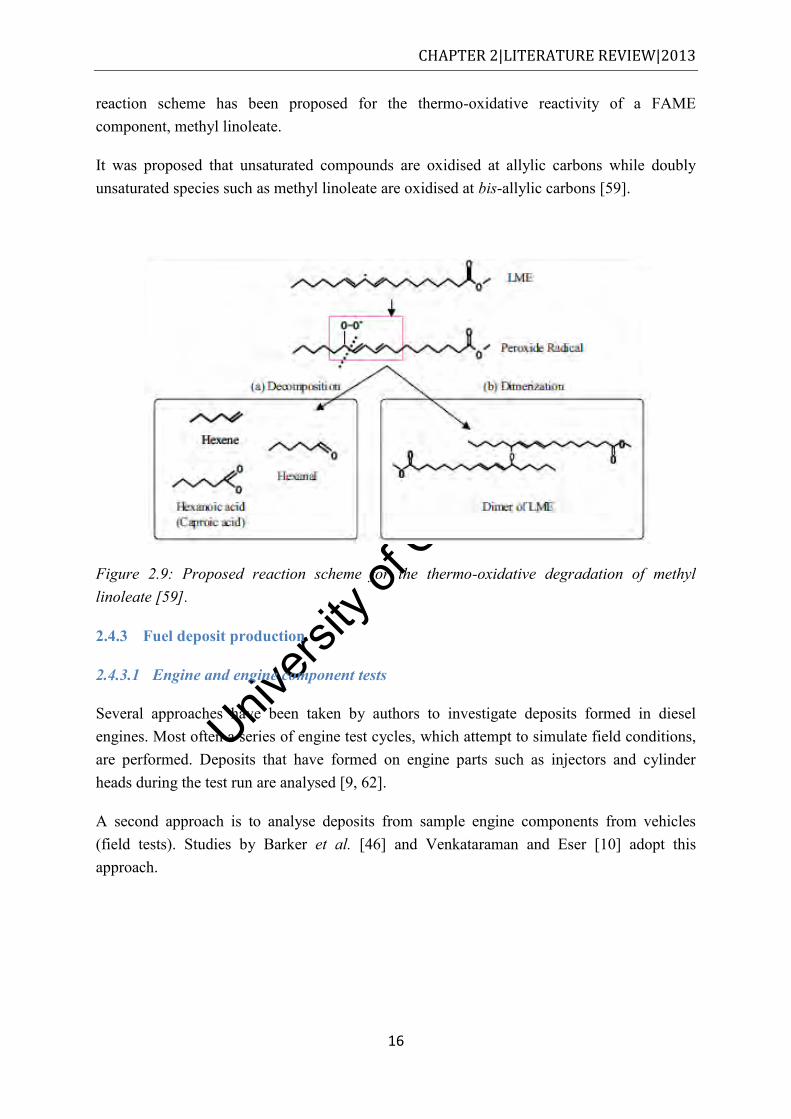
Univers
ity of
Cap
e Tow
n
CHAPTER 2|LITERATURE REVIEW|2013
16
reaction scheme has been proposed for the thermo-oxidative reactivity of a FAME component, methyl linoleate.
It was proposed that unsaturated compounds are oxidised at allylic carbons while doubly unsaturated species such as methyl linoleate are oxidised at bis-allylic carbons [59].
Figure 2.9: Proposed reaction scheme for the thermo-oxidative degradation of methyl linoleate [59].
2.4.3 Fuel deposit production
2.4.3.1 Engine and engine component tests
Several approaches have been taken by authors to investigate deposits formed in diesel engines. Most often a series of engine test cycles, which attempt to simulate field conditions, are performed. Deposits that have formed on engine parts such as injectors and cylinder heads during the test run are analysed [9, 62].
A second approach is to analyse deposits from sample engine components from vehicles (field tests). Studies by Barker et al. [46] and Venkataraman and Eser [10] adopt this approach.
Univers
ity of
Cap
e Tow
n
CHAPTER 2|LITERATURE REVIEW|2013
17
2.4.3.2 Reactor testing
Venkataraman and Eser [10], and Mayo and Bosco [63] adopted an approach where deposits are formed by subjecting fuels to accelerated degradation tests. In accelerated degradation tests, fuels are subjected to conditions, which favour the formation of deposits and/or gums, for extended periods of time [63]. This has been widely applied in the study of jet fuel deposits. Fuel is typically degraded using a range of apparatus including closed bomb reactors (often heated in a sand bath) [49], continuous flow rigs [11, 12, 52, 64] and glass flasks [50, 63].
The advantage that reactors have over bench test cycle testing in the study of fuel degradation is that reactors provide more degrees of freedom, i.e. more variables can be introduced and hence enable one to test a wider range of factors. The role of temperature, air pressure, metal substrates, oxygen concentration and sulfur content in deposit formation has been well studied using the aforementioned reactors [6, 11, 12, 63]. Reactor studies are useful for development of fuel degradation mechanisms [50, 63].
2.4.3.3 Quartz crystal microbalance
In many of the afore-mentioned reactors, forming sufficient deposits to quantify is a challenge [65]. The minute quantity of deposits formed during mild fuel degradation tests has led to the development of tests under more extreme conditions. Unfortunately these accelerated tests are conducted at conditions (elevated temperature and/or high oxygen availability) that may not be a realistic representation of what a real fuel may experience. The chemical mechanisms, governing the reactions at accelerated conditions, may differ from the mechanisms that govern fuel degradation under real world conditions [65].
The quartz crystal microbalance (QCM), developed by Klavetter et al. [66] for jet fuel stability studies, is a reactor with the ability to execute real-time in situ measurements of deposition at temperatures that closely approximate real fuel system conditions [65]. The instrument can resolve minute quantities of surface deposits, as low as 0.1 to 0.2µg/cm2. This inherent high sensitivity has paved the way for real-time fuel deposition tests at low temperatures [65]. Further insight into the basic operation of the QCM as well as the theory behind its workings can be found in [65] and [67].
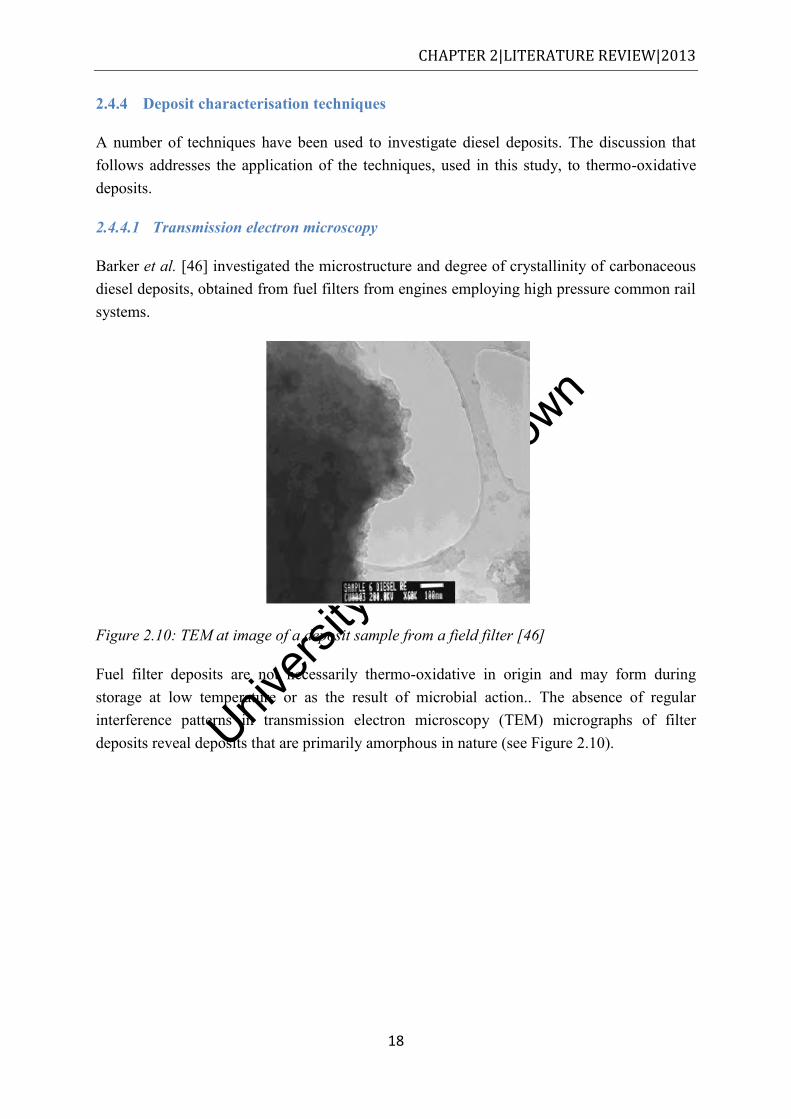
Univers
ity of
Cap
e Tow
n
CHAPTER 2|LITERATURE REVIEW|2013
18
2.4.4 Deposit characterisation techniques
A number of techniques have been used to investigate diesel deposits. The discussion that follows addresses the application of the techniques, used in this study, to thermo-oxidative deposits.
2.4.4.1 Transmission electron microscopy
Barker et al. [46] investigated the microstructure and degree of crystallinity of carbonaceous diesel deposits, obtained from fuel filters from engines employing high pressure common rail systems.
Figure 2.10: TEM at image of a deposit sample from a field filter [46]
Fuel filter deposits are not necessarily thermo-oxidative in origin and may form during storage at low temperature or as the result of microbial action.. The absence of regular interference patterns in transmission electron microscopy (TEM) micrographs of filter deposits reveal deposits that are primarily amorphous in nature (see Figure 2.10).
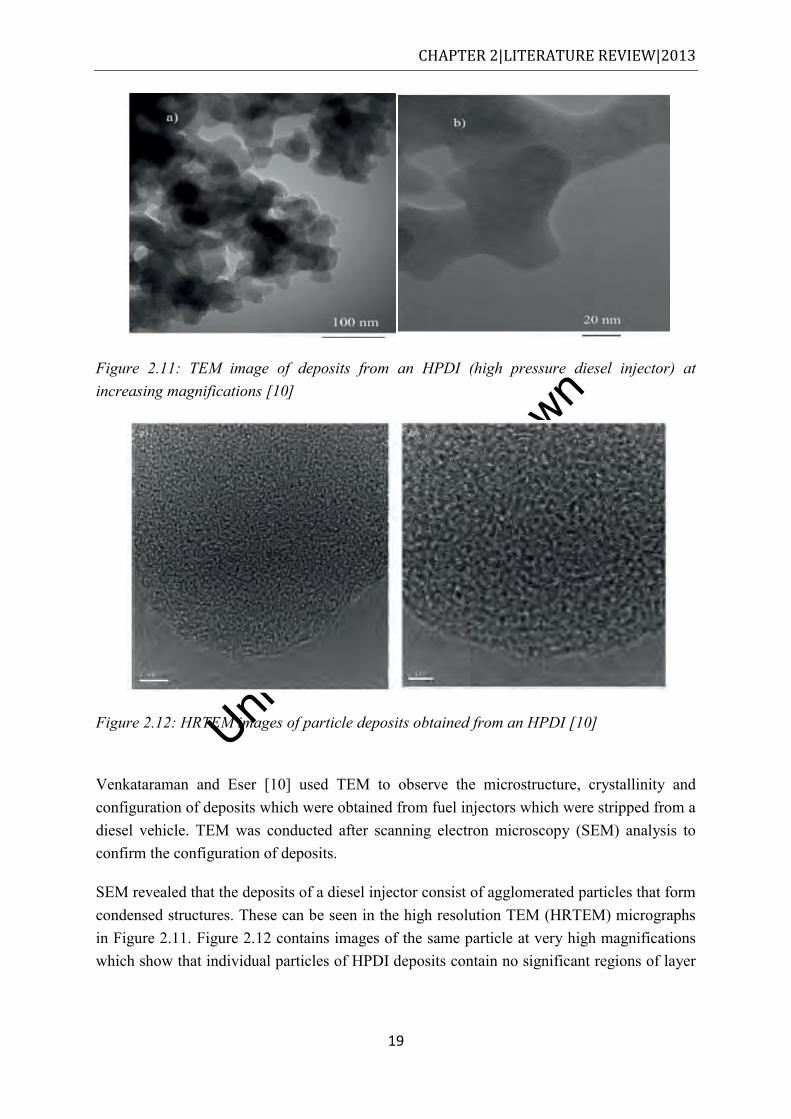
Univers
ity of
Cap
e Tow
n
CHAPTER 2|LITERATURE REVIEW|2013
19
Figure 2.11: TEM image of deposits from an HPDI (high pressure diesel injector) at increasing magnifications [10]
Figure 2.12: HRTEM images of particle deposits obtained from an HPDI [10]
Venkataraman and Eser [10] used TEM to observe the microstructure, crystallinity and configuration of deposits which were obtained from fuel injectors which were stripped from a diesel vehicle. TEM was conducted after scanning electron microscopy (SEM) analysis to confirm the configuration of deposits.
SEM revealed that the deposits of a diesel injector consist of agglomerated particles that form condensed structures. These can be seen in the high resolution TEM (HRTEM) micrographs in Figure 2.11. Figure 2.12 contains images of the same particle at very high magnifications which show that individual particles of HPDI deposits contain no significant regions of layer
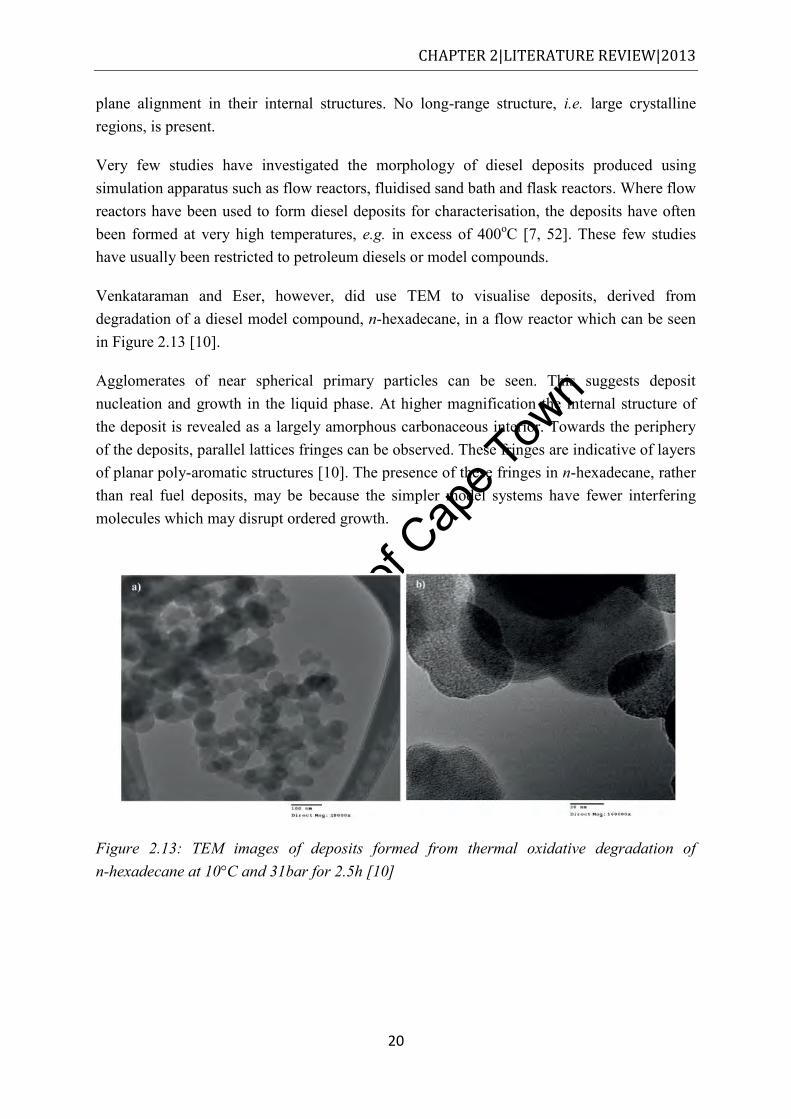
Univers
ity of
Cap
e Tow
n
CHAPTER 2|LITERATURE REVIEW|2013
20
plane alignment in their internal structures. No long-range structure, i.e. large crystalline regions, is present.
Very few studies have investigated the morphology of diesel deposits produced using simulation apparatus such as flow reactors, fluidised sand bath and flask reactors. Where flow reactors have been used to form diesel deposits for characterisation, the deposits have often been formed at very high temperatures, e.g. in excess of 400oC [7, 52]. These few studies have usually been restricted to petroleum diesels or model compounds.
Venkataraman and Eser, however, did use TEM to visualise deposits, derived from degradation of a diesel model compound, n-hexadecane, in a flow reactor which can be seen in Figure 2.13 [10].
Agglomerates of near spherical primary particles can be seen. This suggests deposit nucleation and growth in the liquid phase. At higher magnification the internal structure of the deposit is revealed as a largely amorphous carbonaceous interior. Towards the periphery of the deposits, parallel lattices fringes can be observed. These fringes are indicative of layers of planar poly-aromatic structures [10]. The presence of these fringes in n-hexadecane, rather than real fuel deposits, may be because the simpler model systems have fewer interfering molecules which may disrupt ordered growth.
Figure 2.13: TEM images of deposits formed from thermal oxidative degradation of n-hexadecane at 10°C and 31bar for 2.5h [10]
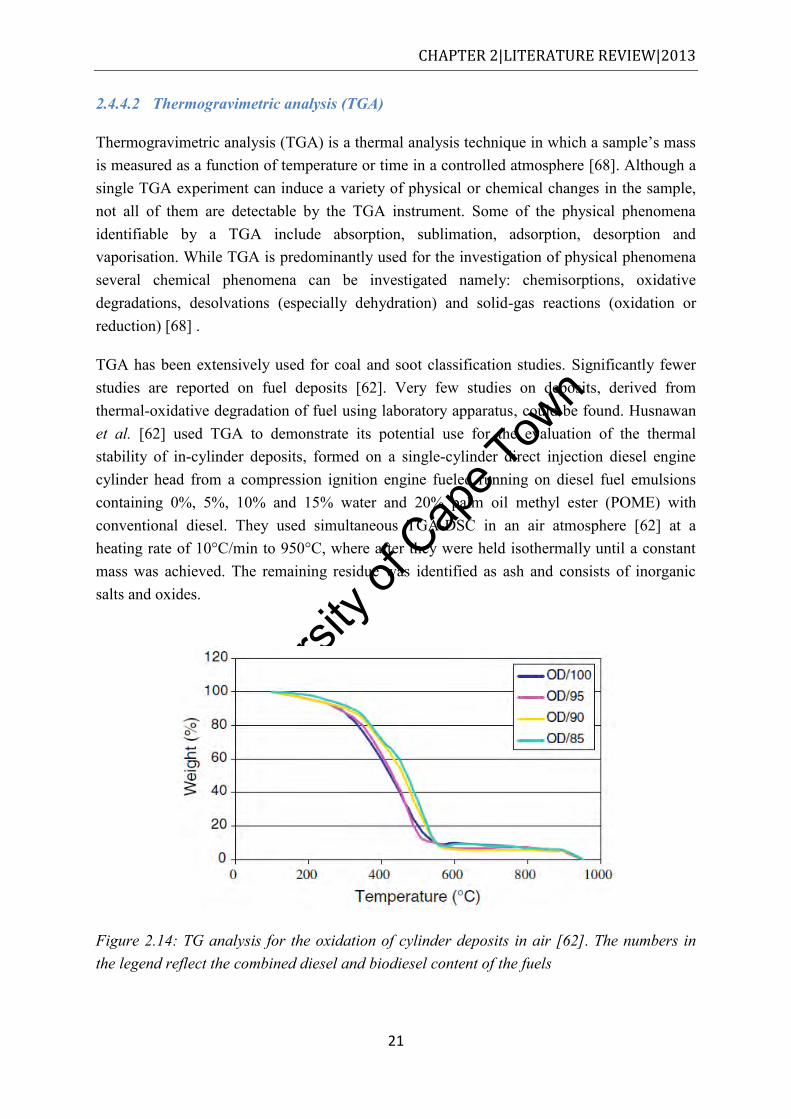
Univers
ity of
Cap
e Tow
n
CHAPTER 2|LITERATURE REVIEW|2013
21
2.4.4.2 Thermogravimetric analysis (TGA)
Thermogravimetric analysis (TGA) is a thermal analysis technique in which a sample’s mass is measured as a function of temperature or time in a controlled atmosphere [68]. Although a single TGA experiment can induce a variety of physical or chemical changes in the sample, not all of them are detectable by the TGA instrument. Some of the physical phenomena identifiable by a TGA include absorption, sublimation, adsorption, desorption and vaporisation. While TGA is predominantly used for the investigation of physical phenomena several chemical phenomena can be investigated namely: chemisorptions, oxidative degradations, desolvations (especially dehydration) and solid-gas reactions (oxidation or reduction) [68] .
TGA has been extensively used for coal and soot classification studies. Significantly fewer studies are reported on fuel deposits [62]. Very few studies on deposits, derived from thermal-oxidative degradation of fuel using laboratory apparatus, could be found. Husnawan et al. [62] used TGA to demonstrate its potential use for the evaluation of the thermal stability of in-cylinder deposits, formed on a single-cylinder direct injection diesel engine cylinder head from a compression ignition engine fueled running on diesel fuel emulsions containing 0%, 5%, 10% and 15% water and 20% palm oil methyl ester (POME) with conventional diesel. They used simultaneous TGA-DSC in an air atmosphere [62] at a heating rate of 10°C/min to 950°C, where after they were held isothermally until a constant mass was achieved. The remaining residue was identified as ash and consists of inorganic salts and oxides.
Figure 2.14: TG analysis for the oxidation of cylinder deposits in air [62]. The numbers in the legend reflect the combined diesel and biodiesel content of the fuels
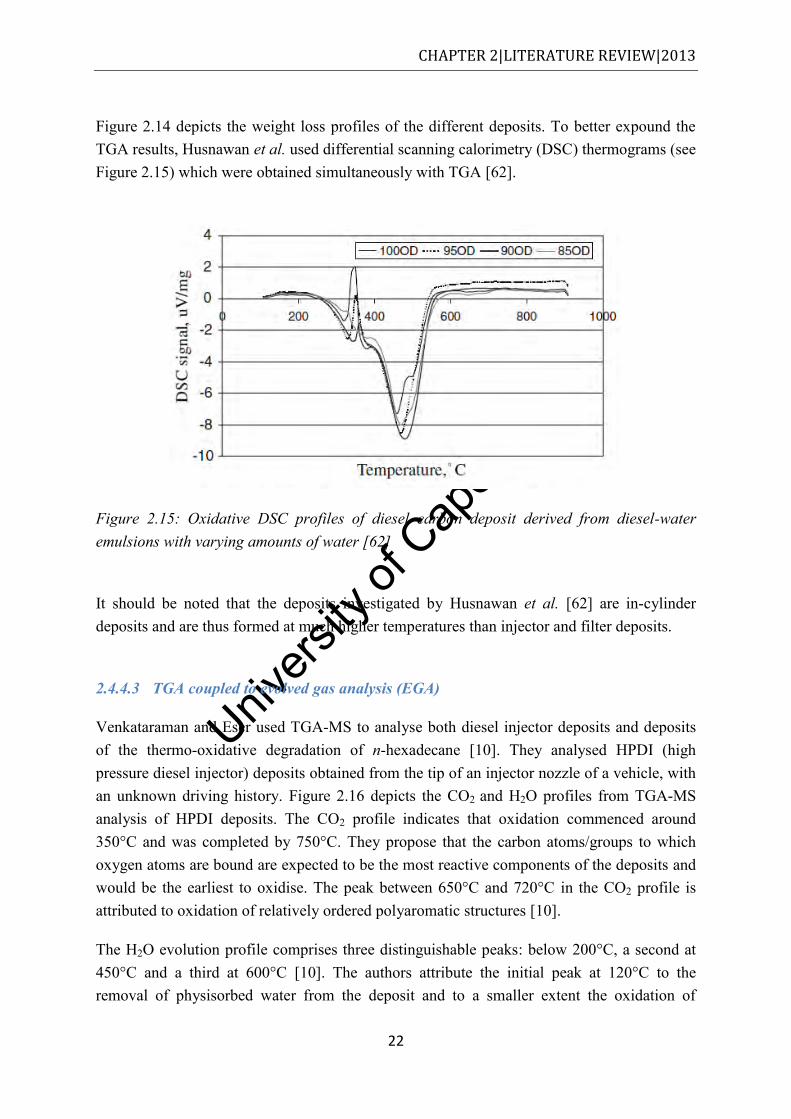
Univers
ity of
Cap
e Tow
n
CHAPTER 2|LITERATURE REVIEW|2013
22
Figure 2.14 depicts the weight loss profiles of the different deposits. To better expound the TGA results, Husnawan et al. used differential scanning calorimetry (DSC) thermograms (see Figure 2.15) which were obtained simultaneously with TGA [62].
Figure 2.15: Oxidative DSC profiles of diesel carbon deposit derived from diesel-water emulsions with varying amounts of water [62]
It should be noted that the deposits investigated by Husnawan et al. [62] are in-cylinder deposits and are thus formed at much higher temperatures than injector and filter deposits.
2.4.4.3 TGA coupled to evolved gas analysis (EGA)
Venkataraman and Eser used TGA-MS to analyse both diesel injector deposits and deposits of the thermo-oxidative degradation of n-hexadecane [10]. They analysed HPDI (high pressure diesel injector) deposits obtained from the tip of an injector nozzle of a vehicle, with an unknown driving history. Figure 2.16 depicts the CO2 and H2O profiles from TGA-MS analysis of HPDI deposits. The CO2 profile indicates that oxidation commenced around 350°C and was completed by 750°C. They propose that the carbon atoms/groups to which oxygen atoms are bound are expected to be the most reactive components of the deposits and would be the earliest to oxidise. The peak between 650°C and 720°C in the CO2 profile is attributed to oxidation of relatively ordered polyaromatic structures [10].
The H2O evolution profile comprises three distinguishable peaks: below 200°C, a second at 450°C and a third at 600°C [10]. The authors attribute the initial peak at 120°C to the removal of physisorbed water from the deposit and to a smaller extent the oxidation of
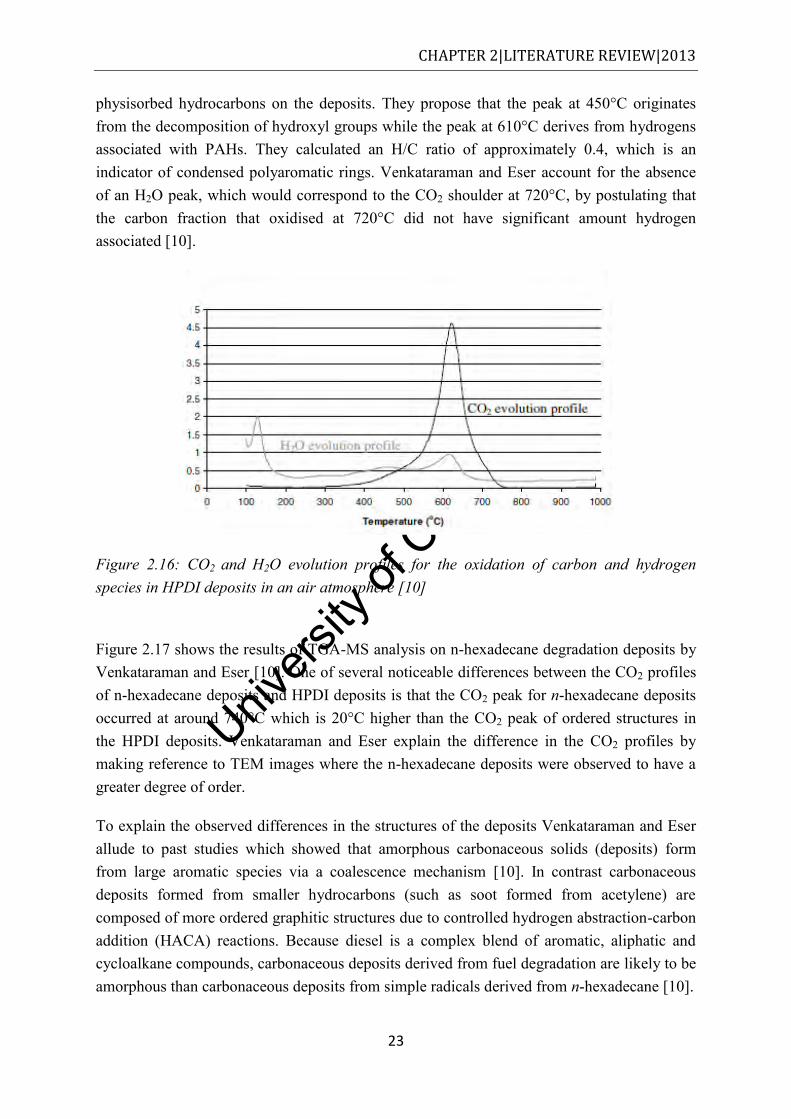
Univers
ity of
Cap
e Tow
n
CHAPTER 2|LITERATURE REVIEW|2013
23
physisorbed hydrocarbons on the deposits. They propose that the peak at 450°C originates from the decomposition of hydroxyl groups while the peak at 610°C derives from hydrogens associated with PAHs. They calculated an H/C ratio of approximately 0.4, which is an indicator of condensed polyaromatic rings. Venkataraman and Eser account for the absence of an H2O peak, which would correspond to the CO2 shoulder at 720°C, by postulating that the carbon fraction that oxidised at 720°C did not have significant amount hydrogen associated [10].
Figure 2.16: CO2 and H2O evolution profiles for the oxidation of carbon and hydrogen species in HPDI deposits in an air atmosphere [10]
Figure 2.17 shows the results of TGA-MS analysis on n-hexadecane degradation deposits by Venkataraman and Eser [10]. One of several noticeable differences between the CO2 profiles of n-hexadecane deposits and HPDI deposits is that the CO2 peak for n-hexadecane deposits occurred at around 740°C which is 20°C higher than the CO2 peak of ordered structures in the HPDI deposits. Venkataraman and Eser explain the difference in the CO2 profiles by making reference to TEM images where the n-hexadecane deposits were observed to have a greater degree of order.
To explain the observed differences in the structures of the deposits Venkataraman and Eser allude to past studies which showed that amorphous carbonaceous solids (deposits) form from large aromatic species via a coalescence mechanism [10]. In contrast carbonaceous deposits formed from smaller hydrocarbons (such as soot formed from acetylene) are composed of more ordered graphitic structures due to controlled hydrogen abstraction-carbon addition (HACA) reactions. Because diesel is a complex blend of aromatic, aliphatic and cycloalkane compounds, carbonaceous deposits derived from fuel degradation are likely to be amorphous than carbonaceous deposits from simple radicals derived from n-hexadecane [10].
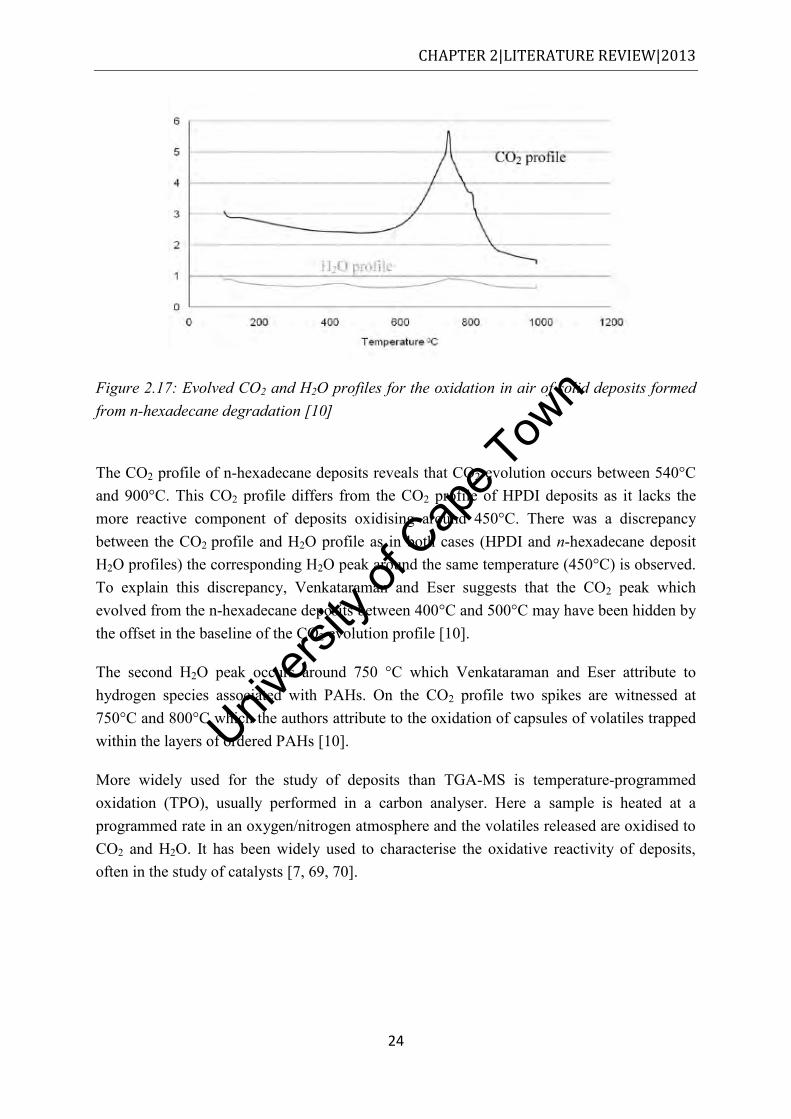
Univers
ity of
Cap
e Tow
n
CHAPTER 2|LITERATURE REVIEW|2013
24
Figure 2.17: Evolved CO2 and H2O profiles for the oxidation in air of solid deposits formed from n-hexadecane degradation [10]
The CO2 profile of n-hexadecane deposits reveals that CO2 evolution occurs between 540°C and 900°C. This CO2 profile differs from the CO2 profile of HPDI deposits as it lacks the more reactive component of deposits oxidising around 450°C. There was a discrepancy between the CO2 profile and H2O profile as in both cases (HPDI and n-hexadecane deposit H2O profiles) the corresponding H2O peak around the same temperature (450°C) is observed. To explain this discrepancy, Venkataraman and Eser suggests that the CO2 peak which evolved from the n-hexadecane deposits between 400°C and 500°C may have been hidden by the offset in the baseline of the CO2 evolution profile [10].
The second H2O peak occurs around 750 °C which Venkataraman and Eser attribute to hydrogen species associated with PAHs. On the CO2 profile two spikes are witnessed at 750°C and 800°C which the authors attribute to the oxidation of capsules of volatiles trapped within the layers of ordered PAHs [10].
More widely used for the study of deposits than TGA-MS is temperature-programmed oxidation (TPO), usually performed in a carbon analyser. Here a sample is heated at a programmed rate in an oxygen/nitrogen atmosphere and the volatiles released are oxidised to CO2 and H2O. It has been widely used to characterise the oxidative reactivity of deposits, often in the study of catalysts [7, 69, 70].
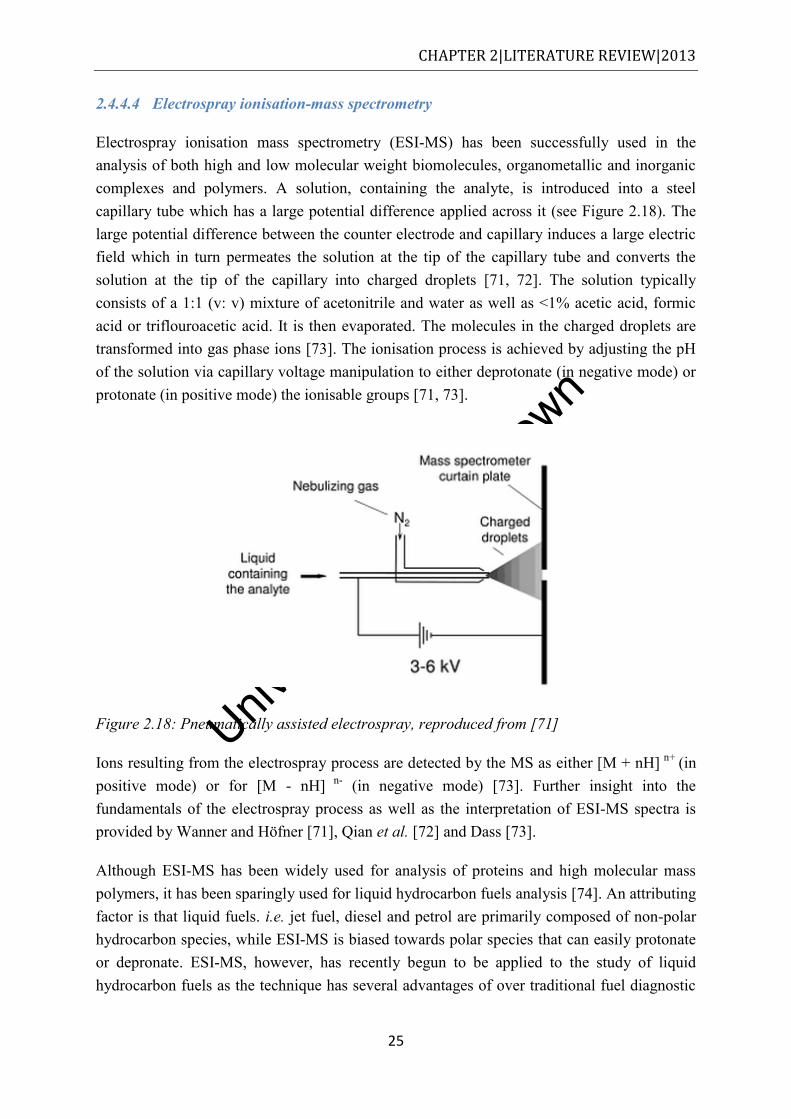
Univers
ity of
Cap
e Tow
n
CHAPTER 2|LITERATURE REVIEW|2013
25
2.4.4.4 Electrospray ionisation-mass spectrometry
Electrospray ionisation mass spectrometry (ESI-MS) has been successfully used in the analysis of both high and low molecular weight biomolecules, organometallic and inorganic complexes and polymers. A solution, containing the analyte, is introduced into a steel capillary tube which has a large potential difference applied across it (see Figure 2.18). The large potential difference between the counter electrode and capillary induces a large electric field which in turn permeates the solution at the tip of the capillary tube and converts the solution at the tip of the capillary into charged droplets [71, 72]. The solution typically consists of a 1:1 (v: v) mixture of acetonitrile and water as well as <1% acetic acid, formic acid or triflouroacetic acid. It is then evaporated. The molecules in the charged droplets are transformed into gas phase ions [73]. The ionisation process is achieved by adjusting the pH of the solution via capillary voltage manipulation to either deprotonate (in negative mode) or protonate (in positive mode) the ionisable groups [71, 73].
Figure 2.18: Pneumatically assisted electrospray, reproduced from [71]
Ions resulting from the electrospray process are detected by the MS as either [M + nH] n+ (in positive mode) or for [M - nH] n- (in negative mode) [73]. Further insight into the fundamentals of the electrospray process as well as the interpretation of ESI-MS spectra is provided by Wanner and Höfner [71], Qian et al. [72] and Dass [73].
Although ESI-MS has been widely used for analysis of proteins and high molecular mass polymers, it has been sparingly used for liquid hydrocarbon fuels analysis [74]. An attributing factor is that liquid fuels. i.e. jet fuel, diesel and petrol are primarily composed of non-polar hydrocarbon species, while ESI-MS is biased towards polar species that can easily protonate or depronate. ESI-MS, however, has recently begun to be applied to the study of liquid hydrocarbon fuels as the technique has several advantages of over traditional fuel diagnostic
Univers
ity of
Cap
e Tow
n
CHAPTER 2|LITERATURE REVIEW|2013
26
techniques such as GC-MS. The major advantages are i) sample volatility in ESI-MS is not an issue and hence this allows ESI-MS the ability to detect molecules with molecular masses as high as 100MDa and ii) the electrospray ionisation process is a significantly softer ionisation mode than electron ionisation (EI), usually used in GC-MS, and as a consequence leads to little or no mass fragmentation of target molecules. The high selectivity towards polar species was exploited by Rostad et al. [75] who used the technique to differentiate between different fuel types based on their polar components.
Thermo-oxidative degradation of hydrocarbon fuel leads to the formation of high molecular polar species, e.g. acids and ketones. Commodo et al. [74] applied positive ESI-MS to identify polar compounds in neat unstressed jet fuel (Jet A-1) as well as polar species that formed when the fuel was thermally stressed in the presence of oxygen. Jet A-1 positive ESI-MS identified several nitrogenous homologous series in Jet A-1, including possible alkylated pyridines/or anilines, alkylated carbazoles and alkylated quinolines. Polar molecules that were detected for neat unstressed Jet-A1 were generally in the m/z 100-250 range. Two additional homologous series in the low molecular region (m/z 100-250) were observed in stressed Jet A-1 (160°C for 2 h under excess air). Furthermore stressed Jet-A1 formed homologous series in the m/z 250-400 range while no dimers [2M+H]+ or trimers [3M+H]+ were observed in the spectra. ESI-MS not only afforded Commodo et al. [74] a means in which to identify polar species in unstressed jet fuel, but also proved integral for the development of a mechanism for jet fuel degradation. In the proposed mechanism, soluble polar species in the m/z 250-400 range adopt the role of parent deposit precursors which by aggregation, polymerisation and/or clustering convert into insoluble precursors which ultimately precipitate to form solid deposits.
Rostad et al. [75] and Hughey et al. [76] used ESI-MS to investigate polar species in diesel fuel. Although both sets of authors showed that ESI-MS can be useful in identifying particular polar species in diesel fuel, their studies did not investigate polar species formed during thermal-oxidative stressing of the respective diesel fuels.
The use of ESI-MS in tracking oxidation products has had greater reception with biodiesel than petroleum diesel. Catharino et al. [77] used the technique to characterise biodiesel. They could determine the alcohol used in the trans-esterification process, track degradation products and screen for residual glycerine and associated glycerides. Catharino et al. [77] purposely chose to perform ESI-MS on biodiesel in both positive and negative modes. In negative mode ESI-MS oxidation products (mainly oxidised fatty acids) formed as a result of thermo-oxidative degradation (120°C, 8 h in excess air) of biodiesel were identified. Additionally negative ESI-MS provided identification of deprotonated fatty acids in unstressed biodiesel. Positive ESI-MS aided in the identification of protonated fatty esters of the biodiesel which was used to reveal the alcohol (methanol or ethanol) used in the trans-

Univers
ity of
Cap
e Tow
n
CHAPTER 2|LITERATURE REVIEW|2013
27
esterification process [77]. Ogawa et al. [59] used ESI-MS to track the oxidation of a number of FAME model compounds.
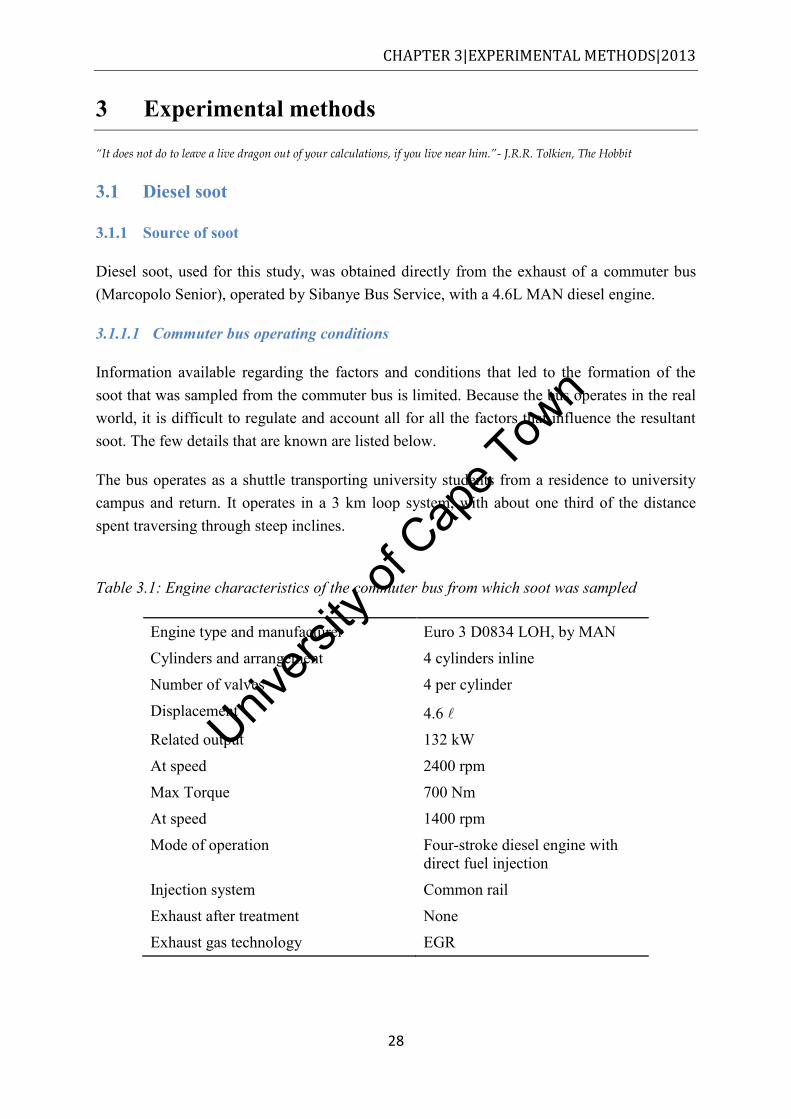
Univers
ity of
Cap
e Tow
n
CHAPTER 3|EXPERIMENTAL METHODS|2013
28
3 Experimental methods
“It does not do to leave a live dragon out of your calculations, if you live near him.”- J.R.R. Tolkien, The Hobbit
3.1 Diesel soot
3.1.1 Source of soot
Diesel soot, used for this study, was obtained directly from the exhaust of a commuter bus (Marcopolo Senior), operated by Sibanye Bus Service, with a 4.6L MAN diesel engine.
3.1.1.1 Commuter bus operating conditions
Information available regarding the factors and conditions that led to the formation of the soot that was sampled from the commuter bus is limited. Because the bus operates in the real world, it is difficult to regulate and account all for all the factors that influence the resultant soot. The few details that are known are listed below.
The bus operates as a shuttle transporting university students from a residence to university campus and return. It operates in a 3 km loop system, with about one third of the distance spent traversing through steep inclines.
Table 3.1: Engine characteristics of the commuter bus from which soot was sampled
Engine type and manufacturer Euro 3 D0834 LOH, by MAN
Cylinders and arrangement 4 cylinders inline
Number of valves 4 per cylinder
Displacement 4.6 Related output 132 kW
At speed 2400 rpm
Max Torque 700 Nm
At speed 1400 rpm
Mode of operation Four-stroke diesel engine with direct fuel injection
Injection system Common rail
Exhaust after treatment None
Exhaust gas technology EGR
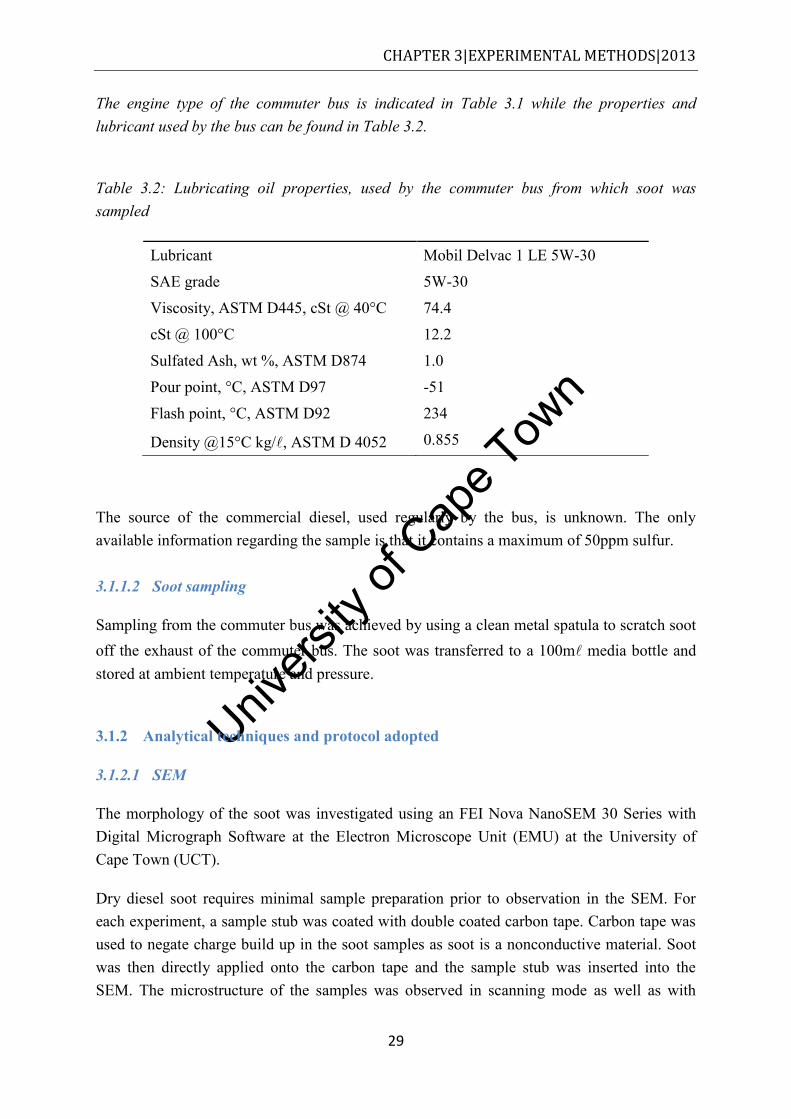
Univers
ity of
Cap
e Tow
n
CHAPTER 3|EXPERIMENTAL METHODS|2013
29
The engine type of the commuter bus is indicated in Table 3.1 while the properties and lubricant used by the bus can be found in Table 3.2.
Table 3.2: Lubricating oil properties, used by the commuter bus from which soot was sampled
Lubricant Mobil Delvac 1 LE 5W-30
SAE grade 5W-30
Viscosity, ASTM D445, cSt @ 40°C 74.4
cSt @ 100°C 12.2
Sulfated Ash, wt %, ASTM D874 1.0
Pour point, °C, ASTM D97 -51
Flash point, °C, ASTM D92 234
Density @15°C kg/, ASTM D 4052 0.855
The source of the commercial diesel, used regularly by the bus, is unknown. The only available information regarding the sample is that it contains a maximum of 50ppm sulfur. 3.1.1.2 Soot sampling
Sampling from the commuter bus was achieved by using a clean metal spatula to scratch soot off the exhaust of the commuter bus. The soot was transferred to a 100m media bottle and stored at ambient temperature and pressure.
3.1.2 Analytical techniques and protocol adopted
3.1.2.1 SEM
The morphology of the soot was investigated using an FEI Nova NanoSEM 30 Series with Digital Micrograph Software at the Electron Microscope Unit (EMU) at the University of Cape Town (UCT).
Dry diesel soot requires minimal sample preparation prior to observation in the SEM. For each experiment, a sample stub was coated with double coated carbon tape. Carbon tape was used to negate charge build up in the soot samples as soot is a nonconductive material. Soot was then directly applied onto the carbon tape and the sample stub was inserted into the SEM. The microstructure of the samples was observed in scanning mode as well as with
Univers
ity of
Cap
e Tow
n
CHAPTER 3|EXPERIMENTAL METHODS|2013
30
back-scattered electron detection. The acquisition parameters used to obtain each micrograph are displayed on the each respective micrograph in the results section.
3.1.2.2 TEM
Transmission electron microscopy was employed to study soot microstructure in greater detail. The instrument used for this analysis was a FEI Tecnai G2 20 TEM, equipped with a lanthanum hexaboride (LaB6) filament and a Gatan Tridiem image filter (GIF), housed at the EMU at UCT. The protocol highlighting the sample preparation undertaken by this study for all soot samples for TEM analysis is listed below.
Sample preparation protocol:
Note: Steps 1-3 applied only to test bed engine soot while steps 4-6 applied to both the commuter bus and test bed engine soot.
1. A 25 mm diameter TIGF filter paper containing ± 4mg of soot sample was placed in a 100m beaker containing 20m ethanol (Kimix, Cape Town, South Africa).
2. The filter paper with adsorbed soot was ultrasonicated for 5min or until the soot de-adsorbed from the filter paper and dispersed into the ethanol solvent.
3. The stripped filter paper was removed from solution. 4. Using a dropper, a few drops of the soot and ethanol mixture from the beaker were
transferred onto a 3mm carbon-coated copper grid. 5. The 3mm grid containing the sample was held under a UV light (250W xenon lamp
source) until the ethanol completely evaporated. 6. The dry copper grid was then inserted into the TEM grid holder.
TEM experimental parameters
The TEM was operated at 200keV to obtain high resolution bright field images. The signal-to-noise ratio, and hence the contrast, in the images was enhanced by employing a 20eV energy slit (using the GIF) to filter out elastically scattered electrons. All images were captured using a Gatan Ultrascan 1000 digital camera with a CCD chip comprising of 1024 x 1024 array of pixels of width 15 m.
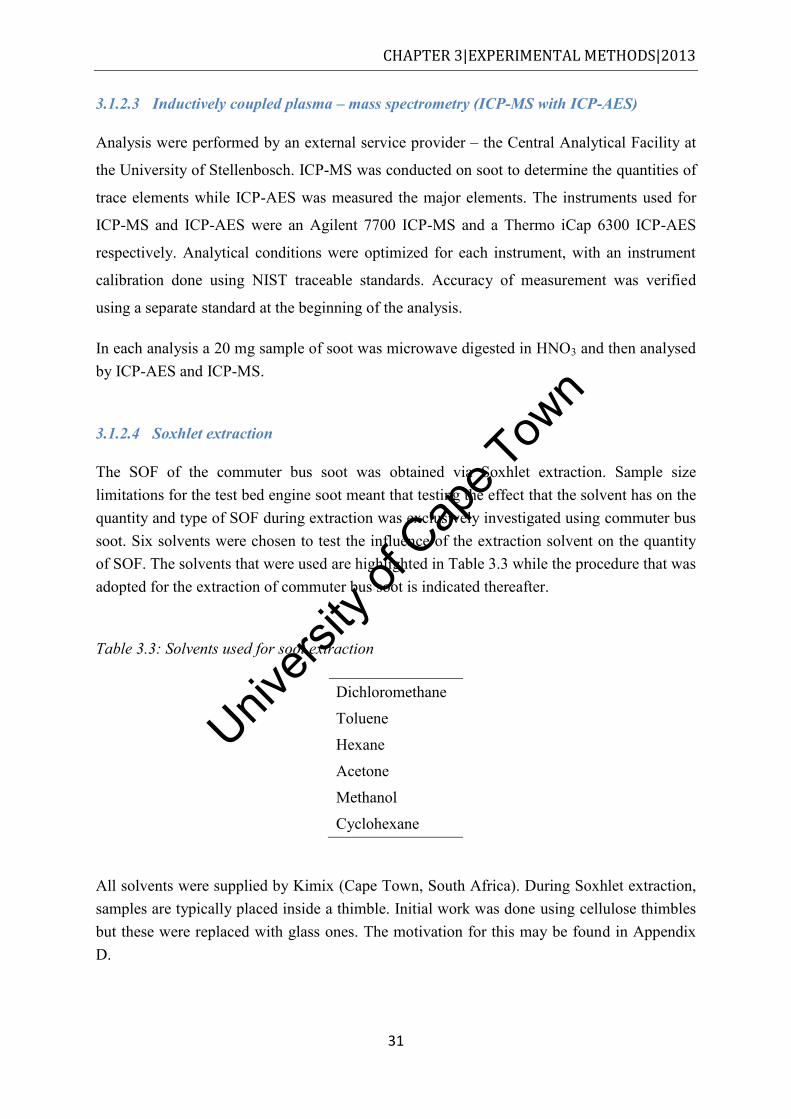
Univers
ity of
Cap
e Tow
n
CHAPTER 3|EXPERIMENTAL METHODS|2013
31
3.1.2.3 Inductively coupled plasma – mass spectrometry (ICP-MS with ICP-AES)
Analysis were performed by an external service provider – the Central Analytical Facility at
the University of Stellenbosch. ICP-MS was conducted on soot to determine the quantities of
trace elements while ICP-AES was measured the major elements. The instruments used for
ICP-MS and ICP-AES were an Agilent 7700 ICP-MS and a Thermo iCap 6300 ICP-AES
respectively. Analytical conditions were optimized for each instrument, with an instrument
calibration done using NIST traceable standards. Accuracy of measurement was verified
using a separate standard at the beginning of the analysis.
In each analysis a 20 mg sample of soot was microwave digested in HNO3 and then analysed by ICP-AES and ICP-MS.
3.1.2.4 Soxhlet extraction
The SOF of the commuter bus soot was obtained via Soxhlet extraction. Sample size limitations for the test bed engine soot meant that testing the effect that the solvent has on the quantity and type of SOF during extraction was exclusively investigated using commuter bus soot. Six solvents were chosen to test the influence of the extraction solvent on the quantity of SOF. The solvents that were used are highlighted in Table 3.3 while the procedure that was adopted for the extraction of commuter bus soot is indicated thereafter.
Table 3.3: Solvents used for soot extraction
Dichloromethane
Toluene
Hexane
Acetone
Methanol
Cyclohexane
All solvents were supplied by Kimix (Cape Town, South Africa). During Soxhlet extraction, samples are typically placed inside a thimble. Initial work was done using cellulose thimbles but these were replaced with glass ones. The motivation for this may be found in Appendix D.
Univers
ity of
Cap
e Tow
n
CHAPTER 3|EXPERIMENTAL METHODS|2013
32
Extraction protocol:
1. A glass fibre extraction thimble, extractor and flask were cleaned with acetone to remove any laden particles.
2. The thimble, extractor and flask were dried in an oven at 50°C for 15min. 3. The extraction thimble was weighed using a Mettler Toledo AT 20 microbalance
( 2 g). 4. Approximately 100mg of commuter bus soot was added to the thimble and the
combination was reweighed. 5. The thimble, containing the soot sample, was inserted into the extraction cavity of the
Soxhlet and 30m solvent was added to the flask. 6. Soxhlet extraction was continued under reflux for 24 h. 7. On completion of the extraction process the thimble with sample was removed from
the extraction cavity and dried in a fumehood for 1 h. Thereafter they were dried in an oven at 50°C for 48 h.
8. The dried thimble with sample was then weighed. 9. SOF was calculated as follows
100sm
smtmsmtm(%)SOF
fi
where m = mass, t = thimble, s = sample, i = prior extraction and f = after extraction.
3.1.2.5 Chemical speciation of the SOF
Chemical speciation of the SOF of the soot was conducted. The extraction process adopted was the same as in section 3.1.2.4, except steps 7-9 were omitted. The solvents used were the same as those in Table 3.3. The protocol undertaken in determining the chemical speciation of the SOF from extraction commuter bus soot is highlighted below.
3.1.3 Gas Chromatography - Mass Spectrometry (GC-MS)
GC-MS enabled identification of contents in the SOF for both test bed engine and commuter bus soot extracts. Of particular interest were PAHs and phthalates (esters). The GC-MS used for this work was a Shimadzu GCMS-QP2010 Plus, with a high performance quadrupole mass spectrometer that allow detection of a mass range of 1.5 to 1090 m/z.
The solvent (SOF) obtained from Soxhlet extraction was analysed using the following protocol:
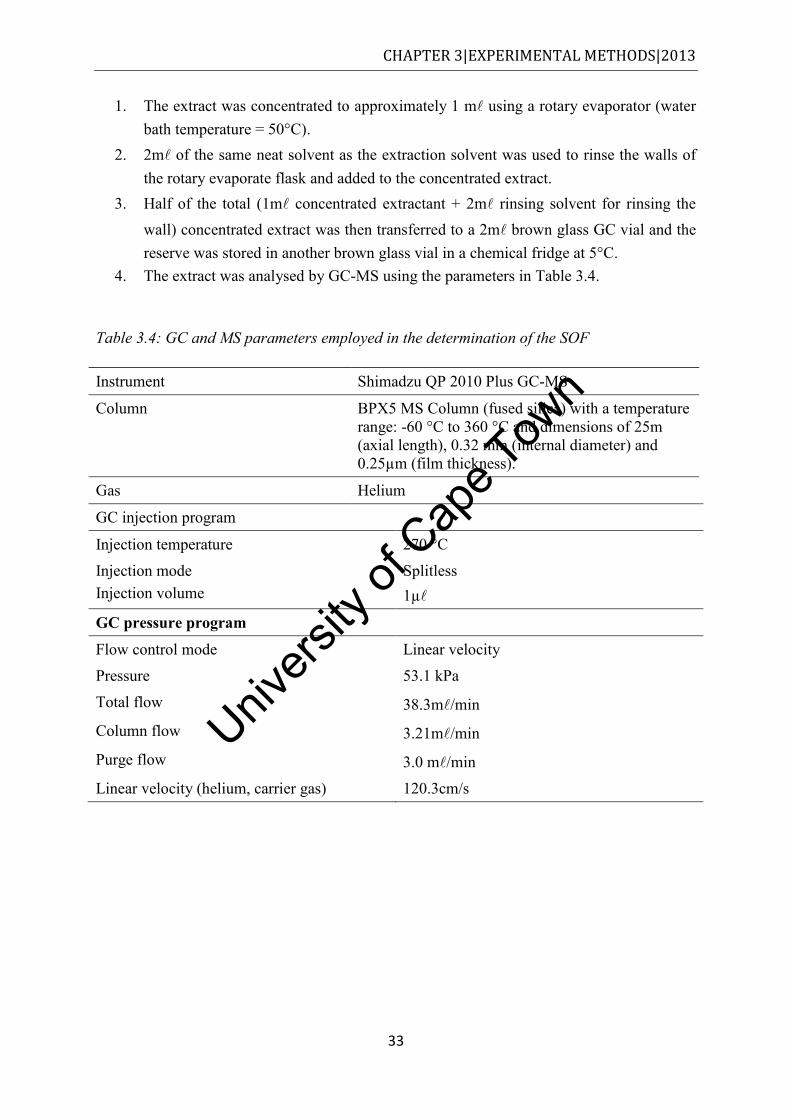
Univers
ity of
Cap
e Tow
n
CHAPTER 3|EXPERIMENTAL METHODS|2013
33
1. The extract was concentrated to approximately 1 m using a rotary evaporator (water bath temperature = 50°C).
2. 2m of the same neat solvent as the extraction solvent was used to rinse the walls of the rotary evaporate flask and added to the concentrated extract.
3. Half of the total (1m concentrated extractant + 2m rinsing solvent for rinsing the wall) concentrated extract was then transferred to a 2m brown glass GC vial and the reserve was stored in another brown glass vial in a chemical fridge at 5°C.
4. The extract was analysed by GC-MS using the parameters in Table 3.4.
Table 3.4: GC and MS parameters employed in the determination of the SOF
Instrument Shimadzu QP 2010 Plus GC-MS
Column BPX5 MS Column (fused silica) with a temperature range: -60 °C to 360 °C and dimensions of 25m (axial length), 0.32 mm (internal diameter) and 0.25µm (film thickness).
Gas Helium
GC injection program
Injection temperature 270 °C
Injection mode Injection volume
Splitless 1µ
GC pressure program
Flow control mode Linear velocity
Pressure 53.1 kPa
Total flow 38.3m/min Column flow 3.21m/min Purge flow 3.0 m/min
Linear velocity (helium, carrier gas) 120.3cm/s
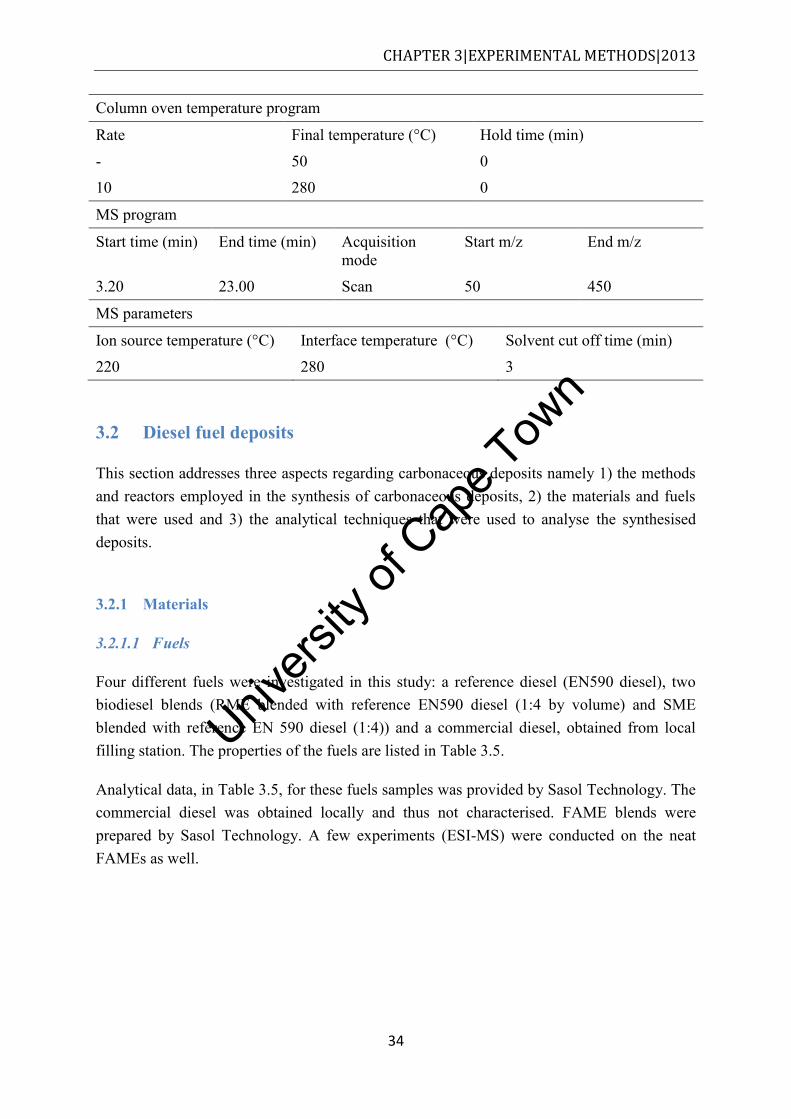
Univers
ity of
Cap
e Tow
n
CHAPTER 3|EXPERIMENTAL METHODS|2013
34
Column oven temperature program
Rate Final temperature (°C) Hold time (min)
- 50 0
10 280 0
MS program
Start time (min) End time (min) Acquisition mode
Start m/z End m/z
3.20 23.00 Scan 50 450
MS parameters
Ion source temperature (°C) Interface temperature (°C) Solvent cut off time (min)
220 280 3
3.2 Diesel fuel deposits
This section addresses three aspects regarding carbonaceous deposits namely 1) the methods and reactors employed in the synthesis of carbonaceous deposits, 2) the materials and fuels that were used and 3) the analytical techniques that were used to analyse the synthesised deposits.
3.2.1 Materials
3.2.1.1 Fuels
Four different fuels were investigated in this study: a reference diesel (EN590 diesel), two biodiesel blends (RME blended with reference EN590 diesel (1:4 by volume) and SME blended with reference EN 590 diesel (1:4)) and a commercial diesel, obtained from local filling station. The properties of the fuels are listed in Table 3.5.
Analytical data, in Table 3.5, for these fuels samples was provided by Sasol Technology. The commercial diesel was obtained locally and thus not characterised. FAME blends were prepared by Sasol Technology. A few experiments (ESI-MS) were conducted on the neat FAMEs as well.
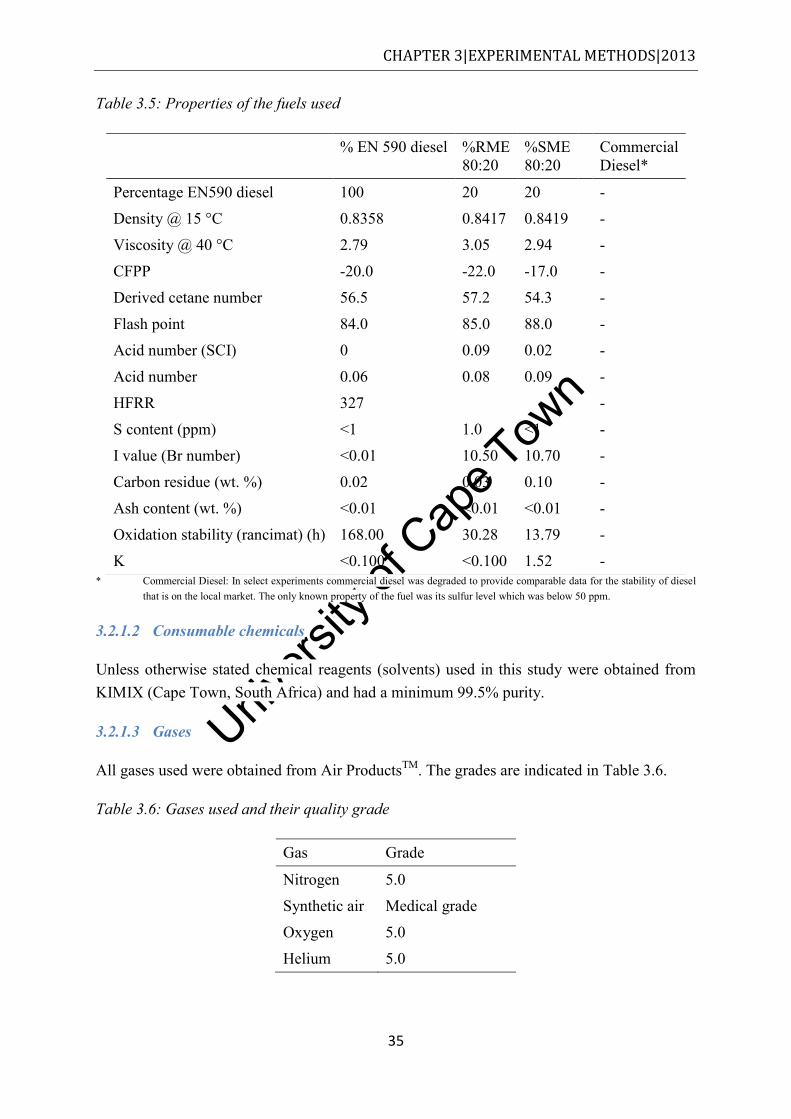
Univers
ity of
Cap
e Tow
n
CHAPTER 3|EXPERIMENTAL METHODS|2013
35
Table 3.5: Properties of the fuels used
% EN 590 diesel %RME 80:20
%SME 80:20
Commercial Diesel*
Percentage EN590 diesel 100 20 20 -
Density @ 15 °C 0.8358 0.8417 0.8419 -
Viscosity @ 40 °C 2.79 3.05 2.94 -
CFPP -20.0 -22.0 -17.0 -
Derived cetane number 56.5 57.2 54.3 -
Flash point 84.0 85.0 88.0 -
Acid number (SCI) 0 0.09 0.02 -
Acid number 0.06 0.08 0.09 -
HFRR 327 -
S content (ppm) <1 1.0 <1 -
I value (Br number) <0.01 10.50 10.70 -
Carbon residue (wt. %) 0.02 0.03 0.10 -
Ash content (wt. %) <0.01 <0.01 <0.01 -
Oxidation stability (rancimat) (h) 168.00 30.28 13.79 -
K <0.100 <0.100 1.52 - * Commercial Diesel: In select experiments commercial diesel was degraded to provide comparable data for the stability of diesel
that is on the local market. The only known property of the fuel was its sulfur level which was below 50 ppm.
3.2.1.2 Consumable chemicals
Unless otherwise stated chemical reagents (solvents) used in this study were obtained from KIMIX (Cape Town, South Africa) and had a minimum 99.5% purity.
3.2.1.3 Gases
All gases used were obtained from Air ProductsTM. The grades are indicated in Table 3.6.
Table 3.6: Gases used and their quality grade
Gas Grade
Nitrogen 5.0
Synthetic air Medical grade
Oxygen 5.0
Helium 5.0
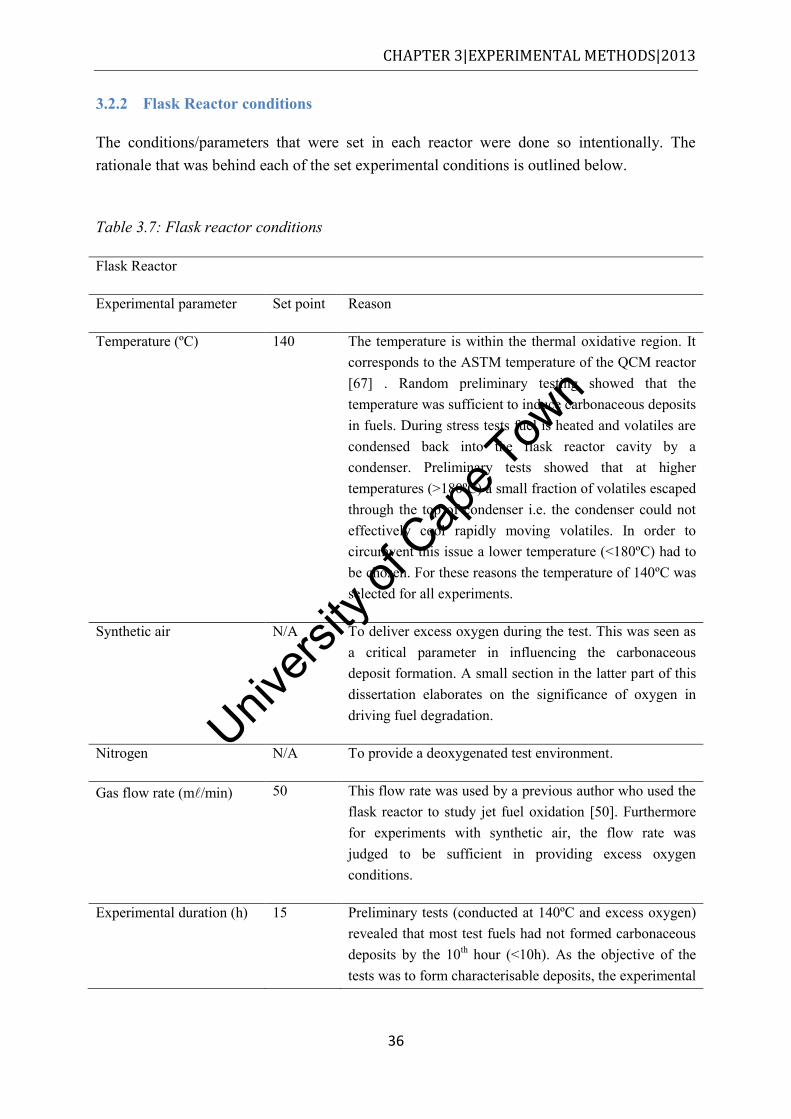
Univers
ity of
Cap
e Tow
n
CHAPTER 3|EXPERIMENTAL METHODS|2013
36
3.2.2 Flask Reactor conditions
The conditions/parameters that were set in each reactor were done so intentionally. The rationale that was behind each of the set experimental conditions is outlined below.
Table 3.7: Flask reactor conditions
Flask Reactor
Experimental parameter Set point Reason
Temperature (ºC) 140 The temperature is within the thermal oxidative region. It corresponds to the ASTM temperature of the QCM reactor [67] . Random preliminary testing showed that the temperature was sufficient to induce carbonaceous deposits in fuels. During stress tests fuel is heated and volatiles are condensed back into the flask reactor cavity by a condenser. Preliminary tests showed that at higher temperatures (>180ºC) a small fraction of volatiles escaped through the top of condenser i.e. the condenser could not effectively cool rapidly moving volatiles. In order to circumvent this issue a lower temperature (<180ºC) had to be chosen. For these reasons the temperature of 140ºC was selected for all experiments.
Synthetic air N/A To deliver excess oxygen during the test. This was seen as a critical parameter in influencing the carbonaceous deposit formation. A small section in the latter part of this dissertation elaborates on the significance of oxygen in driving fuel degradation.
Nitrogen N/A To provide a deoxygenated test environment.
Gas flow rate (m/min) 50 This flow rate was used by a previous author who used the flask reactor to study jet fuel oxidation [50]. Furthermore for experiments with synthetic air, the flow rate was judged to be sufficient in providing excess oxygen conditions.
Experimental duration (h) 15 Preliminary tests (conducted at 140ºC and excess oxygen) revealed that most test fuels had not formed carbonaceous deposits by the 10th hour (<10h). As the objective of the tests was to form characterisable deposits, the experimental
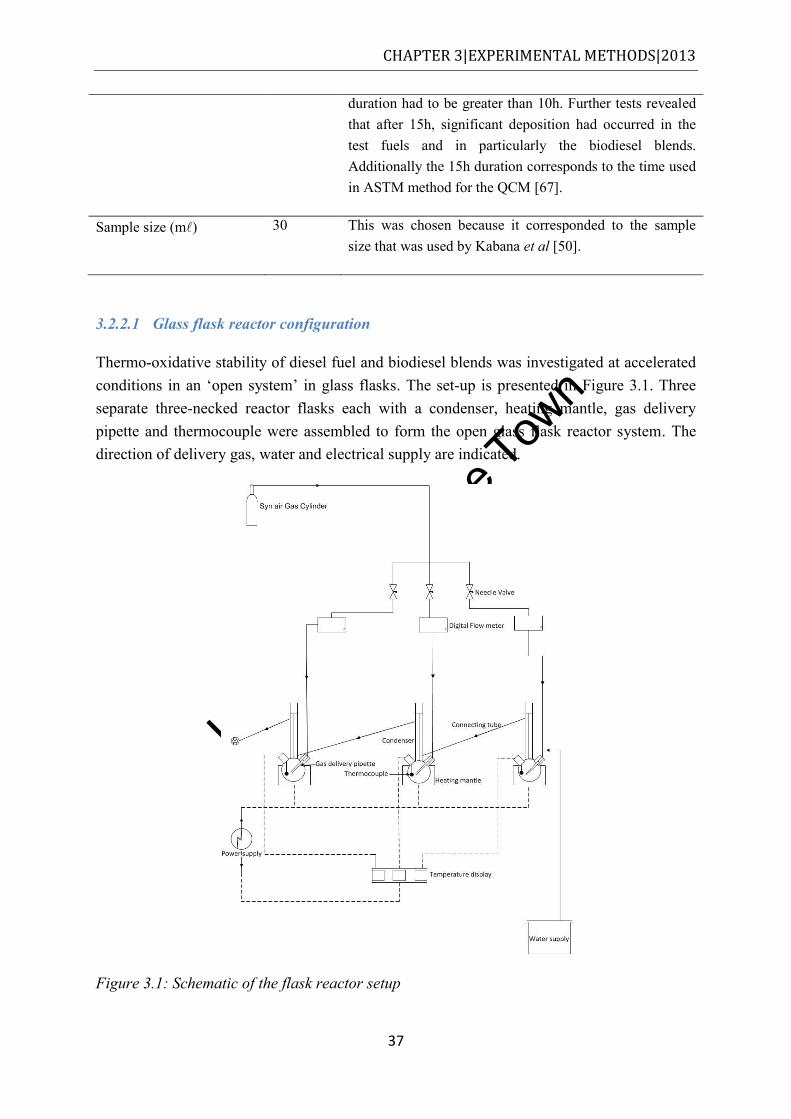
Univers
ity of
Cap
e Tow
n
CHAPTER 3|EXPERIMENTAL METHODS|2013
37
duration had to be greater than 10h. Further tests revealed that after 15h, significant deposition had occurred in the test fuels and in particularly the biodiesel blends. Additionally the 15h duration corresponds to the time used in ASTM method for the QCM [67].
Sample size (m) 30 This was chosen because it corresponded to the sample size that was used by Kabana et al [50].
3.2.2.1 Glass flask reactor configuration
Thermo-oxidative stability of diesel fuel and biodiesel blends was investigated at accelerated conditions in an ‘open system’ in glass flasks. The set-up is presented in Figure 3.1. Three separate three-necked reactor flasks each with a condenser, heating mantle, gas delivery pipette and thermocouple were assembled to form the open glass flask reactor system. The direction of delivery gas, water and electrical supply are indicated.
Figure 3.1: Schematic of the flask reactor setup
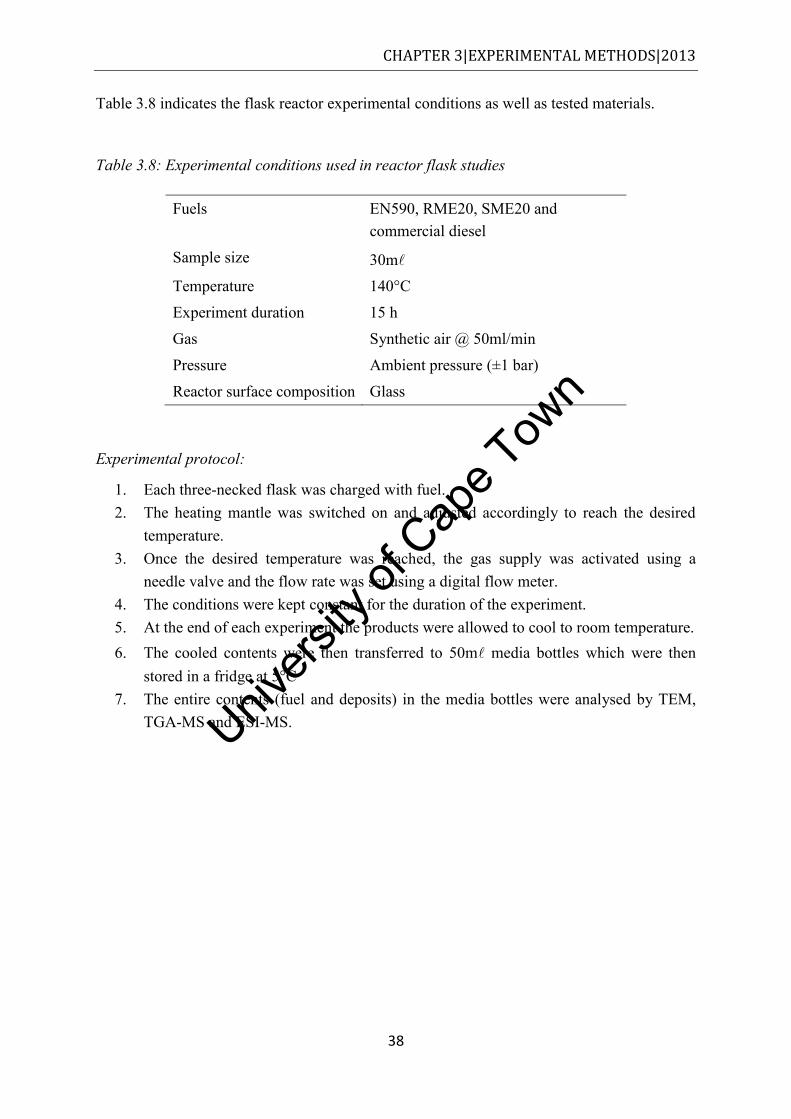
Univers
ity of
Cap
e Tow
n
CHAPTER 3|EXPERIMENTAL METHODS|2013
38
Table 3.8 indicates the flask reactor experimental conditions as well as tested materials.
Table 3.8: Experimental conditions used in reactor flask studies
Fuels EN590, RME20, SME20 and commercial diesel
Sample size 30m Temperature 140°C
Experiment duration 15 h
Gas Synthetic air @ 50ml/min
Pressure Ambient pressure (±1 bar)
Reactor surface composition Glass
Experimental protocol:
1. Each three-necked flask was charged with fuel. 2. The heating mantle was switched on and adjusted accordingly to reach the desired
temperature. 3. Once the desired temperature was reached, the gas supply was activated using a
needle valve and the flow rate was set using a digital flow meter. 4. The conditions were kept constant for the duration of the experiment. 5. At the end of each experiment the products were allowed to cool to room temperature. 6. The cooled contents were then transferred to 50m media bottles which were then
stored in a fridge at 5°C 7. The entire contents (fuel and deposits) in the media bottles were analysed by TEM,
TGA-MS and ESI-MS.
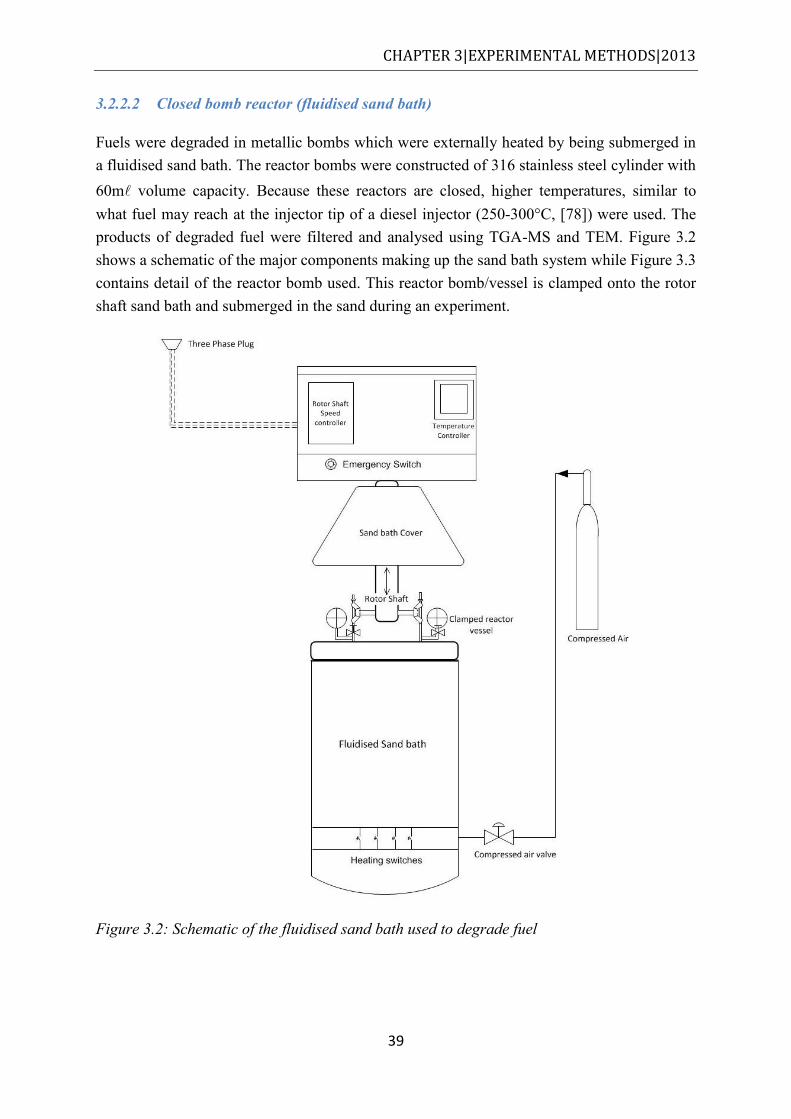
Univers
ity of
Cap
e Tow
n
CHAPTER 3|EXPERIMENTAL METHODS|2013
39
3.2.2.2 Closed bomb reactor (fluidised sand bath)
Fuels were degraded in metallic bombs which were externally heated by being submerged in a fluidised sand bath. The reactor bombs were constructed of 316 stainless steel cylinder with 60m volume capacity. Because these reactors are closed, higher temperatures, similar to what fuel may reach at the injector tip of a diesel injector (250-300°C, [78]) were used. The products of degraded fuel were filtered and analysed using TGA-MS and TEM. Figure 3.2 shows a schematic of the major components making up the sand bath system while Figure 3.3 contains detail of the reactor bomb used. This reactor bomb/vessel is clamped onto the rotor shaft sand bath and submerged in the sand during an experiment.
Figure 3.2: Schematic of the fluidised sand bath used to degrade fuel
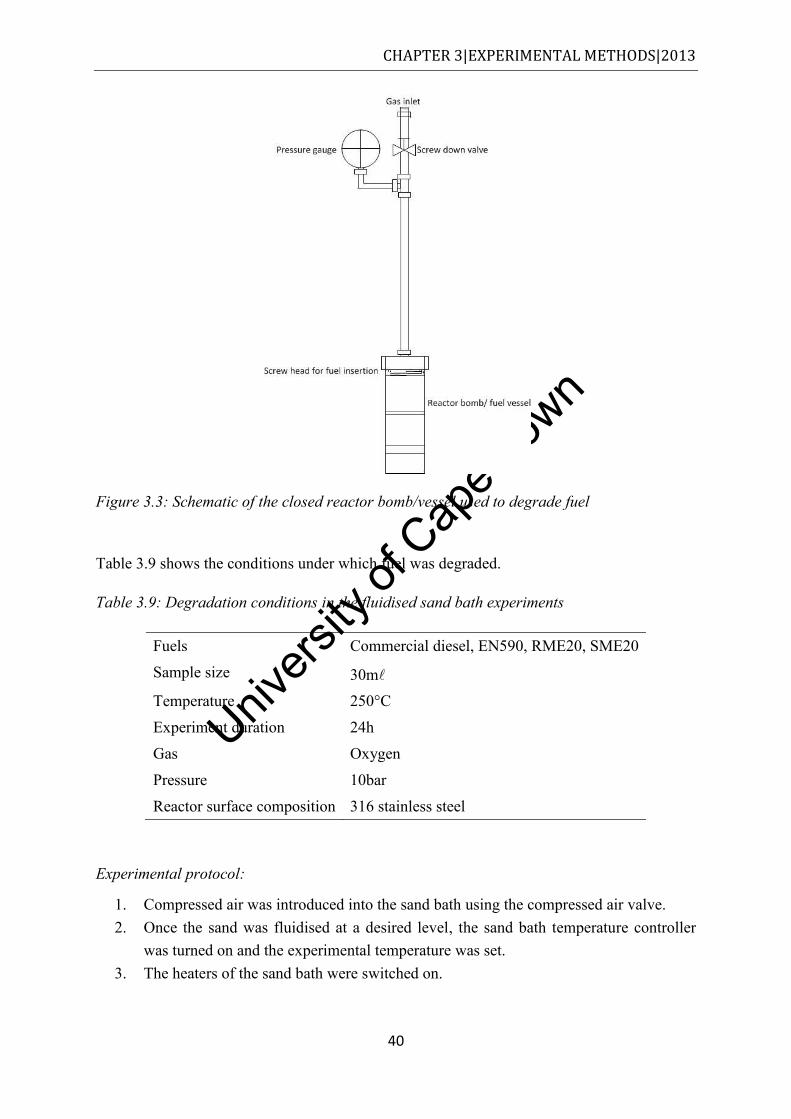
Univers
ity of
Cap
e Tow
n
CHAPTER 3|EXPERIMENTAL METHODS|2013
40
Figure 3.3: Schematic of the closed reactor bomb/vessel used to degrade fuel
Table 3.9 shows the conditions under which fuel was degraded.
Table 3.9: Degradation conditions in the fluidised sand bath experiments
Fuels Commercial diesel, EN590, RME20, SME20
Sample size 30m Temperature 250°C
Experiment duration 24h
Gas Oxygen
Pressure 10bar
Reactor surface composition 316 stainless steel
Experimental protocol:
1. Compressed air was introduced into the sand bath using the compressed air valve. 2. Once the sand was fluidised at a desired level, the sand bath temperature controller
was turned on and the experimental temperature was set. 3. The heaters of the sand bath were switched on.
Univers
ity of
Cap
e Tow
n
CHAPTER 3|EXPERIMENTAL METHODS|2013
41
4. The reactor bombs were filled with the appropriate fuel and charged with oxygen gas to the desired pressure.
5. Once the sand bath reached the set temperature the reactor bomb was clamped onto the rotor shaft of the sand bath and then submerged in the fluidised heated sand.
6. The submerged reactor bomb was then agitated by switching on and adjusting the speed controller of the reciprocating shaft. The agitation is provided by a constant upward and downward motion of the shaft.
7. All conditions were kept constant for the duration of the experiment. Procedure for collecting deposits.
8. After the duration of the experiment each reactor bomb was removed from the fluidised sand bath and quenched in a water bucket and left to cool in the bucket for approximately 10min.
9. The reactor bombs were depressurised and opened. The products were collected on a Munktell glass fibre filter, washed with 25m hexane and analysed using TGA-MS and TEM.
3.2.2.3 Continuous flow reactor
A flow reactor was employed in this study to stress diesel at elevated temperature and pressure in a flowing system. The system is composed of a vertical furnace, temperature controller, HPLC pump and chiller, which circulates coolant to the condensing unit to cool heated fuel. The temperature conditions were chosen to resemble the conditions experienced by the diesel injector tip [78]. Figure 3.4 depicts a basic schematic of the flow reactor used in this study while Table 3.10 illustrates the experimental conditions and reactor tube characteristics.
Other authors [10, 11] use single-pass fuel flow reactors. Because some of the fuel in common rail injections systems recirculates between the rail and the tank, it was decided to modify the system to enable recirculation of fuel. This also allows smaller quantities of fuel to be used for stressing.
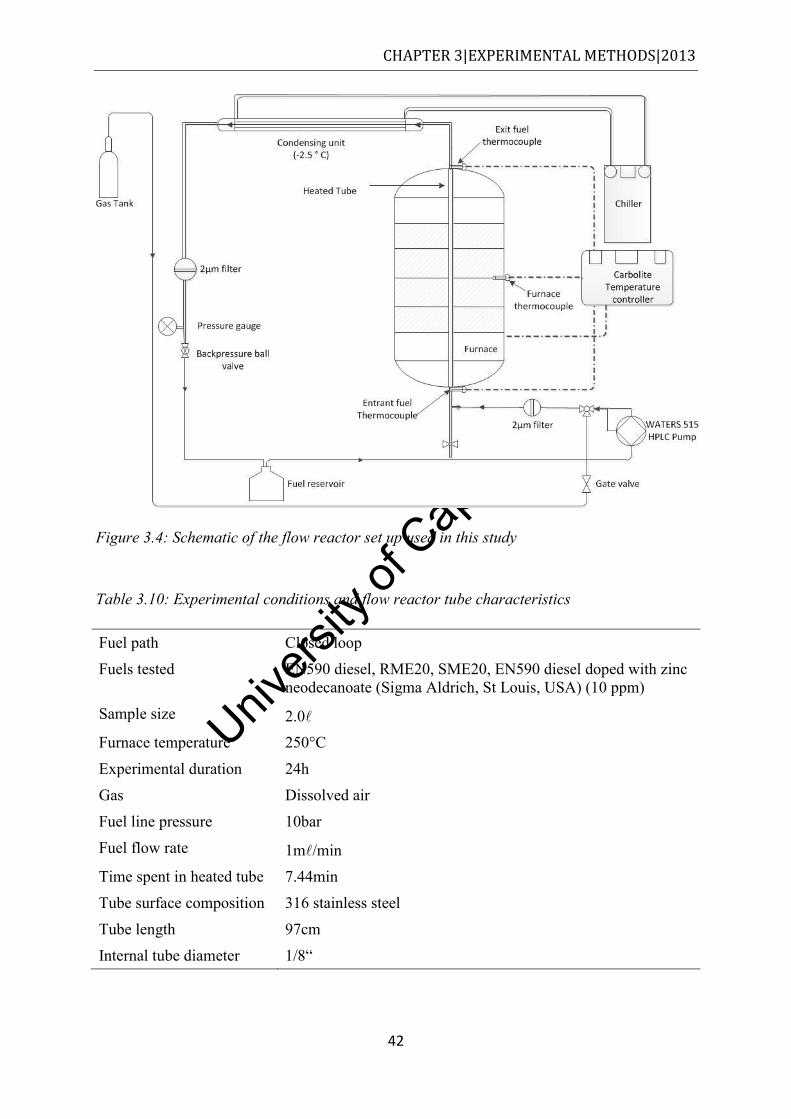
Univers
ity of
Cap
e Tow
n
CHAPTER 3|EXPERIMENTAL METHODS|2013
42
Figure 3.4: Schematic of the flow reactor set up used in this study
Table 3.10: Experimental conditions and flow reactor tube characteristics
Fuel path Closed loop
Fuels tested EN590 diesel, RME20, SME20, EN590 diesel doped with zinc neodecanoate (Sigma Aldrich, St Louis, USA) (10 ppm)
Sample size 2.0 Furnace temperature 250°C
Experimental duration 24h
Gas Dissolved air
Fuel line pressure 10bar
Fuel flow rate 1m/min Time spent in heated tube 7.44min
Tube surface composition 316 stainless steel
Tube length 97cm
Internal tube diameter 1/8“
Univers
ity of
Cap
e Tow
n
CHAPTER 3|EXPERIMENTAL METHODS|2013
43
Experimental protocol:
1. The metal tube reactor was fastened into the furnace and connected to the external fuel circuit.
2. The furnace was then turned on and the desired temperature was set. 3. Once the furnace reached the set temperature, the fuel was pumped through the
system by activating the HPLC pump. 4. The back pressure valve was adjusted to the desired pressure. 5. The conditions were kept constant for the duration of the experiment. 6. The reactor tube was sectioned into seven segments of equal length. 3 mm thick disks
representing each segment were sliced out at the junctions between segments and washed in hexane to remove residual fuel.
7. The sectioned disks were then analysed using TGA-MS and optical microscopy.
Because the fuel residence time in the flow reactor is short, further tests were performed on fuels which had been doped with 10ppm zinc. Zinc was added because it is known to accelerate deposit formation [79, 80, 81, 82]. Doping followed the CEC F-98-08 DW10 injector fouling engine test protocol [83].
Doping protocol:
1. A zinc stock solution was prepared by dissolving 2.99g zinc neodecanote (Alfa Aesar, Karlsruhe, Germany) in 26.95g of an aromatic solvent, Fluidar 150 (Engen, Durban, South Africa).
2. This solution was then used to dose diesel fuels and blends. 10ppm (m/m) dosed fuels were prepared by adding 44.5mg of the zinc stock solution to 800g of the base fuels, to produce the fuels in Table 3.5.
3.2.2.4 Quartz crystal microbalance (QCM)
A QCM was employed by this study to provide quantitative data on the depositing propensity of diesel fuels under conditions described in Zabarnick [65] and ASTM D7739-11 [67]. The preparation, clean up and basic operation of the QCM are described in ASTM D7739-11. Below is a summary of these.
Univers
ity of
Cap
e Tow
n
CHAPTER 3|EXPERIMENTAL METHODS|2013
44
Table 3.11: Set of conditions that fuels were subjected during QCM experiments
Test conditions
Temperature (°C) Pressure (bar) Time (h)
140 1 15
Fuels tested
EN59 diesel
Commercial diesel
RME20 SME20
3.2.3 Sampling methodology for reactor deposits
The sample sizes of the deposits varied due to difference in their sampling methodologies. These methodologies were enforced by the different nature of the deposits.
3.2.3.1 Flask reactions
Degradation of RME20 and even more so SME20 in glass flasks produced viscous sludge that was difficult to filter. For this reason a representative sample of fuel plus deposits was collected from the flask reactor and was analysed using TGA-MS and TEM. Where two layers formed after stressing, a Pasteur pipette was used to remove a sample from each layer.
3.2.3.2 Sand bath reactor deposits
Sand bath reactor deposits were filtered because they were not as viscous as flask reactor deposits. At the end of a degradation test the fuel and deposit contents in each reactor bomb were filtered through a MunktellTM glass fibre filter paper (1.6µm). Carbonaceous deposits, which strongly adhered to the walls of the sand bath reactor bombs, were scrapped off and transferred onto the filter with the fuel deposit filtrate. The filter and filtrate were analysed using TGA-MS and TEM.
3.2.3.3 Flow reactor deposits
Sampling from the flow reactor required sectioning the reactor tubes into 3mm disks. This was done to minimise the mass of the tubes because the TA Instruments Q5000IR mass balance has a weight range up to 100mg. The sectioned tubes consistently had a mass of 70-80mg. These were analysed directly in the TGA.
Univers
ity of
Cap
e Tow
n
CHAPTER 3|EXPERIMENTAL METHODS|2013
45
3.2.4 Techniques employed to characterise fuel deposits
3.2.4.1 TGA-MS
All thermal analysis experiments were performed using a TA Q5000IR thermogravimetric analyser (TGA) which was coupled to an MKSTM Cirrus 2 mass spectrometer via a heated capillary tube. This configuration enabled simultaneous monitoring of mass loss of the sample and identification of the evolved gases. Thermal analysis was conducted on deposits from the flask, fluidised sand bath and flow reactor, under nitrogen and synthetic air atmospheres. Thermal analysis of deposits yielded gases which were detected by the MS. During oxidative thermal analysis (synthetic air atmosphere) the gases of concern were primarily CO2 and H2O. CO2 profiles were used to indicate the fixed carbon content of the deposits and their oxidative stability while the water signal was used as an indicator of deposits associated with hydrogen [10].
Table 3.12 contains system conditions for the TGA which were consistent for deposits from all reactors. The TGA was calibrated for mass using mass standards and for temperature using the Curie points of nickel (358oC) and iron (770oC). The MS was calibrated for concentration using synthetic air. The MS instrumental information and experimental parameters are shown in Table 3.13.
Table 3.12: Experimental conditions adopted for analysis of diesel soot and deposits in the TGA
Heating rate 10°C/min
Atmosphere Syn air or N2
Sample purge gas flow rate 25m/min Pan type 50µl Pt
The heating rate was chosen because 10oC/min is often used as default and so that the results observed here could be compared to other studies [84].
Univers
ity of
Cap
e Tow
n
CHAPTER 3|EXPERIMENTAL METHODS|2013
46
Table 3.13: MS instrument information and experimental parameters for analysis of diesel deposits
Instrument information
Instrument MKSTM Cirrus 2 MS
Sensor identification Standard enclosed source
Detector types Dual Faraday and multipliers
Maximum mass 300 amu
Experimental parameters
Source Standard electron energy (70eV)
Detector used Faraday
Mass scan range 12-50 amu
3.2.4.2 Fourier transform infrared spectroscopy (FTIR)
FTIR spectra were obtained using the instrument and technique detailed in Table 3.14.
Table 3.14: FTIR instrument description and experimental parameters
Instrument specifications
Instrument type Nicolet 6700 FTIR
Spectral range 7800-350 cm-1
Optical resolution 0.09 cm-1
Wavenumber precision 0.01 cm-1
Experimental parameters
FTIR mode Absorbance
Number of sample scans 32.0
Number of background scans 32.0
Resolution 4.00
Optical velocity 0.63
Aperture 100
Detector DTGS KBr
Beamsplitter KBR
Source IR
Univers
ity of
Cap
e Tow
n
CHAPTER 3|EXPERIMENTAL METHODS|2013
47
3.2.4.3 TEM
The TEM used to analyse fuel deposits was the same as that employed for the study of diesel soot. The deposits that were analysed using this technique were deposits from the flask and sand bath reactions.
Analysis of flask reactor deposits with the TEM required a representative sample. Approximately 15m fuel, soluble and insoluble gum etc. from the bottom of the flasks were removed with a spatula and transferred to a glass vial containing 20m ethanol. The ethanol deposit mixture was then centrifuged. A sample was dropped onto a copper TEM grid using a Pasteur pipette. The remainder of the procedure was in accordance with the method described in section 3.1.2.2.
For sand bath reactor deposits, the filtrate was scrapped off the filter and transferred to a vial containing ethanol, then centrifuged and transferred to a Cu grid. The rest of the procedure followed that in section 3.1.2.2.
3.2.4.4 ESI-MS
Positive ESI-MS was used to evaluate the deposit precursors that are formed during thermal-oxidative stressing of diesel fuels in a glass flask. Sample preparation for ESI-MS as well as instrumental parameters are outlined below.
Sample preparation:
1. 30 of each fuel were degraded inside a 50m flask at 140°C with 50m/min air flow for 15h.
2. After the thermal-oxidative stressing process, the cooled fuels were inserted into a separatory funnel and mixed with methanol (fuel: methanol 5:2 by volume).
3. The fuel-methanol mixture was shaken and left in the separatory funnel for 2 h to ensure adequate separation of the methanol fraction from the fuel.
4. The methanol layer was collected and stored in glass vials in a fridge at 5°C for later analysis.
Univers
ity of
Cap
e Tow
n
CHAPTER 3|EXPERIMENTAL METHODS|2013
48
The acquisition process involved introducing the ESI probe containing sample into a stream of acetonitrile and 0.1% formic acid. Commodo et al. [74] diluted their methanol extract with methanol i.e. (1:100 methanol extract/ methanol). In the paper however they concede that dilution of the sample with methanol was probably unwise and hence in this study no dilution of the methanol extract was conducted. The mass spectra of the methanol extract were collected in the range of m/z 100-1000.
Analyses where performed at the Central Analytical Facility at the University of Stellenbosch.
The instrument as well as its parameters are detailed in Table 3.15.
Table 3.15: Instrument employed in the acquisition of ESI-MS data
Instrument Waters Synapt G2
Source ESI positive
Cone voltage 15 V
Lock mass (reference) Leucine enkaphalin (555.6g/mol)
3.2.4.5 Digital microscopy
Images of the compressed samples were captured using a Nikon ShuttlePix P-MFSC microscope.
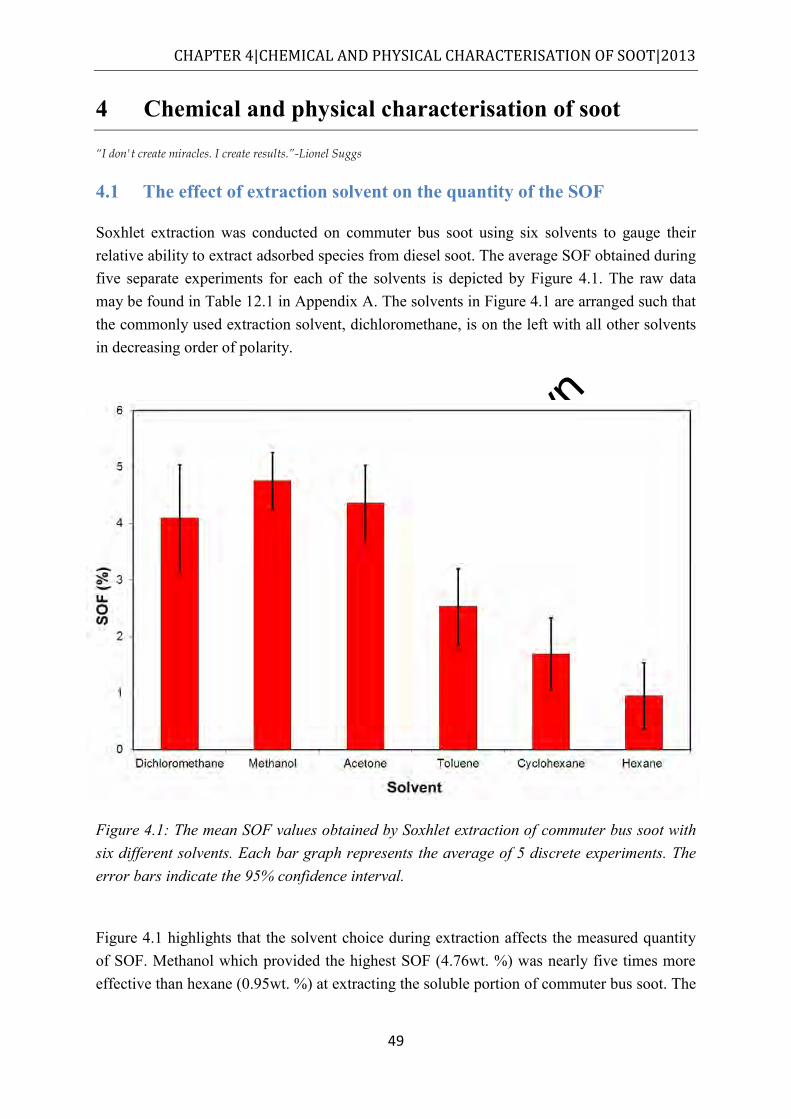
Univers
ity of
Cap
e Tow
n
CHAPTER 4|CHEMICAL AND PHYSICAL CHARACTERISATION OF SOOT|2013
49
4 Chemical and physical characterisation of soot
“I don't create miracles. I create results.”-Lionel Suggs
4.1 The effect of extraction solvent on the quantity of the SOF
Soxhlet extraction was conducted on commuter bus soot using six solvents to gauge their relative ability to extract adsorbed species from diesel soot. The average SOF obtained during five separate experiments for each of the solvents is depicted by Figure 4.1. The raw data may be found in Table 12.1 in Appendix A. The solvents in Figure 4.1 are arranged such that the commonly used extraction solvent, dichloromethane, is on the left with all other solvents in decreasing order of polarity.
Figure 4.1: The mean SOF values obtained by Soxhlet extraction of commuter bus soot with six different solvents. Each bar graph represents the average of 5 discrete experiments. The error bars indicate the 95% confidence interval.
Figure 4.1 highlights that the solvent choice during extraction affects the measured quantity of SOF. Methanol which provided the highest SOF (4.76wt. %) was nearly five times more effective than hexane (0.95wt. %) at extracting the soluble portion of commuter bus soot. The
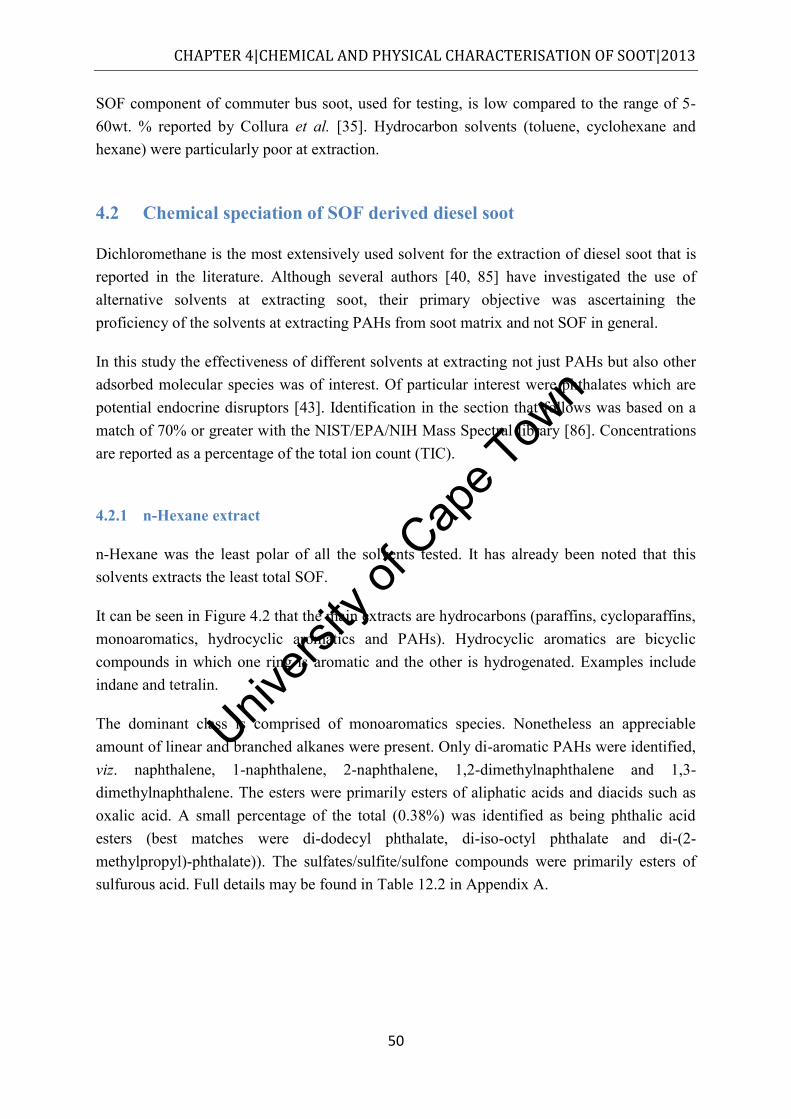
Univers
ity of
Cap
e Tow
n
CHAPTER 4|CHEMICAL AND PHYSICAL CHARACTERISATION OF SOOT|2013
50
SOF component of commuter bus soot, used for testing, is low compared to the range of 5-60wt. % reported by Collura et al. [35]. Hydrocarbon solvents (toluene, cyclohexane and hexane) were particularly poor at extraction.
4.2 Chemical speciation of SOF derived diesel soot
Dichloromethane is the most extensively used solvent for the extraction of diesel soot that is reported in the literature. Although several authors [40, 85] have investigated the use of alternative solvents at extracting soot, their primary objective was ascertaining the proficiency of the solvents at extracting PAHs from soot matrix and not SOF in general.
In this study the effectiveness of different solvents at extracting not just PAHs but also other adsorbed molecular species was of interest. Of particular interest were phthalates which are potential endocrine disruptors [43]. Identification in the section that follows was based on a match of 70% or greater with the NIST/EPA/NIH Mass Spectral library [86]. Concentrations are reported as a percentage of the total ion count (TIC).
4.2.1 n-Hexane extract
n-Hexane was the least polar of all the solvents tested. It has already been noted that this solvents extracts the least total SOF.
It can be seen in Figure 4.2 that the main extracts are hydrocarbons (paraffins, cycloparaffins, monoaromatics, hydrocyclic aromatics and PAHs). Hydrocyclic aromatics are bicyclic compounds in which one ring is aromatic and the other is hydrogenated. Examples include indane and tetralin.
The dominant class is comprised of monoaromatics species. Nonetheless an appreciable amount of linear and branched alkanes were present. Only di-aromatic PAHs were identified, viz. naphthalene, 1-naphthalene, 2-naphthalene, 1,2-dimethylnaphthalene and 1,3-dimethylnaphthalene. The esters were primarily esters of aliphatic acids and diacids such as oxalic acid. A small percentage of the total (0.38%) was identified as being phthalic acid esters (best matches were di-dodecyl phthalate, di-iso-octyl phthalate and di-(2-methylpropyl)-phthalate)). The sulfates/sulfite/sulfone compounds were primarily esters of sulfurous acid. Full details may be found in Table 12.2 in Appendix A.
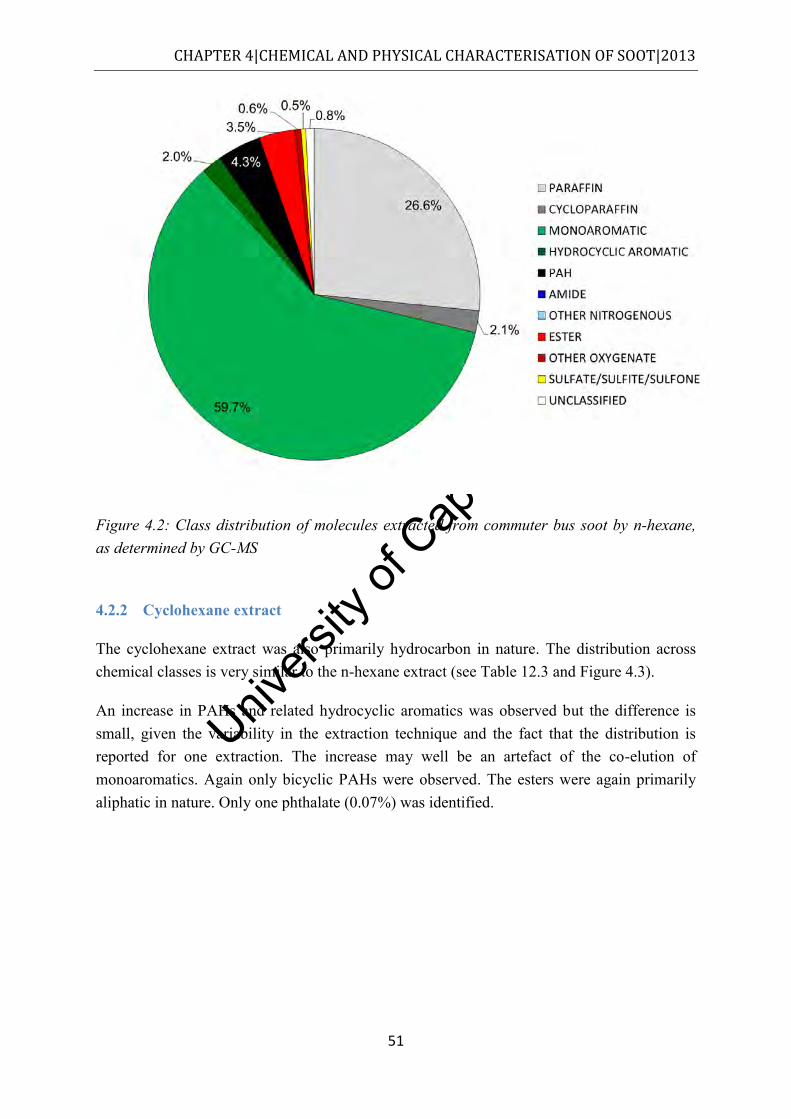
Univers
ity of
Cap
e Tow
n
CHAPTER 4|CHEMICAL AND PHYSICAL CHARACTERISATION OF SOOT|2013
51
Figure 4.2: Class distribution of molecules extracted from commuter bus soot by n-hexane, as determined by GC-MS
4.2.2 Cyclohexane extract
The cyclohexane extract was also primarily hydrocarbon in nature. The distribution across chemical classes is very similar to the n-hexane extract (see Table 12.3 and Figure 4.3).
An increase in PAHs and related hydrocyclic aromatics was observed but the difference is small, given the variability in the extraction technique and the fact that the distribution is reported for one extraction. The increase may well be an artefact of the co-elution of monoaromatics. Again only bicyclic PAHs were observed. The esters were again primarily aliphatic in nature. Only one phthalate (0.07%) was identified.
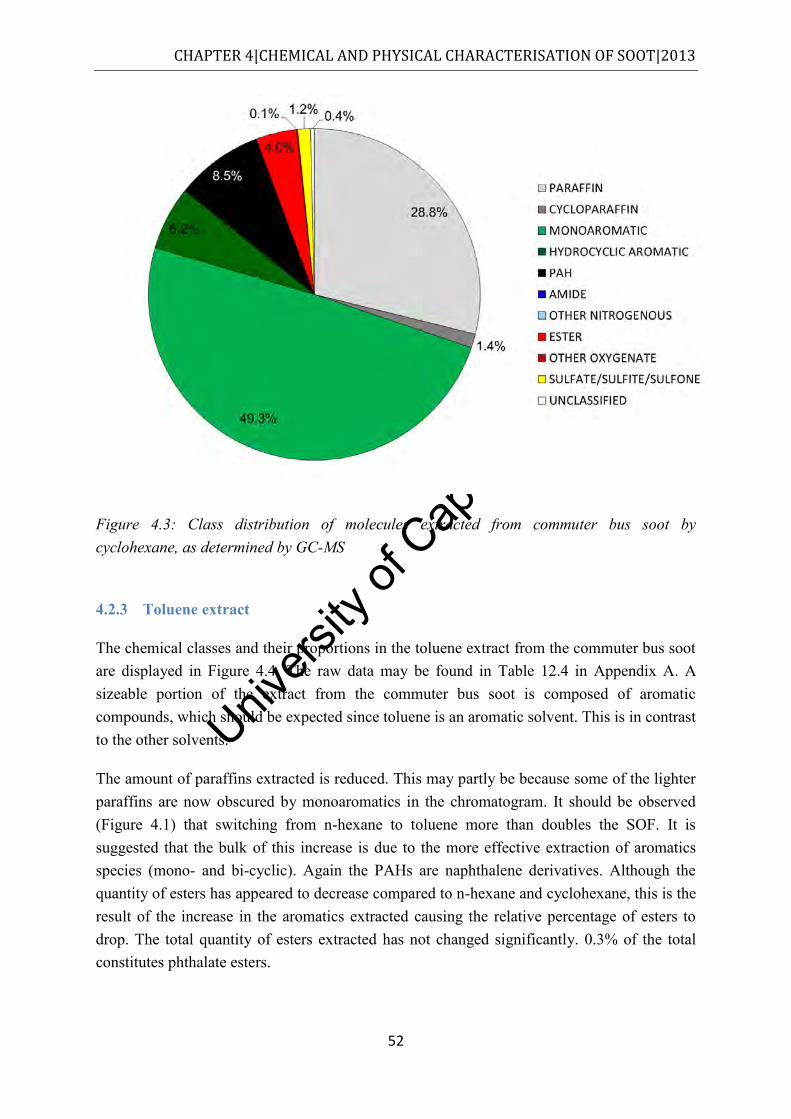
Univers
ity of
Cap
e Tow
n
CHAPTER 4|CHEMICAL AND PHYSICAL CHARACTERISATION OF SOOT|2013
52
Figure 4.3: Class distribution of molecules extracted from commuter bus soot by cyclohexane, as determined by GC-MS
4.2.3 Toluene extract
The chemical classes and their proportions in the toluene extract from the commuter bus soot are displayed in Figure 4.4. The raw data may be found in Table 12.4 in Appendix A. A sizeable portion of the extract from the commuter bus soot is composed of aromatic compounds, which should be expected since toluene is an aromatic solvent. This is in contrast to the other solvents.
The amount of paraffins extracted is reduced. This may partly be because some of the lighter paraffins are now obscured by monoaromatics in the chromatogram. It should be observed (Figure 4.1) that switching from n-hexane to toluene more than doubles the SOF. It is suggested that the bulk of this increase is due to the more effective extraction of aromatics species (mono- and bi-cyclic). Again the PAHs are naphthalene derivatives. Although the quantity of esters has appeared to decrease compared to n-hexane and cyclohexane, this is the result of the increase in the aromatics extracted causing the relative percentage of esters to drop. The total quantity of esters extracted has not changed significantly. 0.3% of the total constitutes phthalate esters.
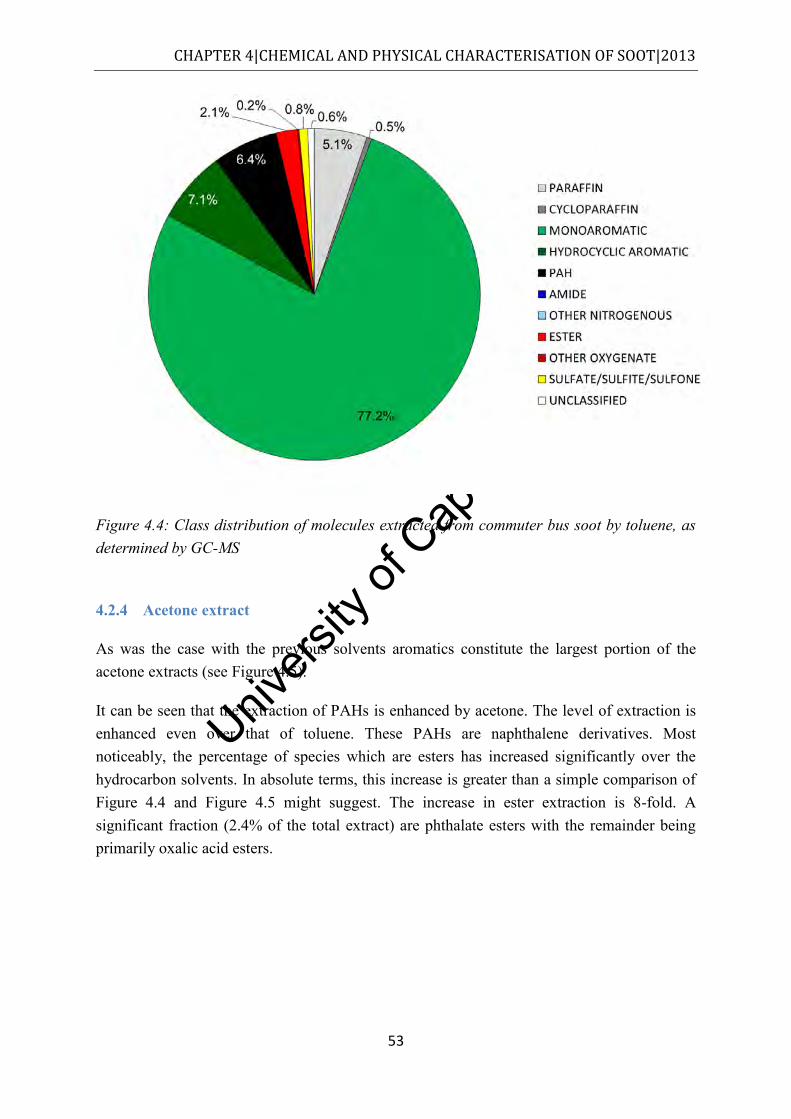
Univers
ity of
Cap
e Tow
n
CHAPTER 4|CHEMICAL AND PHYSICAL CHARACTERISATION OF SOOT|2013
53
Figure 4.4: Class distribution of molecules extracted from commuter bus soot by toluene, as determined by GC-MS
4.2.4 Acetone extract
As was the case with the previous solvents aromatics constitute the largest portion of the acetone extracts (see Figure 4.5).
It can be seen that the extraction of PAHs is enhanced by acetone. The level of extraction is enhanced even over that of toluene. These PAHs are naphthalene derivatives. Most noticeably, the percentage of species which are esters has increased significantly over the hydrocarbon solvents. In absolute terms, this increase is greater than a simple comparison of Figure 4.4 and Figure 4.5 might suggest. The increase in ester extraction is 8-fold. A significant fraction (2.4% of the total extract) are phthalate esters with the remainder being primarily oxalic acid esters.
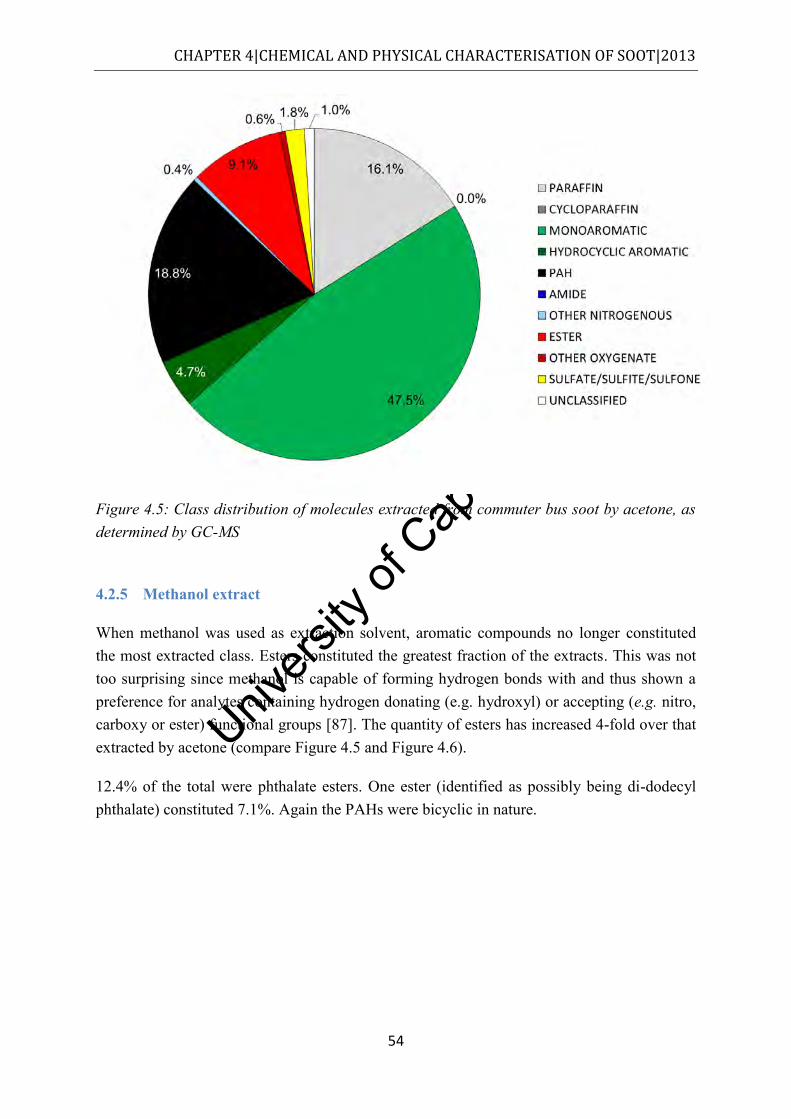
Univers
ity of
Cap
e Tow
n
CHAPTER 4|CHEMICAL AND PHYSICAL CHARACTERISATION OF SOOT|2013
54
Figure 4.5: Class distribution of molecules extracted from commuter bus soot by acetone, as determined by GC-MS
4.2.5 Methanol extract
When methanol was used as extraction solvent, aromatic compounds no longer constituted the most extracted class. Esters constituted the greatest fraction of the extracts. This was not too surprising since methanol is capable of forming hydrogen bonds with and thus shown a preference for analytes containing hydrogen donating (e.g. hydroxyl) or accepting (e.g. nitro, carboxy or ester) functional groups [87]. The quantity of esters has increased 4-fold over that extracted by acetone (compare Figure 4.5 and Figure 4.6).
12.4% of the total were phthalate esters. One ester (identified as possibly being di-dodecyl phthalate) constituted 7.1%. Again the PAHs were bicyclic in nature.
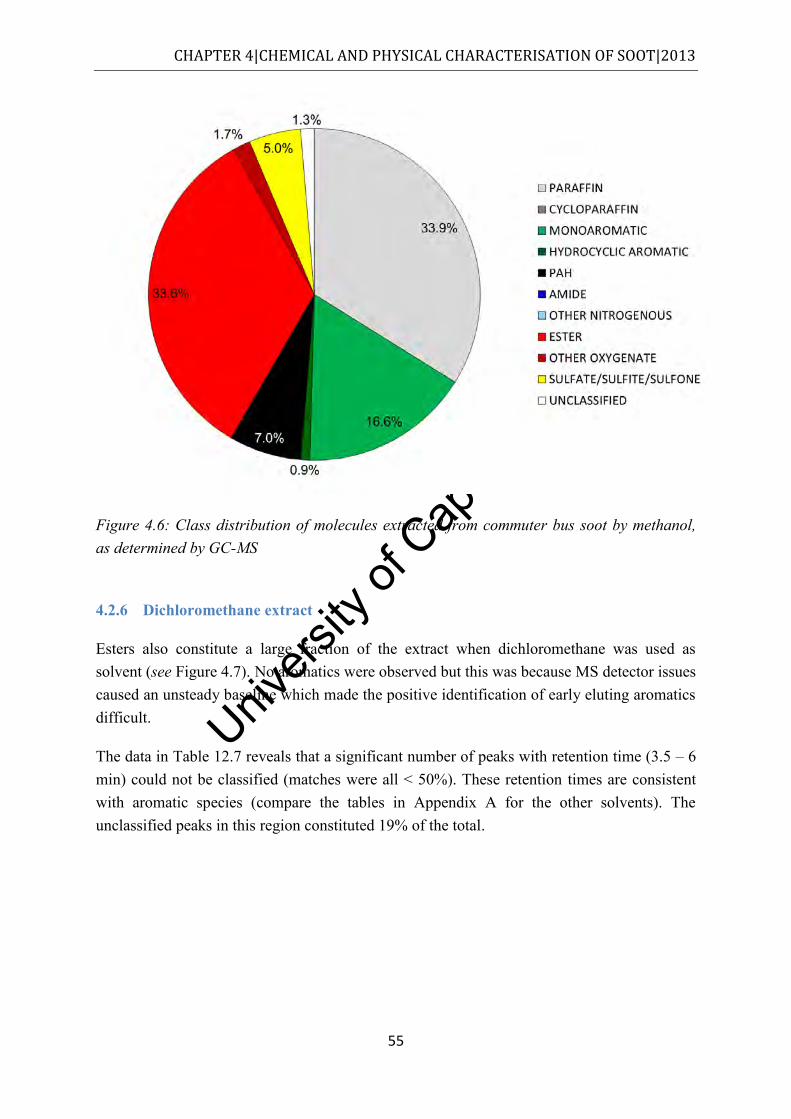
Univers
ity of
Cap
e Tow
n
CHAPTER 4|CHEMICAL AND PHYSICAL CHARACTERISATION OF SOOT|2013
55
Figure 4.6: Class distribution of molecules extracted from commuter bus soot by methanol, as determined by GC-MS
4.2.6 Dichloromethane extract
Esters also constitute a large fraction of the extract when dichloromethane was used as solvent (see Figure 4.7). No aromatics were observed but this was because MS detector issues caused an unsteady baseline which made the positive identification of early eluting aromatics difficult.
The data in Table 12.7 reveals that a significant number of peaks with retention time (3.5 – 6 min) could not be classified (matches were all < 50%). These retention times are consistent with aromatic species (compare the tables in Appendix A for the other solvents). The unclassified peaks in this region constituted 19% of the total.
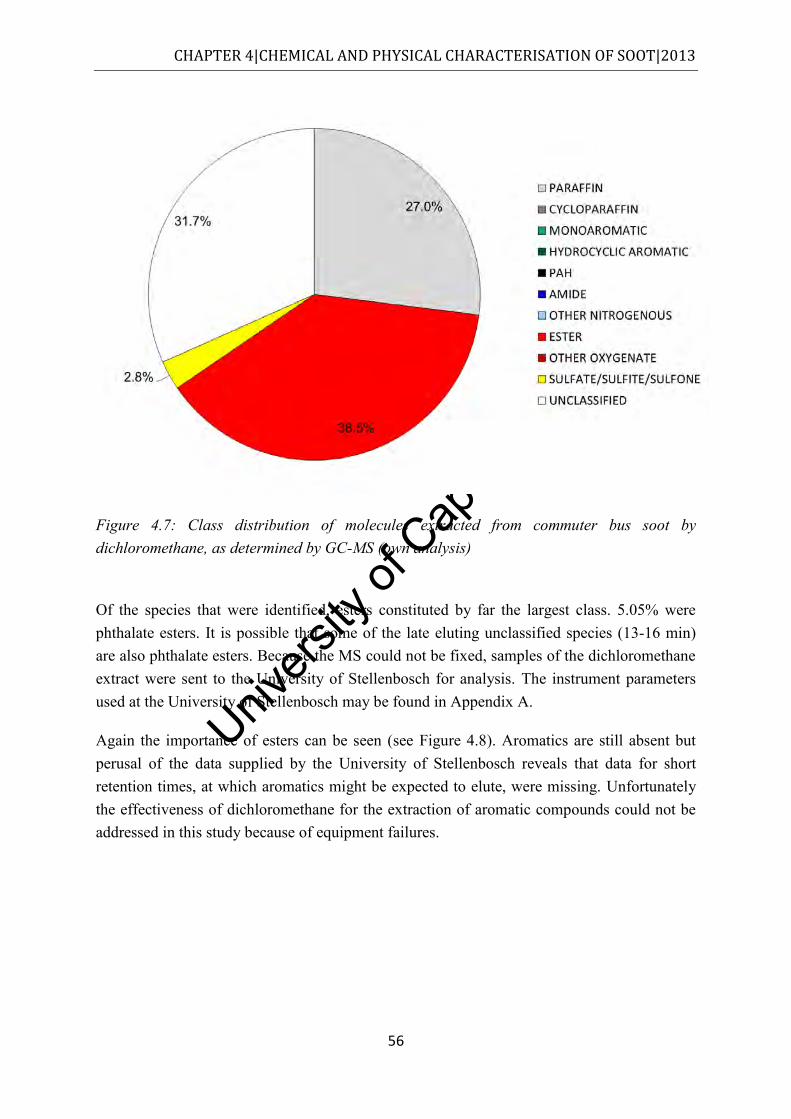
Univers
ity of
Cap
e Tow
n
CHAPTER 4|CHEMICAL AND PHYSICAL CHARACTERISATION OF SOOT|2013
56
Figure 4.7: Class distribution of molecules extracted from commuter bus soot by dichloromethane, as determined by GC-MS (own analysis)
Of the species that were identified, esters constituted by far the largest class. 5.05% were phthalate esters. It is possible that some of the late eluting unclassified species (13-16 min) are also phthalate esters. Because the MS could not be fixed, samples of the dichloromethane extract were sent to the University of Stellenbosch for analysis. The instrument parameters used at the University of Stellenbosch may be found in Appendix A.
Again the importance of esters can be seen (see Figure 4.8). Aromatics are still absent but perusal of the data supplied by the University of Stellenbosch reveals that data for short retention times, at which aromatics might be expected to elute, were missing. Unfortunately the effectiveness of dichloromethane for the extraction of aromatic compounds could not be addressed in this study because of equipment failures.
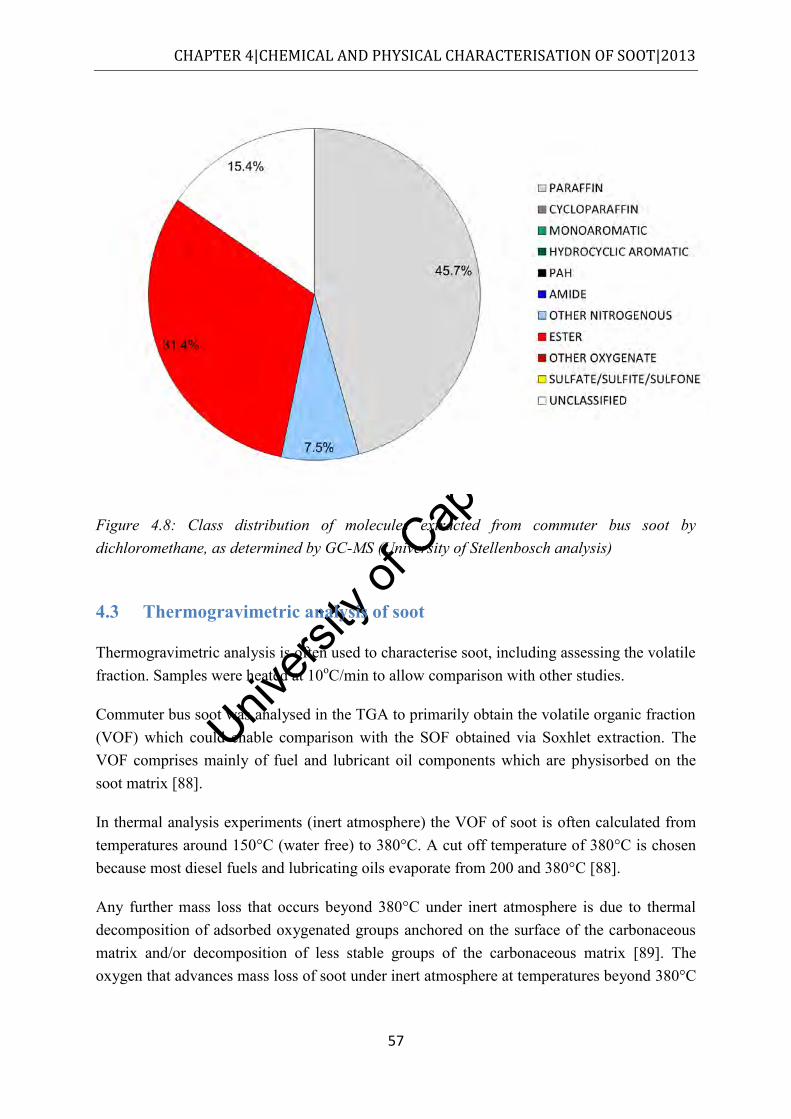
Univers
ity of
Cap
e Tow
n
CHAPTER 4|CHEMICAL AND PHYSICAL CHARACTERISATION OF SOOT|2013
57
Figure 4.8: Class distribution of molecules extracted from commuter bus soot by dichloromethane, as determined by GC-MS (University of Stellenbosch analysis)
4.3 Thermogravimetric analysis of soot
Thermogravimetric analysis is often used to characterise soot, including assessing the volatile fraction. Samples were heated at 10oC/min to allow comparison with other studies.
Commuter bus soot was analysed in the TGA to primarily obtain the volatile organic fraction (VOF) which could enable comparison with the SOF obtained via Soxhlet extraction. The VOF comprises mainly of fuel and lubricant oil components which are physisorbed on the soot matrix [88].
In thermal analysis experiments (inert atmosphere) the VOF of soot is often calculated from temperatures around 150°C (water free) to 380°C. A cut off temperature of 380°C is chosen because most diesel fuels and lubricating oils evaporate from 200 and 380°C [88].
Any further mass loss that occurs beyond 380°C under inert atmosphere is due to thermal decomposition of adsorbed oxygenated groups anchored on the surface of the carbonaceous matrix and/or decomposition of less stable groups of the carbonaceous matrix [89]. The oxygen that advances mass loss of soot under inert atmosphere at temperatures beyond 380°C
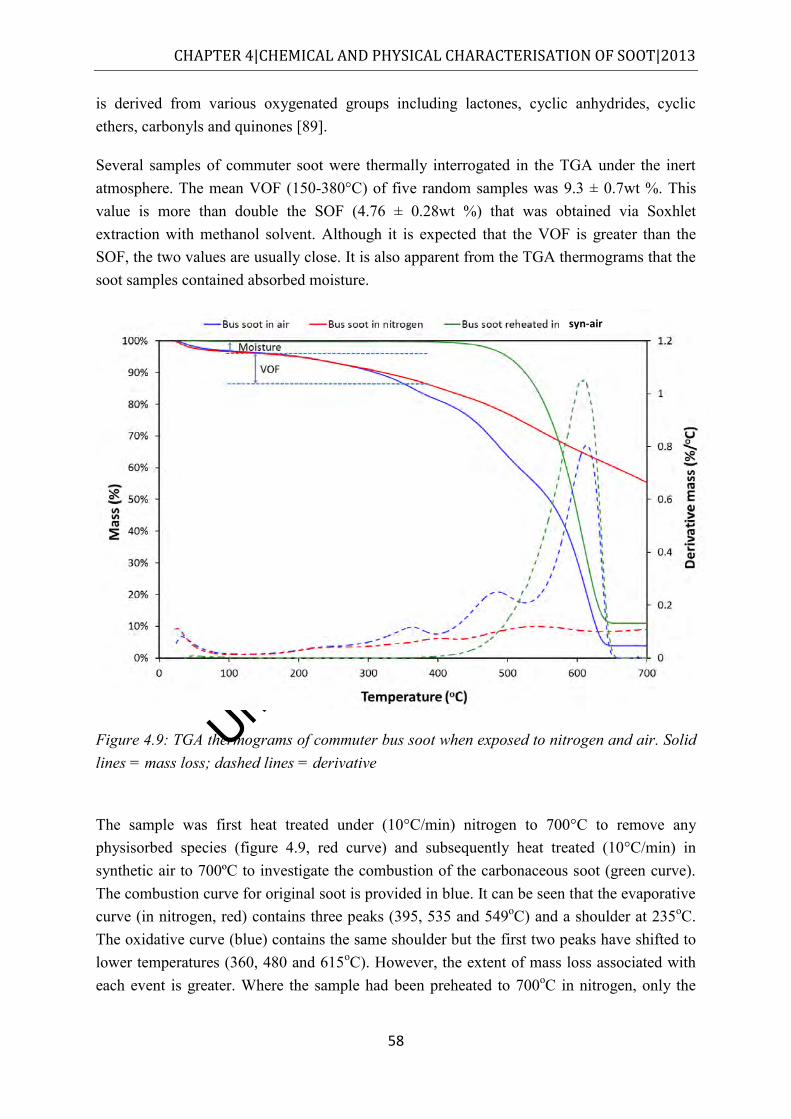
Univers
ity of
Cap
e Tow
n
CHAPTER 4|CHEMICAL AND PHYSICAL CHARACTERISATION OF SOOT|2013
58
is derived from various oxygenated groups including lactones, cyclic anhydrides, cyclic ethers, carbonyls and quinones [89].
Several samples of commuter soot were thermally interrogated in the TGA under the inert atmosphere. The mean VOF (150-380°C) of five random samples was 9.3 ± 0.7wt %. This value is more than double the SOF (4.76 ± 0.28wt %) that was obtained via Soxhlet extraction with methanol solvent. Although it is expected that the VOF is greater than the SOF, the two values are usually close. It is also apparent from the TGA thermograms that the soot samples contained absorbed moisture.
Figure 4.9: TGA thermograms of commuter bus soot when exposed to nitrogen and air. Solid lines = mass loss; dashed lines = derivative
The sample was first heat treated under (10°C/min) nitrogen to 700°C to remove any physisorbed species (figure 4.9, red curve) and subsequently heat treated (10°C/min) in synthetic air to 700ºC to investigate the combustion of the carbonaceous soot (green curve). The combustion curve for original soot is provided in blue. It can be seen that the evaporative curve (in nitrogen, red) contains three peaks (395, 535 and 549oC) and a shoulder at 235oC. The oxidative curve (blue) contains the same shoulder but the first two peaks have shifted to lower temperatures (360, 480 and 615oC). However, the extent of mass loss associated with each event is greater. Where the sample had been preheated to 700oC in nitrogen, only the
syn-air
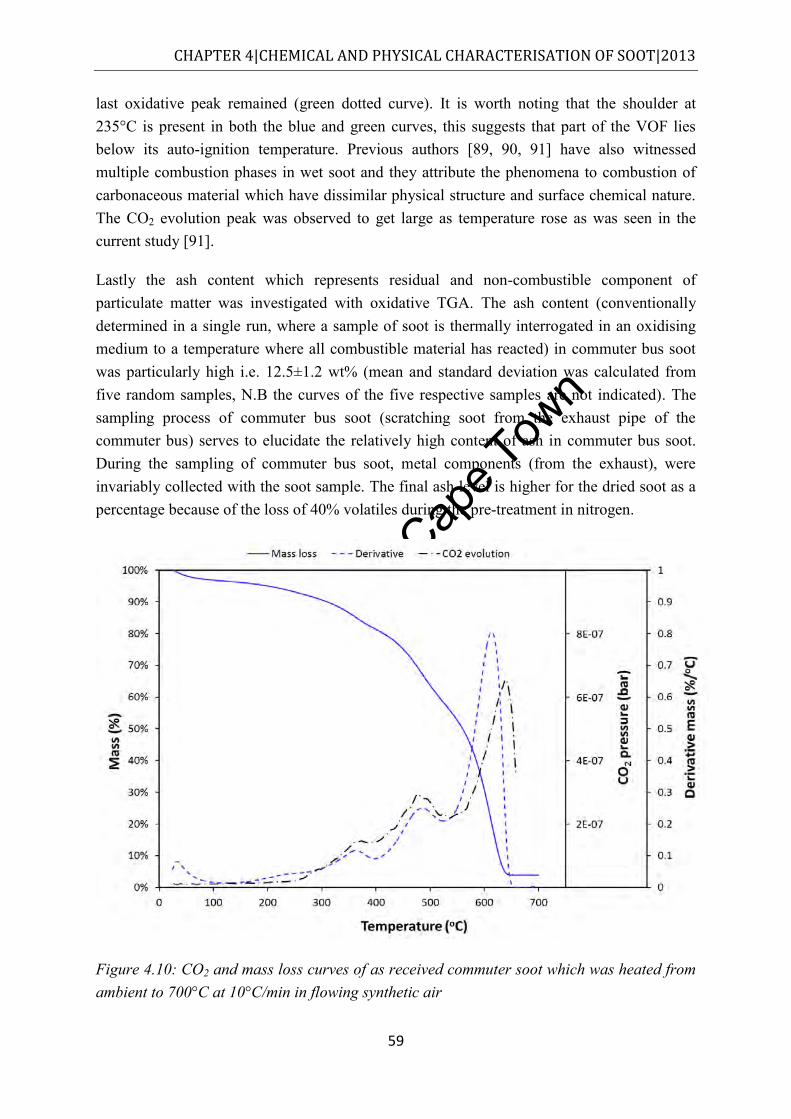
Univers
ity of
Cap
e Tow
n
CHAPTER 4|CHEMICAL AND PHYSICAL CHARACTERISATION OF SOOT|2013
59
last oxidative peak remained (green dotted curve). It is worth noting that the shoulder at 235°C is present in both the blue and green curves, this suggests that part of the VOF lies below its auto-ignition temperature. Previous authors [89, 90, 91] have also witnessed multiple combustion phases in wet soot and they attribute the phenomena to combustion of carbonaceous material which have dissimilar physical structure and surface chemical nature. The CO2 evolution peak was observed to get large as temperature rose as was seen in the current study [91].
Lastly the ash content which represents residual and non-combustible component of particulate matter was investigated with oxidative TGA. The ash content (conventionally determined in a single run, where a sample of soot is thermally interrogated in an oxidising medium to a temperature where all combustible material has reacted) in commuter bus soot was particularly high i.e. 12.5±1.2 wt% (mean and standard deviation was calculated from five random samples, N.B the curves of the five respective samples are not indicated). The sampling process of commuter bus soot (scratching soot from the exhaust pipe of the commuter bus) serves to elucidate the relatively high content of ash in commuter bus soot. During the sampling of commuter bus soot, metal components (from the exhaust), were invariably collected with the soot sample. The final ash level is higher for the dried soot as a percentage because of the loss of 40% volatiles during the pre-treatment in nitrogen.
Figure 4.10: CO2 and mass loss curves of as received commuter soot which was heated from ambient to 700°C at 10°C/min in flowing synthetic air
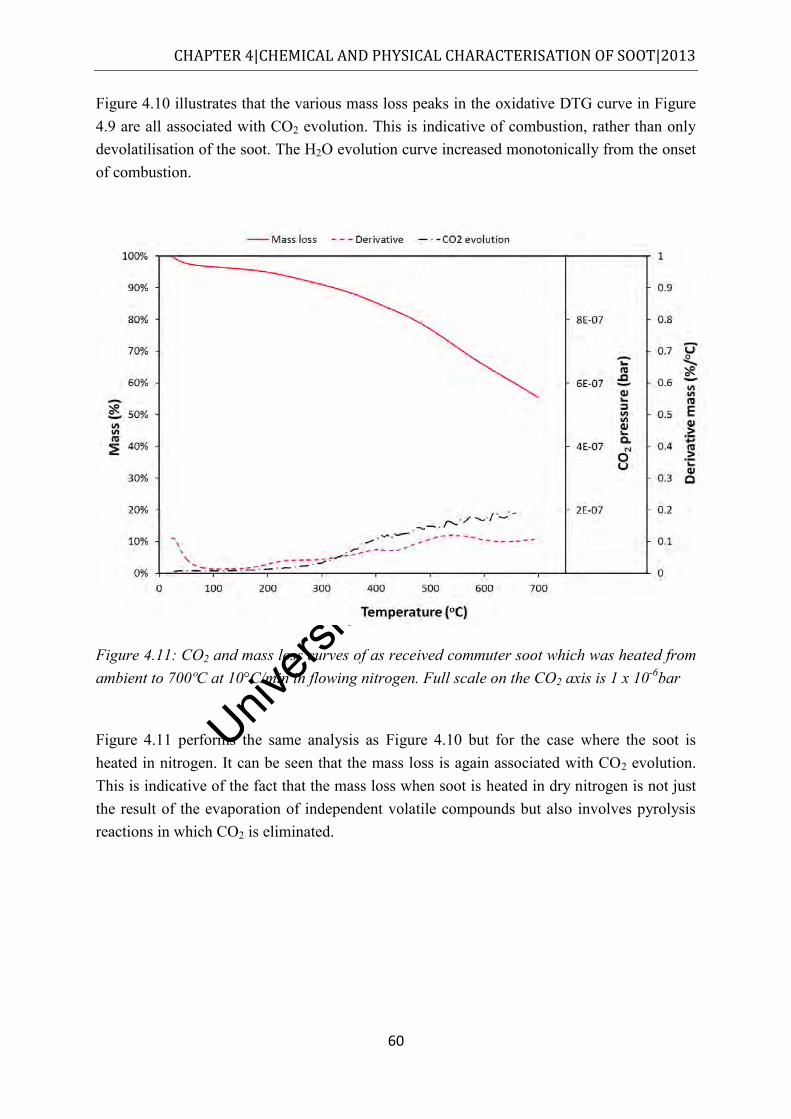
Univers
ity of
Cap
e Tow
n
CHAPTER 4|CHEMICAL AND PHYSICAL CHARACTERISATION OF SOOT|2013
60
Figure 4.10 illustrates that the various mass loss peaks in the oxidative DTG curve in Figure 4.9 are all associated with CO2 evolution. This is indicative of combustion, rather than only devolatilisation of the soot. The H2O evolution curve increased monotonically from the onset of combustion.
Figure 4.11: CO2 and mass loss curves of as received commuter soot which was heated from ambient to 700ºC at 10°C/min in flowing nitrogen. Full scale on the CO2 axis is 1 x 10⁻⁶bar
Figure 4.11 performs the same analysis as Figure 4.10 but for the case where the soot is heated in nitrogen. It can be seen that the mass loss is again associated with CO2 evolution. This is indicative of the fact that the mass loss when soot is heated in dry nitrogen is not just the result of the evaporation of independent volatile compounds but also involves pyrolysis reactions in which CO2 is eliminated.
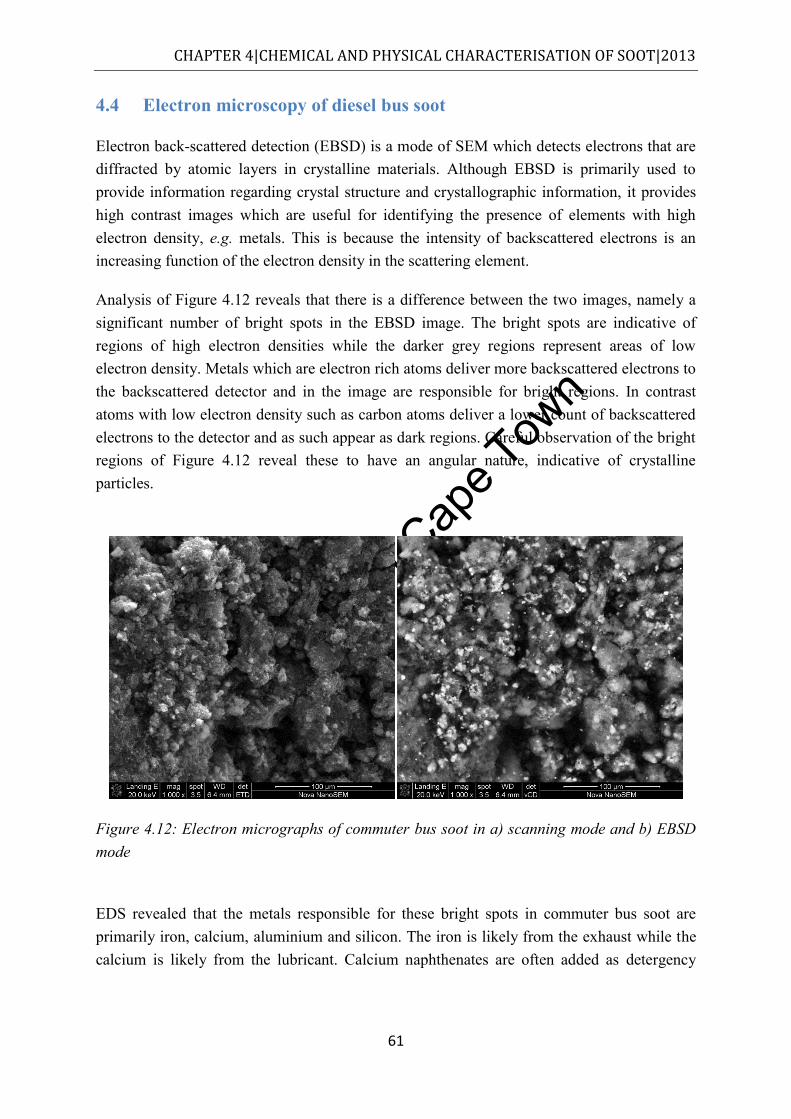
Univers
ity of
Cap
e Tow
n
CHAPTER 4|CHEMICAL AND PHYSICAL CHARACTERISATION OF SOOT|2013
61
4.4 Electron microscopy of diesel bus soot
Electron back-scattered detection (EBSD) is a mode of SEM which detects electrons that are diffracted by atomic layers in crystalline materials. Although EBSD is primarily used to provide information regarding crystal structure and crystallographic information, it provides high contrast images which are useful for identifying the presence of elements with high electron density, e.g. metals. This is because the intensity of backscattered electrons is an increasing function of the electron density in the scattering element.
Analysis of Figure 4.12 reveals that there is a difference between the two images, namely a significant number of bright spots in the EBSD image. The bright spots are indicative of regions of high electron densities while the darker grey regions represent areas of low electron density. Metals which are electron rich atoms deliver more backscattered electrons to the backscattered detector and in the image are responsible for bright regions. In contrast atoms with low electron density such as carbon atoms deliver a lower count of backscattered electrons to the detector and as such appear as dark regions. Careful observation of the bright regions of Figure 4.12 reveal these to have an angular nature, indicative of crystalline particles.
Figure 4.12: Electron micrographs of commuter bus soot in a) scanning mode and b) EBSD mode
EDS revealed that the metals responsible for these bright spots in commuter bus soot are primarily iron, calcium, aluminium and silicon. The iron is likely from the exhaust while the calcium is likely from the lubricant. Calcium naphthenates are often added as detergency
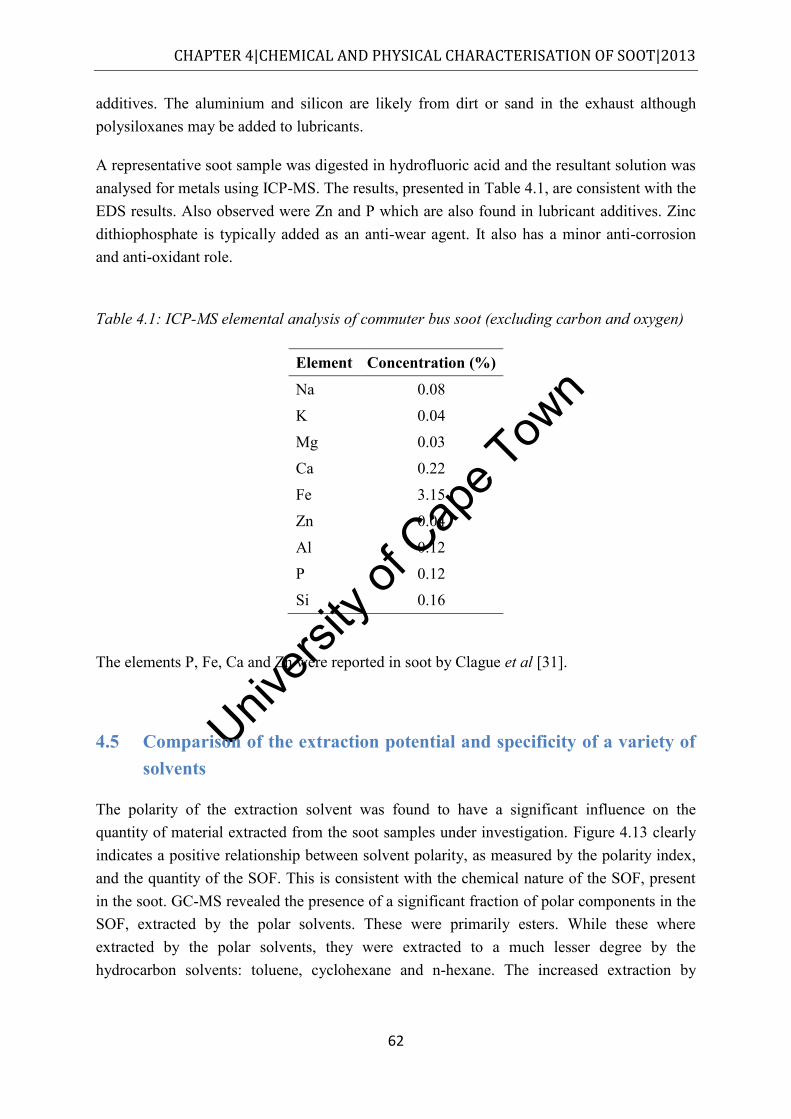
Univers
ity of
Cap
e Tow
n
CHAPTER 4|CHEMICAL AND PHYSICAL CHARACTERISATION OF SOOT|2013
62
additives. The aluminium and silicon are likely from dirt or sand in the exhaust although polysiloxanes may be added to lubricants.
A representative soot sample was digested in hydrofluoric acid and the resultant solution was analysed for metals using ICP-MS. The results, presented in Table 4.1, are consistent with the EDS results. Also observed were Zn and P which are also found in lubricant additives. Zinc dithiophosphate is typically added as an anti-wear agent. It also has a minor anti-corrosion and anti-oxidant role.
Table 4.1: ICP-MS elemental analysis of commuter bus soot (excluding carbon and oxygen)
Element Concentration (%)
Na 0.08
K 0.04
Mg 0.03
Ca 0.22
Fe 3.15
Zn 0.04
Al 0.12
P 0.12
Si 0.16
The elements P, Fe, Ca and Zn were reported in soot by Clague et al [31].
4.5 Comparison of the extraction potential and specificity of a variety of solvents
The polarity of the extraction solvent was found to have a significant influence on the quantity of material extracted from the soot samples under investigation. Figure 4.13 clearly indicates a positive relationship between solvent polarity, as measured by the polarity index, and the quantity of the SOF. This is consistent with the chemical nature of the SOF, present in the soot. GC-MS revealed the presence of a significant fraction of polar components in the SOF, extracted by the polar solvents. These were primarily esters. While these where extracted by the polar solvents, they were extracted to a much lesser degree by the hydrocarbon solvents: toluene, cyclohexane and n-hexane. The increased extraction by
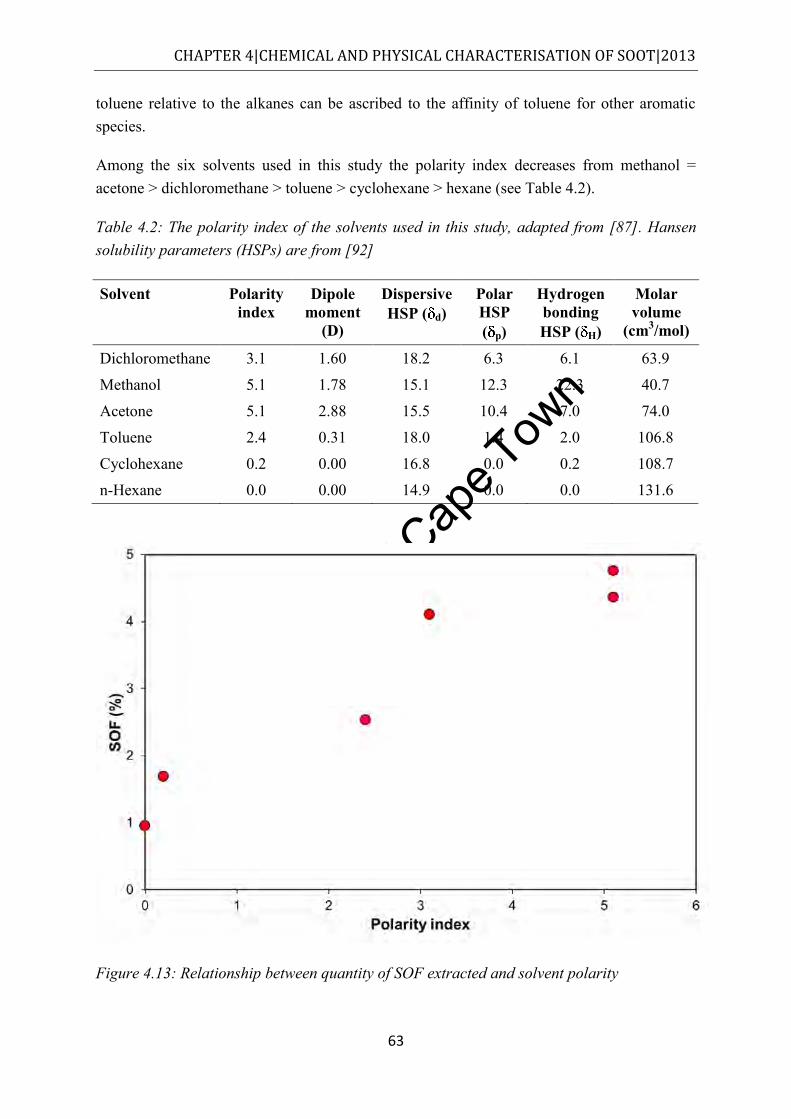
Univers
ity of
Cap
e Tow
n
CHAPTER 4|CHEMICAL AND PHYSICAL CHARACTERISATION OF SOOT|2013
63
toluene relative to the alkanes can be ascribed to the affinity of toluene for other aromatic species.
Among the six solvents used in this study the polarity index decreases from methanol = acetone > dichloromethane > toluene > cyclohexane > hexane (see Table 4.2).
Table 4.2: The polarity index of the solvents used in this study, adapted from [87]. Hansen solubility parameters (HSPs) are from [92]
Solvent Polarity index
Dipole moment
(D)
Dispersive HSP ( d)
Polar HSP ( p)
Hydrogen bonding HSP ( H)
Molar volume
(cm3/mol)
Dichloromethane 3.1 1.60 18.2 6.3 6.1 63.9
Methanol 5.1 1.78 15.1 12.3 22.3 40.7
Acetone 5.1 2.88 15.5 10.4 7.0 74.0
Toluene 2.4 0.31 18.0 1.4 2.0 106.8
Cyclohexane 0.2 0.00 16.8 0.0 0.2 108.7
n-Hexane 0.0 0.00 14.9 0.0 0.0 131.6
Figure 4.13: Relationship between quantity of SOF extracted and solvent polarity
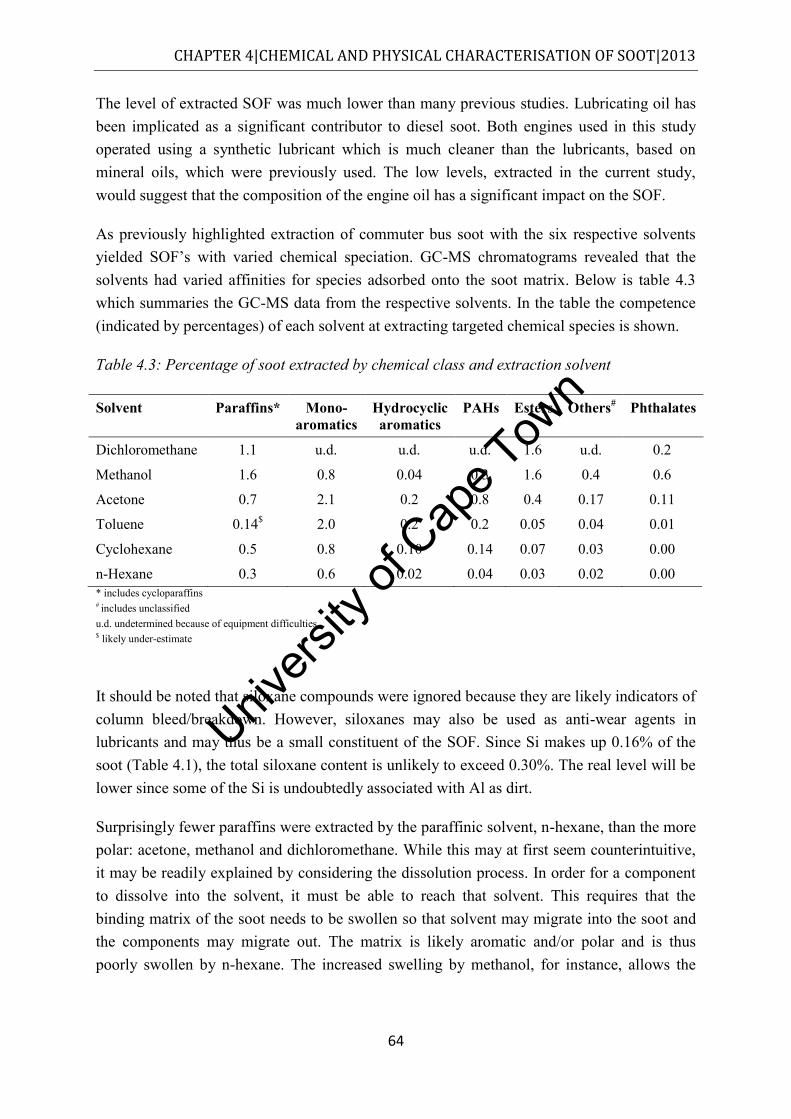
Univers
ity of
Cap
e Tow
n
CHAPTER 4|CHEMICAL AND PHYSICAL CHARACTERISATION OF SOOT|2013
64
The level of extracted SOF was much lower than many previous studies. Lubricating oil has been implicated as a significant contributor to diesel soot. Both engines used in this study operated using a synthetic lubricant which is much cleaner than the lubricants, based on mineral oils, which were previously used. The low levels, extracted in the current study, would suggest that the composition of the engine oil has a significant impact on the SOF.
As previously highlighted extraction of commuter bus soot with the six respective solvents yielded SOF’s with varied chemical speciation. GC-MS chromatograms revealed that the solvents had varied affinities for species adsorbed onto the soot matrix. Below is table 4.3 which summaries the GC-MS data from the respective solvents. In the table the competence (indicated by percentages) of each solvent at extracting targeted chemical species is shown.
Table 4.3: Percentage of soot extracted by chemical class and extraction solvent
Solvent Paraffins* Mono-aromatics
Hydrocyclic aromatics
PAHs Esters Others# Phthalates
Dichloromethane 1.1 u.d. u.d. u.d. 1.6 u.d. 0.2
Methanol 1.6 0.8 0.04 0.3 1.6 0.4 0.6 Acetone 0.7 2.1 0.2 0.8 0.4 0.17 0.11 Toluene 0.14$ 2.0 0.2 0.2 0.05 0.04 0.01 Cyclohexane 0.5 0.8 0.10 0.14 0.07 0.03 0.00 n-Hexane 0.3 0.6 0.02 0.04 0.03 0.02 0.00 * includes cycloparaffins # includes unclassified u.d. undetermined because of equipment difficulties $ likely under-estimate
It should be noted that siloxane compounds were ignored because they are likely indicators of column bleed/breakdown. However, siloxanes may also be used as anti-wear agents in lubricants and may thus be a small constituent of the SOF. Since Si makes up 0.16% of the soot (Table 4.1), the total siloxane content is unlikely to exceed 0.30%. The real level will be lower since some of the Si is undoubtedly associated with Al as dirt.
Surprisingly fewer paraffins were extracted by the paraffinic solvent, n-hexane, than the more polar: acetone, methanol and dichloromethane. While this may at first seem counterintuitive, it may be readily explained by considering the dissolution process. In order for a component to dissolve into the solvent, it must be able to reach that solvent. This requires that the binding matrix of the soot needs to be swollen so that solvent may migrate into the soot and the components may migrate out. The matrix is likely aromatic and/or polar and is thus poorly swollen by n-hexane. The increased swelling by methanol, for instance, allows the
Univers
ity of
Cap
e Tow
n
CHAPTER 4|CHEMICAL AND PHYSICAL CHARACTERISATION OF SOOT|2013
65
paraffins to exit the soot. A similar effect has been observed when coal is swollen and extracted [92].
Toluene and acetone were the most effective for the extraction of monoaromatics and hydroaromatics. The extraction by the former is not surprising since the solubility parameters of toluene matches those of the aromatics concerned. Dissolution is usually maximised when solubility parameters match [92]. The extraction by methanol is reduced because methanol is likely too polar. Although there is a slight mismatch in solubility parameters between acetone and monoaromatics, this is offset by the small molar volume of acetone. Small molar volume solvents are more effective at swelling and dissolution [92].
The extraction of PAHs was maximised in acetone. Although these species are aromatic their delocalised -electron distribution gives them some polar and “hydrogen-bonding” character.
p and h are more closely aligned with those of acetone. The extraction by methanol is lower because the p and h are even higher and more mismatched, leading to methanol being a poorer solvent for PAHs. Similar behaviour has been observed for the extraction of polyaromatic asphaltenes from crude oil [92]. Mannistu et al. found better asphaltene solubility in acetone than methanol [93]. Another possible reason for the absence of PAHs in methanol extract is that PAH stability in methanol has been shown to be an issue. PAHs such as benzo[ ]pyrene, acenapthene, benz[ ]anthracene, fluoranthene and dibenz[a,h]anthracene photodegrade in methanol [87] on relatively short time scales which may have occurred during handling. Interestingly Jonker and Koelmans [40]were able to get good extraction using alcohols by blending these with toluene. This has the effect of creating a solvent with average solubility parameters closest to PAHs. The study of mixed solvents was beyond the scope of the current study.
Nonetheless, the total level of PAH extraction was low. This is in contrast to Todorović and Zdravkovski [4] and Yu et al. [36]. Yu et al. [36] reported that their toluene fraction was almost wholly composed of substituted and unsubstituted PAHs. Note, however, that their study was conducted in 1981. Commercial diesel fuels had less stringent fuel specifications, permitting a larger component of PAHs and aromatics in the fuel and lubricants. Lubricants have been implicated as a significant contributor to soot [31]. The commercial bus, from which soot was taken, used synthetic oil which contains next to no PAHs, unlike older lubricants which used mineral oils as a base. In a more recent study by Todorović and Zdravkovski [4] the toluene extract of soot from several modern vehicles contained far fewer PAHs. Only naphthalene, pyrene, anthracene and phenanthrene were detected. This observation suggests that lower PAHs in modern commercial fuels and lubricants, leads to fewer PAHs being detected in modern soot samples.
Univers
ity of
Cap
e Tow
n
CHAPTER 4|CHEMICAL AND PHYSICAL CHARACTERISATION OF SOOT|2013
66
The intrinsic polarity of methanol and acetone renders these solvents ideally suited for ester extraction. Esters are common additives to lubricating oil, particularly synthetic lubricating oils (composed of mainly n-paraffinic molecules), to enhance the oils lubricity as well as enable the oil to form stable solutions with polar additives [26]. It is known that the bus (MAN) from which our sample was collected, ran on synthetic lubricating oil (Mobil Delvac 1 LE 5W-30). The higher solubility parameters of methanol than acetone provide a better match with those for these esters which explains the higher extraction by methanol. Over a third of the esters extracted by methanol were found to be phthalate esters. These esters are potential endocrine disruptors. Esters were also identified by Todorović and Zdravkovski [4]. The low polarity of the hydrocarbon solvents explains why very little of these esters are found in the extracts of these solvents.
Unfortunately good data could not be obtained for dichloromethane because of equipment difficulties. However, dichloromethane has been shown to extract PAHs in diesel soot by Borras et al. [5], Yu et al. [36] and Oukebdane et al. [85]. However, mixed aromatic/alocohol solvents were demonstrated to be better [40]. Esters also make up a large portion of the dichloromethane extract. This was confirmed by analysis both at SAFL and at the University of Stellenbosch.
4.6 Comparison of the analysis of SOF and VOF
In this study the VOF, as determined by TGA, was significantly higher than the SOF as determined by Soxhlet extraction. While this could to some extent be ascribed to uncertainties about which temperature range in the TGA best corresponds to the VOF, it may well indicate that the VOF contains volatile species not extracted by the organic solvents used. Likely candidates are sulfurous and sulfuric acid. It should be noted that the commuter bus operated on diesel that contained up to 50 ppm sulfur. It is not inconceivable that this contributed to the VOF. A number of organic sulfates, such as dibutyl sulfate, hexyl decyl sulphate and di-(2-ethyl hexyl sulphate), were observed in the polar extracts of the commuter bus soot. More polar sulphates and sulphuric acid, however, would not be observed in the extracts by GC-MS. Another possible explanation for the discrepancy is that pyrolysis of soot constituents produces a char and some volatile components [94]. The constituents, themselves, are not extractable by solvent. There is evidence for such pyrolysis in the results of this study. This can be seen in the evolution of CO2 in Figure 4.11. Unfortunately CO (amu 28) evolution could not be monitored because N2, the atmosphere, has the same molar mass.
Collura et al. [89] extracted two types of diesel soot (VSA and VSB) and found their SOF’s to be 6 and 20% respectively. Thermal analysis of the two soot samples revealed that the VOF (excluding moisture) of VSA and VSB was 8 and 20% respectively. It is possible that the closer match of SOF and VOF values was because Collura et al. [89] performed
Univers
ity of
Cap
e Tow
n
CHAPTER 4|CHEMICAL AND PHYSICAL CHARACTERISATION OF SOOT|2013
67
sequential Soxhlet extraction using two different solvents on the same sample. They used dichloromethane extraction followed by toluene extraction. The data in As previously highlighted extraction of commuter bus soot with the six respective solvents yielded SOF’s with varied chemical speciation. GC-MS chromatograms revealed that the solvents had varied affinities for species adsorbed onto the soot matrix. Below is table 4.3 which summaries the GC-MS data from the respective solvents. In the table the competence (indicated by percentages) of each solvent at extracting targeted chemical species is shown.
Table 4.3 indicate that while methanol is effective at extracting esters, acetone is more effective at extracting PAHs. The total sequentially extractable material is thus expected to exceed that extracted by each of the solvents, individually. It should, however, be noted that not all authors report a match between volatile and extractable content. Clague et al. report discrepancies of between 40 and 90% [31]. The latter discrepancy is of the order measured in this study.
In order to investigate the mismatch further, the extracted soot samples were subjected to thermogravimetric analysis. Figure 4.14 provides a comparison of the mass loss of original soot vs. acetone extracted soot under nitrogen.
It is apparent that a significant volatile fraction remains and that only about half of the VOF is present in the SOF. The difference between 9.4% and 5.3% compares well with SOF for acetone (4.3%). Similar curves were found for the other extracted soots. The VOF remaining was largest for n-hexane, as expected.
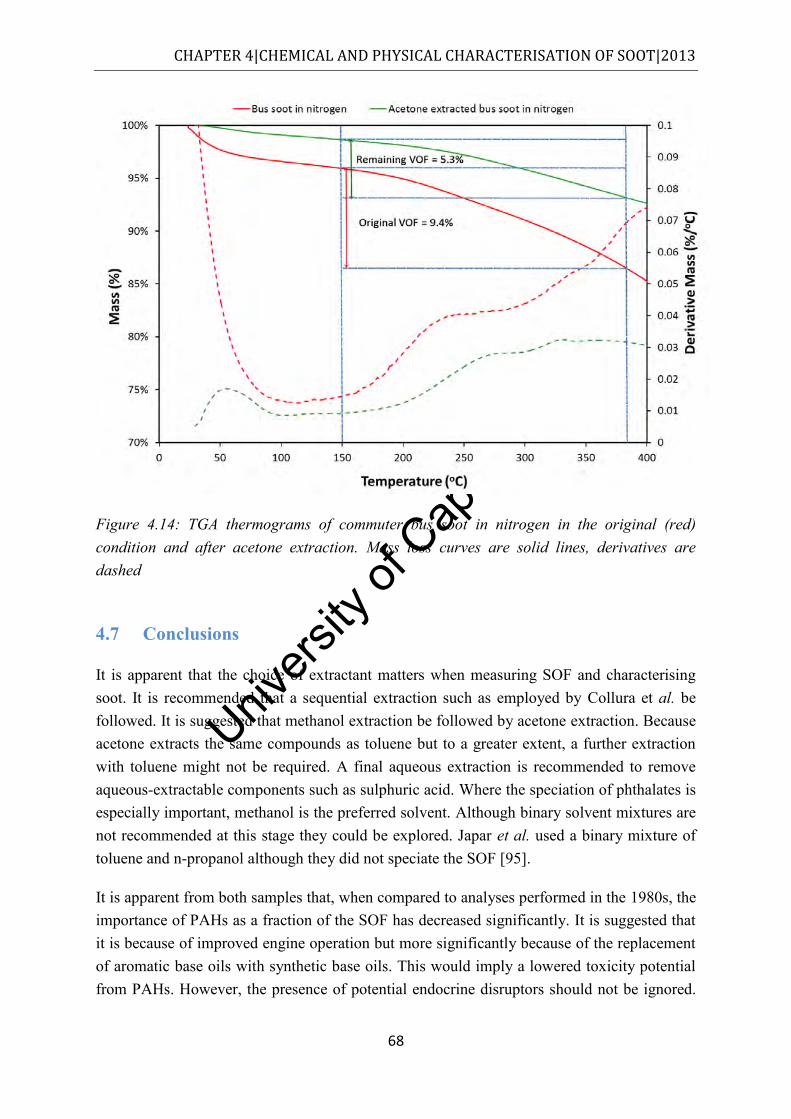
Univers
ity of
Cap
e Tow
n
CHAPTER 4|CHEMICAL AND PHYSICAL CHARACTERISATION OF SOOT|2013
68
Figure 4.14: TGA thermograms of commuter bus soot in nitrogen in the original (red) condition and after acetone extraction. Mass loss curves are solid lines, derivatives are dashed
4.7 Conclusions
It is apparent that the choice of extractant matters when measuring SOF and characterising soot. It is recommended that a sequential extraction such as employed by Collura et al. be followed. It is suggested that methanol extraction be followed by acetone extraction. Because acetone extracts the same compounds as toluene but to a greater extent, a further extraction with toluene might not be required. A final aqueous extraction is recommended to remove aqueous-extractable components such as sulphuric acid. Where the speciation of phthalates is especially important, methanol is the preferred solvent. Although binary solvent mixtures are not recommended at this stage they could be explored. Japar et al. used a binary mixture of toluene and n-propanol although they did not speciate the SOF [95].
It is apparent from both samples that, when compared to analyses performed in the 1980s, the importance of PAHs as a fraction of the SOF has decreased significantly. It is suggested that it is because of improved engine operation but more significantly because of the replacement of aromatic base oils with synthetic base oils. This would imply a lowered toxicity potential from PAHs. However, the presence of potential endocrine disruptors should not be ignored.
Univers
ity of
Cap
e Tow
n
CHAPTER 4|CHEMICAL AND PHYSICAL CHARACTERISATION OF SOOT|2013
69
This has often been ignored in previous studies. These are likely derived from engine oil additives. A number of other lubricant markers were observed in the soot such as Ca, Zn and P.
Because of the low SOF obtained, any contribution of non-extractable species such as sulfurous and sulphuric acid will contribute a greater fraction to the VOF than earlier studies where the organic fraction constitutes a greater fraction of the volatiles. The VOF would be better termed volatile fraction since a component is likely not organic in nature.
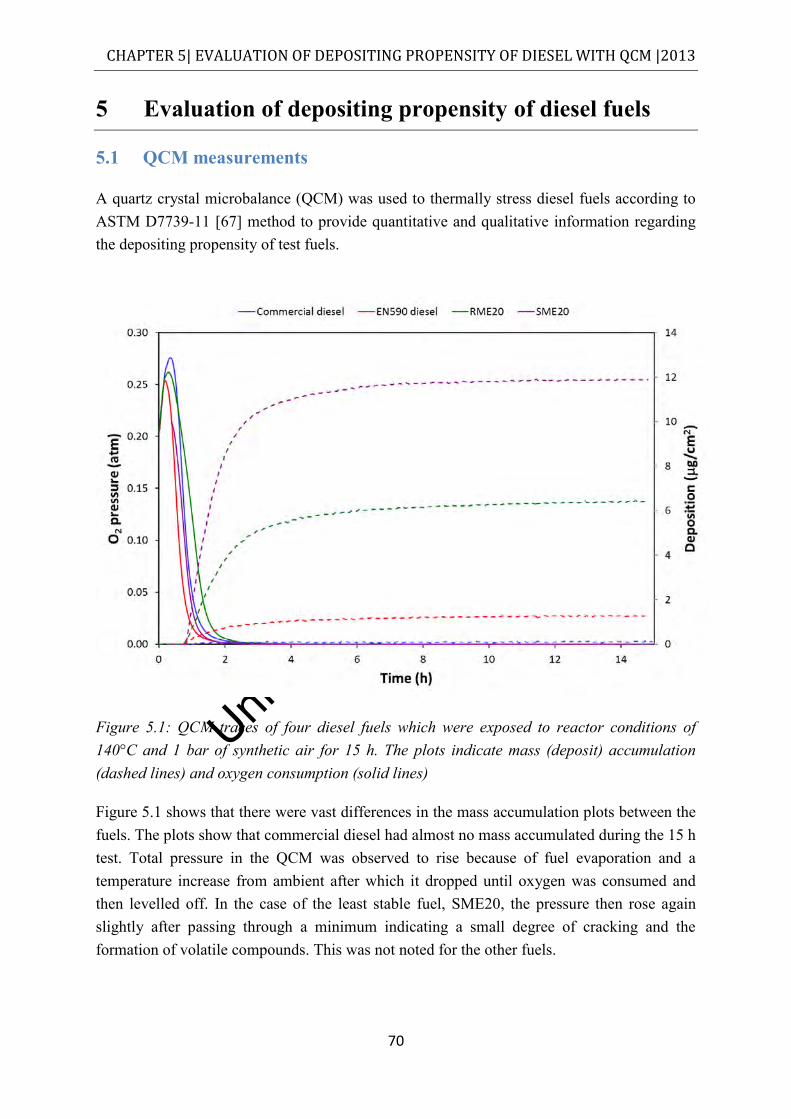
Univers
ity of
Cap
e Tow
n
CHAPTER 5| EVALUATION OF DEPOSITING PROPENSITY OF DIESEL WITH QCM |2013
70
5 Evaluation of depositing propensity of diesel fuels
5.1 QCM measurements
A quartz crystal microbalance (QCM) was used to thermally stress diesel fuels according to ASTM D7739-11 [67] method to provide quantitative and qualitative information regarding the depositing propensity of test fuels.
Figure 5.1: QCM traces of four diesel fuels which were exposed to reactor conditions of 140°C and 1 bar of synthetic air for 15 h. The plots indicate mass (deposit) accumulation (dashed lines) and oxygen consumption (solid lines)
Figure 5.1 shows that there were vast differences in the mass accumulation plots between the fuels. The plots show that commercial diesel had almost no mass accumulated during the 15 h test. Total pressure in the QCM was observed to rise because of fuel evaporation and a temperature increase from ambient after which it dropped until oxygen was consumed and then levelled off. In the case of the least stable fuel, SME20, the pressure then rose again slightly after passing through a minimum indicating a small degree of cracking and the formation of volatile compounds. This was not noted for the other fuels.
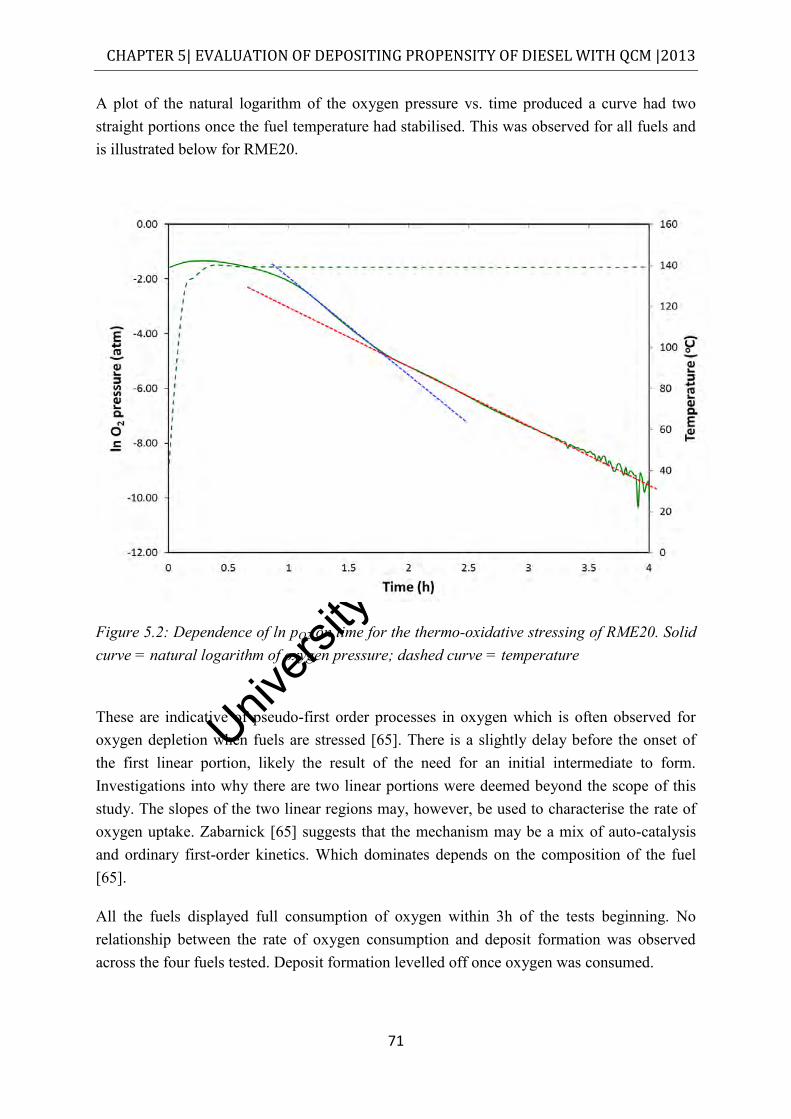
Univers
ity of
Cap
e Tow
n
CHAPTER 5| EVALUATION OF DEPOSITING PROPENSITY OF DIESEL WITH QCM |2013
71
A plot of the natural logarithm of the oxygen pressure vs. time produced a curve had two straight portions once the fuel temperature had stabilised. This was observed for all fuels and is illustrated below for RME20.
Figure 5.2: Dependence of ln pO2 on time for the thermo-oxidative stressing of RME20. Solid curve = natural logarithm of oxygen pressure; dashed curve = temperature
These are indicative of pseudo-first order processes in oxygen which is often observed for oxygen depletion when fuels are stressed [65]. There is a slightly delay before the onset of the first linear portion, likely the result of the need for an initial intermediate to form. Investigations into why there are two linear portions were deemed beyond the scope of this study. The slopes of the two linear regions may, however, be used to characterise the rate of oxygen uptake. Zabarnick [65] suggests that the mechanism may be a mix of auto-catalysis and ordinary first-order kinetics. Which dominates depends on the composition of the fuel [65].
All the fuels displayed full consumption of oxygen within 3h of the tests beginning. No relationship between the rate of oxygen consumption and deposit formation was observed across the four fuels tested. Deposit formation levelled off once oxygen was consumed.
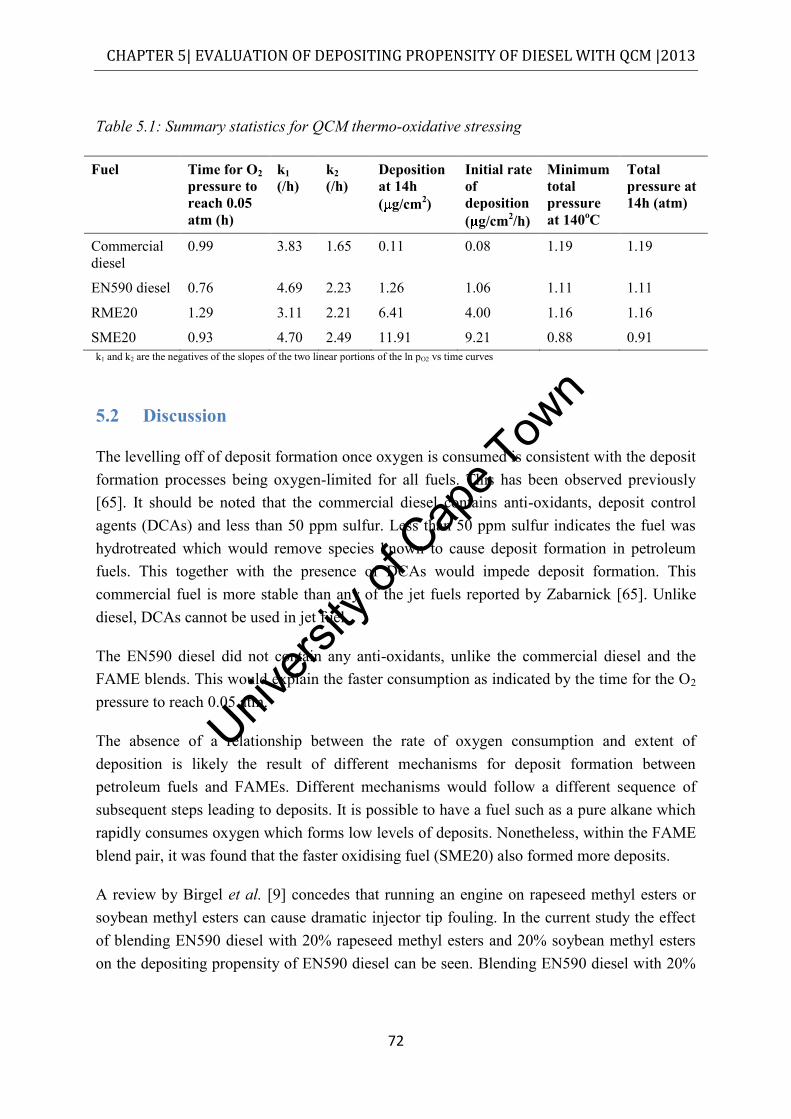
Univers
ity of
Cap
e Tow
n
CHAPTER 5| EVALUATION OF DEPOSITING PROPENSITY OF DIESEL WITH QCM |2013
72
Table 5.1: Summary statistics for QCM thermo-oxidative stressing
Fuel Time for O2 pressure to reach 0.05 atm (h)
k1 (/h)
k2 (/h)
Deposition at 14h ( g/cm2)
Initial rate of deposition ( g/cm2/h)
Minimum total pressure at 140oC
Total pressure at 14h (atm)
Commercial diesel
0.99 3.83 1.65 0.11 0.08 1.19 1.19
EN590 diesel 0.76 4.69 2.23 1.26 1.06 1.11 1.11 RME20 1.29 3.11 2.21 6.41 4.00 1.16 1.16 SME20 0.93 4.70 2.49 11.91 9.21 0.88 0.91 k1 and k2 are the negatives of the slopes of the two linear portions of the ln pO2 vs time curves
5.2 Discussion
The levelling off of deposit formation once oxygen is consumed is consistent with the deposit formation processes being oxygen-limited for all fuels. This has been observed previously [65]. It should be noted that the commercial diesel contains anti-oxidants, deposit control agents (DCAs) and less than 50 ppm sulfur. Less than 50 ppm sulfur indicates the fuel was hydrotreated which would remove species known to cause deposit formation in petroleum fuels. This together with the presence of DCAs would impede deposit formation. This commercial fuel is more stable than any of the jet fuels reported by Zabarnick [65]. Unlike diesel, DCAs cannot be used in jet fuel.
The EN590 diesel did not contain any anti-oxidants, unlike the commercial diesel and the FAME blends. This would explain the faster consumption as indicated by the time for the O2 pressure to reach 0.05 atm.
The absence of a relationship between the rate of oxygen consumption and extent of deposition is likely the result of different mechanisms for deposit formation between petroleum fuels and FAMEs. Different mechanisms would follow a different sequence of subsequent steps leading to deposits. It is possible to have a fuel such as a pure alkane which rapidly consumes oxygen which forms low levels of deposits. Nonetheless, within the FAME blend pair, it was found that the faster oxidising fuel (SME20) also formed more deposits.
A review by Birgel et al. [9] concedes that running an engine on rapeseed methyl esters or soybean methyl esters can cause dramatic injector tip fouling. In the current study the effect of blending EN590 diesel with 20% rapeseed methyl esters and 20% soybean methyl esters on the depositing propensity of EN590 diesel can be seen. Blending EN590 diesel with 20%
Univers
ity of
Cap
e Tow
n
CHAPTER 5| EVALUATION OF DEPOSITING PROPENSITY OF DIESEL WITH QCM |2013
73
rapeseed methyl esters increases deposition more than four fold. The deposition propensity of EN590 diesel almost doubles again when blended with 20% soybean methyl esters.
Two possible reasons have been proposed for the increased deposition in biodiesel blends, namely ester functional groups have been shown to moderately affect fuel stability [6] and that, because fatty acid methyl esters have an unsaturated hydrocarbon backbone, these can experience double bond migration to form conjugated dienes which when attacked by oxygen lead to crosslinking between molecules leading to deposits [96]. The tendency of FAME molecules to undergo oxidation is strongly dependent on the number of double bonds and the extent of conjugation [55, 97].
Not all methyl esters have the same propensity to decrease fuel stability, as was evidenced SME20 produced approximately double the amount of deposits as RME20 under the same conditions. This can be attributed to the fatty acid composition of the soybean oil which is composed of 50% 18:2 (carbon number: double bond) fatty acids as opposed to 13% (18:2) for rapeseed oil (see appendix B). It is this greater degree of unsaturation that renders soybean methyl esters more prone to oxidation than rapeseed methyl esters hence the higher rate of oxygen consumption since bis-allylic sites are extremely prone to hydrogen abstraction. This in turn leads to faster crosslinking reactions and thereby deposition. The mechanism in petroleum fuels does not follow this pathway.
While a useful predictor of storage stability of biodiesels, oxygen consumption is not necessarily a useful predictor of thermo-oxidative stability of a full set of fuels which includes fuels which do not contain FAME.
5.3 Conclusions
QCM measurements indicated under thermo-oxidative conditions that the four test fuels have different depositing propensities. The depositing propensities of test fuels increased from commercial diesel << EN590 diesel < RME20 < SME20. As demonstrated in the following chapters, this is consistent with other observations about the quantity and nature of the deposits formed.
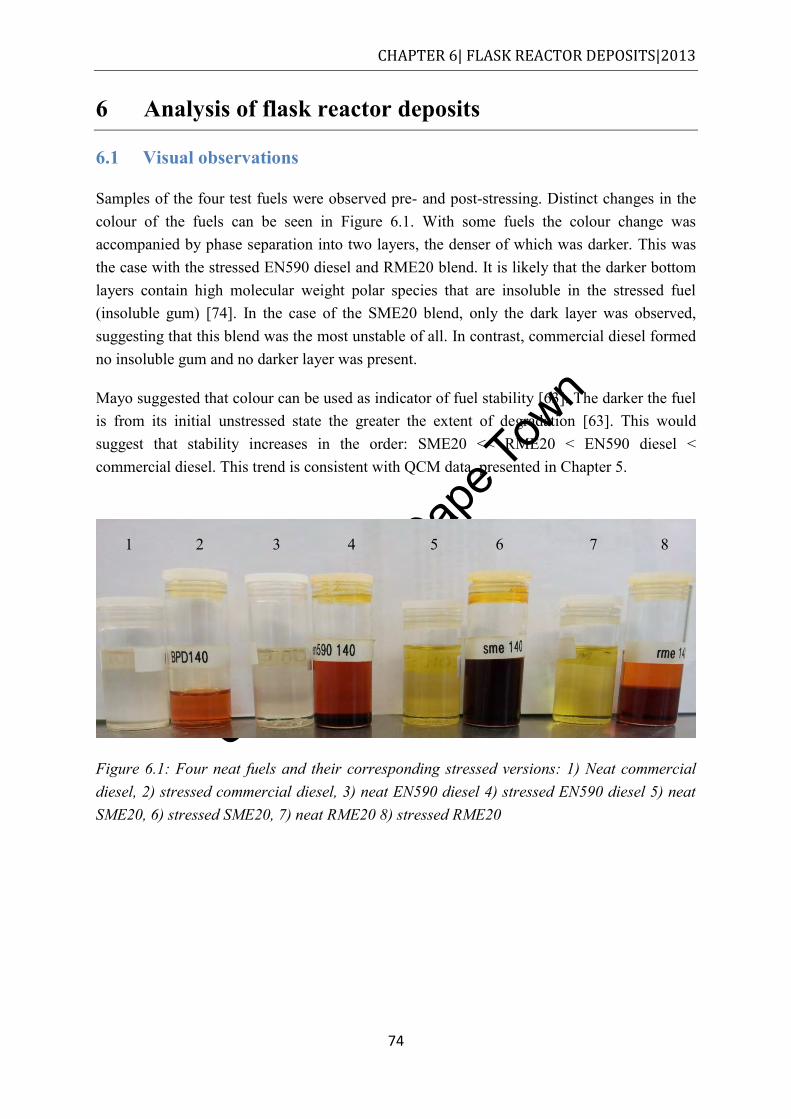
Univers
ity of
Cap
e Tow
n
CHAPTER 6| FLASK REACTOR DEPOSITS|2013
74
6 Analysis of flask reactor deposits
6.1 Visual observations
Samples of the four test fuels were observed pre- and post-stressing. Distinct changes in the colour of the fuels can be seen in Figure 6.1. With some fuels the colour change was accompanied by phase separation into two layers, the denser of which was darker. This was the case with the stressed EN590 diesel and RME20 blend. It is likely that the darker bottom layers contain high molecular weight polar species that are insoluble in the stressed fuel (insoluble gum) [74]. In the case of the SME20 blend, only the dark layer was observed, suggesting that this blend was the most unstable of all. In contrast, commercial diesel formed no insoluble gum and no darker layer was present.
Mayo suggested that colour can be used as indicator of fuel stability [63]. The darker the fuel is from its initial unstressed state the greater the extent of degradation [63]. This would suggest that stability increases in the order: SME20 << RME20 < EN590 diesel < commercial diesel. This trend is consistent with QCM data, presented in Chapter 5.
Figure 6.1: Four neat fuels and their corresponding stressed versions: 1) Neat commercial diesel, 2) stressed commercial diesel, 3) neat EN590 diesel 4) stressed EN590 diesel 5) neat SME20, 6) stressed SME20, 7) neat RME20 8) stressed RME20
1 2 3 4 5 7 6 8
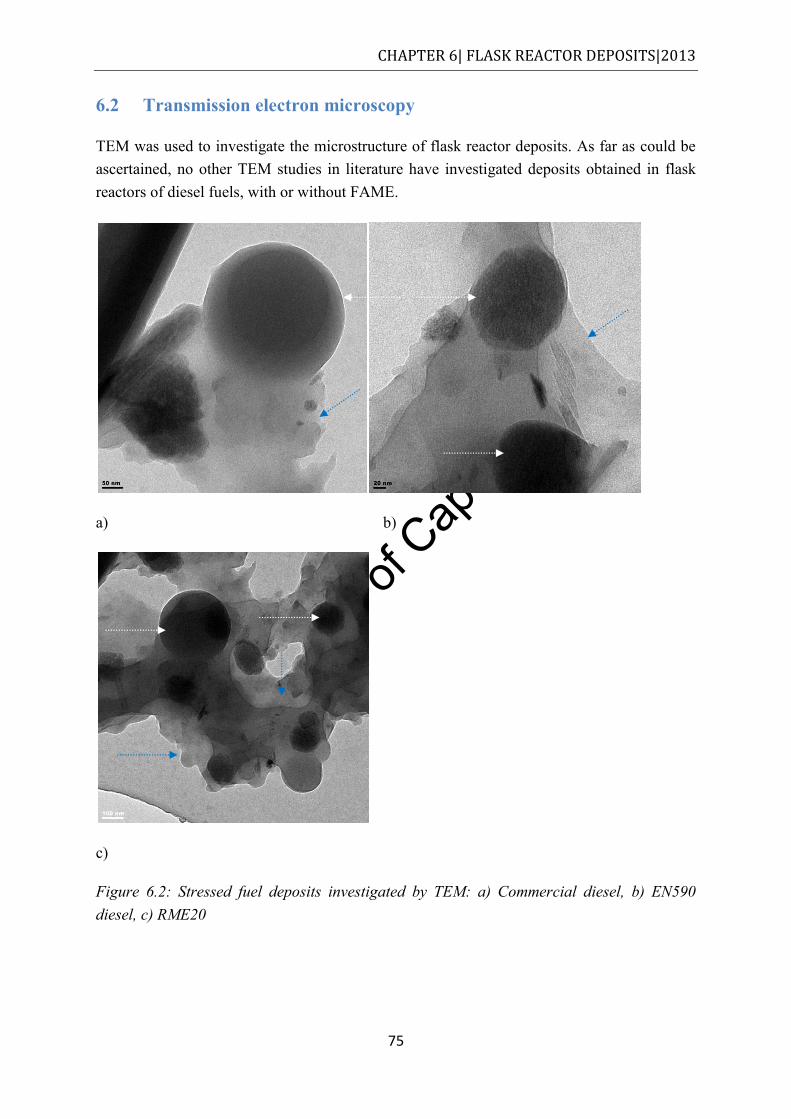
Univers
ity of
Cap
e Tow
n
CHAPTER 6| FLASK REACTOR DEPOSITS|2013
75
6.2 Transmission electron microscopy
TEM was used to investigate the microstructure of flask reactor deposits. As far as could be ascertained, no other TEM studies in literature have investigated deposits obtained in flask reactors of diesel fuels, with or without FAME.
a) b)
c)
Figure 6.2: Stressed fuel deposits investigated by TEM: a) Commercial diesel, b) EN590 diesel, c) RME20
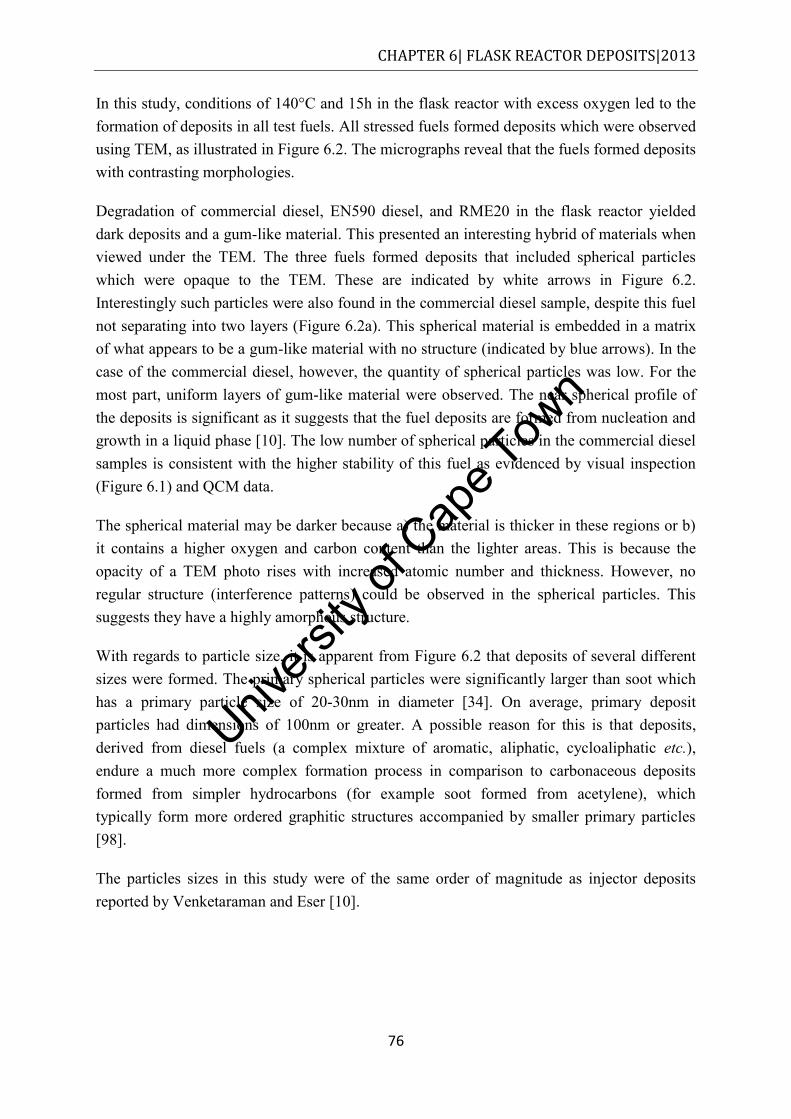
Univers
ity of
Cap
e Tow
n
CHAPTER 6| FLASK REACTOR DEPOSITS|2013
76
In this study, conditions of 140°C and 15h in the flask reactor with excess oxygen led to the formation of deposits in all test fuels. All stressed fuels formed deposits which were observed using TEM, as illustrated in Figure 6.2. The micrographs reveal that the fuels formed deposits with contrasting morphologies.
Degradation of commercial diesel, EN590 diesel, and RME20 in the flask reactor yielded dark deposits and a gum-like material. This presented an interesting hybrid of materials when viewed under the TEM. The three fuels formed deposits that included spherical particles which were opaque to the TEM. These are indicated by white arrows in Figure 6.2. Interestingly such particles were also found in the commercial diesel sample, despite this fuel not separating into two layers (Figure 6.2a). This spherical material is embedded in a matrix of what appears to be a gum-like material with no structure (indicated by blue arrows). In the case of the commercial diesel, however, the quantity of spherical particles was low. For the most part, uniform layers of gum-like material were observed. The near spherical profile of the deposits is significant as it suggests that the fuel deposits are formed from nucleation and growth in a liquid phase [10]. The low number of spherical particles in the commercial diesel samples is consistent with the higher stability of this fuel as evidenced by visual inspection (Figure 6.1) and QCM data.
The spherical material may be darker because a) the material is thicker in these regions or b) it contains a higher oxygen and carbon content than the lighter areas. This is because the opacity of a TEM photo rises with increased atomic number and thickness. However, no regular structure (interference patterns) could be observed in the spherical particles. This suggests they have a highly amorphous structure.
With regards to particle size, it is apparent from Figure 6.2 that deposits of several different sizes were formed. The primary spherical particles were significantly larger than soot which has a primary particle size of 20-30nm in diameter [34]. On average, primary deposit particles had dimensions of 100nm or greater. A possible reason for this is that deposits, derived from diesel fuels (a complex mixture of aromatic, aliphatic, cycloaliphatic etc.), endure a much more complex formation process in comparison to carbonaceous deposits formed from simpler hydrocarbons (for example soot formed from acetylene), which typically form more ordered graphitic structures accompanied by smaller primary particles [98].
The particles sizes in this study were of the same order of magnitude as injector deposits reported by Venketaraman and Eser [10].
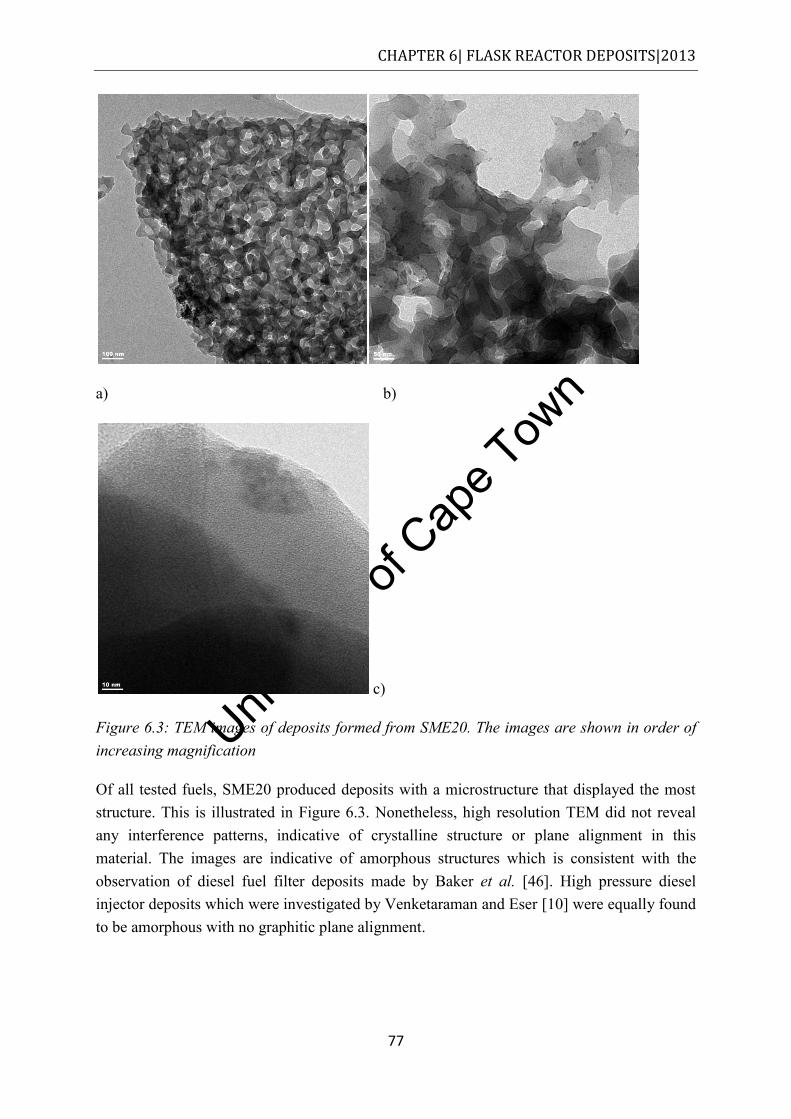
Univers
ity of
Cap
e Tow
n
CHAPTER 6| FLASK REACTOR DEPOSITS|2013
77
a) b)
c)
Figure 6.3: TEM images of deposits formed from SME20. The images are shown in order of increasing magnification
Of all tested fuels, SME20 produced deposits with a microstructure that displayed the most structure. This is illustrated in Figure 6.3. Nonetheless, high resolution TEM did not reveal any interference patterns, indicative of crystalline structure or plane alignment in this material. The images are indicative of amorphous structures which is consistent with the observation of diesel fuel filter deposits made by Baker et al. [46]. High pressure diesel injector deposits which were investigated by Venketaraman and Eser [10] were equally found to be amorphous with no graphitic plane alignment.
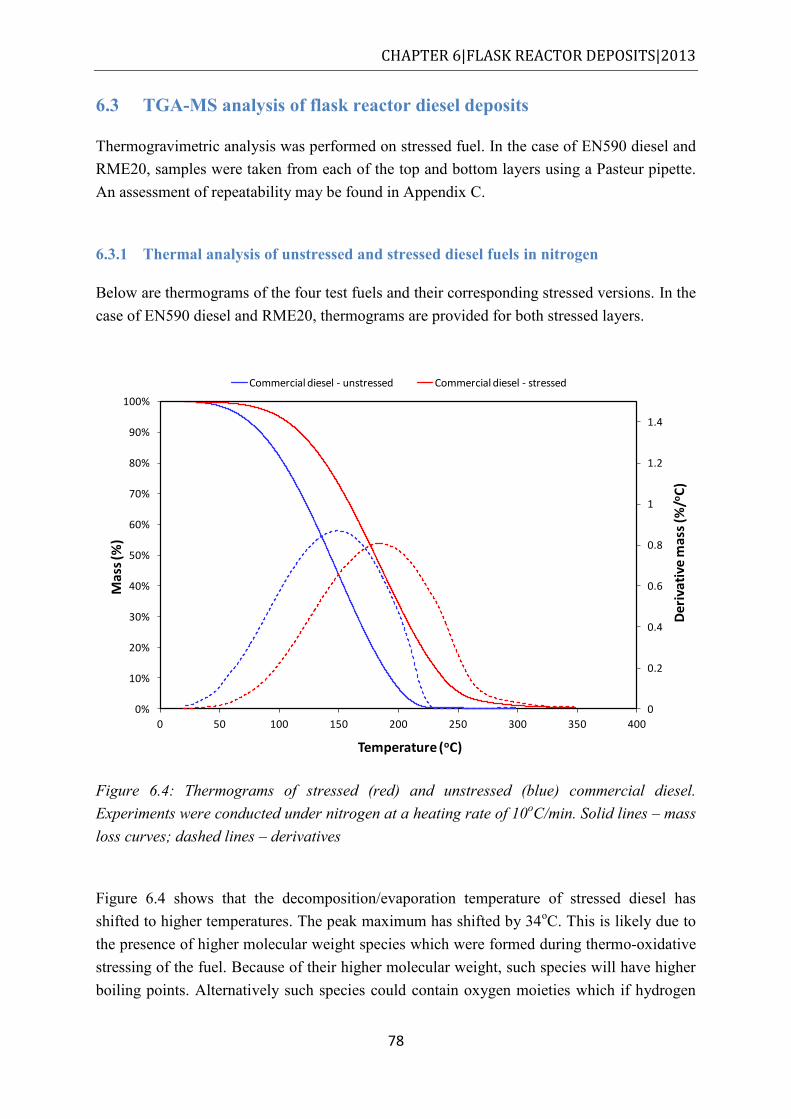
Univers
ity of
Cap
e Tow
n
CHAPTER 6|FLASK REACTOR DEPOSITS|2013
78
6.3 TGA-MS analysis of flask reactor diesel deposits
Thermogravimetric analysis was performed on stressed fuel. In the case of EN590 diesel and RME20, samples were taken from each of the top and bottom layers using a Pasteur pipette. An assessment of repeatability may be found in Appendix C.
6.3.1 Thermal analysis of unstressed and stressed diesel fuels in nitrogen
Below are thermograms of the four test fuels and their corresponding stressed versions. In the case of EN590 diesel and RME20, thermograms are provided for both stressed layers.
Figure 6.4: Thermograms of stressed (red) and unstressed (blue) commercial diesel. Experiments were conducted under nitrogen at a heating rate of 10oC/min. Solid lines – mass loss curves; dashed lines – derivatives
Figure 6.4 shows that the decomposition/evaporation temperature of stressed diesel has shifted to higher temperatures. The peak maximum has shifted by 34oC. This is likely due to the presence of higher molecular weight species which were formed during thermo-oxidative stressing of the fuel. Because of their higher molecular weight, such species will have higher boiling points. Alternatively such species could contain oxygen moieties which if hydrogen
0
0.2
0.4
0.6
0.8
1
1.2
1.4
0%
10%
20%
30%
40%
50%
60%
70%
80%
90%
100%
0 50 100 150 200 250 300 350 400
Der
ivat
ive
mas
s (%
/oC
)
Ma
ss (%
)
Temperature (oC)
Commercial diesel - unstressed Commercial diesel - stressed
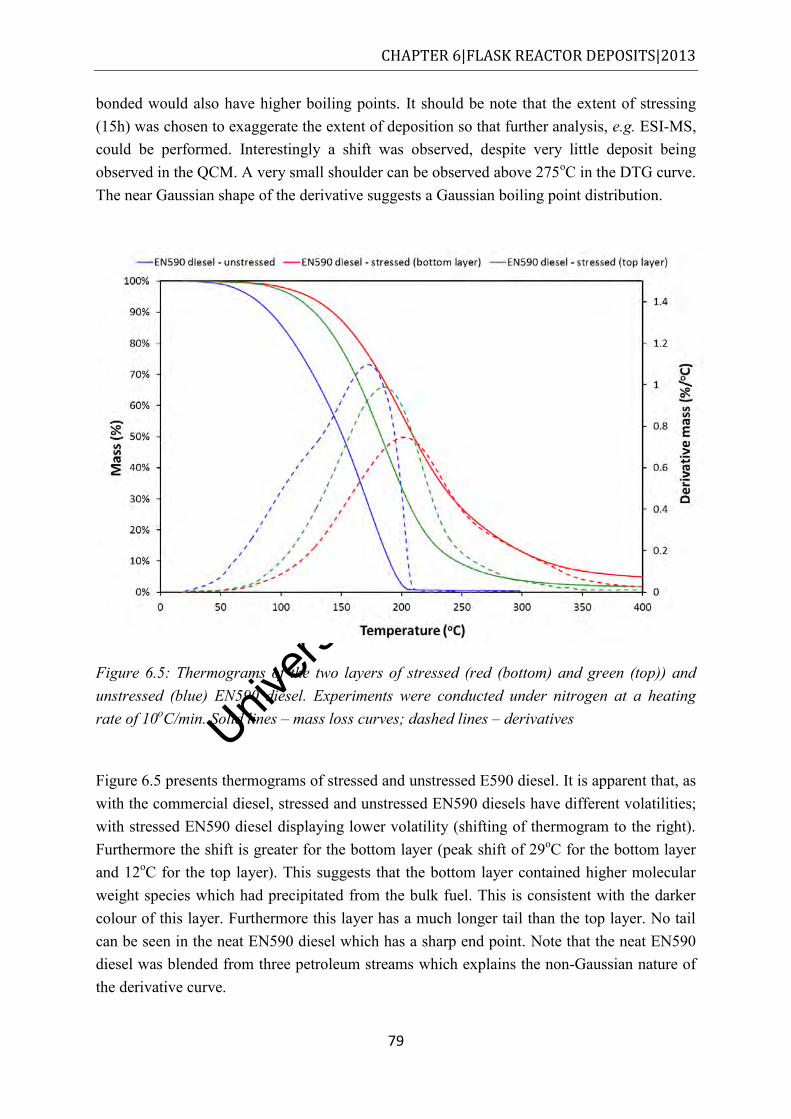
Univers
ity of
Cap
e Tow
n
CHAPTER 6|FLASK REACTOR DEPOSITS|2013
79
bonded would also have higher boiling points. It should be note that the extent of stressing (15h) was chosen to exaggerate the extent of deposition so that further analysis, e.g. ESI-MS, could be performed. Interestingly a shift was observed, despite very little deposit being observed in the QCM. A very small shoulder can be observed above 275oC in the DTG curve. The near Gaussian shape of the derivative suggests a Gaussian boiling point distribution.
Figure 6.5: Thermograms of the two layers of stressed (red (bottom) and green (top)) and unstressed (blue) EN590 diesel. Experiments were conducted under nitrogen at a heating rate of 10oC/min. Solid lines – mass loss curves; dashed lines – derivatives
Figure 6.5 presents thermograms of stressed and unstressed E590 diesel. It is apparent that, as with the commercial diesel, stressed and unstressed EN590 diesels have different volatilities; with stressed EN590 diesel displaying lower volatility (shifting of thermogram to the right). Furthermore the shift is greater for the bottom layer (peak shift of 29oC for the bottom layer and 12oC for the top layer). This suggests that the bottom layer contained higher molecular weight species which had precipitated from the bulk fuel. This is consistent with the darker colour of this layer. Furthermore this layer has a much longer tail than the top layer. No tail can be seen in the neat EN590 diesel which has a sharp end point. Note that the neat EN590 diesel was blended from three petroleum streams which explains the non-Gaussian nature of the derivative curve.
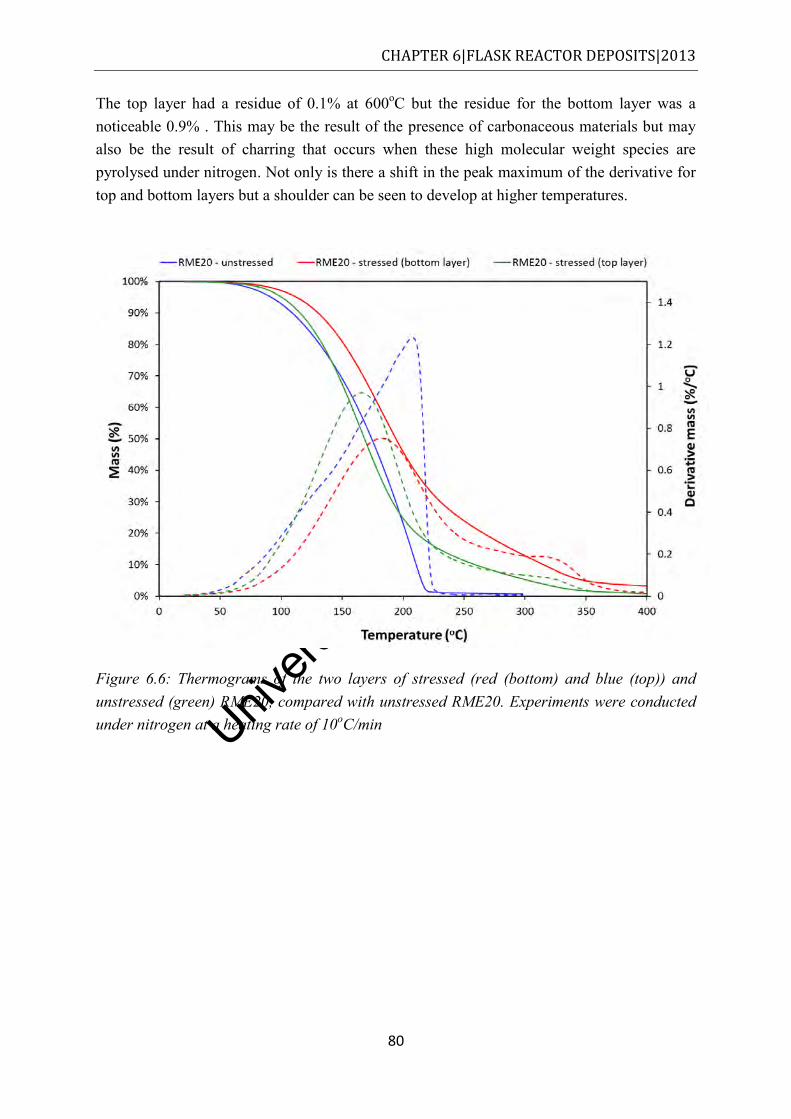
Univers
ity of
Cap
e Tow
n
CHAPTER 6|FLASK REACTOR DEPOSITS|2013
80
The top layer had a residue of 0.1% at 600oC but the residue for the bottom layer was a noticeable 0.9% . This may be the result of the presence of carbonaceous materials but may also be the result of charring that occurs when these high molecular weight species are pyrolysed under nitrogen. Not only is there a shift in the peak maximum of the derivative for top and bottom layers but a shoulder can be seen to develop at higher temperatures.
Figure 6.6: Thermograms of the two layers of stressed (red (bottom) and blue (top)) and unstressed (green) RME20, compared with unstressed RME20. Experiments were conducted under nitrogen at a heating rate of 10oC/min
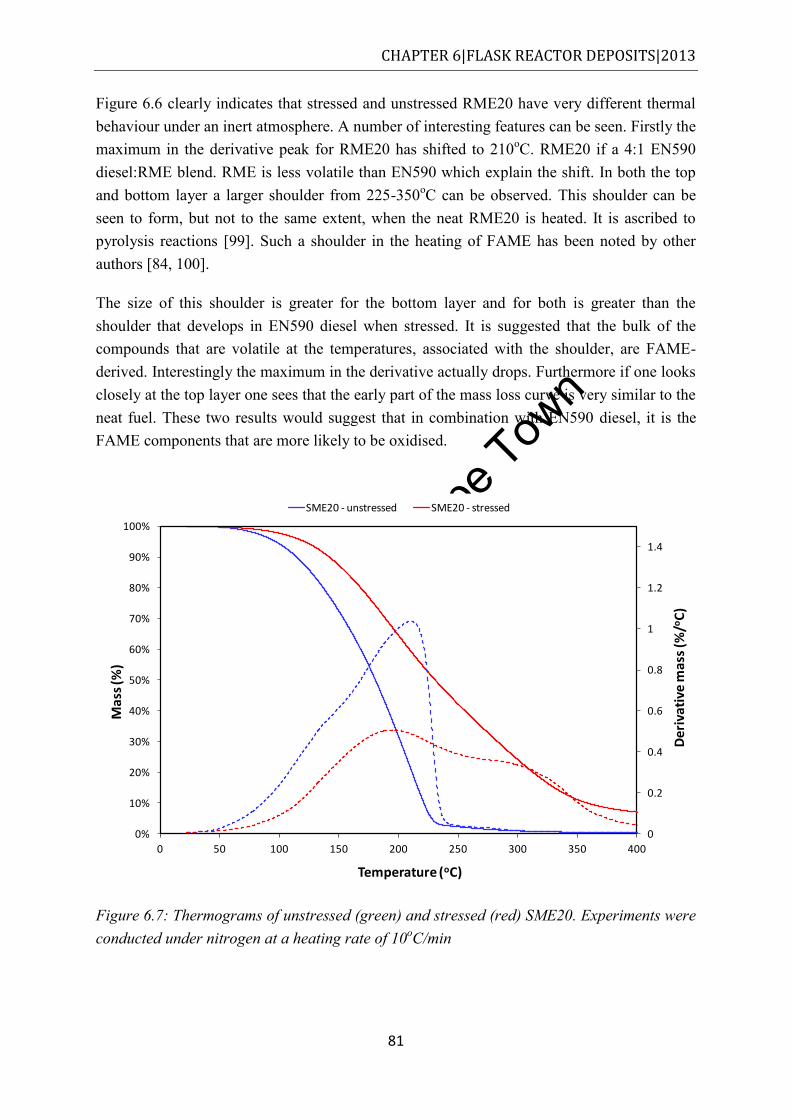
Univers
ity of
Cap
e Tow
n
CHAPTER 6|FLASK REACTOR DEPOSITS|2013
81
Figure 6.6 clearly indicates that stressed and unstressed RME20 have very different thermal behaviour under an inert atmosphere. A number of interesting features can be seen. Firstly the maximum in the derivative peak for RME20 has shifted to 210oC. RME20 if a 4:1 EN590 diesel:RME blend. RME is less volatile than EN590 which explain the shift. In both the top and bottom layer a larger shoulder from 225-350oC can be observed. This shoulder can be seen to form, but not to the same extent, when the neat RME20 is heated. It is ascribed to pyrolysis reactions [99]. Such a shoulder in the heating of FAME has been noted by other authors [84, 100].
The size of this shoulder is greater for the bottom layer and for both is greater than the shoulder that develops in EN590 diesel when stressed. It is suggested that the bulk of the compounds that are volatile at the temperatures, associated with the shoulder, are FAME-derived. Interestingly the maximum in the derivative actually drops. Furthermore if one looks closely at the top layer one sees that the early part of the mass loss curve is very similar to the neat fuel. These two results would suggest that in combination with EN590 diesel, it is the FAME components that are more likely to be oxidised.
Figure 6.7: Thermograms of unstressed (green) and stressed (red) SME20. Experiments were conducted under nitrogen at a heating rate of 10oC/min
0
0.2
0.4
0.6
0.8
1
1.2
1.4
0%
10%
20%
30%
40%
50%
60%
70%
80%
90%
100%
0 50 100 150 200 250 300 350 400
Der
ivat
ive
mas
s (%
/oC
)
Ma
ss (%
)
Temperature (oC)
SME20 - unstressed SME20 - stressed
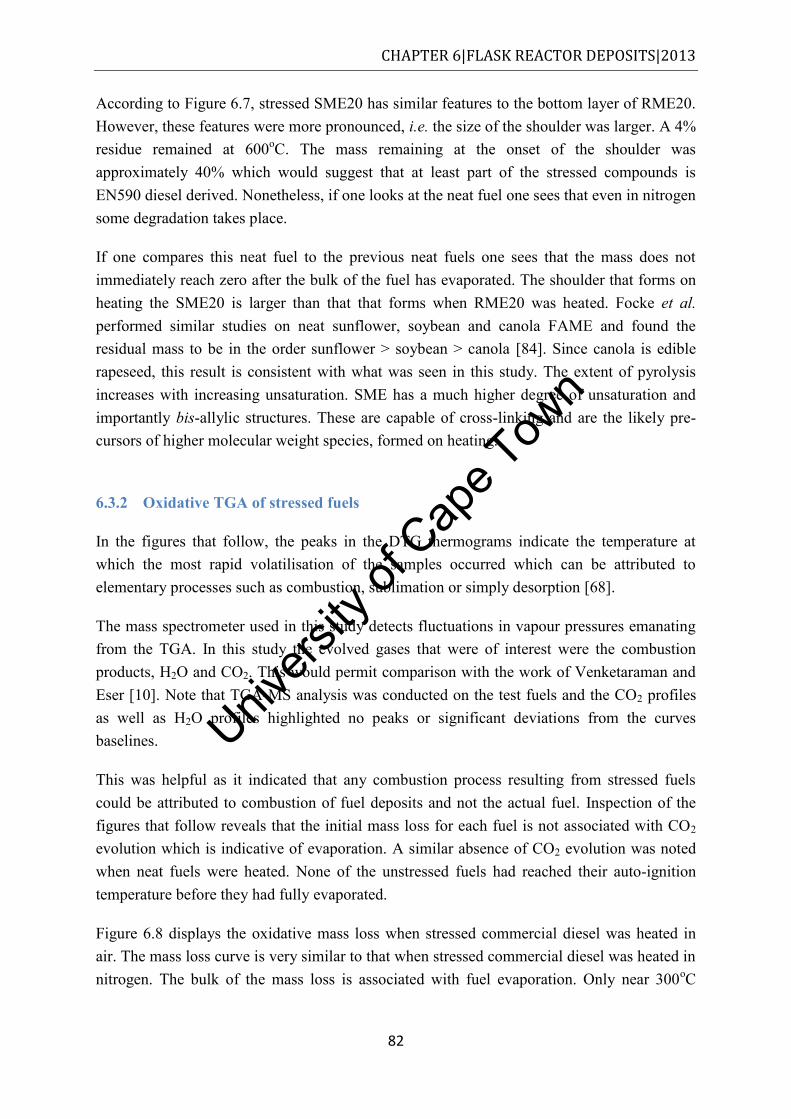
Univers
ity of
Cap
e Tow
n
CHAPTER 6|FLASK REACTOR DEPOSITS|2013
82
According to Figure 6.7, stressed SME20 has similar features to the bottom layer of RME20. However, these features were more pronounced, i.e. the size of the shoulder was larger. A 4% residue remained at 600oC. The mass remaining at the onset of the shoulder was approximately 40% which would suggest that at least part of the stressed compounds is EN590 diesel derived. Nonetheless, if one looks at the neat fuel one sees that even in nitrogen some degradation takes place.
If one compares this neat fuel to the previous neat fuels one sees that the mass does not immediately reach zero after the bulk of the fuel has evaporated. The shoulder that forms on heating the SME20 is larger than that that forms when RME20 was heated. Focke et al. performed similar studies on neat sunflower, soybean and canola FAME and found the residual mass to be in the order sunflower > soybean > canola [84]. Since canola is edible rapeseed, this result is consistent with what was seen in this study. The extent of pyrolysis increases with increasing unsaturation. SME has a much higher degree of unsaturation and importantly bis-allylic structures. These are capable of cross-linking and are the likely pre-cursors of higher molecular weight species, formed on heating.
6.3.2 Oxidative TGA of stressed fuels
In the figures that follow, the peaks in the DTG thermograms indicate the temperature at which the most rapid volatilisation of the samples occurred which can be attributed to elementary processes such as combustion, sublimation or simply desorption [68].
The mass spectrometer used in this study detects fluctuations in vapour pressures emanating from the TGA. In this study the evolved gases that were of interest were the combustion products, H2O and CO2. This would permit comparison with the work of Venketaraman and Eser [10]. Note that TGA-MS analysis was conducted on the test fuels and the CO2 profiles as well as H2O profiles highlighted no peaks or significant deviations from the curves baselines.
This was helpful as it indicated that any combustion process resulting from stressed fuels could be attributed to combustion of fuel deposits and not the actual fuel. Inspection of the figures that follow reveals that the initial mass loss for each fuel is not associated with CO2 evolution which is indicative of evaporation. A similar absence of CO2 evolution was noted when neat fuels were heated. None of the unstressed fuels had reached their auto-ignition temperature before they had fully evaporated.
Figure 6.8 displays the oxidative mass loss when stressed commercial diesel was heated in air. The mass loss curve is very similar to that when stressed commercial diesel was heated in nitrogen. The bulk of the mass loss is associated with fuel evaporation. Only near 300oC
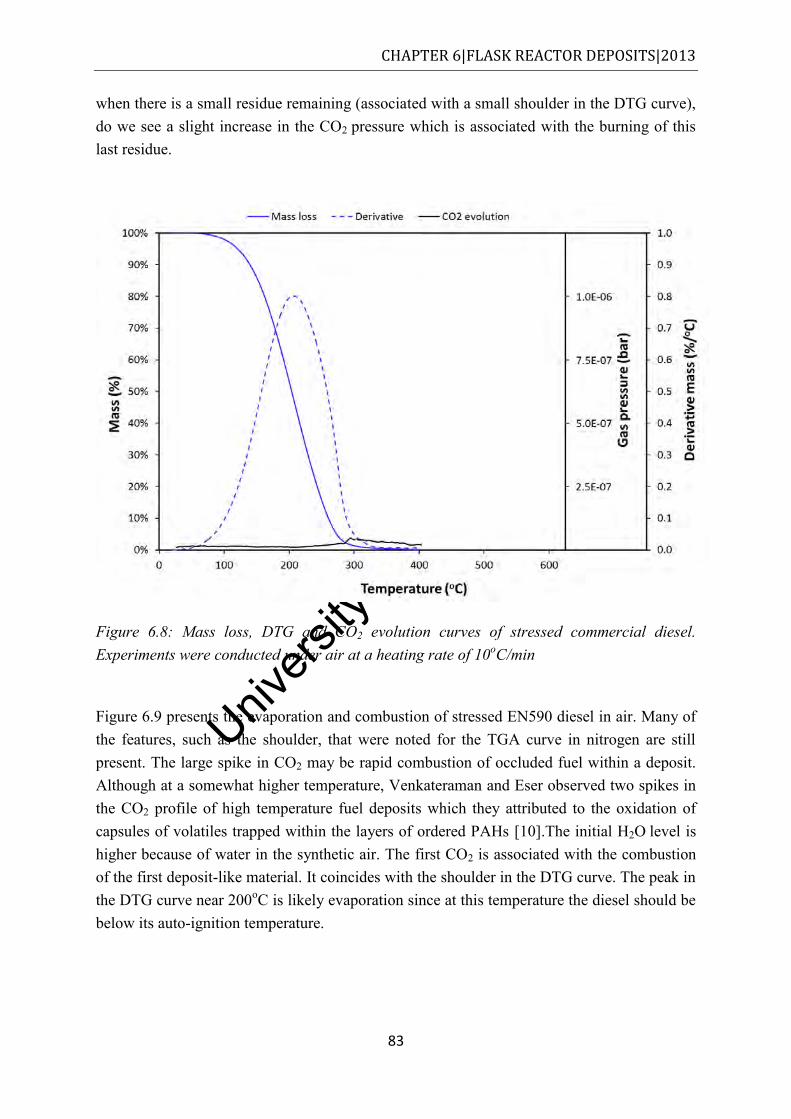
Univers
ity of
Cap
e Tow
n
CHAPTER 6|FLASK REACTOR DEPOSITS|2013
83
when there is a small residue remaining (associated with a small shoulder in the DTG curve), do we see a slight increase in the CO2 pressure which is associated with the burning of this last residue.
Figure 6.8: Mass loss, DTG and CO2 evolution curves of stressed commercial diesel. Experiments were conducted under air at a heating rate of 10oC/min
Figure 6.9 presents the evaporation and combustion of stressed EN590 diesel in air. Many of the features, such as the shoulder, that were noted for the TGA curve in nitrogen are still present. The large spike in CO2 may be rapid combustion of occluded fuel within a deposit. Although at a somewhat higher temperature, Venkateraman and Eser observed two spikes in the CO2 profile of high temperature fuel deposits which they attributed to the oxidation of capsules of volatiles trapped within the layers of ordered PAHs [10].The initial H2O level is higher because of water in the synthetic air. The first CO2 is associated with the combustion of the first deposit-like material. It coincides with the shoulder in the DTG curve. The peak in the DTG curve near 200oC is likely evaporation since at this temperature the diesel should be below its auto-ignition temperature.
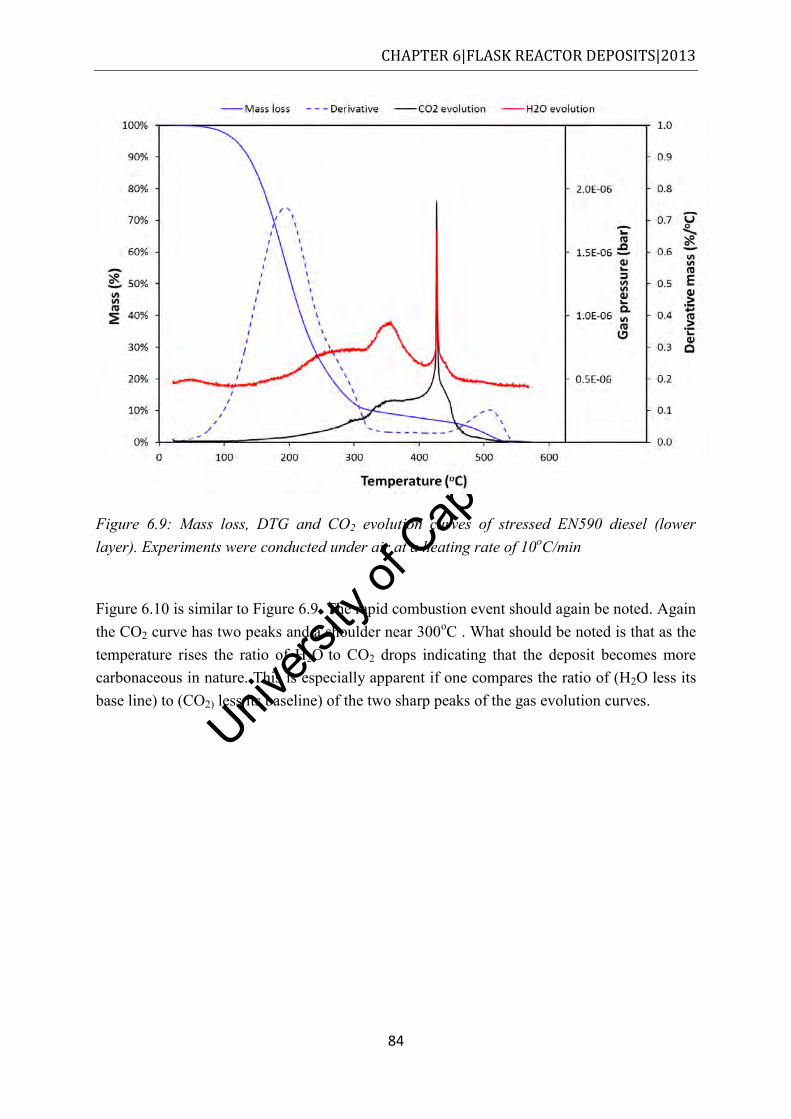
Univers
ity of
Cap
e Tow
n
CHAPTER 6|FLASK REACTOR DEPOSITS|2013
84
Figure 6.9: Mass loss, DTG and CO2 evolution curves of stressed EN590 diesel (lower layer). Experiments were conducted under air at a heating rate of 10oC/min
Figure 6.10 is similar to Figure 6.9. The rapid combustion event should again be noted. Again the CO2 curve has two peaks and a shoulder near 300oC . What should be noted is that as the temperature rises the ratio of H2O to CO2 drops indicating that the deposit becomes more carbonaceous in nature. This is especially apparent if one compares the ratio of (H2O less its base line) to (CO2) less its baseline) of the two sharp peaks of the gas evolution curves.
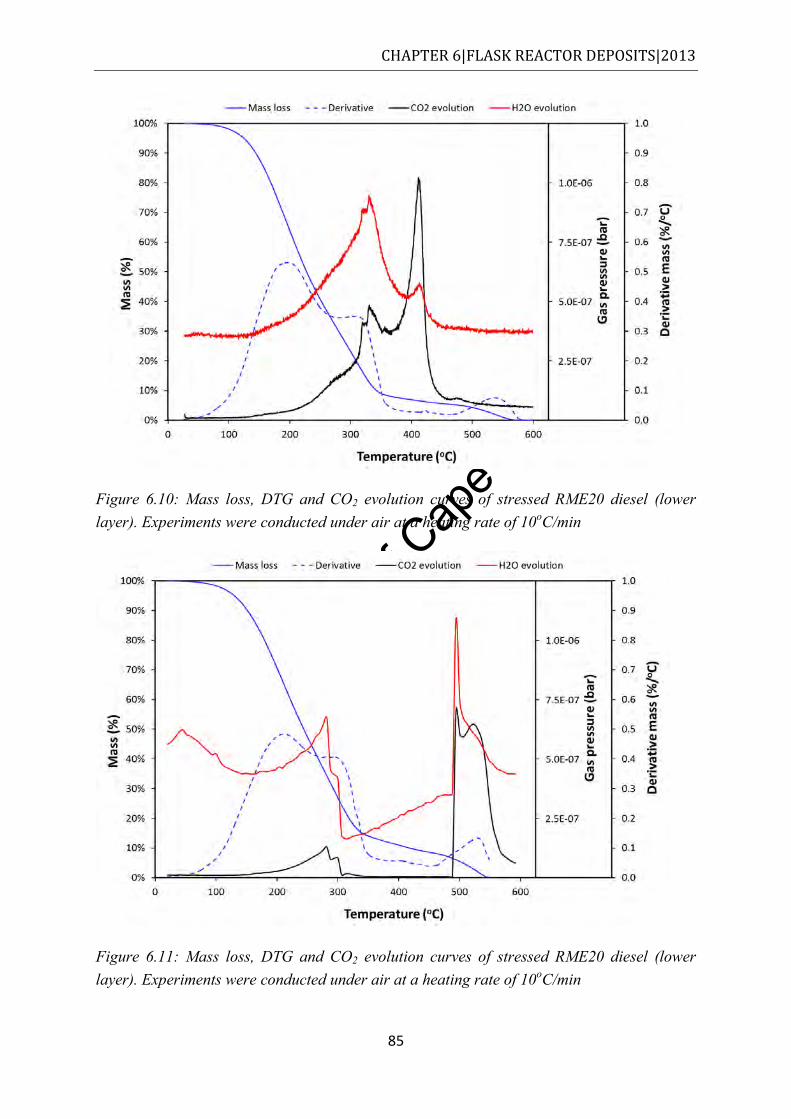
Univers
ity of
Cap
e Tow
n
CHAPTER 6|FLASK REACTOR DEPOSITS|2013
85
Figure 6.10: Mass loss, DTG and CO2 evolution curves of stressed RME20 diesel (lower layer). Experiments were conducted under air at a heating rate of 10oC/min
Figure 6.11: Mass loss, DTG and CO2 evolution curves of stressed RME20 diesel (lower layer). Experiments were conducted under air at a heating rate of 10oC/min
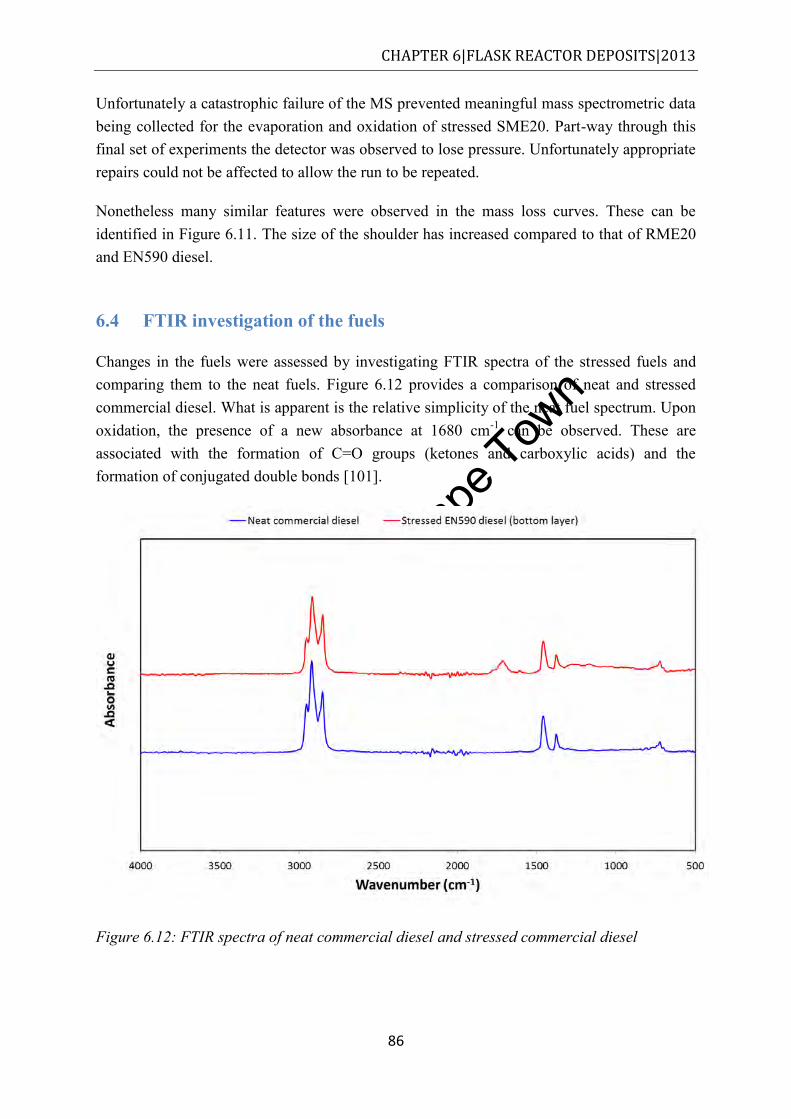
Univers
ity of
Cap
e Tow
n
CHAPTER 6|FLASK REACTOR DEPOSITS|2013
86
Unfortunately a catastrophic failure of the MS prevented meaningful mass spectrometric data being collected for the evaporation and oxidation of stressed SME20. Part-way through this final set of experiments the detector was observed to lose pressure. Unfortunately appropriate repairs could not be affected to allow the run to be repeated.
Nonetheless many similar features were observed in the mass loss curves. These can be identified in Figure 6.11. The size of the shoulder has increased compared to that of RME20 and EN590 diesel.
6.4 FTIR investigation of the fuels
Changes in the fuels were assessed by investigating FTIR spectra of the stressed fuels and comparing them to the neat fuels. Figure 6.12 provides a comparison of neat and stressed commercial diesel. What is apparent is the relative simplicity of the neat fuel spectrum. Upon oxidation, the presence of a new absorbance at 1680 cm-1 can be observed. These are associated with the formation of C=O groups (ketones and carboxylic acids) and the formation of conjugated double bonds [101].
Figure 6.12: FTIR spectra of neat commercial diesel and stressed commercial diesel
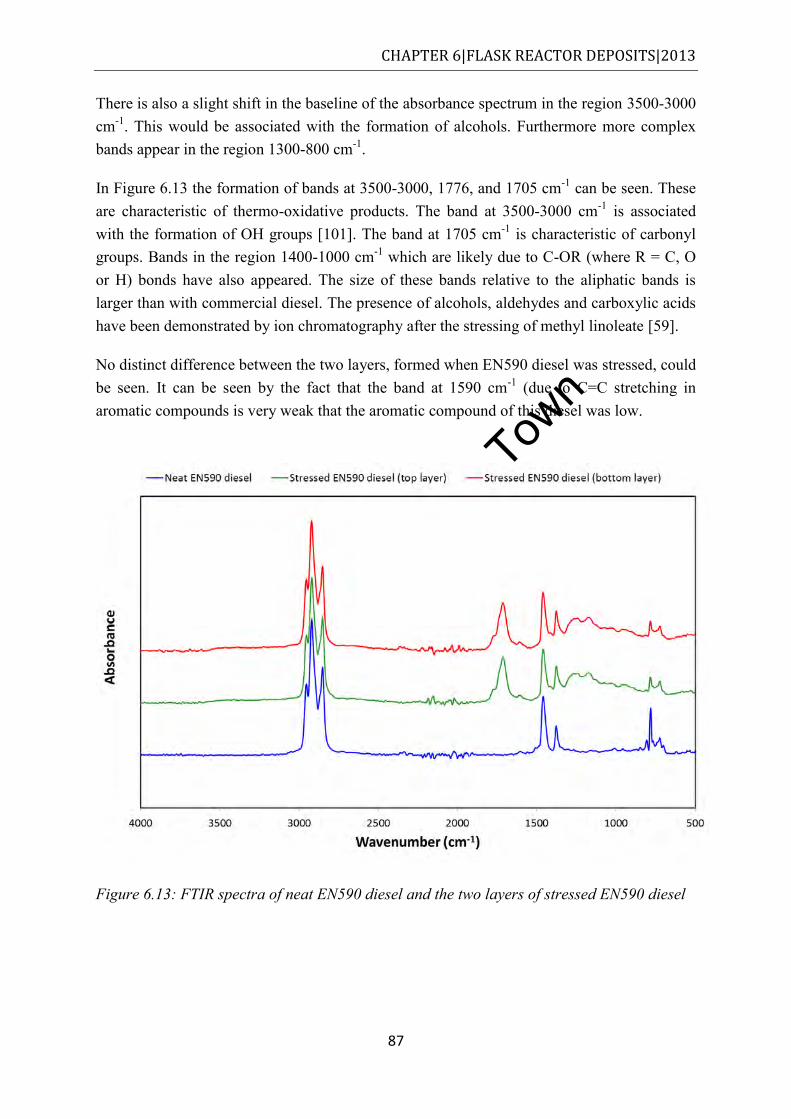
Univers
ity of
Cap
e Tow
n
CHAPTER 6|FLASK REACTOR DEPOSITS|2013
87
There is also a slight shift in the baseline of the absorbance spectrum in the region 3500-3000 cm-1. This would be associated with the formation of alcohols. Furthermore more complex bands appear in the region 1300-800 cm-1.
In Figure 6.13 the formation of bands at 3500-3000, 1776, and 1705 cm-1 can be seen. These are characteristic of thermo-oxidative products. The band at 3500-3000 cm-1 is associated with the formation of OH groups [101]. The band at 1705 cm-1 is characteristic of carbonyl groups. Bands in the region 1400-1000 cm-1 which are likely due to C-OR (where R = C, O or H) bonds have also appeared. The size of these bands relative to the aliphatic bands is larger than with commercial diesel. The presence of alcohols, aldehydes and carboxylic acids have been demonstrated by ion chromatography after the stressing of methyl linoleate [59].
No distinct difference between the two layers, formed when EN590 diesel was stressed, could be seen. It can be seen by the fact that the band at 1590 cm-1 (due to C=C stretching in aromatic compounds is very weak that the aromatic compound of this diesel was low.
Figure 6.13: FTIR spectra of neat EN590 diesel and the two layers of stressed EN590 diesel
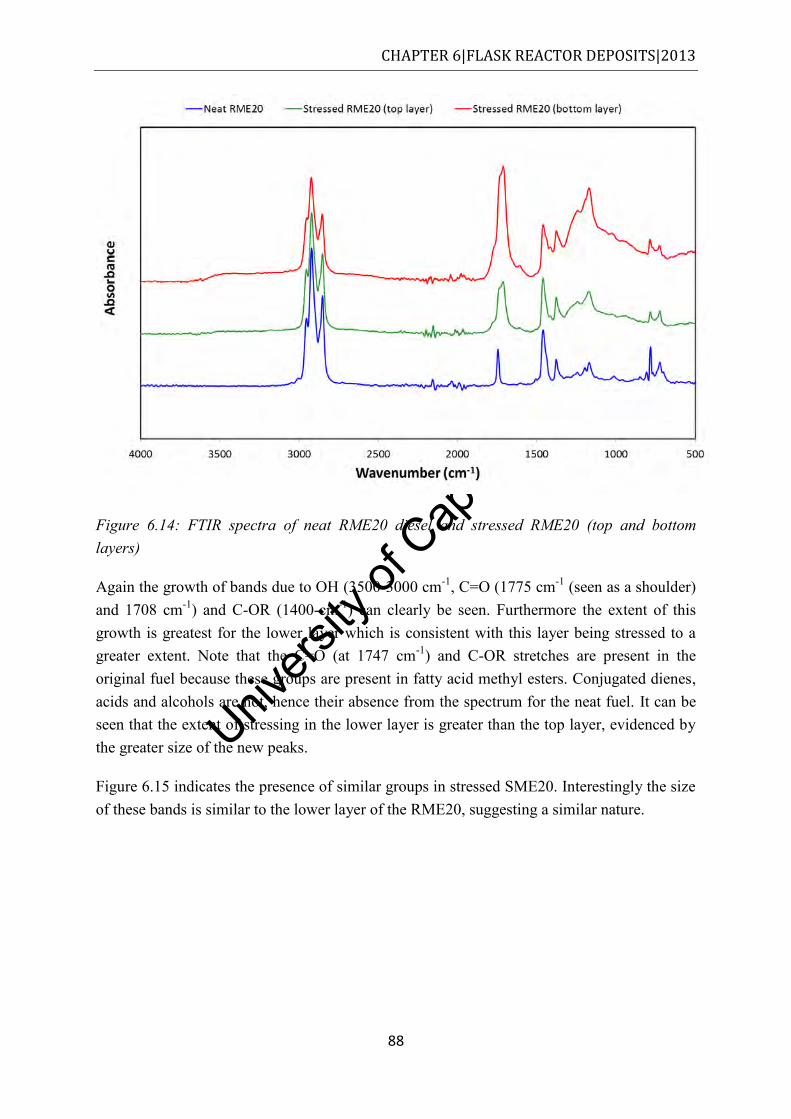
Univers
ity of
Cap
e Tow
n
CHAPTER 6|FLASK REACTOR DEPOSITS|2013
88
Figure 6.14: FTIR spectra of neat RME20 diesel and stressed RME20 (top and bottom layers)
Again the growth of bands due to OH (3500-3000 cm-1, C=O (1775 cm-1 (seen as a shoulder) and 1708 cm-1) and C-OR (1400-cm-1) can clearly be seen. Furthermore the extent of this growth is greatest for the lower layer which is consistent with this layer being stressed to a greater extent. Note that the C=O (at 1747 cm-1) and C-OR stretches are present in the original fuel because these groups are present in fatty acid methyl esters. Conjugated dienes, acids and alcohols are not, hence their absence from the spectrum for the neat fuel. It can be seen that the extent of stressing in the lower layer is greater than the top layer, evidenced by the greater size of the new peaks.
Figure 6.15 indicates the presence of similar groups in stressed SME20. Interestingly the size of these bands is similar to the lower layer of the RME20, suggesting a similar nature.
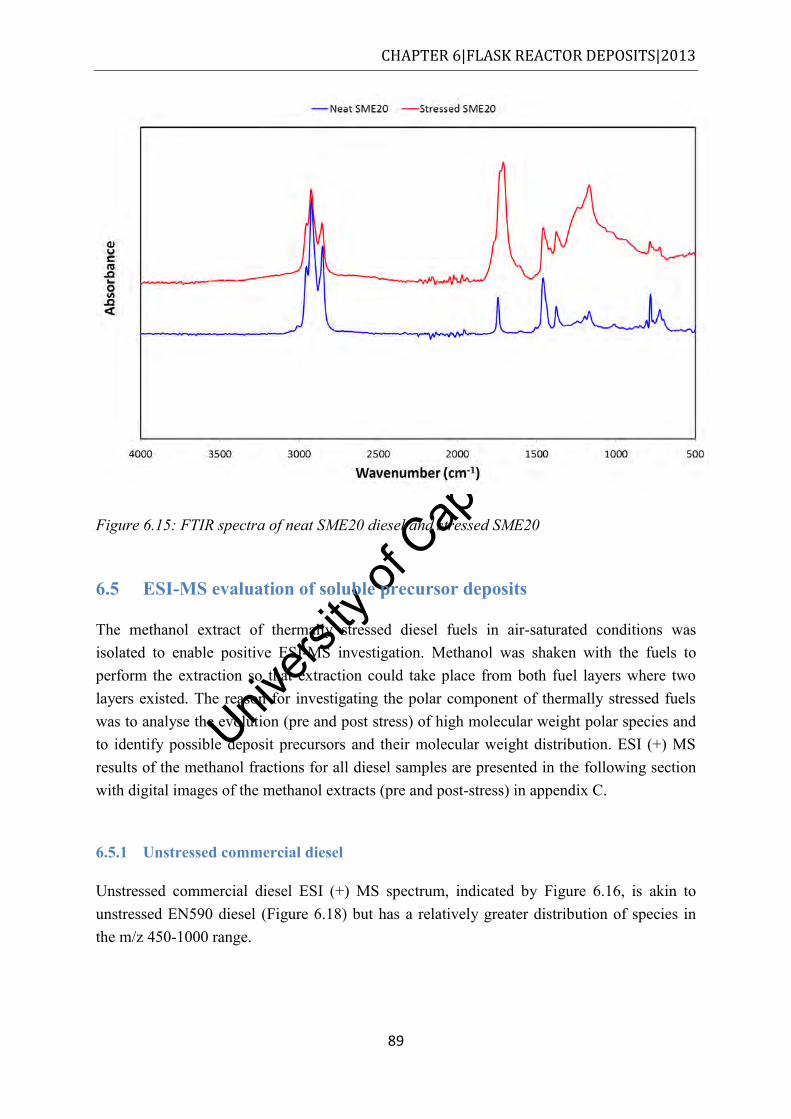
Univers
ity of
Cap
e Tow
n
CHAPTER 6|FLASK REACTOR DEPOSITS|2013
89
Figure 6.15: FTIR spectra of neat SME20 diesel and stressed SME20
6.5 ESI-MS evaluation of soluble precursor deposits
The methanol extract of thermally stressed diesel fuels in air-saturated conditions was isolated to enable positive ESI-MS investigation. Methanol was shaken with the fuels to perform the extraction so that extraction could take place from both fuel layers where two layers existed. The reason for investigating the polar component of thermally stressed fuels was to analyse the evolution (pre and post stress) of high molecular weight polar species and to identify possible deposit precursors and their molecular weight distribution. ESI (+) MS results of the methanol fractions for all diesel samples are presented in the following section with digital images of the methanol extracts (pre and post-stress) in appendix C.
6.5.1 Unstressed commercial diesel
Unstressed commercial diesel ESI (+) MS spectrum, indicated by Figure 6.16, is akin to unstressed EN590 diesel (Figure 6.18) but has a relatively greater distribution of species in the m/z 450-1000 range.
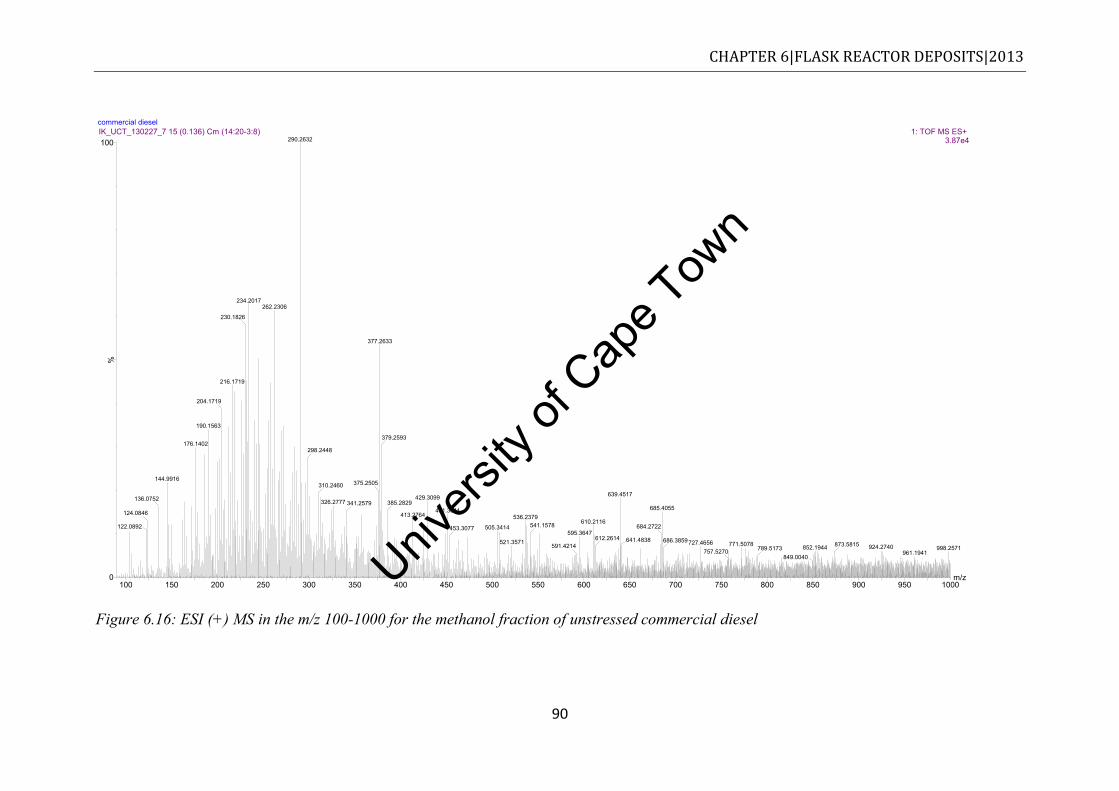
Univers
ity of
Cap
e Tow
n
CHAPTER 6|FLASK REACTOR DEPOSITS|2013
90
Figure 6.16: ESI (+) MS in the m/z 100-1000 for the methanol fraction of unstressed commercial diesel
commercial diesel
m/z100 150 200 250 300 350 400 450 500 550 600 650 700 750 800 850 900 950 1000
%
0
100IK_UCT_130227_7 15 (0.136) Cm (14:20-3:8) 1: TOF MS ES+
3.87e4290.2632
234.2017
230.1826
216.1719
204.1719
190.1563
176.1402
144.9916
136.0752
124.0846
122.0892
262.2306
377.2633
298.2448
375.2505310.2460
326.2777 341.2579
379.2593
639.4517429.3099385.2829
413.2764451.3041
536.2379
505.3414453.3077
521.3571
610.2116541.1578595.3647
591.4214612.2614
685.4055
684.2722
641.4838 727.4656686.3859 771.5078757.5270
924.2740852.1944789.5173849.0040
873.5815 998.2571961.1941
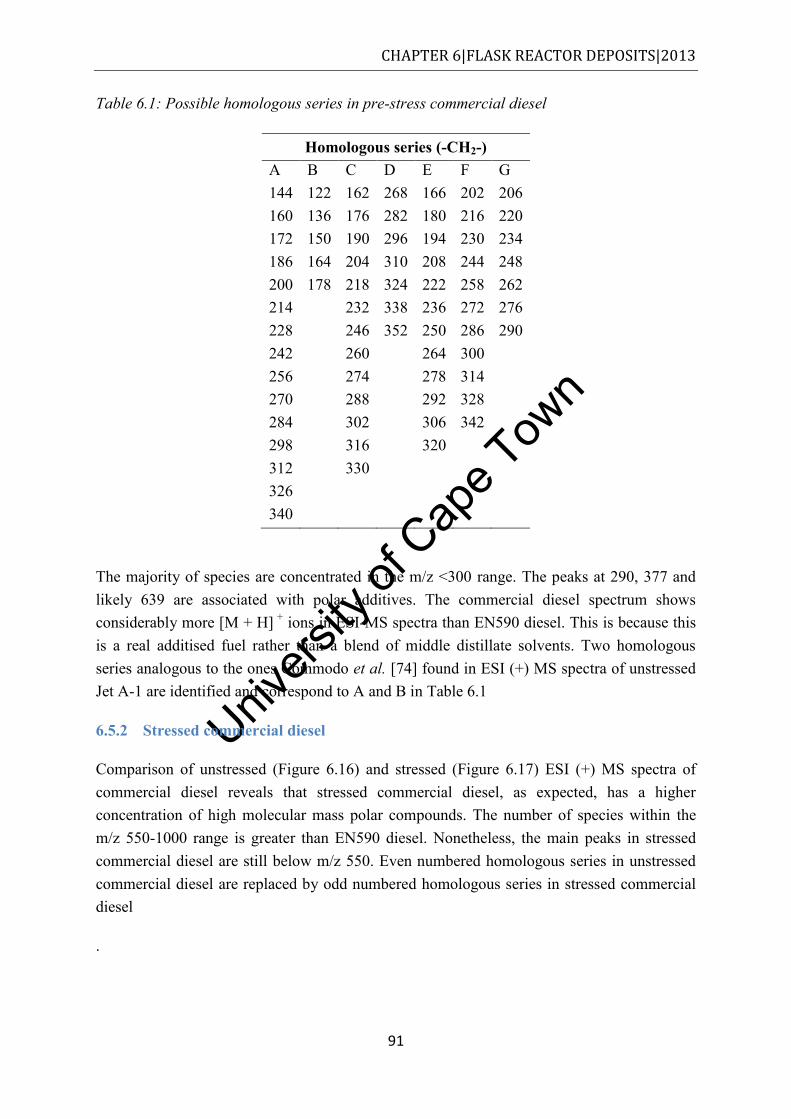
Univers
ity of
Cap
e Tow
n
CHAPTER 6|FLASK REACTOR DEPOSITS|2013
91
Table 6.1: Possible homologous series in pre-stress commercial diesel
Homologous series (-CH2-) A B C D E F G 144 122 162 268 166 202 206 160 136 176 282 180 216 220 172 150 190 296 194 230 234 186 164 204 310 208 244 248 200 178 218 324 222 258 262 214 232 338 236 272 276 228 246 352 250 286 290 242 260 264 300 256 274 278 314 270 288 292 328 284 302 306 342 298 316 320 312 330 326 340
The majority of species are concentrated in the m/z <300 range. The peaks at 290, 377 and likely 639 are associated with polar additives. The commercial diesel spectrum shows considerably more [M + H] + ions in ESI-MS spectra than EN590 diesel. This is because this is a real additised fuel rather than a blend of middle distillate solvents. Two homologous series analogous to the ones Commodo et al. [74] found in ESI (+) MS spectra of unstressed Jet A-1 are identified and correspond to A and B in Table 6.1
6.5.2 Stressed commercial diesel
Comparison of unstressed (Figure 6.16) and stressed (Figure 6.17) ESI (+) MS spectra of commercial diesel reveals that stressed commercial diesel, as expected, has a higher concentration of high molecular mass polar compounds. The number of species within the m/z 550-1000 range is greater than EN590 diesel. Nonetheless, the main peaks in stressed commercial diesel are still below m/z 550. Even numbered homologous series in unstressed commercial diesel are replaced by odd numbered homologous series in stressed commercial diesel
.
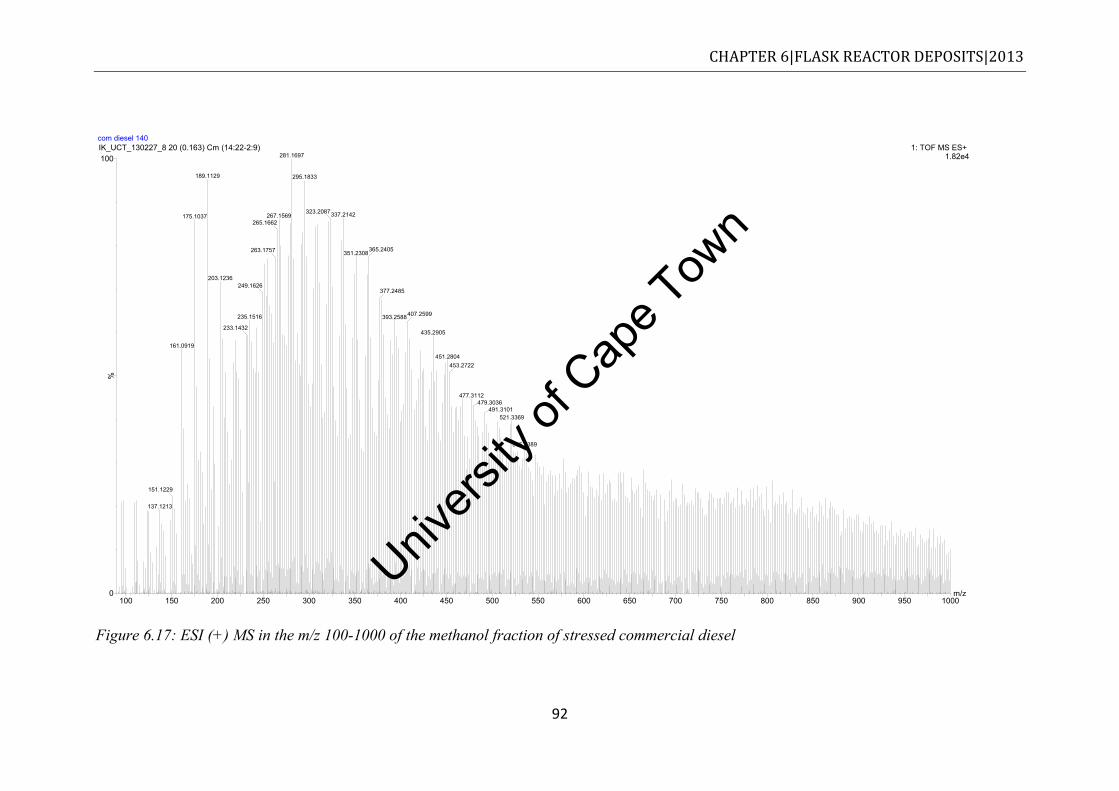
Univers
ity of
Cap
e Tow
n
CHAPTER 6|FLASK REACTOR DEPOSITS|2013
92
Figure 6.17: ESI (+) MS in the m/z 100-1000 of the methanol fraction of stressed commercial diesel
com diesel 140
m/z100 150 200 250 300 350 400 450 500 550 600 650 700 750 800 850 900 950 1000
%
0
100IK_UCT_130227_8 20 (0.163) Cm (14:22-2:9) 1: TOF MS ES+
1.82e4281.1697
189.1129
175.1037
161.0919
151.1229
137.1213
267.1569265.1662
263.1757
203.1236249.1626
235.1516
233.1432
295.1833
337.2142323.2087
351.2308365.2405
377.2485
393.2588407.2599
435.2905
451.2804453.2722
477.3112479.3036
491.3101521.3369
535.3389
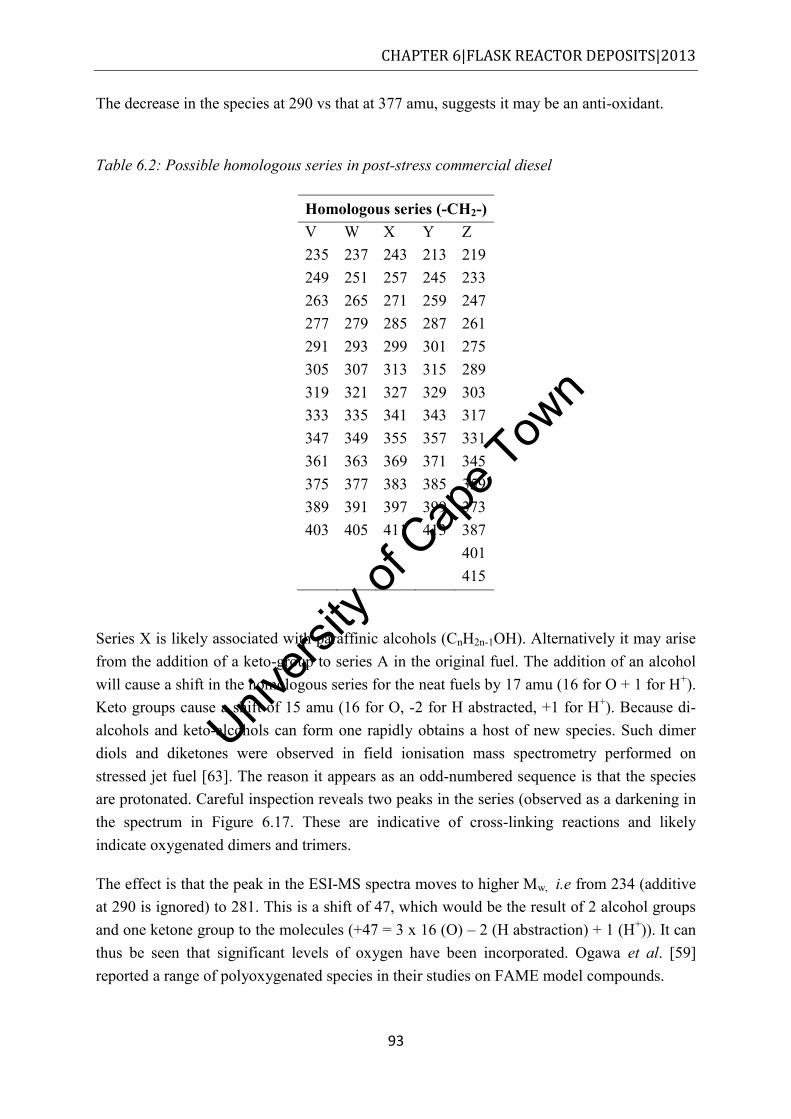
Univers
ity of
Cap
e Tow
n
CHAPTER 6|FLASK REACTOR DEPOSITS|2013
93
The decrease in the species at 290 vs that at 377 amu, suggests it may be an anti-oxidant.
Table 6.2: Possible homologous series in post-stress commercial diesel
Homologous series (-CH2-) V W X Y Z 235 237 243 213 219 249 251 257 245 233 263 265 271 259 247 277 279 285 287 261 291 293 299 301 275 305 307 313 315 289 319 321 327 329 303 333 335 341 343 317 347 349 355 357 331 361 363 369 371 345 375 377 383 385 359 389 391 397 399 373 403 405 411 413 387 401 415
Series X is likely associated with paraffinic alcohols (CnH2n-1OH). Alternatively it may arise from the addition of a keto-group to series A in the original fuel. The addition of an alcohol will cause a shift in the homologous series for the neat fuels by 17 amu (16 for O + 1 for H+). Keto groups cause a shift of 15 amu (16 for O, -2 for H abstracted, +1 for H+). Because di-alcohols and keto-alcohols can form one rapidly obtains a host of new species. Such dimer diols and diketones were observed in field ionisation mass spectrometry performed on stressed jet fuel [63]. The reason it appears as an odd-numbered sequence is that the species are protonated. Careful inspection reveals two peaks in the series (observed as a darkening in the spectrum in Figure 6.17. These are indicative of cross-linking reactions and likely indicate oxygenated dimers and trimers.
The effect is that the peak in the ESI-MS spectra moves to higher Mw, i.e from 234 (additive at 290 is ignored) to 281. This is a shift of 47, which would be the result of 2 alcohol groups and one ketone group to the molecules (+47 = 3 x 16 (O) – 2 (H abstraction) + 1 (H+)). It can thus be seen that significant levels of oxygen have been incorporated. Ogawa et al. [59] reported a range of polyoxygenated species in their studies on FAME model compounds.

Univers
ity of
Cap
e Tow
n
CHAPTER 6|FLASK REACTOR DEPOSITS|2013
94
6.5.3 Unstressed EN590 diesel
Below is the ESI (+) MS spectrum (Figure 6.18) of the methanol fraction of unstressed EN590 diesel.
Table 6.3 illustrates possible homologous series emanating from the spectrum.
Table 6.3: Possible homologous series (identified by 14 m/z (-CH2-) increments) in unstressed EN590 diesel
Homologous series (-CH2-) A B C D E F G H 335 263 351 275 397 489 431 234 349 277 365 289 411 503 445 248 363 291 379 303 425 459 262 377 305 317 473 276 319 290 333 347
The very large response species could not be identified but are likely additives. The maximum possibly belongs in the homologous series which starts at m/z 234 and increases in alkyl groups (-CH2-) until m/z 290, although it is more likely there are more than one species with m/z 290 present. Other possible but unidentified homologous series are listed from A-G. Species at m/z 144 and 158 were also found in [74]. These may correspond with methyl isoquinoline and ethyl isoquinoline respectively.
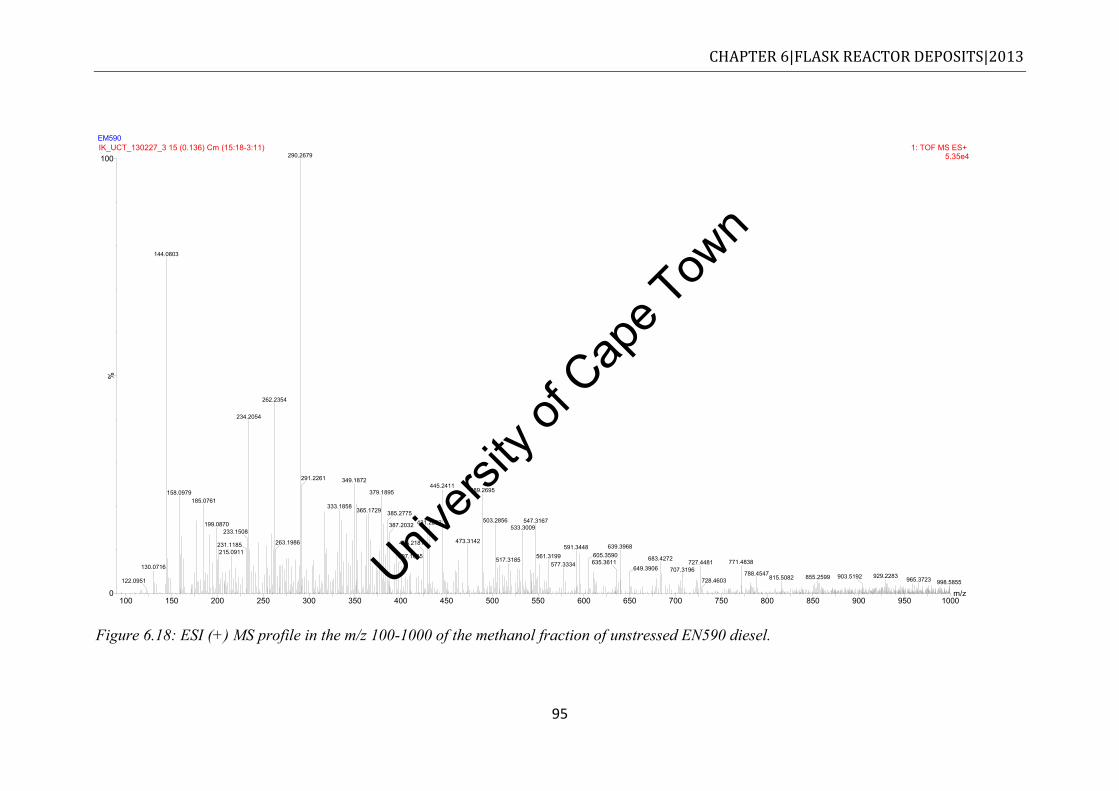
Univers
ity of
Cap
e Tow
n
CHAPTER 6|FLASK REACTOR DEPOSITS|2013
95
Figure 6.18: ESI (+) MS profile in the m/z 100-1000 of the methanol fraction of unstressed EN590 diesel.
EM590
m/z100 150 200 250 300 350 400 450 500 550 600 650 700 750 800 850 900 950 1000
%
0
100IK_UCT_130227_3 15 (0.136) Cm (15:18-3:11) 1: TOF MS ES+
5.35e4290.2679
144.0803
130.0716
122.0951
262.2354
234.2054
158.0979185.0761
199.0870233.1508
231.1185215.0911
263.1986
349.1872291.2261
333.1858
445.2411379.1895
365.1729 385.2775431.2292387.2032
425.2181
397.1835
489.2695
473.3142
503.2856 547.3167533.3009
517.3185
639.3968591.3448561.3199
577.3334605.3590635.3611 683.4272
649.3906771.4838727.4481
707.3196
728.4603788.4547 929.2283855.2599815.5082 903.5192 965.3723 998.5855
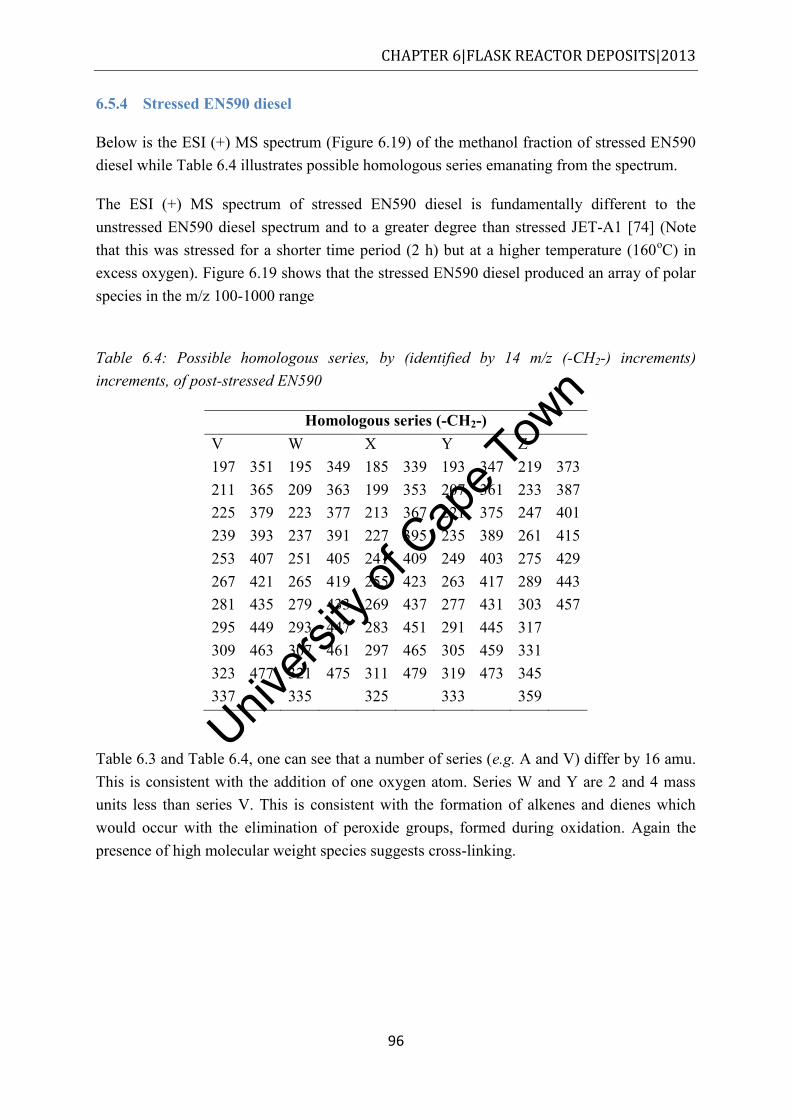
Univers
ity of
Cap
e Tow
n
CHAPTER 6|FLASK REACTOR DEPOSITS|2013
96
6.5.4 Stressed EN590 diesel
Below is the ESI (+) MS spectrum (Figure 6.19) of the methanol fraction of stressed EN590 diesel while Table 6.4 illustrates possible homologous series emanating from the spectrum.
The ESI (+) MS spectrum of stressed EN590 diesel is fundamentally different to the unstressed EN590 diesel spectrum and to a greater degree than stressed JET-A1 [74] (Note that this was stressed for a shorter time period (2 h) but at a higher temperature (160oC) in excess oxygen). Figure 6.19 shows that the stressed EN590 diesel produced an array of polar species in the m/z 100-1000 range
Table 6.4: Possible homologous series, by (identified by 14 m/z (-CH2-) increments) increments, of post-stressed EN590
Homologous series (-CH2-) V W X Y Z 197 351 195 349 185 339 193 347 219 373 211 365 209 363 199 353 207 361 233 387 225 379 223 377 213 367 221 375 247 401 239 393 237 391 227 395 235 389 261 415 253 407 251 405 241 409 249 403 275 429 267 421 265 419 255 423 263 417 289 443 281 435 279 433 269 437 277 431 303 457 295 449 293 447 283 451 291 445 317 309 463 307 461 297 465 305 459 331 323 477 321 475 311 479 319 473 345 337 335 325 333 359
Table 6.3 and Table 6.4, one can see that a number of series (e.g. A and V) differ by 16 amu. This is consistent with the addition of one oxygen atom. Series W and Y are 2 and 4 mass units less than series V. This is consistent with the formation of alkenes and dienes which would occur with the elimination of peroxide groups, formed during oxidation. Again the presence of high molecular weight species suggests cross-linking.
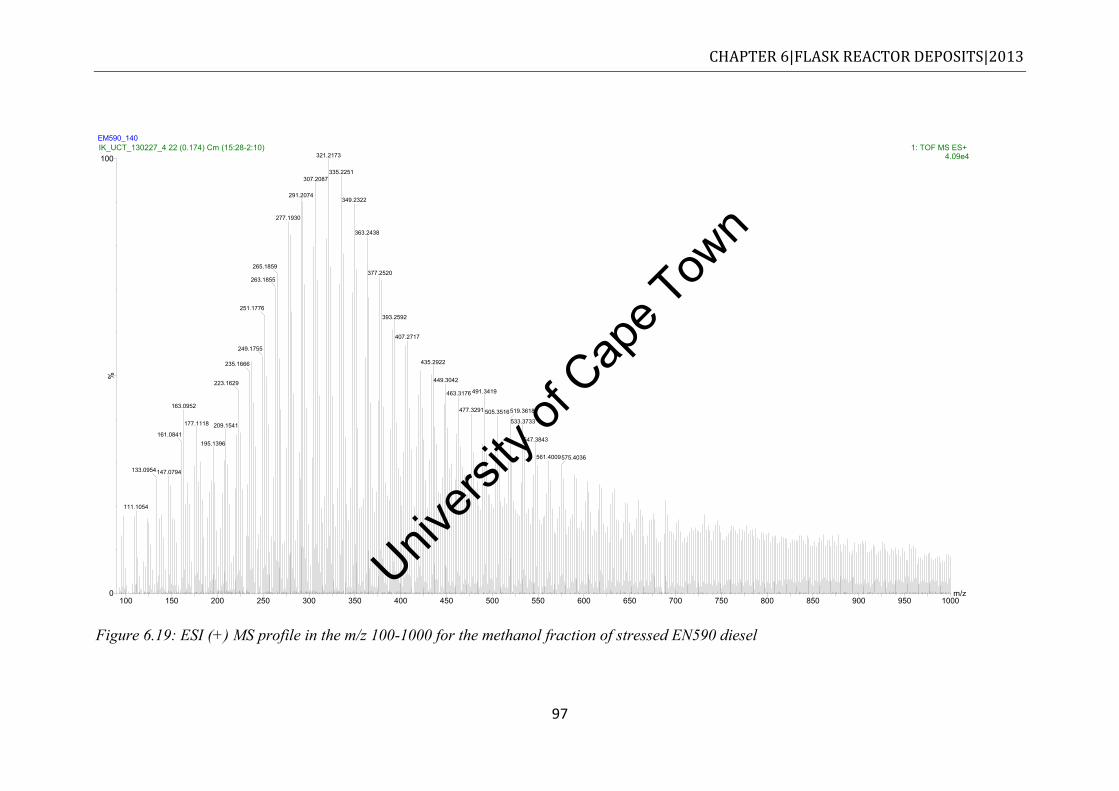
Univers
ity of
Cap
e Tow
n
CHAPTER 6|FLASK REACTOR DEPOSITS|2013
97
Figure 6.19: ESI (+) MS profile in the m/z 100-1000 for the methanol fraction of stressed EN590 diesel
EM590_140
m/z100 150 200 250 300 350 400 450 500 550 600 650 700 750 800 850 900 950 1000
%
0
100IK_UCT_130227_4 22 (0.174) Cm (15:28-2:10) 1: TOF MS ES+
4.09e4321.2173
307.2087
291.2074
277.1930
265.1859
263.1855
251.1776
249.1755
235.1666
223.1629
163.0952
161.0841
147.0794133.0954
111.1054
177.1118 209.1541
195.1396
335.2251
349.2322
363.2438
377.2520
393.2592
407.2717
435.2922
449.3042
491.3419463.3176
477.3291 505.3516519.3618
533.3733
547.3843
561.4009575.4036
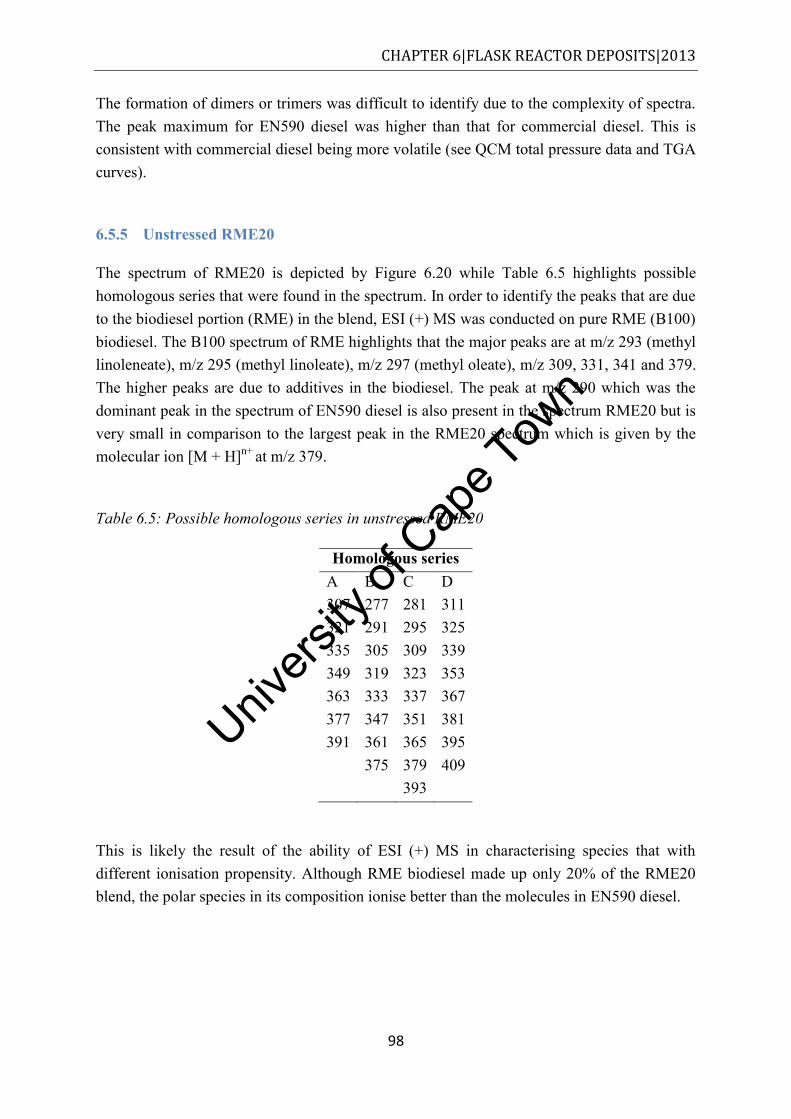
Univers
ity of
Cap
e Tow
n
CHAPTER 6|FLASK REACTOR DEPOSITS|2013
98
The formation of dimers or trimers was difficult to identify due to the complexity of spectra. The peak maximum for EN590 diesel was higher than that for commercial diesel. This is consistent with commercial diesel being more volatile (see QCM total pressure data and TGA curves).
6.5.5 Unstressed RME20
The spectrum of RME20 is depicted by Figure 6.20 while Table 6.5 highlights possible homologous series that were found in the spectrum. In order to identify the peaks that are due to the biodiesel portion (RME) in the blend, ESI (+) MS was conducted on pure RME (B100) biodiesel. The B100 spectrum of RME highlights that the major peaks are at m/z 293 (methyl linoleneate), m/z 295 (methyl linoleate), m/z 297 (methyl oleate), m/z 309, 331, 341 and 379. The higher peaks are due to additives in the biodiesel. The peak at m/z 290 which was the dominant peak in the spectrum of EN590 diesel is also present in the spectrum RME20 but is very small in comparison to the largest peak in the RME20 spectrum which is given by the molecular ion [M + H]n+ at m/z 379.
Table 6.5: Possible homologous series in unstressed RME20
Homologous series A B C D 307 277 281 311 321 291 295 325 335 305 309 339 349 319 323 353 363 333 337 367 377 347 351 381 391 361 365 395 375 379 409 393
This is likely the result of the ability of ESI (+) MS in characterising species that with different ionisation propensity. Although RME biodiesel made up only 20% of the RME20 blend, the polar species in its composition ionise better than the molecules in EN590 diesel.
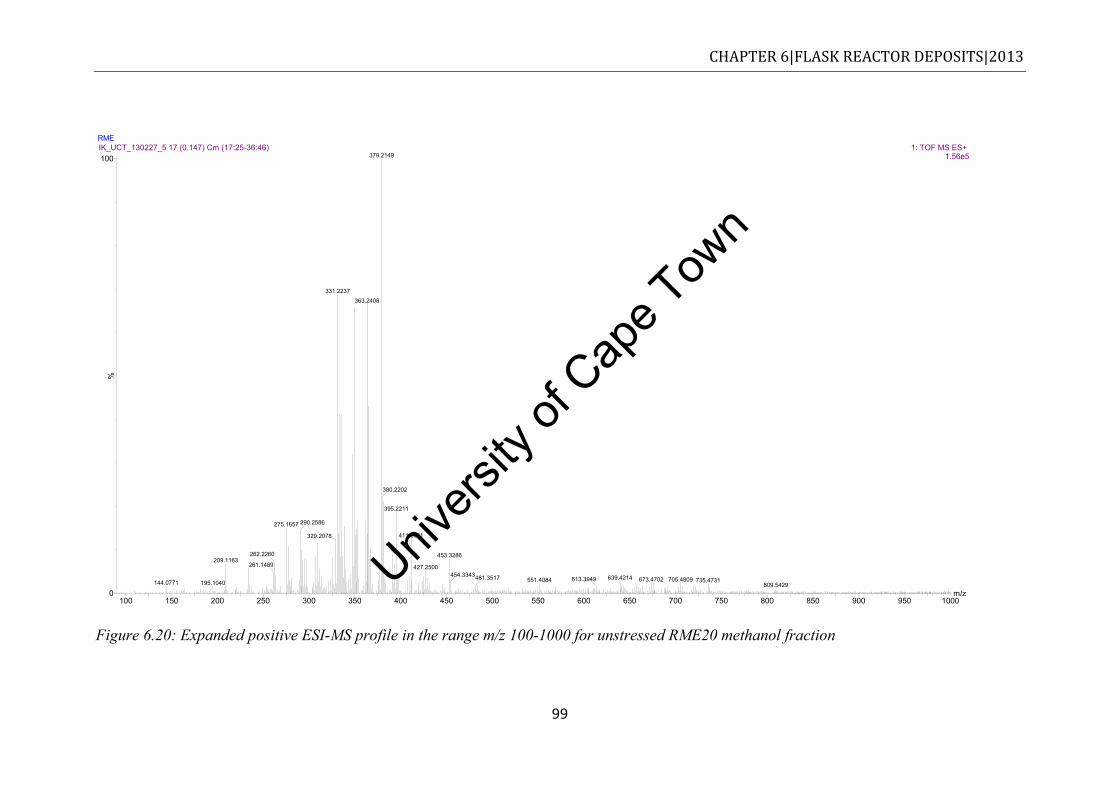
Univers
ity of
Cap
e Tow
n
CHAPTER 6|FLASK REACTOR DEPOSITS|2013
99
Figure 6.20: Expanded positive ESI-MS profile in the range m/z 100-1000 for unstressed RME20 methanol fraction
RME
m/z100 150 200 250 300 350 400 450 500 550 600 650 700 750 800 850 900 950 1000
%
0
100IK_UCT_130227_5 17 (0.147) Cm (17:25-36:46) 1: TOF MS ES+
1.56e5379.2149
331.2237
275.1657
262.2260209.1163
144.0771 195.1040
261.1489
290.2586
329.2078
363.2408
380.2202
395.2211
411.2331
453.3286
427.2500
639.4214454.3343551.4084481.3517 613.3949 673.4702 705.4809 735.4731
809.5429
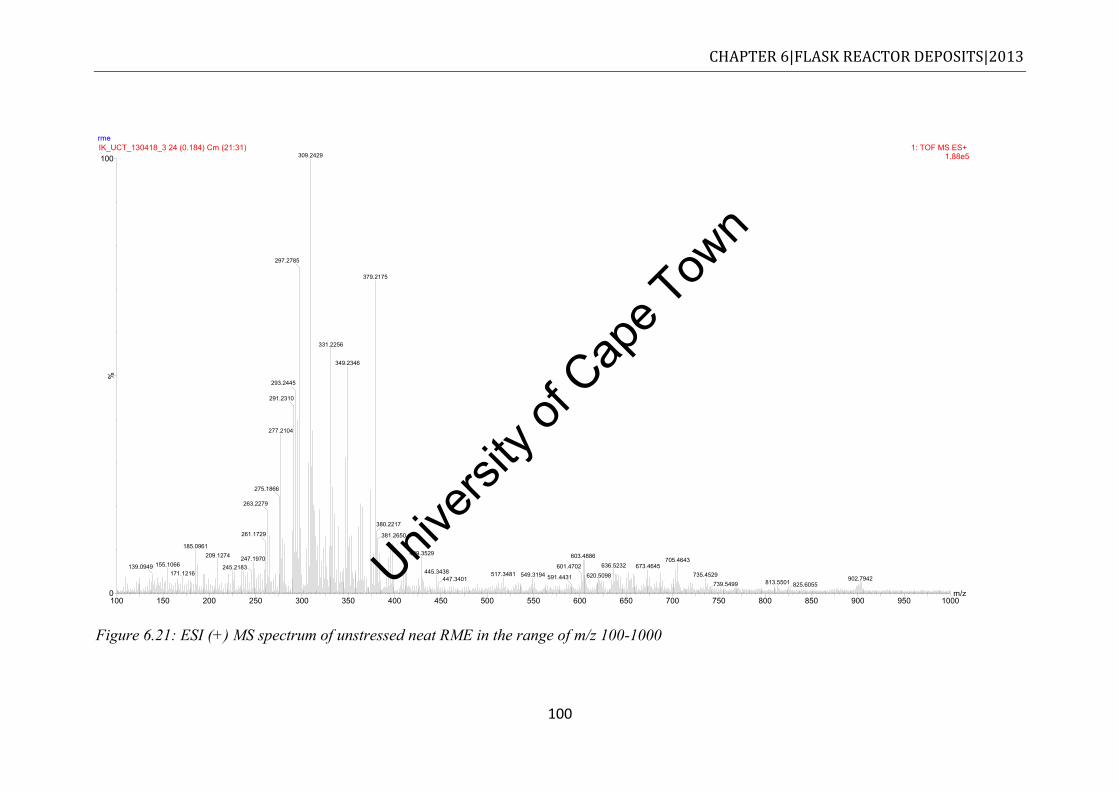
Univers
ity of
Cap
e Tow
n
CHAPTER 6|FLASK REACTOR DEPOSITS|2013
100
Figure 6.21: ESI (+) MS spectrum of unstressed neat RME in the range of m/z 100-1000
rme
m/z100 150 200 250 300 350 400 450 500 550 600 650 700 750 800 850 900 950 1000
%
0
100IK_UCT_130418_3 24 (0.184) Cm (21:31) 1: TOF MS ES+
1.88e5309.2429
297.2785
293.2445
291.2310
277.2104
275.1866
263.2279
261.1729
185.0961
155.1066139.0949171.1216
209.1274 247.1970245.2183
379.2175
331.2256
349.2346
380.2217
381.2650
429.3529 603.4886
601.4702445.3438 517.3481
447.3401549.3194 591.4431
705.4643636.5232
620.5098673.4645
735.4529 902.7942813.5501739.5499 825.6055
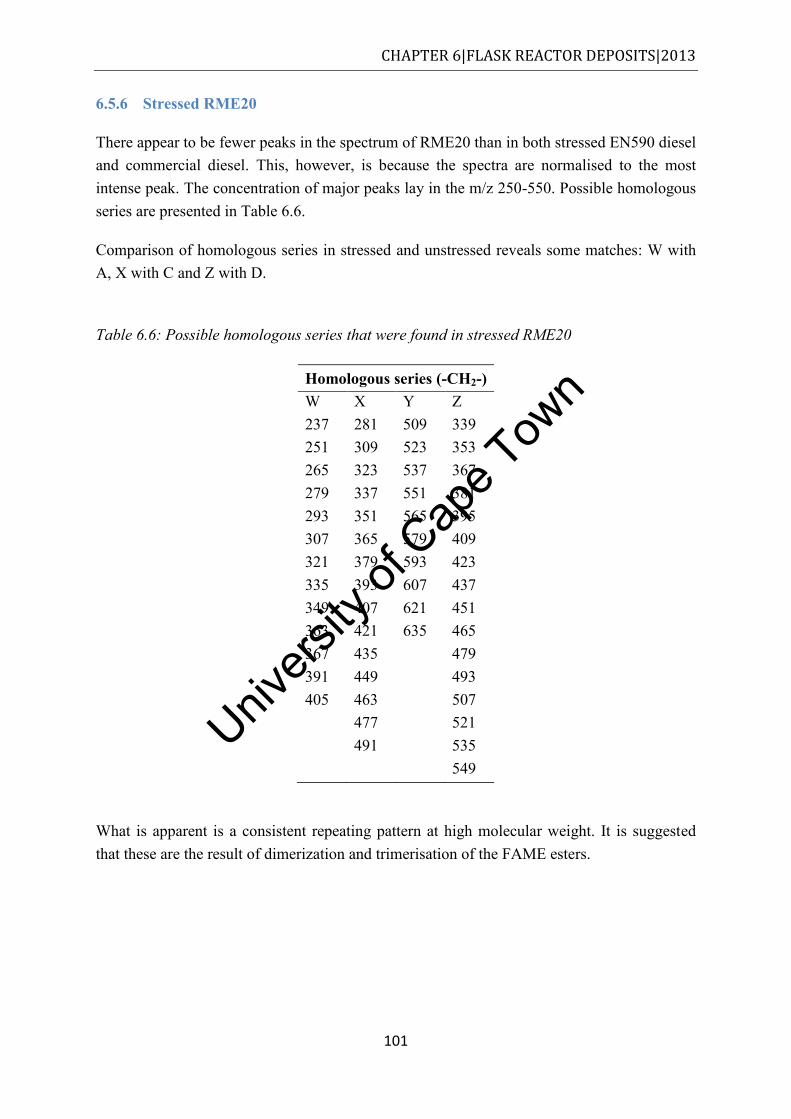
Univers
ity of
Cap
e Tow
n
CHAPTER 6|FLASK REACTOR DEPOSITS|2013
101
6.5.6 Stressed RME20
There appear to be fewer peaks in the spectrum of RME20 than in both stressed EN590 diesel and commercial diesel. This, however, is because the spectra are normalised to the most intense peak. The concentration of major peaks lay in the m/z 250-550. Possible homologous series are presented in Table 6.6.
Comparison of homologous series in stressed and unstressed reveals some matches: W with A, X with C and Z with D.
Table 6.6: Possible homologous series that were found in stressed RME20
Homologous series (-CH2-) W X Y Z 237 281 509 339 251 309 523 353 265 323 537 367 279 337 551 381 293 351 565 395 307 365 579 409 321 379 593 423 335 393 607 437 349 407 621 451 363 421 635 465 367 435 479 391 449 493 405 463 507 477 521 491 535 549
What is apparent is a consistent repeating pattern at high molecular weight. It is suggested that these are the result of dimerization and trimerisation of the FAME esters.
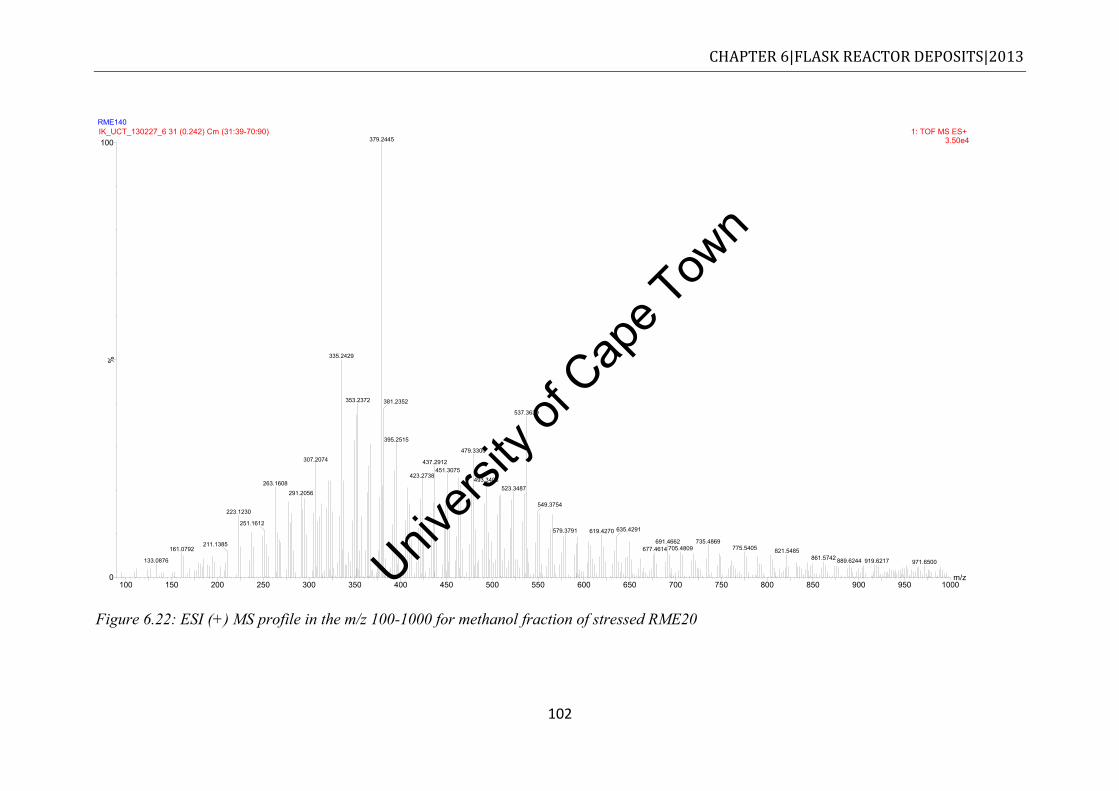
Univers
ity of
Cap
e Tow
n
CHAPTER 6|FLASK REACTOR DEPOSITS|2013
102
Figure 6.22: ESI (+) MS profile in the m/z 100-1000 for methanol fraction of stressed RME20
RME140
m/z100 150 200 250 300 350 400 450 500 550 600 650 700 750 800 850 900 950 1000
%
0
100IK_UCT_130227_6 31 (0.242) Cm (31:39-70:90) 1: TOF MS ES+
3.50e4379.2445
335.2429
307.2074
263.1608
223.1230
211.1385161.0792
133.0876
251.1612
291.2056
353.2372 381.2352
537.3639
395.2515
479.3300
437.2912
423.2738451.3075
493.3406523.3487
549.3754
579.3791 619.4270 635.4291
735.4869691.4662677.4614 705.4809 775.5405 821.5485
861.5742 889.6244 919.6217 971.6500
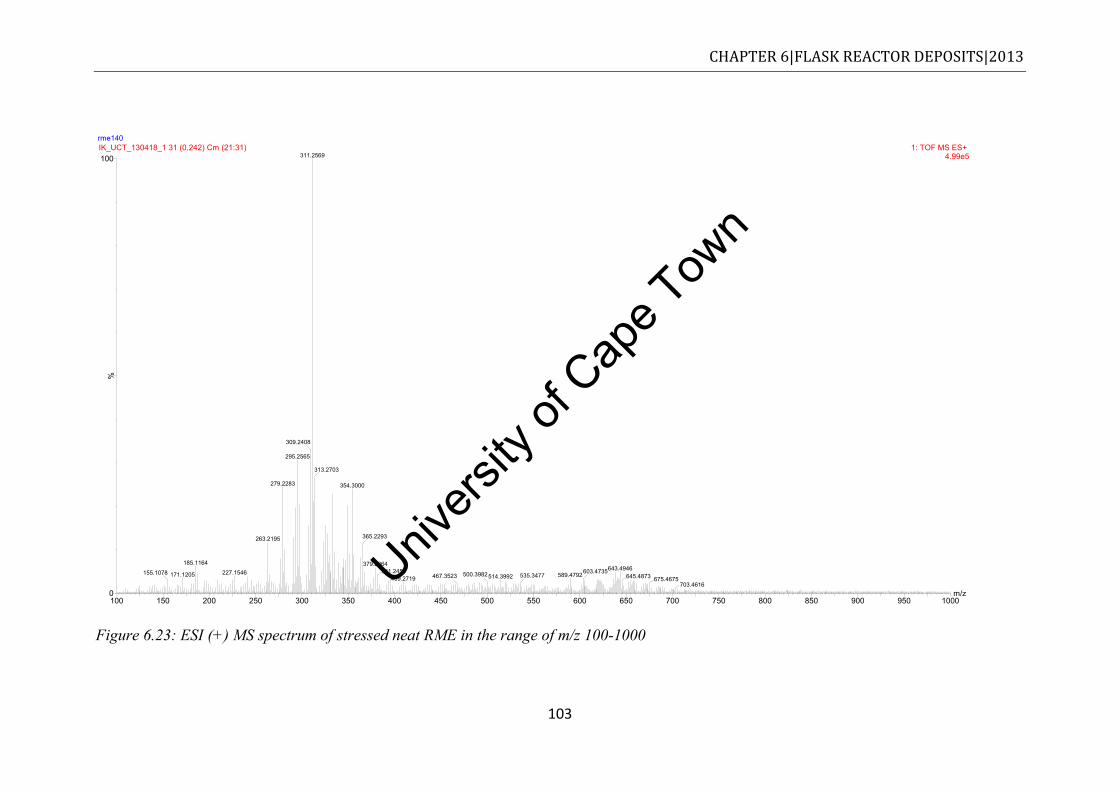
Univers
ity of
Cap
e Tow
n
CHAPTER 6|FLASK REACTOR DEPOSITS|2013
103
Figure 6.23: ESI (+) MS spectrum of stressed neat RME in the range of m/z 100-1000
rme140
m/z100 150 200 250 300 350 400 450 500 550 600 650 700 750 800 850 900 950 1000
%
0
100IK_UCT_130418_1 31 (0.242) Cm (21:31) 1: TOF MS ES+
4.99e5311.2569
309.2408
295.2565
279.2283
263.2195
185.1164
171.1205155.1078 227.1546
313.2703
354.3000
365.2293
379.2264643.4946381.2459 589.4792514.3992500.3982
409.2719 467.3523 535.3477603.4735
645.4873 675.4675703.4616
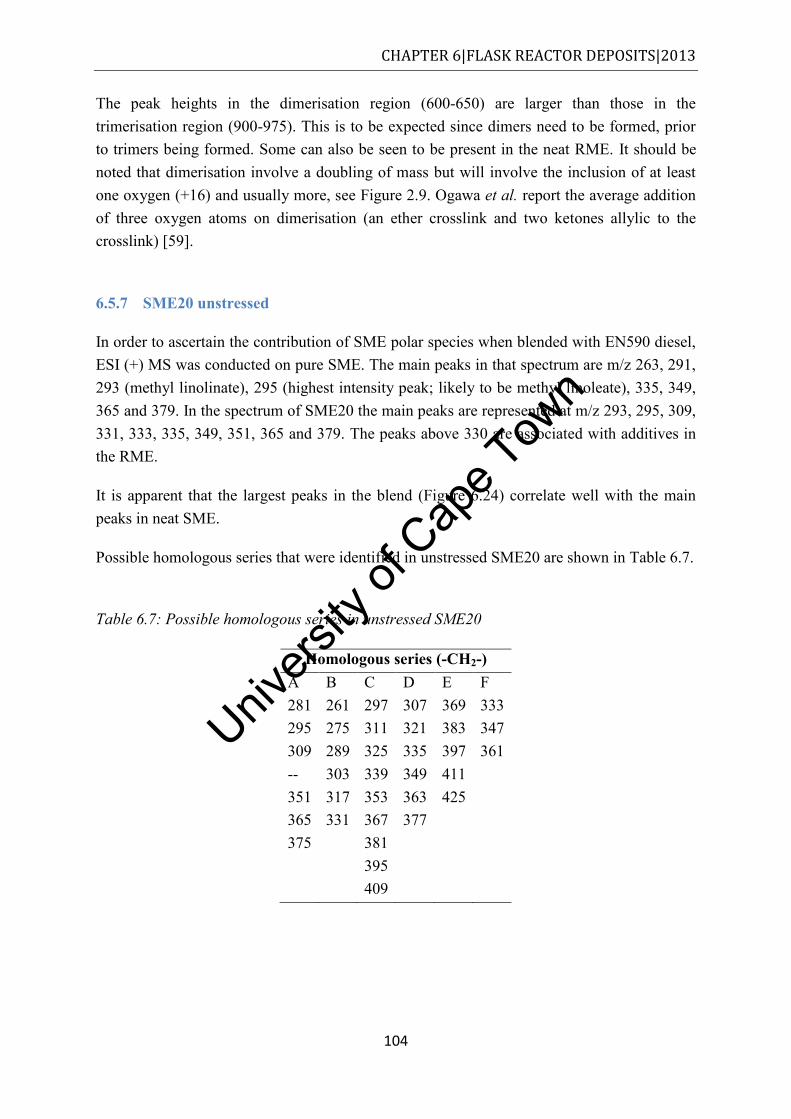
Univers
ity of
Cap
e Tow
n
CHAPTER 6|FLASK REACTOR DEPOSITS|2013
104
The peak heights in the dimerisation region (600-650) are larger than those in the trimerisation region (900-975). This is to be expected since dimers need to be formed, prior to trimers being formed. Some can also be seen to be present in the neat RME. It should be noted that dimerisation involve a doubling of mass but will involve the inclusion of at least one oxygen (+16) and usually more, see Figure 2.9. Ogawa et al. report the average addition of three oxygen atoms on dimerisation (an ether crosslink and two ketones allylic to the crosslink) [59].
6.5.7 SME20 unstressed
In order to ascertain the contribution of SME polar species when blended with EN590 diesel, ESI (+) MS was conducted on pure SME. The main peaks in that spectrum are m/z 263, 291, 293 (methyl linolinate), 295 (highest intensity peak; likely to be methyl linoleate), 335, 349, 365 and 379. In the spectrum of SME20 the main peaks are represented at m/z 293, 295, 309, 331, 333, 335, 349, 351, 365 and 379. The peaks above 330 are associated with additives in the RME.
It is apparent that the largest peaks in the blend (Figure 6.24) correlate well with the main peaks in neat SME.
Possible homologous series that were identified in unstressed SME20 are shown in Table 6.7.
Table 6.7: Possible homologous series in unstressed SME20
Homologous series (-CH2-) A B C D E F 281 261 297 307 369 333 295 275 311 321 383 347 309 289 325 335 397 361 -- 303 339 349 411 351 317 353 363 425 365 331 367 377 375 381 395 409
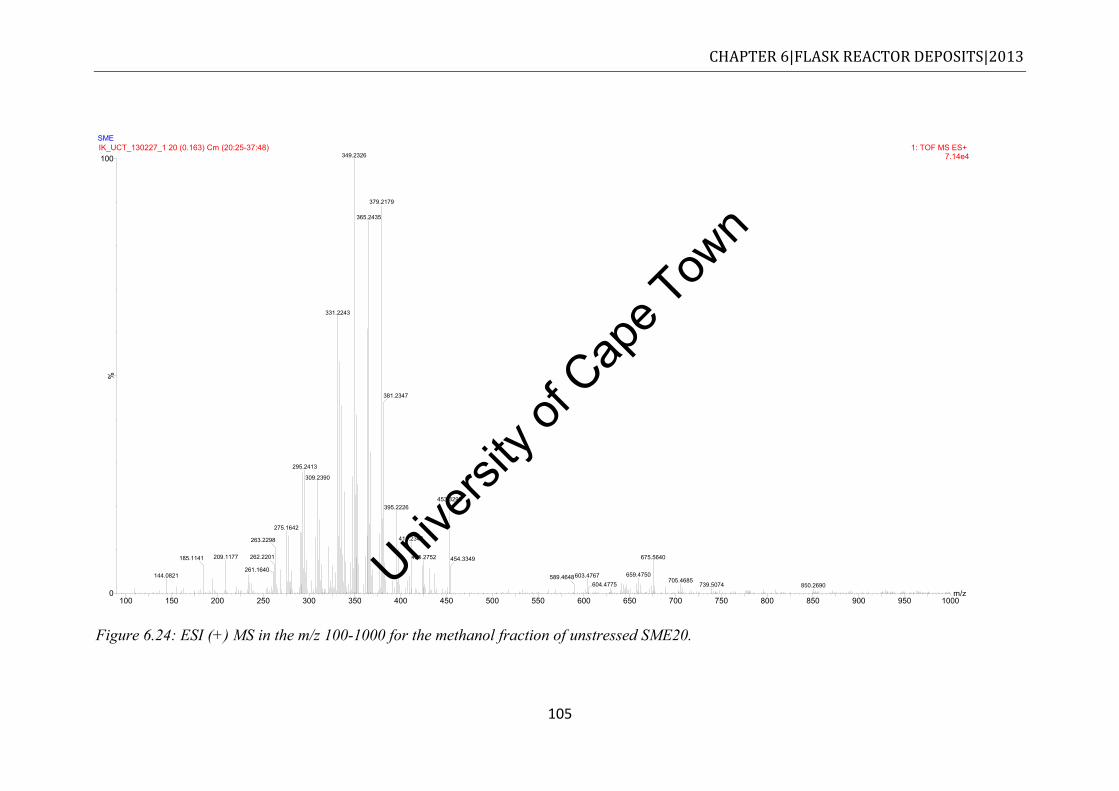
Univers
ity of
Cap
e Tow
n
CHAPTER 6|FLASK REACTOR DEPOSITS|2013
105
Figure 6.24: ESI (+) MS in the m/z 100-1000 for the methanol fraction of unstressed SME20.
SME
m/z100 150 200 250 300 350 400 450 500 550 600 650 700 750 800 850 900 950 1000
%
0
100IK_UCT_130227_1 20 (0.163) Cm (20:25-37:48) 1: TOF MS ES+
7.14e4349.2326
331.2243
295.2413
275.1642
263.2298
209.1177185.1141
144.0821
262.2201
261.1640
309.2390
379.2179
365.2435
381.2347
453.3293395.2226
411.2340
425.2752 675.5640454.3349
659.4750603.4767589.4648604.4775
705.4685739.5074 850.2690
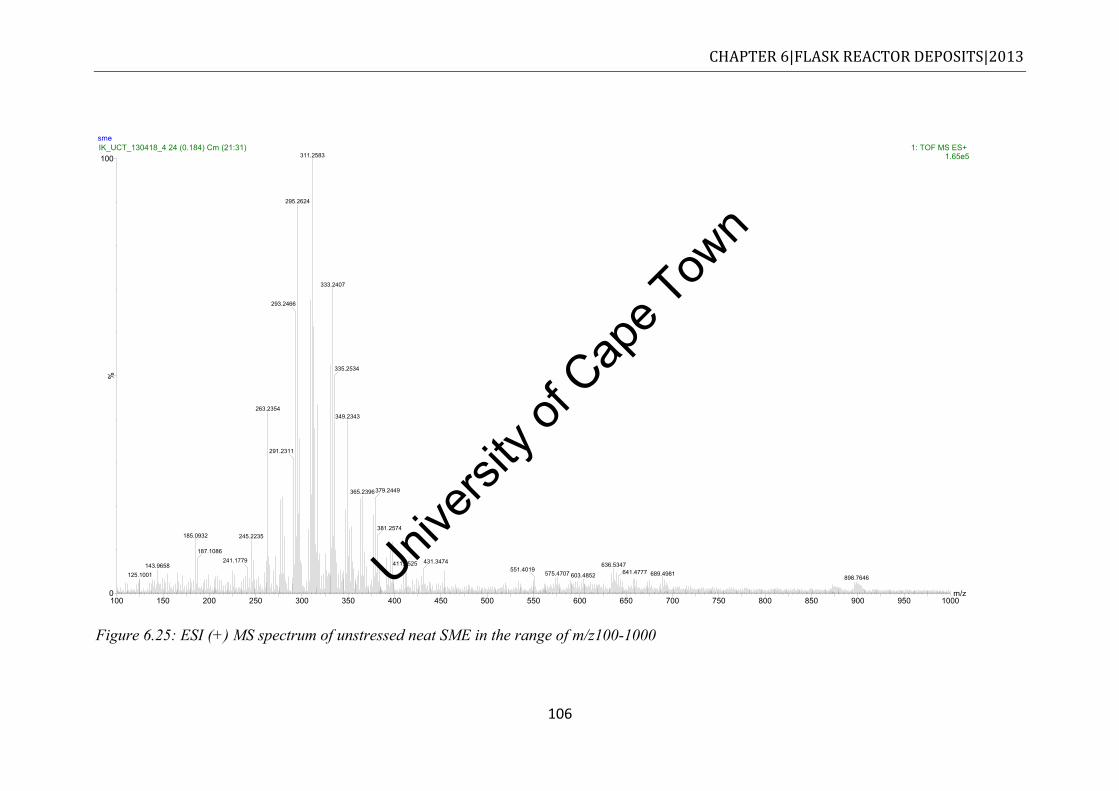
Univers
ity of
Cap
e Tow
n
CHAPTER 6|FLASK REACTOR DEPOSITS|2013
106
Figure 6.25: ESI (+) MS spectrum of unstressed neat SME in the range of m/z100-1000
sme
m/z100 150 200 250 300 350 400 450 500 550 600 650 700 750 800 850 900 950 1000
%
0
100IK_UCT_130418_4 24 (0.184) Cm (21:31) 1: TOF MS ES+
1.65e5311.2583
295.2624
293.2466
263.2354
185.0932
143.9658125.1001
245.2235
187.1086241.1779
291.2311
333.2407
335.2534
349.2343
365.2396379.2449
381.2574
411.2525 636.5347431.3474
575.4707551.4019
603.4852 641.4777 689.4981898.7646
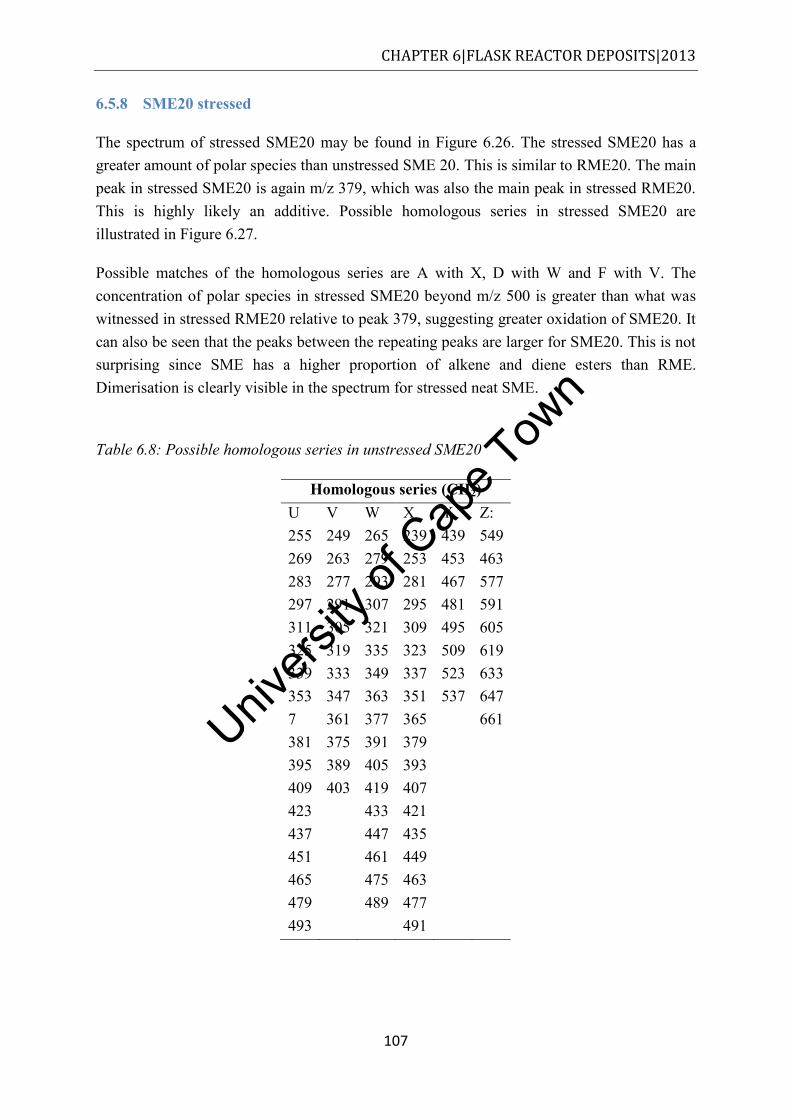
Univers
ity of
Cap
e Tow
n
CHAPTER 6|FLASK REACTOR DEPOSITS|2013
107
6.5.8 SME20 stressed
The spectrum of stressed SME20 may be found in Figure 6.26. The stressed SME20 has a greater amount of polar species than unstressed SME 20. This is similar to RME20. The main peak in stressed SME20 is again m/z 379, which was also the main peak in stressed RME20. This is highly likely an additive. Possible homologous series in stressed SME20 are illustrated in Figure 6.27.
Possible matches of the homologous series are A with X, D with W and F with V. The concentration of polar species in stressed SME20 beyond m/z 500 is greater than what was witnessed in stressed RME20 relative to peak 379, suggesting greater oxidation of SME20. It can also be seen that the peaks between the repeating peaks are larger for SME20. This is not surprising since SME has a higher proportion of alkene and diene esters than RME. Dimerisation is clearly visible in the spectrum for stressed neat SME.
Table 6.8: Possible homologous series in unstressed SME20
Homologous series (CH2) U V W X Y Z: 255 249 265 239 439 549 269 263 279 253 453 463 283 277 293 281 467 577 297 291 307 295 481 591 311 305 321 309 495 605 325 319 335 323 509 619 339 333 349 337 523 633 353 347 363 351 537 647 7 361 377 365 661 381 375 391 379 395 389 405 393 409 403 419 407 423 433 421 437 447 435 451 461 449 465 475 463 479 489 477 493 491
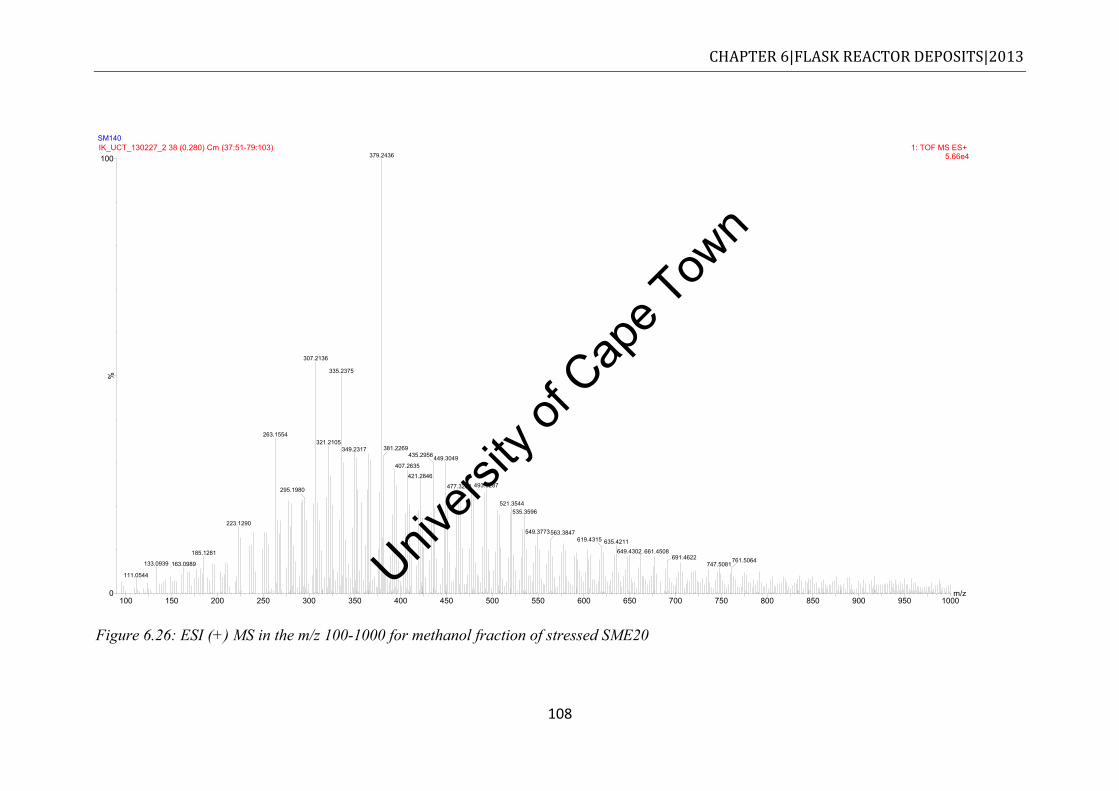
Univers
ity of
Cap
e Tow
n
CHAPTER 6|FLASK REACTOR DEPOSITS|2013
108
Figure 6.26: ESI (+) MS in the m/z 100-1000 for methanol fraction of stressed SME20
SM140
m/z100 150 200 250 300 350 400 450 500 550 600 650 700 750 800 850 900 950 1000
%
0
100IK_UCT_130227_2 38 (0.280) Cm (37:51-79:103) 1: TOF MS ES+
5.66e4379.2436
307.2136
263.1554
223.1290
185.1281
133.0939
111.0544
163.0989
295.1980
335.2375
321.2105349.2317 381.2269
449.3049435.2956
407.2635
421.2846493.3287477.3268
521.3544535.3596
549.3773563.3847635.4211619.4315
649.4302 661.4508691.4622
747.5081761.5064
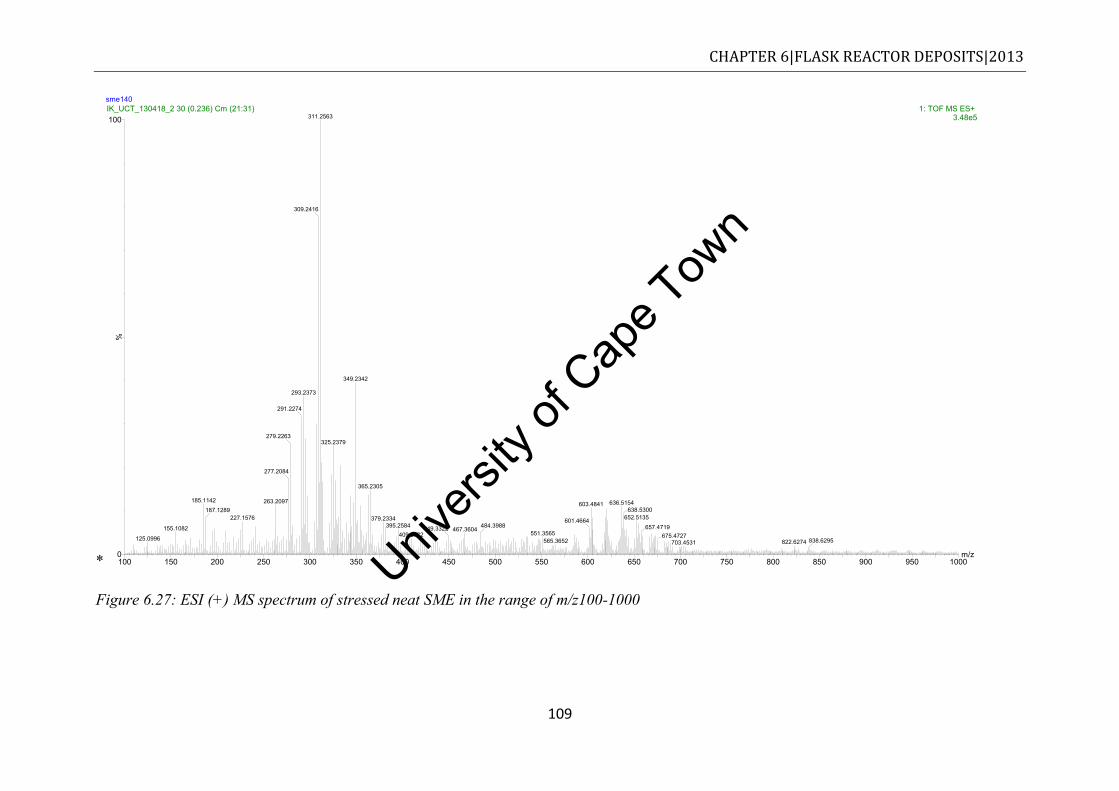
Univers
ity of
Cap
e Tow
n
CHAPTER 6|FLASK REACTOR DEPOSITS|2013
109
*
Figure 6.27: ESI (+) MS spectrum of stressed neat SME in the range of m/z100-1000
sme140
m/z100 150 200 250 300 350 400 450 500 550 600 650 700 750 800 850 900 950 1000
%
0
100IK_UCT_130418_2 30 (0.236) Cm (21:31) 1: TOF MS ES+
3.48e5311.2563
309.2416
293.2373
291.2274
279.2263
277.2084
185.1142
155.1082
125.0996
263.2097187.1289
227.1576
349.2342
325.2379
365.2305
636.5154603.4841
379.2334 601.4664395.2584 467.3604449.3322
409.2772484.3988
551.3565565.3652
638.5300652.5135
657.4719675.4727
822.6274703.4531 838.6295
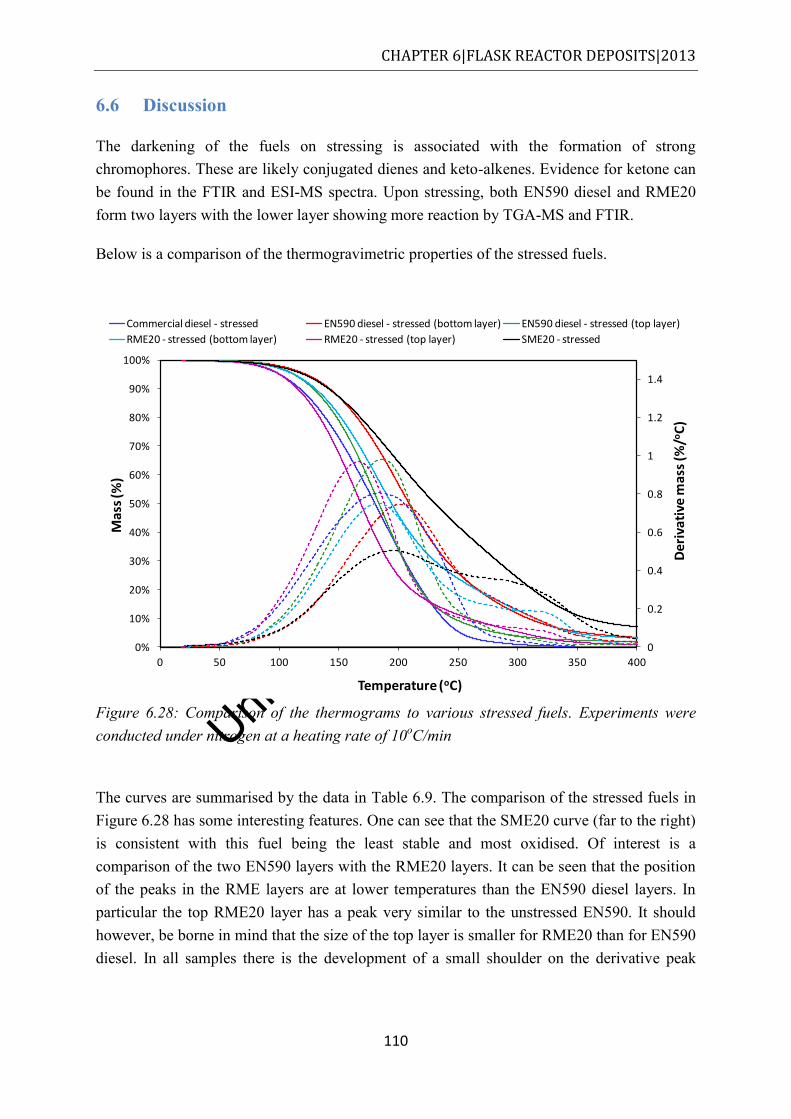
Univers
ity of
Cap
e Tow
n
CHAPTER 6|FLASK REACTOR DEPOSITS|2013
110
6.6 Discussion
The darkening of the fuels on stressing is associated with the formation of strong chromophores. These are likely conjugated dienes and keto-alkenes. Evidence for ketone can be found in the FTIR and ESI-MS spectra. Upon stressing, both EN590 diesel and RME20 form two layers with the lower layer showing more reaction by TGA-MS and FTIR.
Below is a comparison of the thermogravimetric properties of the stressed fuels.
Figure 6.28: Comparison of the thermograms to various stressed fuels. Experiments were conducted under nitrogen at a heating rate of 10oC/min
The curves are summarised by the data in Table 6.9. The comparison of the stressed fuels in Figure 6.28 has some interesting features. One can see that the SME20 curve (far to the right) is consistent with this fuel being the least stable and most oxidised. Of interest is a comparison of the two EN590 layers with the RME20 layers. It can be seen that the position of the peaks in the RME layers are at lower temperatures than the EN590 diesel layers. In particular the top RME20 layer has a peak very similar to the unstressed EN590. It should however, be borne in mind that the size of the top layer is smaller for RME20 than for EN590 diesel. In all samples there is the development of a small shoulder on the derivative peak
0
0.2
0.4
0.6
0.8
1
1.2
1.4
0%
10%
20%
30%
40%
50%
60%
70%
80%
90%
100%
0 50 100 150 200 250 300 350 400
Der
ivat
ive
mas
s (%
/oC
)
Ma
ss (%
)
Temperature (oC)
Commercial diesel - stressed EN590 diesel - stressed (bottom layer) EN590 diesel - stressed (top layer)
RME20 - stressed (bottom layer) RME20 - stressed (top layer) SME20 - stressed
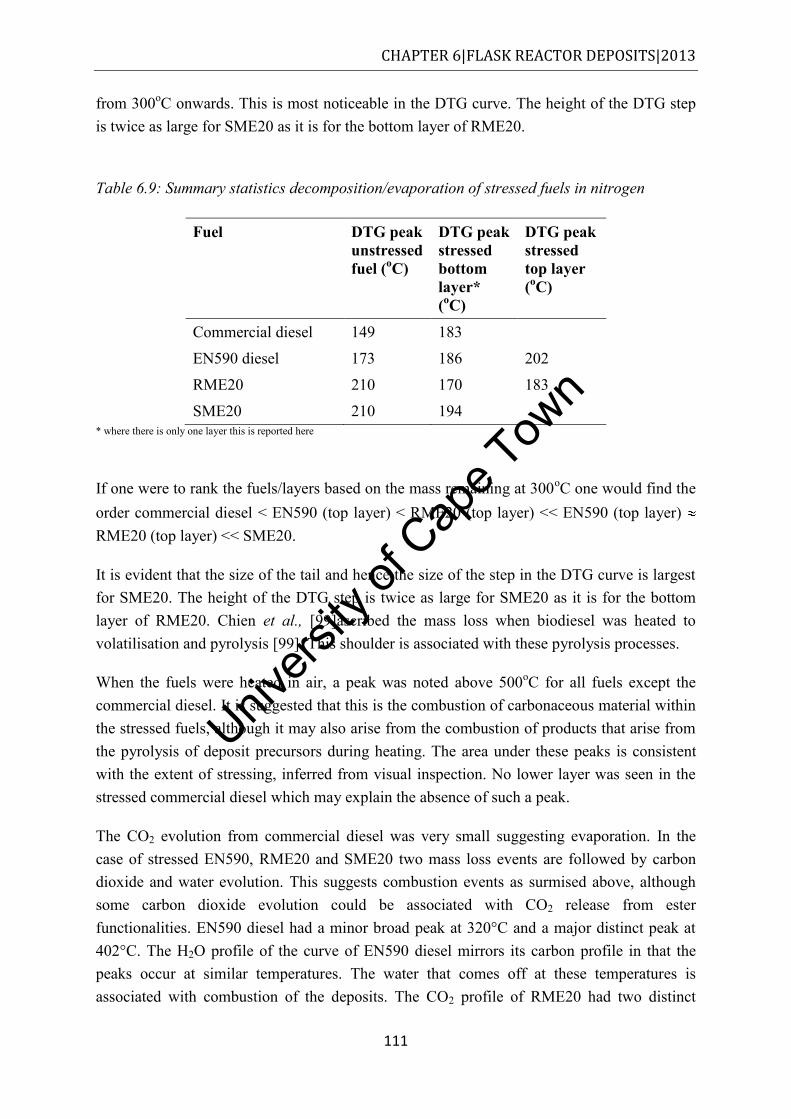
Univers
ity of
Cap
e Tow
n
CHAPTER 6|FLASK REACTOR DEPOSITS|2013
111
from 300oC onwards. This is most noticeable in the DTG curve. The height of the DTG step is twice as large for SME20 as it is for the bottom layer of RME20.
Table 6.9: Summary statistics decomposition/evaporation of stressed fuels in nitrogen
Fuel DTG peak unstressed fuel (oC)
DTG peak stressed bottom layer* (oC)
DTG peak stressed top layer (oC)
Commercial diesel 149 183
EN590 diesel 173 186 202
RME20 210 170 183
SME20 210 194 * where there is only one layer this is reported here
If one were to rank the fuels/layers based on the mass remaining at 300oC one would find the order commercial diesel < EN590 (top layer) < RME20 (top layer) << EN590 (top layer) RME20 (top layer) << SME20.
It is evident that the size of the tail and hence the size of the step in the DTG curve is largest for SME20. The height of the DTG step is twice as large for SME20 as it is for the bottom layer of RME20. Chien et al., [99]ascribed the mass loss when biodiesel was heated to volatilisation and pyrolysis [99]. This shoulder is associated with these pyrolysis processes.
When the fuels were heated in air, a peak was noted above 500oC for all fuels except the commercial diesel. It is suggested that this is the combustion of carbonaceous material within the stressed fuels, although it may also arise from the combustion of products that arise from the pyrolysis of deposit precursors during heating. The area under these peaks is consistent with the extent of stressing, inferred from visual inspection. No lower layer was seen in the stressed commercial diesel which may explain the absence of such a peak.
The CO2 evolution from commercial diesel was very small suggesting evaporation. In the case of stressed EN590, RME20 and SME20 two mass loss events are followed by carbon dioxide and water evolution. This suggests combustion events as surmised above, although some carbon dioxide evolution could be associated with CO2 release from ester functionalities. EN590 diesel had a minor broad peak at 320°C and a major distinct peak at 402°C. The H2O profile of the curve of EN590 diesel mirrors its carbon profile in that the peaks occur at similar temperatures. The water that comes off at these temperatures is associated with combustion of the deposits. The CO2 profile of RME20 had two distinct
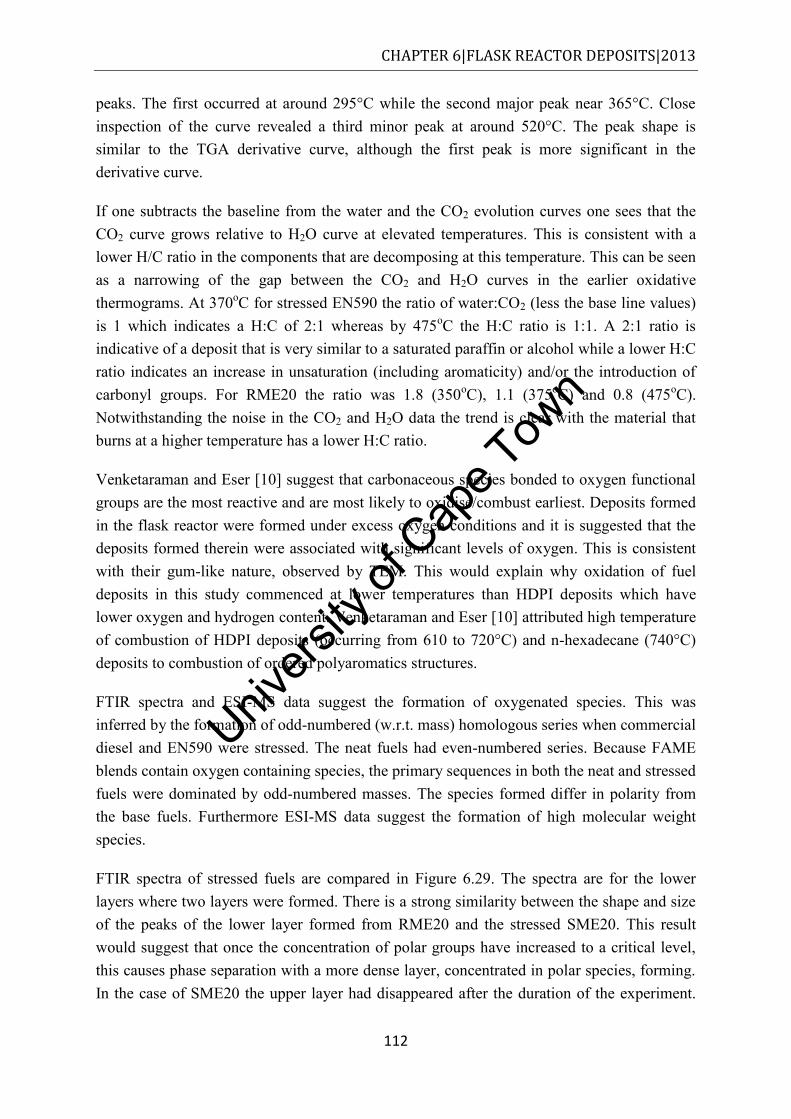
Univers
ity of
Cap
e Tow
n
CHAPTER 6|FLASK REACTOR DEPOSITS|2013
112
peaks. The first occurred at around 295°C while the second major peak near 365°C. Close inspection of the curve revealed a third minor peak at around 520°C. The peak shape is similar to the TGA derivative curve, although the first peak is more significant in the derivative curve.
If one subtracts the baseline from the water and the CO2 evolution curves one sees that the CO2 curve grows relative to H2O curve at elevated temperatures. This is consistent with a lower H/C ratio in the components that are decomposing at this temperature. This can be seen as a narrowing of the gap between the CO2 and H2O curves in the earlier oxidative thermograms. At 370oC for stressed EN590 the ratio of water:CO2 (less the base line values) is 1 which indicates a H:C of 2:1 whereas by 475oC the H:C ratio is 1:1. A 2:1 ratio is indicative of a deposit that is very similar to a saturated paraffin or alcohol while a lower H:C ratio indicates an increase in unsaturation (including aromaticity) and/or the introduction of carbonyl groups. For RME20 the ratio was 1.8 (350oC), 1.1 (375oC) and 0.8 (475oC). Notwithstanding the noise in the CO2 and H2O data the trend is clear with the material that burns at a higher temperature has a lower H:C ratio.
Venketaraman and Eser [10] suggest that carbonaceous species bonded to oxygen functional groups are the most reactive and are most likely to oxidise/combust earliest. Deposits formed in the flask reactor were formed under excess oxygen conditions and it is suggested that the deposits formed therein were associated with significant levels of oxygen. This is consistent with their gum-like nature, observed by TEM. This would explain why oxidation of fuel deposits in this study commenced at lower temperatures than HDPI deposits which have lower oxygen and hydrogen content. Venketaraman and Eser [10] attributed high temperature of combustion of HDPI deposits (occurring from 610 to 720°C) and n-hexadecane (740°C) deposits to combustion of ordered polyaromatics structures.
FTIR spectra and ESI-MS data suggest the formation of oxygenated species. This was inferred by the formation of odd-numbered (w.r.t. mass) homologous series when commercial diesel and EN590 were stressed. The neat fuels had even-numbered series. Because FAME blends contain oxygen containing species, the primary sequences in both the neat and stressed fuels were dominated by odd-numbered masses. The species formed differ in polarity from the base fuels. Furthermore ESI-MS data suggest the formation of high molecular weight species.
FTIR spectra of stressed fuels are compared in Figure 6.29. The spectra are for the lower layers where two layers were formed. There is a strong similarity between the shape and size of the peaks of the lower layer formed from RME20 and the stressed SME20. This result would suggest that once the concentration of polar groups have increased to a critical level, this causes phase separation with a more dense layer, concentrated in polar species, forming. In the case of SME20 the upper layer had disappeared after the duration of the experiment.
Univers
ity of
Cap
e Tow
n
CHAPTER 6|FLASK REACTOR DEPOSITS|2013
113
The high molecular mass and polarity of these species would make it difficult for the base fuels to retain them in solution.
Figure 6.29: Comparison of the FTIR spectra of stressed fuels
Stressing diesel fuel leads to the formation of higher molecular weight species. The molecular weight distribution varies depending on the test fuel, however all stressed diesel fuels portrayed species with significantly higher molecular weight distribution than stressed jet fuel. Although ESI (+) MS shows strong capability as a diagnostic tool for tracking evolution of polar species in fuels, biodiesel blends showed that it is biased towards particular molecules. When biodiesel was blended with EN590 diesel, the peaks that had the greatest intensity in the spectrum emanated from the biodiesel component of the blend, even though, in both cases, the biodiesel component only accounted for 20%. This is not surprising given the presence of oxygen in the FAME constituent molecules.
Univers
ity of
Cap
e Tow
n
CHAPTER 6|FLASK REACTOR DEPOSITS|2013
114
6.7 Conclusions
Visual inspections, TGA thermograms, FTIR spectra and ESI-MS all suggest that SME20 experiences greater reaction under oxidative stressing and is thus less stable at elevated temperatures with flowing oxygen than RME20, EN590 diesel and commercial diesel. The order of stability is commercial diesel > EN590 diesel > RME20 > SME20. These results are in agreement with those obtained from the QCM, even though that study was performed under oxygen-limited conditions. The species that were formed were higher in molecular mass and polar in nature containing increased levels of oxygen.
The analysis of reactor deposits suggests that TGA may be used to monitor the oxidative degradation of fuels, in particular those containing FAME. While beyond the scope of this study, it is possible that TGA thermograms could be used with stressing experiments of different duration to provide kinetic data for the analysis of oxidation. This could be coupled with FTIR information, e.g. the growth of C=O bands. Importantly TGA could provide a handy method of tracking high molecular weight species by concentrating on the mass of sample that decomposes above 300oC.
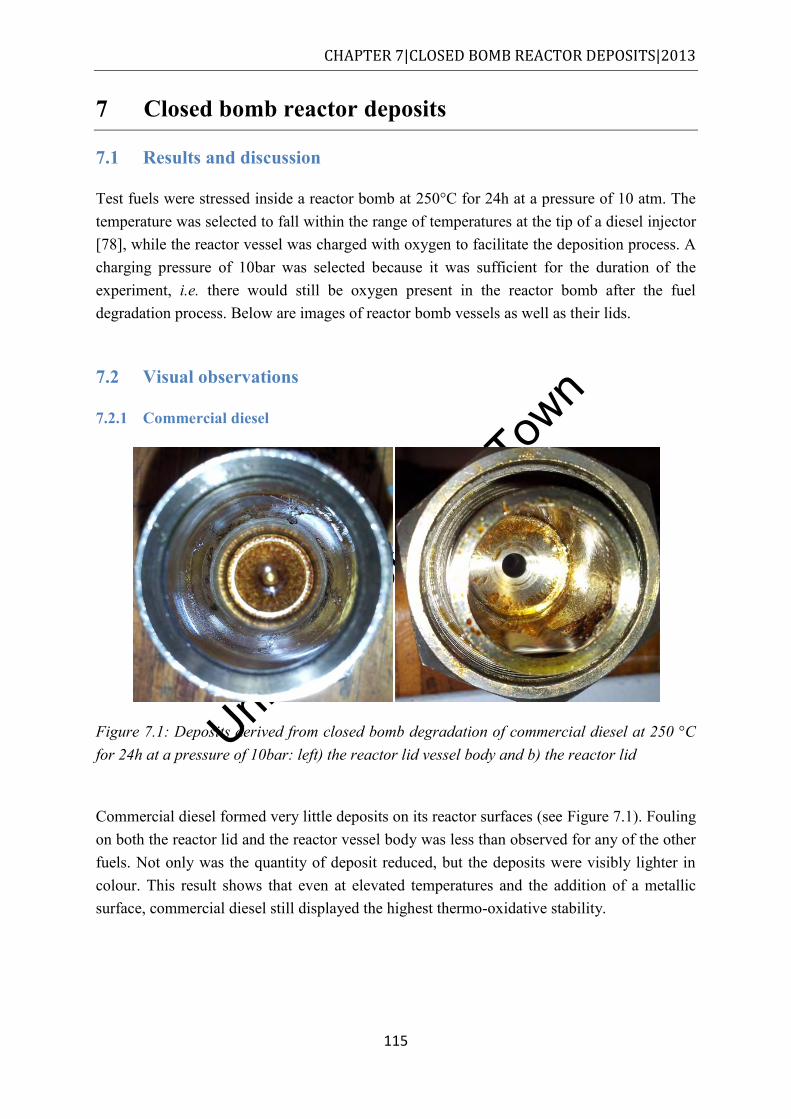
Univers
ity of
Cap
e Tow
n
CHAPTER 7|CLOSED BOMB REACTOR DEPOSITS|2013
115
7 Closed bomb reactor deposits
7.1 Results and discussion
Test fuels were stressed inside a reactor bomb at 250°C for 24h at a pressure of 10 atm. The temperature was selected to fall within the range of temperatures at the tip of a diesel injector [78], while the reactor vessel was charged with oxygen to facilitate the deposition process. A charging pressure of 10bar was selected because it was sufficient for the duration of the experiment, i.e. there would still be oxygen present in the reactor bomb after the fuel degradation process. Below are images of reactor bomb vessels as well as their lids.
7.2 Visual observations
7.2.1 Commercial diesel
Figure 7.1: Deposits derived from closed bomb degradation of commercial diesel at 250 °C for 24h at a pressure of 10bar: left) the reactor lid vessel body and b) the reactor lid
Commercial diesel formed very little deposits on its reactor surfaces (see Figure 7.1). Fouling on both the reactor lid and the reactor vessel body was less than observed for any of the other fuels. Not only was the quantity of deposit reduced, but the deposits were visibly lighter in colour. This result shows that even at elevated temperatures and the addition of a metallic surface, commercial diesel still displayed the highest thermo-oxidative stability.
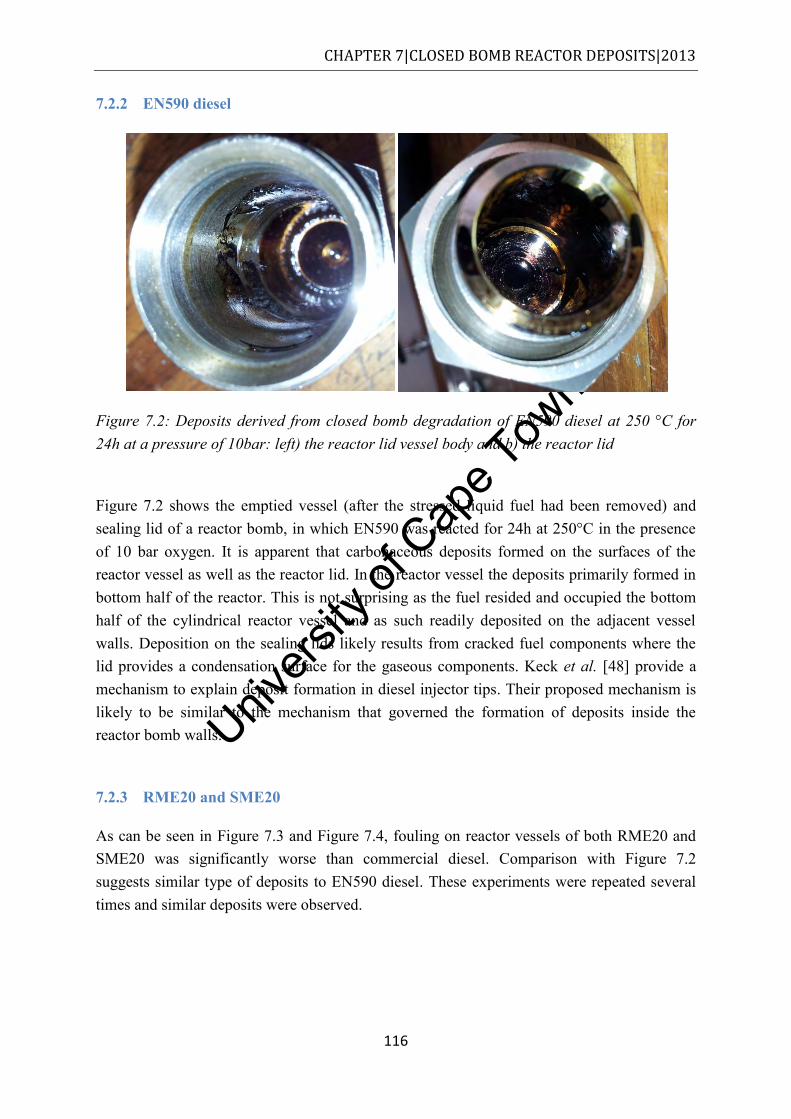
Univers
ity of
Cap
e Tow
n
CHAPTER 7|CLOSED BOMB REACTOR DEPOSITS|2013
116
7.2.2 EN590 diesel
Figure 7.2: Deposits derived from closed bomb degradation of EN590 diesel at 250 °C for 24h at a pressure of 10bar: left) the reactor lid vessel body and b) the reactor lid
Figure 7.2 shows the emptied vessel (after the stressed liquid fuel had been removed) and sealing lid of a reactor bomb, in which EN590 was reacted for 24h at 250°C in the presence of 10 bar oxygen. It is apparent that carbonaceous deposits formed on the surfaces of the reactor vessel as well as the reactor lid. In the reactor vessel the deposits primarily formed in bottom half of the reactor. This is not surprising as the fuel resided and occupied the bottom half of the cylindrical reactor vessel and as such readily deposited on the adjacent vessel walls. Deposition on the sealing lids likely results from cracked fuel components where the lid provides a condensation surface for the gaseous components. Keck et al. [48] provide a mechanism to explain deposit formation in diesel injector tips. Their proposed mechanism is likely to be similar to the mechanism that governed the formation of deposits inside the reactor bomb walls.
7.2.3 RME20 and SME20
As can be seen in Figure 7.3 and Figure 7.4, fouling on reactor vessels of both RME20 and SME20 was significantly worse than commercial diesel. Comparison with Figure 7.2 suggests similar type of deposits to EN590 diesel. These experiments were repeated several times and similar deposits were observed.
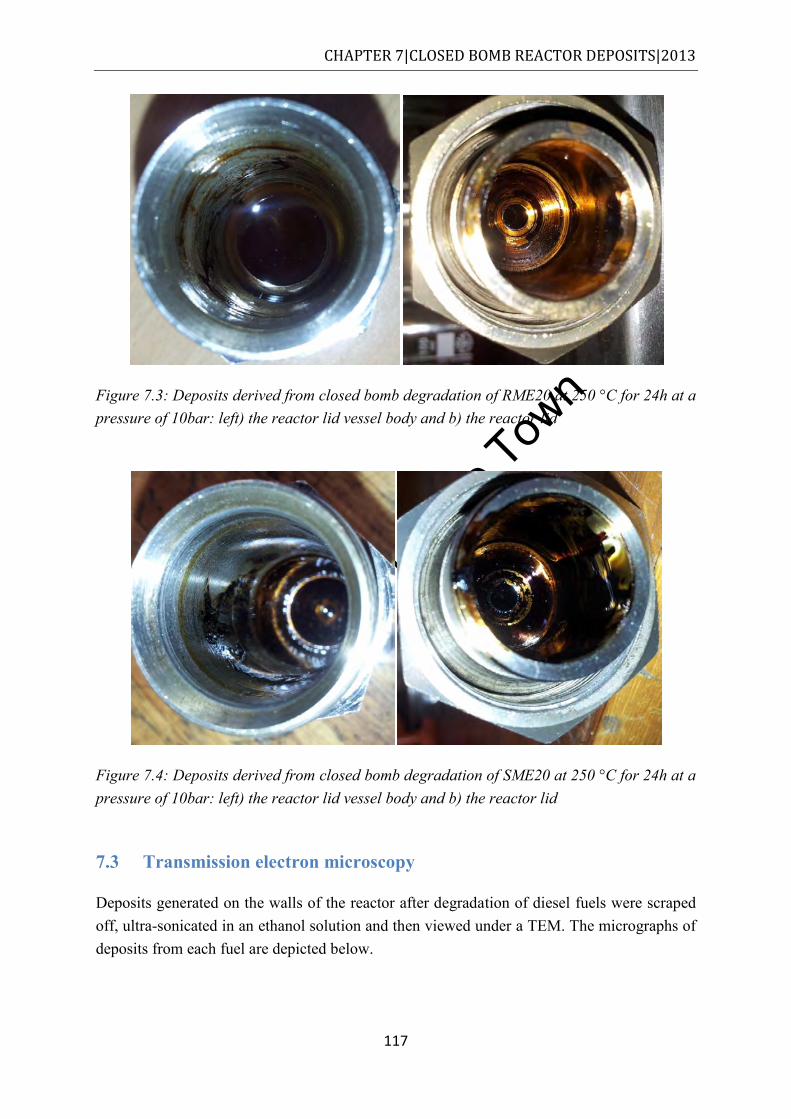
Univers
ity of
Cap
e Tow
n
CHAPTER 7|CLOSED BOMB REACTOR DEPOSITS|2013
117
Figure 7.3: Deposits derived from closed bomb degradation of RME20 at 250 °C for 24h at a pressure of 10bar: left) the reactor lid vessel body and b) the reactor lid
Figure 7.4: Deposits derived from closed bomb degradation of SME20 at 250 °C for 24h at a pressure of 10bar: left) the reactor lid vessel body and b) the reactor lid
7.3 Transmission electron microscopy
Deposits generated on the walls of the reactor after degradation of diesel fuels were scraped off, ultra-sonicated in an ethanol solution and then viewed under a TEM. The micrographs of deposits from each fuel are depicted below.
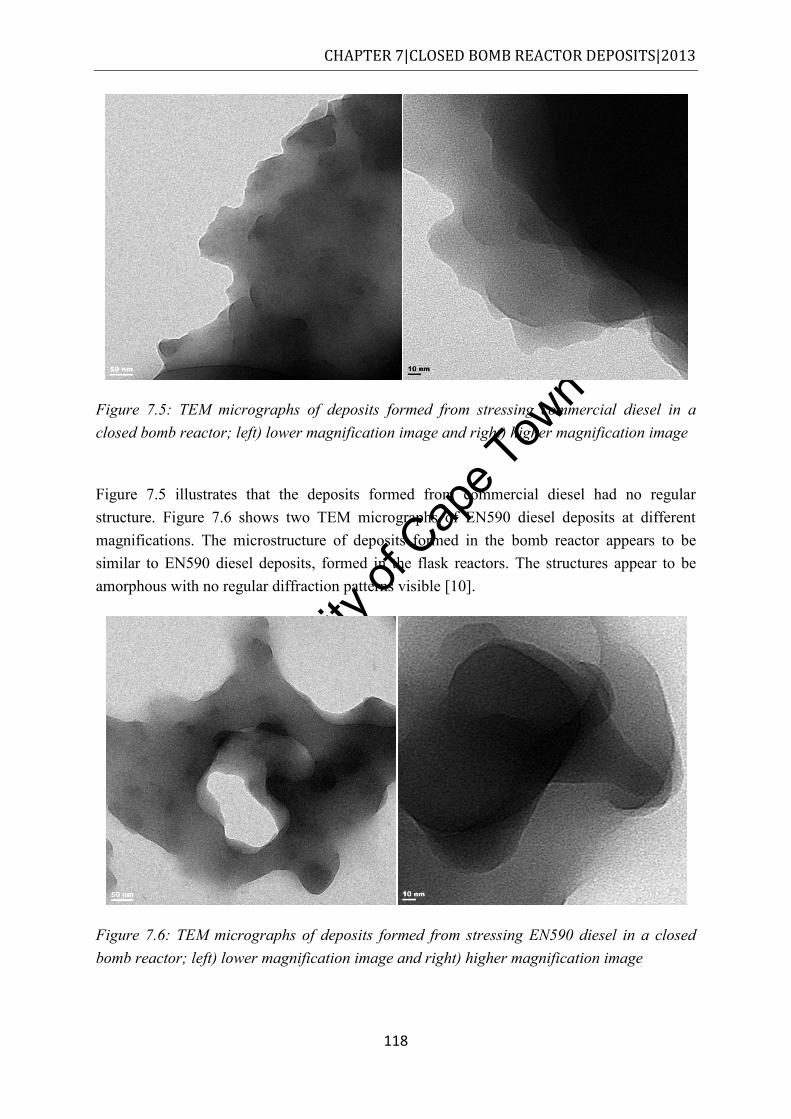
Univers
ity of
Cap
e Tow
n
CHAPTER 7|CLOSED BOMB REACTOR DEPOSITS|2013
118
Figure 7.5: TEM micrographs of deposits formed from stressing commercial diesel in a closed bomb reactor; left) lower magnification image and right) higher magnification image
Figure 7.5 illustrates that the deposits formed from commercial diesel had no regular structure. Figure 7.6 shows two TEM micrographs of EN590 diesel deposits at different magnifications. The microstructure of deposits formed in the bomb reactor appears to be similar to EN590 diesel deposits, formed in the flask reactors. The structures appear to be amorphous with no regular diffraction patterns visible [10].
Figure 7.6: TEM micrographs of deposits formed from stressing EN590 diesel in a closed bomb reactor; left) lower magnification image and right) higher magnification image
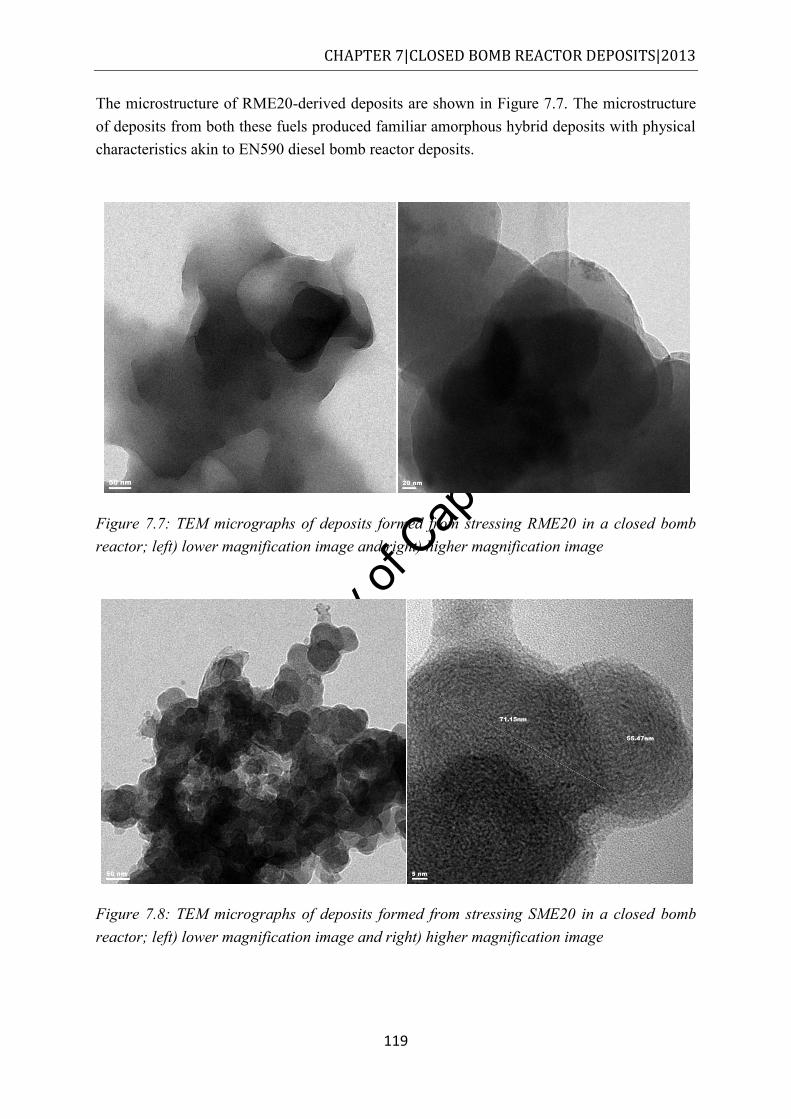
Univers
ity of
Cap
e Tow
n
CHAPTER 7|CLOSED BOMB REACTOR DEPOSITS|2013
119
The microstructure of RME20-derived deposits are shown in Figure 7.7. The microstructure of deposits from both these fuels produced familiar amorphous hybrid deposits with physical characteristics akin to EN590 diesel bomb reactor deposits.
Figure 7.7: TEM micrographs of deposits formed from stressing RME20 in a closed bomb reactor; left) lower magnification image and right) higher magnification image
Figure 7.8: TEM micrographs of deposits formed from stressing SME20 in a closed bomb reactor; left) lower magnification image and right) higher magnification image
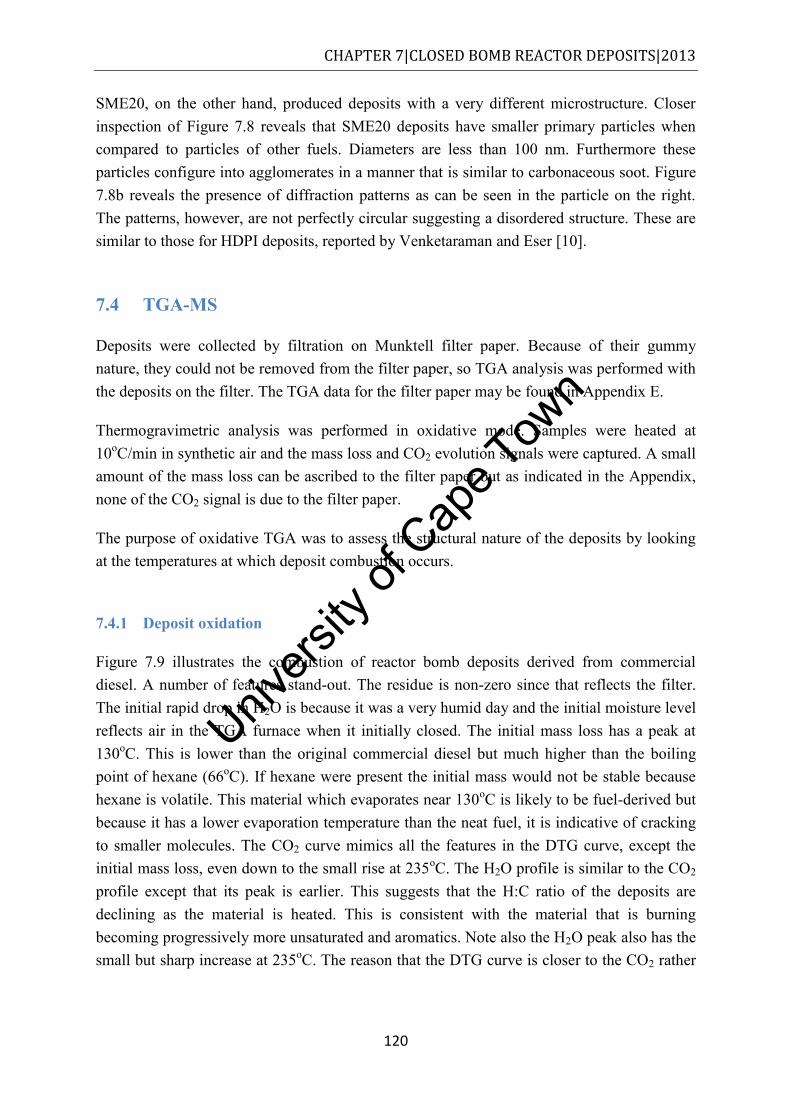
Univers
ity of
Cap
e Tow
n
CHAPTER 7|CLOSED BOMB REACTOR DEPOSITS|2013
120
SME20, on the other hand, produced deposits with a very different microstructure. Closer inspection of Figure 7.8 reveals that SME20 deposits have smaller primary particles when compared to particles of other fuels. Diameters are less than 100 nm. Furthermore these particles configure into agglomerates in a manner that is similar to carbonaceous soot. Figure 7.8b reveals the presence of diffraction patterns as can be seen in the particle on the right. The patterns, however, are not perfectly circular suggesting a disordered structure. These are similar to those for HDPI deposits, reported by Venketaraman and Eser [10].
7.4 TGA-MS
Deposits were collected by filtration on Munktell filter paper. Because of their gummy nature, they could not be removed from the filter paper, so TGA analysis was performed with the deposits on the filter. The TGA data for the filter paper may be found in Appendix E.
Thermogravimetric analysis was performed in oxidative mode. Samples were heated at 10oC/min in synthetic air and the mass loss and CO2 evolution signals were captured. A small amount of the mass loss can be ascribed to the filter paper but as indicated in the Appendix, none of the CO2 signal is due to the filter paper.
The purpose of oxidative TGA was to assess the structural nature of the deposits by looking at the temperatures at which deposit combustion occurs.
7.4.1 Deposit oxidation
Figure 7.9 illustrates the combustion of reactor bomb deposits derived from commercial diesel. A number of features stand-out. The residue is non-zero since that reflects the filter. The initial rapid drop in H2O is because it was a very humid day and the initial moisture level reflects air in the TGA furnace when it initially closed. The initial mass loss has a peak at 130oC. This is lower than the original commercial diesel but much higher than the boiling point of hexane (66oC). If hexane were present the initial mass would not be stable because hexane is volatile. This material which evaporates near 130oC is likely to be fuel-derived but because it has a lower evaporation temperature than the neat fuel, it is indicative of cracking to smaller molecules. The CO2 curve mimics all the features in the DTG curve, except the initial mass loss, even down to the small rise at 235oC. The H2O profile is similar to the CO2 profile except that its peak is earlier. This suggests that the H:C ratio of the deposits are declining as the material is heated. This is consistent with the material that is burning becoming progressively more unsaturated and aromatics. Note also the H2O peak also has the small but sharp increase at 235oC. The reason that the DTG curve is closer to the CO2 rather
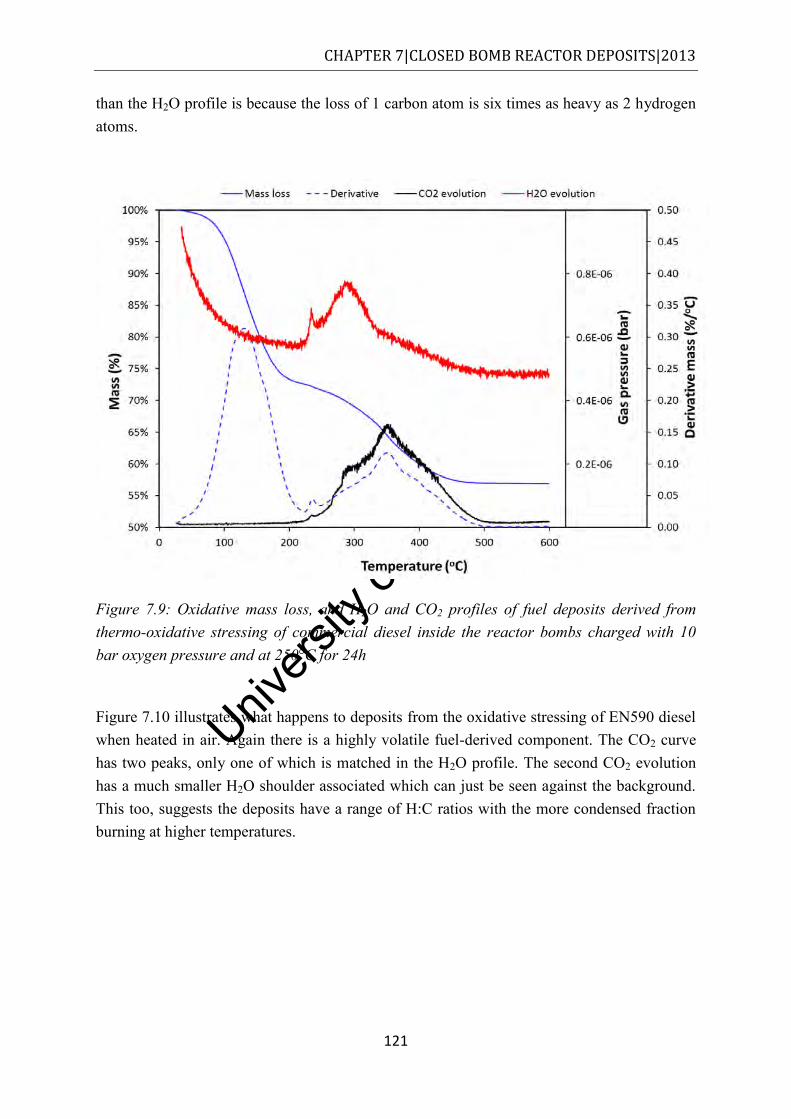
Univers
ity of
Cap
e Tow
n
CHAPTER 7|CLOSED BOMB REACTOR DEPOSITS|2013
121
than the H2O profile is because the loss of 1 carbon atom is six times as heavy as 2 hydrogen atoms.
Figure 7.9: Oxidative mass loss, and H2O and CO2 profiles of fuel deposits derived from thermo-oxidative stressing of commercial diesel inside the reactor bombs charged with 10 bar oxygen pressure and at 250°C for 24h
Figure 7.10 illustrates what happens to deposits from the oxidative stressing of EN590 diesel when heated in air. Again there is a highly volatile fuel-derived component. The CO2 curve has two peaks, only one of which is matched in the H2O profile. The second CO2 evolution has a much smaller H2O shoulder associated which can just be seen against the background. This too, suggests the deposits have a range of H:C ratios with the more condensed fraction burning at higher temperatures.
Univers
ity of
Cap
e Tow
n
CHAPTER 7|CLOSED BOMB REACTOR DEPOSITS|2013
122
Figure 7.10: Oxidative mass loss, and H2O and CO2 profiles of fuel deposits derived from thermo-oxidative stressing of EN590 diesel inside the reactor bombs charged with 10 bar oxygen pressure and at 250°C for 24h
Figure 7.11 shows a comparison between the evolved gas profiles of deposits formed from the stressing of RME20. The correlation between the DTG curve and the CO2 profile is striking. It can be seen that the DTG curve has two major peaks: one for volatile material and one for the carbonaceous deposits but that the latter has two shoulders. Careful perusal of the DTG curves for EN590 and commercial diesel reveals the presence of two shoulders in those curves too. There are two peaks in the H2O profile at similar temperatures to the main CO2 evolution peak and one of its shoulders. However, the height of the second H2O peak is similar to the first unlike CO2 in which the second peak is much larger. Again this demonstrates the increasing degree of unsaturation. The absence of H2O for the last shoulder suggests that the material is very unsaturated and likely implies the presence of condensed aromatic rings.
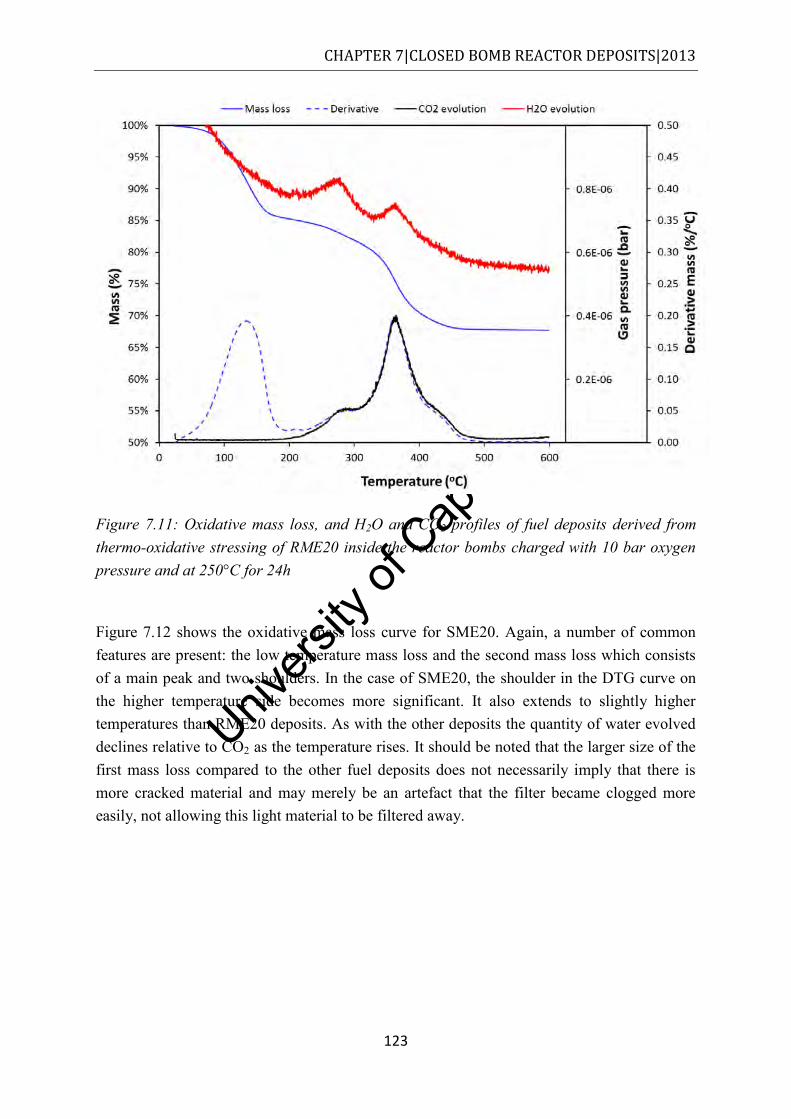
Univers
ity of
Cap
e Tow
n
CHAPTER 7|CLOSED BOMB REACTOR DEPOSITS|2013
123
Figure 7.11: Oxidative mass loss, and H2O and CO2 profiles of fuel deposits derived from thermo-oxidative stressing of RME20 inside the reactor bombs charged with 10 bar oxygen pressure and at 250°C for 24h
Figure 7.12 shows the oxidative mass loss curve for SME20. Again, a number of common features are present: the low temperature mass loss and the second mass loss which consists of a main peak and two shoulders. In the case of SME20, the shoulder in the DTG curve on the higher temperature side becomes more significant. It also extends to slightly higher temperatures than RME20 deposits. As with the other deposits the quantity of water evolved declines relative to CO2 as the temperature rises. It should be noted that the larger size of the first mass loss compared to the other fuel deposits does not necessarily imply that there is more cracked material and may merely be an artefact that the filter became clogged more easily, not allowing this light material to be filtered away.
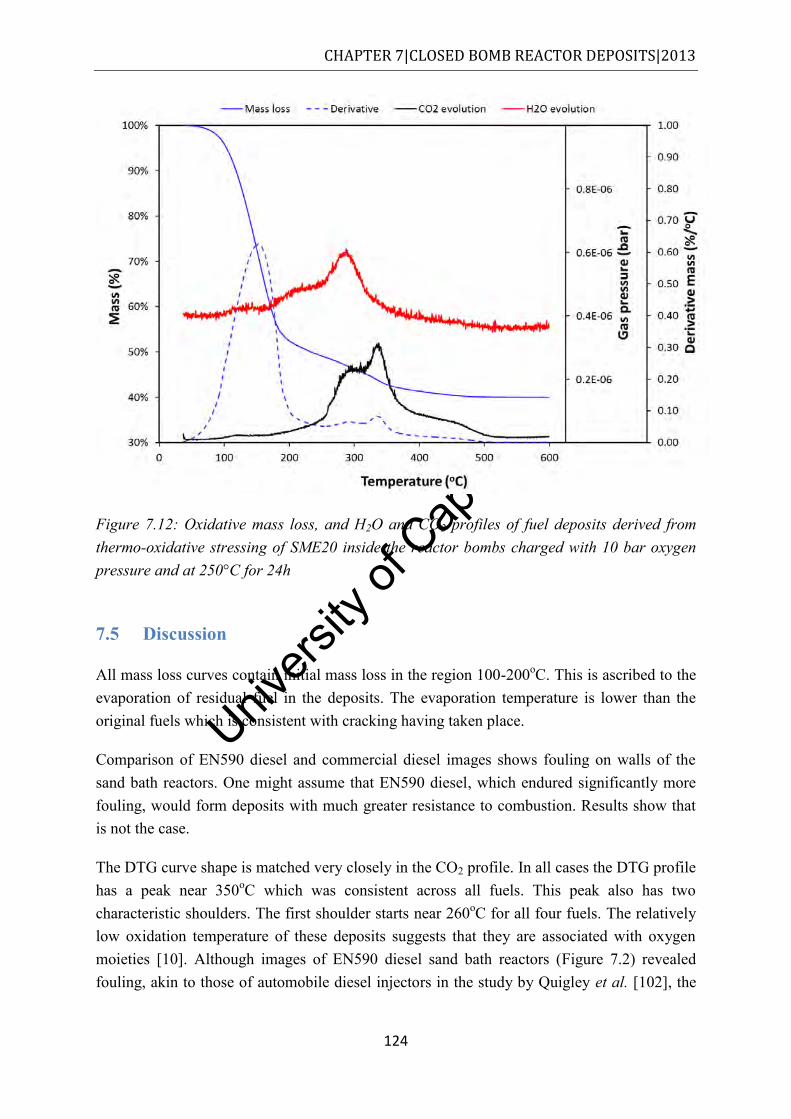
Univers
ity of
Cap
e Tow
n
CHAPTER 7|CLOSED BOMB REACTOR DEPOSITS|2013
124
Figure 7.12: Oxidative mass loss, and H2O and CO2 profiles of fuel deposits derived from thermo-oxidative stressing of SME20 inside the reactor bombs charged with 10 bar oxygen pressure and at 250°C for 24h
7.5 Discussion
All mass loss curves contain initial mass loss in the region 100-200oC. This is ascribed to the evaporation of residual fuel in the deposits. The evaporation temperature is lower than the original fuels which is consistent with cracking having taken place.
Comparison of EN590 diesel and commercial diesel images shows fouling on walls of the sand bath reactors. One might assume that EN590 diesel, which endured significantly more fouling, would form deposits with much greater resistance to combustion. Results show that is not the case.
The DTG curve shape is matched very closely in the CO2 profile. In all cases the DTG profile has a peak near 350oC which was consistent across all fuels. This peak also has two characteristic shoulders. The first shoulder starts near 260oC for all four fuels. The relatively low oxidation temperature of these deposits suggests that they are associated with oxygen moieties [10]. Although images of EN590 diesel sand bath reactors (Figure 7.2) revealed fouling, akin to those of automobile diesel injectors in the study by Quigley et al. [102], the
Univers
ity of
Cap
e Tow
n
CHAPTER 7|CLOSED BOMB REACTOR DEPOSITS|2013
125
combustibility of these deposits formed in the current study was higher, i.e. they burnt at lower temperatures. TGA-MS of diesel injector deposits was conducted by Venketaram and Eser [10]. The injector deposits had much higher thermal-oxidative stability than EN590 diesel sand bath deposits. It is likely that under injector conditions higher levels of carbonisation are achieved. Nonetheless, comparison of the H2O to CO2 profiles reveals that the deposits of all fuels have a range of H:C ratios with the lower H:C ratio components burning at higher temperatures. The last CO2 shoulder is associated with little H2O which suggests that there are polyaromatic rings in this component. The relative importance of this shoulder is greatest for SME20.
Altin and Eser [12] also noted the major CO2 evolution on metal surfaces (Inconel 600 and Inconel X) to be between 250 and 450oC when jet fuel was stressed. These measurements were made using a carbon analyser. In fact the Inconel X CO2 profile appeared to have a central peak and two shoulders as obtained here. These authors suggested that the low temperature peaks possibly contained significantly more hydrogen. This has been confirmed to be the case in this study. Some of the deposits studied by Gül et al., also had the characteristic two shoulders and a main peak in their TPO profile, despite having been produced at temperatures above 400oC [7].
It should be noted that, although the deposits’ thermal profiles are similar across the fuels, the quantity of deposits are not necessarily slow. Nonetheless the similarity of profiles suggest a similar progression of deposit formation.
7.6 Conclusions
The set of conditions in the sand bath reactor (250°C, 10 bar oxygen pressure for 24 h) led to fouling of the reactor vessels in all test fuels. Reactor vessel fouling was lowest for commercial diesel and greatest for SME20.
TEM micrographs elucidated the microstructure of fuel deposits and revealed that they were primarily amorphous in nature for commercial diesel, EN590 diesel and RME20 stressing. Some structure was noted in SME20 deposits, as indicated by the interference patterns that are visible. This would suggest that the greatest carbonisation had occurred in this sample.
Consistent with the visual and TEM observation was the observation that the deposits formed from SME20 has a greater fraction burning at higher temperatures (the final shoulder in the DTG curve was more prominent. This is consistent with more carbonised deposits, i.e. deposits containing less hydrogen and oxygen. It has been demonstrated that oxidative TGA with MS detection can provide information consistent with microscopy that is indicative of the degree of carbonisation of the deposit. The relationship between the DTG curves and the

Univers
ity of
Cap
e Tow
n
CHAPTER 7|CLOSED BOMB REACTOR DEPOSITS|2013
126
CO2 profile was striking and much stronger than what was observed for flask deposits. It should, however, be noted that the bulk of flask deposits burnt at lower temperatures and had much higher hydrogen content and likely less condensed structures.
Univers
ity of
Cap
e Tow
n
CHAPTER 8|FLOW REACTOR DEPOSITS|2013
127
8 Fuel degradation in a flow reactor
8.1 Results and discussion
A flow reactor was used for two reasons: 1) to stress diesel fuels under thermal-oxidative conditions similar to those used in the sand bath reactor and 2) to ascertain whether zinc (in solution with fuel) affects the depositing behaviour of fuels. Fuels were doped with 10ppm zinc neodecanoate because such doping has been shown to accelerate deposition [82, 83].
Table 8.1 indicates that no deposits that were discernible by digital microscope. No SEM and TEM analysis on the tubes were performed. TGA-MS analysis of small segments of the tubes yielded negligible mass loss while the MS detected no significant rise in CO2 pressure. Figure 8.1 is an image highlighting the typical appearance of sectioned reactor tubes post-stress. A small amount of yellow staining can be observed.
Table 8.1: Fuels tested and deposit character
Fuel Visible deposits (Microscope)
Gravimetric evidence of deposits (TGA-MS)
EN590 diesel No Negligible mass loss, no CO2 peak
RME20 No (yellow stains) Negligible mass loss, no CO2 peak
SME20 No ( yellow stains) Negligible mass loss, no CO2 peak
Commercial diesel No Negligible mass loss, no CO2 peak
EN590 (10ppm zinc) No Negligible mass loss, no CO2 peak
SME20(10ppm zinc) No (yellow stains) Negligible mass loss, no CO2 peak
All post stress sample tubes exhibited negligible mass loss during oxidative TGA analysis. No significant CO2 evolution was observed. Figure 8.2 presents an example thermogram and CO2 profile of a sectioned (3mm disk) reactor tube which ran EN590 10ppm zinc fuel. From this example it is noticeable that the tube experienced a very small mass loss up to 600°C. The total sample size was 84.301 mg. The observed mass loss of 0.096 is equivalent to 81 g which while small is detectable by the sensitive balance of the Q5000IR. However, at least half of this is associated with the loss of volatile components which is likely fuel. Compare Figure 6.5. The accompanying carbon evolution is very close to background because the mass of evolved compounds must be small as a result of the small mass of decomposable material. There may well be a slight rise in CO2 above 200oC which could be associated with fuel combustion but this could also be an artefact.
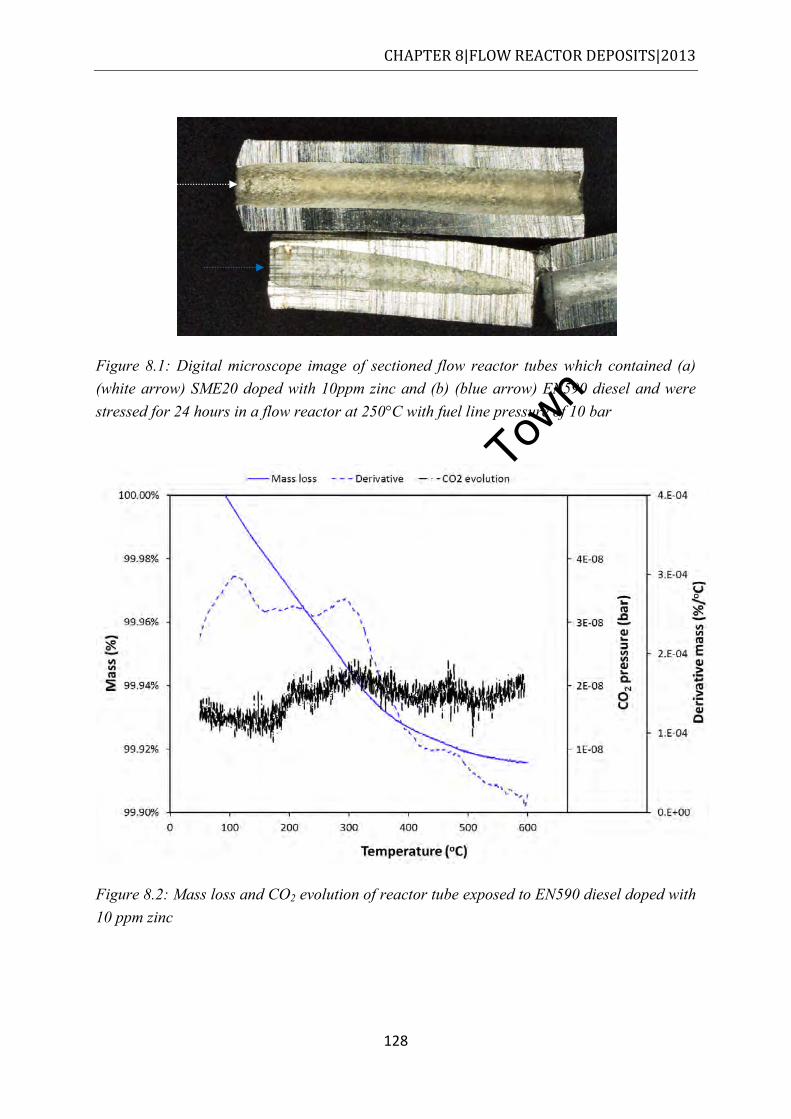
Univers
ity of
Cap
e Tow
n
CHAPTER 8|FLOW REACTOR DEPOSITS|2013
128
Figure 8.1: Digital microscope image of sectioned flow reactor tubes which contained (a) (white arrow) SME20 doped with 10ppm zinc and (b) (blue arrow) EN590 diesel and were stressed for 24 hours in a flow reactor at 250°C with fuel line pressure of 10 bar
Figure 8.2: Mass loss and CO2 evolution of reactor tube exposed to EN590 diesel doped with 10 ppm zinc
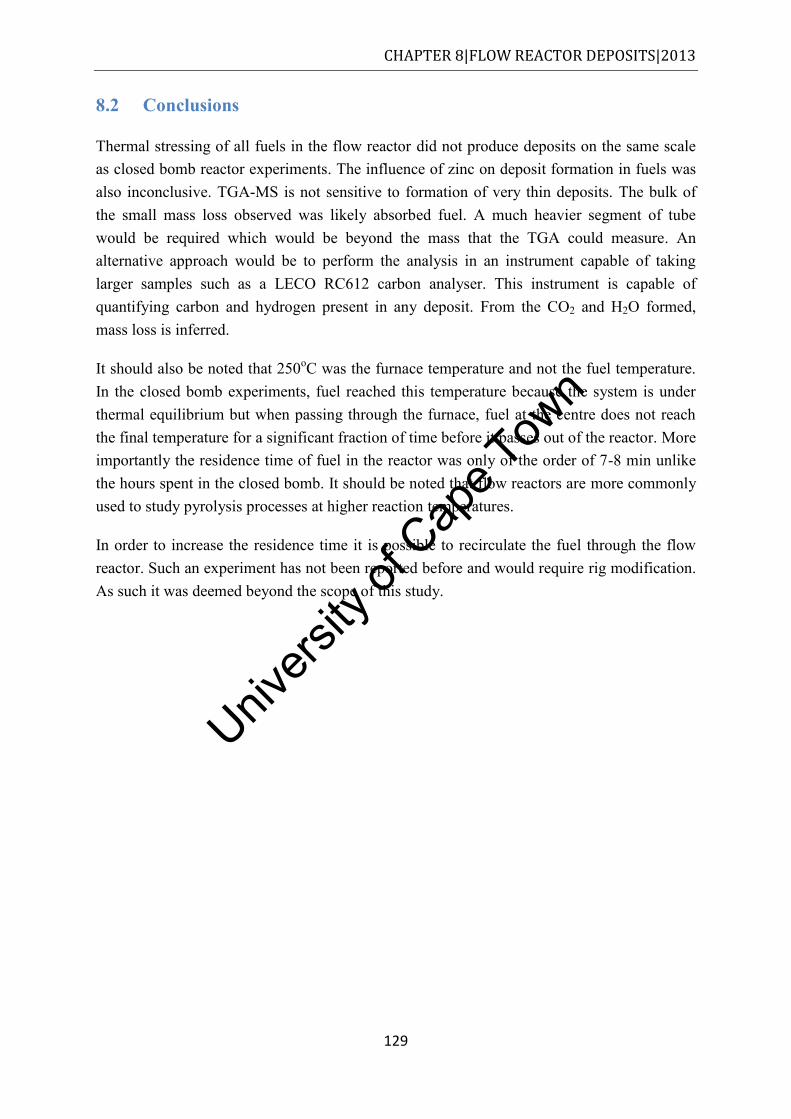
Univers
ity of
Cap
e Tow
n
CHAPTER 8|FLOW REACTOR DEPOSITS|2013
129
8.2 Conclusions
Thermal stressing of all fuels in the flow reactor did not produce deposits on the same scale as closed bomb reactor experiments. The influence of zinc on deposit formation in fuels was also inconclusive. TGA-MS is not sensitive to formation of very thin deposits. The bulk of the small mass loss observed was likely absorbed fuel. A much heavier segment of tube would be required which would be beyond the mass that the TGA could measure. An alternative approach would be to perform the analysis in an instrument capable of taking larger samples such as a LECO RC612 carbon analyser. This instrument is capable of quantifying carbon and hydrogen present in any deposit. From the CO2 and H2O formed, mass loss is inferred.
It should also be noted that 250oC was the furnace temperature and not the fuel temperature. In the closed bomb experiments, fuel reached this temperature because the system is under thermal equilibrium but when passing through the furnace, fuel at the centre does not reach the final temperature for a significant fraction of time before it passes out of the reactor. More importantly the residence time of fuel in the reactor was only of the order of 7-8 min unlike the hours spent in the closed bomb. It should be noted that flow reactors are more commonly used to study pyrolysis processes at higher reaction temperatures.
In order to increase the residence time it is possible to recirculate the fuel through the flow reactor. Such an experiment has not been reported before and would require rig modification. As such it was deemed beyond the scope of this study.
Univers
ity of
Cap
e Tow
n
CHAPTER 9|GENERAL CONCLUSIONS OF STUDY|2013
130
9 Conclusions
“Follow the evidence to where it leads, even if the conclusion is uncomfortable.”- Steven James, The Knight
It has been demonstrated that the extraction solvent has a significant impact on the quantity of SOF extracted from diesel soot and the chemical nature of this soot. Increasing solvent polarity led to an increase in the quantity of SOF. This is because many of the components in the SOF such as aromatic esters are polar and have a natural affinity for polar solvents, unlike paraffinic hydrocarbons which did not extract these species at all.
It is evident when comparing the characterisation in this study and previous studies that the importance of PAHs in the SOF of diesel soot has declined. This is ascribed to the use of cleaner diesel with lower PAHs and the replacement of mineral oil based lubricants with those based on synthetic stocks. Such lubricants are likely to reduce the loading on diesel particulate filters significantly. What has increased is the importance of esters, including phthalates. Since these are potential endocrine disruptors, this may warrant future studies. These esters are likely derived from synthetic lubricating oils which contain such compounds as additives.
PAHs were best extracted by acetone whereas methanol was better for the extraction of esters. This would suggest that the SOF is best characterised by a sequential extraction procedure of these two solvents.
A significant discrepancy between SOF and VOF, as determined by TGA, was observed. It is suggested that this is due to the presence of species which were not extracted by the organic solvents used. Likely candidates are sulfates, sulfurous and sulphuric acids derived from sulfur-containing diesel. This indicates that both methods are required for the full characterisation of soot. Thermogravimetric analysis also revealed that the soot formed consists of a multitude of carbonaceous forms. This was evidenced by three peaks in both the DTG and CO2 evolution curves when the soot was burnt in oxygen. These are likely material of increasing carbonisation.
Stressing diesel fuel under thermo-oxidative conditions can lead to the formation of deposits. All experiments and analysis techniques pointed to thermo-oxidative stability which followed the trend commercial diesel > EN590 reference diesel > RME20 and SME20. The low stability of the last two is ascribed to the presence of double bonds in the backbone of their constituent fatty acid methyl esters. The higher concentration of such bonds in SME20 explains why it has the lowest stability. The rate of oxygen uptake is not a predictor of stability under the reactor conditions measured in this study. This was ascribed to different oxidative mechanisms being important for different fuels.
Univers
ity of
Cap
e Tow
n
CHAPTER 9|GENERAL CONCLUSIONS OF STUDY|2013
131
It has been demonstrated that a number of techniques and experimental methodologies can be used to discriminate between fuels. In particular QCMs can be used to accurately assess the deposit-forming potential of diesel fuels. This has not previously been demonstrated for diesels which contain FAME.
Stressing fuels leads to a variety of changes. These include colour changes which can be used to differentiate between stressed and unstressed fuel. These changes are likely the result of the formation of conjugated chromophores. Furthermore oxygen containing groups (C-OH and C=O) were also formed as evidenced by FTIR spectra.
Thermogravimetric analysis (TGA) can also be used to differentiate between stressed and unstressed fuels. Stressing was observed to raise the temperature at which a fuel volatilised. Furthermore significant quantities of high molecular weight species (as inferred from high decomposition temperatures) were observed. The presence of these species was most noticeable in SME20 followed by RME20. Oxidative TGA revealed the presence of a carbonaceous residue which burnt above 500oC. Again SME20 was shown to have the lowest stability.
Moreover when TGA is connected to MS, the oxidative stability of carbonaceous deposits of the stressed fuel can be ascertained. The MS also permits observation of water formed as stressed fuel is thermally interrogated in the TGA and consequently assist in elucidating carbonaceous deposits associated with hydrogen. This was especially useful for characterising deposits formed under more severe conditions. TGA-MS data demonstrated the likely occurrence of cracking as well as the formation of deposits of varying H:C ratios. Material with lower H:C ratios was observed to burn at higher temperatures.
ESI (+) MS was shown adequate in tracking the formation of soluble macromolecular species during fuel oxidation. Preferential ionisation of particular molecules however restricts the technique to qualitative analyses. Notwithstanding the technique showed that there is no direct association between number of soluble macromolecular polar species formed during fuel oxidation and solid deposits formed. The data revealed that stressing caused the formation of high molecular weight species which were inferred to contain oxygen. The formation high molecular weight polar species is consistent with the formation of two phases upon extended stressing of diesel fuel.
TEM imaging suggested that deposits were formed from the liquid phase as demonstrated by the spherical nature of the deposits seen under electron microscopy. The structure in the SME20 deposits at elevated temperatures may, however, hint at a different formation mechanism, e.g. by reaction of cracked fuel products.

Univers
ity of
Cap
e Tow
n
CHAPTER 9|GENERAL CONCLUSIONS OF STUDY|2013
132
It has been demonstrated that a number of techniques provide complementary information about the relative stability of different fuels. In particular the application of thermogravimetric analysis and ESI-MS to diesel stability has been demonstrated.
Univers
ity of
Cap
e Tow
n
CHAPTER 10|RECOMMENDATIONS AND FURTHER WORK|2013
133
10 Recommendations and further work
There are plenty of recommendations on how to get out of trouble cheaply and fast. Most of them come down to this: Deny
your responsibility.-Lyndon B. Johnson
Based on findings of this dissertation the following recommendations have been made.
If one is to perform Soxhlet extraction of diesel soot, it is best performed using glass thimbles, particularly when emphasis is on SOF determination.
Extraction of PAHs and esters such as phthalates from diesel soot matrix is best achieved using polar solvents. Furthermore extraction of phthalates with polar oxygenated solvents will be most effective during Soxhlet extraction.
It is recommended that sequential extraction using acetone followed by methanol be performed to provide an accurate value of SOF. This will maximise PAH and ester extraction. A final toluene extraction may be required to remove any residual paraffins. Further extraction of sulfurous acids should also be considered. This will allow better correlation between SOF and VOF.
In ascertaining the microstructure of diesel soot, it is advisable to perform TEM and discount SEM as TEM provides micrographs that can enable distinction of soot’s complex microstructure and the hierarchal components (primary particles, agglomerates etc.). SEM’s resolving power is insufficient for fine microstructure analysis and should only be used in tandem with EDS to enable elemental analysis.
Sampling of soot from an exhaust pipe of a vehicle should be conducted with great care as to avoid introduction of exhaust pipe components into the soot sample. A future study would require the direct sampling of soot from the exhaust stream. The quantity of soot obtained from a dilution tunnel limited the amount of testing that could be performed.
10.1 Further work
Based on the findings the following is suggested work that could advance and expand on this study.
Extraction of diesel soot was conducted with six solvents. Many other solvents could be used to extract soot. Polar nitrogen containing solvents (e.g. acetonitrile, pyridine etc.) for example could be benchmarked against polar oxygenated solvents in extraction PAHs and/or phthalates. A wider range of solvents would allow a correlation between extraction and solubility parameters to be probed. Such studies could also encompass mixed solvents. GCxGC could be considered for the characterisation of the extracts.
Univers
ity of
Cap
e Tow
n
CHAPTER 10|RECOMMENDATIONS AND FURTHER WORK|2013
134
As other authors have shown, a more accurate quantity of the SOF is obtained by two subsequent extractions i.e. extraction of a soot sample with one solvent followed by extraction with another solvent. This procedure could be tested and the resulting SOF could be benchmarked against the VOF obtained from the TGA. Such benchmarking should also include the aqueous extraction of sulfurous compounds. The hypothesis that some of the VOF results from pyrolysis processes, as proposed by Leifeld [94], could be tested by performing TGA-MS and looking for pyrolysis signatures, notably CO.
Although the microstructure of diesel soot from a commuter bus and a bench engine was observed using TEM, the process involved ultrasonicating the soot samples in ethanol. This process potentially modifies the hierarchal components of soot as well as its microstructure. This hypothesis could be tested by comparing the microstructure of soot sampled directly onto a TEM grid (located at the exhaust of a bench engine) via a process known as thermophoresis, to the microstructure of soot that endures ultrasonication in ethanol.
During oxidative thermal analysis of soot (via TGA-MS), the only gases that were monitored were CO2 and H2O. Inert atmosphere TGA-MS could be used to track other gases or volatiles that develop or desorb from the soot matrix during thermal treatment. Of particular importance would be cracked alkenes. Furthermore Ar should be used as an inert medium so that CO can be identified.
The SMORS mechanism suggests that fuel stability is depressed by inherent fuel phenols. Diesel fuel could be doped with phenols and degraded in reactors (QCM, flask, fluidised sand bath and flow reactor) under their respective conditions. This could be useful in evaluating the effect phenols have on carbonaceous deposit formation in fuels under thermal oxidative conditions.
Testing the effect that zinc has on fuel stability could be extended to other reactors namely, the QCM, flask reactor and fluidised reactor. Furthermore reactions in a flow reactor could be done at a higher fuel temperature to accelerate deposition.
In sand bath experiments, the reactor bomb could be modified to permit determination of headspace oxygen pressure pre and post an experiment. This would enable one to relate the quantity of carbonaceous deposits formed to oxygen consumption (one would perceptibly vary the initial oxygen pressure in the bomb prior across several experiments).
Speeding up deposit formation by using elevated temperatures may cause cracking. An alternative would be to do longer testing at lower temperatures. The flow reactor (configured in a closed loop system) could be used to simulate fuel that recirculates from the tank to the diesel injector equipment and back to the tank. Fuel that is exposed to fuel injectors and recirculated back to the tank can experience temperatures above 100°C. The recirculated fuel can also be characterised using
Univers
ity of
Cap
e Tow
n
CHAPTER 10|RECOMMENDATIONS AND FURTHER WORK|2013
135
continuous FTIR or UV-Vis flow cells to provide kinetic information about the formation of deposition products.
TGA-MS data should be compared with data obtained from an instrument such as a carbon analyser.
The use of MALDI-MS for the characterisation of deposits should be investigated. This result may be compared to ESI-MS. Furthermore size exclusion chromatography could be used to monitor dimerization and trimerisation.
Oxidative TGA can be extended to obtain oxidation kinetic parameters, e.g. activation energy, of the stressed fuels and/or carbonaceous deposits of the fuels.
Negative ESI (-) MS could be performed on methanol fractions of stressed fuels, from the flask reactor, to give a more complete picture of all possible polar soluble macromolecular species that are formed during thermal oxidative stressing of fuel. ESI (-) MS would highlight proton donating species such as acids, which are one of the main products of fuel oxidation.
Finally the test fuel matrix could be extended to include neat RME and SME (B100), and a variety of blend concentrations.
Univers
ity of
Cap
e Tow
n
CHAPTER 11|LIST OF REFERENCES|2013
136
11 List of references
[1] B. R. Stanmore, J. F. Brilhac and P. Gilot, “The oxidation of soot: a review of experiments, mechanisms,” Carbon, vol. 39, p. 2247–2268, 2001.
[2] D. L. Poster, M. M. Schantz, L. C. Sander and S. A. Wise, “Analysis of polycyclic aromatic hydrocarbons (PAHs) in environmental samples: a critical review of gas chromatographic (GC) methods,” Anal. Bioanal. Chem., vol. 386, pp. 859-881, 2006.
[3] R. Ballesteros, “Determination of PAHs in diesel particulate matter using thermal extraction and solid phase micro-extraction,” Atmos. Env., vol. 43, pp. 655-662, 2009.
[4] D. Todorović and Z. Zdravkovski, “Development of a trap for fuel exhaust particulate matter under driving conditions and GC-MS method for their analysis,” Macedonian J. Chem. & Chem. Eng., vol. 30, pp. 97-106, 2011.
[5] E. Borras, L. A. Tortajada-Genaro, M. Vázquez and B. Zielinska, “Polycyclic aromatic hydrocarbon exhaust emissions from different reformulated diesel fuels and engine operating conditions,” Atmos. Env., vol. 43, p. 5944–5952, 2009.
[6] B. D. Batts and A. Z. Fathoni, “A literature review on fuel stability studies with particular emphasis on diesel oil,” Energy & Fuels, vol. 5, pp. 2-21, 1991.
[7] O. Gül, L. Rudnick and H. Schobert, “Morphology of carbon deposits as a function of coal-derived jet fuel chemical composition,” Prepr. Pap.-Am. Chem. Soc., Div. Fuel Chem., vol. 29, no. 2, pp. 773-775, 2004.
[8] O. Altin and S. Eser, “Carbon deposit formation from thermal stressing of petroleum fuels,” Prepr. Pap. - Am. Chem. Soc., Div. Fuel Chem., vol. 49, pp. 764-766, 2004.
[9] A. Birgel, N. Ladommatos, P. Aleiferis, S. Zülch, N. Milovanovic, V. Lafon, A. Orlovic, P. Lacey and P. Richards, “Deposit formation in the holes of diesel injector nozzles: A critical review,” SAE 2008-01-2383, 2008.
[10] R. Venkataraman and S. Eser, “Characterization of deposits formed on diesel injectors in field test and form thermal oxidative degradation of n-hexadecane in a laboratory reactor,” Chem. Cent. J., vol. 25, p. 25, 2008.
[11] O. Altin and S. Eser, “Analysis of solid deposits from thermal stressing of a JP-8
Univers
ity of
Cap
e Tow
n
CHAPTER 11|LIST OF REFERENCES|2013
137
fuel on different tube surfaces in a flow reactor,” Ind. Eng. Chem. Res., vol. 40, pp. 596-603, 2001.
[12] O. Altin and S. Eser, “Characterization of carbon deposits from jet fuel on Inconel 600 and Inconel X surfaces,” Ind. Eng. Chem. Res., vol. 39, pp. 642-645, 2000.
[13] H. N. Sharma, L. Pahalagedara, A. Joshi, S. L. Suib and A. B. Mhadeshwar, “Experimental study of carbon black and diesel engine soot oxidation kinetics using thermogravimetric analysis,” Energy & Fuels, vol. 26, pp. 5613-5625, 2012.
[14] T. Nishiyama and N. Emori, “Commercialisation of a diesel particulate filter (DPF),” Komatsu Technical Report, vol. 48, pp. 23-28, 2002.
[15] A. Stanislaus, A. Marafi and M. S. Rana, “Recent advances in the science and technology of ultra low sulfur diesel (ULSD) production,” Catalysis Today, vol. 153, p. 1–68, 2010.
[16] S. C. Gad and C. P. Chengelis, Acute toxicology testing, 2nd ed., Amsterdam, NL: Elsevier, 1998.
[17] J. Bacha, J. Freel , A. Gibbs, L. Gibbs, G. Hemighaus, K. Hoekman and J. Horn, Diesel fuels technical review, San Ramon, CA, USA: Chevron, 2007.
[18] SAPIA, Petrol and diesel in South Africa and the impact on air quality, Johannesburg, RSA: SAPIA, 2008, pp. 81-122.
[19] S. Gad, Diesel Fuel, Acute Toxicology Testing, 2005, p. 19.
[20] “Fuel regulations USA,” [Online]. Available: http://www.dieselnet.com/standards/us/fuel.php#sulfur. [Accessed February 2012].
[21] “Fuel regulations: European Union,” [Online]. Available: http://www.dieselnet.com/standards/eu/fuel.php. [Accessed February 2012].
[22] A. Keskin, A. Yasar, M. Guru and D. Altiparmak, “Usage of methyl ester of tall oil fatty acids and resinic acids as alternative diesel fuel,” Energy Conservation & Management, vol. 51, pp. 2863-2868, 2010.
[23] R. Caprotti, S. Takaharu and D. Masahiro, “Impact of diesel fuel additives on vehicle performance,” SAE 2008-01-1600, 2008.
[24] M. Matzke, U. Litzow, A. Jess, R. Caprotti and G. Balfour, “Diesel lubricity requirements of future fuel injection equipment,” SAE Int. J. Fuels Lubr., vol. 2,
Univers
ity of
Cap
e Tow
n
CHAPTER 11|LIST OF REFERENCES|2013
138
pp. 273-286, 2009.
[25] R. H. Barbour, D. J. Rickeard and N. G. Elliott, “Understanding diesel lubricity,” SAE Transactions, vol. 109, pp. 1556-1566, 2000.
[26] S. Grgelewicz, M. Stankiewicz, F. A. Oko and I. Surawska, “Esters of dicarboxylic acids as additives for lubricating oils,” Tribol. Int., vol. 39, pp. 560-564, 2006.
[27] M. Maricq, “Chemical characterization of particulate emissions from diesel engines: A review,” Aer. Sci., vol. 38, p. 1079–1118, 2007.
[28] H. Burtscher, “A review on physical characterization of soot,” Aerosol Sci., vol. 36, p. 896–932, 2005.
[29] M. S. Celnik, M. Sander, A. Raj, R. H. West and M. Kraft, “Modelling soot formation in a premixed flame using an aromatic-site soot model and an improved oxidation rate,” Proc. Combust. Inst., vol. 32, pp. 639-646, 22 January 2010.
[30] I. Glassman and R. A. Yetter, Combustion, 4th ed., Burlington, MA, USA: Academic Press, 2008.
[31] A. Clague, J. Donnet, T. Wang and J. Peng, “A comparison of diesel engine soot with carbon black,” Carbon, vol. 37, pp. 1553-1565, 1999.
[32] A. Oberlin, “High resolution TEM studies of carbonization and graphitization,” in Chemistry and physics of carbon, vol. 22, P. Thrower, Ed., New York, NY, USA, Dekker, 1989.
[33] M. Lapuerta, F. J. Martos and J. M. Herrerosa, “Effect of engine operating conditions on the size of primary particles composing diesel soot agglomerates,” Aer. Sci., vol. 38, pp. 455-466, 2007.
[34] M. Lapuerta, R. Ballesteros and F. J. Martos, “A method to determine the fractal dimension of diesel soot agglomerates,” J. Coll. Interf. Sci., vol. 303, p. 149–158, 2006.
[35] S. Collura, N. Chaoui, B. Azambre, G. Finqueneisel, O. Heintz, A. Krzton, A. Koch and J. V. Weber, “Influence of the soluble organic fraction on the thermal behaviour, texture and surface chemistry of diesel exhaust,” Carbon, vol. 43, p. 605–613, 2005.
[36] M.-L. Yu and R. A. Hites, “Identification of organic compounds on diesel engine soot,” Anal. Chem., vol. 53, pp. 951-954, 1981.
Univers
ity of
Cap
e Tow
n
CHAPTER 11|LIST OF REFERENCES|2013
139
[37] D. H. Phillips, “Polycyclic aromatic hydrocarbons in the diet,” Mutation Research, vol. 443, p. 139–147, 1999.
[38] G. Lyons, “Polyaromatic Hydrocarbons (PAHs),” August 1997. [Online]. Available: http://www.wwf.org.uk/filelibrary/pdf/mu_32.pdf. [Accessed July 2012].
[39] N. Saim, J. R. Dean, M. P. Abdullah and Z. Zakaria, “Extraction of polycyclic aromatic hydrocarbons from contaminated soil using Soxhlet extraction, pressurised and atmospheric microwave-assisted extraction, super critical fluid extraction and accelerated solvent extraction,” J. Chrom. A, vol. 791, p. 361–366, 1997.
[40] M. O. Jonker and A. A. Koelmans, “Extraction of polycyclic aromatic hydrocarbons from soot and sediment: solvent evaluation and implications for sorption mechanism,” Environ. Sci. Technol, vol. 36, pp. 4107-4113, 2002.
[41] R. Romero, R. Sienra and P. Richter, “Efficient screening method for determination of polycyclic aromatic hydrocarbons (PAHs) in airborne particles,” Atmos. Env., vol. 36, p. 2375–2381, 2002.
[42] Japanese Environmental Agency, “Strategic Programs on Environmental Endocrine Disruptors '98,” 1998. [Online]. Available: http://www.env.go.jp/en/chemi/ed/bda_speed96.pdf. [Accessed 11 June 2012].
[43] “Phthalates: Toxicity and Exposure Assessment for Children’s Health,” 2007. [Online]. Available: http://www.epa.gov/teach/chem_summ/phthalates_summary.pdf. [Accessed October 2012].
[44] T. Murahashi, S. Sasaki and T. Nakajima, “Determination of endocrine disruptors in automobile exhaust particulate matter,” J. Health Sci., vol. 49, pp. 72-75, 2003.
[45] M. Diaby, M. Sablier, A. Le Negrate, M. El Fassi and J. Bocquet, “Understanding carbonaceous deposit formation resulting from engine oil degradation,” Carbon, vol. 47, pp. 355-366, 2009.
[46] J. Barker, P. Richards, D. Pinch and B. Cheeseman, “Temperature programmed oxidation as a technique for understanding diesel fuel system deposits,” SAE Int. J. Fuels Lubr., vol. 3, pp. 85-99, 2010.
[47] J. Barker, P. Richards, C. Snape and W. Meredith, “Diesel injector deposits – an issue that has evolved with engine technology,” SAE 2011-01-1923, 2011.
Univers
ity of
Cap
e Tow
n
CHAPTER 11|LIST OF REFERENCES|2013
140
[48] J. Keck, “DI-Diesel Engine - Injection Nozzle Coking,” 2008. [Online]. Available: http://cdm.unfccc.int/filestorage/U/6/0/U60DS3HTCQF9PW1J2KGXB5E7IML48A/Additional%20information%3A%20Annex%201.pdf?t=NEF8bWp5ZndufDChRLgBY2BZozpTClxvb1fW. [Accessed February 2013].
[49] P. Aksoy, O. Gul, R. Cetiner, D. A. Fonseca, M. Sobkowiak, S. Falcone-Miller, B. D. Miller and B. Beaver, “Insight into the mechanisms of middle distillate fuel oxidative degradation. Part 2: On the relationship between jet fuel thermal oxidative deposit, soluble macromolecular oxidatively reactive species, and smoke point,” Energy & Fuels, vol. 23, p. 2047–2051, 2009.
[50] C. G. Kabana, S. Botha, C. Schmucker, C. Woolard and B. Beaver, “Oxidative stability of middle distillate fuels. Part 1: Exploring the soluble macromolecular oxidatively reactive species (SMORS) mechanism with jet fuels,” Energy & Fuels, vol. 25, p. 5145–5157, 2011.
[51] D. Hardy and M. Wechter, “Characterization of Soluble Macromolecular Oxidatively Reactive Species (SMORS) from middle distillate diesel fuels: Their origin and role in instability,” Energy Fuels, vol. 8, pp. 782-787, 1994.
[52] M. Sobkowiak, J. Griffith, B. Wang and B. Beaver, “Insight into the mechanisms of middle distillate fuel oxidative degradation. Part 1: on the role of phenol, indole, and carbazole derivatives in the thermal oxidative stability of Fischer-Tropsch/Petroleum jet fuel blends,” Energy Fuels, vol. 23, pp. 2041-2046, 2009.
[53] A. R. Mohan, PhD Dissertation: Metal organic chemical vapor deposition of environmental barrier coatings for the inhibition of solid deposit formation from heated jet fuel, State College, PA, USA, The Pennsylvania State University: Pennsylvania State University, 2011.
[54] A. Bouaid, M. Martinez and J. Aracil, “Long storage stability of biodiesel from vegetable and used frying oils,” Fuel, vol. 87, pp. 2355-2373, 2007.
[55] G. Knothe and R. O. Dunn, “Dependence of oil stability index of fatty compounds on their structure and concentration and presence of metals,” J. Am. Oil Chem. Soc., vol. 80, pp. 1021-1026, 2003.
[56] R. O. Dunn, “Effect of antioxidants on the oxidative stability of methyl soyate (biodiesel),” Fuel Process Technol., vol. 86, pp. 1071-1085, 2005.
[57] G. Knothe, “Some aspects of biodiesel stability,” Fuel Process technol., vol. 88, pp. 669-677, 2007.
[58] S. Jain and M. Sharma, “Prospects of biodiesel from Jatropha in India: a review,”
Univers
ity of
Cap
e Tow
n
CHAPTER 11|LIST OF REFERENCES|2013
141
Renew. Sustainable Energy Rev., vol. 14, pp. 761-771, 2010.
[59] T. Ogawa, S. Kajiya, S. kosaka, I. Tajima, M. Yamamoto and M. Okada, “Analysis of oxidative deterioration of biodiesel fuel,” SAE Technical Paper Series 2008-01-2502, 2008.
[60] G. Knothe, “Analysis of oxidized biodiesel by 1H-NMR and effect of contact area with air,” Eur. J. Lipid Sci. Technol., vol. 108, pp. 493-500, 2006.
[61] H. L. Fang and R. L. McCormick, “Spectroscopic study of biodiesel degradation,” SAE Technical Paper Series 2006-01-3300, 2006.
[62] M. Husnawan, H. H. Masjuki, T. M. I. Mahlia and M. G. Saifullah, “Thermal analysis of cylinder head carbon deposits from single cylinder diesel engine fueled by palm oil–diesel fuel emulsions,” Appl. Energy, vol. 86, p. 2107–2113, 2009.
[63] F. R. Mayo and B. Y. Lan, “Gum and deposit formation from jet turbine and diesel fuels at 130 degrees celcius,” Ind. Eng. Chem. Prod. Res. Dev., vol. 25, pp. 333-348, 1986.
[64] A. R. Mohan and S. Esir, “Analysis of carbonaceous solid deposits from thermal oxidative stressing of Jet-A fuel on iron- and nickel-based alloy surfaces,” Ind. Eng. Chem. Res., vol. 49, p. 2722–2730, 2010.
[65] S. Zabarnick, “Studies of jet fuel thermal stability and oxidation using a quartz crystal microbalance and pressure measurements,” Ind. Eng. Chem. Res, vol. 33, pp. 1348-1354, 1994.
[66] E. Klavetter, S. Martin and K. Wessendorf, “Monitoring jet fuel thermal stability using a quartz crystal microbalance,” Energy Fuels, vol. 7, pp. 582-588, 1993.
[67] ASTM D7739-11: Standard practice for thermal oxidative stability measurement via quartz crystal microbalance, West Conshohocken, PA, USA: ASTM International, 2011.
[68] A. W. Coats and J. P. Redfern, “Thermogravimetric Analysis A Review,” Analyst, vol. 88, pp. 906-924, 1963.
[69] J. McCarty and H. Wise, “Hydrogenation of surface carbon on alumina-supported nickel,” J. Catal., vol. 57, pp. 406-416, 1979.
[70] P. Marecot, A. Akhachane, C. Micheaud and J. Barbier, “Deactivation by coking of supported palladium catalysts. Effect of time and temperature,” Appl. Catal. A: Gen., vol. 169, pp. 189-196, 1998.
Univers
ity of
Cap
e Tow
n
CHAPTER 11|LIST OF REFERENCES|2013
142
[71] K. Wanner and G. Höfner, Eds., Mass spectrometry in medicinal chemistry, Weinheim, DE: WILEY-VCH, 2007, pp. 14-15.
[72] K. Qian, K. E. Edwards, J. H. Diehl and L. A. Green, “Fundamentals and applications of electrospray ionization mass spectrometry for petroleum characterization,” Energy & Fuels, vol. 18, pp. 1784-1791, 2004.
[73] C. Dass, “Electrospray ionization,” in Fundamentals of contemporary mass spectrometry, Hoboken, NJ, USA, John Wiley & Sons, 2007.
[74] M. Commodo, I. Fabris, C. P. T. Groth and O. L. Gulder, “Analysis of aviation fuel thermal oxidative stability by electrospray ionization mass spectrometry (ESI-MS),” Energy & Fuels, vol. 25, pp. 2142-2150, 2011.
[75] C. E. Rostad, “Screening of polar components of petroleum products by electrospray ionization mass spectrometry,” Energy & Fuels, vol. 19, pp. 992-997, 2005.
[76] C. A. Hughey, C. L. Hendrickson, R. P. Rodgers and A. G. Marshall, “Elemental composition analysis of processed and unprocessed diesel fuel by electrospray ionization Fourier Transform ion cyclotron resonance mass spectrometry,” Energy & Fuels, vol. 15, pp. 1186-1193, 2001.
[77] R. R. Catharino, H. M. S. Milagre, S. A. Saraiva and C. M. Garcia, “Biodiesel typification and quality control by direct infusion electrospray ionization mass spectrometry fingerprinting,” Energy & Fuels, vol. 21, p. 3698–3701, 2007.
[78] J. Byatt-Smith, R. Day, O. Harlen, J. Lister, S. L. Smith, C. P. Please, R. Stone, S. D. Howison and A. Fowler, Temperature of diesel fuel spray at injector nozzle hole exit, Aus: Perkins Technologies, 1996.
[79] R. Caprotti, A. Breakspear, O. Graupner and T. Klaua, “Detergency requirements of future diesel injection systems,” SAE Technical Paper Series 2005-01-3901, 2005.
[80] R. Caprotti, A. Breakspear, O. Greipner, T. Klaua and O. Kohnen, “Diesel injector deposits potential in future fueling systems,” SAE Technical Paper Series 2006-01-3359, 2006.
[81] M. Ikemoto, K. Omae, K. Nakai, R. Ueda, N. Kakehashi and K. Sunami, “Injection nozzle coking mechanism in common-rail diesel engine,” SAE Technical Paper Series 2011-01-1818, 2011.
[82] A. Velaers, S. De Goede, R. Burnham and C. Woolard, “Injector fouling performance and solubility of GTL diesel doped with zinc,” SAE Int. J. Lubr., vol.
Univers
ity of
Cap
e Tow
n
CHAPTER 11|LIST OF REFERENCES|2013
143
6, no. 1, pp. 276-288, 2013.
[83] R. Barbour, R. Quigley, D. Browne and A. Panesar, “A comparison of Peugeot DW10 dynamometer and vehicle engine performance,” in 8th International Colloquiom on Fuels, Esslingen, 2011.
[84] W. Focke, I. Van der Westhuizen, A. Lofté Grobler, T. Ntshoane, J. Reddy and A. Luyt, “The effect of synthetic antioxidants on the oxidative stability of biodiesel,” Fuel, vol. 94, pp. 227-233, 2012.
[85] K. Oukebdane, F. Portet-Koltalo, N. Machoura, F. Dionnet and P. L. Desbène, “Comparison of hot Soxhlet and accelerated solvent extractions,” Talanta, vol. 82, p. 227–236, 2010.
[86] NIST/EPA/NIH Mass Spectral Library, Gaithersburg, MD, USA: National Institute of Standards and Technology, 2008.
[87] P. C. Sadek, The HPLC solvent guide, 2nd ed., New York, NY, USA: John Wiley & Sons, 2002, pp. 10-300.
[88] A. S. G.A. Stratakis, “Thermogravimetric analysis of soot emitted by a modern diesel engine run on catalyst-doped fuel,” Combustion and Flame , vol. 132, pp. 157-169, 2003.
[89] S. Collura, “Influence of the soluble organic fraction on the thermal behaviour, texture and surface chemistry of diesel exhaust,” Carbon, no. 43, p. 605–613, 2005.
[90] J. Rodríguez-Fernandez, F. Oliva and R. A. Vazquez, “Characterization of the Diesel Soot Oxidation Process through an Optimized Thermogravimetric Method,” Energy Fuels, 2011.
[91] D. Su, R. Jentoft, J. Müller, D. Rothe, E. Jacob, C. Simpson, Z. Tomovic', K. Müllen, A. Messerer, U. Poschl, R. Niessner and R. Schlogl, “Microstructure and oxidation behaviour of Euro IV diesel engine soot: a comparative study with synthetic model soot substances,” Catal. Today, vol. 90, pp. 127-132, 2004.
[92] C. M. Hansen, Hansen solubility parameters: A user's handbook, 2nd ed., Boca Raton, FL, USA: CRC Press, 2007.
[93] K. Mannistu, H. Yarranton and J. Masliyah, “Solubility modelling of asphaltenes in organic solvents,” Energy Fuels, vol. 11, pp. 615-622, 1997.
[94] J. Leifeld, “Thermal stability of black carbon characterised by oxidative
Univers
ity of
Cap
e Tow
n
CHAPTER 11|LIST OF REFERENCES|2013
144
differential scanning calorimetry,” Org. Geochem., vol. 38, pp. 112-127, 2007.
[95] S. Japar, A. Szkariat, R. Gorse, E. Heyerdahl, R. Johnson, J. Rau and J. Huntzicker, “Comparison of solvent extraction and thermal-optical carbon analysis methods: application to disel vehicale exhaust aerosol,” Environ. Sci. Technol., pp. 231-234, 1984.
[96] M. A. Fazal, A. S. M. A. Haseeb and H. H. Masjuki, “Biodiesel feasibility study: An evaluation of material compatibility; performance; emission and engine durability,” Renewable & Sustainable Energy Reviews, vol. 15, pp. 1314-1324, 2011.
[97] G. Knothe, “Dependence of biodiesel fuel properties on the structure of fatty acid alkyl esters,” Fuel Process Technol., vol. 86, pp. 1059-1070, 2005.
[98] M. Frenklach, “Reaction mechanism of soot formation in flames,” Phys. Chem. Chem. Phys., vol. 4, pp. 2028-2037, 2002.
[99] Y. Chien, M. Lu, M. Chai and F. Boreo, “Characterization of biodiesel and biodiesel particulate matter by TG, TG-MS and FTIR,” Energy Fuels, vol. 23, pp. 202-206, 2009.
[100] R. Umer, A. Farooq, J. Amer and N. Haq, “Jatropha Curcas seed oil as a viable source for biodiesel,” Pak. J. Bot., vol. 42, pp. 575-582, 2010.
[101] B. Stuart, “Infrared Spectroscopy: Fundamentals and Applications,” New York, NY, USA, 2004.
[102] R. Quigley, R. Barbour and E. Fahey, “A study of the internal diesel injector deposit phenomenon,” in Proceedings of Fuels: conventional and future energy for automobiles, 8th International Colloquium, Esslingen, DE, 2011.
[103] E. G. Hammond, L. A. Johnson and C. Su, “Soybean oil,” 2005. [Online]. Available: http://uqu.edu.sa/files2/tiny_mce/plugins/filemanager/files/4281709/84607_28.pdf. [Accessed March 2013].
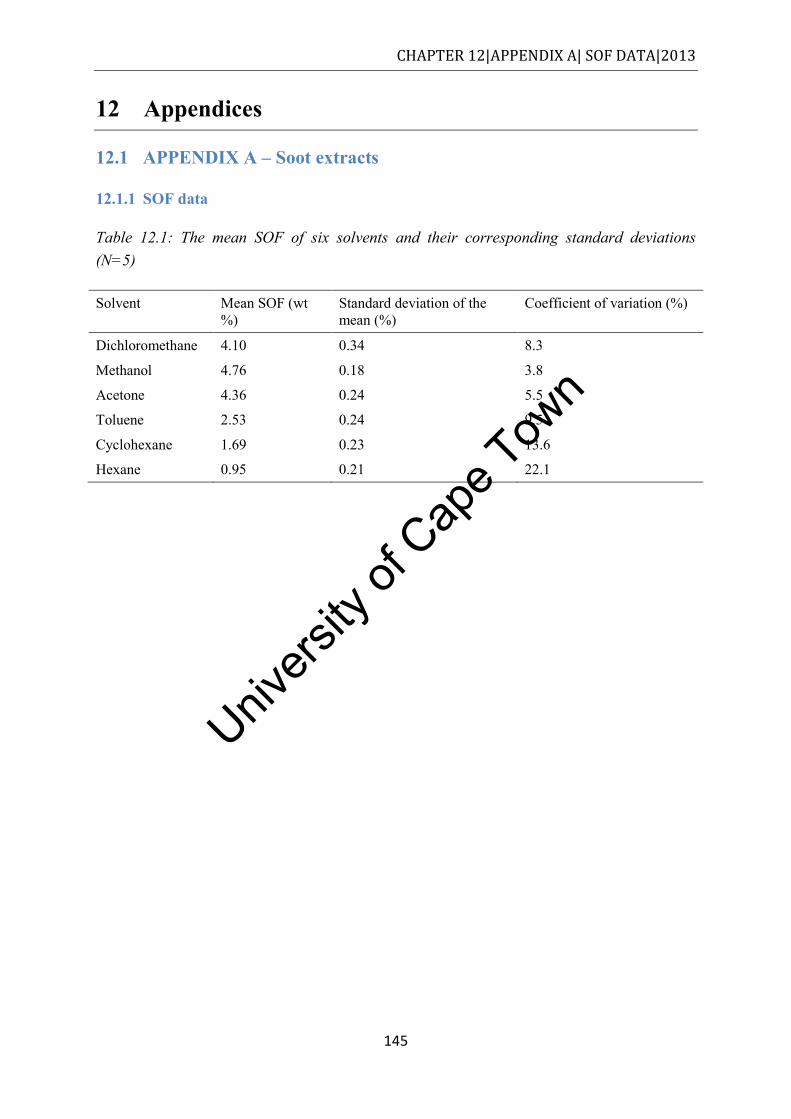
Univers
ity of
Cap
e Tow
n
CHAPTER 12|APPENDIX A| SOF DATA|2013
145
12 Appendices
12.1 APPENDIX A – Soot extracts
12.1.1 SOF data
Table 12.1: The mean SOF of six solvents and their corresponding standard deviations (N=5)
Solvent Mean SOF (wt %)
Standard deviation of the mean (%)
Coefficient of variation (%)
Dichloromethane 4.10 0.34 8.3
Methanol 4.76 0.18 3.8
Acetone 4.36 0.24 5.5
Toluene 2.53 0.24 9.5
Cyclohexane 1.69 0.23 13.6
Hexane 0.95 0.21 22.1
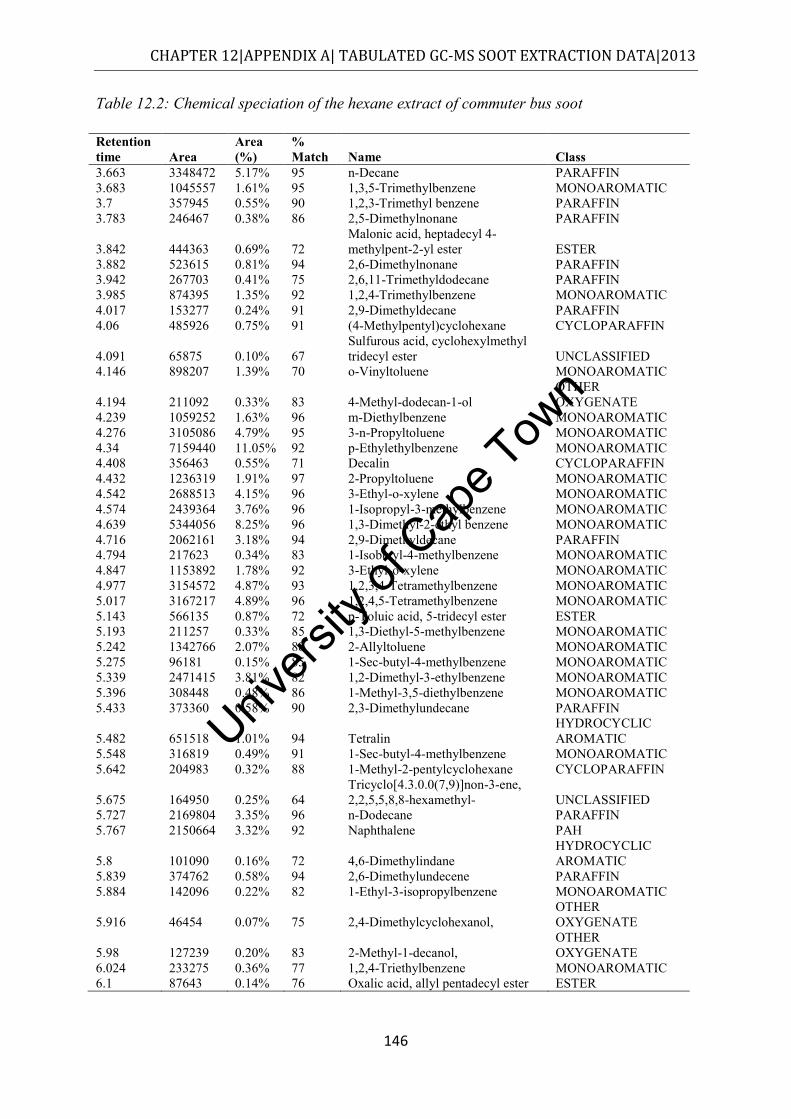
Univers
ity of
Cap
e Tow
n
CHAPTER 12|APPENDIX A| TABULATED GC-MS SOOT EXTRACTION DATA|2013
146
Table 12.2: Chemical speciation of the hexane extract of commuter bus soot
Retention time Area
Area (%)
% Match Name Class
3.663 3348472 5.17% 95 n-Decane PARAFFIN 3.683 1045557 1.61% 95 1,3,5-Trimethylbenzene MONOAROMATIC 3.7 357945 0.55% 90 1,2,3-Trimethyl benzene PARAFFIN 3.783 246467 0.38% 86 2,5-Dimethylnonane PARAFFIN
3.842 444363 0.69% 72 Malonic acid, heptadecyl 4-methylpent-2-yl ester ESTER
3.882 523615 0.81% 94 2,6-Dimethylnonane PARAFFIN 3.942 267703 0.41% 75 2,6,11-Trimethyldodecane PARAFFIN 3.985 874395 1.35% 92 1,2,4-Trimethylbenzene MONOAROMATIC 4.017 153277 0.24% 91 2,9-Dimethyldecane PARAFFIN 4.06 485926 0.75% 91 (4-Methylpentyl)cyclohexane CYCLOPARAFFIN
4.091 65875 0.10% 67 Sulfurous acid, cyclohexylmethyl tridecyl ester UNCLASSIFIED
4.146 898207 1.39% 70 o-Vinyltoluene MONOAROMATIC
4.194 211092 0.33% 83 4-Methyl-dodecan-1-ol OTHER OXYGENATE
4.239 1059252 1.63% 96 m-Diethylbenzene MONOAROMATIC 4.276 3105086 4.79% 95 3-n-Propyltoluene MONOAROMATIC 4.34 7159440 11.05% 92 p-Ethylethylbenzene MONOAROMATIC 4.408 356463 0.55% 71 Decalin CYCLOPARAFFIN 4.432 1236319 1.91% 97 2-Propyltoluene MONOAROMATIC 4.542 2688513 4.15% 96 3-Ethyl-o-xylene MONOAROMATIC 4.574 2439364 3.76% 96 1-Isopropyl-3-methylbenzene MONOAROMATIC 4.639 5344056 8.25% 96 1,3-Dimethyl-2-ethyl benzene MONOAROMATIC 4.716 2062161 3.18% 94 2,9-Dimethyldecane PARAFFIN 4.794 217623 0.34% 83 1-Isobutyl-4-methylbenzene MONOAROMATIC 4.847 1153892 1.78% 92 3-Ethyl-o-xylene MONOAROMATIC 4.977 3154572 4.87% 93 1,2,3,4-Tetramethylbenzene MONOAROMATIC 5.017 3167217 4.89% 96 1,2,4,5-Tetramethylbenzene MONOAROMATIC 5.143 566135 0.87% 72 p-Toluic acid, 5-tridecyl ester ESTER 5.193 211257 0.33% 85 1,3-Diethyl-5-methylbenzene MONOAROMATIC 5.242 1342766 2.07% 88 2-Allyltoluene MONOAROMATIC 5.275 96181 0.15% 85 1-Sec-butyl-4-methylbenzene MONOAROMATIC 5.339 2471415 3.81% 82 1,2-Dimethyl-3-ethylbenzene MONOAROMATIC 5.396 308448 0.48% 86 1-Methyl-3,5-diethylbenzene MONOAROMATIC 5.433 373360 0.58% 90 2,3-Dimethylundecane PARAFFIN
5.482 651518 1.01% 94 Tetralin HYDROCYCLIC AROMATIC
5.548 316819 0.49% 91 1-Sec-butyl-4-methylbenzene MONOAROMATIC 5.642 204983 0.32% 88 1-Methyl-2-pentylcyclohexane CYCLOPARAFFIN
5.675 164950 0.25% 64 Tricyclo[4.3.0.0(7,9)]non-3-ene, 2,2,5,5,8,8-hexamethyl- UNCLASSIFIED
5.727 2169804 3.35% 96 n-Dodecane PARAFFIN 5.767 2150664 3.32% 92 Naphthalene PAH
5.8 101090 0.16% 72 4,6-Dimethylindane HYDROCYCLIC AROMATIC
5.839 374762 0.58% 94 2,6-Dimethylundecene PARAFFIN 5.884 142096 0.22% 82 1-Ethyl-3-isopropylbenzene MONOAROMATIC
5.916 46454 0.07% 75 2,4-Dimethylcyclohexanol, OTHER OXYGENATE
5.98 127239 0.20% 83 2-Methyl-1-decanol, OTHER OXYGENATE
6.024 233275 0.36% 77 1,2,4-Triethylbenzene MONOAROMATIC 6.1 87643 0.14% 76 Oxalic acid, allyl pentadecyl ester ESTER
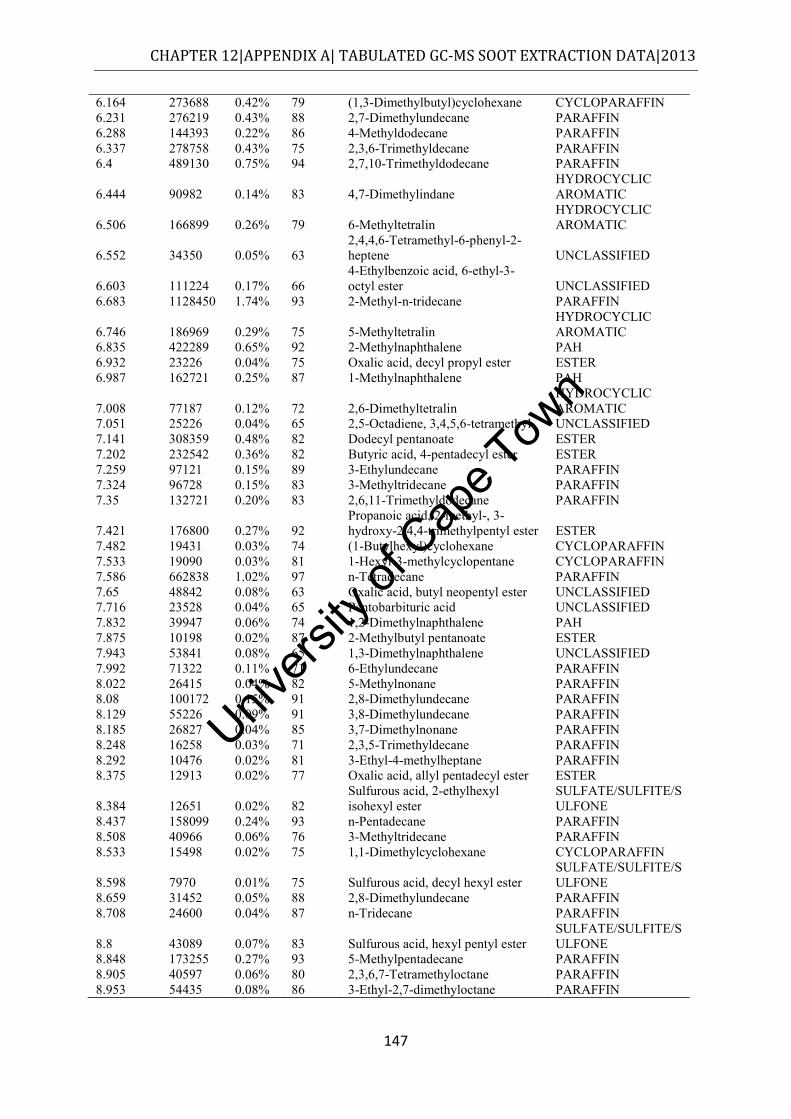
Univers
ity of
Cap
e Tow
n
CHAPTER 12|APPENDIX A| TABULATED GC-MS SOOT EXTRACTION DATA|2013
147
6.164 273688 0.42% 79 (1,3-Dimethylbutyl)cyclohexane CYCLOPARAFFIN 6.231 276219 0.43% 88 2,7-Dimethylundecane PARAFFIN 6.288 144393 0.22% 86 4-Methyldodecane PARAFFIN 6.337 278758 0.43% 75 2,3,6-Trimethyldecane PARAFFIN 6.4 489130 0.75% 94 2,7,10-Trimethyldodecane PARAFFIN
6.444 90982 0.14% 83 4,7-Dimethylindane HYDROCYCLIC AROMATIC
6.506 166899 0.26% 79 6-Methyltetralin HYDROCYCLIC AROMATIC
6.552 34350 0.05% 63 2,4,4,6-Tetramethyl-6-phenyl-2-heptene UNCLASSIFIED
6.603 111224 0.17% 66 4-Ethylbenzoic acid, 6-ethyl-3-octyl ester UNCLASSIFIED
6.683 1128450 1.74% 93 2-Methyl-n-tridecane PARAFFIN
6.746 186969 0.29% 75 5-Methyltetralin HYDROCYCLIC AROMATIC
6.835 422289 0.65% 92 2-Methylnaphthalene PAH 6.932 23226 0.04% 75 Oxalic acid, decyl propyl ester ESTER 6.987 162721 0.25% 87 1-Methylnaphthalene PAH
7.008 77187 0.12% 72 2,6-Dimethyltetralin HYDROCYCLIC AROMATIC
7.051 25226 0.04% 65 2,5-Octadiene, 3,4,5,6-tetramethyl UNCLASSIFIED 7.141 308359 0.48% 82 Dodecyl pentanoate ESTER 7.202 232542 0.36% 82 Butyric acid, 4-pentadecyl ester ESTER 7.259 97121 0.15% 89 3-Ethylundecane PARAFFIN 7.324 96728 0.15% 83 3-Methyltridecane PARAFFIN 7.35 132721 0.20% 83 2,6,11-Trimethyldodecane PARAFFIN
7.421 176800 0.27% 92 Propanoic acid, 2-methyl-, 3-hydroxy-2,4,4-trimethylpentyl ester ESTER
7.482 19431 0.03% 74 (1-Butylhexyl)cyclohexane CYCLOPARAFFIN 7.533 19090 0.03% 81 1-Hexyl-3-methylcyclopentane CYCLOPARAFFIN 7.586 662838 1.02% 97 n-Tetradecane PARAFFIN 7.65 48842 0.08% 63 Oxalic acid, butyl neopentyl ester UNCLASSIFIED 7.716 23528 0.04% 65 Pentobarbituric acid UNCLASSIFIED 7.832 39947 0.06% 74 1,2-Dimethylnaphthalene PAH 7.875 10198 0.02% 87 2-Methylbutyl pentanoate ESTER 7.943 53841 0.08% 65 1,3-Dimethylnaphthalene UNCLASSIFIED 7.992 71322 0.11% 71 6-Ethylundecane PARAFFIN 8.022 26415 0.04% 82 5-Methylnonane PARAFFIN 8.08 100172 0.15% 91 2,8-Dimethylundecane PARAFFIN 8.129 55226 0.09% 91 3,8-Dimethylundecane PARAFFIN 8.185 26827 0.04% 85 3,7-Dimethylnonane PARAFFIN 8.248 16258 0.03% 71 2,3,5-Trimethyldecane PARAFFIN 8.292 10476 0.02% 81 3-Ethyl-4-methylheptane PARAFFIN 8.375 12913 0.02% 77 Oxalic acid, allyl pentadecyl ester ESTER
8.384 12651 0.02% 82 Sulfurous acid, 2-ethylhexyl isohexyl ester
SULFATE/SULFITE/SULFONE
8.437 158099 0.24% 93 n-Pentadecane PARAFFIN 8.508 40966 0.06% 76 3-Methyltridecane PARAFFIN 8.533 15498 0.02% 75 1,1-Dimethylcyclohexane CYCLOPARAFFIN
8.598 7970 0.01% 75 Sulfurous acid, decyl hexyl ester SULFATE/SULFITE/SULFONE
8.659 31452 0.05% 88 2,8-Dimethylundecane PARAFFIN 8.708 24600 0.04% 87 n-Tridecane PARAFFIN
8.8 43089 0.07% 83 Sulfurous acid, hexyl pentyl ester SULFATE/SULFITE/SULFONE
8.848 173255 0.27% 93 5-Methylpentadecane PARAFFIN 8.905 40597 0.06% 80 2,3,6,7-Tetramethyloctane PARAFFIN 8.953 54435 0.08% 86 3-Ethyl-2,7-dimethyloctane PARAFFIN
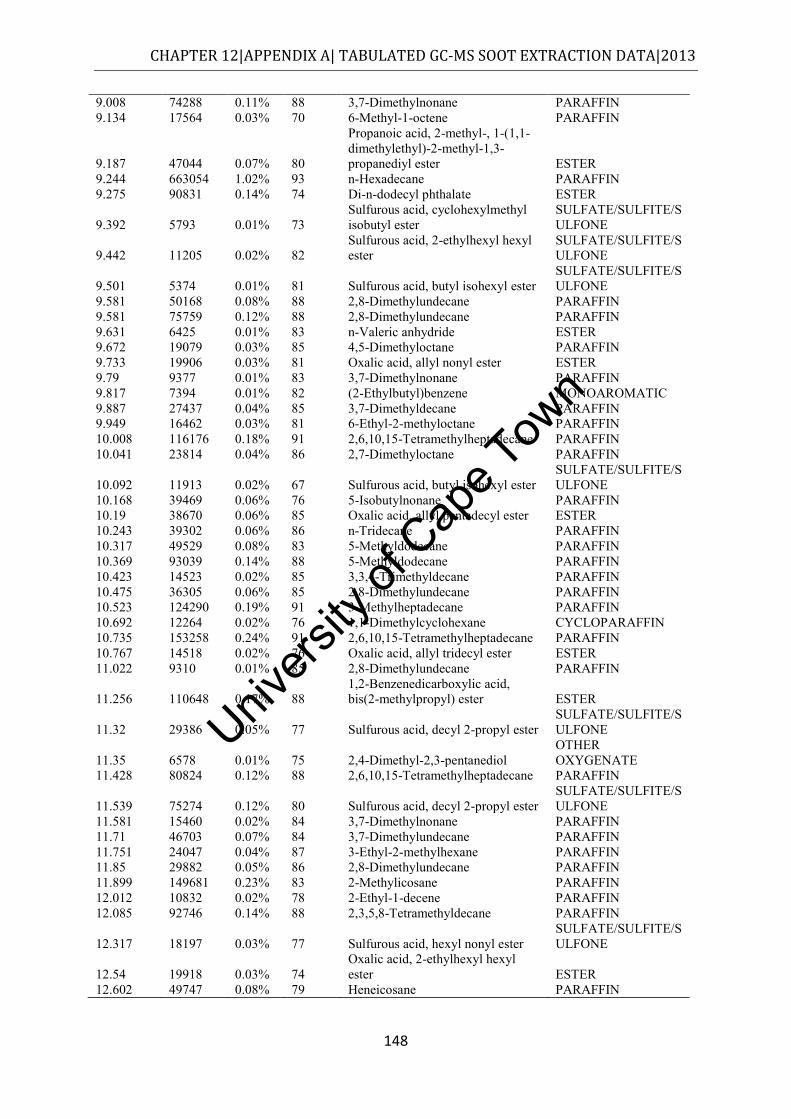
Univers
ity of
Cap
e Tow
n
CHAPTER 12|APPENDIX A| TABULATED GC-MS SOOT EXTRACTION DATA|2013
148
9.008 74288 0.11% 88 3,7-Dimethylnonane PARAFFIN 9.134 17564 0.03% 70 6-Methyl-1-octene PARAFFIN
9.187 47044 0.07% 80
Propanoic acid, 2-methyl-, 1-(1,1-dimethylethyl)-2-methyl-1,3-propanediyl ester ESTER
9.244 663054 1.02% 93 n-Hexadecane PARAFFIN 9.275 90831 0.14% 74 Di-n-dodecyl phthalate ESTER
9.392 5793 0.01% 73 Sulfurous acid, cyclohexylmethyl isobutyl ester
SULFATE/SULFITE/SULFONE
9.442 11205 0.02% 82 Sulfurous acid, 2-ethylhexyl hexyl ester
SULFATE/SULFITE/SULFONE
9.501 5374 0.01% 81 Sulfurous acid, butyl isohexyl ester SULFATE/SULFITE/SULFONE
9.581 50168 0.08% 88 2,8-Dimethylundecane PARAFFIN 9.581 75759 0.12% 88 2,8-Dimethylundecane PARAFFIN 9.631 6425 0.01% 83 n-Valeric anhydride ESTER 9.672 19079 0.03% 85 4,5-Dimethyloctane PARAFFIN 9.733 19906 0.03% 81 Oxalic acid, allyl nonyl ester ESTER 9.79 9377 0.01% 83 3,7-Dimethylnonane PARAFFIN 9.817 7394 0.01% 82 (2-Ethylbutyl)benzene MONOAROMATIC 9.887 27437 0.04% 85 3,7-Dimethyldecane PARAFFIN 9.949 16462 0.03% 81 6-Ethyl-2-methyloctane PARAFFIN 10.008 116176 0.18% 91 2,6,10,15-Tetramethylheptadecane PARAFFIN 10.041 23814 0.04% 86 2,7-Dimethyloctane PARAFFIN
10.092 11913 0.02% 67 Sulfurous acid, butyl isohexyl ester SULFATE/SULFITE/SULFONE
10.168 39469 0.06% 76 5-Isobutylnonane PARAFFIN 10.19 38670 0.06% 85 Oxalic acid, allyl pentadecyl ester ESTER 10.243 39302 0.06% 86 n-Tridecane PARAFFIN 10.317 49529 0.08% 83 5-Methyldodecane PARAFFIN 10.369 93039 0.14% 88 5-Methyldodecane PARAFFIN 10.423 14523 0.02% 85 3,3,4-Trimethyldecane PARAFFIN 10.475 36305 0.06% 85 2,8-Dimethylundecane PARAFFIN 10.523 124290 0.19% 91 3-Methylheptadecane PARAFFIN 10.692 12264 0.02% 76 1,1-Dimethylcyclohexane CYCLOPARAFFIN 10.735 153258 0.24% 91 2,6,10,15-Tetramethylheptadecane PARAFFIN 10.767 14518 0.02% 76 Oxalic acid, allyl tridecyl ester ESTER 11.022 9310 0.01% 85 2,8-Dimethylundecane PARAFFIN
11.256 110648 0.17% 88 1,2-Benzenedicarboxylic acid, bis(2-methylpropyl) ester ESTER
11.32 29386 0.05% 77 Sulfurous acid, decyl 2-propyl ester SULFATE/SULFITE/SULFONE
11.35 6578 0.01% 75 2,4-Dimethyl-2,3-pentanediol OTHER OXYGENATE
11.428 80824 0.12% 88 2,6,10,15-Tetramethylheptadecane PARAFFIN
11.539 75274 0.12% 80 Sulfurous acid, decyl 2-propyl ester SULFATE/SULFITE/SULFONE
11.581 15460 0.02% 84 3,7-Dimethylnonane PARAFFIN 11.71 46703 0.07% 84 3,7-Dimethylundecane PARAFFIN 11.751 24047 0.04% 87 3-Ethyl-2-methylhexane PARAFFIN 11.85 29882 0.05% 86 2,8-Dimethylundecane PARAFFIN 11.899 149681 0.23% 83 2-Methylicosane PARAFFIN 12.012 10832 0.02% 78 2-Ethyl-1-decene PARAFFIN 12.085 92746 0.14% 88 2,3,5,8-Tetramethyldecane PARAFFIN
12.317 18197 0.03% 77 Sulfurous acid, hexyl nonyl ester SULFATE/SULFITE/SULFONE
12.54 19918 0.03% 74 Oxalic acid, 2-ethylhexyl hexyl ester ESTER
12.602 49747 0.08% 79 Heneicosane PARAFFIN
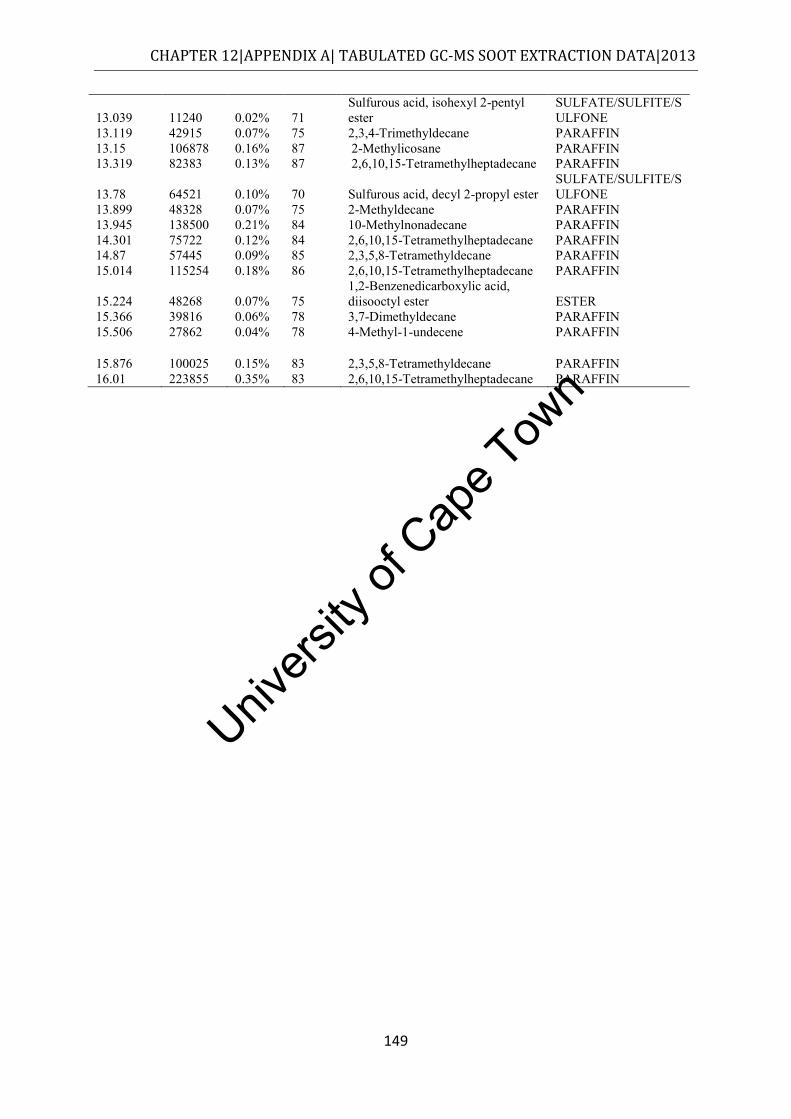
Univers
ity of
Cap
e Tow
n
CHAPTER 12|APPENDIX A| TABULATED GC-MS SOOT EXTRACTION DATA|2013
149
13.039 11240 0.02% 71 Sulfurous acid, isohexyl 2-pentyl ester
SULFATE/SULFITE/SULFONE
13.119 42915 0.07% 75 2,3,4-Trimethyldecane PARAFFIN 13.15 106878 0.16% 87 2-Methylicosane PARAFFIN 13.319 82383 0.13% 87 2,6,10,15-Tetramethylheptadecane PARAFFIN
13.78 64521 0.10% 70 Sulfurous acid, decyl 2-propyl ester SULFATE/SULFITE/SULFONE
13.899 48328 0.07% 75 2-Methyldecane PARAFFIN 13.945 138500 0.21% 84 10-Methylnonadecane PARAFFIN 14.301 75722 0.12% 84 2,6,10,15-Tetramethylheptadecane PARAFFIN 14.87 57445 0.09% 85 2,3,5,8-Tetramethyldecane PARAFFIN 15.014 115254 0.18% 86 2,6,10,15-Tetramethylheptadecane PARAFFIN
15.224 48268 0.07% 75 1,2-Benzenedicarboxylic acid, diisooctyl ester ESTER
15.366 39816 0.06% 78 3,7-Dimethyldecane PARAFFIN 15.506 27862 0.04% 78 4-Methyl-1-undecene PARAFFIN
15.876 100025 0.15% 83 2,3,5,8-Tetramethyldecane PARAFFIN 16.01 223855 0.35% 83 2,6,10,15-Tetramethylheptadecane PARAFFIN
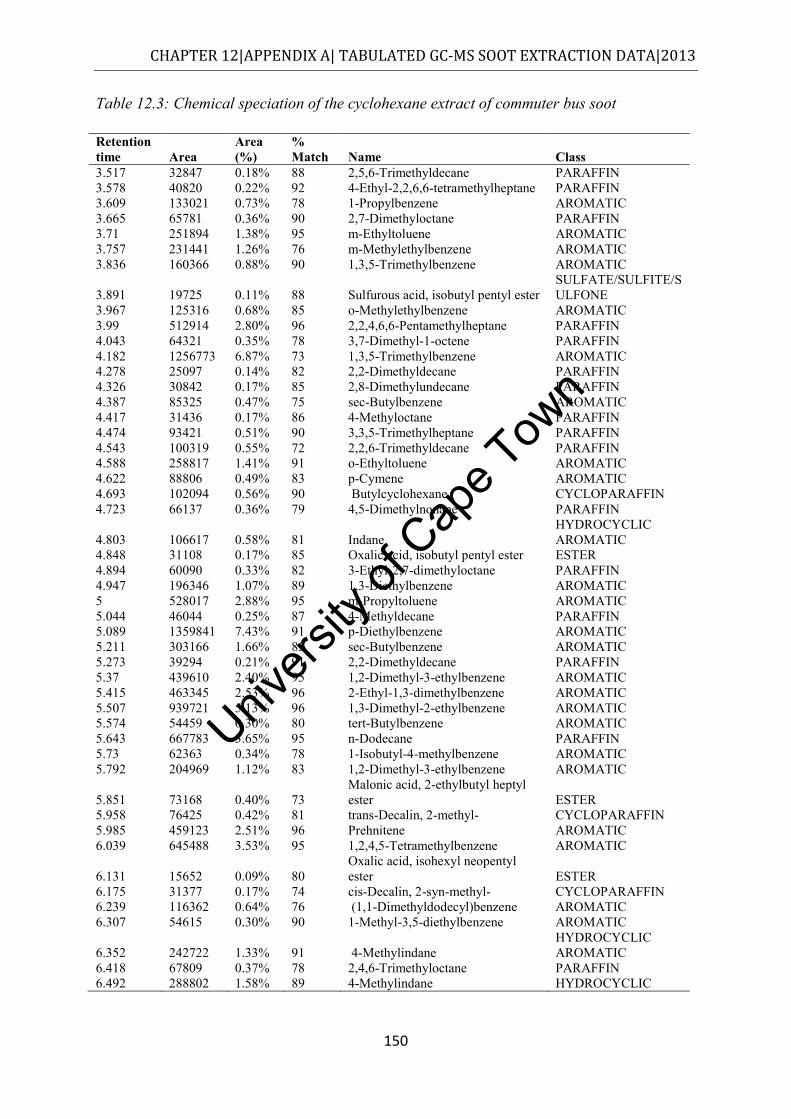
Univers
ity of
Cap
e Tow
n
CHAPTER 12|APPENDIX A| TABULATED GC-MS SOOT EXTRACTION DATA|2013
150
Table 12.3: Chemical speciation of the cyclohexane extract of commuter bus soot
Retention time Area
Area (%)
% Match Name Class
3.517 32847 0.18% 88 2,5,6-Trimethyldecane PARAFFIN 3.578 40820 0.22% 92 4-Ethyl-2,2,6,6-tetramethylheptane PARAFFIN 3.609 133021 0.73% 78 1-Propylbenzene AROMATIC 3.665 65781 0.36% 90 2,7-Dimethyloctane PARAFFIN 3.71 251894 1.38% 95 m-Ethyltoluene AROMATIC 3.757 231441 1.26% 76 m-Methylethylbenzene AROMATIC 3.836 160366 0.88% 90 1,3,5-Trimethylbenzene AROMATIC
3.891 19725 0.11% 88 Sulfurous acid, isobutyl pentyl ester SULFATE/SULFITE/SULFONE
3.967 125316 0.68% 85 o-Methylethylbenzene AROMATIC 3.99 512914 2.80% 96 2,2,4,6,6-Pentamethylheptane PARAFFIN 4.043 64321 0.35% 78 3,7-Dimethyl-1-octene PARAFFIN 4.182 1256773 6.87% 73 1,3,5-Trimethylbenzene AROMATIC 4.278 25097 0.14% 82 2,2-Dimethyldecane PARAFFIN 4.326 30842 0.17% 85 2,8-Dimethylundecane PARAFFIN 4.387 85325 0.47% 75 sec-Butylbenzene AROMATIC 4.417 31436 0.17% 86 4-Methyloctane PARAFFIN 4.474 93421 0.51% 90 3,3,5-Trimethylheptane PARAFFIN 4.543 100319 0.55% 72 2,2,6-Trimethyldecane PARAFFIN 4.588 258817 1.41% 91 o-Ethyltoluene AROMATIC 4.622 88806 0.49% 83 p-Cymene AROMATIC 4.693 102094 0.56% 90 Butylcyclohexane CYCLOPARAFFIN 4.723 66137 0.36% 79 4,5-Dimethylnonane PARAFFIN
4.803 106617 0.58% 81 Indane HYDROCYCLIC AROMATIC
4.848 31108 0.17% 85 Oxalic acid, isobutyl pentyl ester ESTER 4.894 60090 0.33% 82 3-Ethyl-2,7-dimethyloctane PARAFFIN 4.947 196346 1.07% 89 1,3-Diethylbenzene AROMATIC 5 528017 2.88% 95 m-Propyltoluene AROMATIC 5.044 46044 0.25% 87 4-Methyldecane PARAFFIN 5.089 1359841 7.43% 91 p-Diethylbenzene AROMATIC 5.211 303166 1.66% 85 sec-Butylbenzene AROMATIC 5.273 39294 0.21% 91 2,2-Dimethyldecane PARAFFIN 5.37 439610 2.40% 95 1,2-Dimethyl-3-ethylbenzene AROMATIC 5.415 463345 2.53% 96 2-Ethyl-1,3-dimethylbenzene AROMATIC 5.507 939721 5.13% 96 1,3-Dimethyl-2-ethylbenzene AROMATIC 5.574 54459 0.30% 80 tert-Butylbenzene AROMATIC 5.643 667783 3.65% 95 n-Dodecane PARAFFIN 5.73 62363 0.34% 78 1-Isobutyl-4-methylbenzene AROMATIC 5.792 204969 1.12% 83 1,2-Dimethyl-3-ethylbenzene AROMATIC
5.851 73168 0.40% 73 Malonic acid, 2-ethylbutyl heptyl ester ESTER
5.958 76425 0.42% 81 trans-Decalin, 2-methyl- CYCLOPARAFFIN 5.985 459123 2.51% 96 Prehnitene AROMATIC 6.039 645488 3.53% 95 1,2,4,5-Tetramethylbenzene AROMATIC
6.131 15652 0.09% 80 Oxalic acid, isohexyl neopentyl ester ESTER
6.175 31377 0.17% 74 cis-Decalin, 2-syn-methyl- CYCLOPARAFFIN 6.239 116362 0.64% 76 (1,1-Dimethyldodecyl)benzene AROMATIC 6.307 54615 0.30% 90 1-Methyl-3,5-diethylbenzene AROMATIC
6.352 242722 1.33% 91 4-Methylindane HYDROCYCLIC AROMATIC
6.418 67809 0.37% 78 2,4,6-Trimethyloctane PARAFFIN 6.492 288802 1.58% 89 4-Methylindane HYDROCYCLIC
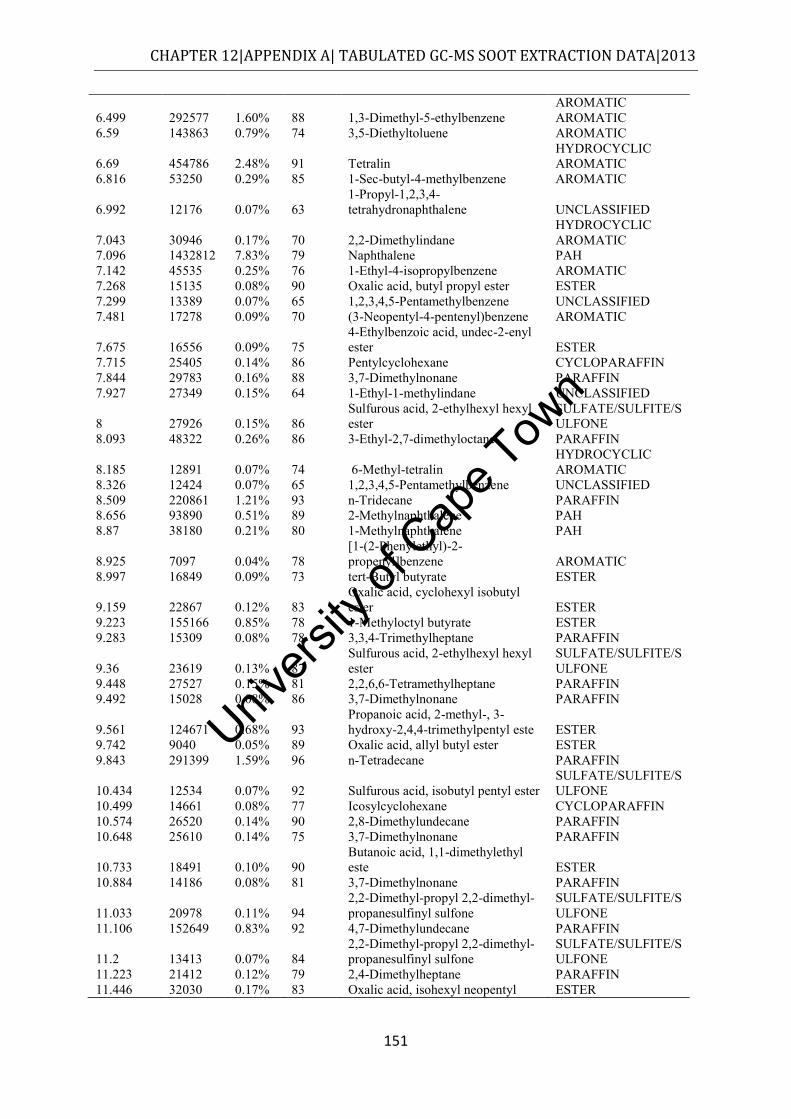
Univers
ity of
Cap
e Tow
n
CHAPTER 12|APPENDIX A| TABULATED GC-MS SOOT EXTRACTION DATA|2013
151
AROMATIC 6.499 292577 1.60% 88 1,3-Dimethyl-5-ethylbenzene AROMATIC 6.59 143863 0.79% 74 3,5-Diethyltoluene AROMATIC
6.69 454786 2.48% 91 Tetralin HYDROCYCLIC AROMATIC
6.816 53250 0.29% 85 1-Sec-butyl-4-methylbenzene AROMATIC
6.992 12176 0.07% 63 1-Propyl-1,2,3,4-tetrahydronaphthalene UNCLASSIFIED
7.043 30946 0.17% 70 2,2-Dimethylindane HYDROCYCLIC AROMATIC
7.096 1432812 7.83% 79 Naphthalene PAH 7.142 45535 0.25% 76 1-Ethyl-4-isopropylbenzene AROMATIC 7.268 15135 0.08% 90 Oxalic acid, butyl propyl ester ESTER 7.299 13389 0.07% 65 1,2,3,4,5-Pentamethylbenzene UNCLASSIFIED 7.481 17278 0.09% 70 (3-Neopentyl-4-pentenyl)benzene AROMATIC
7.675 16556 0.09% 75 4-Ethylbenzoic acid, undec-2-enyl ester ESTER
7.715 25405 0.14% 86 Pentylcyclohexane CYCLOPARAFFIN 7.844 29783 0.16% 88 3,7-Dimethylnonane PARAFFIN 7.927 27349 0.15% 64 1-Ethyl-1-methylindane UNCLASSIFIED
8 27926 0.15% 86 Sulfurous acid, 2-ethylhexyl hexyl ester
SULFATE/SULFITE/SULFONE
8.093 48322 0.26% 86 3-Ethyl-2,7-dimethyloctane PARAFFIN
8.185 12891 0.07% 74 6-Methyl-tetralin HYDROCYCLIC AROMATIC
8.326 12424 0.07% 65 1,2,3,4,5-Pentamethylbenzene UNCLASSIFIED 8.509 220861 1.21% 93 n-Tridecane PARAFFIN 8.656 93890 0.51% 89 2-Methylnaphthalene PAH 8.87 38180 0.21% 80 1-Methylnaphthalene PAH
8.925 7097 0.04% 78 [1-(2-Phenylethyl)-2-propenyl]benzene AROMATIC
8.997 16849 0.09% 73 tert-Butyl butyrate ESTER
9.159 22867 0.12% 83 Oxalic acid, cyclohexyl isobutyl ester ESTER
9.223 155166 0.85% 78 1-Methyloctyl butyrate ESTER 9.283 15309 0.08% 78 3,3,4-Trimethylheptane PARAFFIN
9.36 23619 0.13% 87 Sulfurous acid, 2-ethylhexyl hexyl ester
SULFATE/SULFITE/SULFONE
9.448 27527 0.15% 81 2,2,6,6-Tetramethylheptane PARAFFIN 9.492 15028 0.08% 86 3,7-Dimethylnonane PARAFFIN
9.561 124671 0.68% 93 Propanoic acid, 2-methyl-, 3-hydroxy-2,4,4-trimethylpentyl este ESTER
9.742 9040 0.05% 89 Oxalic acid, allyl butyl ester ESTER 9.843 291399 1.59% 96 n-Tetradecane PARAFFIN
10.434 12534 0.07% 92 Sulfurous acid, isobutyl pentyl ester SULFATE/SULFITE/SULFONE
10.499 14661 0.08% 77 Icosylcyclohexane CYCLOPARAFFIN 10.574 26520 0.14% 90 2,8-Dimethylundecane PARAFFIN 10.648 25610 0.14% 75 3,7-Dimethylnonane PARAFFIN
10.733 18491 0.10% 90 Butanoic acid, 1,1-dimethylethyl este ESTER
10.884 14186 0.08% 81 3,7-Dimethylnonane PARAFFIN
11.033 20978 0.11% 94 2,2-Dimethyl-propyl 2,2-dimethyl-propanesulfinyl sulfone
SULFATE/SULFITE/SULFONE
11.106 152649 0.83% 92 4,7-Dimethylundecane PARAFFIN
11.2 13413 0.07% 84 2,2-Dimethyl-propyl 2,2-dimethyl-propanesulfinyl sulfone
SULFATE/SULFITE/SULFONE
11.223 21412 0.12% 79 2,4-Dimethylheptane PARAFFIN 11.446 32030 0.17% 83 Oxalic acid, isohexyl neopentyl ESTER
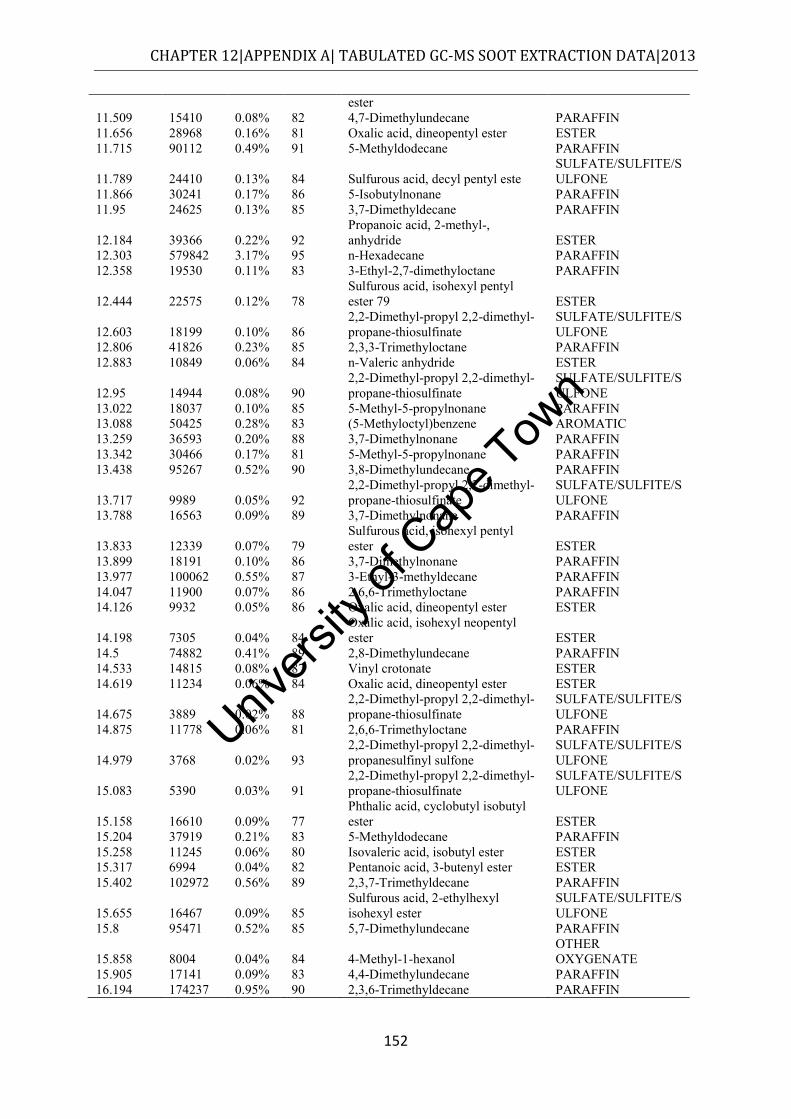
Univers
ity of
Cap
e Tow
n
CHAPTER 12|APPENDIX A| TABULATED GC-MS SOOT EXTRACTION DATA|2013
152
ester 11.509 15410 0.08% 82 4,7-Dimethylundecane PARAFFIN 11.656 28968 0.16% 81 Oxalic acid, dineopentyl ester ESTER 11.715 90112 0.49% 91 5-Methyldodecane PARAFFIN
11.789 24410 0.13% 84 Sulfurous acid, decyl pentyl este SULFATE/SULFITE/SULFONE
11.866 30241 0.17% 86 5-Isobutylnonane PARAFFIN 11.95 24625 0.13% 85 3,7-Dimethyldecane PARAFFIN
12.184 39366 0.22% 92 Propanoic acid, 2-methyl-, anhydride ESTER
12.303 579842 3.17% 95 n-Hexadecane PARAFFIN 12.358 19530 0.11% 83 3-Ethyl-2,7-dimethyloctane PARAFFIN
12.444 22575 0.12% 78 Sulfurous acid, isohexyl pentyl ester 79 ESTER
12.603 18199 0.10% 86 2,2-Dimethyl-propyl 2,2-dimethyl-propane-thiosulfinate
SULFATE/SULFITE/SULFONE
12.806 41826 0.23% 85 2,3,3-Trimethyloctane PARAFFIN 12.883 10849 0.06% 84 n-Valeric anhydride ESTER
12.95 14944 0.08% 90 2,2-Dimethyl-propyl 2,2-dimethyl-propane-thiosulfinate
SULFATE/SULFITE/SULFONE
13.022 18037 0.10% 85 5-Methyl-5-propylnonane PARAFFIN 13.088 50425 0.28% 83 (5-Methyloctyl)benzene AROMATIC 13.259 36593 0.20% 88 3,7-Dimethylnonane PARAFFIN 13.342 30466 0.17% 81 5-Methyl-5-propylnonane PARAFFIN 13.438 95267 0.52% 90 3,8-Dimethylundecane PARAFFIN
13.717 9989 0.05% 92 2,2-Dimethyl-propyl 2,2-dimethyl-propane-thiosulfinate
SULFATE/SULFITE/SULFONE
13.788 16563 0.09% 89 3,7-Dimethylnonane PARAFFIN
13.833 12339 0.07% 79 Sulfurous acid, isohexyl pentyl ester ESTER
13.899 18191 0.10% 86 3,7-Dimethylnonane PARAFFIN 13.977 100062 0.55% 87 3-Ethyl-3-methyldecane PARAFFIN 14.047 11900 0.07% 86 2,6,6-Trimethyloctane PARAFFIN 14.126 9932 0.05% 86 Oxalic acid, dineopentyl ester ESTER
14.198 7305 0.04% 84 Oxalic acid, isohexyl neopentyl ester ESTER
14.5 74882 0.41% 89 2,8-Dimethylundecane PARAFFIN 14.533 14815 0.08% 87 Vinyl crotonate ESTER 14.619 11234 0.06% 84 Oxalic acid, dineopentyl ester ESTER
14.675 3889 0.02% 88 2,2-Dimethyl-propyl 2,2-dimethyl-propane-thiosulfinate
SULFATE/SULFITE/SULFONE
14.875 11778 0.06% 81 2,6,6-Trimethyloctane PARAFFIN
14.979 3768 0.02% 93 2,2-Dimethyl-propyl 2,2-dimethyl-propanesulfinyl sulfone
SULFATE/SULFITE/SULFONE
15.083 5390 0.03% 91 2,2-Dimethyl-propyl 2,2-dimethyl-propane-thiosulfinate
SULFATE/SULFITE/SULFONE
15.158 16610 0.09% 77 Phthalic acid, cyclobutyl isobutyl ester ESTER
15.204 37919 0.21% 83 5-Methyldodecane PARAFFIN 15.258 11245 0.06% 80 Isovaleric acid, isobutyl ester ESTER 15.317 6994 0.04% 82 Pentanoic acid, 3-butenyl ester ESTER 15.402 102972 0.56% 89 2,3,7-Trimethyldecane PARAFFIN
15.655 16467 0.09% 85 Sulfurous acid, 2-ethylhexyl isohexyl ester
SULFATE/SULFITE/SULFONE
15.8 95471 0.52% 85 5,7-Dimethylundecane PARAFFIN
15.858 8004 0.04% 84 4-Methyl-1-hexanol OTHER OXYGENATE
15.905 17141 0.09% 83 4,4-Dimethylundecane PARAFFIN 16.194 174237 0.95% 90 2,3,6-Trimethyldecane PARAFFIN
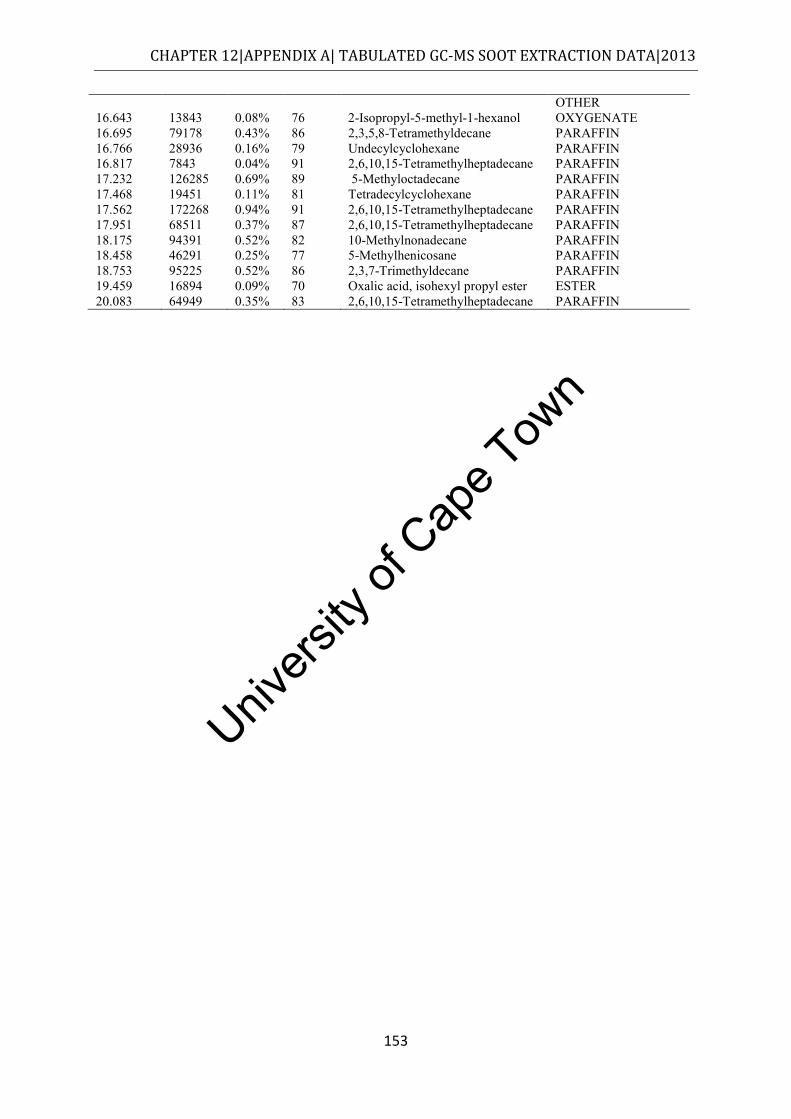
Univers
ity of
Cap
e Tow
n
CHAPTER 12|APPENDIX A| TABULATED GC-MS SOOT EXTRACTION DATA|2013
153
16.643 13843 0.08% 76 2-Isopropyl-5-methyl-1-hexanol OTHER OXYGENATE
16.695 79178 0.43% 86 2,3,5,8-Tetramethyldecane PARAFFIN 16.766 28936 0.16% 79 Undecylcyclohexane PARAFFIN 16.817 7843 0.04% 91 2,6,10,15-Tetramethylheptadecane PARAFFIN 17.232 126285 0.69% 89 5-Methyloctadecane PARAFFIN 17.468 19451 0.11% 81 Tetradecylcyclohexane PARAFFIN 17.562 172268 0.94% 91 2,6,10,15-Tetramethylheptadecane PARAFFIN 17.951 68511 0.37% 87 2,6,10,15-Tetramethylheptadecane PARAFFIN 18.175 94391 0.52% 82 10-Methylnonadecane PARAFFIN 18.458 46291 0.25% 77 5-Methylhenicosane PARAFFIN 18.753 95225 0.52% 86 2,3,7-Trimethyldecane PARAFFIN 19.459 16894 0.09% 70 Oxalic acid, isohexyl propyl ester ESTER 20.083 64949 0.35% 83 2,6,10,15-Tetramethylheptadecane PARAFFIN
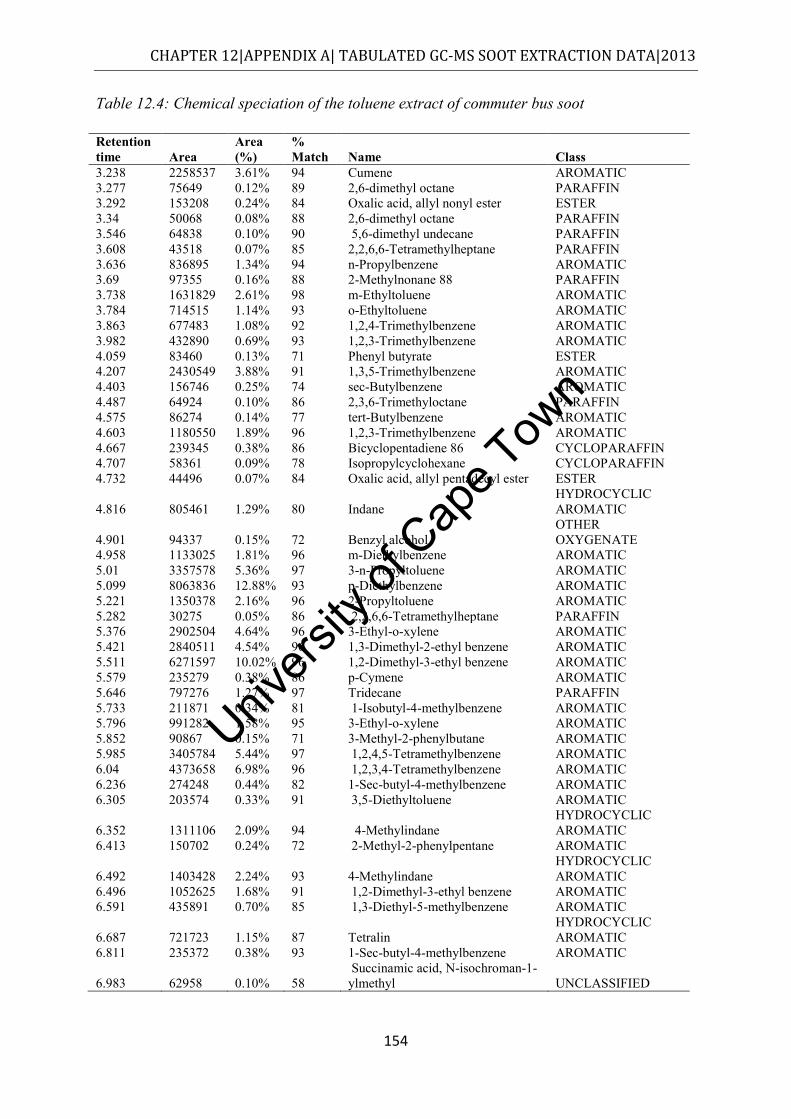
Univers
ity of
Cap
e Tow
n
CHAPTER 12|APPENDIX A| TABULATED GC-MS SOOT EXTRACTION DATA|2013
154
Table 12.4: Chemical speciation of the toluene extract of commuter bus soot
Retention time Area
Area (%)
% Match Name Class
3.238 2258537 3.61% 94 Cumene AROMATIC 3.277 75649 0.12% 89 2,6-dimethyl octane PARAFFIN 3.292 153208 0.24% 84 Oxalic acid, allyl nonyl ester ESTER 3.34 50068 0.08% 88 2,6-dimethyl octane PARAFFIN 3.546 64838 0.10% 90 5,6-dimethyl undecane PARAFFIN 3.608 43518 0.07% 85 2,2,6,6-Tetramethylheptane PARAFFIN 3.636 836895 1.34% 94 n-Propylbenzene AROMATIC 3.69 97355 0.16% 88 2-Methylnonane 88 PARAFFIN 3.738 1631829 2.61% 98 m-Ethyltoluene AROMATIC 3.784 714515 1.14% 93 o-Ethyltoluene AROMATIC 3.863 677483 1.08% 92 1,2,4-Trimethylbenzene AROMATIC 3.982 432890 0.69% 93 1,2,3-Trimethylbenzene AROMATIC 4.059 83460 0.13% 71 Phenyl butyrate ESTER 4.207 2430549 3.88% 91 1,3,5-Trimethylbenzene AROMATIC 4.403 156746 0.25% 74 sec-Butylbenzene AROMATIC 4.487 64924 0.10% 86 2,3,6-Trimethyloctane PARAFFIN 4.575 86274 0.14% 77 tert-Butylbenzene AROMATIC 4.603 1180550 1.89% 96 1,2,3-Trimethylbenzene AROMATIC 4.667 239345 0.38% 86 Bicyclopentadiene 86 CYCLOPARAFFIN 4.707 58361 0.09% 78 Isopropylcyclohexane CYCLOPARAFFIN 4.732 44496 0.07% 84 Oxalic acid, allyl pentadecyl ester ESTER
4.816 805461 1.29% 80 Indane HYDROCYCLIC AROMATIC
4.901 94337 0.15% 72 Benzyl alcohol OTHER OXYGENATE
4.958 1133025 1.81% 96 m-Diethylbenzene AROMATIC 5.01 3357578 5.36% 97 3-n-Propyltoluene AROMATIC 5.099 8063836 12.88% 93 p-Diethylbenzene AROMATIC 5.221 1350378 2.16% 96 2-Propyltoluene AROMATIC 5.282 30275 0.05% 86 2,2,6,6-Tetramethylheptane PARAFFIN 5.376 2902504 4.64% 96 3-Ethyl-o-xylene AROMATIC 5.421 2840511 4.54% 96 1,3-Dimethyl-2-ethyl benzene AROMATIC 5.511 6271597 10.02% 96 1,2-Dimethyl-3-ethyl benzene AROMATIC 5.579 235279 0.38% 86 p-Cymene AROMATIC 5.646 797276 1.27% 97 Tridecane PARAFFIN 5.733 211871 0.34% 81 1-Isobutyl-4-methylbenzene AROMATIC 5.796 991282 1.58% 95 3-Ethyl-o-xylene AROMATIC 5.852 90867 0.15% 71 3-Methyl-2-phenylbutane AROMATIC 5.985 3405784 5.44% 97 1,2,4,5-Tetramethylbenzene AROMATIC 6.04 4373658 6.98% 96 1,2,3,4-Tetramethylbenzene AROMATIC 6.236 274248 0.44% 82 1-Sec-butyl-4-methylbenzene AROMATIC 6.305 203574 0.33% 91 3,5-Diethyltoluene AROMATIC
6.352 1311106 2.09% 94 4-Methylindane HYDROCYCLIC AROMATIC
6.413 150702 0.24% 72 2-Methyl-2-phenylpentane AROMATIC
6.492 1403428 2.24% 93 4-Methylindane HYDROCYCLIC AROMATIC
6.496 1052625 1.68% 91 1,2-Dimethyl-3-ethyl benzene AROMATIC 6.591 435891 0.70% 85 1,3-Diethyl-5-methylbenzene AROMATIC
6.687 721723 1.15% 87 Tetralin HYDROCYCLIC AROMATIC
6.811 235372 0.38% 93 1-Sec-butyl-4-methylbenzene AROMATIC
6.983 62958 0.10% 58 Succinamic acid, N-isochroman-1-ylmethyl UNCLASSIFIED
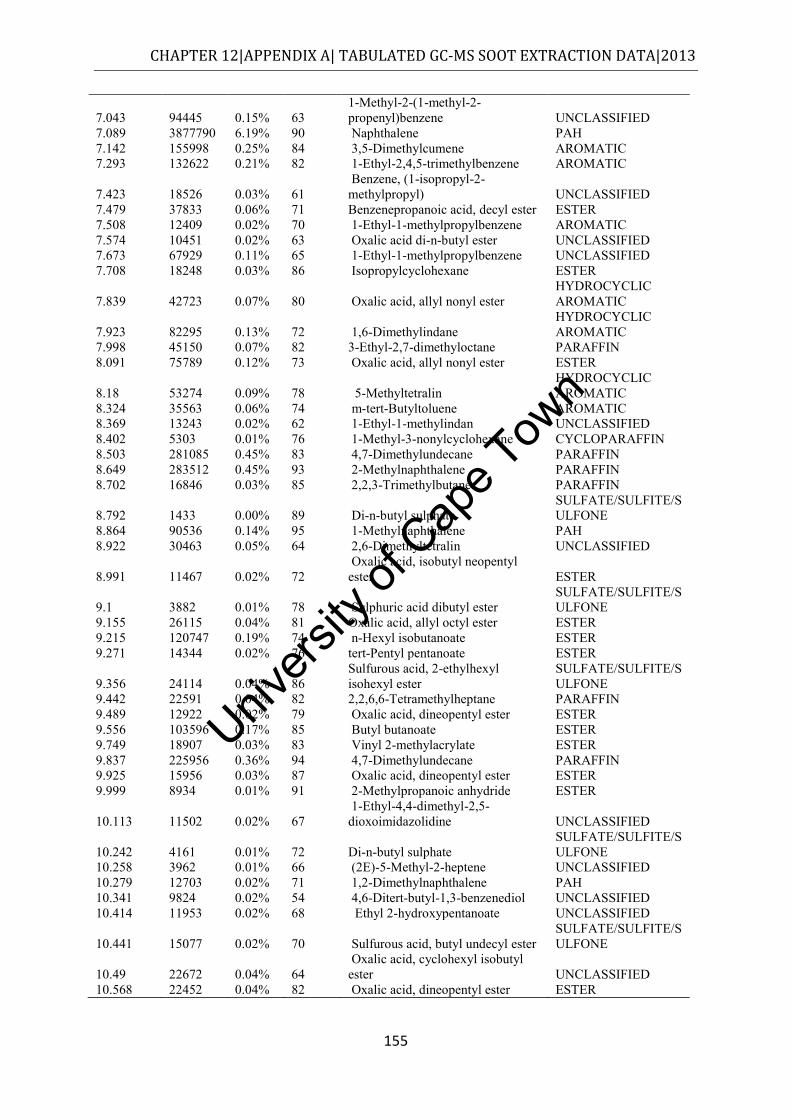
Univers
ity of
Cap
e Tow
n
CHAPTER 12|APPENDIX A| TABULATED GC-MS SOOT EXTRACTION DATA|2013
155
7.043 94445 0.15% 63 1-Methyl-2-(1-methyl-2-propenyl)benzene UNCLASSIFIED
7.089 3877790 6.19% 90 Naphthalene PAH 7.142 155998 0.25% 84 3,5-Dimethylcumene AROMATIC 7.293 132622 0.21% 82 1-Ethyl-2,4,5-trimethylbenzene AROMATIC
7.423 18526 0.03% 61 Benzene, (1-isopropyl-2-methylpropyl) UNCLASSIFIED
7.479 37833 0.06% 71 Benzenepropanoic acid, decyl ester ESTER 7.508 12409 0.02% 70 1-Ethyl-1-methylpropylbenzene AROMATIC 7.574 10451 0.02% 63 Oxalic acid di-n-butyl ester UNCLASSIFIED 7.673 67929 0.11% 65 1-Ethyl-1-methylpropylbenzene UNCLASSIFIED 7.708 18248 0.03% 86 Isopropylcyclohexane ESTER
7.839 42723 0.07% 80 Oxalic acid, allyl nonyl ester HYDROCYCLIC AROMATIC
7.923 82295 0.13% 72 1,6-Dimethylindane HYDROCYCLIC AROMATIC
7.998 45150 0.07% 82 3-Ethyl-2,7-dimethyloctane PARAFFIN 8.091 75789 0.12% 73 Oxalic acid, allyl nonyl ester ESTER
8.18 53274 0.09% 78 5-Methyltetralin HYDROCYCLIC AROMATIC
8.324 35563 0.06% 74 m-tert-Butyltoluene AROMATIC 8.369 13243 0.02% 62 1-Ethyl-1-methylindan UNCLASSIFIED 8.402 5303 0.01% 76 1-Methyl-3-nonylcyclohexane CYCLOPARAFFIN 8.503 281085 0.45% 83 4,7-Dimethylundecane PARAFFIN 8.649 283512 0.45% 93 2-Methylnaphthalene PARAFFIN 8.702 16846 0.03% 85 2,2,3-Trimethylbutane PARAFFIN
8.792 1433 0.00% 89 Di-n-butyl sulphate SULFATE/SULFITE/SULFONE
8.864 90536 0.14% 95 1-Methylnaphthalene PAH 8.922 30463 0.05% 64 2,6-Dimethyltetralin UNCLASSIFIED
8.991 11467 0.02% 72 Oxalic acid, isobutyl neopentyl ester ESTER
9.1 3882 0.01% 78 Sulphuric acid dibutyl ester SULFATE/SULFITE/SULFONE
9.155 26115 0.04% 81 Oxalic acid, allyl octyl ester ESTER 9.215 120747 0.19% 74 n-Hexyl isobutanoate ESTER 9.271 14344 0.02% 76 tert-Pentyl pentanoate ESTER
9.356 24114 0.04% 86 Sulfurous acid, 2-ethylhexyl isohexyl ester
SULFATE/SULFITE/SULFONE
9.442 22591 0.04% 82 2,2,6,6-Tetramethylheptane PARAFFIN 9.489 12922 0.02% 79 Oxalic acid, dineopentyl ester ESTER 9.556 103596 0.17% 85 Butyl butanoate ESTER 9.749 18907 0.03% 83 Vinyl 2-methylacrylate ESTER 9.837 225956 0.36% 94 4,7-Dimethylundecane PARAFFIN 9.925 15956 0.03% 87 Oxalic acid, dineopentyl ester ESTER 9.999 8934 0.01% 91 2-Methylpropanoic anhydride ESTER
10.113 11502 0.02% 67 1-Ethyl-4,4-dimethyl-2,5-dioxoimidazolidine UNCLASSIFIED
10.242 4161 0.01% 72 Di-n-butyl sulphate SULFATE/SULFITE/SULFONE
10.258 3962 0.01% 66 (2E)-5-Methyl-2-heptene UNCLASSIFIED 10.279 12703 0.02% 71 1,2-Dimethylnaphthalene PAH 10.341 9824 0.02% 54 4,6-Ditert-butyl-1,3-benzenediol UNCLASSIFIED 10.414 11953 0.02% 68 Ethyl 2-hydroxypentanoate UNCLASSIFIED
10.441 15077 0.02% 70 Sulfurous acid, butyl undecyl ester SULFATE/SULFITE/SULFONE
10.49 22672 0.04% 64 Oxalic acid, cyclohexyl isobutyl ester UNCLASSIFIED
10.568 22452 0.04% 82 Oxalic acid, dineopentyl ester ESTER
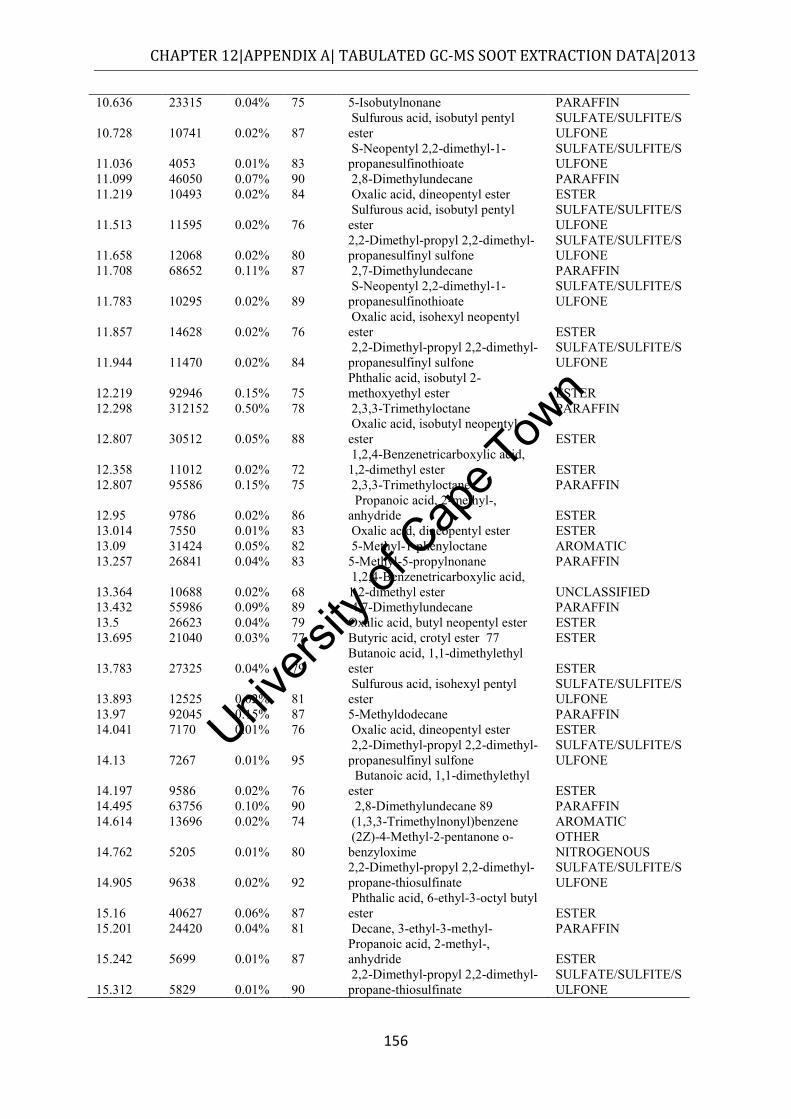
Univers
ity of
Cap
e Tow
n
CHAPTER 12|APPENDIX A| TABULATED GC-MS SOOT EXTRACTION DATA|2013
156
10.636 23315 0.04% 75 5-Isobutylnonane PARAFFIN
10.728 10741 0.02% 87 Sulfurous acid, isobutyl pentyl ester
SULFATE/SULFITE/SULFONE
11.036 4053 0.01% 83 S-Neopentyl 2,2-dimethyl-1-propanesulfinothioate
SULFATE/SULFITE/SULFONE
11.099 46050 0.07% 90 2,8-Dimethylundecane PARAFFIN 11.219 10493 0.02% 84 Oxalic acid, dineopentyl ester ESTER
11.513 11595 0.02% 76 Sulfurous acid, isobutyl pentyl ester
SULFATE/SULFITE/SULFONE
11.658 12068 0.02% 80 2,2-Dimethyl-propyl 2,2-dimethyl-propanesulfinyl sulfone
SULFATE/SULFITE/SULFONE
11.708 68652 0.11% 87 2,7-Dimethylundecane PARAFFIN
11.783 10295 0.02% 89 S-Neopentyl 2,2-dimethyl-1-propanesulfinothioate
SULFATE/SULFITE/SULFONE
11.857 14628 0.02% 76 Oxalic acid, isohexyl neopentyl ester ESTER
11.944 11470 0.02% 84 2,2-Dimethyl-propyl 2,2-dimethyl-propanesulfinyl sulfone
SULFATE/SULFITE/SULFONE
12.219 92946 0.15% 75 Phthalic acid, isobutyl 2-methoxyethyl ester ESTER
12.298 312152 0.50% 78 2,3,3-Trimethyloctane PARAFFIN
12.807 30512 0.05% 88 Oxalic acid, isobutyl neopentyl ester ESTER
12.358 11012 0.02% 72 1,2,4-Benzenetricarboxylic acid, 1,2-dimethyl ester ESTER
12.807 95586 0.15% 75 2,3,3-Trimethyloctane PARAFFIN
12.95 9786 0.02% 86 Propanoic acid, 2-methyl-, anhydride ESTER
13.014 7550 0.01% 83 Oxalic acid, dineopentyl ester ESTER 13.09 31424 0.05% 82 5-Methyl-1-phenyloctane AROMATIC 13.257 26841 0.04% 83 5-Methyl-5-propylnonane PARAFFIN
13.364 10688 0.02% 68 1,2,4-Benzenetricarboxylic acid, 1,2-dimethyl ester UNCLASSIFIED
13.432 55986 0.09% 89 4,7-Dimethylundecane PARAFFIN 13.5 26623 0.04% 79 Oxalic acid, butyl neopentyl ester ESTER 13.695 21040 0.03% 77 Butyric acid, crotyl ester 77 ESTER
13.783 27325 0.04% 79 Butanoic acid, 1,1-dimethylethyl ester ESTER
13.893 12525 0.02% 81 Sulfurous acid, isohexyl pentyl ester
SULFATE/SULFITE/SULFONE
13.97 92045 0.15% 87 5-Methyldodecane PARAFFIN 14.041 7170 0.01% 76 Oxalic acid, dineopentyl ester ESTER
14.13 7267 0.01% 95 2,2-Dimethyl-propyl 2,2-dimethyl-propanesulfinyl sulfone
SULFATE/SULFITE/SULFONE
14.197 9586 0.02% 76 Butanoic acid, 1,1-dimethylethyl ester ESTER
14.495 63756 0.10% 90 2,8-Dimethylundecane 89 PARAFFIN 14.614 13696 0.02% 74 (1,3,3-Trimethylnonyl)benzene AROMATIC
14.762 5205 0.01% 80 (2Z)-4-Methyl-2-pentanone o-benzyloxime
OTHER NITROGENOUS
14.905 9638 0.02% 92 2,2-Dimethyl-propyl 2,2-dimethyl-propane-thiosulfinate
SULFATE/SULFITE/SULFONE
15.16 40627 0.06% 87 Phthalic acid, 6-ethyl-3-octyl butyl ester ESTER
15.201 24420 0.04% 81 Decane, 3-ethyl-3-methyl- PARAFFIN
15.242 5699 0.01% 87 Propanoic acid, 2-methyl-, anhydride ESTER
15.312 5829 0.01% 90 2,2-Dimethyl-propyl 2,2-dimethyl-propane-thiosulfinate
SULFATE/SULFITE/SULFONE
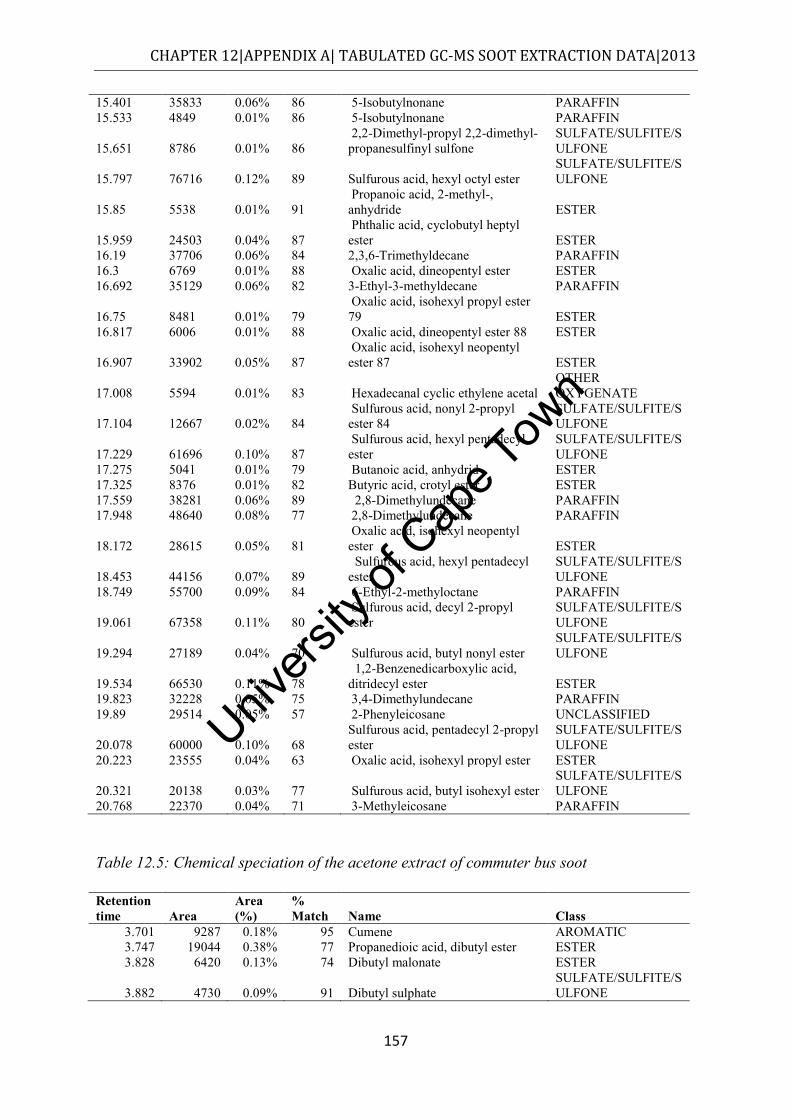
Univers
ity of
Cap
e Tow
n
CHAPTER 12|APPENDIX A| TABULATED GC-MS SOOT EXTRACTION DATA|2013
157
15.401 35833 0.06% 86 5-Isobutylnonane PARAFFIN 15.533 4849 0.01% 86 5-Isobutylnonane PARAFFIN
15.651 8786 0.01% 86 2,2-Dimethyl-propyl 2,2-dimethyl-propanesulfinyl sulfone
SULFATE/SULFITE/SULFONE
15.797 76716 0.12% 89 Sulfurous acid, hexyl octyl ester SULFATE/SULFITE/SULFONE
15.85 5538 0.01% 91 Propanoic acid, 2-methyl-, anhydride ESTER
15.959 24503 0.04% 87 Phthalic acid, cyclobutyl heptyl ester ESTER
16.19 37706 0.06% 84 2,3,6-Trimethyldecane PARAFFIN 16.3 6769 0.01% 88 Oxalic acid, dineopentyl ester ESTER 16.692 35129 0.06% 82 3-Ethyl-3-methyldecane PARAFFIN
16.75 8481 0.01% 79 Oxalic acid, isohexyl propyl ester 79 ESTER
16.817 6006 0.01% 88 Oxalic acid, dineopentyl ester 88 ESTER
16.907 33902 0.05% 87 Oxalic acid, isohexyl neopentyl ester 87 ESTER
17.008 5594 0.01% 83 Hexadecanal cyclic ethylene acetal OTHER OXYGENATE
17.104 12667 0.02% 84 Sulfurous acid, nonyl 2-propyl ester 84
SULFATE/SULFITE/SULFONE
17.229 61696 0.10% 87 Sulfurous acid, hexyl pentadecyl ester
SULFATE/SULFITE/SULFONE
17.275 5041 0.01% 79 Butanoic acid, anhydrid ESTER 17.325 8376 0.01% 82 Butyric acid, crotyl ester ESTER 17.559 38281 0.06% 89 2,8-Dimethylundecane PARAFFIN 17.948 48640 0.08% 77 2,8-Dimethylundecane PARAFFIN
18.172 28615 0.05% 81 Oxalic acid, isohexyl neopentyl ester ESTER
18.453 44156 0.07% 89 Sulfurous acid, hexyl pentadecyl ester
SULFATE/SULFITE/SULFONE
18.749 55700 0.09% 84 6-Ethyl-2-methyloctane PARAFFIN
19.061 67358 0.11% 80 Sulfurous acid, decyl 2-propyl ester
SULFATE/SULFITE/SULFONE
19.294 27189 0.04% 70 Sulfurous acid, butyl nonyl ester SULFATE/SULFITE/SULFONE
19.534 66530 0.11% 78 1,2-Benzenedicarboxylic acid, ditridecyl ester ESTER
19.823 32228 0.05% 75 3,4-Dimethylundecane PARAFFIN 19.89 29514 0.05% 57 2-Phenyleicosane UNCLASSIFIED
20.078 60000 0.10% 68 Sulfurous acid, pentadecyl 2-propyl ester
SULFATE/SULFITE/SULFONE
20.223 23555 0.04% 63 Oxalic acid, isohexyl propyl ester ESTER
20.321 20138 0.03% 77 Sulfurous acid, butyl isohexyl ester SULFATE/SULFITE/SULFONE
20.768 22370 0.04% 71 3-Methyleicosane PARAFFIN
Table 12.5: Chemical speciation of the acetone extract of commuter bus soot
Retention time Area
Area (%)
% Match Name Class
3.701 9287 0.18% 95 Cumene AROMATIC 3.747 19044 0.38% 77 Propanedioic acid, dibutyl ester ESTER 3.828 6420 0.13% 74 Dibutyl malonate ESTER
3.882 4730 0.09% 91 Dibutyl sulphate SULFATE/SULFITE/SULFONE
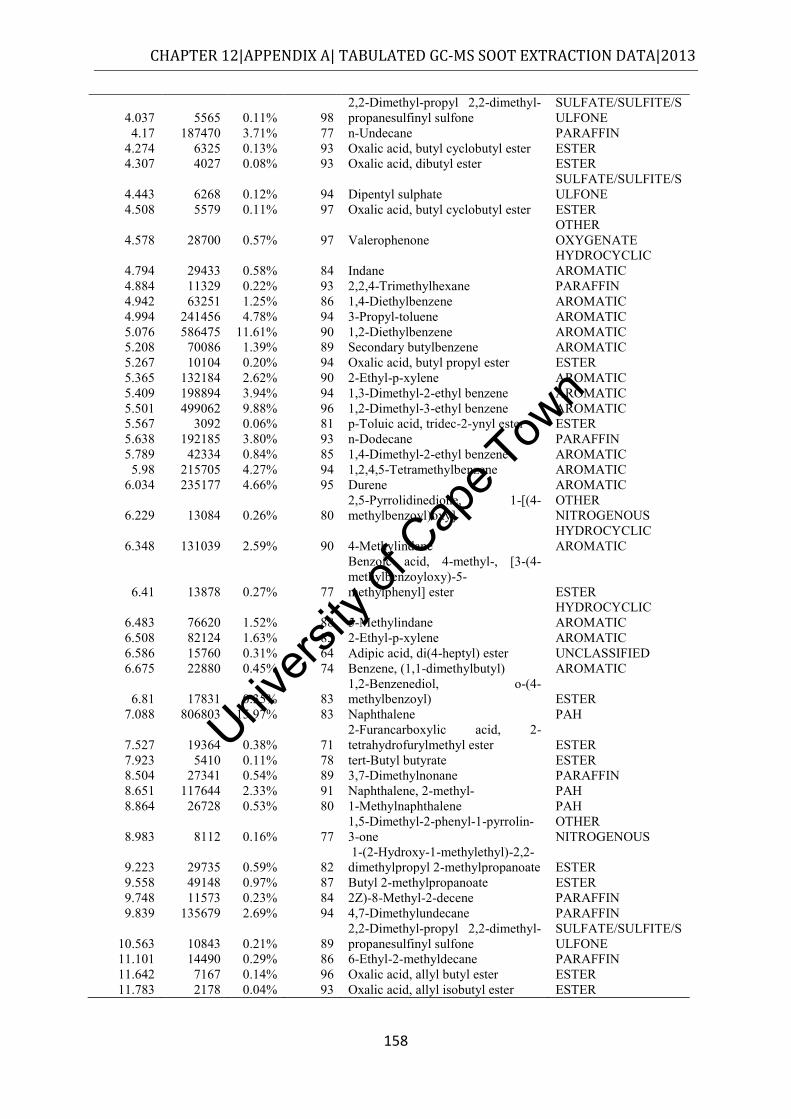
Univers
ity of
Cap
e Tow
n
CHAPTER 12|APPENDIX A| TABULATED GC-MS SOOT EXTRACTION DATA|2013
158
4.037 5565 0.11% 98 2,2-Dimethyl-propyl 2,2-dimethyl-propanesulfinyl sulfone
SULFATE/SULFITE/SULFONE
4.17 187470 3.71% 77 n-Undecane PARAFFIN 4.274 6325 0.13% 93 Oxalic acid, butyl cyclobutyl ester ESTER 4.307 4027 0.08% 93 Oxalic acid, dibutyl ester ESTER
4.443 6268 0.12% 94 Dipentyl sulphate SULFATE/SULFITE/SULFONE
4.508 5579 0.11% 97 Oxalic acid, butyl cyclobutyl ester ESTER
4.578 28700 0.57% 97 Valerophenone OTHER OXYGENATE
4.794 29433 0.58% 84 Indane HYDROCYCLIC AROMATIC
4.884 11329 0.22% 93 2,2,4-Trimethylhexane PARAFFIN 4.942 63251 1.25% 86 1,4-Diethylbenzene AROMATIC 4.994 241456 4.78% 94 3-Propyl-toluene AROMATIC 5.076 586475 11.61% 90 1,2-Diethylbenzene AROMATIC 5.208 70086 1.39% 89 Secondary butylbenzene AROMATIC 5.267 10104 0.20% 94 Oxalic acid, butyl propyl ester ESTER 5.365 132184 2.62% 90 2-Ethyl-p-xylene AROMATIC 5.409 198894 3.94% 94 1,3-Dimethyl-2-ethyl benzene AROMATIC 5.501 499062 9.88% 96 1,2-Dimethyl-3-ethyl benzene AROMATIC 5.567 3092 0.06% 81 p-Toluic acid, tridec-2-ynyl ester ESTER 5.638 192185 3.80% 93 n-Dodecane PARAFFIN 5.789 42334 0.84% 85 1,4-Dimethyl-2-ethyl benzene AROMATIC
5.98 215705 4.27% 94 1,2,4,5-Tetramethylbenzene AROMATIC 6.034 235177 4.66% 95 Durene AROMATIC
6.229 13084 0.26% 80 2,5-Pyrrolidinedione, 1-[(4-methylbenzoyl)oxy]
OTHER NITROGENOUS
6.348 131039 2.59% 90 4-Methylindane HYDROCYCLIC AROMATIC
6.41 13878 0.27% 77
Benzoic acid, 4-methyl-, [3-(4-methylbenzoyloxy)-5-methylphenyl] ester ESTER
6.483 76620 1.52% 88 5-Methylindane HYDROCYCLIC AROMATIC
6.508 82124 1.63% 85 2-Ethyl-p-xylene AROMATIC 6.586 15760 0.31% 64 Adipic acid, di(4-heptyl) ester UNCLASSIFIED 6.675 22880 0.45% 74 Benzene, (1,1-dimethylbutyl) AROMATIC
6.81 17831 0.35% 83 1,2-Benzenediol, o-(4-methylbenzoyl) ESTER
7.088 806803 15.97% 83 Naphthalene PAH
7.527 19364 0.38% 71 2-Furancarboxylic acid, 2-tetrahydrofurylmethyl ester ESTER
7.923 5410 0.11% 78 tert-Butyl butyrate ESTER 8.504 27341 0.54% 89 3,7-Dimethylnonane PARAFFIN 8.651 117644 2.33% 91 Naphthalene, 2-methyl- PAH 8.864 26728 0.53% 80 1-Methylnaphthalene PAH
8.983 8112 0.16% 77 1,5-Dimethyl-2-phenyl-1-pyrrolin-3-one
OTHER NITROGENOUS
9.223 29735 0.59% 82 1-(2-Hydroxy-1-methylethyl)-2,2-dimethylpropyl 2-methylpropanoate ESTER
9.558 49148 0.97% 87 Butyl 2-methylpropanoate ESTER 9.748 11573 0.23% 84 2Z)-8-Methyl-2-decene PARAFFIN 9.839 135679 2.69% 94 4,7-Dimethylundecane PARAFFIN
10.563 10843 0.21% 89 2,2-Dimethyl-propyl 2,2-dimethyl-propanesulfinyl sulfone
SULFATE/SULFITE/SULFONE
11.101 14490 0.29% 86 6-Ethyl-2-methyldecane PARAFFIN 11.642 7167 0.14% 96 Oxalic acid, allyl butyl ester ESTER 11.783 2178 0.04% 93 Oxalic acid, allyl isobutyl ester ESTER
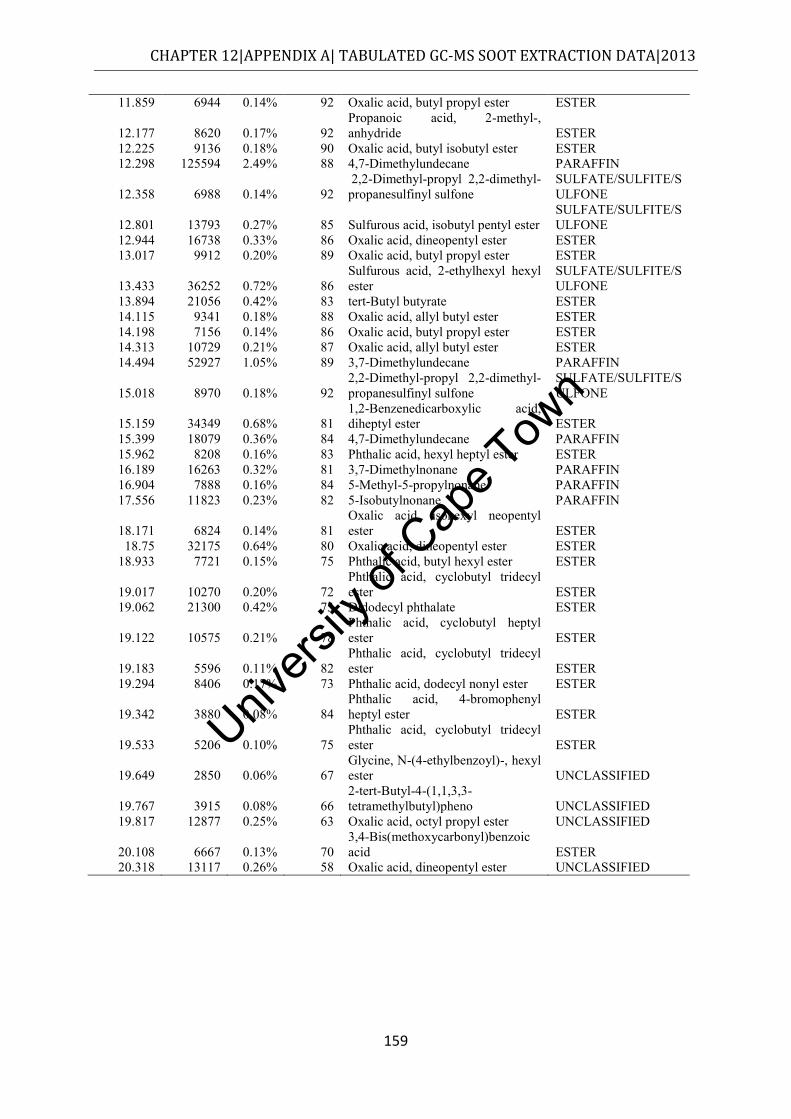
Univers
ity of
Cap
e Tow
n
CHAPTER 12|APPENDIX A| TABULATED GC-MS SOOT EXTRACTION DATA|2013
159
11.859 6944 0.14% 92 Oxalic acid, butyl propyl ester ESTER
12.177 8620 0.17% 92 Propanoic acid, 2-methyl-, anhydride ESTER
12.225 9136 0.18% 90 Oxalic acid, butyl isobutyl ester ESTER 12.298 125594 2.49% 88 4,7-Dimethylundecane PARAFFIN
12.358 6988 0.14% 92 2,2-Dimethyl-propyl 2,2-dimethyl-propanesulfinyl sulfone
SULFATE/SULFITE/SULFONE
12.801 13793 0.27% 85 Sulfurous acid, isobutyl pentyl ester SULFATE/SULFITE/SULFONE
12.944 16738 0.33% 86 Oxalic acid, dineopentyl ester ESTER 13.017 9912 0.20% 89 Oxalic acid, butyl propyl ester ESTER
13.433 36252 0.72% 86 Sulfurous acid, 2-ethylhexyl hexyl ester
SULFATE/SULFITE/SULFONE
13.894 21056 0.42% 83 tert-Butyl butyrate ESTER 14.115 9341 0.18% 88 Oxalic acid, allyl butyl ester ESTER 14.198 7156 0.14% 86 Oxalic acid, butyl propyl ester ESTER 14.313 10729 0.21% 87 Oxalic acid, allyl butyl ester ESTER 14.494 52927 1.05% 89 3,7-Dimethylundecane PARAFFIN
15.018 8970 0.18% 92 2,2-Dimethyl-propyl 2,2-dimethyl-propanesulfinyl sulfone
SULFATE/SULFITE/SULFONE
15.159 34349 0.68% 81 1,2-Benzenedicarboxylic acid, diheptyl ester ESTER
15.399 18079 0.36% 84 4,7-Dimethylundecane PARAFFIN 15.962 8208 0.16% 83 Phthalic acid, hexyl heptyl ester ESTER 16.189 16263 0.32% 81 3,7-Dimethylnonane PARAFFIN 16.904 7888 0.16% 84 5-Methyl-5-propylnonane PARAFFIN 17.556 11823 0.23% 82 5-Isobutylnonane PARAFFIN
18.171 6824 0.14% 81 Oxalic acid, isohexyl neopentyl ester ESTER
18.75 32175 0.64% 80 Oxalic acid, dineopentyl ester ESTER 18.933 7721 0.15% 75 Phthalic acid, butyl hexyl ester ESTER
19.017 10270 0.20% 72 Phthalic acid, cyclobutyl tridecyl ester ESTER
19.062 21300 0.42% 73 Didodecyl phthalate ESTER
19.122 10575 0.21% 78 Phthalic acid, cyclobutyl heptyl ester ESTER
19.183 5596 0.11% 82 Phthalic acid, cyclobutyl tridecyl ester ESTER
19.294 8406 0.17% 73 Phthalic acid, dodecyl nonyl ester ESTER
19.342 3880 0.08% 84 Phthalic acid, 4-bromophenyl heptyl ester ESTER
19.533 5206 0.10% 75 Phthalic acid, cyclobutyl tridecyl ester ESTER
19.649 2850 0.06% 67 Glycine, N-(4-ethylbenzoyl)-, hexyl ester UNCLASSIFIED
19.767 3915 0.08% 66 2-tert-Butyl-4-(1,1,3,3-tetramethylbutyl)pheno UNCLASSIFIED
19.817 12877 0.25% 63 Oxalic acid, octyl propyl ester UNCLASSIFIED
20.108 6667 0.13% 70 3,4-Bis(methoxycarbonyl)benzoic acid ESTER
20.318 13117 0.26% 58 Oxalic acid, dineopentyl ester UNCLASSIFIED
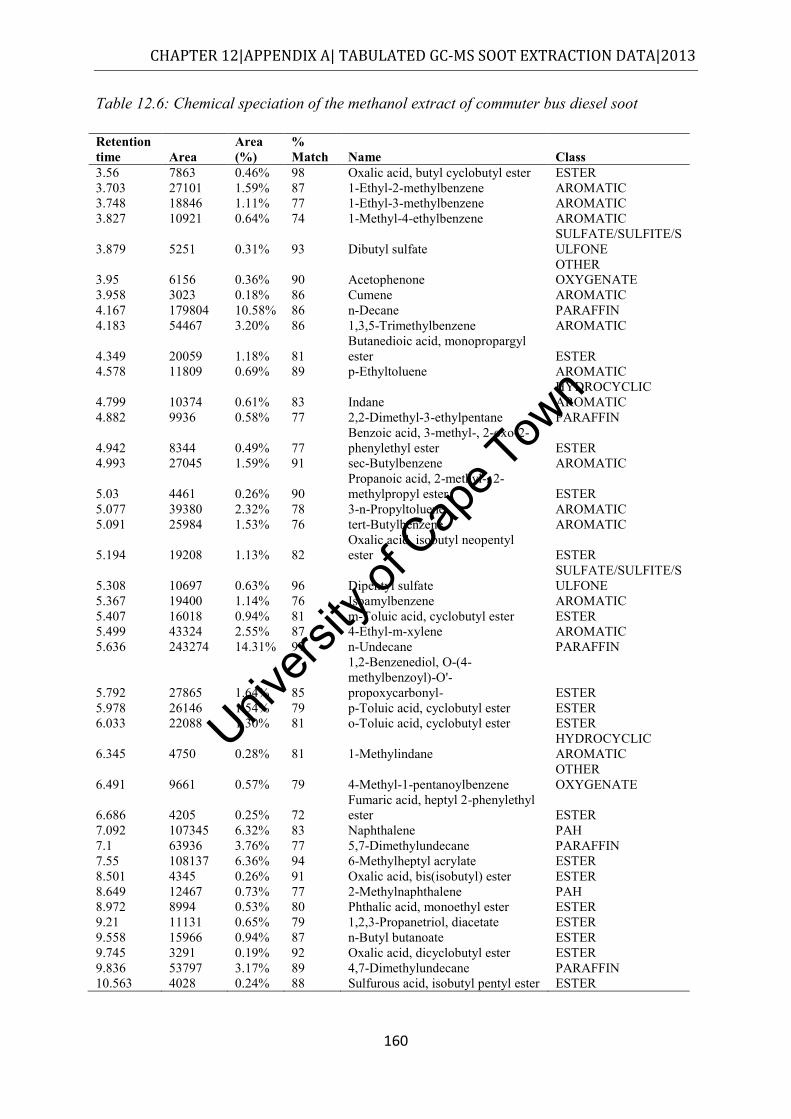
Univers
ity of
Cap
e Tow
n
CHAPTER 12|APPENDIX A| TABULATED GC-MS SOOT EXTRACTION DATA|2013
160
Table 12.6: Chemical speciation of the methanol extract of commuter bus diesel soot
Retention time Area
Area (%)
% Match Name Class
3.56 7863 0.46% 98 Oxalic acid, butyl cyclobutyl ester ESTER 3.703 27101 1.59% 87 1-Ethyl-2-methylbenzene AROMATIC 3.748 18846 1.11% 77 1-Ethyl-3-methylbenzene AROMATIC 3.827 10921 0.64% 74 1-Methyl-4-ethylbenzene AROMATIC
3.879 5251 0.31% 93 Dibutyl sulfate SULFATE/SULFITE/SULFONE
3.95 6156 0.36% 90 Acetophenone OTHER OXYGENATE
3.958 3023 0.18% 86 Cumene AROMATIC 4.167 179804 10.58% 86 n-Decane PARAFFIN 4.183 54467 3.20% 86 1,3,5-Trimethylbenzene AROMATIC
4.349 20059 1.18% 81 Butanedioic acid, monopropargyl ester ESTER
4.578 11809 0.69% 89 p-Ethyltoluene AROMATIC
4.799 10374 0.61% 83 Indane HYDROCYCLIC AROMATIC
4.882 9936 0.58% 77 2,2-Dimethyl-3-ethylpentane PARAFFIN
4.942 8344 0.49% 77 Benzoic acid, 3-methyl-, 2-oxo-2-phenylethyl ester ESTER
4.993 27045 1.59% 91 sec-Butylbenzene AROMATIC
5.03 4461 0.26% 90 Propanoic acid, 2-methyl-, 2-methylpropyl ester ESTER
5.077 39380 2.32% 78 3-n-Propyltoluene AROMATIC 5.091 25984 1.53% 76 tert-Butylbenzene AROMATIC
5.194 19208 1.13% 82 Oxalic acid, isobutyl neopentyl ester ESTER
5.308 10697 0.63% 96 Dipentyl sulfate SULFATE/SULFITE/SULFONE
5.367 19400 1.14% 76 Isoamylbenzene AROMATIC 5.407 16018 0.94% 81 m-Toluic acid, cyclobutyl ester ESTER 5.499 43324 2.55% 87 4-Ethyl-m-xylene AROMATIC 5.636 243274 14.31% 97 n-Undecane PARAFFIN
5.792 27865 1.64% 85
1,2-Benzenediol, O-(4-methylbenzoyl)-O'-propoxycarbonyl- ESTER
5.978 26146 1.54% 79 p-Toluic acid, cyclobutyl ester ESTER 6.033 22088 1.30% 81 o-Toluic acid, cyclobutyl ester ESTER
6.345 4750 0.28% 81 1-Methylindane HYDROCYCLIC AROMATIC
6.491 9661 0.57% 79 4-Methyl-1-pentanoylbenzene OTHER OXYGENATE
6.686 4205 0.25% 72 Fumaric acid, heptyl 2-phenylethyl ester ESTER
7.092 107345 6.32% 83 Naphthalene PAH 7.1 63936 3.76% 77 5,7-Dimethylundecane PARAFFIN 7.55 108137 6.36% 94 6-Methylheptyl acrylate ESTER 8.501 4345 0.26% 91 Oxalic acid, bis(isobutyl) ester ESTER 8.649 12467 0.73% 77 2-Methylnaphthalene PAH 8.972 8994 0.53% 80 Phthalic acid, monoethyl ester ESTER 9.21 11131 0.65% 79 1,2,3-Propanetriol, diacetate ESTER 9.558 15966 0.94% 87 n-Butyl butanoate ESTER 9.745 3291 0.19% 92 Oxalic acid, dicyclobutyl ester ESTER 9.836 53797 3.17% 89 4,7-Dimethylundecane PARAFFIN 10.563 4028 0.24% 88 Sulfurous acid, isobutyl pentyl ester ESTER
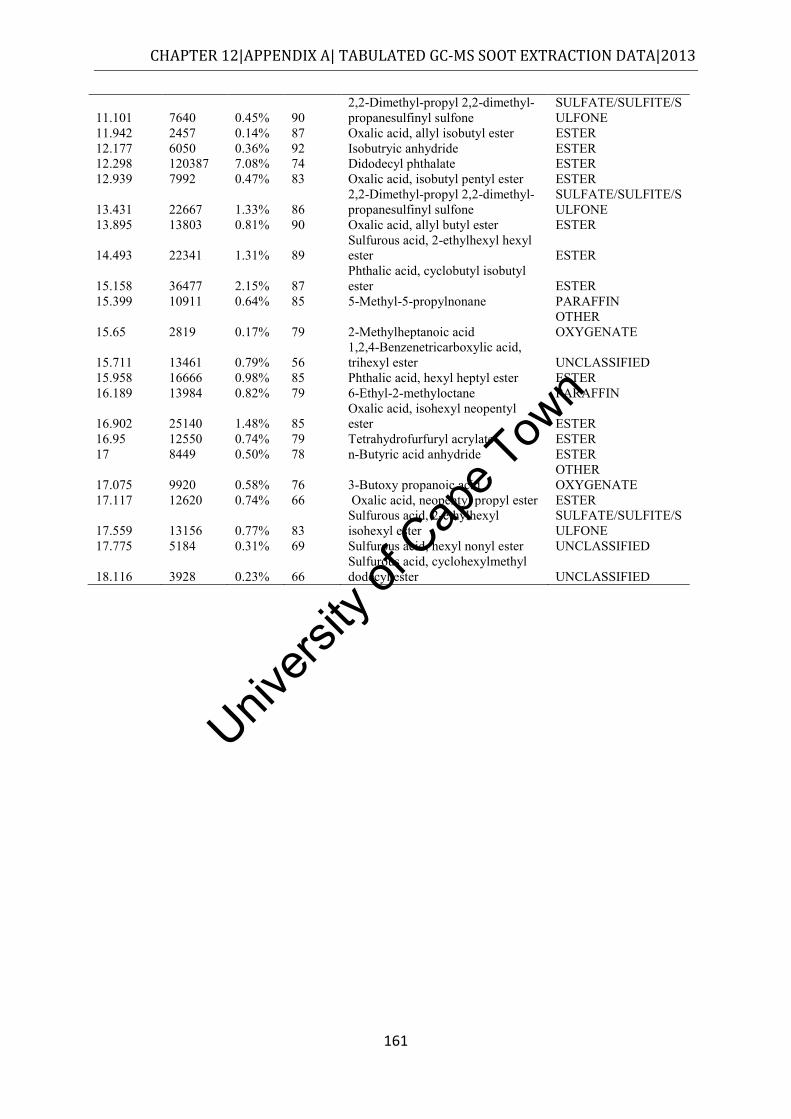
Univers
ity of
Cap
e Tow
n
CHAPTER 12|APPENDIX A| TABULATED GC-MS SOOT EXTRACTION DATA|2013
161
11.101 7640 0.45% 90 2,2-Dimethyl-propyl 2,2-dimethyl-propanesulfinyl sulfone
SULFATE/SULFITE/SULFONE
11.942 2457 0.14% 87 Oxalic acid, allyl isobutyl ester ESTER 12.177 6050 0.36% 92 Isobutryic anhydride ESTER 12.298 120387 7.08% 74 Didodecyl phthalate ESTER 12.939 7992 0.47% 83 Oxalic acid, isobutyl pentyl ester ESTER
13.431 22667 1.33% 86 2,2-Dimethyl-propyl 2,2-dimethyl-propanesulfinyl sulfone
SULFATE/SULFITE/SULFONE
13.895 13803 0.81% 90 Oxalic acid, allyl butyl ester ESTER
14.493 22341 1.31% 89 Sulfurous acid, 2-ethylhexyl hexyl ester ESTER
15.158 36477 2.15% 87 Phthalic acid, cyclobutyl isobutyl ester ESTER
15.399 10911 0.64% 85 5-Methyl-5-propylnonane PARAFFIN
15.65 2819 0.17% 79 2-Methylheptanoic acid OTHER OXYGENATE
15.711 13461 0.79% 56 1,2,4-Benzenetricarboxylic acid, trihexyl ester UNCLASSIFIED
15.958 16666 0.98% 85 Phthalic acid, hexyl heptyl ester ESTER 16.189 13984 0.82% 79 6-Ethyl-2-methyloctane PARAFFIN
16.902 25140 1.48% 85 Oxalic acid, isohexyl neopentyl ester ESTER
16.95 12550 0.74% 79 Tetrahydrofurfuryl acrylate ESTER 17 8449 0.50% 78 n-Butyric acid anhydride ESTER
17.075 9920 0.58% 76 3-Butoxy propanoic acid OTHER OXYGENATE
17.117 12620 0.74% 66 Oxalic acid, neopentyl propyl ester ESTER
17.559 13156 0.77% 83 Sulfurous acid, 2-ethylhexyl isohexyl ester
SULFATE/SULFITE/SULFONE
17.775 5184 0.31% 69 Sulfurous acid, hexyl nonyl ester UNCLASSIFIED
18.116 3928 0.23% 66 Sulfurous acid, cyclohexylmethyl dodecyl ester UNCLASSIFIED
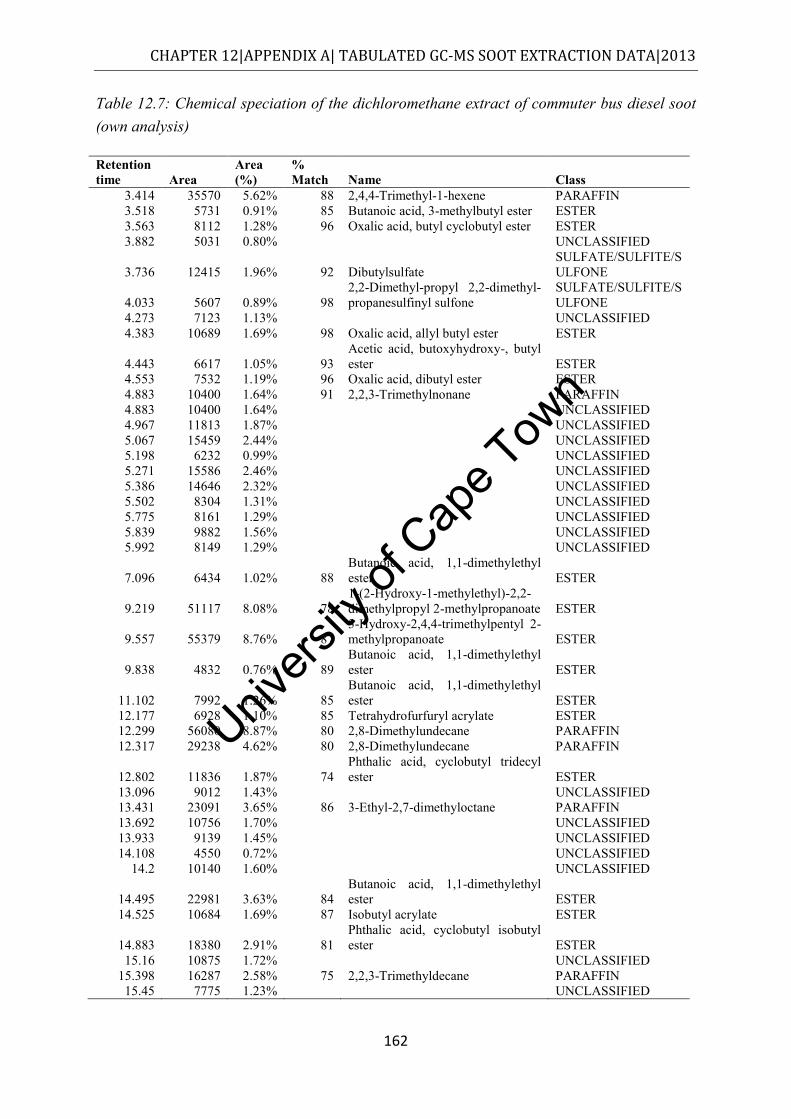
Univers
ity of
Cap
e Tow
n
CHAPTER 12|APPENDIX A| TABULATED GC-MS SOOT EXTRACTION DATA|2013
162
Table 12.7: Chemical speciation of the dichloromethane extract of commuter bus diesel soot (own analysis)
Retention time Area
Area (%)
% Match Name Class
3.414 35570 5.62% 88 2,4,4-Trimethyl-1-hexene PARAFFIN 3.518 5731 0.91% 85 Butanoic acid, 3-methylbutyl ester ESTER 3.563 8112 1.28% 96 Oxalic acid, butyl cyclobutyl ester ESTER 3.882 5031 0.80% UNCLASSIFIED
3.736 12415 1.96% 92 Dibutylsulfate SULFATE/SULFITE/SULFONE
4.033 5607 0.89% 98 2,2-Dimethyl-propyl 2,2-dimethyl-propanesulfinyl sulfone
SULFATE/SULFITE/SULFONE
4.273 7123 1.13% UNCLASSIFIED 4.383 10689 1.69% 98 Oxalic acid, allyl butyl ester ESTER
4.443 6617 1.05% 93 Acetic acid, butoxyhydroxy-, butyl ester ESTER
4.553 7532 1.19% 96 Oxalic acid, dibutyl ester ESTER 4.883 10400 1.64% 91 2,2,3-Trimethylnonane PARAFFIN 4.883 10400 1.64% UNCLASSIFIED 4.967 11813 1.87% UNCLASSIFIED 5.067 15459 2.44% UNCLASSIFIED 5.198 6232 0.99% UNCLASSIFIED 5.271 15586 2.46% UNCLASSIFIED 5.386 14646 2.32% UNCLASSIFIED 5.502 8304 1.31% UNCLASSIFIED 5.775 8161 1.29% UNCLASSIFIED 5.839 9882 1.56% UNCLASSIFIED 5.992 8149 1.29% UNCLASSIFIED
7.096 6434 1.02% 88 Butanoic acid, 1,1-dimethylethyl ester ESTER
9.219 51117 8.08% 78 1-(2-Hydroxy-1-methylethyl)-2,2-dimethylpropyl 2-methylpropanoate ESTER
9.557 55379 8.76% 87 3-Hydroxy-2,4,4-trimethylpentyl 2-methylpropanoate ESTER
9.838 4832 0.76% 89 Butanoic acid, 1,1-dimethylethyl ester ESTER
11.102 7992 1.26% 85 Butanoic acid, 1,1-dimethylethyl ester ESTER
12.177 6928 1.10% 85 Tetrahydrofurfuryl acrylate ESTER 12.299 56080 8.87% 80 2,8-Dimethylundecane PARAFFIN 12.317 29238 4.62% 80 2,8-Dimethylundecane PARAFFIN
12.802 11836 1.87% 74 Phthalic acid, cyclobutyl tridecyl ester ESTER
13.096 9012 1.43% UNCLASSIFIED 13.431 23091 3.65% 86 3-Ethyl-2,7-dimethyloctane PARAFFIN 13.692 10756 1.70% UNCLASSIFIED 13.933 9139 1.45% UNCLASSIFIED 14.108 4550 0.72% UNCLASSIFIED
14.2 10140 1.60% UNCLASSIFIED
14.495 22981 3.63% 84 Butanoic acid, 1,1-dimethylethyl ester ESTER
14.525 10684 1.69% 87 Isobutyl acrylate ESTER
14.883 18380 2.91% 81 Phthalic acid, cyclobutyl isobutyl ester ESTER
15.16 10875 1.72% UNCLASSIFIED 15.398 16287 2.58% 75 2,2,3-Trimethyldecane PARAFFIN 15.45 7775 1.23% UNCLASSIFIED

Univers
ity of
Cap
e Tow
n
CHAPTER 12|APPENDIX A| TABULATED GC-MS SOOT EXTRACTION DATA|2013
163
15.708 8288 1.31% UNCLASSIFIED 15.959 8055 1.27% 74 Phthalic acid, butyl hexyl ester ESTER 15.45 3775 0.60% UNCLASSIFIED
15.708 5288 0.84% UNCLASSIFIED
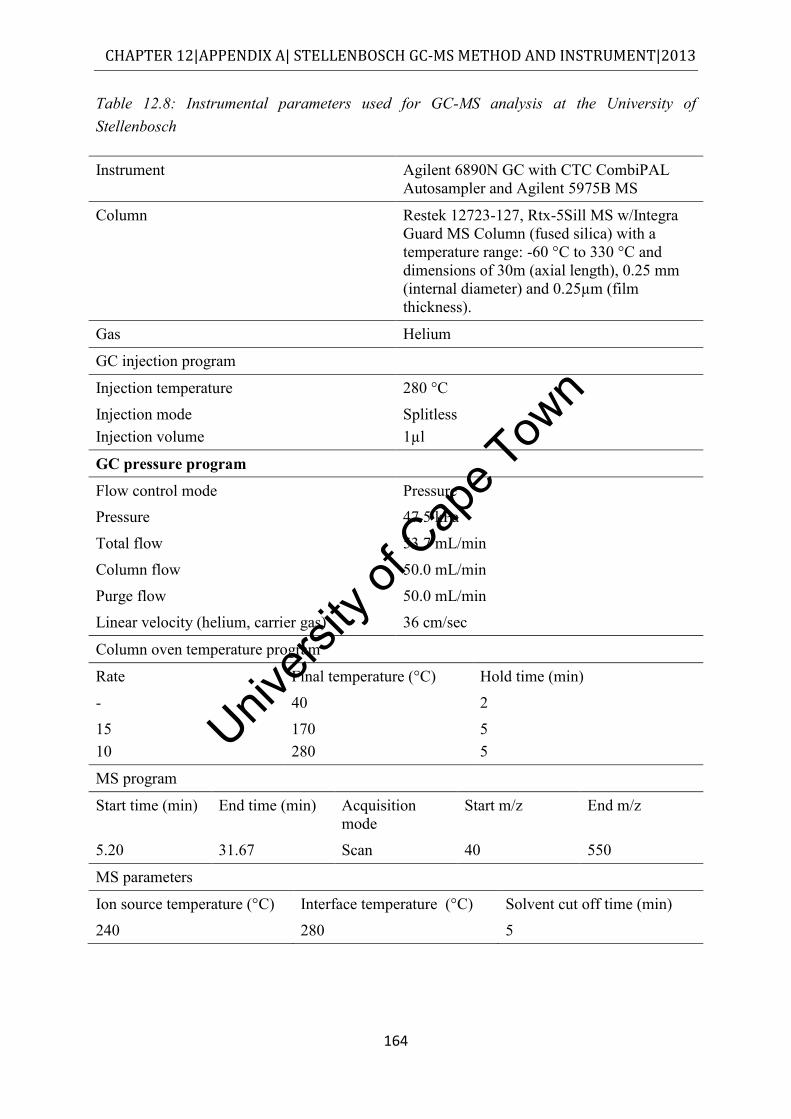
Univers
ity of
Cap
e Tow
n
CHAPTER 12|APPENDIX A| STELLENBOSCH GC-MS METHOD AND INSTRUMENT|2013
164
Table 12.8: Instrumental parameters used for GC-MS analysis at the University of Stellenbosch
Instrument Agilent 6890N GC with CTC CombiPAL Autosampler and Agilent 5975B MS
Column Restek 12723-127, Rtx-5Sill MS w/Integra Guard MS Column (fused silica) with a temperature range: -60 °C to 330 °C and dimensions of 30m (axial length), 0.25 mm (internal diameter) and 0.25µm (film thickness).
Gas Helium
GC injection program
Injection temperature 280 °C
Injection mode Injection volume
Splitless 1µl
GC pressure program
Flow control mode Pressure Pressure 47.5 kPa
Total flow 53.7 mL/min
Column flow 50.0 mL/min
Purge flow 50.0 mL/min
Linear velocity (helium, carrier gas) 36 cm/sec
Column oven temperature program
Rate Final temperature (°C) Hold time (min)
- 40 2
15 10
170 280
5 5
MS program
Start time (min) End time (min) Acquisition mode
Start m/z End m/z
5.20 31.67 Scan 40 550
MS parameters
Ion source temperature (°C) Interface temperature (°C) Solvent cut off time (min)
240 280 5
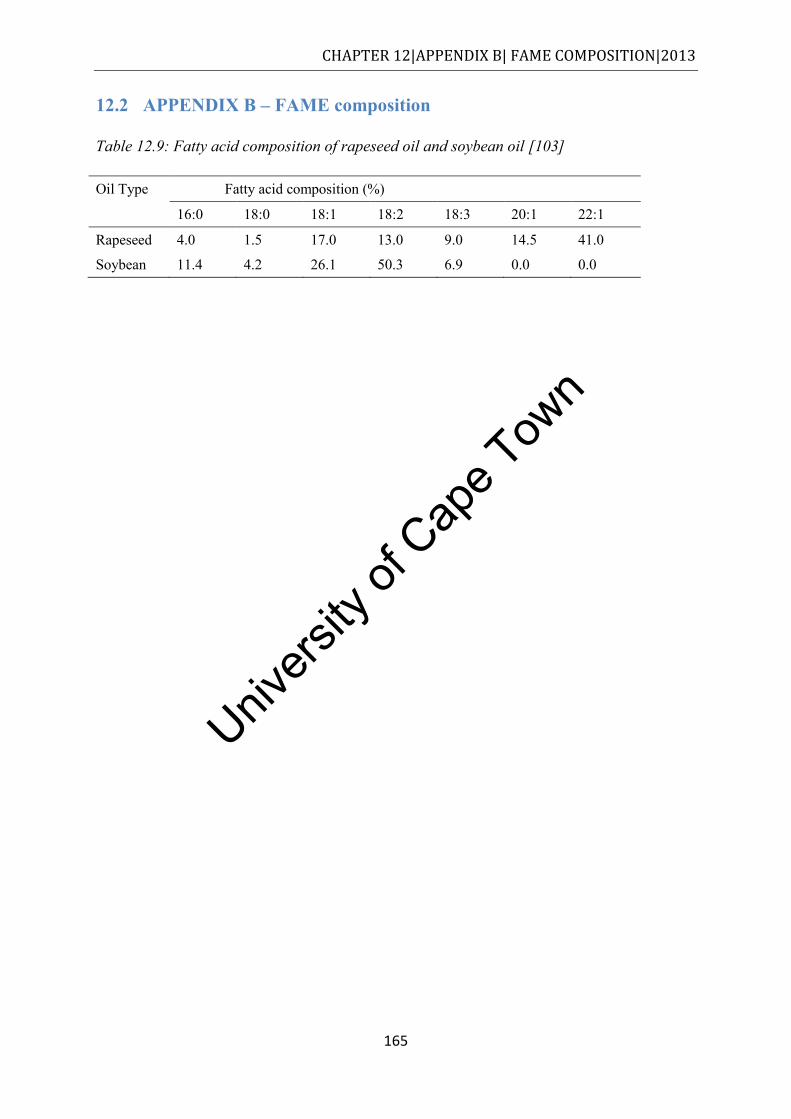
Univers
ity of
Cap
e Tow
n
CHAPTER 12|APPENDIX B| FAME COMPOSITION|2013
165
12.2 APPENDIX B – FAME composition
Table 12.9: Fatty acid composition of rapeseed oil and soybean oil [103]
Oil Type Fatty acid composition (%)
16:0 18:0 18:1 18:2 18:3 20:1 22:1
Rapeseed 4.0 1.5 17.0 13.0 9.0 14.5 41.0
Soybean 11.4 4.2 26.1 50.3 6.9 0.0 0.0
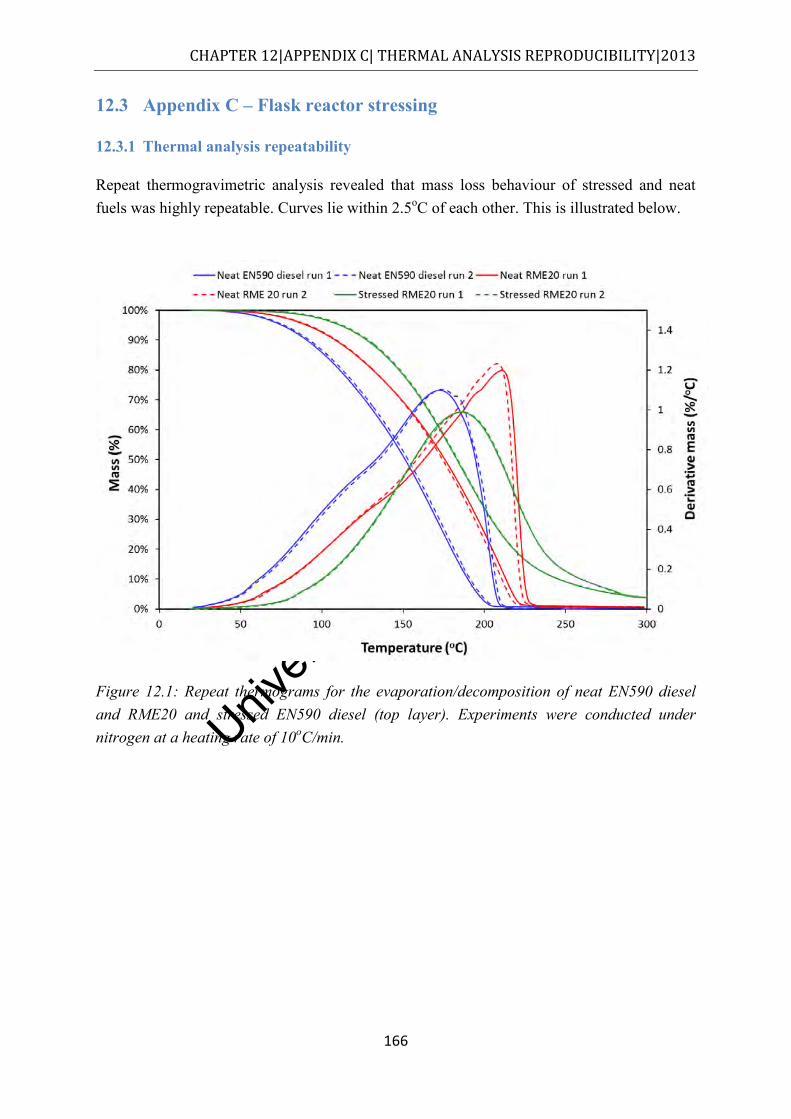
Univers
ity of
Cap
e Tow
n
CHAPTER 12|APPENDIX C| THERMAL ANALYSIS REPRODUCIBILITY|2013
166
12.3 Appendix C – Flask reactor stressing
12.3.1 Thermal analysis repeatability
Repeat thermogravimetric analysis revealed that mass loss behaviour of stressed and neat fuels was highly repeatable. Curves lie within 2.5oC of each other. This is illustrated below.
Figure 12.1: Repeat thermograms for the evaporation/decomposition of neat EN590 diesel and RME20 and stressed EN590 diesel (top layer). Experiments were conducted under nitrogen at a heating rate of 10oC/min.
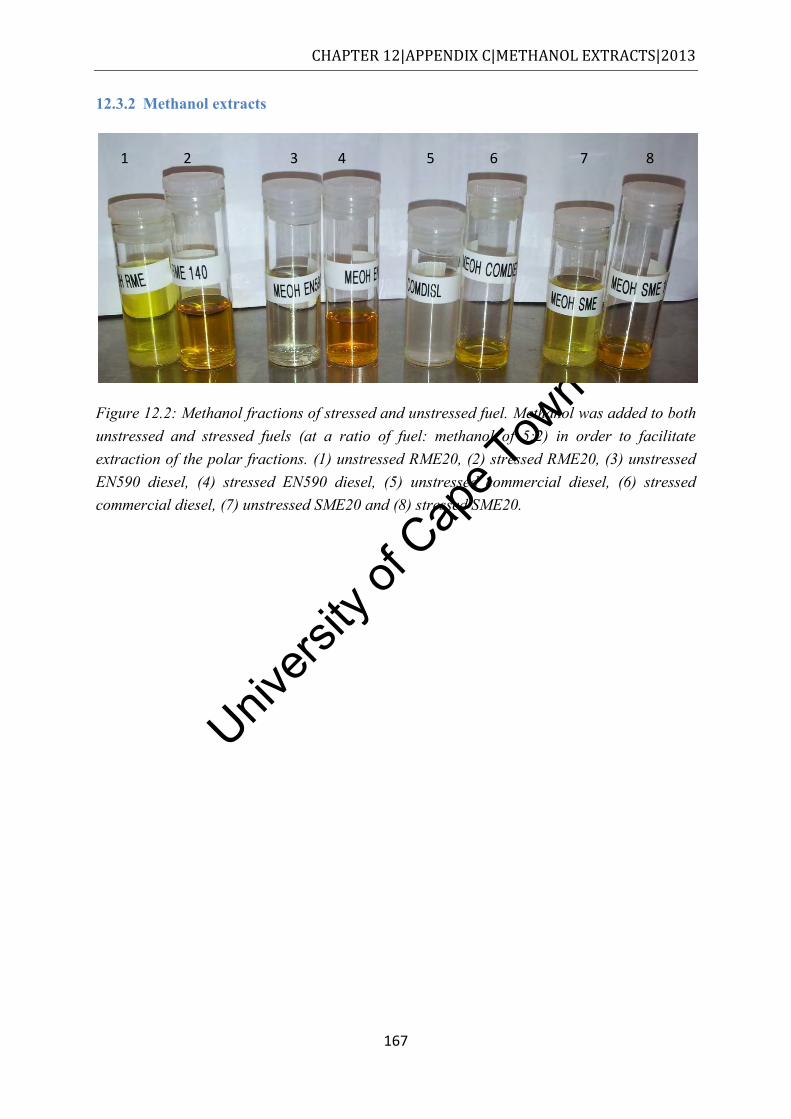
Univers
ity of
Cap
e Tow
n
CHAPTER 12|APPENDIX C|METHANOL EXTRACTS|2013
167
12.3.2 Methanol extracts
Figure 12.2: Methanol fractions of stressed and unstressed fuel. Methanol was added to both unstressed and stressed fuels (at a ratio of fuel: methanol of 5:2) in order to facilitate extraction of the polar fractions. (1) unstressed RME20, (2) stressed RME20, (3) unstressed EN590 diesel, (4) stressed EN590 diesel, (5) unstressed commercial diesel, (6) stressed commercial diesel, (7) unstressed SME20 and (8) stressed SME20.
1 2 3 4 5 6 7 8
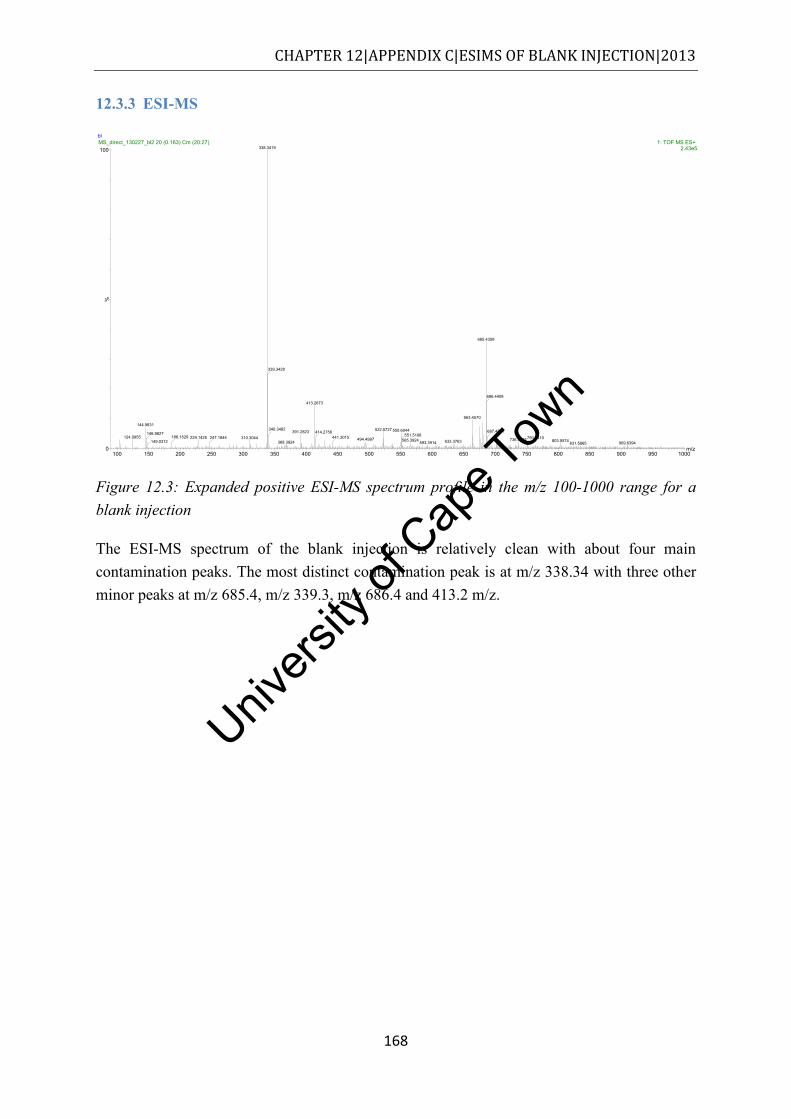
Univers
ity of
Cap
e Tow
n
CHAPTER 12|APPENDIX C|ESIMS OF BLANK INJECTION|2013
168
12.3.3 ESI-MS
Figure 12.3: Expanded positive ESI-MS spectrum profile in the m/z 100-1000 range for a blank injection
The ESI-MS spectrum of the blank injection is relatively clean with about four main contamination peaks. The most distinct contamination peak is at m/z 338.34 with three other minor peaks at m/z 685.4, m/z 339.3, m/z 686.4 and 413.2 m/z.
bl
m/z100 150 200 250 300 350 400 450 500 550 600 650 700 750 800 850 900 950 1000
%
0
100MS_direct_130227_bl2 20 (0.163) Cm (20:27) 1: TOF MS ES+
2.43e5338.3419
144.9831
124.0855146.9827
229.1425186.1529149.0312
310.3044247.1644
685.4358
339.3428
413.2673
391.2823340.3482
368.3924
663.4570
522.5727414.2756
494.4997441.3015
550.6044551.5108
565.3924 633.3763593.3914
686.4408
687.4551
736.5565750.5410803.5574 909.6394831.5865
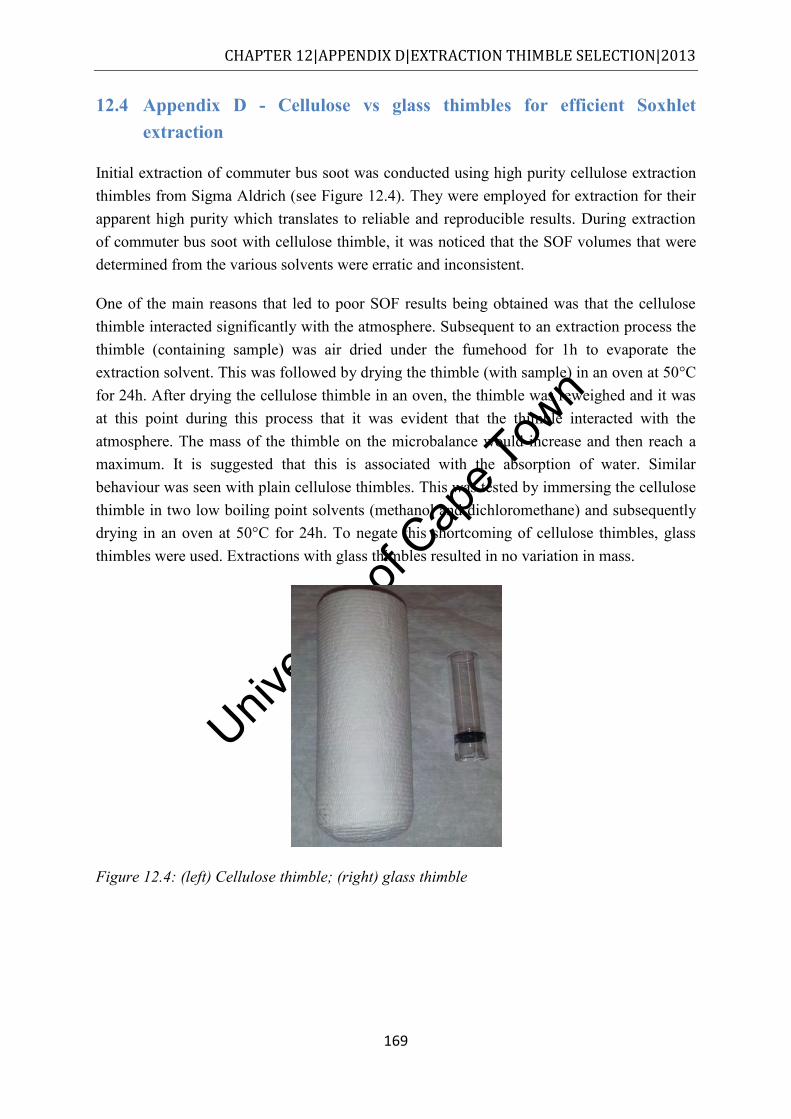
Univers
ity of
Cap
e Tow
n
CHAPTER 12|APPENDIX D|EXTRACTION THIMBLE SELECTION|2013
169
12.4 Appendix D - Cellulose vs glass thimbles for efficient Soxhlet extraction
Initial extraction of commuter bus soot was conducted using high purity cellulose extraction thimbles from Sigma Aldrich (see Figure 12.4). They were employed for extraction for their apparent high purity which translates to reliable and reproducible results. During extraction of commuter bus soot with cellulose thimble, it was noticed that the SOF volumes that were determined from the various solvents were erratic and inconsistent.
One of the main reasons that led to poor SOF results being obtained was that the cellulose thimble interacted significantly with the atmosphere. Subsequent to an extraction process the thimble (containing sample) was air dried under the fumehood for 1h to evaporate the extraction solvent. This was followed by drying the thimble (with sample) in an oven at 50°C for 24h. After drying the cellulose thimble in an oven, the thimble was reweighed and it was at this point during this process that it was evident that the thimble interacted with the atmosphere. The mass of the thimble on the microbalance would increase and then reach a maximum. It is suggested that this is associated with the absorption of water. Similar behaviour was seen with plain cellulose thimbles. This was tested by immersing the cellulose thimble in two low boiling point solvents (methanol and dichloromethane) and subsequently drying in an oven at 50°C for 24h. To negate this shortcoming of cellulose thimbles, glass thimbles were used. Extractions with glass thimbles resulted in no variation in mass.
Figure 12.4: (left) Cellulose thimble; (right) glass thimble
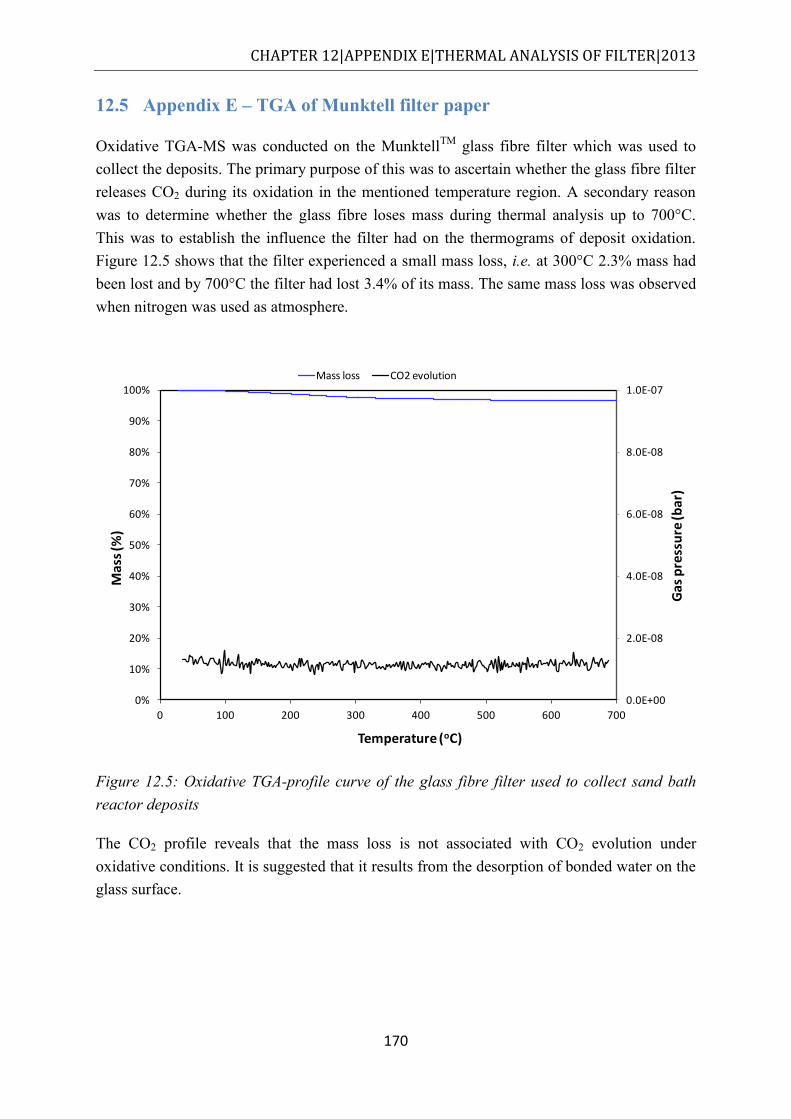
Univers
ity of
Cap
e Tow
n
CHAPTER 12|APPENDIX E|THERMAL ANALYSIS OF FILTER|2013
170
12.5 Appendix E – TGA of Munktell filter paper
Oxidative TGA-MS was conducted on the MunktellTM glass fibre filter which was used to collect the deposits. The primary purpose of this was to ascertain whether the glass fibre filter releases CO2 during its oxidation in the mentioned temperature region. A secondary reason was to determine whether the glass fibre loses mass during thermal analysis up to 700°C. This was to establish the influence the filter had on the thermograms of deposit oxidation. Figure 12.5 shows that the filter experienced a small mass loss, i.e. at 300°C 2.3% mass had been lost and by 700°C the filter had lost 3.4% of its mass. The same mass loss was observed when nitrogen was used as atmosphere.
Figure 12.5: Oxidative TGA-profile curve of the glass fibre filter used to collect sand bath reactor deposits
The CO2 profile reveals that the mass loss is not associated with CO2 evolution under oxidative conditions. It is suggested that it results from the desorption of bonded water on the glass surface.
0.0E+00
2.0E-08
4.0E-08
6.0E-08
8.0E-08
1.0E-07
0%
10%
20%
30%
40%
50%
60%
70%
80%
90%
100%
0 100 200 300 400 500 600 700
Gas
pre
ssu
re (b
ar)
Ma
ss (%
)
Temperature (oC)
Mass loss CO2 evolution