Embed Size (px)
Citation preview
Diet-induced obesity suppresses ghrelin in rat gastrointestinaltract and serum
Ibrahim Sahin • Suleyman Aydin • Yusuf Ozkan •
Adile Ferda Dagli • Kadir Okhan Akin • Saadet Pilten Guzel •
Zekiye Catak • Mehmet Resat Ozercan
Received: 28 February 2011 / Accepted: 28 April 2011 / Published online: 10 May 2011
� Springer Science+Business Media, LLC. 2011
Abstract The aims of the present study were to examine
ghrelin expression in serum and gastrointestinal tract (GIT)
tissues, and to measure tissue ghrelin levels and obesity-
related alterations in some serum biochemical variables in
rats with diet-induced obesity (DIO). The study included 12
male rats, 60 days old. The rats were randomly allocated to
two groups (n = 6). Rats in the DIO group were fed a caf-
eteria-style diet to induce obesity, while those in the control
group were fed on standard rat pellets. After a 12 week diet
program including an adaptation period all rats were
decapitated, tissues were individually fixed, ghrelin expres-
sion was examined by immunohistochemistry , and tissue
and serum ghrelin levels were measured by radioimmuno-
assay. Serum biochemical variables were measured using an
autoanalyzer. When the baseline and week 12 body mass
index and GIT ghrelin expression were compared between
DIO and control rats, BMI had increased and ghrelin
expression decreased due to obesity. The RIA results were
consistent with these findings. Serum glucose, LDL choles-
terol, and total cholesterol levels were elevated and HDL
cholesterol significantly decreased in the DIO group. A
comparison of GIT tissues between the control and obese
groups demonstrated that ghrelin was decreased in all tissues
of the latter. This decrease was brought about a decline in the
circulating ghrelin pool. This suggests that rather than being
associated with a change in a single tissue, obesity is a
pathological condition in which ghrelin expression is chan-
ged in all tissues.
Keywords Diet-induced obesity �Immunohistochemistry � Gastrointestinal tract �Acylated ghrelin � Desacylated ghrelin
Introduction
Obesity results from impairment of the balance between
the body weight and body height in favor of the former.
This impairment is brought about by genetic factors,
dietary habits, physical activity, and orexigenic and
anorexigenic hormone levels. Ghrelin, a hormone of lipo-
peptide-structure, was discovered by Kojima et al. in 1999 in
the X/A cells (ghrelin cells) of the fundus and pyloric parts of
the rat stomach [1]. It is composed of 28 amino acids and
contains a fatty acyl (octanoyl) group on the third amino acid
(serine) from the N-terminal. This bioactive peptide is found
in two major forms, acylated (with octanoyl-bioactive) and
desacylated (without octanoyl-inactive). These two forms
are present in both the plasma and tissues [2–6].
Levels of ghrelin are lower in obese humans than in thin
humans [7, 8]. Research on experimental animals has
I. Sahin
Department of Nutrition and Dietetics, Erzincan University,
Erzincan, Turkey
I. Sahin � S. Aydin (&) � S. P. Guzel � Z. Catak
Department of Medical Biochemistry and Clinical Biochemistry
(Firat Hormones Research Group), Firat University Hospital,
Medical Faculty of Firat University, 23100 Elazig, Turkey
e-mail: [email protected]
Y. Ozkan
Department of Internal Medicine, School of Medicine, Firat
University Hospital, Elazig, Turkey
A. F. Dagli � M. R. Ozercan
Department of Pathology, School of Medicine, Firat University
Hospital, Elazig, Turkey
K. O. Akin
Department of Medical Biochemistry and Clinical Biochemistry,
Kecioren Education and Research Hospital, Ankara, Turkey
123
Mol Cell Biochem (2011) 355:299–308
DOI 10.1007/s11010-011-0867-5
supported this finding [2, 9, 10]. Weight loss brings about an
increase in circulating ghrelin levels [11]. The fall in ghrelin
levels after food intake is less marked in obese individuals
than in healthy controls [12]. Although, endogenous ghrelin
and PYY(3-36) in diet-induced obese rats are not altered in
the fasting state, peripheral administration of ghrelin and
PYY (3-36) exhibit blunted responses in food intake [13].
As stated above, the stomach is the main site for ghrelin
production (reviewed by Schubert) [14], but the hormone is
synthesized in various other parts of the gastrointestinal tract
(GIT) and elsewhere in the body: hypothalamus, hypophysis,
salivary glands, thyroid gland, small intestines, kidneys,
heart, pancreas, central nervous system, lungs, placenta,
gonads, immune system, breasts, and teeth (reviewed by
Aydin) [2]. The amount of ghrelin released from these organs
accounts for about 30% of the blood ghrelin pool [3]. In the
GIT, ghrelin has been identified in the esophagus, duodenum,
jejunum, ileum, and colon, decreasing in intensity from the
duodenum toward the colon [2]. Ghrelin mRNA is present in
almost all tissues, as demonstrated by Gnanapavan et al. [15].
Quantities of mRNA were reported in the following, in
descending order: stomach fundus, jejunum, duodenum,
antrum, lung, pancreas, vein, gall bladder, lymph node,
esophagus, left colon, cheek, somatotropinoma, hypophysis,
breast, kidney, ovarium, prostate, right colon, ileum, liver,
spleen, fallopian tubes, lymphocyte, testis, adipose tissue,
placenta, adrenal gland, muscle, urinary bladder, atrium,
thyroid, myocardium, and skin [15]. Diet-induced models of
obesity in rats aptly represent obesity in humans. There is a
significant correlation between the development of obesity
and circulating lipid parameters. Furthermore, acylated and
desacylated ghrelin are transported in the circulation by
binding to very high density lipoprotein (VHDL) and HDL
[16]. Similarly, a significant relationship has been reported
between ghrelin and weight gain in several studies [17–19].
On the basis of the available data, the aims of the present
study were to create diet-induced obesity in rats to determine
and compare: (I) ghrelin expression in GIT tissues by
immunohistochemistry, (II) ghrelin expression in GIT tis-
sues by RIA, (III) serum ghrelin levels by RIA, and (IV)
serum glucose, alanine aminotransferase (ALT), aspartate
aminotransferase (AST), gamma glutamyltransferase
(GGT), total cholesterol, triglycerides, HDL cholesterol,
LDL cholesterol, total protein, albumin, calcium, and iron
levels using an autoanalzyer.
Materials and methods
Experimental animals and diet protocol
The study was carried out at the Experimental Research
Unit of Firat University (FUDAM), after the approval by
the Ethics Committee of Firat University Medical School
with the decision dated May 25, 2006 and number 20. The
study included 12 two-month-old male rats of the Wistar
albino type. After random allocation to two groups, the rats
were put into four cages, each sheltering three rats. Fol-
lowing a 1 week period of adaptation, the heights and
weights of the rats were measured to determine their BMIs.
In order to induce diabetes through diet, rats in the DIO
group were fed on a cafeteria-style diet consisting of 33%
rat pellet, 33% whole-fat sugary milk (Nestle), 7% sucrose,
and 27% water, while the rats in the control group were fed
ad libitum on standard rat pellet containing 51% carbohy-
drate, 4% fat, 21% protein, and 24% water [20]. All rats
were given water ad libitum. In order to determine the
development of DIO, BMI values were recorded at three-
week intervals.
Body mass index (BMI) and obesity criteria in rats
BMI is commonly determined according to the following
formula: BMI = body weight (kg)/height2 (m2). The
height of each rat was measured as the distance between
the tip of the nose and the anus. In order to determine their
weight, the rats were weighed in a capped plastic container
without tare. BMI value in healthy rats is considered to be
0.72 kg/m2 [21]. Despite the extensive literature search
undertaken, no BMI value indicating obesity in rats could
be found. Human individuals with BMI between 18.5 and
24.9 are accepted as having normal weight, those with BMI
between 25 and 29.9 are accepted as overweight, and those
with BMI at and above 30 are accepted as obese [22]. In
order to determine a BMI for obese rats, the ratios between
normal and obese BMI in humans were used. Accordingly,
the mean BMI of normal people was calculated
(18.5 ? 24.9 = 43.4/2 = 21.7). This value was subtracted
from the obesity borderline value in humans
(BMI C 30 kg/m2) (30-21.7 = 8.3) to determine what
percentage of BMI in normal humans should be added to
the mean to obtain an obese value (38.248%). This coef-
ficient (38.248%) was added to the BMI values of the
healthy rats to determine the probable BMI value of obese
rats (38.248% of 0.72 is 0.275; 0.72 ? 0.275 = 0.995 g/
cm2). As BMI is expressed in g/cm2 in rats, the obese BMI
was established to be C1.00 g/cm2 for rats.
Preparation and storage of samples
At the end of the diet program, the rats were sacrificed
using sterile equipment. Half of the blood obtained was put
into regular biochemistry tubes containing aprotinin and
the other half into regular empty biochemistry tubes. The
blood samples were centrifuged for 5 min at 4,000 rpm at
room temperature. Sera containing aprotinin were added to
300 Mol Cell Biochem (2011) 355:299–308
123
1/10 N HCl and transferred to Eppendorf tubes to be stored
in the deep freeze at -20�C pending analyses [23]. Bio-
chemical variables were measured immediately in the
serum samples without aprotinin. The tissue samples were
also divided into two for immunohistochemical (IHC)
staining and determination of ghrelin levels. Samples for
the IHC staining were immediately put into 10% formal-
dehyde. Samples for quantifying ghrelin were put into a
boiling water bath immediately after dissection and boiled
for 5 min, preventing proteolysis of the ghrelin. After
boiling, the tissue samples (100 mg) were transferred into
regular biochemistry tubes containing 10 ml 5% w/v
phosphate buffered saline (PBS), carefully ground with a
glass rod, and centrifuged at 4,000 rpm for 10 min at
?4�C. To adjust its temperature, the centrifuge was run
several times before loading. The resulting tissue super-
natants were added to 50 ll/ml (500 KIU) aprotinin and
stored in a deep freeze at -20�C pending analysis of the
hormone.
Hormone analysis
Levels of ghrelin in sera and tissues were measured by
RIA. Serum samples and tissue homogenates prepared in
advance and stored at -20�C were used. RIA was per-
formed in accordance with the procedures described in the
catalogues. As the measurement limits of the kits are set
(7.8 pg/ml for acylated ghrelin and 93 pg/ml for total
ghrelin), ghrelin levels below these amounts were mea-
sured as follows: the tubes were supplemented with pure
standards of 7.8 pg/ml for acylated ghrelin and 93 pg/ml
for total ghrelin. At the end of the experiment, these
quantities were subtracted from the values obtained to
determine the original ghrelin levels in the samples. The
quantities of desacylated ghrelin were established by sub-
tracting the amount of acylated ghrelin from the total
ghrelin. RIA analysis of ghrelin in serum and tissues was
carried out in three stages: preparation, analysis, and cal-
culation. Both IHC and RIA analyses recognize the octa-
noylated and des-octanylated porsion of ghrelin.
Antibodies rose against positions 1–11(N-terminal) and
13–28 (C-terminal) of ghrelin protein.
Immunohistochemistry
The tissues were stained immunohistochemically using
Avidin–Biotin-Peroxidase Complex (ABC) as suggested
by Hsu et al. [24]. IHC analyses consisted of two stages:
preparation and staining. The solutions to be used were
freshly prepared before staining. The chromogen solution
(3-amino-9-ethyl carbazole, AEC) was used within 15 s
after it was prepared.
Preparation: 1. Sections of 4 lm from the blocks of
tissue samples in paraffin were transferred on to polylysine
microscope slides. 2. They were kept in the drying oven
(?80�C) for 20 min. 3. They were passed through a pure
xylol series four times, 5 min each (4 9 50). 4. They were
passed through an ethanol series (99.5 ? 96 ? 90 ?80 ? 70%) (5 9 30). 5. They were kept in distilled water
for 10 min. 6. They were kept in 3% H2O2 in methanol
(2 9 50).Staining: 1. Samples were incubated in 10% citrate
buffer, pH 6.0 for 15 min in a microwave heater (750 mw),
and left to cool for 20 min at room temperature. 2. They
were kept in PBS (0.01 M, pH 7.4) for 5 min. 3. They were
incubated with horse radish peroxidase blocking for
10 min. 4. They were incubated with ghrelin tissue anti-
body for 30 min in a water bath (?38�C). 5. They were
kept in PBS for 5 min. 6. They were incubated with bio-
tinylated goat anti-mouse for 10 min in a water bath
(?38�C). 7. They were kept in PBS for 5 min. 8. They
were incubated with streptavidin peroxidase for 10 min in
a water bath (?38�C). 9. They were kept in PBS for 5 min.
10. They were incubated with AEC for 10 min in a water
bath (?38�C). 11. They were washed with distilled water
for 1–2 min. 12. They were rinsed (not thoroughly dried)
and subjected to contrast staining with Mayer hematoxylin
for 1–2 min. 13. They were washed in distilled water for
1–2 min and dried. 14. They were covered with lamellae to
obtain permanent preparations. 15. The preparations were
examined under a light microscope and photographed.
Salivary gland, which is known to express ghrelin, was
used as a positive control [17]. When preparing negative
tissue samples, PBS was used instead of primary antibody
(ghrelin tissue antibody). Absence of staining in tissue
preparations was evaluated as negative (-) and different
staining intensities were evaluated as ?1, ?2 and ?3 in the
IHC evaluation.
Statistical analyses
Statistical analyses were conducted using SPSS 10.00. The
data are presented as mean ± standard deviation. Levels of
acylated ghrelin, desacylated ghrelin, and total ghrelin
obtained from the statistical analyses were rounded to two
digits after the decimal point and the percentage differ-
ences in these values between the DIO and control groups
were rounded to one digit after the decimal point. A Mann–
Whitney U test was used to compare data between groups,
and a Wilcoxon rank test to determine the statistical sig-
nificance of repeated measurements. Possible correlations
between the data were evaluated using a Pearson correla-
tion test. The level of statistical significance was set at
P B 0.05.
Mol Cell Biochem (2011) 355:299–308 301
123
Results
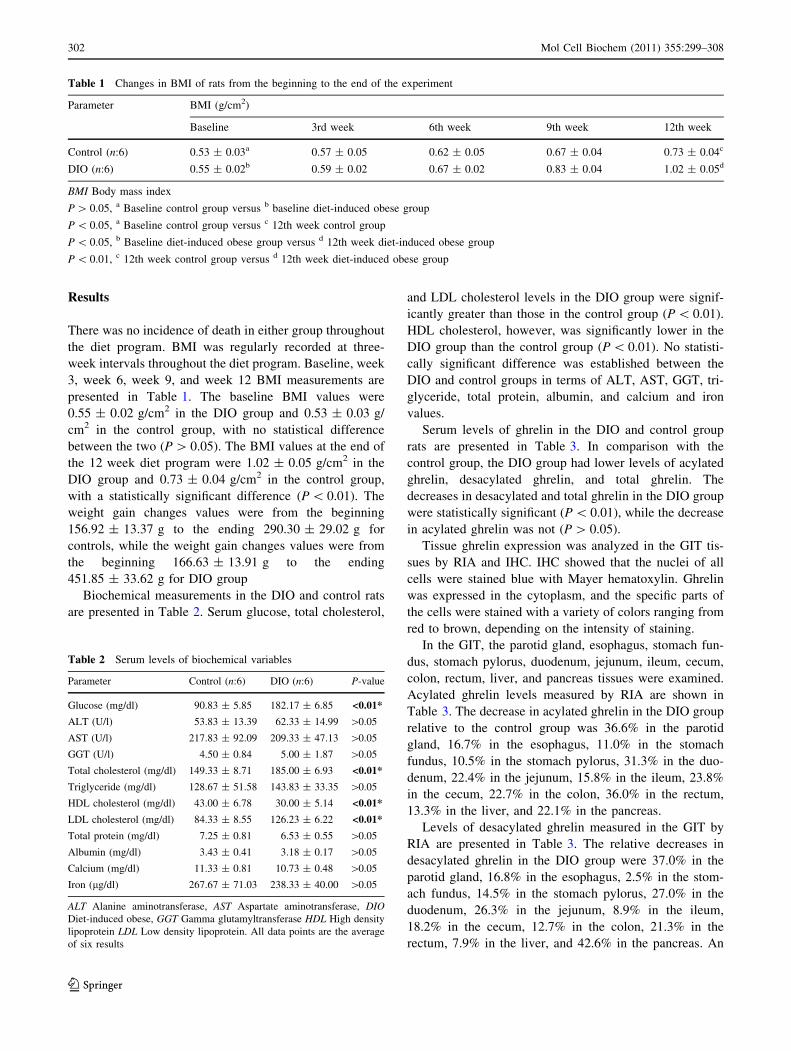
There was no incidence of death in either group throughout
the diet program. BMI was regularly recorded at three-
week intervals throughout the diet program. Baseline, week
3, week 6, week 9, and week 12 BMI measurements are
presented in Table 1. The baseline BMI values were
0.55 ± 0.02 g/cm2 in the DIO group and 0.53 ± 0.03 g/
cm2 in the control group, with no statistical difference
between the two (P [ 0.05). The BMI values at the end of
the 12 week diet program were 1.02 ± 0.05 g/cm2 in the
DIO group and 0.73 ± 0.04 g/cm2 in the control group,
with a statistically significant difference (P \ 0.01). The
weight gain changes values were from the beginning
156.92 ± 13.37 g to the ending 290.30 ± 29.02 g for
controls, while the weight gain changes values were from
the beginning 166.63 ± 13.91 g to the ending
451.85 ± 33.62 g for DIO group
Biochemical measurements in the DIO and control rats
are presented in Table 2. Serum glucose, total cholesterol,
and LDL cholesterol levels in the DIO group were signif-
icantly greater than those in the control group (P \ 0.01).
HDL cholesterol, however, was significantly lower in the
DIO group than the control group (P \ 0.01). No statisti-
cally significant difference was established between the
DIO and control groups in terms of ALT, AST, GGT, tri-
glyceride, total protein, albumin, and calcium and iron
values.
Serum levels of ghrelin in the DIO and control group
rats are presented in Table 3. In comparison with the
control group, the DIO group had lower levels of acylated
ghrelin, desacylated ghrelin, and total ghrelin. The
decreases in desacylated and total ghrelin in the DIO group
were statistically significant (P \ 0.01), while the decrease
in acylated ghrelin was not (P [ 0.05).
Tissue ghrelin expression was analyzed in the GIT tis-
sues by RIA and IHC. IHC showed that the nuclei of all
cells were stained blue with Mayer hematoxylin. Ghrelin
was expressed in the cytoplasm, and the specific parts of
the cells were stained with a variety of colors ranging from
red to brown, depending on the intensity of staining.
In the GIT, the parotid gland, esophagus, stomach fun-
dus, stomach pylorus, duodenum, jejunum, ileum, cecum,
colon, rectum, liver, and pancreas tissues were examined.
Acylated ghrelin levels measured by RIA are shown in
Table 3. The decrease in acylated ghrelin in the DIO group
relative to the control group was 36.6% in the parotid
gland, 16.7% in the esophagus, 11.0% in the stomach
fundus, 10.5% in the stomach pylorus, 31.3% in the duo-
denum, 22.4% in the jejunum, 15.8% in the ileum, 23.8%
in the cecum, 22.7% in the colon, 36.0% in the rectum,
13.3% in the liver, and 22.1% in the pancreas.
Levels of desacylated ghrelin measured in the GIT by
RIA are presented in Table 3. The relative decreases in
desacylated ghrelin in the DIO group were 37.0% in the
parotid gland, 16.8% in the esophagus, 2.5% in the stom-
ach fundus, 14.5% in the stomach pylorus, 27.0% in the
duodenum, 26.3% in the jejunum, 8.9% in the ileum,
18.2% in the cecum, 12.7% in the colon, 21.3% in the
rectum, 7.9% in the liver, and 42.6% in the pancreas. An
Table 1 Changes in BMI of rats from the beginning to the end of the experiment
Parameter BMI (g/cm2)
Baseline 3rd week 6th week 9th week 12th week
Control (n:6) 0.53 ± 0.03a 0.57 ± 0.05 0.62 ± 0.05 0.67 ± 0.04 0.73 ± 0.04c
DIO (n:6) 0.55 ± 0.02b 0.59 ± 0.02 0.67 ± 0.02 0.83 ± 0.04 1.02 ± 0.05d
BMI Body mass index
P [ 0.05, a Baseline control group versus b baseline diet-induced obese group
P \ 0.05, a Baseline control group versus c 12th week control group
P \ 0.05, b Baseline diet-induced obese group versus d 12th week diet-induced obese group
P \ 0.01, c 12th week control group versus d 12th week diet-induced obese group
Table 2 Serum levels of biochemical variables
Parameter Control (n:6) DIO (n:6) P-value
Glucose (mg/dl) 90.83 ± 5.85 182.17 ± 6.85 <0.01*
ALT (U/l) 53.83 ± 13.39 62.33 ± 14.99 [0.05
AST (U/l) 217.83 ± 92.09 209.33 ± 47.13 [0.05
GGT (U/l) 4.50 ± 0.84 5.00 ± 1.87 [0.05
Total cholesterol (mg/dl) 149.33 ± 8.71 185.00 ± 6.93 <0.01*
Triglyceride (mg/dl) 128.67 ± 51.58 143.83 ± 33.35 [0.05
HDL cholesterol (mg/dl) 43.00 ± 6.78 30.00 ± 5.14 <0.01*
LDL cholesterol (mg/dl) 84.33 ± 8.55 126.23 ± 6.22 <0.01*
Total protein (mg/dl) 7.25 ± 0.81 6.53 ± 0.55 [0.05
Albumin (mg/dl) 3.43 ± 0.41 3.18 ± 0.17 [0.05
Calcium (mg/dl) 11.33 ± 0.81 10.73 ± 0.48 [0.05
Iron (lg/dl) 267.67 ± 71.03 238.33 ± 40.00 [0.05
ALT Alanine aminotransferase, AST Aspartate aminotransferase, DIODiet-induced obese, GGT Gamma glutamyltransferase HDL High density
lipoprotein LDL Low density lipoprotein. All data points are the average
of six results
302 Mol Cell Biochem (2011) 355:299–308
123
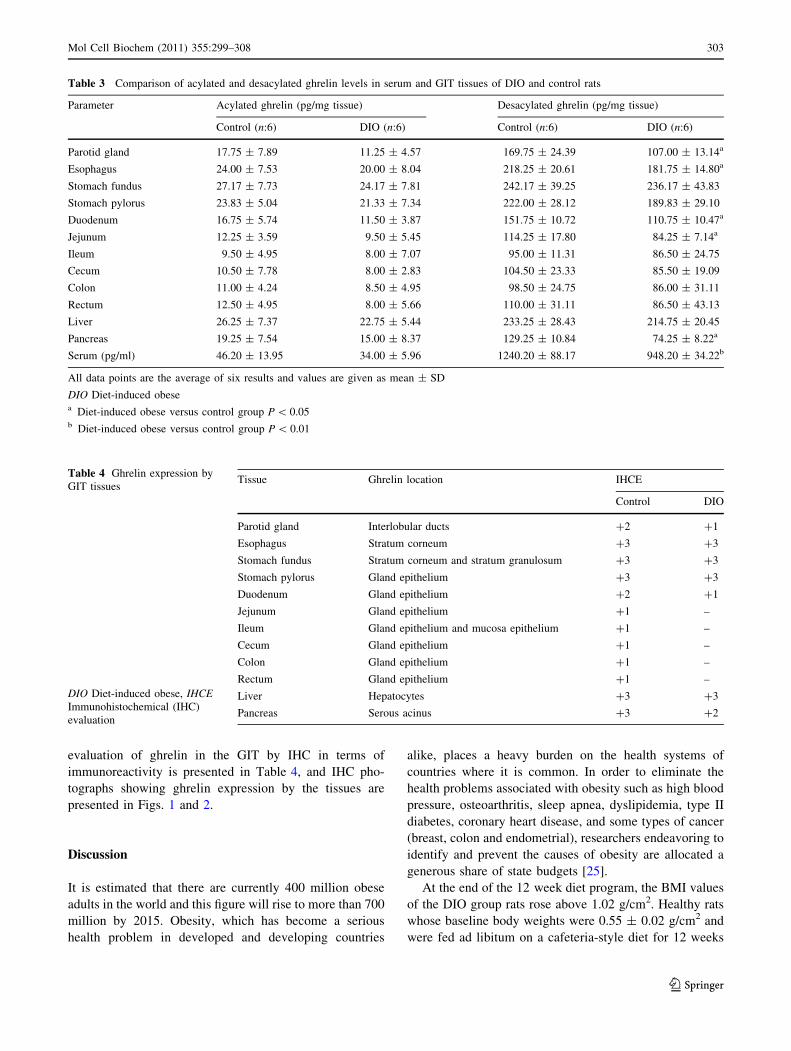
evaluation of ghrelin in the GIT by IHC in terms of
immunoreactivity is presented in Table 4, and IHC pho-
tographs showing ghrelin expression by the tissues are
presented in Figs. 1 and 2.
Discussion
It is estimated that there are currently 400 million obese
adults in the world and this figure will rise to more than 700
million by 2015. Obesity, which has become a serious
health problem in developed and developing countries
alike, places a heavy burden on the health systems of
countries where it is common. In order to eliminate the
health problems associated with obesity such as high blood
pressure, osteoarthritis, sleep apnea, dyslipidemia, type II
diabetes, coronary heart disease, and some types of cancer
(breast, colon and endometrial), researchers endeavoring to
identify and prevent the causes of obesity are allocated a
generous share of state budgets [25].
At the end of the 12 week diet program, the BMI values
of the DIO group rats rose above 1.02 g/cm2. Healthy rats
whose baseline body weights were 0.55 ± 0.02 g/cm2 and
were fed ad libitum on a cafeteria-style diet for 12 weeks
Table 3 Comparison of acylated and desacylated ghrelin levels in serum and GIT tissues of DIO and control rats
Parameter Acylated ghrelin (pg/mg tissue) Desacylated ghrelin (pg/mg tissue)
Control (n:6) DIO (n:6) Control (n:6) DIO (n:6)
Parotid gland 17.75 ± 7.89 11.25 ± 4.57 169.75 ± 24.39 107.00 ± 13.14a
Esophagus 24.00 ± 7.53 20.00 ± 8.04 218.25 ± 20.61 181.75 ± 14.80a
Stomach fundus 27.17 ± 7.73 24.17 ± 7.81 242.17 ± 39.25 236.17 ± 43.83
Stomach pylorus 23.83 ± 5.04 21.33 ± 7.34 222.00 ± 28.12 189.83 ± 29.10
Duodenum 16.75 ± 5.74 11.50 ± 3.87 151.75 ± 10.72 110.75 ± 10.47a
Jejunum 12.25 ± 3.59 9.50 ± 5.45 114.25 ± 17.80 84.25 ± 7.14a
Ileum 9.50 ± 4.95 8.00 ± 7.07 95.00 ± 11.31 86.50 ± 24.75
Cecum 10.50 ± 7.78 8.00 ± 2.83 104.50 ± 23.33 85.50 ± 19.09
Colon 11.00 ± 4.24 8.50 ± 4.95 98.50 ± 24.75 86.00 ± 31.11
Rectum 12.50 ± 4.95 8.00 ± 5.66 110.00 ± 31.11 86.50 ± 43.13
Liver 26.25 ± 7.37 22.75 ± 5.44 233.25 ± 28.43 214.75 ± 20.45
Pancreas 19.25 ± 7.54 15.00 ± 8.37 129.25 ± 10.84 74.25 ± 8.22a
Serum (pg/ml) 46.20 ± 13.95 34.00 ± 5.96 1240.20 ± 88.17 948.20 ± 34.22b
All data points are the average of six results and values are given as mean ± SD
DIO Diet-induced obesea Diet-induced obese versus control group P \ 0.05b Diet-induced obese versus control group P \ 0.01
Table 4 Ghrelin expression by
GIT tissues
DIO Diet-induced obese, IHCEImmunohistochemical (IHC)
evaluation
Tissue Ghrelin location IHCE
Control DIO
Parotid gland Interlobular ducts ?2 ?1
Esophagus Stratum corneum ?3 ?3
Stomach fundus Stratum corneum and stratum granulosum ?3 ?3
Stomach pylorus Gland epithelium ?3 ?3
Duodenum Gland epithelium ?2 ?1
Jejunum Gland epithelium ?1 –
Ileum Gland epithelium and mucosa epithelium ?1 –
Cecum Gland epithelium ?1 –
Colon Gland epithelium ?1 –
Rectum Gland epithelium ?1 –
Liver Hepatocytes ?3 ?3
Pancreas Serous acinus ?3 ?2
Mol Cell Biochem (2011) 355:299–308 303
123
were seen to develop obesity. The units of BMI values used
for rats vary. Some studies use kg/m2 [26, 27] and others
use g/cm2 [28, 29]. Novelli et al. [30] suggested the use of
g/cm2 in their study. We also employed this unit (g/cm2)
for BMI values. Although this kind of diet can cause
obesity in rats over the period we used, we are of the
opinion that BMI values rather than dietary period should
be employed to determine the development of DIO in rats.
When the serum glucose levels of the obese rats were
compared with those of the control group, the former was
seen to be statistically significantly elevated. Many studies
have shown that the amount of adipose tissue increases
with obesity [30, 31]. Adipose tissue that is metabolically
active continuously supplies non-esterified or free fatty
acids (FFA) to the liver. While providing the energy
required for glucogenesis, high FFA levels lead to hepatic
insulin resistance owing to the increase in hepatic glucose
output. Thus, this mechanism impairs glucose tolerance by
reducing cellular glucose intake and increasing the blood
glucose level.
The effects of obesity, which leads to liver dysfunction,
and its relationship to other parameters, have been topics of
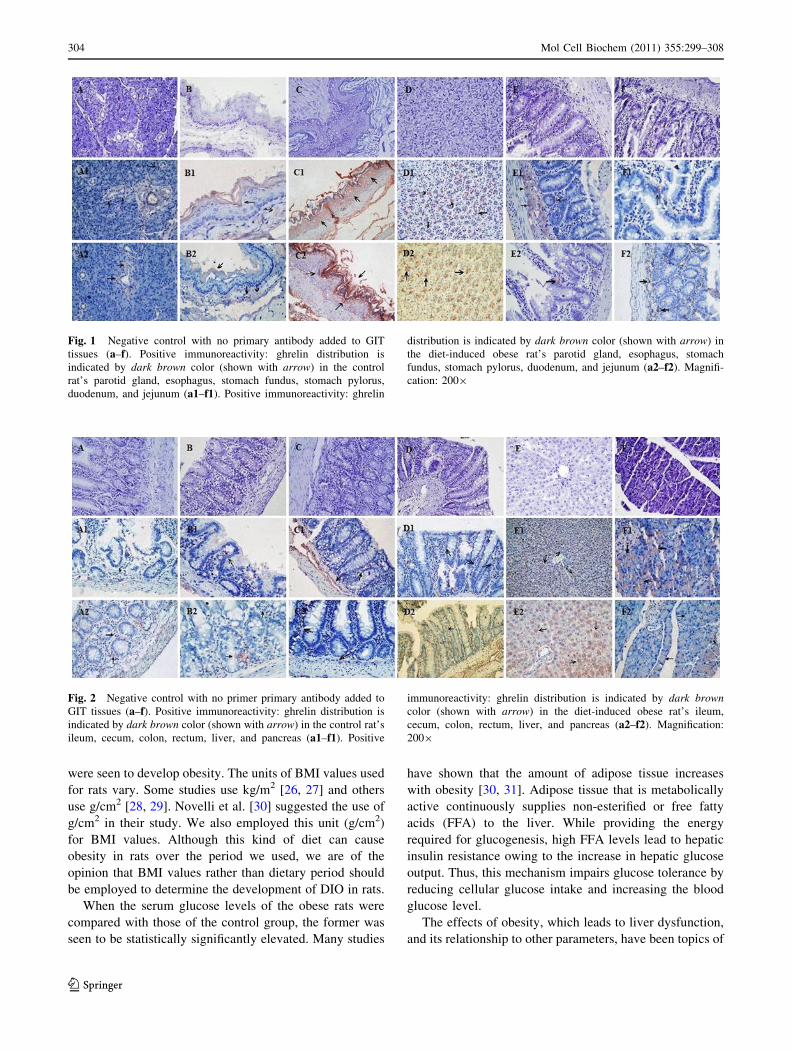
Fig. 1 Negative control with no primary antibody added to GIT
tissues (a–f). Positive immunoreactivity: ghrelin distribution is
indicated by dark brown color (shown with arrow) in the control
rat’s parotid gland, esophagus, stomach fundus, stomach pylorus,
duodenum, and jejunum (a1–f1). Positive immunoreactivity: ghrelin
distribution is indicated by dark brown color (shown with arrow) in
the diet-induced obese rat’s parotid gland, esophagus, stomach
fundus, stomach pylorus, duodenum, and jejunum (a2–f2). Magnifi-
cation: 2009
Fig. 2 Negative control with no primer primary antibody added to
GIT tissues (a–f). Positive immunoreactivity: ghrelin distribution is
indicated by dark brown color (shown with arrow) in the control rat’s
ileum, cecum, colon, rectum, liver, and pancreas (a1–f1). Positive
immunoreactivity: ghrelin distribution is indicated by dark browncolor (shown with arrow) in the diet-induced obese rat’s ileum,
cecum, colon, rectum, liver, and pancreas (a2–f2). Magnification:
2009
304 Mol Cell Biochem (2011) 355:299–308
123
many recent studies. Therefore, some liver function tests
(ALT, AST, GGT, and albumin) were conducted in the
present study to investigate changes in serum levels. The
results revealed that ALT levels were higher while AST
levels were lower in obese rats than in controls. In two
independent studies, Brucket et al. [32] and Clark et al.
[33] established that ALT levels in obese individuals were
higher than normal. Studies of experimental animals have
also revealed that ALT increases with obesity [34].
Increased ALT and AST indicate hepatocellular damage. It
appears that ALT (EC. 2.6.1.2) is more markedly affected
by obesity than AST (EC. 2.6.1.1). A possible explanation
may be that although ALT is synthesized only in the liver,
AST is synthesized and stored in the pancreas, liver, lung,
heart, spleen, muscle, erythrocytes, and brain as well as the
liver.
It was also found in this study that the serum GGT level
was almost 10% higher in the DIO group than the controls.
Elevated GGT activity is mainly seen in diseases of the
liver, biliary tract, and pancreas. The increase associated
with DIO indicates hepatocellular damage. It is understood
that kidney, heart, brain, pancreas, and spleen tissues are
afflicted with inflammation in obesity. GGT (EC. 2.3.2.2),
which is a cell surface glycoprotein, is found in liver,
pancreas, kidney, seminal glands, heart, spleen, and brain,
and these organs may have increased in capacity by 10%
because of inflammation. Recent studies have also shown a
strong correlation between elevated GGT levels and the
metabolic syndrome [35].
It was established in the present study that total cho-
lesterol, triglyceride, and LDL cholesterol levels were
higher, and HDL cholesterol was significantly lower, in the
obese rats than the controls. A possible reason why tri-
glycerides and cholesterol were higher in the obese rats is
that the cafeteria-style diet contains more fat than normal
rat pellet, and more of this fat is absorbed by the intestine.
As stated previously, insulin resistance is among the major
components of obesity. The development of insulin resis-
tance brings about an increase in the plasma concentration
of free fatty acids, which stimulate the accumulation of
triglyceride in the liver. Also, insulin resistance causes a
decrease in plasma lipoprotein lipase activity, which leads
to dyslipidemia and hypertriglyceridemia (elevated plasma
triglycerides) on the one hand, and destruction of HDL
cholesterol on the other [36]. In addition, increased hepatic
glucogenesis creates a predisposition to glucose intolerance
in the liver and muscles [37].
Metabolic and endocrine changes take place during the
preliminary stages of obesity. Ghrelin is a lipopeptide-
structure hormone that plays a pivotal part in the etiopa-
thology of obesity. Although this hormone is mainly
synthesized in the stomach, both its mRNA and the peptide
itself have been demonstrated in many tissues [15]. It is
found in two major forms in the circulation, acylated and
desacylated. This study compared serum ghrelin levels
between DIO rats and controls. Both the forms were
observed to decrease in obesity. Clinical studies have
demonstrated that ghrelin levels decline in the obese [8].
Similarly, the present study showed decreased ghrelin in
obese rats. Obesity is closely associated with inflammation
and oxidative stress. Ghrelin not only fulfills a hormonal
function, but also is an endogenous antioxidant [38].
Therefore, ghrelin may have been consumed in eliminating
the inflammation and oxidative stress caused by obesity,
and this may have caused the decline in levels. In addition,
increases in the glucose level are accompanied by decreases
in ghrelin, and so the increased glucose level observed in
this study may also have brought about a decrease in
ghrelin; the decreased ghrelin levels may be associated with
energy regulation. All these factors may jointly or severally
account for the decrease in ghrelin levels. Furthermore, the
loss of ghrelin expression in tissues caused by obesity may
have contributed. The following part of the discussion will
deal with ghrelin expression in the GIT tissues and their
interactions with obesity.
The present study compared ghrelin expression in the
GIT between DIO rats and controls. Ghrelin expression in
the parotid gland, a part of the GIT, showed positive
staining with ghrelin antibody in its striated, intralobular,
sinus, and asinus parts. The intensity of this staining was
lower in the obese group. These results are consistent with
the tissue ghrelin levels analyzed by RIA. They also show
that the salivary gland secretes ghrelin. Our literature
review revealed no study indicating whether the salivary
glands express ghrelin in control or DIO group rats.
However, Gnanapavan et al. [15] reported ghrelin mRNA
in the salivary gland using RT-PCR. Since ghrelin is
known to be present in human saliva [5, 17], we think that
ghrelin synthesized by the salivary gland may be trans-
ferred from saliva to blood or from blood to saliva after it
reaches a certain level. The presence of ghrelin in the
human salivary gland is consistent with the ghrelin posi-
tivity of the salivary gland in rats [5, 17, 39]. Furthermore,
several researchers have noted that various salivary pro-
teins may be transported [16, 40, 41].
Ghrelin expression in the esophagus, which is located in
the upper GIT, was demonstrated by both IHC and RIA.
The presence of ghrelin mRNA was demonstrated previ-
ously [15]. The present study established that ghrelin
expression in the esophagus declined with obesity.
Although ghrelin expression by the esophagus has been
demonstrated by IHC in humans, no published study
indicates that the esophagus synthesizes ghrelin in rats
[42].
The present study also explored how obesity changed
ghrelin expression in the stomach, the organ in which
Mol Cell Biochem (2011) 355:299–308 305
123
ghrelin was first discovered [1]. It has already been
reported that the stomach synthesizes ghrelin in X/A cells;
this study confirmed those results and showed that ghrelin
expression declined with obesity. The amount of ghrelin
synthesized in the fundus and pyloric parts of the stomach
was parallel to the ghrelin synthesized in the liver.
Although it has been reported that the stomach is respon-
sible for the predominantly produced circulating ghrelin
[43], the present study demonstrated that the liver synthe-
sizes almost as much ghrelin as the stomach, or even more.
The pancreas has also been shown to synthesize ghrelin,
reportedly in the beta or epsilon cells or another unknown
cell group [44]. The present study not only confirmed
ghrelin synthesis by the pancreas, but also showed a
decrease with the development of obesity.
Examination of ghrelin expression by the duodenum,
jejunum, ileum, cecum, colon, and rectum, which are other
organs of the GIT, showed a decrease from the duodenum
toward the ileum and a partial increase from the ileum to
the rectum in the control group. This pattern of change in
the GIT was found to be parallel in the control and DIO
groups, and ghrelin levels in the obese group were lower
than those in the control group. These data, obtained from
IHC, were confirmed by RIA. When the levels of ghrelin
expression were compared in our study, more ghrelin was
synthesized by the pyloric part of the stomach than the
duodenum. Although, this part of our study is not consis-
tent with the IHC studies by Date et al. [45], there is a
consistency with respect to the ghrelin levels in the stom-
ach fundus, jejunum, ileum, and colon. Besides, ghrelin
synthesis per mg tissue as measured by RIA was parallel to
the IHC results. Moreover, tissue ghrelin expression by the
GIT was consistent with the IHC evaluation data.
Further and more detailed studies are needed to identify
the functions of ghrelin, which is synthesized by a variety
of tissues. However, the available data suggest that it may
undertake several functions such as anti-apoptosis, anti-
angiogenesis, cell proliferation, growth hormone secretion,
cell division, reducing organ injury associated with burns,
reducing inflammation, and energy regulation [46, 47].
Obesity not only leads to damage and fibrosis in many
organs, most notably the liver (hepatosteatosis) but also the
parotid gland, stomach fundus, lung, artery, heart, spleen,
thymus, muscle, brain, and adipose tissue. Our results
revealed elevated ALT and GGT, which are indicators of
liver damage. Furthermore, there are studies showing
increased alkaline phosphatase (ALP) and bilirubin in
obese rats, and the development of obesity leads to various
degrees of liver damage [48]. The most crucial correlation
among these is the negative relationship between BMI and
ghrelin. These results confirm the findings of Jeyakumar
et al. [49].
Conclusion
It was established in the present study that serum and tissue
expression levels of both acylated and desacylated ghrelin
levels decreased in obesity. It is believed that the major
cause for this decrease in the blood pool is that synthesis of
ghrelin by tissues is inhibited to restore energy regulation.
As a matter of fact, one study has demonstrated that blood
ghrelin levels decrease in obese individuals. However, no
previous study has investigated tissue ghrelin levels in all
organs. Therefore, the present study provides empirical
evidence for the reduction of ghrelin expression in obesity.
Although, this is an experimental animal study, it may offer
a new perspective on the etiopathology of obesity in
humans. Furthermore, it indicates that the amount of
ghrelin is important in energy regulation for losing weight.
The best way to eliminate obesity, which has currently
become a pandemic, is to eradicate the agents that stimu-
late appetite, and the most significant of these is ghrelin; it
creates a sensation of hunger and leads people to food [6].
Elimination of the effect of acylated ghrelin by pharma-
cological means will retard weight gain. The decrease in
ghrelin due to obesity is a significant metabolic event for
maintaining energy homeostasis.
Acknowledgments The authors would like to acknowledge TUBI-
TAK (project no: 106S350) and FUBAP (project no: 1445) for their
financial support.
References
1. Kojima M, Hosoda H, Date Y, Nakazato M, Matsuo H, Kangawa
K (1999) Ghrelin is a growth-hormone-releasing acylated peptide
from stomach. Nature 402:656–660
2. Aydin S (2007) Discovery of ghrelin hormone: research and
clinical applications. Turk J Biochem 32:76–89
3. Aydin S, Ozkan Y, Caylak E, Aydin S (2006) Ghrelin and its
biochemical functions. Turk Klin J Med Sci 26:272–283
4. Goodyear S, Arasaradnam RP, Quraishi N, Mottershead M,
Nwokolo CU (2010) Acylated and des acyl ghrelin in human
portal and systemic circulations. Mol Biol Rep 37:3697–3701
5. Groschl M, Topf HG, Bohlender J, Zenk J, Klussmann S, Dotsch
J, Rascher W, Rauh M (2005) Identification of ghrelin in human
saliva: production by the salivary glands and potential role in
proliferation of oral keratinocytes. Clin Chem 51:997–1006
6. Sakurada T, Ro S, Onouchi T, Ohno S, Aoyama T, Chinen K,
Takabayashi H, Kato S, Takayama K, Yakabi K (2010) Com-
parison of the actions of acylated and desacylated ghrelin on acid
secretion in the rat stomach. J Gastroenterol 45:1111–1120
7. Nanjo Y, Adachi H, Hirai Y, Enomoto M, Fukami A, Otsuka M,
Yoshikawa K, Yokoi K, Ogata K, Tsukagawa E, Kasahara A,
Murayama K, Yasukawa H, Kojima M, Imaizumi T (2010)
Factors associated with plasma ghrelin level in Japanese general
population. Clin Endocrinol (Oxf) 74:453–458
8. Tschop M, Weyer C, Tataranni PA, Devanarayan V, Ravussin E,
Heiman ML (2001) Circulating ghrelin levels are decreased in
human obesity. Diabetes 50:707–709
306 Mol Cell Biochem (2011) 355:299–308
123
9. Ariyasu H, Takaya K, Hosoda H, Iwakura H, Ebihara K, Mori K,
Ogawa Y, Hosoda K, Akamizu T, Kojima M, Kangawa K, Nakao
K (2002) Delayed short-term secretory regulation of ghrelin in
obese animals: evidenced by a specific RIA for the active form of
ghrelin. Endocrinology 143:3341–3350
10. Briggs DI, Enriori PJ, Lemus MB, Cowley MA, Andrews ZB
(2010) Diet-induced obesity causes ghrelin resistance in arcuate
NPY/AgRP neurons. Endocrinology 151:4745–4755
11. de Luis DA, Sagrado MG, Conde R, Aller R, Izaola O (2008)
Changes of ghrelin and leptin in response to hypocaloric diet in
obese patients. Nutrition 24:162–166
12. Sangiao-Alvarellos S, Helmling S, Vazquez MJ, Klussmann S,
Cordido F (2011) Ghrelin neutralization during fasting-refeeding
cycle impairs the recuperation of body weight and alters hepatic
energy metabolism. Mol Cell Endocrinol 335(2):177–188
13. Xu J, McNearney TA, Chen J (2010) Impaired postprandial
releases/syntheses of ghrelin and PYY(3–36) and blunted
responses to exogenous ghrelin and PYY(3–36) in a rodent model
of diet-induced obesity. J Gastroenterol Hepatol 26:700–705
14. Schubert ML (2010) Gastric secretion. Curr Opin Gastroenterol
26:598–603
15. Gnanapavan S, Kola B, Bustin SA, Morris DG, McGee P,
Fairclough P, Bhattacharya S, Carpenter R, Grossman AB, Kor-
bonits M (2002) The tissue distribution of the mRNA of ghrelin
and subtypes of its receptor, GHS-R, in humans. J Clin Endo-
crinol Metab 87:2988–2991
16. Holmes E, Davies I, Lowe G, Ranganath LR (2009) Circulating
ghrelin exists in both lipoprotein bound and free forms. Ann Clin
Biochem 46:514–516
17. Aydin S, Halifeoglu I, Ozercan IH, Erman F, Kilic N, Aydin S,
Ilhan N, Ilhan N, Ozkan Y, Akpolat N, Sert L, Caylak E (2005) A
comparison of leptin and ghrelin levels in plasma and saliva of
young healthy subjects. Peptides 26:647–652
18. Kim BJ, Sohn JW, Park CS, Hahn GH, Koo J, Noh YD, Lee CS
(2008) Body weight and plasma levels of ghrelin and leptin
during treatment with olanzapine. J Korean Med Sci 23:685–690
19. Kong A, Neuhouser ML, Xiao L, Ulrich CM, McTiernan A,
Foster-Schubert KE (2009) Higher habitual intake of dietary fat
and carbohydrates are associated with lower leptin and higher
ghrelin concentrations in overweight and obese postmenopausal
women with elevated insulin levels. Nutr Res 29:768–776
20. Holemans K, Caluwaerts S, Poston L, Van Assche FA (2004)
Diet-induced obesity in the rat: a model for gestational diabetes
mellitus. Am J Obstet Gynecol 190:858–865
21. Paradis S, Cabanac M (2005) Calcium deficiency cannot induce
obesity in rats. Physiol Behav 85:259–264
22. Pieracci FM, Hydo L, Pomp A, Eachempati SR, Shou J, Barie PS
(2008) The relationship between body mass index and postop-
erative mortality from critical illness. Obes Surg 18:501–507
23. Hosoda H, Doi K, Nagaya N, Okumura H, Nakagawa E, Enomoto
M, Ono F, Kangawa K (2004) Optimum collection and storage
conditions for ghrelin measurements: octanoyl modification of
ghrelin is rapidly hydrolyzed to desacyl ghrelin in blood samples.
Clin Chem 50:1077–1080
24. Hsu SM, Raine L, Fanger H (1981) Use of avidin-biotin-perox-
idase complex (ABC) in immunoperoxidase techniques: a com-
parison between ABC and unlabeled antibody (PAP) procedures.
J Histochem Cytochem 29:577–580
25. World Health Organization (2009) Obesity and overweight.
http://www.who.int/mediacentre/factsheets/fs311/en/index.html
26. Altunkaynak BZ, Ozbek E (2009) Overweight and structural
alterations of the liver in female rats fed a high-fat diet: a ster-
eological and histological study. Turk J Gastroenterol 20:93–103
27. She M, Deng X, Guo Z, Laudon M, Hu Z, Liao D, Hu X, Luo Y,
Shen Q, Su Z, Yin W (2009) NEU-P11, a novel melatonin
agonist, inhibits weight gain and improves insulin sensitivity in
high-fat/high-sucrose-fed rats. Pharmacol Res 59:248–253
28. Novelli EL, Diniz YS, Galhardi CM, Ebaid GM, Rodrigues HG,
Mani F, Fernandes AA, Cicogna AC, Novelli Filho JL (2007)
Anthropometrical parameters and markers of obesity in rats. Lab
Anim 41:111–119
29. Schroeder M, Lavi-Avnon Y, Zagoory-Sharon O, Moran TH,
Weller A (2007) Preobesity in the infant OLETF rat: the role of
sucking. Dev Psychobiol 49:685–691
30. Schelbert KB (2009) Comorbidities of obesity. Prim Care
36:271–285
31. Stucchi P, Cano V, Ruiz-Gayo M, Fernandez-Alfonso MS (2009)
Aliskiren reduces body-weight gain, adiposity and plasma leptin
during diet-induced obesity. Br J Pharmacol 158:771–778
32. Bruckert E, Giral P, Ratziu V, Poynard T, Chapman MJ, Opolon
P, Turpin G (2002) A constellation of cardiovascular risk factors
is associated with hepatic enzyme elevation in hyperlipidemic
patients. Metabolism 51:1071–1076
33. Clark JM, Brancati FL, Diehl AM (2003) The prevalence and
etiology of elevated aminotransferase levels in the United States.
Am J Gastroenterol 98:960–967
34. Lo L, McLennan SV, F Williams P, Bonner J, Chowdhury S,
McCaughan GW, Gorrell MD, Yue DK, Twigg SM (2010)
Diabetes is a progression factor for hepatic fibrosis in a high fat
fed mouse obesity model of non-alcoholic steatohepatitis. J Hep-
atol (in press)
35. Li M, Campbell S, McDermott R (2009) Gamma-glutamyl-
transferase, obesity, physical activity, and the metabolic syn-
drome in indigenous Australian adults. Obesity 17:809–813
36. Mori N, Lee P, Kondo K, Kido T, Saito T, Arai T (2011)
Potential use of cholesterol lipoprotein profile to confirm obesity
status in dogs. Vet Res Commun 35:223–235
37. Klover PJ, Mooney RA (2004) Hepatocytes: critical for glucose
homeostasis. Int J Biochem Cell Biol 36:753–758
38. El Eter E, Al Tuwaijiri A, Hagar H, Arafa M (2007) In vivo and
in vitro antioxidant activity of ghrelin: attenuation of gastric
ischemic injury in the rat. J Gastroenterol Hepatol 22:1791–1799
39. Ozbay Y, Aydin S, Dagli AF, Akbulut M, Dagli N, Kilic N,
Rahman A, Sahin I, Polat V, Ozercan HI, Arslan N, Sensoy D
(2008) Obestatin is present in saliva: alterations in obestatin and
ghrelin levels of saliva and serum in ischemic heart disease. BMB
Rep 41:55–61
40. Nashida T, Yoshie S, Imai A, Shimomura H (2009) Transferrin
secretory pathways in rat parotid acinar cells. Arch Biochem
Biophys 487:131–138
41. Sun QF, Sun QH, Du J, Wang S (2008) Differential gene
expression profiles of normal human parotid and submandibular
glands. Oral Dis 14:500–509
42. Volante M, Fulcheri E, Allıa E, Cerrato M, Pucci A, Papotti M
(2002) Ghrelin expression in fetal, infant, and adult human lung.
J Histochem Cytochem 50:1013–1021
43. Dieguez C, da Boit K, Novelle MG, Martınez de Morentin PB,
Nogueiras R, Lopez M (2010) New insights in ghrelin orexigenic
effect. Front Horm Res 38:196–205
44. An W, Li Y, Xu G, Zhao J, Xiang X, Ding L, Li J, Guan Y, Wang
X, Tang C, Li X, Mulholland M, Zhang W (2010) Modulation of
ghrelin O-acyltransferase expression in pancreatic islets. Cell
Physiol Biochem 26:707–716
45. Date Y, Kojima M, Hosoda H, Sawaguchi A, Mondal MS,
Suganuma T, Matsukura S, Kangawa K, Nakazato M (2000)
Ghrelin, a novel growth hormone-releasing acylated peptide, is
synthesized in a distinct endocrine cell type in the gastrointestinal
tracts of rats and humans. Endocrinology 141:4255–4261
46. Kasımay O, Iseri SO, Barlas A, Bangir D, Yegen C, Arbak S,
Yegen BC (2006) Ghrelin ameliorates pancreaticobiliary
Mol Cell Biochem (2011) 355:299–308 307
123
inflammation and associated remote organ injury in rats. Hepatol
Res 36:11–19
47. Sehirli O, Sener E, Sener G, Cetinel S, Erzik C, Yegen BC (2008)
Ghrelin improves burn-induced multiple organ injury by
depressing neutrophil infiltration and the release of pro-inflam-
matory cytokines. Peptides 29:1231–1240
48. Kilic SS, Aydin S, Kilic N, Erman F, Aydin S, Celik I (2005)
Serum arylesterase and paraoxonase activity in patients with
chronic hepatitis. World J Gastroenterol 11:7351–7354
49. Jeyakumar SM, Lopamudra P, Padmini S, Balakrishna N,
Giridharan NV, Vajreswari A (2009) Fatty acid desaturation
index correlates with body mass and adiposity indices of obesity
in Wistar NIN obese mutant rat strains WNIN/Ob and WNIN/
GR-Ob. Nutr Metab 6:27
308 Mol Cell Biochem (2011) 355:299–308
123


