Embed Size (px)
Citation preview
MS(BD
Dietary Weight Loss and Exercise Effects onInsulin Resistance in Postmenopausal Women
Caitlin Mason, PhD, Karen E. Foster-Schubert, MD, MSc, Ikuyo Imayama, MD, PhD,Angela Kong, PhD, MPH, Liren Xiao, MSc, Carolyn Bain, MPH,
Kristin L. Campbell, BSc PT, PhD, Ching-Yun Wang, PhD, Catherine R. Duggan, PhD,Cornelia M. Ulrich, PhD, Catherine M. Alfano, PhD,
George L. Blackburn, MD, PhD, Anne McTiernan, MD, PhD
This activity is available for CME credit. See page AXX for information.
Background: Comprehensive lifestyle interventions are effective in preventing diabetes and restor-ing glucose regulation; however, the key stimulus for change has not been identifıed and effects inolder individuals are not established. The aim of the study was to investigate the independent andcombined effects of dietary weight loss and exercise on insulin sensitivity and restoration of normalfasting glucose in middle-aged and older women.
Design: Four-arm RCT, conducted between 2005 and 2009 and data analyzed in 2010.
Setting/participants: 439 inactive, overweight/obese postmenopausal women.
Interventions: Women were assigned to: dietary weight loss (n�118); exercise (n�117);exercise�diet (n�117); or control (n�87). The diet intervention was a group-based reduced-calorieprogram with a 10% weight-loss goal. The exercise intervention was 45 min/day, 5 days/week ofmoderate-to-vigorous intensity aerobic activity.
Main outcome measures: 12-month change in serum insulin, C-peptide, fasting glucose, andwhole body insulin resistance (HOMA-IR).
Results: A signifıcant improvement in HOMA-IR was detected in the diet (–24%, p�0.001) andexercise� diet (–26%, p�0.001) groups but not in the exercise (–9%, p�0.22) group compared withcontrols (–2%); these effects were similar in middle-aged (50–60 years) and older women (aged60–75 years). Among those with impaired fasting glucose (5.6–6.9 mmol/L) at baseline (n�143;33%), the odds (95% CI) of regressing to normal fasting glucose after adjusting for weight loss andbaseline levels were 2.5 (0.8, 8.4); 2.76 (0.8, 10.0); and 3.1 (1.0, 9.9) in the diet, exercise�diet, andexercise group, respectively, compared with controls.
Conclusions: Dietary weight loss, with or without exercise, signifıcantly improved insulin resis-tance. Older women derived as much benefıt as did the younger postmenopausal women.
Trial registration: This study is registered at Clinicaltrials.gov NCT00470119.(Am J Prev Med 2011;xx(x):xxx) © 2011 American Journal of Preventive Medicine
UNDER EMBARGO UNTIL AUGUST 30, 2011, 12:01 AM ET
shg
s
Introduction
Given the high prevalence of insulin resistance1
and its associated health burden,2–7 effective pre-vention strategies for high-risk individuals are a
priority. Several trials have examined the effıcacy of life-
From the Public Health Sciences Division, Fred Hutchinson Cancer Re-search Center (Mason, Imayama, Kong, Xiao, Bain,Wang, Duggan,McTi-ernan); Division of Metabolism, Endocrinology and Nutrition, School ofedicine, University of Washington (Foster-Schubert, Wang, McTiernan),eattle,Washington;Offıce of Cancer Survivorship, National Cancer InstituteAlfano), Bethesda,Maryland;DivisionofNutrition,HarvardMedical School,eth Israel Deaconess Medical Center (Blackburn), Boston, Massachusetts;
epartment of Physiotherapy, University of British Columbia (Campbell),©2011American Journal of PreventiveMedicine. All rights reserved.
tyle interventions for preventing type 2 diabetes, but fewave examined their effectiveness on restoring normallucose homeostasis.The Diabetes Prevention Program (DPP) demon-
trated that combined diet and exercise therapy is effec-
Vancouver, Canada; andGermanCancer ResearchCenter andNational Cen-ter for Tumour Diseases (Ulrich), Heidelberg, Germany
Address correspondence to: Anne McTiernan, MD, PhD, PreventionCenter, Fred Hutchinson Cancer Research Center, M4-B874, PO Box19024, Seattle WA 98109. E-mail: [email protected].
0749-3797/$17.00doi: 10.1016/j.amepre.2011.06.042
Am J PrevMed 2011;xx(x):xxx 1
r
ko
itdti
a
l(
2 Mason et al / Am J Prev Med 2011;xx(x):xxx
tive for diabetes prevention8 and restores normal glucoseegulation more frequently than placebo.9 Moreover, theeffect of lifestyle therapy was more pronounced in oldercompared with younger participants.10 Yet, because theDPP did not randomly assign each lifestyle component,the relative importance of the diet and exercise compo-nents could not be adequately examined. Furthermore,the DPP lifestyle intervention was resource-intensive,providing ongoing, individualized counseling.8 To ournowledge, the effectiveness of group-based adaptationsf the DPP program has not been widely tested.Because the restoration of normal glucose homeostasis
s more akin to true prevention than delayed progressiono overt diabetes, unraveling the relative importance ofiet, exercise, and body weight in this regard has impor-ant implications for resource allocation, patient counsel-ng, and public health.Although both obesity and diabetes risk increases with
ge in the U.S.,11,12 few studies have included older indi-viduals in large enough numbers to determine whetherlifestyle changes to reduce weight can improve insulinresistance, a major predictor of diabetes risk.13 Thus, thepurpose of the present studywas to examine the indepen-dent and combined effects of 12months of dietary weightloss and aerobic exercise on insulin resistance and therestoration of normal fasting glucose among overweightpostmenopausal women and to examine whether themagnitude of these effects differed between middle-aged(50–60 years) and older women (aged 60–75 years).The study also examined which factors, including
weight loss, fat loss, or changes in cardiorespiratory fıt-ness or physical activity, were most associated withchanges in glucose homeostasis. It was hypothesized thatinsulin and glucose would improve in all interventiongroups compared with controls, and that these changeswould be mediated by the degree of weight loss. It wasalso hypothesized that younger womenwould experiencegreatermetabolic improvements relative to olderwomen.
MethodsDesign Overview
The Nutrition and Exercise in Women (NEW) study was a 12-monthRCT testing the effects of exercise and/or dietaryweight losson circulating hormones and other outcomes.14 The trial was con-ducted from 2005 to 2009; data were analyzed in 2010. Studyprocedures were reviewed and approved by the Fred HutchinsonCancer Research Center IRB in Seattle WA. All participants pro-vided informed consent.
Setting and Participants
Participants were overweight or obese (BMI �25.0, �23.0 if AsianAmerican) postmenopausal women (aged 50–75 years) from the
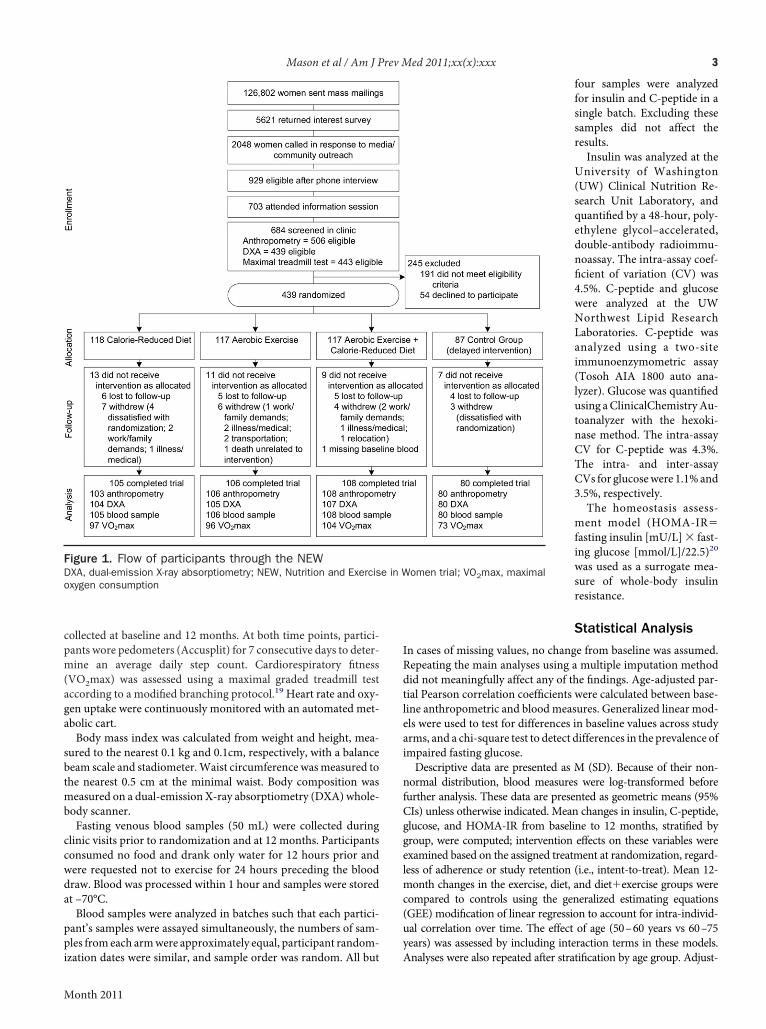
greater-Seattle area who were not meeting physical activity guide-ines.15 Women were recruited through media and mass mailingsFigure 1). Specifıc exclusion criteria included diagnosed diabetes,fasting blood glucose �126 mg/dL or use of diabetes medications;use of postmenopausal hormones; history of other serious medicalcondition(s); alcohol intake�2 drinks/day; current smoking; con-traindication to the study interventions for any reason (e.g., abnor-mal exercise tolerance test); participation in another structuredweight loss program; or use of weight-loss medications.
Randomization and Interventions
Eligible women were randomized to (1) dietary weight loss(n�118); (2) moderate-to-vigorous intensity aerobic exercise(n�117); (3) combined diet and exercise (n�117); or (4) control(no intervention; n�87). Computerized random assignment wasstratifıed according to BMI (� or �30) and participants’ self-reported race/ethnicity (black, white, other). A permuted blocksrandomization, wherein the control assignment was randomlyeliminated fromeachblockwith a probability of approximately 1 in4, was used to achieve a proportionally smaller control group. Oneparticipant that was randomized to diet�exercise was excludedfrom analysis because of missing baseline blood measures.The exercise intervention progressed to 45minutes ofmoderate-
to-vigorous intensity exercise at a target heart rate of 70%–85%observed maximum, 5 days/week, by the 7th week. Participantsattended three supervised sessions/week at the study facility andexercised 2 days/week at home. Participants recorded exercisemode, duration, peak heart rate, and perceived exertion at eachsession. Activities of �4 METs16 were counted toward the pre-scribed target.The dietary weight-loss intervention involved a modifıcation of
the DPP8 and Look AHEAD17 lifestyle behavior change programswith goals of 1200–2000 kcal/day,�30%calories from fat, and 10%weight loss by 6 months with maintenance thereafter. Participantsmet individually with a dietitian at least twice, followed by weeklygroup meetings (5–10 women) for 6 months. Thereafter, partici-pants attended monthly group meetings, in addition to biweeklyphone or email contact. A combination of individual and group-based approaches was used to maximize the benefıts of personal-ized recommendations with the social support and cost effective-ness of a group setting. Women completed daily food logs for atleast 6 months or until they reached their 10% weight-loss goal.Food logs were collected by the dietitian and returned with feed-back. Logs, weekly weigh-ins, and session attendance were trackedto promote dietary adherence. Participants who did not meet theirweight-loss goal by 6months were encouraged to continue weight-loss efforts and were offered additional sessions, whereas womenwho reached their goal were allowed to continue losing but weremonitored to ensure that BMI did not go below 18.5.Participants who were randomized to dietary weight loss �
exercise received separate sessions and were instructed not to dis-cuss diet during supervised exercise. The control group was in-structed not to change their diet or exercise behavior for 12months. At study completion, they were offered four group nutri-tion classes and 8 weeks of exercise training.
Outcomes and Follow-Up
All study measures were obtained and analyzed by trained person-nel who were blinded to the participants’ randomization status.Demographic information, medical history, dietary patterns (via
120-item self-administered food frequency questionnaire18) werewww.ajpmonline.org
aga
sbtmb
ccwda
ppi
Mason et al / Am J Prev Med 2011;xx(x):xxx 3
collected at baseline and 12 months. At both time points, partici-pants wore pedometers (Accusplit) for 7 consecutive days to deter-mine an average daily step count. Cardiorespiratory fıtness(VO2max) was assessed using a maximal graded treadmill testccording to a modifıed branching protocol.19 Heart rate and oxy-en uptake were continuously monitored with an automated met-bolic cart.Body mass index was calculated from weight and height, mea-
ured to the nearest 0.1 kg and 0.1cm, respectively, with a balanceeam scale and stadiometer.Waist circumference wasmeasured tohe nearest 0.5 cm at the minimal waist. Body composition waseasured on a dual-emission X-ray absorptiometry (DXA) whole-ody scanner.Fasting venous blood samples (50 mL) were collected during
linic visits prior to randomization and at 12 months. Participantsonsumed no food and drank only water for 12 hours prior andere requested not to exercise for 24 hours preceding the bloodraw. Blood was processed within 1 hour and samples were storedt –70°C.Blood samples were analyzed in batches such that each partici-ant’s samples were assayed simultaneously, the numbers of sam-les fromeach armwere approximately equal, participant random-
Figure 1. Flow of participants through the NEWDXA, dual-emission X-ray absorptiometry; NEW, Nutrition and Exercisoxygen consumption
zation dates were similar, and sample order was random. All but
Month 2011
four samples were analyzedfor insulin and C-peptide in asingle batch. Excluding thesesamples did not affect theresults.Insulin was analyzed at the
University of Washington(UW) Clinical Nutrition Re-search Unit Laboratory, andquantifıed by a 48-hour, poly-ethylene glycol–accelerated,double-antibody radioimmu-noassay. The intra-assay coef-fıcient of variation (CV) was4.5%. C-peptide and glucosewere analyzed at the UWNorthwest Lipid ResearchLaboratories. C-peptide wasanalyzed using a two-siteimmunoenzymometric assay(Tosoh AIA 1800 auto ana-lyzer). Glucose was quantifıedusing aClinicalChemistryAu-toanalyzer with the hexoki-nase method. The intra-assayCV for C-peptide was 4.3%.The intra- and inter-assayCVs for glucosewere 1.1%and3.5%, respectively.The homeostasis assess-
ment model (HOMA-IR�fasting insulin [mU/L] � fast-ing glucose [mmol/L]/22.5)20
was used as a surrogate mea-sure of whole-body insulinresistance.
Statistical Analysis
In cases of missing values, no change from baseline was assumed.Repeating the main analyses using a multiple imputation methoddid not meaningfully affect any of the fındings. Age-adjusted par-tial Pearson correlation coeffıcients were calculated between base-line anthropometric and bloodmeasures. Generalized linear mod-els were used to test for differences in baseline values across studyarms, and a chi-square test to detect differences in the prevalence ofimpaired fasting glucose.Descriptive data are presented as M (SD). Because of their non-
normal distribution, blood measures were log-transformed beforefurther analysis. These data are presented as geometric means (95%CIs) unless otherwise indicated. Mean changes in insulin, C-peptide,glucose, and HOMA-IR from baseline to 12 months, stratifıed bygroup, were computed; intervention effects on these variables wereexamined based on the assigned treatment at randomization, regard-less of adherence or study retention (i.e., intent-to-treat). Mean 12-month changes in the exercise, diet, and diet�exercise groups werecompared to controls using the generalized estimating equations(GEE) modifıcation of linear regression to account for intra-individ-ual correlation over time. The effect of age (50–60 years vs 60–75years) was assessed by including interaction terms in these models.
omen trial; VO2max, maximal
e in WAnalyses were also repeated after stratifıcation by age group. Adjust-
�
F sess
H
4 Mason et al / Am J Prev Med 2011;xx(x):xxx
ment formultiple comparisonswasmadeusingBonferroni correction(two-sided alpha�0.05/3).Changes in body weight, body composition, pedometer steps/day,
and VO2max were similarly calculated and used to predict the ob-
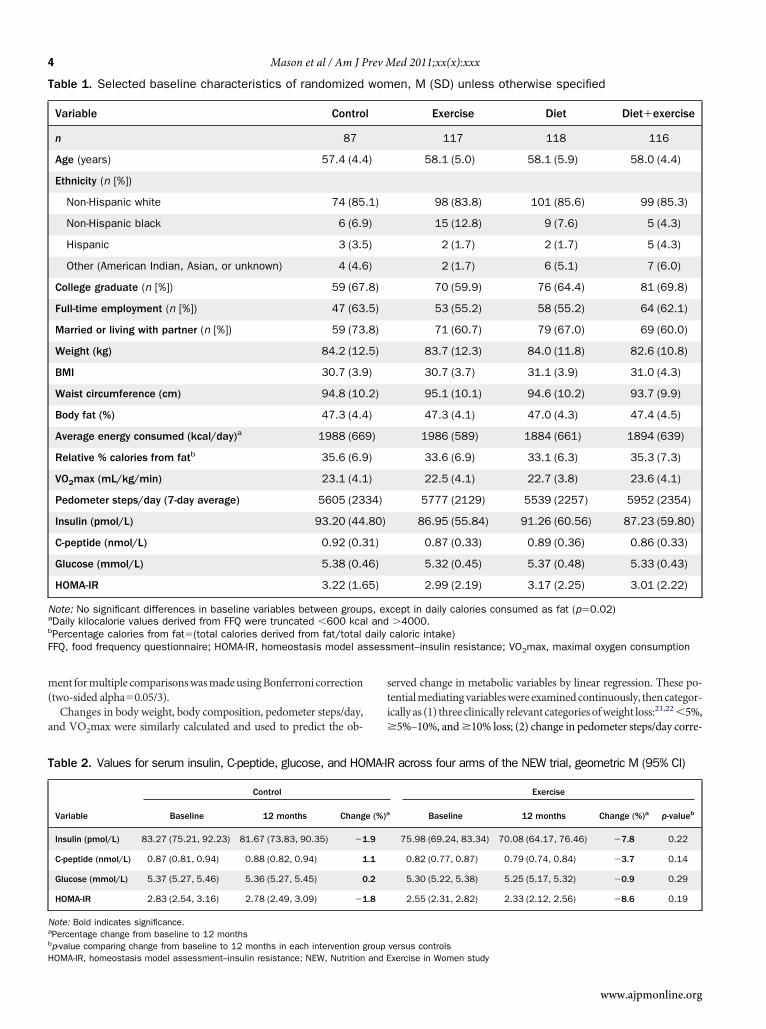
Table 1. Selected baseline characteristics of randomized
Variable Contro
n 87
Age (years) 57.4 (4.4
Ethnicity (n [%])
Non-Hispanic white 74 (85
Non-Hispanic black 6 (6.9
Hispanic 3 (3.5
Other (American Indian, Asian, or unknown) 4 (4.6
College graduate (n [%]) 59 (67
Full-time employment (n [%]) 47 (63
Married or living with partner (n [%]) 59 (73
Weight (kg) 84.2 (12
BMI 30.7 (3.9
Waist circumference (cm) 94.8 (10
Body fat (%) 47.3 (4.4
Average energy consumed (kcal/day)a 1988 (66
Relative % calories from fatb 35.6 (6.9
VO2max (mL/kg/min) 23.1 (4.1
Pedometer steps/day (7-day average) 5605 (23
Insulin (pmol/L) 93.20 (44
C-peptide (nmol/L) 0.92 (0.3
Glucose (mmol/L) 5.38 (0.4
HOMA-IR 3.22 (1.6
Note: No significant differences in baseline variables between groupaDaily kilocalorie values derived from FFQ were truncated �600 kcabPercentage calories from fat�(total calories derived from fat/totalFQ, food frequency questionnaire; HOMA-IR, homeostasis model as
Table 2. Values for serum insulin, C-peptide, glucose, and HO
Variable
Control
Baseline 12 months Chang
Insulin (pmol/L) 83.27 (75.21, 92.23) 81.67 (73.83, 90.35) �1
C-peptide (nmol/L) 0.87 (0.81, 0.94) 0.88 (0.82, 0.94) 1
Glucose (mmol/L) 5.37 (5.27, 5.46) 5.36 (5.27, 5.45) 0
HOMA-IR 2.83 (2.54, 3.16) 2.78 (2.49, 3.09) �1
Note: Bold indicates significance.aPercentage change from baseline to 12 monthsb
p-value comparing change from baseline to 12 months in each intervention groupOMA-IR, homeostasis model assessment–insulin resistance; NEW, Nutrition and E
served change in metabolic variables by linear regression. These po-tentialmediatingvariableswereexaminedcontinuously, thencategor-ically as (1) threeclinically relevant categoriesofweight loss:21,22�5%,5%–10%, and�10% loss; (2) change in pedometer steps/day corre-
en, M (SD) unless otherwise specified
Exercise Diet Diet�exercise
117 118 116
58.1 (5.0) 58.1 (5.9) 58.0 (4.4)
98 (83.8) 101 (85.6) 99 (85.3)
15 (12.8) 9 (7.6) 5 (4.3)
2 (1.7) 2 (1.7) 5 (4.3)
2 (1.7) 6 (5.1) 7 (6.0)
70 (59.9) 76 (64.4) 81 (69.8)
53 (55.2) 58 (55.2) 64 (62.1)
71 (60.7) 79 (67.0) 69 (60.0)
83.7 (12.3) 84.0 (11.8) 82.6 (10.8)
30.7 (3.7) 31.1 (3.9) 31.0 (4.3)
95.1 (10.1) 94.6 (10.2) 93.7 (9.9)
47.3 (4.1) 47.0 (4.3) 47.4 (4.5)
1986 (589) 1884 (661) 1894 (639)
33.6 (6.9) 33.1 (6.3) 35.3 (7.3)
22.5 (4.1) 22.7 (3.8) 23.6 (4.1)
5777 (2129) 5539 (2257) 5952 (2354)
86.95 (55.84) 91.26 (60.56) 87.23 (59.80)
0.87 (0.33) 0.89 (0.36) 0.86 (0.33)
5.32 (0.45) 5.37 (0.48) 5.33 (0.43)
2.99 (2.19) 3.17 (2.25) 3.01 (2.22)
cept in daily calories consumed as fat (p�0.02)�4000.caloric intake)ment–insulin resistance; VO2max, maximal oxygen consumption
across four arms of the NEW trial, geometric M (95% CI)
Exercise
Baseline 12 months Change (%)a p-valueb
75.98 (69.24, 83.34) 70.08 (64.17, 76.46) �7.8 0.22
0.82 (0.77, 0.87) 0.79 (0.74, 0.84) �3.7 0.14
5.30 (5.22, 5.38) 5.25 (5.17, 5.32) �0.9 0.29
2.55 (2.31, 2.82) 2.33 (2.12, 2.56) �8.6 0.19
wom
l
)
.1)
)
)
)
.8)
.5)
.8)
.5)
)
.2)
)
9)
)
)
34)
.80)
1)
6)
5)
s, exl anddaily
MA-IR
e (%)a
.9
.1
.2
.8
versus controlsxercise in Women study
www.ajpmonline.org
snwgw
y
rrd
dA
aseb(pstTa(
(dgWdprc
s
ap
Mason et al / Am J Prev Med 2011;xx(x):xxx 5
sponding to a decrease/no change (�0 steps/day); an increase up to 2miles/day (1–3520 steps/day); or �2 miles/day (�3520 steps/day);and (3) tertiles of change in total body fat (kg) and VO2max (L/min).Models included age, group assignment, and the baseline value of theoutcome variable as covariates.Participants’ fasting glucose levels were classifıed as “impaired”
(5.6–6.9 mmol/L) or “normal” (�5.6 mmol/L).23 Logistic regres-ion was used to calculate the ORs for regression from impaired toormal fasting glucose within each intervention arm comparedith controls, adjusting for age, weight loss, and baseline bloodlucose level. Corresponding ORs were calculated for categories ofeight loss (1%–5%,�5%–10%,�10%, relative to no change/gain)
and approximate tertiles of change in VO2max. All statistical anal-ses were performed using SAS software, version 9.1.
ResultsParticipantsAt 12 months, 398 of 438 participants completed physicalexams and provided a blood sample, 397 underwent aDXAscan, and 371 completed a treadmill test; 39 did not com-plete the study (Figure 1). There were no differences inrelevant variables between groups at baseline, except the per-centage of daily calories consumed as fat (p�0.02; Table 1).
Adherence to InterventionsIntervention adherence and body composition changesin this sample have been recently reported.14 Briefly,women who were randomized to exercise alone partici-pated in moderate-to-vigorous activity for an M (SD) of163.3 (70.6) minutes/week, whereas women who wererandomized to diet�exercise participated for 171.5(62.9) minutes/week. Both groups signifıcantly increasedaverage pedometer steps/day (�2416 and �3471 steps/day, respectively) andVO2max (�0.17 and�0.12 L/min,espectively) compared with baseline. Women who wereandomized to diet�exercise increased pedometer steps/aymore than womenwho did exercise alone (p�0.006).Percentage of calories from fat decreased in both theiet alone (�18%) and diet�exercise (�20.0%) groups.verage fıber intake and daily fruit and vegetable servings
Table 2. (continued)
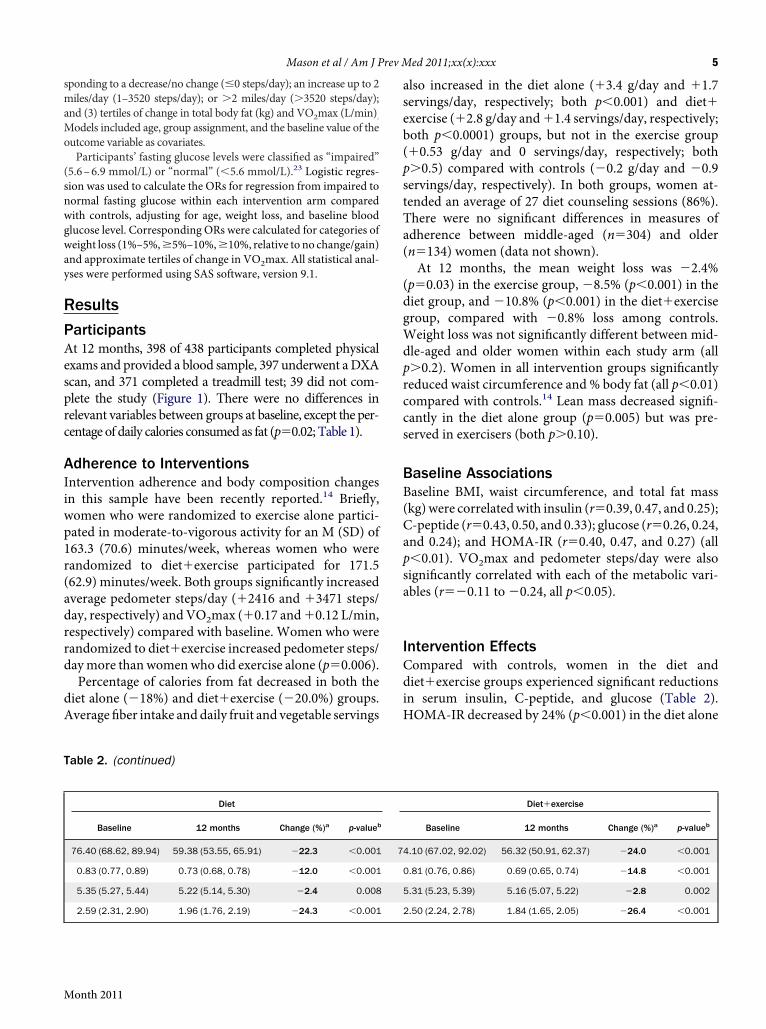
Diet
Baseline 12 months Change (%)a p-valueb
76.40 (68.62, 89.94) 59.38 (53.55, 65.91) �22.3 �0.001
0.83 (0.77, 0.89) 0.73 (0.68, 0.78) �12.0 �0.001
5.35 (5.27, 5.44) 5.22 (5.14, 5.30) �2.4 0.008
2.59 (2.31, 2.90) 1.96 (1.76, 2.19) �24.3 �0.001
Month 2011
lso increased in the diet alone (�3.4 g/day and �1.7ervings/day, respectively; both p�0.001) and diet�xercise (�2.8 g/day and�1.4 servings/day, respectively;oth p�0.0001) groups, but not in the exercise group�0.53 g/day and 0 servings/day, respectively; both�0.5) compared with controls (�0.2 g/day and �0.9ervings/day, respectively). In both groups, women at-ended an average of 27 diet counseling sessions (86%).here were no signifıcant differences in measures ofdherence between middle-aged (n�304) and oldern�134) women (data not shown).At 12 months, the mean weight loss was �2.4%
p�0.03) in the exercise group, �8.5% (p�0.001) in theiet group, and �10.8% (p�0.001) in the diet�exerciseroup, compared with �0.8% loss among controls.eight loss was not signifıcantly different between mid-le-aged and older women within each study arm (all�0.2). Women in all intervention groups signifıcantlyeduced waist circumference and % body fat (all p�0.01)ompared with controls.14 Lean mass decreased signifı-cantly in the diet alone group (p�0.005) but was pre-erved in exercisers (both p�0.10).
Baseline AssociationsBaseline BMI, waist circumference, and total fat mass(kg)were correlatedwith insulin (r�0.39, 0.47, and 0.25);C-peptide (r�0.43, 0.50, and 0.33); glucose (r�0.26, 0.24,nd 0.24); and HOMA-IR (r�0.40, 0.47, and 0.27) (all�0.01). VO2max and pedometer steps/day were alsosignifıcantly correlated with each of the metabolic vari-ables (r��0.11 to �0.24, all p�0.05).
Intervention EffectsCompared with controls, women in the diet anddiet�exercise groups experienced signifıcant reductionsin serum insulin, C-peptide, and glucose (Table 2).HOMA-IR decreased by 24% (p�0.001) in the diet alone
Diet�exercise
Baseline 12 months Change (%)a p-valueb
4.10 (67.02, 92.02) 56.32 (50.91, 62.37) �24.0 �0.001
0.81 (0.76, 0.86) 0.69 (0.65, 0.74) �14.8 �0.001
5.31 (5.23, 5.39) 5.16 (5.07, 5.22) �2.8 0.002
2.50 (2.24, 2.78) 1.84 (1.65, 2.05) �26.4 �0.001
7
csapd(Hiegabocgpp
agw(icawca
oiwoma
tg(cww
stt
6 Mason et al / Am J Prev Med 2011;xx(x):xxx
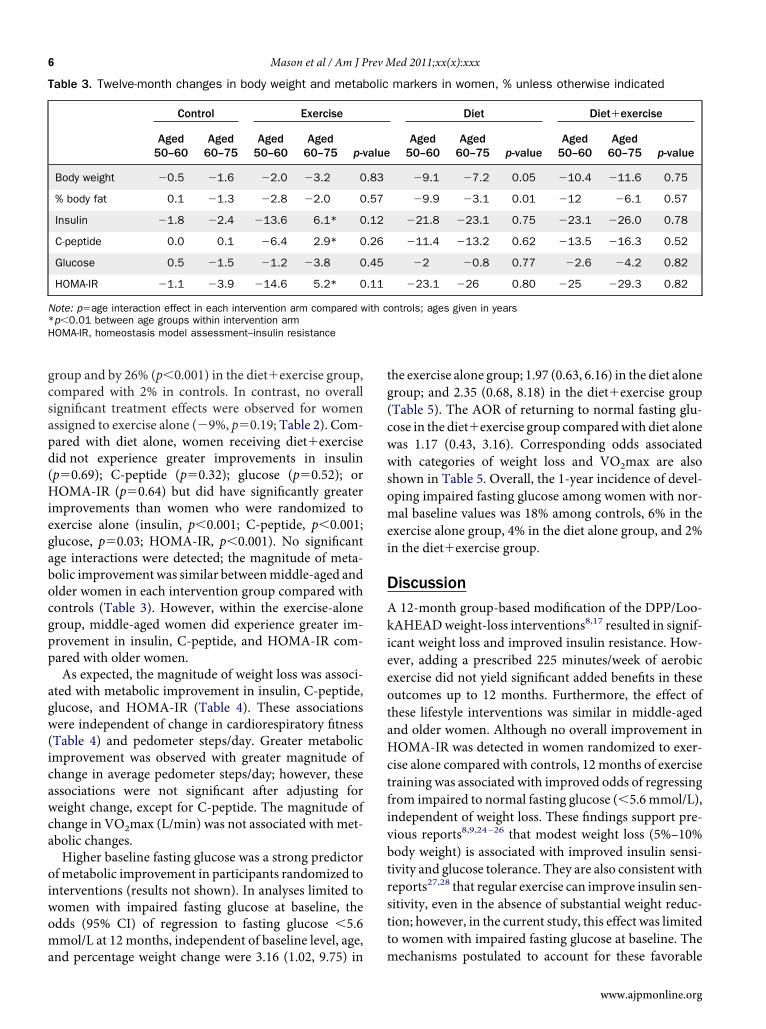
group and by 26% (p�0.001) in the diet�exercise group,ompared with 2% in controls. In contrast, no overallignifıcant treatment effects were observed for womenssigned to exercise alone (�9%, p�0.19; Table 2). Com-ared with diet alone, women receiving diet�exerciseid not experience greater improvements in insulinp�0.69); C-peptide (p�0.32); glucose (p�0.52); orOMA-IR (p�0.64) but did have signifıcantly greatermprovements than women who were randomized toxercise alone (insulin, p�0.001; C-peptide, p�0.001;lucose, p�0.03; HOMA-IR, p�0.001). No signifıcantge interactions were detected; the magnitude of meta-olic improvementwas similar betweenmiddle-aged andlder women in each intervention group compared withontrols (Table 3). However, within the exercise-aloneroup, middle-aged women did experience greater im-rovement in insulin, C-peptide, and HOMA-IR com-ared with older women.As expected, the magnitude of weight loss was associ-
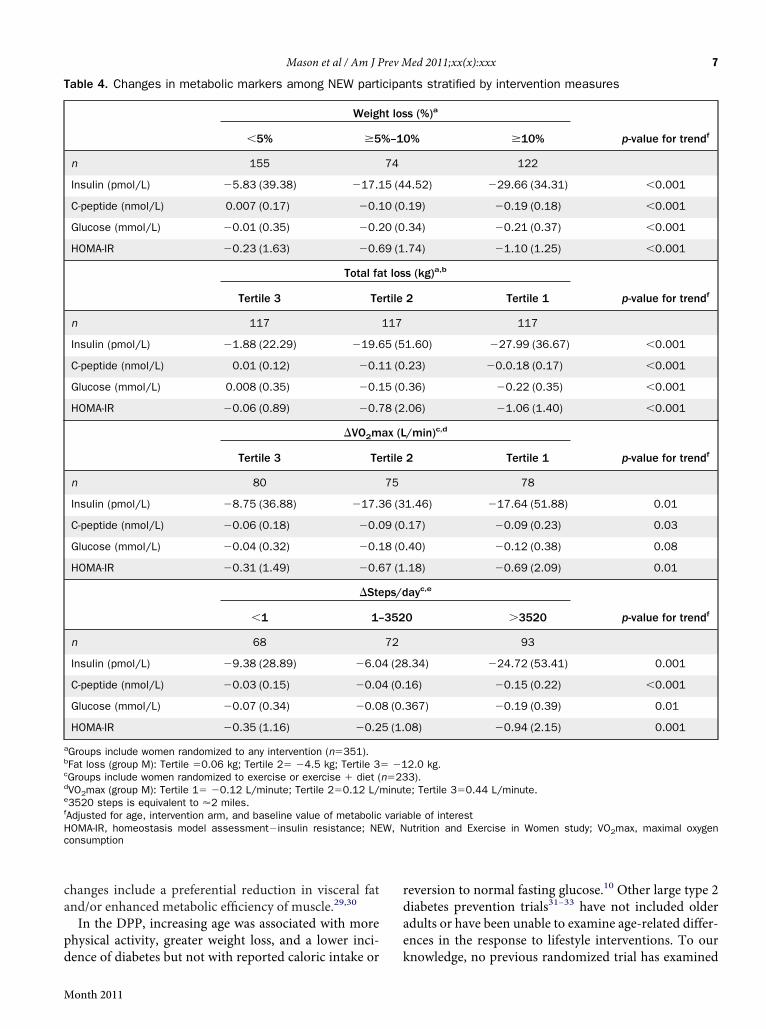
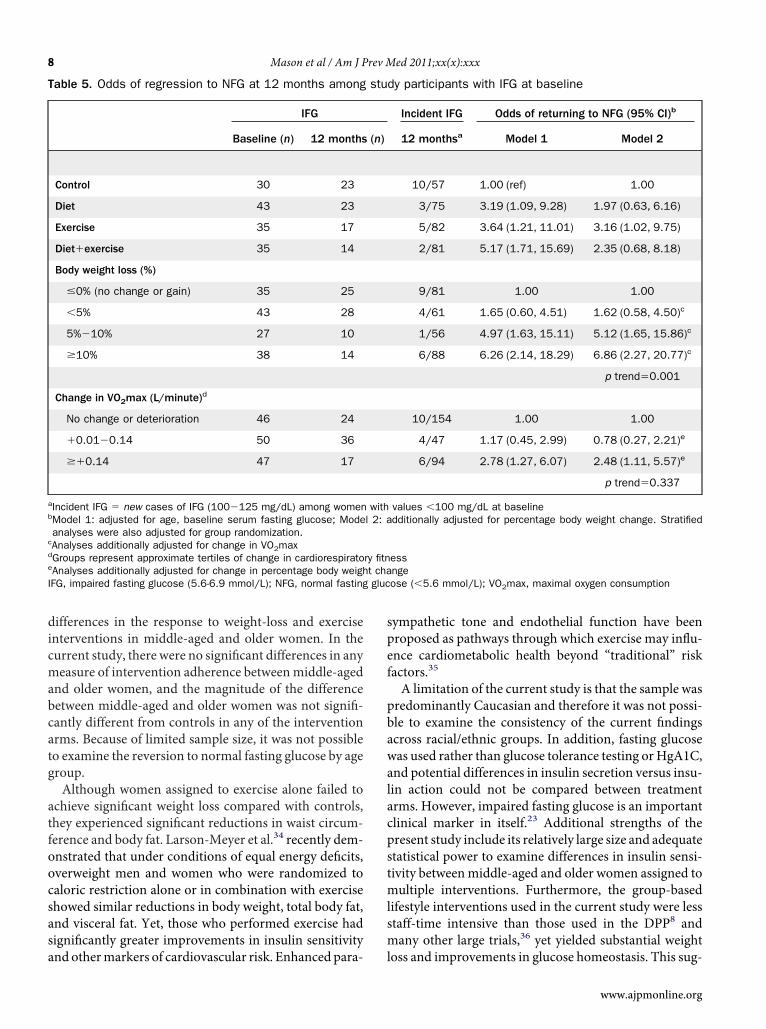
ted with metabolic improvement in insulin, C-peptide,lucose, and HOMA-IR (Table 4). These associationsere independent of change in cardiorespiratory fıtnessTable 4) and pedometer steps/day. Greater metabolicmprovement was observed with greater magnitude ofhange in average pedometer steps/day; however, thesessociations were not signifıcant after adjusting foreight change, except for C-peptide. The magnitude ofhange in VO2max (L/min) was not associated with met-bolic changes.Higher baseline fasting glucose was a strong predictorf metabolic improvement in participants randomized tonterventions (results not shown). In analyses limited toomen with impaired fasting glucose at baseline, thedds (95% CI) of regression to fasting glucose �5.6mol/L at 12 months, independent of baseline level, age,
Table 3. Twelve-month changes in body weight and metab
Control Exercise
Aged50–60
Aged60–75
Aged50–60
Aged60–75 p-v
Body weight �0.5 �1.6 �2.0 �3.2 0
% body fat 0.1 �1.3 �2.8 �2.0 0
Insulin �1.8 �2.4 �13.6 6.1* 0
C-peptide 0.0 0.1 �6.4 2.9* 0
Glucose 0.5 �1.5 �1.2 �3.8 0
HOMA-IR �1.1 �3.9 �14.6 5.2* 0
Note: p�age interaction effect in each intervention arm compared w*p�0.01 between age groups within intervention armHOMA-IR, homeostasis model assessment–insulin resistance
nd percentage weight change were 3.16 (1.02, 9.75) in m
he exercise alone group; 1.97 (0.63, 6.16) in the diet aloneroup; and 2.35 (0.68, 8.18) in the diet�exercise groupTable 5). The AOR of returning to normal fasting glu-ose in the diet�exercise group comparedwith diet aloneas 1.17 (0.43, 3.16). Corresponding odds associatedith categories of weight loss and VO2max are also
shown in Table 5. Overall, the 1-year incidence of devel-oping impaired fasting glucose among women with nor-mal baseline values was 18% among controls, 6% in theexercise alone group, 4% in the diet alone group, and 2%in the diet�exercise group.
DiscussionA 12-month group-based modifıcation of the DPP/Loo-kAHEADweight-loss interventions8,17 resulted in signif-icant weight loss and improved insulin resistance. How-ever, adding a prescribed 225 minutes/week of aerobicexercise did not yield signifıcant added benefıts in theseoutcomes up to 12 months. Furthermore, the effect ofthese lifestyle interventions was similar in middle-agedand older women. Although no overall improvement inHOMA-IR was detected in women randomized to exer-cise alone compared with controls, 12 months of exercisetraining was associated with improved odds of regressingfrom impaired to normal fasting glucose (�5.6 mmol/L),independent of weight loss. These fındings support pre-vious reports8,9,24–26 that modest weight loss (5%–10%body weight) is associated with improved insulin sensi-tivity and glucose tolerance. They are also consistent withreports27,28 that regular exercise can improve insulin sen-itivity, even in the absence of substantial weight reduc-ion; however, in the current study, this effect was limitedo women with impaired fasting glucose at baseline. The
markers in women, % unless otherwise indicated
Diet Diet�exercise
Aged50–60
Aged60–75 p-value
Aged50–60
Aged60–75 p-value
�9.1 �7.2 0.05 �10.4 �11.6 0.75
�9.9 �3.1 0.01 �12 �6.1 0.57
�21.8 �23.1 0.75 �23.1 �26.0 0.78
�11.4 �13.2 0.62 �13.5 �16.3 0.52
�2 �0.8 0.77 �2.6 �4.2 0.82
�23.1 �26 0.80 �25 �29.3 0.82
ontrols; ages given in years
olic
alue
.83
.57
.12
.26
.45
.11
ith c
echanisms postulated to account for these favorable
www.ajpmonline.org
r
c
Mason et al / Am J Prev Med 2011;xx(x):xxx 7
changes include a preferential reduction in visceral fatand/or enhanced metabolic effıciency of muscle.29,30
In the DPP, increasing age was associated with morephysical activity, greater weight loss, and a lower inci-
Table 4. Changes in metabolic markers among NEW part
Weigh
�5% �5
n 155
Insulin (pmol/L) �5.83 (39.38) �17.1
C-peptide (nmol/L) 0.007 (0.17) �0.1
Glucose (mmol/L) �0.01 (0.35) �0.2
HOMA-IR �0.23 (1.63) �0.6
Total fa
Tertile 3 Te
n 117
Insulin (pmol/L) �1.88 (22.29) �19.6
C-peptide (nmol/L) 0.01 (0.12) �0.1
Glucose (mmol/L) 0.008 (0.35) �0.1
HOMA-IR �0.06 (0.89) �0.7
�VO2m
Tertile 3 Te
n 80
Insulin (pmol/L) �8.75 (36.88) �17.3
C-peptide (nmol/L) �0.06 (0.18) �0.0
Glucose (mmol/L) �0.04 (0.32) �0.1
HOMA-IR �0.31 (1.49) �0.6
�Ste
�1 1–
n 68
Insulin (pmol/L) �9.38 (28.89) �6.0
C-peptide (nmol/L) �0.03 (0.15) �0.0
Glucose (mmol/L) �0.07 (0.34) �0.0
HOMA-IR �0.35 (1.16) �0.2
aGroups include women randomized to any intervention (n�351).bFat loss (group M): Tertile �0.06 kg; Tertile 2� �4.5 kg; Tertile 3cGroups include women randomized to exercise or exercise � diet (dVO2max (group M): Tertile 1� �0.12 L/minute; Tertile 2�0.12 L/e3520 steps is equivalent to �2 miles.fAdjusted for age, intervention arm, and baseline value of metabolicHOMA-IR, homeostasis model assessment�insulin resistance; NEonsumption
dence of diabetes but not with reported caloric intake or
Month 2011
eversion to normal fasting glucose.10 Other large type 2diabetes prevention trials31–33 have not included olderadults or have been unable to examine age-related differ-ences in the response to lifestyle interventions. To our
nts stratified by intervention measures
s (%)a
p-value for trendf0% �10%
122
4.52) �29.66 (34.31) �0.001
.19) �0.19 (0.18) �0.001
.34) �0.21 (0.37) �0.001
.74) �1.10 (1.25) �0.001
s (kg)a,b
p-value for trendf2 Tertile 1
117
1.60) �27.99 (36.67) �0.001
.23) �0.0.18 (0.17) �0.001
.36) �0.22 (0.35) �0.001
.06) �1.06 (1.40) �0.001
/min)c,d
p-value for trendf2 Tertile 1
78
1.46) �17.64 (51.88) 0.01
.17) �0.09 (0.23) 0.03
.40) �0.12 (0.38) 0.08
.18) �0.69 (2.09) 0.01
ayc,e
p-value for trendf0 �3520
93
.34) �24.72 (53.41) 0.001
16) �0.15 (0.22) �0.001
367) �0.19 (0.39) 0.01
08) �0.94 (2.15) 0.001
2.0 kg.3).e; Tertile 3�0.44 L/minute.
ble of interestutrition and Exercise in Women study; VO2max, maximal oxygen
icipa
t los
%–1
74
5 (4
0 (0
0 (0
9 (1
t los
rtile
117
5 (5
1 (0
5 (0
8 (2
ax (L
rtile
75
6 (3
9 (0
8 (0
7 (1
ps/d
352
72
4 (28
4 (0.
8 (0.
5 (1.
� �1n�23minut
variaW, N
knowledge, no previous randomized trial has examined
oocsasa
spef
pstmlsm
gluc
8 Mason et al / Am J Prev Med 2011;xx(x):xxx
differences in the response to weight-loss and exerciseinterventions in middle-aged and older women. In thecurrent study, there were no signifıcant differences in anymeasure of intervention adherence betweenmiddle-agedand older women, and the magnitude of the differencebetween middle-aged and older women was not signifı-cantly different from controls in any of the interventionarms. Because of limited sample size, it was not possibleto examine the reversion to normal fasting glucose by agegroup.Although women assigned to exercise alone failed to
achieve signifıcant weight loss compared with controls,they experienced signifıcant reductions in waist circum-ference and body fat. Larson-Meyer et al.34 recently dem-nstrated that under conditions of equal energy defıcits,verweight men and women who were randomized toaloric restriction alone or in combination with exercisehowed similar reductions in body weight, total body fat,nd visceral fat. Yet, those who performed exercise hadignifıcantly greater improvements in insulin sensitivity
Table 5. Odds of regression to NFG at 12 months among
IFG
Baseline (n) 12 months
Control 30 23
Diet 43 23
Exercise 35 17
Diet�exercise 35 14
Body weight loss (%)
�0% (no change or gain) 35 25
�5% 43 28
5%�10% 27 10
�10% 38 14
Change in VO2max (L/minute)d
No change or deterioration 46 24
�0.01�0.14 50 36
��0.14 47 17
aIncident IFG � new cases of IFG (100�125 mg/dL) among womenbModel 1: adjusted for age, baseline serum fasting glucose; Modeanalyses were also adjusted for group randomization.
cAnalyses additionally adjusted for change in VO2maxdGroups represent approximate tertiles of change in cardiorespiratoeAnalyses additionally adjusted for change in percentage body weighIFG, impaired fasting glucose (5.6-6.9 mmol/L); NFG, normal fasting
nd othermarkers of cardiovascular risk. Enhanced para-
ympathetic tone and endothelial function have beenroposed as pathways through which exercise may influ-nce cardiometabolic health beyond “traditional” riskactors.35
A limitation of the current study is that the sample waspredominantly Caucasian and therefore it was not possi-ble to examine the consistency of the current fındingsacross racial/ethnic groups. In addition, fasting glucosewas used rather than glucose tolerance testing orHgA1C,and potential differences in insulin secretion versus insu-lin action could not be compared between treatmentarms. However, impaired fasting glucose is an importantclinical marker in itself.23 Additional strengths of theresent study include its relatively large size and adequatetatistical power to examine differences in insulin sensi-ivity betweenmiddle-aged and older women assigned toultiple interventions. Furthermore, the group-based
ifestyle interventions used in the current study were lesstaff-time intensive than those used in the DPP8 andany other large trials,36 yet yielded substantial weight
dy participants with IFG at baseline
Incident IFG Odds of returning to NFG (95% CI)b
12 monthsa Model 1 Model 2
10/57 1.00 (ref) 1.00
3/75 3.19 (1.09, 9.28) 1.97 (0.63, 6.16)
5/82 3.64 (1.21, 11.01) 3.16 (1.02, 9.75)
2/81 5.17 (1.71, 15.69) 2.35 (0.68, 8.18)
9/81 1.00 1.00
4/61 1.65 (0.60, 4.51) 1.62 (0.58, 4.50)c
1/56 4.97 (1.63, 15.11) 5.12 (1.65, 15.86)c
6/88 6.26 (2.14, 18.29) 6.86 (2.27, 20.77)c
p trend�0.001
10/154 1.00 1.00
4/47 1.17 (0.45, 2.99) 0.78 (0.27, 2.21)e
6/94 2.78 (1.27, 6.07) 2.48 (1.11, 5.57)e
p trend�0.337
values �100 mg/dL at baselinedditionally adjusted for percentage body weight change. Stratified
essngeose (�5.6 mmol/L); VO2max, maximal oxygen consumption
stu
(n)
withl 2: a
ry fitnt cha
loss and improvements in glucose homeostasis. This sug-
www.ajpmonline.org
up“k
sdptst
atltbea
itt
1
1
1
1
1
1
1
Mason et al / Am J Prev Med 2011;xx(x):xxx 9
gests that group-based diet and exercise programsmay beas effective as one-on-one counseling in eliciting favor-able improvements, at least among postmenopausalwomen. Future studies to determine the comparative ef-fectiveness of these programs with larger and more di-verse groups, and in other settings, would provide animportant contribution to the current literature.The current study provides evidence that clinically
meaningful improvements in insulin sensitivity can beachieved through caloric restriction alone or with theaddition of exercise. Furthermore, a prescribed exercisedose of 225 minutes/week resulted in regression to nor-mal glucose levels for more than half of women withimpaired fasting glucose at baseline. In the DPP, individ-uals who were randomized to lifestyle intervention whodid not achieve the desired goal of 7% reduction in bodyweight but attained the physical activity goal of �150 min-tes/week experienced a 44% reduction in the risk ofrogression to diabetes.9 The optimal exercise dose fortreatment” of impaired fasting glucose remains un-nown but clearly warrants further investigation.Weight loss among older people remains controver-
ial, primarily because of concern over the potentiallyeleterious loss of muscle and bone mass. The exerciserogram tested in the current study did not include resis-ance training; however, resistance exercise has beenhown to have favorable effects on glycemic control37 andohelp preserve leanmass duringweight loss.25An earlierstudy27 has shown that the combination of resistance anderobic exercise is the optimal exercise strategy for simul-aneous reduction in insulin resistance and functionalimitation in obese older adults. The current fındings andhose of others therefore suggest that weight loss com-ined with exercise is likely to be the safest and mostffective approach to glycemic control among olderdults.In the U.S., approximately 57 million adults have
mpaired fasting glucose, and up to 70% will progresso overt type 2 diabetes in their lifetime without effec-ive intervention.38 True disease prevention should becounted as the maintenance or restoration of normalglucose regulation rather than a prolonged prediabeticstate, with which there remains signifıcant health risk.2
The American Diabetes Association39 currently recom-mends that people with prediabetes be referred to aneffective program promoting 5%–10% body weight lossand at least 150minutes/week ofmoderate physical activ-ity. Although maximum benefıt will be achieved withsuccessful weight loss, ongoing effort to promote regularphysical activity has the potential for health benefıtsamongwomenwith impaired fasting glucose, and to helpprevent the potentially deleterious loss of lean mass in
older individuals undergoing weight loss.Month 2011
This work was supported by the National Cancer Institute atthe NIH (grant number: R01 CA102504, U54-CA116847,and 5KL2RR025015-03 to KFS, R25 CA94880 and2R25CA057699-16 to AK) and the Canadian Institutes ofHealth Research (Fellowship to KLC and CM). None of thefunding agencies were involved in the trial design or conduct.While working on the trial, CMA was employed at the OhioState University, and located to NCI following completion ofher effort on the NEW trial.No fınancial disclosures were reported by the authors of this
paper.
References1. International Diabetes Federation: Diabetes atlas. 3rd ed. Brussels:
International Diabetes Federation, 2006.2. Reaven GM. Pathophysiology of insulin resistance in human disease.
Physiol Rev 1995;75(3):473–86.3. CoutinhoM,GersteinHC,Wang Y, Yusuf S. The relationship between
glucose and incident cardiovascular events. A metaregression analysisof published data from 20 studies of 95,783 individuals followed for12.4 years. Diabetes Care 1999;22(2):233–40.
4. Folsom AR, Rasmussen ML, Chambless LE, et al. Prospective associa-tions of fasting insulin, body fat distribution, and diabetes with risk ofischemic stroke. The Atherosclerosis Risk in Communities (ARIC)Study Investigators. Diabetes Care 1999;22(7):1077–83.
5. Levitzky YS, Pencina MJ, D’Agostino RB, et al. Impact of impairedfasting glucose on cardiovascular disease: the Framingham HeartStudy. J Am Coll Cardiol 2008;51(3):264–70.
6. Pisani P. Hyper-insulinaemia and cancer, meta-analyses of epidemio-logical studies. Arch Physiol Biochem 2008;114(1):63–70.
7. Rapp K, Schroeder J, Klenk J, et al. Fasting blood glucose and cancerrisk in a cohort of more than 140,000 adults in Austria. Diabetologia2006;49(5):945–52.
8. Knowler WC, Barrett-Connor E, Fowler SE, et al. Reduction in theincidence of type 2 diabetes with lifestyle intervention or metformin.N Engl J Med 2002;346(6):393–403.
9. Perreault L, Kahn SE, Christophi CA, Knowler WC, Hamman RF.Regression from pre-diabetes to normal glucose regulation in the dia-betes prevention program. Diabetes Care 2009;32(9):1583–8.
0. Crandall J, Schade D, Ma Y, et al. The influence of age on the effects oflifestyle modifıcation and metformin in prevention of diabetes. JGerontol A Biol Sci Med Sci 2006;61(10):1075–81.
1. Mokdad AH, Bowman BA, Ford ES, Vinicor F, Marks JS, Koplan JP.The continuing epidemics of obesity and diabetes in the U.S. JAMA2001;286(10):1195–200.
2. Houston DK, Nicklas BJ, Zizza CA. Weighty concerns: the growingprevalence of obesity among older adults. J Am Diet Assoc2009;109(11):1886–95.
3. Witham MD, Avenell A. Interventions to achieve long-term weightloss in obese older people: a systematic review and meta-analysis. AgeAgeing 2010;39(2):176–84.
4. Foster-Schubert KE, Alfano CM,Duggan C, et al. Effect of exercise anddiet, alone or combined, on weight and body composition in over-weight-to-obese post-menopausal women. Obesity 2011;in press.
5. 2008 Physical Activity Guidelines for Americans. DHHS. www.health-.gov/paguidelines.
6. Ainsworth BE, Haskell WL,Whitt MC, et al. Compendium of physicalactivities: an update of activity codes and MET intensities. Med Sci
Sports Exerc 2000;32(9S):S498–504.
10 Mason et al / Am J Prev Med 2011;xx(x):xxx
17. Ryan DH, Espeland MA, Foster GD, et al. Look AHEAD (Action forHealth in Diabetes): design and methods for a clinical trial of weightloss for the prevention of cardiovascular disease in type 2 diabetes.Control Clin Trials 2003;24(5):610–28.
18. TaylorHL, JacobsDR Jr, Schucker B, Knudsen J, LeonAS, Debacker G.A questionnaire for the assessment of leisure time physical activities.J Chronic Dis 1978;31(12):741–55.
19. Pate R, Blair S, Durstine J. Guidelines for exercise testing and prescrip-tion. Philadelphia PA: Lea & Febinger, 1991:70–2.
20. Matthews DR, Hosker JP, Rudenski AS, Naylor BA, Treacher DF,Turner RC. Homeostasis model assessment: insulin resistance andbeta-cell function from fasting plasma glucose and insulin concentra-tions in man. Diabetologia 1985;28(7):412–9.
21. NIH. Clinical guidelines on the identifıcation, evaluation, and treat-ment of overweight and obesity in adults—the evidence report. ObesRes 1998;6(S2):51S–209S.
22. Christian JG, Tsai AG, Bessesen DH. Interpreting weight losses fromlifestyle modifıcation trials: using categorical data. Int J Obes2010;34(1):207–9.
23. Report of the expert committee on the diagnosis and classifıcation ofdiabetes mellitus. Diabetes Care 2003;26(S1):S5–20.
24. Weiss EP, Racette SB, Villareal DT, et al. Improvements in glucosetolerance and insulin action induced by increasing energy expenditureor decreasing energy intake: a randomized controlled trial. Am J ClinNutr 2006;84(5):1033–42.
25. Ross R, Dagnone D, Jones PJ, et al. Reduction in obesity and relatedcomorbid conditions after diet-induced weight loss or exercise-in-duced weight loss in men. A randomized, controlled trial. Ann InternMed 2000;133(2):92–103.
26. Tuomilehto J, Lindstrom J, Eriksson JG, et al. Prevention of type 2diabetes mellitus by changes in lifestyle among subjects with impairedglucose tolerance. N Engl J Med 2001;344(18):1343–50.
27. Davidson LE,HudsonR, KilpatrickK, et al. Effects of exercisemodalityon insulin resistance and functional limitation in older adults: a ran-domized controlled trial. Arch Intern Med 2009;169(2):122–31.
28. Houmard JA, Tanner CJ, Slentz CA, Duscha BD, McCartney JS, KrausWE. Effect of the volume and intensity of exercise training on insulin
sensitivity. J Appl Physiol 2004;96(1):101–6.29. Menshikova EV, Ritov VB, Toledo FG, Ferrell RE, Goodpaster BH,KelleyDE. Effects ofweight loss andphysical activity on skeletalmusclemitochondrial function in obesity. Am J Physiol Endocrinol Metab2005;288(4):E818–25.
30. Hughes VA, Fiatarone MA, Fielding RA, et al. Exercise increases mus-cle GLUT-4 levels and insulin action in subjects with impaired glucosetolerance. Am J Physiol 1993;264(6 Pt 1):E855–62.
31. Li G, Zhang P, Wang J, et al. The long-term effect of lifestyleinterventions to prevent diabetes in the China Da Qing DiabetesPrevention Study: a 20-year follow-up study. Lancet 2008;371(9626):1783–9.
32. Saaristo T, Moilanen L, Korpi-Hyovalti E, et al. Lifestyle interventionfor prevention of type 2 diabetes in primary health care: one-yearfollow-up of the Finnish National Diabetes Prevention Program (FIN-D2D). Diabetes Care 2010;33(10):2146–51.
33. RamachandranA, SnehalathaC,Mary S,Mukesh B, BhaskarAD,VijayV. The Indian Diabetes Prevention Programme shows that lifestylemodifıcation and metformin prevent type 2 diabetes in Asian Indiansubjects with impaired glucose tolerance (IDPP-1). Diabetologia2006;49(2):289–97.
34. Larson-Meyer DE, Redman L, Heilbronn LK, Martin CK, Ravussin E.Caloric restriction with or without exercise: the fıtness versus fatnessdebate. Med Sci Sports Exerc 2009;42(1):152–9.
35. Joyner MJ, Green DJ. Exercise protects the cardiovascular system:effects beyond traditional risk factors. J Physiol 2009;587(Pt23):5551–8.
36. Walker KZ, O’Dea K, Gomez M, Girgis S, Colagiuri R. Diet and exer-cise in the prevention of diabetes. J HumNutr Diet 2010;23(4):344–52.
37. Sigal RJ, Kenny GP, Boule NG, et al. Effects of aerobic training, resis-tance training, or both on glycemic control in type 2 diabetes: a ran-domized trial. Ann Intern Med 2007;147(6):357–69.
38. Cowie CC, Rust KF, Byrd-Holt DD, et al. Prevalence of diabetes andimpaired fasting glucose in adults in the U.S. population: NationalHealth And Nutrition Examination Survey 1999–2002. Diabetes Care2006;29(6):1263–8.
39. American Diabetes Association. Executive summary: Standards of
medical care in diabetes–2010. Diabetes Care 2010;33(S1):S4–10.www.ajpmonline.org


