Embed Size (px)
Citation preview

RESEARCH Open Access
High levels of dietary stearate promote adiposityand deteriorate hepatic insulin sensitivitySjoerd AA van den Berg1*, Bruno Guigas2, Silvia Bijland1, Margriet Ouwens2, Peter J Voshol3, Rune R Frants1,Louis M Havekes4,5,6, Johannes A Romijn3, Ko Willems van Dijk1,4
Abstract
Background: Relatively little is known about the role of specific saturated fatty acids in the development of highfat diet induced obesity and insulin resistance. Here, we have studied the effect of stearate in high fat diets (45%energy as fat) on whole body energy metabolism and tissue specific insulin sensitivity.
Methods: C57Bl/6 mice were fed a low stearate diet based on palm oil or one of two stearate rich diets, one dietbased on lard and one diet based on palm oil supplemented with tristearin (to the stearate level of the lard baseddiet), for a period of 5 weeks. Ad libitum fed Oxidative metabolism was assessed by indirect calorimetry at week 5.Changes in body mass and composition was assessed by DEXA scan analysis. Tissue specific insulin sensitivity wasassessed by hyperinsulinemic-euglycemic clamp analysis and Western blot at the end of week 5.
Results: Indirect calorimetry analysis revealed that high levels of dietary stearate resulted in lower caloric energyexpenditure characterized by lower oxidation of fatty acids. In agreement with this metabolic phenotype, mice onthe stearate rich diets gained more adipose tissue mass. Whole body and tissue specific insulin sensitivity wasassessed by hyperinsulinemic-euglycemic clamp and analysis of insulin induced PKBser473 phosphorylation. Wholebody insulin sensitivity was decreased by all high fat diets. However, while insulin-stimulated glucose uptake byperipheral tissues was impaired by all high fat diets, hepatic insulin sensitivity was affected only by the stearate richdiets. This tissue-specific pattern of reduced insulin sensitivity was confirmed by similar impairment in insulin-induced phosphorylation of PKBser473 in both liver and skeletal muscle.
Conclusion: In C57Bl/6 mice, 5 weeks of a high fat diet rich in stearate induces a metabolic state favoring lowoxidative metabolism, increased adiposity and whole body insulin resistance characterized by severe hepatic insulinresistance. These results indicate that dietary fatty acid composition per sé rather than dietary fat contentdetermines insulin sensitivity in liver of high fat fed C57Bl/6 mice.
IntroductionHigh fat diets are widely used to study the developmentof obesity and insulin resistance in rodent models. Thefat used in these diets often derives from naturalsources, for example lard, tallow, palm oil or coca butterwhich contain fatty acids varying in chain-length andsaturation level. Although different high fat diets clearlyinduce different effects [1-3], it has been a challenge toassign specific effects to individual fatty acids. This isspecifically of interest and relevance for differentialeffects of the saturated long chain fatty acids (FA)
palmitic acid (C16:0) and stearic acid (C18:0), whichrepresent the most common nutritional long chain fattyacids [4].Differences in dietary FA composition are of physiolo-
gical relevance, since the metabolic fate of FA is depen-dent on chain length as well as the degree of saturation.For example, oxidative efficiency of FA decreases withincreasing chain length and saturation level. In rats,after oral administration of labeled FA, the efficiency ofthe oxidation of saturated FA has been demonstrated tobe lauric acid (C12:0) > myristic acid (C14:0) > palmiticacid (C16:0) > stearic acid (C18:0) [5]. Similar resultshave been found in a human study where the oxidationrate of stearic acid after a bolus administration wasfound to be poor in comparison to lauric acid (13%
* Correspondence: [email protected] of Human Genetics, Leiden University Medical Center, Leiden,The Netherlands
van den Berg et al. Nutrition & Metabolism 2010, 7:24http://www.nutritionandmetabolism.com/content/7/1/24
© 2010 Berg et al; licensee BioMed Central Ltd. This is an Open Access article distributed under the terms of the Creative CommonsAttribution License (http://creativecommons.org/licenses/by/2.0), which permits unrestricted use, distribution, and reproduction inany medium, provided the original work is properly cited.

versus 41% oxidized within 9 hours after administration)[6]. Accordingly, at the cellular level, stearic acid hasbeen described to be poorly oxidized by hepatocytes [7].In addition to their low oxidative efficiency, saturatedlong chain FA are known to affect insulin sensitivitydirectly in a chain length dependent manner via a TLR4dependent pathway [8-10].In this study, we investigated whether the level of diet-
ary stearate in high fat diets determines whole-bodyenergy metabolism and tissue-specific insulin sensitivity.For this purpose, mice were fed for 5 weeks either a dietlow in stearate or two diets naturally or artificiallyenriched in stearate. Whole-body metabolism wasassessed by indirect calorimetry and body compositionanalyzed by Dual Energy X-ray Absorptiometry (DEXA).Tissue-specific insulin sensitivity was evaluated by bothhyperinsulinemic-euglycemic clamp and phosphorylationof key proteins involved in the insulin signaling pathway.
MethodsAnimals, diets and housingAll animal experiments were approved by the AnimalEthic Committee from the Leiden University MedicalCenter (Leiden, the Netherlands) in accordance with theprinciples and guidelines established by the EuropeanConvention for the Protection of Laboratory Animals.Male C57Bl/6J mice were obtained from Charles River
Laboratories at an age of 8 weeks and acclimatized upto an age of 12 weeks at the Leiden University MedicalCenter animal facility. Animals were housed in a con-trolled environment (23°C, 55% humidity) under a 12 hlight-dark cycle (07:00-19:00). Food and tap water wasavailable ad libitum during the whole experiment. Afteracclimatization mice were switched to a low-fat run-indiet (10% energy in the form of fat, D12450B, ResearchDiet Services, Wijk bij Duurstede, The Netherlands) fora period of 2 weeks, with fat sources consisting of palmoil (LFW) or lard (LFL) matching the later experimentalhigh and low stearate high fat diets. The composition ofthe low fat run in diets was similar to the high fat dietsin all respects apart from total fat content. At the age of14 weeks, animals were randomized for body mass andswitched to the high fat experimental diets (24% w/wprotein, 41% w/w carbohydrate and 24% w/w fat with45% energy in the form of fat, D12451, Research DietServices, Wijk bij Duurstede, The Netherlands) for aperiod of 5 weeks. High fat diets are referred to as HFP(palm oil, 4.4% of total fat content is stearate), HFL(lard based diet, 15.0% of total fat is stearate) and HFPS(palm oil + tristearin supplementation, 13.9% of total fatis stearate) in this paper (table 1). After tristearin sup-plementation, stearate content of the HFPS high fat dietwas comparable to the lard based high fat diet, whereasthe dilution of the other fatty acids was kept to a
minimum (2.3%) to avoid secondary effects due todepletion of other fatty acids (table 2).
Indirect calorimetryGroups of 8 mice per high fat diet were subjected toindividual indirect calorimetry measurements for a per-iod of 4 consecutive days (Comprehensive LaboratoryAnimal Monitoring System, Columbus Instruments,Columbus Ohio, US). A period of 24 hours prior to thestart of the experiment allowed the acclimatization of
Table 1 Composition of HFP, HFL, HFPS high fat diets.
Diet composition
Ingredient grams
Casein, 80 Mesh 200 200 200
L-Cystine 3 3 3
Corn Starch 72.8 72.8 72.8
Maltodextrin 10 100 100 100
Sucrose 172.8 172.8 172.8
Cellulose, BW200 50 50 50
Soybean Oil 25 25 25
Palm oil 177.5 0 177.5
Tristearin 0 0 27.5
Lard 0 177.5 0
Mineral Mix S10026 10 10 10
DiCalcium Phosphate 13 13 13
Calcium Carbonate 5.5 5.5 5.5
Potassium Citrate, 1 H2O 16.5 16.5 16.5
Vitamin Mix V10001 10 10 10
Choline Bitartrate 2 2 2
FD&C Red Dye #40 0.05 0.05 0.05
total 858.15 858.15 885.65
Table 2 Fatty acid composition of HFP, HFL, HFPS. FAlevels are represented as percentage of total fat content.
Fatty acid composition (% of total):
HFP HFL HFPS
C12:0 0.3 - 0.3
C14:0 0.9 0.8 0.8
C16:0 35.6 29.2 32.0
C16:1w7 0.2 2.8 0.2
C18:0 4.4 15.0 13.9
C18:1w9 40.6 43.3 36.6
C18:2w6 16.5 8.9 14.8
C18:3w3 0.7 - 0.6
C20:0 0.5 - 0.5
C20:1w9 0.1 - 0.1
C22:0 0.2 - 0.2
Total % 100 100 100
van den Berg et al. Nutrition & Metabolism 2010, 7:24http://www.nutritionandmetabolism.com/content/7/1/24
Page 2 of 11

the animals to the cages and the single housing. Experi-mental analysis started at 09:00 h and continued for 72hours. Analyzed parameters included real time food andwater intake, as well as meal size, frequency and dura-tion. Oxygen consumption (VO2) and carbon dioxideproduction rates (VCO2) were measured at intervals of7 minutes. Respiratory exchange ratio (RER) as a mea-sure for metabolic substrate choice was calculated usingthe following formula:
RER VCO2/VO2.
Carbohydrate and fat oxidation rates were calculatedfrom VO2 and VCO2 using the following formulas [11]:
Carbohydrate oxidation kcal/h 585*VCO2)-(3.226*VO2))*( ) (( . 4 44/1000
Fat oxidation(kcal/h) ((1.695*VO2)-(1.701*VCO2))*9/1 0000
VO2 and VCO2 values are in mL/h. Total energyexpenditure was calculated from the sum of carbohy-drate and fat oxidation. Activity was monitored as infra-red beam breaks in both X and Y axis.
Body anthropometry and Dual Energy X-rayAbsorptiometry (DEXA) scan analysisAnimals were subjected to DEXA scan analysis in fedconditions to avoid weight loss induced by overnightfasting. Animals were weighed and sedated by a singleintra peritoneal injection of a mixture of Acepromazin(0.5 mg/kg), Midazolam (0.25 mg/kg) and Fentanyl(0.025 mg/kg). Sedated animals were scanned in totousing a small animal DEXA scanner (pDEXA, NorlandStratec Medizintechinik GmbH, Birkenfeld, Germany)and data were analyzed by the software supplied by themanufacturer. Fat mass and lean body mass weredetermined.
Hyperinsulinemic euglycemic clamp experimentsHyperinsulinemic - euglycemic clamp experiments wereperformed as described before [12-16] with minor modi-fications to fit our specific model. Per group 5-8 micewere clamped. Clamp experiments were performed afteran overnight fast. Animals were anesthetized by ip injec-tion with a combination of Acepromazin (0.5 mg/kg,Sanofi Santé Nutrition Animale, Libourne Cedex,France), Midazolam (0.25 mg/kg, Roche, Mijdrecht, TheNetherlands) and Fentanyl (0.025 mg/kg, Janssen-Cilag,Tilburg, The Netherlands). An infusion needle was placedinto a tail vein. After 60 min infusion of D-[1-14C]-glucose at a rate of 0.8 μCi/h (specific activity, 9.6GBq/mmol; Amersham, Little Chalfont, UK) to achievesteady-state levels and basal parameters were deter-mined with 10-min intervals. Thereafter, a bolus ofinsulin (4.5 mU, Actrapid; Novo Nordisk, Chartres,France) was administered and the hyperinsulinemic
clamp was started. Insulin was infused at a constantrate of 3.5 mU/kg.min, and D-[1-14C]glucose wasinfused at a rate of 0.8 μCi/h. A variable infusion of12.5% D-glucose (in PBS) was also started to maintaineuglycemic basal blood glucose levels. Blood glucosewas measured with an AccuCheck hand glucose mea-surer (AccuCheck, Roche Diagnostics, Metronic Medi-cal Systems, Vianen, The Netherlands) every 10 min tomonitor glucose levels and adjust the glucose pump.After reaching steady state, blood samples were takenat 10-min intervals during 30 min to determine steady-state levels of [14C]glucose. An average clamp experi-ment took approximately 2.5 h, and anesthesia as wellas body temperature was maintained throughout theprocedure. For time courses of the plasma glucoselevels and glucose infusion rates during the clamp areshown (see additional file 1).
Analysis of clamp samplesPlasma insulin concentrations were measured by ELISA(Mercodia, Sweden). To measure plasma [14C]glucoseactivity, trichloroacetic acid (final concentration 2%) wasadded to 7.5 μl plasma to precipitate proteins using cen-trifugation. The supernatant was dried to remove waterand resuspended in milliQ. The samples were countedusing scintillation counting (Packard Instruments, Dow-ers Grove, IL).
CalculationsThe glucose turnover rate (μmol/min·kg) was calculatedduring the basal period and under steady-state clampconditions as the rate of tracer infusion (dpm/min)divided by the plasma specific activity of [14C]glucose(dpm/μmol). The ratio was corrected for lean bodymass. The hyperinsulinemic hepatic glucose production(HGP) was calculated as the difference between thetracer-derived rate of glucose appearance and the glucoseinfusion rate.
Insulin signalling experimentsInsulin signalling analysis was performed as describedbefore [17,18], with minor modifications to fit our speci-fic model. Experiments were performed after overnightfast, to mimic the physiological situation of the clampexperiments. A total of 15 to 20 mice per interventiongroup were used in this experiment. Each group wasdivided in a control (PBS infusion) group and an insulingroup. All animals were sedated using a mixture of Ace-promazin (0.5 mg/kg), Midazolam (0.25 mg/kg) andFentanyl (0.025 mg/kg). Custom made intravenousocclusion canulas (27G * 3/4, BD Microlance) wereinserted in the tail vein and kept open by infusion ofPBS. PBS or insulin (0.25 mU/min) was administeredfor a period of 15 minutes during the experiment.
van den Berg et al. Nutrition & Metabolism 2010, 7:24http://www.nutritionandmetabolism.com/content/7/1/24
Page 3 of 11

Co-infusion with glucose (1.73 umol/min) was per-formed in concert with insulin to maintain euglycemia.After the infusion animals were sacrificed by cervicaldislocation and liver and calf muscle were harvested andsnap frozen in liquid nitrogen as fast as possible. Insulinstimulated phosphorylation of PKB at serine 473 wasmeasured and corrected for total PKB.
Western Blot analysisTissues were homogenized by Ultraturax in a 10:1 (v/w)ratio of ice-cold buffer containing: 30 mM Tris.HCl (pH7.5), 150 mM NaCl, 0.5% Triton X-100, 0.5% sodiumdeoxycholate, 1% SDS, 1 mM Na3VO4, 10 mM NaFand protease inhibitors cocktail (Complete Protease Inhi-bitor Cocktail, Roche Nederland BV, Woeren, TheNetherlands). Homogenates were cleared by centrifuga-tion (13.200 rpm; 15 min, 4°C) and the protein contentof the supernatant was determined using a BCA proteinassay kit (Thermo Fisher Scientific Inc, Rock-ford, IL, USA) Samples were prepared in 2 ×Laemmli buffer containing 100 mM dithiothreitol andboiled in a water bath for 5 minutes. 20-50 mg of pro-teins were separated on SDS-PAGE (7-10% gel) followedby transfer to a PVDF membrane. Membranes wereblocked for 1 hour at room temperature in TBST 5%non-fat dry milk followed by an overnight incubationwith the anti-phospho-Ser473-PKB, anti-PKB, anti-a-actin (Cell signaling) or anti-GLUT4 (Abcam). Blotswere then incubated with an HRP-conjugated goat anti-rabbit secondary antibody for 1 hour at room tempera-ture. Bands were visualized by ECL and quantified usingImage J (NIH, USA).
Statistical analysisAll data derived from the experiments were analyzedusing the SPSS 15.0 package. DEXA scan data and indir-ect calorimetry data was tested by one-way ANOVA fornormally distributed data followed by a Tukey’s multiplecomparison test between the HFP, HFL and HFPSgroups. Indirect calorimetry data was split into day andnight values for all respiratory parameters as well asactivity levels. Clamp data were generated in two experi-ments; HFL versus HFP and HFPS versus HFP. CLAMPdata was analyzed per experiment using unpaired stu-dent T-Test for normally distributed data. For graphicalrepresentation, data was normalized to HFP. In allgraphs and tables, means ± SEM are given. Statisticalsignificance threshold was set at p < 0.05.
ResultsThe effect of dietary stearate on whole body energymetabolismTo determine whether a high level of dietary stearateinduces changes in whole body substrate selection or
energy metabolism, three high fat diets were evaluated(table 1): a low stearate diet based on palm oil (HFP,containing 4.4% stearate) and two stearate rich dietsbased on lard (HFL, containing 15.0% stearate) or thepalm oil diet supplemented with tristearin (HFPS, con-taining 13.9% stearate).Mice were fed the various diets for 5 weeks and sub-
jected to indirect calorimetry using automated metaboliccages. The animals fed the stearate rich HFL and HFPSdiets exhibited significant lower energy expenditurerates compared to animals fed the HFP diet (figure 1A).The lower energy expenditure levels in HFL and HFPSfed animals was associated with lower caloric energyexpenditure levels during both the diurnal and nocturnalperiod of the day in HFL and HFPS fed animals (figure1B). Activity levels did not differ between groups at anypart of the day (data not shown). These data indicatethat the lower energy expenditure levels were indepen-dent of physical activity. The significant decrease inaccumulated energy expenditure was mainly due to asignificantly lower FA oxidation rate (figure 1C, D).Nocturnal FA oxidation rate tended to be lower in HFLfed animals compared to HFP fed animals, although thisfailed to reach statistical significance (p = 0.08). Carbo-hydrate oxidation was not different between groups, atany time of the day (figure 1E, F). During the diurnalperiod, RER values only differed significantly betweenthe HFL group and the HFP group, whereas nocturnalvalues did not differ between groups (figure 1G, H).This may be due to the large variation in absolute car-bohydrate oxidation compared to absolute fat oxidationwithin the HFP and HFPS groups. Since the RER repre-sents a composite measure of carbohydrate and fat oxi-dation, the variation in carbohydrate oxidation will alsoaffect variation in RER.Accumulated food intake over a period of 2.5 days was
significantly higher in HFL fed animals but not HFPSfed animals compared to HFP fed animals (HFL, 8.4 ±0.7 g; HFPS, 8.3 ± 0.7 g and HFP 7.2 ± 0.8 g, respec-tively, p = 0.02 for HFL versus HFP). These data showthat mice fed the stearate rich HFL and HFPS dietshave higher or equal caloric intake but lower caloricexpenditure compared to the low stearate HFP fed mice,a metabolic state favoring fat deposition. Accumulatedfecal caloric content determined in HFP and HFPS fedanimals after the end of the metabolic cage experimentdid not differ significantly between groups (HFP, 7.0 ±1.9 kcal, HFPS, 7.8 ± 2.8 kcal, p = 0.520). After 5 weeksof high fat diet, total body mass was higher in HFL andHFPS fed mice when compared to HFP fed mice (HFL,37.0 ± 3.0 g, HFPS, 35.6 ± 2.9 g, HFP, 31.1 ± 2.3 g resp.,p < 0.05). DEXA analysis revealed that this was due to asignificantly higher fat mass in HFL and HFPS fed mice(HFL, 15.3 ± 2.8 g, HFPS, 14.3 ± 1.2 g, HFP, 9.9 ± 1.4 g
van den Berg et al. Nutrition & Metabolism 2010, 7:24http://www.nutritionandmetabolism.com/content/7/1/24
Page 4 of 11

Figure 1 Indirect calorimetry analyses. Comparison of diets HFP, HFL and HFPS N = 7-8 mice per group. Rates and averaged values of energyexpenditure (A, B), fatty acid oxidation (C, D), carbohydrate oxidation (E, F) and Respiratory Exchange Rates (G, H) over a period of 2.5 days and2.5 nights. Night periods are indicated by the black bars on the x-axis of the line graphs. In the line graphs, solid black lines represent the HFPgroup, solid grey lines the HFL group and the dotted grey lines the HFPS group. In the bar graphs, nocturnal versus diurnal averaged values areindicted with, respectively, N and D. * = p < 0.05 for the comparison with the equivalent period of the day of HFP fed mice.
van den Berg et al. Nutrition & Metabolism 2010, 7:24http://www.nutritionandmetabolism.com/content/7/1/24
Page 5 of 11

resp., p < 0.05). Lean body mass did not differ signifi-cantly between groups (data not shown). In addition,bone mineral content and bone mineral density did notdiffer between groups (data not shown). Taken together,these data show that the metabolic state of mice fed thestearate rich HFL and HFPS diets resulted in higheradiposity when compared to low stearate HFP fed mice.
The effect of dietary stearate on insulin sensitivityTo determine whether the adverse effects of stearate onwhole body metabolism are associated with the dete-rioration of tissue specific insulin sensitivity, hyperinsuli-nemic euglycemic clamp analyses were performed.Fasting plasma glucose levels did not differ signifi-
cantly between groups (HFL; 4.4 ± 0.4, HFP, 4.7 ± 0.7and HFPS 4.0 ± 0.4 mmol/l). At the end of the hyperin-sulinemic period, plasma glucose levels where somewhathigher in the HFL group, but did not differ significantlyfrom HFP controls (HFL; 5.3 ± 0.5, HFP, 4.4 ± 0.8 andHFPS 4.2 ± 0.3 mmol/l). Insulin levels did not differbetween the HFL and HFP groups at the start (HFL; 0.6± 0.2, HFP, 0.8 ± 0.3 ng/mL) or at the end of the clamp(HFL; 4.7 ± 1.7, HFP, 4.4 ± 0.8 ng/mL). Unfortunately,due to experimental error, insulin levels could not bedetermined in the HFP versus HFPS experiment. Duringthe hyperinsulinemic clamp, the steady-state glucose
infusion rate was significantly decreased in HFP, HFLand HFPS fed mice compared to a historical referencegroup of chow fed mice (Chow; 124.6 ± 25.4, HFP; 34.5± 22.6, HFL; 35.1 ± 17.4 and HFPS; 46.5 ± 22.6 umol*-min-1*kg-1, p < 0.05 for all groups compared to chow),demonstrating that all high fat diets induce whole bodyinsulin resistance (supplemental figure 1b). Interestingly,the ability of insulin to repress hepatic glucose produc-tion was significantly decreased in HFL and HFPS fedanimals compared to HFP fed mice (figure 2). Insulinmediated uptake of glucose by peripheral tissues waslower in all high fat diet groups compared to chow con-trols (figure 2). In addition, the ability of insulin to sti-mulate the rate of disappearance of glucose wassignificantly reduced in HFP fed animals compared toHFL and HFPS fed animals, indicating aggravated insu-lin resistance in peripheral tissues (figure 2). These datashow that despite a similar decrease in whole body insu-lin sensitivity, the insulin resistance induced by the lowstearate HFP diet is characterized by peripheral insulinresistance only. In contrast, the stearate rich HFL andHFPS diets induce severe hepatic insulin resistance buta relatively less severe peripheral insulin resistance.To further investigate the stearate induced alterations
in tissue specific insulin sensitivity, insulin signaling wasexamined in liver and skeletal muscle (calf muscle) from
Figure 2 Insulin sensitivity. Chow, HFP, HFL and HFPS fed mice were subjected to hyperinsulinemic-euglycemic clamp analysis. Shown are theinsulin sensitivity of the peripheral tissues and the liver. Peripheral insulin sensitivity was expressed as the percentage of increase of glucosedisappearance rate (Rd) during the hyperinsulinemic state compared to basal. Hepatic insulin sensitivity was expressed as the percentage ofrepression of hepatic glucose production compared to basal. N = 5-8 per group. The chow data (checkered bars) were obtained in a separateexperiment and are shown for comparison. *; p < 0.05 compared to chow, $; p < 0.05 compared to HFP.
van den Berg et al. Nutrition & Metabolism 2010, 7:24http://www.nutritionandmetabolism.com/content/7/1/24
Page 6 of 11

mice subjected to a 15 min i.v. infusion of PBS (control)or insulin. In liver, the insulin-induced stimulation ofPKBser473 phosphorylation was identical in chow andlow stearate HFP fed mice (3.3 ± 0.6 and 2.9 ± 0.4 fold,respectively) but severely impaired in stearate-rich HFLand HFPS fed mice (1.1 ± 0.1 and 1.1 ± 0.4 fold, respec-tively; p < 0.01 and p < 0.05 compared to HFP fed mice)(figure 3A). This is in agreement with the clamp data onhepatic insulin sensitivity. In parallel, hepatic expressionof the insulin receptor b (IR-b), which mediates cellularinsulin action, tended to be decreased in livers frommice fed stearate rich HFL and HFPS, although this didnot reach statistical significance (p = 0.11 and p = 0.13in HFL and HFPS versus HFP, respectively) (figure 3B).In skeletal muscle, the insulin induced stimulation of
PKBser473 phosphorylation was impaired to a similarextent by all high fat diets compared to chow (2.8 ± 0.8,1.9 ± 0.6, 1.8 ± 0.4 and 9.6 ± 3.0 fold for HFP, HFL,HFPS and chow, respectively; p < 0.05), although no dif-ferences could be detected between the high fat groups(figure 4A). Similarly, total GLUT-4 content wasreduced in the high fat diet groups HFP and HFL com-pared to chow (p = 0.03, p = 0.03 in HFP and HFL ver-sus chow, respectively) and was reduced in HFPS,although this did not reach statistical significance (p =0.06). No differences could be detected between high fatdiet groups (p = 0.39 and p = 0.40 in HFL and HFPSversus HFP, respectively). These data are in line withthe clamp results indicating severe impairment of per-ipheral tissue insulin sensitivity by the high fat diets.
DiscussionIn this study, we have addressed the role of stearate inhigh fat diet induced obesity and insulin resistance. Ascompared to the low stearate HFP diet, the HFL dietnaturally high in stearate as well as the HFPS diet exo-genously enriched with stearate (table 1) resulted inlower energy expenditure (figure 1). Energy expenditurevalues were lower during both the active (nocturnal)and inactive (diurnal) part of the day, indicating that thelower energy expenditure was independent of activity.The lower energy expenditure levels were characterizedby a lower fat oxidation. Food intake was either higher(HFL) or similar (HFPS) compared to HFP fed mice.Weight gain was higher in the HFL and HFPS fed ani-mals as compared to HFP fed animals. These resultsmay be explained by a low oxidative efficiency of stearicacid which, together with the differences in food intake,may lead to changes in nutrient partitioning and subse-quent storage of fat in white adipose tissue.In addition to an adverse metabolic phenotype, high
dietary stearate levels decreased hepatic insulin sensitiv-ity, characterized by a decreased repression of hepaticglucose production (figure 2) and impaired induction of
hepatic PKBser473 phosphorylation by insulin (figure 3A).Thus, high fat diets rich in stearate induce a metabolicstate favoring adipogenesis and hepatic insulinresistance.The low stearate HFP diet did not affect hepatic insu-
lin sensitivity as determined by clamp analysis andquantification of insulin induced PKBser473 phosphoryla-tion (figure 3, 4A). Addition of stearate to HFP in theHFPS diet mimicked the effects of the high stearateHFL diet on hepatic insulin sensitivity. Thus, stearateenrichment of the HFP diet per se induced an adversemetabolic phenotype and hepatic insulin resistance.However, since the FA composition of HFPS and HFLare not identical (table 1), we cannot exclude that otherFA’s or non fatty acid components of the HFL diet, inaddition to stearate, contributed to the induction ofhepatic insulin resistance in HFL fed animals. However,although food intake was significantly higher in HFL fedanimals compared to HFP fed animals, no differenceswere found between HFPS and HFP fed animals. Thisindicates that the amount of stearate added to the dietdoes not affect food intake, and thus, that the hepaticinsulin resistance found in the HFPS fed animals isdependant of dietary fatty acid composition rather thanfood intake.Interestingly, the effects of high dietary stearate are in
line with the effects of deficiency for Elovl6, the geneencoding the elongase that catalyzes the conversion ofpalmitate to stearate [19]. Deficiency for Elovl6 pro-tected high fat diet fed mice from hyperinsulinemia andhyperglycemia but not obesity and steatosis. These dataunderline that fatty acid composition rather than fatcontent per se determines insulin sensitivity in liver.All high fat diets decreased whole body insulin sensi-
tivity (figure 2). This was characterized by a significantlyreduced insulin stimulated uptake of glucose in periph-eral tissues. Interestingly, insulin sensitivity of peripheraltissues was significantly more affected in mice fed thelow stearate diet as compared to the two stearate richdiets. Analysis of insulin induced phosphorylation ofPKBser473 in muscle confirmed that all high fat dietsinduce peripheral insulin resistance (figure 4B). How-ever, this analysis did not confirm a difference in per-ipheral insulin sensitivity between the low stearate andstearate rich diets. This discrepancy between the clampand the PKBser473 phosphorylation analyses in musclecould be due to the differences in the sensitivity of eachmethod (whole body/steady state versus isolated tissue/bolus injection). In addition, it is possible that the glu-cose and insulin response of PKBser473 phosphorylationfollow different kinetics in response to a continuousinfusion and a bolus administration. Moreover, alterna-tive mechanisms responsible for the induction of insulinresistance could play a role in peripheral tissues.
van den Berg et al. Nutrition & Metabolism 2010, 7:24http://www.nutritionandmetabolism.com/content/7/1/24
Page 7 of 11
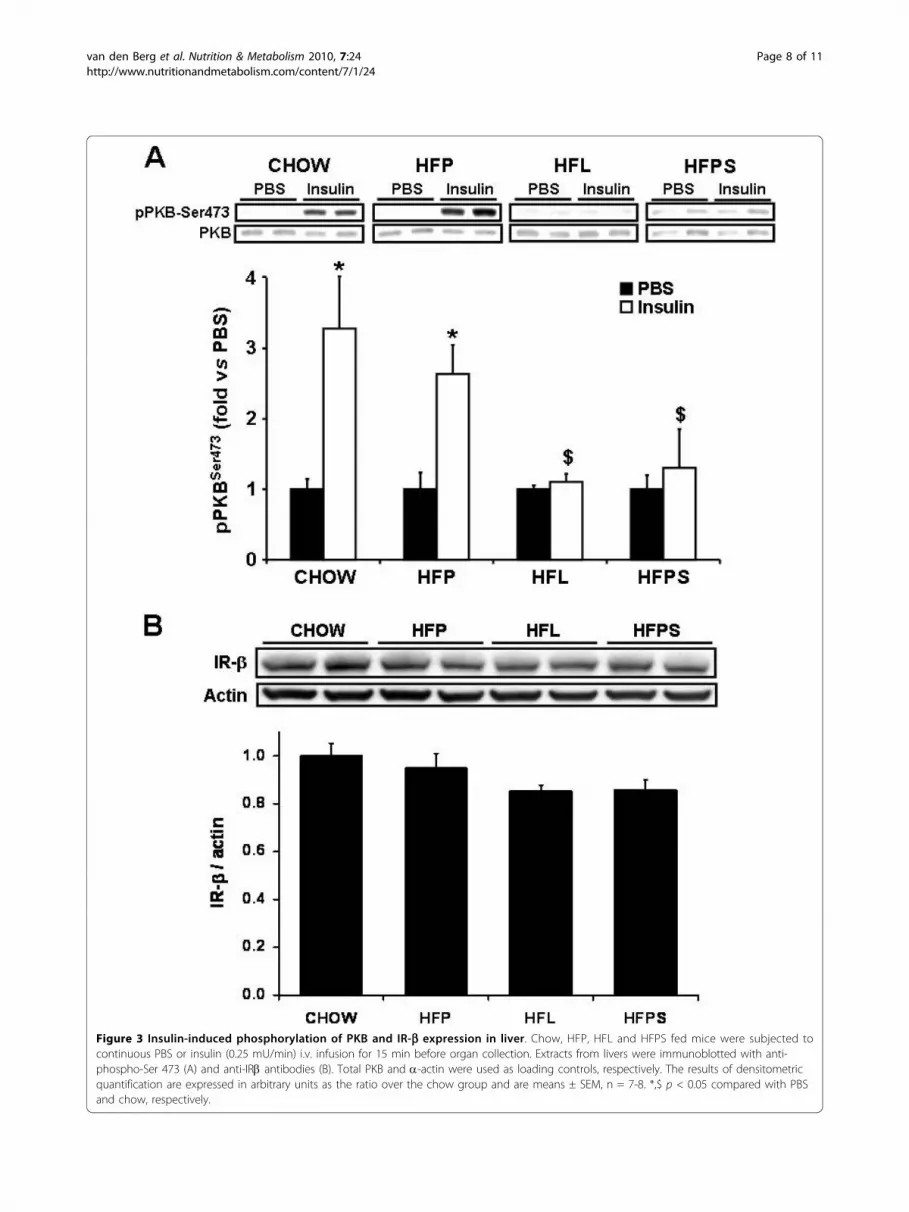
Figure 3 Insulin-induced phosphorylation of PKB and IR-b expression in liver. Chow, HFP, HFL and HFPS fed mice were subjected tocontinuous PBS or insulin (0.25 mU/min) i.v. infusion for 15 min before organ collection. Extracts from livers were immunoblotted with anti-phospho-Ser 473 (A) and anti-IRb antibodies (B). Total PKB and a-actin were used as loading controls, respectively. The results of densitometricquantification are expressed in arbitrary units as the ratio over the chow group and are means ± SEM, n = 7-8. *,$ p < 0.05 compared with PBSand chow, respectively.
van den Berg et al. Nutrition & Metabolism 2010, 7:24http://www.nutritionandmetabolism.com/content/7/1/24
Page 8 of 11

Figure 4 Insulin-induced phosphorylation of PKB and IR-b and GLUT4 expression in calf muscle. Chow, HFP, HFL and HFPS fed micewere subjected to continuous PBS or insulin (0.25 mU/min) i.v. infusion for 15 min before organ collection. Extracts from calf skeletal musclewere immunoblotted with anti-phospho-Ser 473 (A), and anti-GLUT4 antibodies (B). Total PKB and a-actin were used as loading controls,respectively. The results of densitometric quantification are expressed in arbitrary units as the ratio over the chow group and are means ± SEM,n = 7-8. *,$ p < 0.05 compared with PBS and chow, respectively.
van den Berg et al. Nutrition & Metabolism 2010, 7:24http://www.nutritionandmetabolism.com/content/7/1/24
Page 9 of 11

The mechanistic explanation for the induction ofhepatic insulin resistance by dietary stearate remains tobe determined. The higher food intake in the HFL fedanimals per sé may induce insulin resistance. However,no differences in food intake were found between theHFP and HFPS fed groups. As the only difference indietary composition between these groups is stearate,these data indicate that the higher food intake in theHFL fed group are due to other components than stea-rate. In addition, these data indicate that stearateinduces hepatic insulin resistance independent of foodintake. In a number of studies, long chain saturatedfatty acids have been shown to induce insulin resistanceby activation of pathways involved in inflammation thatintersect with insulin resistance such as the Toll-likereceptor 4 mediated activation of NF-kB, as well ashyperphosphorylation of protein kinases like mammaliantarget of rapamycin (mTOR), c-jun N-terminal kinase(JNK), and protein kinase C isoforms [20-22]. A sus-tained activation of these signaling kinases has beenlinked to abrogation of the activation of the PI3K-PKB/Akt pathway by insulin by inducing inhibitory serinephosphorylations on the insulin receptor and IRS1/2[23]. The involvement of these pathways in the develop-ment of insulin resistance in the various tissues is cur-rently under investigation.A second explanation could be that stearate has been
found to be poorly oxidized in isolated rat hepatocytescompared to myristate (C14:0) and palmitate (C16:0)[24]. Since stearate is also a poor substrate for the gen-eration of triglycerides and subsequently VLDL synthesis[25], this could lead to an increased level of hepaticstearate and/or stearate derived intermediates such asdiacylglycerol [26]. Accumulation of these factors hasbeen linked to increased insulin resistance (reviewed in[27]).A third explanation for the stearate effect concerns
the role of saturated fatty acids in determining mem-brane rigidity and fluidity. The FA saturation degree andFA chain length as well as the relative abundance ofindividual FA have been described to affect membranecomposition and rigidity/fluidity [28]. This is especiallytrue in tissues where FA represent a large proportion ofthe membrane, such as the liver in which FA can makeup as much as 10% of the total membrane [29]. In vitromodeling studies of artificial cholesterol/phospholipidmembranes reveal that, already at a low concentration,stearate destabilizes membrane integrity by increasingthe rigidity [30]. The stearate rich diets HFL and HFPScould thus affect hepatic membrane structure, which inturn will affect insulin signal transduction across theplasma membrane.In conclusion, our findings clearly show that feeding
high fat diets rich in stearate for 5 weeks induces
hepatic insulin resistance and obesity. Unraveling themechanisms underlying the effect of stearate on theliver and on the development of obesity is highly rele-vant to the human, in particular given the high propor-tion of stearate in the human diet.
Additional file 1: Time course of plasma glucose and glucoseinfusion rate during hyperinsulinemic euglycemic clamp. Plasmaglucose levels and glucose infusion rates as recorded during thehyperinsulinemic euglycemic clamp analysis.
AbbreviationsCLAMP: Hyperinsulinemic - Euglycemic Clamp Analysis; DEXA: Dual EnergyX-ray Absorptiometry; FA: Fatty acids; HFL: High Fat Lard diet; HFP: High FatPalm oil diet; HFPS: High Fat Palm oil diet supplemented with Tristearin;HGP: Hepatic Glucose Production; LFL: Low Fat Lard diet; LFP: Low Fat Palmoil diet; VCO2: Carbon dioxide production rate (ml/hr); VO2: Oxygenconsumption rate (ml/hr); RER: Respiratory Exchange Ratio; TLR4: Toll LikeReceptor 4
AcknowledgementsThis work was supported by grants from the Nutrigenomics Consortium/TopInstitute Food and Nutrition (NGC/TIFN) and the Center of Medical SystemsBiology (CMSB) and the Netherlands Consortium for Systems Biology (NCSB)established by The Netherlands Genomics Initiative/Netherlands Organizationfor Scientific Research (NGI/NWO), Diabetes Research Foundation, CareerDevelopment grant: 2005.01.003, NWO Zon-MW, VIDI grant: 917.76.301 andby the Netherlands Organization for Health Care Research Medical Sciences(ZON-MW project nr. 948 000 04). The authors are grateful to Jan Kriek fortechnical assistance.
Author details1Department of Human Genetics, Leiden University Medical Center, Leiden,The Netherlands. 2Department of Molecular Cell Biology, Leiden UniversityMedical Center, Leiden, The Netherlands. 3Department of Endocrinology andMetabolic Diseases, Leiden University Medical Center, Leiden, TheNetherlands. 4Department of General Internal Medicine, Leiden UniversityMedical Center, Leiden, The Netherlands. 5The Netherlands Organization forApplied Scientific Research - BioSciences, Gaubius Laboratory, Leiden, TheNetherlands. 6Department of Cardiology, Leiden University Medical Center,Leiden, The Netherlands.
Authors’ contributionsSVDB wrote the paper, designed the research, conducted the research andanalyzed the data. BG wrote the paper, conducted the research andanalyzed the data. SB conducted the research. DMO conducted the research.PJV conducted the research and analyzed the data. RRF provided essentialreagents and wrote the paper. LMH provided essential reagents and wrotethe paper. JAR provided essential reagents and wrote the paper. KWVDwrote the paper, designed the research and had primary responsibility forfinal content.All authors have read and approved the final manuscript
Competing interestsThe authors declare that they have no competing interests.
Received: 5 November 2009 Accepted: 27 March 2010Published: 27 March 2010
References1. Buettner R, Parhofer KG, Woenckhaus M, Wrede CE, Kunz-Schughart LA,
Scholmerich J, Bollheimer LC: Defining high-fat-diet rat models: metabolicand molecular effects of different fat types. J Mol Endocrinol 2006,36:485-501.
2. Jen KL, Buison A, Pellizzon M, Ordiz F Jr, Santa AL, Brown J: Differentialeffects of fatty acids and exercise on body weight regulation and
van den Berg et al. Nutrition & Metabolism 2010, 7:24http://www.nutritionandmetabolism.com/content/7/1/24
Page 10 of 11

metabolism in female Wistar rats. Exp Biol Med (Maywood) 2003,228:843-849.
3. Wilkes JJ, Bonen A, Bell RC: A modified high-fat diet induces insulinresistance in rat skeletal muscle but not adipocytes. Am J Physiol 1998,275:E679-E686.
4. Nkondjock A, Krewski D, Johnson KC, Ghadirian P: Specific fatty acid intakeand the risk of pancreatic cancer in Canada. Br J Cancer 2005, 92:971-977.
5. Leyton J, Drury PJ, Crawford MA: Differential oxidation of saturated andunsaturated fatty acids in vivo in the rat. Br J Nutr 1987, 57:383-393.
6. DeLany JP, Windhauser MM, Champagne CM, Bray GA: Differentialoxidation of individual dietary fatty acids in humans. Am J Clin Nutr 2000,72:905-911.
7. Pai T, Yeh YY: Stearic acid unlike shorter-chain saturated fatty acids ispoorly utilized for triacylglycerol synthesis and beta-oxidation incultured rat hepatocytes. Lipids 1996, 31:159-164.
8. Shi H, Kokoeva MV, Inouye K, Tzameli I, Yin H, Flier JS: TLR4 links innateimmunity and fatty acid-induced insulin resistance. J Clin Invest 2006,116:3015-3025.
9. Hommelberg PP, Plat J, Langen RC, Schols AM, Mensink RP: Fatty acid-induced NF-kappaB activation and insulin resistance in skeletal muscleare chain length dependent. Am J Physiol Endocrinol Metab 2009, 296:E114-E120.
10. Cai D, Yuan M, Frantz DF, Melendez PA, Hansen L, Lee J, Shoelson SE: Localand systemic insulin resistance resulting from hepatic activation of IKK-beta and NF-kappaB. Nat Med 2005, 11:183-190.
11. Peronnet F, Massicotte D: Table of nonprotein respiratory quotient: anupdate. Can J Sport Sci 1991, 16:23-29.
12. Hoek van den AM, Teusink B, Voshol PJ, Havekes LM, Romijn JA, Pijl H:Leptin deficiency per se dictates body composition and insulin action inob/ob mice. J Neuroendocrinol 2008, 20:120-127.
13. den Boer MA, Voshol PJ, Kuipers F, Romijn JA, Havekes LM: Hepaticglucose production is more sensitive to insulin-mediated inhibition thanhepatic VLDL-triglyceride production. Am J Physiol Endocrinol Metab 2006,291:E1360-E1364.
14. Duivenvoorden I, Teusink B, Rensen PC, Romijn JA, Havekes LM, Voshol PJ:Apolipoprotein C3 deficiency results in diet-induced obesity andaggravated insulin resistance in mice. Diabetes 2005, 54:664-671.
15. Goudriaan JR, Dahlmans VE, Teusink B, Ouwens DM, Febbraio M,Maassen JA, Romijn JA, Havekes LM, Voshol PJ: CD36 deficiency increasesinsulin sensitivity in muscle, but induces insulin resistance in the liver inmice. J Lipid Res 2003, 44:2270-2277.
16. Voshol PJ, Jong MC, Dahlmans VE, Kratky D, Levak-Frank S, Zechner R,Romijn JA, Havekes LM: In muscle-specific lipoprotein lipase-overexpressing mice, muscle triglyceride content is increased withoutinhibition of insulin-stimulated whole-body and muscle-specific glucoseuptake. Diabetes 2001, 50:2585-2590.
17. Nascimento EB, Fodor M, Zon van der GC, Jazet IM, Meinders AE, Voshol PJ,Vlasblom R, Baan B, Eckel J, Maassen JA, et al: Insulin-mediatedphosphorylation of the proline-rich Akt substrate PRAS40 is impaired ininsulin target tissues of high-fat diet-fed rats. Diabetes 2006,55:3221-3228.
18. Korsheninnikova E, Zon van der GC, Voshol PJ, Janssen GM, Havekes LM,Grefhorst A, Kuipers F, Reijngoud DJ, Romijn JA, Ouwens DM, et al:Sustained activation of the mammalian target of rapamycin nutrientsensing pathway is associated with hepatic insulin resistance, but notwith steatosis, in mice. Diabetologia 2006, 49:3049-3057.
19. Matsuzaka T, Shimano H, Yahagi N, Kato T, Atsumi A, Yamamoto T, Inoue N,Ishikawa M, Okada S, Ishigaki N, et al: Crucial role of a long-chain fattyacid elongase, Elovl6, in obesity-induced insulin resistance. Nat Med2007, 13:1193-1202.
20. Chavez JA, Summers SA: Characterizing the effects of saturated fattyacids on insulin signaling and ceramide and diacylglycerol accumulationin 3T3-L1 adipocytes and C2C12 myotubes. Arch Biochem Biophys 2003,419:101-109.
21. Schaeffler A, Gross P, Buettner R, Bollheimer C, Buechler C, Neumeier M,Kopp A, Schoelmerich J, Falk W: Fatty acid-induced induction of Toll-likereceptor-4/nuclear factor-kappaB pathway in adipocytes links nutritionalsignalling with innate immunity. Immunology 2009, 126:233-245.
22. Shi H, Kokoeva MV, Inouye K, Tzameli I, Yin H, Flier JS: TLR4 links innateimmunity and fatty acid-induced insulin resistance. J Clin Invest 2006,116:3015-3025.
23. Hotamisligil GS, Erbay E: Nutrient sensing and inflammation in metabolicdiseases. Nat Rev Immunol 2008, 8:923-934.
24. Pai T, Yeh YY: Stearic acid unlike shorter-chain saturated fatty acids ispoorly utilized for triacylglycerol synthesis and beta-oxidation incultured rat hepatocytes. Lipids 1996, 31:159-164.
25. Pai T, Yeh YY: Stearic acid modifies very low density lipoprotein lipidcomposition and particle size differently from shorter-chain saturatedfatty acids in cultured rat hepatocytes. Lipids 1997, 32:143-149.
26. Neschen S, Moore I, Regittnig W, Yu CL, Wang Y, Pypaert M, Petersen KF,Shulman GI: Contrasting effects of fish oil and safflower oil on hepaticperoxisomal and tissue lipid content. Am J Physiol Endocrinol Metab 2002,282:E395-E401.
27. van Herpen NA, Schrauwen-Hinderling VB: Lipid accumulation in non-adipose tissue and lipotoxicity. Physiol Behav 2008, 94:231-241.
28. Maxfield FR, Tabas I: Role of cholesterol and lipid organization in disease.Nature 2005, 438:612-621.
29. Funari SS, Barcelo F, Escriba PV: Effects of oleic acid and its congeners,elaidic and stearic acids, on the structural properties ofphosphatidylethanolamine membranes. J Lipid Res 2003, 44:567-575.
30. Hac-Wydro K, Wydro P: The influence of fatty acids on model cholesterol/phospholipid membranes. Chem Phys Lipids 2007, 150:66-81.
doi:10.1186/1743-7075-7-24Cite this article as: van den Berg et al.: High levels of dietary stearatepromote adiposity and deteriorate hepatic insulin sensitivity. Nutrition &Metabolism 2010 7:24.
Submit your next manuscript to BioMed Centraland take full advantage of:
• Convenient online submission
• Thorough peer review
• No space constraints or color figure charges
• Immediate publication on acceptance
• Inclusion in PubMed, CAS, Scopus and Google Scholar
• Research which is freely available for redistribution
Submit your manuscript at www.biomedcentral.com/submit
van den Berg et al. Nutrition & Metabolism 2010, 7:24http://www.nutritionandmetabolism.com/content/7/1/24
Page 11 of 11


