Embed Size (px)
Citation preview

This article was downloaded by: [Athens Agricultural University ]On: 03 February 2014, At: 06:27Publisher: Taylor & FrancisInforma Ltd Registered in England and Wales Registered Number: 1072954 Registeredoffice: Mortimer House, 37-41 Mortimer Street, London W1T 3JH, UK
Journal of Plant NutritionPublication details, including instructions for authors andsubscription information:http://www.tandfonline.com/loi/lpla20
DIFFERENTIAL RESPONSE OF TWO OLIVECULTIVARS TO EXCESS MANGANESET. Chatzistathis a , I. Papadakis a , I. Therios a , A. Patakas b , A.Giannakoula c & G. Menexes da Labotatory of Pomology, Aristotle University , Thessaloniki ,Greeceb Department of Natural Resources and Enterprise Management ,University of Ioannina , Agrinio , Greecec Department of Botany , Aristotle University , Thessaloniki , Greeced Laboratory of Agronomy, Aristotle University , Thessaloniki ,GreecePublished online: 12 Mar 2012.
To cite this article: T. Chatzistathis , I. Papadakis , I. Therios , A. Patakas , A. Giannakoula & G.Menexes (2012) DIFFERENTIAL RESPONSE OF TWO OLIVE CULTIVARS TO EXCESS MANGANESE, Journal ofPlant Nutrition, 35:5, 784-804, DOI: 10.1080/01904167.2012.653080
To link to this article: http://dx.doi.org/10.1080/01904167.2012.653080
PLEASE SCROLL DOWN FOR ARTICLE
Taylor & Francis makes every effort to ensure the accuracy of all the information (the“Content”) contained in the publications on our platform. However, Taylor & Francis,our agents, and our licensors make no representations or warranties whatsoever as tothe accuracy, completeness, or suitability for any purpose of the Content. Any opinionsand views expressed in this publication are the opinions and views of the authors,and are not the views of or endorsed by Taylor & Francis. The accuracy of the Contentshould not be relied upon and should be independently verified with primary sourcesof information. Taylor and Francis shall not be liable for any losses, actions, claims,proceedings, demands, costs, expenses, damages, and other liabilities whatsoever orhowsoever caused arising directly or indirectly in connection with, in relation to or arisingout of the use of the Content.
This article may be used for research, teaching, and private study purposes. Anysubstantial or systematic reproduction, redistribution, reselling, loan, sub-licensing,systematic supply, or distribution in any form to anyone is expressly forbidden. Terms &

Conditions of access and use can be found at http://www.tandfonline.com/page/terms-and-conditions
Dow
nloa
ded
by [
Ath
ens
Agr
icul
tura
l Uni
vers
ity ]
at 0
6:27
03
Febr
uary
201
4

Journal of Plant Nutrition, 35:784–804, 2012Copyright C© Taylor & Francis Group, LLCISSN: 0190-4167 print / 1532-4087 onlineDOI: 10.1080/01904167.2012.653080
DIFFERENTIAL RESPONSE OF TWO OLIVE CULTIVARS
TO EXCESS MANGANESE
T. Chatzistathis,1 I. Papadakis,1 I. Therios,1 A. Patakas,2 A. Giannakoula,3
and G. Menexes4
1Labotatory of Pomology, Aristotle University, Thessaloniki, Greece2Department of Natural Resources and Enterprise Management,University of Ioannina, Agrinio, Greece3Department of Botany, Aristotle University, Thessaloniki, Greece4Laboratory of Agronomy, Aristotle University, Thessaloniki, Greece
� The response of three-month-old rooted cuttings of the olive cultivars ‘Picual’ and ‘Koroneiki’grown in black plastic bags containing perlite as a substrate to excess manganese (Mn) (640 µM)was studied. The rooted cuttings were irrigated with 50% modified Hoagland nutrient solution. Atthe end of the experimental period, which lasted 130 days, the total fresh and dry weights, as wellas the shoot elongation of ‘Picual’ plants were significantly reduced under excess Mn (640 µM),compared to the control plants (2 µM), whereas the growth of ‘Koroneiki’ plants was similar inboth Mn treatments. The tolerance index, which is derived from the ratios between the plant growthdata of different treatments and the control one, of ‘Picual’ plants to excess Mn was about half ofthis of ‘Koroneiki’ plants. In both cultivars, the concentrations of Mn in various plant parts (root,basal stem, top stem, basal leaves, top leaves) were significantly increased as Mn concentration inthe nutrient solution increased. Furthermore, in the 640 µM Mn treatment, 2 to 2.5-fold greaterMn concentrations were recorded in almost all plant parts of ‘Koroneiki’, than those of ‘Picual’.Similar results were recorded with regard to the total Mn content per plant (‘Koroneiki’ absorbedmuch more Mn from the nutrient solution than ‘Picual’). On the other hand, excess Mn negativelyaffected the absorption of iron (Fe), calcium (Ca), magnesium (Mg), phosphorus (P), zinc (Zn),and boron (B), depending on the olive cultivar. In both cultivars, while the Mn use efficiency wassignificantly decreased under excess Mn conditions, the nutrient use efficiencies of P, Ca, and Fewere significantly increased, compared to the control plants (2 µM Mn). It was also found thatexcess Mn resulted in a significant increase of stomatal conductance and transpiration rate ofboth cultivars, whereas the photosynthetic rate was significantly increased only in ‘Koroneiki’. In‘Picual’, similar photosynthetic rates were recorded in both Mn treatments. The measurement of thevarious chlorophyll fluorescence parameters, Fv/Fm and Fv/F0 ratios, revealed that the functionalintegrity of photosystem II (PSII) of photosynthesis was not affected due to excess Mn, irrespectivelyof the cultivar. In conclusion, although ‘Koroneiki’ tissues had much higher Mn concentrations
Received 13 May 2010; accepted 30 September 2011.Address correspondence to T. Chatzistathis, Labotatory of Pomology, School of Agriculture, Aristo-
tle University, 54124 Thessaloniki, Greece. E-mail: [email protected]
784
Dow
nloa
ded
by [
Ath
ens
Agr
icul
tura
l Uni
vers
ity ]
at 0
6:27
03
Febr
uary
201
4

Response of Olive Plants to Excess Manganese 785
than those of ‘Picual’, the parameters related to the growth and photosynthetic performance of plantsindicates that the internal tolerance of ‘Koroneiki’ tissues to excess Mn was higher than this of‘Picual’.
Keywords: chlorophyll fluorescence, manganese, photosynthesis, photosystem II,tolerance, toxicity
INTRODUCTION
Manganese (Mn) is one of the fundamental microelements for plantgrowth, since it plays a vital role in many biochemical and physiologicalfunctions. Three Mn-containing enzymes have been reported so far, includ-ing a polypeptide of the water-splitting system associated with photosystemII (PSII), the Mn-containing superoxide dismutase (MnSOD) and the Mn-containing acid phosphatases. Furthermore, Mn is an activator of a widerange of enzymes and is involved in the metabolism of carbohydrates andnitrogen and in some biochemical pathways, such as the Krebs’ cycle, and inthe biosynthetic pathway of shikimic acid (Sirkar and Amin, 1974; Burnell,1988; Marschner, 1995; Vadez et al., 2000).
Manganese toxicity is a nutritional disorder affecting the growth andyield of many plant species all over the world, especially in acid soils (pH < 5),in soils rich in Mn parental material (e.g., manganite, pyrolusite, birnessite,lithiophorite and hausmannite) and/or poor in oxygen, in soils near tomines, and in glasshouses after soil sterilization. Furthermore, Mn toxicityconditions are common in areas where crops are overfertilized with ammo-nium sulfate [(NH4)2SO4] and/or Mn fertilizers, and in agricultural areaslocated very close to highly polluted regions (El-Jaoual and Cox, 1998; Qing-Ren et al., 2002).
Growth and photosynthetic rates of many plant species suffered fromMn toxicity are reduced considerably (Ohki, 1985; Macfie and Taylor, 1992).However, very little information has been published concerning the effectsof Mn toxicity on PSII functionality, despite their increased physiologicalimpact (Papadakis et al., 2007a). Although it has been well documented thatthe uptake of Mn is depressed by other divalent cations such as calcium (Ca),magnesium (Mg), and zinc (Zn) (Marschner, 1988), the studies concerningthe effects of Mn on the uptake of the other nutrients are limited and theyare not in agreement with each other. Lidon (2000, 2001) reported thatunder excess Mn, the uptake of Ca, Mg, phosphorus (P), copper (Cu), andiron (Fe) by rice plants was increased, while that of potassium (K) and Znwas decreased. In contrast, in Triticales, excess Mn resulted in decreaseduptake of Ca and Mg (Quartin et al., 2001). Often, the excess Mn createssymptoms that resemble those of Fe deficiency (Sarkar et al., 2004), whichcan be prevented by adding Fe to the growth medium in which the plantsare cultivated (Foy et al., 1988).
Dow
nloa
ded
by [
Ath
ens
Agr
icul
tura
l Uni
vers
ity ]
at 0
6:27
03
Febr
uary
201
4

786 T. Chatzistathis et al.
The cultivation of olive tree is very important for many countries, es-pecially for those of the Mediterranean basin, due to historical, ecologicaland economical reasons. Unfortunately, almost nothing is known about thegrowth, the photosynthetic performance, the functionality of photosystem IIand the nutritional status of olive plants growing under excess Mn concen-trations, as in some regions in Greece olive trees are grown in soils rich inMn, or in soils near to mines, and/or irrigated with water containing veryhigh Mn concentrations. The usual Mn concentration in the soils around thearea of Thessaloniki is within the range 5-15 mg kg−1 soil [according to thediethylenetriaminepentaacetic acid (DTPA) method], while the increasedone (close to mines) can be greater than 200 mg kg−1 soil (Chatzistathis,unpublished data). Under these Mn concentrations many tree species suf-fer from Mn toxicity. Therefore, the objective of the present study was toinvestigate the effect of excess Mn on growth, as well as on some parametersrelated to mineral nutrition (nutrient use efficiency, distribution within plantand total absorption of mineral nutrients) and physiology (photosyntheticand transpiration rate, stomatal conductance and chlorophyll fluorescence)of olive plants. It is also well-known that not only plant species, but alsogenotypes within the same species may differ with each other in their toler-ance to excess Mn (Foy et al., 1988; Alam et al., 2001; Quartin et al., 2001;Sarkar et al., 2004). In order to elucidate whether genotypic differences existamong olive cultivars under excess Mn, two widely cultivated olive cultivars(‘Koroneiki’ and ‘Picual’), producing high oleuropein olive oil, were tested.
MATERIALS AND METHODS
Plant Material
Twenty well-grown (three-month-old rooted cuttings, about 30 cm inheight) olive plants (Olea europaea L. cvs. ‘Picual’ and ‘Koroneiki’) comingfrom commercial nursery were transplanted into 5L black plastic bags con-taining perlite (inert and stable substrate, very light, containing Si and Aloxides and no fundamental nutrients, with a pH of 6.5–7.5). After trans-planting, the plants of each cultivar were divided into two groups each oneconsisted of five plants (replicates). The experiment was carried out dur-ing the period from the 9th of March until the 17th of July. The plantswere grown in a glasshouse of the University of Thessaloniki, Macedonia,northern Greece, under natural light conditions, with minimum, averageand maximum temperature of 17, 29 and 36◦C, respectively; the relativehumidity ranged from 54 to 82%.
Mn Treatments
During the experimental period (130 days), all the plants were irrigatedevery second day, based on their needs, with 50% modified Hoagland’s
Dow
nloa
ded
by [
Ath
ens
Agr
icul
tura
l Uni
vers
ity ]
at 0
6:27
03
Febr
uary
201
4

Response of Olive Plants to Excess Manganese 787
nutrient solution (macronutrients were supplied at half strength and mi-cronutrients at full strength). Particularly, the composition of that nutrientsolution was: potassium nitrate (KNO3), calcium nitrate [Ca(NO3)24H2O],ammonium phosphate (NH4H2PO4), magnesium sulfate (MgSO47H2O),potassium chloride (KCl), boric acid (H3BO3), manganese sulfate(MnSO4H2O), zinc sulfate (ZnSO47H2O), copper sulfate (CuSO45H2O),molybdic acid (H2MoO4) and iron (Fe)- ethylenediaminetetraacetic acid(EDTA) and the final concentrations of the nutrient elements were: ni-trogen (N; 8000 µM), K (3000 µM), Ca (2000 µM), P (1000 µM), sulfur(S; 500 µM), Mg (500 µM), chloride (Cl; 50 µM), boron (B; 25 µM), Mn(2 µM), Zn (2 µM), Cu (0.5 µM), molybdenum (Mo; 0.5 µM), and Fe (20µM). The pH of the nutrient solution was 6.5. The standard Mn concentra-tion of this solution was 2 µM Mn (experimental control). Five plants percultivar were irrigated with the previously mentioned solution and thus theyused as controls, while the remaining five plants of each cultivar were irri-gated with the same nutrient solution, which, however, contained 640 µMMn (to induce Mn toxicity). The Mn was added in the form of manganesesulfate (MnSO4H2O).
Plant Growth Parameters
The plants were harvested after 130 days. The elongation of the mainshoot of each plant during the experimental period was determined every10 days. At the end of the experiment (130th day), each plant was dividedinto root and shoot. The shoot was further divided into two halves, i.e.,the basal half (>45 days old), which was further separated into stem (basalstem) and leaves (basal leaves), and the top half (<45 days old), which wasalso separated into stem (top stem) and leaves (top leaves). Each one ofthe previously mentioned plant parts was weighed (fresh weight), washedinitially with tap and afterwards with distilled water, oven-dried at 75◦C for48 hours, weighed again (dry weight) and milled to a fine powder to passa 30 mesh screen used for element determination. Finally, the toleranceindex (TI) of the plants of each cultivar was computed using the formula:TI(%) = (Mean shoot elongation in solution with 640 µM Mn/Mean shootelongation in solution with 2 µM Mn) × 100, according to Rout et al.(2001).
Determination of Mn and Other Mineral Elements
In order to determine the concentrations of mineral elements, 0.5 g ofthe fine powder of each sample was dry-ashed in a muffle furnace at 515◦Cfor 5 h. Then, the ash was dissolved in 3 mL of 6 N hydrochloric acid (HCl)and diluted with deionized water up to 50 mL. The concentrations of Mn,Fe, Zn, Ca, Mg and K were determined by atomic absorption spectroscopy
Dow
nloa
ded
by [
Ath
ens
Agr
icul
tura
l Uni
vers
ity ]
at 0
6:27
03
Febr
uary
201
4

788 T. Chatzistathis et al.
(Perkin-Elmer 2340, Waltham, MA, USA). Then, the concentrations of Pand B were assayed colorimetrically; P in 470 nm using the vanado-molybdo-phosphate yellow method (Page et al., 1982) and B in 420 nm by theazomethine-H method (Wolf, 1971). Multiplying the concentration of eachnutrient (µg or mg g−1 dry weight) found in each plant part by the dryweight of the corresponding plant part, the content (absolute quantity) ofeach nutrient existed in each plant part at the end of this experiment wascalculated. By addition of the nutrient contents of different plant parts, thetotal nutrient content (µg or mg) per plant, and thus the total nutrientuptake per plant, was computed. Finally, the nutrient use efficiency of eachnutrient (NUE), which is defined as the amount of biomass produced perunit of nutrient, was further calculated (Chapin and Van Cleve, 1991).
Photosynthetic Parameters and Chlorophyll Fluorescence
At the 130th day (last day of the experiment), photosynthetic rate, stom-atal conductance and leaf transpiration rate of olive cultivars were measuredusing the LCpro+ (ADC Bioscientific, Hoddesdon, England) portable mea-suring device. All the above gas exchange measurements were carried outon fully expanded leaves located in the middle of the shoot. The age of theseleaves were about two months old (basal leaves). Measurements were per-formed in the morning (9:30–10:30 a.m.) at natural light intensity, greaterthan 700 µmol m−2 sec−1, while leaf temperature varied between 24 and25◦C. The chlorophyll fluorescence parameters (Fv/Fm and Fv/F0; F0, initialfluorescence; Fm, maximum fluorescence; Fv = Fm − F0, variable fluores-cence) were recorded by the PAM-2000 fluorometer (Heinz Walz GmbH,Effeltrich, Germany), after preconditioning of leaves in the dark for 20 min.
Statistics
The experiment was laid out in a 2 × 2 factorial completely randomizeddesign (CRD) involving two olive cultivars (‘Picual’ and ‘Koroneiki’) and twoMn levels (2 and 640 µM), with five replications (n = 5) per treatment (i.e.,total number of plants of the experiment was 20). Prior to statistical analysis,some data Xi on mineral element content and nutrient use efficiency (theMn concentrations in all vegetal tissues, Fe and B concentrations in roots,total per plant Mn and Fe content, MnUE, FeUE and the Mn content in allplant parts) were transformed into log10(Xi) or log10(Xi + 1) for obtaininghomogeneity of error variance. The data were analyzed by two way analysesof variance (ANOVAs), and post-hoc least significant difference (LSD) wasemployed to compare the mean values at P ≤ 0.05, using the statisticalpackage SPSS version 15.0 (SPSS, Inc., Chicago, IL, USA).
Dow
nloa
ded
by [
Ath
ens
Agr
icul
tura
l Uni
vers
ity ]
at 0
6:27
03
Febr
uary
201
4

Response of Olive Plants to Excess Manganese 789
RESULTS
Plant Growth
Based on the measurements of various growth parameters of the plantsgrown under 2 and 640 µM Mn, significant differences were recorded onlyin ‘Picual’ plants. More specifically, the total fresh and dry weights of ‘Picual’plants were significantly decreased as the Mn concentration in nutrient so-lution increased from 2 to 640 µM, mainly due to the limited shoot growth.Similar results were observed concerning the shoot elongation of ‘Picual’plants, i.e., excess Mn resulted in a significant decrease of the shoot elonga-tion of ‘Picual’ plants. Furthermore, in the same cultivar (‘Picual’), statisti-cally significant differences were observed between the two Mn treatmentsfrom the 20th day of the experiment (Figure 1). On the other hand, theincrease of Mn concentration in the nutrient solution did not significantlyaffect any of the above mentioned growth parameters of ‘Koroneiki’ plants(Table 1; Figure 1). Finally, under the presence of excessive Mn concen-tration in the nutrient solution (640 µM), the TI of ‘Picual’ (41.5%) wasapproximately half of that of ‘Koroneiki’ (87.3%) (data not shown).
Concentrations, Nutrient Use Efficiency and Total Plant Content
of Mineral Elements
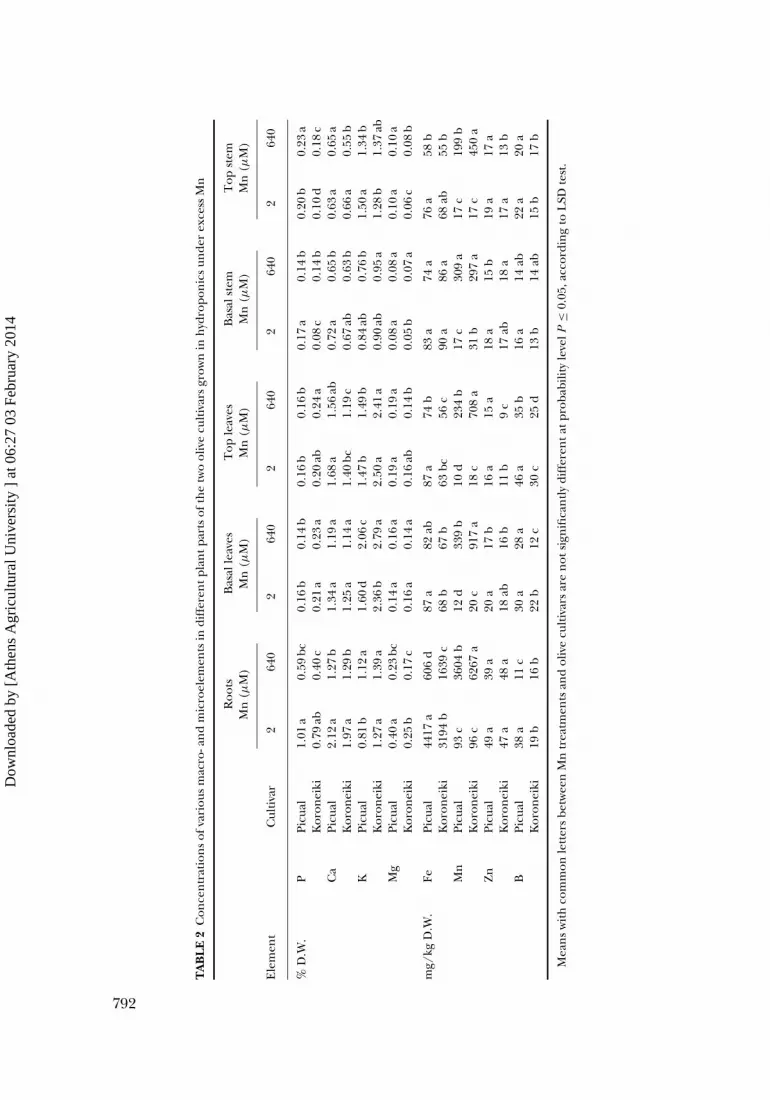
Manganese concentrations in all plant parts were increased as the Mnconcentration in the nutrient solution increased from 2 to 640 µM. Whenthe plants of both tested olive cultivars were treated with 640 µM Mn, con-siderably higher concentrations of Mn were found in the root than in theother plant parts (root > basal leaves > basal stem > top leaves > top stemin ‘Picual’; root > basal leaves > top leaves > top stem > basal stem in ‘Ko-roneiki’). Furthermore, in the 640 µM Mn treatment, Mn concentrationsin all plant parts, except for basal stem, were by about 2 to 2.5-fold higherin ‘Koroneiki’, compared to ‘Picual’. However, in the same treatment (640µM Mn), similar Mn concentrations were recorded in the basal part of stem(basal stem) of both cultivars. Generally, talking about the concentrationsof Mn in different plant parts, as well as the total per plant Mn content, aninteraction effect of Mn treatment × olive cultivar took place (Tables 2 and3). This means that Mn concentration in olive plants’ tissues, as well as totalper plant Mn, depends not only on Mn treatment, but also on genotype.
The concentrations of P, Ca, Mg, Fe and B in the root of ‘Picual’ plants,as well as those of P, Ca, Mg and Fe in the root of ‘Koroneiki’ plants weresignificantly lower under the presence of 640 µM Mn in the nutrient solu-tion, than in the control treatment (2 µM Mn) (Table 2). Furthermore, Kconcentration in basal leaves of both cultivars was significantly increased asMn concentration increased from 2 to 640 µM. Excess Mn also resulted in a
Dow
nloa
ded
by [
Ath
ens
Agr
icul
tura
l Uni
vers
ity ]
at 0
6:27
03
Febr
uary
201
4

790 T. Chatzistathis et al.
(A)
(B)
0
5
10
15
20
25
30
35
10 20 30 40 50 60 70 80 90 100 110 120 130
Days from the beginning of the experiment
Sh
oo
t el
on
gat
ion
(cm
)
2µM
640µM
0
2
4
6
8
10
12
14
16
18
20
10 20 30 40 50 60 70 80 90 100 110 120 130
Days from the beginning of the experiment
Sh
oo
t el
on
gat
ion
(cm
)
2µM
640µM
FIGURE 1 Effect of Mn concentration in the nutrient solution on the shoot elongation of A) ‘Picual’and B) ‘Koroneiki’ olive cultivars. N = 5, means ± S.D.
considerable increase of P concentrations in the basal (‘Koroneiki’) and topstems (‘Picual’, ‘Koroneiki’), as well as of Mg concentrations in the stem of‘Koroneiki’ (Table 2). However, excess Mn caused a significant decrease ofthe concentrations of B in the basal (‘Koroneiki’) and top leaves (‘Picual’,‘Koroneiki’), Zn in the top leaves (‘Koroneiki’), and of Ca only in the upperparts of stem of ‘Koroneiki’ plants (Table 2).
Dow
nloa
ded
by [
Ath
ens
Agr
icul
tura
l Uni
vers
ity ]
at 0
6:27
03
Febr
uary
201
4

TA
BL
E1
Eff
ects
ofM
nto
xici
tyon
plan
tgro
wth
(fre
shw
eigh
t=F.
W.;
dry
wei
ght=
D.W
.)in
two
cult
ivar
sof
oliv
epl
ants
grow
nin
hyd
ropo
nic
s
Roo
tSt
emL
eave
sSh
oot(
stem
+le
aves
)T
otal
(roo
t+sh
oot)
Mn
Shoo
t(µ
M)
Cul
tiva
rF.
W.(
g)D
.W.(
g)F.
W.(
g)D
.W.(
g)F.
W.(
g)D
.W.(
g)F.
W.(
g)D
.W.(
g)F.
W.(
g)D
.W.(
g)el
onga
tion
(cm
)
2Pi
cual
22.1
7a
4.62
a10
.94
a5.
02a
11.5
4b
4.16
b22
.49
b9.
19b
41.7
3a
13.4
4a
14.7
b64
019
.34
a3.
11b
7.24
b3.
38b
7.37
c2.
72c
14.6
1c
6.10
c33
.54
b9.
37b
6.1
c2
Kor
onei
ki14
.29
b2.
65b
11.8
8a
4.94
a18
.00
a5.
53a
29.8
8a
11.0
6a
44.9
5a
12.4
2ab
28.3
a64
014
.99
b2.
74b
11.8
1a
4.90
a16
.00
a5.
42ab
27.8
2a
10.3
1ab
43.2
6a
12.5
9ab
24.7
a
Mea
ns
wit
hco
mm
onle
tter
sin
each
colu
mn
are
not
sign
ifica
ntl
ydi
ffer
enta
tpro
babi
lity
leve
lP≤
0.05
,acc
ordi
ng
toL
SDte
st.
791
Dow
nloa
ded
by [
Ath
ens
Agr
icul
tura
l Uni
vers
ity ]
at 0
6:27
03
Febr
uary
201
4
TA
BL
E2
Con
cen
trat
ion
sof
vari
ous
mac
ro-a
nd
mic
roel
emen
tsin
diff
eren
tpla
ntp
arts
ofth
etw
ool
ive
cult
ivar
sgr
own
inh
ydro
pon
ics
unde
rex
cess
Mn
Roo
tsB
asal
leav
esT
ople
aves
Bas
alst
emT
opst
emM
n(µ
M)
Mn
(µM
)M
n(µ
M)
Mn
(µM
)M
n(µ
M)
Ele
men
tC
ulti
var
264
02
640
264
02
640
264
0
%D
.W.
PPi
cual
1.01
a0.
59bc
0.16
b0.
14b
0.16
b0.
16b
0.17
a0.
14b
0.20
b0.
23a
Kor
onei
ki0.
79ab
0.40
c0.
21a
0.23
a0.
20ab
0.24
a0.
08c
0.14
b0.
10d
0.18
cC
aPi
cual
2.12
a1.
27b
1.34
a1.
19a
1.68
a1.
56ab
0.72
a0.
65b
0.63
a0.
65a
Kor
onei
ki1.
97a
1.29
b1.
25a
1.14
a1.
40bc
1.19
c0.
67ab
0.63
b0.
66a
0.55
bK
Picu
al0.
81b
1.12
a1.
60d
2.06
c1.
47b
1.49
b0.
84ab
0.76
b1 .
50a
1.34
bK
oron
eiki
1.27
a1.
39a
2.36
b2.
79a
2.50
a2.
41a
0.90
ab0.
95a
1.28
b1.
37ab
Mg
Picu
al0.
40a
0.23
bc0.
14a
0.16
a0.
19a
0.19
a0.
08a
0.08
a0.
10a
0.10
aK
oron
eiki
0.25
b0.
17c
0.16
a0.
14a
0.16
ab0.
14b
0.05
b0.
07a
0.06
c0.
08b
mg/
kgD
.W.
FePi
cual
4417
a60
6d
87a
82ab
87a
74b
83a
74a
76a
58b
Kor
onei
ki31
94b
1639
c68
b67
b63
bc56
c90
a86
a68
ab55
bM
nPi
cual
93c
3604
b12
d33
9b
10d
234
b17
c30
9a
17c
199
bK
oron
eiki
96c
6267
a20
c91
7a
18c
708
a31
b29
7a
17c
450
aZ
nPi
cual
49a
39a
20a
17b
16a
15a
18a
15b
19a
17a
Kor
onei
ki47
a48
a18
ab16
b11
b9
c17
ab18
a17
a13
bB
Picu
al38
a11
c30
a28
a46
a35
b16
a14
ab22
a20
aK
oron
eiki
19b
16b
22b
12c
30c
25d
13b
14ab
15b
17b
Mea
ns
wit
hco
mm
onle
tter
sbe
twee
nM
ntr
eatm
ents
and
oliv
ecu
ltiv
ars
are
not
sign
ifica
ntl
ydi
ffer
enta
tpro
babi
lity
leve
lP≤
0.05
,acc
ordi
ng
toL
SDte
st.
792
Dow
nloa
ded
by [
Ath
ens
Agr
icul
tura
l Uni
vers
ity ]
at 0
6:27
03
Febr
uary
201
4

TA
BL
E3
Eff
ects
ofex
cess
Mn
onto
talp
lan
tcon
ten
tofm
acro
-an
dm
icro
nut
rien
ts,a
nd
nut
rien
tuse
effi
cien
cy(N
UE
)of
the
two
oliv
ecu
ltiv
ars
grow
nun
der
hyd
ropo
nic
s
Nut
rien
tuse
effi
cien
cy(m
gof
plan
tdry
wei
ghtp
erm
gof
each
mac
ron
utri
enta
nd
mg
ofpl
ant
Tot
alco
nte
nt
dry
wei
ghtp
erµ
gof
each
per
plan
tm
icro
nut
rien
t)M
n(µ
M)
Mn
(µM
)
Ele
men
t(m
g)C
ulti
var
264
02
640
PPi
cual
75.2
4a
30.9
8c
184.
08c
298.
59b
Kor
onei
ki41
.37
b28
.42
c30
9.23
b44
3.00
aC
aPi
cual
286.
54a
111.
50c
49.4
3c
82.6
0b
Kor
onei
ki16
5.16
b10
8.96
c78
.34
b11
7.56
aM
gPi
cual
28.5
5a
15.9
8bc
484.
00c
579.
65bc
Kor
onei
ki17
.94
b14
.63
c70
8.27
ab86
0.56
aK
Picu
al21
2.24
a22
8.00
a59
.70
b55
.22
bK
oron
eiki
113.
01b
127.
32b
121.
45a
73.3
9b
Mg
Mn
Picu
al44
2.80
d14
818
b29
.56
a0.
57b
Kor
onei
ki53
8.40
c21
792
a28
.37
a0.
48b
FePi
cual
2120
6a
1918
d0.
72d
5.25
aK
oron
eiki
9812
b44
71c
1.08
c2.
88b
Zn
Picu
al35
2a
255
b39
.26
bc36
.12
cK
oron
eiki
273
b24
7b
47.4
9ab
51.7
7a
BPi
cual
557
a18
1c
26.6
7b
50.8
8a
Kor
onei
ki25
4b
211
c48
.05
a58
.14
a
Mea
ns
wit
hco
mm
onle
tter
sbe
twee
nM
ntr
eatm
ents
and
oliv
ecu
ltiv
ars
are
not
sign
ifica
ntl
ydi
ffer
enta
tpro
babi
lity
leve
lP≤
0.05
,acc
ordi
ng
toL
SDte
st.
793
Dow
nloa
ded
by [
Ath
ens
Agr
icul
tura
l Uni
vers
ity ]
at 0
6:27
03
Febr
uary
201
4

794 T. Chatzistathis et al.
As far as the total plant contents (absolute quantities) of various mineralelements are concerned, the increase of Mn concentration in the nutrientsolution from 2 to 640 µM resulted in a significant increase of the absolutequantity of Mn per plant from 442 to 14818 µg in ‘Picual’, and from 538 to21792 µg in ‘Koroneiki’ (Table 3). On the other hand, total plant contents ofthe other elements, except those of K in ‘Picual’ and K and Zn in ‘Koroneiki’,were significantly decreased with the increase of Mn concentration in thenutrient solution (Table 3). In the cases of the total plant content of P,Fe and B, there was an interactive effect of Mn treatment x olive cultivar(Table 3).
The Mn use efficiency (MnUE) of both olive cultivars was significantlydecreased with the increase of Mn concentration in the nutrient solution(Table 3). The nutrient use efficiencies of P, Ca and Fe in both cultivars weresignificantly higher in the 640 µM Mn treatment, compared to the control.The same was also observed with regard to B use efficiency (BUE), but onlyin the cultivar ‘Picual’. Finally, excess Mn resulted in a significant decreaseof K use efficiency (KUE) in ‘Koroneiki’ plants, whereas the increase of Mnconcentration in the nutrient solution did not affect the K use efficiency in‘Picual’ (Table 3).
In both cultivars, the excessive Mn concentration in the nutrient so-lution resulted in an alteration of the Mn distribution within the plants.Compared to the control Mn treatment, in the 640 µM Mn treatment, thefractions (%) of the total plant Mn content that retained in the root andtranslocated in the leaves were significantly increased, irrespectively of thecultivar. These increases resulted in a corresponding decrease of the per-centage of the total plant Mn content existed in the stems of both cultivars.Concerning Mn distribution in stem and leaves, a clear interactive effectof Mn treatment x olive cultivar took place (Table 4). This means that Mndistribution within tissues depends not only on Mn treatment, but also ongenotype.
TABLE 4 Effects of excess Mn on Mn content (µg) in various plant parts of the two olive cultivarsgrown under hydroponics
Mn Total (root +(µM) Cultivar Root Stem Leaves stem + leaves)
2 Picual 356.3 b(80.5%) 67.4 d(15.2%) 19.1 d (4.3%) 442.8 d (100%)640 13143 a (88.7%) 805 b (5.4%) 870 b (5.9%) 14818 b (100%)2 Koroneiki 335.3 b (62.3%) 130.4 c (24.2%) 72.7 c (13.5%) 538.4 c (100%)640 15225 a (69.9%) 2049 a (9.4%) 4518 a (20.7%) 21792 a (100%)
Means with common letters in each column are not significantly different at probability level P ≤ 0.05,according to LSD test.
Numbers in parentheses represent percentages (%) of the total per plant Mn content.
Dow
nloa
ded
by [
Ath
ens
Agr
icul
tura
l Uni
vers
ity ]
at 0
6:27
03
Febr
uary
201
4

Response of Olive Plants to Excess Manganese 795
Gas Exchange and Chlorophyll Fluorescence Parameters
For the same Mn treatment, ‘Picual’ had greater values of stomatal con-ductance, transpiration rate and photosynthetic rate than ‘Koroneiki’. Plantsof both olive cultivars grown under excess Mn displayed significantly highervalues of stomatal conductance and transpiration rate, compared to the con-trol plants. Furthermore, the photosynthetic rate of ‘Koroneiki’ was greaterin the 640 µM Mn treatment than in the control. As far as the photosyn-thetic rate of ‘Picual’ plants is concerned, non-significant differences werefound between the two Mn treatments (Figure 2). Finally, chlorophyll fluo-rescence measurements revealed that there were no significant differencesbetween the two Mn treatments (2, 640 µM) concerning the chlorophyllfluorescence parameters (Fv/Fm and Fv/F0 ratios), irrespectively of the olivecultivar (‘Picual, ‘Koroneiki’) (Figure 3). This means that the functionalyield of PSII was not influenced by Mn excess.
0
2
4
6
8
10
2 µM Mn 640 µM Mn
Ph
oto
syn
thet
ic r
ate
(µm
ol
CO
2 m
-2 s
-1)
*
0
2
4
6
8
10
2 µM Mn 640 µM Mn
Ph
oto
syn
thet
ic r
ate
(µm
ol
CO
2 m
-2 s
-1)
*
0
10
20
30
40
50
60
2 µM Mn 640 µM Mn
Sto
mat
al c
on
du
ctan
ce
(mm
ol
m- 2
s-1
)
*
0
10
20
30
40
50
60
2 µM Mn 640 µM Mn
Sto
mat
al c
on
du
c tan
ce
(mm
ol
m- 2
s-1
)
*
0
0.5
1
1.5
2
2 µM Mn 640 µM Mn
Tra
nsp
irat
ion
rat
e
(mm
ol
H20
m-2
s-1
)
*
0
0.5
1
1.5
2
2 µM Mn 640 µM Mn
Tra
nsp
irat
ion
rat
e
(mm
ol
H20
m-2
s-1
)
F
B
A
C
D
E
FIGURE 2 Effects of Mn concentration in the nutrient solution on the A, D) photosynthetic rate, (B,E) stomatal conductance and C, F) transpiration rate of ‘Picual’ (A, B, C) and ‘Koroneiki’ (D, E, F)olive cultivars. N = 5, means ± S.D. For each cultivar and parameter, the symbol ∗ indicates significantdifferences between the two Mn treatments at probability level P < 0.05.
Dow
nloa
ded
by [
Ath
ens
Agr
icul
tura
l Uni
vers
ity ]
at 0
6:27
03
Febr
uary
201
4

796 T. Chatzistathis et al.
0
0.2
0.4
0.6
0.8
1
2 μΜ Mn 640 μΜ Mn
Fv/F
m
0
0.2
0.4
0.6
0.8
1
2 μΜ Mn 640 μΜ Mn
Fv/F
m0
1.5
3
4.5
6
2 μΜ Mn 640 μΜ Mn
Fv/F
o
0
1
2
3
4
5
6
2μΜ Mn 640μΜ MnFv
/Fo
Α
B
C
D
FIGURE 3 Effects of Mn concentration in the nutrient solution on A, C) Fv/Fm and B, D) Fv/F0 ratiosof ‘Picual’ (A, B) and ‘Koroneiki’ (C, D) olive cultivars. N = 5, means ± S.D.
DISCUSSION
Based on the photosynthesis and growth data, it is somewhat strikingthat ‘Koroneiki’ plants had greater total fresh and dry weights than ‘Picual’,although ‘Koroneiki’ plants had lower photosynthetic rates than ‘Picual’. Infact, photosynthetic rate is only one of the factors affecting plant growth,since there are many others, such as genetic ones, i.e., the influence of dif-ferent genotypes of a given species. The genotype can influence directly thegrowth rate, or indirectly through its’ influence on nutrient use efficiency,stomata opening, etc. Furthermore, the larger leaves and the greater totalleaf area per ‘Koroneiki’ than per ‘Picual’ plant, which were a fact underthe conditions of the present experiment, are also other factors explainingthe greater fresh and dry weight of ‘Koroneiki’ plants. Significant growthreductions of several plant species grown under Mn toxicity conditions havebeen reported (Vlamis and Williams, 1973; Ohki, 1985; Tracy, 1991; Foyet al., 1998; Alam et al., 2001; Quartin et al., 2001; Sarkar et al., 2004). In thepresent study, the total fresh and dry weights of ‘Picual’ plants were nega-tively affected by excessive Mn concentration in the nutrient solution; as faras the fresh and dry weights of ‘Koroneiki’ plants are concerned, they werenot significantly affected by Mn toxicity. Similarly, although excess Mn didnot significantly affect the shoot length of ‘Koroneiki’ plants, it negativelyaffected the rate of shoot elongation of ‘Picual’ plants (Table 1; Figure 1).Growth difference between cultivars of the same species exposed to excessiveMn concentrations have also been reported by other researchers. Accordingto Ducic and Polle (2007), the higher persistence of root growth under Mn
Dow
nloa
ded
by [
Ath
ens
Agr
icul
tura
l Uni
vers
ity ]
at 0
6:27
03
Febr
uary
201
4

Response of Olive Plants to Excess Manganese 797
excess in Pseudotsuga menziesii var. viridis was caused by greater entrapmentof Mn in the vacuole and apoplast and by more efficient detoxification ofMn in insoluble complexes with P, than in Pseudotsuga menziesii var. glauca, aswell as excess Mn inhibited root elongation more strongly in ‘glauca’ (sensi-tive cultivar), than in ‘viridis’ (resistant cultivar). In our experiment, it is alsopossible that the olive cultivar ‘Koroneiki’ may have better Mn detoxificationsystems, compared to ‘Picual’, as its’ growth was not inhibited due to excessMn. Furthermore, the tolerance index (TI) (Rout et al., 2001) of ‘Koroneiki’plants to excess Mn (640 µM) was much higher than that of ‘Picual’ plants(data non-shown). In conclusion, the analysis of all plant growth parametersindicates that ‘Picual’ plants were much more sensitive to Mn toxicity, than‘Koroneiki’ plants.
The concentration of Mn in all plant parts as well as the total Mn contentper plant were significantly increased as Mn concentration in the nutrientsolution increased from 2 to 640 µM (Tables 2 and 3). These results aresimilar to other Mn-toxicity experiments (Marschner, 1988; Foy et al., 1998;Alam et al., 2001; Lidon, 2001; Quartin et al., 2001). Furthermore, in thepresence of 640 µM Mn in the nutrient solution, the Mn concentrationsin all plant parts, except for basal stem, of ‘Picual’ was by 2–3 times lowerthan the corresponding values of ‘Koroneiki’ (Table 2). Given that (i)Mn excess did not significantly affect the growth of ‘Koroneiki’ plantsand (ii) the concentrations of Mn in most parts of ‘Koroneiki’ plantswere much higher than those of ‘Picual’ plants, it could be concludedthat the internal tolerance of ‘Koroneiki’ tissues to excess Mn was muchgreater than this of ‘Picual’ tissues. Among the possible mechanisms thatare responsible for tolerance to Mn toxicity conditions are (i) the internaltolerance of plant tissues to excess Mn and (ii) the genetic control of Mntolerance (El-Jaoual and Cox, 1998). The total Mn content per ‘Picual’plant under 640 µM Mn was significantly lower, compared to ‘Koroneiki’(14818 µg Mn vs. 21792 µg Mn) (Table 3). This finding could be ascribedprobably to a lesser Mn absorption from the nutrient solution by the rootof ‘Picual’ plants. Restricted absorption of Mn is another factor responsiblefor tolerance under Mn toxicity conditions (El-Jaoual and Cox, 1998).However, the Mn tolerance is not simply due to its restricted Mn absorption,but also to genotypic tolerance of the cultivar. Hence, although ‘Picual’ hasaccumulated less Mn than ‘Koroneiki’, is more sensitive than the secondcultivar. This means that ‘Koroneiki’ has better mechanisms to detoxifyexcess Mn. One such possible mechanism for example could be the greaterentrapment of Mn in the vacuoles and apoplast and the more efficientdetoxification of Mn in insoluble complexes with P, as proposed by Ducicand Polle (2007). Other such possible mechanisms could be Mn chelationwith organic (e.g., phytochelatins) substances, or the formation of moreand greater in size chloroplasts (Mn sinks), the activity of various enzymicand non-enzymic antioxidant systems and/or the increased retention of
Dow
nloa
ded
by [
Ath
ens
Agr
icul
tura
l Uni
vers
ity ]
at 0
6:27
03
Febr
uary
201
4

798 T. Chatzistathis et al.
Mn in the cell walls (Hall, 2002). However, more research in the future isrequired to test the above assumptions. Considerable differences in therates of Mn uptake from the nutrient solution were also found amongdifferent plant species and genotypes of a given species (Carter et al., 1975;Foy et al., 1981; Marschner, 1988; Wu, 1994; Khabaz-Saberi et al., 1997;Tong et al., 1997; Foy et al., 1998; Quartin et al., 2001; St. Clair and Lynch,2005; Ducic et al., 2006). It was also reported that some species tolerateexcess Mn because they are able to control the distribution of the elementwithin the plant, i.e., greater Mn accumulation in some tissues and restrictedtranslocation to other ones, such as greater retention of excess Mn in theroot and restricted translocation to the shoot (El-Jaoual and Cox, 1998).Ducic et al. (2006) observed that the endodermis in two Douglas fir varieties(Pseudotsuga menziesii var. viridis and glauca) appears to have important bar-rier functions, since Mn transport to their needles displayed a pronounceddelay, mainly due to restricted xylem loading. In our experiment, largeamounts of Mn (80.5–88.7% in ‘Picual’ and 62.3-69.9% in ‘Koroneiki’)were retained in the roots, compared to those that existed in their leavesand stems (Table 4). Although ‘Picual’ absorbed less Mn and accumulatedmore of it in its root system and less in leaves (Tables 3 and 4), comparedto ‘Koroneiki’, it was proved to be more sensitive, probably because it mayhave lower internal tolerance and/or because it may have less efficientdetoxification systems, as these discussed above. Therefore, the mechanismproposed by Ducic et al. (2006) could possibly explain the restrictedtransport of Mn from the roots to the shoots of olive plants of both cultivars.Given that the shoot tissues, and especially the leaves, are more sensitive tohigh Mn concentrations than the root, the fact that both cultivars retainedmost of the total absorbed Mn quantity to their roots could be consideredas a mechanism that increases their relative tolerance to excess Mn.
Generally, the Fv/Fm ratio (maximum quantum yield of PSII) is themost frequently used chlorophyll fluorescence parameter. Reduction of themaximum quantum yield of PSII (Fv/Fm), as well as of the Fv/F0 ratio inleaves, means that the plants are under stress conditions, where the struc-tural and functional integrity of chloroplasts have been damaged exten-sively. In the present study, the maximum quantum yield of PSII (Fv/Fm)was not significantly influenced by the change of Mn concentration in thenutrient solution. The same was observed concerning the ratio Fv/F0 (Fig-ure 3). These results are in agreement with those of other researchers forBetula platyphylla (var. japonica) (Kitao et al., 1997a) and Vigna umbellata(Subrahmanyam and Rathore, 2000), grown under hydroponic conditions,indicating that under Mn toxicity conditions the functionality of the PSII ofphotosynthesis was not significantly affected in none of the two tested olivecultivars. In citrus plants, it was also observed that excess Mn did not affectneither the maximum quantum yield of PSII (Fv/Fm), nor the structural in-tegrity of chloroplasts, but it significantly increased starch accumulation in
Dow
nloa
ded
by [
Ath
ens
Agr
icul
tura
l Uni
vers
ity ]
at 0
6:27
03
Febr
uary
201
4

Response of Olive Plants to Excess Manganese 799
chloroplasts (Papadakis et al., 2007a, 2007b). However, accumulation ofstarch in chloroplasts is often one the factors limiting photosynthesis. In thepresent study, excess Mn linearly increased stomatal conductance of bothcultivars (r = 0.849 and 0.795 for ‘Picual’ and ‘Koroneiki’, respectively),but promoted only the photosynthetic rate of the cultivar ‘Koroneiki’ andnot that of ‘Picual’ (Figure 2). Since K regulates stomata opening, the sig-nificantly greater concentration of K in the basal leaves (used for the mea-surement of gas exchange parameters) of plants treated with 640 µM Mn,compared to the 2 µM Mn treatment (Table 2), is a possible explanationfor the increase of stomatal conductance in both olive cultivars under excessMn. Another explanation could be a possible direct effect of Mn in stomataopening, due to its effect either on absisic acid (ABA) concentration in leaftissue or on the size of stomata and their number per leaf area. These possi-ble explanations need further investigation, since there are not any relativepublished works. Many authors found that the photosynthetic rate of severalplant species decreased under conditions of Mn toxicity (Ohki, 1985; Nableet al., 1988; Houtz et al., 1988; Macfie and Taylor, 1992; Kitao et al., 1997a,1997b; Subrahmanyam and Rathore, 2000; St. Clair and Lynch, 2004, 2005),which is in contrast to our results. Subrahmanyam and Rathore (2000) foundthat the reduction in photosynthesis of Vigna umbellata was not due to thedirect effect of Mn on stomata regulation (stomatal factors). Theoretically,an increase of stomatal conductance causes corresponding increases in thetranspiration rate and carbon dioxide (CO2) entrance to mesophyll. Con-sequently, an increase in stomatal conductance leads to a correspondingincrease of the photosynthetic rate, if all the other factors affecting the pho-tosynthesis operate normally. Stomatal limitation of photosynthesis was nota case in our study. Instead, the fact that excess Mn caused an increase instomatal conductance without changing the photosynthetic rate in ‘Picual’could be ascribed to nonstomatal factors, such as accumulation of starchand/or decreased activity of several photosynthetic enzymes. On the otherhand, the facts that (i) leaf Mn concentrations of ‘Koroneiki’ were higherthan those of ‘Picual’, (ii) the photosynthetic rate of ‘Picual’ leaves under640 µM Mn was not increased proportionally to the increase of stomatalconductance and (iii) the photosynthetic rate of ‘Koroneiki’ leaves was anal-ogous to the increase of stomatal conductance due to Mn toxicity, indicatethat (i) non-stomatal limitations of photosynthesis were existed in ‘Picual’plants treated with 640 µM Mn, (ii) neither stomatal, nor non-stomatal lim-itations of photosynthesis were existed in ‘Koroneiki’ plants under excessMn, and (iii) the subcellular tolerance of ‘Koroneiki’ leaves to Mn toxicitywas greater than this of ‘Picual’. It is well documented that a large part ofMn quantity entering into cytoplasm, moves and binds to the outer side ofthylakoid membranes of chloroplasts (Gonzalez and Lynch, 1999; Lidon andTeixeira, 2000a, 2000b), affecting their structure and photosynthesis (Nableet al., 1988; Kitao et al., 1997a). According to Papadakis et al. (2007b), the
Dow
nloa
ded
by [
Ath
ens
Agr
icul
tura
l Uni
vers
ity ]
at 0
6:27
03
Febr
uary
201
4

800 T. Chatzistathis et al.
fact that more and the largest chloroplasts observed in the mesophyll cellsof C. volkameriana plants treated with 686 µM Mn, compared to the controltreatment (2 µM Mn), could be considered as a mechanism of cell adaptationto the toxic effects of Mn. By this way, C. volkameriana plants accomplishedto increase the number and size of the intracellular reservoirs (sinks) ofMn. Thus, a relative intracellular Mn dilution was achieved, resulting in theproper function of the chloroplasts. Such an explanation could be a fact un-der the conditions of the present study, since the functional and structuralintegrity of chloroplasts was not affected by excess Mn in none olive cultivar,as it was indicated by the measurements of chlorophyll fluorescence param-eters (unchanged values of Fv/Fm and Fv/F0). In other words, the increasedphotosynthetic rate recorded in ‘Koroneiki’ plants grown under excess Mncould be possibly ascribed to the increase of the number and the size ofchloroplasts per leaf area. Furthermore, the higher internal tolerance of‘Koroneiki’, than that of ‘Picual’ plants, to excess Mn could be possibly dueto some other factors as well, such as better compartmentalization of excessMn within leaf tissue and/or chelation of it with organic acids. However, allthese factors need to be investigated extensively in the near future.
As far as the interaction of Mn with Fe in plants is concerned, manystudies showed a negative correlation between their concentrations in vari-ous plant organs as well as between their accumulation in root and shoot ofmany plant species (El-Jaoual and Cox, 1998; Foy et al., 1998; Alam et al.,2001; Quartin et al., 2001). Similarly, the increase of Mn concentration inthe nutrient solution caused a decrease of Fe concentrations in all plantparts of both olive cultivars, which, however, was significant only in theroot (Table 2). Total plant Fe content was affected by Mn concentration inthe nutrient solution, as well as by the olive cultivar and there was a clearinteractive effect (Table 3). Nevertheless, Lidon (2002) reported that theconcentration and accumulation of Fe in 28-days-old rice plants treated withexcess Mn were higher, compared to the treatments containing normal orlow Mn concentrations. The concentration of P in the roots of both cultivarsreduced, while it remained unaffected, increased or decreased, dependingon the plant part and the cultivar. On the other hand, Tracy (1991) reportedthat leaf P concentration of avocado plants was increased with the increaseof Mn in the nutrient solution. Furthermore, the concentration of P in theroots of four triticale cultivars remained unaffected, while in the shoots itwas increased with the increase of Mn from 2.5 to 50 mg/L in the nutrientsolution (Quartin et al., 2001). As far as the total P plant content of botholive cultivars is concerned, it was significantly reduced with the increase ofMn concentration in the nutrient solution (Table 3). This later finding wasin accordance with the results of Lidon (2001) and Sarkar et al. (2004) forrice and potato plants, grown hydroponically and in vitro, respectively.
In many studies, an antagonism between Mn and Ca in cases of highMn supply has been well documented (El-Jaoual and Cox, 1998; Quartin
Dow
nloa
ded
by [
Ath
ens
Agr
icul
tura
l Uni
vers
ity ]
at 0
6:27
03
Febr
uary
201
4
Response of Olive Plants to Excess Manganese 801
et al., 2001). Under such excess Mn conditions, not only the total Ca up-take, but also the translocation of Ca from the roots to the young expandingleaves were restricted (Horst, 1988). Similarly, such an antagonism was alsoobserved in olive, since the concentrations of Ca in all plant parts of bothcultivars were somewhat lower in the 640 µM Mn treatment than in thecontrol treatment (2 µM Mn). Furthermore, total Ca plant content was sig-nificantly reduced in both cultivars (more in ‘Picual’) with the accumulationof Mn. This finding is not in agreement with the results of Lidon (2001) forrice plants. As far as the Mg concentrations are concerned, they reduced, in-creased or remained unaffected, depending on cultivar and/or plant tissue(Table 2). These results are merely in accordance with those of Lidon (2001)who studied the response of the rice cultivar ‘Safari’ to a great variety of Mnconcentrations in nutrient solution (from 0.125 to 32 mg l−1). The totalplant K content was not significantly changed due to Mn toxicity, irrespec-tively of the olive cultivar (Table 3). According to Brown and Jones (1977),high K levels in the shoots of Mn-tolerant ‘Lee’ soybean cultivar alleviatedthe harmful effects of high internal Mn concentrations. The concentrationsof Zn in all plant parts of both cultivars, except for root of ‘Picual’ plants,were not significantly affected by Mn toxicity (Table 2). Also, the decrease intotal Zn plant content with the increase of Mn in the nutrient solution wassignificantly greater only in the cultivar ‘Picual’ (Table 3). These results arein agreement with those of other researchers (Quartin et al., 2001; Lidon,2002).
Generally, NUE on a whole-plant basis links several processes and givesa global response of the plants to nutrient stress (Chapin and Van Cleve,1991). In our study, the Mn use efficiency of both olive cultivars was signifi-cantly decreased with the increase of Mn in the nutrient solution from 2 to640 µM (Table 3). These data indicate that both cultivars were not able toutilize the whole amount of absorbed Mn for their growth. This could beascribed to the very high Mn concentrations that were found in the leaves ofboth cultivars in the 640 µM Mn treatment. In a general basis, the fraction ofan applied element that is used efficiently by plants is significantly decreasedwith an increase of its concentration in the nutrient solution more thanthe optimum-recommended range (Xu et al., 2002; Dwivedi et al., 2003;Cabrera, 2003; Papadakis et al., 2003). Reduced Mn use efficiency is alsomentioned under B toxicity conditions (Papadakis et al., 2003). In the cur-rent experiment, Mn toxicity conditions also affected negatively the K useefficiency of cultivar ‘Koroneiki’ and positively the nutrient use efficiency ofmost of the other elements, i.e., P, Ca, and Fe (Table 3). These results arein good agreement with those reported by Papadakis et al. (2003) for Citrusplants (Citrus aurantium L. and Citrus paradisi Macf. X Poncirus trifoliata L.)grown in nutrient solutions that contain high B concentrations.
Overall, although ‘Koroneiki’ tissues had much higher Mn concentra-tions than those of ‘Picual’, the parameters related to the growth and pho-tosynthetic performance of plants indicated a higher internal tolerance of
Dow
nloa
ded
by [
Ath
ens
Agr
icul
tura
l Uni
vers
ity ]
at 0
6:27
03
Febr
uary
201
4

802 T. Chatzistathis et al.
‘Koroneiki’ tissues to excess Mn, compared to ‘Picual’. A better distributionof the absorbed Mn within plants was not a factor contributing to the highertolerance of ‘Koroneiki’ to excess Mn, since ‘Koroneiki’ plants retained lessof the absorbed Mn to the root (less sensitive tissue to Mn toxicity) anddistributed more of it to the leaves (more sensitive tissue to Mn toxicity),than ‘Picual’. Therefore, some other factors relating to the better toleranceof ‘Koroneiki’, not only at whole plant level but also at tissue and cell level,could take part. Such possible factors could be a better compartmentaliza-tion of Mn within cells and/or functionality of Mn detoxification systems,by chelation with organic or inorganic substances, or formation of moreand greater chloroplasts (Mn sinks), and/or activity of various enzymic andnon-enzymic antioxidant systems. All these possible explanations should bethe topics of future research to gain better understanding of Mn tolerancein olive plants.
ACKNOWLEDGMENTS
We would like to thank Sofia Kouti and Vasiliki Tsakiridou for theirassistance in chemical analyses.
REFERENCES
Alam, S., S. Kamei, and S. Kawai. 2001. Amelioration of manganese toxicity in barley with iron. Journal ofPlant Nutrition 24: 1421–1433.
Brown, J. C., and W. E. Jones. 1977. Fitting plants nutritionally to soils. II. Cotton. Agronomy Journal 69:405–409.
Burnell, J. M. 1988. The biochemistry of manganese in plants. In: Manganese in Soils and Plants, eds.R. D. Graham, R. J. Hannam, and N. C. Uren, pp. 125–137. Dordrecht, the Netherlands: KluwerAcademic Publishers.
Cabrera, R. I. 2003. Nitrogen balance for two container-grown woody ornamental plants. Scientia Horti-culturae 97: 297–308.
Carter, O. G., I. A. Rose, and P. F. Reading. 1975. Variation in susceptibility to manganese toxicity in 30soybean genotypes. Crop Science 15: 730–732.
Chapin, F. S., and K. Van Cleve. 1991. Approaches to studying nutrient uptake, use and loss in plants. In:Plant Physiological Ecology-Field Methods and Instrumentation, eds. R. W. Pearcy, J. R. Ehleringer, H. A.Mooney, and P. W. Rundel, pp. 185–207. New York: Springer.
Ducic, T., L. Leinemann, R. Finkeldey, and A. Polle. 2006. Uptake and translocation of manganese inseedlings of two varieties of Douglas fir (Pseudotsuga menziesii var. viridis and glauca). New Phytologist170: 11–20.
Ducic, T., and A. Polle. 2007. Manganese toxicity in two varieties of Douglas fir (Pseudotsuga menziesii var.viridis and glauca) seedlings as affected by phosphorus supply. Functional Plant Biology 34: 31–40.
Dwivedi, B. S., A. K. Shulka, V. K. Singh, and R. L. Yadav. 2003. Improving nitrogen and phosphorususe efficiencies through inclusion of forage cowpea in the rice-wheat systems in the Indo-Gangeticplains of India. Field Crops Research 80: 167–193.
El-Jaoual, T., and D. A. Cox. 1998. Manganese toxicity in plants. Journal of Plant Nutrition 21: 353–386.Foy, C. D., M. P. W. Farina, and A. J. Oakes. 1998. Iron-manganese interactions among clones of nilegrass.
Journal of Plant Nutrition 21: 978–1009.Foy, C. D., B. J. Scott, and J. A. Fisher. 1988. Genetic differences in plant tolerance to manganese toxicity.
In: Manganese in Soils and Plants, eds. R. D. Graham, R. J. Hannam, and N. C. Uren, pp. 293–307.Dordrecht, The Netherlands: Kluwer Academic Publishers.
Dow
nloa
ded
by [
Ath
ens
Agr
icul
tura
l Uni
vers
ity ]
at 0
6:27
03
Febr
uary
201
4

Response of Olive Plants to Excess Manganese 803
Foy, C. D., H. W. Webb, and J. E. Jones. 1981. Adaptation of cotton genotypes to an acid, manganesetoxic soil. Agronomy Journal 73: 107–111.
Gonzalez, A., and J. P. Lynch. 1999. Subcellular and tissue compartmentation in bean leaves under Mntoxicity stress. Australian Journal of Plant Physiology 26: 811–822.
Hall, J. L. 2002. Cellular mechanisms for heavy metal detoxification and tolerance. Journal of ExperimentalBotany 53: 1–11.
Horst, W. J. 1988. The physiology of manganese toxicity. In: Manganese In soils and Plants, eds. R. D.Graham, R. J. Hannam, and N. C. Uren, pp. 175–188. Dordrecht, The Netherlands: Kluwer AcademicPublishers.
Houtz, R. L., R. O. Nable, and G. M. Cheniae. 1988. Evidence for effects on the in vivo activity of ribulose-bisphosphate carboxylase/oxygenase during development of Mn toxicity in tobacco. Plant Physiology86: 1143–1149.
Khabaz-Saberi, H., R. D. Graham, and A. J. Rathjen. 1997. Genotypic variation for Mn efficiency indurum wheat (Triticum turgidium L. var. durum). In: Plant Nutrition For Sustainable Food Production andEnvironment, eds. T. Ando, K. Fujita, T. Mae, H. Matsumoto, S. Mori, and J. Sekiya, pp. 289–290.Dordrecht, The Netherlands: Kluwer Academic Publishers.
Kitao, M., T. T. Lei, and T. Koike. 1997a. Effects of manganese toxicity on photosynthesis of white birch(Betulla platyphylla var. japonica) seedlings. Physiologia Plantarum 101: 249–256.
Kitao, M., T. T. Lei, and T. Koike. 1997b. Comparison of photosynthetic responses to manganese toxicityof deciduous broad-leaved trees in northern Japan. Environmental Pollution 97: 113–118.
Lidon, F. C. 2000. Rice adaptation to excess manganese: Nutrient accumulation and implications of thequality of crops. Journal of Plant Physiology 156: 652–658.
Lidon, F. C. 2001. Modulation of macronutrients uptake and translocation in Mn-treated rice in earlystages of vegetative growth. Journal of Plant Nutrition 24: 61—74.
Lidon, F. C. 2002. Micronutrient uptake and translocation in Mn-treated rice. Journal of Plant Nutrition25: 757—768.
Lidon, F. C., and M. G. Teixeira. 2000a. Oxy radicals production and control in the chloroplast ofMn-treated rice. Plant Science 152: 7–15.
Lidon, F. C., and M. G. Teixeira. 2000b. Rice tolerance to excess Mn: Implications in the chloroplastlamellae and synthesis of a novel Mn protein. Plant Physiology and Biochemistry 38: 969–978.
Macfie, S. M., and G. J. Taylor. 1992. The effect of excess manganese on photosynthetic rate andconcentration of chlorophyll in Triticum aestivum, grown in solution culture. Physiologia Plantarum85: 467–475.
Marschner, H. 1988. Mechanisms of manganese acquisition by roots from soils. In: Manganese in Soils andPlants, eds. R. D. Graham, R. J. Hannam, and N. C. Uren, pp. 191–204. Dodrechet, the Netherlands:Kluwer Academic Publishers.
Marschner, H. 1995. Mineral Nutrition of Higher Plants. London: Academic Press.Nable, R. O., R. L. Houtz, and G. M. Cheniae. 1988. Early inhibition of photosynthesis during development
of Mn toxicity in tobacco. Plant Physiology 86: 1136–1142.Ohki, K. 1985. Manganese deficiency and toxicity effects on photosynthesis, chlorophyll and transpiration
in wheat. Crop Science 25: 187–191.Page, A. L., R. H. Miller, and D. R. Keeney. 1982. Chemical and microbiological properties. In: Method
of Soil Analysis, Part 2, eds. A. L. Page, R. H. Miller, and D. R. Keeney, p. 1159. Madison, WI: ASA,SSSA.
Papadakis, I. E., K. N. Dimassi, and I. N. Therios. 2003. Response of two citrus genotypes to six boronconcentrations: Concentration and distribution of nutrients, total absorption and nutrient useefficiency. Australian Journal of Agricultural Research 54: 571–580.
Papadakis, I. E., A. Giannakoula, C. P. Antonopoulou, M. Moustakas, E. Avramaki, and I. N. Therios.2007a. Photosystem 2 activity of Citrus volkameriana (L.) leaves as affected by Mn nutrition andirradiance. Photosynthetica 45: 208–213.
Papadakis, I. E., A. Giannakoula, I. N. Therios, A. M. Bosabalidis, M. Moustakas, and A. Nastou. 2007b.Mn-induced changes in leaf structure and chloroplast ultrastructure of Citrus volkameriana (L.)plants. Journal of Plant Physiology 164: 100–103.
Qing-Ren, W., L. Xiu-Mei, C. Yan-Shan, D. Yi-Ting, and C. Peter. 2002. Responses of legume and non-legume crop species to heavy metals in soils with multiple metal contamination. Journal of Envi-ronmental Science and Health, Part A, Toxic/Hazardous Substances & Environmental Engineering 37: 611–621.
Dow
nloa
ded
by [
Ath
ens
Agr
icul
tura
l Uni
vers
ity ]
at 0
6:27
03
Febr
uary
201
4

804 T. Chatzistathis et al.
Quartin, V. M. L., M. L. Antunes, M. C. Muralha, M. M. Sousa, and M. A. Nines. 2001. Mineral imbalancedue to manganese excess in triticales. Journal of Plant Nutrition 24: 175–189.
Rout, G. R., S. Samantaray, and P. Das. 2001. Studies on differential manganese tolerance of mung beanand rice genotypes in hydroponic culture. Agronomie 21: 725–733.
Sarkar, D., S. K. Pandey, K. C. Sud, and A. Chanemougasoundharam. 2004. In vitro characterizationof manganese toxicity in relation to phosphorus nutrition in potato (Solanum tuberosum L.). PlantScience 167: 977–986.
Sirkar, S., and J. V. Amin. 1974. The manganese toxicity of cotton. Plant Physiology 54: 539–543.St. Clair, S. B., and J. P. Lynch. 2004. Photosynthetic and antioxidant enzyme responses of sugar maple
and red maple seedlings to excess manganese in contrasting light environments. Functional PlantBiology 31: 1005–1014.
St. Clair, S. B., and J. P. Lynch. 2005. Element accumulation patterns of deciduous and evergreen treeseedlings on acid soils: Implications for sensitivity to manganese toxicity. Tree Physiology 25: 85–92.
Subrahmanyan, D., and V. S. Rathore. 2000. Influence of manganese toxicity on photosynthesis inricebean (Vigna umbellate) seedlings. Photosynthetica 38: 449–453.
Tong, Y., Z. Rengel, and R. D. Graham. 1997. Interactions between nitrogen and manganese nutritionof barley genotypes differing in manganese efficiency. Annals of Botany 79: 53–58.
Tracy, J. E. 1991. Manganese toxicity in avocado (Persea americana Mill.). California Avocado Society, Yearbook75: 147–158.
Vadez, V., T. R. Sinclair, R. Serraj, and L. C. Purcell. 2000. Manganese application alleviates the waterdeficit-induced decline of N2 fixation. Plant Cell and Environment 23: 497–505.
Vlamis, J., and D. E. Williams. 1973. Manganese toxicity and marginal chlorosis of lettuce. Plant Soil 39:245–251.
Wolf, B. 1971. The determination of boron in soil extracts, plant materials, composts, manures, waterand nutrient solutions. Communications in Soil Science and Plant Analysis 2: 363–374.
Wu, S. 1994. Effect of manganese excess on the soybean plant cultivated under various growth conditions.Journal of Plant Nutrition 17: 991–1003.
Xu, D., B. Dell, N. Malajczuk, and M. Gong. 2002. Effects of P fertilization on productivity and nutrientaccumulation in a Eucalyptus grandis x E. urophylla plantation, in Southern China. Forest Ecology andManagement 161: 89–100.
Dow
nloa
ded
by [
Ath
ens
Agr
icul
tura
l Uni
vers
ity ]
at 0
6:27
03
Febr
uary
201
4


