Embed Size (px)
Citation preview
DIODE LASER ATOMIC ABSORPTION SPECTROMETRY AS A DETECTOR FOR METAL
SPECIATION
David J. Butcher", Aleksandr Zybin, Michail A. Bolshov, and Kay Niemax"
Institute of Spectrochemistry and Applied Spectroscopy Bunsen-Kirchhoff-Strasse 11
D-44139, Dortmund, Germany
1. INTRODUCTION.
Metal speciation is the quantitative determination of each of the chemical forms of a metal present in a sample. Considerable interest has developed in speciation over the past twenty years because the toxicity and mobility of metals in the environment and organisms is dependent upon their chemical form. The definition of speciation depends on the specific goals of the research and the analytical methodology employed by the researcher.
A considerable body of literature is available on metal speciation. Volumes have been edited by Kramer and Allen III, Harrison and Rapsomanikis 111, and Caroli 131. These books contain chapters on speciation techniques, as well as chapters on individual elements such as tin, germanium, lead, arsenic, antimony, mercury, and selenium. Cornelius and De Kimpe 14/ reviewed elemental speciation in biological fluids, and Irgolic 15/ discussed procedures to do speciation of environmental samples. The volume edited by Prichard, MacKay, and Points 161 includes a chapter on metal speciation. Annual reviews of speciation are provided in the Journal of Analytical Atomic Spectrometry 111. Quevauviller /8,9/ reviewed projects conducted by a testing program conducted by the Community Bureau of
"Current address: Department of Chemistry and Physics, Western Carolina University, Cullowhee, NC 28723 "Corresponding author: (phone) +49-231-1392-101; (fax) +49-231-1392-310; (e-mail) [email protected]
79
Vol. 20, No. 2, 2001 Diode Laser Atomic Absorption Spectrometry
Reference of the European Union to assess the accuracy and potential sources of error in metal speciation.
Metal compounds may be classified as free metal ions (e.g., Pb2+(aq)),
inorganic complexes (e.g., PbC03) , low molecular weight organic compounds (e.g., CH3-Hg-CH3), high molecular weight organic compounds (e.g., M-lipids, M-humic acids), metal species as colloids (e.g., Fe(OH)3), and metal species adsorbed on particles /10/. A variation in the toxicity of different oxidation states exists for some metals. For example, chromium(VI) is considerably more toxic than chromium(lll). In general, the low molecular weight organometallic compounds (e.g., alkylated metal compounds) are more toxic than inorganic compounds because the former have greater permeability through biomembranes and may accumulate in fatty tissues. Mercury is an example of this type of element, where alkylated mercury compounds (e.g., methyl mercury) are more toxic than inorganic mercury (although these species are also regarded as toxic). Tin compounds (e.g., tributyltin) have been of interest because of their use as algicides, fungicides, and molluscicides. These compounds may accumulate to toxic levels in shellfish and fish, although inorganic tin is an essential trace element. Arsenic is an exception to the general rule because some organometallic forms, such as arsenobetaine, arsenocholine, and some arsenosugars, are relatively nontoxic, but inorganic arsenic(III) (arsenite) and arsenic(V) (arsenate) are toxic.
Many clay minerals have surfaces with negative charges to which metal ions may be adsorbed. The affinity of metal ions for these surfaces depends on whether the metal is free or complexed. In some cases, the complexed metal is more strongly attracted to the particles, while for other systems the free metal is more strongly adsorbed. An increase in the pH may induce redissolution of the adsorbed metal species.
The specific types of compounds present depend upon a variety of environmental factors, which include redox conditions, ionic strength and macroconstituents, pH, temperature, and pressure. For example, chromium(VI) is favored by a relatively high pH, aerobic conditions, and low amounts of organic matter /11/. Clearly it is important that the chemical species are not changed by the analysis procedures.
A number of procedures have been used for speciation. Some methods, such as electrochemical methods, can be used for speciation without a separation procedure. However, these methods are frequently limited to
80
David J. Butcher et al. Reviews in Analytical Chemistry
specific species (e.g., Potentiometrie methods are only sensitive to the free metal ion).
Most speciation procedures include a separation step followed by a detection step. Separation procedures are classified on the basis of analyte size, analyte physical(chemical properties, or bioassays /10/. Size-based methods include centrifugation, filtration, dialysis, and gel permeation chromatography. These techniques are commonly used to separate large molecular weight compounds from those of smaller molecular weights, or soluble compounds from insoluble compounds. Physical/chemical techniques are typically characterized by the separation of species on the basis of solubility, ion exchange, adsorptive properties, or partitioning. These methods include extraction, ion exchange chromatography, gas chromatography (GC), and high performance liquid chromatography (HPLC), and are commonly used for chemical species of low to medium molecular weight. Bioassays involve the measurement of the growth or inhibition of organisms in the presence of a chemical species. Although bioassays ideally provide a direct toxicity measurement, they assume that the free element is the most toxic species, which may not always be the case. Moreover, they are time-consuming and are difficult to standardize. Additional separation methods involving atomic spectrometry are discussed in the chapter by de la Guardia I ML
In order to provide good sensitivity and selectivity, most detection techniques for metal speciation are specific for the metal of interest. Consequently, elemental analysis techniques, such as neutron activation analysis (NAA), x-ray fluorescence (XRF), and atomic spectrometry, are the best choices for the detection system. Although NAA provides excellent specificity and sensitivity, its use has been limited because it is restricted to a handful of nuclear centers /13/. XRF has not been widely used for speciation, presumably because it is most widely used for the direct analysis of solids and its relatively poor detection limits. Other techniques that have been employed for speciation include x-ray absorption fine structure spectrometry and scanning electron microscopy /14/ and X-ray energy dispersive spectrometry, and analytical transmission electron microscopy /15/. However, these techniques are not well-suited for routine speciation analysis.
The most widely used techniques for chemical speciation are the atomic spectrometry methods of atomic absorption (AAS), optical emission (OES), atomic fluorescence (AFS), and atomic mass spectrometries /2,3,7,16,17/. The most suitable atomizers for speciation employ a continuous flow of
81
Vol. 20, No. 2, 2001 Diode Laser Atomic Absorption Spectrometry
sample into the instrument to allow a direct interface between a chromatography system, such as flames or plasmas. Discrete atom cells, such as electrothermal atomizers (graphite furnaces) and arcs/sparks, are less suitable because of the difficulty of interfacing continuous flow into these devices /18/. Early speciation work employed chromatography systems coupled to flames as atomizers, primarily with hollow cathode lamps (HCLs) as excitation sources for AAS. Disadvantages of HCLAAS include relatively poor sensitivity and a short linear dynamic range (LDR).
More recently, speciation work has focused upon the use of inductively coupled plasmas (ICP) for detection, using either optical emission spectrometry (1CP-OES) /19/ or mass spectrometry (ICP-MS) 1201. These techniques provide better detection limits and longer LDRs than flames. ICP-MS is particularly sensitive, with detection limits below 1 part-per-trillion for many elements. However, the purchase price and cost of operation of these instruments are high.
An alternative approach to speciation involves the use of lasers as excitation sources for AAS or AFS. For example, Walton et al. /21/ determined organomanganese compounds by HPLC with AFS detection using a flame as the atom cell, and obtained a detection limit of 0.5 ng/mL (10 pg). This system used an expensive and unreliable excimer laser system, which limits the practicality of the technique. In addition, these laser systems are pulsed lasers, operating at relatively low frequencies (maximum 500 Hz, most less than 100 Hz) and very low duty cycles. They are also very large and cumbersome to operate.
Semiconductor diode lasers (DL) are a relatively new laser source that offer high reliability, small size, and easy operation 122,231, and consequently offer the potential for low cost, high sensitivity elemental analysis. The use of DLs for AAS typically improves the sensitivity by 1-3 orders of magnitude while maintaining the advantages of low cost, robustness, reliability, ease of use, and widespread use. Many HPLC methods employ high concentrations of organic solvents or salts. An important advantage of AAS compared to ICP-MS is the insensitivity of a flame to these compounds compared to a plasma, providing higher flexibility for the chromatographic conditions. In summary, DLAAS provides a sensitive, low cost alternative to complicated and expensive detection systems for speciation.
The purpose of this article is to describe analytical capabilities of DLAAS to solve complicated speciation analyses. The instrumentation for DLAAS is discussed, with a focus on recent developments in laser diode technology that
82
David J. Butcher et al. Reviews in Analytical Chemistry
have increased its sensitivity. Two examples of analytical problems are outlined which require metal speciation: (1) the determination of a potentially toxic organomanganese fuel additive, methylcyclopentadienyl manganese tricarbonyl (MMT) in the presence of essential manganese(II) and (2) the detenuination of toxic and carcinogenic chromium(VI) with essential chromium(III). Lastly, analytical results are presented which demonstrate the suitability of DLAAS to perform these analyses.
2. INSTRUMENTATION FOR DLAAS
The instrumentation for DL-AAS is very similar to that for HCLAAS. The superior analytical performance of DLAAS is caused by the higher spectral power of DLs compared to HCLs and the ability to rapidly modulate the DL wavelength. The spectral power of an HCL at the photodetector is typically 1-100 nW. This power provides a photodetector current of about 0.1-10 nA and the shot noise limitation for the absorption measurements is approximately
AI5hot/I = (2e/I)1 ( 2~10-3-10-4 (1)
where e is the charge of the electron and I is the photodetector current. This sensitivity is difficult to reach in practice due to technical noise (appearing in the atom cell) and flicker noise, and, in fact, the limit of detection is usually between 0.1 and 1 %. The HCL beam intensity is modulated (either with a chopper or the HCL current) which serves to shift the flicker noise and most of the technical noise to the modulation frequency together with the signal. Hence, flicker and technical noise are not effectively separated from the signal in HCLAAS.
A common way to suppress flicker noise is to modulate the source wavelength across the atomic line profile /23/. This approach is easy to perform with DLs by simple modulation of the source current. The signal is measured at the frequency of modulation (or at its harmonics) which is sufficiently high (usually between 10 and 100 kHz) to remove flicker and technical noise. Wavelength modulation allows the measurement of relative absorption values as low as 10"5.
DLs have typical powers of several mW in the red and near infrared range of the electromagnetic spectrum. Most useful atomic lines for AAS are in the
83
Vol. 20, No. 2, 2001 Diode Laser Atomic Absorption Spectrometry
UV or blue region, and hence frequency doubling of the DL radiation is
necessary. Until quite recently, the only technique to access these
wavelengths for DLs involved second harmonic generation (SHG) using a
bulk frequency doubling crystal, which is a very inefficient process,
producing typical powers of 10-100 nW. The shot noise limit for this power
is approximately 10"4 absorption units (AU).
Recently, quasi phase-matching (QPM) structures for f requency doubling
/24,25/ became commercial ly available. These devices, which can be used at
wavelengths above 320 nm, are based on periodically poled nonlinear
crystals and have a much higher efficiency - up to 1% at 100 m W of DL
power. This innovation improves the performance of the DL-AAS
instrumentation and makes the method applicable for about 40 elements.
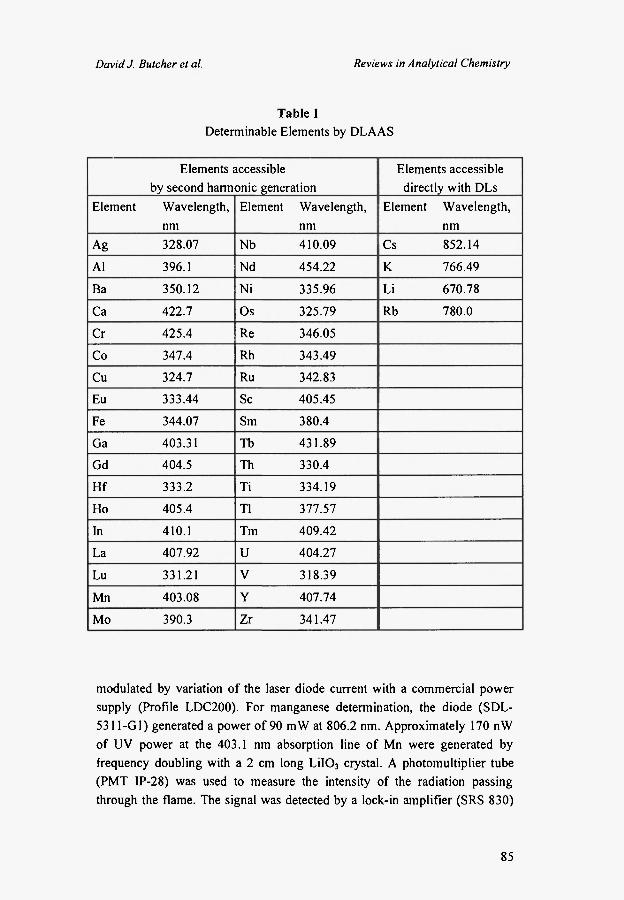
Table 1 shows the elements that can be excited directly with commercially
available DLs (in the red and near-infrared) or by frequency doubling of DL
radiation with QPM structures (in the UV and blue).
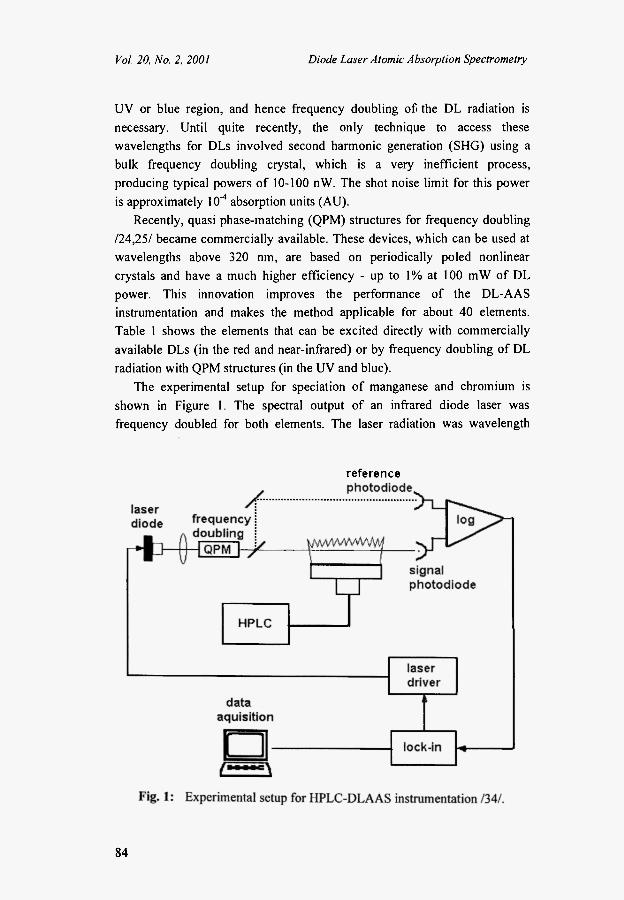
The experimental setup for speciation of manganese and chromium is
shown in Figure 1. The spectral output of an infrared diode laser was
frequency doubled for both elements. The laser radiation was wavelength
reference
84
David J. Butcher et al. Reviews in Analytical Chemistry
Table 1 Determinable Elements by DLAAS
Elements accessible Elements accessible by second harmonic generation directly with DLs
Element Wavelength, Element Wavelength, Element Wavelength, nm nm nm
Ag 328.07 Nb 410.09 Cs 852.14
Al 396.1 Nd 454.22 Κ 766.49
Ba 350.12 Ni 335.96 Li 670.78
Ca 422.7 Os 325.79 Rb 780.0
Cr 425.4 Re 346.05
Co 347.4 Rh 343.49
Cu 324.7 Ru 342.83
Eu 333.44 Sc 405.45
Fe 344.07 Sm 380.4
Ga 403.31 Tb 431.89
Gd 404.5 Th 330.4
Hf 333.2 Ti 334.19
Ho 405.4 T1 377.57
In 410.1 Tm 409.42
La 407.92 U 404.27
Lu 331.21 V 318.39
Mn 403.08 Y 407.74
Mo 390.3 Zr 341.47
modulated by variation of the laser diode current with a commercial power supply (Profile LDC200). For manganese determination, the diode (SDL-5311-Gl) generated a power of 90 mW at 806.2 nm. Approximately 170 nW of UV power at the 403.1 nm absorption line of Mn were generated by frequency doubling with a 2 cm long L1IO3 crystal. A photomultiplier tube (PMT IP-28) was used to measure the intensity of the radiation passing through the flame. The signal was detected by a lock-in amplifier (SRS 830)
85
Vol. 20, No. 2, 2001 Diode Laser Atomic Absorption Spectrometry
at the fourth harmonic of the modulation frequency. The signal at fourth harmonic was a factor of 1.9 smaller than that at the commonly used second harmonic /23/. Nevertheless the S(N ratio was better because background was produced at the second harmonic by nonlinear frequency doubling of the DL radiation /26/.
For the determination of chromium, the wavelength was modulated with detection at the second harmonic of the modulation frequency. The absorption line used in this DLAAS work at 425.44 nm is a factor of -2 .5 weaker than the strongest HCLAAS line at 357.87 nm. This work was performed before the development of QPM structures, and it was not possible to generate sufficient radiation at 357.87 nm using DLs. Consequently, a 0.6 cm long KNb0 3 crystal was used to convert the 850.88 nm output of an infrared DL (SDL-5411-G1) into the 425.44 nm light used for excitation. This crystal has a much higher conversion efficiency than the LiI0 3 crystal and the frequency doubled power was approximately 4 μ\ν . The beam of the diode laser was split into sample and reference beams using a double beam scheme to suppress background produced by the second harmonic detection process /27/. Silicon photodiodes (Hamamatsu SI223-01) were employed to measure the intensities of both beams.
Both detection approaches - fourth harmonic detection with single beam scheme used for manganese and second harmonic detection with double beam scheme used for chromium - provide similar performance in background suppression. The former has the advantage of simplicity but requires a modulation amplitude almost twice as large for optimal detection at the fourth harmonic. The laser diode employed for chromium did not have a sufficiently long mode to provide the appropriate amplitude, and hence the second harmonic detection with double beam scheme was superior in this case. In both cases, the photodetector signal was processed by a logarithmic amplifier before detection by a lock-in amplifier (SRS-830).
3. SPECIATION OF ORGANIC AND INORGANIC MANGANESE COMPOUNDS BY HPLC-DLAAS
3.1. B a c k g r o u n d .
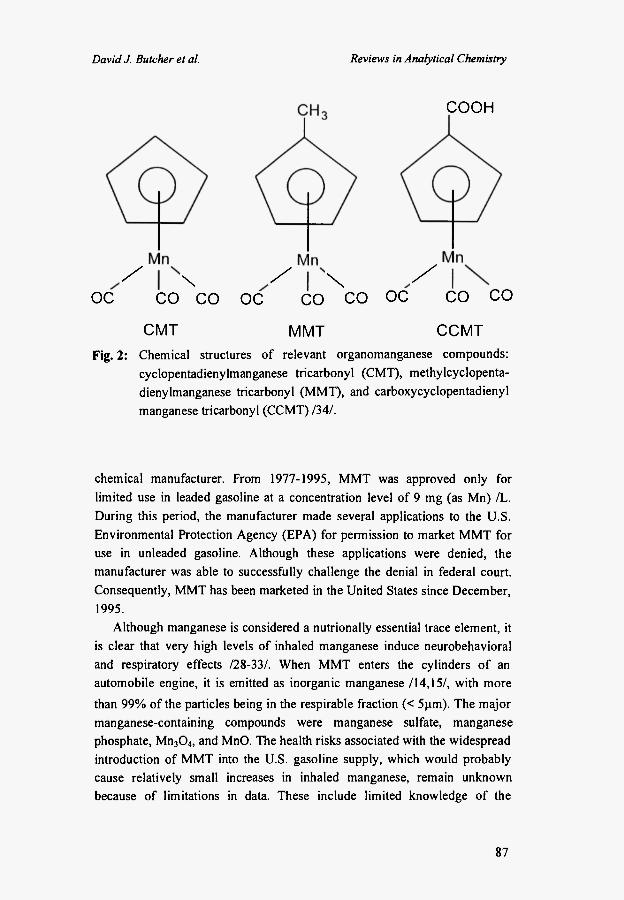
Considerable controversy has developed over the potential toxicity of a fuel additive, methylcyclopentadienyl manganese tricarbonyl (MMT) /28-33/ (Figure 2). This compound is an organomanganese compound produced by a
86
David J. Butcher et al. Reviews in Analytical Chemistry
O C ^ C O ^ C O O C ^ C O ^ C O O C ^ C O C O
C M T M M T C C M T
Fig. 2: Chemical structures of relevant organomanganese compounds :
cyclopentadienylmanganese tr icarbonyl (CMT), methylcyclopenta-
dienylmanganese tricarbonyl (MMT) , and carboxycyclopentadienyl
manganese tricarbonyl (CCMT) /34/.
chemical manufacturer . From 1977-1995, M M T was approved only for
limited use in leaded gasoline at a concentration level of 9 m g (as Mn) /L.
During this period, the manufacturer made several applications to the U.S.
Environmental Protection Agency (EPA) for permission to market M M T for
use in unleaded gasoline. Although these applications were denied, the
manufacturer was able to successfully challenge the denial in federal court.
Consequently, M M T has been marketed in the United States since December ,
1995.
Although manganese is considered a nutrionally essential trace element, it
is clear that very high levels of inhaled manganese induce neurobehavioral
and respiratory effects /28-33Λ When M M T enters the cylinders of an
automobile engine, it is emitted as inorganic manganese /14,15/, with more
than 9 9 % of the particles being in the respirable fraction (< 5μηι). The m a j o r
manganese-containing compounds were manganese sulfate, manganese
phosphate, Mn 3 0 4 , and MnO. The health risks associated with the widespread
introduction of M M T into the U.S. gasoline supply, which would probably
cause relatively small increases in inhaled manganese, remain unknown
because of limitations in data. These include limited knowledge of the
C O O H
87
Vol. 20, No. 2, 2001 Diode Laser Atomic Absorption Spectrometry
toxicity of MMT and its combustion products and considerable uncertainty in exposure assessments of MMT.
In addition to the combustion of manganese, human exposure to MMT may also occur through surface water and ground water ecosystems /30/. The addition of MMT to gasoline may increase gastronomical absorption of gasoline. Workers at MMT production facilities, refineries, fuel terminals, and service stations may sustain direct exposure to the chemical. In addition, manganese emissions from tailpipes are expected to contaminate soil near roads. This may lead to ingestion of manganese-contaminated soil by children.
The widespread introduction of MMT into the United States gasoline supply has the potential to be a serious threat to public health /29Λ It may be necessary to routinely monitor gasoline, ground water, and human fluids (e.g., urine, blood) to evaluate potential human exposure. Toxicological experiments of MMT and its metabolites on animals are required to assess the effects of these compounds on human health, with particular emphasis on "at risk" populations which include MMT production facility workers, service station attendants, children, and pregnant women. The development of high sensitivity, low-cost, reliable instrumentation will allow research and monitoring laboratories to make these important measurements.
One of the deficiencies of most previous studies of MMT is the analysis typically consisting of the measurement of total levels of manganese, rather than speciation of the compounds present. MMT is considerably more toxic than most inorganic forms of manganese. Differences in toxicity exist among inorganic manganese compounds, with manganese(III) more toxic than manganese(II).
We have applied HPLC-DLAAS instrumentation described in Section 2 (Table 2 and Figure 1) and for the determination of inorganic manganese, MMT and its nonmethylated derivative, cyclopentadienyl manganese carbonyl (CMT) /34/. In this study, a near-infrared laser diode was employed to produce laser light at 806.2 nm which was then frequency doubled to produce radiation at 403.1 nm for manganese determination. The detection system included a photomultiplier tube, logarithmic amplifier, and a lock-in amplifier. Data processing was performed with a personal computer. Reversed phase Η PLC was employed to separate the manganese-containing compounds. The chromatographic conditions were optimized, and detection limits, linear dynamic ranges, and analysis times were obtained for DLAAS with and without Η PLC.
88
David J. Butcher et al. Reviews in Analytical Chemistry
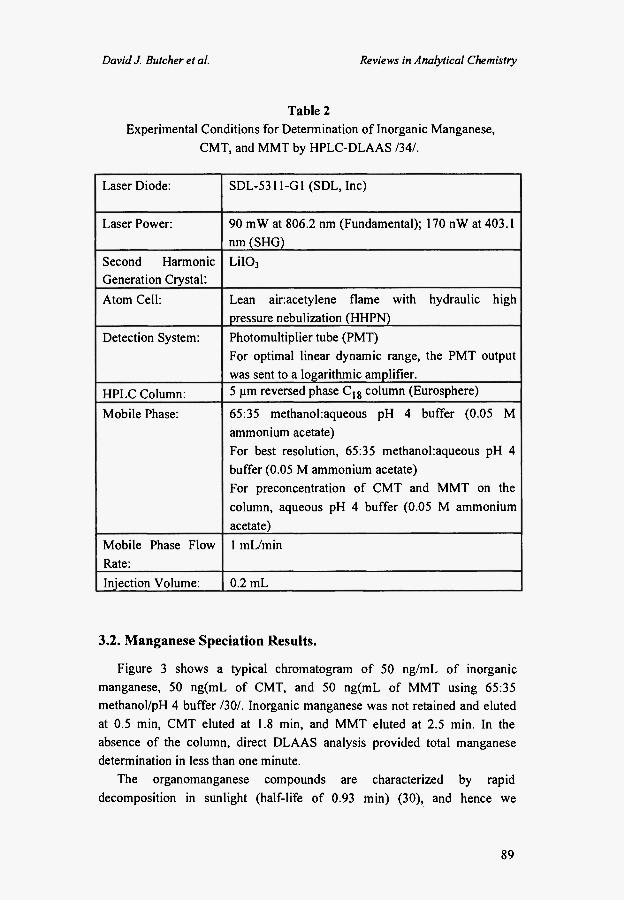
Table 2 Experimental Conditions for Determination of Inorganic Manganese,
CMT, and MMT by HPLC-DLAAS /34/.
Laser Diode: SDL-5311-G1 (SDL, Inc)
Laser Power: 90 mW at 806.2 nm (Fundamental); 170 nW at 403.1 nm (SHG)
Second Harmonic Generation Crystal:
LiI03
Atom Cell: Lean ainacetylene flame with hydraulic high pressure nebulization (HHPN)
Detection System: Photomultiplier tube (PMT) For optimal linear dynamic range, the PMT output was sent to a logarithmic amplifier.
HPLC Column: 5 μπι reversed phase C l g column (Eurosphere)
Mobile Phase: 65:35 methanol:aqueous pH 4 buffer (0.05 Μ ammonium acetate) For best resolution, 65:35 methanol:aqueous pH 4 buffer (0.05 Μ ammonium acetate) For preconcentration of CMT and MMT on the column, aqueous pH 4 buffer (0.05 Μ ammonium acetate)
Mobile Phase Flow Rate:
1 mL/min
Injection Volume: 0.2 mL
3.2. Manganese Speciation Results.
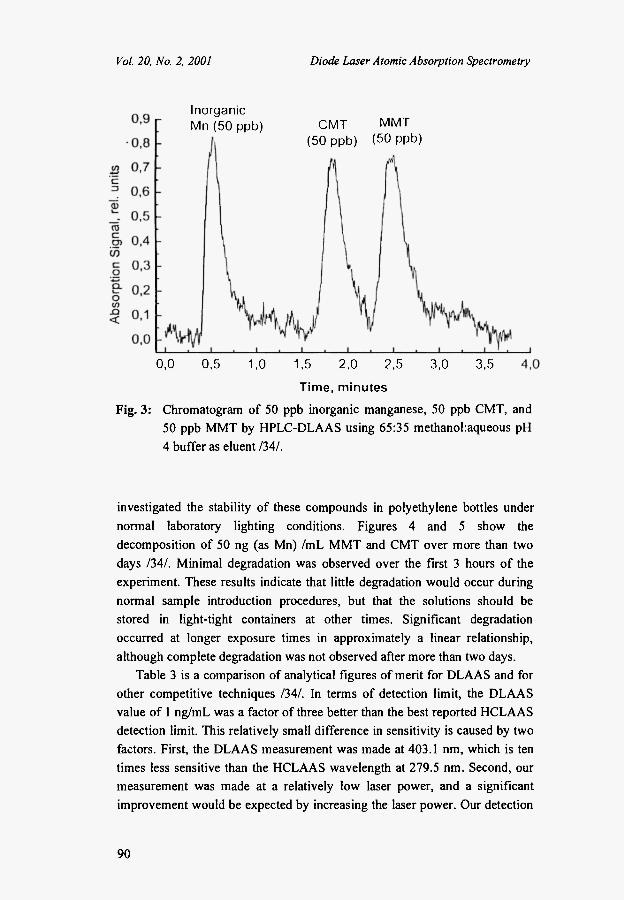
Figure 3 shows a typical chromatogram of 50 ng/mL of inorganic manganese, 50 ng(mL of CMT, and 50 ng(mL of MMT using 65:35 methanol/pH 4 buffer /30/. Inorganic manganese was not retained and eluted at 0.5 min, CMT eluted at 1.8 min, and MMT eluted at 2.5 min. In the absence of the column, direct DLAAS analysis provided total manganese determination in less than one minute.
The organomanganese compounds are characterized by rapid decomposition in sunlight (half-life of 0.93 min) (30), and hence we
89
Vol. 20, No. 2, 2001 Diode Laser Atomic Absorption Spectrometry
Inorganic Mn (50 ppb) CMT MMT
(50 ppb) (50 ppb)
0,0 0,5 1,0 1,5 2,0 2,5 3,0 3,5
Time, minutes
Fig. 3: Chromatogram of 50 ppb inorganic manganese, 50 ppb CMT, and 50 ppb MMT by HPLC-DLAAS using 65:35 methanol:aqueous pH 4 buffer as eluent /34/.
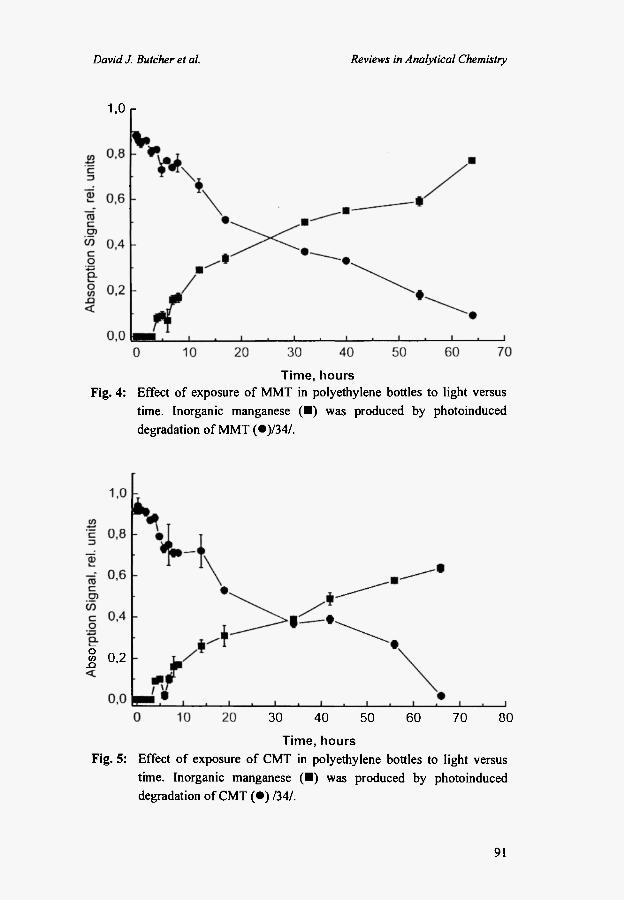
investigated the stability of these compounds in polyethylene bottles under normal laboratory lighting conditions. Figures 4 and 5 show the decomposition of 50 ng (as Mn) /mL MMT and CMT over more than two days /34/. Minimal degradation was observed over the first 3 hours of the experiment. These results indicate that little degradation would occur during normal sample introduction procedures, but that the solutions should be stored in light-tight containers at other times. Significant degradation occurred at longer exposure times in approximately a linear relationship, although complete degradation was not observed after more than two days.
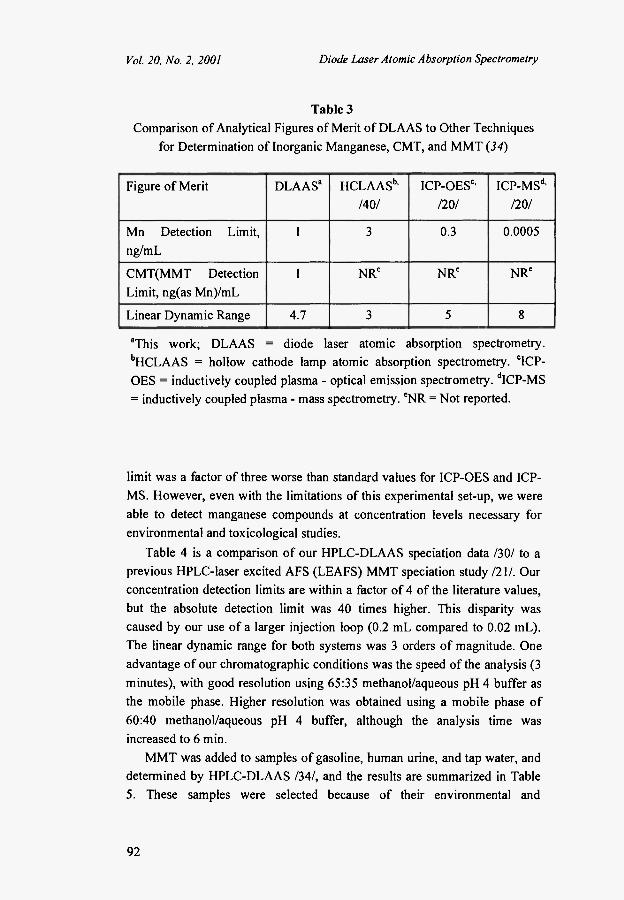
Table 3 is a comparison of analytical figures of merit for DLAAS and for other competitive techniques /34/. In terms of detection limit, the DLAAS value of 1 ng/mL was a factor of three better than the best reported HCLAAS detection limit. This relatively small difference in sensitivity is caused by two factors. First, the DLAAS measurement was made at 403.1 nm, which is ten times less sensitive than the HCLAAS wavelength at 279.5 nm. Second, our measurement was made at a relatively low laser power, and a significant improvement would be expected by increasing the laser power. Our detection
90
David J. Butcher et al. Reviews in Analytical Chemistry
1,0 r
Time, hours Fig. 4: Effect of exposure of MMT in polyethylene bottles to light versus
time. Inorganic manganese ( • ) was produced by photoinduced degradation of MMT ( · ) /34 / .
8 0,2 .ο
Fig. 5:
30 40 50 60 70 80
Time, hours
Effect of exposure of CMT in polyethylene bottles to light versus time. Inorganic manganese ( • ) was produced by photoinduced degradation of CMT ( · ) /34/.
91
Vol. 20, No. 2, 2001 Diode Laser Atomic Absorption Spectrometry
Table 3 Comparison of Analytical Figures of Merit of DLAAS to Other Techniques
for Determination of Inorganic Manganese, CMT, and MMT (34)
Figure of Merit DLAAS3 HCLAASb ' /40/
ICP-OESc ' 1201
ICP-MSd ' 1201
Mn Detection Limit, ng/mL
1 3 0.3 0.0005
CMT(MMT Detection Limit, ng(as Mn)/mL
1 NRe NRe NRe
Linear Dynamic Range 4.7 3 5 8
aThis work; DLAAS = diode laser atomic absorption spectrometry. bHCLAAS = hollow cathode lamp atomic absorption spectrometry. clCP-OES = inductively coupled plasma - optical emission spectrometry. dICP-MS = inductively coupled plasma - mass spectrometry. *NR = Not reported.
limit was a factor of three worse than standard values for ICP-OES and ICP-MS. However, even with the limitations of this experimental set-up, we were able to detect manganese compounds at concentration levels necessary for environmental and toxicological studies.
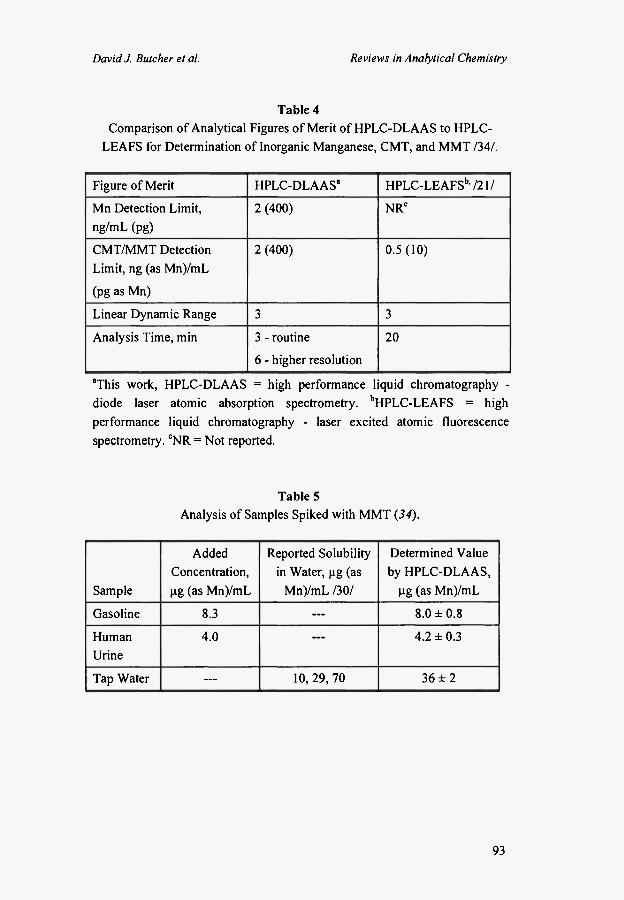
Table 4 is a comparison of our HPLC-DLAAS speciation data /30/ to a previous HPLC-laser excited AFS (LEAFS) MMT speciation study /21/. Our concentration detection limits are within a factor of 4 of the literature values, but the absolute detection limit was 40 times higher. This disparity was caused by our use of a larger injection loop (0.2 mL compared to 0.02 mL). The linear dynamic range for both systems was 3 orders of magnitude. One advantage of our chromatographic conditions was the speed of the analysis (3 minutes), with good resolution using 65:35 methanol/aqueous pH 4 buffer as the mobile phase. Higher resolution was obtained using a mobile phase of 60:40 methanol/aqueous pH 4 buffer, although the analysis time was increased to 6 min.
MMT was added to samples of gasoline, human urine, and tap water, and determined by HPLC-DLAAS /34/, and the results are summarized in Table 5. These samples were selected because of their environmental and
92
David J. Butcher et al. Reviews in Analytical Chemistry
Table 4 Comparison of Analytical Figures of Merit of HPLC-DLAAS to HPLC-
LEAFS for Determination of Inorganic Manganese, CMT, and MMT /34/.
Figure of Merit HPLC-DLAAS" HPLC-LEAFSb , /21/
Mn Detection Limit, ng/mL (pg)
2 (400) NRC
CMT/MMT Detection
Limit, ng (as Mn)/mL
(pg as Mn)
2 (400) 0 .5(10)
Linear Dynamic Range 3 3
Analysis Time, min 3 - routine
6 - higher resolution
20
"This work, HPLC-DLAAS = high performance liquid chromatography -diode laser atomic absorption spectrometry. bHPLC-LEAFS = high performance liquid chromatography - laser excited atomic fluorescence spectrometry. CNR = Not reported.
Table 5 Analysis of Samples Spiked with MMT (34).
Sample
Added Concentration, μg (as Mn)/mL
Reported Solubility in Water, μg (as
Mn)/mL /30/
Determined Value by HPLC-DLAAS,
μg (as Mn)/mL
Gasoline 8.3 . . . 8.0 ± 0 . 8
Human Urine
4.0 — 4.2 ± 0 . 3
Tap Water — 10, 29, 70 36 ± 2
93
Vol. 20, No. 2, 2001 Diode Laser Atomic Absorption Spectrometry
toxicological significance. The spiked samples were diluted to give MMT concentration levels between 40 and 100 ng/mL for analysis. Aqueous calibration graphs were constructed to quantify the samples. The sample matrices did not effect the retention time and peak shapes of the analyte, probably because our low detection limits allowed large dilution factors to be employed. In all cases, good agreement was obtained between the expected concentration and the concentration determined by HPLC-DLAAS. In summary, HPLC-DLAAS was shown to be a sensitive, selective, rapid, and accurate technique for MMT determination.
4. SPECIATION OF CHROMIUM(III) AND CHROMIUM(VI) BY HPLC-DLAAS
4.1. Background
In the environment, chromium exists predominantly in two oxidation states, chromium(III) and chromium (VI) /11,35-38/. Chromium(III) is regarded as a nutritionally essential element that is linked to glucose and lipid metabolism in mammals /35/. The estimated safe and adequate dietary intake is 50-200 μg for an adult /41/. Chromium(VI), however, is significantly more toxic than chromium(III), producing liver and kidney damage, respiratory disorders, and internal hemorrhage /11,41,42/. In addition, inhalation exposure of Cr(VI) has been shown to induce lung cancer. Skin contact may cause allergies and dermal corrosion. The higher toxicity of Cr(VI) has been linked to the ease at which it crosses cell membranes and its high oxidative potential. The U.S. Environmental Protection Agency (EPA) has established Preliminary Remediation Goals (PRGs) of 55,000 μg/L for Cr(III) and 110 μg/L for Cr(VI) in drinking water, illustrating the differences in toxicity between the two oxidation states /42/.
Chromium is the 21st most abundant element in the crust of the earth / I I ,42/. It is employed in a variety of industrial applications, including metallurgical applications (steel production), as pigments for paints and other products, and in wood preservatives. Because of its industrial importance, large quantities of chromium are discharged into the environment. The speciation of this element is further complicated because Cr(III) and Cr(VI) are in dynamic equilibrium. Chromium(III) is favored by low pH, anaerobic conditions, and high amounts of organic matter. In addition, chromium(III)
94
David J. Butcher et al. Reviews in Analytical Chemistry
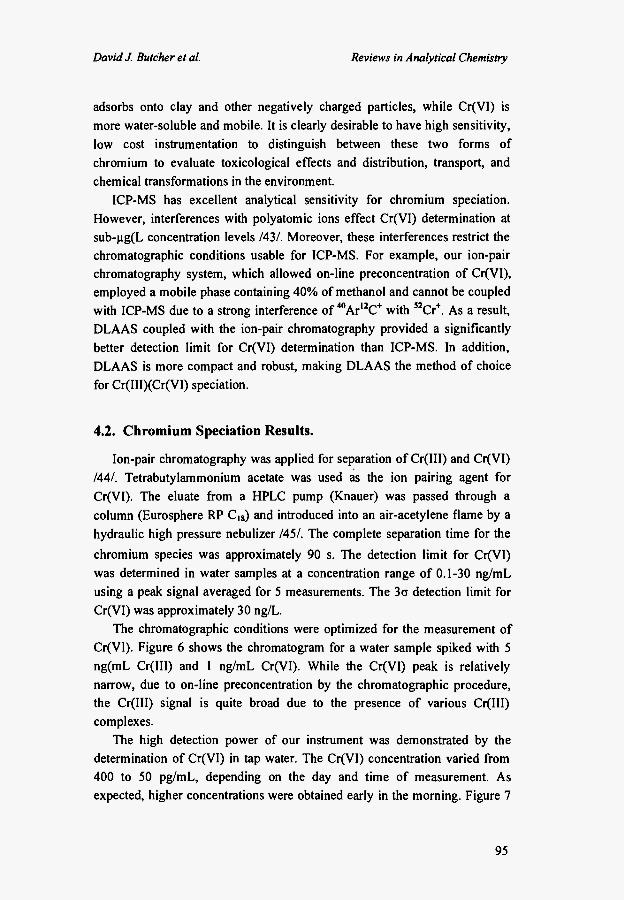
adsorbs onto clay and other negatively charged particles, while Cr(VI) is more water-soluble and mobile. It is clearly desirable to have high sensitivity, low cost instrumentation to distinguish between these two forms of chromium to evaluate toxicological effects and distribution, transport, and chemical transformations in the environment.
ICP-MS has excellent analytical sensitivity for chromium speciation. However, interferences with polyatomic ions effect Cr(VI) determination at s u b ^ g ( L concentration levels /43/. Moreover, these interferences restrict the chromatographic conditions usable for ICP-MS. For example, our ion-pair chromatography system, which allowed on-line preconcentration of Cr(VI), employed a mobile phase containing 40% of methanol and cannot be coupled with ICP-MS due to a strong interference of 40Ar12C+ with 52Cr+. As a result, DLAAS coupled with the ion-pair chromatography provided a significantly better detection limit for Cr(VI) determination than ICP-MS. In addition, DLAAS is more compact and robust, making DLAAS the method of choice for Cr(III)(Cr(VI) speciation.
4.2. Chromium Speciation Results.
Ion-pair chromatography was applied for separation of Cr(III) and Cr(VI) /44/. Tetrabutylammonium acetate was used as the ion pairing agent for Cr(VI). The eluate from a HPLC pump (Knauer) was passed through a column (Eurosphere RP Ci8) and introduced into an air-acetylene flame by a hydraulic high pressure nebulizer /45/. The complete separation time for the chromium species was approximately 90 s. The detection limit for Cr(VI) was determined in water samples at a concentration range of 0.1-30 ng/mL using a peak signal averaged for 5 measurements. The 3σ detection limit for Cr(VI) was approximately 30 ng/L.
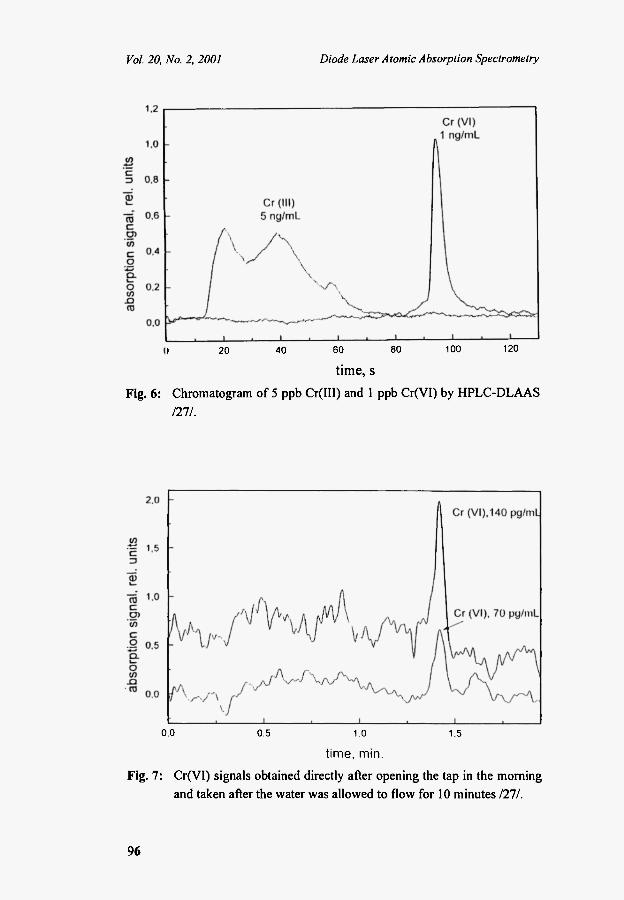
The chromatographic conditions were optimized for the measurement of Cr(Vl). Figure 6 shows the chromatogram for a water sample spiked with 5 ng(mL Cr(III) and 1 ng/mL Cr(VI). While the Cr(VI) peak is relatively narrow, due to on-line preconcentration by the chromatographic procedure, the Cr(III) signal is quite broad due to the presence of various Cr(III) complexes.
The high detection power of our instrument was demonstrated by the determination of Cr(VI) in tap water. The Cr(VI) concentration varied from 400 to 50 pg/mL, depending on the day and time of measurement. As expected, higher concentrations were obtained early in the morning. Figure 7
95
Vol. 20, No. 2, 2001 Diode Laser Atomic Absorption Spectrometry
Fig. 6:
I 20 40 60 80 100 120
t ime, s
Chromatogram of 5 ppb Cr(III) and 1 ppb Cr(VI) by HPLC-DLAAS
1211.
0.0 0.5 1.0 1,5
time, min.
Fig. 7: Cr(VI) signals obtained directly after opening the tap in the morning and taken after the water was allowed to flow for 10 minutes 1211.
96
David J. Butcher et al. Reviews in Analytical Chemistry
shows, for example, the signal of a sample taken directly after opening the tap in the morning and taken after the water was allowed to flow for 10 minutes.
The KNb03 crystal used in this work can be effectively used only in the spectral range above 420 nm where only chromium and calcium have strong absorption lines. For elements with lower absorption wavelengths (Table 1), the QPM structures should be used. In recent unpublished work, a QPM structure (SOREQ, Israel) for frequency doubling was applied and further improvement in the detection limit of Cr(VI) was obtained. This technique made it possible to determine Cr(VI) in air aerosols at a concentration level below the detection limit of ICP-MS technique.
5. CONCLUSIONS
In conclusion, DLAAS is a low cost, robust, sensitive technique for the speciation of elements. Recent developments in diode laser technology offer the potential for even better analytical performance than the results described here. We anticipate it has a bright future for metal speciation.
REFERENCES
1. Kramer, J.R. and Allen, H.E., eds. Metal Speciation: Theory, Analysis, and Application, Lewis Publishers, Chelsea, MI, 1988.
2. Harrison, R.M. and Rapsomanikis, S., eds. Environmental Analysis using Chromatography Interfaced with Atomic Spectroscopy, Halsted Press, New York, 1989.
3. Caroli, S., Ed. Element Speciation in Bioinorganic Chemistry, Wiley, New York, 1996.
4. Cornelius, R. and De Kimpe, J., J. Anal. Atom. Spectrom., 1994, 9, 945-950.
5. Irgolic, K.J., Sei. Total Environ., 1987, 64, 61-73. 6. Prichard, E., MacKay, G.M., and Points, J., eds. Trace Analysis: A
Structured Approach to Obtaining Reliable Results, Royal Society of Chemistry, Cambridge, 1996.
7. Hill, S.J., Chenery, S., Dason, J.B., Evans, E.H., Fisher, Α., Price, W.J.,
97
Vol. 20, No. 2, 2001 Diode Laser Atomic Absorption Spectrometry
Smith, C.M.M., Sutton, K.L., and Tyson, J.F., J. Anal. Atom. Spectrom., 2000, 15, 763-805.
8. Quevauviller, P., J. Anal. Atom. Spectrom., 1996,11, 1225-1231. 9. Quevauviller, P., Maier, E.A., and Griepink, B., Quality Control of
Results of Speciation Analysis, in Element Speciation in Bioinorganic Chemistry, S. Caroli, Editor. 1996, Wiley: New York. p. 195-222.
10. Mota, A.M. and Goncalves, M.L.S., Direct Methods of Speciation of Heavy Metals in Natural Waters, in Element Speciation in Bioinorganic Chemistry, S. Caroli, Editor. 1996, Wiley: New York. p. 21-96.
11. Ecological Soil Screening Level Guidance. 2000, U.S. EPA: Washington, http:((www.epa.gov(oenpage(superfund(programs(risk(ecorisk (guidance.pdf.
12. de la Guardia, M., Nonchromatographic Methods of Element Speciation by Atomic Spectrometry, in Element Speciation in Bioinorganic Chemistry, S. Caroli, Editor. 1996, Wiley: New York. p. 97-119.
13. Das, H.A. and Woittiez, J.R.W., Neutron Activation Analysis and Radiotracer Methods in Bioinorganic Chemistry, in Element Speciation in Bioinorganic Chemistry, S. Caroli, Editor. 1996, Wiley: New York, p. 155-194.
14. Ressler, T., Wong, J., and Roos, J., J. Synchrotron Rad., 1999, 6, 656-658.
15. Zayed, J., Hong, B., and L'Esperance, G., Environ. Sei. Technol, 1999, 33, 3341-3346.
16. Ebdon, L., Hill, S., and Ward, R.W., Analyst, 1987,112, 1-16. 17. Ebdon, L., Hill, S., and Ward, R.W., Analyst, 1986, 111, 1113-1138. 18. Butcher, D.J. and Sneddon, J., A Practical Guide to Graphite Furnace
Atomic Absorption Spectrometry, New York, Wiley, 1998. 19. Montaser, A. and Golightly, D.W., eds. Inductively Coupled Plasmas in
Analytical Atomic Spectrometry, VCH, New York, 1992. 20. Montaser, Α., Ed. Inductively Coupled Plasma Mass Spectrometry,
Wiley-VCH, New York, 1998. 21. Walton, A.P., Wei, G.-T., Liang, Z., Michel, R.G., and Morris, J.B.,
Anal. Chem., 1991, 63, 232-240. 22. Niemax, K., Zybin, Α., Schnurer-Patschan, C., and Groll, Η., Anal.
Chem., 1996, 68, 351A-356A. 23. Silver, J.A., Appl. Opt., 1993, 31, 707-717.
98
David J. Butcher et al. Reviews in Analytical Chemistry
24. Armstrong, J. Α., Blombergen, N., Ducuing, J., Persham, P.S.,"Interaction between light waves in a nonlinear dielectric", Phys. Rev. 1962, 127,1918.
25. Meyn, J. P. and Fejer, Μ. M., "Tunable ultraviolet radiation by SHG in Periodically poled LiTa03" Opt. Lett., 1997, 22, 1214.
26. Butcher, D.J., Zybin, Α., Bolshov, M., and Niemax, K., Anal. Chem., 1999, 71, 5379-5385.
27. Zybin, Α., Schaldach, G., Berndt, H., Niemax, K. 28. Davis, J.M., Environ. Health Perspect. Suppl. 1, 1998,106, 191-201. 29. Frumkin, H. and Solomon, G., Am. J. Ind. Med., 1997, 31, 107-115. 30. Garrison, A.W., Cippolone, M.G., Wolfe, N.L., and Swank, R.R.,
Environ. Toxicol. Chem., 1995, 14, 1859-1864. 31. Lynam, D.R., Pfeifer, G.D., Fort, B.F., Ter Haar, G.L., and Hollrah,
D.P., Sei. Total Environ., 1994, 146(147, 103-109. 32. Lenane, D.L., Fort, B.F., Ter Haar, G.L., Lynam, D.R., and Pfeifer,
G.D., Sei. Total Environ., 1994, 146(147, 245-251. 33. Egyed, M. and Wood, G.C., Sei. Total Environ., 1996, 189(190, 11-20. 34. Campanella, L., Problems in the Speciation of Elements in Natural
Waters: The Case of Chromium and Selenium, in Element Speciation in Bioinorganic Chemistry, S. Caroli, Editor. 1996, Wiley: New York.
35. Kotas, J. and Stasicka, Z., Environ. Poll., 2000,107, 263-283. 36. Marques, M.J., Salvador, Α., Morales-Rubio, Α., and de la Guardia, M.,
Fresenius J. Anal. Chem., 2000, 367, 601-613. 37. Nriagu, J.O. and Nieboer, E., Chromium in the Natural and Human
Environment, New York, Wiley, 1988. 38. Toxicological Review of Trivalent Chromium. 1998, U.S.
Environmental Protection Agency: Washington, http:((www.epa.gov(iris(toxreviews(cr3-toxf.pdf.
39. Iyengar, G.V., Sei. Total Environ., 1989, 86, 69-74. 40. Goldhaber, S. and Vogt, C., Sei. Total Environ., 1989, 86,43-51. 41. Toxicological Review of Hexavalent Chromium. 1998: Washington,
http:((www.epa.gov(ngispgm3(iris(toxreviews(cr6-toxf.pdf. 42. Region 9 Preliminary Remediation Goals (PRGs) 1999. 1999,
U.S. Environmental Protection Agency: San Francisco, http:((www.epa.gov(region09(waste(sfund(prg.
43. Barnowski, C., Jakubowski, N., Stiiwer, D., Broekaert, J. A. C. J. Anal. At. Spectrom. 1997,12, 1155-1161.
99
Vol. 20, No. 2, 2001 Diode Laser Atomic Absorption Spectrometry
44. Posta, G., Berndt, H., Schaldach, G., Luo, SK.,. Anal. ChemA993, 65, 2590-2595.
45. Schaldach, G., Berndt, H., Fresenius J. Anal. Chem. 1994, 350, 481-486.
46. Welz, B., Atomic Absorption Spectrometry, Third Ed., Chichester, Wiley, 1998.
100


