Embed Size (px)
Citation preview
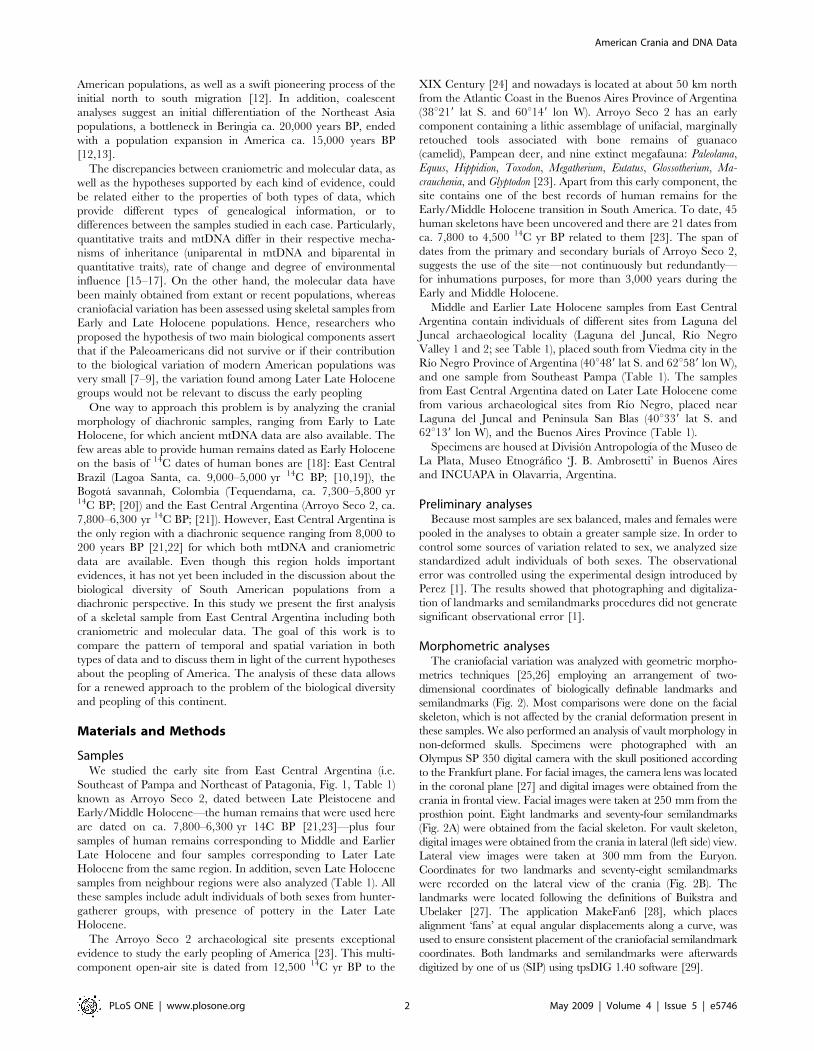
Discrepancy between Cranial and DNA Data of EarlyAmericans: Implications for American PeoplingS. Ivan Perez1*, Valeria Bernal1, Paula N. Gonzalez1, Marina Sardi1, Gustavo G. Politis2
1 CONICET, Division Antropologıa, Facultad de Ciencias Naturales y Museo, Universidad Nacional de La Plata, La Plata, Buenos Aires, Argentina, 2 CONICET, Division
Arqueologıa, Facultad de Ciencias Naturales y Museo, Universidad Nacional de La Plata, La Plata, Buenos Aires, Argentina
Abstract
Currently, one of the major debates about the American peopling focuses on the number of populations that originated thebiological diversity found in the continent during the Holocene. The studies of craniometric variation in American humanremains dating from that period have shown morphological differences between the earliest settlers of the continent andsome of the later Amerindian populations. This led some investigators to suggest that these groups—known asPaleomericans and Amerindians respectively—may have arisen from two biologically different populations. On the otherhand, most DNA studies performed over extant and ancient populations suggest a single migration of a population fromNortheast Asia. Comparing craniometric and mtDNA data of diachronic samples from East Central Argentina dated from8,000 to 400 years BP, we show here that even when the oldest individuals display traits attributable to Paleoamericancrania, they present the same mtDNA haplogroups as later populations with Amerindian morphology. A possibleexplanation for these results could be that the craniofacial differentiation was a local phenomenon resulting from random(i.e. genetic drift) and non-random factors (e.g. selection and plasticity). Local processes of morphological differentiation inAmerica are a probable scenario if we take into consideration the rapid peopling and the great ecological diversity of thiscontinent; nevertheless we will discuss alternative explanations as well.
Citation: Perez SI, Bernal V, Gonzalez PN, Sardi M, Politis GG (2009) Discrepancy between Cranial and DNA Data of Early Americans: Implications for AmericanPeopling. PLoS ONE 4(5): e5746. doi:10.1371/journal.pone.0005746
Editor: Dennis O’Rourke, University of Utah, United States of America
Received February 14, 2009; Accepted May 4, 2009; Published May 29, 2009
Copyright: � 2009 Perez et al. This is an open-access article distributed under the terms of the Creative Commons Attribution License, which permitsunrestricted use, distribution, and reproduction in any medium, provided the original author and source are credited.
Funding: The authors have no support or funding to report.
Competing Interests: The authors have declared that no competing interests exist.
* E-mail: [email protected]
Introduction
The biological diversity of South American human populations
has been the focus of extensive research for more than a hundred
years (see review in [1]). These investigations have been associated
with intense interdisciplinary studies regarding the peopling of the
Americas. The great interest in this subject is partially due to the
fact that America was the latest continent colonized by modern
humans (ca. 11,000–13,000 years B.P.; [2]) and also due to the
high levels of morphological variation found in Native American
populations. In this context, two main hypotheses have been
proposed to account for this biological variation: a) the migratory
hypothesis, which suggests that the biological variation among
South American groups was the result of a variable number of
migratory waves [3,4]; and b) the local diversification hypothesis,
i.e. that all South American groups descend from the same
ancestral population or from populations related to each other,
with local random (i.e. genetic drift) and non-random factors (i.e.
selection and phenotypic plasticity) as the main causes of the
diversification [5–7].
In recent years, the migratory hypothesis that postulates
different biological origins for South American populations has
received increased attention by researchers working with cranio-
metric evidence [8–10]. This hypothesis, known as two main
biological components, asserts that the morphological diversity of
American human populations results from two successive
migratory events. The first component, named Palaeoamericans,
derived from Pleistocene Southeast Asian populations which
expanded into America around 14,000 years BP. Morphologically
they were characterized by long and narrow cranial vault (i.e.
dolichocephalic morphology) and a narrow face. The second
component, named Amerindians, from which most of modern
American groups derive, corresponds to a migration of popula-
tions from Northeast Asia which occurred during the Early
Holocene (ca. 8,000 years BP; [8–11]). These populations
exhibited short and wide cranial vault, along with wide faces (i.e.
brachycephalic morphology). In addition, it was pointed out that
this Amerindian morphology corresponds with a mongoloid
pattern of craniofacial shape. The presence of this cranial shape
in America has been explained as the result of a ‘‘fixation’’ of the
mongoloid morphology in North Asia, previous to the Amerindian
migration.
In contrast, the molecular evidence available to date (i.e.
mtDNA and nuclear DNA information) supports a single origin in
Northeast Asia ca. 15,000 years BP for almost all American
populations, followed by local diversification—probably with the
exception of the Esquimo and Na-Dene groups [12–14].
Particularly, mtDNA studies have detected four major pan-
American founding haplotypes (A2, B2, C1, D1), which are also
frequent in Asia. In addition, other founding mtDNA haplotypes
occur in the Americas, such as X2a, D2, and D3, which are found
nearly exclusively in North America [12,13]. The haplogroup
distribution, together with the similar coalescence time for these
haplotypes, has been used to support a single origin for extant
PLoS ONE | www.plosone.org 1 May 2009 | Volume 4 | Issue 5 | e5746
American populations, as well as a swift pioneering process of the
initial north to south migration [12]. In addition, coalescent
analyses suggest an initial differentiation of the Northeast Asia
populations, a bottleneck in Beringia ca. 20,000 years BP, ended
with a population expansion in America ca. 15,000 years BP
[12,13].
The discrepancies between craniometric and molecular data, as
well as the hypotheses supported by each kind of evidence, could
be related either to the properties of both types of data, which
provide different types of genealogical information, or to
differences between the samples studied in each case. Particularly,
quantitative traits and mtDNA differ in their respective mecha-
nisms of inheritance (uniparental in mtDNA and biparental in
quantitative traits), rate of change and degree of environmental
influence [15–17]. On the other hand, the molecular data have
been mainly obtained from extant or recent populations, whereas
craniofacial variation has been assessed using skeletal samples from
Early and Late Holocene populations. Hence, researchers who
proposed the hypothesis of two main biological components assert
that if the Paleoamericans did not survive or if their contribution
to the biological variation of modern American populations was
very small [7–9], the variation found among Later Late Holocene
groups would not be relevant to discuss the early peopling
One way to approach this problem is by analyzing the cranial
morphology of diachronic samples, ranging from Early to Late
Holocene, for which ancient mtDNA data are also available. The
few areas able to provide human remains dated as Early Holocene
on the basis of 14C dates of human bones are [18]: East Central
Brazil (Lagoa Santa, ca. 9,000–5,000 yr 14C BP; [10,19]), the
Bogota savannah, Colombia (Tequendama, ca. 7,300–5,800 yr14C BP; [20]) and the East Central Argentina (Arroyo Seco 2, ca.
7,800–6,300 yr 14C BP; [21]). However, East Central Argentina is
the only region with a diachronic sequence ranging from 8,000 to
200 years BP [21,22] for which both mtDNA and craniometric
data are available. Even though this region holds important
evidences, it has not yet been included in the discussion about the
biological diversity of South American populations from a
diachronic perspective. In this study we present the first analysis
of a skeletal sample from East Central Argentina including both
craniometric and molecular data. The goal of this work is to
compare the pattern of temporal and spatial variation in both
types of data and to discuss them in light of the current hypotheses
about the peopling of America. The analysis of these data allows
for a renewed approach to the problem of the biological diversity
and peopling of this continent.
Materials and Methods
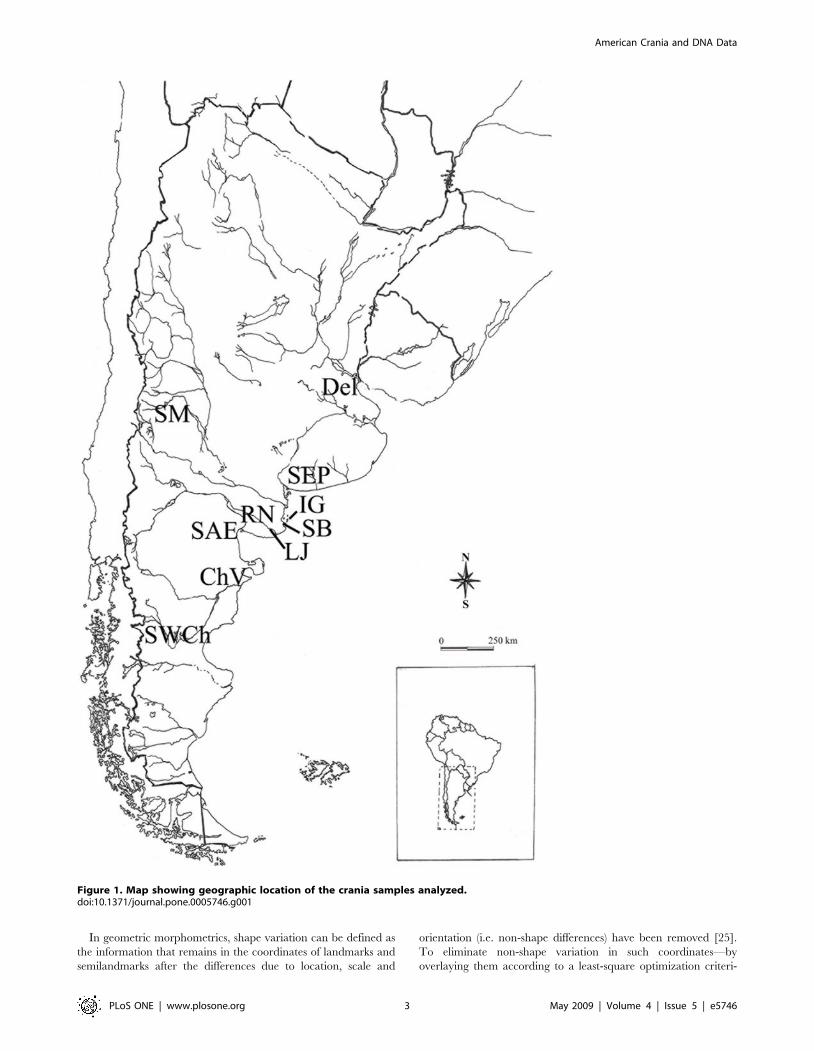
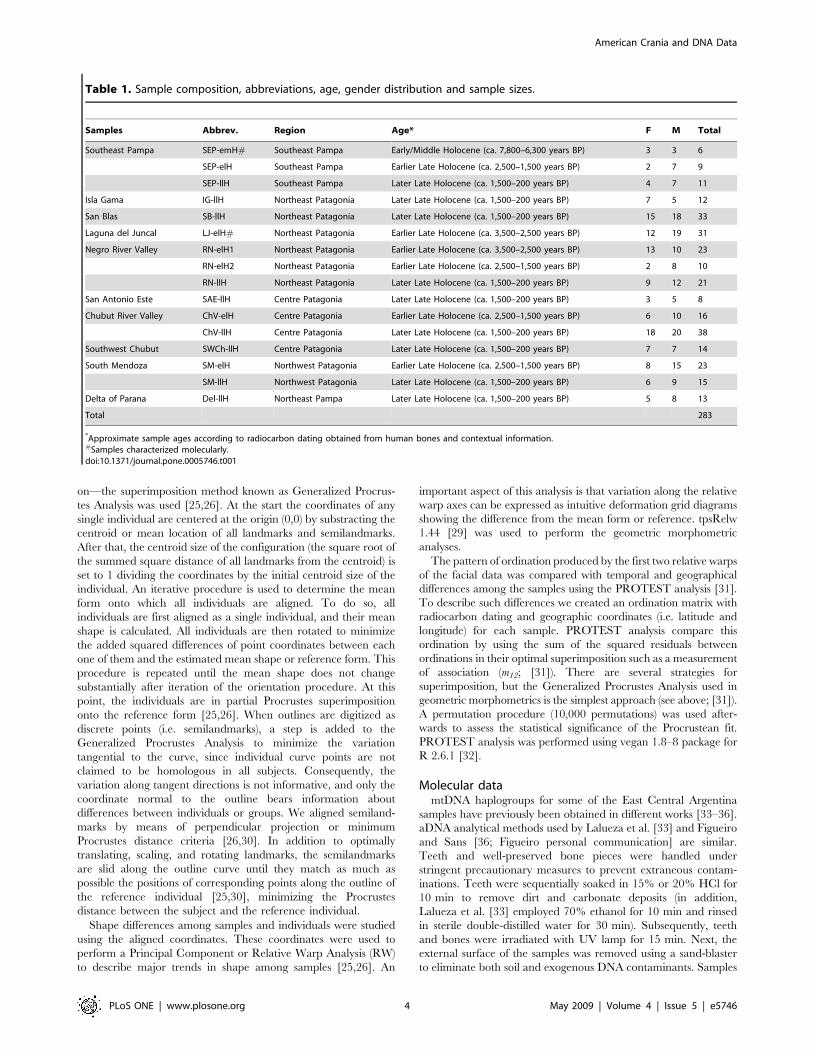
SamplesWe studied the early site from East Central Argentina (i.e.
Southeast of Pampa and Northeast of Patagonia, Fig. 1, Table 1)
known as Arroyo Seco 2, dated between Late Pleistocene and
Early/Middle Holocene—the human remains that were used here
are dated on ca. 7,800–6,300 yr 14C BP [21,23]—plus four
samples of human remains corresponding to Middle and Earlier
Late Holocene and four samples corresponding to Later Late
Holocene from the same region. In addition, seven Late Holocene
samples from neighbour regions were also analyzed (Table 1). All
these samples include adult individuals of both sexes from hunter-
gatherer groups, with presence of pottery in the Later Late
Holocene.
The Arroyo Seco 2 archaeological site presents exceptional
evidence to study the early peopling of America [23]. This multi-
component open-air site is dated from 12,500 14C yr BP to the
XIX Century [24] and nowadays is located at about 50 km north
from the Atlantic Coast in the Buenos Aires Province of Argentina
(38u219 lat S. and 60u149 lon W). Arroyo Seco 2 has an early
component containing a lithic assemblage of unifacial, marginally
retouched tools associated with bone remains of guanaco
(camelid), Pampean deer, and nine extinct megafauna: Paleolama,
Equus, Hippidion, Toxodon, Megatherium, Eutatus, Glossotherium, Ma-
crauchenia, and Glyptodon [23]. Apart from this early component, the
site contains one of the best records of human remains for the
Early/Middle Holocene transition in South America. To date, 45
human skeletons have been uncovered and there are 21 dates from
ca. 7,800 to 4,500 14C yr BP related to them [23]. The span of
dates from the primary and secondary burials of Arroyo Seco 2,
suggests the use of the site—not continuously but redundantly—
for inhumations purposes, for more than 3,000 years during the
Early and Middle Holocene.
Middle and Earlier Late Holocene samples from East Central
Argentina contain individuals of different sites from Laguna del
Juncal archaeological locality (Laguna del Juncal, Rıo Negro
Valley 1 and 2; see Table 1), placed south from Viedma city in the
Rıo Negro Province of Argentina (40u489 lat S. and 62u589 lon W),
and one sample from Southeast Pampa (Table 1). The samples
from East Central Argentina dated on Later Late Holocene come
from various archaeological sites from Rıo Negro, placed near
Laguna del Juncal and Peninsula San Blas (40u339 lat S. and
62u139 lon W), and the Buenos Aires Province (Table 1).
Specimens are housed at Division Antropologıa of the Museo de
La Plata, Museo Etnografico ‘J. B. Ambrosetti’ in Buenos Aires
and INCUAPA in Olavarria, Argentina.
Preliminary analysesBecause most samples are sex balanced, males and females were
pooled in the analyses to obtain a greater sample size. In order to
control some sources of variation related to sex, we analyzed size
standardized adult individuals of both sexes. The observational
error was controlled using the experimental design introduced by
Perez [1]. The results showed that photographing and digitaliza-
tion of landmarks and semilandmarks procedures did not generate
significant observational error [1].
Morphometric analysesThe craniofacial variation was analyzed with geometric morpho-
metrics techniques [25,26] employing an arrangement of two-
dimensional coordinates of biologically definable landmarks and
semilandmarks (Fig. 2). Most comparisons were done on the facial
skeleton, which is not affected by the cranial deformation present in
these samples. We also performed an analysis of vault morphology in
non-deformed skulls. Specimens were photographed with an
Olympus SP 350 digital camera with the skull positioned according
to the Frankfurt plane. For facial images, the camera lens was located
in the coronal plane [27] and digital images were obtained from the
crania in frontal view. Facial images were taken at 250 mm from the
prosthion point. Eight landmarks and seventy-four semilandmarks
(Fig. 2A) were obtained from the facial skeleton. For vault skeleton,
digital images were obtained from the crania in lateral (left side) view.
Lateral view images were taken at 300 mm from the Euryon.
Coordinates for two landmarks and seventy-eight semilandmarks
were recorded on the lateral view of the crania (Fig. 2B). The
landmarks were located following the definitions of Buikstra and
Ubelaker [27]. The application MakeFan6 [28], which places
alignment ‘fans’ at equal angular displacements along a curve, was
used to ensure consistent placement of the craniofacial semilandmark
coordinates. Both landmarks and semilandmarks were afterwards
digitized by one of us (SIP) using tpsDIG 1.40 software [29].
American Crania and DNA Data
PLoS ONE | www.plosone.org 2 May 2009 | Volume 4 | Issue 5 | e5746
In geometric morphometrics, shape variation can be defined as
the information that remains in the coordinates of landmarks and
semilandmarks after the differences due to location, scale and
orientation (i.e. non-shape differences) have been removed [25].
To eliminate non-shape variation in such coordinates—by
overlaying them according to a least-square optimization criteri-
Figure 1. Map showing geographic location of the crania samples analyzed.doi:10.1371/journal.pone.0005746.g001
American Crania and DNA Data
PLoS ONE | www.plosone.org 3 May 2009 | Volume 4 | Issue 5 | e5746
on—the superimposition method known as Generalized Procrus-
tes Analysis was used [25,26]. At the start the coordinates of any
single individual are centered at the origin (0,0) by substracting the
centroid or mean location of all landmarks and semilandmarks.
After that, the centroid size of the configuration (the square root of
the summed square distance of all landmarks from the centroid) is
set to 1 dividing the coordinates by the initial centroid size of the
individual. An iterative procedure is used to determine the mean
form onto which all individuals are aligned. To do so, all
individuals are first aligned as a single individual, and their mean
shape is calculated. All individuals are then rotated to minimize
the added squared differences of point coordinates between each
one of them and the estimated mean shape or reference form. This
procedure is repeated until the mean shape does not change
substantially after iteration of the orientation procedure. At this
point, the individuals are in partial Procrustes superimposition
onto the reference form [25,26]. When outlines are digitized as
discrete points (i.e. semilandmarks), a step is added to the
Generalized Procrustes Analysis to minimize the variation
tangential to the curve, since individual curve points are not
claimed to be homologous in all subjects. Consequently, the
variation along tangent directions is not informative, and only the
coordinate normal to the outline bears information about
differences between individuals or groups. We aligned semiland-
marks by means of perpendicular projection or minimum
Procrustes distance criteria [26,30]. In addition to optimally
translating, scaling, and rotating landmarks, the semilandmarks
are slid along the outline curve until they match as much as
possible the positions of corresponding points along the outline of
the reference individual [25,30], minimizing the Procrustes
distance between the subject and the reference individual.
Shape differences among samples and individuals were studied
using the aligned coordinates. These coordinates were used to
perform a Principal Component or Relative Warp Analysis (RW)
to describe major trends in shape among samples [25,26]. An
important aspect of this analysis is that variation along the relative
warp axes can be expressed as intuitive deformation grid diagrams
showing the difference from the mean form or reference. tpsRelw
1.44 [29] was used to perform the geometric morphometric
analyses.
The pattern of ordination produced by the first two relative warps
of the facial data was compared with temporal and geographical
differences among the samples using the PROTEST analysis [31].
To describe such differences we created an ordination matrix with
radiocarbon dating and geographic coordinates (i.e. latitude and
longitude) for each sample. PROTEST analysis compare this
ordination by using the sum of the squared residuals between
ordinations in their optimal superimposition such as a measurement
of association (m12; [31]). There are several strategies for
superimposition, but the Generalized Procrustes Analysis used in
geometric morphometrics is the simplest approach (see above; [31]).
A permutation procedure (10,000 permutations) was used after-
wards to assess the statistical significance of the Procrustean fit.
PROTEST analysis was performed using vegan 1.8–8 package for
R 2.6.1 [32].
Molecular datamtDNA haplogroups for some of the East Central Argentina
samples have previously been obtained in different works [33–36].
aDNA analytical methods used by Lalueza et al. [33] and Figueiro
and Sans [36; Figueiro personal communication] are similar.
Teeth and well-preserved bone pieces were handled under
stringent precautionary measures to prevent extraneous contam-
inations. Teeth were sequentially soaked in 15% or 20% HCl for
10 min to remove dirt and carbonate deposits (in addition,
Lalueza et al. [33] employed 70% ethanol for 10 min and rinsed
in sterile double-distilled water for 30 min). Subsequently, teeth
and bones were irradiated with UV lamp for 15 min. Next, the
external surface of the samples was removed using a sand-blaster
to eliminate both soil and exogenous DNA contaminants. Samples
Table 1. Sample composition, abbreviations, age, gender distribution and sample sizes.
Samples Abbrev. Region Age* F M Total
Southeast Pampa SEP-emH# Southeast Pampa Early/Middle Holocene (ca. 7,800–6,300 years BP) 3 3 6
SEP-elH Southeast Pampa Earlier Late Holocene (ca. 2,500–1,500 years BP) 2 7 9
SEP-llH Southeast Pampa Later Late Holocene (ca. 1,500–200 years BP) 4 7 11
Isla Gama IG-llH Northeast Patagonia Later Late Holocene (ca. 1,500–200 years BP) 7 5 12
San Blas SB-llH Northeast Patagonia Later Late Holocene (ca. 1,500–200 years BP) 15 18 33
Laguna del Juncal LJ-elH# Northeast Patagonia Earlier Late Holocene (ca. 3,500–2,500 years BP) 12 19 31
Negro River Valley RN-elH1 Northeast Patagonia Earlier Late Holocene (ca. 3,500–2,500 years BP) 13 10 23
RN-elH2 Northeast Patagonia Earlier Late Holocene (ca. 2,500–1,500 years BP) 2 8 10
RN-llH Northeast Patagonia Later Late Holocene (ca. 1,500–200 years BP) 9 12 21
San Antonio Este SAE-llH Centre Patagonia Later Late Holocene (ca. 1,500–200 years BP) 3 5 8
Chubut River Valley ChV-elH Centre Patagonia Earlier Late Holocene (ca. 2,500–1,500 years BP) 6 10 16
ChV-llH Centre Patagonia Later Late Holocene (ca. 1,500–200 years BP) 18 20 38
Southwest Chubut SWCh-llH Centre Patagonia Later Late Holocene (ca. 1,500–200 years BP) 7 7 14
South Mendoza SM-elH Northwest Patagonia Earlier Late Holocene (ca. 2,500–1,500 years BP) 8 15 23
SM-llH Northwest Patagonia Later Late Holocene (ca. 1,500–200 years BP) 6 9 15
Delta of Parana Del-llH Northeast Pampa Later Late Holocene (ca. 1,500–200 years BP) 5 8 13
Total 283
*Approximate sample ages according to radiocarbon dating obtained from human bones and contextual information.#Samples characterized molecularly.doi:10.1371/journal.pone.0005746.t001
American Crania and DNA Data
PLoS ONE | www.plosone.org 4 May 2009 | Volume 4 | Issue 5 | e5746
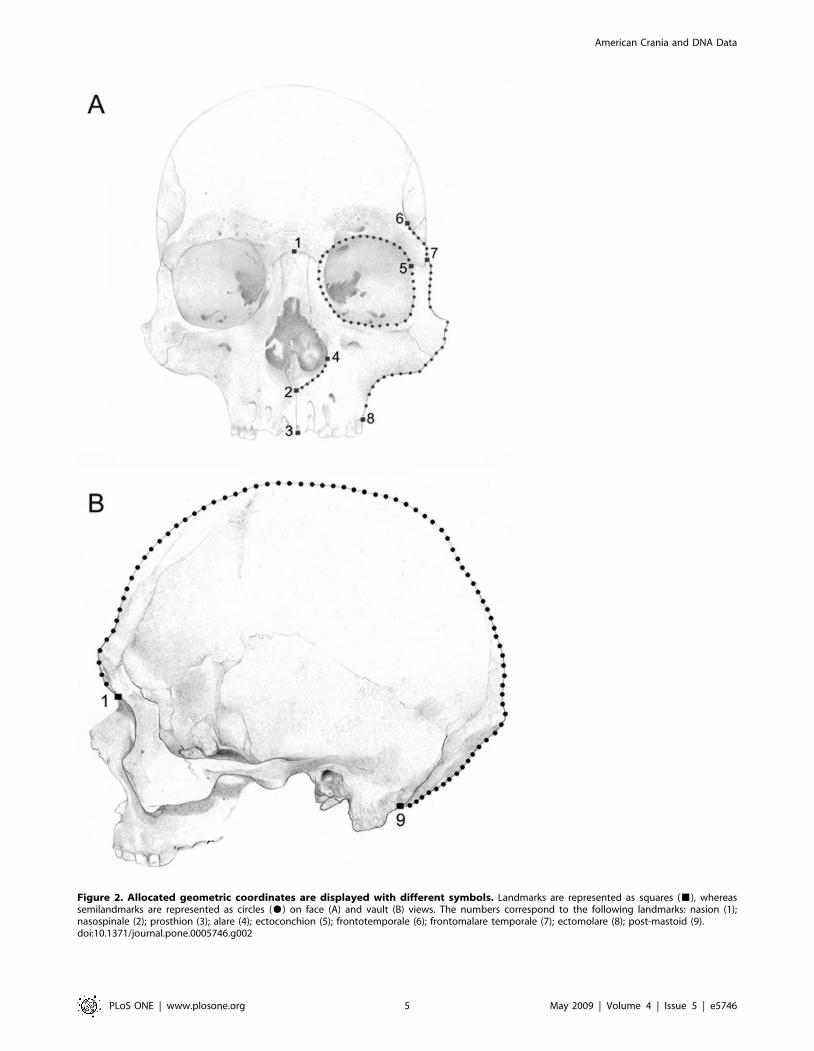
Figure 2. Allocated geometric coordinates are displayed with different symbols. Landmarks are represented as squares (&), whereassemilandmarks are represented as circles ($) on face (A) and vault (B) views. The numbers correspond to the following landmarks: nasion (1);nasospinale (2); prosthion (3); alare (4); ectoconchion (5); frontotemporale (6); frontomalare temporale (7); ectomolare (8); post-mastoid (9).doi:10.1371/journal.pone.0005746.g002
American Crania and DNA Data
PLoS ONE | www.plosone.org 5 May 2009 | Volume 4 | Issue 5 | e5746
were powdered under liquid nitrogen in a Spex freezer mill fitted
with UV-sterilized tubes and impactors. The obtained powder was
used to DNA extraction, employing a standard, high-volume
phenol/chloroform protocol [33]. Several strategies were strictly
followed with the object to demonstrate authenticity of the
obtained data. All analyses were performed in laboratories
exclusively dedicated to ancient DNA manipulation. To trace
possible contamination, mtDNA sequences from the authors and
other laboratory members who had manipulated the bones were
obtained. To characterize the mtDNA lineages, DNA purified
from bone and teeth was amplified by PCR using specific primers
[33,35,36]. After amplification, the mtDNA products were
classified with the specific endonucleases defining each Amerin-
dian haplogroup and then electrophoresed on agarose gels. In
addition, several samples that yielded significant PCR amplifica-
tion products for the HVRI mtDNA region were used for further
mtDNA sequencing characterization [33,35].
Results
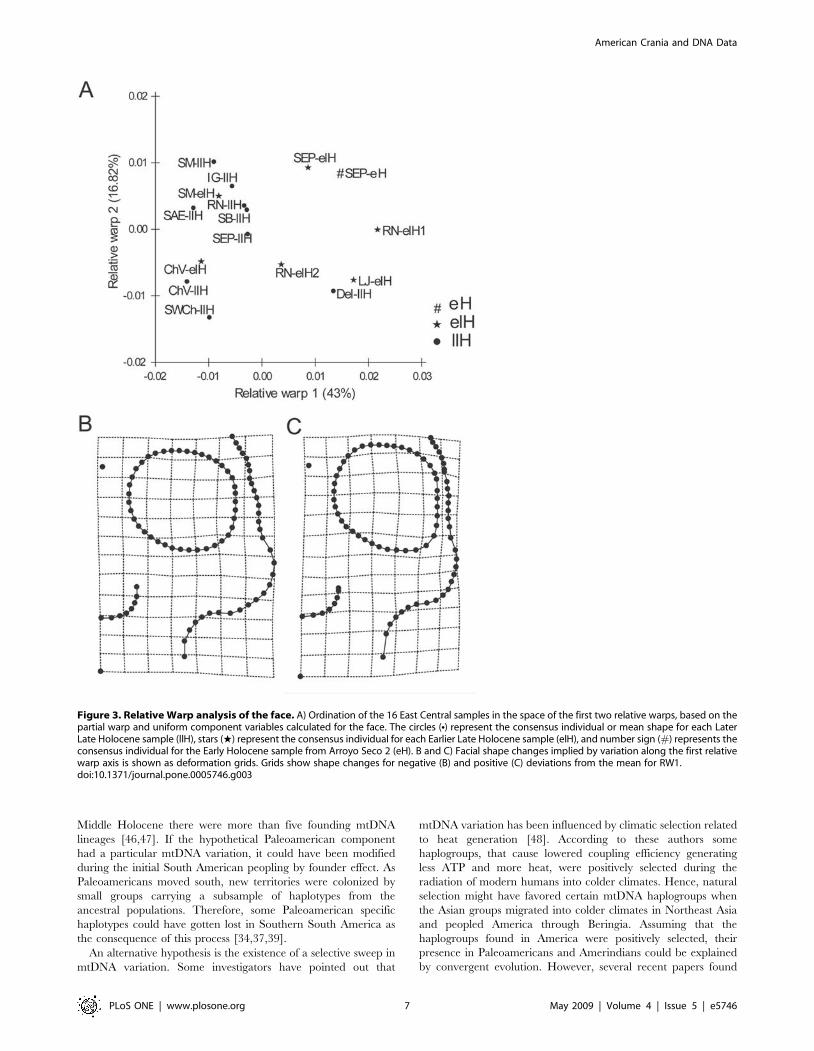
For the facial skeleton, the relative warp 1 shows that the
samples from Arroyo Seco 2 and the four samples corresponding
to the Middle and Earlier Late Holocene from East Central
Argentina separate themselves from the four Later Late Holocene
samples of the same region (Fig. 3A). Almost all samples of the
neighbour regions—with exception of the Delta of Parana
sample—have a similar shape to the Later Late Holocene samples
from East Central Argentina (Fig. 3A). Figures 3B and 3C display
the deformation grids for these data, showing that the main
differences along the first axis are located in the orbital and
zygomatic shape, as well as in the relative size of the orbit.
Particularly, the Later Late Holocene samples show the widest
facial skeleton, with wider malar bones, and relatively smaller
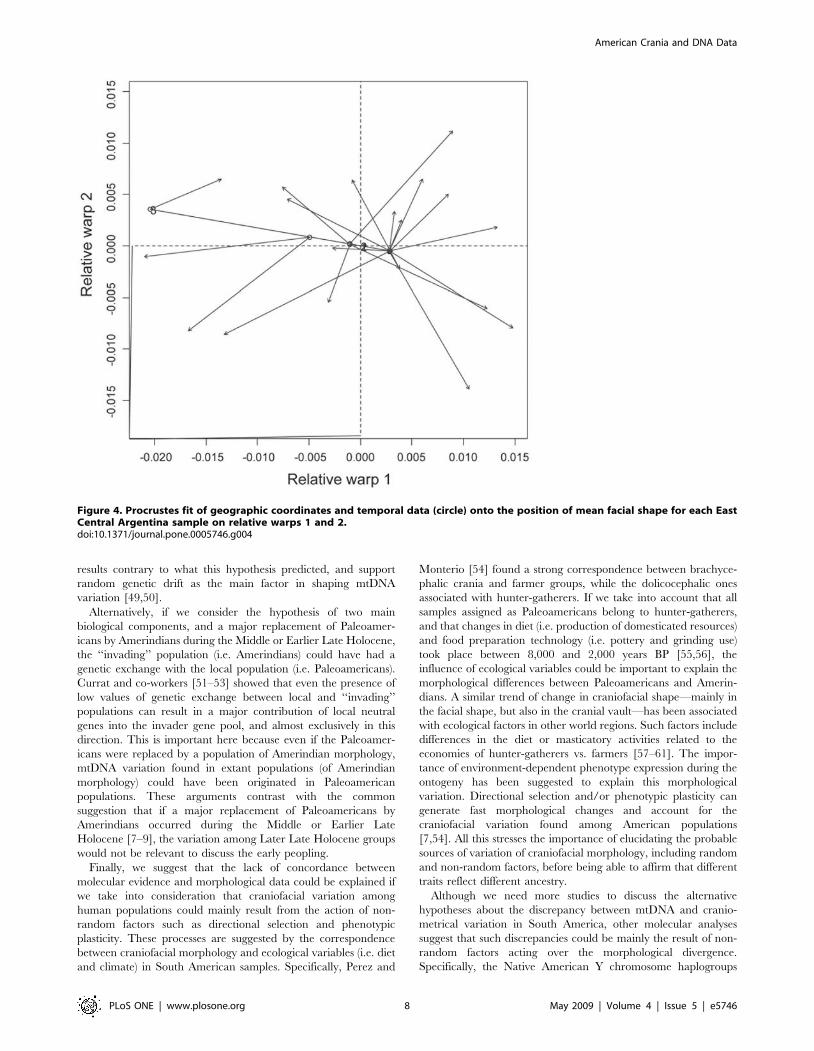
orbits. The Procrustes analysis confirm this diachronic pattern of
differences (Fig. 4), showing a significant association between facial
shape and temporal plus geographic dimension (m12 = 0.447,
P = 0.016), being both, temporal and geographic variation,
important to explain facial shape differences (temporal variation
m12 = 0.446, P = 0.016; geographic variation m12 = 0.489,
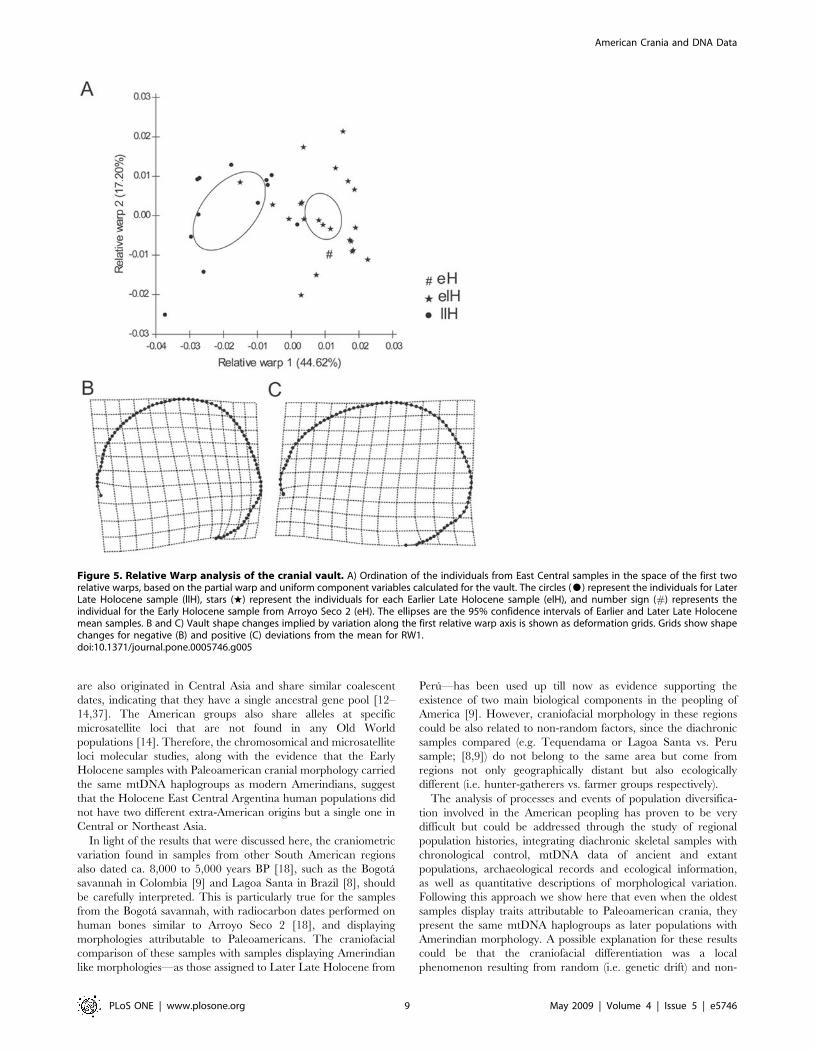
P = 0.012). The relative warp 1 of vault variation indicates that
the individuals from Arroyo Seco 2 and those of the Middle and
Earlier Late Holocene from East Central Argentina (mainly the
sample from Laguna del Juncal) are different from the Later Late
Holocene individuals of the same region (Fig. 5A). Figures 5B and
5C display the deformation grids for these data, showing that the
earlier samples have longer, or dolicocephalic, cranial vault. This
craniometric variation, particularly in the relative cranial length
and facial width, seems to be consistent with the pattern of
morphological variation interpreted as differences between
Paleoamerican and Amerindian groups [9].
The ancient mtDNA analyses of individuals from Arroyo Seco 2
and Laguna del Juncal samples, however, show the presence of
native American haplogroups B, C and D [33,35,36]. This agrees
with the main incidence of these three haplogroups in mtDNA
sequences of recent populations from the same region
[33,35,36,37], related to our Later Late Holocene samples.
Figueiro and Sans [36] successfully recover DNA from 8
individuals from a total of 23 individuals studied in Arroyo Seco
2 site. The haplogroups B (n = 3; 37.5%), C (n = 4; 50%) and D
(n = 1; 12.5%) were found [36]. In Laguna del Juncal haplogroups
C (n = 4; 26.7%) and D (n = 11; 73.3%) are present [33; but note
that this sample sizes represent the haplogroups from Aonikenk
plus Laguna del Juncal site]. In addition, several samples of
haplogroups C and D were successfully cloned and sequenced by
Lalueza et al. [33] and Garcia-Bour et al. [35], verifying the results
provided by the analysis of restriction site polymorphisms. The
haplogroup frequencies from Arroyo Seco 2 and Laguna del
Juncal are very similar to the haplogroup frequencies from recent
groups of Central Argentina. Particularly, a recent population
from Pampa, the Mapuche, has values of A = 6.14%, B = 35.96%,
C = 23.9% and D = 34% [38] and a recent population from
Northwest Patagonia, the Pewenche, has values of A = 2%,
B = 9%, C = 37% and D = 52% [39]. Such values match with
the expected clinal change of haplogroups frequencies from north
to south observed in South America [34,37,39].
Discussion
The results obtained show that morphological variation in East
Central Argentina does not correlate with mtDNA differences.
The oldest samples from the region under study, dated on ca.
8,000–2,000 years BP, present more elongated crania than the
Later Late Holocene samples, but both groups have the same
mtDNA haplogroups (and even haplotypes). It was pointed out
that mtDNA variation in modern Native Americans support a
single expansion into America of groups from Northeast or
Central Asia [12–14,37]. Conversely, the same morphological
differences were also observed in other regions of South America
and have been used as evidence of different migratory waves,
according with the two main biological components hypothesis,
with a major population replacement taking place around 8,000–
3,000 years BP [8–10].
This hypothesis asserts, in particular, that Amerindians have a
mongoloid craniofacial shape, while Paleoamericans have a
generalized morphology. Although mongoloid phenotypic pattern
encompasses highly variable groups, most populations of North
East Asia share two phenotypic traits: facial flatness [40] and the
synodont dental pattern [41,42]. However, despite the two main
biological components affirmation, facial flatness is absent among
Late Holocene South American groups [40,43]. In addition,
several studies that analyze craniofacial similarities between
American groups and other worldwide populations demonstrate
that modern aborigines do not present the typical morphology of
North East Asia [44,45]. Specifically, ‘‘the American groups are
more apt to join Europeans than Asiatics’’ [44], suggesting that the
Late Holocene South American groups have not specific
mongoloid craniofacial traits.
The lack of concordance between molecular data and
craniofacial morphology has also been observed when studying
the groups who inhabited the southernmost part of America
during historic times [1]. The Fueguian groups have been
classified as Paleoamericans by cranial shape (i.e. high levels of
dolicocephaly and robusticity), and differ morphologically from
other South American groups with brachycephalic morphology
(i.e. Amerindian morphology sensu Neves and co-workers) [1].
However, the molecular studies show that they carried Native
American mtDNA haplotypes C and D [34–35]. In addition, the
study of Y-STRs sequences shows similar results [35], suggesting
that the Fueguians are close to Amerindian populations from
South Central Chile and Argentina.
Different hypotheses can be suggested to explain the discrep-
ancy between mtDNA and craniometrical variation in South
America. Because mtDNA is essentially a single locus, it could
have been subject to considerable genetic drift, even more than
morphological traits [7], during the Pleistocene-Early Holocene.
Particularly, some North American aDNA studies suggest that the
founding migrants exhibited greater molecular diversity than what
has been previously recognized, showing that during the Early-
American Crania and DNA Data
PLoS ONE | www.plosone.org 6 May 2009 | Volume 4 | Issue 5 | e5746
Middle Holocene there were more than five founding mtDNA
lineages [46,47]. If the hypothetical Paleoamerican component
had a particular mtDNA variation, it could have been modified
during the initial South American peopling by founder effect. As
Paleoamericans moved south, new territories were colonized by
small groups carrying a subsample of haplotypes from the
ancestral populations. Therefore, some Paleoamerican specific
haplotypes could have gotten lost in Southern South America as
the consequence of this process [34,37,39].
An alternative hypothesis is the existence of a selective sweep in
mtDNA variation. Some investigators have pointed out that
mtDNA variation has been influenced by climatic selection related
to heat generation [48]. According to these authors some
haplogroups, that cause lowered coupling efficiency generating
less ATP and more heat, were positively selected during the
radiation of modern humans into colder climates. Hence, natural
selection might have favored certain mtDNA haplogroups when
the Asian groups migrated into colder climates in Northeast Asia
and peopled America through Beringia. Assuming that the
haplogroups found in America were positively selected, their
presence in Paleoamericans and Amerindians could be explained
by convergent evolution. However, several recent papers found
Figure 3. Relative Warp analysis of the face. A) Ordination of the 16 East Central samples in the space of the first two relative warps, based on thepartial warp and uniform component variables calculated for the face. The circles (N) represent the consensus individual or mean shape for each LaterLate Holocene sample (llH), stars (w) represent the consensus individual for each Earlier Late Holocene sample (elH), and number sign (#) represents theconsensus individual for the Early Holocene sample from Arroyo Seco 2 (eH). B and C) Facial shape changes implied by variation along the first relativewarp axis is shown as deformation grids. Grids show shape changes for negative (B) and positive (C) deviations from the mean for RW1.doi:10.1371/journal.pone.0005746.g003
American Crania and DNA Data
PLoS ONE | www.plosone.org 7 May 2009 | Volume 4 | Issue 5 | e5746
results contrary to what this hypothesis predicted, and support
random genetic drift as the main factor in shaping mtDNA
variation [49,50].
Alternatively, if we consider the hypothesis of two main
biological components, and a major replacement of Paleoamer-
icans by Amerindians during the Middle or Earlier Late Holocene,
the ‘‘invading’’ population (i.e. Amerindians) could have had a
genetic exchange with the local population (i.e. Paleoamericans).
Currat and co-workers [51–53] showed that even the presence of
low values of genetic exchange between local and ‘‘invading’’
populations can result in a major contribution of local neutral
genes into the invader gene pool, and almost exclusively in this
direction. This is important here because even if the Paleoamer-
icans were replaced by a population of Amerindian morphology,
mtDNA variation found in extant populations (of Amerindian
morphology) could have been originated in Paleoamerican
populations. These arguments contrast with the common
suggestion that if a major replacement of Paleoamericans by
Amerindians occurred during the Middle or Earlier Late
Holocene [7–9], the variation among Later Late Holocene groups
would not be relevant to discuss the early peopling.
Finally, we suggest that the lack of concordance between
molecular evidence and morphological data could be explained if
we take into consideration that craniofacial variation among
human populations could mainly result from the action of non-
random factors such as directional selection and phenotypic
plasticity. These processes are suggested by the correspondence
between craniofacial morphology and ecological variables (i.e. diet
and climate) in South American samples. Specifically, Perez and
Monterio [54] found a strong correspondence between brachyce-
phalic crania and farmer groups, while the dolicocephalic ones
associated with hunter-gatherers. If we take into account that all
samples assigned as Paleoamericans belong to hunter-gatherers,
and that changes in diet (i.e. production of domesticated resources)
and food preparation technology (i.e. pottery and grinding use)
took place between 8,000 and 2,000 years BP [55,56], the
influence of ecological variables could be important to explain the
morphological differences between Paleoamericans and Amerin-
dians. A similar trend of change in craniofacial shape—mainly in
the facial shape, but also in the cranial vault—has been associated
with ecological factors in other world regions. Such factors include
differences in the diet or masticatory activities related to the
economies of hunter-gatherers vs. farmers [57–61]. The impor-
tance of environment-dependent phenotype expression during the
ontogeny has been suggested to explain this morphological
variation. Directional selection and/or phenotypic plasticity can
generate fast morphological changes and account for the
craniofacial variation found among American populations
[7,54]. All this stresses the importance of elucidating the probable
sources of variation of craniofacial morphology, including random
and non-random factors, before being able to affirm that different
traits reflect different ancestry.
Although we need more studies to discuss the alternative
hypotheses about the discrepancy between mtDNA and cranio-
metrical variation in South America, other molecular analyses
suggest that such discrepancies could be mainly the result of non-
random factors acting over the morphological divergence.
Specifically, the Native American Y chromosome haplogroups
Figure 4. Procrustes fit of geographic coordinates and temporal data (circle) onto the position of mean facial shape for each EastCentral Argentina sample on relative warps 1 and 2.doi:10.1371/journal.pone.0005746.g004
American Crania and DNA Data
PLoS ONE | www.plosone.org 8 May 2009 | Volume 4 | Issue 5 | e5746
are also originated in Central Asia and share similar coalescent
dates, indicating that they have a single ancestral gene pool [12–
14,37]. The American groups also share alleles at specific
microsatellite loci that are not found in any Old World
populations [14]. Therefore, the chromosomical and microsatellite
loci molecular studies, along with the evidence that the Early
Holocene samples with Paleoamerican cranial morphology carried
the same mtDNA haplogroups as modern Amerindians, suggest
that the Holocene East Central Argentina human populations did
not have two different extra-American origins but a single one in
Central or Northeast Asia.
In light of the results that were discussed here, the craniometric
variation found in samples from other South American regions
also dated ca. 8,000 to 5,000 years BP [18], such as the Bogota
savannah in Colombia [9] and Lagoa Santa in Brazil [8], should
be carefully interpreted. This is particularly true for the samples
from the Bogota savannah, with radiocarbon dates performed on
human bones similar to Arroyo Seco 2 [18], and displaying
morphologies attributable to Paleoamericans. The craniofacial
comparison of these samples with samples displaying Amerindian
like morphologies—as those assigned to Later Late Holocene from
Peru—has been used up till now as evidence supporting the
existence of two main biological components in the peopling of
America [9]. However, craniofacial morphology in these regions
could be also related to non-random factors, since the diachronic
samples compared (e.g. Tequendama or Lagoa Santa vs. Peru
sample; [8,9]) do not belong to the same area but come from
regions not only geographically distant but also ecologically
different (i.e. hunter-gatherers vs. farmer groups respectively).
The analysis of processes and events of population diversifica-
tion involved in the American peopling has proven to be very
difficult but could be addressed through the study of regional
population histories, integrating diachronic skeletal samples with
chronological control, mtDNA data of ancient and extant
populations, archaeological records and ecological information,
as well as quantitative descriptions of morphological variation.
Following this approach we show here that even when the oldest
samples display traits attributable to Paleoamerican crania, they
present the same mtDNA haplogroups as later populations with
Amerindian morphology. A possible explanation for these results
could be that the craniofacial differentiation was a local
phenomenon resulting from random (i.e. genetic drift) and non-
Figure 5. Relative Warp analysis of the cranial vault. A) Ordination of the individuals from East Central samples in the space of the first tworelative warps, based on the partial warp and uniform component variables calculated for the vault. The circles ($) represent the individuals for LaterLate Holocene sample (llH), stars (w) represent the individuals for each Earlier Late Holocene sample (elH), and number sign (#) represents theindividual for the Early Holocene sample from Arroyo Seco 2 (eH). The ellipses are the 95% confidence intervals of Earlier and Later Late Holocenemean samples. B and C) Vault shape changes implied by variation along the first relative warp axis is shown as deformation grids. Grids show shapechanges for negative (B) and positive (C) deviations from the mean for RW1.doi:10.1371/journal.pone.0005746.g005
American Crania and DNA Data
PLoS ONE | www.plosone.org 9 May 2009 | Volume 4 | Issue 5 | e5746
random factors (e.g. selection and plasticity). Local processes of
morphological differentiation in America are a probable scenario
if we take into consideration the rapid peopling and the great
ecological diversity of this continent.
Acknowledgments
The authors would like to thank Hector Pucciarelli (Division Antropologıa,
Facultad de Ciencias Naturales y Museo of La Plata [Argentina]), Ines
Baffi and Leandro Luna (Museo Etnografico ‘‘J. B. Ambrosetti’’ of Buenos
Aires [Argentina]) for granting access to the human skeletal collections
under their care. Hector Pucciarelli, Gonzalo Figueiro and Nelson
Fagundes provided insightful comments on previous versions of the
manuscript. We are deeply indebted to Dennis O’Rourke and two
anonymous reviewers who contributed greatly to improve the content of
the manuscript. We also thank to Grammar101 editors, Cecilia Morgan
and Amelia Barreiro for help with the English version of the manuscript.
Marina Perez helped with the drawings.
Author Contributions
Conceived and designed the experiments: SIP VB PNG. Performed the
experiments: SIP. Analyzed the data: SIP. Contributed reagents/
materials/analysis tools: GP. Wrote the paper: SIP VB PNG MS.
References
1. Perez SI, Bernal V, Gonzalez PN (2007) Morphological differentiation of
aboriginal human populations from Tierra del Fuego (Patagonia): implicationsfor South American peopling. Am J Phys Anthropol 133: 1067–1079.
2. Borrero LA (1999) The prehistoric exploration and colonization of Fuego-
Patagonia. J World Prehistory 13: 321–355.
3. Imbelloni J (1938) Tabla clasificatoria de los indios. Regiones biologicas y gruposraciales humanos de America. Physis 12: 228–248.
4. Neves WA, Pucciarelli HM (1989) Extra-continental biological relationships of
early South American human remains: a multivariate analysis. Cien Cult 41:
566–575.
5. Hrdlicka A (1912) Early Man in South America. Smithsonian Institution:Bureau of American Ethnology Bulletin 52.
6. Greenberg J, Turner II CG, Zegura SL (1986) The settlement of the Americas: a
comparison of the linguistic, dental and genetic evidence. Curr Anthrop 4:
477–497.
7. Powell JF, Neves WA (1999) Craniofacial morphology of the first Americans:pattern and process in the peopling of the New World. Yearb Phys Anthropol
42: 153–188.
8. Neves WA, Prous A, Gonzalez-Jose R, Kipnis R, Powell J (2003) Early Holocenehuman skeletal remains from Santana do Riacho, Brazil: implications for the
settlement of the New World. J Hum Evol 45: 19–42.
9. Neves WA, Hubbe M, Correal G (2007) Human skeletal remains from Sabana
de Bogota, Colombia: a case of Paleoamerican morphology late survival inSouth America? Am J Phys Anthropol 133: 1080–1098.
10. Neves WA, Hubbe M (2005) Cranial morphology of early Americans from
Lagoa Santa, Brazil: Implications for the settlement of the New World. Proc NatlAcad Sci USA 102: 18309–18314.
11. Gonzalez-Jose R, Gonzalez-Martın A, Hernandez M, Pucciarelli HM, Sardi M,et al. (2003) Craniometric evidence for Palaeoamerican survival in Baja
California. Nature 425: 62–65.
12. Tamm E, Kivisild T, Reidla M, Metspalu M, Smith DG, et al. (2007) Beringianstandstill and spread of Native American founders. PLoS ONE 9: e829.
13. Fagundes NJR, Kanitz R, Eckert R, Valls ACS, Bogo MR, et al. (2008)
Mitochondrial population genomics supports a single pre-Clovis origin with a
coastal route for the peopling of the Americas. Am J Hum Genet 82: 583–592.
14. Goebel T, Waters MR, O’Rourke DH (2008) The Late Pleistocene dispersal ofmodern humans in the Americas. Science 319: 1497–1502.
15. Brown WM, Prager EM, Wang A, Wilson AC (1979) Rapid evolution of animal
mitochondrial DNA. Proc Natl Acad Sci USA 76: 1967–1971.
16. Cavalli-Sforza LL, Menozzi P, Piazza A (1994) The history and geography of
human genes. Princeton: Princeton University Press.
17. Jobling MA, Tyler-Smith C (2003) The human Y chromosome: an evolutionarymarker comes of age. Nat Rev Genet 4: 598–612.
18. Politis G, Prates L, Perez SI (2009) Los primeros Americanos. Una historia
arqueologica y bioantropologica del poblamiento de America. Buenos Aires:EUDEBA.
19. Dillehay TD (2000) The Settlement of the Americas: A New Prehistory. NewYork: Basic books.
20. Correal Urrego G, van der Hammen T (1977) Investigaciones arqueologicasen
los abrigos rocosos del Tequendana. Bogota: Banco Popular.
21. Scabuzzo C, Politis G (2007) Early-Holocene secundary burials in the Pampas ofArgentina. Curr Res Pleistocene 23: 64–66.
22. Bernal V, Gonzalez P, Perez SI, Pucciarelli HM (2008) Entierros humanos del
Noreste de Patagonia: nuevos fechados radiocarbonicos. Magallania 36:
175–183.
23. Politis G, Gutierrez MA, Scabuzzo C (2009) Estado actual de las investigacionesen el sitio 2 de Arroyo Seco (region pampeana, Argentina). Olavarrıa: Serie
Monografica INCUAPA 5, In press.
24. Steele J, Politis G (2009) AMS 14C dating of early human occupation of
southern South America. J Arch Sc 36: 419–429.
25. Adams DC, Rohlf FJ, Slice DE (2004) Geometric morphometrics: ten years ofprogress following the ‘revolution’. Ital J Zool 71: 5–16.
26. Zelditch ML, Swiderski DL, Sheets HD, Fink WL (2004) Geometric
morphometric for Biologists: a primer. London: Academic Press.
27. Buikstra J, Ubelaker D (1994) Standards for data collection from human skeletalremains. Fayetteville: Arkansas Archaeological Survey, Research Series 44.
28. Sheets HD (2003) IMP-Integrated Morphometrics Package. Buffalo: Depart-
ment of Physics, Canisius College.
29. Rohlf FJ (2008) Tps Serie Softwares. New York: Department of Ecology andEvolution, State University of New York Stony Brook.
30. Perez SI, Bernal V, Gonzalez P (2006) Differences between sliding semiland-marks methods: implications for shape analyses of human populations. J Anat
208: 769–784.
31. Peres-Neto PR, Jackson DA (2001) How well do multivariate data sets match?
The advantages of a Procrustean superimposition approach over the Mantel test.Oecologia 129: 169–178.
32. R Development Core Team (2008) R: a language and environment for statisticalcomputing. Vienna: R Foundation for Statistical Computing.
33. Lalueza C, Perez-Perez A, Prats E, Cornudella L, Turbon D (1997) Lack of
founding Amerindian mitochondrial DNA lineages in extinct aborigines from
Tierra de Fuego-Patagonia. Hum Mol Genet 6: 41–46.
34. Moraga LM, Rocco P, Miquel JF, Nervi F, Llop E, et al. (2000) MitochondrialDNA polymorphisms in Chilean aboriginal populations: implications for the
peopling of the southern cone of the continent. Am J Phys Anthropol 113:
19–29.
35. Garcıa-Bour J, Perez-Perez A, Alvarez S, Fernandez A, Lopez-Parra AM, et al.
(2004) Early population differentiation in extinct aborigines from Tierra delFuego-Patagonia: ancient mtDNA sequences and Y-chromosome STR charac-
terization. Am J Phys Anthropol 123: 361–370.
36. Figueiro G, Sans M (2007) Primeros resultados del analisis de ADN mitocondrial
del sitio Arroyo Seco 2, Provincia de Buenos Aires, Argentina. Rev Arg AntropBiol 9(1): 78.
37. Schurr TG (2004) The peopling of the new world: perspectives from molecular
anthropology. Annu Rev Anthropol 33: 551–583.
38. Bailliet G, Rothhammer F, Carnese FR, Bravi CM, Bianchi NO (1994) Founder
mitochondrial haplotypes in Amerindian populations. Am J Hum Genet 55:27–33.
39. Merriwether DA, Rothhammer F, Ferrell RE (1995) Distribution of the fourlineage haplotypes in Native Americans suggests a single wave of migration for
the New World. Am J Phys Anthropol 98: 411–430.
40. Hanihara T (2000) Frontal and facial flatness of mahor human populations.
Am J Phys Anthropol 111: 105–134.
41. Turner II CG (1984) Advances in the dental search for native american origins.
Acta Anthropogenet 8: 23–78.
42. Turner II CG (1987) Late Pleistocene and Holocene population history of EastAsia based on dental variation. Am J Phys Anthropol 73: 305–321.
43. Sardi ML, Pucciarelli HM, Dahinten SL (2001) Evaluacion de la mongolizacionen amerindios. Rev Arg Antrop Biol 3(2): 96.
44. Howells WW (1989) Skull shape and the map. Papers of the Peabody Museum ofArchaeology and Ethnology. Cambridge: Harvard University Press.
45. Brace CL, Nelson AR, Seguchi N, Oe H, Sering L, et al. (2001) Old World
sources of the first New World human inhabitants: A comparative craniofacial
view. Proc Natl Acad Sci USA 98: 10017–10022.
46. Kemp BM, Malhi RS, McDonough J, Bolnick DA, Eshleman JA, et al. (2007)Genetic analysis of Early Holocene skeletal remains from Alaska and its
implications for the settlement of the Americas. Am J Phys Anthropol 132:
605–621.
47. Malhi RS, Kemp BM, Eshleman JA, Cybulski J, Smith DG, et al. (2007)Mitochondrial haplogroup M discovered in prehistoric North Americans.
J Archaeol Sci 34: 642–648.
48. Ruiz-Pesini E, Mishmar D, Brandon M, Procaccio V, Wallace DC (2004) Effects
of purifying and adaptive selection on regional variation in human mtDNA.Science 303: 223–226.
49. Sun C, Kong Q, Zhang Y (2006) The role of climate in human mitochondrialDNA evolution: A reappraisal. Genomics 89: 338–342.
50. Amo T, Brand MD (2007) Were inefficient mitochondrial haplogroups selectedduring migrations of modern humans? A test using modular kinetic analysis of
coupling in mitochondria from cybrid cell lines. Biochem J 404: 345–351.
51. Currat M, Excoffier L (2004) Modern humans did not admix with Neanderthals
during their range expansion into Europe. PLoS Biol 2: 2264–2274.
52. Currat M, Excoffier L (2005) The effect of the Neolithic expansion on Europeanmolecular diversity. Proc R Soc Lond B 272: 679–688.
American Crania and DNA Data
PLoS ONE | www.plosone.org 10 May 2009 | Volume 4 | Issue 5 | e5746
53. Currat M, Ruedi M, Petit RJ, Excoffier L (2008) The hidden side of invasions:
Massive introgression by local genes. Evolution 62: 1908–1920.
54. Perez SI, Monteiro LR (2009) Non-random factors in modern human
morphological diversification: a study of craniofacial variation in southern
South American populations. Evolution Int J Org Evolution 63–4: 978–993.
55. Price TD (2009) Ancient farming in eastern North America. Proc Natl Acad Sci
USA 106: 6427–6428.
56. Berberian EE, Nielsen AE (2001) Historia Argentina prehispanica. Cordoba:
Brujas.
57. Larsen CS (2006) The agricultural revolution as environmental catastrophe:
Implications for health and lifestyle in the Holocene. Quat Internat 150: 12–20.
58. van Vark GN, Kuizenga D, L’Engle Williams F (2003) Kennewick and Luzia:
lessons from the European Upper Paleolithic. Am J Phys Anthropol 121:181–184.
59. Sardi ML, Novellino PS, Pucciarelli HM (2006) Craniofacial morphology in the
Argentine Center-West: Consequences of the transition to food production.Am J Phys Anthropol 130: 333–343.
60. Stynder DD, Ackermann RR, Sealy JC (2007) Craniofacial variation andpopulation continuity during the South African Holocene. Am J Phys Anthropol
134: 489–500.
61. Sardi ML, Ramırez-Rozzi F, Pucciarelli HM (2004) The Neolithic transition inEurope and North Africa. The functional craneology contribution. Anthropol
Anz 62: 120–145.
American Crania and DNA Data
PLoS ONE | www.plosone.org 11 May 2009 | Volume 4 | Issue 5 | e5746