Embed Size (px)
Citation preview
Relationship of Cranial Robusticity to Cranial Form,Geography and Climate in Homo sapiens
Karen L. Baab,1* Sarah E. Freidline,2,3 Steven L. Wang,3 and Timothy Hanson4
1Department of Anatomical Sciences, Stony Brook University Medical Center, Stony Brook, NY 117942Department of Human Evolution, Max-Planck Institute for Evolutionary Anthropology,D-04103 Leipzig, Germany3Department of Anthropology, The Graduate School and University Center/CUNY,New York, NY 10016 & NYCEP4Division of Biostatistics, University of Minnesota, Minneapolis, MN 55455
KEY WORDS geometric morphometrics; cranial morphology; human variation
ABSTRACT Variation in cranial robusticity amongmodern human populations is widely acknowledged butnot well-understood. While the use of ‘‘robust’’ cranialtraits in hominin systematics and phylogeny suggeststhat these characters are strongly heritable, this hypothe-sis has not been tested. Alternatively, cranial robusticitymay be a response to differences in diet/mastication or itmay be an adaptation to cold, harsh environments. Thisstudy quantifies the distribution of cranial robusticity in14 geographically widespread human populations, andcorrelates this variation with climatic variables, neutralgenetic distances, cranial size, and cranial shape. Withthe exception of the occipital torus region, all traits werepositively correlated with each other, suggesting that theyshould not be treated as individual characters. Whilemales are more robust than females within each of thepopulations, among the independent variables (cranial
shape, size, climate, and neutral genetic distances), onlyshape is significantly correlated with inter-population dif-ferences in robusticity. Two-block partial least-squaresanalysis was used to explore the relationship between cra-nial shape (captured by three-dimensional landmarkdata) and robusticity across individuals. Weak supportwas found for the hypothesis that robusticity was relatedto mastication as the shape associated with greater robus-ticity was similar to that described for groups that ateharder-to-process diets. Specifically, crania with moreprognathic faces, expanded glabellar and occipital regions,and (slightly) longer skulls were more robust than thosewith rounder vaults and more orthognathic faces. How-ever, groups with more mechanically demanding diets(hunter-gatherers) were not always more robust thangroups practicing some form of agriculture. Am J PhysAnthropol 141:97–115, 2010. VVC 2009 Wiley-Liss, Inc.
Cranial robusticity in hominins includes aspects ofcranial size, cranial bone thickness, and a suite ofdiscrete characters, such as well-developed supraorbitalelements and midline keeling. Many of the individualcharacters used to assess cranial robusticity in modernhumans are also used as diagnostic characters to distin-guish among Homo taxa and to reconstruct human phy-logeny (e.g., H. erectus; Stringer, 1984; Bilsborough andWood, 1986; Hublin, 1986; Rightmire, 1990; Brauer andMbua, 1992; Wood and Richmond, 2000; Dunsworth andWalker, 2002; Schwartz, 2004; Villmoare, 2005). Cranialrobusticity in some populations of modern humans, par-ticularly Aboriginal Australians, has also been used tosupport a close relationship with H. erectus from Java(e.g., Ngandong) under the multiregional model ofmodern human origins (Wolpoff et al., 1984; Frayeret al., 1993; Wolpoff, 1999). The assumption underlyingthese practices is that these traits have a strong genetic/hereditary component. However, it is also possible thatcranial robusticity is influenced by functional or climaticvariables.Previous work by Lahr and Wright (1996) found that
cranial robusticity is strongly influenced by the size,and, to a lesser extent, the shape of the cranium. Thishas been interpreted as supporting integration of cranialform and robusticity (Lahr and Wright, 1996; Churchill,1998). At the same time, numerous studies have shownthat cranial form is relatively homogeneous within singlemodern human populations (Howells, 1973, 1989; Hani-
hara, 1996; Hennessy and Stringer, 2002; Strand Vio-darsdottir et al., 2002), and that cranial shape inhumans reflects neutral genetic distances among pres-ent-day populations (Roseman, 2004; Harvati andWeaver, 2006a,b; Smith et al., 2007). Taken together,these two observations suggest that cranial robusticitymay track modern human population history. This wouldindicate that cranial robusticity is not under strongselection within H. sapiens.Models derived from quantitative genetics are fre-
quently applied to cranial morphometric data to assess ahypothesis of neutral evolution (e.g., Roseman, 2004;Roseman and Weaver, 2004; Harvati and Weaver,2006a,b; Smith et al., 2007; Weaver et al., 2007). Thisstudy extends this practice to traits that capture cranial
Grant sponsor: NSF; Grant numbers: BCS 04-24262, DGE 03-33415, DBI 96-02234. The L.S.B. Leakey Foundation, Sigma XiFoundation.
*Correspondence to: Karen Baab, Department of Anatomical Sci-ences, Stony Brook University Medical Center, Stony Brook, NY11794. E-mail: [email protected]
Received 30 September 2008; accepted 12 May 2009
DOI 10.1002/ajpa.21120Published online 24 June 2009 in Wiley InterScience
(www.interscience.wiley.com).
VVC 2009 WILEY-LISS, INC.
AMERICAN JOURNAL OF PHYSICAL ANTHROPOLOGY 141:97–115 (2010)
robusticity. The null hypothesis that will be tested hereis that neutral evolutionary processes (particularly theeffects of genetic drift) were responsible for the globalpatterning of cranial robusticity in modern humans. Theprimary assumptions of this model are that all geneticvariance in a quantitative trait is 1) additive (no domi-nance or epistatic effects), and 2) selectively neutralwithin and among populations (Lande, 1992). Deviationsfrom the null hypothesis of neutral evolution implyselection on these characters.Ordinal data cannot simply be slotted into quantita-
tive genetics models in a manner identical to morpho-metric data due to differences in the assumptions under-lying categorical data. Fortunately, a similar model hasbeen advanced for dichotomous or polychotomous charac-ters, such as those used here to assess cranial robustic-ity. In this case, a discontinuous trait is assumed to havean underlying continuous character, termed the liabilityor the latent variable, with one or more thresholds(Wright, 1934; Falconer, 1965, 1989; Gianola, 1979, 1982;Falconer and Mackay, 1996; Lynch and Walsh, 1998;Konigsberg, 2000; Leigh et al., 2003). The threshold canbe viewed as a certain accumulation of genetic and possi-bly environmental effects; when the liability exceeds thethreshold value, one version of the trait is expressedwhile below this value an alternate expression of thetrait occurs. To simplify this model, the distribution ofthis liability is assumed to be normally distributed inthe population (Konigsberg, 2000), an assumption whichis reasonable if the liability is multifactorial, with multi-ple genes contributing to the expression of the trait, andall factors having a relatively small effect (Falconer andMackay, 1996). As mentioned above, the quantitativegenetics model used here assumes an equal and additivegenetic effects model. Although this assumption has notbeen evaluated explicitly for the characters being inves-tigated here, it has been suggested that this assumptionis met generally for morphological features (Lopez-Fan-jul et al., 2003). In regards to discrete cranial characters,Cheverud and Buikstra (1981a,b, 1982) found that epi-static traits have higher heritabilities than linear mea-surements in rhesus macaques. In contrast, Carson(2006a) found generally low heritabilities for nonmetrictraits in a sample of modern human crania from Hall-statt, Austria whose family relationships were known.However, in both cases the discrete/meristic featureswere not identical to those examined here. Rather thediscrete characters examined in these other studies werestandard epistatic traits including accessory ossicles,foramina, and hyperostotic features, all with fairly clearcut categories of expression. Interestingly, one trait thatCarson (2006a) investigated, the zygomaxillary tubercle,was also examined here. When measured as a dichoto-mous variable, this trait had one of the highest narrowsense heritabilities (0.49) of the traits examined; itsvalue compared favorably with heritabilities for cranio-metric measures from the same sample presented inCarson (2006b).In contrast to this nonadaptive model, several studies
have linked a robust cranial phenotype to variation inmasticatory (Endo, 1966, 1970; Russell, 1985) and para-masticatory (Spencer and Ungar, 2000) stresses.Mechanically demanding dietary regimes have beenlinked with variation in modern human craniofacial mor-phology (Larsen, 1981, 1982; Spencer and Demes, 1993;Spencer and Ungar, 2000), including the appearance ofcertain ‘‘robust’’ characters such as sagittal keeling and
supraorbital ridges (Hrdlicka, 1910; Hilloowala andTrent, 1987; Lahr, 1995; Hernandez et al., 1997). Thetransition from a hunter-gather to an agricultural life-style is characterized by a reduction in overall cranialrobusticity and the size of the facial skeleton, the masti-catory complex, and the occipital region, as well asshorter, rounder cranial vaults (e.g, Carlson and vanGerven, 1977, 1979; Larsen, 1982, 1995; y’Edynak andFleisch, 1983; Sardi et al., 2006). These studies proposedthat these changes were mainly a biomechanicalresponse of the skull to reduced muscular activityrelated to a softer (i.e., agricultural) diet. Experimentalevidence from other mammals has also supported theinfluence of diet on craniofacial morphology (Ciochonet al., 1997; Bresin et al., 1999; Lieberman et al., 2004).A more general argument has also been made that thesupraorbital region may be better developed in primatetaxa that generate greater forces in this region duringmastication (Russell, 1985; Wolpoff, 1985; Booksteinet al., 1999; but see Hylander et al., 1991; Ravosa, 1991;Ross and Hylander, 1996). It is therefore possible thatdifferences in masticatory stress may influence the sizeand morphology of the facial, supraorbital, and occipitalregions that encompass many of the ‘‘robust’’ charactersconsidered in this study.Climate, particularly very cold conditions, appears to
influence overall craniofacial morphology (Harvati andWeaver, 2006a,b; Gilligan and Bulbeck, 2007), especiallyin regards to nasal morphology (Carey and Steegmann,1981; Franciscus and Long, 1991; Hernandez et al.,1997; Lalueza et al., 1997; Roseman and Weaver, 2004).Studies of interpopulation variation in South Americahave also found that indigenous people from southernPatagonia and Tierra del Fuego (a cold, harsh environ-ment) are more robust than South American populationsat higher, warmer latitudes, concluding that cranialrobusticity may be a response to cold climates (Bernalet al., 2006; Perez et al., 2007). The mechanism proposedby Bernal et al. (2006) and Perez et al. (2007) relates toincreased hormone levels in cold adapted populations asdemonstrated by Leonard et al. (2002), which may resultin greater cortical bone growth throughout the organism.Similarly, Bulbeck (2001) reasoned that in situ evolutionof cranial robusticity in Late Pleistocene/Holocene Aus-tralian fossils was an adaptation to the cold, extremeenvironmental conditions present in western New SouthWales during the Last Glacial Maximum.This study represents the first attempt to investigate
the influence of numerous independent factors (e.g., cli-mate, neutral genetic distances, cranial size, and cranialshape) on the expression of cranial robusticity within abroad geographic sample of modern humans. The resultsof this study will help inform our interpretations of vari-ation in cranial robusticity in both modern and extincthominin species.
MATERIALS AND METHODS
Sample
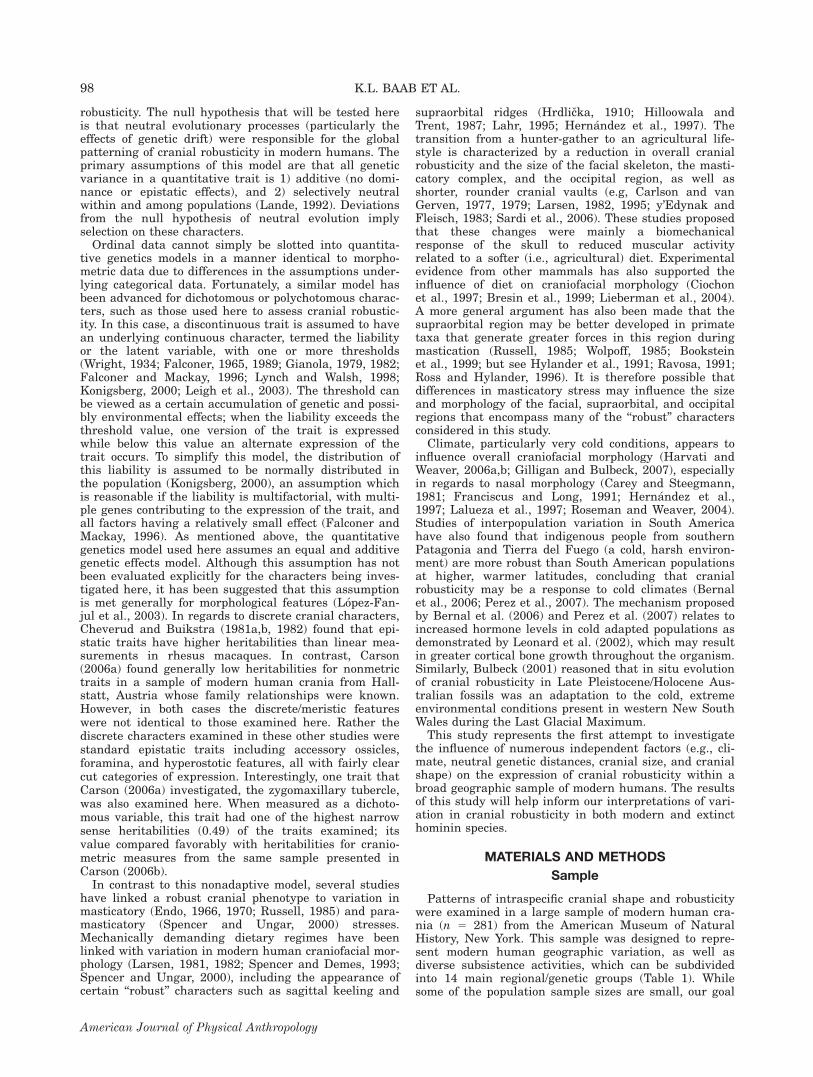
Patterns of intraspecific cranial shape and robusticitywere examined in a large sample of modern human cra-nia (n 5 281) from the American Museum of NaturalHistory, New York. This sample was designed to repre-sent modern human geographic variation, as well asdiverse subsistence activities, which can be subdividedinto 14 main regional/genetic groups (Table 1). Whilesome of the population sample sizes are small, our goal
98 K.L. BAAB ET AL.
American Journal of Physical Anthropology
was to sample broadly on a global scale rather than fo-cusing on intrapopulation variation. The small size ofthe Tierra del Fuego sample is particularly regrettable,but this population is essential because it is one of twocold-adapted groups.All specimens were adult, and males and females were
approximately equally represented. Some of the discrete‘‘robusticity’’ characters analyzed in this study are com-monly used to differentiate between male and femalecrania, such as the development of the supraorbital andoccipital regions. To avoid circularity, overall cranial sizeand the size of the mastoid process were used as indica-tors of sex because they were not scored as robusticitytraits, and mandibles were used to confirm these assess-ments when present (most crania are not associatedwith postcranial remains). At least two observersassigned sex to each specimen. In those few cases wheretheir assessments disagreed, sex was categorized asunknown. In addition, a few populations (Mongolians,Grand Gulch, and Australians) were sexed independ-
ently at an earlier time. There is little or no informationregarding how these original sex assignments weredetermined and could be similarly based on cranial fea-tures. In the rare instances when there was disagree-ment between our assessments and those provided, ourstook precedence. However, the high degree of accord pro-vided additional independent confirmation of our sexassignments. Casts of several prehistoric (Upper Paleo-lithic or Neolithic) individuals were included in the anal-ysis when sufficiently complete.
Data collection
Morphological data. Two types of data were collectedfrom each specimen. Eleven discrete traits were scoredby a single observer (SF) for all specimens (Table 2 andFig. 1). Character states for eight of the traits weredefined previously by Lahr (1996) and Lahr and Wright(1996), while the other three, the malar tubercle, supra-mastoid crest, and anterior mastoid tubercle, were
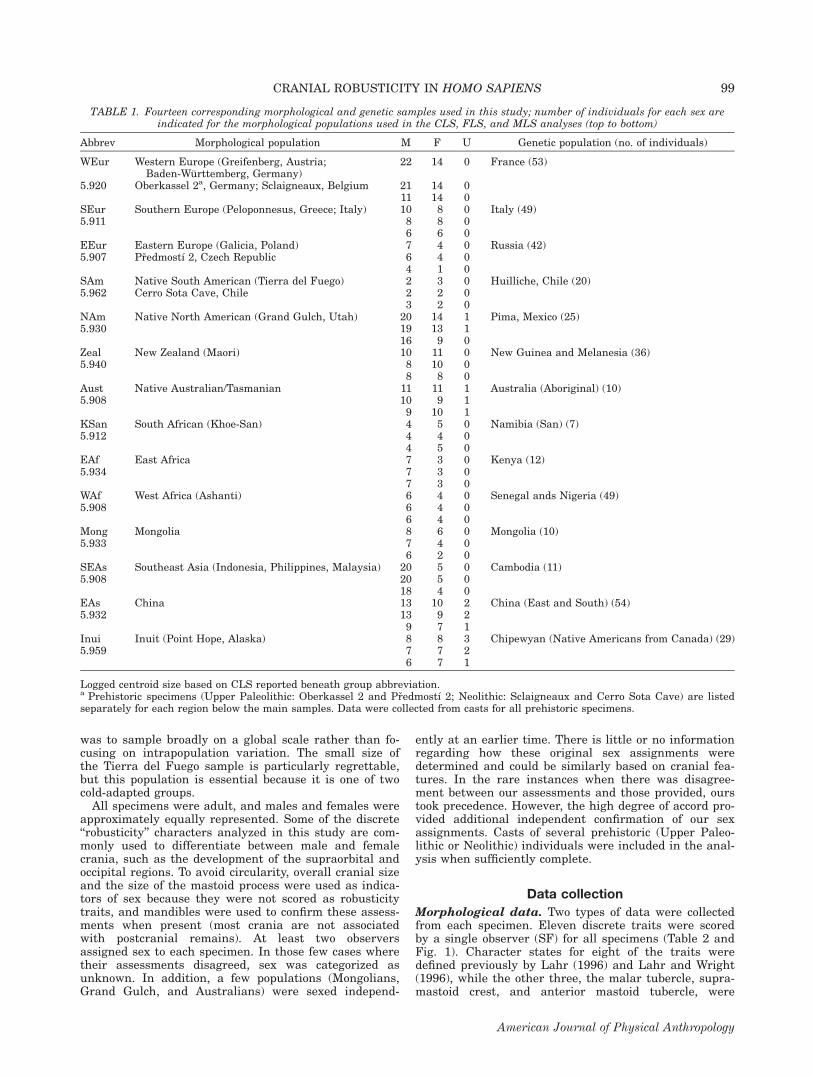
TABLE 1. Fourteen corresponding morphological and genetic samples used in this study; number of individuals for each sex areindicated for the morphological populations used in the CLS, FLS, and MLS analyses (top to bottom)
Abbrev Morphological population M F U Genetic population (no. of individuals)
WEur Western Europe (Greifenberg, Austria;Baden-Wurttemberg, Germany)
22 14 0 France (53)
5.920 Oberkassel 2a, Germany; Sclaigneaux, Belgium 21 14 011 14 0
SEur Southern Europe (Peloponnesus, Greece; Italy) 10 8 0 Italy (49)5.911 8 8 0
6 6 0EEur Eastern Europe (Galicia, Poland) 7 4 0 Russia (42)5.907 Predmostı 2, Czech Republic 6 4 0
4 1 0SAm Native South American (Tierra del Fuego) 2 3 0 Huilliche, Chile (20)5.962 Cerro Sota Cave, Chile 2 2 0
3 2 0NAm Native North American (Grand Gulch, Utah) 20 14 1 Pima, Mexico (25)5.930 19 13 1
16 9 0Zeal New Zealand (Maori) 10 11 0 New Guinea and Melanesia (36)5.940 8 10 0
8 8 0Aust Native Australian/Tasmanian 11 11 1 Australia (Aboriginal) (10)5.908 10 9 1
9 10 1KSan South African (Khoe-San) 4 5 0 Namibia (San) (7)5.912 4 4 0
4 5 0EAf East Africa 7 3 0 Kenya (12)5.934 7 3 0
7 3 0WAf West Africa (Ashanti) 6 4 0 Senegal ands Nigeria (49)5.908 6 4 0
6 4 0Mong Mongolia 8 6 0 Mongolia (10)5.933 7 4 0
6 2 0SEAs Southeast Asia (Indonesia, Philippines, Malaysia) 20 5 0 Cambodia (11)5.908 20 5 0
18 4 0EAs China 13 10 2 China (East and South) (54)5.932 13 9 2
9 7 1Inui Inuit (Point Hope, Alaska) 8 8 3 Chipewyan (Native Americans from Canada) (29)5.959 7 7 2
6 7 1
Logged centroid size based on CLS reported beneath group abbreviation.a Prehistoric specimens (Upper Paleolithic: Oberkassel 2 and Predmostı 2; Neolithic: Sclaigneaux and Cerro Sota Cave) are listedseparately for each region below the main samples. Data were collected from casts for all prehistoric specimens.
99CRANIAL ROBUSTICITY IN HOMO SAPIENS
American Journal of Physical Anthropology
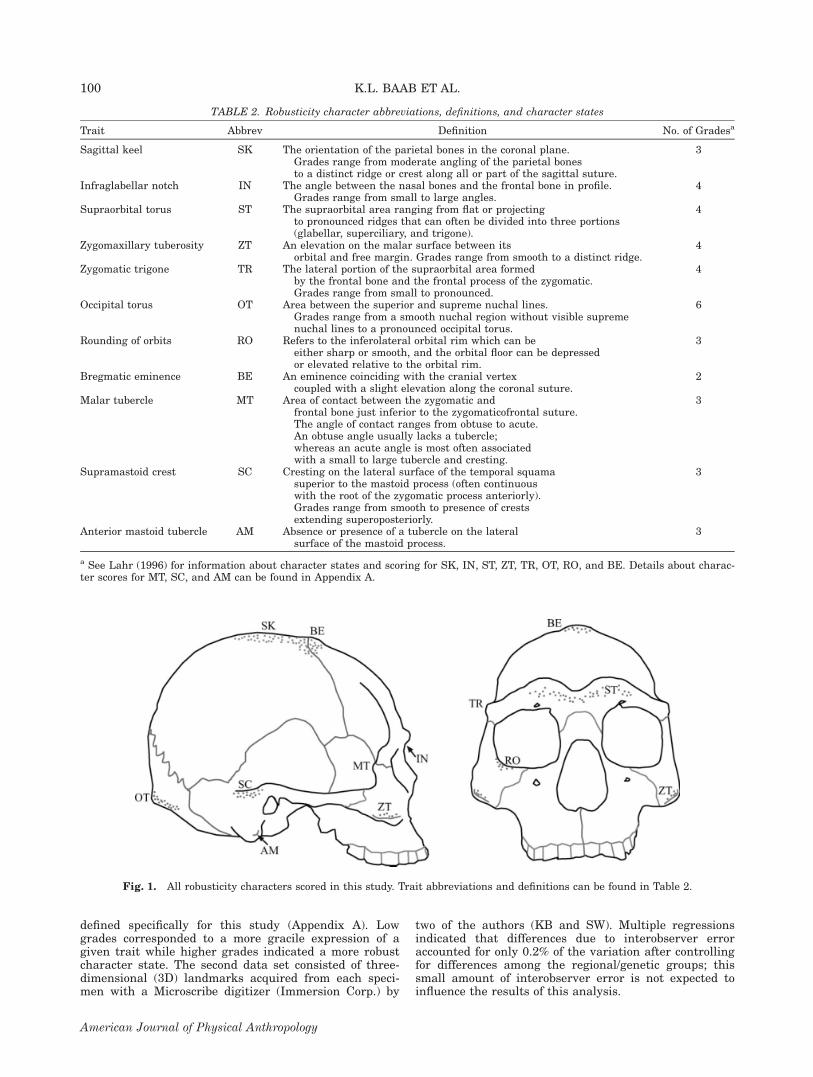
defined specifically for this study (Appendix A). Lowgrades corresponded to a more gracile expression of agiven trait while higher grades indicated a more robustcharacter state. The second data set consisted of three-dimensional (3D) landmarks acquired from each speci-men with a Microscribe digitizer (Immersion Corp.) by
two of the authors (KB and SW). Multiple regressionsindicated that differences due to interobserver erroraccounted for only 0.2% of the variation after controllingfor differences among the regional/genetic groups; thissmall amount of interobserver error is not expected toinfluence the results of this analysis.
Fig. 1. All robusticity characters scored in this study. Trait abbreviations and definitions can be found in Table 2.
TABLE 2. Robusticity character abbreviations, definitions, and character states
Trait Abbrev Definition No. of Gradesa
Sagittal keel SK The orientation of the parietal bones in the coronal plane.Grades range from moderate angling of the parietal bonesto a distinct ridge or crest along all or part of the sagittal suture.
3
Infraglabellar notch IN The angle between the nasal bones and the frontal bone in profile.Grades range from small to large angles.
4
Supraorbital torus ST The supraorbital area ranging from flat or projectingto pronounced ridges that can often be divided into three portions(glabellar, superciliary, and trigone).
4
Zygomaxillary tuberosity ZT An elevation on the malar surface between itsorbital and free margin. Grades range from smooth to a distinct ridge.
4
Zygomatic trigone TR The lateral portion of the supraorbital area formedby the frontal bone and the frontal process of the zygomatic.Grades range from small to pronounced.
4
Occipital torus OT Area between the superior and supreme nuchal lines.Grades range from a smooth nuchal region without visible supremenuchal lines to a pronounced occipital torus.
6
Rounding of orbits RO Refers to the inferolateral orbital rim which can beeither sharp or smooth, and the orbital floor can be depressedor elevated relative to the orbital rim.
3
Bregmatic eminence BE An eminence coinciding with the cranial vertexcoupled with a slight elevation along the coronal suture.
2
Malar tubercle MT Area of contact between the zygomatic andfrontal bone just inferior to the zygomaticofrontal suture.The angle of contact ranges from obtuse to acute.An obtuse angle usually lacks a tubercle;whereas an acute angle is most often associatedwith a small to large tubercle and cresting.
3
Supramastoid crest SC Cresting on the lateral surface of the temporal squamasuperior to the mastoid process (often continuouswith the root of the zygomatic process anteriorly).Grades range from smooth to presence of crestsextending superoposteriorly.
3
Anterior mastoid tubercle AM Absence or presence of a tubercle on the lateralsurface of the mastoid process.
3
a See Lahr (1996) for information about character states and scoring for SK, IN, ST, ZT, TR, OT, RO, and BE. Details about charac-ter scores for MT, SC, and AM can be found in Appendix A.
100 K.L. BAAB ET AL.
American Journal of Physical Anthropology
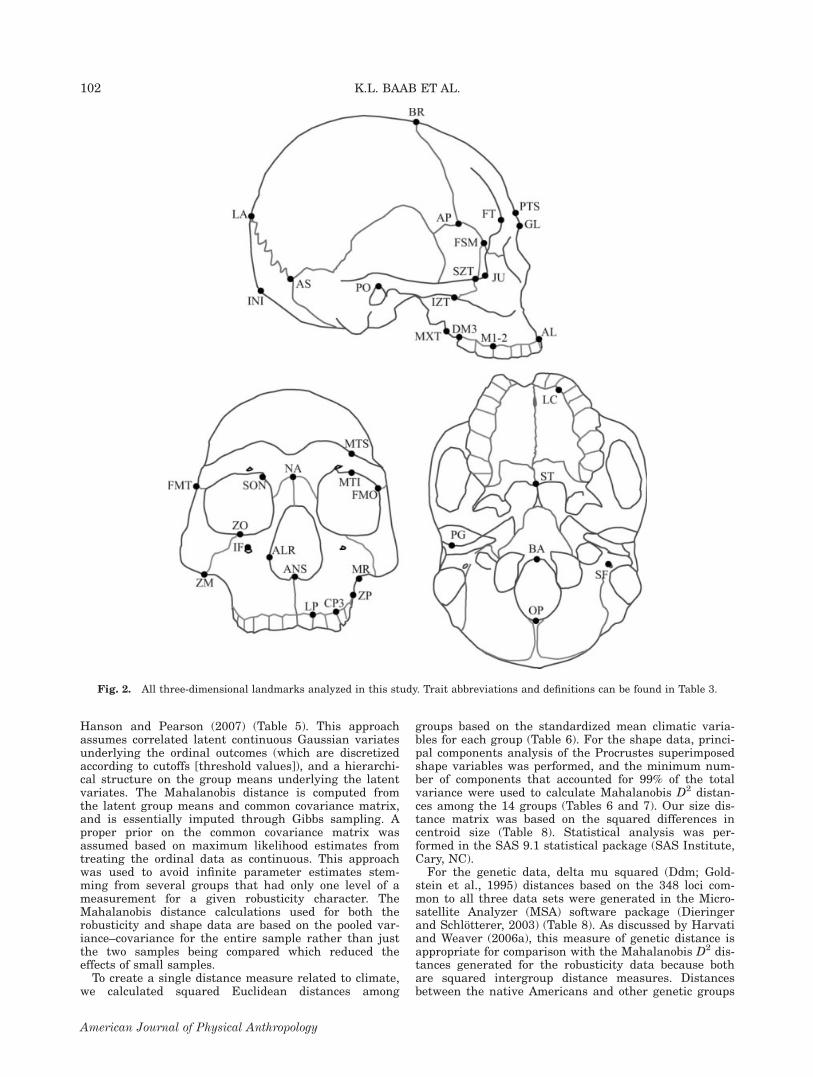
For the shape data, all missing bilateral landmarkswere reconstructed by reflecting their antimeres acrossthe midsagittal line (reflected relabelling; Mardia et al.,2000; Harvati, 2003; McNulty, 2003; Gunz and Harvati,2007); all other landmarks were averaged with theirreflected configurations to remove bilateral asymmetry.For each subset of landmarks analyzed, the data weresuperimposed using generalized Procrustes analysis(GPA; Gower, 1975; Rohlf and Slice, 1990; Rohlf, 1999),thereby removing the effects of scale, translation, andorientation. GPA was performed in Morpheus et al.(Slice, 1998). Statistical analysis was then performed onthe Procrustes superimposed landmark data. Centroidsize, the square root of the sum of squared distancesfrom each landmark to the centroid, was calculated foreach specimen; logged centroid size was used as a proxyfor overall size in subsequent analyses (Table 1). Threedistinct subsets of landmarks were analyzed: cranial(CLS), masticatory (MLS), and facial (FLS) (Table 3 andFig. 2). The MLS consisted of 20 landmarks thatreflected the constrained lever model of mastication(Greaves, 1978; Spencer and Demes, 1993; Spencer,1998, 1999). These landmarks were identical to those ofSingleton (2005) with the addition of frontotemporale toreflect the anterior position of the temporalis muscle, amajor muscle of mastication. Singleton (2005) demon-strated the utility of this landmark set in elucidating therelationship between craniofacial morphology and masti-cation in mangabey monkeys. In addition, previousresearch indicates that chewing a softer, more processeddiet results in reduction of the facial skeleton in modernhumans, including the lower face, a pattern that shouldbe reflected by this landmark set.Polychoric correlation coefficients were calculated
among all of the robusticity variables to investigate pat-terns of covariation among the various discrete robusticitycharacters. Polychoric correlations are maximum likeli-hood estimates of the product-moment correlations amongordered categorical variables, assuming an underlyingbivariate normal distribution for the variables (SAS Insti-tute, 2003). The polychoric correlation (equivalent to a tet-rachoric correlation for dichotomous variables) is the pre-ferred measure of association between two continuouscharacters (Krzanowski, 2000) and has been used previ-ously in paleoanthropology in similar contexts (Konigs-berg et al., 1993; Hanson and Pearson, 2007). Principal
components analysis (PCA) of the standardized robustic-ity scores was used to investigate covariation of thesecharacters across groups. Multiple regression analysiswas then used to assess the relationship between princi-pal component scores and sex (scored as dummy variables;individuals of unknown sex excluded) and logged centroidsize. All statistical analyses were performed in the SAS9.1 statistical package (SAS Institute, Cary, NC).
Climatic and genetic data. Supplementary data on cli-mate and genetic relatedness were collated for each of the14 regional/genetic groups described above. Average val-ues from 1961 to 1990 were used for average temperature,precipitation, vapor pressure, and wind speed (Table 4).Average values for minimum and maximum temperaturewere from either January or July depending on the hemi-sphere. These variables were interpolated from thousandsof local climate stations corresponding to the latitude andlongitude reported in Table 4 (http://www.ipcc-data.org/java/visualisation.html; see New et al., 1999, 2000 formore details). For groups sampled from more than onelocation, such as East Africa, an average location wasdetermined and the climatic values for this location wereused (Harvati and Weaver, 2006a; Smith et al., 2007).Microsatellite data at 783 autosomal microsatellite loci
were genotyped from 1,056 individuals across the world(Cann et al., 2002; Rosenberg et al., 2002, 2005; Rama-chandran et al., 2005). An additional 422 Native Ameri-cans were typed for 678 of the same loci (Wang et al.,2007), resulting in the most complete set of microsatel-lite data available for modern humans. A smaller set ofthese loci were also typed for 10 indigenous Australians(http://research.marshfieldclinic.org/genetics/home/index.asp). Sample sizes for the genetic samples are tabulatedin Table 1. Microsatellites are polymorphic loci in non-coding regions of the genome that consist of repeatingunits of DNA from one to five base pairs long. The num-ber of repeated units varies among individuals and popu-lations; these neutral genetic markers are commonlyused in quantitative genetics to establish a model of neu-tral evolution.
Data analysis
Distance calculations. Interpopulation distances werecalculated for all datasets. Mahalanobis D2 distances forthe robusticity data were computed via method M3 of
TABLE 3. Landmarksa in cranial landmark set (CLS), facial landmark set (FLS), and masticatory landmark set (MLS),with abbreviations
CLS FLS MLS
Inion (INI), lambda (LA),bregma (BR), glabella (GL),alveolare (AL), alare (ALR),zygomaxillare (ZM),zygoorbitale (ZO),supraorbital notches (SON),anterior pterion (AP), porion (PO),asterion (AS), frontomalaretemporale(FMT), opisthion (OP), basion (BA),stylomastoid foramen (SF),maxillary tuberosity (MXT)
Glabella, midlinepost-toral sulcus (PTS), nasion (NA),anterior nasal spine (ANS),alveolare, infraorbital foramen (IF),alare, supraorbital notches,zygomaxillare, zygoorbitale,mid-torus superior (MTS),mid-torus inferior (MTI),frontomalareorbitale (FMO),jugale (JU), frontotemporale (FT),frontmalaretemporale,frontosphenomalare (FSM),malar root (MR), superiorzygomaticotemporal suture (SZT),root of the zygomatic process (ZP),staphylion (ST), maxillary tuberosity
Alveolare, zygomaxillare, frontotemporale,staphylion, postglenoid (PG),inferior zygomaticotemporal suture (IZT),lateral prosthion (LP),lingual canine (LC),canine-P3 contact (CP3),M1-M2 contact (M1-2),distal M3 (DM3)
a Landmark definitions can be found in Baab (2007). Landmarks illustrated in Figure 2.
101CRANIAL ROBUSTICITY IN HOMO SAPIENS
American Journal of Physical Anthropology
Hanson and Pearson (2007) (Table 5). This approachassumes correlated latent continuous Gaussian variatesunderlying the ordinal outcomes (which are discretizedaccording to cutoffs [threshold values]), and a hierarchi-cal structure on the group means underlying the latentvariates. The Mahalanobis distance is computed fromthe latent group means and common covariance matrix,and is essentially imputed through Gibbs sampling. Aproper prior on the common covariance matrix wasassumed based on maximum likelihood estimates fromtreating the ordinal data as continuous. This approachwas used to avoid infinite parameter estimates stem-ming from several groups that had only one level of ameasurement for a given robusticity character. TheMahalanobis distance calculations used for both therobusticity and shape data are based on the pooled var-iance–covariance for the entire sample rather than justthe two samples being compared which reduced theeffects of small samples.To create a single distance measure related to climate,
we calculated squared Euclidean distances among
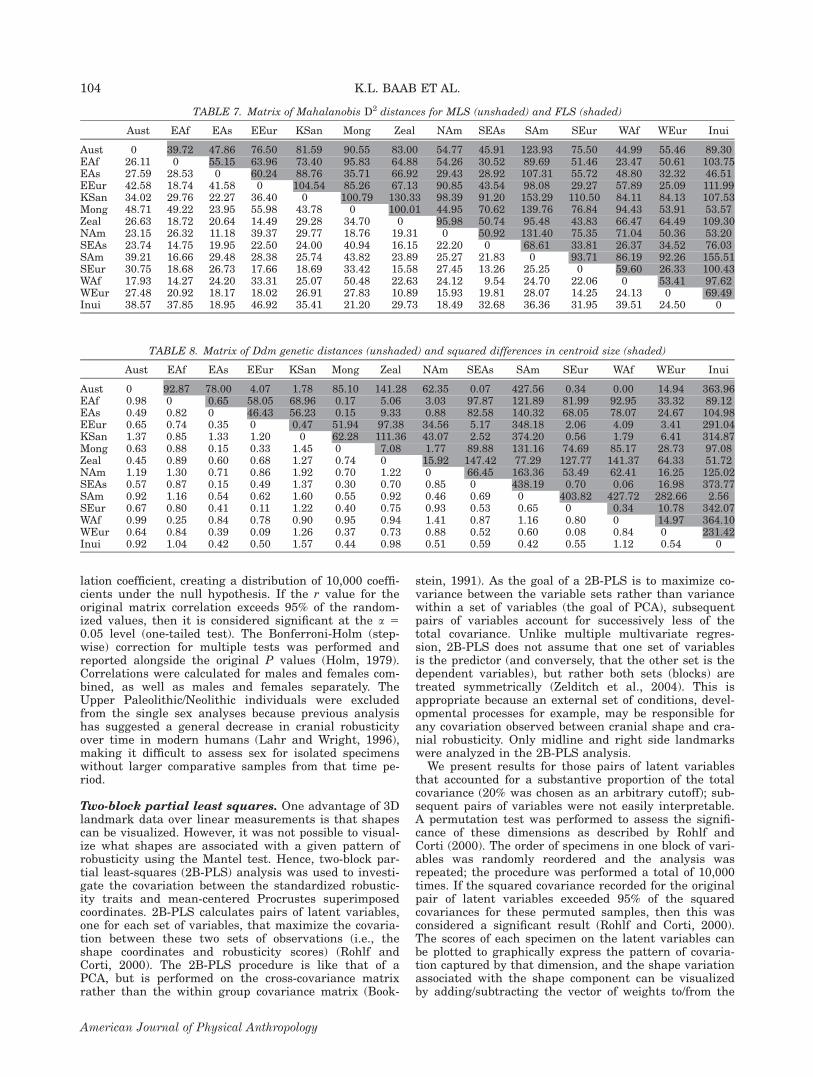
groups based on the standardized mean climatic varia-bles for each group (Table 6). For the shape data, princi-pal components analysis of the Procrustes superimposedshape variables was performed, and the minimum num-ber of components that accounted for 99% of the totalvariance were used to calculate Mahalanobis D2 distan-ces among the 14 groups (Tables 6 and 7). Our size dis-tance matrix was based on the squared differences incentroid size (Table 8). Statistical analysis was per-formed in the SAS 9.1 statistical package (SAS Institute,Cary, NC).For the genetic data, delta mu squared (Ddm; Gold-
stein et al., 1995) distances based on the 348 loci com-mon to all three data sets were generated in the Micro-satellite Analyzer (MSA) software package (Dieringerand Schlotterer, 2003) (Table 8). As discussed by Harvatiand Weaver (2006a), this measure of genetic distance isappropriate for comparison with the Mahalanobis D2 dis-tances generated for the robusticity data because bothare squared intergroup distance measures. Distancesbetween the native Americans and other genetic groups
Fig. 2. All three-dimensional landmarks analyzed in this study. Trait abbreviations and definitions can be found in Table 3.
102 K.L. BAAB ET AL.
American Journal of Physical Anthropology
have been increased due to a population bottleneck thatoccurred early in the settlement of the Americas (Mul-ligan et al., 2004; Wang et al., 2007; Halverson and Bol-nick, 2008). Therefore, analyses were performed bothwith and without the American groups (i.e., Inui, NAm,SAm) (see also Smith et al., 2007). Distance matrices inTables 5–8 correspond to the combined male–femalesample.
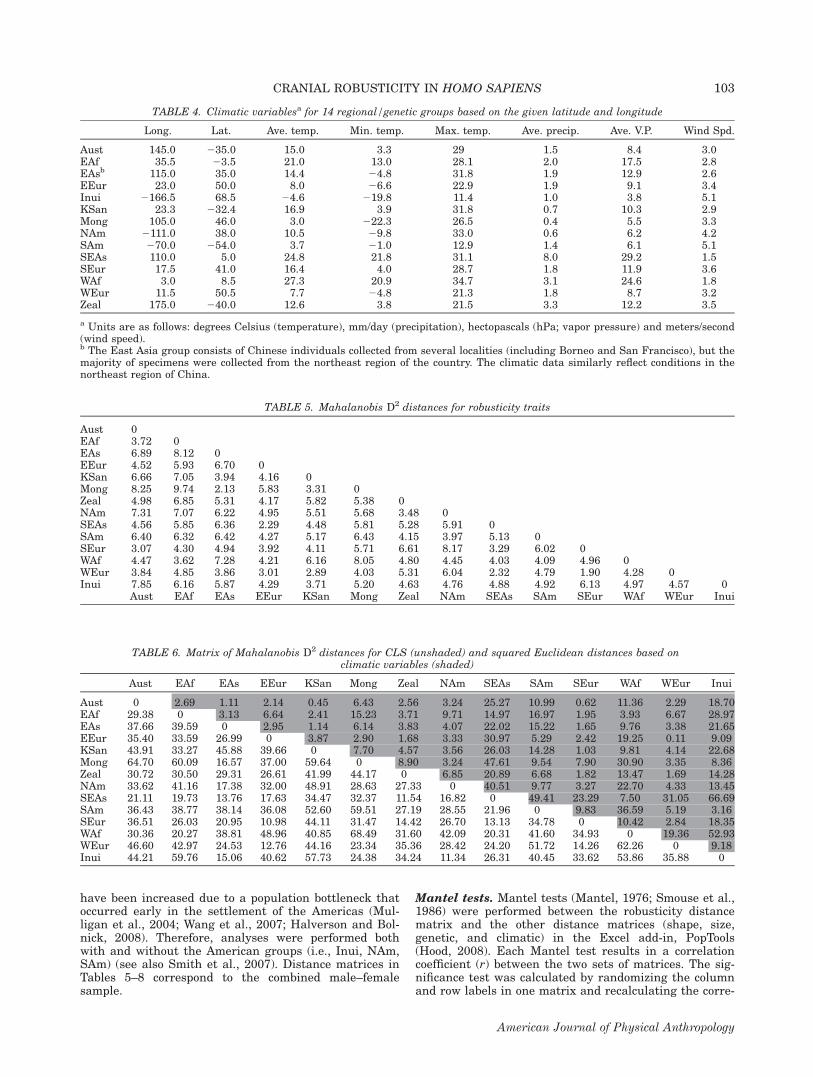
Mantel tests. Mantel tests (Mantel, 1976; Smouse et al.,1986) were performed between the robusticity distancematrix and the other distance matrices (shape, size,genetic, and climatic) in the Excel add-in, PopTools(Hood, 2008). Each Mantel test results in a correlationcoefficient (r) between the two sets of matrices. The sig-nificance test was calculated by randomizing the columnand row labels in one matrix and recalculating the corre-
TABLE 4. Climatic variablesa for 14 regional/genetic groups based on the given latitude and longitude
Long. Lat. Ave. temp. Min. temp. Max. temp. Ave. precip. Ave. V.P. Wind Spd.
Aust 145.0 235.0 15.0 3.3 29 1.5 8.4 3.0EAf 35.5 23.5 21.0 13.0 28.1 2.0 17.5 2.8EAsb 115.0 35.0 14.4 24.8 31.8 1.9 12.9 2.6EEur 23.0 50.0 8.0 26.6 22.9 1.9 9.1 3.4Inui 2166.5 68.5 24.6 219.8 11.4 1.0 3.8 5.1KSan 23.3 232.4 16.9 3.9 31.8 0.7 10.3 2.9Mong 105.0 46.0 3.0 222.3 26.5 0.4 5.5 3.3NAm 2111.0 38.0 10.5 29.8 33.0 0.6 6.2 4.2SAm 270.0 254.0 3.7 21.0 12.9 1.4 6.1 5.1SEAs 110.0 5.0 24.8 21.8 31.1 8.0 29.2 1.5SEur 17.5 41.0 16.4 4.0 28.7 1.8 11.9 3.6WAf 3.0 8.5 27.3 20.9 34.7 3.1 24.6 1.8WEur 11.5 50.5 7.7 24.8 21.3 1.8 8.7 3.2Zeal 175.0 240.0 12.6 3.8 21.5 3.3 12.2 3.5
a Units are as follows: degrees Celsius (temperature), mm/day (precipitation), hectopascals (hPa; vapor pressure) and meters/second(wind speed).b The East Asia group consists of Chinese individuals collected from several localities (including Borneo and San Francisco), but themajority of specimens were collected from the northeast region of the country. The climatic data similarly reflect conditions in thenortheast region of China.
TABLE 5. Mahalanobis D2 distances for robusticity traits
Aust 0EAf 3.72 0EAs 6.89 8.12 0EEur 4.52 5.93 6.70 0KSan 6.66 7.05 3.94 4.16 0Mong 8.25 9.74 2.13 5.83 3.31 0Zeal 4.98 6.85 5.31 4.17 5.82 5.38 0NAm 7.31 7.07 6.22 4.95 5.51 5.68 3.48 0SEAs 4.56 5.85 6.36 2.29 4.48 5.81 5.28 5.91 0SAm 6.40 6.32 6.42 4.27 5.17 6.43 4.15 3.97 5.13 0SEur 3.07 4.30 4.94 3.92 4.11 5.71 6.61 8.17 3.29 6.02 0WAf 4.47 3.62 7.28 4.21 6.16 8.05 4.80 4.45 4.03 4.09 4.96 0WEur 3.84 4.85 3.86 3.01 2.89 4.03 5.31 6.04 2.32 4.79 1.90 4.28 0Inui 7.85 6.16 5.87 4.29 3.71 5.20 4.63 4.76 4.88 4.92 6.13 4.97 4.57 0
Aust EAf EAs EEur KSan Mong Zeal NAm SEAs SAm SEur WAf WEur Inui
TABLE 6. Matrix of Mahalanobis D2 distances for CLS (unshaded) and squared Euclidean distances based onclimatic variables (shaded)
Aust EAf EAs EEur KSan Mong Zeal NAm SEAs SAm SEur WAf WEur Inui
Aust 0 2.69 1.11 2.14 0.45 6.43 2.56 3.24 25.27 10.99 0.62 11.36 2.29 18.70EAf 29.38 0 3.13 6.64 2.41 15.23 3.71 9.71 14.97 16.97 1.95 3.93 6.67 28.97EAs 37.66 39.59 0 2.95 1.14 6.14 3.83 4.07 22.02 15.22 1.65 9.76 3.38 21.65EEur 35.40 33.59 26.99 0 3.87 2.90 1.68 3.33 30.97 5.29 2.42 19.25 0.11 9.09KSan 43.91 33.27 45.88 39.66 0 7.70 4.57 3.56 26.03 14.28 1.03 9.81 4.14 22.68Mong 64.70 60.09 16.57 37.00 59.64 0 8.90 3.24 47.61 9.54 7.90 30.90 3.35 8.36Zeal 30.72 30.50 29.31 26.61 41.99 44.17 0 6.85 20.89 6.68 1.82 13.47 1.69 14.28NAm 33.62 41.16 17.38 32.00 48.91 28.63 27.33 0 40.51 9.77 3.27 22.70 4.33 13.45SEAs 21.11 19.73 13.76 17.63 34.47 32.37 11.54 16.82 0 49.41 23.29 7.50 31.05 66.69SAm 36.43 38.77 38.14 36.08 52.60 59.51 27.19 28.55 21.96 0 9.83 36.59 5.19 3.16SEur 36.51 26.03 20.95 10.98 44.11 31.47 14.42 26.70 13.13 34.78 0 10.42 2.84 18.35WAf 30.36 20.27 38.81 48.96 40.85 68.49 31.60 42.09 20.31 41.60 34.93 0 19.36 52.93WEur 46.60 42.97 24.53 12.76 44.16 23.34 35.36 28.42 24.20 51.72 14.26 62.26 0 9.18Inui 44.21 59.76 15.06 40.62 57.73 24.38 34.24 11.34 26.31 40.45 33.62 53.86 35.88 0
103CRANIAL ROBUSTICITY IN HOMO SAPIENS
American Journal of Physical Anthropology
lation coefficient, creating a distribution of 10,000 coeffi-cients under the null hypothesis. If the r value for theoriginal matrix correlation exceeds 95% of the random-ized values, then it is considered significant at the a 50.05 level (one-tailed test). The Bonferroni-Holm (step-wise) correction for multiple tests was performed andreported alongside the original P values (Holm, 1979).Correlations were calculated for males and females com-bined, as well as males and females separately. TheUpper Paleolithic/Neolithic individuals were excludedfrom the single sex analyses because previous analysishas suggested a general decrease in cranial robusticityover time in modern humans (Lahr and Wright, 1996),making it difficult to assess sex for isolated specimenswithout larger comparative samples from that time pe-riod.
Two-block partial least squares. One advantage of 3Dlandmark data over linear measurements is that shapescan be visualized. However, it was not possible to visual-ize what shapes are associated with a given pattern ofrobusticity using the Mantel test. Hence, two-block par-tial least-squares (2B-PLS) analysis was used to investi-gate the covariation between the standardized robustic-ity traits and mean-centered Procrustes superimposedcoordinates. 2B-PLS calculates pairs of latent variables,one for each set of variables, that maximize the covaria-tion between these two sets of observations (i.e., theshape coordinates and robusticity scores) (Rohlf andCorti, 2000). The 2B-PLS procedure is like that of aPCA, but is performed on the cross-covariance matrixrather than the within group covariance matrix (Book-
stein, 1991). As the goal of a 2B-PLS is to maximize co-variance between the variable sets rather than variancewithin a set of variables (the goal of PCA), subsequentpairs of variables account for successively less of thetotal covariance. Unlike multiple multivariate regres-sion, 2B-PLS does not assume that one set of variablesis the predictor (and conversely, that the other set is thedependent variables), but rather both sets (blocks) aretreated symmetrically (Zelditch et al., 2004). This isappropriate because an external set of conditions, devel-opmental processes for example, may be responsible forany covariation observed between cranial shape and cra-nial robusticity. Only midline and right side landmarkswere analyzed in the 2B-PLS analysis.We present results for those pairs of latent variables
that accounted for a substantive proportion of the totalcovariance (20% was chosen as an arbitrary cutoff); sub-sequent pairs of variables were not easily interpretable.A permutation test was performed to assess the signifi-cance of these dimensions as described by Rohlf andCorti (2000). The order of specimens in one block of vari-ables was randomly reordered and the analysis wasrepeated; the procedure was performed a total of 10,000times. If the squared covariance recorded for the originalpair of latent variables exceeded 95% of the squaredcovariances for these permuted samples, then this wasconsidered a significant result (Rohlf and Corti, 2000).The scores of each specimen on the latent variables canbe plotted to graphically express the pattern of covaria-tion captured by that dimension, and the shape variationassociated with the shape component can be visualizedby adding/subtracting the vector of weights to/from the
TABLE 7. Matrix of Mahalanobis D2 distances for MLS (unshaded) and FLS (shaded)
Aust EAf EAs EEur KSan Mong Zeal NAm SEAs SAm SEur WAf WEur Inui
Aust 0 39.72 47.86 76.50 81.59 90.55 83.00 54.77 45.91 123.93 75.50 44.99 55.46 89.30EAf 26.11 0 55.15 63.96 73.40 95.83 64.88 54.26 30.52 89.69 51.46 23.47 50.61 103.75EAs 27.59 28.53 0 60.24 88.76 35.71 66.92 29.43 28.92 107.31 55.72 48.80 32.32 46.51EEur 42.58 18.74 41.58 0 104.54 85.26 67.13 90.85 43.54 98.08 29.27 57.89 25.09 111.99KSan 34.02 29.76 22.27 36.40 0 100.79 130.33 98.39 91.20 153.29 110.50 84.11 84.13 107.53Mong 48.71 49.22 23.95 55.98 43.78 0 100.01 44.95 70.62 139.76 76.84 94.43 53.91 53.57Zeal 26.63 18.72 20.64 14.49 29.28 34.70 0 95.98 50.74 95.48 43.83 66.47 64.49 109.30NAm 23.15 26.32 11.18 39.37 29.77 18.76 19.31 0 50.92 131.40 75.35 71.04 50.36 53.20SEAs 23.74 14.75 19.95 22.50 24.00 40.94 16.15 22.20 0 68.61 33.81 26.37 34.52 76.03SAm 39.21 16.66 29.48 28.38 25.74 43.82 23.89 25.27 21.83 0 93.71 86.19 92.26 155.51SEur 30.75 18.68 26.73 17.66 18.69 33.42 15.58 27.45 13.26 25.25 0 59.60 26.33 100.43WAf 17.93 14.27 24.20 33.31 25.07 50.48 22.63 24.12 9.54 24.70 22.06 0 53.41 97.62WEur 27.48 20.92 18.17 18.02 26.91 27.83 10.89 15.93 19.81 28.07 14.25 24.13 0 69.49Inui 38.57 37.85 18.95 46.92 35.41 21.20 29.73 18.49 32.68 36.36 31.95 39.51 24.50 0
TABLE 8. Matrix of Ddm genetic distances (unshaded) and squared differences in centroid size (shaded)
Aust EAf EAs EEur KSan Mong Zeal NAm SEAs SAm SEur WAf WEur Inui
Aust 0 92.87 78.00 4.07 1.78 85.10 141.28 62.35 0.07 427.56 0.34 0.00 14.94 363.96EAf 0.98 0 0.65 58.05 68.96 0.17 5.06 3.03 97.87 121.89 81.99 92.95 33.32 89.12EAs 0.49 0.82 0 46.43 56.23 0.15 9.33 0.88 82.58 140.32 68.05 78.07 24.67 104.98EEur 0.65 0.74 0.35 0 0.47 51.94 97.38 34.56 5.17 348.18 2.06 4.09 3.41 291.04KSan 1.37 0.85 1.33 1.20 0 62.28 111.36 43.07 2.52 374.20 0.56 1.79 6.41 314.87Mong 0.63 0.88 0.15 0.33 1.45 0 7.08 1.77 89.88 131.16 74.69 85.17 28.73 97.08Zeal 0.45 0.89 0.60 0.68 1.27 0.74 0 15.92 147.42 77.29 127.77 141.37 64.33 51.72NAm 1.19 1.30 0.71 0.86 1.92 0.70 1.22 0 66.45 163.36 53.49 62.41 16.25 125.02SEAs 0.57 0.87 0.15 0.49 1.37 0.30 0.70 0.85 0 438.19 0.70 0.06 16.98 373.77SAm 0.92 1.16 0.54 0.62 1.60 0.55 0.92 0.46 0.69 0 403.82 427.72 282.66 2.56SEur 0.67 0.80 0.41 0.11 1.22 0.40 0.75 0.93 0.53 0.65 0 0.34 10.78 342.07WAf 0.99 0.25 0.84 0.78 0.90 0.95 0.94 1.41 0.87 1.16 0.80 0 14.97 364.10WEur 0.64 0.84 0.39 0.09 1.26 0.37 0.73 0.88 0.52 0.60 0.08 0.84 0 231.42Inui 0.92 1.04 0.42 0.50 1.57 0.44 0.98 0.51 0.59 0.42 0.55 1.12 0.54 0
104 K.L. BAAB ET AL.
American Journal of Physical Anthropology
consensus landmark configuration. The 2B-PLS and per-mutation tests were performed by a routine written inSAS/IML (Interactive Matrix Language) by K.L.B.;results of the 2B-PLS were confirmed in MorphoJ (Klin-genberg, 2008). Wireframe illustrations were generatedusing Morpheus et al. (Slice, 1998).
Hypothesis testing
By performing Mantel tests on each pair of distancematrices, it was possible to compare the correlationsbetween robusticity and neutral genetic distances, size,shape, and climate. To test the null hypothesis of neutralevolution for cranial robusticity in modern humans, theMahalanobis D2 distances based on robusticity charac-ters were compared to the Ddm distances derived fromthe microsatellite data. If the robusticity traits are thesubject of neutral evolutionary processes, then the dis-tance matrix based on these characters will be stronglycorrelated with that based on the neutral geneticmarkers (microsatellite data) (e.g., Roseman, 2004).Assuming that the morphological features being studiedare adequately described by an equal and additive effectsmodel; then statistically significant deviations from thisneutral pattern indicate selection is acting on thesecharacters.If the expression of robusticity was strongly correlated
with the size or shape of the cranium, this would implyfunctional or developmental integration of robusticityand cranial form. These functional/developmental factorsmay or may not be related to mastication as it is theoret-ically possible that these features form as a way tostrengthen regions of the skull for reasons other thanmastication-related stresses (e.g., protection from inter-individual violence). A functional hypothesis that specifi-cally implicates forces associated with mastication wouldbe supported by a stronger correlation between cranialrobusticity and the MLS rather than CLS as the formermore directly captures morphology associated with mas-tication, although it is also possible that changes in over-all cranial shape may be related to mastication. A strongrelationship between cranial robusticity and the climaticvariables would support the influence of the local envi-ronment on the development of cranial robusticity.
RESULTS
Correlations among robusticity traits
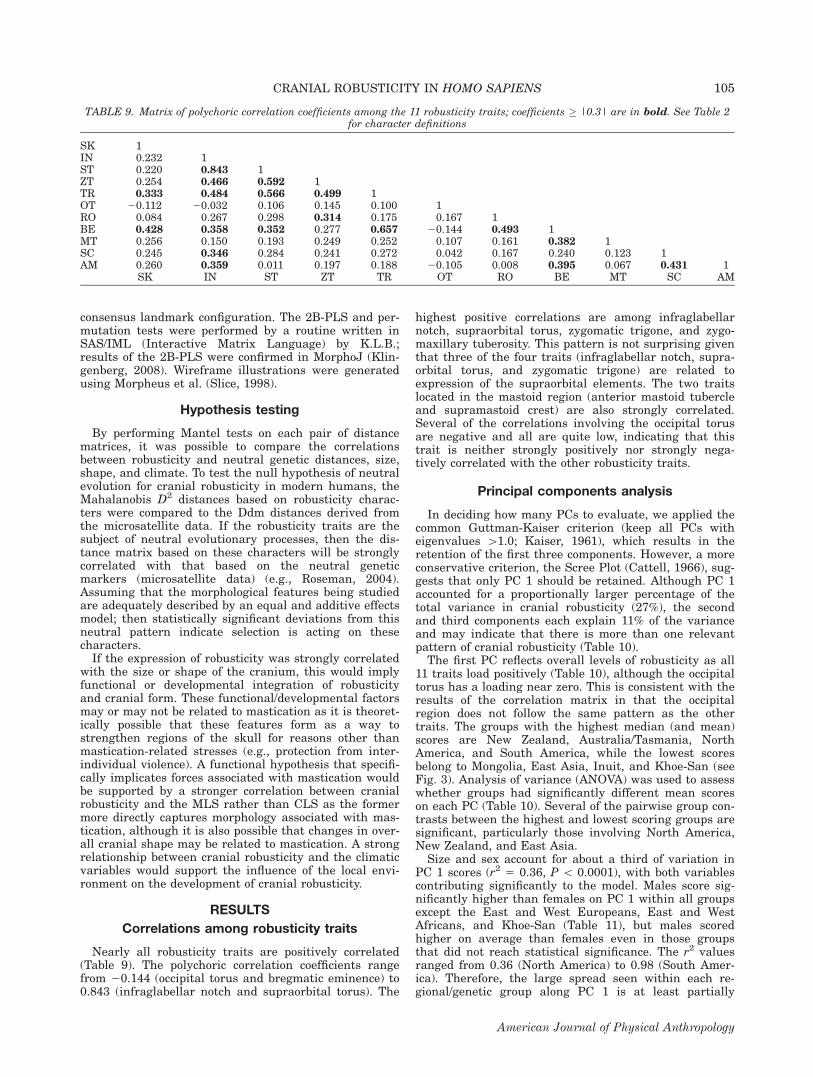
Nearly all robusticity traits are positively correlated(Table 9). The polychoric correlation coefficients rangefrom 20.144 (occipital torus and bregmatic eminence) to0.843 (infraglabellar notch and supraorbital torus). The
highest positive correlations are among infraglabellarnotch, supraorbital torus, zygomatic trigone, and zygo-maxillary tuberosity. This pattern is not surprising giventhat three of the four traits (infraglabellar notch, supra-orbital torus, and zygomatic trigone) are related toexpression of the supraorbital elements. The two traitslocated in the mastoid region (anterior mastoid tubercleand supramastoid crest) are also strongly correlated.Several of the correlations involving the occipital torusare negative and all are quite low, indicating that thistrait is neither strongly positively nor strongly nega-tively correlated with the other robusticity traits.
Principal components analysis
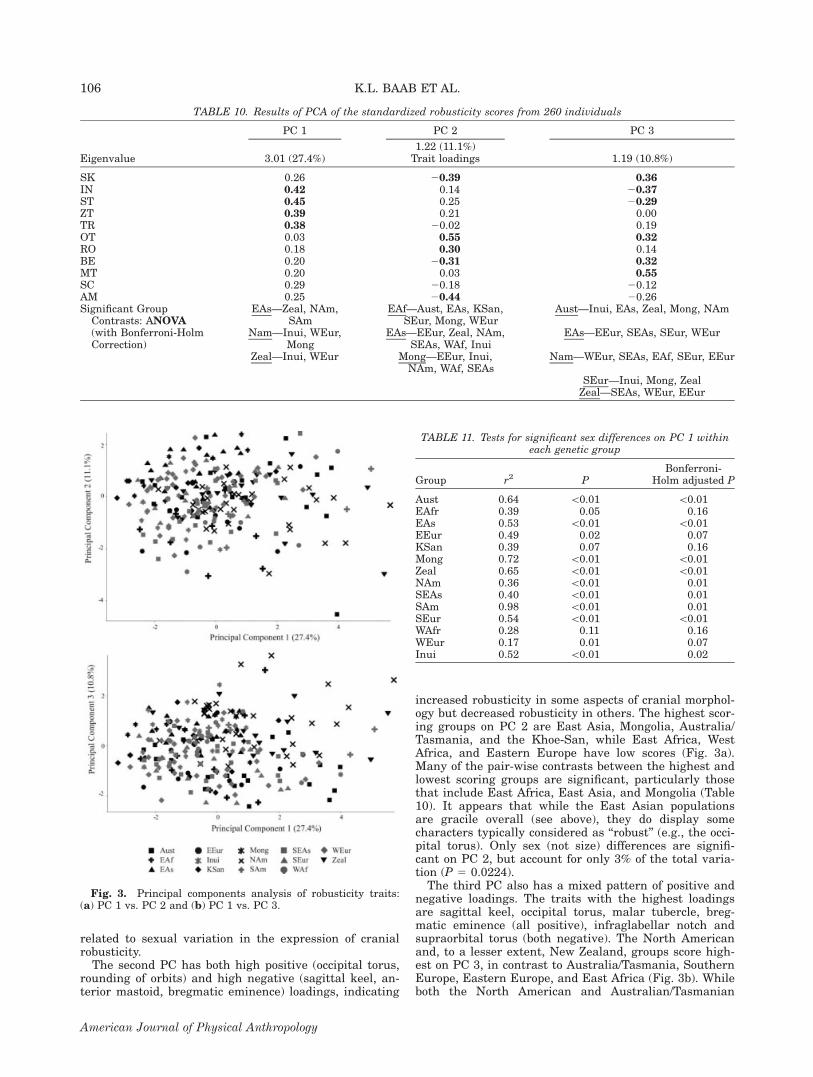
In deciding how many PCs to evaluate, we applied thecommon Guttman-Kaiser criterion (keep all PCs witheigenvalues [1.0; Kaiser, 1961), which results in theretention of the first three components. However, a moreconservative criterion, the Scree Plot (Cattell, 1966), sug-gests that only PC 1 should be retained. Although PC 1accounted for a proportionally larger percentage of thetotal variance in cranial robusticity (27%), the secondand third components each explain 11% of the varianceand may indicate that there is more than one relevantpattern of cranial robusticity (Table 10).The first PC reflects overall levels of robusticity as all
11 traits load positively (Table 10), although the occipitaltorus has a loading near zero. This is consistent with theresults of the correlation matrix in that the occipitalregion does not follow the same pattern as the othertraits. The groups with the highest median (and mean)scores are New Zealand, Australia/Tasmania, NorthAmerica, and South America, while the lowest scoresbelong to Mongolia, East Asia, Inuit, and Khoe-San (seeFig. 3). Analysis of variance (ANOVA) was used to assesswhether groups had significantly different mean scoreson each PC (Table 10). Several of the pairwise group con-trasts between the highest and lowest scoring groups aresignificant, particularly those involving North America,New Zealand, and East Asia.Size and sex account for about a third of variation in
PC 1 scores (r2 5 0.36, P \ 0.0001), with both variablescontributing significantly to the model. Males score sig-nificantly higher than females on PC 1 within all groupsexcept the East and West Europeans, East and WestAfricans, and Khoe-San (Table 11), but males scoredhigher on average than females even in those groupsthat did not reach statistical significance. The r2 valuesranged from 0.36 (North America) to 0.98 (South Amer-ica). Therefore, the large spread seen within each re-gional/genetic group along PC 1 is at least partially
TABLE 9. Matrix of polychoric correlation coefficients among the 11 robusticity traits; coefficients � |0.3| are in bold. See Table 2for character definitions
SK 1IN 0.232 1ST 0.220 0.843 1ZT 0.254 0.466 0.592 1TR 0.333 0.484 0.566 0.499 1OT 20.112 20.032 0.106 0.145 0.100 1RO 0.084 0.267 0.298 0.314 0.175 0.167 1BE 0.428 0.358 0.352 0.277 0.657 20.144 0.493 1MT 0.256 0.150 0.193 0.249 0.252 0.107 0.161 0.382 1SC 0.245 0.346 0.284 0.241 0.272 0.042 0.167 0.240 0.123 1AM 0.260 0.359 0.011 0.197 0.188 20.105 0.008 0.395 0.067 0.431 1
SK IN ST ZT TR OT RO BE MT SC AM
105CRANIAL ROBUSTICITY IN HOMO SAPIENS
American Journal of Physical Anthropology
related to sexual variation in the expression of cranialrobusticity.The second PC has both high positive (occipital torus,
rounding of orbits) and high negative (sagittal keel, an-terior mastoid, bregmatic eminence) loadings, indicating
increased robusticity in some aspects of cranial morphol-ogy but decreased robusticity in others. The highest scor-ing groups on PC 2 are East Asia, Mongolia, Australia/Tasmania, and the Khoe-San, while East Africa, WestAfrica, and Eastern Europe have low scores (Fig. 3a).Many of the pair-wise contrasts between the highest andlowest scoring groups are significant, particularly thosethat include East Africa, East Asia, and Mongolia (Table10). It appears that while the East Asian populationsare gracile overall (see above), they do display somecharacters typically considered as ‘‘robust’’ (e.g., the occi-pital torus). Only sex (not size) differences are signifi-cant on PC 2, but account for only 3% of the total varia-tion (P 5 0.0224).The third PC also has a mixed pattern of positive and
negative loadings. The traits with the highest loadingsare sagittal keel, occipital torus, malar tubercle, breg-matic eminence (all positive), infraglabellar notch andsupraorbital torus (both negative). The North Americanand, to a lesser extent, New Zealand, groups score high-est on PC 3, in contrast to Australia/Tasmania, SouthernEurope, Eastern Europe, and East Africa (Fig. 3b). Whileboth the North American and Australian/Tasmanian
Fig. 3. Principal components analysis of robusticity traits:(a) PC 1 vs. PC 2 and (b) PC 1 vs. PC 3.
TABLE 10. Results of PCA of the standardized robusticity scores from 260 individuals
PC 1 PC 2 PC 3
Eigenvalue 3.01 (27.4%)1.22 (11.1%)Trait loadings 1.19 (10.8%)
SK 0.26 20.39 0.36IN 0.42 0.14 20.37ST 0.45 0.25 20.29ZT 0.39 0.21 0.00TR 0.38 20.02 0.19OT 0.03 0.55 0.32RO 0.18 0.30 0.14BE 0.20 20.31 0.32MT 0.20 0.03 0.55SC 0.29 20.18 20.12AM 0.25 20.44 20.26Significant Group
Contrasts: ANOVA(with Bonferroni-HolmCorrection)
EAs—Zeal, NAm,SAm
EAf—Aust, EAs, KSan,SEur, Mong, WEur
Aust—Inui, EAs, Zeal, Mong, NAm
Nam—Inui, WEur,Mong
EAs—EEur, Zeal, NAm,SEAs, WAf, Inui
EAs—EEur, SEAs, SEur, WEur
Zeal—Inui, WEur Mong—EEur, Inui,NAm, WAf, SEAs
Nam—WEur, SEAs, EAf, SEur, EEur
SEur—Inui, Mong, ZealZeal—SEAs, WEur, EEur
TABLE 11. Tests for significant sex differences on PC 1 withineach genetic group
Group r2 PBonferroni-
Holm adjusted P
Aust 0.64 \0.01 \0.01EAfr 0.39 0.05 0.16EAs 0.53 \0.01 \0.01EEur 0.49 0.02 0.07KSan 0.39 0.07 0.16Mong 0.72 \0.01 \0.01Zeal 0.65 \0.01 \0.01NAm 0.36 \0.01 0.01SEAs 0.40 \0.01 0.01SAm 0.98 \0.01 0.01SEur 0.54 \0.01 \0.01WAfr 0.28 0.11 0.16WEur 0.17 0.01 0.07Inui 0.52 \0.01 0.02
106 K.L. BAAB ET AL.
American Journal of Physical Anthropology
groups are fairly robust overall (as indicated by theirhigh scores on PC 1), they exhibit significantly differentpatterns of character expression on PC 3. Together, sizeand sex explain only 8% of variation in PC 3 scores (P \0.0001).
Relationship between external variables andcranial robusticity
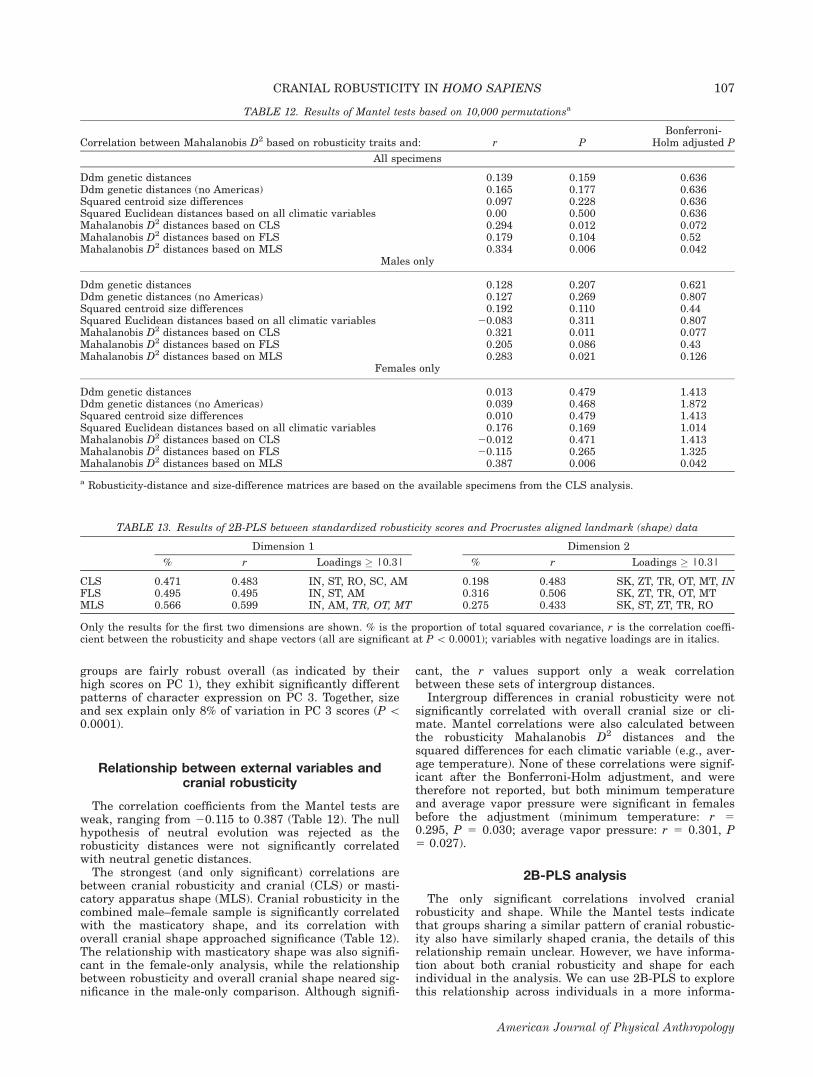
The correlation coefficients from the Mantel tests areweak, ranging from 20.115 to 0.387 (Table 12). The nullhypothesis of neutral evolution was rejected as therobusticity distances were not significantly correlatedwith neutral genetic distances.The strongest (and only significant) correlations are
between cranial robusticity and cranial (CLS) or masti-catory apparatus shape (MLS). Cranial robusticity in thecombined male–female sample is significantly correlatedwith the masticatory shape, and its correlation withoverall cranial shape approached significance (Table 12).The relationship with masticatory shape was also signifi-cant in the female-only analysis, while the relationshipbetween robusticity and overall cranial shape neared sig-nificance in the male-only comparison. Although signifi-
cant, the r values support only a weak correlationbetween these sets of intergroup distances.Intergroup differences in cranial robusticity were not
significantly correlated with overall cranial size or cli-mate. Mantel correlations were also calculated betweenthe robusticity Mahalanobis D2 distances and thesquared differences for each climatic variable (e.g., aver-age temperature). None of these correlations were signif-icant after the Bonferroni-Holm adjustment, and weretherefore not reported, but both minimum temperatureand average vapor pressure were significant in femalesbefore the adjustment (minimum temperature: r 50.295, P 5 0.030; average vapor pressure: r 5 0.301, P5 0.027).
2B-PLS analysis
The only significant correlations involved cranialrobusticity and shape. While the Mantel tests indicatethat groups sharing a similar pattern of cranial robustic-ity also have similarly shaped crania, the details of thisrelationship remain unclear. However, we have informa-tion about both cranial robusticity and shape for eachindividual in the analysis. We can use 2B-PLS to explorethis relationship across individuals in a more informa-
TABLE 12. Results of Mantel tests based on 10,000 permutationsa
Correlation between Mahalanobis D2 based on robusticity traits and: r PBonferroni-
Holm adjusted P
All specimens
Ddm genetic distances 0.139 0.159 0.636Ddm genetic distances (no Americas) 0.165 0.177 0.636Squared centroid size differences 0.097 0.228 0.636Squared Euclidean distances based on all climatic variables 0.00 0.500 0.636Mahalanobis D2 distances based on CLS 0.294 0.012 0.072Mahalanobis D2 distances based on FLS 0.179 0.104 0.52Mahalanobis D2 distances based on MLS 0.334 0.006 0.042
Males only
Ddm genetic distances 0.128 0.207 0.621Ddm genetic distances (no Americas) 0.127 0.269 0.807Squared centroid size differences 0.192 0.110 0.44Squared Euclidean distances based on all climatic variables 20.083 0.311 0.807Mahalanobis D2 distances based on CLS 0.321 0.011 0.077Mahalanobis D2 distances based on FLS 0.205 0.086 0.43Mahalanobis D2 distances based on MLS 0.283 0.021 0.126
Females only
Ddm genetic distances 0.013 0.479 1.413Ddm genetic distances (no Americas) 0.039 0.468 1.872Squared centroid size differences 0.010 0.479 1.413Squared Euclidean distances based on all climatic variables 0.176 0.169 1.014Mahalanobis D2 distances based on CLS 20.012 0.471 1.413Mahalanobis D2 distances based on FLS 20.115 0.265 1.325Mahalanobis D2 distances based on MLS 0.387 0.006 0.042
a Robusticity-distance and size-difference matrices are based on the available specimens from the CLS analysis.
TABLE 13. Results of 2B-PLS between standardized robusticity scores and Procrustes aligned landmark (shape) data
Dimension 1 Dimension 2
% r Loadings � |0.3| % r Loadings � |0.3|
CLS 0.471 0.483 IN, ST, RO, SC, AM 0.198 0.483 SK, ZT, TR, OT, MT, INFLS 0.495 0.495 IN, ST, AM 0.316 0.506 SK, ZT, TR, OT, MTMLS 0.566 0.599 IN, AM, TR, OT, MT 0.275 0.433 SK, ST, ZT, TR, RO
Only the results for the first two dimensions are shown. % is the proportion of total squared covariance, r is the correlation coeffi-cient between the robusticity and shape vectors (all are significant at P\ 0.0001); variables with negative loadings are in italics.
107CRANIAL ROBUSTICITY IN HOMO SAPIENS
American Journal of Physical Anthropology
tive manner. The summary statistics for the 2B-PLSanalyses using the CLS, MLS, and FLS landmark setsare presented in Table 13. We used permutation tests onthose dimensions (i.e., 2B-PLS latent variables) thataccounted for 20% or more of the total covariance (thefirst two dimensions in all analyses). We found thatthese dimensions were highly significant in the CLS,FLS, and MLS analyses.
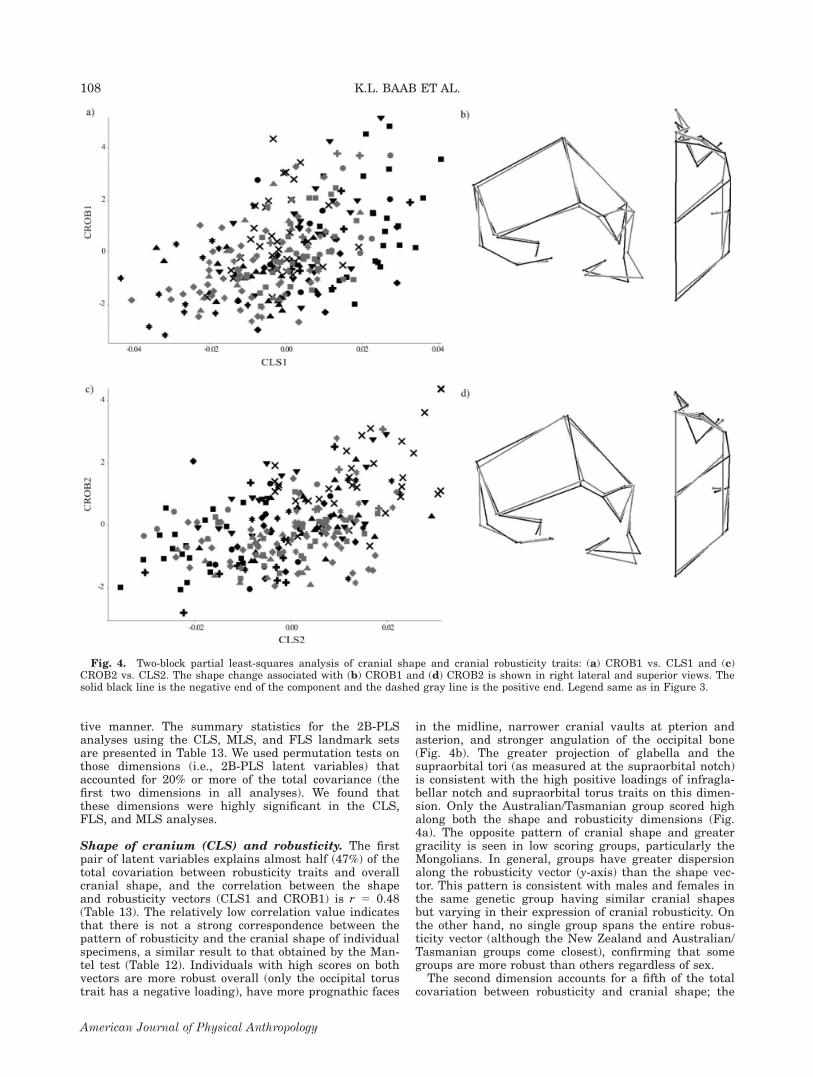
Shape of cranium (CLS) and robusticity. The firstpair of latent variables explains almost half (47%) of thetotal covariation between robusticity traits and overallcranial shape, and the correlation between the shapeand robusticity vectors (CLS1 and CROB1) is r 5 0.48(Table 13). The relatively low correlation value indicatesthat there is not a strong correspondence between thepattern of robusticity and the cranial shape of individualspecimens, a similar result to that obtained by the Man-tel test (Table 12). Individuals with high scores on bothvectors are more robust overall (only the occipital torustrait has a negative loading), have more prognathic faces
in the midline, narrower cranial vaults at pterion andasterion, and stronger angulation of the occipital bone(Fig. 4b). The greater projection of glabella and thesupraorbital tori (as measured at the supraorbital notch)is consistent with the high positive loadings of infragla-bellar notch and supraorbital torus traits on this dimen-sion. Only the Australian/Tasmanian group scored highalong both the shape and robusticity dimensions (Fig.4a). The opposite pattern of cranial shape and greatergracility is seen in low scoring groups, particularly theMongolians. In general, groups have greater dispersionalong the robusticity vector (y-axis) than the shape vec-tor. This pattern is consistent with males and females inthe same genetic group having similar cranial shapesbut varying in their expression of cranial robusticity. Onthe other hand, no single group spans the entire robus-ticity vector (although the New Zealand and Australian/Tasmanian groups come closest), confirming that somegroups are more robust than others regardless of sex.The second dimension accounts for a fifth of the total
covariation between robusticity and cranial shape; the
Fig. 4. Two-block partial least-squares analysis of cranial shape and cranial robusticity traits: (a) CROB1 vs. CLS1 and (c)CROB2 vs. CLS2. The shape change associated with (b) CROB1 and (d) CROB2 is shown in right lateral and superior views. Thesolid black line is the negative end of the component and the dashed gray line is the positive end. Legend same as in Figure 3.
108 K.L. BAAB ET AL.
American Journal of Physical Anthropology
correlation between these vectors is r 5 0.48. Higherscoring groups, particularly the North Americans (Fig.4c), have a stronger expression of the sagittal keel, zygo-maxillary tuberosity, zygomatic trigone, malar tubercle,and occipital torus but a weaker expression of the infra-glabellar notch (Table 13). These groups have long ortho-gnathic faces that are narrower across the supraorbitalregion but wider across the malars, and narrower cra-nial vaults with more tightly angled occipitals (Fig. 4d).The more posterior position of inion is consistent withthe high positive loading of the occipital torus trait onthis dimension. There is not a single group that scoredvery low on both vectors, although the East African andAustralian/Tasmanian groups are among the lowest. Thesecond pair of singular vectors highlights a similar pat-tern to that described above for PC 3.
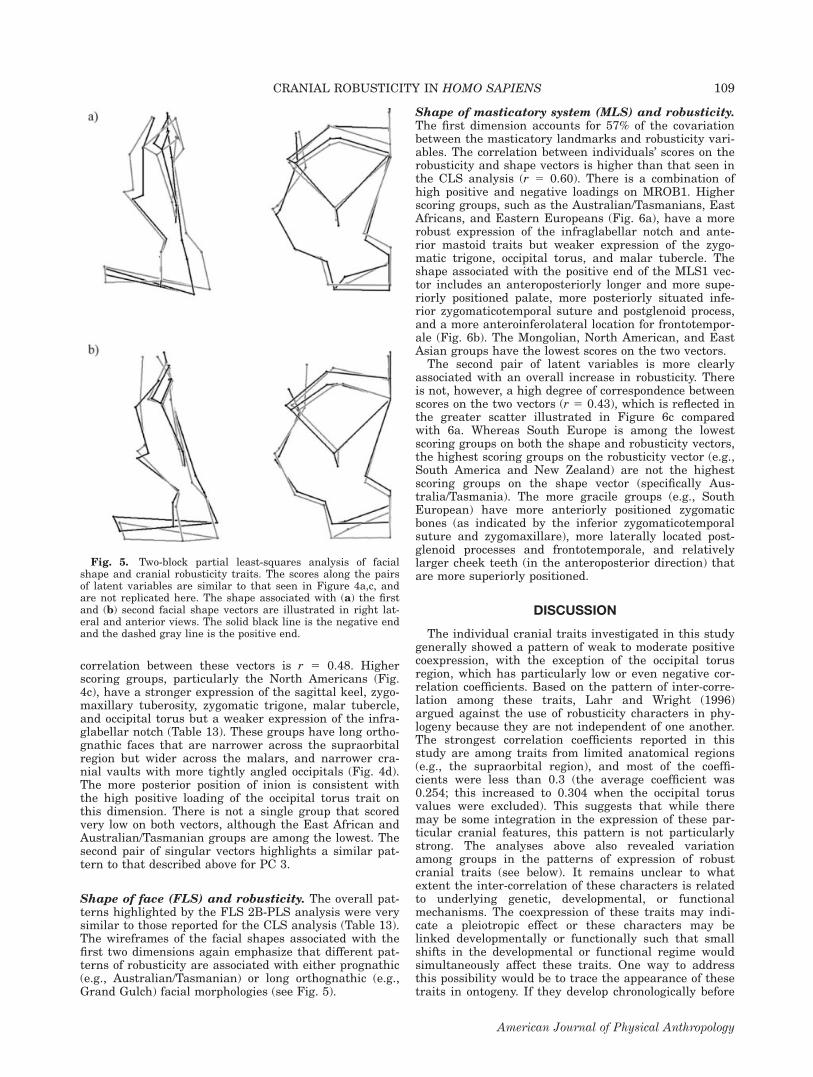
Shape of face (FLS) and robusticity. The overall pat-terns highlighted by the FLS 2B-PLS analysis were verysimilar to those reported for the CLS analysis (Table 13).The wireframes of the facial shapes associated with thefirst two dimensions again emphasize that different pat-terns of robusticity are associated with either prognathic(e.g., Australian/Tasmanian) or long orthognathic (e.g.,Grand Gulch) facial morphologies (see Fig. 5).
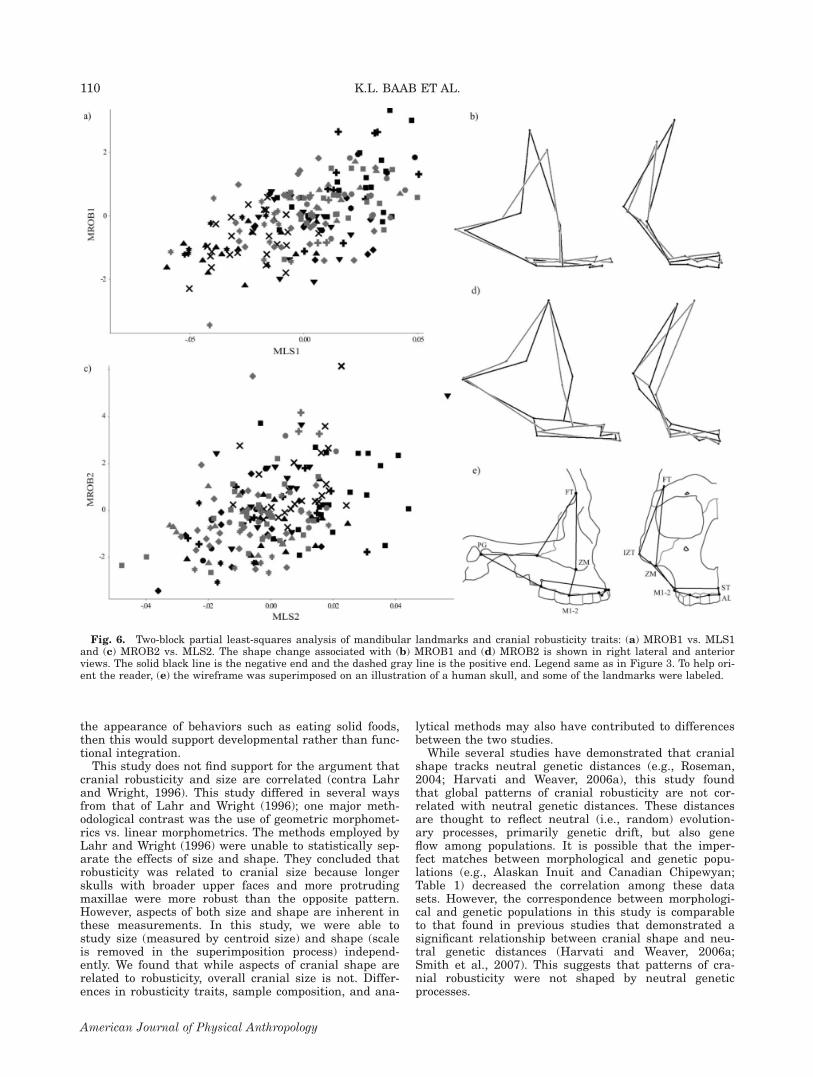
Shape of masticatory system (MLS) and robusticity.The first dimension accounts for 57% of the covariationbetween the masticatory landmarks and robusticity vari-ables. The correlation between individuals’ scores on therobusticity and shape vectors is higher than that seen inthe CLS analysis (r 5 0.60). There is a combination ofhigh positive and negative loadings on MROB1. Higherscoring groups, such as the Australian/Tasmanians, EastAfricans, and Eastern Europeans (Fig. 6a), have a morerobust expression of the infraglabellar notch and ante-rior mastoid traits but weaker expression of the zygo-matic trigone, occipital torus, and malar tubercle. Theshape associated with the positive end of the MLS1 vec-tor includes an anteroposteriorly longer and more supe-riorly positioned palate, more posteriorly situated infe-rior zygomaticotemporal suture and postglenoid process,and a more anteroinferolateral location for frontotempor-ale (Fig. 6b). The Mongolian, North American, and EastAsian groups have the lowest scores on the two vectors.The second pair of latent variables is more clearly
associated with an overall increase in robusticity. Thereis not, however, a high degree of correspondence betweenscores on the two vectors (r 5 0.43), which is reflected inthe greater scatter illustrated in Figure 6c comparedwith 6a. Whereas South Europe is among the lowestscoring groups on both the shape and robusticity vectors,the highest scoring groups on the robusticity vector (e.g.,South America and New Zealand) are not the highestscoring groups on the shape vector (specifically Aus-tralia/Tasmania). The more gracile groups (e.g., SouthEuropean) have more anteriorly positioned zygomaticbones (as indicated by the inferior zygomaticotemporalsuture and zygomaxillare), more laterally located post-glenoid processes and frontotemporale, and relativelylarger cheek teeth (in the anteroposterior direction) thatare more superiorly positioned.
DISCUSSION
The individual cranial traits investigated in this studygenerally showed a pattern of weak to moderate positivecoexpression, with the exception of the occipital torusregion, which has particularly low or even negative cor-relation coefficients. Based on the pattern of inter-corre-lation among these traits, Lahr and Wright (1996)argued against the use of robusticity characters in phy-logeny because they are not independent of one another.The strongest correlation coefficients reported in thisstudy are among traits from limited anatomical regions(e.g., the supraorbital region), and most of the coeffi-cients were less than 0.3 (the average coefficient was0.254; this increased to 0.304 when the occipital torusvalues were excluded). This suggests that while theremay be some integration in the expression of these par-ticular cranial features, this pattern is not particularlystrong. The analyses above also revealed variationamong groups in the patterns of expression of robustcranial traits (see below). It remains unclear to whatextent the inter-correlation of these characters is relatedto underlying genetic, developmental, or functionalmechanisms. The coexpression of these traits may indi-cate a pleiotropic effect or these characters may belinked developmentally or functionally such that smallshifts in the developmental or functional regime wouldsimultaneously affect these traits. One way to addressthis possibility would be to trace the appearance of thesetraits in ontogeny. If they develop chronologically before
Fig. 5. Two-block partial least-squares analysis of facialshape and cranial robusticity traits. The scores along the pairsof latent variables are similar to that seen in Figure 4a,c, andare not replicated here. The shape associated with (a) the firstand (b) second facial shape vectors are illustrated in right lat-eral and anterior views. The solid black line is the negative endand the dashed gray line is the positive end.
109CRANIAL ROBUSTICITY IN HOMO SAPIENS
American Journal of Physical Anthropology
the appearance of behaviors such as eating solid foods,then this would support developmental rather than func-tional integration.This study does not find support for the argument that
cranial robusticity and size are correlated (contra Lahrand Wright, 1996). This study differed in several waysfrom that of Lahr and Wright (1996); one major meth-odological contrast was the use of geometric morphomet-rics vs. linear morphometrics. The methods employed byLahr and Wright (1996) were unable to statistically sep-arate the effects of size and shape. They concluded thatrobusticity was related to cranial size because longerskulls with broader upper faces and more protrudingmaxillae were more robust than the opposite pattern.However, aspects of both size and shape are inherent inthese measurements. In this study, we were able tostudy size (measured by centroid size) and shape (scaleis removed in the superimposition process) independ-ently. We found that while aspects of cranial shape arerelated to robusticity, overall cranial size is not. Differ-ences in robusticity traits, sample composition, and ana-
lytical methods may also have contributed to differencesbetween the two studies.While several studies have demonstrated that cranial
shape tracks neutral genetic distances (e.g., Roseman,2004; Harvati and Weaver, 2006a), this study foundthat global patterns of cranial robusticity are not cor-related with neutral genetic distances. These distancesare thought to reflect neutral (i.e., random) evolution-ary processes, primarily genetic drift, but also geneflow among populations. It is possible that the imper-fect matches between morphological and genetic popu-lations (e.g., Alaskan Inuit and Canadian Chipewyan;Table 1) decreased the correlation among these datasets. However, the correspondence between morphologi-cal and genetic populations in this study is comparableto that found in previous studies that demonstrated asignificant relationship between cranial shape and neu-tral genetic distances (Harvati and Weaver, 2006a;Smith et al., 2007). This suggests that patterns of cra-nial robusticity were not shaped by neutral geneticprocesses.
Fig. 6. Two-block partial least-squares analysis of mandibular landmarks and cranial robusticity traits: (a) MROB1 vs. MLS1and (c) MROB2 vs. MLS2. The shape change associated with (b) MROB1 and (d) MROB2 is shown in right lateral and anteriorviews. The solid black line is the negative end and the dashed gray line is the positive end. Legend same as in Figure 3. To help ori-ent the reader, (e) the wireframe was superimposed on an illustration of a human skull, and some of the landmarks were labeled.
110 K.L. BAAB ET AL.
American Journal of Physical Anthropology
While Aboriginal Australians have long been thestandard bearers for robust cranial morphology, thisstudy reveals that human populations exhibit more thanone pattern of cranial robusticity. The results of thisstudy emphasize a primary trend of variability fromgracile to robust (except in the occipital torus region),but also highlight secondary patterns of differential cra-nial trait expression within populations. For example,the Native American group from Grand Gulch, Utah ischaracterized by robust expression of the sagittal keel,bregmatic eminence, occipital torus, and malar tubercle,but a more gracile supraorbital region in contrast to thepattern seen in Aboriginal Australians. A similar patternwas noted in native Americans from the Santa BarbaraChannel, CA region by Walker (2008).There was no support for a relationship between
robusticity and climate (contra suggestions by Bulbeck,2001; Bernal et al., 2006; Perez et al., 2007). This wastrue whether we examined individual climatic variablesor multiple variables simultaneously. This analysis doesnot entirely rule out the influence of the environment onrobust cranial morphology, but it appears to excludeglobal climate differences as a major factor. However,this conclusion is limited by the small number of cold cli-mate populations in our study. If either the Tierra delFuego or Inuit populations are outliers in terms of theexpression of robusticity, then further sampling of coldadapted groups could reveal a relationship not detectedhere.The strongest correlations were found between cranial
robusticity and either cranial or masticatory shape. Thismay provide support for the functional model (relatingmastication to robusticity), suggesting that futureresearch into this relationship is warranted. The distan-ces based on masticatory shape variables were signifi-cantly correlated with robusticity distances in both thecombined male–female and female-only samples, andvariation in the expression of robusticity was morestrongly correlated with the masticatory landmarks thanthe cranial landmarks in the 2B-PLS analysis. However,the relationship between robusticity and shape high-lighted by the 2B-PLS analysis was complex. Gonzalez-Jose et al. (2005) found that masticatory morphology bet-ter differentiated between South American hunter-gath-erers and farmers than did craniofacial shape as awhole. They attributed the smaller masticatory compo-nent to a reduction of mechanical stress associated withagriculture. In our analysis, however, those populationspracticing hunter-gatherer subsistence activities (SouthAmericans from Tierra del Fuego, Inuit, Khoe-San, andAboriginal Australians) were neither consistently morerobust, nor did they differ in the shape of their mastica-tory morphology, relative to the other groups. The lattermay be due to deficiencies in the masticatory landmarksbecause they were designed for more large-scale differen-ces in mastication/diet than observed among modernhuman populations. It is possible that a more extensiveset of landmarks designed specifically with modernhumans in mind may lead to a stronger correlationbetween robusticity and mastication. Interestingly, inthe CLS 2B-PLS the shape associated with greaterrobusticity was similar to that described for groups thatate harder-to-process diets (Carlson and van Gerven,1977, 1979; Larsen, 1995, 1997; Sardi et al., 2006). Spe-cifically, crania with more prognathic faces, expandedglabellar and occipital regions, and (slightly) longerskulls were more robust than those with rounder vaults
and more orthognathic faces. Lahr and Wright (1996)described a similar cranial shape/robusticity pattern,emphasizing the relationship between longer, narrowercrania with increased facial prognathism and greaterrobusticity. More detailed information related to subsist-ence and paramasticatory activities could clarify thispotential relationship.While this study examined a wide range of factors
previously implicated in the expression of robust cra-nial morphology, there are additional explanations thatmay be considered in future research. Particularlyactive/mobile individuals or populations may expresscranial robusticity to a greater degree than sedentaryones. Experimental evidence in armadillos and pigsindicated that increased exercise resulted in thickercranial bones (Lieberman, 1996), and it has beenshown that exercise causes the release of growth hor-mone (GH), which in turn has been implicated inincreased bone mass (Vogl et al., 1993; Banu et al.,2001; Forwood et al., 2001). While hormones such asGH are thought to influence craniofacial growth (Con-sole et al., 2001), it is unclear whether this explana-tion can be extrapolated to the development of morelocalized cranial superstructures. Hunter-gatherer pop-ulations are thought to lead more physically demand-ing lives than sedentary, agricultural ones (Larsen,1982, 1984; Perzigian et al., 1984; Larsen and Ruff,1994; Carlson et al., 2007, but see Bridges, 1989;Kelly, 1995), but this study indicates that they are notalways more cranially robust. Of the four hunter-gath-erer populations included in this study, the SouthAmericans and Aboriginal Australians are fairly ro-bust, but the Khoe-San and Inuit are not.Protection of the contents of the skull may also influ-
ence the development of robust cranial superstructuresand cranial bone thickness. Boaz and Ciochon (2004)hypothesized that the thick skull bones and stronglydeveloped cranial superstructures ubiquitous in H. erec-tus are the result of selection against injury duringinter-population violence. Interpersonal violence wasalso posited to explain the presence of relatively thickcranial vault bones in some Aboriginal Australians(Brown, 1987; 1994). More detailed ethnographic infor-mation detailing the occurrences of interpersonal vio-lence for each of the populations studied would be neces-sary to completely address these questions.Extrapolation of these results to fossil hominins sug-
gests that caution should be exercised when treating thetypes of traits analyzed here as independent charactersas most are positively correlated; this coexpression mayrelate to developmental or functional integration. ThePCA confirmed that males are generally more robustthan females (Table 11), but this pattern was more appa-rent within single populations—males were more robustthan females from the same groups, but not necessarilymore robust than females from other groups. Therefore,these features should only be used to establish sex forindividual fossil hominins when a reasonable sample ofindividuals is uncovered from the same time period andlocality. The results of this analysis also raise doubtsabout whether variation in robusticity can be used toinfer population history or local climatic adaptationswithin a population. While the possibility that theexpression of robusticity is related to elevated activitylevels or the processing of a more difficult-to-process dietcannot be ruled out, there is also not strong evidence tosupport these claims.
111CRANIAL ROBUSTICITY IN HOMO SAPIENS
American Journal of Physical Anthropology
CONCLUSIONS
This study represents the first statistically rigorous testof a range of hypotheses regarding the expression of cra-nial robusticity. Positive coexpression of robust cranialtraits may support a relatively simple genetic basis or de-velopmental/functional integration, although varying pat-terns of ‘‘robust’’ cranial morphology were observed in dif-ferent populations. Shape of the overall cranium and themasticatory apparatus are the only factors examined herethat are significantly correlated with robusticity, but therelationship is weak. These results are partially consist-ent with those obtained by Lahr and Wright (1996), theonly other study to explore robusticity at a global level.Our results indicate that unlike cranial shape, variationin robusticity did not reflect either climate or neutralgenetic distances. The relationship between the mastica-tory landmark configuration and robusticity suggests thatcranial robusticity may be influenced by masticatory/para-masticatory function. The possibility also remains openthat variation in activity levels or behavior (e.g., interper-sonal violence) contributed to the observed pattern of cra-nial robusticity in modern humans, and these should becarefully examined in future research.
ACKNOWLEDGMENTS
The authors acknowledge the American Museum ofNatural History for access to human skeletal material.They are also grateful to Eric Delson, Ryan Raaum, JimRohlf and Philipp Gunz for assistance with this project.Useful comments were provided by Katerina Harvati onan earlier version of this manuscript. This is NYCEPMorphometrics contribution 37.
APPENDIX A
LITERATURE CITED
Baab KL. 2007. Cranial shape variation in Homo erectus. Ph.D.dissertation. New York: City University of New York.
Banu J, Orhii PB, Okafor MC, Wang L, Kalu DN. 2001. Analy-sis of the effects of growth hormone, exercise and food restric-tion on cancellous bone in different bone sites in middle-agedfemale rats. Mech Ageing Dev 122:849–864.
Bernal V, Perez SI, Gonzalez PN. 2006. Variation and causalfactors of craniofacial robusticity in Patagonian hunter-gath-erers from Late Holocene. Am J Hum Biol 18:748–765.
Bilsborough A, Wood BA. 1986. The nature, origin and fate ofHomo erectus. In: Wood B, Martin LB, Andrews P, editors.Major topics in primate and human evolution. Cambridge:Cambridge University Press. p 295–316.
Boaz NT, Ciochon RL. 2004. Dragon Bone Hill: an ice-age sagoof Homo erectus. New York: Oxford University Press.
Bookstein FL. 1991. Morphometric tools for landmark data: ge-ometry and biology. Cambridge, England: Cambridge Univer-sity Press.
Bookstein FL, Schaefer K, Prossinger H, Seidler H, Fieder M,Stringer CB, Weber GW, Arsuaga JL, Slice D, Rohlf F,Recheis W, Mariam J, Marcus L. 1999. Comparing frontal cra-nial profiles in archaic and modern Homo by morphometricanalysis. Anat Record 257:217–224.
Brauer G, Mbua E. 1992. Homo erectus features used in cladis-tics and their variability in Asian and African hominids.J Hum Evol 22:79–108.
Bresin A, Kiliaridis S, Strid KG. 1999. Effect of masticatoryfunction on the internal bone structure in the mandible of thegrowing rat. Eur J Oral Sci 107:35–44.
Bridges PS. 1989. Changes in activities with the shift to agricul-ture in the southeastern United States. Curr Anthropol30:385–394.
Brown P. 1987. Pleistocene homogeneity and Holocene sizereduction: the Australian human skeletal evidence. ArchaeolOceania 22:41–71.
Brown P. 1994. Cranial vault thickness in Asian Homo erectusand Homo sapiens. Cour Forsch Inst Senckenberg 171:33–46.
Bulbeck D. 2001. Robust and gracile Australian crania: the taleof the Willandra Lakes. In: Simanjuntak T, Prasetyo B, Hand-ini R, editors. Sangiran: man, culture and environment inPleistocene times. Jakarta: Yayasan Obor Indonesia/TheNational Research Centre of Archaeology/Ecole Francaised’Extreme-Orient. p 60–106.
Cann HM, Toma C, Cazes L, Legrand M-F, Morel V, Piouffre L,Bodmer J, Bodmer WF, Bonne-Tamir B, Cambon-ThomsenACZ, Chu J, Carcassi C, Contu L, Du REL, Ferrara GB,Friedlaender JS, Groot H, Gurwitz D, Jenkins T, Herrera RJ,Huang X, Kidd J, Kidd KK, Langaney A, Lin AA, Mehdi SQ,Parham P, Piazza A, Pistillo MP, Qian Y, Shu Q, Xu J, Zhu S,Weber JL, Greely HT, Feldman MW, Thomas G, Dausset J,Cavalli-Sforza LL. 2002. A human genome diversity cell linepanel. Science 296:261–262.
Carey JW, Steegmann JR. 1981. Human nasal protrusion, lati-tude, and climate. Am J Phys Anthropol 56:313–319.
Carlson DS, van Gerven DP. 1977. Masticatory function andpost-Pleistocene evolution in Nubia. Am J Phys Anthropol46:495–450.
Carlson DS, van Gerven DP. 1979. Diffusion, biological deter-minism, and biocultural adaptation in the Nubian Corridor.Am Anthropol 81:561–580.
Carlson KJ, Grine FE, Pearson OM. 2007. Robusticity and sex-ual dimorphism in the postcranium of modern hunter-gather-ers from Australia. Am J Phys Anthropol 134:9–23.
Carson EA. 2006a. Maximum-likelihood variance componentsanalysis of heritabilities of cranial nonmetric traits. Hum Biol78:383–402.
Carson EA. 2006b. Maximum likelihood estimation of humancraniometric heritabilities. Am J Phys Anthropol 131:169–180.
Cattell RB. 1966. The scree test for the number of factors. Mul-tivar Behav Res 1:629–637.
Trait Abbrev. Definition of gradesNo.
of grades
Malartubercle
MT 1. Contact betweenfrontal bone and zygomaticbone inferior to thezygomaticofrontal sutureforms no angle; tubercleabsent
3
2. Obtuse angle is formed;smooth tubercle present
3. Acute angle is formed;tubercle present andoften associatedwith cresting
Supramastoidcrest
SC 1. The lateral surface of thetemporal squama superiorto the mastoid processis smooth; no cresting
3
2. Some elevation ispresent, extendingsuperoposteriorly; no crest
3. Crest present, extendingsuperoposteriorly
Anteriormastoidtubercle
AM 1. Lateral surface ofthe mastoidprocess is smooth
3
2. Weak to moderatetubercle present
3. Strongly expressedtubercle present
112 K.L. BAAB ET AL.
American Journal of Physical Anthropology
Cheverud JM, Buikstra JE. 1981a. Quantitative genetics ofskeletal nonmetric traits in the Rhesus macaques on CayoSantiago. I. Single trait heritabilities. Am J Phys Anthropol54:43–49.
Cheverud JM, Buikstra JE. 1981b. Quantitative genetics ofskeletal non-metric traits in the rhesus macaques on CayoSantiago. II. Phenotypic, genetic, and environmental correla-tions between traits. Am J Phys Anthropol 54:51–58.
Cheverud JM, Buikstra JE. 1982. Quantitative genetics of skel-etal non-metric traits in the rhesus macaques on Cayo San-tiago. III. Relative heritability of skeletal non-metric and met-ric traits. Am J Phys Anthropol 59:151–155.
Churchill SE. 1998. Cold adaptation, heterochrony, and Nean-dertals. Evol Anthropol 7:46–61.
Ciochon RL, Nisbett RA, Corruccini RS. 1997. Dietary consis-tency and craniofacial development related to masticatoryfunction in minipigs. J Craniofac Genet Dev Biol 17:96–102.
Console GM, Oyhenart EE, Jurado SB, Riccillo FL, PucciarelliHM, Gomez Dumm CLA. 2001. Effect of undernutrition oncranial components and somatotroph-lactotroph pituitary pop-ulations in the squirrel monkey. Cells Tissues Organs168:272–284.
Dieringer D, Schlotterer C. 2003. Microsatellite Analyser(MSA): a platform independent analysis tool for large micro-satellite data sets. Molec Ecol Notes 3:167–169.
Dunsworth HM, Walker A. 2002. Early Genus Homo. In: Hart-wig W, editor. The primate fossil record. Cambridge: Cam-bridge University Press. p 419–426.
Endo B. 1966. Experimental studies on the mechanical signifi-cance of the form of the human facial skeleton. J Faculty SciUniv Tokyo (Section V, Anthropol) 3:1–106.
Endo B. 1970. Analysis of stress around the orbit due to mass-eter and temporalis muscles respectively. J Anthropol SocNippon 78:251–266.
Falconer DS. 1965. The inheritance of liability to certain dis-eases, estimated from the incidence among relatives. AnnHum Genet 29:51–76.
Falconer DS. 1989. Introduction to quantitative genetics. NewYork: Wiley.
Falconer DS, Mackay TFC. 1996. Introduction to quantitativegenetics. Harlow, England: Pearson Education.
Forwood MR, Li L, Kelly WL, Bennett MB. 2001. Growth hor-mone is permissive for skeletal adaptation to mechanical load-ing. J Bone Miner Res 16:2284–2290.
Franciscus RG, Long JC. 1991. Variation in human nasal heightand breadth. Am J Phys Anthropol 85:419–427.
Frayer DW, Wolpoff MH, Thorne AG, Smith FH, Pope GG.1993. Theories of modern human origins: the paleontologicaltest. Am Anthropol 95:14–50.
Gianola D. 1979. Heritability of polychotomous characters.Genetics 93:1051–1055.
Gianola D. 1982. Theory and analysis of threshold characters. JAnim Sci 54:1079–1096.
Gilligan I, Bulbeck D. 2007. Environment and morphology inAustralian Aborigines: a re-analysis of the Birdsell database.Am J Phys Anthropol 134:75–91.
Goldstein DB, Linares AR, Cavalli-Sforza LL, Feldman MW.1995. An evaluation of genetic distances for use with micro-satellite loci. Genetics 139:463–471.
Gonzalez-Jose R, Ramırez-Rozzi F, Sardi M, Martınez-AbadıasN, Hernandez M, Pucciarelli HM. 2005. Functional-cranialapproach to the influence of economic strategy on skull mor-phology. Am J Phys Anthropol 128:757–771.
Gower JC. 1975. Generalized procrustes analysis. Psychome-trika 40:33–51.
Greaves WS. 1978. The jaw lever system in ungulates: a newmodel. J Zool 184:271–285.
Gunz P, Harvati K. 2007. The Neanderthal ‘‘chignon’’: variation,integration, and homology. J Hum Evol 52:262–274.
Halverson MS, Bolnick DA. 2008. An ancient DNA test of afounder effect in Native American ABO blood group frequen-cies. Am J Phys Anthropol 137:342–347.
Hanihara T. 1996. Comparison of craniofacial features of majorhuman groups. Am J Phys Anthropol 99:389–412.
Hanson TE, Pearson OM. 2007. Fitting Manova models withmissing continuous or ordinal data using reference priors.Commun Stat Simulat 36:621–630.
Harvati K. 2003. The Neanderthal taxonomic position: modelsof intra-and inter-specific craniofacial variation. J Hum Evol44:107–132.
Harvati K, Weaver TD. 2006a. Human cranial anatomy and thedifferential preservation of population history and climate sig-natures. Anat Rec A 288:1225–1233.
Harvati K, Weaver TD. 2006b. Reliability of cranial morphologyin reconstructing Neanderthal phylogeny. In: Harvati K, Har-rison T, editors. Neanderthals revisited: new approaches andperspectives. Dordrecht: Springer. p 239–254.
Hennessy RJ, Stringer CB. 2002. Geometric morphometricstudy of the regional variation of modern human craniofacialform. Am J Phys Anthropol 117:37–48.
Hernandez M, Lalueza C, Garcıa-Moro C. 1997. Fueguian cra-nial morphology: the adaptation to a cold, harsh environment.Am J Phys Anthropol 103:103–117.
Hilloowala RA, Trent RB. 1987. Supraorbital ridge and ma-sticatory apparatus II: Humans (Eskimos). Hum Evol 3:351–356.
Holm S. 1979. A simple sequentially rejective multiple test pro-cedure. Scand J Stat 6:65–70.
Hood GM. 2008. PopTools version 3.0.2. Available on the inter-net URL at: http://www.cse.csiro.au/poptools.
Howells WW. 1973. Cranial variation in man. Pap Peabody MusAm Archaeol Ethnol 67:1–259.
Howells WW. 1989. Skull shapes and the map: craniometricanalyses in the dispersion of modern Homo. Pap PeabodyMus Am Archaeol Ethnol 79:1–189.
Hrdlicka A. 1910. Contribution to the anthropology of central andSmith Sound Eskimo. Anthrop Pap AmMus nat Hist 5:177–280.
Hublin J-J. 1986. Some comments on the diagnostic features ofHomo erectus. Anthropos (Brno) 23:175–187.
Hylander WL, Picq PG, Johnson KR. 1991. Masticatory-stresshypothese and the supraorbital region of primates. Am JPhys Anthropol 86:1–36.
Kaiser HF. 1961. A note on Guttman’s lower bound for the num-ber of common factors. Br J Psychol 14:1–2.
Kelly RL. 1995. The foraging spectrum: diversity in hunter-gatherer lifeways. Washington, DC: Smithsonian InstitutionPress.
Klingenberg CP. 2008. MorphoJ: faculty of life sciences, Univer-sity of Manchester, UK. Available at: http://www.flywings.org.uk/MorphoJ_page.htm.
Konigsberg LW. 2000. Quantitative variation and genetics. In:Stinson S, Bogin B, Huss-Ashmore R, O’Rourke D, editors.Human biology: an evolutionary and biocultural approach.New York: Wiley. p 135–162.
Konigsberg LW, Kohn LAP, Cheverud JM. 1993. Cranial defor-mation and nonmetric trait variation. Am J Phys Anthropol90:35–48.
Krzanowski WJ. 2000. Principles of multivariate analysis: auser’s perspective. Oxford: Oxford University Press.
Lahr MM. 1995. Patterns of modern human diversification:implications for Amerindian origins. Yearb Phys Anthropol38:163–198.
Lahr MM. 1996. The evolution of modern human diversity.Cambridge: Cambridge University Press.
Lahr MM, Wright RSV. 1996. The question of robusticity andthe relationship between cranial size and shape in Homo sapi-ens. J Hum Evol 31:157–191.
Lalueza C, Hernandez M, Garcıa-Moro C. 1997. La morfologıafacial de las poblaciones fueguinas: >reflejo de una adaptacional frıo? An Inst Patagon Ser Cs Hum 25:45–58.
Lande R. 1992. Neutral theory of quantitative genetic variancein an island model with local extinction and colonization. Evo-lution 46:381–389.
Larsen CS. 1981. Skeletal and dental adaptations to the shift toagriculture on the Georgia Coast. Curr Anthropol 22:422–423.
Larsen CS. 1982. The anthropology of St. Catherines Island. 3,Prehistoric human biological adaptation. Anthrop Pap AmMus Nat Hist 57:157–270.
113CRANIAL ROBUSTICITY IN HOMO SAPIENS
American Journal of Physical Anthropology
Larsen CS. 1984. Health and disease in prehistoric Georgia: thetransition to agriculture. In: Cohen MN, Armelagos GJ, edi-tors. Paleopathology at the origins of agriculture. Orlando,FL: Academic Press. p 367–392.
Larsen CS. 1995. Biological changes in human populations withagriculture. Ann Rev Anthropol 24:185–213.
Larsen CS. 1997. Bioarchaeology: interpreting behavior fromthe human skeleton. Cambridge: Cambridge University Press.
Larsen CS, Ruff CB. 1994. The stresses of conquest in SpanishFlorida: structural adaptation and change before and aftercontact. In: Larsen CS, Milner GR, editors. In the wake ofcontact: biological responses to conquest. New York: Wiley-Liss. p 21–34.
Leonard WR, Sorensen MV, Galloway VA, Spencer GJ, MosherMJ. 2002. Climatic influences on basal metabolic rates amongcircumpolar populations. Am J Hum Biol 14:609–620.
Leigh SR, Relethford JH, Park PB, Konigsberg LW. 2003. Mor-phological differentiation of Gorilla subspecies. In: Taylor AB,Goldsmith ML, editors. Gorilla biology: a multidisciplinary per-spective. Cambridge: Cambridge University Press. p 104–131.
Lieberman DE. 1996. How and why humans grow thin skulls:experimental evidence for systemic cortical robusticity. Am JPhys Anthropol 101:217–236.
Lieberman DE, Krovitz GE, Yates FW, Devlin M, St. Claire M.2004. Effects of food processing on masticatory strain and cra-niofacial growth in a retrognathic face. J Hum Evol 46:655–677.
Lopez-Fanjul C, Fernandez A, Toro MA. 2003. The effect of neu-tral nonadditive gene action on the quantitative index of pop-ulation divergence. Genetics 164:1627–1633.
Lynch M, Walsh JB. 1998. Genetics and analysis of quantitativetraits. Sunderland, MA: Sinauer Associates.
Mantel N. 1967. The detection of disease clustering and a gener-alized regression approach. Cancer Res 27:209–220.
Mardia KV, Bookstein FL, Moreton IJ. 2000. Statistical assess-ment of bilateral symmetry of shapes. Biometrika 87:285–300.
McNulty KP. 2003. Geometric morphometric analyses of extantand fossil hominoid craniofacial morphology, Ph.D. disserta-tion. New York: City University of New York.
Mulligan CJ, Hunley K, Cole S, Long JC. 2004. Populationgenetics, history, and health patterns in Native Americans.Annu Rev Genomics Hum Genet 5:295–315.
New M, Hulme M, Jones P. 1999. Representing twentieth-cen-tury space-time climate variability: I, development of a 1961–90 mean monthly terrestrial climatology. J Clim 12:829–856.
New M, Hulme M, Jones P. 2000. Representing twentieth-cen-tury space-time climate variability. part II: development of1901–96 monthly grids of terrestrial surface climate. J Clim13:2217–2238.
Perez SI, Bernal V, Gonzalez PN. 2007. Morphological differen-tiation of aboriginal human populations from Tierra del Fuego(Patagonia): implications for South American peopling. Am JPhys Anthropol 133:1067–1079.
Perzigian AJ, Tench PA, Braun DJ. 1984. Prehistoric health inthe Ohio River Valley. In: Cohen MN, Armelagos GJ, editors.Paleopathology at the origins of agriculture London. London:Academic Press. p 347–366.
Ramachandran S, Deshpande O, Roseman CC, Rosenberg NA,Feldman MW. 2005. Support from the relationship of geneticand geographic distance in human populations for a serialfounder effect originating in Africa. Proc Natl Acad Sci USA102:15942–15947.
Ravosa MJ. 1991. Interspecific perspecitve on mechanical andnonmechanical models of primate circumorbital morphology.Am J Phys Anthropol 86:369–396.
Rightmire GP. 1990. The evolution of Homo erectus: comparativeanatomical studies of an extinct human species. New York:Cambridge University Press.
Rohlf FJ. 1999. Shape statistics: procrustes superimpositionsand tangent spaces. J Classif 16:197–223.
Rohlf FJ, Corti M. 2000. Use of two-block partial least-squaresto study covariation in shape. Syst Biol 49:740–753.
Rohlf FJ, Slice D. 1990. Extensions of the procrustes method forthe optimal superimposition of landmarks. Syst Zool 39:40–59.
Roseman CC. 2004. Detecting inter-regionally diversifying natu-ral selection on modern human cranial form using matchedmolecular and morphometric data. Proc Natl Acad Sci USA101:12824–12829.
Roseman CC, Weaver TD. 2004. Multivariate apportionment ofglobal human craniometric diversity. Am J Phys Anthropol125:257–263.
Rosenberg NA, Mahajan S, Ramachandran S, Zhao C, PritchardJK, Feldman MW. 2005. Clines, clusters, and the effect ofstudy design on the inference of human population structure.PLoS Genet 1:e1–e70.
Rosenberg NA, Pritchard JK, Weber JL, Cann HM, Kidd KK,Zhivotovsky LA, Feldman MW. 2002. Genetic structure ofhuman populations. Science 298:2381–2385.
Ross CF, Hylander WL. 1996. In vivo and in vitro bone strainanalysis of the circumorbital region of Aotus and the func-tion of the postorbital septum. Am J Phys Anthropol 101:183–215.
Russell MD. 1985. The supraobital torus: a most remarkable pe-culiarity. Curr Anthropol 26:337–350.
Sardi ML, Novellino PS, Pucciarelli HM. 2006. Craniofacialmorphology in the Argentine Center-West: consequences ofthe transition to food production. Am J Phys Anthropol 130:330–343.
Schwartz JH. 2004. Getting to know Homo erectus. Science305:53–54.
Singleton M. 2005. Geometric morphometric analysis of func-tional divergence of mangabey facial form. J Anthropol Sci82:29–45.
Slice DE. 1998. Morpheus et al.: software for morphometricresearch. Department of Ecology and Evolution (Stony Brook,New York): State University of New York.
Smith HF, Terhune CE, Lockwood CA. 2007. Genetic, geo-graphic, and environmental correlates of human temporalbone variation. Am J Phys Anthropol 134:312–322.
Smouse PE, Long JC, Sokal RT. 1986. Multiple regression andcorrelation extensions of the Mantel test of matrix correspon-dence. Syst Zool 35:627–632.
Spencer MA. 1998. Force production in the primate masticatorysystem—electromyographic tests of biomechanical hypotheses.J Hum Evol 34:25–54.
Spencer MA. 1999. Constraints on masticatory system evol-ution in anthropoid primates. Am J Phys Anthropol 108:483–506.
Spencer MA, Demes B. 1993. Biomechanical analysis of mastica-tory system configuration in Neandertals and Inuits. Am JPhys Anthropol 91:1–20.
Spencer MA, Ungar PS. 2000. Craniofacial morphology, diet andincisor use in three Native American populations. Int J Osteo-archaeol 10:229–241.
Strand Viodarsdottir U, O’Higgins P, Stringer CB. 2002. A geo-metric morphometric study of regional differences in the on-togeny of the modern human facial skeleton J Anat 201:211–229.
Stringer CB. 1984. The definition of Homo erectus and the exis-tence of the species in Africa and Europe. Cour Forsch InstSenckenberg 69:131–143.
Villmoare B. 2005. Metric and non-metric randomizationmethods, geographic variation, and the single-species hy-pothesis for Asian and African Homo erectus. J Hum Evol49:680–701.
Vogl C, Atchley WC, Cowley DE, Crenshaw P, Murray JD,Pomp D. 1993. The epigenetic influence of growth hormone onskeletal development. Growth Dev Aging 57:163–182.
Walker PL. 2008. Sexing skulls using discriminant functionanalysis of visually assessed traits. Am J Phys Anthropol 136:39–50.
Wang S, Lewis CM Jr, Jakobsson M, Ramachandran S, Ray N,Bedoya G, Rojas W, Parra MV, Molina JA, Gallo C, MazzottiG, Poletti G, Hill K, Hurtado AM, Labuda D, Klitz W, Bar-rantes R, Bortolini MC, Salzano FM, Petzl-Erler ML, TsunetoLT, Llop E, Rothhammer F, Excoffier L, Feldman MW, Rosen-berg NA, Ruiz-Linares A. 2007. Genetic variation and popula-tion structure in Native Americans. PLoS Genet 3:e185.
114 K.L. BAAB ET AL.
American Journal of Physical Anthropology
Weaver TD, Roseman CC, Stringer CB. 2007. Were Neanderthaland modern human cranial differences produced by naturalselection or genetic drift? J Hum Evol 53:135–145.
Wolpoff MH. 1985. On explaining the supraorbital torus. CurrAnthropol 26:522.
Wolpoff MH. 1999. Paleoanthropology. Boston: McGraw-Hill.Wolpoff MH, Wu XZ, Thorne AG. 1984. Modern Homo sapiens
origins: a general theory of hominid evolution involving thefossil evidence from East Asia. In: Smith FH, and Spencer F,editors. The origins of modern humans. New York: Alan R.Liss. p 411–484.
Wood BA, Richmond BG. 2000. Human evolution: taxonomy andpaleobiology. J Anat 197:19–60.
Wright S. 1934. An analysis of variability in number of digits inan inbred strain of guinea pigs. Genetics 19:506–536.
y’Edynak G, Fleisch S. 1983. Microevolution and biologicaladaptability in the transition from food-collecting to food-producing in the Iron Gates of Yugoslavia. J Hum Evol12:279–296.
Zelditch M, Swiderski D, Sheets DH, Fink W. 2004. Geometricmorphometrics for biologists: a primer. New York: ElsevierAcademic Press.
115CRANIAL ROBUSTICITY IN HOMO SAPIENS
American Journal of Physical Anthropology