Embed Size (px)
Citation preview
INSTITUTE OF PHYSICS PUBLISHING JOURNAL OF PHYSICS: CONDENSED MATTER
J. Phys.: Condens. Matter 18 (2006) 597–611 doi:10.1088/0953-8984/18/2/017
Disorder effects in Nd3+-doped strontiumhexa-aluminate laser crystals
A Lupei1, V Lupei1, C Gheorghe1, L Gheorghe1, D Vivien2, G Aka2 andE Antic-Fidancev2
1 Institute of Atomic Physics, INFLPR-Bucharest, MG 077125, Romania2 Laboratoire Chimie Appliquee de L’etat Solide, ENSCP, 11 rue Pierre et Marie Curie,75231 Paris Cedex 05, France
Received 27 September 2005, in final form 16 November 2005Published 14 December 2005Online at stacks.iop.org/JPhysCM/18/597
AbstractThe high resolution and polarized absorption spectroscopic data of Nd3+-doped,Mg2+-compensated strontium hexa-aluminate Sr1−x NdyLax−yMgxAl12−x O19
(ASL: Nd) crystals in an extended compositional range (0.01 � x � 0.5) arepresented. This crystal offers for the Nd3+ ions a unique crystallographic site(2d) with 12 O2− coordination and ideal D3h symmetry. The optical spectrain all this compositional range contain contributions from two families ofstructural centres, C1 and C2 (with two components C′
2 and C′′2), whose spectral
features are mainly dependent on the composition parameter x . The presenceof these centres is attributed to the cationic disorder. It is inferred that whilethe centres C1 and C2 are connected with the presence or absence of trivalentions in the nearest (2d) coordination sphere normally occupied by Sr2+, the twocomponents C′
2 and C′′2 are associated to the existence or lack of Mg2+ ions
in the nearest sphere of Al3+ tetrahedral (Al3+tetr) sites. This structural disorder
leads to crystal-field perturbations by electric charge difference, although for C1
centres the perturbation by ionic size differences is also evident. The polarizedspectroscopy indicates departures from the selection rules for D3h symmetry forC1 centres, whereas both polarized spectra and crystal-field analysis confirmthe near-D3h symmetry for C2 centres. The composition dependence of thespectra indicates that the distribution of the La3+ and Nd3+ ions at the (2d)sites is random, while that of the Mg2+ in the Al3+
tetr sites is correlated with theformer. The connection of this structural model with the EPR data and withearlier models is discussed.
1. Introduction
Owing to the attractive properties, such as the ability to incorporate large concentrations ofrare-earth or transition-metal ions and to grow high-quality crystals, strontium hexa-aluminateSrAl12O19 is being actively investigated as potential luminescent phosphor or laser material.
0953-8984/06/020597+15$30.00 © 2006 IOP Publishing Ltd Printed in the UK 597
598 A Lupei et al
The strontium hexa-aluminate crystal has hexagonal magnetoplumbite structure [1] with spacegroup P63/mmc, is uniaxial with the c-axis perpendicular to the mirror (a, b at 120◦) plane.The crystallographic unit cell contains two formula units and the Sr2+ ions occupy the (2d)sites with 12 O2− coordination and D3h symmetry, placed in the mirror planes that separate twospinel-like groups, while Al3+ ions occupy several small sites with tetrahedral, octahedral andfivefold bipyramidal O2− coordination. The Nd3+ ions replace part of Sr2+ ions in the largecationic (2d) sites, and charge compensation can be accomplished by a partial substitutionof Al3+ with divalent ions such as Mg2+ [2–5], which show preference for the tetrahedralsites [6, 7]. The crystal growth experiments of Nd-doped Mg-compensated strontium aluminateSr1−x Ndx Mgx Al12−x O19 (in what follows we shall use the abbreviation ASN [3]) have shownthat large amounts of Nd3+ ions (over 20% with respect to the (2d) sites) enable congruentmelting. Although the density of sites available to Nd3+ is quite low (∼0.34 × 1022 cm−3),such large Nd3+ concentrations could produce concentration quenching of emission, that canbe prevented by co-doping the crystals with optically inert La3+ ions [8–10], resulting in ASL:Nd—Sr1−x NdyLax−y Mgx Al12−x O19 crystals with 0 � x < 1 and y � x .
The 12-fold O2− coordination of the (2d) sites determines low covalence for the metal–ligand bonds and low nephelauxetic effects [11, 12] for the doping rare-earth ions as well asmoderate crystal-field effects. This makes the strontium aluminate attractive as a host for short-wavelength quasi-three-level 4F3/2 → 4I9/2 laser emission of Nd3+. Indeed, laser studies [13]on ASL: Nd have evidenced efficient emission at ∼900 nm, one of the shortest wavelengthsfor this range, with a 58% slope efficiency. A major application of this laser is opened by thegeneration, by frequency doubling, of blue laser emission, required by various applicationssuch as display or medicine.
The initial x-ray diffraction, optical spectroscopy and EPR data on Nd3+ in (Ln, Mg)strontium hexa-aluminates, ASN (Ln3+ = Nd3+) [3–5] and ASL (Ln3+ = Nd3+ andLa3+) [8–10], as well as the laser emission characteristics [13],have been interpreted in terms ofa one-centre model, consisting of a substitutional Nd3+ that occupies a (2d) site that preservesthe D3h symmetry, although the x-ray investigations have suggested [4] that for large x someLn3+ ions could also occupy sites of lower symmetry (probably C2v) and extra lines have beenobserved in the optical spectra [4, 5].
Recent high-resolution optical spectroscopy [14–16] of ASL: Nd for 0.2 � x � 0.4,0.05 � y � 0.15 clearly revealed the presence of two types of structural centre, labelled C1
and C2, whose proportion and spectroscopic properties (the line positions, shapes and widths)are determined especially by the composition parameter x . The existence of two structuralcentres could influence the laser emission properties of ASL: Nd, leading to instabilities orwavelength shifts of laser emission. Indeed, by selection of the optimal compositions of thecrystals (with dominance of a unique type of centre) and pumping conditions, improved laseremission characteristics at ∼901 nm (slope efficiency 74%) in ASL: Nd have recently beenobtained [17].
From the composition dependence of the spectral data it was inferred [14–16] that thetwo Nd3+ centres in ASL have the same basic structure, a Nd3+ ion in a (2d) site, with onlybivalent Sr2+ ions in the nearby (2d) cationic sites for C2 centres and with one to six trivalentLn3+ (Nd3+ or La3+) ions for the C1 class of centre. However, several basic problems of thespectroscopic and structural properties of this system remain unsolved:
(i) the validity of the composition dependence on x of the two centres at very low and at highx values;
(ii) the difference between the perturbing effect of the La3+ and Nd3+ ions in nearby (2d) siteson the spectroscopic properties of C1 centres;
Disorder effects in Nd3+-doped strontium hexa-aluminate laser crystals 599
(iii) the perturbing effect of the Mg2+ ions (and their distribution in nearby Al3+ sites) on thespectroscopic properties of the C1 and C2 centres;
(iv) the effect of the cationic disorder on the local symmetry of the centres.
The present paper attempts to answer these problems in a consistent way. The spectral dataon crystals with an extended composition range x = 0.01–0.5 are analysed in section 3.1. Thepolarized absorption data for the two centres are examined in terms of the ideal D3h local group(section 3.2). In section 3.3, improved models for non-equivalent centres are proposed and theprevious interpretations of the optical or EPR spectra are examined. A crystal-field parametriccalculation for the C2 centre energy levels is performed in section 3.4. In section 3.5 theimplication of the presence of two types of structural centres on the laser emission propertiesof these crystals is briefly analysed.
2. Experiment
Crystals of Sr1−x Ndx Mgx Al12−x O19 (ASN) with x = 0.01 and 0.05 and ofSr1−x NdyLax−yMgx Al12−x O19 (ASL: Nd) with x = 0.1–0.5, y = 0.05 were grown byCzochralski method in iridium crucibles. For low x(<0.2) the melt is incongruent [10] and thecrystal growth is difficult; however, small pieces of crystals with magnetoplumbite structurewere obtained.
The absorption spectra at 15 and 300 K were measured with a set-up consisting of a tungstenhalogen lamp, a GDM 1 m monochromator with a resolution of ∼0.3 cm−1, a photon-countingphotomultiplier, a Turbo-MCS multichannel analyser and a helium closed-cycle system for lowtemperatures. The emission spectra at selective excitation were obtained with a CW Ti:sapphirelaser (Coherent 890) pumped with an argon-ion laser. The spectra were analysed with an ARCSpectra Pro-7510 monochromator and detected with a cooled InGaAs photodiode.
3. Results and discussion
3.1. Composition dependence of the Nd3+ spectra in strontium aluminates
The optical spectroscopic measurements over an extended spectral range (up to ∼24 000 cm−1)on Nd3+ in ASN and ASL crystals in the enlarged compositional range 0.01 � x � 0.5confirm the division of the Nd3+ centres in two main classes, named previously [15] C1 and C2,and reveal new composition-dependent spectral features, that manifest selectively in varioustransitions.
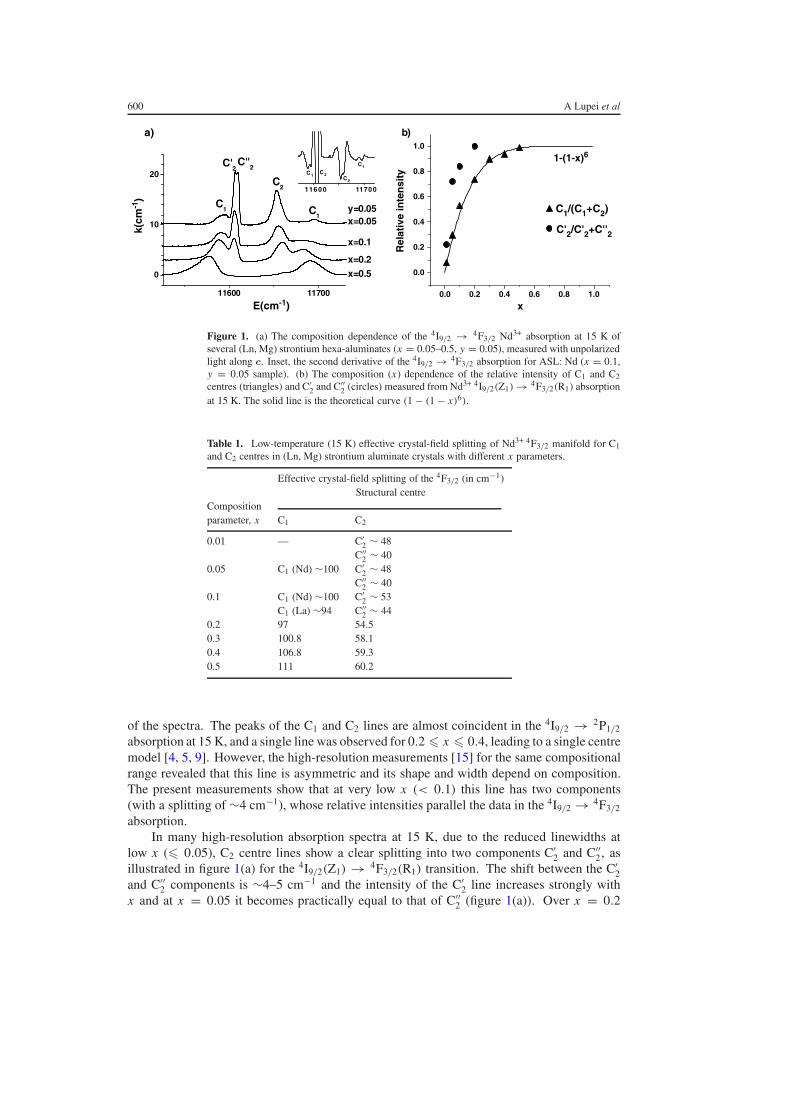
The most pronounced difference between the two Nd3+ structural centres is revealed inthe 4I9/2 → 4F3/2 spectra, as illustrated in figure 1(a). The spectra evidence the predominanceof C2 centres at low x(x < 0.05), and the strong growth of the C1 centre intensity withx : at x = 0.5 its relative intensity is larger than 95%. The effective crystal-field splittingof the 4F3/2 manifold, estimated from the peaks in the low-temperature absorption bands,depends on the composition parameters x for both centres (table 1), being about twice aslarge for the C1 centre than for C2, but with similar barycentres (within ∼2–3 cm−1). TheNd3+ lines in ASL are inhomogeneously broadened: many lines show asymmetric shape,whereas other lines are Gaussian. The full width at half maximum of 4I9/2(Z1) → 4F3/2(R1)
lines is centre and composition dependent; for the C1 centre it increases from ∼12 cm−1 forx = 0.05 to ∼25 cm−1 for x = 0.5, while for the C2 centre the maximum widths are of∼6 cm−1. Due to the smaller widths of the C2 lines, the peak absorption cross-sections ofC2 lines are much stronger than those of C1, a misleading fact in the previous interpretations
600 A Lupei et al
11600 11700
0
10
20
a)
11600 11700
CC
C
C
x=0.5
k(cm
-1)
C''2C'
2
C1
C2
C1 y=0.05
x=0.2
x=0.1
x=0.05
0.0
0.2
0.4
0.6
0.8
1.0
b)
Rel
ativ
e in
ten
sity
1-(1-x)6
C'2/C'2+C''2
C1/(C1+C2)
0.0 0.2 0.4 0.6 0.8 1.0
E(cm-1) x
Figure 1. (a) The composition dependence of the 4I9/2 → 4F3/2 Nd3+ absorption at 15 K ofseveral (Ln, Mg) strontium hexa-aluminates (x = 0.05–0.5, y = 0.05), measured with unpolarizedlight along c. Inset, the second derivative of the 4I9/2 → 4F3/2 absorption for ASL: Nd (x = 0.1,y = 0.05 sample). (b) The composition (x) dependence of the relative intensity of C1 and C2centres (triangles) and C′
2 and C′′2 (circles) measured from Nd3+ 4I9/2(Z1) → 4F3/2(R1) absorption
at 15 K. The solid line is the theoretical curve (1 − (1 − x)6).
Table 1. Low-temperature (15 K) effective crystal-field splitting of Nd3+ 4F3/2 manifold for C1and C2 centres in (Ln, Mg) strontium aluminate crystals with different x parameters.
Effective crystal-field splitting of the 4F3/2 (in cm−1)Structural centre
Compositionparameter, x C1 C2
0.01 — C′2 ∼ 48
C′′2 ∼ 40
0.05 C1 (Nd) ∼100 C′2 ∼ 48
C′′2 ∼ 40
0.1 C1 (Nd) ∼100 C′2 ∼ 53
C1 (La) ∼94 C′′2 ∼ 44
0.2 97 54.50.3 100.8 58.10.4 106.8 59.30.5 111 60.2
of the spectra. The peaks of the C1 and C2 lines are almost coincident in the 4I9/2 → 2P1/2
absorption at 15 K, and a single line was observed for 0.2 � x � 0.4, leading to a single centremodel [4, 5, 9]. However, the high-resolution measurements [15] for the same compositionalrange revealed that this line is asymmetric and its shape and width depend on composition.The present measurements show that at very low x (< 0.1) this line has two components(with a splitting of ∼4 cm−1), whose relative intensities parallel the data in the 4I9/2 → 4F3/2
absorption.In many high-resolution absorption spectra at 15 K, due to the reduced linewidths at
low x (� 0.05), C2 centre lines show a clear splitting into two components C′2 and C′′
2, asillustrated in figure 1(a) for the 4I9/2(Z1) → 4F3/2(R1) transition. The shift between the C′
2and C′′
2 components is ∼4–5 cm−1 and the intensity of the C′2 line increases strongly with
x and at x = 0.05 it becomes practically equal to that of C′′2 (figure 1(a)). Over x = 0.2
Disorder effects in Nd3+-doped strontium hexa-aluminate laser crystals 601
the C′2 component is dominant and accounts for the previously analysed C2 centre [15]. The
two components are almost Gaussian: the C′′2 line is very sharp, ∼1–2 cm−1, while the C′
2component is broader, ∼4–5 cm−1, and its linewidth increases with x . For small x (� 0.1)table 1 gives the crystal-field splittings of 4F3/2 for both components C′′
2 and C′2, while for
larger x it presents those of C2 ≡ C′2.
The relative global intensity of the C1 centre for the new compositions investigated here,estimated from the ratio of the area of the low-temperature 4I9/2(Z1) → 4F3/2(R1) absorptionline to the sum of areas of C1 and C2 lines (triangles in figure 1(b)), confirms an increase withthe parameter x according to the 1 − (1 − x)6 law (continuous line in figure 1(b)) [15]; seelater in section 3.3. The relative intensity of the C′
2 centre with respect to the global intensityof the C′
2 and C′′2 centres (circles in figure 1(b)) grows much stronger with x .
In our previous investigations [15] only the global effects associated to the perturbationsinduced by Ln3+ ions in nearby (2d) sites were observed. In order to detect ionic size effectsof nearby Nd3+ or La3+ ions, the 15 K absorption spectra of Sr1−x NdyLax−yMgxAl12−x O19
with different x , y parameters were compared. Thus, while for the crystal without La3+
(x = y = 0.05) each of the two transitions, 4I9/2(Z1) → 4F3/2(R1) and 4I9/2(Z1) → 4F3/2(R2),of the C1 centre consist of a single line, in the crystal with 0.05 La and 0.05 Nd (x = 0.1,y = 0.05), these transitions are composed of two lines of about the same intensity (seethe second derivative of absorption for x = 0.1, y = 0.05 sample, inset in figure 1(a)).Obviously, these two components of the C1 lines correspond to the centres for which theperturbing effect is determined by Nd3+ (C1 (Nd)-centre) and respectively La3+ (C1 (La)-centre) ions in the nearest (2d) coordination sphere. The crystal-field splitting for C1 (Nd) islarger than for C1 (La) (table 1) and the barycentre of the 4F3/2 manifold is slightly higher. Bykeeping the parameter y constant and increasing x , the intensity of last line becomes dominant(figure 1). Such size effects were not remarked in the 4I9/2 → 4F3/2 absorption spectra of C2
centres.The laser excited emissions of the C1 and C2 centres depend on the parameter x and show
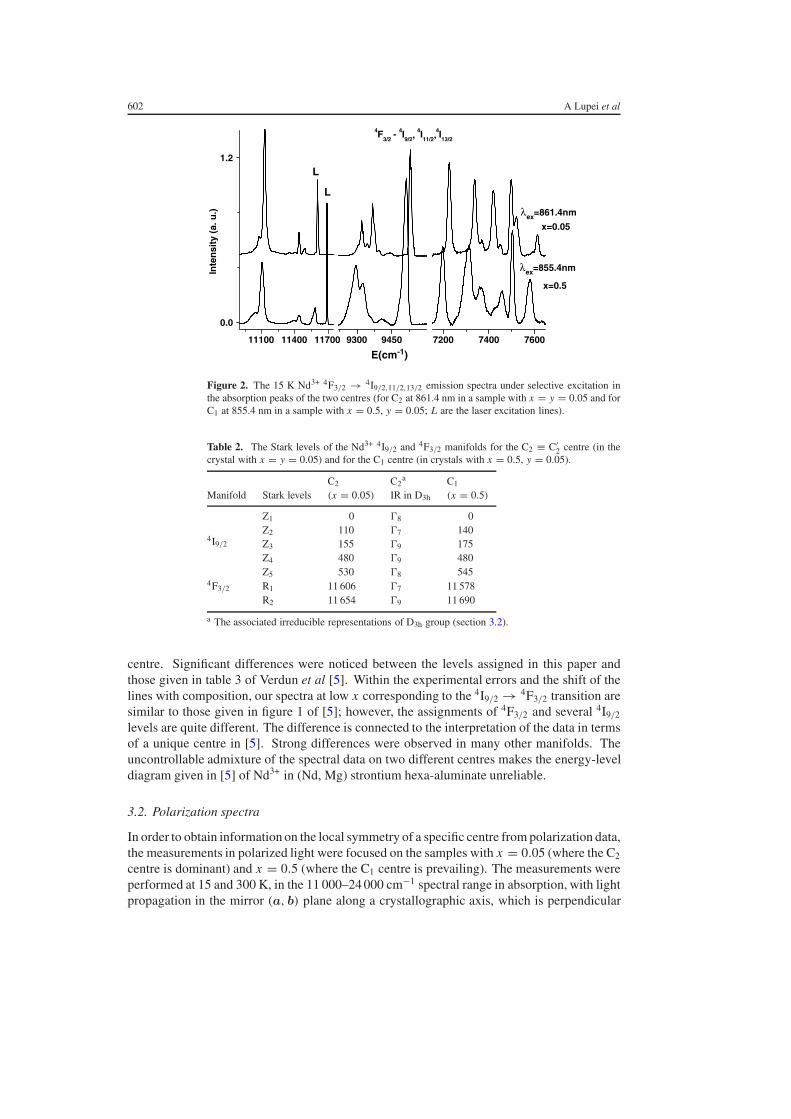
systematic shifts by tuning the excitation inside the absorption lines, especially for the C1 centre.This confirms that the inhomogeneously broadened lines are envelopes of lines correspondingto slightly different structural centres. Figure 2 presents the 15 K 4F3/2 → 4I9/2,11/2,13/2
emission spectra under excitation at the peak of the absorption lines for two crystals where oneor the other centre prevails (x = 0.05 for C2 and x = 0.5 for C1). The excitation was done in4F3/2 (transition Z1 → R2 for C1 and Z1 → R1 for C2) along the c axis; L denotes the laserexcitation wavelengths. It is obvious that the emission spectra for these centres are different.Effective Stark level energies (inferred from the line peaks) for the 4F3/2 and 4I9/2 manifoldsinvolved in the 900 nm laser emission of the C1 centre in the crystal with x = 0.5 and thosefor C2 in case of x = 0.05 are given in table 2. In table 2 the irreducible representations (IRs)of D3h group associated to Stark levels of C2 centre are also given (see section 3.2). Basedon the differences observed in table 2, it is obvious that one cannot speak of an energy-levelscheme for Nd3+ in ASN or ASL in the model of a single centre.
While for the C1 centre one could speak only of the effective energy levels at a givencomposition, the positions of the spectral lines for the C2 ≡ C′
2 Nd3+ centre for x � 0.2 do notchange significantly with x (figure 1). Therefore, an actual experimental energy-level schemecould be tentatively assigned for the C2 Nd3+ centre in ASN from 15 to 300 K absorptionor low-temperature selectively excited emission for the x = 0.05 sample. Whereas in the4IJ ⇔ 4F3/2 transitions the lines belonging to the two centres could be clearly separated,in other ranges, especially at high energies, this identification is more difficult. Part of theexperimentally determined energy levels at 15 K are given in table 3. The experimental Starklevels in parentheses refer to weak lines in the spectra and they could be attributed to the C1
602 A Lupei et al
0.0
1.2
x=0.05
4F3/2
- 4I9/2,
4I11/2,
4I13/2
Inte
nsi
ty (
a. u
.)
L
L
x=0.5
E(cm-1)
λex=855.4nm
λex=861.4nm
9300 9450 7200 7400 760011100 11400 11700
Figure 2. The 15 K Nd3+ 4F3/2 → 4I9/2,11/2,13/2 emission spectra under selective excitation inthe absorption peaks of the two centres (for C2 at 861.4 nm in a sample with x = y = 0.05 and forC1 at 855.4 nm in a sample with x = 0.5, y = 0.05; L are the laser excitation lines).
Table 2. The Stark levels of the Nd3+ 4I9/2 and 4F3/2 manifolds for the C2 ≡ C′2 centre (in the
crystal with x = y = 0.05) and for the C1 centre (in crystals with x = 0.5, y = 0.05).
C2 C2a C1
Manifold Stark levels (x = 0.05) IR in D3h (x = 0.5)
4I9/2
Z1 0 �8 0Z2 110 �7 140Z3 155 �9 175Z4 480 �9 480Z5 530 �8 545
4F3/2 R1 11 606 �7 11 578R2 11 654 �9 11 690
a The associated irreducible representations of D3h group (section 3.2).
centre. Significant differences were noticed between the levels assigned in this paper andthose given in table 3 of Verdun et al [5]. Within the experimental errors and the shift of thelines with composition, our spectra at low x corresponding to the 4I9/2 → 4F3/2 transition aresimilar to those given in figure 1 of [5]; however, the assignments of 4F3/2 and several 4I9/2
levels are quite different. The difference is connected to the interpretation of the data in termsof a unique centre in [5]. Strong differences were observed in many other manifolds. Theuncontrollable admixture of the spectral data on two different centres makes the energy-leveldiagram given in [5] of Nd3+ in (Nd, Mg) strontium hexa-aluminate unreliable.
3.2. Polarization spectra
In order to obtain information on the local symmetry of a specific centre from polarization data,the measurements in polarized light were focused on the samples with x = 0.05 (where the C2
centre is dominant) and x = 0.5 (where the C1 centre is prevailing). The measurements wereperformed at 15 and 300 K, in the 11 000–24 000 cm−1 spectral range in absorption, with lightpropagation in the mirror (a, b) plane along a crystallographic axis, which is perpendicular
Disorder effects in Nd3+-doped strontium hexa-aluminate laser crystals 603
Table 3. Experimental energy levels of the C2 Nd3+ centre in ASN (x = y = 0.05) and calculatedones for the D3h local group including the irreducible representations (IR).
Energy (cm−1) Energy (cm−1)
Theory IR Theory IR2S+1LJ Exp. D3h D3h
2S+1LJ Exp. D3h D3h
0 −8 �8 (13 520) 13 538 �8
110 138 �74F7/2 + 4S3/2 13 567 13 573 �7
4I9/2 155 152 �9 13 714 13 720 �9
480 482 �9 13 734 13 742 �7
530 529 �8 13 740 13 750 �9
(13 803) 13 794 �8
(2069) 2059 �7
2073 2063 �9 14 868 14 872 �74I11/2 (2174) 2167 �7 14 893 14 902 �9
(2208) 2209 �94F9/2 (14 940) 14 941 �8
2235 2236 �8 (14 952) 14 958 �8
2281 2277 �8 15 015 14 986 �9
(3990) 3986 �7 16 036 16 033 �7
(4084) 4085 �7 16 040 16 046 �9
4105 4105 �92H11/2 (16 075) 16 062 �8
4I13/2 (4151) 4153 �7 16 092 16 102 �9
4185 4187 �8 16 110 16 107 �7
4266 4266 �9 (16 176) 16 168 �8
4377 4384 �8
17 298 17 305 �94F3/2 11 606 11 583 �7 — 17 324 �8
11 654 11 651 �9 17 342 17 368 �74G5/2 + 2G7/2 17 465 17 490 �9
(12 600) 12 610 �8 17 538 17 554 �74F5/2 + 2H9/2 12 639 12 635 �7 (17 557) 17 555 �8
12 648 12 644 �9 (17 575) 17 578 �8
12 689 12 668 �9
12 703 12 705 �82P1/2 23 427 23 422 �7
12 845 12 861 �7
— 12 880 �9
(12 972) 12 990 �8
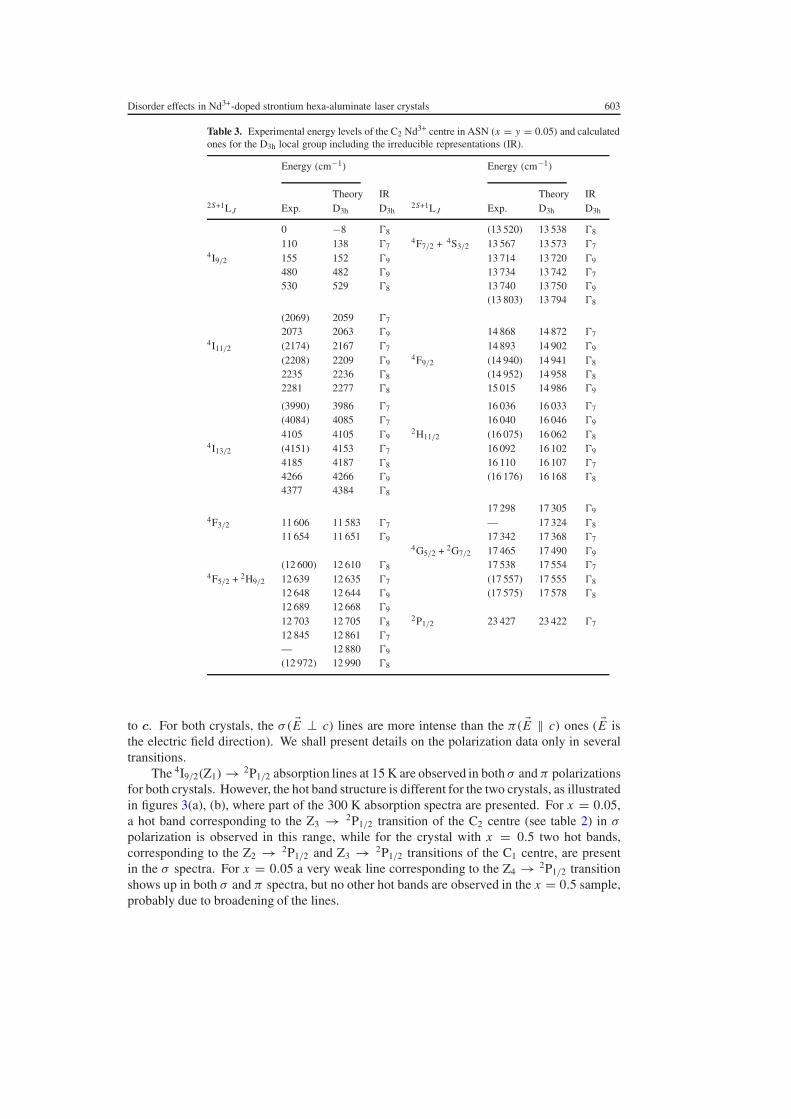
to c. For both crystals, the σ( �E ⊥ c) lines are more intense than the π( �E ‖ c) ones ( �E isthe electric field direction). We shall present details on the polarization data only in severaltransitions.
The 4I9/2(Z1) → 2P1/2 absorption lines at 15 K are observed in both σ and π polarizationsfor both crystals. However, the hot band structure is different for the two crystals, as illustratedin figures 3(a), (b), where part of the 300 K absorption spectra are presented. For x = 0.05,a hot band corresponding to the Z3 → 2P1/2 transition of the C2 centre (see table 2) in σ
polarization is observed in this range, while for the crystal with x = 0.5 two hot bands,corresponding to the Z2 → 2P1/2 and Z3 → 2P1/2 transitions of the C1 centre, are presentin the σ spectra. For x = 0.05 a very weak line corresponding to the Z4 → 2P1/2 transitionshows up in both σ and π spectra, but no other hot bands are observed in the x = 0.5 sample,probably due to broadening of the lines.
604 A Lupei et al
23200 23300 23400 23500
0.0
0.5
x=0.5
σ
π
C1
Z 2-2
P1/
2
Z 3-2
P1/
2Z 3
-2P
1/2
E(cm-1)
0
1
x=0.05
b)
a)
k(cm
-1)
C2
π
σ
Z 1-2
P1/
2
k(cm
-1)
Figure 3. The polarized Nd3+ 4I9/2 → 2P1/2 absorption spectra at 300 K of two (Ln, Mg) strontiumhexa-aluminate samples: (a) x = y = 0.05 and (b) x = 0.5, y = 0.05.
11400 11550 11700
0
1
Z 3-R
2(C
1)
R1(
C1)
R2(
C1)
x=0.5
σπ
0
1
Z 3-R
1(C
2)
b)
a)
Z 3-R
2(C
2)
Z 2-R
2(C
2)
R1(
C1)
R1(
C2)
R2(
C2)
R2(
C1)
x=0.05
π
σ
E(cm-1)
k(cm
-1)
k(cm
-1)
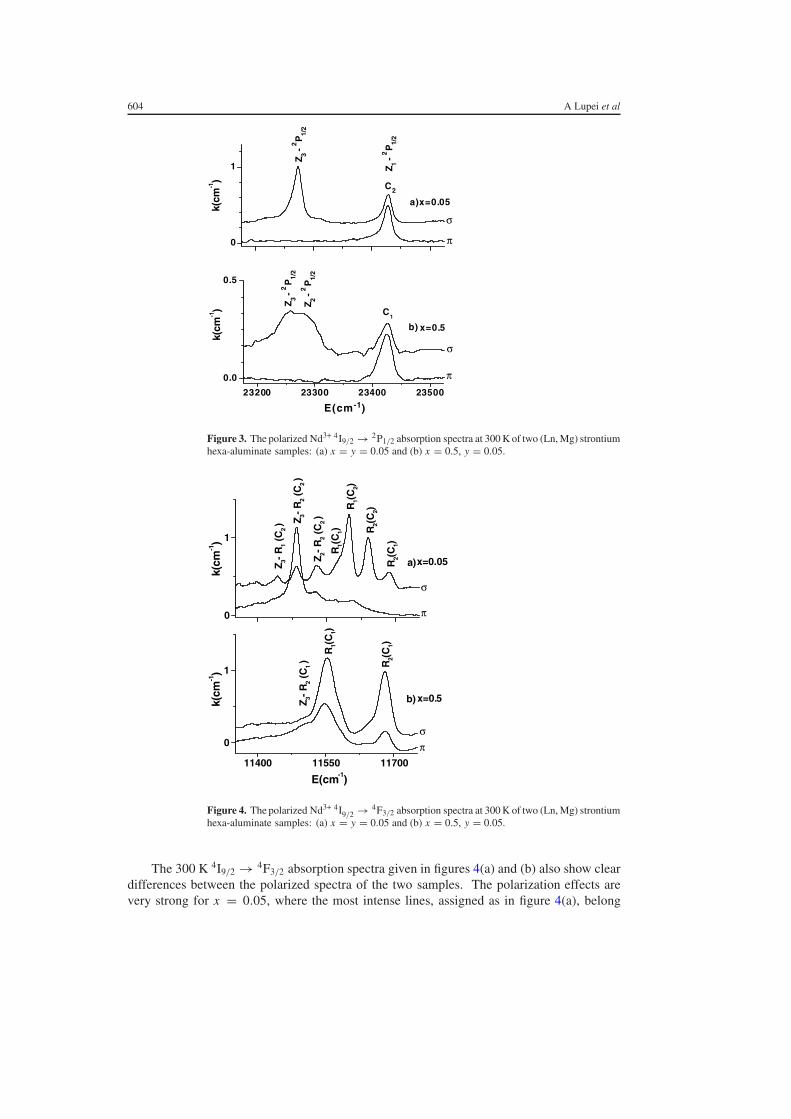
Figure 4. The polarized Nd3+ 4I9/2 → 4F3/2 absorption spectra at 300 K of two (Ln, Mg) strontiumhexa-aluminate samples: (a) x = y = 0.05 and (b) x = 0.5, y = 0.05.
The 300 K 4I9/2 → 4F3/2 absorption spectra given in figures 4(a) and (b) also show cleardifferences between the polarized spectra of the two samples. The polarization effects arevery strong for x = 0.05, where the most intense lines, assigned as in figure 4(a), belong
Disorder effects in Nd3+-doped strontium hexa-aluminate laser crystals 605
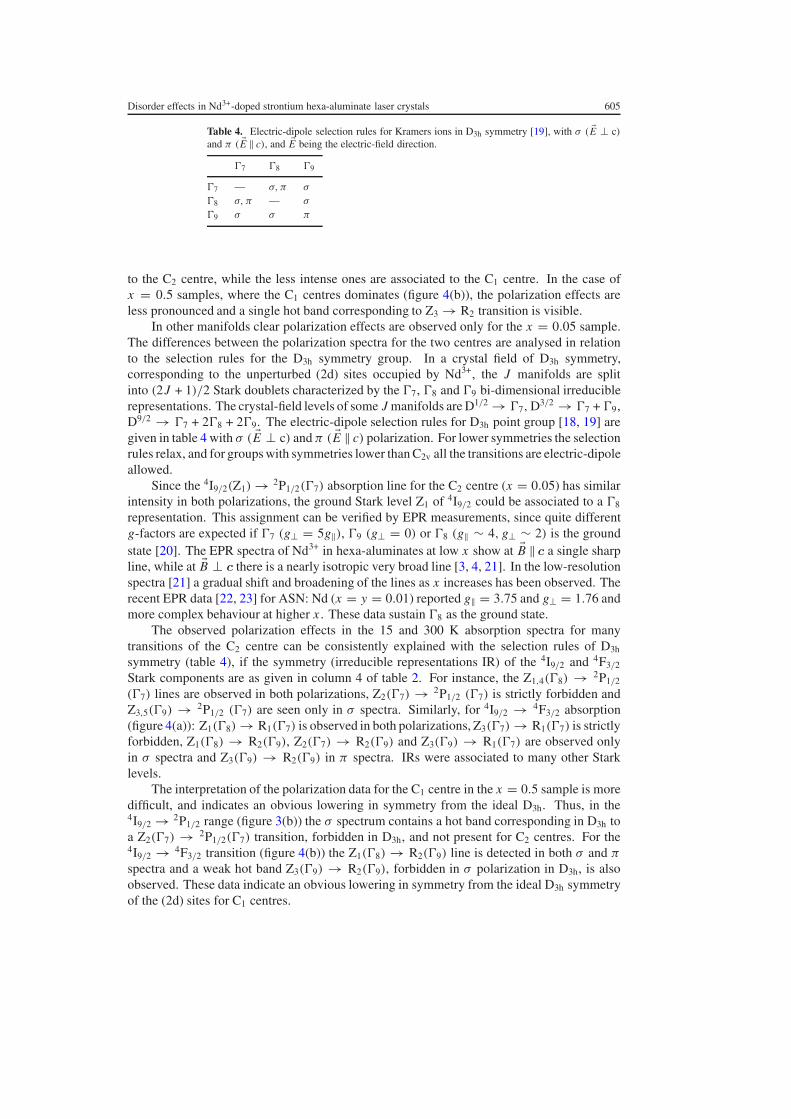
Table 4. Electric-dipole selection rules for Kramers ions in D3h symmetry [19], with σ ( �E ⊥ c)and π ( �E ‖ c), and �E being the electric-field direction.
�7 �8 �9
�7 — σ, π σ
�8 σ, π — σ
�9 σ σ π
to the C2 centre, while the less intense ones are associated to the C1 centre. In the case ofx = 0.5 samples, where the C1 centres dominates (figure 4(b)), the polarization effects areless pronounced and a single hot band corresponding to Z3 → R2 transition is visible.
In other manifolds clear polarization effects are observed only for the x = 0.05 sample.The differences between the polarization spectra for the two centres are analysed in relationto the selection rules for the D3h symmetry group. In a crystal field of D3h symmetry,corresponding to the unperturbed (2d) sites occupied by Nd3+, the J manifolds are splitinto (2J + 1)/2 Stark doublets characterized by the �7, �8 and �9 bi-dimensional irreduciblerepresentations. The crystal-field levels of some J manifolds are D1/2 → �7, D3/2 → �7 + �9,D9/2 → �7 + 2�8 + 2�9. The electric-dipole selection rules for D3h point group [18, 19] aregiven in table 4 with σ ( �E ⊥ c) and π ( �E ‖ c) polarization. For lower symmetries the selectionrules relax, and for groups with symmetries lower than C2v all the transitions are electric-dipoleallowed.
Since the 4I9/2(Z1) → 2P1/2(�7) absorption line for the C2 centre (x = 0.05) has similarintensity in both polarizations, the ground Stark level Z1 of 4I9/2 could be associated to a �8
representation. This assignment can be verified by EPR measurements, since quite differentg-factors are expected if �7 (g⊥ = 5g‖), �9 (g⊥ = 0) or �8 (g‖ ∼ 4, g⊥ ∼ 2) is the groundstate [20]. The EPR spectra of Nd3+ in hexa-aluminates at low x show at �B ‖ c a single sharpline, while at �B ⊥ c there is a nearly isotropic very broad line [3, 4, 21]. In the low-resolutionspectra [21] a gradual shift and broadening of the lines as x increases has been observed. Therecent EPR data [22, 23] for ASN: Nd (x = y = 0.01) reported g‖ = 3.75 and g⊥ = 1.76 andmore complex behaviour at higher x . These data sustain �8 as the ground state.
The observed polarization effects in the 15 and 300 K absorption spectra for manytransitions of the C2 centre can be consistently explained with the selection rules of D3h
symmetry (table 4), if the symmetry (irreducible representations IR) of the 4I9/2 and 4F3/2
Stark components are as given in column 4 of table 2. For instance, the Z1,4(�8) → 2P1/2
(�7) lines are observed in both polarizations, Z2(�7) → 2P1/2 (�7) is strictly forbidden andZ3,5(�9) → 2P1/2 (�7) are seen only in σ spectra. Similarly, for 4I9/2 → 4F3/2 absorption(figure 4(a)): Z1(�8) → R1(�7) is observed in both polarizations, Z3(�7) → R1(�7) is strictlyforbidden, Z1(�8) → R2(�9), Z2(�7) → R2(�9) and Z3(�9) → R1(�7) are observed onlyin σ spectra and Z3(�9) → R2(�9) in π spectra. IRs were associated to many other Starklevels.
The interpretation of the polarization data for the C1 centre in the x = 0.5 sample is moredifficult, and indicates an obvious lowering in symmetry from the ideal D3h. Thus, in the4I9/2 → 2P1/2 range (figure 3(b)) the σ spectrum contains a hot band corresponding in D3h toa Z2(�7) → 2P1/2(�7) transition, forbidden in D3h, and not present for C2 centres. For the4I9/2 → 4F3/2 transition (figure 4(b)) the Z1(�8) → R2(�9) line is detected in both σ and π
spectra and a weak hot band Z3(�9) → R2(�9), forbidden in σ polarization in D3h, is alsoobserved. These data indicate an obvious lowering in symmetry from the ideal D3h symmetryof the (2d) sites for C1 centres.
606 A Lupei et al
3.3. The models for non-equivalent Nd3+ centres in ASN and ASL
The new spectroscopic data obtained in this work enable the refinement of the structuralmodels [15] for the non-equivalent Nd3+ centres in magnesium-compensated strontium hexa-aluminates Sr1−x NdyLax−y Mgx Al12−x O19.
The barycentres of the manifolds are mainly determined by the nature and structure of thefirst anionic coordination sphere, via the nephelauxetic effect [11, 12, 24]. Thus, the closenessof the energies of the barycentres of the C1 and C2 centres and their quite high energy indicatethat the Nd3+ ions occupy, for both classes of centre, large (2d) sites with the same ioniccoordination to 12 O2−. At the same time, the strong differences between the crystal-fieldeffects in the 4F3/2 manifold for these centres (table 1) and less in other manifolds, suggest thatthe changes are induced by more distant perturbations that influence mainly the second-orderparameters B2
q and less the fourth- or sixth-order ones. Such perturbations can originate from
the cationic disorder of the nearest coordination spheres around the Nd3+ ion. In ASL, Sr2+
and Ln3+ (Nd3+ or La3+) can occupy large (2d) sites and Mg2+ enter in Al3+ sites. The maineffects in the crystal field at the Nd3+ ion are expected from the electric charge differences.The spectral effects of this disorder are further analysed.
The probability of occurrence of the structural centres. The experimental compositiondependence of the relative intensity of the C1 centre to the total intensity of the spectra(C1 +C′
2 +C′′2) satisfies the 1− (1− x)6 law for the entire composition range (figure 1(b)). This
dependence corresponds to the calculated probability of random and equiprobable occupationof the nearest-neighbour (2d) coordination sphere (at 5.56 Å) by one to six trivalent Ln3+ (Nd3+
or La3+) ions replacing bivalent Sr2+ ions and the assumption that the integral absorption cross-sections for the two centres are almost equal. The probability of occurrence of a perturbedcentre with n out of the m available sites on a given coordination sphere around the centralNd3+ ion is
Pmn = m!
(m − n)!n!pn(1 − p)m−n (1)
where p is the probability of occupation of a site on this sphere. For random equiprobableplacement of Ln3+ in the (2d) sites, p = x . The probability of occurrence of the centres withno Ln3+ ions on the first coordination sphere of six (2d) sites—C2 centres—is (1 − x)6, whilethe global probability of occurrence for all the perturbed centres having one to six Ln3+ ionson this sphere would be equal to 1 − (1 − x)6–C1 centres. The data for x = 0.5 confirmthe saturation character of the dependence on x for C1 centres. The assumption that theintegral absorption cross-sections for the two centres are similar is based on the fact that forthe transitions between 4IJ and 4F3/2 manifolds, the �2 Judd–Ofelt parameter, which containsthe low-k crystal-field terms that are more influenced by the distant cationic perturbations, iszero. On the other hand, the high-k crystal-field terms, which influence the active Judd–Ofeltparameters of these transitions, are less sensitive to distant perturbations.
This structural model for the C1 and C2 families of centres is consistent with the emissiondecay measurements on ASL: Nd crystals [15] with x = 0.2–0.4 and y = 0.05–0.15: theemission decay for the two centres differs only at early times up to ∼200 µs, being faster forC1; then they run in parallel. It was inferred that this difference originates from the energytransfer inside the first Nd3+–Nd3+ pairs that, according to this structural model, are possibleonly for C1 centres. The effect of the energy transfer on the emission decay of the C2 centrewhere the nearest-neighbour Nd3+ pairs are excluded indicates that this transfer is inducedmainly by electric-dipole interactions between the excited and non-excited Nd3+ ions.
Disorder effects in Nd3+-doped strontium hexa-aluminate laser crystals 607
The selective perturbing effects of Nd3+ and La3+ ions. Up to now only the global effect ofperturbation due to the electric charge differences between Sr2+ and Ln3+ ions was considered.The differences between C1 (La) and C1 (Nd) lines show that the perturbation is due to bothelectric charge and ionic size differences. Due to the different occupation numbers (1 to 6) andto various possibilities of occupation of nearest sites by Ln3+ ions, the C1 centre correspondsto a family of perturbed structural centres of various local symmetries. This is sustained bythe shapes and widths of the lines. The perturbations produced by Ln3+ in sites from other(2d) coordination spheres are not resolved, owing to the large distances (at minimum 9.62 Å),but they contribute to broadening of C1 centre lines.
The perturbing effects of Mg2+ ions. The spectral effects due to the Mg2+ charge-compensatorions are not evident in samples with large x parameters. However, the spectral structureobserved for low-x (<0.1) samples in the range of C2 centre lines, C′
2 and C′′2 lines, could be
associated to Mg2+ effects. As shown in earlier studies [6, 7], the Mg2+ ions in ASL substitutepreferentially the tetrahedral Al3+ sites (Al3+
tetr). The closest coordination sphere of Al3+tetr sites at
5.85 Å contains six sites forming two triangles, above and below the mirror plane (figures 5, 6)and do not share common O2− with the central Nd3+ ion. However, there are many Al3+ sitescloser to a (2d) site with other O2− coordinations: 3 bipyramidal at ∼3.2 Å and 24 octahedralsites (at 3.46, 3.47, or 5.26 Å). The crystal-field perturbation due to the charge disorder inducedby Mg2+ in Al3+
tetr sites is weaker than in the case of Ln3+ ions due mainly to the much smallerrelative concentration of Mg2+ to that of all Al3+ ions. This is consistent with the small shiftbetween the C′
2 and C′′2 centres lines. It is thus very likely that the two components of the C2
lines reflect the crystal-field perturbing effect of the Mg2+ ions: the C′′2 centre could correspond
to a Nd3+ centre without any Mg2+ ion in the nearest coordination sphere of Al3+tetr sites, while
the component C′2 corresponds to Nd3+ ions with such perturbing Mg2+ ions on this sphere.
The C2 centres, having no Ln3+ near neighbours, require only the charge compensation of thecentral Nd3+ ion. The statistics of distribution of the Mg2+ ions is complex, since the placementof the Mg2+ ions would not be random and independent of the placement of the Ln3+ ions, but itwill be rather correlated with it, i.e., the Mg2+ ions will have the tendency to replace Al3+ ionsin vicinity of the Ln3+ ions. Obviously, the Mg2+ ions perturb the crystal field of the C1 centrestoo: in this case more than one Mg2+ ion could be present on the near-neighbour tetrahedralcoordination sphere, in correlation with the occupation of the nearest (2d) coordination sphereby Ln3+ ions.
The polarization effects and local symmetry of the centres. The polarization data show thatthe local symmetry for the C2 centres is very close to D3h, while it is lower for C1 centres.Since the central Nd3+ ion shares the surrounding O2− ions with the near-neighbour (2d) sites,the presence of Ln3+ ions in these sites could distort by electric charge or ionic size the anionicenvironment, leading to lowering of the local symmetry for C1 centres. These facts sustain theresults of x ray measurements [4] for high x parameter.
Another argument for a unique centre model has been based on the EPR data [3, 4, 21].The low-resolution EPR spectra of Nd3+ in hexa-aluminates show at �B ‖ c a single sharp line,while at �B ⊥ c they show a nearly isotropic very broad one [3, 4] and a gradual shift andbroadening of the lines as x increases [21]. Recent EPR measurements [22, 23] at 15 K onSr1−x Ndx Mgx Al12−x O19 (ASN) crystals with x � 0.2 show that, if at low x the spectrum withthe magnetic field parallel to the c-axis contains a single line, at larger Nd3+ concentrations,several pairs of satellites placed almost symmetrically around this line were observed. Athigher x or in lanthanum hexa-aluminates [21] this structure is not resolved in the EPR spectra.
608 A Lupei et al
c
b
a
Nd3+ (2d)
Sr2+ -5.56 Å (2d)
O2- -2.69 Å . 2.78 Å
Al3+ /Mg2+ -5.83 Å (4f)
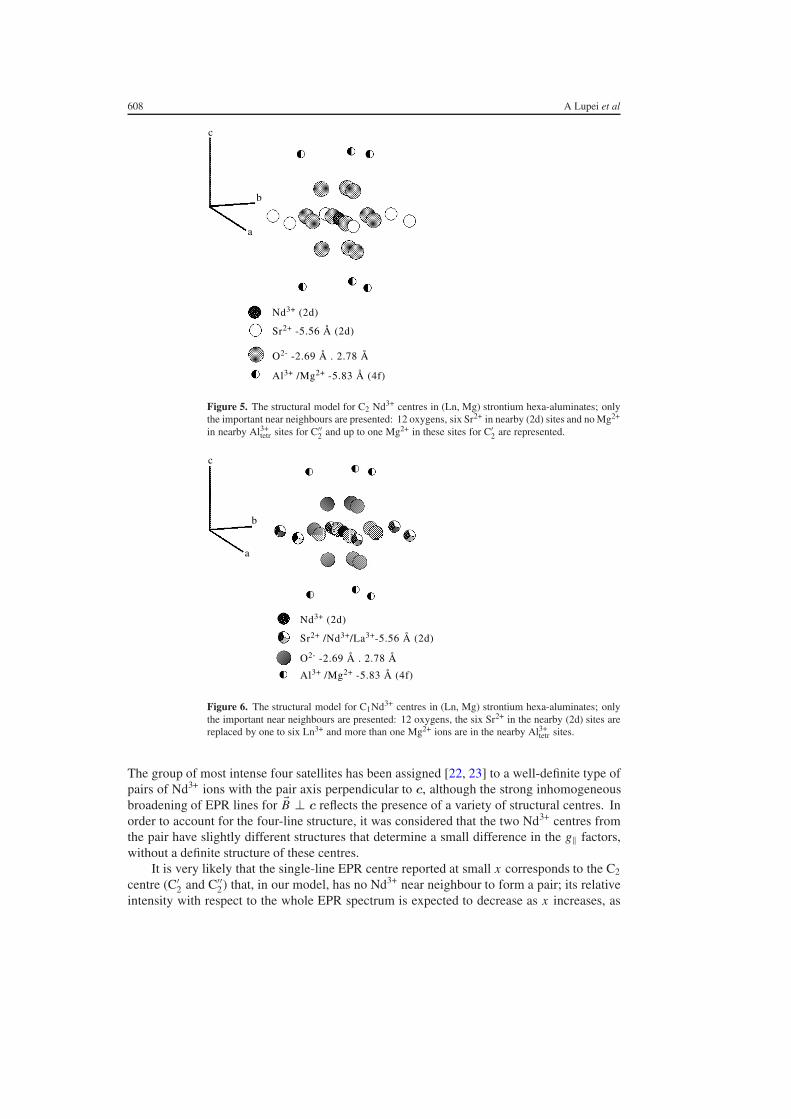
Figure 5. The structural model for C2 Nd3+ centres in (Ln, Mg) strontium hexa-aluminates; onlythe important near neighbours are presented: 12 oxygens, six Sr2+ in nearby (2d) sites and no Mg2+
in nearby Al3+tetr sites for C′′
2 and up to one Mg2+ in these sites for C′2 are represented.
Nd3+ (2d)
Sr2+ /Nd3+/La3+-5.56 Å (2d)
O2- -2.69 Å . 2.78 Å
Al3+ /Mg2+ -5.83 Å (4f)
c
b
a
Figure 6. The structural model for C1Nd3+ centres in (Ln, Mg) strontium hexa-aluminates; onlythe important near neighbours are presented: 12 oxygens, the six Sr2+ in the nearby (2d) sites arereplaced by one to six Ln3+ and more than one Mg2+ ions are in the nearby Al3+
tetr sites.
The group of most intense four satellites has been assigned [22, 23] to a well-definite type ofpairs of Nd3+ ions with the pair axis perpendicular to c, although the strong inhomogeneousbroadening of EPR lines for �B ⊥ c reflects the presence of a variety of structural centres. Inorder to account for the four-line structure, it was considered that the two Nd3+ centres fromthe pair have slightly different structures that determine a small difference in the g‖ factors,without a definite structure of these centres.
It is very likely that the single-line EPR centre reported at small x corresponds to the C2
centre (C′2 and C′′
2) that, in our model, has no Nd3+ near neighbour to form a pair; its relativeintensity with respect to the whole EPR spectrum is expected to decrease as x increases, as
Disorder effects in Nd3+-doped strontium hexa-aluminate laser crystals 609
experimentally observed [22, 23]. The C1 centres in ASN are in fact pairs or higher assembliesof Nd3+ ions in the nearest-neighbour (2d) sites and there is a quite large variety of such pairs.EPR pairs could correspond to C1 centres for which the surrounding of the Nd3+ ions differs,for instance by the composition of the nearest Al3+
tetr sphere. The gradual shift of the g-valuesand the broadening of EPR lines with x could indicate the increasing complexity of C1 centresconnected with the structural disorder in the (2d) and Al3+
tetr sites.
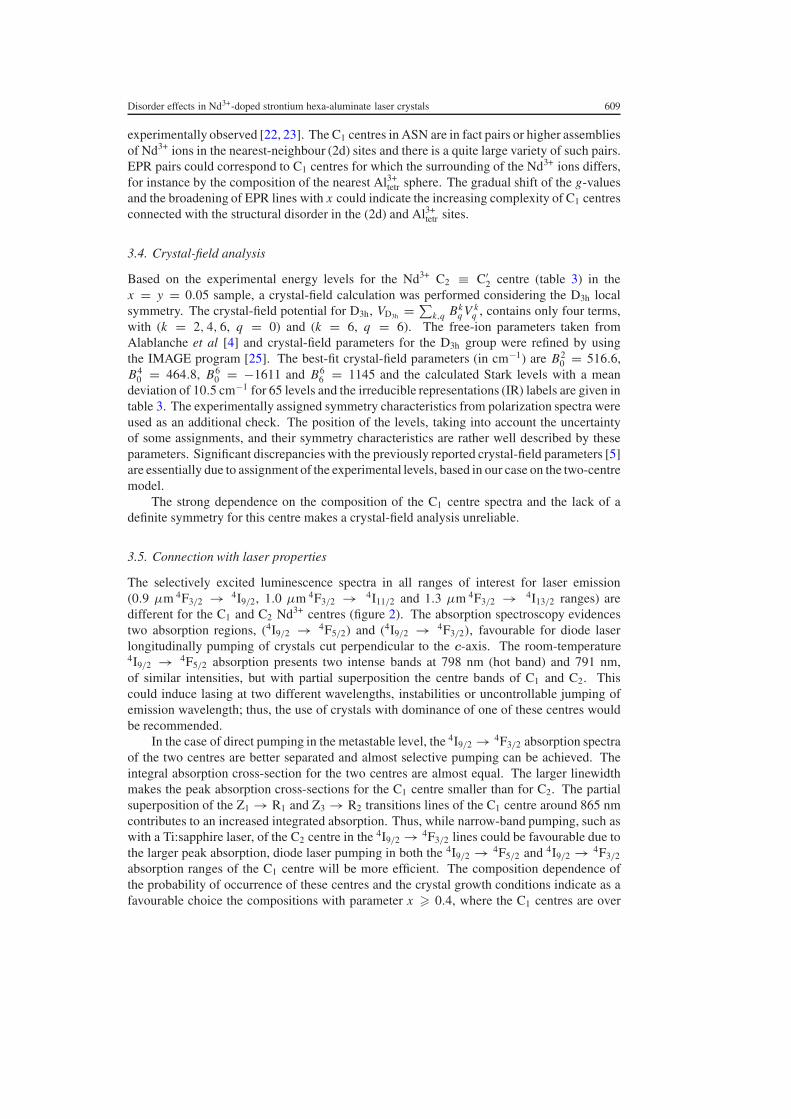
3.4. Crystal-field analysis
Based on the experimental energy levels for the Nd3+ C2 ≡ C′2 centre (table 3) in the
x = y = 0.05 sample, a crystal-field calculation was performed considering the D3h localsymmetry. The crystal-field potential for D3h, VD3h = ∑
k,q Bkq V k
q , contains only four terms,with (k = 2, 4, 6, q = 0) and (k = 6, q = 6). The free-ion parameters taken fromAlablanche et al [4] and crystal-field parameters for the D3h group were refined by usingthe IMAGE program [25]. The best-fit crystal-field parameters (in cm−1) are B2
0 = 516.6,B4
0 = 464.8, B60 = −1611 and B6
6 = 1145 and the calculated Stark levels with a meandeviation of 10.5 cm−1 for 65 levels and the irreducible representations (IR) labels are given intable 3. The experimentally assigned symmetry characteristics from polarization spectra wereused as an additional check. The position of the levels, taking into account the uncertaintyof some assignments, and their symmetry characteristics are rather well described by theseparameters. Significant discrepancies with the previously reported crystal-field parameters [5]are essentially due to assignment of the experimental levels, based in our case on the two-centremodel.
The strong dependence on the composition of the C1 centre spectra and the lack of adefinite symmetry for this centre makes a crystal-field analysis unreliable.
3.5. Connection with laser properties
The selectively excited luminescence spectra in all ranges of interest for laser emission(0.9 µm 4F3/2 → 4I9/2, 1.0 µm 4F3/2 → 4I11/2 and 1.3 µm 4F3/2 → 4I13/2 ranges) aredifferent for the C1 and C2 Nd3+ centres (figure 2). The absorption spectroscopy evidencestwo absorption regions, (4I9/2 → 4F5/2) and (4I9/2 → 4F3/2), favourable for diode laserlongitudinally pumping of crystals cut perpendicular to the c-axis. The room-temperature4I9/2 → 4F5/2 absorption presents two intense bands at 798 nm (hot band) and 791 nm,of similar intensities, but with partial superposition the centre bands of C1 and C2. Thiscould induce lasing at two different wavelengths, instabilities or uncontrollable jumping ofemission wavelength; thus, the use of crystals with dominance of one of these centres wouldbe recommended.
In the case of direct pumping in the metastable level, the 4I9/2 → 4F3/2 absorption spectraof the two centres are better separated and almost selective pumping can be achieved. Theintegral absorption cross-section for the two centres are almost equal. The larger linewidthmakes the peak absorption cross-sections for the C1 centre smaller than for C2. The partialsuperposition of the Z1 → R1 and Z3 → R2 transitions lines of the C1 centre around 865 nmcontributes to an increased integrated absorption. Thus, while narrow-band pumping, such aswith a Ti:sapphire laser, of the C2 centre in the 4I9/2 → 4F3/2 lines could be favourable due tothe larger peak absorption, diode laser pumping in both the 4I9/2 → 4F5/2 and 4I9/2 → 4F3/2
absorption ranges of the C1 centre will be more efficient. The composition dependence ofthe probability of occurrence of these centres and the crystal growth conditions indicate as afavourable choice the compositions with parameter x � 0.4, where the C1 centres are over
610 A Lupei et al
95% abundant. These conclusions are consistent with the recent 901 nm laser studies on Nd:ASL crystals with x = 0.4 that show [17] a higher laser efficiency (slope efficiency 0.74) withpumping at 791 nm than the crystals with x = 0.3 used earlier (slope efficiency 0.58), whilethe direct 865 nm pumping in 4F3/2 produced laser emission with slope efficiency [26] of 0.84,much higher than for any other quasi-three-level Nd3+ laser emission reported so far.
4. Conclusion
An analysis of the non-equivalent Nd3+ centres in disordered ASL: Nd—Sr1−x NdyLax−y MgxAl12−x O19 crystals, based on new high-resolution optical spectroscopy data (includingpolarization) on an extended composition range (0.01 � x � 0.5), was performed. Theprevious division [15] in two main classes of Nd3+ centre, C1 and C2, is preserved. A doubletstructure was resolved in C2 lines (C′
2 and C′′2 components) at low x and the effects that could
be assigned to the ionic size difference between Nd3+ and La3+ ions were also noticed inthe C1 centre spectral range. It was concluded that whereas for C2 (C′
2 and C′′2) centres the
nearest-neighbour (2d) coordination sphere is occupied only by Sr2+ ions, in the case of C1
centres one up to all the six sites of this sphere are occupied by Ln3+ (Nd3+ or La3+) ions. Thedifference between the C′
2 and C′′2 centres is tentatively connected by the perturbing effects of
the Mg2+ ions at the nearest tetrahedral Al3+ sites: with no Mg2+ for C′′2, and one Mg2+ for C′
2.It is inferred that the distribution of trivalent Ln3+ ion at the (2d) sites is random, while thatof Mg2+ is rather correlated with the distribution of the Ln2+ ions. The polarization data thatsuggest a D3h symmetry for C2 and lower for the C1 centre and the emission decay data areconsistent with these models.
A comparative examination of the previous published optical spectroscopic data (energy-level scheme, polarization effects, crystal-field parameters, etc) of Nd3+ in strontium hexa-aluminates, interpreted in terms of a unique centre model or EPR data shows definitely thatsuch a model cannot consistently describe any of these data. The results of this study can beextended to the investigation of other laser ions or to the luminescent phosphors based on Sr2+
or Ca2+ hexa-aluminates.
References
[1] Wickoff R W G 1965 Crystal Structure vol 3 Inorganic Compounds (New York: Interscience)[2] Bagdasarov Kh S, Kaminskii A A, Kevorkov L, Li, Prokhorov A M, Sarkisov S E and Tevosyan T A 1974 Sov.
Phys.—Dokl. 19 350[3] Alablanche S, Collongues R, Leduc M, Minvielle A, Thery J and Vivien D 1991 J. Physique Coll. IV 1 C7 275[4] Alablanche S, Kahn-Harari A, Thery J, Viana B, Vivien D, Dexpert-Ghys J and Faucher M 1992 J. Solid State
Chem. 98 10[5] Verdun H R, Wortman D E, Morrison C A and Bradshaw J L 1997 Opt. Mater. 7 117[6] Kahn A, Gasperin M, Saine M C, Lejus A M, Thery J and Vivien D 1988 J. Chem. Phys. 88 8018[7] Xie L and Cormack A N 1989 J. Solid State Chem. 83 282[8] Delacarte V, Thery J and Vivien D 1994 J. Physique Coll. IV C4 4 361[9] Delacarte V, Thery J and Vivien D 1994 J. Lumin. 62 237
[10] Delacarte V, Thery J, Benitez J M, Vivien D, Borel C, Templier R and Wyon C 1995 OSA Proc. Adv. Solid StateLasers 24 123
[11] Kettle S F A 1996 Physical Inorganic Chemistry, A Coordination Chemistry Approach (Oxford: SpectrumAcademic Publishers)
[12] Vivien D 2004 Proc. SPIE 5581 56[13] Aka G, Reino E, Vivien D, Balembois F, Georges P and Ferrand B 2002 Trends Opt. Photon. 68 329[14] Vivien D, Aka G, Lupei A, Lupei V and Gheorghe C 2004 Proc. SPIE 5581 287[15] Lupei A, Lupei V, Gheorghe C, Vivien D, Aka G and Aschehoug P 2004 J. Appl. Phys. 96 3057[16] Lupei A, Lupei V, Gheorghe C, Gheorghe L, Vivien D and Aka G 2005 Phys. Status Solidi c 2 276
Disorder effects in Nd3+-doped strontium hexa-aluminate laser crystals 611
[17] Aka G, Vivien D and Lupei V 2004 Appl. Phys. Lett. 85 2685[18] Koster G F, Dimmock J O, Wheeler R G and Statz H 1963 Properties of the Thirty-two Point Groups (Cambridge,
MA: MIT Press)[19] Hufner S 1978 Optical Spectra of Transparent Rare earth Compounds (New York: Academic)[20] Abragam A and Bleaney B 1970 Electron Paramagnetic Resonance of Transition Ions (Oxford: Clarendon)[21] Gbehi T, Thery J, Vivien D, Collongues R, Dhalenne R and Revcolevschi A 1988 J. Solid State Chem. 77 211[22] Guillot-Noel O, Goldner Ph, Higel P and Gourier D 2003 Chem. Phys. Lett. 380 563[23] Guillot-Noel O, Goldner Ph, Higel P and Gourier D 2004 J. Phys.: Condens. Matter 16 (3) R1[24] Antic-Fidancev E 2000 J. Alloys Compounds 300/301 2[25] Porcher P, Computer code IMAGE, unpublished[26] Lupei V, Aka G and Vivien D 2005 Trends Opt. Photon. 98 177


