Embed Size (px)
Citation preview

Disrupted Cortical Conductivity in Schizophrenia: TMS–EEG Study
Marina Frantseva1, Jie Cui2, Faranak Farzan1, Lakshminarayan V. Chinta1, Jose Luis Perez Velazquez3
and Zafiris Jeffrey Daskalakis1
1Schizophrenia Program, Centre for Addiction and Mental Health, Department of Psychiatry, University of Toronto, Toronto,ON, Canada, 2Visual Neuroscience Lab, Division of Neurobiology, Barrow Neurological Institute, St. Joseph’s Hospital andMedical Center, Phoenix, AZ, USA, 3Division of Neurology, The Hospital for Sick Children, Toronto, ON, Canada
Address correspondence to Marina Frantseva, Centre for Addiction and Mental Health, 1001 Queen Street West, Toronto, ON, Canada.Email: [email protected]
Schizophrenia is conceptualized as a failure of cognitive integration,and altered oscillatory properties of neurocircuits are associated withits symptoms. We hypothesized that abnormal characteristics ofneural networks may alter functional connectivity and distort propa-gation of activation in schizophrenic brains. Thus, electroencephalo-graphy (EEG) responses to transcranial magnetic stimulation (TMS) ofmotor cortex were compared between schizophrenia and healthysubjects. There was no difference in the initial response. However,TMS-induced waves of recurrent excitation spreading across thecortex were observed in schizophrenia, while in healthy subjects theactivation faded away soon after stimulation. This widespread acti-vation in schizophrenia was associated with increased oscillatoryactivities in the proximal central leads and in fronto-temporo-parietalleads bilaterally. A positive correlation was found between increasedTMS-induced cortical activation in gamma frequency and positivesymptoms of schizophrenia, while negative symptoms were corre-lated with activation in theta and delta bands. We suggest that ex-cessive activation in response to stimulation in schizophrenia brainsmay lead to abnormal propagation of the signal that could potentiallyresult in aberrant activity in areas remote from the activation origin.This mechanism may account for the positive symptoms of schizo-phrenia and could worsen signal to noise deficits, jeopardizing ade-quate information processing with ensuing cognitive deficits.
Keywords: connectivity, electroencephalography, neuronal synchrony,schizophrenia, transcranial magnetic stimulation
Introduction
Schizophrenia is a heterogeneous disorder characterized by acomplex constellation of seemingly unrelated symptoms, in-cluding hallucinations, delusions, thought disorder, affectiveflattening, and pronounced cognitive deficits. Recent evidencesupports the notion that a wide range of deficits in schizo-phrenia may result from a failure to integrate the activity oflocal and distributed neural circuits. This includes abnormalpower and synchronization patterns of induced or evokedelectroencephalography (EEG) rhythmic activity in both medi-cated and medication-naive patients (Spencer et al. 2004; Choet al. 2006; Uhlhaas et al. 2006; Minzenberg et al. 2010) aswell as decreased entrainment of oscillatory activity, primarilyin high-frequency bands, in response to a steady-state stimu-lation (Kwon et al. 1999).
Impaired ability of distributed neuronal networks to inte-grate information in schizophrenia has been attributed to ab-normalities in the rhythm-generating neuronal networks, suchas inhibitory interneurons (Lewis et al. 2005). The crucial roleof inhibitory deficits in the pathophysiology of schizophrenia
has been suggested by abnormalities in the functional integ-rity, morphology, and distribution of inhibitory interneuronsin schizophrenic patients (Lewis et al. 2008). Further supportfor impaired inhibitory neurocircuits in schizophrenia is pro-vided by evidence of significant deficits in intracortical inhi-bition in response to transcranial magnetic stimulation (TMS)in patients with schizophrenia (Daskalakis et al. 2002). Thesedeficits have also been documented in first-episode schizo-phrenia patients (Wobrock et al. 2008) and are more pro-nounced in unmedicated patients (Daskalakis et al. 2002).
Despite ample evidence linking affective and cognitivesymptoms of schizophrenia with abnormalities of neural oscil-latory activity (Uhlhaas et al. 2006), to date, we have a littleunderstanding of how impaired synchrony between distribu-ted neuronal networks translates into specific symptoms ofschizophrenia. Current theories of cognitive functioningassociate perceptual awareness with long-range synchronousrhythmic oscillatory activity. Intricate loops of feedback andfeed-forward inhibition are known to segregate the activatedneuronal assemblies into fine spatial and temporal domainsspecific to the incoming stimulus, which thus generategeometrically discrete rhythmic oscillations in distributedneuronal networks (Llinas et al. 2005). Binding of the multi-sensory inputs into a coherent cognitive experience is relianton this inhibitory rhythm-generating “clustering,” as dimin-ution of γ-aminobutyric acid release (GABAergic) inhibitionhas been shown to not only distort synchronized brain activity(Fingelkurts et al. 2004), but also alter perceptual selectivity(Wang et al. 2000, 2002). There is substantial theoretical andempirical evidence indicating that inhibition determines thespread of cortical activation by sculpting oscillatory patternsin time and space. Blocking inhibition has been shown toalter spatial and temporal patterns of neuronal activity, result-ing in lateral spread of stimulation-induced neuronal acti-vation in in vitro model systems (Contreras and Llinas 2001).Spatio-temporal patterns of spreading synaptic activity inresponse to stimulation were also reported in rat brain slicesin the presence of both, dopamine and the GABAergic antag-onist, bicuculline, 2 neurotransmitter mechanisms implicatedin the pathophysiology of schizophrenia (Bandyopadhyayet al. 2005). It is possible, therefore, that deficient inhibitoryneurocircuits lead to disrupted signal propagation of neuronalexcitation in schizophrenia brains.
Hence, we hypothesized that deficits in inhibitory neuronalnetworks, as has reliably demonstrated in patients withschizophrenia, may ultimately result in excessive spread ofneuronal excitation in response to an incoming stimulus inthe brains of patients with schizophrenia. However, addres-sing this question in live humans is not a trivial task. A recent
© Crown Copyright 2012.
Cerebral Cortex January 2014;24:211–221doi:10.1093/cercor/bhs304Advance Access publication October 5, 2012
by guest on April 8, 2016
http://cercor.oxfordjournals.org/D
ownloaded from
study by Massimini et al. (2005) has provided elegantmethods through which to approach such questions. Specifi-cally, the group assessed effective cortical connectivity inhumans using TMS and EEG recordings during sleep and wa-kefulness. Electrical oscillations evoked by TMS during wake-fulness have been shown to propagate to connected corticalareas several centimeters away, while same stimulus deliveredduring the non-rapid eye movement (NREM) sleep wasrapidly dampened and did not propagate beyond the site ofstimulation. The study suggests that diminished cortical con-nectivity reflects the failure of brain’s ability to integrate infor-mation, which may underlie loss of conscious awarenessduring sleep (Massimini et al. 2005). Of note, TMS-inducedelectrical field stimulates primarily horizontally situated corti-cal interneurons and perpendicularly aligned pyramidal andnon-pyramidal cells located within the sulci, while no directstimulation is transmitted to deep subcortical structures.Therefore, it can be inferred that changing patterns of brainactivity from high frequency (wakefulness) to slow-waverhythmic activity (NREM sleep) are sufficient to alter func-tional (e.g., physical) properties of the cortex, or its functionalconductivity. Of note, we purposely avoid attributing alteredpatterns of neuronal activity to changes in functional (or effec-tive) connectivity, as it is well-known that in some pathologi-cal conditions increased excitation may result from decreasedanatomical, functional, or effective connectivity (e.g., loss ofinhibitory or some excitatory neuronal populations enhancelocal excitability while decreasing long-range connectivity;Moeller et al. 2009), so this term may in fact become mislead-ing. Instead, we propose to use a more impartial character-istic, functional cortical conductivity, depicting a purelyphysical property of the brain, which is however a product offunctional interactions between its neuronal elements. Alarge-scale mathematical modeling of thalamocortical systemsdemonstrated that a shift in the excitation/inhibition balancetoward inhibition may account for this diminished intercorticalsignal propagation (Esser et al. 2009). This, along with evi-dence of diminished cortical inhibition in schizophrenia, pro-vides further support for a possibility of altered corticalconductivity in schizophrenia brains.
To test this hypothesis, we used a combination of TMS–EEG recordings in order to compare cortical activity resultingfrom direct cortical stimulation in schizophrenia subjects totheir healthy counterparts. If our hypothesis is confirmed, wecould expect to see a disrupted pattern of cortical conduc-tivity in patients with schizophrenia.
Materials and Methods
ParticipantsWe studied 16 patients (mean age 36.7 ± 10.4 years; 12 males,4 females) with a diagnostic and statistical manual of mental disorders(DSM) diagnosis of schizophrenia or schizoaffective disorder confirmedby the structured clinical interview for DSM IV and 16 healthy subjects(mean age 36.1 ± 7.9; 11 males, 5 females). Fourteen of 16 patientswith schizophrenia were treated with antipsychotic medications (cloza-pine, n = 6, mean dose 400 ± 54.8 mg/day; risperidone, n = 3, meandose 3.2 ± 2.5 mg; haloperidol, n = 2, mean dose 2 ± 1.4 mg; quetiapinen = 1, 100 mg; perphenazine n = 1, 16 mg; olanzapine, n = 1, 7.5 mg)and with no other psychotropic medications. All participants wereright-handed as assessed by the Oldfield Handedness Inventory.Healthy volunteers were screened for psychopathology and excluded ifthey had psychiatric, neurological, or major medical illness or were
suffering from substance abuse disorder. The ethics committee at theCentre for Addiction and Mental Health approved the study and writteninformed consent was obtained for each participant.
Experimental DesignOur experimental design consisted of measuring global cortical acti-vation and cortical excitability in response to a single monophasicTMS pulse. Cortical excitability was determined using the motor-evoked potential (MEP) size, which was defined as the intensity ofTMS stimulus sufficient to produce mean MEP amplitude of 1-mVpeak-to-peak response at the baseline (stimulus intensity of 1 mV orSI1 mV). This was consistent with previous studies using both TMS–electromyography (EMG) and TMS–EEG recordings (Farzan et al.2010, Frantseva et al. 2008).
To determine SI1 mV, the average MEP of 20 stimuli at rest was cal-culated. TMS was administered over the left motor cortex of all sub-jects. One hundred TMS stimuli were delivered per trial for every 5 s.Moreover, to control for the effect of TMS click-induced auditoryactivation on the cortical-evoked potentials, single-pulse Sham-stimulation was administered in all healthy and schizophrenia sub-jects at the same intensity as used for active stimulation but with thecoil angled at 90° from the scalp resting on one wing of the coil.During the experiment, subjects were sitting in a comfortable arm-chair with their eyes open, their elbow flexed, and their hands restedon a pillow placed on their laps.
Data Recording
Transcranial Magnetic StimulationTMS of the left motor cortex was performed with a 7-cm figure-of-eightcoil and a Magstim 200 stimulator (The Magstim Company, Whitland,United Kingdom). The coil was placed at the optimal position for elicit-ing EMG-recorded MEPs from the right abductor pollicis brevis (APB)muscle, which typically corresponded to a region between FC3 and C3electrodes on the 10–20 EEG system. The optimal position was markedon the scalp with a felt pen to ensure identical placement of the coilthroughout the experiment. The handle of the coil pointed backwardand was perpendicular to the presumed direction of the central sulcus,about 45° to the midsagittal line. The direction of the induced currentwas from posterior to anterior and was optimal to activate the motorcortex transsynaptically.
EMG RecordingSurface EMG was recorded from the right APB muscle with disposa-ble disc electrodes placed in a tendon-belly arrangement over thebulk of the APB muscle and the first metacarpal–phalangeal joint.The subject maintained relaxation throughout the experiment, andthe EMG was monitored on a computer screen and via speakers athigh gain. The signal was amplified (Intronix Technologies Corpor-ation Model 2024F, Bolton, Ontario, Canada), filtered (band pass 2 Hzto 2.5 kHz), digitized at 5 kHz (Micro 1401, Cambridge ElectronicsDesign, Cambridge, United Kingdom), and stored in a laboratorycomputer for off-line analysis.
EEG RecordingTo evaluate TMS-induced and Sham-induced cortical-evoked poten-tials, EEG was recorded concurrently with the EMG. EEG was ac-quired through a 64-channel EEG cap, and 4 electrodes were placedon the outer side of each eye, and above and below the left eye tomonitor the eye movement artifact. All electrodes were referenced toan electrode placed posterior to the central electrode. EEG signalswere recorded direct current and a low-pass filter of 100 Hz at the20-kHz sampling rate, which was shown to avoid saturation of ampli-fiers and to minimize the TMS-related artifact (Daskalakis et al. 2008).
TMS–EEG PreprocessingAll TMS–EEG signals were downsampled from 20 to 1 kHz. The60-Hz powerline (f0) artifact was removed from the signals by usingthe Thomson F-test based on multitaper spectral estimate techniques
212 Disrupted Cortical Conductivity in Schizophrenia • Frantseva et al.
by guest on April 8, 2016
http://cercor.oxfordjournals.org/D
ownloaded from

(Percival and Walden 1993). The signals from all 60 channels weresubsequently average referenced (Nunez and Srinivasan 2006). Thepreprocessing of Sham-EEG signals follows that of TMS–EEG prepro-cessing explained above in this section.
Time-domain AnalysisAn average signal was obtained from each electrode for TMS–EEGand Sham-EEG. To further smooth the data, a sliding window with100-ms width stepping at 1 ms was employed. The mean voltagewithin this window at each time instance was calculated. We thus ob-tained 60 smoothed each for TMS–EEG and Sham-EEG signals from60 electrodes for the healthy and the schizophrenia (SCZ) subjects,respectively. Moreover, the spatial voltage distributions over scalpsurface were derived from the signals with the topographic toolbox ofEEGLAB.
Frequency-domain AnalysisThe power spectra of the signals were calculated for a window of400–800 ms post-test stimulus (TS). Optimized spectral smoothing/concentration was achieved using the multitaper method (Jarvis andMitra 2001). In this analysis, we chose the number of tapers (k = 2),and the time–frequency product time -frequency window (TW) = 1.5,resulting in the frequency resolution of 7.5 Hz.
Time–Frequency AnalysisThe data epochs were extracted from the sliding windows with200-ms width that were moved over the TMS–EEG signals in steps of10 ms. For each epoch extracted, the corresponding power spectrumwas obtained.
To obtain an error bar of the estimate at each time–frequencylocation on the spectrogram for Figure 3A,B, we applied the methodof Jackknife, that is, we leave one trial out and calculate the spectrumat each time instant from the rest trials. By repeating this procedure,we obtain an ensemble of estimates at each time–frequency location.The error bar indicates the standard deviation of the estimates, whichare considered significantly different if the estimates are separated bymore than 2 standard deviations.
To obtain a relation between measure of SCZ symptoms and con-ductivity (Fig. 4), time–frequency signal power in delta (1–3.5 Hz),theta (4–7 Hz), alpha (8–12 Hz), beta (12–28 Hz), and gamma (30–50Hz) was evaluated from the average TMS–EEG signal across 60 elec-trodes for each subject. A time-varying maximum power was com-puted for each frequency band providing a measure of conductivity(maximum spectral power) for the time period of interest. Positiveand negative symptoms based upon the positive and negative syn-drome scale (PANSS) score were used as the measure of SCZ symp-toms. A linear correlation test between the symptom score (positiveand negative) and maximum spectral power (within each frequencyband at 200 ms and between 400 and 700 ms) was performed.Regression plots were generated for the statistically significant corre-lation results.
Results
Motor ThresholdsBrain responses evoked by TMS were recorded using a64-channel EEG amplifier in a group of 16 healthy volunteersand 16 schizophrenia patients, 14 of whom were treated withantipsychotics, and 2 were unmedicated. Monophasic singleTMS pulses were delivered to the motor cortex, as describedpreviously (Daskalakis et al. 2008). While some previousstudies have shown significant difference in resting motorthresholds between schizophrenia and normal control sub-jects, no statistically significant difference in the resting motorthreshold was found in our experiments (P = 0.2, Table 1).
Characteristics of TMS-Induced Cortical ActivationsFigure 1 illustrates a comparison of TMS-induced EEG activitybetween schizophrenia patients and healthy control subjects.In healthy subjects, initial voltage deflections elicited by aTMS pulse were primarily limited to 300-ms poststimulus in-terval (Fig. 1A), whereas in schizophrenia patients, who dis-played similar characteristics of the initial (75–150 ms)response, we consistently observed delayed EEG activityaround 200 ms and between 400 and 750 ms after stimulation(Fig. 1B,C). To quantify total brain activation in response toTMS, we calculated the mean average global voltage, esti-mated as a surface area under the rectified EEG traces acrossall electrodes for each subject. While we observed no statisti-cally significant difference between averaged global voltagesin the 75–150-ms poststimulus interval (Fig. 1C), the averageglobal voltage 400–750 ms poststimulus was significantlyhigher in schizophrenia when compared with healthy controlsubjects. Subtraction of Sham-EEG signal from activeTMS-induced EEG responses did not diminish the observeddifference statistically in delayed EEG responses as illustratedin Figure 1D. Of note, Sham-stimulation, which is deliveredwith a coil placed at 90° from the scalp, may provide less of asensory stimulation than active TMS, given that tactile stimu-lation component of it is diminished. Figure 2 illustrates thetopography of average voltage distribution in both healthycontrol and schizophrenia groups. This data suggests thatschizophrenia subjects experience prolonged and widespread cortical activation in response to TMS.
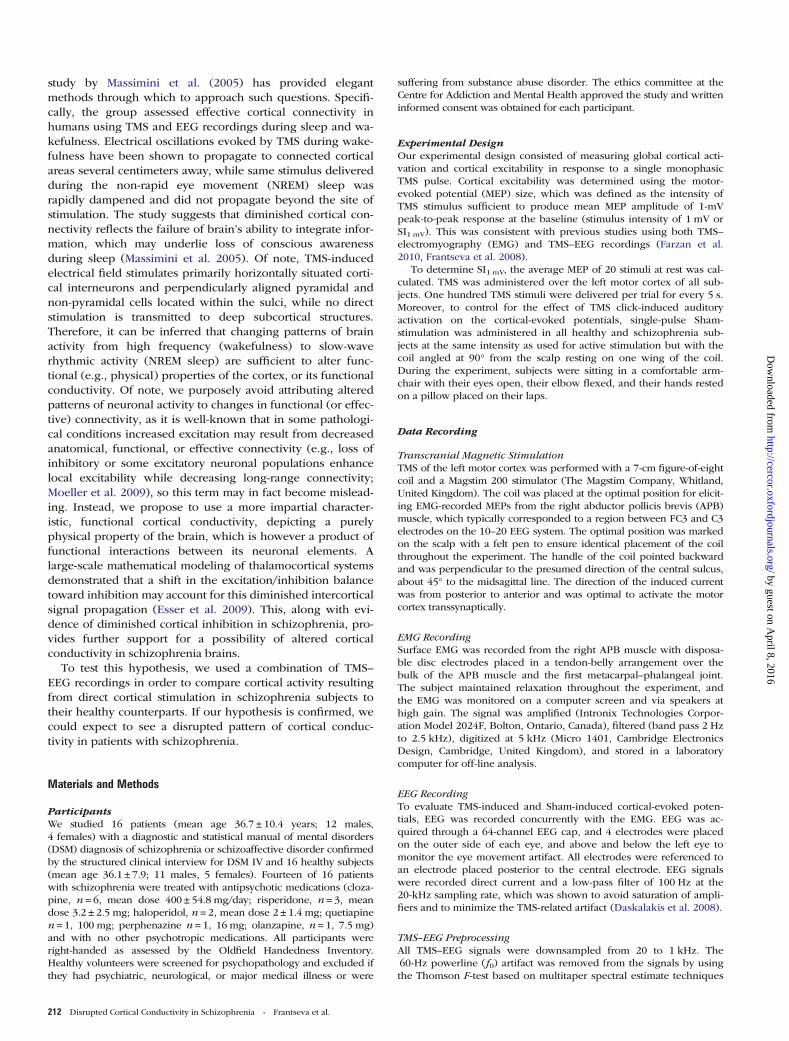
Given a wealth of evidence for spectral abnormalities inschizophrenia, we wanted to explore time and frequencydomains of evoked TMS responses in both study groups. Wewere particularly interested to characterize the spatio-temporal properties of aberrant oscillatory activity evoked byTMS in schizophrenia subjects. For this we compared time–frequency signal power in delta (1–3.5 Hz), theta (4–7 Hz),alpha (8–12 Hz), beta (12–28 Hz), and gamma (30–50 Hz)ranges following TMS between 2 study groups. As shown inFigure 3a,b, significantly enhanced delta frequency oscil-lations were observed in the ipsilateral frontal and temporo-parietal leads and in bilateral occipital and parietal electrodes.High-frequency (beta–gamma) oscillations were also pro-nounced in ipsilateral leads proximal to stimulation and inhomologous contralateral areas (motor cortex) of schizo-phrenia patients. Finally, high-frequency oscillations were re-corded in the bilateral fronto-temporo-parietal leads ofschizophrenia subjects.
Table 1Demographic and clinical characteristics
Schizophrenia (n= 16) Healthy (n= 16) P-value
Age (years) 36.7 ± 10.4 36.1 ± 7.9 0.85Sex, M/F 12/4 11/5 0.7Illness duration (years) 9.7 ± 7.3 NA NAResting motor threshold 56.6 ± 13.9 51.3 ± 7.5 0.201 mV Intensity 66.9 ± 16.5 64.1 ± 10.0 0.56PANSS scoresTotal 65.3 ± 17.6 NA NAPositive 16.3 ± 4.3 NA NANegative 18.3 ± 6.1 NA NAGlobal 30.4 ± 8.6 NA NA
Note: Data are given as mean ± standard deviation.PANSS, positive and negative syndrome scale; NA, not applicable.
Cerebral Cortex January 2014, V 24 N 1 213
by guest on April 8, 2016
http://cercor.oxfordjournals.org/D
ownloaded from

A correlation between measure of SCZ symptoms and con-ductivity based upon PNASS (positive and negative scores)and maximum spectral power within each frequency bands at200 ms and between 400 and 700 ms post-TMS were per-formed. Positive symptoms were positively correlated withgamma band (P < 0.0425) between 400 and 700 ms. Negativesymptoms were positively correlated with theta (P < 0.0218)and delta bands (P < 0.0237) at 200-ms post-TMS. Regressionplots between the correlation results are illustrated in Figure 4.
Discussion
To our knowledge, this is the first demonstration of excessivespread of neuronal excitation induced by TMS in schizo-phrenia subjects. In this study, we provide evidence that,although TMS elicits the initial response of similar magnitudein both study groups, this response remains limited to thesame area proximal to the stimulation site in normal control
subjects, while in schizophrenia subjects it propagates both intime and in space. Enhanced TMS–EEG activity in schizo-phrenia group was observed post-stimulus, and this wasassociated with increased oscillatory activity primarily ingamma, beta, and delta frequency ranges in ipsilateral centralleads proximal to stimulation, and in fronto-temporo-parietalleads bilaterally. These oscillatory abnormalities are sugges-tive of increased interhemispheric functional connectivity,which seems to be most pronounced between homologous(motor cortex) areas, but also extends toward temporo-parietal regions in schizophrenia brains, areas most implicatedin schizophrenia pathology. Increased cortical conductivity ingamma-band frequency between 400 and 700 ms was posi-tively correlated with positive schizophrenia symptoms (e.g.,delusions and hallucinations), while negative symptoms werepositively correlated with functional cortical conductivity intheta and delta bands at 200-ms post-TMS, suggesting thatthese indices may be functionally related.
Figure 1. A comparison of TMS-induced EEG activity between schizophrenia and healthy control subjects demonstrates delayed activity in schizophrenia patients. Thewaveforms in (A) and (B) represent mean rectified cortical EEG voltage traces from 60 electrodes following the delivery of a single pulse of TS to the left motor cortex at time0. These waveforms are averaged across 16 healthy subjects (A), and 16 patients with schizophrenia (B). In all figures, x-axis represents the time after the delivery of the TS, andthe y-axis represents the mean absolute signal EEG voltage recorded across all channels. The inserts at the top panel illustrate spatial distribution of mean absolute signalvoltage, calculated for individual channel and averaged between the subjects within the group at indicated time points. The hot colors indicate the area of maximum voltage.These plots suggest that patients with schizophrenia have enhanced cortical activity following TMS compared with healthy subjects. (C) The comparison of ensemble mean ofaverage referenced EEG channel signals. Solid blue (healthy control, 16 subjects) and green curves (schizophrenia subjects, 16) represent average area under a 100-ms widthwindow sliding along the rectified EEG traces across all channels. The dotted curves indicate ±1 standard error of the mean. Red segments show the time intervals wheresignificant difference between the healthy and schizophrenic subjects was found by using a 2-tailed unpaired t-test (P< 0.05). There is delayed EEG activity in schizophreniasubjects from ∼400 to ∼750 ms post-TS. (D) The comparison of ensemble mean of average referenced EEG channel signals after subtraction of Sham-stimulation–inducedactivity. Solid blue (healthy control, 16 subjects) and green curves (schizophrenia subjects, 16) represent average area under a 100-ms width window sliding along the rectifiedEEG traces across all channels. The dotted curves indicate ±1 standard error of the mean. Red segments show the time intervals where significant difference between thehealthy and schizophrenic subjects was found by using a 2-tailed unpaired t-test (P<0.05). Note that subtraction of Sham-stimulation does not diminish delayed TMS-inducedEEG activity in schizophrenia subjects.
214 Disrupted Cortical Conductivity in Schizophrenia • Frantseva et al.
by guest on April 8, 2016
http://cercor.oxfordjournals.org/D
ownloaded from

Of interest, prior studies of TMS-evoked activity in schizo-phrenia brains analyzed EEG responses within 100-ms poststi-mulus window, reporting reduced evoked gamma oscillations(Ferrarelli et al. 2008) and significantly reduced field power(Ferrarelli et al. 2008; Levit-Binnun et al. 2010), particularly attime points corresponding with the peaks of 2 TMS-evokedgamma oscillations (Ferrarelli et al. 2008). This, along withour data showing increased global voltage and high-frequency oscillatory activity after 200-ms poststimulus,suggests that altered resonant properties of neuronal net-works likely result in delayed, but prolonged activation(especially in high-frequency bands) in schizophrenia.
These observations suggest that pathophysiologicalchanges characteristic for schizophrenia lead to fundamental
difference in functional properties of cortical surface, whichreflects the altered functional interactions between groups ofneurons. Given that lateral cortical inhibition determines theextent of spread of activity along the cortical surface (Bandyo-padhyay et al. 2005; Llinas et al. 2005), increased functionalcortical conductivity may be a biophysical manifestation ofinhibitory (and/or any other) deficits underlying impaired fil-tering in schizophrenia. The abnormal sensory filtering, ordeficient gating, hypothesis is based on significantly reducedbehavioral and electrophysiological indices of sensory gatingobserved in schizophrenic patients and in animal models ofschizophrenia (Thaker 2008). An impaired sensory filtering inschizophrenia is thought to underlie an inability to selectivelyprocess relevant information, supposedly due to beingflooded with unconstrained and irrelevant “perceptual noise”(Braff et al. 1992). Human and animal data indicate thatsimilar information gating deficits may be a corollary tovarious molecular abnormalities, which include glutamatergic(Ma et al. 2009), cholinergic (Bickford and Wear 1995), dopa-minergic (Bickford-Wimer et al. 1990; Hajos et al. 2005), andGABAergic (Hershman et al. 1995) mechanisms. Interestingly,amphetamine-induced thalamic auditory gating deficits in ratswere linked to impairment of bursting activity of the inhibi-tory thalamic reticular neurons, deficits that were restoredeither by dopamine D2 antagonist haloperidol (Krause et al.2003) or by acetylcholine receptor agonists (an agonist of α7nicotinic acetylcholine receptor, genetically linked to schizo-phrenia), supposedly via restoration of GABAergic neuro-transmission (Hajos et al. 2005). Likewise, GABAergic,dopaminergic, and cholinergic mechanisms were implicatedin glutamatergic (ketamine-induced) impairment of auditorygating in rat hippocampus (Ma et al. 2009). These studiessuggest that multiple molecular underpinnings of schizo-phrenia may manifest via a somewhat uniform phenomenon,such as impaired filtering. We speculate that increased func-tional cortical conductivity is an electrophysiological correlateof impaired ability to filter information in schizophrenicbrains.
Could aberrant cortical conductivity with ensuing excessivespread of neuronal excitation provide any insight withregards to the mechanisms of schizophrenia symptoms? Or, inother words, what are the possible functional consequencesto this “excitation leak”? Indirect answer to this question maybe derived from in vivo studies utilizing intracortical injec-tions of a GABAa antagonist bicuculline (Alloway and Burton1991; Kyriazi et al. 1996; Wang et al. 2000, 2002), shown toenhance lateral spread of cortical activation (Contreras andLlinas 2001; Bandyopadhyay et al. 2005). Local microionto-phoretic application of bicuculline has been shown to enlargethe size of receptive fields of neurons in somatosensory ratand visual primate cortices (Alloway and Burton 1991; Wanget al. 2000), and to change their spatial selectivity so that af-fected neurons become responsive to a broader range ofstimuli (Kyriazi et al. 1996; Wang et al. 2002). Moreover, asubset of these neurons became responsive to stimuli that didnot resemble the previously preferred inputs (Rao et al. 2000;Wang et al. 2002). These results parallel data obtained withEMG recordings from the rat motor cortex, demonstrating thatfollowing a local bicuculline injection stimulation of themotor cortex responsible for vibrissal movement activated aforelimb (Jacobs and Donoghue 1991). It has been concludedthat intracortical blockade of GABAergic neurotransmission
Figure 2. A comparison of topographic representation of the voltage distributionbetween healthy control (HLT) and schizophrenia patients (SCZ) illustrates delayedreverberating activity in schizophrenia patients in response to TMS. Topographic headplots were obtained by EEGLAB toolbox (Delorme and Makeig 2004), which showthe spatial distribution of mean absolute signal voltage, calculated for individualchannel and averaged between the subjects within the group at indicated timepoints. The TMS test stimulus (TS) was applied at time 0. The spatial distributionsare shown at time instants (A) 100 ms, (B) 300 ms, (C) 500 ms, (D) 700 ms, and (E)900 ms, respectively. The hot colors indicate the area of maximum voltage.
Cerebral Cortex January 2014, V 24 N 1 215
by guest on April 8, 2016
http://cercor.oxfordjournals.org/D
ownloaded from

unmasks normally silent excitatory connections, resultingnot only in loss of neuronal selectivity, but also makingneurons respond to non-specific stimuli. In other words,some neurons disinhibited by bicuculline “hallucinate” by
identifying a stimulus that has never been presented. Wepropose that similar mechanisms may be relevant to generat-ing aberrant rhythmic activity responsible for perceptual ab-normalities. In other words, the signal that “leaks” to the
Figure 3. (A and B) represent the right and left hemisphere regions. A comparison of TMS-evoked cortical oscillatory activity between schizophrenia and healthy controlsubjects demonstrates increased oscillatory rhythmic activity in schizophrenia subjects. Each graph is a time–frequency plot of the EEG signal difference calculated at eachchannel between 2 experimental groups (healthy control and schizophrenia patient subjects). The horizontal red dotted lines indicate frequency levels at 3, 7, 12, 30, and 50 Hz,from bottom to top. Black areas indicate the time–frequency points where the power of signal in patients with schizophrenia is significantly higher than that of healthy subjects(P< 0.05, using multitaper method TW= 1.5, k=2, Jackknife, see Materials and Methods section for the details). The TMS pulse was administered at left motor cortex (redasterisk). Increased gamma-band activity was clearly observed in ipsilateral channels C3, C5, CP3, CP5, P3, P5, and P7, as well as in contralateral channels F8, FT8, FC6, C6,CP6, and T8 between 400- and 800-ms post-TMS.
216 Disrupted Cortical Conductivity in Schizophrenia • Frantseva et al.
by guest on April 8, 2016
http://cercor.oxfordjournals.org/D
ownloaded from
neighboring cortical area due to unfaithful filtering mayexcite “untuned” neurons, whose activation may be misinter-preted by the brain as, for example, a voice when no onespeaks. Of interest, in our experiments, the TMS pulse deliv-ered to the left motor cortex seems to induce fast oscillatoryactivity not only in homologous contralateral cortical area, butalso in contralateral temporo-parietal regions, most implicatedin schizophrenia pathology and, specifically, linked to audi-tory hallucinations. For example, several studies using func-tional neuroimaging techniques provide evidence forincreased brain activity during auditory hallucinations inboth, primary and secondary, associative auditory cortices(Dierks et al. 1999; Lennox et al. 2000; Bentaleb et al. 2002)of schizophrenia patients. In addition, increased excitatory
activity in the right temporo-parietal cortical areas andincreased interhemispheric coherence between auditory cor-tices have been implicated in the genesis of auditory halluci-nations by EEG techniques (Line et al. 1998; Sritharan et al.2005), strengthening a potential link between abnormal neur-onal activation in speech-related areas and auditory hallucina-tions. Positive correlation between increased functionalcortical conductivity in gamma-band frequency and positivesymptoms, as well as between cortical conductivity in thetaand delta bands and negative symptoms, demonstrated in ourstudy seems to further suggest a link between schizophreniasymptoms and delayed cortical activation. Bilateral oscillatoryactivity in temporo-parietal areas in response to the left motorcortex, TMS shown in our study seems to be in line with
Figure 3. Continued
Cerebral Cortex January 2014, V 24 N 1 217
by guest on April 8, 2016
http://cercor.oxfordjournals.org/D
ownloaded from

evidence of increased functional correlation betweenthese regions, thus providing a further support to pathologi-cally increased synchrony between left and right temporo-parietal regions in schizophrenia. There is recent evidencerelating locally increased white matter connectivity intemporo-parietal and other speech-related areas to auditoryhallucinations (Hubl et al. 2004). The same study has alsodemonstrated that inner speech in patients with frequent
hallucinations leads to abnormal coactivation in regionsrelated to the acoustical processing of external stimuli. An in-teresting interpretation of these findings was proposed byUhlhaas and Singer (2006), who hypothesize that “hypercon-nectivity between higher- and lower-order cortical areasfavors backpropagation to the respective primary auditorycortices of oscillatory activity generated in higher sensoryareas during visual and auditory imagery, thus generatingactivation patterns that resemble those induced by sensorystimulation.” The “leaky cortex” may be an additional (or, insome cases, primary?) mechanism, underlying spontaneousectopic activity in areas responsible for hallucinatory experi-ences. Given that “backpropagation” of cortical activation dueto abnormal cortical conductivity is bidirectional, ectopic acti-vation of secondary auditory cortices resulting from activationof lower-order auditory cortex is just as possible. A well-known clinical phenomenon of auditory hallucinations trig-gered by the humming sounds of appliances that typicallystart as indistinct noises and gradually progress throughwhisper-like sounds to distinctive voices (Hoffman et al.2003; Perez Velazquez and Frantseva 2011) seems to be inline with this hypothesis. Another well-known clinicalphenomenon is that some schizophrenia patients are able tokeep their voices under control by listening to loud music(Sadock et al. 2009), an intervention that may hypotheticallysharpen their auditory receptive fields via thalamic depolariz-ation (Llinas et al. 2005), potentially limiting lateral spread ofcortical excitation.
Our results seem to be in concordance with the interpret-ation of an EEG study (Breakspear et al. 2003) that analyzedthe topographic organization of nonlinear interdependenciesin patients with schizophrenia. According to this study, therate of occurrence of dynamical interdependencies did notdiffer at any of the sites between subjects; however, the topo-graphy across the scalp was significantly different betweenschizophrenia and normal control groups: Nonlinear interde-pendences tended to occur in larger concurrent clustersacross the scalp in schizophrenia than in healthy subjects.These findings were interpreted as they “do not support asimple ‘disconnection’ of cortical interactions, as implied bydisconnection hypothesis of schizophrenia.” Disconnectionhypothesis of schizophrenia postulates that multiple deficitsin schizophrenia are brought about by the lack of structuraland functional connectivity across multiple brain regions thatresult in abnormal functional integration of brain processes(Braff 1999). “Instead, they suggest a loss of fine-grainedorganization of cortical interactions and hence can be cau-tiously interpreted as evidence of impoverishment of flexi-bility across hierarchical brain regions in schizophrenia”(Breakspear 2006).
One of the major limitations of this study is the fact that 14of the 16 schizophrenia patients were treated with antipsycho-tic medications. Although oscillatory abnormalities inmedication-naive and first-episode patients with schizo-phrenia have been widely reported (Gallinat et al. 2004;Symond et al. 2005), there are also studies suggesting EEGalterations (e.g., general slowing) induced by antipsychoticmedications (Koshino et al. 1993). In contrast, others reportnormalizing effects of neuroleptic medications in schizo-phrenia (Saletu et al. 1994; Canive et al. 1996). Importantly,deficits in cortical inhibition, a putative neurophysiologicmechanism of enhanced cortical conductivity, have been
Figure 4. Schizophrenia symptoms (PANSS scores) are positively correlated withfunctional cortical conductivity in specific frequency bands. Each graph demonstratesa positive correlation between PANSS scores and functional cortical conductivity atγ, θ, or δ frequency bands. The functional cortical conductivity in specific frequencyband was calculated for individual subject (as described in Materials and methodssection), and averaged across all channels and trials. Correlations between PANSS(positive and negative) scores and the functional cortical conductivity within eachfrequency band at 200 ms and 400–700 ms were performed using “corr” function(Matlab, Mathworks). Functional cortical conductivity between 400 and 700 ms inγ band showed significant positive correlation (P<0.0425) with positive symptomscores (PANSS). At 200 ms, functional cortical conductivity in θ (P<0.0218) andδ (P<0.0237) bands showed significant positive correlation with negative symptomscores (PANSS). (A) Illustrates regression fit between positive symptom score andspectral power of γ band between 400 and 700 ms. (B) and (C) demonstrateregression fits between negative symptom score and functional cortical conductivityin θ and δ bands at 200 ms.
218 Disrupted Cortical Conductivity in Schizophrenia • Frantseva et al.
by guest on April 8, 2016
http://cercor.oxfordjournals.org/D
ownloaded from

found to be more pronounced in unmedicated schizophreniapatients (Daskalakis et al. 2002). Nevertheless, future researchconfirming our preliminary findings in medication-freepatients with schizophrenia is required.
Another important potential limitation of our study issuggested by recent publications linking EEG-recordedgamma-band rhythms with muscular activity (Whitham et al.2007). However, increase in gamma frequency in schizo-phrenia subjects, reported in our study was calculated as EEGsignal difference between 2 groups. To our knowledge, thereis no evidence that schizophrenia patients have higher restingEEG activity. Therefore, it is likely that subtraction of EEGsignal between 2 groups would eliminate the noise inducedby muscle movement. Accordingly, increased gamma fre-quency observed in our experiments gravitates toward centralrather than circumferential leads: No increase in high-frequency activity was detected in most lateral and posteriorleads, as would be expected if they were a product of amuscle artifact (Whitham et al. 2007). As well, most recentstudy by Pope et al. (2009) that performed comparative analy-sis between paralyzed and nonparalyzed subjects within thegroup (e.g., before and after paralysis) demonstrates thatevoked responses to cognitive tasks were qualitatively unaf-fected by muscle paralysis, although some gamma responseswere still obscured by EMG. Further experiments comparinghigh-frequency TMS-induced activity in paralyzed subjectswould be helpful to address this issue.
Another important avenue that needs to be further ad-dressed is the specificity of abnormal cortical conductivity toschizophrenia (or psychotic illness). Of interest, TMS–EEG re-cordings were recently utilized in order to assess corticalexcitability in epilepsy, another disorder characterized byaltered excitation–inhibition balance. Delayed (>100 ms and<1 s after TMS stimulus) responses to TMS were observed in 3of 15 epileptic patients. These responses frequentlyresembled the patient’s epileptiform discharges and were eli-cited only when stimulating over epileptogenic, but not othercortical regions (Valentin et al. 2008). In addition, no evi-dence of increased excitability (measured as average globalvoltage after TMS) was obtained in a group of bipolarpatients, and in patients suffering from major depressive orobsessive–compulsive disorders (manuscript in preparation).These findings suggest that abnormal cortical conductivitymay be a phenomenonspecific for schizophrenia.
In summary, our study provides preliminary evidence forincreased functional cortical conductivity in schizophrenia.We propose that increased cortical conductivity is a novelelectrophysiological representation of a core information pro-cessing deficit in schizophrenia. We suggest that abnormalcortical conductivity in schizophrenic brains may favor propa-gation of oscillatory activity to the adjacent and remote corti-cal areas, thus generating areas of aberrant cortical activation.It is possible that these abnormalities may be the underlyingresponsible mechanisms mediating perceptual abnormalitiescharacteristic for schizophrenia. In addition, they couldpotentially worsen (or even underlie) signal to noise deficits,jeopardizing cognitive functioning of affected individuals.Future studies linking impaired cortical conductivity tospecific clinical signs and symptoms of schizophrenia, and tospecific neurophysiologic deficits may open new possibilitiesfor understanding the neural substrates of altered informationprocessing in schizophrenia patients.
Funding
Z.J.D received external funding through Neuronetics andBrainsway Inc., Aspect Medical, and a travel allowancethrough Pfizer and Merck. Z.J.D has also received speakerfunding through Sepracor Inc., and served on the advisoryboard for Hoffmann-La Roche Limited. This work was sup-ported by the Ontario Mental Health Foundation (OMHF), theCanadian Institutes of Health Research (CIHR), the Brain andBehaviour Research Foundation, and the Grant Family andTemerty Family through the Centre for Addiction and MentalHealth (CAMH) Foundation. M.F. was supported by internalfunding at CAMH.
NotesConflict of Interest: None declared.
ReferencesAlloway KD, Burton H. 1991. Differential effects of GABA and
bicuculline on rapidly- and slowly-adapting neurons in primarysomatosensory cortex of primates. Exp Brain Res. 85:598–610.
Bandyopadhyay S, Gonzalez-Islas C, Hablitz JJ. 2005. Dopamineenhances spatiotemporal spread of activity in rat prefrontal cortex.J Neurophysiol. 93:864–872.
Bentaleb LA, Beauregard M, Liddle P, Stip E. 2002. Cerebral activityassociated with auditory verbal hallucinations: a functional mag-netic resonance imaging case study. J Psychiatry Neurosci.27:110–115.
Bickford PC, Wear KD. 1995. Restoration of sensory gating of audi-tory evoked response by nicotine in fimbria-fornix lesioned rats.Brain Res. 705:235–240.
Bickford-Wimer PC, Nagamoto H, Johnson R, Adler LE, Egan M, RoseGM, Freedman R. 1990. Auditory sensory gating in hippocampalneurons: a model system in the rat. Biol Psychiatry. 27:183–192.
Braff DL. 1999. Connecting the “dots” of brain dysfunction in schizo-phrenia: what does the picture look like? Arch Gen Psychiatry.56:791–793.
Braff DL, Grillon C, Geyer MA. 1992. Gating and habituation of thestartle reflex in schizophrenic patients. Arch Gen Psychiatry.49:206–215.
Breakspear M. 2006. The nonlinear theory of schizophrenia. Aust N ZJ Psychiatry. 40:20–35.
Breakspear M, Terry JR, Friston KJ, Harris AW, Williams LM, Brown K,Brennan J, Gordon E. 2003. A disturbance of nonlinear interde-pendence in scalp EEG of subjects with first episode schizo-phrenia. Neuroimage. 20:466–478.
Canive JM, Lewine JD, Edgar JC, Davis JT, Torres F, Roberts B,Graeber D, Orrison WW Jr, Tuason VB. 1996. Magnetoencephalo-graphic assessment of spontaneous brain activity in schizophrenia.Psychopharmacol Bull. 32:741–750.
Cho RY, Konecky RO, Carter CS. 2006. Impairments in frontal corticalgamma synchrony and cognitive control in schizophrenia. ProcNatl Acad Sci USA. 103:19878–19883.
Contreras D, Llinas R. 2001. Voltage-sensitive dye imaging of neocor-tical spatiotemporal dynamics to afferent activation frequency.J Neurosci. 21:9403–9413.
Daskalakis ZJ, Christensen BK, Chen R, Fitzgerald PB, Zipursky RB,Kapur S. 2002. Evidence for impaired cortical inhibition in schizo-phrenia using transcranial magnetic stimulation. Arch Gen Psy-chiatry. 59:347–354.
Daskalakis ZJ, Farzan F, Barr MS, Maller JJ, Chen R, Fitzgerald PB.2008. Long-interval cortical inhibition from the dorsolateral pre-frontal cortex: a TMS-EEG study. Neuropsychopharmacology.33:2860–2869.
Delorme A, Makeig S. 2004. EEGLAB: an open source toolbox foranalysis of single-trial EEG dynamics including independent com-ponent analysis. J Neurosci Methods. 134:9–21.
Cerebral Cortex January 2014, V 24 N 1 219
by guest on April 8, 2016
http://cercor.oxfordjournals.org/D
ownloaded from

Dierks T, Linden DE, Jandl M, Formisano E, Goebel R, Lanfermann H,Singer W. 1999. Activation of Heschl’s gyrus during auditory hallu-cinations. Neuron. 22:615–621.
Esser SK, Hill S, Tononi G. 2009. Breakdown of effective connectivityduring slow wave sleep: investigating the mechanism underlyinga cortical gate using large-scale modeling. J Neurophysiol.102:2096–2111.
Farzan F, Barr MS, Levinson AJ, Chen R, Wong W, Fitzgerald PB, Das-kalakis ZJ. 2010. Evidence for gamma inhibition deficits in thedorsolateral prefrontal cortex of patients with schizophrenia.Brain. 133(Pt 5):1505–1514.
Ferrarelli F, Massimini M, Peterson MJ, Riedner BA, Lazar M, MurphyMJ, Huber R, Rosanova M, Alexander AL, Kalin N et al. 2008.Reduced evoked gamma oscillations in the frontal cortex inschizophrenia patients: a TMS/EEG study. Am J Psychiatry.165:996–1005.
Fingelkurts AA, Kivisaari R, Pekkonen E, Ilmoniemi RJ, Kahkonen S.2004. Local and remote functional connectivity of neocortex underthe inhibition influence. Neuroimage. 22:1390–1406.
Frantseva MV, Fitzgerald PB, Chen R, Moller B, Daigle M, DaskalakisZJ. 2008. Evidence for impaired long-term potentiation in schizo-phrenia and its relationship to motor skill learning. Cereb Cortex.18(5):990–996.
Gallinat J, Winterer G, Herrmann CS, Senkowski D. 2004. Reducedoscillatory gamma-band responses in unmedicated schizophrenicpatients indicate impaired frontal network processing. Clin Neuro-physiol. 115:1863–1874.
Hajos M, Hurst RS, Hoffmann WE, Krause M, Wall TM, Higdon NR,Groppi VE. 2005. The selective alpha7 nicotinic acetylcholine re-ceptor agonist PNU-282987 [N-[(3R)-1-Azabicyclo[2.2.2]oct-3-yl]-4-chlorobenzamide hydrochloride] enhances GABAergic synapticactivity in brain slices and restores auditory gating deficits in an-esthetized rats. J Pharmacol Exp Ther. 312:1213–1222.
Hershman KM, Freedman R, Bickford PC. 1995. GABAB antagonistsdiminish the inhibitory gating of auditory response in the rat hip-pocampus. Neurosci Lett. 190:133–136.
Hoffman RE, Hakins KA, Gueorgieva R, Boutros NN, Rachid F, CarrollK, Krystal JH. 2003. Transcranial magnetic stimulation of left tem-poroparietal cortex and medication-resistant auditory hallucina-tions. Arch Gen Psychiatry. 60:49–56.
Hubl D, Koenig T, Strik W, Federspiel A, Kreis R, Boesch C, Maier SE,Schroth G, Lovblad K, Dierks T. 2004. Pathways that make voices:white matter changes in auditory hallucinations. Arch Gen Psy-chiatry. 61:658–668.
Jacobs KM, Donoghue JP. 1991. Reshaping the cortical motor map byunmasking latent intracortical connections. Science. 251:944–947.
Jarvis MR, Mitra PP. 2001. Sampling properties of the spectrum andcoherency of sequences of action potentials. Neural Comput.13:717–749.
Koshino Y, Murata I, Murata T, Omori M, Hamada T, Miyagoshi M,Isaki K. 1993. Frontal intermittent delta activity in schizophrenicpatients receiving antipsychotic drugs. Clin Electroencephalogr.24:13–18.
Krause M, Hoffmann WE, Hajos M. 2003. Auditory sensory gating inhippocampus and reticular thalamic neurons in anesthetized rats.Biol Psychiatry. 53:244–253.
Kwon JS, O’Donnell BF, Wallenstein GV, Greene RW, Hirayasu Y,Nestor PG, Hasselmo ME, Potts GF, Shenton ME, McCarley RW.1999. Gamma frequency-range abnormalities to auditory stimu-lation in schizophrenia. Arch Gen Psychiatry. 56:1001–1005.
Kyriazi HT, Carvell GE, Brumberg JC, Simons DJ. 1996. Quantitativeeffects of GABA and bicuculline methiodide on receptive fieldproperties of neurons in real and simulated whisker barrels. J Neu-rophysiol. 75:547–560.
Lennox BR, Park SB, Medley I, Morris PG, Jones PB. 2000. The func-tional anatomy of auditory hallucinations in schizophrenia. Psy-chiatry Res. 100:13–20.
Levit-Binnun N, Litvak V, Pratt H, Moses E, Zaroor M, Peled A. 2010.Differences in TMS-evoked responses between schizophreniapatients and healthy controls can be observed without a dedicatedEEG system. Clin Neurophysiol. 121:332–339.
Lewis DA, Hashimoto T, Morris HM. 2008. Cell and receptor type-specific alterations in markers of GABA neurotransmission in theprefrontal cortex of subjects with schizophrenia. Neurotox Res.14:237–248.
Lewis DA, Hashimoto T, Volk DW. 2005. Cortical inhibitory neuronsand schizophrenia. Nat Rev Neurosci. 6:312–324.
Line P, Silberstein RB, Wright JJ, Copolov DL. 1998. Steady state visu-ally evoked potential correlates of auditory hallucinations inschizophrenia. Neuroimage. 8:370–376.
Llinas R, Urbano FJ, Leznik E, Ramirez RR, van Marle HJ. 2005. Rhyth-mic and dysrhythmic thalamocortical dynamics: GABA systemsand the edge effect. Trends Neurosci. 28:325–333.
Ma J, Tai SK, Leung LS. 2009. Ketamine-induced deficit of auditorygating in the hippocampus of rats is alleviated by medial septalinactivation and antipsychotic drugs. Psychopharmacology (Berl).206:457–467.
Massimini M, Ferrarelli F, Huber R, Esser SK, Singh H, Tononi G.2005. Breakdown of cortical effective connectivity during sleep.Science. 309:2228–2232.
Minzenberg MJ, Firl AJ, Yoon JH, Gomes GC, Reinking C, Carter CS.2010. Gamma oscillatory power is impaired during cognitivecontrol independent of medication status in first-episode schizo-phrenia. Neuropsychopharmacology. 35:2590–2599.
Moeller CK, Kurt S, Happel MFK, Schulze H. 2009. Long-range effectsof GABAergic inhibition in gerbil primary auditory cortex. Eur JNeurosci. 31:49–59.
Nunez PL, Srinivasan R. 2006. Electric fields of the brain: the neuro-physics of EEG. New York: Oxford University Press.
Percival DB, Walden AT. 1993. Spectral analysis for physical appli-cations: multitaper and conventional univariate techniques. Cam-bridge, New York (NY), USA: Cambridge University Press.
Perez Velazquez JL, Frantseva MV. 2011. The brain-behaviourcontinuum: the subtle transition between sanity and insanity.Singapore: World Scientific Publishing Co.
Pope KJ, Fitzgibbon SP, Lewis TW, Whitham EM, Willoughby JO.2009. Brain Topogr. 22:13–17.
Rao SG, Williams GV, Goldman-Rakic PS. 2000. Destruction and cre-ation of spatial tuning by disinhibition: GABA(A) blockade of pre-frontal cortical neurons engaged by working memory. J Neurosci.20:485–494.
Sadock BJS, Sadock VA, Ruiz P. 2009. Kaplan and Sadock’s compre-hensive textbook of psychiatry. Philadelphia (PA), USA: LippincottWilliams & Wilkins.
Saletu B, Kufferle B, Grunberger J, Foldes P, Topitz A, Anderer P.1994. Clinical, EEG mapping and psychometric studies in negativeschizophrenia: comparative trials with amisulpride and fluphena-zine. Neuropsychobiology. 29:125–135.
Spencer KM, Nestor PG, Perlmutter R, Niznikiewicz MA, Klump MC,Frumin M, Shenton ME, McCarley RW. 2004. Neural synchronyindexes disordered perception and cognition in schizophrenia.Proc Natl Acad Sci USA. 101:17288–17293.
Sritharan A, Line P, Sergejew A, Silberstein R, Egan G, Copolov D.2005. EEG coherence measures during auditory hallucinations inschizophrenia. Psychiatry Res. 136:189–200.
Symond MP, Harris AW, Gordon E, Williams LM. 2005. “Gamma syn-chrony” in first-episode schizophrenia: a disorder of temporal con-nectivity? Am J Psychiatry. 162:459–465.
Thaker GK. 2008. Neurophysiological endophenotypesacross bipolar and schizophrenia psychosis. Schizophr Bull.34:760–773.
Uhlhaas PJ, Linden DE, Singer W, Haenschel C, Lindner M, Maurer K,Rodriguez E. 2006. Dysfunctional long-range coordinationof neural activity during Gestalt perception in schizophrenia.J Neurosci. 26:8168–8175.
Uhlhaas PJ, Singer W. 2006. Neural synchrony in brain disorders: rel-evance for cognitive dysfunctions and pathophysiology. Neuron.52:155–168.
Valentin A, Arunachalam R, Mesquita-Rodrigues A, Garcia Seoane JJ,Richardson MP, Mills KR, Alarcon G. 2008. Late EEG responsestriggered by transcranial magnetic stimulation (TMS) in the evalu-ation of focal epilepsy. Epilepsia. 49:470–480.
220 Disrupted Cortical Conductivity in Schizophrenia • Frantseva et al.
by guest on April 8, 2016
http://cercor.oxfordjournals.org/D
ownloaded from

Wang Y, Fujita I, Murayama Y. 2000. Neuronal mechanisms of selec-tivity for object features revealed by blocking inhibition in infero-temporal cortex. Nat Neurosci. 3:807–813.
Wang Y, Fujita I, Tamura H, Murayama Y. 2002. Contribution ofGABAergic inhibition to receptive field structures of monkeyinferior temporal neurons. Cereb Cortex. 12:62–74.
Whitham EM, Pope KJ, Fitzgibbon SP, Lewis T, Clark CR, Loveless S,Broberg M, Wallace A, DeLosAngeles D, Lillie P et al. 2007. ClinNeurophysiol. 118:1877–1888.
Wobrock T, Schneider M, Kadovic D, Schneider-Axmann T, Ecker UK,Retz W, Rosler M, Falkai P. 2008. Reduced cortical inhibition infirst-episode schizophrenia. Schizophr Res. 105:252–261.
Cerebral Cortex January 2014, V 24 N 1 221
by guest on April 8, 2016
http://cercor.oxfordjournals.org/D
ownloaded from