Embed Size (px)
Citation preview
Investigation of the Interactions in the Eu(III)-Borate System
DISSERTATION
zur Erlangung des akademischen Grades
Doctor rerum naturalium
(Dr. rer. nat.)
vorgelegt
der Fakultät Mathematik und Naturwissenschaften
der Technischen Universität Dresden
von
M.Sc. Juliane Schott
geboren am 01.06.1986 in Dresden
Eingereicht am
Die Dissertation wurde in der Zeit von November 2010 bis Mai 2014 am Helmholtz-Zentrum
Dresden-Rossendorf, Institut für Ressourcenökologie, sowie am Sachgebiet Strahlenschutz
der Technischen Universität Dresden, Zentrales Radionuklidlabor, angefertigt.
Acknowledgement ― Danksagung
Zunächst möchte ich mich bei den ehemaligen und jetzigen Direktoren des Instituts für Ressourcenökologie
(ehemals Radiochemie) am Helmholtz-Zentrum Dresden-Rossendorf ― Prof. Dr. Gert Bernhard und Prof.
Dr. Thorsten Stumpf ― bedanken, unter deren Schirm ich meine Doktorarbeit anfer8gen konnte.
Mein großer Dank gilt Dr. Margret Acker, welche die Themen zu meinen bisherigen Abschlussarbeiten und
nun auch der Doktorarbeit gestellt hat. Vielen Dank für deine jahrelange Unterstützung und dein Vertrauen.
Bei Dr. Astrid Barkleit, Dr. Vinzenz Brendler als auch wiederum bei Dr. Margret Acker möchte ich mich sehr
herzlich für ihre außerordentlich intensive Betreuung und Unterstützung in der Bearbeitung meines
Promotionsthemas bedanken. Unvergesslich bleiben mir euer unermüdlicher Einsatz in der Korrektur der
Publikationen und Doktorarbeit, sowie eure zielführenden und motivierenden Gesprächsrunden. Auch bei
Herrn Dr. Steffen Taut möchte mich recht herzlich für sein Engagement im Korrigieren von Schriftstücken
und aufmerksames Begleiten dieser Arbeit bedanken.
Mein unendlicher Dank gilt Jérôme Kretzschmar, mit dessen Unterstützung und Expertise in NMR-
Spektroskopie diese Arbeit solide aufgestellt werden konnte. Die Anwendung der NMR-Spektroskopie hat
zur Aufklärung eines sehr komplexen Systems in einem hohen Maß beigetragen. Vielen herzlichen Dank für
deine unablässige Unterstützung, unermüdlichen Einsatz, ansteckende Begeisterungsfähigkeit und
Motivation. Ich habe viel von dir gelernt.
Bei Björn Drobot, welcher die PARAFAC durchgeführt hat, und Prof. Dr. Satoru Tsushima, welcher DFT
Rechnungen ausgeführt hat, möchte ich mich sehr gern bedanken. Durch diese Methoden konnten
Ergebnisse und Hypothesen gefestigt und das Gesamtbild über das zu bearbeitende System abgerundet
werden. Vielen Dank.
Ein herzlicher Dank geht an die Aktinidenverbundprojektteilnehmer Dr. Sascha Eidner und Prof. Dr.
Michael U. Kumke vom Institut für Physikalische Chemie der Universität Potsdam für die Möglichkeit ihre
Lasersysteme für Untersuchungen zu nutzen, die umfassende Betreuung während meines Aufenthalts, und
Diskussion der Ergebnisse. In diesem Zusammenhang möchte ich mich auch bei den weiteren Mitarbeitern
im Aktinidenverbundprojekt für einen regen Austausch und Diskussionsrunden bedanken.
Bei Prof. Dr. Eike Brunner und Dr. Silvia Paasch vom Institut für Bioanalytische Chemie der TU Dresden
bedanke ich mich für die Durchführung der Festkörper-NMR Messungen und Diskussionen.
Folgenden weiteren Personen möchte ich für ihre Zusammenarbeit und Untersützung sehr gern danken:
- Karsten Heim (HZDR) für die Durchführung von IR Messungen,
- Stephan Weiß (HZDR) für die Betreuung in den Lichtstreuexperimenten, SEM-Probenpräparation und
Unterstützung in labortechnischen Angelegenheit,
- Elfi Christalle (HZDR) für die Durchführung der SEM Messungen,
- Analytikgruppe des Insituts für Ressourcenökologie (HZDR) für unzählige ICP-MS Analysen,
- Dr. Henry Moll (HZDR) für die Einführung in das Lasersystem für TRLFS, Wartung des Lasersystems und
damit verbunden einem reibungslosen Messablauf, sowie für die Betreuung der Cm-Arbeiten,
- Dr. Christoph Hennig (HZDR) und Dr. Sabrina Labs (Forschungszentrum Jülich) für die Organisation und
Durchführen von XRD Messungen am DESY in Hamburg (ein Dank geht an diese Institution für die
Möglichkeit zur Messung) und nachfolgende Diskussionen,
- Dr. Erica Brendler vom Institut für Analytische Chemie der TU Bergakademie Freiberg für die
Zusammenarbeit und Möglichkeit NMR Messungen durchzuführen,
- dem Strahlenschutz und Technikern des Insituts für Ressourcenökologie (HZDR) für einen reibungslosen
Laborablauf und -alltag, insbesondere Annette Rumpel, Heidemarie Heim, Kathrin Nebe, Christa Müller,
Steffen Henke, Bernd Hiller, Stephan Weiß, Carola Eckardt, Heidrun Neubert und Sylvia Heller,
- Dr. Frank Bok (HZDR) für seine Expertise in thermodynamischen Datenbanken und Beratung,
- Dr. Juliane März (HZDR), Dr. Matthias Schmid (ehemals HZDR), Dr. Jörg Grenzer (HZDR) und Andrea
Scholz (HZDR) für ihren Einsatz in der Röntgendiffraktometrie,
- dem Sekretariat des Insituts für Ressourcenökologie (HZDR), vorallem Jana Gorzitze und Claudia Kirmes,
sowie des Sachgebiets Strahlenschutz (TU Dresden) Martina Kobus für organisatorische Angelegenheiten
wie Dienstreisen und Abrechnungen, und Ronny Berndt in IT Angelegenheiten,
- Mitarbeiter des Sachgebiets Strahlenschutz der TU Dresden (Dr. Steffen Taut, Dr. Margret Acker,
Franziska Taube, Melanie Müller, Norman Kelly, Martina Kobus, Wolfgang Krause, Sandra Hertwig) für ein
angenehmes Arbeitsklima, und alle nicht namentlich genannten IRE-Kollegen für eine angenehme Zeit.
- Freunde und Kollegen des Büros P254 am Institut für Ressourcenökologie (HZDR) Isabel Zirnstein,
Corinna Gagell, Katja Schulz, Ulrike Gerber, Siriwan Dulnee, Laura Lütke, Anne Heller, Erik Johnstone,
Claudia Joseph, Claudia Wilke, sowie Jérôme Kretzschmar, Constanze Richter und Frank Bok, meinen
lieben Freunden Franziska und Stephan, Maria, Madlen und René, für den guten Zusammenhalt,
Unterstützung, Motivation und gemeinsame Unternehmungen.
Meinen lieben Eltern und Großeltern mit Geschwistern, sowie meinem lieben Schwesterherz und Freund
mit Familie danke ich aus ganzem Herzen für eure jahrelange Unterstützung, Bestätigungen,
Aufmunterungen, Motivation, Geduld, Verständnis und den familiären Rückhalt. Ganz herzlichen Dank.
Juliane Schott
Table of Contents
i
Table of Contents
page
List of abbreviations, symbols and units iii ─ v
List of Figures vi ─ ix
List of Tables x ─ xi
Summary xii ─ xiii
Zusammenfassung xiv ─ xvi
1 Motivation and Aims 1 ─ 4
2 Basics 5 ─ 28
2.1 Trivalent actinides and lanthanides 5 ─ 9
2.2 Complexation reaction of metals with ligands in aqueous solution 9 ─ 13
2.3 Literature overview 13 ─ 26
2.3.1 B(OH)3-(poly)borate equilibria 13 ─ 20
2.3.2 Organoborates 20 ─ 21
2.3.3 Metal-borate complexes 22 ─ 24
2.3.4 Borate solids 24 ─ 26
2.4 Working hypothesis and approaches 26 ─ 28
3 Methods 29 ─ 50
3.1 Luminescence spectroscopy 29 ─ 39
3.1.1 Time-resolved laser-induced fluorescence spectroscopy (TRLFS) 31 ─ 33
3.1.2 Luminescence properties of Eu(III) 33 ─ 39
3.2 NMR spectroscopy 39 ─ 47
3.2.1 Basic principles of NMR spectroscopy 39 ─ 42
3.2.2 11B NMR spectroscopy 42 ─ 47
3.3 Miscellaneous methods and analytics 47 ─ 50
Table of Contents
ii
4 Results and Discussion 51 ─ 96
4.1 The system Eu(III)-B(OH)3-polyborates 51 ─ 82
4.1.1 11B NMR spectroscopy of B(OH)3-polyborate containing solutions 51 ─ 53
4.1.2 Eu(III)-(poly)borate complexation 54 ─ 62
4.1.3 Description of a Eu(III)-borate solid 62 ─ 82
4.2 The system Eu(III)-B(OH)3-organics 82 ─ 96
4.2.1 Formation of organoborates 83 ─ 86
4.2.2 Eu(III)-organoborate complexation 86 ─ 95
4.2.3 Effect of organics on the Eu(III)-borate solid formation 95 ─ 96
5 Conclusion and Outlook 97 ─ 98
6 Experimental details 99 ─ 105
Appendix 106 ─ 117
References 118 ─ 126
List of Publications 127 ─ 128
List of abbreviations, symbols and units
iii
List of abbreviations, symbols and units
α alpha particle
An, An(III) actinides, trivalent actinides
BH, B boric acid, monoborate
BL, BLac, BSal organoborate, lactatoborate, salicylatoborate
B(3), B(4) threefold/fourfold coordinated boron center
[BO3], [BO4−] trigonal planar/tetrahedral boron units
BMWi Bundesministerium für Wirtschaft und Energie
(Federal Ministry for Economic Affairs and Energy)
CN coordination number
δ in-plane bending
DFT density functional theory
DLS dynamic light scattering
e Euler´s number
ED electric dipole
EDTA ethylenediaminetetraacetic acid
EDX energy dispersive X-ray analysis
efg electric field gradient
e.g. for example
Eq. equation
et al. and others
etc. et cetera
EuL, EuL2, EuBL 1:1/1:2 Eu(III)-ligand complex, Eu(III)-organoborate complex
EuLac, EuLac2, EuBLac 1:1/1:2 Eu(III)-lactate complex, Eu(III)-lactatoborate complex
EuSal, EuSal2, EuBSal 1:1/1:2 Eu(III)-salicylate complex, Eu(III)-salicylatoborate complex
FID free induction decay
Fig. figure
FT Fourier transform
γ out-of-plane bending
HLW high-level radioactive waste
HSAB hard and soft acids and bases (concept of Pearson)
HZDR Helmholtz-Zentrum Dresden-Rossendorf
iCCD intensified charge-coupled device
ICP-MS Inductively Coupled Plasma Mass Spectrometry
i.e. that is
IR infrared
IUPAC International Union of Pure and Applied Chemistry
LacH, Lac lactic acid, lactate
laser light amplification by stimulated emission of radiation
lg decadic logarithm
LH, L protonated ligand, deprotonated ligand
Ln, Ln(III) lanthanides, trivalent lanthanides
M metal ion
MAS magic angle spinning
MD magnetic dipole
ML metal-ligand complex
n neutron
Nagra Nationale Genossenschaft für die Lagerung radioaktiver Abfälle
(National Cooperative for the Disposal of Radioactive Waste)
Nd:YAG neodymium-doped yttrium aluminium garnet
List of abbreviations, symbols and units
iv
NEA Nuclear Energy Agency
NMR nuclear magnetic resonance (spectroscopy)
OECD Organisation for Economic Co-operation and Development
OPO optical parametric oscillator
PARAFAC parallel factor analysis
PSI Paul Scherrer Institut
S singlet state
SalH, Sal salicylic acid, salicylate
SEM Scanning Electron Microscopy
SIT Specific Ion Interaction Theory
T triplet state
TDB thermodynamic data base
THEREDA Thermodynamic Reference Database
TRLFS time-resolved laser-induced fluorescence spectroscopy
UV/Vis ultraviolet/visible
ν stretching vibration
viz. that is
WIPP Waste Isolation Pilot Plant
XRD X-ray diffraction
[…] reference
ai activity of species i
B, B0 magnetic field, external magnetic field
[B]total total concentration of boron
β, βm, β0 cumulative complexation constant in molar scale, in molal scale,
extrapolated to zero ionic strength
c concentration in molar scale; speed of light
d thickness of the sample
D Debye-Hückel term
∆ difference
δ chemical shift
E energy
ε decadic molar extinction coefficient; interaction coefficient
Eh redox potential
[Eu(III)]total total concentration of Eu(III)
F1/F2 intensity ratio of 5D0 → 7F1 and 5D0 → 7F2 transition
γ activity coefficient; gyromagnetic ratio
h Planck´s constant
I, Im ionic strength in molar scale, in molal scale; nuclear spin quantum number
I0, IA, IL intensity of initial light, absorbed light, luminescence light
J total angular momentum
k decay rate
K, K0 formation constant in molar scale, extrapolated to zero ionic strength;
stepwise complexation constant
Ka, Ka0, pKa acid dissociation constant in molar scale, extrapolated to zero ionic strength, negative
decadic logarithm of Ka
Kw, pKw ion product of water, negative decadic logarithm of Kw
L, l total orbital angular momentum, orbital angular momentum
λ, λex, λem wavelength, excitation wavelength, emission wavelength
[lactate]total total concentration of lactate (Lac + LacH)
m concentration in molal scale;
magnetic quantum number
List of abbreviations, symbols and units
v
M multiplicity
µ magnetic moment
nH2O amount of water molecules in the first hydration shell
[organics]total total concentration of organics
P nuclear spin
p, pCO2 pressure, partial pressure of CO2
pH, pHc (corrected) negative decadic logarithm of the hydrogen ion activity or concentration
Q quantum yield
ρ conversion factor
S, s total spin, electron spin
σ standard deviation
[salicylate]total total concentration of salicylate (Sal + SalH)
t time
T temperature
T1/2 half-life
τ luminescence lifetime
ν frequency, wavenumber; stoichiometric coefficient
x fraction
z charge
[X] equilibrium concentration of substance X
Å Ångström (1 Å = 10−10 m)
a.u. arbitrary unit
cm centimeter
d day
g gram
K, °C Kelvin, degree Celsius
kg kilogram
L liter
m mol/kg
m³ cubic meter
M mol/L
MHz megahertz
mol mol
MPa megapascal
ms millisecond
µs microsecond
nm nanometer
ppm parts per million
rad radian
s second
T tesla
% percent
List of Figures
vi
List of Figures
Fig. 1: Molecular structure of the main and clearly identified polyborate species in solution.
Fig. 2: B(OH)3-polyborate speciation relative to [B]total for different [B]total as a function of pH, I = 0.1 M
(NaClO4). Calculation with converted values of Ingri´s formation constants [46], [48] for different
(poly)borates (Table A-1, see appendix). Calculated B(OH)3-polyborate formation as effective
species concentration is shown in Fig. A-1 (see appendix).
Fig. 3: Distribution of the polyborates B3O3(OH)4− (left) and B5O6(OH)4
− (right) as a function of [B]total and
pH, I = 0.1 M (NaClO4).
Fig. 4: General structures of organoborates resulting from reaction of (a) boric acid with
hydroxycarboxylates and (b) monoborate with polyols.
Fig. 5: Reaction mechanism for the formation of the (a) mono-cyclic and (b) bi-cyclic organoborate
(hydroxycarboxylate based).
Fig. 6: Linear relationship (according to Bousher [83]) between complexation constants of metal-borate
complexes (converted values according to Eq. 26) and first metal hydrolysis constants (converted
values according to Eq. 24), Table 6. The calculated data points for Eu(III) from this relationship
are plotted and respective values for lg β*Eu,B/lg β0
Eu,B are calculated.
Fig. 7: M(III)-borate complex, M = trivalent actinides/lanthanides.
Fig. 8: Jabłoński diagram, according to Otto [114].
Fig. 9: Set-up of the laser system for luminescence spectroscopy.
Fig. 10: Time-resolved Eu(III) luminescence spectra (left), decay curve of the Eu(III) luminescence (right).
Fig. 11: Energy level diagram of Eu(III). The coupling of the lowest excited state of Eu(III) with an overtone
frequency of water leads to luminescence quenching. Figure according to Horrocks et al. [116]
with data of Carnall et al. [115].
Fig. 12: (a) Luminescence spectrum of Eu(III) aquo ion, (b) Luminescence spectrum of Eu(III) in presence
of a ligand (here: [salicylate]total = 0.01 M, pH 5).
Fig. 13: 11B ground state splitting in an external magnetic field.
Fig. 14: Figure copied from Müller et al. [128]; 11B MAS NMR spectrum of Tl[B5O6(OH)4]·2H2O (128.3 MHz),
(a) experimentally obtained spectrum, (b) calculated spectrum, (c) single components of the
spectrum, (d) spectrum calculated for 160.4 MHz.
Fig. 15: 11B NMR spectra (normalized) of solutions containing variable amounts of [B]total (0.2 m to 0.7 m,
step size 0.1 m) at (a) pHc 5 and (b) pHc 6; in each case Im = 0.1 m (NaClO4). The insets show
expansion of the polyborate region. 11B NMR spectrum in orange shows a six months aged solution
containing [B]total = 0.7 m at pHc 6, Im = 0.1 m (NaClO4).
Fig. 16: Europium luminescence spectra at (a) pHc 5 and (b) pHc 6 as a function of [B]total (step size 0.1 m),
3·10-5 m Eu(III), Im = 0.1 m (NaClO4).
Fig. 17: F1/F2 as a function of pHc, pH titration of solutions containing 3·10-5 m Eu(III) and [B]total = constant,
Im = 0.1 m (NaClO4).
Fig. 18: Linear relationship (according to Bousher [83], see chapter 2.3.3) between complexation
constants of metal-borate complexes (converted value according to Eq. 26) and first metal
hydrolysis constants (converted value according to Eq. 24), Table 6. The determined data points
for Eu(III) (this work) integrate well into this relationship.
List of Figures
vii
Fig. 19: Eu(III)-(poly)borate speciation as a function of [B]total and pH (carbonate-free system), [Eu(III)]total
= 3·10-5 m, Im = 0.1 m (NaClO4). Speciation calculated with converted complexation constants
summarized in Table A-1 (see appendix). Application of lg βEuB = 2.0 (primarily valid for Eu(III)
complexes with borate ligands having one binding site) for all the Eu(III)-(poly)borate complexes,
although there are Eu(III) complexes with borate ligands having two binding sites. Eu(III)-
(poly)borate speciation calculated with lg βEuB = 2.6: Fig. A-2 (see appendix).
Fig. 20: F1/F2 ratio as a function of [B]total and ionic strength, left: NaClO4 medium, right: NaCl medium.
Fig. 21: (a) SIT plot of data points from the Eu(III)-(poly)borate-NaClO4 system (error bars: 2σ from
estimation), (b) SIT curve (calculated with lg β01 = 3.14 and ∆ε = -0.09 via Eq. 12) for the Eu(III)-
(poly)borate-NaClO4 system.
Fig. 22: left: Development of Eu(III) luminescence spectra and lifetimes with observation time at (a) pHc =
5 and (b) pHc = 6; right: Eu(III) luminescence spectra of unfiltered and filtered solutions at (c) pHc
= 5 and (d) pHc = 6, filtration after 71 days; solution: [B]total = 0.6 m, [Eu(III)]total = 3·10−5 m, Im = 0.1
m (NaClO4).
Fig. 23: Possible Eu(III) environment in the Eu(III)-borate solid; R = H, other threefold coordinated boron
centers, condensed borate structures.
Fig. 24: (a) Formation progress of the Eu(III)-borate solid species for a solution containing [Eu(III)]total =
3·10-5 m, [B]total = 0.7 m, Im = 0.1 m (NaClO4) at pHc 6, (b) Europium luminescence lifetime observed
with observation time.
Fig. 25: Eu(III) luminescence decay curves during the formation progress of the Eu(III)-borate solid at pHc
= 6; [Eu]total = 3·10-5 m, [B]total = 0.7 m, Im = 0.1 m (NaClO4).
Fig. 26: IR spectrum of the isolated Eu(III)-borate solid and for comparison of boric acid in the range of (a)
4000-380 cm-1 and (b) 800-380 cm-1.
Fig. 27: IR spectrum of the isolated Eu(III)-borate solid precipitated at different ionic strengths and media
(NaCl/NaClO4), above: comparison of ionic strength, below: comparison of medium.
Fig. 28: Solid-state 11B NMR spectrum (256.8 MHz) of the La(III)-borate solid as representative for the
Eu(III)-borate solid.
Fig. 29: Solid-state Eu(III) luminescence spectra of the Eu(III)-borate solid precipitated at different ionic
strengths and media (left: NaClO4, right: NaCl). Excitation: λex = 394 nm, room temperature (T =
22 °C).
Fig. 30: Excitation spectra at low temperature (T < 5 K) of the Eu(III)-borate solid precipitated at different
ionic strengths and media (NaClO4/NaCl).
Fig. 31: Comparison of the Eu(III) luminescence spectra at low temperature (T < 5 K) of the Eu(III)-borate
solid excited at different λex; Eu(III)-borate solid precipitated at different ionic strengths and media
(NaCl/NaClO4).
Fig. 32: Luminescence spectra of single Eu(III) species determined with PARAFAC from luminescence
data.
Fig. 33: Content of different Eu(III) solid species in the Eu(III)-borate solid precipitated at different ionic
strengths.
Fig. 34: Eu(III) luminescence spectra of unfiltered and filtered solutions (left: spectrum with detected
intensity, right: spectrum with normalized intensity); filtration after around 1 year and 3 months;
solution: [B]total = 0.5 m, [Eu(III)]total = 3·10−5 m, pHc = 6, Im = 0.1 m (NaClO4).
List of Figures
viii
Fig. 35: SEM images of Eu(III)-borate particles on a 50 nm-membrane filter surface (black spots = 50 nm
pores).
Fig. 36: (a) salicylatoborate, (b) lactatoborate.
Fig. 37: 11B NMR spectra of aqueous solutions (pH 5, I = 0.1 M (NaClO4)) with (a) [B]total = 0.2 M and
[lactate]total = 0.005 M lactate, (b) [B]total = 0.2 M and [salicylate]total = 0.005 M; scaling factors of
the organoborate signals are given.
Fig. 38: Speciation of different organic-boron systems for solutions with [organics]total = 0.005 M and
[B]total = 0.2 M, I = 0.1 M (NaClO4), T = 22 °C (own data for pKa and KBL taken from Table 25 and
Table 26). left: salicylate-B(OH)3 system, right: lactate-B(OH)3 system. Speciations relative to
[B]total: Fig. A-9 (see appendix).
Fig. 39: Influence of boric acid on the Eu(III)-salicylate system. Eu(III) luminescence spectra of solutions at
around pH 4.4 and [Eu(III)]total = 3·10−5 M, I = 0.1 M (NaClO4) with (I) [salicylate]total = 0.01 M, (II)
[salicylate]total = 0.01 M and [B]total = 0.2 M, (III) pH titration of a solution containing [Eu(III)]total =
3·10−5 M, [salicylate]total = 0.01 M and [B]total = 0.2 M from around pH 4.4 down to around pH 2.
Fig. 40: 11B chemical shift of salicylatoborate as a function of [Eu(III)]total; solutions: [salicylate]total = 0.005
M, [B]total = 0.2 M, [Eu(III)]total = variable, pH 5, 11B chemical shift corrected according to [108].
Fig. 41: Influence of boric acid on the Eu(III)-lactate system. Eu(III) luminescence spectra of solutions at
around pH 4.4 and [Eu(III)]total = 3·10−5 M, I = 0.1 M (NaClO4) with (I) [lactate]total = 0.002 M, (II)
[lactate]total = 0.002 M and [B]total = 0.4 M, (III) pH titration of a solution containing [Eu(III)]total =
3·10−5 M, [lactate]total = 0.002 M and [B]total = 0.4 M from around pH 4.4 down to around pH 2.
Fig. 42: 11B chemical shift of lactatoborate as a function of [Eu(III)]total; solutions: [lactate]total = 0.005 M,
[B]total = 0.2 M, [Eu(III)]total = variable, pH 5, 11B chemical shift corrected according to [108].
Fig. 43: Speciation for the Eu(III)-salicylate-B(OH)3 system as a function of [salicylate]total and pH
(carbonate-free system), [Eu(III)]total = 3·10-5 M, I = 0.1 M (NaClO4). Speciation calculated with
converted complexation constants summarized in Table A-1 (see appendix). Application of lg
βEuBSal = 2.0, and lg βEuB = 2.0 (primarily valid for Eu(III) complexes with borate ligands having one
binding site) for all the Eu(III)-(poly)borate complexes, although there are Eu(III) complexes with
borate ligands having two binding sites. Speciation for the Eu(III)-salicylate-B(OH)3 system
calculated with lg βEuBSal = 2.7 and lg βEuB = 2.6: Fig. A-13 (see appendix).
Fig. 44: Speciation for the Eu(III)-lactate-B(OH)3 system as a function of [lactate]total and pH (carbonate-
free system), [Eu(III)]total = 3·10-5 M, I = 0.1 M (NaClO4). Speciation calculated with converted
complexation constants summarized in Table A-1 (see appendix). Application of lg βEuBLac = 2.0,
and lg βEuB = 2.0 (primarily valid for Eu(III) complexes with borate ligands having one binding site)
for all the Eu(III)-(poly)borate complexes, although there are Eu(III) complexes with borate ligands
having two binding sites. Speciation for the Eu(III)-lactate-B(OH)3 system calculated with lg βEuBLac
= 2.7 and lg βEuB = 2.6: Fig. A-14 (see appendix).
Fig. 45: Eu(III)-borate solid formation progress as a function of [organics]total; solution: [Eu(III)]total =
3·10-5 M, [B]total = 0.65 M, [oranganics]total = variable, pH = 6, I = 0.1 M (NaClO4).
Fig. A-1: B(OH)3-polyborate formation as effective species concentration for different [B]total as a function
of pH, I = 0.1 M (NaClO4). Calculation with converted values of Ingri´s formation constants [46],
[48] for different (poly)borates (Table A-1, see appendix).
Fig. A-2: Eu(III)-(poly)borate speciation as a function of [B]total and pH (carbonate-free system), [Eu(III)]total
= 3·10-5 m, Im = 0.1 m. Speciation calculated with converted complexation constants summarized
List of Figures
ix
in Table A-1 (see appendix). Application of lg βEuB = 2.6 (primarily valid for Eu(III) complexes with
borate ligands having one binding site) for all the Eu(III)-(poly)borate complexes, although there
are Eu(III) complexes with borate ligands having two binding sites. Eu(III)-(poly)borate speciation
calculated with lg βEuB = 2.0: see Fig. 19.
Fig. A-3: Powder X-ray diffraction pattern of the Eu(III)-borate solid (black graph); grey vertical lines: main
diffraction peaks of the sodium pentaborate phase (Na2[B5O8(OH)]·H2O) described by Menchetti
et al. [146].
Fig. A-4: Comparison of the IR spectrum of the Eu(III)-borate and La(III)-borate solid precipitated at I =
0.1 m (NaClO4).
Fig. A-5: Proposed structures of the borate ligand in the Eu(III)-borate solid deduced from solid-state 11B NMR spectroscopy.
Fig. A-6: Europium luminescence spectra obtained at low temperature (left: λex = 578.5 nm, right: λex =
579.45 nm) of the Eu(III)-borate solid precipitated at different ionic strengths (0.1 m/1 m/3 m
NaCl/NaClO4).
Fig. A-7: Luminescence spectra of single Eu(III) species determined with PARAFAC from luminescence
data, 5D0 → 7F3 transition is shown.
Fig. A-8: Particle size distribution of colloid-like particles (in the 1.2 µm filtrate) of Eu(III) and polyborate
containing solutions.
Fig. A-9: Speciation of different organic-boron systems for solutions with [organics]total = 0.005 M and
[B]total = 0.2 M, I = 0.1 M, T = 22 °C (own data for pKa and KBL taken from Table 25 and Table 26,
Table A-1, see appendix). (a) salicylate-B(OH)3 system, (b) lactate-B(OH)3 system.
Fig. A-10: (a) Eu(III)-salicylate speciation at pH 5 and I = 0.1 M (NaClO4); [Eu(III)]total = 3·10−5 M Eu(III),
[salicylate]total = 0.0029 M (if [B]total = 0.2 M, [salicylate]total = 0.01 M → [salicylate]free =
0.0029 M); lg βEuSal = 2.10 (this work), lg βEuSal2 = 3.84 [34]. (b) Eu(III)-lactate speciation at pH 5;
[Eu(III)]total = 3·10−5 M Eu(III), [lactate]total = 0.0056 M (if [B]total = 0.2 M, [lactate]total = 0.01 M →
[lactate]free = 0.0056 M); lg βEuLac = 2.51 [33], lg βEuLac2 = 4.45 [33].
Fig. A-11: Europium(III) speciation obtained from PARAFAC. Solutions: [Eu(III)]total = 3·10−5 M ,
[salicylate]total = 0.01 M and varying [B]total , pH 5, I = 0.1 M (NaClO4).
Fig. A-12: Europium(III) speciation obtained from PARAFAC. Solutions: [Eu(III)]total = 3·10−5 M, [lactate]total =
0.01 M and varying [B]total, pH 5, I = 0.1 M (NaClO4).
Fig. A-13: Speciation for the Eu(III)-salicylate-B(OH)3 system as a function of [salicylate]total and pH
(carbonate-free system), [Eu(III)]total = 3·10-5 m, I = 0.1 m (NaClO4). Speciation calculated with
converted complexation constants summarized in Table A-1 (see appendix). Application of lg
βEuBSal = 2.7, and lg βEuB = 2.6 (primarily valid for Eu(III) complexes with borate ligands having one
binding site) for all the Eu(III)-(poly)borate complexes, although there are Eu(III) complexes with
borate ligands having two binding sites. Speciation for the Eu(III)-salicylate-B(OH)3 system
calculated with lg βEuBSal = 2.0 and lg βEuB = 2.0: see Fig. 43.
Fig. A-14: Speciation for the Eu(III)-lactate-B(OH)3 system as a function of [lactate]total and pH (carbonate-
free system), [Eu(III)]total = 3·10-5 m, I = 0.1 m (NaClO4). Speciation calculated with converted
complexation constants summarized in Table A-1 (see appendix). Application of lg βEuBLac = 2.7,
and lg βEuB = 2.6 (primarily valid for Eu(III) complexes with borate ligands having one binding site)
for all the Eu(III)-(poly)borate complexes, although there are Eu(III) complexes with borate ligands
having two binding sites. Speciation for the Eu(III)-lactate-B(OH)3 system calculated with lg βEuBLac
= 2.0 and lg βEuB = 2.0: see Fig. 44.
List of Tables
x
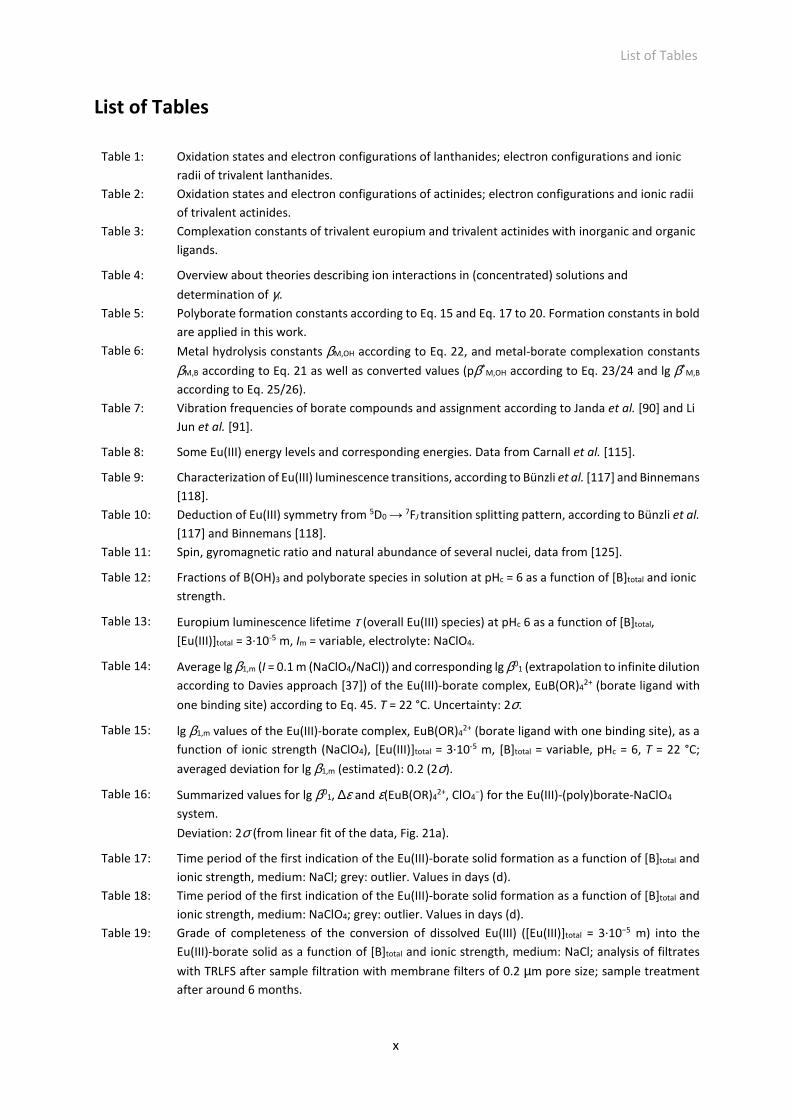
List of Tables
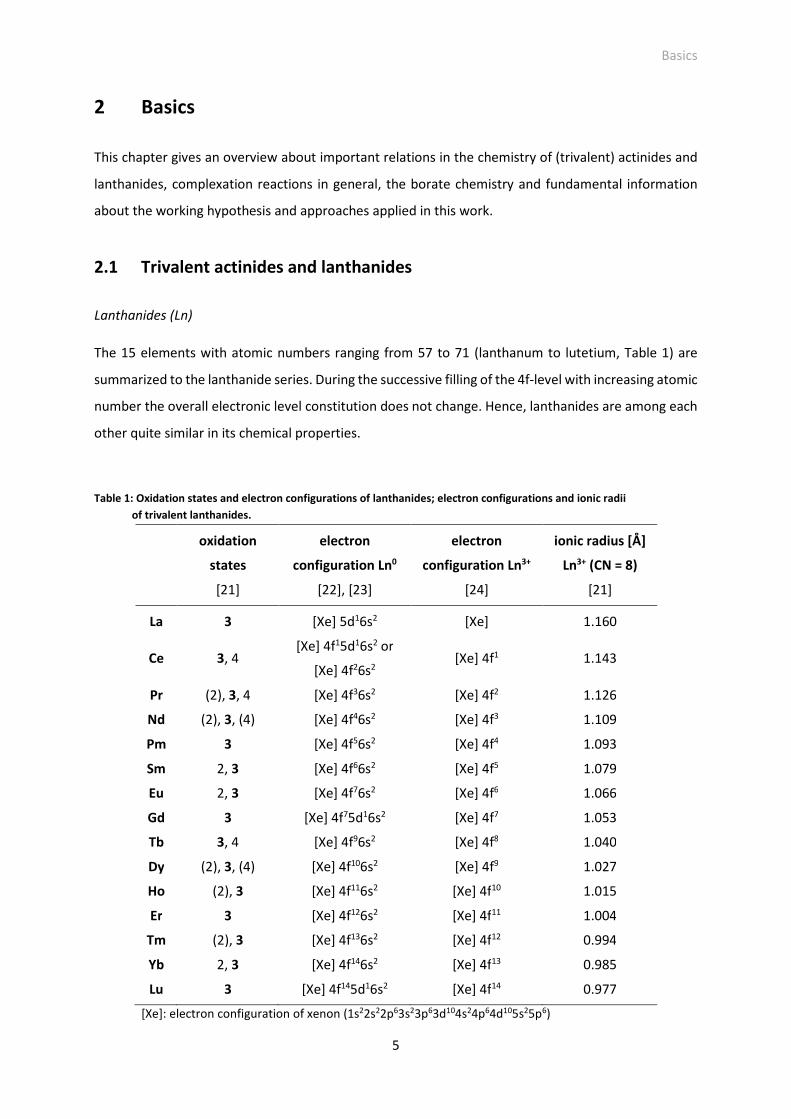
Table 1: Oxidation states and electron configurations of lanthanides; electron configurations and ionic
radii of trivalent lanthanides.
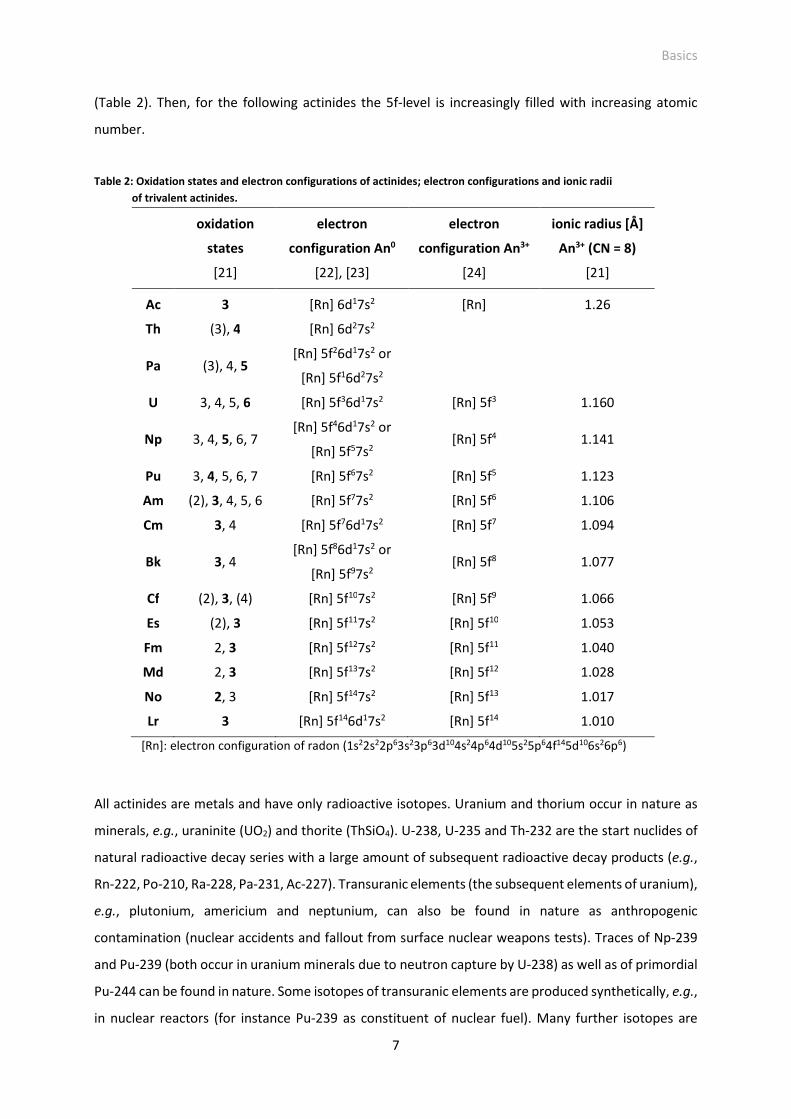
Table 2: Oxidation states and electron configurations of actinides; electron configurations and ionic radii
of trivalent actinides.
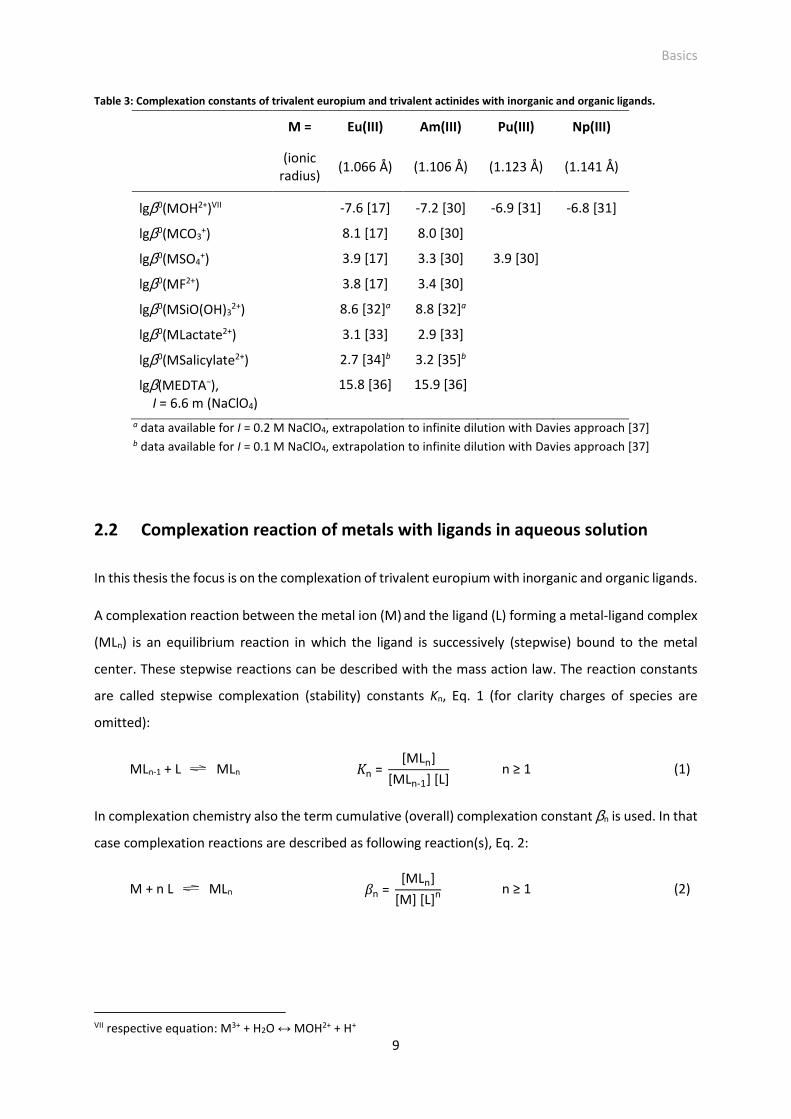
Table 3: Complexation constants of trivalent europium and trivalent actinides with inorganic and organic
ligands.
Table 4: Overview about theories describing ion interactions in (concentrated) solutions and
determination of γi.
Table 5: Polyborate formation constants according to Eq. 15 and Eq. 17 to 20. Formation constants in bold
are applied in this work.
Table 6: Metal hydrolysis constants βM,OH according to Eq. 22, and metal-borate complexation constants
βM,B according to Eq. 21 as well as converted values (pβ*M,OH according to Eq. 23/24 and lg β*
M,B
according to Eq. 25/26).
Table 7: Vibration frequencies of borate compounds and assignment according to Janda et al. [90] and Li
Jun et al. [91].
Table 8: Some Eu(III) energy levels and corresponding energies. Data from Carnall et al. [115].
Table 9: Characterization of Eu(III) luminescence transitions, according to Bünzli et al. [117] and Binnemans
[118].
Table 10: Deduction of Eu(III) symmetry from 5D0 → 7FJ transition splitting pattern, according to Bünzli et al.
[117] and Binnemans [118].
Table 11: Spin, gyromagnetic ratio and natural abundance of several nuclei, data from [125].
Table 12: Fractions of B(OH)3 and polyborate species in solution at pHc = 6 as a function of [B]total and ionic
strength.
Table 13: Europium luminescence lifetime τ (overall Eu(III) species) at pHc 6 as a function of [B]total,
[Eu(III)]total = 3·10-5 m, Im = variable, electrolyte: NaClO4.
Table 14: Average lg β1,m (I = 0.1 m (NaClO4/NaCl)) and corresponding lg β01 (extrapolation to infinite dilution
according to Davies approach [37]) of the Eu(III)-borate complex, EuB(OR)42+ (borate ligand with
one binding site) according to Eq. 45. T = 22 °C. Uncertainty: 2σ.
Table 15: lg β1,m values of the Eu(III)-borate complex, EuB(OR)42+ (borate ligand with one binding site), as a
function of ionic strength (NaClO4), [Eu(III)]total = 3·10-5 m, [B]total = variable, pHc = 6, T = 22 °C;
averaged deviation for lg β1,m (estimated): 0.2 (2σ).
Table 16: Summarized values for lg β01, ∆ε and ε(EuB(OR)4
2+, ClO4−) for the Eu(III)-(poly)borate-NaClO4
system.
Deviation: 2σ (from linear fit of the data, Fig. 21a).
Table 17: Time period of the first indication of the Eu(III)-borate solid formation as a function of [B]total and
ionic strength, medium: NaCl; grey: outlier. Values in days (d).
Table 18: Time period of the first indication of the Eu(III)-borate solid formation as a function of [B]total and
ionic strength, medium: NaClO4; grey: outlier. Values in days (d).
Table 19: Grade of completeness of the conversion of dissolved Eu(III) ([Eu(III)]total = 3·10−5 m) into the
Eu(III)-borate solid as a function of [B]total and ionic strength, medium: NaCl; analysis of filtrates
with TRLFS after sample filtration with membrane filters of 0.2 µm pore size; sample treatment
after around 6 months.
List of Tables
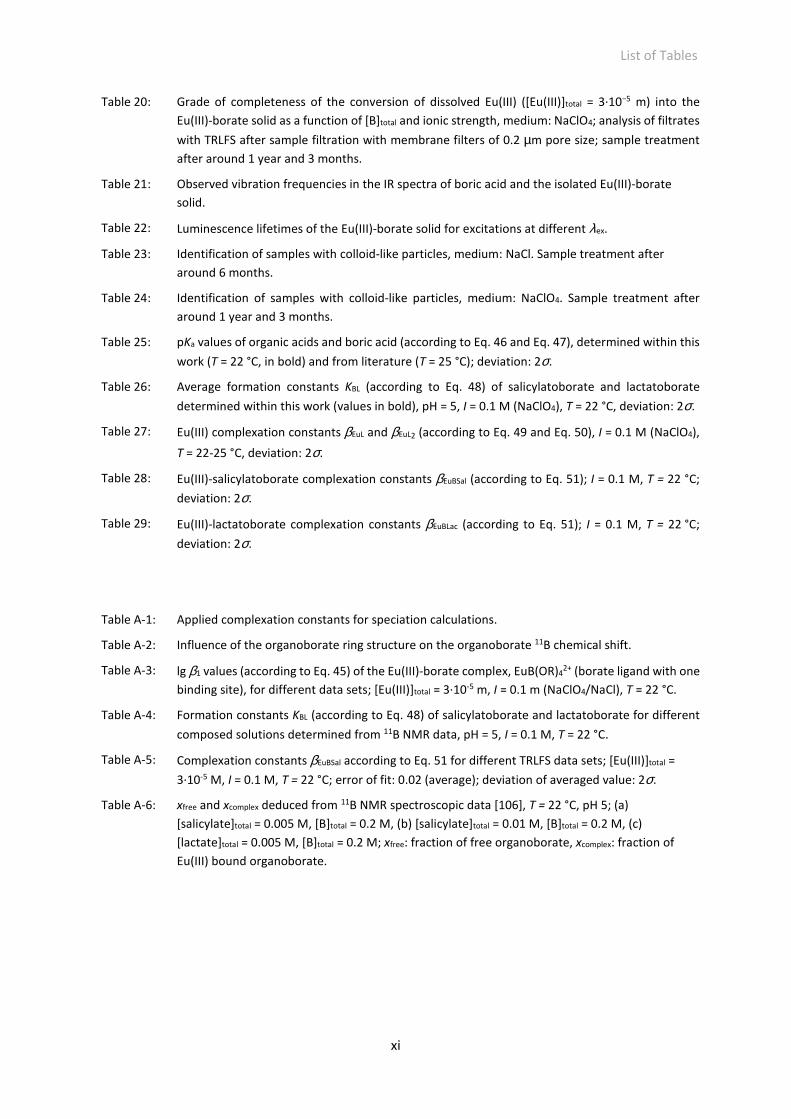
xi
Table 20: Grade of completeness of the conversion of dissolved Eu(III) ([Eu(III)]total = 3·10−5 m) into the
Eu(III)-borate solid as a function of [B]total and ionic strength, medium: NaClO4; analysis of filtrates
with TRLFS after sample filtration with membrane filters of 0.2 µm pore size; sample treatment
after around 1 year and 3 months.
Table 21: Observed vibration frequencies in the IR spectra of boric acid and the isolated Eu(III)-borate
solid.
Table 22: Luminescence lifetimes of the Eu(III)-borate solid for excitations at different λex.
Table 23: Identification of samples with colloid-like particles, medium: NaCl. Sample treatment after
around 6 months.
Table 24: Identification of samples with colloid-like particles, medium: NaClO4. Sample treatment after
around 1 year and 3 months.
Table 25: pKa values of organic acids and boric acid (according to Eq. 46 and Eq. 47), determined within this
work (T = 22 °C, in bold) and from literature (T = 25 °C); deviation: 2σ.
Table 26: Average formation constants KBL (according to Eq. 48) of salicylatoborate and lactatoborate
determined within this work (values in bold), pH = 5, I = 0.1 M (NaClO4), T = 22 °C, deviation: 2σ.
Table 27: Eu(III) complexation constants βEuL and βEuL2 (according to Eq. 49 and Eq. 50), I = 0.1 M (NaClO4),
T = 22-25 °C, deviation: 2σ.
Table 28: Eu(III)-salicylatoborate complexation constants βEuBSal (according to Eq. 51); I = 0.1 M, T = 22 °C;
deviation: 2σ.
Table 29: Eu(III)-lactatoborate complexation constants βEuBLac (according to Eq. 51); I = 0.1 M, T = 22 °C;
deviation: 2σ.
Table A-1: Applied complexation constants for speciation calculations.
Table A-2: Influence of the organoborate ring structure on the organoborate 11B chemical shift.
Table A-3: lg β1 values (according to Eq. 45) of the Eu(III)-borate complex, EuB(OR)42+ (borate ligand with one
binding site), for different data sets; [Eu(III)]total = 3·10-5 m, I = 0.1 m (NaClO4/NaCl), T = 22 °C.
Table A-4: Formation constants KBL (according to Eq. 48) of salicylatoborate and lactatoborate for different
composed solutions determined from 11B NMR data, pH = 5, I = 0.1 M, T = 22 °C.
Table A-5: Complexation constants βEuBSal according to Eq. 51 for different TRLFS data sets; [Eu(III)]total =
3·10-5 M, I = 0.1 M, T = 22 °C; error of fit: 0.02 (average); deviation of averaged value: 2σ.
Table A-6: xfree and xcomplex deduced from 11B NMR spectroscopic data [106], T = 22 °C, pH 5; (a)
[salicylate]total = 0.005 M, [B]total = 0.2 M, (b) [salicylate]total = 0.01 M, [B]total = 0.2 M, (c)
[lactate]total = 0.005 M, [B]total = 0.2 M; xfree: fraction of free organoborate, xcomplex: fraction of
Eu(III) bound organoborate.
Summary
xii
Summary
The aim of this work is the characterization of the Eu(III)-borate system by the identification of possible
interactions (Eu(III) complexation by borate ligands, Eu(III) precipitation, etc.). Borate compounds will
be a part of the inventory of a future nuclear waste repository, e.g., glass coquilles for high-level
radioactive waste and cementitious waste packages. Moreover, borate compounds naturally occur in
rock salt, a potential host rock formation for nuclear waste repositories, e.g., as minerals (borax, etc.),
and in respective brines. Hence, the interactions of borate compounds with components of nuclear
waste, i.e., radionuclides (e.g., actinides like Am and Pu), is of general interest in the identification and
characterization of mobilization pathways of radionuclides in the context of the safety and risk
assessment for a future nuclear waste repository. Until now, the complexation between actinides and
borate species is investigated insufficiently. Eu(III) is available from non-radioactive compounds and is
used as a chemical analog for trivalent actinides, e.g., Am(III) and Pu(III). Consequently, the handling
with Eu(III) enables easier access to and extensive studies in the unknown An(III)/Ln(III)-borate
complexation system.
Two different approaches to study the Eu(III)-borate complexation system were drafted to determine
the order of magnitude for the Eu(III)-borate complexation constant. For that purpose the Eu(III)
complexation with various borate ligands holding a „B(OR)4−“ unit was investigated. For the first
approach inorganic borate compounds, i.e., polyborates, and for the second approach organoborates
(salicylatoborate and lactatoborate) were used. A similar complexation behavior of borate ligands with
one „B(OR)4−“ unit concerning Eu(III) was hypothesized and experimentally confirmed. In the
complexation studies different spectroscopic techniques were applied, for instance time-resolved
laser-induced fluorescence spectroscopy (TRLFS) and NMR spectroscopy. As a result of these
complexation studies the complexation constant for a 1:1 Eu(III)-borate complex (EuB(OR)42+) is set in
the range lg β0 = 2.6 – 3.3. Hence, the Eu(III)-borate complexation is weak. SIT (Specific Ion Interaction
Theory) parameters were determined in this work from the ionic strength dependency of the Eu(III)-
(poly)borate complexation constant in NaClO4 medium (lg β01 = 3.14 ± 0.17, ∆ε = (-0.09 ± 0.10) kg/mol,
ε(EuB(OR)42+, ClO4
−) = 0.33 kg/mol).
Prior the Eu(III)-borate complexation studies the borate speciation in solution was studied with
11B NMR spectroscopy. For the first approach the formation of polyborate species was studied. At pHc 6
triborate and pentaborate species were detected. Their formed amount agrees well with calculated
amounts from polyborate formation constants found in literature. For the second approach the
formation of organoborates (salicylatoborate and lactatoborate) was studied and their formation
constants were determined (lg K0BSal = 1.10 ± 0.07, lg K0
BLac = 0.57 ± 0.11).
Summary
xiii
In the Eu(III)-polyborate system at pHc 6 a Eu(III) precipitation was observed by means of TRLFS. IR and
solid-state 11B NMR spectroscopy confirmed the formation of a borate containing Eu(III) solid phase.
At low Eu(III) concentrations (3·10−5 m) this Eu(III)-borate precipitate forms within days to weeks
depending on [B]total and the medium (background electrolyte, ionic strength). The higher [B]total and
the Eu(III) concentration the faster is the solid formation. The Eu(III)-borate solid phase is long-term
stable at pHc 6, but dissolves increasingly with decreasing pH. An effect of the presence of organics
(salicylate, lactate) on the precipitation kinetics was not detected up to [organics]total = 2·10−3 m. For
[lactate]total = 2·10−2 m a delay of the Eu(III)-borate precipitation progress and for [salicylate]total =
2·10−2 m an incomplete conversion of the dissolved Eu(III) into the solid were observed.
The isolated Eu(III)-borate solid is amorphous. Hence, structural information from X-ray diffraction is
not obtainable. The analysis of the solid-state 11B NMR spectrum of a La(III)-borate solid (structural
similarity to the Eu(III)-borate solid confirmed with IR spectroscopy) reveals a ratio of the fourfold
coordinated to the threefold coordinated boron environments of 3:1 in the borate ligand.
Unfortunately, from this information no concrete structure of the borate ligand around La(III) is
deducible. However, the high amount of fourfold coordinated boron environments suggests a high(er)
grade of condensation of the borate structure.
Three europium species in the solid were identified by solid-state site-selective TRLFS investigations of
the Eu(III)-borate solid. Luminescence spectrum and luminescence lifetime of two species are quite
similar. They are assigned to the Eu(III)-borate species. Both species occur in equal parts if the Eu(III)-
borate solid is precipitated at low ionic strength (0.1 m NaClO4/NaCl), whereas high(er) ionic strengths
(1 m/3 m NaClO4/NaCl) favors the formation of only one of these species. The IR spectra of the Eu(III)-
borate solids precipitated at different ionic strengths and electrolytes are almost identical. Hence, a
high structural similarity of these two species can be assumed. Differences are possible in the content
of structural water, grade of condensation of the borate ligand or long-range order in the solid. The
luminescence spectrum and luminescence lifetime of the third species differ significantly from that of
the other species. Possibly, the third species is a primary stage of the completely formed Eu(III)-borate
solid.
At Im = 0.1 m (NaCl/NaClO4) colloid-like Eu(III)-borate particles (particle size distribution: 100-500 nm)
were detected.
Summarizing the results: Within this work different interactions in the Eu(III)-borate system
(complexation, solid formation, colloid formation) were identified and described qualitatively and
quantitatively.
Zusammenfassung
xiv
Zusammenfassung
Ziel dieser Arbeit ist die Beschreibung des Eu(III)-Borat Systems durch die Identifizierung möglicher
Wechselwirkungen (Komplexierung von Eu(III) mit Boratliganden, Eu(III)-Fällung, etc.).
Boratverbindungen werden Bestandteil des Inventars eines zukünftigen nuklearen Endlagers
(Glaskokillen für hochradioaktive Abfälle, Abfallgebinde in Zement, etc.) sein. Des Weiteren sind
Boratverbindungen im Steinsalz ─ einer potentiellen Wirtsgesteinsformation für Endlager radioaktiver
Abfälle ─ in Form von Mineralen wie Borax und Salzlaugen natürlich vorhanden. Deshalb sind im Zuge
der Risiko- und Sicherheitsanalyse von zukünftigen Endlagern für radioaktive Abfälle im
Zusammenhang mit der Identifizierung von Mobilisierungspfaden von Radionukliden die
Wechselwirkungen von Boratverbindungen mit Bestandteilen radioaktiver Abfälle, d.h. Radionukliden
wie Actinide (z.B. Am und Pu), von generellem Interesse. Bisher ist die Komplexierung von Actiniden
mit Boratspezies jedoch nur unzureichend untersucht worden. Eu(III) ist in Form nicht-radioaktiver
Verbindungen verfügbar und wird als ein chemisches Analogon für dreiwertige Actinide, wie Am(III)
und Pu(III), genutzt. Somit ermöglicht der Umgang mit Eu(III) einen einfacheren Zugang zu und
umfangreiche Untersuchungen in dem unbekannten An(III)/Ln(III)-Borat Komplexierungssystem.
Zwei verschiedene Herangehensweisen für die Untersuchung des Eu(III)-Borat Komplexierungssystem
wurden erarbeitet, um die Größenordnung für die Eu(III)-Borat Komplexierungskonstante zu
bestimmen. Dazu wurde die Eu(III)-Komplexierung mit verschiedenen Boratliganden, die eine
„B(OR)4−“-Einheit aufweisen, untersucht. Für den ersten Untersuchungsansatz wurden anorganische
Boratverbindungen, d.h. Polyborate, und für den zweiten Untersuchungsansatz Organoborate
(Salicylatoborat und Lactatoborat) verwendet. Ein ähnliches Komplexierungsverhalten der
verschiedenen Boratliganden mit einer „B(OR)4−“-Einheit gegenüber Eu(III) wurde angenommen und
konnte experimentell bestätigt werden. In den Komplexierungsstudien kamen verschiedene
spektroskopische Methoden, z.B. zeitaufgelöste Laser-induzierte Fluoreszenzspektroskopie (TRLFS)
und NMR-Spektroskopie, zum Einsatz. Als Ergebnis der Komplexierungsstudien konnte die
Komplexierungskonstante für einen 1:1 Eu(III)-Borat Komplex (EuB(OR)42+) im Bereich lg β0 = 2,6 – 3,3
eingegrenzt werden. Die Eu(III)-Borat Komplexierung ist entsprechend schwach. SIT-Parameter
(Specific Ion Interaction Theory) wurden in dieser Arbeit aus der Ionenstärkeabhängigkeit der Eu(III)-
(Poly)borat Komplexierungskonstante im NaClO4-Medium bestimmt (lg β0 = 3,14 ± 0,17, ∆ε =
(-0,09 ± 0,10) kg/mol, ε(EuB(OR)42+, ClO4
−) = 0,33 kg/mol).
Vor den Eu(III)-Borat Komplexierungsstudien wurde die Borat-Speziation in Lösung mittels 11B-NMR-
Spektroskopie untersucht. Für den ersten Untersuchungsansatz wurde die Bildung von Polyborat-
Zusammenfassung
xv
Spezies nachvollzogen. Bei pHc 6 wurden Tri- und Pentaboratspezies detektiert. Deren gebildete
Menge stimmt gut mit berechneten Werten aus Polyborat-Bildungskonstanten (Literaturwerte)
überein. Für den zweiten Untersuchungsansatz wurde die Bildung von Organoboraten (Salicylatoborat
und Lactatoborat) untersucht und die jeweiligen Bildungskonstanten bestimmt (lg K0BSal = 1,10 ± 0,07,
lg K0BLac = 0,57 ± 0,11).
Im Eu(III)-Polyborat System wurde bei pHc 6 mittels TRLFS eine Europiumfällung beobachtet. IR- und
Festkörper-11B NMR-Spektroskopie beweisen die Bildung einer Borat-haltigen Eu(III)-Festphase. Bei
niedrigen Eu(III)-Konzentrationen (3·10−5 m) erfolgt die Bildung dieses Eu(III)-Borat Feststoffes je nach
[B]total und Medium (Hintergrundelektrolyt, Ionenstärke) innerhalb von Tagen bis Wochen. Je höher
[B]total und die Eu(III)-Konzentration sind, desto schneller erfolgt die Feststoffbildung. Die Festphase ist
bei pHc 6 langzeitstabil, löst sich jedoch zunehmend mit sinkendem pH. Die Präsenz von Organik
(Salicylat, Lactat) hat keine Auswirkung auf den zeitlichen Verlauf der Feststoffbildung bis zu einer
totalen Organikkonzentration von 2·10−3 m. Für [Lactat]total = 2·10−2 m wurde eine zeitliche Verzögerung
der Eu(III)-Borat Ausfällung und für [Salicylat]total = 2·10−2 m eine unvollständige Umwandlung des
gelösten Eu(III) in den Feststoff beobachtet.
Der isolierte Eu(III)-Borat Feststoff ist amorph. Deshalb konnten keine Strukturinformationen aus der
Röntgenbeugung erhalten werden. Die Auswertung des Festkörper-11B-NMR-Spektrums eines La(III)-
Borat Feststoffes (die strukturelle Übereinstimmung mit dem Eu(III)-Borat Feststoffes wurde IR-
spektroskopisch bestätigt) offenbarte ein Verhältnis der vierfach- zu dreifachkoordinierten
Borumgebungen von 3:1 im Boratliganden. Daraus lässt sich keine konkrete Struktur des Boratliganden
um La(III) ableiten. Jedoch lässt die hohe Menge an vierfachkoordinierten Borumgebungen einen
höheren Kondensationsgrad der Boratstruktur vermuten.
Aus den Untersuchungen des Eu(III)-Borat Feststoffes mittels Festkörper-TRLFS über die selektive
Anregung einzelner Spezies konnten drei Europium-Spezies im Feststoff identifiziert werden. Zwei
Spezies sind sich im Lumineszenzspektrum und Lumineszenzlebensdauer recht ähnlich. Sie werden
dem Eu(III)-Borat Feststoff zugeordnet. Beide Spezies liegen zu gleichen Anteilen vor, wenn der Eu(III)-
Borat Feststoff bei niedriger Ionenstärke (0.1 m NaClO4/NaCl) gefällt wird. Wird der Eu(III)-Borat
Feststoff bei höheren Ionenstärken ausgefällt (1 m/3 m NaClO4/NaCl), dann wird die Bildung von nur
noch einer der beiden Spezies begünstigt. Die IR-Spektren der bei verschiedenen Ionenstärken und
Elektrolyten gefällten Eu(III)-Borat Feststoffe sind nahezu identisch, sodass von einer hohen
strukturellen Ähnlichkeit ausgegangen werden kann. Unterschiede gibt es möglicherweise im
Strukturwassergehalt, Kondensierungsgrad des Boratliganden oder in der Fernordnung im Feststoff.
Lumineszenzspektrum und Lumineszenzlebensdauer der dritten Spezies unterscheiden sich deutlich
Zusammenfassung
xvi
von denen der anderen Spezies. Möglicherweise handelt es sich bei der dritten Spezies um eine
Vorstufe des vollständig ausgebildeten Eu(III)-Borat Feststoffes.
Bei einer Ionenstärke von 0.1 m (NaCl/NaClO4) wurden Kolloid-artige Eu(III)-Borat Partikel
(Partikelgrößenverteilung: 100-500 nm) entdeckt.
Zusammenfassend konnten im Rahmen dieser Arbeit verschiedene Arten der Wechselwirkungen im
Eu(III)-Borat System (Komplexierung, Feststoffbildung, Kolloidbildung) identifiziert und qualitativ wie
quantitativ beschrieben werden.
Motivation and Aims
1
1 Motivation and Aims
Nuclear energy is an important part of the electric power generation in many countries. In this process
high-level radioactive waste is produced. Although GermanyI will drop out of nuclear energy in the
year 2022, 22000 m³ (99.9 % of the total radioactivity of the waste) heat-generating high-level
radioactive waste (HLW) has to be treated and disposed [1]. HLW includes mainly spent nuclear fuel,
glass coquilles after reprocessing of fuel elements and activated construction materials [2].
Radionuclides relevant for the safety and risk assessment of a future nuclear waste repository are
fission products (e.g., I-129/131, Cs-135/137, Tc-99, Sr-90, Se-79, Sm-151, Sn-126), uranium (e.g., U-
235, U-238) and transuranic elements (e.g., Pu-239/240/241, Np-237, Am-241/243, Cm-244) [2], [3].
Some of these radionuclides contribute to the long-term (over thousands of years) heat generation
and radiotoxicity, because of the long half-lives of some radioisotopes (e.g., T1/2(Pu-239) = 24110 years)
[2]. Hence, the disposal of (high-level) radioactive waste requires a special concept to isolate the waste
and to store it save in a proper environment for a time period of 106 years [1]. In many countries (e.g.,
Germany, Switzerland, France, USA) there is a consensus on the enclosure of radioactive waste in deep
geological formations. Appropriate formations are embedded in rock salt, argillaceous rock, or
crystalline rock. So far, in Germany rock salt and argillaceous rock obtained most attention [1].
Extensive multibarrier systems (geological, geotechnical and technical barriers) shall ensure the long-
term safety of a nuclear waste repository.
For the nuclear waste repository operation a long-term safety and risk assessment is required. In this
assessment a water ingress into the repository is considered, which would accelerates corrosion and
initiates dissolution processes of the stored inventory (container material, radioactive waste), host
rock components and backfill materials. Consequently, released radionuclides can be involved in a
multitude of reactions leading to their mobilization or retention. To evaluate the migration behavior
of radionuclides in the near and far field of a respective repository its complexation, redox, solubility,
colloidal, sorption and diffusion characteristics over a wide range of parameters (pH, Eh, ionic strength,
temperature, presence of complexing ligands, sorbents, etc.) has to be studied. Large amounts of data
concerning the chemistry of repository relevant radionuclides were generated in the last decades.
Mainly, data of radionuclide complexation with organic (e.g., salicylate, lactate, propionate, acetate,
citrate, oxalate) and inorganic ligands (e.g., hydroxide, carbonate, sulfate, nitrate, chloride) as well as
solubility data are summarized in several thermodynamic databases, e.g., Thermochemical Database
(TDB) Project of NEA and OECD, Nagra/PSI Chemical Thermodynamic Data Base and THEREDA
I gross power generation in Germany from nuclear energy:
1990-2011: 20-30 %, 2011-2014: 15-16 % source: Arbeitsgemeinschaft Energiebilanzen e.V. (www.ag-energiebilanzen.de), date: 12.12.2014
Motivation and Aims
2
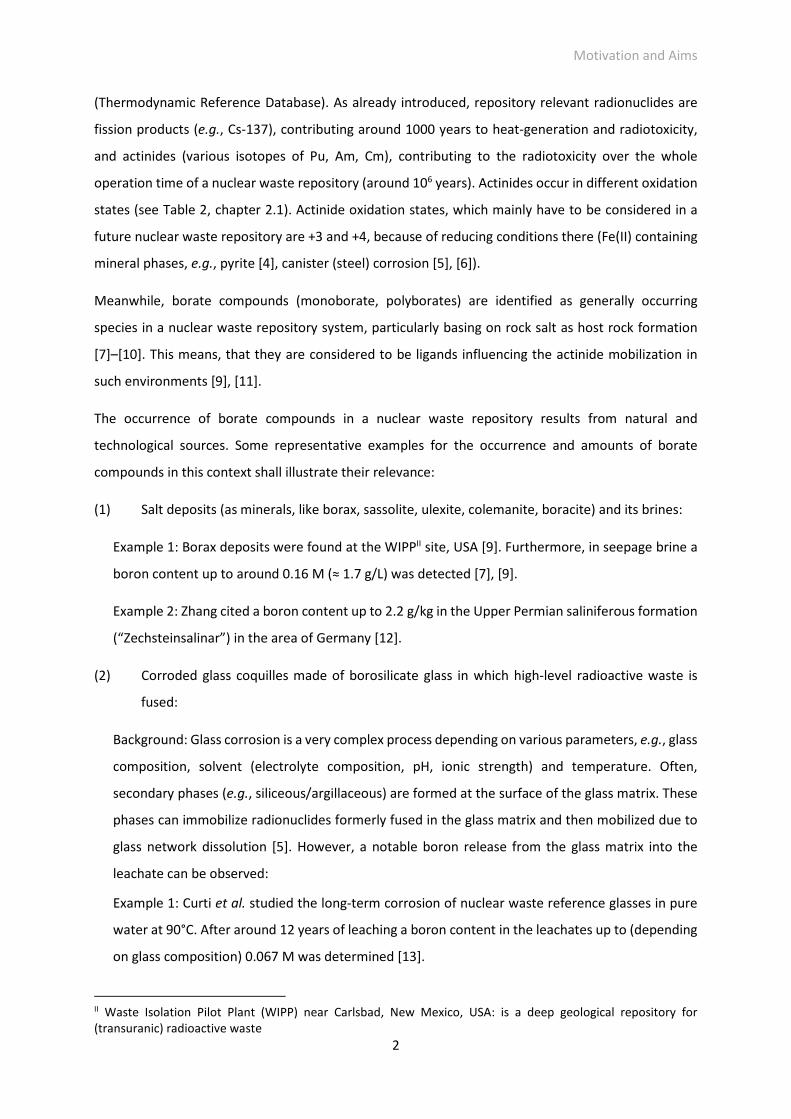
(Thermodynamic Reference Database). As already introduced, repository relevant radionuclides are
fission products (e.g., Cs-137), contributing around 1000 years to heat-generation and radiotoxicity,
and actinides (various isotopes of Pu, Am, Cm), contributing to the radiotoxicity over the whole
operation time of a nuclear waste repository (around 106 years). Actinides occur in different oxidation
states (see Table 2, chapter 2.1). Actinide oxidation states, which mainly have to be considered in a
future nuclear waste repository are +3 and +4, because of reducing conditions there (Fe(II) containing
mineral phases, e.g., pyrite [4], canister (steel) corrosion [5], [6]).
Meanwhile, borate compounds (monoborate, polyborates) are identified as generally occurring
species in a nuclear waste repository system, particularly basing on rock salt as host rock formation
[7]–[10]. This means, that they are considered to be ligands influencing the actinide mobilization in
such environments [9], [11].
The occurrence of borate compounds in a nuclear waste repository results from natural and
technological sources. Some representative examples for the occurrence and amounts of borate
compounds in this context shall illustrate their relevance:
(1) Salt deposits (as minerals, like borax, sassolite, ulexite, colemanite, boracite) and its brines:
Example 1: Borax deposits were found at the WIPPII site, USA [9]. Furthermore, in seepage brine a
boron content up to around 0.16 M (≈ 1.7 g/L) was detected [7], [9].
Example 2: Zhang cited a boron content up to 2.2 g/kg in the Upper Permian saliniferous formation
(“Zechsteinsalinar”) in the area of Germany [12].
(2) Corroded glass coquilles made of borosilicate glass in which high-level radioactive waste is
fused:
Background: Glass corrosion is a very complex process depending on various parameters, e.g., glass
composition, solvent (electrolyte composition, pH, ionic strength) and temperature. Often,
secondary phases (e.g., siliceous/argillaceous) are formed at the surface of the glass matrix. These
phases can immobilize radionuclides formerly fused in the glass matrix and then mobilized due to
glass network dissolution [5]. However, a notable boron release from the glass matrix into the
leachate can be observed:
Example 1: Curti et al. studied the long-term corrosion of nuclear waste reference glasses in pure
water at 90°C. After around 12 years of leaching a boron content in the leachates up to (depending
on glass composition) 0.067 M was determined [13].
II Waste Isolation Pilot Plant (WIPP) near Carlsbad, New Mexico, USA: is a deep geological repository for (transuranic) radioactive waste
Motivation and Aims
3
Example 2: Kienzler et al. computed the boron release from a glass matrix for high-level radioactive
waste in NaCl brine at 110/190°C, pH 7.5-8.5, as a function of the reaction progress. Beside Li, Si
and Ca boron is one of the major leached elements (theoretically 10−2-10−1 M boron after the
leaching experiment) [14].
(3) Boron containing water remains from the cooling circuit of (spent) nuclear fuels in the nuclear
waste containers for the temporary storage, e.g., type CASTOR® (if these containers should be
placed in a nuclear waste repository) and evaporator bottoms.
Background: Boric acid is used as neutron absorber (application of the high cross section of the
boron isotope B-10 for the nuclear reaction 10B (n,α) 7Li [15]) to regulate the nuclear chain reaction
in a pressurized water reactor or to prevent criticality in the cooling pond for spent nuclear fuel.
(4) Cement (for inclusion of radioactive waste):
Background: Boron compounds are cement additives to influence the solidification process of
cement. They are used as retarding agents to prolong the workability of cement [16]. Cement
additives (as entirety; retarders are included) are added in low amounts (< 5 % mass fractionIII,IV)
depending on the cement composition and requirements to the cement workability.
So far, the interaction, particularly the complexation, of (poly)borates with actinides is investigated
insufficiently in order to estimate a possible actinide mobilization in a nuclear waste repository. Hence,
it is necessary to study the relevance of borate species concerning the actinide mobilization potential.
In their pioneering work Borkowski et al. investigated the complexation of Nd(III) (as chemical analog
for trivalent actinides, e.g., Am(III), Pu(III), Cm(III)) in borate solutions considering high ionic strength
conditions (up to I = 5 M, NaCl) typical for the WIPP site [9]. From solubility experiments they
determined a 1:1 Nd(III)-(tetra)borate complexation constant lg β01 = 4.55 (extrapolated to zero ionic
strength with SIT approach) [9]. It indicates that an accordant actinide(III)-borate species could
influence the moderate actinide(III)-carbonate complexationV [9], [11]. In consequence, this
An(III)/Ln(III)-borate complex is interpreted to be a predominant species under the WIPP brine
conditions (up to 0.16 M borate, pHc = 8 to 9) [9], [11].
III Zement-Merkblatt Betontechnik B3, Ausgabe 02-2014, „Betonzusätze, Zusatzmittel und Zusatzstoffe“, http://www.beton.org/service/zement-merkblaetter/ IV DIN EN 934 Zusatzmittel für Beton, Mörtel und Einpressmörtel, Teil 2 Betonzusatzmittel - Definitionen, Anforderungen, Konformität, Kennzeichnung und Beschriftung V lg β0 (AmCO3
+) = 7.8 [17], lg β0 (Am(CO3)2-) = 12.3 [17], lg β0 (Am(CO3)3
3-) = 15.2 [17]
Motivation and Aims
4
Parallel to the here presented thesis Hinz et al. also studied the Nd(OH)3(am) solubility in the alkaline
pH range in presence of borate [18]. A distinct solubility decrease (up to 4.5 orders of magnitude
depending on pH, ionic strength and electrolyte) of Nd(III) in presence of borate was determined [18].
The reason for this solubility decrease is the transformation of the initial Nd(OH)3 solid phase into a
borate containing Nd(III) solid phase. The results of Hinz et al. are contradictory to those of Borkowski
et al. observing a solubility increase and interpreting this as a moderate Nd(III)-borate complexation.
Because of these conflicting opinions and inexistent basis of data concerning the complexation of
(poly)borate species with trivalent f-elements in this thesis other approaches were elaborated (for
more detailed information about the approaches see chapter 2.4). The An(III)/Ln(III)-borate system is
much more difficult to study under alkaline conditions (applied in the studies of Borkowski et al. and
Hinz et al.). To study complexation and solubility systems under alkaline conditions is advisable,
because the pH conditions in a future nuclear waste repository will be (highly) alkaline (corrosion of
cement waste forms and barrier materials [19], [20]). But for the An(III)/Ln(III)-borate system a
multitude of reactions occurs in the alkaline pH range which are not clear and actually not manageable
for the An(III)/Ln(III)-borate complexation studies: complex boron chemistry (see chapter 2.3.1) and
strong hydrolysis of trivalent f-elements. For the basic understanding of this system it is more
reasonable to carry out complexation studies under acidic conditions applied in this work. Strongly
competing reactions (for instance strong hydrolysis of Ln(III)) can be excluded. Furthermore, the
amount of polyborate species is clearly diminished.
The aim of this work is to contribute to a better understanding of the An(III)-(poly)borate system. For
that, possible interactions (complexation, precipitation, etc.), in this system have to be identified and
described qualitatively as well as quantitatively. Primarily, the complexation properties of
(poly)borates regarding An(III) are in the focus of the investigations to obtain fundamental
thermodynamic data. For this purpose the complexation between borate species (polyborates,
organoborates) and trivalent europium (chemical analog of trivalent actinides, e.g., Am(III), Pu(III),
Cm(III), see chapter 2.1) was studied spectroscopically by means of time-resolved laser-induced
fluorescence spectroscopy (TRLFS) and nuclear magnetic resonance spectroscopy (NMR). The
investigations were extended in terms of complexation studies under higher ionic strength conditions
and the investigation of the formation of a Eu(III)-borate solid phase (kinetic, structural information)
which was observed under the used conditions. The actinide/lanthanide(III) mobilization by
(poly)borates under repository conditions will be discussed.
This thesis was part of the BMWi funded joint research project “Rückhaltung endlagerrelevanter
Radionuklide im natürlichen Tongestein und in salinaren Systemen” (Contract No. 02E11021).
Basics
5
2 Basics
This chapter gives an overview about important relations in the chemistry of (trivalent) actinides and
lanthanides, complexation reactions in general, the borate chemistry and fundamental information
about the working hypothesis and approaches applied in this work.
2.1 Trivalent actinides and lanthanides
Lanthanides (Ln)
The 15 elements with atomic numbers ranging from 57 to 71 (lanthanum to lutetium, Table 1) are
summarized to the lanthanide series. During the successive filling of the 4f-level with increasing atomic
number the overall electronic level constitution does not change. Hence, lanthanides are among each
other quite similar in its chemical properties.
Table 1: Oxidation states and electron configurations of lanthanides; electron configurations and ionic radii
of trivalent lanthanides.
oxidation
states
[21]
electron
configuration Ln0
[22], [23]
electron
configuration Ln3+
[24]
ionic radius [Å]
Ln3+ (CN = 8)
[21]
La 3 [Xe] 5d16s2 [Xe] 1.160
Ce 3, 4 [Xe] 4f15d16s2 or
[Xe] 4f26s2 [Xe] 4f1 1.143
Pr (2), 3, 4 [Xe] 4f36s2 [Xe] 4f2 1.126
Nd (2), 3, (4) [Xe] 4f46s2 [Xe] 4f3 1.109
Pm 3 [Xe] 4f56s2 [Xe] 4f4 1.093
Sm 2, 3 [Xe] 4f66s2 [Xe] 4f5 1.079
Eu 2, 3 [Xe] 4f76s2 [Xe] 4f6 1.066
Gd 3 [Xe] 4f75d16s2 [Xe] 4f7 1.053
Tb 3, 4 [Xe] 4f96s2 [Xe] 4f8 1.040
Dy (2), 3, (4) [Xe] 4f106s2 [Xe] 4f9 1.027
Ho (2), 3 [Xe] 4f116s2 [Xe] 4f10 1.015
Er 3 [Xe] 4f126s2 [Xe] 4f11 1.004
Tm (2), 3 [Xe] 4f136s2 [Xe] 4f12 0.994
Yb 2, 3 [Xe] 4f146s2 [Xe] 4f13 0.985
Lu 3 [Xe] 4f145d16s2 [Xe] 4f14 0.977
[Xe]: electron configuration of xenon (1s22s22p63s23p63d104s24p64d105s25p6)
Basics
6
Except promethium all lanthanides have stable isotopes. Lanthanides occur in nature and form their
own mineral classes. Common minerals are monazite LnPO4 (Ln = light lanthanides, e.g., Ce, La, Nd,
Sm, Gd), bastnaesite LnCO3F (Ln = light lanthanides, e.g., Ce, La, Nd) and xenotime LnPO4 (Ln = heavy
lanthanides, e.g., Dy, Er, Tb, Yb).
All lanthanides are metals and occur in the main oxidation state +3, for some lanthanides additionally
the oxidation states +2 or +4 exist (Table 1). The radii of lanthanide ions decrease with increasing
atomic number due to increasing nuclear charge (lanthanide contraction). Consequently, lanthanide
ion properties change regularly within the lanthanide series. For instance, solubility and alkalinity of
the lanthanide hydroxide Ln(OH)3 decrease with increasing atomic number [23], complexation strength
(e.g., with fluoride, EDTA) slightly increases with increasing atomic number (decreasing cation radius)
[17], [24]. However, these changes are small and lanthanide ion (chemical) properties are still
comparable within the series.
The 4f-levels are almost shielded by 5s- and 5p-levels and keep uninfluenced from the chemical
environment around the lanthanide ion. This has consequences:
- The electrons of the 4f-level are not involved in chemical bonding. Hence, chemical bonds in
lanthanide complexes are of ionic character [24].
- Absorption bands of the f-f transitions are very sharp and less structured [23], [24].
Ln(III) ions are, according to Pearson´s HSAB conceptVI, hard acids [22], [24]. Hence, preferably they
react with hard F- and O-donor ligands, less with S- and P-ligands [24].
Trivalent lanthanides form the aquo complex [Ln(H2O)n]3+ (n = 8-9) [24]. It exists in the acid pH range
up to around pH 6. At pH > 6 a strong Ln(III)-carbonate (under ambient conditions) and Ln(III)-hydroxide
complexation as well as precipitation occur [17]. The complexation of Ln(III) with chloride (Cl−) or
perchlorate (ClO4−), typical background electrolytes in complexation studies, is very weak: Up to 8 M
chloride and 7-9 M perchlorate no evidence for an inner-sphere complexation of these anions with
europium(III) was found [26].
Actinides (An)
The 15 elements with atomic numbers ranging from 89 to 103 (actinium to lawrencium, Table 2) are
summarized to the actinide series. For actinium and thorium first the 6d-level is successively filled
VI Concept of „hard and soft acids and bases“ introduced by R. Pearson. Hard acids/bases are small molecules with high charge and are less polarizable. Soft acids/bases are larger molecules with low charge and are strongly polarizable [25].
Basics
7
(Table 2). Then, for the following actinides the 5f-level is increasingly filled with increasing atomic
number.
Table 2: Oxidation states and electron configurations of actinides; electron configurations and ionic radii
of trivalent actinides.
oxidation
states
[21]
electron
configuration An0
[22], [23]
electron
configuration An3+
[24]
ionic radius [Å]
An3+ (CN = 8)
[21]
Ac 3 [Rn] 6d17s2 [Rn] 1.26
Th (3), 4 [Rn] 6d27s2
Pa (3), 4, 5 [Rn] 5f26d17s2 or
[Rn] 5f16d27s2
U 3, 4, 5, 6 [Rn] 5f36d17s2 [Rn] 5f3 1.160
Np 3, 4, 5, 6, 7 [Rn] 5f46d17s2 or
[Rn] 5f57s2 [Rn] 5f4 1.141
Pu 3, 4, 5, 6, 7 [Rn] 5f67s2 [Rn] 5f5 1.123
Am (2), 3, 4, 5, 6 [Rn] 5f77s2 [Rn] 5f6 1.106
Cm 3, 4 [Rn] 5f76d17s2 [Rn] 5f7 1.094
Bk 3, 4 [Rn] 5f86d17s2 or
[Rn] 5f97s2 [Rn] 5f8 1.077
Cf (2), 3, (4) [Rn] 5f107s2 [Rn] 5f9 1.066
Es (2), 3 [Rn] 5f117s2 [Rn] 5f10 1.053
Fm 2, 3 [Rn] 5f127s2 [Rn] 5f11 1.040
Md 2, 3 [Rn] 5f137s2 [Rn] 5f12 1.028
No 2, 3 [Rn] 5f147s2 [Rn] 5f13 1.017
Lr 3 [Rn] 5f146d17s2 [Rn] 5f14 1.010
[Rn]: electron configuration of radon (1s22s22p63s23p63d104s24p64d105s25p64f145d106s26p6)
All actinides are metals and have only radioactive isotopes. Uranium and thorium occur in nature as
minerals, e.g., uraninite (UO2) and thorite (ThSiO4). U-238, U-235 and Th-232 are the start nuclides of
natural radioactive decay series with a large amount of subsequent radioactive decay products (e.g.,
Rn-222, Po-210, Ra-228, Pa-231, Ac-227). Transuranic elements (the subsequent elements of uranium),
e.g., plutonium, americium and neptunium, can also be found in nature as anthropogenic
contamination (nuclear accidents and fallout from surface nuclear weapons tests). Traces of Np-239
and Pu-239 (both occur in uranium minerals due to neutron capture by U-238) as well as of primordial
Pu-244 can be found in nature. Some isotopes of transuranic elements are produced synthetically, e.g.,
in nuclear reactors (for instance Pu-239 as constituent of nuclear fuel). Many further isotopes are
Basics
8
generated during energy production in a nuclear reactor and remain in the spent nuclear fuel as part
of the nuclear waste (see chapter 1).
The 5f-level of the actinides has a greater extent than the 4f-level of the lanthanides. Furthermore, it
is less shielded by 6s- and 6p-levels as comparatively the 4f-level of the lanthanides by 5s- and 5p-
levels [23], [24]. The 5f-electrons are more delocalized. This has consequences:
- The f-electrons of actinides, particularly of the lighter actinides, participate in the formation of
chemical bonds [23]. Hence, in comparison to lanthanide compounds a covalent part in chemical bonds
of actinide compounds exists [24]. This makes, for instance, actinide complexes more stable than the
respective lanthanide complexes.
- The first half of the actinide series, up to Am, possesses a high amount of more or less stable oxidation
states (Table 2). The chemistry of the early actinides is more transition-metal like [24]. In the second
half of the actinide series (from Cm on) the variability of oxidation states decreases and the most stable
oxidation state becomes +3 (except for nobelium with its main oxidation state +2).
As it is observed for trivalent lanthanide ions also trivalent actinide ions exhibit a radii contraction with
increasing atomic number (actinide contraction) [23]. Furthermore, their absorption spectra exhibit
sharp bands less influenced by ligand fields [23].
Like Ln(III), An(III) ions are, according to the HSAB concept, hard acids with a preferred interaction to
F- and O-donor ligands [17], [22].
Trivalent actinides, particularly Cm(III), Am(III) and Pu(III), form the aquo complex [An(H2O)n]3+ (n = 9)
[24], [26], [27] existing in the acid pH range. A strong hydroxide and carbonate complexation
characterizes An(III) under ambient conditions [17], [28].
Thus, in general trivalent actinides are comparable to trivalent lanthanides in its chemical behavior
[24], [29]. An established term for this observation is An(III)-Ln(III) analog chemistry resulting from the
similar ionic radii of An(III) and Ln(III) ions (Table 1 and Table 2) and similar oxidation state. Particularly,
An(III) and Ln(III) with congeneric electron configuration (e.g., Eu(III) and Am(III)) are chemically nearly
identical (see Table 1 and Table 2). Examples confirming the similarity in complexation of An(III) and
Ln(III) with common inorganic (hydroxide, carbonate, sulfate, fluoride, silicate) and organic (salicylate,
lactate, EDTA) ligands of the environment and nuclear industry are given in Table 3. A high congruence,
even with Np(III), can be stated.
In this work Eu(III) was used as chemical analog for trivalent actinides, e.g., Am(III), Cm(III) and Pu(III).
Basics
9
Table 3: Complexation constants of trivalent europium and trivalent actinides with inorganic and organic ligands.
M = Eu(III) Am(III) Pu(III) Np(III)
(ionic
radius) (1.066 Å) (1.106 Å) (1.123 Å) (1.141 Å)
lgβ0(MOH2+)VII -7.6 [17] -7.2 [30] -6.9 [31] -6.8 [31]
lgβ0(MCO3+) 8.1 [17] 8.0 [30]
lgβ0(MSO4+) 3.9 [17] 3.3 [30] 3.9 [30]
lgβ0(MF2+) 3.8 [17] 3.4 [30]
lgβ0(MSiO(OH)32+) 8.6 [32]a
8.8 [32]a
lgβ0(MLactate2+) 3.1 [33] 2.9 [33]
lgβ0(MSalicylate2+) 2.7 [34]b 3.2 [35]b
lgβ(MEDTA−), I = 6.6 m (NaClO4)
15.8 [36] 15.9 [36]
a data available for I = 0.2 M NaClO4, extrapolation to infinite dilution with Davies approach [37] b data available for I = 0.1 M NaClO4, extrapolation to infinite dilution with Davies approach [37]
2.2 Complexation reaction of metals with ligands in aqueous solution
In this thesis the focus is on the complexation of trivalent europium with inorganic and organic ligands.
A complexation reaction between the metal ion (M) and the ligand (L) forming a metal-ligand complex
(MLn) is an equilibrium reaction in which the ligand is successively (stepwise) bound to the metal
center. These stepwise reactions can be described with the mass action law. The reaction constants
are called stepwise complexation (stability) constants Kn, Eq. 1 (for clarity charges of species are
omitted):
MLn-1 + L MLn �n = [MLn]
[MLn-1] [L] n ≥ 1 (1)
In complexation chemistry also the term cumulative (overall) complexation constant βn is used. In that
case complexation reactions are described as following reaction(s), Eq. 2:
M + n L MLn �n = [MLn]
[M] [L]n n ≥ 1 (2)
VII respective equation: M3+ + H2O ↔ MOH2+ + H+
Basics
10
A cumulative complexation constant can be formulated as product of the stepwise complexation
constant(s), Eq. 3:
�n = �1 ∙ �2 ∙ … ∙ �n n ≥ 1 (3)
In the case of protonable ligands the acid dissociation constant, Ka, of the protonated ligand has to be
considered in the analysis of complexation equilibria. The acid dissociation constant is defined as
follows, Eq. 4:
LH L− + H+ �a = [L] [H+]
[LH] = 10-pKa (4)
Accordingly, the pH (- lg [H+]) has an influence on the metal complexation, because the pH set the
amount of free ligand for the complexation.
The previously described reactions (Eq. 1 and Eq. 2, respectively, Eq. 4) are equilibrium reactions
depending on different parameters, e.g. temperature, pressure and ionic strength. Therefore, mass
action laws for real systems have to be described via activities instead of concentrations. The relation
between activity ai (“active” concentration) and concentration [i] of a species i is described via the
activity coefficient γi, Eq. 5:
�i = i ∙ [i] (5)
At infinite dilution (ideal system) the activity coefficient is 1 (ai = [i]) [23]. The deviance from the ideal
system is expressed with the activity coefficient γi, which is dependent on temperature, pressure and
ionic strength. To provide comparability of a determined equilibrium constant (e.g., βn, Ka) in different
concentrated ionic media at a given temperature and pressure (conditional constant) it is extrapolated
to standard state (e.g., βn0, Ka
0) as defined by IUPAC [38]: hypothetic solution at p0 = 0.1 MPa, mi =
1.0 mol/kg, infinite dilution (Im = 0 mol/kg, γi = 1). The reference temperature is T = 25°C.
Expressing [i] in terms of ai Eq. 6 results from Eq. 2 and Eq. 5:
�n = �MLn�M ∙ �Ln
∙ M ∙ Ln
MLn (6)
Substitution of the activity quotient term with βn0 (by definition) and taking the logarithm of Eq. 6,
Eq. 7 follows:
lg �� = lg �n0 + lg M + n ∙ lg L − lg MLn (7)
The activity coefficient of a species γi can be described by different theories, valid for certain conditions
(Table 4):
Basics
11
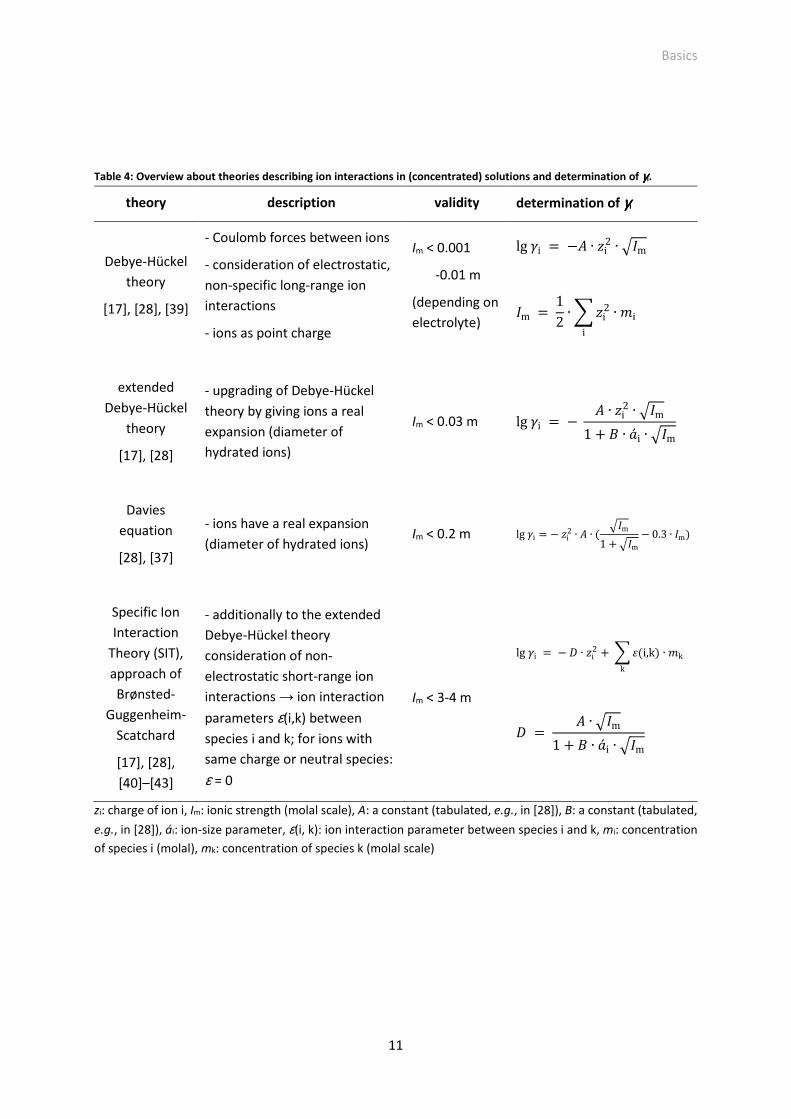
Table 4: Overview about theories describing ion interactions in (concentrated) solutions and determination of γγγγi.
theory description validity determination of γγγγi
Debye-Hückel
theory
[17], [28], [39]
- Coulomb forces between ions
- consideration of electrostatic,
non-specific long-range ion
interactions
- ions as point charge
Im < 0.001
-0.01 m
(depending on
electrolyte)
lg i = −� ∙ �i2 ∙ ��m
�m = 12 ∙ � �i2
i∙ �i
extended
Debye-Hückel
theory
[17], [28]
- upgrading of Debye-Hückel
theory by giving ions a real
expansion (diameter of
hydrated ions)
Im < 0.03 m lg i = − � ∙ �i2 ∙ ��m1 + � ∙ �́i ∙ ��m
Davies
equation
[28], [37]
- ions have a real expansion
(diameter of hydrated ions) Im < 0.2 m lg i = − �i2 ∙ � ∙ ( ��m
1 + ��m− 0.3 ∙ �m)
Specific Ion
Interaction
Theory (SIT),
approach of
Brønsted-
Guggenheim-
Scatchard
[17], [28],
[40]–[43]
- additionally to the extended
Debye-Hückel theory
consideration of non-
electrostatic short-range ion
interactions → ion interaction
parameters ε(i,k) between
species i and k; for ions with
same charge or neutral species:
ε = 0
Im < 3-4 m
lg i = − $ ∙ �i2 + � %(i,k) ∙ �kk
$ = � ∙ ��m1 + � ∙ �́i ∙ ��m
zi: charge of ion i, Im: ionic strength (molal scale), A: a constant (tabulated, e.g., in [28]), B: a constant (tabulated,
e.g., in [28]), ái: ion-size parameter, ε(i, k): ion interaction parameter between species i and k, mi: concentration
of species i (molal), mk: concentration of species k (molal scale)
Basics
12
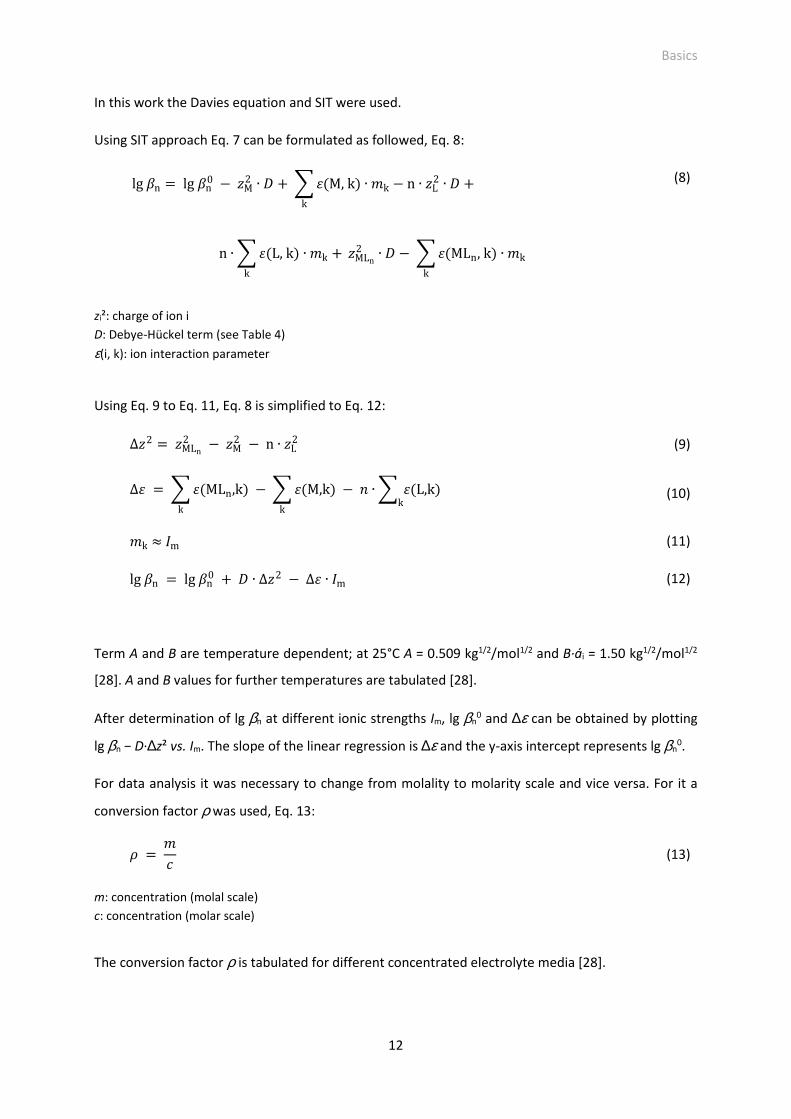
In this work the Davies equation and SIT were used.
Using SIT approach Eq. 7 can be formulated as followed, Eq. 8:
lg �n = lg �n0 − �M2 ∙ $ + � %(M, k) ∙ �kk
− n ∙ �L2 ∙ $ + (8)
n ∙ � %(L, k) ∙ �k + k
�MLn2 ∙ $ − � %(MLn, k) ∙ �k
k
zi²: charge of ion i
D: Debye-Hückel term (see Table 4)
ε(i, k): ion interaction parameter
Using Eq. 9 to Eq. 11, Eq. 8 is simplified to Eq. 12:
∆�2 = �MLn2 − �M2 − n ∙ �L2 (9)
∆% = � %(MLn,k) − � %(M,k) − ) ∙ � %(L,k)kkk
(10)
�k ≈ �m (11)
lg �n = lg �n0 + $ ∙ ∆�2 − ∆% ∙ �m (12)
Term A and B are temperature dependent; at 25°C A = 0.509 kg1/2/mol1/2 and B·ái = 1.50 kg1/2/mol1/2
[28]. A and B values for further temperatures are tabulated [28].
After determination of lg βn at different ionic strengths Im, lg βn0 and ∆ε can be obtained by plotting
lg βn − D·∆z² vs. Im. The slope of the linear regression is ∆ε and the y-axis intercept represents lg βn0.
For data analysis it was necessary to change from molality to molarity scale and vice versa. For it a
conversion factor ρ was used, Eq. 13:
+ = �, (13)
m: concentration (molal scale)
c: concentration (molar scale)
The conversion factor ρ is tabulated for different concentrated electrolyte media [28].
Basics
13
Complexation constants can be converted from molar scale to molal scale, and vice versa, with Eq. 14:
lg �m = lg �c + lg + ∙ � ν (14)
∑ ν: sum of stoichiometric coefficients of the reaction (ν is positiv for products and negative for educts)
The higher the complexation constant the stronger (more stable) is the complex. The complexation
strength is qualitatively assessable via the HSAB-concept of Pearson [25]. Generally, this concept
established that hard-hard and soft-soft combinations of the reactants form notably stable products
(e.g., complexes). Hard acids or bases are hardly polarizable and have a small radius and high charge,
and, therefore, a high charge density. Hard bases are highly electronegative. Hard acids and bases are
for instance, H+, Na+, Al3+, Ln3+, An3+, OH−, organic functional groups with oxygen. Soft acids or bases
are polarizable and have a large radius and small charge, and, therefore, a low charge density (e.g.,
Pb2+, Hg2+, SCN−, CN−, organic functional groups with sulfur). The resulting bond between hard-hard
components has a more ionic character, whereas the bond between soft-soft components is more
covalent. Trivalent lanthanide and actinide ions are according to the HSAB concept hard Lewis acids
(electron pair acceptors). They form comparatively stable complexes with hard electron pair donors,
e.g., compounds and functional groups with oxygen.
Complexes are classified as outer-sphere and inner-sphere complexes. In the case of outer-sphere
complexes the hydration shell of the metal ion is unaffected by ligands (e.g., ClO4−) [44]. The interaction
between the metal center and ligand is very weak and not directly. It occurs via coordinated water
molecules of the metal ion. In the case of inner-sphere complexes ligand molecules (e.g., OH−, CO32−)
successively replace water molecules of the hydration shell of the metal ion [45]. A direct interaction
between the metal center and ligand occurs and the resulting complexes are basically stronger than
outer-sphere complexes.
2.3 Literature overview
2.3.1 B(OH)3-polyborate equilibria
Boric acid, B(OH)3, is a weak acid with a high dissociation constant (pKa,BH = - lg K11 = 8.98, I = 0.1 M
NaClO4 [46]) acting as a Lewis acid (hydroxide acceptor), Eq. 15:
B(OH)3 + H2O B(OH)4− + H+ �11 =
[B(OH)4- ] [H+]
[B(OH)3] (15)
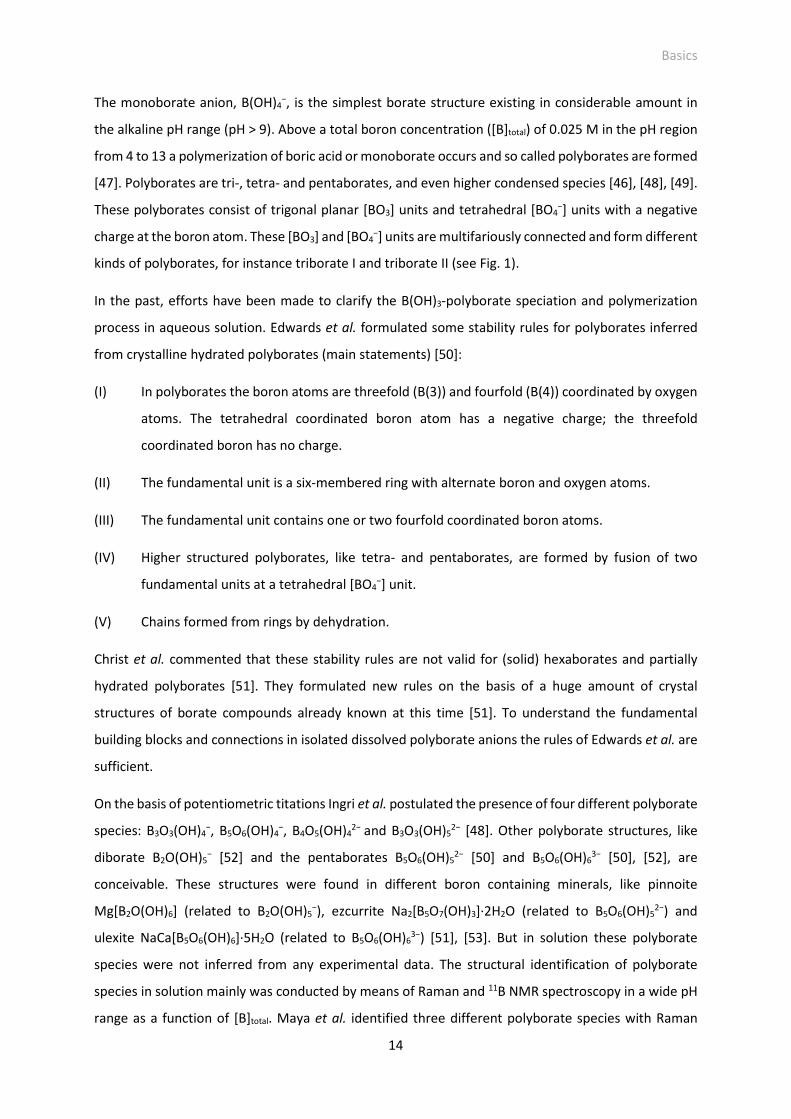
Basics
14
The monoborate anion, B(OH)4−, is the simplest borate structure existing in considerable amount in
the alkaline pH range (pH > 9). Above a total boron concentration ([B]total) of 0.025 M in the pH region
from 4 to 13 a polymerization of boric acid or monoborate occurs and so called polyborates are formed
[47]. Polyborates are tri-, tetra- and pentaborates, and even higher condensed species [46], [48], [49].
These polyborates consist of trigonal planar [BO3] units and tetrahedral [BO4−] units with a negative
charge at the boron atom. These [BO3] and [BO4−] units are multifariously connected and form different
kinds of polyborates, for instance triborate I and triborate II (see Fig. 1).
In the past, efforts have been made to clarify the B(OH)3-polyborate speciation and polymerization
process in aqueous solution. Edwards et al. formulated some stability rules for polyborates inferred
from crystalline hydrated polyborates (main statements) [50]:
(I) In polyborates the boron atoms are threefold (B(3)) and fourfold (B(4)) coordinated by oxygen
atoms. The tetrahedral coordinated boron atom has a negative charge; the threefold
coordinated boron has no charge.
(II) The fundamental unit is a six-membered ring with alternate boron and oxygen atoms.
(III) The fundamental unit contains one or two fourfold coordinated boron atoms.
(IV) Higher structured polyborates, like tetra- and pentaborates, are formed by fusion of two
fundamental units at a tetrahedral [BO4−] unit.
(V) Chains formed from rings by dehydration.
Christ et al. commented that these stability rules are not valid for (solid) hexaborates and partially
hydrated polyborates [51]. They formulated new rules on the basis of a huge amount of crystal
structures of borate compounds already known at this time [51]. To understand the fundamental
building blocks and connections in isolated dissolved polyborate anions the rules of Edwards et al. are
sufficient.
On the basis of potentiometric titations Ingri et al. postulated the presence of four different polyborate
species: B3O3(OH)4−, B5O6(OH)4
−, B4O5(OH)42− and B3O3(OH)5
2− [48]. Other polyborate structures, like
diborate B2O(OH)5− [52] and the pentaborates B5O6(OH)5
2− [50] and B5O6(OH)63− [50], [52], are
conceivable. These structures were found in different boron containing minerals, like pinnoite
Mg[B2O(OH)6] (related to B2O(OH)5−), ezcurrite Na2[B5O7(OH)3]·2H2O (related to B5O6(OH)5
2−) and
ulexite NaCa[B5O6(OH)6]·5H2O (related to B5O6(OH)63−) [51], [53]. But in solution these polyborate
species were not inferred from any experimental data. The structural identification of polyborate
species in solution mainly was conducted by means of Raman and 11B NMR spectroscopy in a wide pH
range as a function of [B]total. Maya et al. identified three different polyborate species with Raman
Basics
15
spectroscopy [54]. These polyborates were assigned to the triborate species B3O3(OH)4−, pentaborate
species B5O6(OH)4− and tetraborate species B4O5(OH)4
2− showing characteristic Raman bands [54]. The
assignment was carried out by comparing the solution spectra containing the unknown polyborates
with reference spectra of structural determined solid borate minerals containing the respective
polyborate structures. Maya et al. found no evidence for the diborate species and tried to estimate
the formation constants of B3O3(OH)4−, B5O6(OH)4
− and B4O5(OH)42− (K13, K15, K24)VIII, Table 5 [54]. Hirao
et al. also found these polyborate species in the pH range from 6 to 12 by means of Raman
spectroscopy [55]. Hirao et al. described more specific Raman bands for the respective polyborates
than Maya et al. [55]. Measuring solid polyborate phases like NH4B5O8·4H2O (≡ NH4[B5O6(OH)4]·2H2O)
and Na2B4O7·10H2O (≡ Na2[B4O5(OH)4]·8H2O) Hirao et al. confirmed Maya et al. that the characteristic
Raman bands for the polyborates structures in the solid are comparable with these in solution for the
respective polyborate [55]. Janda et al. also carried out Raman spectroscopic measurements of
polyborate containing solutions mainly in the pH range 6 to 14. They identified the polyborate species
B5O6(OH)4−, B3O3(OH)4
− and B4O5(OH)42− with its maximum concentration at pH 7.0, 8.0 and 9.4,
respectively [56]. Janda et al. found out that independently from the used solid polyborate (e.g.,
K[B5O6(OH)4]·2H2O, NH4[B5O6(OH)4]·2H2O, Na2[B4O5(OH)4]·8H2O, (NH4)2[B4O5(OH)4]·2H2O) or boric acid
dissolved in solution similar polyborate equilibria were adjusted at respective pH values and [B]total
[56]. The cation (K+, NH4+, Na+) in the solid polyborate has no influence on the polyborate equilibria but
on the solubility of the respective solid polyborate [56]. Both Hirao et al. and Janda et al. observed a
strong pH dependency of the polyborate equilibria [55], [56]. Below pH 4 no polyborate equilibria
exists and only boric acid occurs. In the very alkaline pH range (> 12) the amount of polyborates is also
very low and the boron speciation is mainly dominated by the monoborate anion. Furthermore, Janda
et al. determined a pronounced dependency of the polyborate equilibria on [B]total [56]. At low [B]total
mainly the B(OH)3-B(OH)4− equilibrium (Eq. 15) is present over the whole pH range. In addition to their
Raman spectroscopic studies Janda et al. carried out 11B NMR measurements and clearly identified the
pentaborate species [57]. An observed broadened 11B NMR signal was assigned to further polyborates
like triborate and tetraborate [57]. Momii et al. investigated solutions of MBO2, MB5O8 and M2B4O7
(M = Na, K) with 11B NMR spectroscopy and quantified the polyborate equilibria K11, K13 and K15, Table 5
[58]. In the solution of MB5O8 they identified the polyborates B5O6(OH)4− and B3O3(OH)4
− [58]. In
solutions of M2B4O7 they observed at low concentrations the dissociation of tetraborate into B(OH)3
and B(OH)4─ (Eq. 16) and at high concentrations the formation of polyborates [58].
B4O72─ + 7 H2O 2 B(OH)3 + 2 B(OH)4
− (16)
VIII The subscription x,y at the formation constant Kx,y expresses the negative charge (x) and the number of boron atoms (y) of the borate species.
Basics
16
Salentine et al. also studied the solutions of different solid pentaborates and tetraborates by means of
11B NMR spectroscopy and detected the presence of B5O6(OH)4− and B3O3(OH)4
− under certain
conditions [59]. They quantified the B(OH)3/B(OH)4−, pentaborate and triborate equilibria (K11, K15, K13),
Table 5, knowing the limitation of accuracy of these polyborate formation constants due to the
detection lack of polyborates like tetraborate with 11B NMR [59]. Salentine et al. were the first
investigating a temperature dependency of the polyborate equilibria. They detected a polyborate
dissociation with increasing temperature [59]. Remarkably, Salentine et al. query whether the
polyborate formation constants are “real” constants, because they found a dependency of the
formation constants on [B]total [59]. It is difficult to interpret this statement, because Salentine et al.
also concede the limitation of 11B NMR to determine polyborate formation constants leading to its
inaccuracy. For the determination of polyborate formation constants Spessard et al. used the
(poly)borate species B(OH)3, B(OH)4-, B5O6(OH)4
−, B3O3(OH)4−, B4O5(OH)4
2− and B3O3(OH)52− postulated
by Ingri et al. to fit their titration data and found comparable formation constants, Table 5 [60]. In
more recent works Zhou et al. calculated the Raman spectra of several polyborates (B(OH)3, B(OH)4−,
B2O(OH)4, B2O(OH)5−, B2O(OH)6
2−, B3O3(OH)3, B3O3(OH)4−, B3O3(OH)5
2−, B3O3(OH)63−, B4O5(OH)4
2− and
B5O6(OH)4−) [61]. They found evidence for B(OH)3, B(OH)4
-, B3O3(OH)4−, B3O3(OH)5
2−, B4O5(OH)42− and
B5O6(OH)4− by comparing the calculated Raman spectra with the spectra of polyborate containing
solutions [61]. Interestingly, in a further publication of Zhou et al. the polyborate species B3O3(OH)52−
was not listed as a component of the polyborate equilibria [62]. Hertam et al. also determined the
polyborates B3O3(OH)4−, B4O5(OH)4
2− and B5O6(OH)4− beside B(OH)3/B(OH)4
− in solutions of borax and
boric acid at 60°C with Raman spectroscopy [63].
In saturated solutions of boric acid and (poly)borates, like borax, higher condensed polyborate
structures were detected. For instance Yongzhong et al. detected the hexaborate anion B6O7(OH)62− in
supersaturated magnesium borate solutions using IR spectroscopy [64]. Tsuyumoto et al. suggested
the formation of B7O8(OH)72−, B8O10(OH)6
2−, B8O8(OH)102−, B9O10(OH)9
2−, B10O12(OH)82−, B11O14(OH)7
2−,
B12O16(OH)62−, B13O18(OH)5
2−, B14O20(OH)42− and B15O22(OH)3
2− in highly concentrated boric acid-borax
solutions ([B]total = 5.24 mol/kg) on the basis of a mass spectrometry method [49]. There are indications
that these highly condenced polyborates exist in colloidal state [49]. These conditions were not
relevant for the investigations of this work. Therefore, higher structured polyborates (> pentaborate)
were not expected under the studied conditions.
In summary, all speciation investigations illustrate the high complexity of the aqueous chemistry of
boric acid and borates. A strong dependency of the (poly)borate equilibria on pH, [B]total and
temperature was described. Only a small dependency on the ionic strength was observed.
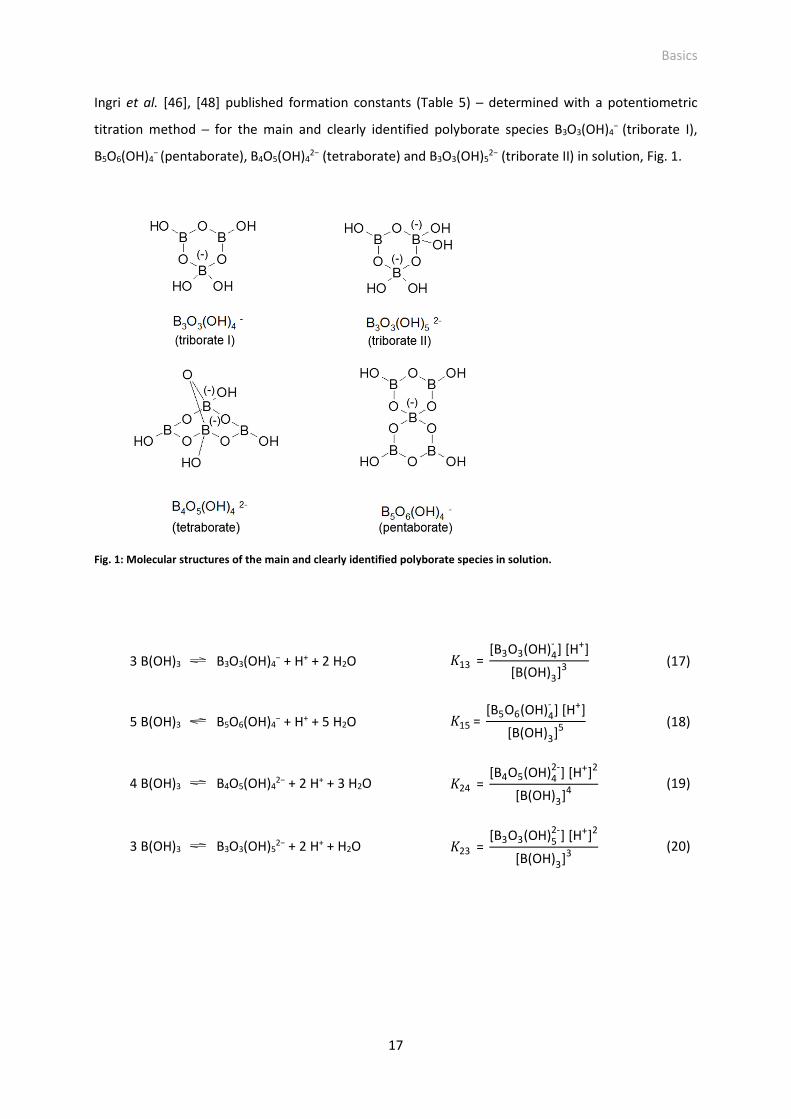
Basics
17
Ingri et al. [46], [48] published formation constants (Table 5) ─ determined with a potentiometric
titration method ─ for the main and clearly identified polyborate species B3O3(OH)4− (triborate I),
B5O6(OH)4− (pentaborate), B4O5(OH)4
2− (tetraborate) and B3O3(OH)52− (triborate II) in solution, Fig. 1.
Fig. 1: Molecular structures of the main and clearly identified polyborate species in solution.
3 B(OH)3 B3O3(OH)4− + H+ + 2 H2O �13 =
[B3O3(OH)4-] [H+]
[B(OH)3]3
(17)
5 B(OH)3 B5O6(OH)4− + H+ + 5 H2O �15=
[B5O6(OH)4-] [H+]
[B(OH)3]5
(18)
4 B(OH)3 B4O5(OH)42− + 2 H+ + 3 H2O �24 =
[B4O5(OH)42-
] [H+]2
[B(OH)3]4
(19)
3 B(OH)3 B3O3(OH)52− + 2 H+ + H2O �23 =
[B3O3(OH)52-
] [H+]2
[B(OH)3]3
(20)
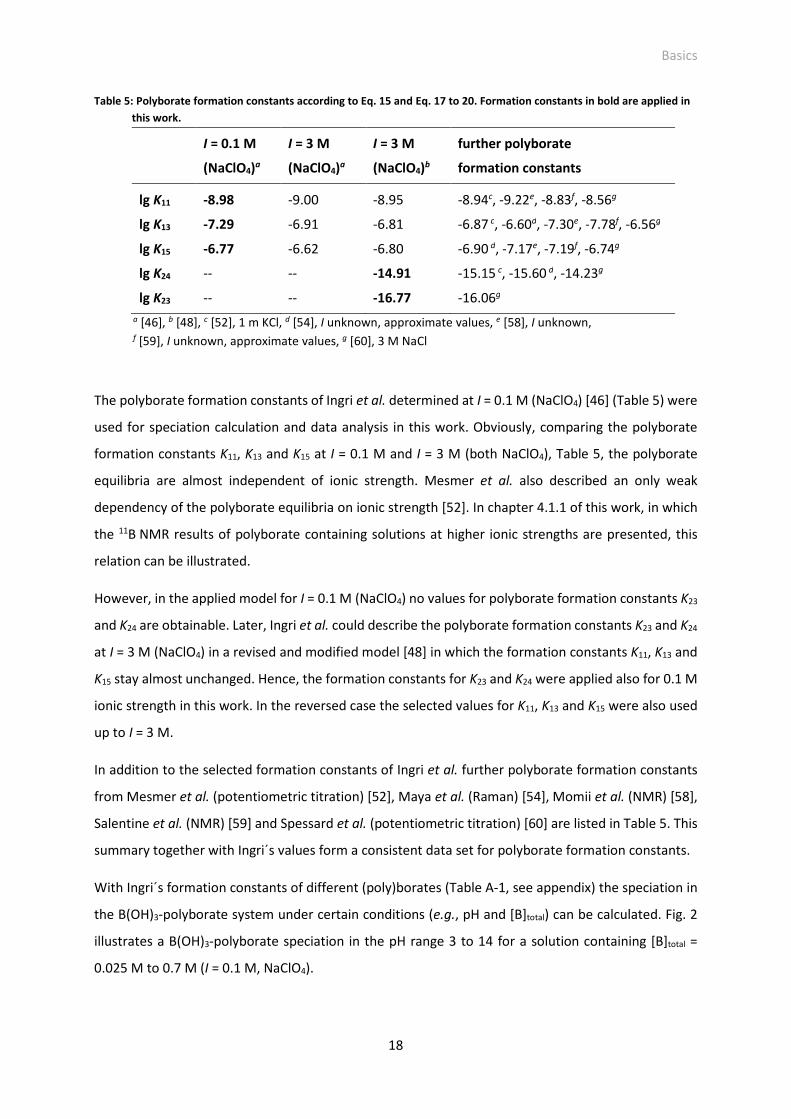
Basics
18
Table 5: Polyborate formation constants according to Eq. 15 and Eq. 17 to 20. Formation constants in bold are applied in
this work.
I = 0.1 M
(NaClO4)a
I = 3 M
(NaClO4)a
I = 3 M
(NaClO4)b
further polyborate
formation constants
lg K11 -8.98 -9.00 -8.95 -8.94c, -9.22e, -8.83f, -8.56g
lg K13 -7.29 -6.91 -6.81 -6.87 c, -6.60d, -7.30e, -7.78f, -6.56g
lg K15 -6.77 -6.62 -6.80 -6.90 d, -7.17e, -7.19f, -6.74g
lg K24 -- -- -14.91 -15.15 c, -15.60 d, -14.23g
lg K23 -- -- -16.77 -16.06g
a [46], b [48], c [52], 1 m KCl, d [54], I unknown, approximate values, e [58], I unknown, f [59], I unknown, approximate values, g [60], 3 M NaCl
The polyborate formation constants of Ingri et al. determined at I = 0.1 M (NaClO4) [46] (Table 5) were
used for speciation calculation and data analysis in this work. Obviously, comparing the polyborate
formation constants K11, K13 and K15 at I = 0.1 M and I = 3 M (both NaClO4), Table 5, the polyborate
equilibria are almost independent of ionic strength. Mesmer et al. also described an only weak
dependency of the polyborate equilibria on ionic strength [52]. In chapter 4.1.1 of this work, in which
the 11B NMR results of polyborate containing solutions at higher ionic strengths are presented, this
relation can be illustrated.
However, in the applied model for I = 0.1 M (NaClO4) no values for polyborate formation constants K23
and K24 are obtainable. Later, Ingri et al. could describe the polyborate formation constants K23 and K24
at I = 3 M (NaClO4) in a revised and modified model [48] in which the formation constants K11, K13 and
K15 stay almost unchanged. Hence, the formation constants for K23 and K24 were applied also for 0.1 M
ionic strength in this work. In the reversed case the selected values for K11, K13 and K15 were also used
up to I = 3 M.
In addition to the selected formation constants of Ingri et al. further polyborate formation constants
from Mesmer et al. (potentiometric titration) [52], Maya et al. (Raman) [54], Momii et al. (NMR) [58],
Salentine et al. (NMR) [59] and Spessard et al. (potentiometric titration) [60] are listed in Table 5. This
summary together with Ingri´s values form a consistent data set for polyborate formation constants.
With Ingri´s formation constants of different (poly)borates (Table A-1, see appendix) the speciation in
the B(OH)3-polyborate system under certain conditions (e.g., pH and [B]total) can be calculated. Fig. 2
illustrates a B(OH)3-polyborate speciation in the pH range 3 to 14 for a solution containing [B]total =
0.025 M to 0.7 M (I = 0.1 M, NaClO4).
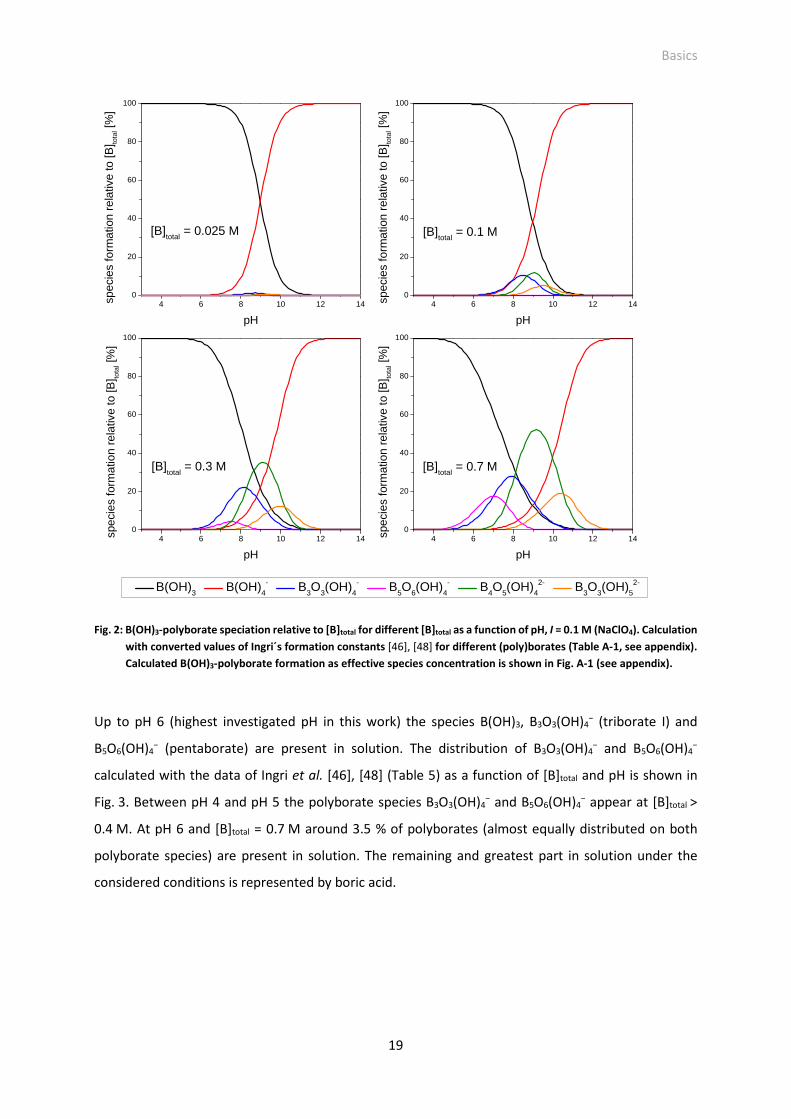
Basics
19
Fig. 2: B(OH)3-polyborate speciation relative to [B]total for different [B]total as a function of pH, I = 0.1 M (NaClO4). Calculation
with converted values of Ingri´s formation constants [46], [48] for different (poly)borates (Table A-1, see appendix).
Calculated B(OH)3-polyborate formation as effective species concentration is shown in Fig. A-1 (see appendix).
Up to pH 6 (highest investigated pH in this work) the species B(OH)3, B3O3(OH)4− (triborate I) and
B5O6(OH)4− (pentaborate) are present in solution. The distribution of B3O3(OH)4
− and B5O6(OH)4−
calculated with the data of Ingri et al. [46], [48] (Table 5) as a function of [B]total and pH is shown in
Fig. 3. Between pH 4 and pH 5 the polyborate species B3O3(OH)4− and B5O6(OH)4
− appear at [B]total >
0.4 M. At pH 6 and [B]total = 0.7 M around 3.5 % of polyborates (almost equally distributed on both
polyborate species) are present in solution. The remaining and greatest part in solution under the
considered conditions is represented by boric acid.
4 6 8 10 12 140
20
40
60
80
100
spec
ies
form
atio
n re
lativ
e to
[B] to
tal [
%]
pH
4 6 8 10 12 140
20
40
60
80
100
spec
ies
form
atio
n re
lativ
e to
[B] to
tal [
%]
pH
4 6 8 10 12 140
20
40
60
80
100
spec
ies
form
atio
n re
lativ
e to
[B] to
tal [
%]
pH
4 6 8 10 12 140
20
40
60
80
100
[B]total = 0.7 M[B]total
= 0.3 M
[B]total = 0.1 M
B(OH)3 B(OH)
4- B
3O
3(OH)
4- B
5O
6(OH)
4- B
4O
5(OH)
42-
B3O
3(OH)
52-
spec
ies
form
atio
n re
lativ
e to
[B] to
tal [
%]
pH
[B]total = 0.025 M
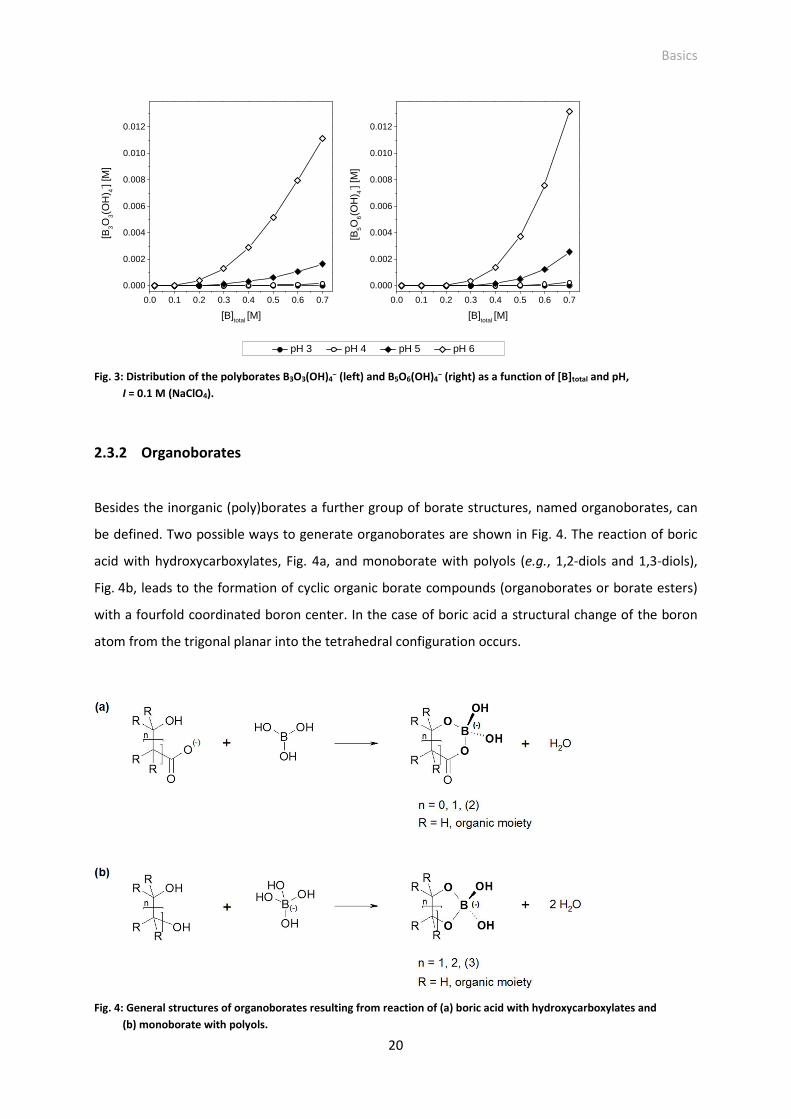
Basics
20
Fig. 3: Distribution of the polyborates B3O3(OH)4
− (left) and B5O6(OH)4− (right) as a function of [B]total and pH,
I = 0.1 M (NaClO4).
2.3.2 Organoborates
Besides the inorganic (poly)borates a further group of borate structures, named organoborates, can
be defined. Two possible ways to generate organoborates are shown in Fig. 4. The reaction of boric
acid with hydroxycarboxylates, Fig. 4a, and monoborate with polyols (e.g., 1,2-diols and 1,3-diols),
Fig. 4b, leads to the formation of cyclic organic borate compounds (organoborates or borate esters)
with a fourfold coordinated boron center. In the case of boric acid a structural change of the boron
atom from the trigonal planar into the tetrahedral configuration occurs.
Fig. 4: General structures of organoborates resulting from reaction of (a) boric acid with hydroxycarboxylates and
(b) monoborate with polyols.
0.0 0.1 0.2 0.3 0.4 0.5 0.6 0.7
0.000
0.002
0.004
0.006
0.008
0.010
0.012
pH 3 pH 4 pH 5 pH 6
[B3O
3(O
H) 4- ] [
M]
[B]total [M]
0.0 0.1 0.2 0.3 0.4 0.5 0.6 0.7
0.000
0.002
0.004
0.006
0.008
0.010
0.012
[B5O
6(O
H) 4- ] [
M]
[B]total [M]
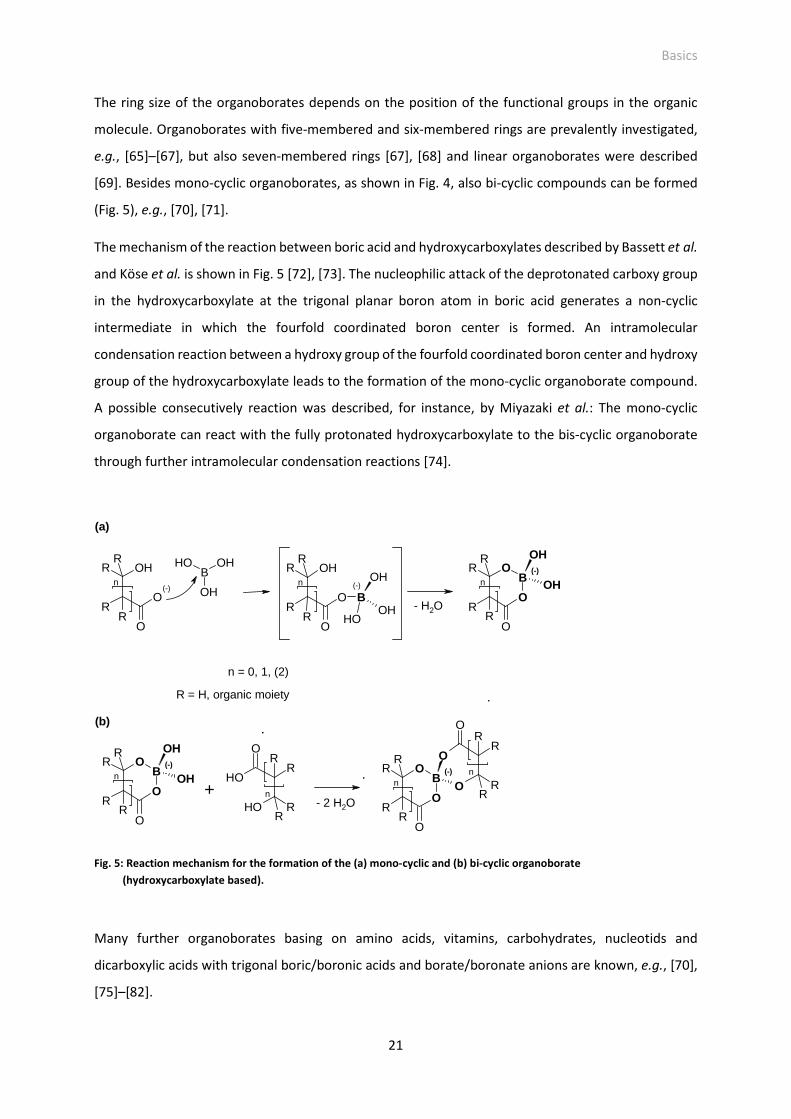
Basics
21
The ring size of the organoborates depends on the position of the functional groups in the organic
molecule. Organoborates with five-membered and six-membered rings are prevalently investigated,
e.g., [65]–[67], but also seven-membered rings [67], [68] and linear organoborates were described
[69]. Besides mono-cyclic organoborates, as shown in Fig. 4, also bi-cyclic compounds can be formed
(Fig. 5), e.g., [70], [71].
The mechanism of the reaction between boric acid and hydroxycarboxylates described by Bassett et al.
and Köse et al. is shown in Fig. 5 [72], [73]. The nucleophilic attack of the deprotonated carboxy group
in the hydroxycarboxylate at the trigonal planar boron atom in boric acid generates a non-cyclic
intermediate in which the fourfold coordinated boron center is formed. An intramolecular
condensation reaction between a hydroxy group of the fourfold coordinated boron center and hydroxy
group of the hydroxycarboxylate leads to the formation of the mono-cyclic organoborate compound.
A possible consecutively reaction was described, for instance, by Miyazaki et al.: The mono-cyclic
organoborate can react with the fully protonated hydroxycarboxylate to the bis-cyclic organoborate
through further intramolecular condensation reactions [74].
OR
R
O
O
B
OH
OH
R
R
n
OHR
RO
O
n
R
R
BOHOH
OH
OHR
RO
O
n
R
R
BOH
OH
OH
OR
R
O
O
B
OH
OH
R
R
n
OH R
ROH
O
n
R
R
R
R
O
n
R
R
OR
R
O
O
B
O
O
R
R
n
(-)
(-)
n = 0, 1, (2)
R = H, organic moiety
(a)
(-)
- H2O
(b)
(-)
+- 2 H2O
(-)
Fig. 5: Reaction mechanism for the formation of the (a) mono-cyclic and (b) bi-cyclic organoborate
(hydroxycarboxylate based).
Many further organoborates basing on amino acids, vitamins, carbohydrates, nucleotids and
dicarboxylic acids with trigonal boric/boronic acids and borate/boronate anions are known, e.g., [70],
[75]–[82].
Basics
22
2.3.3 Metal-borate complexes
In the literature complexation constants βM,B (according to Eq. 21) for the monoborato complexes of
alkaline metals (Li, Na, K), earth alkaline metals (Mg, Ca, Sr, Ba), aluminum(III), iron(III), cobalt(II),
nickel(II), copper(II), zinc(II), silver(I), cadmium(II) and lead(II) are described (Table 6).
Mn+ + B(OH)4− MB(OH)4
(n-1)+ �M,B = [MB(OH)4
(n-1)+]
[Mn+][B(OH)4- ]
(21)
Bousher gave a detailed review about these monoborate complexes [83]. He also deduced
complexation constants βM,B from solubility data of solid metal-borate phases and corrected dubiously
seeming complexation constants [83]. Bousher described in his review a linear relationship between
the dissociation constant of the respective metal-hydroxide pβ*M,OH, Eq. 24, and metal-monoborate
complex (expressed as reaction between the metal-hydroxide and boric acid) lg β∗M,B, Eq. 26, [83].
Mn+ + OH− MOH(n-1)+ �M,OH = [MOH(n-1)+]
[Mn+][OH-] (22)
Mn+ + H2O MOH(n-1)+ + H+ �M,OH∗ = [MOH(n-1)+] [H+]
[Mn+] (23)
p�M,OH∗ = p�W − lg �M,OH (24)
MOH(n-1)+ + B(OH)3 MB(OH)4(n-1)+ �M,B
∗ = [MB(OH)4(n-1)+]
[MOH(n-1)+] [B(OH)3] (25)
lg �M,B∗ = lg �M,B − p�a,BH + p�M,OH
∗ (26)
pβ*M,OH and lg β∗
M,B of the respective metal ion are summarized in Table 6. The plotting of lg β∗M,B vs.
pβ*M,OH is shown in Fig. 6. These data points were fitted with a linear function (Fig. 6). To estimate the
previously not determined complexation constant of the Eu(III) (mono)borate this linear relationship
was applied. For that lg β0Eu,OH = 6.36 [17] was used and pβ*
Eu,OH = 7.64 was determined. The respective
lg β∗Eu,B was obtained from the linear relationship, and the value in an uncertainty range is summarized
in Fig. 6.
lg β0Eu,B was deduced from lg β∗
Eu,B (Eq. 26) with values in the range lg β0Eu,B = 2.6 ─ 3.5 (confidence
interval) or lg β0Eu,B = 1.6 ─ 4.5 (prediction interval).
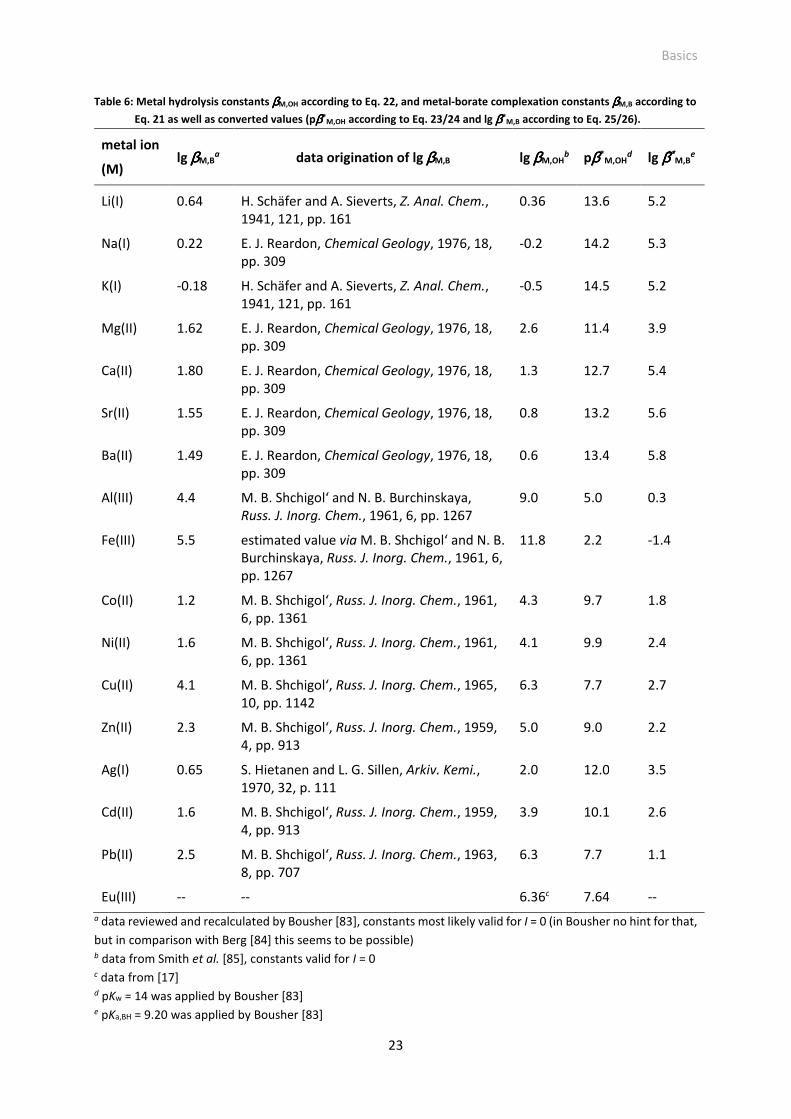
Basics
23
Table 6: Metal hydrolysis constants ββββM,OH according to Eq. 22, and metal-borate complexation constants ββββM,B according to
Eq. 21 as well as converted values (pββββ*M,OH according to Eq. 23/24 and lg ββββ*
M,B according to Eq. 25/26).
metal ion
(M) lg ββββM,B
a data origination of lg ββββM,B lg ββββM,OHb pββββ*
M,OHd lg β β β β∗∗∗∗
M,Be
Li(I) 0.64 H. Schäfer and A. Sieverts, Z. Anal. Chem.,
1941, 121, pp. 161
0.36 13.6 5.2
Na(I) 0.22 E. J. Reardon, Chemical Geology, 1976, 18,
pp. 309
-0.2 14.2 5.3
K(I) -0.18 H. Schäfer and A. Sieverts, Z. Anal. Chem.,
1941, 121, pp. 161
-0.5 14.5 5.2
Mg(II) 1.62 E. J. Reardon, Chemical Geology, 1976, 18,
pp. 309
2.6 11.4 3.9
Ca(II) 1.80 E. J. Reardon, Chemical Geology, 1976, 18,
pp. 309
1.3 12.7 5.4
Sr(II) 1.55 E. J. Reardon, Chemical Geology, 1976, 18,
pp. 309
0.8 13.2 5.6
Ba(II) 1.49 E. J. Reardon, Chemical Geology, 1976, 18,
pp. 309
0.6 13.4 5.8
Al(III) 4.4 M. B. Shchigol‘ and N. B. Burchinskaya,
Russ. J. Inorg. Chem., 1961, 6, pp. 1267
9.0 5.0 0.3
Fe(III) 5.5 estimated value via M. B. Shchigol‘ and N. B.
Burchinskaya, Russ. J. Inorg. Chem., 1961, 6,
pp. 1267
11.8 2.2 -1.4
Co(II) 1.2 M. B. Shchigol‘, Russ. J. Inorg. Chem., 1961,
6, pp. 1361
4.3 9.7 1.8
Ni(II) 1.6 M. B. Shchigol‘, Russ. J. Inorg. Chem., 1961,
6, pp. 1361
4.1 9.9 2.4
Cu(II) 4.1 M. B. Shchigol‘, Russ. J. Inorg. Chem., 1965,
10, pp. 1142
6.3 7.7 2.7
Zn(II) 2.3 M. B. Shchigol‘, Russ. J. Inorg. Chem., 1959,
4, pp. 913
5.0 9.0 2.2
Ag(I) 0.65 S. Hietanen and L. G. Sillen, Arkiv. Kemi.,
1970, 32, p. 111
2.0 12.0 3.5
Cd(II) 1.6 M. B. Shchigol‘, Russ. J. Inorg. Chem., 1959,
4, pp. 913
3.9 10.1 2.6
Pb(II) 2.5 M. B. Shchigol‘, Russ. J. Inorg. Chem., 1963,
8, pp. 707
6.3 7.7 1.1
Eu(III) -- -- 6.36c 7.64 --
a data reviewed and recalculated by Bousher [83], constants most likely valid for I = 0 (in Bousher no hint for that,
but in comparison with Berg [84] this seems to be possible) b data from Smith et al. [85], constants valid for I = 0 c data from [17] d pKw = 14 was applied by Bousher [83] e pKa,BH = 9.20 was applied by Bousher [83]
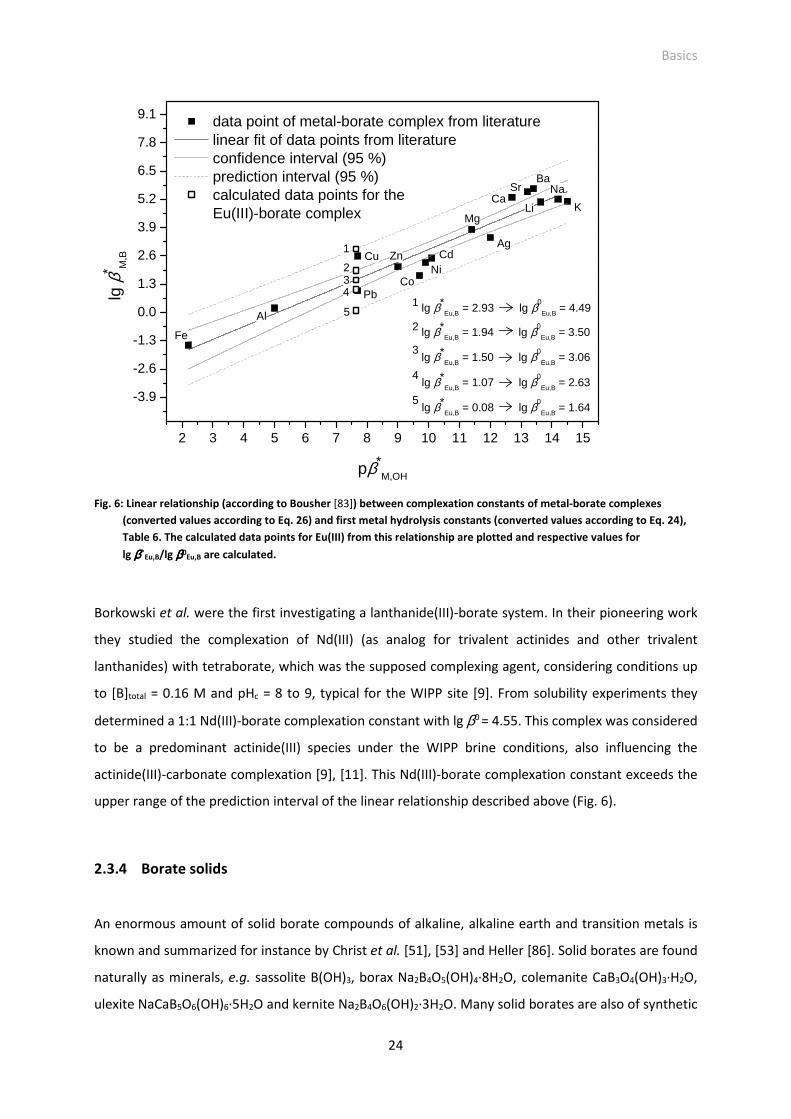
Basics
24
Fig. 6: Linear relationship (according to Bousher [83]) between complexation constants of metal-borate complexes
(converted values according to Eq. 26) and first metal hydrolysis constants (converted values according to Eq. 24),
Table 6. The calculated data points for Eu(III) from this relationship are plotted and respective values for
lg ββββ*Eu,B/lg ββββ0
Eu,B are calculated.
Borkowski et al. were the first investigating a lanthanide(III)-borate system. In their pioneering work
they studied the complexation of Nd(III) (as analog for trivalent actinides and other trivalent
lanthanides) with tetraborate, which was the supposed complexing agent, considering conditions up
to [B]total = 0.16 M and pHc = 8 to 9, typical for the WIPP site [9]. From solubility experiments they
determined a 1:1 Nd(III)-borate complexation constant with lg β0 = 4.55. This complex was considered
to be a predominant actinide(III) species under the WIPP brine conditions, also influencing the
actinide(III)-carbonate complexation [9], [11]. This Nd(III)-borate complexation constant exceeds the
upper range of the prediction interval of the linear relationship described above (Fig. 6).
2.3.4 Borate solids
An enormous amount of solid borate compounds of alkaline, alkaline earth and transition metals is
known and summarized for instance by Christ et al. [51], [53] and Heller [86]. Solid borates are found
naturally as minerals, e.g. sassolite B(OH)3, borax Na2B4O5(OH)4·8H2O, colemanite CaB3O4(OH)3·H2O,
ulexite NaCaB5O6(OH)6·5H2O and kernite Na2B4O6(OH)2·3H2O. Many solid borates are also of synthetic
2 3 4 5 6 7 8 9 10 11 12 13 14 15
-3.9
-2.6
-1.3
0.0
1.3
2.6
3.9
5.2
6.5
7.8
9.1
K
Na
Li
BaSr
Ca
Ag
Mg
CdNi
Co
Zn
Pb
Cu
Al
1
234
data point of metal-borate complex from literature linear fit of data points from literature confidence interval (95 %) prediction interval (95 %) calculated data points for the
Eu(III)-borate complex
lg β
* M,B
pβ*M,OH
51 lg β*
Eu,B = 2.93 lg β0
Eu,B = 4.49
2 lg β*Eu,B = 1.94 lg β0
Eu,B = 3.50
3 lg β*
Eu,B = 1.50 lg β0
Eu,B = 3.06
4 lg β*
Eu,B = 1.07 lg β0
Eu,B = 2.63
5 lg β*
Eu,B = 0.08 lg β0
Eu,B = 1.64
Fe
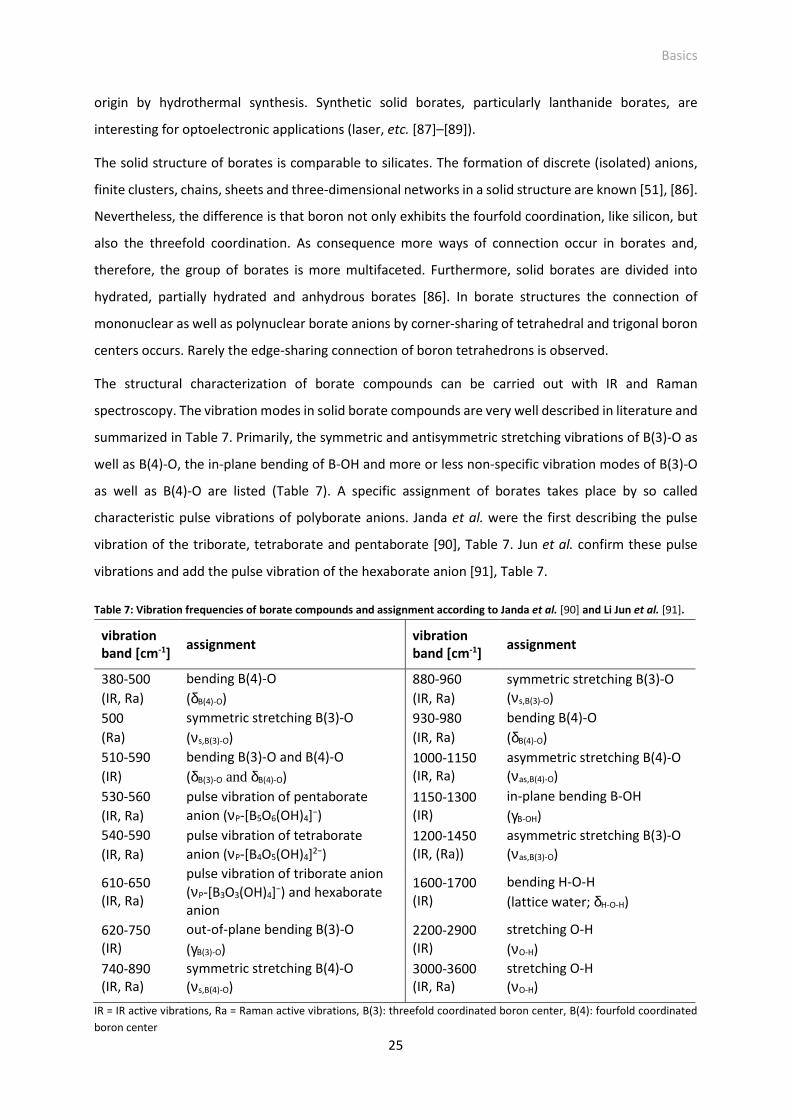
Basics
25
origin by hydrothermal synthesis. Synthetic solid borates, particularly lanthanide borates, are
interesting for optoelectronic applications (laser, etc. [87]–[89]).
The solid structure of borates is comparable to silicates. The formation of discrete (isolated) anions,
finite clusters, chains, sheets and three-dimensional networks in a solid structure are known [51], [86].
Nevertheless, the difference is that boron not only exhibits the fourfold coordination, like silicon, but
also the threefold coordination. As consequence more ways of connection occur in borates and,
therefore, the group of borates is more multifaceted. Furthermore, solid borates are divided into
hydrated, partially hydrated and anhydrous borates [86]. In borate structures the connection of
mononuclear as well as polynuclear borate anions by corner-sharing of tetrahedral and trigonal boron
centers occurs. Rarely the edge-sharing connection of boron tetrahedrons is observed.
The structural characterization of borate compounds can be carried out with IR and Raman
spectroscopy. The vibration modes in solid borate compounds are very well described in literature and
summarized in Table 7. Primarily, the symmetric and antisymmetric stretching vibrations of B(3)-O as
well as B(4)-O, the in-plane bending of B-OH and more or less non-specific vibration modes of B(3)-O
as well as B(4)-O are listed (Table 7). A specific assignment of borates takes place by so called
characteristic pulse vibrations of polyborate anions. Janda et al. were the first describing the pulse
vibration of the triborate, tetraborate and pentaborate [90], Table 7. Jun et al. confirm these pulse
vibrations and add the pulse vibration of the hexaborate anion [91], Table 7.
Table 7: Vibration frequencies of borate compounds and assignment according to Janda et al. [90] and Li Jun et al. [91].
vibration band [cm-1]
assignment vibration band [cm-1]
assignment
380-500
(IR, Ra)
bending B(4)-O
(δB(4)-O)
880-960
(IR, Ra)
symmetric stretching B(3)-O
(νs,B(3)-O)
500
(Ra)
symmetric stretching B(3)-O
(νs,B(3)-O)
930-980
(IR, Ra)
bending B(4)-O
(δB(4)-O)
510-590
(IR)
bending B(3)-O and B(4)-O
(δB(3)-O and δB(4)-O)
1000-1150 (IR, Ra)
asymmetric stretching B(4)-O
(νas,B(4)-O)
530-560
(IR, Ra)
pulse vibration of pentaborate
anion (νP-[B5O6(OH)4]−) 1150-1300 (IR)
in-plane bending B-OH
(γB-OH)
540-590
(IR, Ra)
pulse vibration of tetraborate
anion (νP-[B4O5(OH)4]2−) 1200-1450 (IR, (Ra))
asymmetric stretching B(3)-O
(νas,B(3)-O)
610-650 (IR, Ra)
pulse vibration of triborate anion
(νP-[B3O3(OH)4]−) and hexaborate anion
1600-1700 (IR)
bending H-O-H
(lattice water; δH-O-H)
620-750 (IR)
out-of-plane bending B(3)-O
(γB(3)-O)
2200-2900 (IR)
stretching O-H
(νO-H)
740-890 (IR, Ra)
symmetric stretching B(4)-O (νs,B(4)-O)
3000-3600 (IR, Ra)
stretching O-H (νO-H)
IR = IR active vibrations, Ra = Raman active vibrations, B(3): threefold coordinated boron center, B(4): fourfold coordinated
boron center
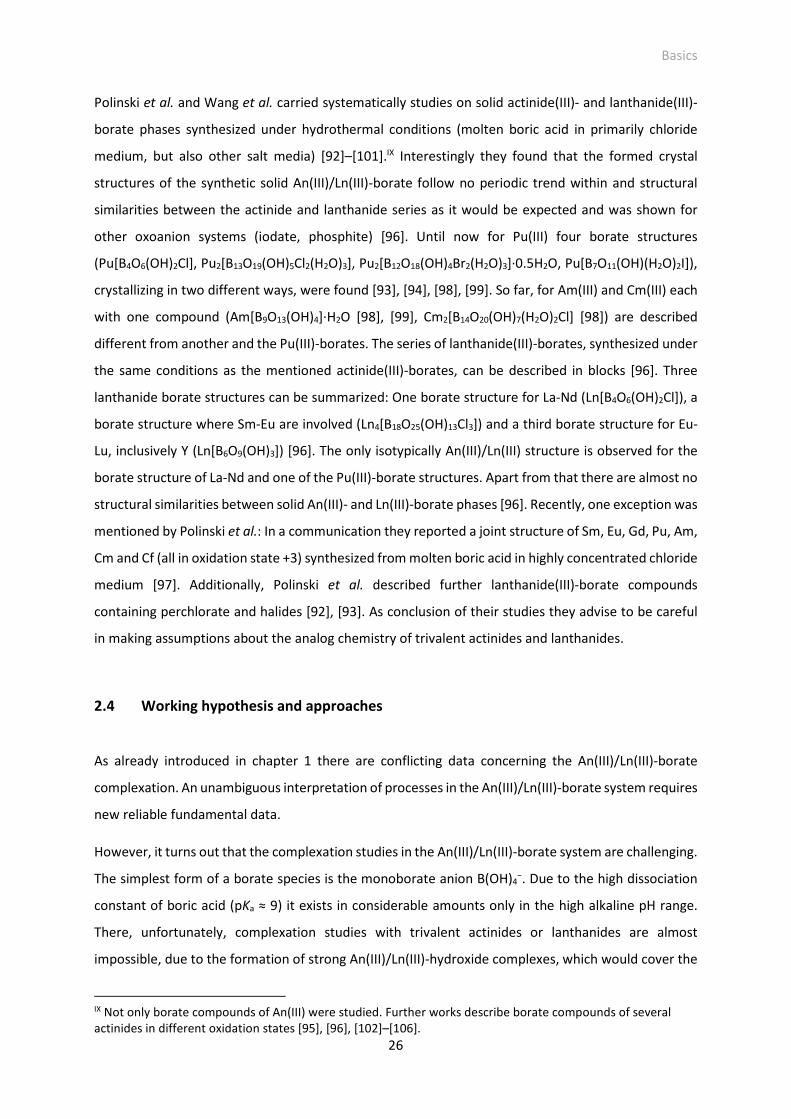
Basics
26
Polinski et al. and Wang et al. carried systematically studies on solid actinide(III)- and lanthanide(III)-
borate phases synthesized under hydrothermal conditions (molten boric acid in primarily chloride
medium, but also other salt media) [92]–[101].IX Interestingly they found that the formed crystal
structures of the synthetic solid An(III)/Ln(III)-borate follow no periodic trend within and structural
similarities between the actinide and lanthanide series as it would be expected and was shown for
other oxoanion systems (iodate, phosphite) [96]. Until now for Pu(III) four borate structures
(Pu[B4O6(OH)2Cl], Pu2[B13O19(OH)5Cl2(H2O)3], Pu2[B12O18(OH)4Br2(H2O)3]·0.5H2O, Pu[B7O11(OH)(H2O)2I]),
crystallizing in two different ways, were found [93], [94], [98], [99]. So far, for Am(III) and Cm(III) each
with one compound (Am[B9O13(OH)4]·H2O [98], [99], Cm2[B14O20(OH)7(H2O)2Cl] [98]) are described
different from another and the Pu(III)-borates. The series of lanthanide(III)-borates, synthesized under
the same conditions as the mentioned actinide(III)-borates, can be described in blocks [96]. Three
lanthanide borate structures can be summarized: One borate structure for La-Nd (Ln[B4O6(OH)2Cl]), a
borate structure where Sm-Eu are involved (Ln4[B18O25(OH)13Cl3]) and a third borate structure for Eu-
Lu, inclusively Y (Ln[B6O9(OH)3]) [96]. The only isotypically An(III)/Ln(III) structure is observed for the
borate structure of La-Nd and one of the Pu(III)-borate structures. Apart from that there are almost no
structural similarities between solid An(III)- and Ln(III)-borate phases [96]. Recently, one exception was
mentioned by Polinski et al.: In a communication they reported a joint structure of Sm, Eu, Gd, Pu, Am,
Cm and Cf (all in oxidation state +3) synthesized from molten boric acid in highly concentrated chloride
medium [97]. Additionally, Polinski et al. described further lanthanide(III)-borate compounds
containing perchlorate and halides [92], [93]. As conclusion of their studies they advise to be careful
in making assumptions about the analog chemistry of trivalent actinides and lanthanides.
2.4 Working hypothesis and approaches
As already introduced in chapter 1 there are conflicting data concerning the An(III)/Ln(III)-borate
complexation. An unambiguous interpretation of processes in the An(III)/Ln(III)-borate system requires
new reliable fundamental data.
However, it turns out that the complexation studies in the An(III)/Ln(III)-borate system are challenging.
The simplest form of a borate species is the monoborate anion B(OH)4−. Due to the high dissociation
constant of boric acid (pKa ≈ 9) it exists in considerable amounts only in the high alkaline pH range.
There, unfortunately, complexation studies with trivalent actinides or lanthanides are almost
impossible, due to the formation of strong An(III)/Ln(III)-hydroxide complexes, which would cover the
IX Not only borate compounds of An(III) were studied. Further works describe borate compounds of several
actinides in different oxidation states [95], [96], [102]–[106].
Basics
27
weak An(III)/Ln(III)-borate complexation (this is an estimation, see chapter 2.3.3). Furthermore,
An(III)/Ln(III)-hydroxide precipitations, starting already in the submicromolar metal concentration
range [107], can interfere these complexation studies.
To avoid the strongly competing hydrolysis reaction the complexation studies in the Eu(III)-borate
system were carried out in the acidic pH range up to pH 6. Under ambient conditions Eu(III)-hydroxo
and -carbonato complexes as well as the formation of solid Eu(III)-hydroxides and -carbonates can be
excluded. The Eu(III) speciation up to pH 6 is exclusively dominated by the Eu(III) aquo ion. However,
no monoborate anion at all exists up to pH 6 and [B]total = 0.7 M (solubility limit of boric acid as borate
source). Above [B]total = 0.025 M respective polyborate species occur (see chapters 2.3.1 and 4.1.1).
They have an effect on the Eu(III) speciation, i.e., complexing the Eu(III) (see chapter 4.1.2). Hence,
polyborates were used as borate ligands in the Eu(III) complexation studies. Certainly, the polyborate
equilibrium is still complex in the acidic pH range, because several polyborates coexist, but simpler
than in the alkaline region (Fig. 2). However, the mathematical deconvolution and separation of their
complexes with Eu(III) was not possible. Consequently, the approach in this work is to generalize all
coexisting polyborate species to one model borate species “B(OR)4−” assuming that all borate species
with the structural unit “B(OR)4−“ show similar complexation properties with Eu(III) (Fig. 7).
Fig. 7: M(III)-borate complex, M = trivalent actinides/lanthanides.
In a second approach organoborates, also containing this structural unit “B(OR)4−“, served for the
complexation studies in the An(III)/Ln(III)-borate system. When using hydroxycarboxylate based
organoborates these studies can be carried out in the acidic pH range (see chapter 4.2.1) with the same
background as for the polyborate approach (avoiding An(III)/Ln(III) hydrolysis).
Both approaches shall provide consistent and assured thermodynamic complexation data for the
An(III)/Ln(III)-borate system. From previous DFT studies it is known that the Eu(III) complexation by the
“B(OR)4−“ unit is not significantly influenced by the nature of the moieties R (R = H, organic moieties
(aliphatic, aromatic), other threefold coordinated boron center(s); including the simple monoborate
anion and inorganic polyborates with one binding site) [108].
Basics
28
The complexation studies were carried out with TRLFS and, in the case of the Eu(III)-organoborate
complexation studies, additionally with 11B NMR spectroscopy. With TRLFS the metal site is probed,
and changes in the Eu(III) speciation can be observed with high sensitivity and selectivity at low metal
concentrations (around 10−6 M). With NMR a view at the ligand site is provided, and, hence, its
speciation changes in presence of the metal, i.e., Eu(III). Due to the paramagnetism of Eu(III), the NMR
signals of molecules interacting with the europium ion are shifted considerably with only low signal
broadening [109]–[111]. The Eu(III) concentration dependent paramagnetic induced shift [112] was
used here to determine the complexation constant of the Eu(III)-salicylatoborate and Eu(III)-
lactatoborate.
Methods
29
3 Methods
This chapter gives an overview about the spectroscopic techniques mainly applied for the
investigations in this work: Luminescence spectroscopy probing the metal site ─ Eu(III) ─ in the
complexation system and NMR spectroscopy to look at the ligand site (polyborates, organoborates).
In chapter 3.3 a short overview about further used spectroscopic and analytical methods is given.
3.1 Luminescence spectroscopy
Luminescence spectroscopy is a spectroscopic method in which the emitted light (luminescence) of
atoms, ions and molecules is analyzed qualitatively as well as quantitatively. The electrons of these
chemical species are transferred from the electronic ground state (S0) to excited electronic and
vibration states (Sn, n > 0) by energy absorption (E = h·ν = h·c·λ−1, E: energy, h: Planck´s constant, ν:
frequency, c: speed of light, λ: wavelength of light). The subsequent relaxation of the electrons back
to the electronic ground state takes place as non-radiative and/or light emitting processes. Non-
radiative processes can be occurred as heat emission, vibrational relaxation, internal conversion (IC;
transition from higher to lower singlet excited states) and intersystem crossing (ISC; transition from
singlet excited state to a triplet excited state) [113]. A relaxation via light emission takes place as
fluorescence or phosphorescence. Fluorescence occurs from the lowest singlet excited state (S1) and
phosphorescence from the lowest triplet excited state (T1). However, in practice it is difficult to
distinguish between fluorescence and phosphorescence. Thus, both light emitting processes are
unified to the term luminescence. All the described processes (absorption as well as relaxation
processes) are illustrated in the Jabłoński diagram (Fig. 8).
As result of absorption and luminescence processes, absorption and luminescence spectra of chemical
species are detectable. Normally, absorption bands appear at lower wavelengths than emission bands
(the emitted light is of lower energy) as a consequence of energy loss by non-radiative processes
(Stokes shift) [113].
The intensity of transmitted light is given by the Lambert-Beer law, Eq. 27:
� = �0 ∙ 100123 = �0 − �A (27)
I: intensity of transmitted light I0: initial light intensity IA: intensity of absorbed light
ε: decadic molar extinction coefficient c: concentration of the absorbing species d: thickness of the sample
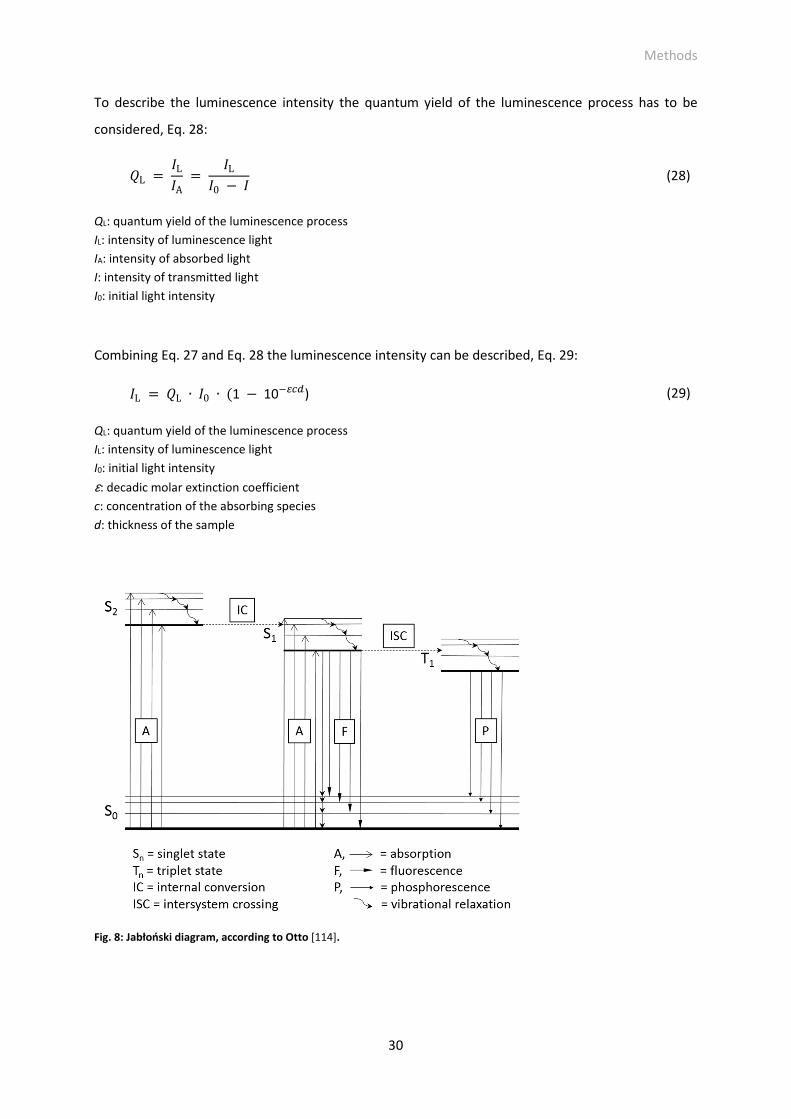
Methods
30
To describe the luminescence intensity the quantum yield of the luminescence process has to be
considered, Eq. 28:
5L � �L
�A�
�L
�0 � � (28)
QL: quantum yield of the luminescence process
IL: intensity of luminescence light
IA: intensity of absorbed light
I: intensity of transmitted light
I0: initial light intensity
Combining Eq. 27 and Eq. 28 the luminescence intensity can be described, Eq. 29:
�L � 5L ∙ �0 ∙ 1 � 100123) (29)
QL: quantum yield of the luminescence process
IL: intensity of luminescence light
I0: initial light intensity
ε: decadic molar extinction coefficient
c: concentration of the absorbing species
d: thickness of the sample
Fig. 8: Jabłoński diagram, according to Otto [114].
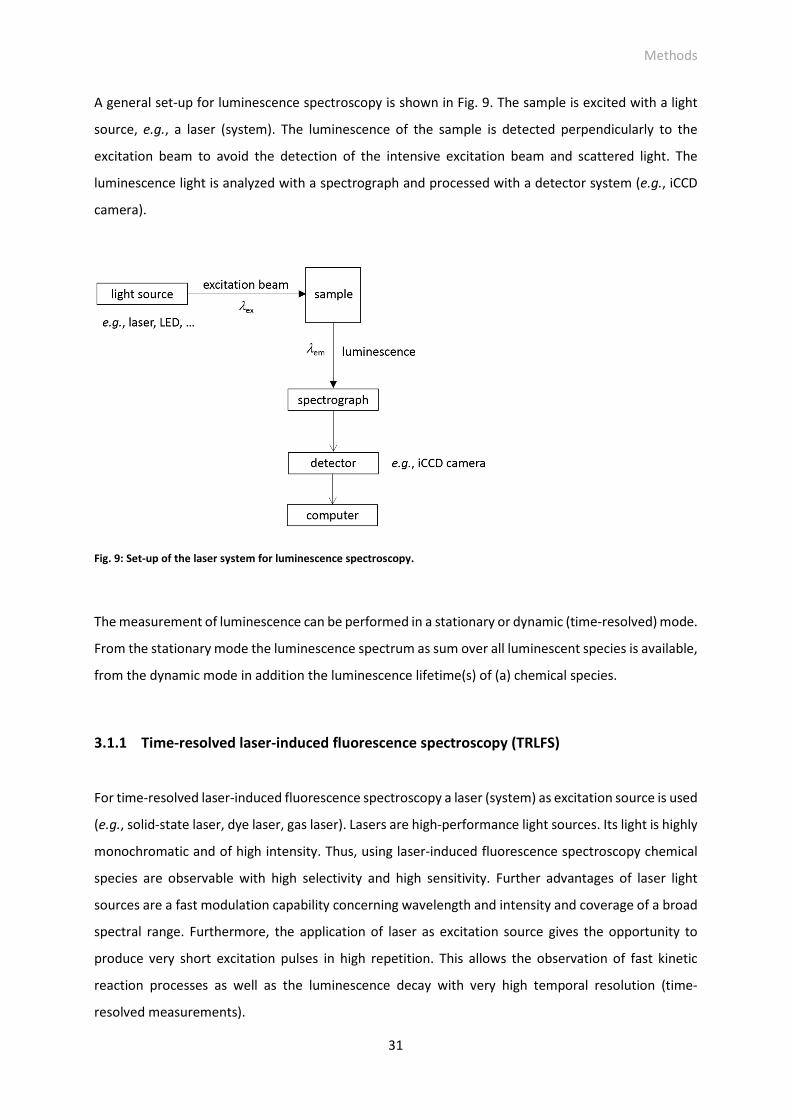
Methods
31
A general set-up for luminescence spectroscopy is shown in Fig. 9. The sample is excited with a light
source, e.g., a laser (system). The luminescence of the sample is detected perpendicularly to the
excitation beam to avoid the detection of the intensive excitation beam and scattered light. The
luminescence light is analyzed with a spectrograph and processed with a detector system (e.g., iCCD
camera).
Fig. 9: Set-up of the laser system for luminescence spectroscopy.
The measurement of luminescence can be performed in a stationary or dynamic (time-resolved) mode.
From the stationary mode the luminescence spectrum as sum over all luminescent species is available,
from the dynamic mode in addition the luminescence lifetime(s) of (a) chemical species.
3.1.1 Time-resolved laser-induced fluorescence spectroscopy (TRLFS)
For time-resolved laser-induced fluorescence spectroscopy a laser (system) as excitation source is used
(e.g., solid-state laser, dye laser, gas laser). Lasers are high-performance light sources. Its light is highly
monochromatic and of high intensity. Thus, using laser-induced fluorescence spectroscopy chemical
species are observable with high selectivity and high sensitivity. Further advantages of laser light
sources are a fast modulation capability concerning wavelength and intensity and coverage of a broad
spectral range. Furthermore, the application of laser as excitation source gives the opportunity to
produce very short excitation pulses in high repetition. This allows the observation of fast kinetic
reaction processes as well as the luminescence decay with very high temporal resolution (time-
resolved measurements).
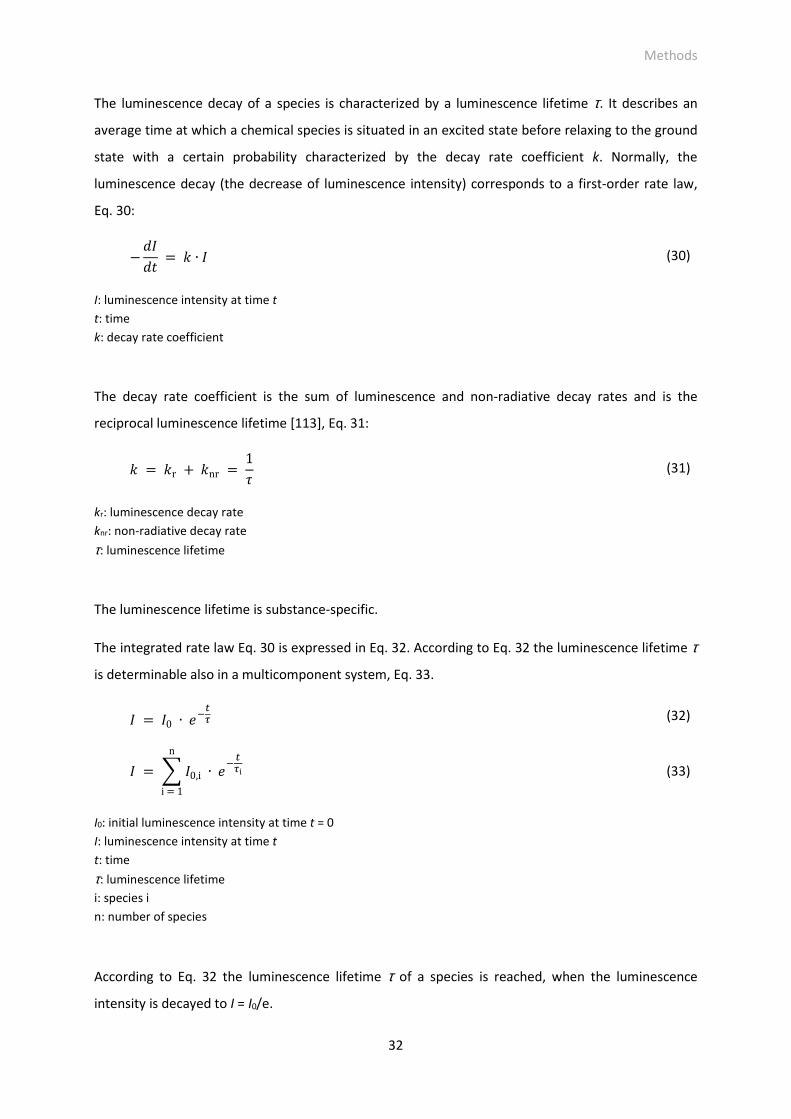
Methods
32
The luminescence decay of a species is characterized by a luminescence lifetime τ. It describes an
average time at which a chemical species is situated in an excited state before relaxing to the ground
state with a certain probability characterized by the decay rate coefficient k. Normally, the
luminescence decay (the decrease of luminescence intensity) corresponds to a first-order rate law,
Eq. 30:
�6�
67 = 8 ∙ � (30)
I: luminescence intensity at time t
t: time
k: decay rate coefficient
The decay rate coefficient is the sum of luminescence and non-radiative decay rates and is the
reciprocal luminescence lifetime [113], Eq. 31:
8 = 8r + 8nr = 1: (31)
kr: luminescence decay rate
knr: non-radiative decay rate
τ: luminescence lifetime
The luminescence lifetime is substance-specific.
The integrated rate law Eq. 30 is expressed in Eq. 32. According to Eq. 32 the luminescence lifetime τ
is determinable also in a multicomponent system, Eq. 33.
� = �0 ∙ ;0<= (32)
� = � �0,i ∙ ;0 <=i
n
i = 1 (33)
I0: initial luminescence intensity at time t = 0
I: luminescence intensity at time t
t: time
τ: luminescence lifetime
i: species i
n: number of species
According to Eq. 32 the luminescence lifetime τ of a species is reached, when the luminescence
intensity is decayed to I = I0/e.
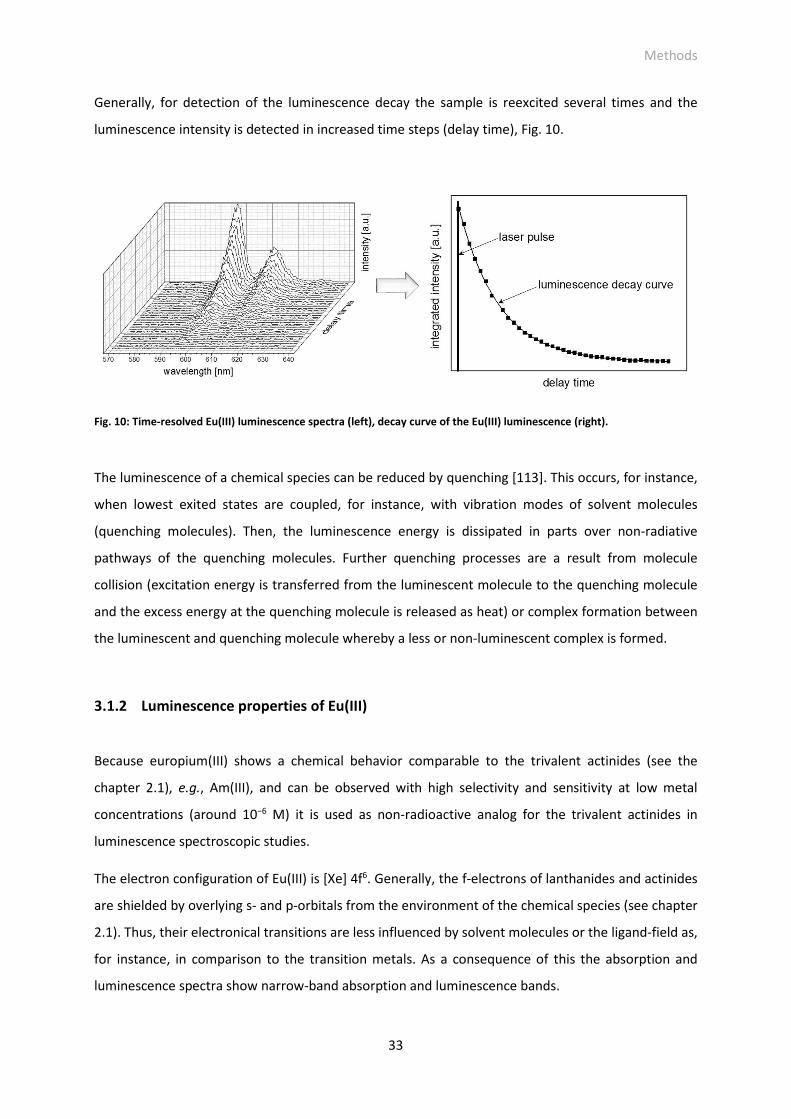
Methods
33
Generally, for detection of the luminescence decay the sample is reexcited several times and the
luminescence intensity is detected in increased time steps (delay time), Fig. 10.
Fig. 10: Time-resolved Eu(III) luminescence spectra (left), decay curve of the Eu(III) luminescence (right).
The luminescence of a chemical species can be reduced by quenching [113]. This occurs, for instance,
when lowest exited states are coupled, for instance, with vibration modes of solvent molecules
(quenching molecules). Then, the luminescence energy is dissipated in parts over non-radiative
pathways of the quenching molecules. Further quenching processes are a result from molecule
collision (excitation energy is transferred from the luminescent molecule to the quenching molecule
and the excess energy at the quenching molecule is released as heat) or complex formation between
the luminescent and quenching molecule whereby a less or non-luminescent complex is formed.
3.1.2 Luminescence properties of Eu(III)
Because europium(III) shows a chemical behavior comparable to the trivalent actinides (see the
chapter 2.1), e.g., Am(III), and can be observed with high selectivity and sensitivity at low metal
concentrations (around 10−6 M) it is used as non-radioactive analog for the trivalent actinides in
luminescence spectroscopic studies.
The electron configuration of Eu(III) is [Xe] 4f6. Generally, the f-electrons of lanthanides and actinides
are shielded by overlying s- and p-orbitals from the environment of the chemical species (see chapter
2.1). Thus, their electronical transitions are less influenced by solvent molecules or the ligand-field as,
for instance, in comparison to the transition metals. As a consequence of this the absorption and
luminescence spectra show narrow-band absorption and luminescence bands.
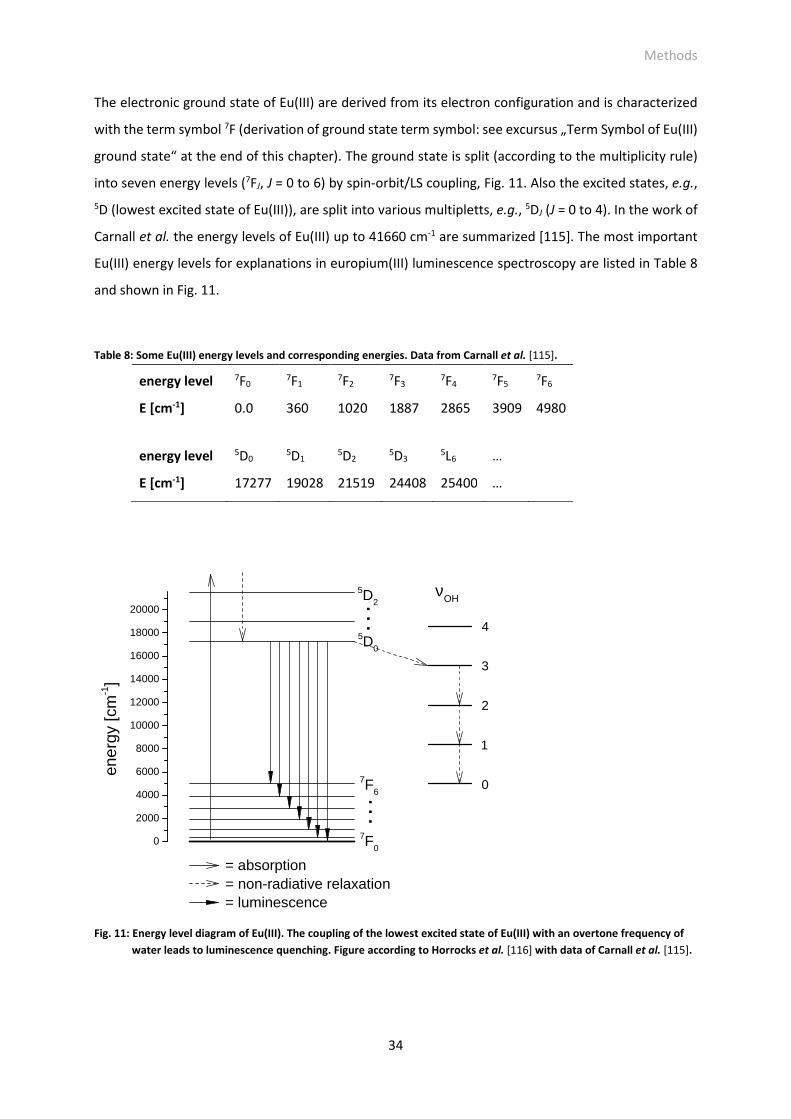
Methods
34
The electronic ground state of Eu(III) are derived from its electron configuration and is characterized
with the term symbol 7F (derivation of ground state term symbol: see excursus „Term Symbol of Eu(III)
ground state“ at the end of this chapter). The ground state is split (according to the multiplicity rule)
into seven energy levels (7FJ, J = 0 to 6) by spin-orbit/LS coupling, Fig. 11. Also the excited states, e.g.,
5D (lowest excited state of Eu(III)), are split into various multipletts, e.g., 5DJ (J = 0 to 4). In the work of
Carnall et al. the energy levels of Eu(III) up to 41660 cm-1 are summarized [115]. The most important
Eu(III) energy levels for explanations in europium(III) luminescence spectroscopy are listed in Table 8
and shown in Fig. 11.
Table 8: Some Eu(III) energy levels and corresponding energies. Data from Carnall et al. [115].
energy level 7F0 7F1 7F2 7F3 7F4 7F5 7F6
E [cm-1] 0.0 360 1020 1887 2865 3909 4980
energy level 5D0 5D1 5D2 5D3
5L6 …
E [cm-1] 17277 19028 21519 24408 25400 …
Fig. 11: Energy level diagram of Eu(III). The coupling of the lowest excited state of Eu(III) with an overtone frequency of
water leads to luminescence quenching. Figure according to Horrocks et al. [116] with data of Carnall et al. [115].
0
2000
4000
6000
8000
10000
12000
14000
16000
18000
20000
4
3
2
1
ener
gy [c
m-1]
. . .
5D0
5D2
7F0
7F6
. . .
= absorption= non-radiative relaxation= luminescence
νOH
0
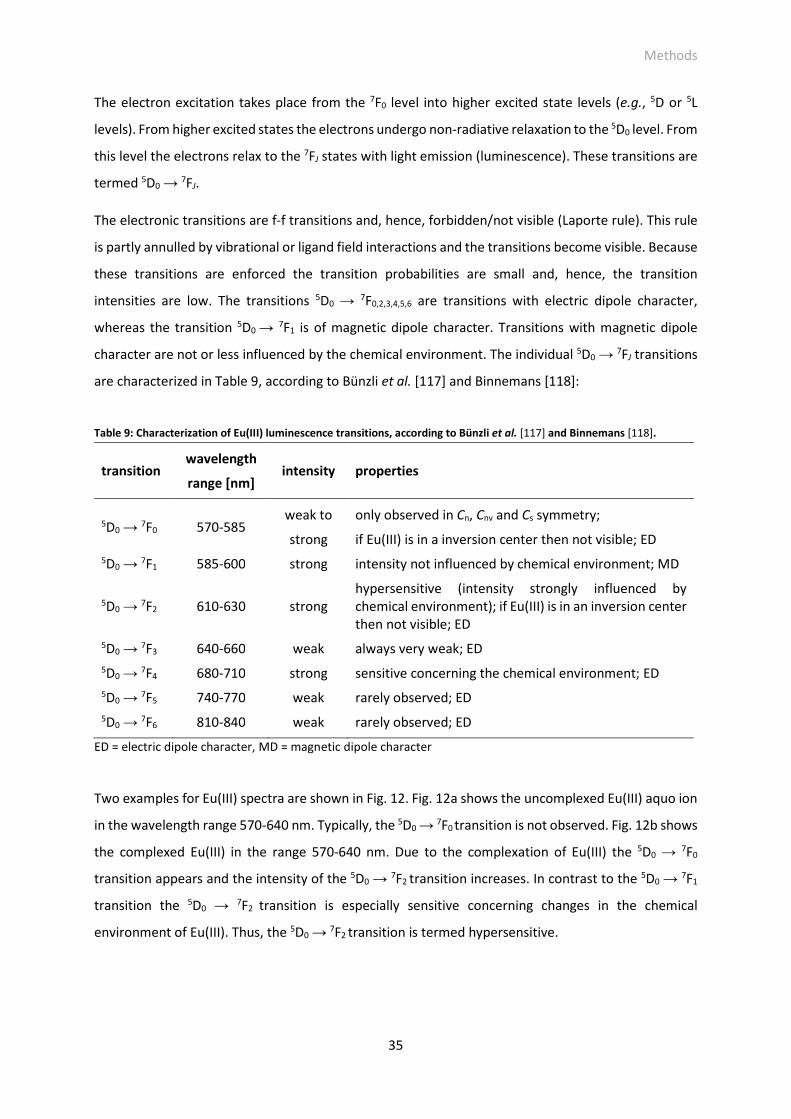
Methods
35
The electron excitation takes place from the 7F0 level into higher excited state levels (e.g., 5D or 5L
levels). From higher excited states the electrons undergo non-radiative relaxation to the 5D0 level. From
this level the electrons relax to the 7FJ states with light emission (luminescence). These transitions are
termed 5D0 → 7FJ.
The electronic transitions are f-f transitions and, hence, forbidden/not visible (Laporte rule). This rule
is partly annulled by vibrational or ligand field interactions and the transitions become visible. Because
these transitions are enforced the transition probabilities are small and, hence, the transition
intensities are low. The transitions 5D0 → 7F0,2,3,4,5,6 are transitions with electric dipole character,
whereas the transition 5D0 → 7F1 is of magnetic dipole character. Transitions with magnetic dipole
character are not or less influenced by the chemical environment. The individual 5D0 → 7FJ transitions
are characterized in Table 9, according to Bünzli et al. [117] and Binnemans [118]:
Table 9: Characterization of Eu(III) luminescence transitions, according to Bünzli et al. [117] and Binnemans [118].
transition wavelength
range [nm] intensity properties
5D0 → 7F0 570-585 weak to
strong
only observed in Cn, Cnv and Cs symmetry;
if Eu(III) is in a inversion center then not visible; ED
5D0 → 7F1 585-600 strong intensity not influenced by chemical environment; MD
5D0 → 7F2 610-630 strong hypersensitive (intensity strongly influenced by chemical environment); if Eu(III) is in an inversion center then not visible; ED
5D0 → 7F3 640-660 weak always very weak; ED
5D0 → 7F4 680-710 strong sensitive concerning the chemical environment; ED
5D0 → 7F5 740-770 weak rarely observed; ED
5D0 → 7F6 810-840 weak rarely observed; ED
ED = electric dipole character, MD = magnetic dipole character
Two examples for Eu(III) spectra are shown in Fig. 12. Fig. 12a shows the uncomplexed Eu(III) aquo ion
in the wavelength range 570-640 nm. Typically, the 5D0 → 7F0 transition is not observed. Fig. 12b shows
the complexed Eu(III) in the range 570-640 nm. Due to the complexation of Eu(III) the 5D0 → 7F0
transition appears and the intensity of the 5D0 → 7F2 transition increases. In contrast to the 5D0 → 7F1
transition the 5D0 → 7F2 transition is especially sensitive concerning changes in the chemical
environment of Eu(III). Thus, the 5D0 → 7F2 transition is termed hypersensitive.
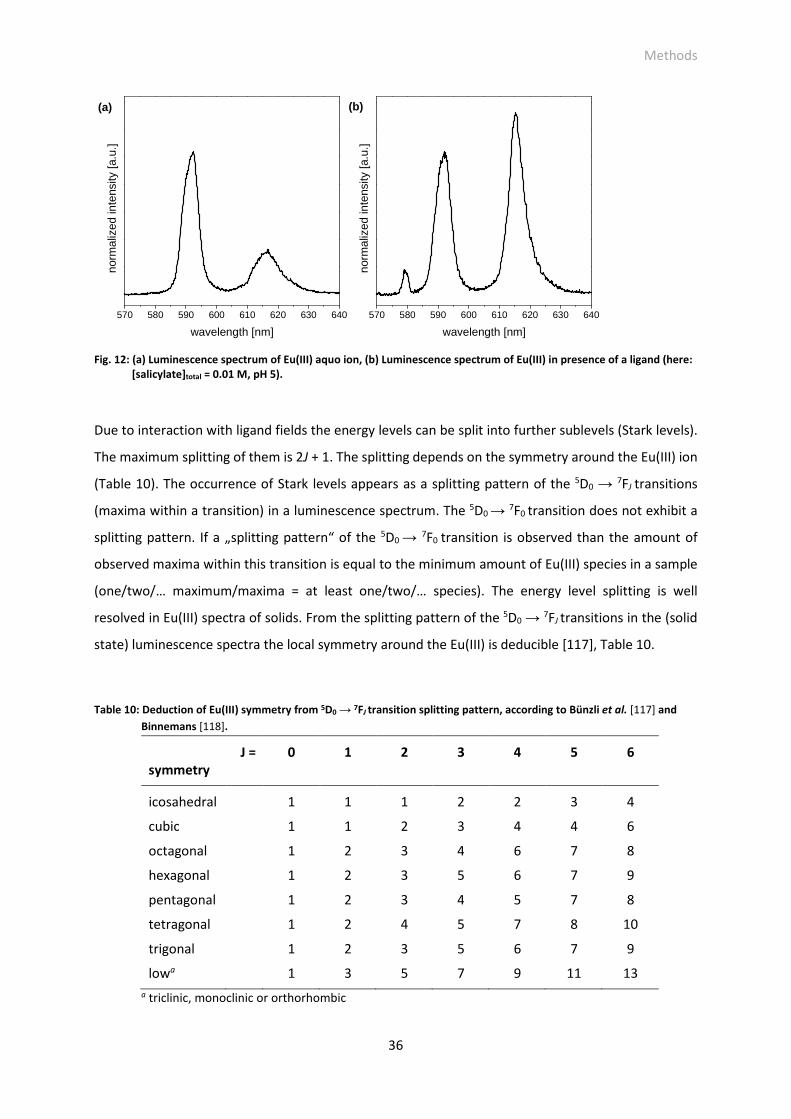
Methods
36
Fig. 12: (a) Luminescence spectrum of Eu(III) aquo ion, (b) Luminescence spectrum of Eu(III) in presence of a ligand (here: [salicylate]total = 0.01 M, pH 5).
Due to interaction with ligand fields the energy levels can be split into further sublevels (Stark levels).
The maximum splitting of them is 2J + 1. The splitting depends on the symmetry around the Eu(III) ion
(Table 10). The occurrence of Stark levels appears as a splitting pattern of the 5D0 → 7FJ transitions
(maxima within a transition) in a luminescence spectrum. The 5D0 → 7F0 transition does not exhibit a
splitting pattern. If a „splitting pattern“ of the 5D0 → 7F0 transition is observed than the amount of
observed maxima within this transition is equal to the minimum amount of Eu(III) species in a sample
(one/two/… maximum/maxima = at least one/two/… species). The energy level splitting is well
resolved in Eu(III) spectra of solids. From the splitting pattern of the 5D0 → 7FJ transitions in the (solid
state) luminescence spectra the local symmetry around the Eu(III) is deducible [117], Table 10.
Table 10: Deduction of Eu(III) symmetry from 5D0 → 7FJ transition splitting pattern, according to Bünzli et al. [117] and
Binnemans [118].
symmetry J = 0 1 2 3 4 5 6
icosahedral 1 1 1 2 2 3 4
cubic 1 1 2 3 4 4 6
octagonal 1 2 3 4 6 7 8
hexagonal 1 2 3 5 6 7 9
pentagonal 1 2 3 4 5 7 8
tetragonal 1 2 4 5 7 8 10
trigonal 1 2 3 5 6 7 9
lowa 1 3 5 7 9 11 13
a triclinic, monoclinic or orthorhombic
570 580 590 600 610 620 630 640
(b)
norm
aliz
ed in
tens
ity [a
.u.]
wavelength [nm]
(a)
570 580 590 600 610 620 630 640
norm
aliz
ed in
tens
ity [a
.u.]
wavelength [nm]
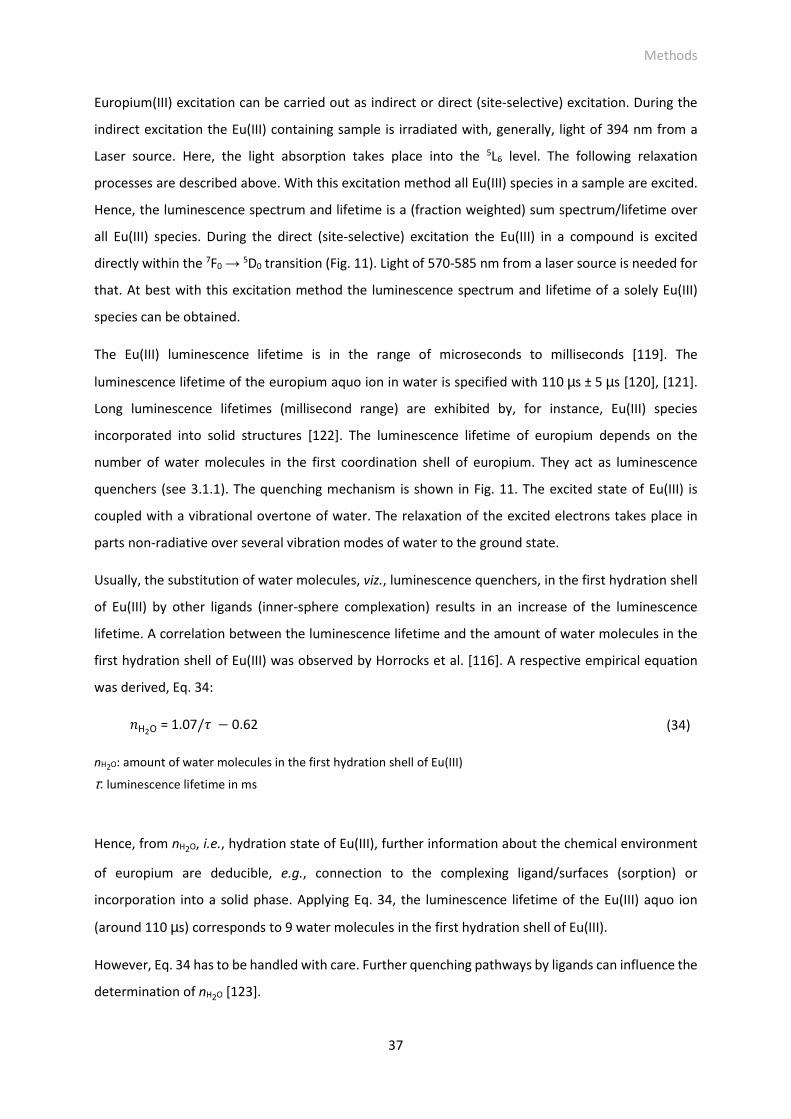
Methods
37
Europium(III) excitation can be carried out as indirect or direct (site-selective) excitation. During the
indirect excitation the Eu(III) containing sample is irradiated with, generally, light of 394 nm from a
Laser source. Here, the light absorption takes place into the 5L6 level. The following relaxation
processes are described above. With this excitation method all Eu(III) species in a sample are excited.
Hence, the luminescence spectrum and lifetime is a (fraction weighted) sum spectrum/lifetime over
all Eu(III) species. During the direct (site-selective) excitation the Eu(III) in a compound is excited
directly within the 7F0 → 5D0 transition (Fig. 11). Light of 570-585 nm from a laser source is needed for
that. At best with this excitation method the luminescence spectrum and lifetime of a solely Eu(III)
species can be obtained.
The Eu(III) luminescence lifetime is in the range of microseconds to milliseconds [119]. The
luminescence lifetime of the europium aquo ion in water is specified with 110 µs ± 5 µs [120], [121].
Long luminescence lifetimes (millisecond range) are exhibited by, for instance, Eu(III) species
incorporated into solid structures [122]. The luminescence lifetime of europium depends on the
number of water molecules in the first coordination shell of europium. They act as luminescence
quenchers (see 3.1.1). The quenching mechanism is shown in Fig. 11. The excited state of Eu(III) is
coupled with a vibrational overtone of water. The relaxation of the excited electrons takes place in
parts non-radiative over several vibration modes of water to the ground state.
Usually, the substitution of water molecules, viz., luminescence quenchers, in the first hydration shell
of Eu(III) by other ligands (inner-sphere complexation) results in an increase of the luminescence
lifetime. A correlation between the luminescence lifetime and the amount of water molecules in the
first hydration shell of Eu(III) was observed by Horrocks et al. [116]. A respective empirical equation
was derived, Eq. 34:
)H2O = 1.07/: − 0.62 (34)
nH2O: amount of water molecules in the first hydration shell of Eu(III)
τ: luminescence lifetime in ms
Hence, from nH2O, i.e., hydration state of Eu(III), further information about the chemical environment
of europium are deducible, e.g., connection to the complexing ligand/surfaces (sorption) or
incorporation into a solid phase. Applying Eq. 34, the luminescence lifetime of the Eu(III) aquo ion
(around 110 µs) corresponds to 9 water molecules in the first hydration shell of Eu(III).
However, Eq. 34 has to be handled with care. Further quenching pathways by ligands can influence the
determination of nH2O [123].
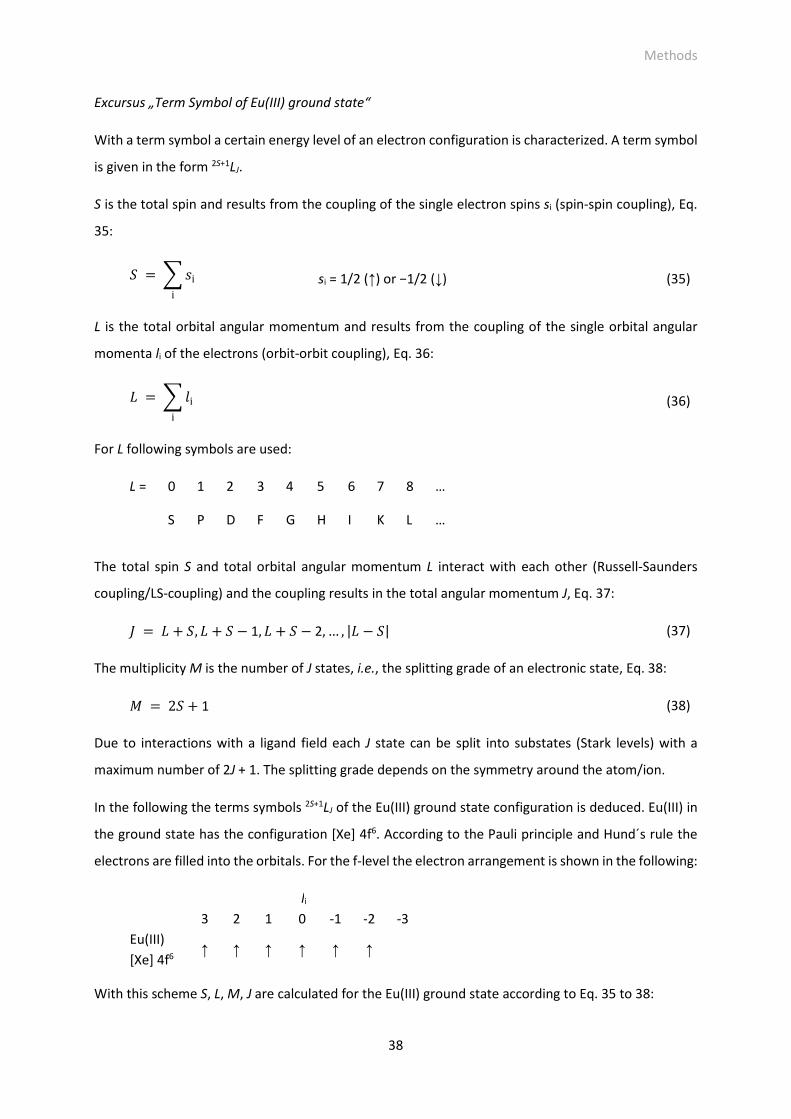
Methods
38
Excursus „Term Symbol of Eu(III) ground state“
With a term symbol a certain energy level of an electron configuration is characterized. A term symbol
is given in the form 2S+1LJ.
S is the total spin and results from the coupling of the single electron spins si (spin-spin coupling), Eq.
35:
? = � @ii
si = 1/2 (↑) or −1/2 (↓) (35)
L is the total orbital angular momentum and results from the coupling of the single orbital angular
momenta li of the electrons (orbit-orbit coupling), Eq. 36:
A = � Bii
(36)
For L following symbols are used:
L = 0 1 2 3 4 5 6 7 8 …
S P D F G H I K L …
The total spin S and total orbital angular momentum L interact with each other (Russell-Saunders
coupling/LS-coupling) and the coupling results in the total angular momentum J, Eq. 37:
C = A + ?, A + ? − 1, A + ? − 2, … , |A − ?| (37)
The multiplicity M is the number of J states, i.e., the splitting grade of an electronic state, Eq. 38:
E = 2? + 1 (38)
Due to interactions with a ligand field each J state can be split into substates (Stark levels) with a
maximum number of 2J + 1. The splitting grade depends on the symmetry around the atom/ion.
In the following the terms symbols 2S+1LJ of the Eu(III) ground state configuration is deduced. Eu(III) in
the ground state has the configuration [Xe] 4f6. According to the Pauli principle and Hund´s rule the
electrons are filled into the orbitals. For the f-level the electron arrangement is shown in the following:
li
3 2 1 0 -1 -2 -3
Eu(III)
[Xe] 4f6 ↑ ↑ ↑ ↑ ↑ ↑
With this scheme S, L, M, J are calculated for the Eu(III) ground state according to Eq. 35 to 38:
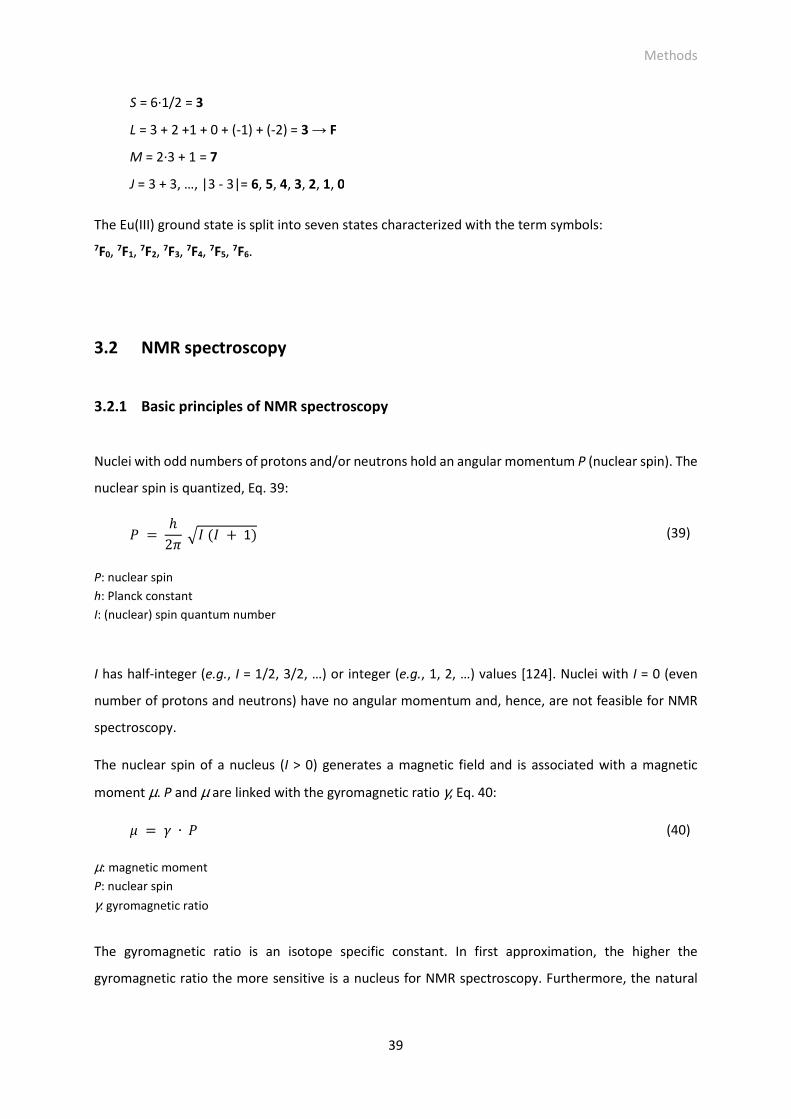
Methods
39
S = 6·1/2 = 3
L = 3 + 2 +1 + 0 + (-1) + (-2) = 3 → F
M = 2·3 + 1 = 7
J = 3 + 3, …, |3 - 3|= 6, 5, 4, 3, 2, 1, 0
The Eu(III) ground state is split into seven states characterized with the term symbols:
7F0, 7F1, 7F2, 7F3, 7F4, 7F5, 7F6.
3.2 NMR spectroscopy
3.2.1 Basic principles of NMR spectroscopy
Nuclei with odd numbers of protons and/or neutrons hold an angular momentum P (nuclear spin). The
nuclear spin is quantized, Eq. 39:
F = ℎ2H �� (� + 1) (39)
P: nuclear spin
h: Planck constant
I: (nuclear) spin quantum number
I has half-integer (e.g., I = 1/2, 3/2, …) or integer (e.g., 1, 2, …) values [124]. Nuclei with I = 0 (even
number of protons and neutrons) have no angular momentum and, hence, are not feasible for NMR
spectroscopy.
The nuclear spin of a nucleus (I > 0) generates a magnetic field and is associated with a magnetic
moment µ. P and µ are linked with the gyromagnetic ratio γ, Eq. 40:
I = ∙ F (40)
µ: magnetic moment
P: nuclear spin
γ: gyromagnetic ratio
The gyromagnetic ratio is an isotope specific constant. In first approximation, the higher the
gyromagnetic ratio the more sensitive is a nucleus for NMR spectroscopy. Furthermore, the natural
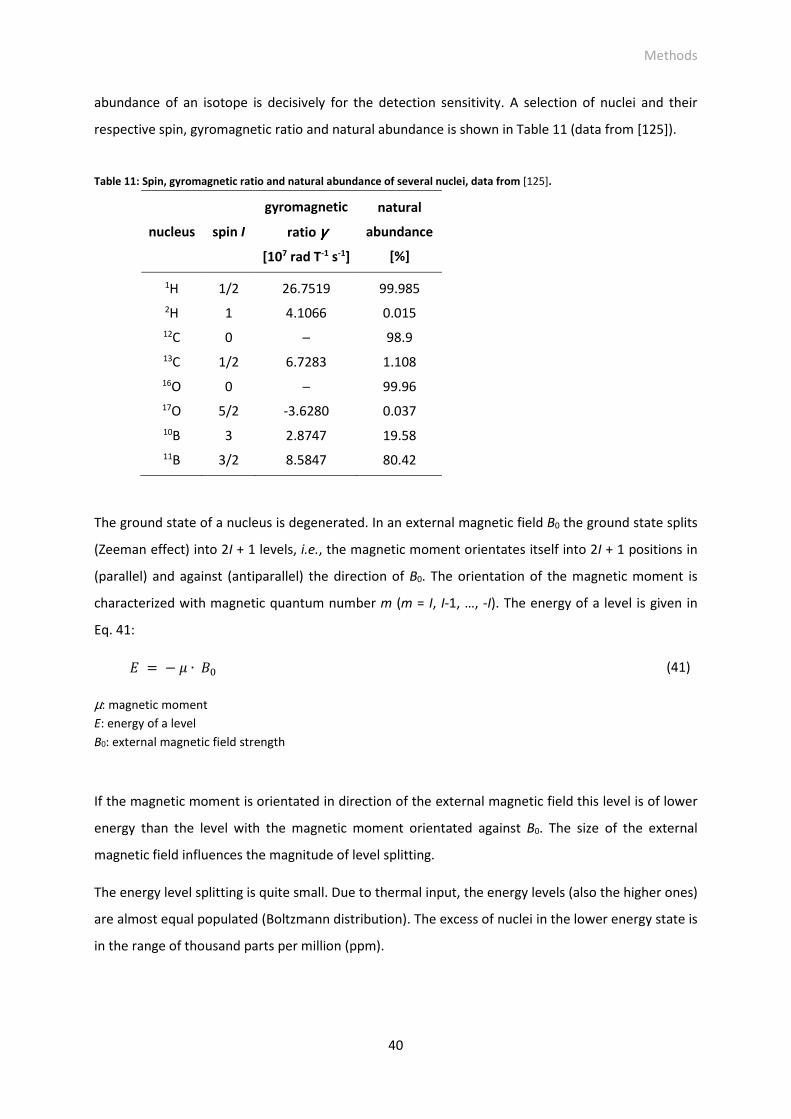
Methods
40
abundance of an isotope is decisively for the detection sensitivity. A selection of nuclei and their
respective spin, gyromagnetic ratio and natural abundance is shown in Table 11 (data from [125]).
Table 11: Spin, gyromagnetic ratio and natural abundance of several nuclei, data from [125].
nucleus spin I
gyromagnetic
ratio γγγγ
[107 rad T-1 s-1]
natural
abundance
[%]
1H 1/2 26.7519 99.985
2H 1 4.1066 0.015
12C 0 ─ 98.9
13C 1/2 6.7283 1.108
16O 0 ─ 99.96
17O 5/2 -3.6280 0.037
10B 3 2.8747 19.58
11B 3/2 8.5847 80.42
The ground state of a nucleus is degenerated. In an external magnetic field B0 the ground state splits
(Zeeman effect) into 2I + 1 levels, i.e., the magnetic moment orientates itself into 2I + 1 positions in
(parallel) and against (antiparallel) the direction of B0. The orientation of the magnetic moment is
characterized with magnetic quantum number m (m = I, I-1, …, -I). The energy of a level is given in
Eq. 41:
J = − I ∙ �K (41)
µ: magnetic moment
E: energy of a level
B0: external magnetic field strength
If the magnetic moment is orientated in direction of the external magnetic field this level is of lower
energy than the level with the magnetic moment orientated against B0. The size of the external
magnetic field influences the magnitude of level splitting.
The energy level splitting is quite small. Due to thermal input, the energy levels (also the higher ones)
are almost equal populated (Boltzmann distribution). The excess of nuclei in the lower energy state is
in the range of thousand parts per million (ppm).
Methods
41
During an NMR experiment nuclei in the external magnetic field are irradiated with rays of certain
frequency (∆E = h·ν). The nuclei absorb the energy and are excited from lower to higher energy levels
(selection rule: ∆m = ± 1). Absorption occurs at the resonance condition as described by Eq. 42:
ν = ||2H
∙ �K (42)
ν: frequency
γ: gyromagnetic ratio
B0: external magnetic field strength
If the frequency for resonance is achieved an NMR signal is measured. At the end of an NMR
experiment the energy levels are similarly populated (saturation). Relaxation processes follow in which
the initial state is reconstituted. In this time no NMR experiment can be carried out.
The resonance frequency of a nucleus depends on the external magnetic field constitution around the
nucleus. The external magnetic field is shielded by the electron shell around the nucleus and, hence, it
is ultimately reduced. Now, a higher frequency is required to fulfill the resonance condition. This
relation allows for the discriminiation between the same sort of nuclei but embedded in different
chemical environments.
The resonance frequency depends on the external magnetic field. Therefore, a further NMR parameter
was established: the B0 independent chemical shift δ. It describes the signal position of a nucleus
relative to a reference substance. For instance, for 1H and 13C NMR spectroscopy the reference
substance is tetramethylsilane, Si(CH3)4, and for 11B NMR spectroscopy it is boron trifluoride etherate,
BF3·O(C2H5)2.
It is known that paramagnetic metal ions are able to shift NMR signals to higher or lower frequencies
due to interactions with the molecule of interest (substrate) [110], [125]. These metal ions are referred
to as shift reagents. In general, paramagnetic trivalent lanthanide ions (e.g., Eu(III) and Pr(III)) are
applied, because these metal ions cause only low signal broadening [109]. The main application of this
metal/lanthanide induced shift is the separation of overlapping NMR signals of structurally complex
(organic) molecules, and to use this information for structure determination. In this work the Eu(III)
concentration dependent induced signal shift was used to determine the complexation constant of the
Eu(III)-salicylatoborate and Eu(III)-lactatoborate complexes.
The signal shift induced by paramagnetic metal ions bases on two interaction mechanisms between
the spin of the unpaired electrons of the metal ion and the nuclear spin: contact and pseudocontact
interaction (leading to the contact and pseudocontact shift). The contact interaction and resulting shift
bases on the formation of a covalent bond between the paramagnetic metal ion and the substrate,
Methods
42
and transfer of electron spin density of unpaired electrons of the metal ion to the nuclei in the molecule
of substrate [110], [125]. The influence of the contact interaction decreases with increasing distance
to the metal ion. In conjugated organic systems the effect of this mechanism is more long ranged [125].
The pseudocontact shift is caused by the interaction of the magnetic moments of the unpaired metal
ion electrons and the nuclei [110], [125]. The mechanism has an effect through space and the
deduction of structural data (e.g., distance metal ion → nuclei) is possible. The lanthanide induced
shift is characterized predominantly by the pseudocontact interaction [110].
In general, the metal-ligand(/substrate) interaction (free and metal bound ligand) is characterized by
a fast exchange concerning NMR time scale. Hence, not two NMR signals of free and metal bound
ligand are observed. The observed chemical shift of a certain nucleus in presence of paramagnetic
metal ions, δobs, is the fraction weighted average of the chemical shifts of free, δL, and metal bound
substrate, δML, [125], Eq. 43:
Lobs � PL ∙ LL + PML ∙ LML = PL ∙ LL + (1 − PL) ∙ LML (43)
δobs: observed chemical shift
δL: chemical shift of free ligand
xL: fraction of free ligand
δML: chemical shift of metal bound ligand
xML: fraction of metal bound ligand
Usally, the pulse-FT NMR technique (FT = Fourier transform) for the recording of NMR spectra is used
[124]. Here, a frequence pulse of corresponding resonance of the nucleus is sent to the sample being
in an external magnetic field. The excitation of the sample follows as described above. After dead time
(complete decay of the excitation pulse in the pickup coil) the free induction decay, FID, is recorded.
The FID is a time decreasing current in the pickup coil due to the relaxation of the nuclei into the ground
state (decay of the magnetization of the sample). By means of Fourier transformation the time-
intensity spectrum is transformed into a frequency-intensity spectrum (NMR spectrum).
The basic principles are applied in the next subchapter (11B NMR spectroscopy) and complexation
studies (chapter 4.2.2).
3.2.2 11B NMR spectroscopy
The element boron has two stable isotopes: 10B and 11B. In general, and in this work, the isotope 11B is
used for NMR spectroscopy, because it is the more sensitive nucleus (higher natural abundance and
gyromagnetic ratio, see Table 11). The resonance frequency of the 11B nucleus in a magnetic field with
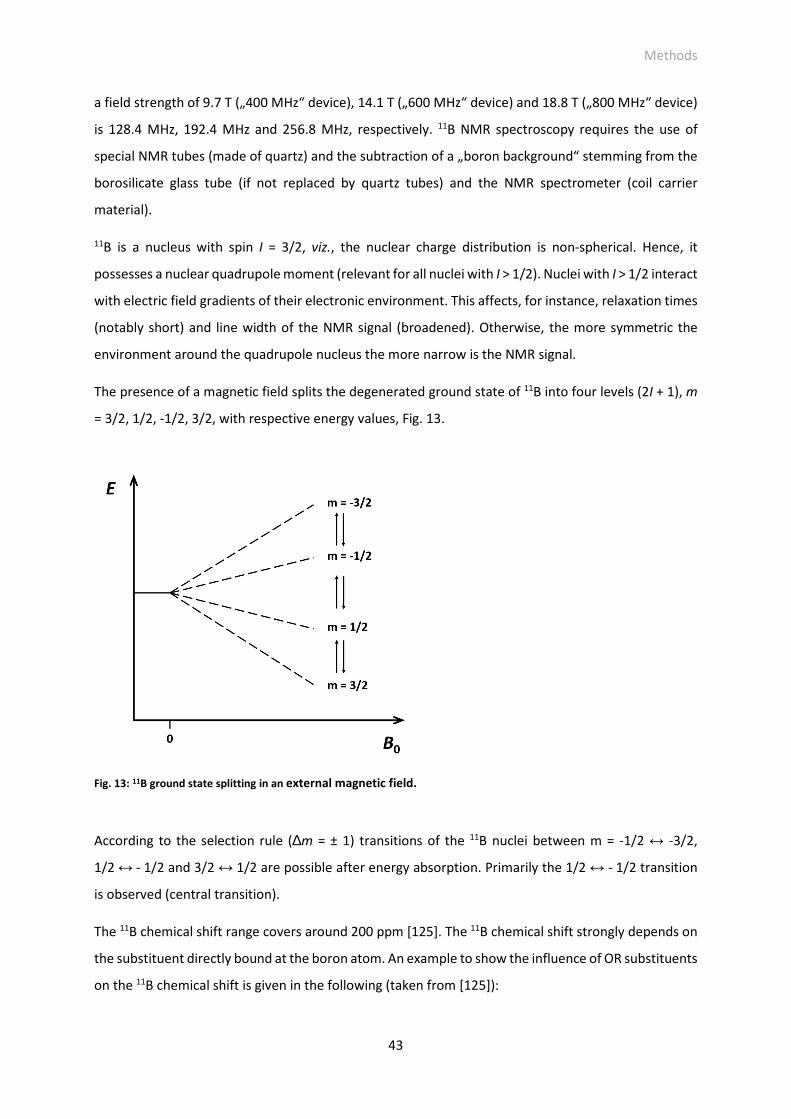
Methods
43
a field strength of 9.7 T („400 MHz“ device), 14.1 T („600 MHz“ device) and 18.8 T („800 MHz“ device)
is 128.4 MHz, 192.4 MHz and 256.8 MHz, respectively. 11B NMR spectroscopy requires the use of
special NMR tubes (made of quartz) and the subtraction of a „boron background“ stemming from the
borosilicate glass tube (if not replaced by quartz tubes) and the NMR spectrometer (coil carrier
material).
11B is a nucleus with spin I = 3/2, viz., the nuclear charge distribution is non-spherical. Hence, it
possesses a nuclear quadrupole moment (relevant for all nuclei with I > 1/2). Nuclei with I > 1/2 interact
with electric field gradients of their electronic environment. This affects, for instance, relaxation times
(notably short) and line width of the NMR signal (broadened). Otherwise, the more symmetric the
environment around the quadrupole nucleus the more narrow is the NMR signal.
The presence of a magnetic field splits the degenerated ground state of 11B into four levels (2I + 1), m
= 3/2, 1/2, -1/2, 3/2, with respective energy values, Fig. 13.
Fig. 13: 11B ground state splitting in an external magnetic field.
According to the selection rule (∆m = ± 1) transitions of the 11B nuclei between m = -1/2 ↔ -3/2,
1/2 ↔ - 1/2 and 3/2 ↔ 1/2 are possible after energy absorption. Primarily the 1/2 ↔ - 1/2 transition
is observed (central transition).
The 11B chemical shift range covers around 200 ppm [125]. The 11B chemical shift strongly depends on
the substituent directly bound at the boron atom. An example to show the influence of OR substituents
on the 11B chemical shift is given in the following (taken from [125]):
Methods
44
δ[B(CH3)3] = +86.3 ppm
δ[B(CH3)2(OCH3)] = +53.8 ppm
δ[B(CH3)(OCH3)2] = +32.1 ppm
δ[B(OCH3)3] = +18.3 ppm
Also the boron coordination influences the 11B signal position. The chemical shift range of threefold
and fourfold coordinated boron is of δ = +92 to -8 ppm and δ = +20 to -128 ppm, respectively [125].
The 11B nucleus in the tetrahedral coordination is more shielded, even though a higher amount of
electronegative oxygen atoms is bound, because of the higher electronic density (negative charge)
around the nucleus in comparison to the trigonal boron coordination.
From several 11B NMR studies of (poly)borate solutions (see section 2.3.1) an assignment of 11B NMR
signals for polyborate species can be deduced. In dilute boric acid solutions (without polyborate
species) a vagrantly 11B signal between 0-1 ppm and 18-19 ppm in the dependence on pH can be
observed. This signal is the exchange signal of the B(OH)3-B(OH)4− equilibrium. At low pH (< 4-5), where
only boric acid, B(OH)3, exists, the 11B NMR signal appears at 18-19 ppm. Above pH 4-5 the signal moves
to higher fields till at pH 11-12 a constant chemical shift at 0-1 ppm is reached [67]. Above pH 11-12
only the monoborate, B(OH)4−, exists. In conclusion, the chemical shift at 18-19 ppm is assigned to
boric acid (or exclusively threefold coordinated boron in borates) and at 0-1 ppm to the monoborate
anion (or exclusively fourfold coordinated boron in borates). The 11B NMR signal observed in the pH
range 4-11 is an species weighted signal of the B(OH)3-B(OH)4− equilibrium. From the signal positions
the fractions of boric acid and monoborate can be determined.
Further 11B NMR signals occur for polyborate containing solutions in dependence on pH and total
boron concentration. A broad signal at 12-13 ppm is assigned to the triborate anion B3O3(OH)4− [59]. It
is a kind of exchange signal resulting from the rapid change between threefold and fourfold
coordinated boron sites within the triborate molecule (depicted as OH-group „hopping“). The
exchange between threefold and fourfold coordinated boron atoms within the molecule is slower than
in the B(OH)3-B(OH)4− equilibrium leading to the broadened signal. The signal position of the triborate
B3O3(OH)4− is explainable with ratio of threefold and fourfold coordinated boron atoms in the molecule,
which is 2:1. Considering the chemical shifts of threefold and fourfold boron environments the
theoretical calculated chemical shift of triborate is 12-13 ppm, which is exactly the observed one.
Another typical, quite narrow 11B NMR signal assigned to a polyborate species occurs at 1 ppm. It is
the characteristic signal of the pentaborate species B5O6(OH)4−. Theoretically, considering the ratio of
threefold and fourfold coordinated boron atoms in this molecule (4:1) the chemical shift would appear
at 14-15 ppm. The discrepancy between calculated and observed chemical shift is explainable: In the
Methods
45
pentaborate anion B5O6(OH)4− no exchange processes between threefold and fourfold coordinated
boron sites occur due to the strong localization of the negative charge at the boron atom connecting
both ring structures. Hence, a clear signal of the fourfold coordinated boron site is observable. The
threefold coordinated boron site is not directly observable. Either it is overlapping with the strong
boric acid signal (always observed) or it is quadrupolar broadened.
A 11B NMR signal of the tetraborate anion B4O5(OH)42− was never observed. The calculated chemical
shift of the tetraborate anion B4O5(OH)42− (2:2 ratio of threefold and fourfold coordinated boron atoms)
is at 9-10 ppm. The missing signal for the tetraborate is attributed to an extreme broadening of this
signal due to strong exchange processes (charges strongly delocalized) within the molecule. The
existence of tetraborate in solution was confirmed with Raman spectroscopy, e.g., [54]–[56].
Organoborates (B(OR)4−, R = organic moieties) contain a fourfold coordinated boron atom. Hence, the
signal should appear in the chemical shift range of B(OH)4− (1 ppm). In fact, the signal is found in the
chemical shift range of the monoborate anion, but there are deviations depending on the formed ring
structure(s) in which the fourfold coordinated boron atom is involved. Table A-2 (see appendix)
illustrates this observation. Obviously, the ring size (5-/6-/7-membered ring, mono-/bis-cyclic) of the
formed organoborate has a stronger influence on the 11B chemical shift than the nature of the organic
moiety (e.g., having an inductive effect) bound to the B(OR)4− unit. The 11B chemical shift of
organoborates with 5-membered ring structure (5-7 ppm for the mono-cyclic, 8-10 ppm for the bis-
cyclic) is remarkably more downfield shifted than that of organoborates with 6-membered ring
structure (1-3 ppm for the mono-cyclic, 1-3 ppm for the bis-cyclic). The ring size effect on the 11B
chemical shift of organoborates and, therefore, the differentiation of five-membered and six-
membered organoborates is also described in literature, e.g., [69], [82], [126].
Excursus solid-state 11B NMR spectroscopy
If a substance is X-ray amorphous solid-state NMR spectroscopy can provide important structural
information.
In comparison to the solution-state in solid-state of a substance many anisotropic (direction
dependent) nuclear interactions effect the NMR experiment and cause characteristic NMR spectra. A
remarkable signal-broadening (some kHz), undifferentiated signals and in parts large signal shifts for
solid samples are observed. In solution-state these interactions are averaged by the in NMR time-scale
fast Brownian motion of the molecules. The NMR signals for solution samples are narrow (except for
a certain quadrupole broadening for nuclei with I > 1/2) and can exhibit a fine structure.
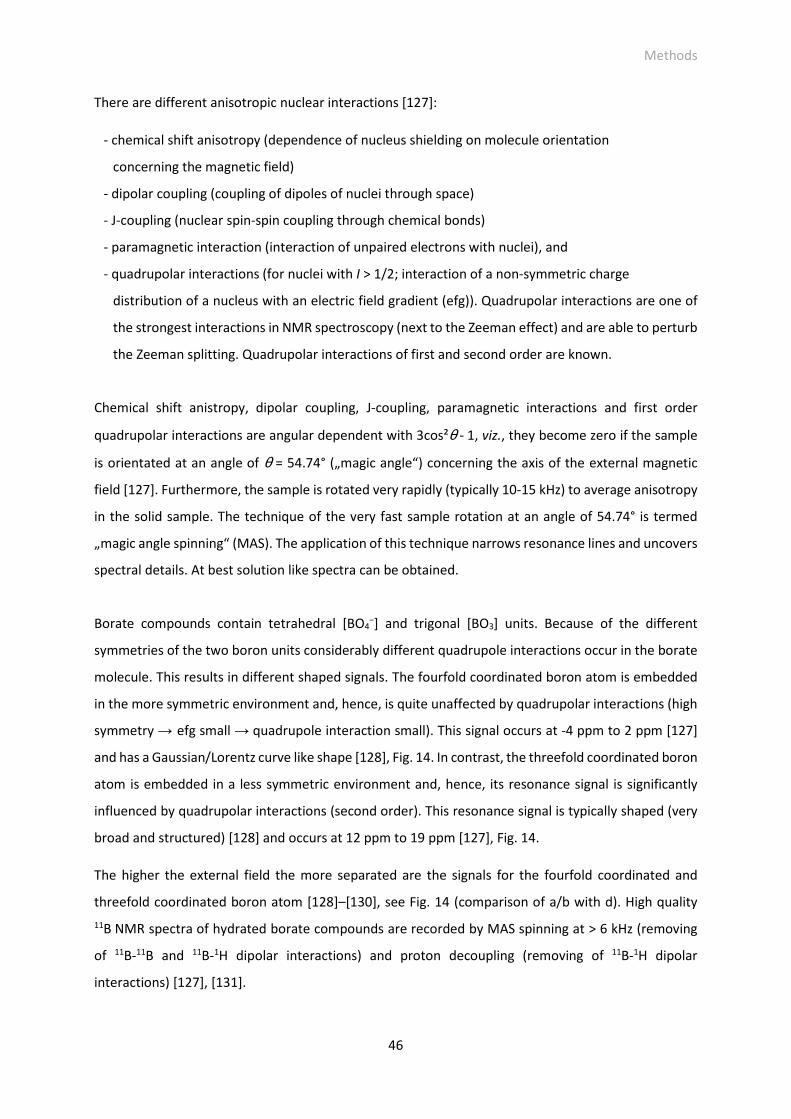
Methods
46
There are different anisotropic nuclear interactions [127]:
- chemical shift anisotropy (dependence of nucleus shielding on molecule orientation
concerning the magnetic field)
- dipolar coupling (coupling of dipoles of nuclei through space)
- J-coupling (nuclear spin-spin coupling through chemical bonds)
- paramagnetic interaction (interaction of unpaired electrons with nuclei), and
- quadrupolar interactions (for nuclei with I > 1/2; interaction of a non-symmetric charge
distribution of a nucleus with an electric field gradient (efg)). Quadrupolar interactions are one of
the strongest interactions in NMR spectroscopy (next to the Zeeman effect) and are able to perturb
the Zeeman splitting. Quadrupolar interactions of first and second order are known.
Chemical shift anistropy, dipolar coupling, J-coupling, paramagnetic interactions and first order
quadrupolar interactions are angular dependent with 3cos²θ - 1, viz., they become zero if the sample
is orientated at an angle of θ = 54.74° („magic angle“) concerning the axis of the external magnetic
field [127]. Furthermore, the sample is rotated very rapidly (typically 10-15 kHz) to average anisotropy
in the solid sample. The technique of the very fast sample rotation at an angle of 54.74° is termed
„magic angle spinning“ (MAS). The application of this technique narrows resonance lines and uncovers
spectral details. At best solution like spectra can be obtained.
Borate compounds contain tetrahedral [BO4−] and trigonal [BO3] units. Because of the different
symmetries of the two boron units considerably different quadrupole interactions occur in the borate
molecule. This results in different shaped signals. The fourfold coordinated boron atom is embedded
in the more symmetric environment and, hence, is quite unaffected by quadrupolar interactions (high
symmetry → efg small → quadrupole interaction small). This signal occurs at -4 ppm to 2 ppm [127]
and has a Gaussian/Lorentz curve like shape [128], Fig. 14. In contrast, the threefold coordinated boron
atom is embedded in a less symmetric environment and, hence, its resonance signal is significantly
influenced by quadrupolar interactions (second order). This resonance signal is typically shaped (very
broad and structured) [128] and occurs at 12 ppm to 19 ppm [127], Fig. 14.
The higher the external field the more separated are the signals for the fourfold coordinated and
threefold coordinated boron atom [128]–[130], see Fig. 14 (comparison of a/b with d). High quality
11B NMR spectra of hydrated borate compounds are recorded by MAS spinning at > 6 kHz (removing
of 11B-11B and 11B-1H dipolar interactions) and proton decoupling (removing of 11B-1H dipolar
interactions) [127], [131].
Methods
47
Fig. 14: Figure copied from Müller et al. [128]; 11B MAS NMR spectrum of Tl[B5O6(OH)4]·2H2O (128.3 MHz),
(a) experimentally obtained spectrum,
(b) calculated spectrum,
(c) single components of the spectrum,
(d) spectrum calculated for 160.4 MHz.
From the intensity ratio of the resonance signals of the fourfold coordinated and threefold coordinated
boron atoms (B(4):B(3)) the smallest structural unit (e.g., polyborates) and, hence, the local structure
in (amorphous) borate compounds can be deduced [128], [131].
3.3 Miscellaneous methods and analytics
Dynamic Light Scattering (DLS) [132]. DLS is a method to determine the size or size distribution of small
particles and molecules in suspension. Small particles and molecules, e.g., colloids, proteins, polymers,
are able to scatter light, e.g., emitted light from a laser source. With DLS the fluctuation of the
scattered light intensity, as a result of the Brownian motion of small particles/molecules, is measured.
The particle movement depends on the particle itself (size) and the medium (density, viscosity,
temperature) in which the particles are suspended. Small particles move faster and cause faster
Methods
48
fluctuations in the scattered light intensity than larger particles. From the mathematical analysis of the
scattered light intensity fluctuations (autocorrelation) a diffusion coefficient is deduced, which in turn
provides the hydrodynamic radius of the particles via the Stokes-Einstein equation.
Inductively Coupled Plasma Mass Spectrometry (ICP-MS) [133]. ICP-MS is a very sensitive analytical
method to determine the content of a certain analyte, e.g., heavy metals. Usually, the detection limit
is in the range ng/L. The analyte is ionized in an argon plasma. Then, the resulting ions are analyzed
qualitatively and quantitatively in a subsequent mass spectrometer, i.e., even different isotopes of an
element can be distinguished.
Infrared spectroscopy (IR spectroscopy) [133]. IR spectroscopy is an analytical method, particularly, for
the determination of ion or molecule structures. The absorption of infrared radiation by a molecule
results in bond vibrations. There are different vibration modes: stretching vibrations and bending
vibrations (in-plane: rocking, scissoring; out-of-plane: wagging, twisting). Furthermore, both vibration
modes may occur as symmetric or antisymmetric vibrations. Chemical bonds and molecule groups
have characteristic vibration frequencies. Hence, the resulting vibration bands in an IR spectrum can
be used for the identification of structures and substances.
Potentiometric titration [133]. By means of the potentiometric titration equilibrium constants, e.g.,
acid dissociation and complex formation constants, are determinable. For this purpose, the change in
the potential of a solution containing the reagent(s) is observed during the titration with a solution
containing another reagent. The potential is measured with an (ion-selective) electrode, e.g., pH/glass
electrode.
Scanning Electron Microscopy (SEM) [133]. With SEM images of a surface can be produced and the
chemical composition (EDX analysisX) of it can be determined. With a generated electron beam the
surface is scanned. The electrons of the electron beam interact with the material of the surface. In this
process, for instance, secondary electrons (containing the information of the topography of the
surface) and X-rays (containing the information of the chemical composition of the material) are
generated, and then are analyzed and converted into images or spectra.
X-ray diffraction (XRD) [23]. X-rays can be diffracted at the electron shell of atoms arranged in a crystal
lattice. However, the reflection of X-rays at parallel lattice planes only takes place when the Bragg´s
law is complied. Then, constructive interference of the radiation occurs and a diffraction pattern can
be detected. On the basis of resulting diffraction pattern or diffractogram the crystal structure of a
compound can be deduced. For the compound identification the resulting diffractogram also can be
X EDX analysis: energy dispersive X-ray analysis
Methods
49
compared with diffractograms of known compounds/crystal structures. X-ray diffraction can be carried
out at a single crystal or crystalline powder (powder XRD).
Hyperquad. The computer program Hyperquad [134], [135] is used for the analysis of data from
potentiometric titrations to determine chemical equilibrium constants, e.g., pKa and lg β. Hyperquad
needs a model for the species and equilibria in solution. Beside the titration data, the total
concentrations of the reactants in the titration vessel, concentration of the standard solution in the
burette, if neccessary known equilibria constants, and an estimated value for the unknown equilibrium
constant(s) (inital value for the fitting procedure) are required. The fitting procedure is an iterative
process in which the unknown equilibrium constant(s) is/are increasingly refined to align the calculated
titration data with the titration data from the experiment.
The version Hyperquad2008 was used in this work.
HypSpec. The computer program HypSpec [136] is used for the analysis of spectroscopic data (UV/Vis,
fluorescence) to determine complex formation constants. HypSpec needs a model for the species and
equilibria in solution. Beside the spectroscopic data, the total concentrations of the reactants in
solution, if neccessary pH of the solution, known equilibria constants (e.g., acid dissociation constant(s)
of the ligand, complex formation constants of secondary reactions, e.g., metal hydrolysis), and an
estimated value for the unknown equilibrium constant(s) (inital value for the fitting procedure) are
required. It is possible to provide known spectra of a species which is then integrated into the analysis.
First of all, on the basis of spectroscopic changes (e.g., intensity, wavelength) in the data matrix by
variation of a parameter in the studied system (e.g., pH, ligand concentration) the program deduces
the amount of species in the studied system and the respective spectrum of a single species. Then, the
respective fractions of the single spectra in a measured spectrum (mixture of spectra of single species)
are determined. With this information a concentration profile of the species as a function of a certain
parameter is deduced. With the concentration information of species the complex formation
constant(s) is/are calculated via the mass action law of the respective equilibrium reaction in
consideration of the model.
HypSpec version 1.1.18 was used in this work.
HySS. The computer program HySS [137] is used for the calculation of speciations (species fractions as
a function of a parameter, e.g., pH, concentration). HySS needs a model for the species and equilibria
in solution. Furthermore, the total concentrations of the reactants, pH of the solution, equilibria
constants (e.g., acid dissociation constant(s) of the ligand, complex formation constants) are entered
into the input mask.
HySS version 4.0.31 was used in this work.
Methods
50
Parallel Factor Analysis (PARAFAC). PARAFAC is a multi-way decomposition method. More than two
dimensions can occur in a data set and can be analyzed. This is a great advantage of this method and
makes the resulting data more meaningful, robust and precise. In the context of this work this method
was successfully applied in the analysis of spectroscopic data to identify and characterize species in a
system [138]–[140]. For instance, the amount of species in a system, spectra of single species, lifetimes
of species and species distribution can be derived from time-resolved luminescence data. The
mathematical background is described in various works [141], [142], [138] and references therein.
Results and Discussion
51
4 Results and Discussion
This chapter summarizes the results obtained in the Eu(III)-(poly)borate and Eu(III)-organoborate
systems. It includes the description of the Eu(III)-borate complexation and quantification of the
complexation constant for the general complex EuB(OR)42+ (ligand: borate species ─ (poly)borates,
organoborates ─ with one binding site), and of the formation of a Eu(III)-borate solid (precipitation
conditions, formation of colloid-like particles, structure information). In parts the results and their
discussion are published in two articles of Schott et al. [108], [143].
4.1 The system Eu(III)-B(OH)3-polyborates
This chapter treats the investigations in the system Eu(III)-B(OH)3-(poly)borates: complexation studies,
the formation of a Eu(III)-borate solid and its structural characterization.
4.1.1 11B NMR spectroscopy of B(OH)3-polyborate containing solutions
The aqueous B(OH)3-(poly)borate speciation is an essential prerequisite to interpret the observed
complexation and solid formation when Eu(III) is present in the B(OH)3-polyborate system.
11B NMR is well applicable to identify (poly)borate species in aqueous solution (see chapter 2.3.1 and
3.2.2). Since the nucleus is sensitive to its local electronic environment, the threefold and fourfold
coordinated boron atoms can be distinguished easily by their well separated NMR signals. The
assignment of 11B NMR signals to respective polyborate species is taken from literature [57], [59],
[144].
The polyborate speciation studies at pHc 5 and pHc 6, at low ionic strength ([NaCl/NaClO4] = const. =
0.1 m, Im ≈ 0.1 mXI) were complemented with studies at higher ionic strengths up to Im = 3 m
(NaCl/NaClO4).
At pHc 5 and up to [B]total = 0.5 m, Im = 0.1 m (NaCl/NaClO4), no polyborate species were detected by
11B NMR (Fig. 15a). The only boron species found was the undissociated boric acid at δ = 19.4 ppm.
Above [B]total = 0.5 m a small 11B NMR signal at 1.2 ppm, displaying a further boron species, occurs. At
XI maximum ionic strength, if [B]total = 0.7 m: Im = 0.5 · ([Na+] · 1² + [Cl−/ClO4
−] · (-1)² + [Na+] · 1² + [B(OR)4−] · (-1)²)
= 0.5 · (0.1 m + 0.1 m + 0.025 m + 0.025 m) = 0.125 m = Im,max
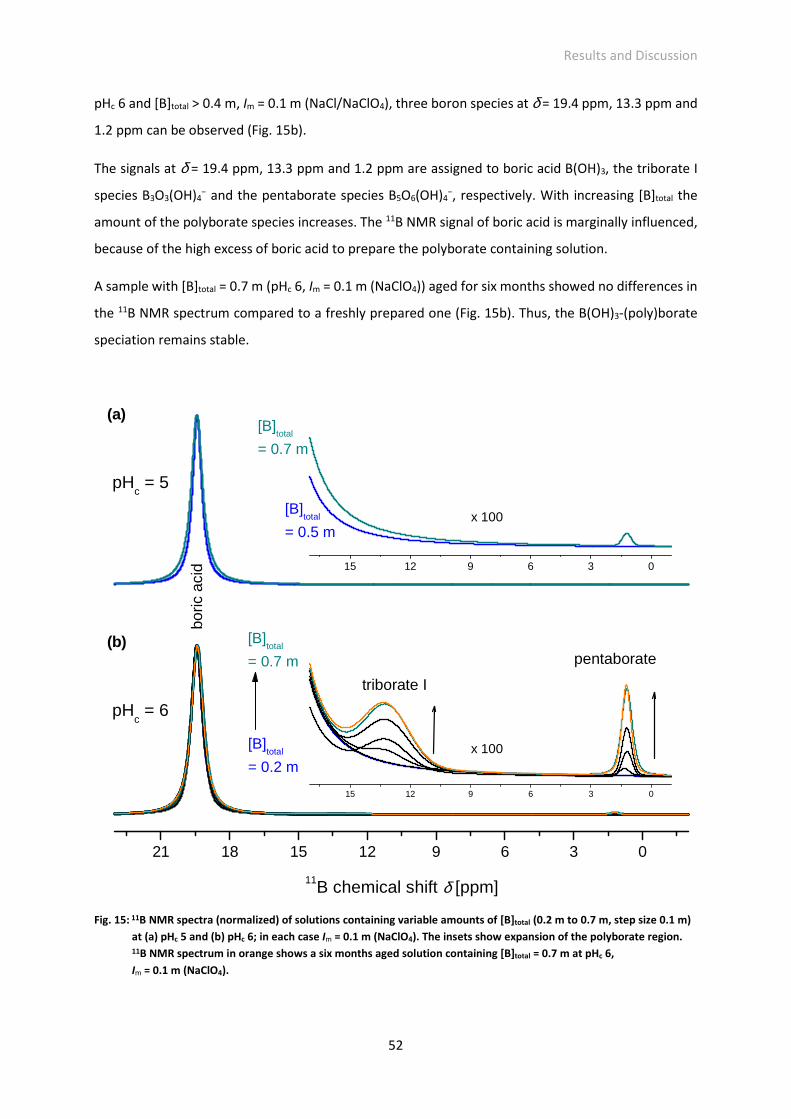
Results and Discussion
52
pHc 6 and [B]total > 0.4 m, Im = 0.1 m (NaCl/NaClO4), three boron species at δ = 19.4 ppm, 13.3 ppm and
1.2 ppm can be observed (Fig. 15b).
The signals at δ = 19.4 ppm, 13.3 ppm and 1.2 ppm are assigned to boric acid B(OH)3, the triborate I
species B3O3(OH)4− and the pentaborate species B5O6(OH)4
−, respectively. With increasing [B]total the
amount of the polyborate species increases. The 11B NMR signal of boric acid is marginally influenced,
because of the high excess of boric acid to prepare the polyborate containing solution.
A sample with [B]total = 0.7 m (pHc 6, Im = 0.1 m (NaClO4)) aged for six months showed no differences in
the 11B NMR spectrum compared to a freshly prepared one (Fig. 15b). Thus, the B(OH)3-(poly)borate
speciation remains stable.
Fig. 15: 11B NMR spectra (normalized) of solutions containing variable amounts of [B]total (0.2 m to 0.7 m, step size 0.1 m)
at (a) pHc 5 and (b) pHc 6; in each case Im = 0.1 m (NaClO4). The insets show expansion of the polyborate region. 11B NMR spectrum in orange shows a six months aged solution containing [B]total = 0.7 m at pHc 6,
Im = 0.1 m (NaClO4).
21 18 15 12 9 6 3 0
15 12 9 6 3 0
15 12 9 6 3 0
pentaborate
triborate I
boric
aci
d
pHc = 6
11B chemical shift δ [ppm]
(b)
(a)
pHc = 5
[B]total
= 0.2 m
[B]total
= 0.7 m
[B]total
= 0.5 m
x 100
[B]total
= 0.7 m
x 100
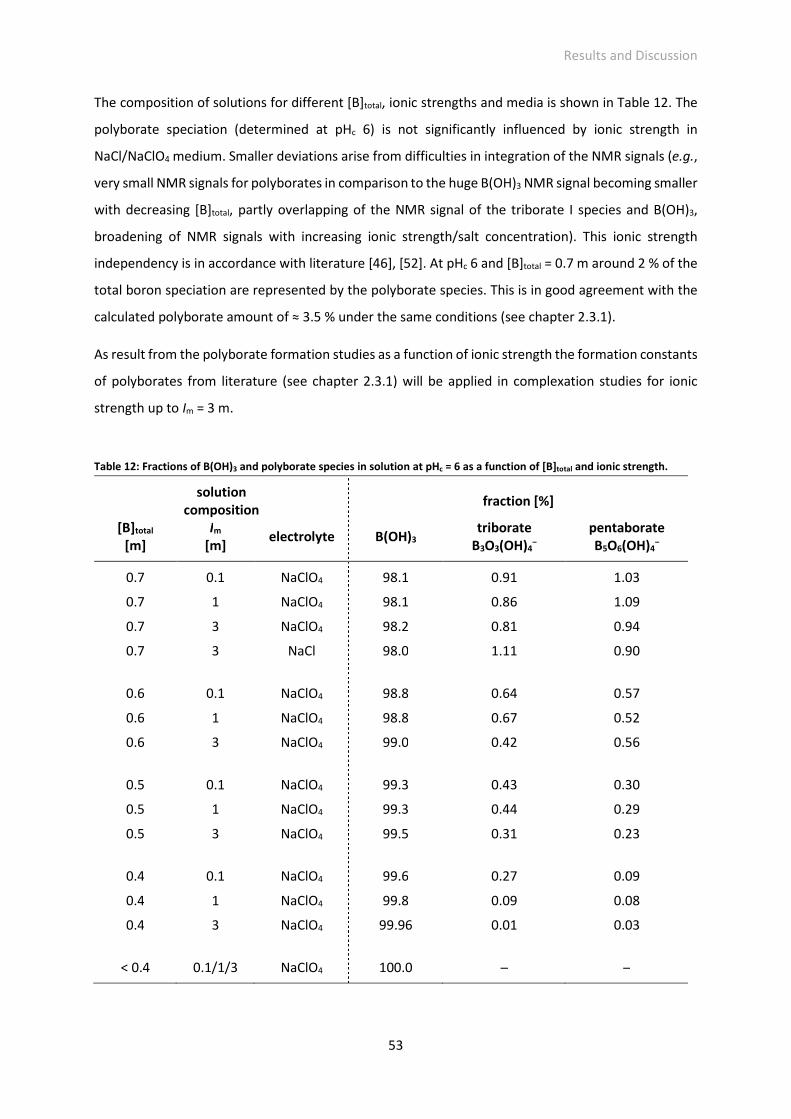
Results and Discussion
53
The composition of solutions for different [B]total, ionic strengths and media is shown in Table 12. The
polyborate speciation (determined at pHc 6) is not significantly influenced by ionic strength in
NaCl/NaClO4 medium. Smaller deviations arise from difficulties in integration of the NMR signals (e.g.,
very small NMR signals for polyborates in comparison to the huge B(OH)3 NMR signal becoming smaller
with decreasing [B]total, partly overlapping of the NMR signal of the triborate I species and B(OH)3,
broadening of NMR signals with increasing ionic strength/salt concentration). This ionic strength
independency is in accordance with literature [46], [52]. At pHc 6 and [B]total = 0.7 m around 2 % of the
total boron speciation are represented by the polyborate species. This is in good agreement with the
calculated polyborate amount of ≈ 3.5 % under the same conditions (see chapter 2.3.1).
As result from the polyborate formation studies as a function of ionic strength the formation constants
of polyborates from literature (see chapter 2.3.1) will be applied in complexation studies for ionic
strength up to Im = 3 m.
Table 12: Fractions of B(OH)3 and polyborate species in solution at pHc = 6 as a function of [B]total and ionic strength.
solution composition
fraction [%]
[B]total [m]
Im [m]
electrolyte B(OH)3 triborate
B3O3(OH)4−
pentaborate B5O6(OH)4
−
0.7 0.1 NaClO4 98.1 0.91 1.03
0.7 1 NaClO4 98.1 0.86 1.09
0.7 3 NaClO4 98.2 0.81 0.94
0.7 3 NaCl 98.0 1.11 0.90
0.6 0.1 NaClO4 98.8 0.64 0.57
0.6 1 NaClO4 98.8 0.67 0.52
0.6 3 NaClO4 99.0 0.42 0.56
0.5 0.1 NaClO4 99.3 0.43 0.30
0.5 1 NaClO4 99.3 0.44 0.29
0.5 3 NaClO4 99.5 0.31 0.23
0.4 0.1 NaClO4 99.6 0.27 0.09
0.4 1 NaClO4 99.8 0.09 0.08
0.4 3 NaClO4 99.96 0.01 0.03
< 0.4 0.1/1/3 NaClO4 100.0 ─ ─
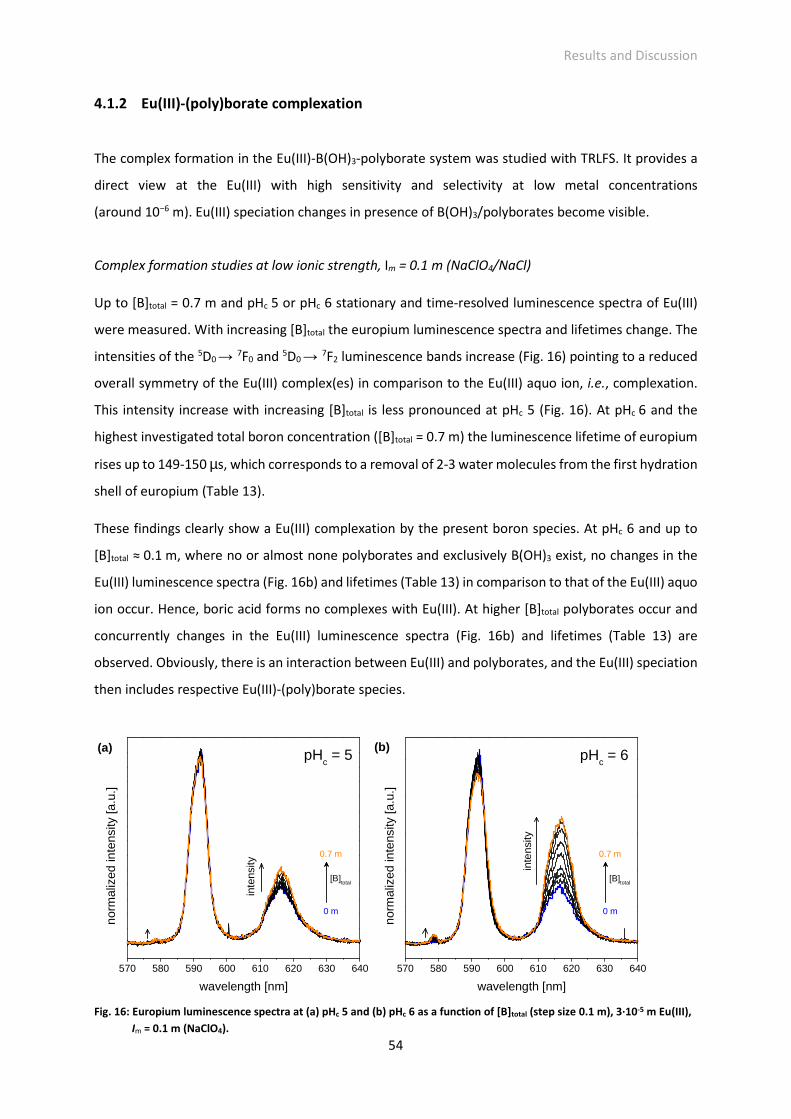
Results and Discussion
54
4.1.2 Eu(III)-(poly)borate complexation
The complex formation in the Eu(III)-B(OH)3-polyborate system was studied with TRLFS. It provides a
direct view at the Eu(III) with high sensitivity and selectivity at low metal concentrations
(around 10−6 m). Eu(III) speciation changes in presence of B(OH)3/polyborates become visible.
Complex formation studies at low ionic strength, Im = 0.1 m (NaClO4/NaCl)
Up to [B]total = 0.7 m and pHc 5 or pHc 6 stationary and time-resolved luminescence spectra of Eu(III)
were measured. With increasing [B]total the europium luminescence spectra and lifetimes change. The
intensities of the 5D0 → 7F0 and 5D0 → 7F2 luminescence bands increase (Fig. 16) pointing to a reduced
overall symmetry of the Eu(III) complex(es) in comparison to the Eu(III) aquo ion, i.e., complexation.
This intensity increase with increasing [B]total is less pronounced at pHc 5 (Fig. 16). At pHc 6 and the
highest investigated total boron concentration ([B]total = 0.7 m) the luminescence lifetime of europium
rises up to 149-150 µs, which corresponds to a removal of 2-3 water molecules from the first hydration
shell of europium (Table 13).
These findings clearly show a Eu(III) complexation by the present boron species. At pHc 6 and up to
[B]total ≈ 0.1 m, where no or almost none polyborates and exclusively B(OH)3 exist, no changes in the
Eu(III) luminescence spectra (Fig. 16b) and lifetimes (Table 13) in comparison to that of the Eu(III) aquo
ion occur. Hence, boric acid forms no complexes with Eu(III). At higher [B]total polyborates occur and
concurrently changes in the Eu(III) luminescence spectra (Fig. 16b) and lifetimes (Table 13) are
observed. Obviously, there is an interaction between Eu(III) and polyborates, and the Eu(III) speciation
then includes respective Eu(III)-(poly)borate species.
Fig. 16: Europium luminescence spectra at (a) pHc 5 and (b) pHc 6 as a function of [B]total (step size 0.1 m), 3·10-5 m Eu(III),
Im = 0.1 m (NaClO4).
570 580 590 600 610 620 630 640
inte
nsity
inte
nsity
norm
aliz
ed in
tens
ity [a
.u.]
wavelength [nm]
0.7 m
0 m
[B]total
0.7 m
0 m
[B]total
570 580 590 600 610 620 630 640
(b)pHc = 6
norm
aliz
ed in
tens
ity [a
.u.]
wavelength [nm]
pHc = 5(a)
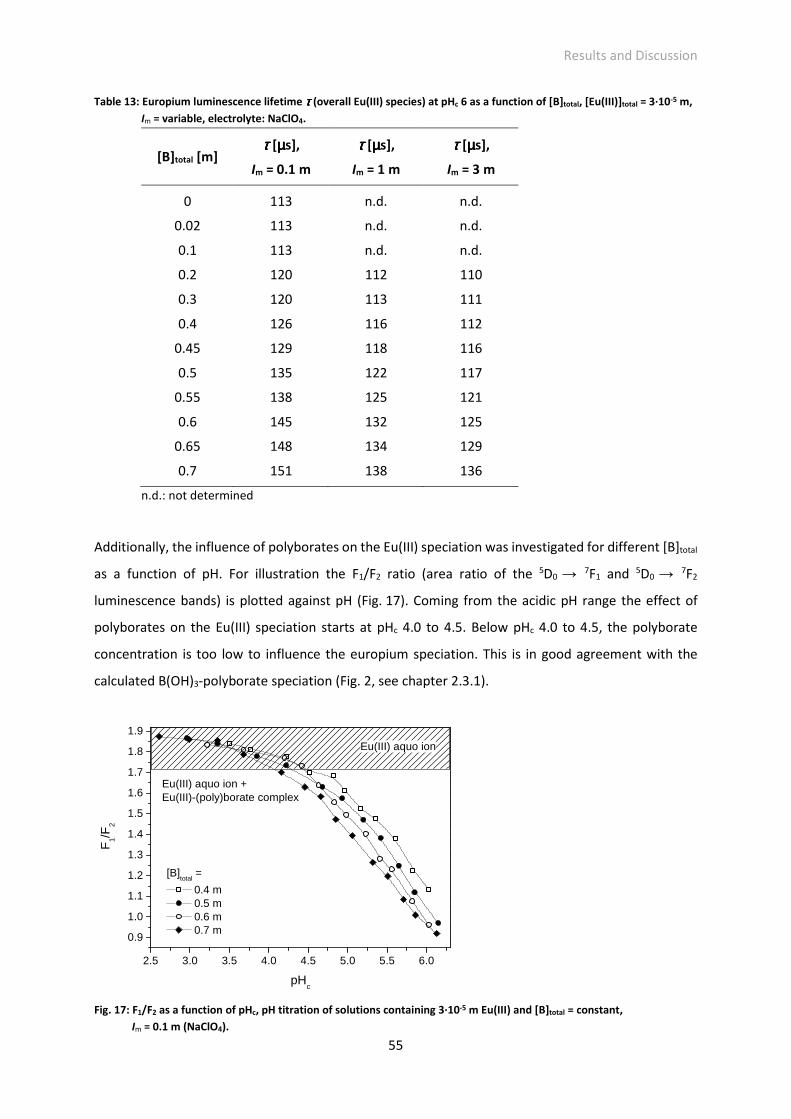
Results and Discussion
55
Table 13: Europium luminescence lifetime ττττ (overall Eu(III) species) at pHc 6 as a function of [B]total, [Eu(III)]total = 3·10-5 m,
Im = variable, electrolyte: NaClO4.
[B]total [m] ττττ [µµµµs],
Im = 0.1 m
ττττ [µµµµs],
Im = 1 m ττττ [µµµµs],
Im = 3 m
0 113 n.d. n.d.
0.02 113 n.d. n.d.
0.1 113 n.d. n.d.
0.2 120 112 110
0.3 120 113 111
0.4 126 116 112
0.45 129 118 116
0.5 135 122 117
0.55 138 125 121
0.6 145 132 125
0.65 148 134 129
0.7 151 138 136
n.d.: not determined
Additionally, the influence of polyborates on the Eu(III) speciation was investigated for different [B]total
as a function of pH. For illustration the F1/F2 ratio (area ratio of the 5D0 → 7F1 and 5D0 → 7F2
luminescence bands) is plotted against pH (Fig. 17). Coming from the acidic pH range the effect of
polyborates on the Eu(III) speciation starts at pHc 4.0 to 4.5. Below pHc 4.0 to 4.5, the polyborate
concentration is too low to influence the europium speciation. This is in good agreement with the
calculated B(OH)3-polyborate speciation (Fig. 2, see chapter 2.3.1).
Fig. 17: F1/F2 as a function of pHc, pH titration of solutions containing 3·10-5 m Eu(III) and [B]total = constant,
Im = 0.1 m (NaClO4).
2.5 3.0 3.5 4.0 4.5 5.0 5.5 6.0
0.9
1.0
1.1
1.2
1.3
1.4
1.5
1.6
1.7
1.8
1.9
Eu(III) aquo ion +Eu(III)-(poly)borate complex
F1/F
2
pHc
[B]total
=
0.4 m 0.5 m 0.6 m 0.7 m
Eu(III) aquo ion
Results and Discussion
56
The data sets of the series with variable [B]total (pHc = constant) and pH titration series ([B]total =
constant) were used to determine a complexation constant, at least its order of magnitude, of the
Eu(III)-(poly)borate species. This, however, proved to be difficult, because all polyborate equilibria
(also those beyond pHc 6) intertwine and several polyborates coexist. The mathematical deconvolution
and separation of single Eu(III)-polyborate complexes was not possible.
The polyborates existing up to pHc 6, i.e., triborate I B3O3(OH)4− and pentaborate B5O6(OH)4
−, are
summarized to one model borate species “B(OR)4−“ (see chapter 2.4 for explanation). Its concentration
is the sum of the concentrations of all the (poly)borate species under the respective conditions.
Depending on pH and [B]total this sum was calculated from the speciation data of Ingri et al. [46], [48].
This approach is warrantable, because DFT calculations confirm a comparable behavior of various
borate species regarding the Eu(III) complexation (see chapter 2.4) [108]. Furthermore, the PARAFAC
of the europium TRLFS data as a function of [B]total showed that until [B]total = 0.7 m only the Eu(III) aquo
ion and one europium complex exist. This means: (1) The model borate species “B(OR)4−“ as sum of
several polyborate species is verified, and (2) only the formation of the 1:1 Eu(III)-borate complex,
EuB(OR)42+ (borate ligand with one binding site), has to be considered, Eq. 44:
Eu3+ + B(OR)4− EuB(OR)4
2+ (44)
According to Eq. 44, the complexation constant for the EuB(OR)42+ complex is expressed in Eq. 45:
�Q = [EuB(OR)4
2+]
[Eu3+][B(OR)4-]
(45)
The analysis of the spectroscopic data with the program HypSpec [136] yielded the average complex
formation constants for the Eu(III)-borate complex, EuB(OR)42+, Table 14:
Table 14: Average lg ββββ1,m (Im = 0.1 m (NaClO4/NaCl)) and corresponding lg ββββ01 (extrapolation to infinite dilution according
to Davies approach [37]) of the Eu(III)-borate complex, EuB(OR)42+ (borate ligand with one binding site) according
to Eq. 45. T = 22 °C. Uncertainty: 2σσσσ.
lg ββββ1,m lg ββββ00001 remark
2.02 ± 0.3 2.66 ± 0.3 from pH titration data sets (Table A-3, see appendix)
2.58 ± 0.05 3.22 ± 0.05 from data sets with variable [B]total (Table A-3, see appendix)
These averages were calculated based on single values for lg β1,m from different data sets as given in
Table A-3 (see appendix).
For the pH titration data sets an averaged value of lg β01 = 2.7 ± 0.3 (2σ) and for the data sets with
variable [B]total an averaged value of lg β01 = 3.2 ± 0.05 (2σ) were determined. Both values differ slightly.
Results and Discussion
57
Maybe, in the pH titration series a kinetic effect in the polyborate back formation (titration with acid)
plays a role. However, to illustrate the order of magnitude of the Eu(III)-borate complexation constant
these values are combined to yield lg β01 = 2.7 to 3.2. It demonstrates that this complex is quite weak.
The only published value to compare with the result of this work is the complexation constant for a
1:1 Nd(III)-(tetra)borate complex with lg β0 = 4.55 determined in solubility experiments [9]. This
constant differs from the result of this work, which might have various reasons:
The supposed borate speciation published by Borkowski et al. seems to be more complicated.
Na2B4O7·10H2O was used in their work to prepare tetraborate containing solutions. But it is known that
Na2B4O7 is not stable in aqueous solution and dissociates into B(OH)3 and B(OH)4− (see chapter 2.3.1).
From the B(OH)3 and B(OH)4− species under their used conditions (up to 0.16 M [B]total, pHc = 8.6)
several polyborate equilibria arise (see chapter 2.3.1). Therefore, the borate speciation would involve
more polyborate species (mainly B(OH)4−, B3O3(OH)4
−, B4O5(OH)42-) than the only supposed tetraborate
species. Even if the initial tetraborate concentration is low, due to the dissociation of the tetraborate
molecule more complexing monoborate molecules (B(OH)4−) are generated than expected under the
used conditions. Both would lead to an underestimation of the effective (poly)borate concentration in
their experiments. Then, the reported complexation constant for this Nd(III)-(tetra)borate complex
would be smaller.
Independent from the previous argumentation and assuming that the tetraborate is stable this borate
species has in principle two binding sites (two “B(OR)4− units) to interact with metal ions (not only one
binding site as the postulated species “HB4O7−“). This would lead to two conclusions: (1) The 1:1 Nd(III)
complex with tetraborate is probably stronger (a kind of chelate complex), than the complexes with
polyborates containing only one binding site, as investigated in this work, or (2) as argued above the
effective borate concentration is underestimated, leading to a smaller complexation constant.
However, the results of Borkowski et al. could not be reproduced. Hinz et al. also carried out Nd(OH)3
solubility experiments in presence of borate species under the same conditions. They observed a clear
solubility decrease of Nd(III) in presence of (poly)borate species [18]. This is contradictory to the results
of Borkowski et al. and indicates the formation of a further solid phase in which borates are involved.
The Eu(III)-(poly)borate complexation constant (lg β01 = 2.7 to 3.2) of this work seems to be reliable for
different reasons:
(1) The complexation studies were carried out under less difficult conditions (avoiding of the strong
Eu(III) hydrolysis, simplification of the polyborate speciation).
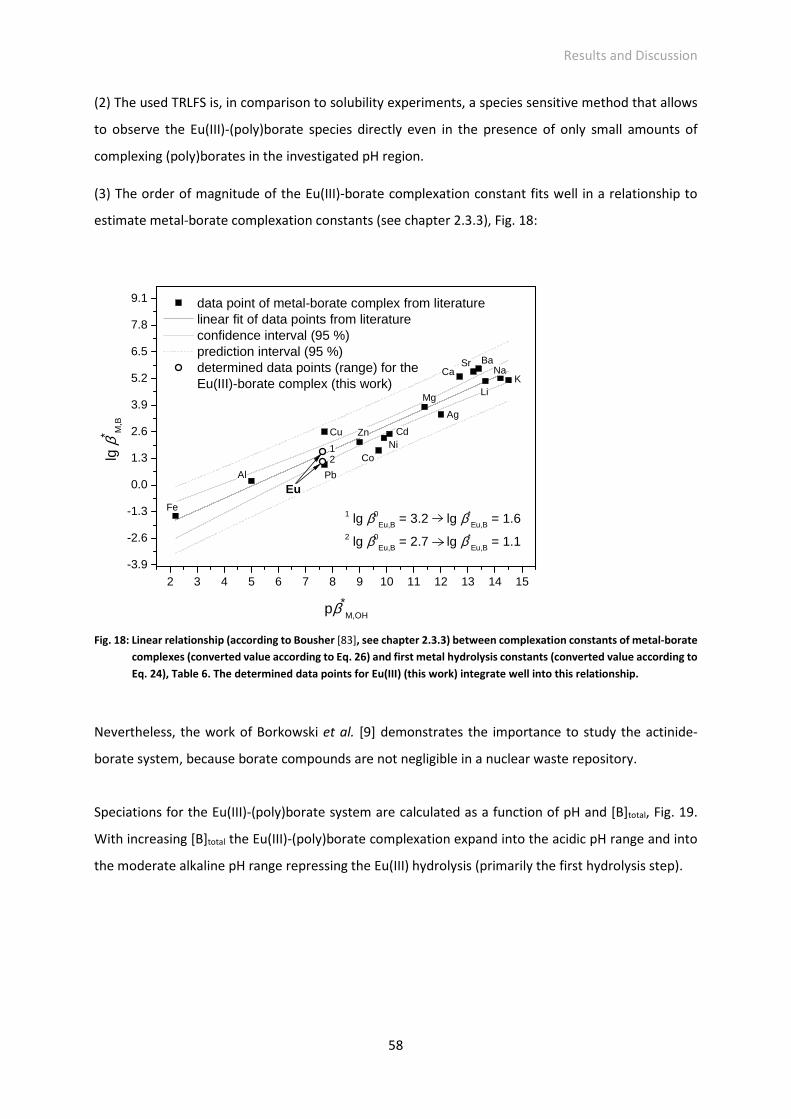
Results and Discussion
58
(2) The used TRLFS is, in comparison to solubility experiments, a species sensitive method that allows
to observe the Eu(III)-(poly)borate species directly even in the presence of only small amounts of
complexing (poly)borates in the investigated pH region.
(3) The order of magnitude of the Eu(III)-borate complexation constant fits well in a relationship to
estimate metal-borate complexation constants (see chapter 2.3.3), Fig. 18:
Fig. 18: Linear relationship (according to Bousher [83], see chapter 2.3.3) between complexation constants of metal-borate
complexes (converted value according to Eq. 26) and first metal hydrolysis constants (converted value according to
Eq. 24), Table 6. The determined data points for Eu(III) (this work) integrate well into this relationship.
Nevertheless, the work of Borkowski et al. [9] demonstrates the importance to study the actinide-
borate system, because borate compounds are not negligible in a nuclear waste repository.
Speciations for the Eu(III)-(poly)borate system are calculated as a function of pH and [B]total, Fig. 19.
With increasing [B]total the Eu(III)-(poly)borate complexation expand into the acidic pH range and into
the moderate alkaline pH range repressing the Eu(III) hydrolysis (primarily the first hydrolysis step).
2 3 4 5 6 7 8 9 10 11 12 13 14 15
-3.9
-2.6
-1.3
0.0
1.3
2.6
3.9
5.2
6.5
7.8
9.1
1 lg β0Eu,B
= 3.2 lg β*Eu,B
= 1.62 lg β0
Eu,B = 2.7 lg β*
Eu,B = 1.1
21
Eu
KNa
Li
BaSrCa
Ag
Mg
CdNi
Co
Zn
Pb
Cu
Al
data point of metal-borate complex from literature linear fit of data points from literature confidence interval (95 %) prediction interval (95 %) determined data points (range) for the
Eu(III)-borate complex (this work)
lg β
* M,B
pβ*M,OH
Fe
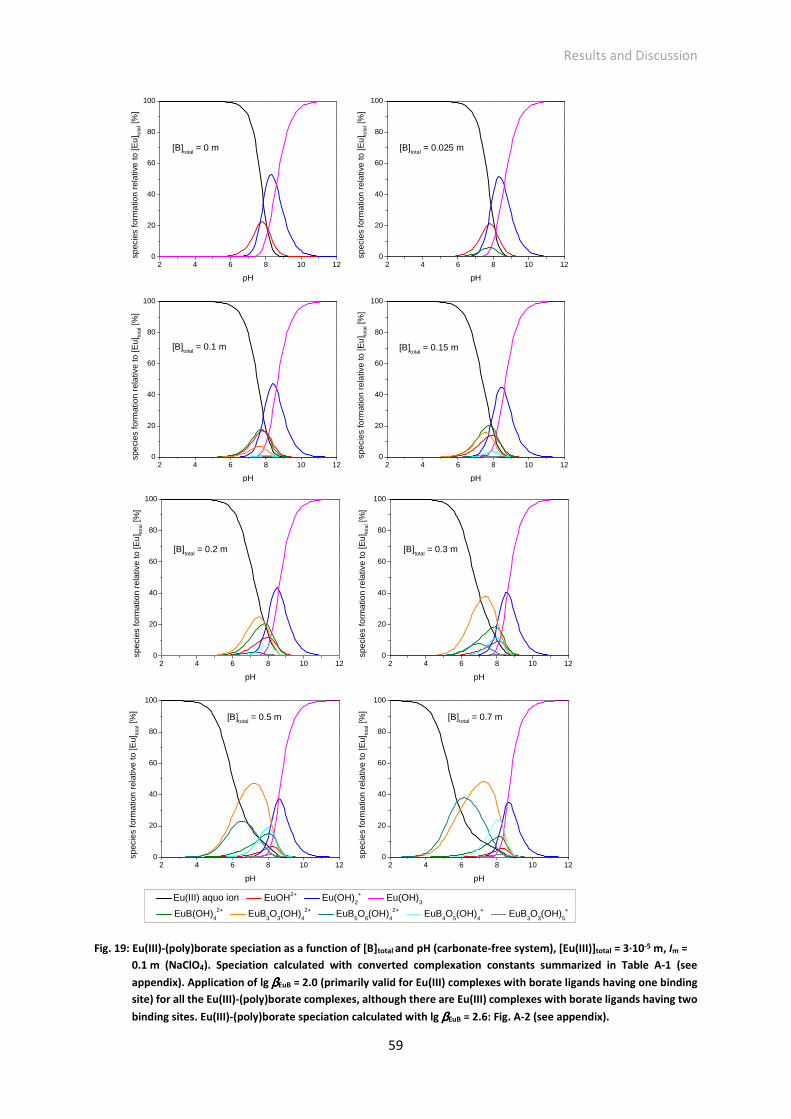
Results and Discussion
59
Fig. 19: Eu(III)-(poly)borate speciation as a function of [B]total and pH (carbonate-free system), [Eu(III)]total = 3·10-5 m, Im =
0.1 m (NaClO4). Speciation calculated with converted complexation constants summarized in Table A-1 (see
appendix). Application of lg ββββEuB = 2.0 (primarily valid for Eu(III) complexes with borate ligands having one binding
site) for all the Eu(III)-(poly)borate complexes, although there are Eu(III) complexes with borate ligands having two
binding sites. Eu(III)-(poly)borate speciation calculated with lg ββββEuB = 2.6: Fig. A-2 (see appendix).
2 4 6 8 10 120
20
40
60
80
100
[B]total
= 0 m
spec
ies
form
atio
n re
lativ
e to
[Eu]
tota
l [%
]
pH
2 4 6 8 10 120
20
40
60
80
100
[B]total
= 0.025 m
spec
ies
form
atio
n re
lativ
e to
[Eu]
tota
l [%
]
pH
2 4 6 8 10 120
20
40
60
80
100
[B]total
= 0.15 m[B]total
= 0.1 m
spec
ies
form
atio
n re
lativ
e to
[Eu]
tota
l [%
]
pH
2 4 6 8 10 120
20
40
60
80
100
spec
ies
form
atio
n re
lativ
e to
[Eu]
tota
l [%
]
pH
2 4 6 8 10 120
20
40
60
80
100
spec
ies
form
atio
n re
lativ
e to
[Eu]
tota
l [%
]
pH
2 4 6 8 10 120
20
40
60
80
100
spec
ies
form
atio
n re
lativ
e to
[Eu]
tota
l [%
]
pH
2 4 6 8 10 120
20
40
60
80
100
spec
ies
form
atio
n re
lativ
e to
[Eu]
tota
l [%
]
pH
2 4 6 8 10 120
20
40
60
80
100
[B]total
= 0.3 m[B]total
= 0.2 m
[B]total
= 0.5 m
Eu(III) aquo ion EuOH2+ Eu(OH)
2+ Eu(OH)
3
EuB(OH)42+
EuB3O
3(OH)
42+
EuB5O
6(OH)
42+
EuB4O
5(OH)
4+ EuB
3O
3(OH)
5+
spec
ies
form
atio
n re
lativ
e to
[Eu]
tota
l [%
]
pH
[B]total = 0.7 m
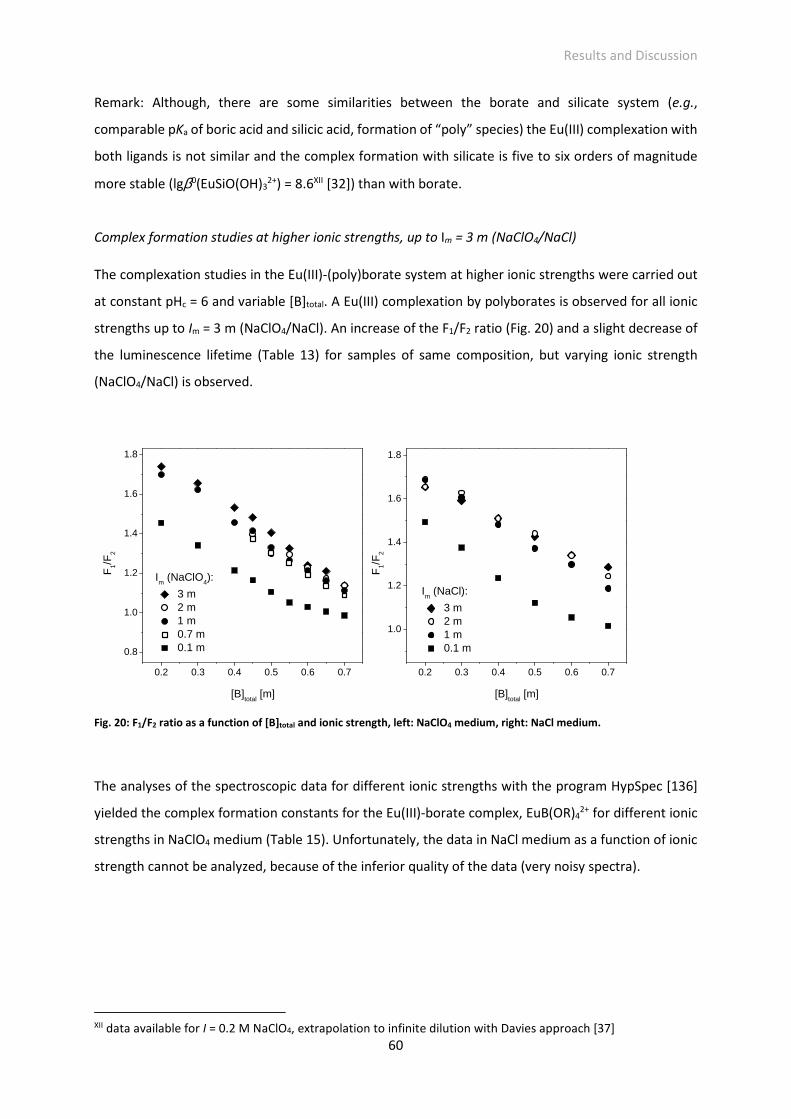
Results and Discussion
60
Remark: Although, there are some similarities between the borate and silicate system (e.g.,
comparable pKa of boric acid and silicic acid, formation of “poly” species) the Eu(III) complexation with
both ligands is not similar and the complex formation with silicate is five to six orders of magnitude
more stable (lgβ0(EuSiO(OH)32+) = 8.6XII [32]) than with borate.
Complex formation studies at higher ionic strengths, up to Im = 3 m (NaClO4/NaCl)
The complexation studies in the Eu(III)-(poly)borate system at higher ionic strengths were carried out
at constant pHc = 6 and variable [B]total. A Eu(III) complexation by polyborates is observed for all ionic
strengths up to Im = 3 m (NaClO4/NaCl). An increase of the F1/F2 ratio (Fig. 20) and a slight decrease of
the luminescence lifetime (Table 13) for samples of same composition, but varying ionic strength
(NaClO4/NaCl) is observed.
Fig. 20: F1/F2 ratio as a function of [B]total and ionic strength, left: NaClO4 medium, right: NaCl medium.
The analyses of the spectroscopic data for different ionic strengths with the program HypSpec [136]
yielded the complex formation constants for the Eu(III)-borate complex, EuB(OR)42+ for different ionic
strengths in NaClO4 medium (Table 15). Unfortunately, the data in NaCl medium as a function of ionic
strength cannot be analyzed, because of the inferior quality of the data (very noisy spectra).
XII data available for I = 0.2 M NaClO4, extrapolation to infinite dilution with Davies approach [37]
0.2 0.3 0.4 0.5 0.6 0.7
0.8
1.0
1.2
1.4
1.6
1.8
F1/
F2
[B]total
[m]
Im (NaClO
4):
3 m 2 m 1 m 0.7 m 0.1 m
0.2 0.3 0.4 0.5 0.6 0.7
1.0
1.2
1.4
1.6
1.8
F1/
F2
[B]total
[m]
Im (NaCl):
3 m 2 m 1 m 0.1 m
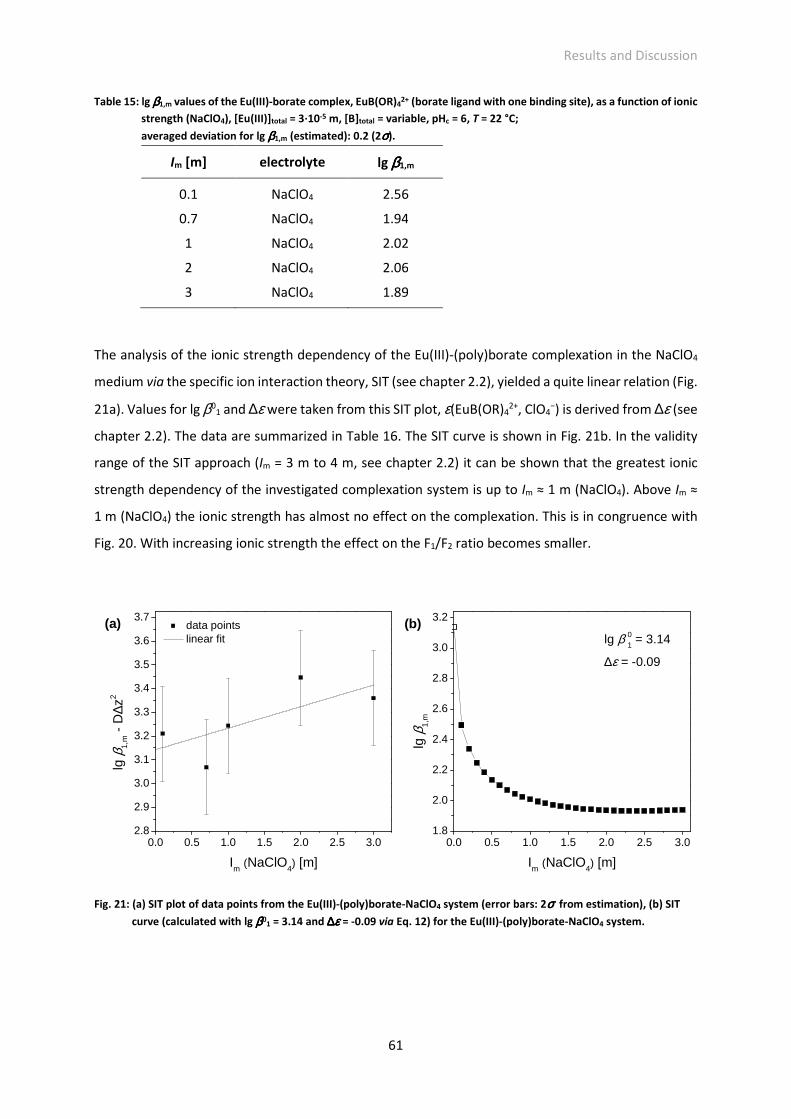
Results and Discussion
61
Table 15: lg ββββ1,m values of the Eu(III)-borate complex, EuB(OR)42+ (borate ligand with one binding site), as a function of ionic
strength (NaClO4), [Eu(III)]total = 3·10-5 m, [B]total = variable, pHc = 6, T = 22 °C;
averaged deviation for lg ββββ1,m (estimated): 0.2 (2σσσσ).
Im [m] electrolyte lg ββββ1,m
0.1 NaClO4 2.56
0.7 NaClO4 1.94
1 NaClO4 2.02
2 NaClO4 2.06
3 NaClO4 1.89
The analysis of the ionic strength dependency of the Eu(III)-(poly)borate complexation in the NaClO4
medium via the specific ion interaction theory, SIT (see chapter 2.2), yielded a quite linear relation (Fig.
21a). Values for lg β01 and ∆ε were taken from this SIT plot, ε(EuB(OR)4
2+, ClO4−) is derived from ∆ε (see
chapter 2.2). The data are summarized in Table 16. The SIT curve is shown in Fig. 21b. In the validity
range of the SIT approach (Im = 3 m to 4 m, see chapter 2.2) it can be shown that the greatest ionic
strength dependency of the investigated complexation system is up to Im ≈ 1 m (NaClO4). Above Im ≈
1 m (NaClO4) the ionic strength has almost no effect on the complexation. This is in congruence with
Fig. 20. With increasing ionic strength the effect on the F1/F2 ratio becomes smaller.
Fig. 21: (a) SIT plot of data points from the Eu(III)-(poly)borate-NaClO4 system (error bars: 2σσσσ from estimation), (b) SIT
curve (calculated with lg ββββ01 = 3.14 and ∆∆∆∆εεεε = -0.09 via Eq. 12) for the Eu(III)-(poly)borate-NaClO4 system.
0.0 0.5 1.0 1.5 2.0 2.5 3.02.8
2.9
3.0
3.1
3.2
3.3
3.4
3.5
3.6
3.7
data points linear fit
lg β
1,m -
D∆z
2
Im (NaClO
4) [m]
0.0 0.5 1.0 1.5 2.0 2.5 3.01.8
2.0
2.2
2.4
2.6
2.8
3.0
3.2(b)
lg β
1,m
Im (NaClO4) [m]
lg β 01 = 3.14
∆ε = -0.09
(a)
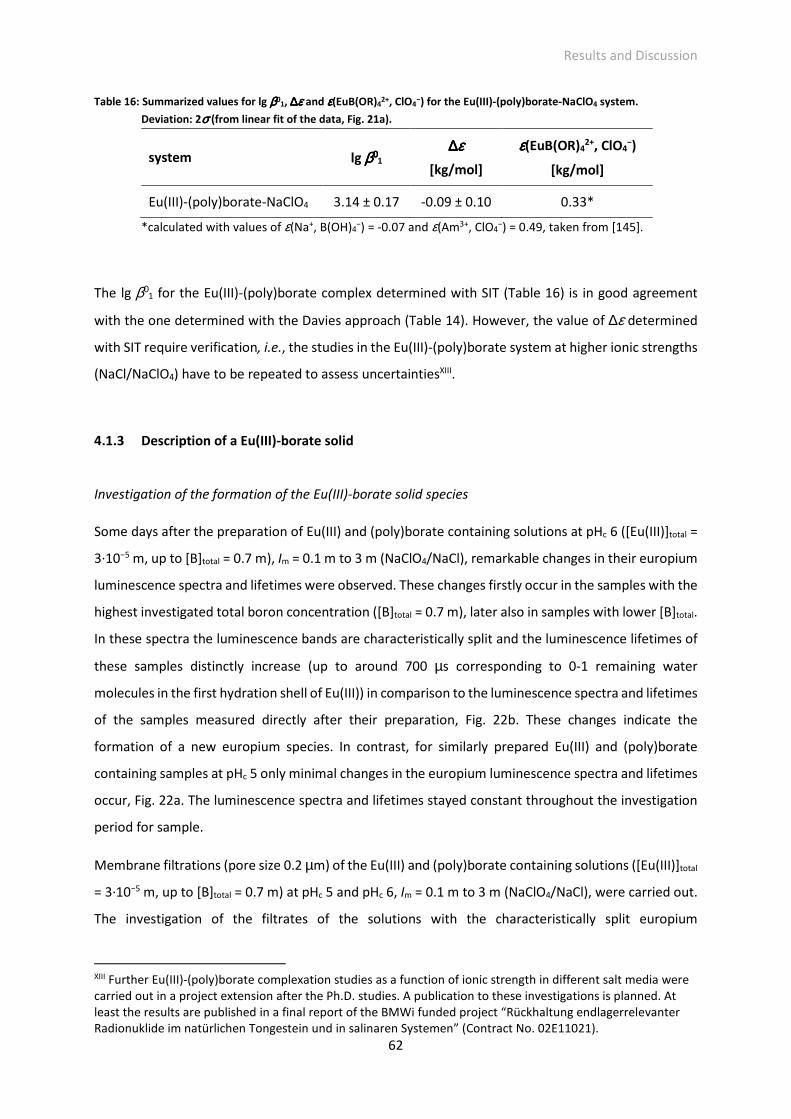
Results and Discussion
62
Table 16: Summarized values for lg ββββ01, ∆∆∆∆εεεε and εεεε(EuB(OR)4
2+, ClO4−) for the Eu(III)-(poly)borate-NaClO4 system.
Deviation: 2σσσσ (from linear fit of the data, Fig. 21a).
system lg ββββ00001
∆∆∆∆εεεε
[kg/mol]
εεεε(EuB(OR)42+, ClO4
−)
[kg/mol]
Eu(III)-(poly)borate-NaClO4 3.14 ± 0.17 -0.09 ± 0.10 0.33*
*calculated with values of ε(Na+, B(OH)4−) = -0.07 and ε(Am3+, ClO4
−) = 0.49, taken from [145].
The lg β01 for the Eu(III)-(poly)borate complex determined with SIT (Table 16) is in good agreement
with the one determined with the Davies approach (Table 14). However, the value of ∆ε determined
with SIT require verification, i.e., the studies in the Eu(III)-(poly)borate system at higher ionic strengths
(NaCl/NaClO4) have to be repeated to assess uncertaintiesXIII.
4.1.3 Description of a Eu(III)-borate solid
Investigation of the formation of the Eu(III)-borate solid species
Some days after the preparation of Eu(III) and (poly)borate containing solutions at pHc 6 ([Eu(III)]total =
3·10−5 m, up to [B]total = 0.7 m), Im = 0.1 m to 3 m (NaClO4/NaCl), remarkable changes in their europium
luminescence spectra and lifetimes were observed. These changes firstly occur in the samples with the
highest investigated total boron concentration ([B]total = 0.7 m), later also in samples with lower [B]total.
In these spectra the luminescence bands are characteristically split and the luminescence lifetimes of
these samples distinctly increase (up to around 700 µs corresponding to 0-1 remaining water
molecules in the first hydration shell of Eu(III)) in comparison to the luminescence spectra and lifetimes
of the samples measured directly after their preparation, Fig. 22b. These changes indicate the
formation of a new europium species. In contrast, for similarly prepared Eu(III) and (poly)borate
containing samples at pHc 5 only minimal changes in the europium luminescence spectra and lifetimes
occur, Fig. 22a. The luminescence spectra and lifetimes stayed constant throughout the investigation
period for sample.
Membrane filtrations (pore size 0.2 µm) of the Eu(III) and (poly)borate containing solutions ([Eu(III)]total
= 3·10−5 m, up to [B]total = 0.7 m) at pHc 5 and pHc 6, Im = 0.1 m to 3 m (NaClO4/NaCl), were carried out.
The investigation of the filtrates of the solutions with the characteristically split europium
XIII Further Eu(III)-(poly)borate complexation studies as a function of ionic strength in different salt media were carried out in a project extension after the Ph.D. studies. A publication to these investigations is planned. At least the results are published in a final report of the BMWi funded project “Rückhaltung endlagerrelevanter Radionuklide im natürlichen Tongestein und in salinaren Systemen” (Contract No. 02E11021).
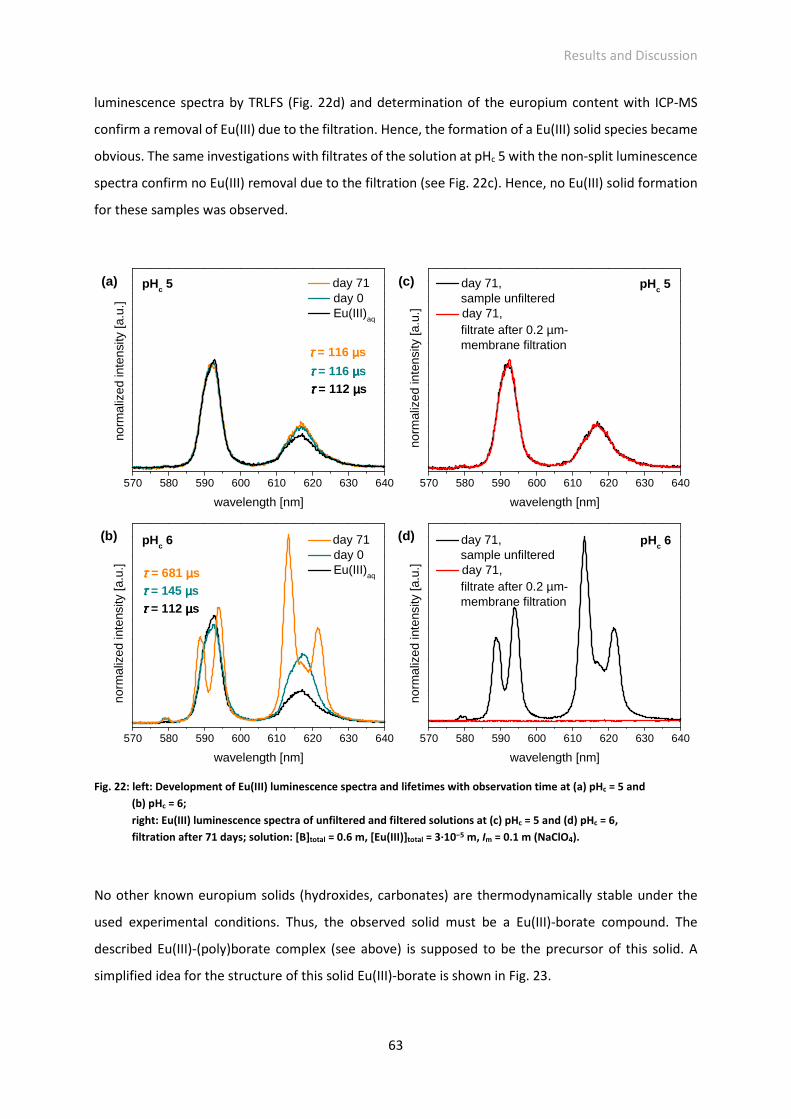
Results and Discussion
63
luminescence spectra by TRLFS (Fig. 22d) and determination of the europium content with ICP-MS
confirm a removal of Eu(III) due to the filtration. Hence, the formation of a Eu(III) solid species became
obvious. The same investigations with filtrates of the solution at pHc 5 with the non-split luminescence
spectra confirm no Eu(III) removal due to the filtration (see Fig. 22c). Hence, no Eu(III) solid formation
for these samples was observed.
Fig. 22: left: Development of Eu(III) luminescence spectra and lifetimes with observation time at (a) pHc = 5 and
(b) pHc = 6;
right: Eu(III) luminescence spectra of unfiltered and filtered solutions at (c) pHc = 5 and (d) pHc = 6,
filtration after 71 days; solution: [B]total = 0.6 m, [Eu(III)]total = 3·10−5 m, Im = 0.1 m (NaClO4).
No other known europium solids (hydroxides, carbonates) are thermodynamically stable under the
used experimental conditions. Thus, the observed solid must be a Eu(III)-borate compound. The
described Eu(III)-(poly)borate complex (see above) is supposed to be the precursor of this solid. A
simplified idea for the structure of this solid Eu(III)-borate is shown in Fig. 23.
570 580 590 600 610 620 630 640
ττττ = 116 µµµµs
ττττ = 681 µµµµsττττ = 145 µµµµs
ττττ = 116 µµµµs
day 71 day 0 Eu(III)
aq
pHc 6pHc 6
pHc 5
norm
aliz
ed in
tens
ity [a
.u.]
wavelength [nm]
day 71 day 0 Eu(III)
aq
pHc 5
ττττ = 112 µµµµs
570 580 590 600 610 620 630 640
(d)
(c)
(b) day 71, sample unfiltered
day 71, filtrate after 0.2 µm- membrane filtration
norm
aliz
ed in
tens
ity [a
.u.]
wavelength [nm]
day 71, sample unfiltered
day 71, filtrate after 0.2 µm- membrane filtration
(a)
570 580 590 600 610 620 630 640
norm
aliz
ed in
tens
ity [a
.u.]
wavelength [nm]
570 580 590 600 610 620 630 640
ττττ = 112 µµµµs
norm
aliz
ed in
tens
ity [a
.u.]
wavelength [nm]
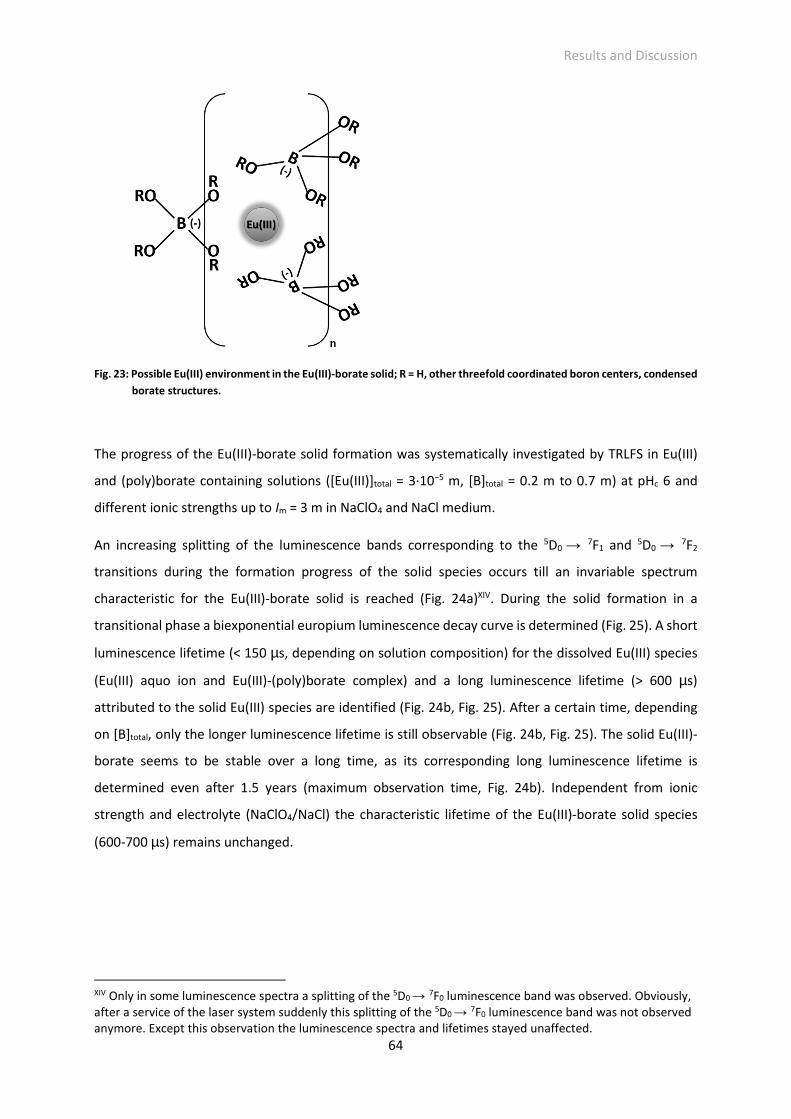
Results and Discussion
64
Fig. 23: Possible Eu(III) environment in the Eu(III)-borate solid; R = H, other threefold coordinated boron centers, condensed
borate structures.
The progress of the Eu(III)-borate solid formation was systematically investigated by TRLFS in Eu(III)
and (poly)borate containing solutions ([Eu(III)]total = 3·10−5 m, [B]total = 0.2 m to 0.7 m) at pHc 6 and
different ionic strengths up to Im = 3 m in NaClO4 and NaCl medium.
An increasing splitting of the luminescence bands corresponding to the 5D0 → 7F1 and 5D0 → 7F2
transitions during the formation progress of the solid species occurs till an invariable spectrum
characteristic for the Eu(III)-borate solid is reached (Fig. 24a)XIV. During the solid formation in a
transitional phase a biexponential europium luminescence decay curve is determined (Fig. 25). A short
luminescence lifetime (< 150 µs, depending on solution composition) for the dissolved Eu(III) species
(Eu(III) aquo ion and Eu(III)-(poly)borate complex) and a long luminescence lifetime (> 600 µs)
attributed to the solid Eu(III) species are identified (Fig. 24b, Fig. 25). After a certain time, depending
on [B]total, only the longer luminescence lifetime is still observable (Fig. 24b, Fig. 25). The solid Eu(III)-
borate seems to be stable over a long time, as its corresponding long luminescence lifetime is
determined even after 1.5 years (maximum observation time, Fig. 24b). Independent from ionic
strength and electrolyte (NaClO4/NaCl) the characteristic lifetime of the Eu(III)-borate solid species
(600-700 µs) remains unchanged.
XIV Only in some luminescence spectra a splitting of the 5D0 → 7F0 luminescence band was observed. Obviously, after a service of the laser system suddenly this splitting of the 5D0 → 7F0 luminescence band was not observed anymore. Except this observation the luminescence spectra and lifetimes stayed unaffected.
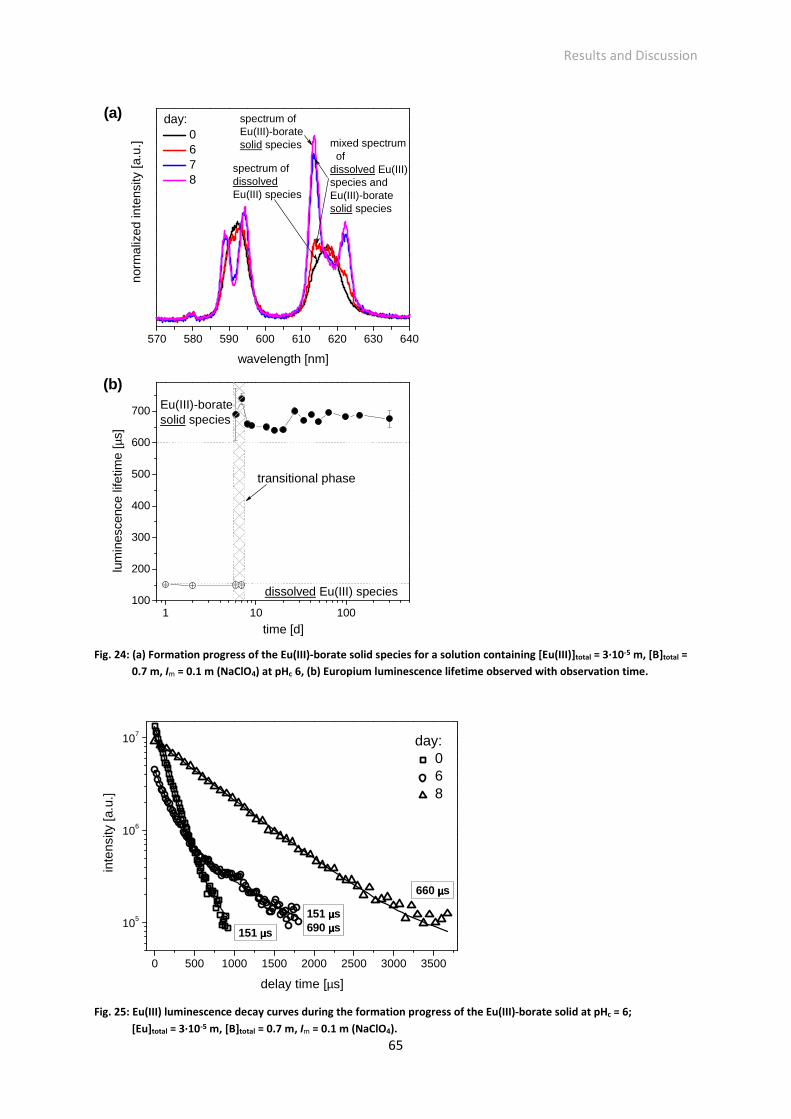
Results and Discussion
65
Fig. 24: (a) Formation progress of the Eu(III)-borate solid species for a solution containing [Eu(III)]total = 3·10-5 m, [B]total =
0.7 m, Im = 0.1 m (NaClO4) at pHc 6, (b) Europium luminescence lifetime observed with observation time.
Fig. 25: Eu(III) luminescence decay curves during the formation progress of the Eu(III)-borate solid at pHc = 6;
[Eu]total = 3·10-5 m, [B]total = 0.7 m, Im = 0.1 m (NaClO4).
570 580 590 600 610 620 630 640
transitional phase
dissolved Eu(III) species
Eu(III)-borate solid species
mixed spectrum of dissolved Eu(III)species and Eu(III)-borate solid species
spectrum of dissolvedEu(III) species
spectrum ofEu(III)-borate solid species
norm
aliz
ed in
tens
ity [a
.u.]
wavelength [nm]
day: 0 6 7 8
1 10 100100
200
300
400
500
600
700
(b)
lum
ines
cenc
e lif
etim
e [µ
s]
time [d]
(a)
0 500 1000 1500 2000 2500 3000 3500
105
106
107
660 µµµµs
151 µµµµs690 µµµµs
day: 0 6 8
inte
nsity
[a.u
.]
delay time [µs]
151 µµµµs
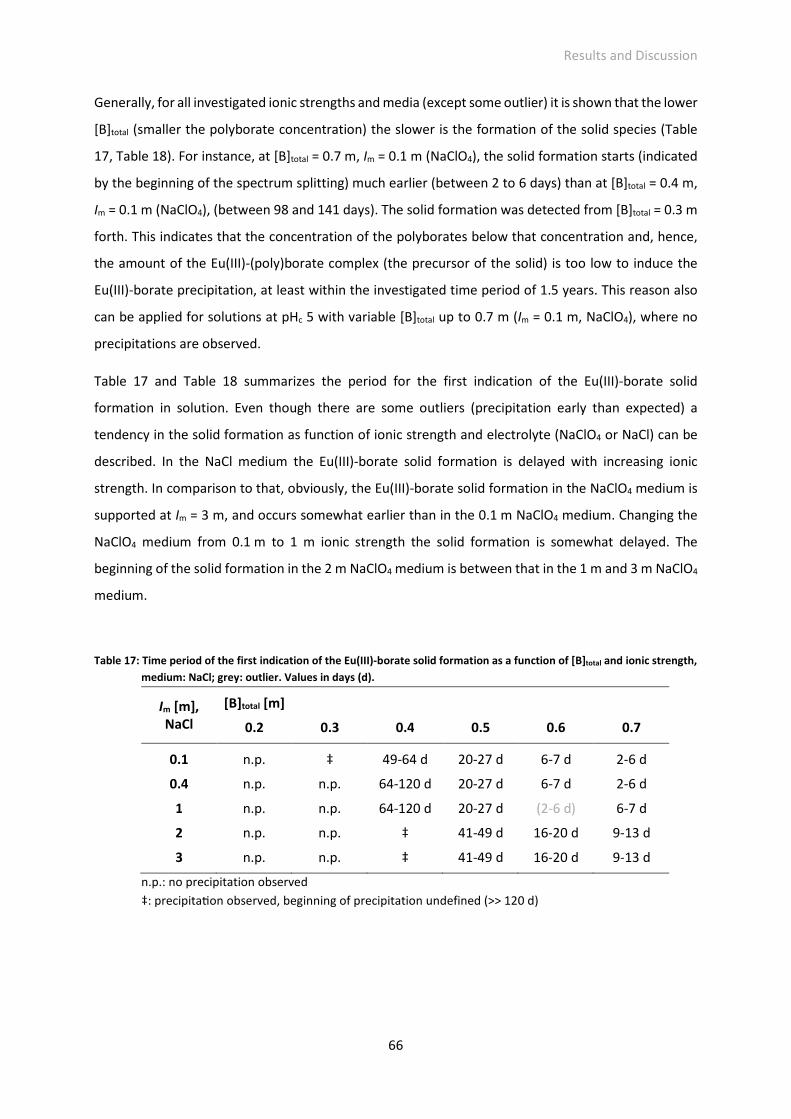
Results and Discussion
66
Generally, for all investigated ionic strengths and media (except some outlier) it is shown that the lower
[B]total (smaller the polyborate concentration) the slower is the formation of the solid species (Table
17, Table 18). For instance, at [B]total = 0.7 m, Im = 0.1 m (NaClO4), the solid formation starts (indicated
by the beginning of the spectrum splitting) much earlier (between 2 to 6 days) than at [B]total = 0.4 m,
Im = 0.1 m (NaClO4), (between 98 and 141 days). The solid formation was detected from [B]total = 0.3 m
forth. This indicates that the concentration of the polyborates below that concentration and, hence,
the amount of the Eu(III)-(poly)borate complex (the precursor of the solid) is too low to induce the
Eu(III)-borate precipitation, at least within the investigated time period of 1.5 years. This reason also
can be applied for solutions at pHc 5 with variable [B]total up to 0.7 m (Im = 0.1 m, NaClO4), where no
precipitations are observed.
Table 17 and Table 18 summarizes the period for the first indication of the Eu(III)-borate solid
formation in solution. Even though there are some outliers (precipitation early than expected) a
tendency in the solid formation as function of ionic strength and electrolyte (NaClO4 or NaCl) can be
described. In the NaCl medium the Eu(III)-borate solid formation is delayed with increasing ionic
strength. In comparison to that, obviously, the Eu(III)-borate solid formation in the NaClO4 medium is
supported at Im = 3 m, and occurs somewhat earlier than in the 0.1 m NaClO4 medium. Changing the
NaClO4 medium from 0.1 m to 1 m ionic strength the solid formation is somewhat delayed. The
beginning of the solid formation in the 2 m NaClO4 medium is between that in the 1 m and 3 m NaClO4
medium.
Table 17: Time period of the first indication of the Eu(III)-borate solid formation as a function of [B]total and ionic strength,
medium: NaCl; grey: outlier. Values in days (d).
Im [m], NaCl
[B]total [m]
0.2 0.3 0.4 0.5 0.6 0.7
0.1 n.p. ‡ 49-64 d 20-27 d 6-7 d 2-6 d
0.4 n.p. n.p. 64-120 d 20-27 d 6-7 d 2-6 d
1 n.p. n.p. 64-120 d 20-27 d (2-6 d) 6-7 d
2 n.p. n.p. ‡ 41-49 d 16-20 d 9-13 d
3 n.p. n.p. ‡ 41-49 d 16-20 d 9-13 d
n.p.: no precipitation observed
‡: precipita8on observed, beginning of precipitation undefined (>> 120 d)
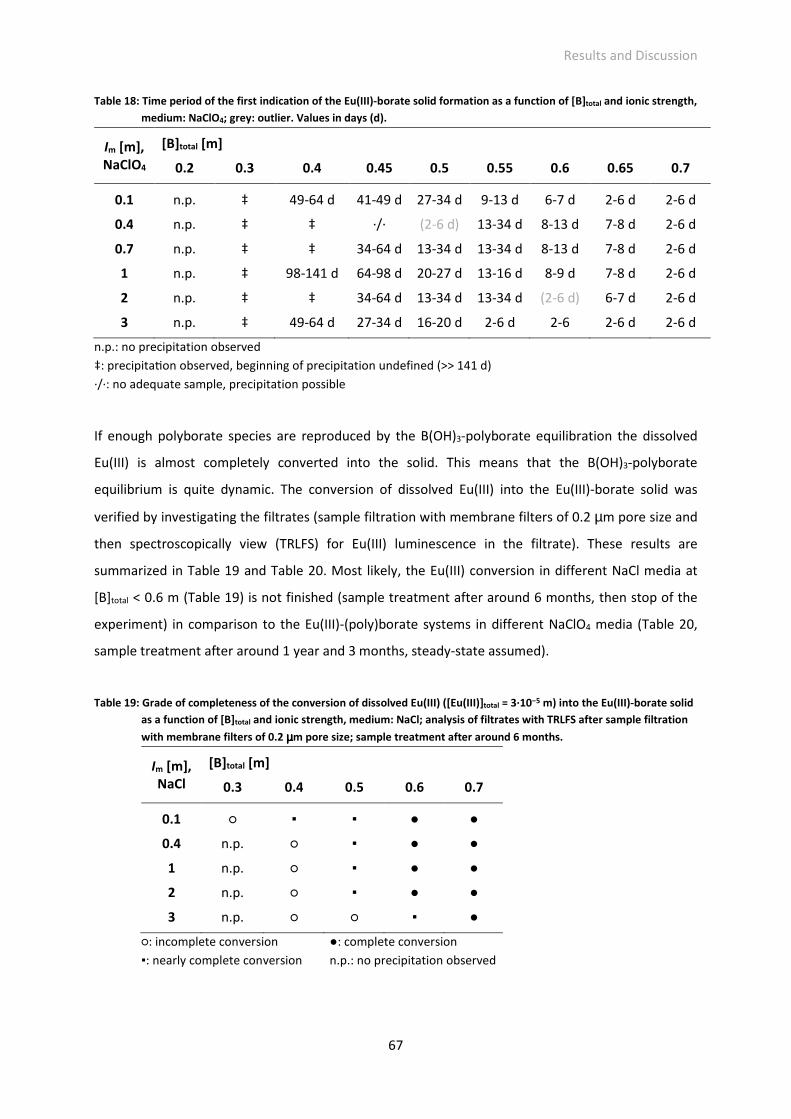
Results and Discussion
67
Table 18: Time period of the first indication of the Eu(III)-borate solid formation as a function of [B]total and ionic strength,
medium: NaClO4; grey: outlier. Values in days (d).
Im [m], NaClO4
[B]total [m]
0.2 0.3 0.4 0.45 0.5 0.55 0.6 0.65 0.7
0.1 n.p. ‡ 49-64 d 41-49 d 27-34 d 9-13 d 6-7 d 2-6 d 2-6 d
0.4 n.p. ‡ ‡ ·/· (2-6 d) 13-34 d 8-13 d 7-8 d 2-6 d
0.7 n.p. ‡ ‡ 34-64 d 13-34 d 13-34 d 8-13 d 7-8 d 2-6 d
1 n.p. ‡ 98-141 d 64-98 d 20-27 d 13-16 d 8-9 d 7-8 d 2-6 d
2 n.p. ‡ ‡ 34-64 d 13-34 d 13-34 d (2-6 d) 6-7 d 2-6 d
3 n.p. ‡ 49-64 d 27-34 d 16-20 d 2-6 d 2-6 2-6 d 2-6 d
n.p.: no precipitation observed
‡: precipita8on observed, beginning of precipitation undefined (>> 141 d)
·/·: no adequate sample, precipitation possible
If enough polyborate species are reproduced by the B(OH)3-polyborate equilibration the dissolved
Eu(III) is almost completely converted into the solid. This means that the B(OH)3-polyborate
equilibrium is quite dynamic. The conversion of dissolved Eu(III) into the Eu(III)-borate solid was
verified by investigating the filtrates (sample filtration with membrane filters of 0.2 µm pore size and
then spectroscopically view (TRLFS) for Eu(III) luminescence in the filtrate). These results are
summarized in Table 19 and Table 20. Most likely, the Eu(III) conversion in different NaCl media at
[B]total < 0.6 m (Table 19) is not finished (sample treatment after around 6 months, then stop of the
experiment) in comparison to the Eu(III)-(poly)borate systems in different NaClO4 media (Table 20,
sample treatment after around 1 year and 3 months, steady-state assumed).
Table 19: Grade of completeness of the conversion of dissolved Eu(III) ([Eu(III)]total = 3·10−5 m) into the Eu(III)-borate solid
as a function of [B]total and ionic strength, medium: NaCl; analysis of filtrates with TRLFS after sample filtration
with membrane filters of 0.2 µµµµm pore size; sample treatment after around 6 months.
Im [m], NaCl
[B]total [m]
0.3 0.4 0.5 0.6 0.7
0.1 ○ ▪ ▪ ● ●
0.4 n.p. ○ ▪ ● ●
1 n.p. ○ ▪ ● ●
2 n.p. ○ ▪ ● ●
3 n.p. ○ ○ ▪ ●
○: incomplete conversion ●: complete conversion
▪: nearly complete conversion n.p.: no precipitation observed
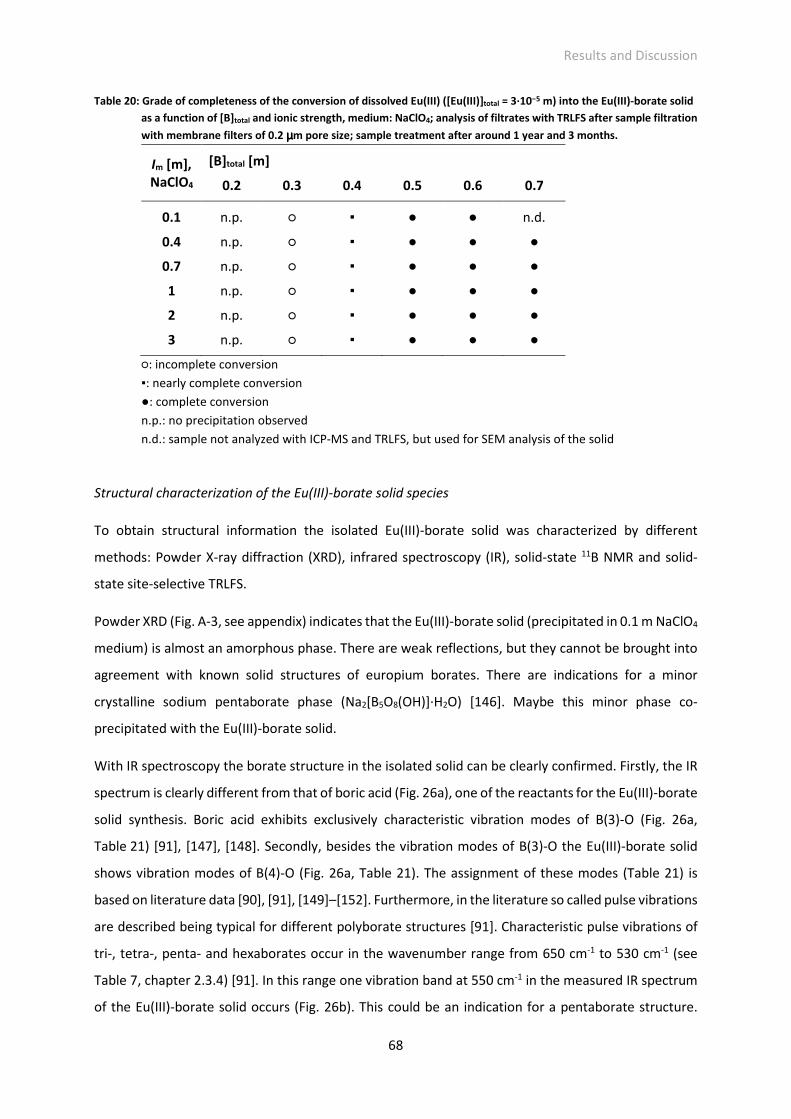
Results and Discussion
68
Table 20: Grade of completeness of the conversion of dissolved Eu(III) ([Eu(III)]total = 3·10−5 m) into the Eu(III)-borate solid
as a function of [B]total and ionic strength, medium: NaClO4; analysis of filtrates with TRLFS after sample filtration
with membrane filters of 0.2 µµµµm pore size; sample treatment after around 1 year and 3 months.
Im [m], NaClO4
[B]total [m]
0.2 0.3 0.4 0.5 0.6 0.7
0.1 n.p. ○ ▪ ● ● n.d.
0.4 n.p. ○ ▪ ● ● ●
0.7 n.p. ○ ▪ ● ● ●
1 n.p. ○ ▪ ● ● ●
2 n.p. ○ ▪ ● ● ●
3 n.p. ○ ▪ ● ● ●
○: incomplete conversion
▪: nearly complete conversion
●: complete conversion
n.p.: no precipitation observed
n.d.: sample not analyzed with ICP-MS and TRLFS, but used for SEM analysis of the solid
Structural characterization of the Eu(III)-borate solid species
To obtain structural information the isolated Eu(III)-borate solid was characterized by different
methods: Powder X-ray diffraction (XRD), infrared spectroscopy (IR), solid-state 11B NMR and solid-
state site-selective TRLFS.
Powder XRD (Fig. A-3, see appendix) indicates that the Eu(III)-borate solid (precipitated in 0.1 m NaClO4
medium) is almost an amorphous phase. There are weak reflections, but they cannot be brought into
agreement with known solid structures of europium borates. There are indications for a minor
crystalline sodium pentaborate phase (Na2[B5O8(OH)]·H2O) [146]. Maybe this minor phase co-
precipitated with the Eu(III)-borate solid.
With IR spectroscopy the borate structure in the isolated solid can be clearly confirmed. Firstly, the IR
spectrum is clearly different from that of boric acid (Fig. 26a), one of the reactants for the Eu(III)-borate
solid synthesis. Boric acid exhibits exclusively characteristic vibration modes of B(3)-O (Fig. 26a,
Table 21) [91], [147], [148]. Secondly, besides the vibration modes of B(3)-O the Eu(III)-borate solid
shows vibration modes of B(4)-O (Fig. 26a, Table 21). The assignment of these modes (Table 21) is
based on literature data [90], [91], [149]–[152]. Furthermore, in the literature so called pulse vibrations
are described being typical for different polyborate structures [91]. Characteristic pulse vibrations of
tri-, tetra-, penta- and hexaborates occur in the wavenumber range from 650 cm-1 to 530 cm-1 (see
Table 7, chapter 2.3.4) [91]. In this range one vibration band at 550 cm-1 in the measured IR spectrum
of the Eu(III)-borate solid occurs (Fig. 26b). This could be an indication for a pentaborate structure.
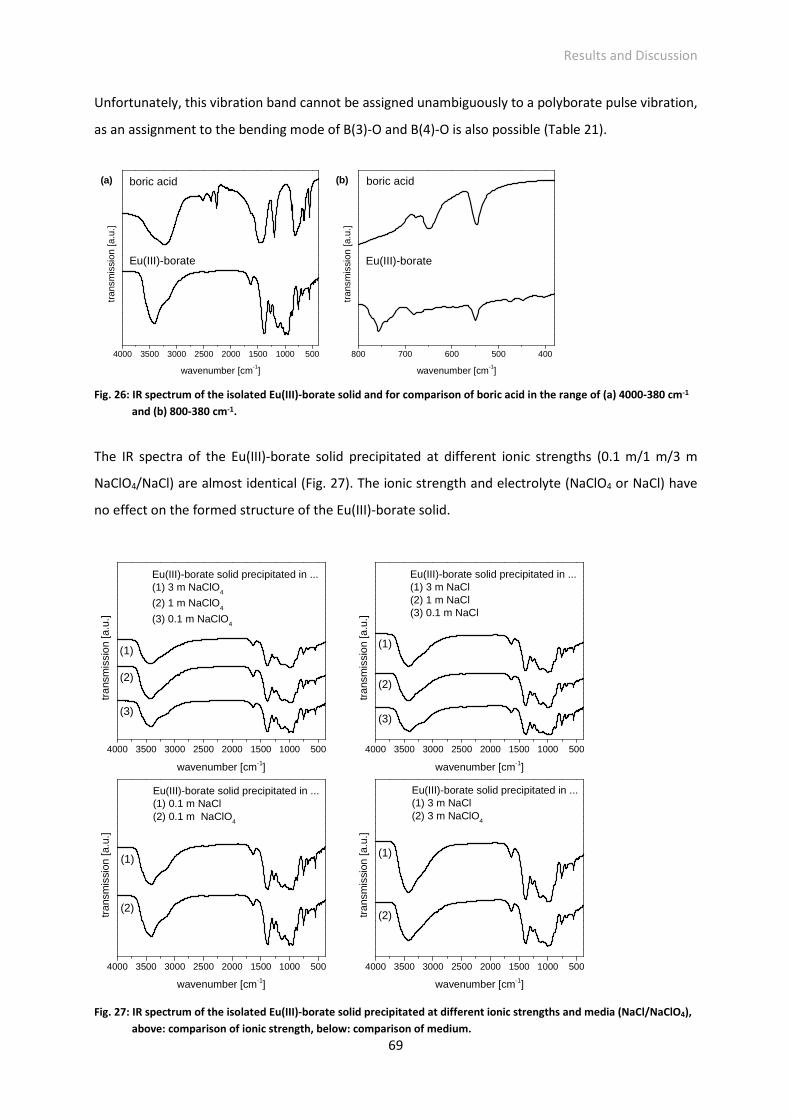
Results and Discussion
69
Unfortunately, this vibration band cannot be assigned unambiguously to a polyborate pulse vibration,
as an assignment to the bending mode of B(3)-O and B(4)-O is also possible (Table 21).
Fig. 26: IR spectrum of the isolated Eu(III)-borate solid and for comparison of boric acid in the range of (a) 4000-380 cm-1
and (b) 800-380 cm-1.
The IR spectra of the Eu(III)-borate solid precipitated at different ionic strengths (0.1 m/1 m/3 m
NaClO4/NaCl) are almost identical (Fig. 27). The ionic strength and electrolyte (NaClO4 or NaCl) have
no effect on the formed structure of the Eu(III)-borate solid.
Fig. 27: IR spectrum of the isolated Eu(III)-borate solid precipitated at different ionic strengths and media (NaCl/NaClO4),
above: comparison of ionic strength, below: comparison of medium.
4000 3500 3000 2500 2000 1500 1000 500
(b)
tran
smis
sion
[a.u
.]
wavenumber [cm-1]
(a)
800 700 600 500 400
Eu(III)-borate
boric acid
tran
smis
sion
[a.u
.]
wavenumber [cm-1]
boric acid
Eu(III)-borate
4000 3500 3000 2500 2000 1500 1000 500
tran
smis
sion
[a.u
.]
wavenumber [cm-1]
Eu(III)-borate solid precipitated in ...(1) 3 m NaClO
4
(2) 1 m NaClO4
(3) 0.1 m NaClO4
4000 3500 3000 2500 2000 1500 1000 500
(3)(3)
(2)(2)
(1)(1)
Eu(III)-borate solid precipitated in ...(1) 3 m NaCl(2) 1 m NaCl(3) 0.1 m NaCl
tran
smis
sion
[a.u
.]
wavenumber [cm-1]
4000 3500 3000 2500 2000 1500 1000 500
(1)
tran
smis
sion
[a.u
.]
wavenumber [cm-1]
Eu(III)-borate solid precipitated in ...(1) 0.1 m NaCl(2) 0.1 m NaClO
4
(2)
4000 3500 3000 2500 2000 1500 1000 500
(2)
(1)
Eu(III)-borate solid precipitated in ...(1) 3 m NaCl(2) 3 m NaClO
4
tran
smis
sion
[a.u
.]
wavenumber [cm-1]
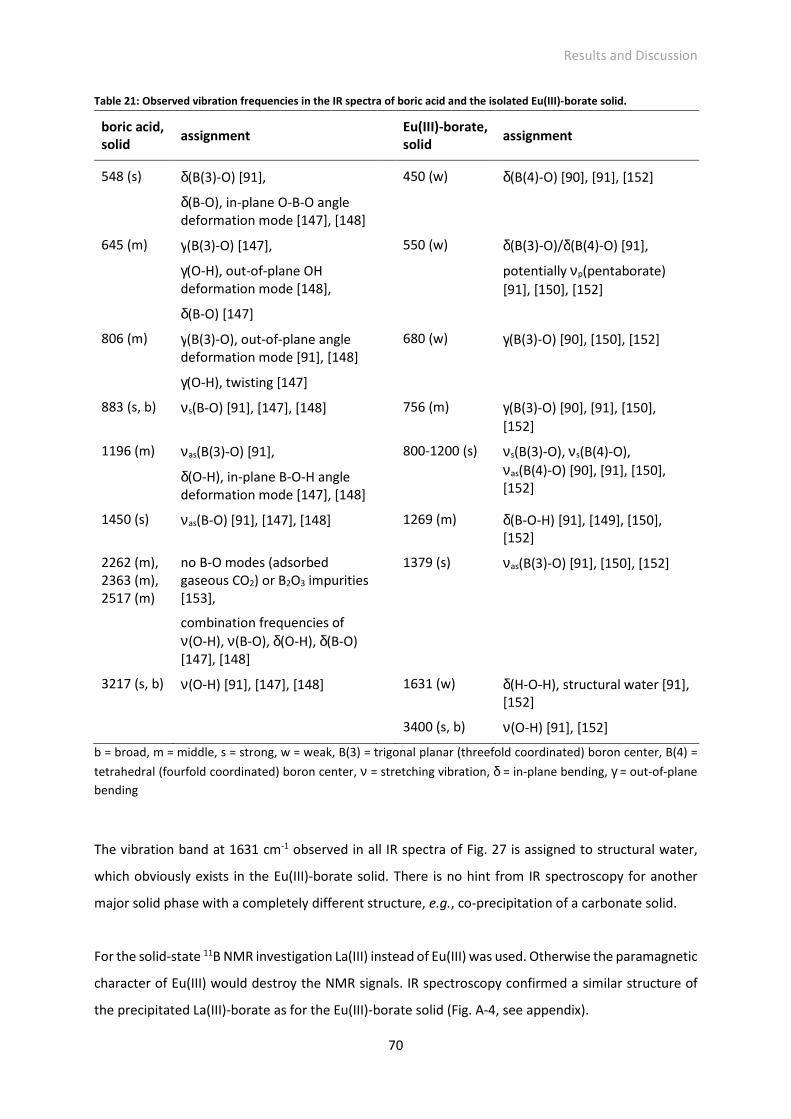
Results and Discussion
70
Table 21: Observed vibration frequencies in the IR spectra of boric acid and the isolated Eu(III)-borate solid.
boric acid, solid
assignment Eu(III)-borate, solid
assignment
548 (s) δ(B(3)-O) [91],
δ(B-O), in-plane O-B-O angle deformation mode [147], [148]
450 (w) δ(B(4)-O) [90], [91], [152]
645 (m) γ(B(3)-O) [147],
γ(O-H), out-of-plane OH deformation mode [148],
δ(B-O) [147]
550 (w) δ(B(3)-O)/δ(B(4)-O) [91],
potentially νp(pentaborate) [91], [150], [152]
806 (m) γ(B(3)-O), out-of-plane angle deformation mode [91], [148]
γ(O-H), twisting [147]
680 (w) γ(B(3)-O) [90], [150], [152]
883 (s, b) νs(B-O) [91], [147], [148]
756 (m) γ(B(3)-O) [90], [91], [150],
[152]
1196 (m) νas(B(3)-O) [91],
δ(O-H), in-plane B-O-H angle deformation mode [147], [148]
800-1200 (s) νs(B(3)-O), νs(B(4)-O), νas(B(4)-O) [90], [91], [150],
[152]
1450 (s) νas(B-O) [91], [147], [148]
1269 (m) δ(B-O-H) [91], [149], [150],
[152]
2262 (m),
2363 (m),
2517 (m)
no B-O modes (adsorbed gaseous CO2) or B2O3 impurities [153],
combination frequencies of ν(O-H), ν(B-O), δ(O-H), δ(B-O) [147], [148]
1379 (s) νas(B(3)-O) [91], [150], [152]
3217 (s, b) ν(O-H) [91], [147], [148]
1631 (w) δ(H-O-H), structural water [91],
[152]
3400 (s, b) ν(O-H) [91], [152]
b = broad, m = middle, s = strong, w = weak, B(3) = trigonal planar (threefold coordinated) boron center, B(4) =
tetrahedral (fourfold coordinated) boron center, ν = stretching vibration, δ = in-plane bending, γ = out-of-plane
bending
The vibration band at 1631 cm-1 observed in all IR spectra of Fig. 27 is assigned to structural water,
which obviously exists in the Eu(III)-borate solid. There is no hint from IR spectroscopy for another
major solid phase with a completely different structure, e.g., co-precipitation of a carbonate solid.
For the solid-state 11B NMR investigation La(III) instead of Eu(III) was used. Otherwise the paramagnetic
character of Eu(III) would destroy the NMR signals. IR spectroscopy confirmed a similar structure of
the precipitated La(III)-borate as for the Eu(III)-borate solid (Fig. A-4, see appendix).
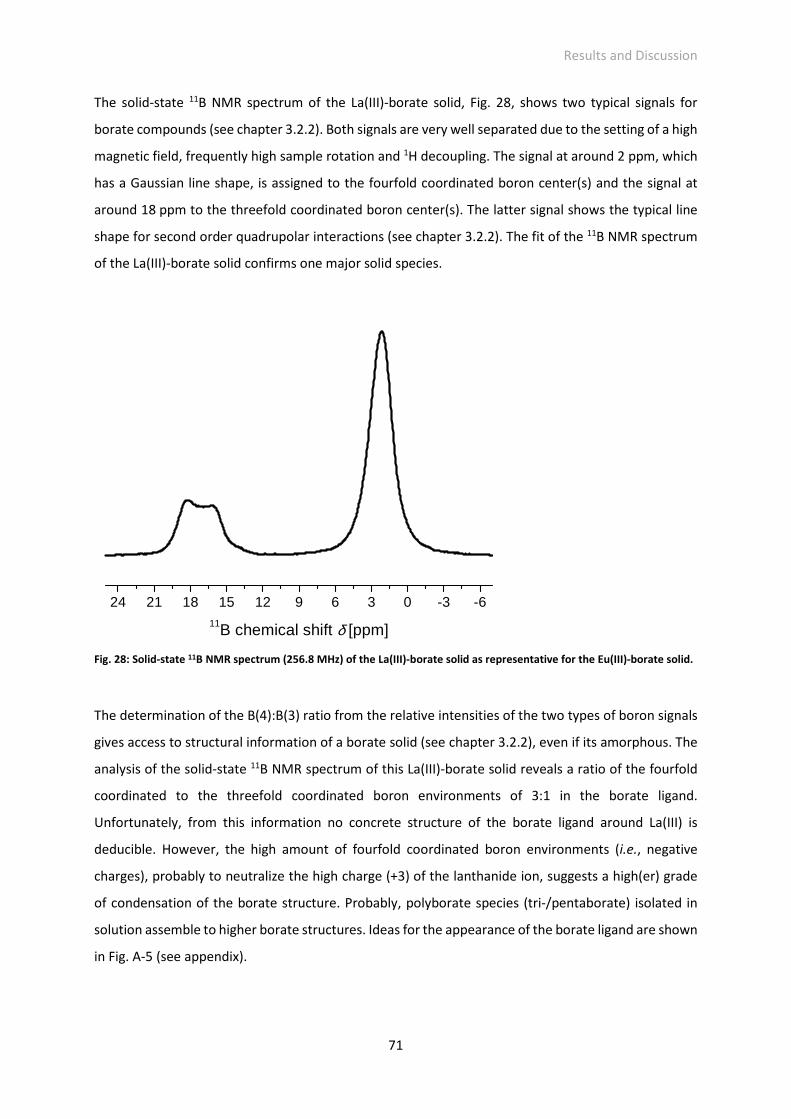
Results and Discussion
71
The solid-state 11B NMR spectrum of the La(III)-borate solid, Fig. 28, shows two typical signals for
borate compounds (see chapter 3.2.2). Both signals are very well separated due to the setting of a high
magnetic field, frequently high sample rotation and 1H decoupling. The signal at around 2 ppm, which
has a Gaussian line shape, is assigned to the fourfold coordinated boron center(s) and the signal at
around 18 ppm to the threefold coordinated boron center(s). The latter signal shows the typical line
shape for second order quadrupolar interactions (see chapter 3.2.2). The fit of the 11B NMR spectrum
of the La(III)-borate solid confirms one major solid species.
Fig. 28: Solid-state 11B NMR spectrum (256.8 MHz) of the La(III)-borate solid as representative for the Eu(III)-borate solid.
The determination of the B(4):B(3) ratio from the relative intensities of the two types of boron signals
gives access to structural information of a borate solid (see chapter 3.2.2), even if its amorphous. The
analysis of the solid-state 11B NMR spectrum of this La(III)-borate solid reveals a ratio of the fourfold
coordinated to the threefold coordinated boron environments of 3:1 in the borate ligand.
Unfortunately, from this information no concrete structure of the borate ligand around La(III) is
deducible. However, the high amount of fourfold coordinated boron environments (i.e., negative
charges), probably to neutralize the high charge (+3) of the lanthanide ion, suggests a high(er) grade
of condensation of the borate structure. Probably, polyborate species (tri-/pentaborate) isolated in
solution assemble to higher borate structures. Ideas for the appearance of the borate ligand are shown
in Fig. A-5 (see appendix).
24 21 18 15 12 9 6 3 0 -3 -611B chemical shift δ [ppm]
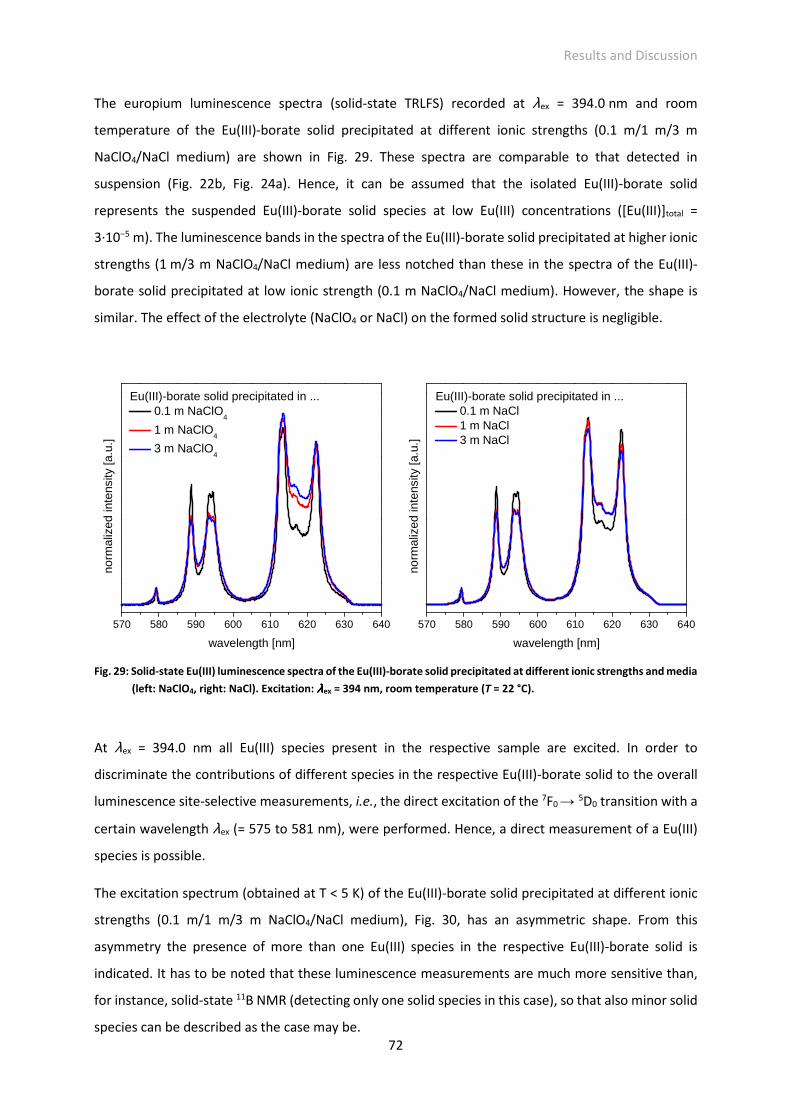
Results and Discussion
72
The europium luminescence spectra (solid-state TRLFS) recorded at λex = 394.0 nm and room
temperature of the Eu(III)-borate solid precipitated at different ionic strengths (0.1 m/1 m/3 m
NaClO4/NaCl medium) are shown in Fig. 29. These spectra are comparable to that detected in
suspension (Fig. 22b, Fig. 24a). Hence, it can be assumed that the isolated Eu(III)-borate solid
represents the suspended Eu(III)-borate solid species at low Eu(III) concentrations ([Eu(III)]total =
3·10−5 m). The luminescence bands in the spectra of the Eu(III)-borate solid precipitated at higher ionic
strengths (1 m/3 m NaClO4/NaCl medium) are less notched than these in the spectra of the Eu(III)-
borate solid precipitated at low ionic strength (0.1 m NaClO4/NaCl medium). However, the shape is
similar. The effect of the electrolyte (NaClO4 or NaCl) on the formed solid structure is negligible.
Fig. 29: Solid-state Eu(III) luminescence spectra of the Eu(III)-borate solid precipitated at different ionic strengths and media
(left: NaClO4, right: NaCl). Excitation: λλλλex = 394 nm, room temperature (T = 22 °C).
At λex = 394.0 nm all Eu(III) species present in the respective sample are excited. In order to
discriminate the contributions of different species in the respective Eu(III)-borate solid to the overall
luminescence site-selective measurements, i.e., the direct excitation of the 7F0 → 5D0 transition with a
certain wavelength λex (= 575 to 581 nm), were performed. Hence, a direct measurement of a Eu(III)
species is possible.
The excitation spectrum (obtained at T < 5 K) of the Eu(III)-borate solid precipitated at different ionic
strengths (0.1 m/1 m/3 m NaClO4/NaCl medium), Fig. 30, has an asymmetric shape. From this
asymmetry the presence of more than one Eu(III) species in the respective Eu(III)-borate solid is
indicated. It has to be noted that these luminescence measurements are much more sensitive than,
for instance, solid-state 11B NMR (detecting only one solid species in this case), so that also minor solid
species can be described as the case may be.
570 580 590 600 610 620 630 640
norm
aliz
ed in
tens
ity [a
.u.]
wavelength [nm]
Eu(III)-borate solid precipitated in ... 0.1 m NaClO
4
1 m NaClO4
3 m NaClO4
570 580 590 600 610 620 630 640
norm
aliz
ed in
tens
ity [a
.u.]
wavelength [nm]
Eu(III)-borate solid precipitated in ... 0.1 m NaCl 1 m NaCl 3 m NaCl
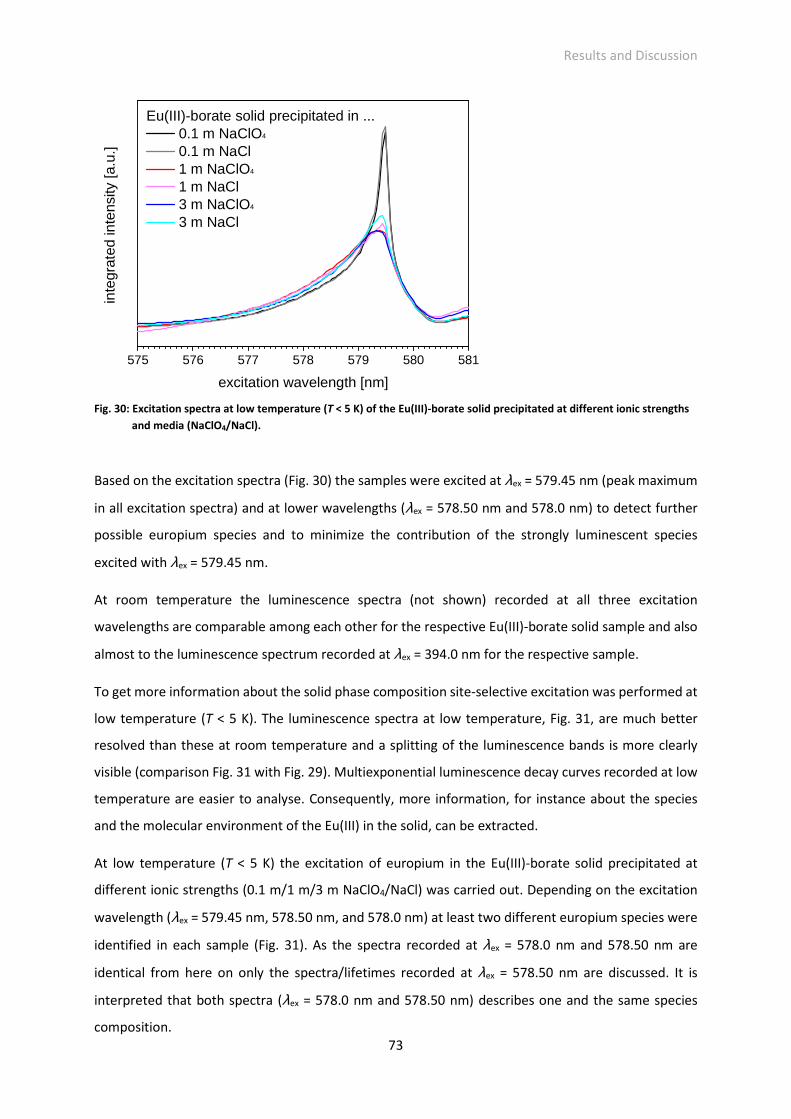
Results and Discussion
73
Fig. 30: Excitation spectra at low temperature (T < 5 K) of the Eu(III)-borate solid precipitated at different ionic strengths
and media (NaClO4/NaCl).
Based on the excitation spectra (Fig. 30) the samples were excited at λex = 579.45 nm (peak maximum
in all excitation spectra) and at lower wavelengths (λex = 578.50 nm and 578.0 nm) to detect further
possible europium species and to minimize the contribution of the strongly luminescent species
excited with λex = 579.45 nm.
At room temperature the luminescence spectra (not shown) recorded at all three excitation
wavelengths are comparable among each other for the respective Eu(III)-borate solid sample and also
almost to the luminescence spectrum recorded at λex = 394.0 nm for the respective sample.
To get more information about the solid phase composition site-selective excitation was performed at
low temperature (T < 5 K). The luminescence spectra at low temperature, Fig. 31, are much better
resolved than these at room temperature and a splitting of the luminescence bands is more clearly
visible (comparison Fig. 31 with Fig. 29). Multiexponential luminescence decay curves recorded at low
temperature are easier to analyse. Consequently, more information, for instance about the species
and the molecular environment of the Eu(III) in the solid, can be extracted.
At low temperature (T < 5 K) the excitation of europium in the Eu(III)-borate solid precipitated at
different ionic strengths (0.1 m/1 m/3 m NaClO4/NaCl) was carried out. Depending on the excitation
wavelength (λex = 579.45 nm, 578.50 nm, and 578.0 nm) at least two different europium species were
identified in each sample (Fig. 31). As the spectra recorded at λex = 578.0 nm and 578.50 nm are
identical from here on only the spectra/lifetimes recorded at λex = 578.50 nm are discussed. It is
interpreted that both spectra (λex = 578.0 nm and 578.50 nm) describes one and the same species
composition.
575 576 577 578 579 580 581
inte
grat
ed in
tens
ity [a
.u.]
excitation wavelength [nm]
Eu(III)-borate solid precipitated in ... 0.1 m NaClO4
0.1 m NaCl 1 m NaClO4
1 m NaCl 3 m NaClO4
3 m NaCl
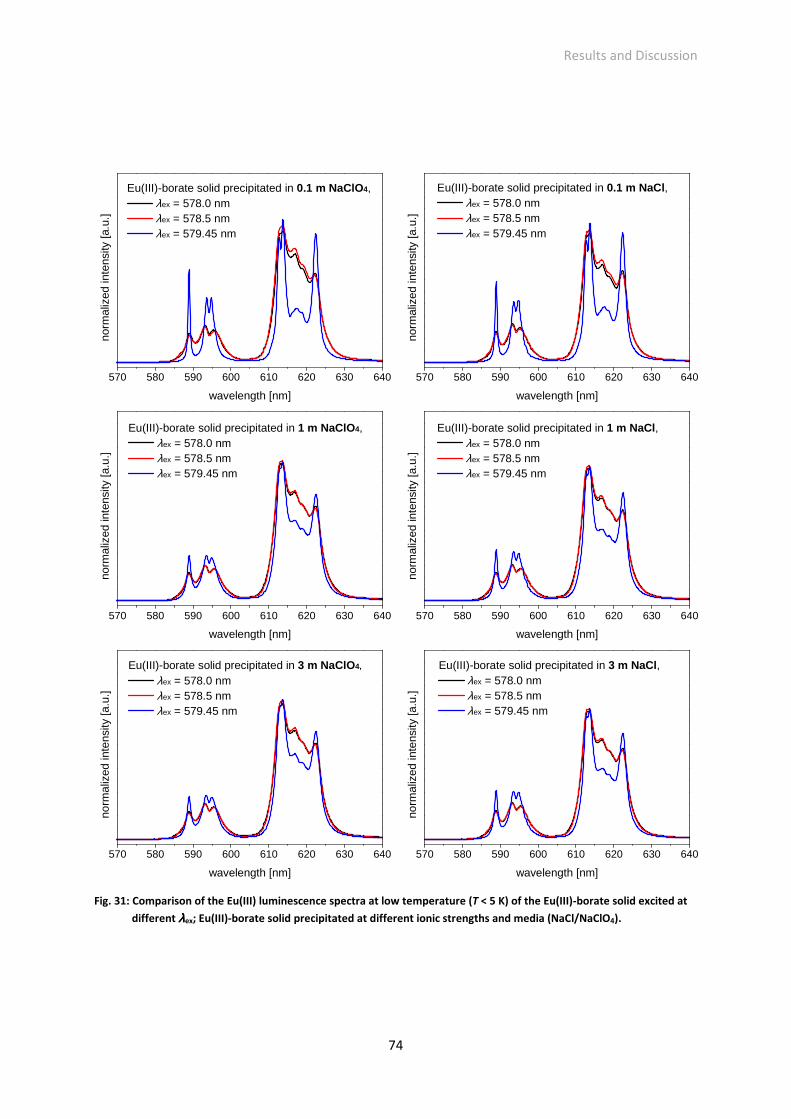
Results and Discussion
74
Fig. 31: Comparison of the Eu(III) luminescence spectra at low temperature (T < 5 K) of the Eu(III)-borate solid excited at
different λλλλex; Eu(III)-borate solid precipitated at different ionic strengths and media (NaCl/NaClO4).
570 580 590 600 610 620 630 640
Eu(III)-borate solid precipitated in 3 m NaCl, λex = 578.0 nm λex = 578.5 nm λex = 579.45 nm
Eu(III)-borate solid precipitated in 3 m NaClO4,
λex = 578.0 nm λex = 578.5 nm λex = 579.45 nm
Eu(III)-borate solid precipitated in 1 m NaCl, λex = 578.0 nm λex = 578.5 nm λex = 579.45 nm
Eu(III)-borate solid precipitated in 1 m NaClO4, λex = 578.0 nm λex = 578.5 nm λex = 579.45 nm
Eu(III)-borate solid precipitated in 0.1 m NaCl, λex = 578.0 nm λex = 578.5 nm λex = 579.45 nm
norm
aliz
ed in
tens
ity [a
.u.]
wavelength [nm]
Eu(III)-borate solid precipitated in 0.1 m NaClO4, λex = 578.0 nm λex = 578.5 nm λex = 579.45 nm
570 580 590 600 610 620 630 640
norm
aliz
ed in
tens
ity [a
.u.]
wavelength [nm]
570 580 590 600 610 620 630 640
norm
aliz
ed in
tens
ity [a
.u.]
wavelength [nm]
570 580 590 600 610 620 630 640
no
rmal
ized
inte
nsity
[a.u
.]
wavelength [nm]
570 580 590 600 610 620 630 640
norm
aliz
ed in
tens
ity [a
.u.]
wavelength [nm]
570 580 590 600 610 620 630 640
norm
aliz
ed in
tens
ity [a
.u.]
wavelength [nm]
Results and Discussion
75
Independent from the medium in which the Eu(III)-borate solid was precipitated, at λex = 579.45 nm
the obtained luminescence spectra for each sample can be assigned to the Eu(III)-borate, because the
spectrum shape is comparable to the spectrum of the Eu(III)-borate solid species in suspension
(comparison Fig. 22b/Fig. 24a with Fig. 31). In contrast, more different luminescence spectra were
recorded at λex = 578.50 nm (Fig. 31). However, these spectra are comparable to the spectra of the
Eu(III)-borate solid precipitated at higher ionic strengths (1 m/3 m NaCl/NaClO4) recorded at λex =
579.45 nm. Hence, they are assigned to at least one further, most likely, Eu(III)-borate solid species.
An indication for a third species comes from the comparison of the spectra, recorded at λex =
579.45 nm, of solid samples precipitated at different ionic strengths (Fig. 31). The shapes of the spectra
are quite similar, but the luminescence bands in the spectra of the Eu(III)-borate solid precipitated at
higher ionic strengths (1 m/3 m NaClO4/NaCl medium) are somewhat less notched than comparably
that at low ionic strength (0.1 m NaClO4/NaCl medium). The first peak in the 5D0 → 7F1 luminescence
band is somewhat higher in the spectra for the solid precipitated at low ionic strength (0.1 m
NaClO4/NaCl medium). The spectra, recorded at λex = 578.50 nm, of Eu(III)-borate solid samples
precipitated at different ionic strengths (0.1 m/1 m/3 m NaClO4/NaCl medium) are identical (Fig. 31,
Fig. A-6, see appendix). Furthermore, the spectra, recorded at λex = 579.45 nm, of Eu(III)-borate solid
samples precipitated at 1 m and 3 m ionic strength (NaClO4/NaCl medium) are nearly identical (Fig. 31,
Fig. A-6, see appendix). Two comparable, but not identical, spectra at λex = 579.45 nm argues for a
further Eu(III)-borate species in the solid mixture differently developed depending on ionic strength
(electrolyte effect (NaClO4 or NaCl) is negligible → Fig. A-6, see appendix). Probably, both Eu(III)-borate
species have the same structure (see the IR spectra of the Eu(III)-borate solid precipitated at different
ionic strengths and media, Fig. 27), but maybe have for instance different water contents or structural
orientations/arrangements. At this point in summary: In the Eu(III)-borate solid at least two, most
likely, three structurally quite similar Eu(III)-borate species occur.
In addition to the stationary luminescence spectra, the luminescence decay curves of the Eu(III)-borate
solid precipitated at different ionic strengths (0.1 m/1 m/3 m NaClO4/NaCl medium) at different
excitation wavelengths were measured. Table 22 summarizes the luminescence lifetimes under certain
conditions.
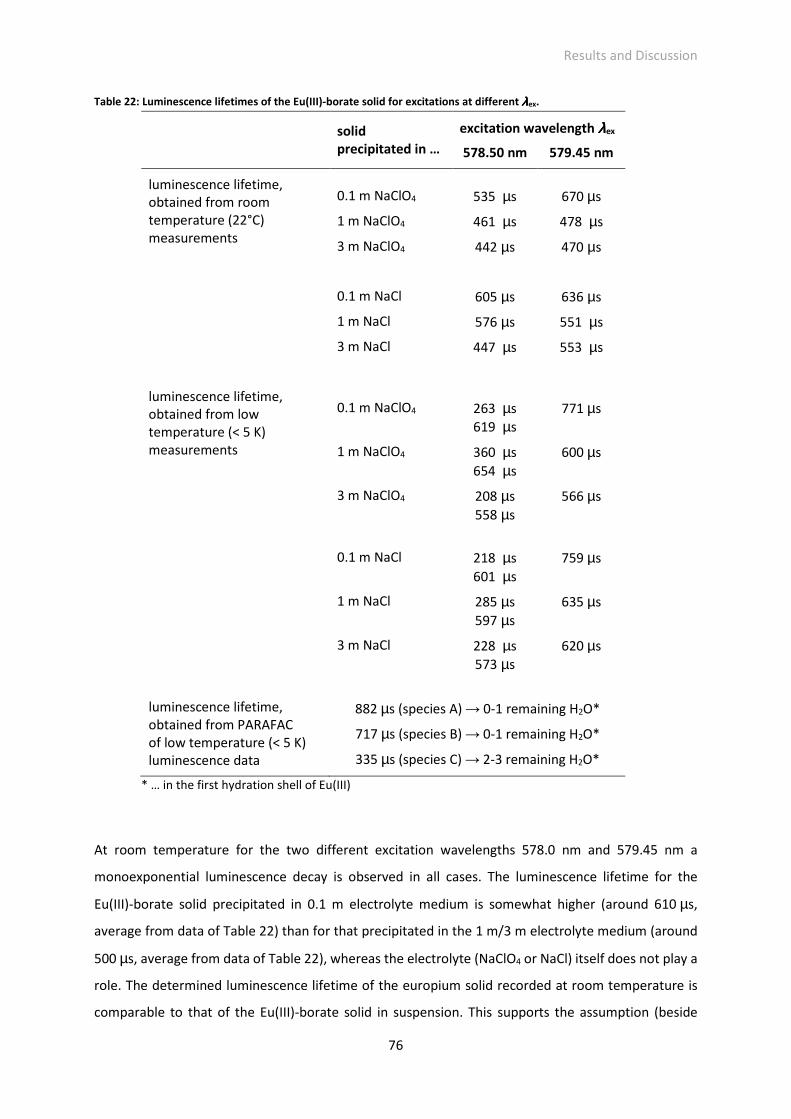
Results and Discussion
76
Table 22: Luminescence lifetimes of the Eu(III)-borate solid for excitations at different λλλλex.
solid precipitated in …
excitation wavelength λλλλex
578.50 nm 579.45 nm
luminescence lifetime, obtained from room temperature (22°C) measurements
0.1 m NaClO4 535 µs 670 µs
1 m NaClO4 461 µs 478 µs
3 m NaClO4 442 µs 470 µs
0.1 m NaCl 605 µs 636 µs
1 m NaCl 576 µs 551 µs
3 m NaCl 447 µs 553 µs
luminescence lifetime, obtained from low temperature (< 5 K) measurements
0.1 m NaClO4 263 µs
619 µs 771 µs
1 m NaClO4 360 µs 654 µs
600 µs
3 m NaClO4 208 µs 558 µs
566 µs
0.1 m NaCl 218 µs
601 µs 759 µs
1 m NaCl 285 µs 597 µs
635 µs
3 m NaCl 228 µs 573 µs
620 µs
luminescence lifetime, obtained from PARAFAC of low temperature (< 5 K) luminescence data
882 µs (species A) → 0-1 remaining H2O*
717 µs (species B) → 0-1 remaining H2O*
335 µs (species C) → 2-3 remaining H2O*
* … in the first hydration shell of Eu(III)
At room temperature for the two different excitation wavelengths 578.0 nm and 579.45 nm a
monoexponential luminescence decay is observed in all cases. The luminescence lifetime for the
Eu(III)-borate solid precipitated in 0.1 m electrolyte medium is somewhat higher (around 610 µs,
average from data of Table 22) than for that precipitated in the 1 m/3 m electrolyte medium (around
500 µs, average from data of Table 22), whereas the electrolyte (NaClO4 or NaCl) itself does not play a
role. The determined luminescence lifetime of the europium solid recorded at room temperature is
comparable to that of the Eu(III)-borate solid in suspension. This supports the assumption (beside
Results and Discussion
77
comparable spectra) that the isolated Eu(III)-borate solid represents the suspended Eu(III)-borate solid
species at low Eu(III) concentrations ([Eu(III)]total = 3·10−5 m). More information from luminescence
lifetimes about the respective systems were gotten from time-resolved measurements at low
temperature described in the following.
At low temperature (< 5 K) and for λex = 578.50 nm clearly two luminescence lifetimes were found for
each precipitation system (Table 22). A short lifetime (average 260 µs) and a longer lifetime (average
600 µs) can be extracted for all precipitation systems. At low temperature (< 5 K) and for λex =
579.45 nm one luminescence lifetime was found for each precipitation system (Table 22). Generally,
this lifetime is somewhat higher than its respective value at room temperature. This effect was
observed elsewhere before [154], and can be ascribed to a reduction of radiationless deactivation
processes at low temperature. However, the single luminescence lifetime is somewhat higher (average
around 770 µs) for the system at low ionic strength (0.1 m) than for that at higher ionic strengths
(1 m/3 m) (average around 600 µs). The latter luminescence lifetime is quite similar to that determined
at λex = 578.50 nm (longer lifetime). Again, no electrolyte effect is detectable, i.e., no significant
differences in luminescence lifetimes determined for the solid precipitated at similar ionic strength but
different electrolyte (NaClO4 or NaCl) are observed. In summary: The analysis of the luminescence
lifetimes confirms, as already indicated from the spectra, that at least two Eu(III) species, most likely
three Eu(III) species, occur in the Eu(III)-borate solid.
PARAFAC of the time-resolved as well as excitation based data (from low temperature measurements)
of the Eu(III)-borate solid (precipitated at different ionic strengths in NaClO4 mediumXV) revealed
emission spectra (Fig. 32) and lifetimes (Table 22) of three europium species (named species A, B and
C) as well as a species distribution as a function of the precipitation conditions. Comparing Fig. 31 and
Fig. 32 one species (named species A) is quite similar to the measured spectrum at λex = 579.45 nm of
the Eu(III)-borate solid precipitated at low ionic strength (0.1 m NaClO4/NaCl). A second species
(named species B) bears a likeness to the measured spectrum at λex = 579.45 nm of the Eu(III)-borate
solid precipitated at higher ionic strengths (1 m/3 m NaClO4/NaCl). The third species (named species
C) shows less similarity to the two other species. It is a species with a quite short luminescence lifetime
(335 µs) in comparison to species A (882 µs) and species B (717 µs).
XV Spectra of the Eu(III)-borate solid precipitated at different ionic strengths in NaCl medium were not analyzed, because no electrolyte effect on the solid formation is observed (Fig. A-6 in the appendix, Table 22).
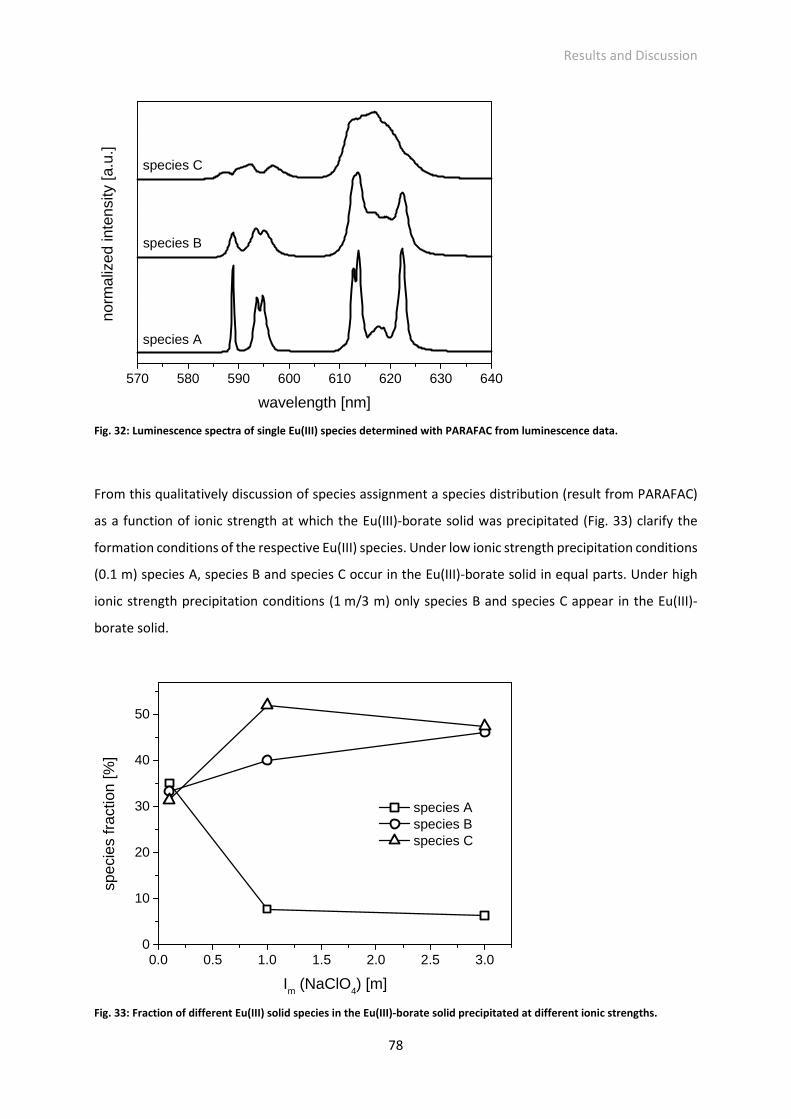
Results and Discussion
78
Fig. 32: Luminescence spectra of single Eu(III) species determined with PARAFAC from luminescence data.
From this qualitatively discussion of species assignment a species distribution (result from PARAFAC)
as a function of ionic strength at which the Eu(III)-borate solid was precipitated (Fig. 33) clarify the
formation conditions of the respective Eu(III) species. Under low ionic strength precipitation conditions
(0.1 m) species A, species B and species C occur in the Eu(III)-borate solid in equal parts. Under high
ionic strength precipitation conditions (1 m/3 m) only species B and species C appear in the Eu(III)-
borate solid.
Fig. 33: Fraction of different Eu(III) solid species in the Eu(III)-borate solid precipitated at different ionic strengths.
570 580 590 600 610 620 630 640
species C
species B
norm
aliz
ed in
tens
ity [a
.u.]
wavelength [nm]
species A
0.0 0.5 1.0 1.5 2.0 2.5 3.00
10
20
30
40
50
spec
ies
frac
tion
[%]
Im (NaClO4) [m]
species A species B species C
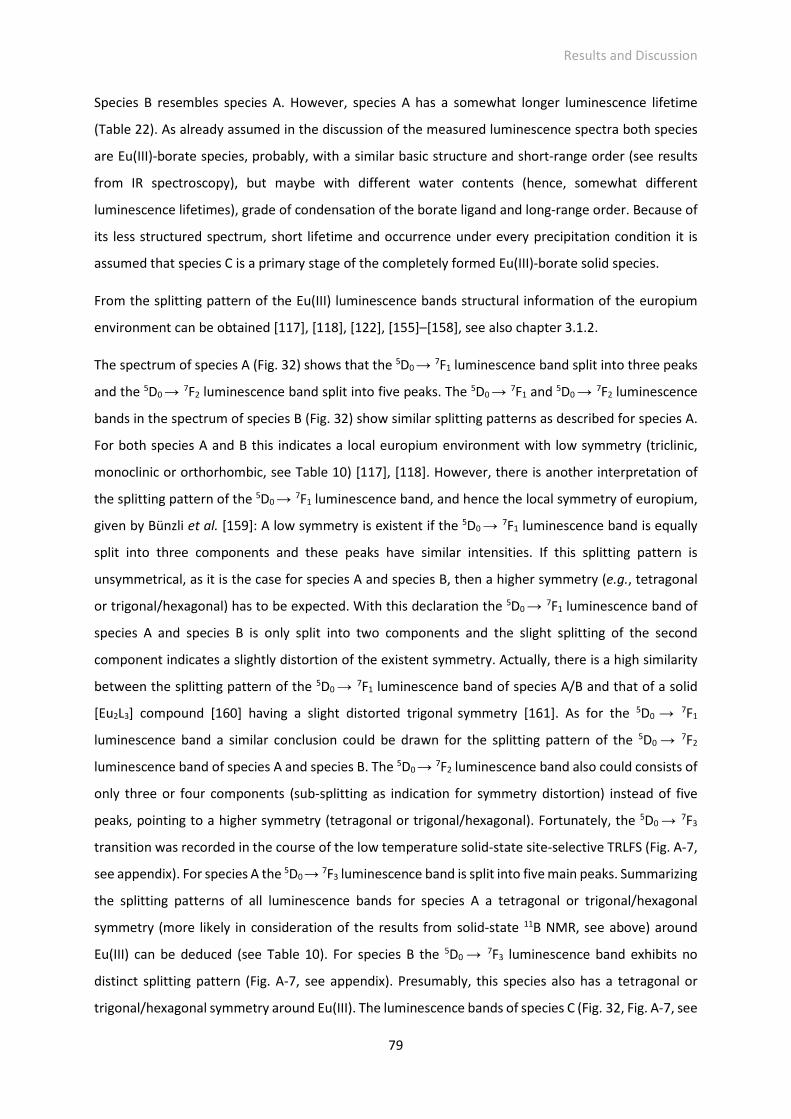
Results and Discussion
79
Species B resembles species A. However, species A has a somewhat longer luminescence lifetime
(Table 22). As already assumed in the discussion of the measured luminescence spectra both species
are Eu(III)-borate species, probably, with a similar basic structure and short-range order (see results
from IR spectroscopy), but maybe with different water contents (hence, somewhat different
luminescence lifetimes), grade of condensation of the borate ligand and long-range order. Because of
its less structured spectrum, short lifetime and occurrence under every precipitation condition it is
assumed that species C is a primary stage of the completely formed Eu(III)-borate solid species.
From the splitting pattern of the Eu(III) luminescence bands structural information of the europium
environment can be obtained [117], [118], [122], [155]–[158], see also chapter 3.1.2.
The spectrum of species A (Fig. 32) shows that the 5D0 → 7F1 luminescence band split into three peaks
and the 5D0 → 7F2 luminescence band split into five peaks. The 5D0 → 7F1 and 5D0 → 7F2 luminescence
bands in the spectrum of species B (Fig. 32) show similar splitting patterns as described for species A.
For both species A and B this indicates a local europium environment with low symmetry (triclinic,
monoclinic or orthorhombic, see Table 10) [117], [118]. However, there is another interpretation of
the splitting pattern of the 5D0 → 7F1 luminescence band, and hence the local symmetry of europium,
given by Bünzli et al. [159]: A low symmetry is existent if the 5D0 → 7F1 luminescence band is equally
split into three components and these peaks have similar intensities. If this splitting pattern is
unsymmetrical, as it is the case for species A and species B, then a higher symmetry (e.g., tetragonal
or trigonal/hexagonal) has to be expected. With this declaration the 5D0 → 7F1 luminescence band of
species A and species B is only split into two components and the slight splitting of the second
component indicates a slightly distortion of the existent symmetry. Actually, there is a high similarity
between the splitting pattern of the 5D0 → 7F1 luminescence band of species A/B and that of a solid
[Eu2L3] compound [160] having a slight distorted trigonal symmetry [161]. As for the 5D0 → 7F1
luminescence band a similar conclusion could be drawn for the splitting pattern of the 5D0 → 7F2
luminescence band of species A and species B. The 5D0 → 7F2 luminescence band also could consists of
only three or four components (sub-splitting as indication for symmetry distortion) instead of five
peaks, pointing to a higher symmetry (tetragonal or trigonal/hexagonal). Fortunately, the 5D0 → 7F3
transition was recorded in the course of the low temperature solid-state site-selective TRLFS (Fig. A-7,
see appendix). For species A the 5D0 → 7F3 luminescence band is split into five main peaks. Summarizing
the splitting patterns of all luminescence bands for species A a tetragonal or trigonal/hexagonal
symmetry (more likely in consideration of the results from solid-state 11B NMR, see above) around
Eu(III) can be deduced (see Table 10). For species B the 5D0 → 7F3 luminescence band exhibits no
distinct splitting pattern (Fig. A-7, see appendix). Presumably, this species also has a tetragonal or
trigonal/hexagonal symmetry around Eu(III). The luminescence bands of species C (Fig. 32, Fig. A-7, see
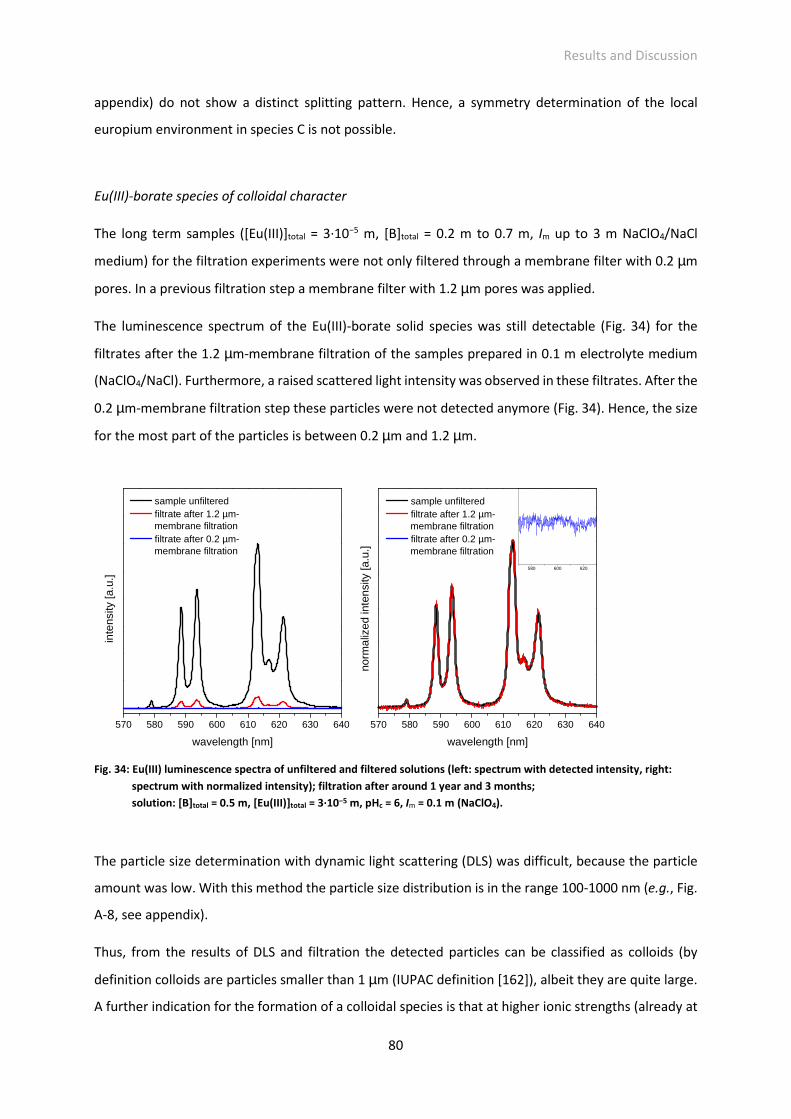
Results and Discussion
80
appendix) do not show a distinct splitting pattern. Hence, a symmetry determination of the local
europium environment in species C is not possible.
Eu(III)-borate species of colloidal character
The long term samples ([Eu(III)]total = 3·10−5 m, [B]total = 0.2 m to 0.7 m, Im up to 3 m NaClO4/NaCl
medium) for the filtration experiments were not only filtered through a membrane filter with 0.2 µm
pores. In a previous filtration step a membrane filter with 1.2 µm pores was applied.
The luminescence spectrum of the Eu(III)-borate solid species was still detectable (Fig. 34) for the
filtrates after the 1.2 µm-membrane filtration of the samples prepared in 0.1 m electrolyte medium
(NaClO4/NaCl). Furthermore, a raised scattered light intensity was observed in these filtrates. After the
0.2 µm-membrane filtration step these particles were not detected anymore (Fig. 34). Hence, the size
for the most part of the particles is between 0.2 µm and 1.2 µm.
Fig. 34: Eu(III) luminescence spectra of unfiltered and filtered solutions (left: spectrum with detected intensity, right:
spectrum with normalized intensity); filtration after around 1 year and 3 months;
solution: [B]total = 0.5 m, [Eu(III)]total = 3·10−5 m, pHc = 6, Im = 0.1 m (NaClO4).
The particle size determination with dynamic light scattering (DLS) was difficult, because the particle
amount was low. With this method the particle size distribution is in the range 100-1000 nm (e.g., Fig.
A-8, see appendix).
Thus, from the results of DLS and filtration the detected particles can be classified as colloids (by
definition colloids are particles smaller than 1 µm (IUPAC definition [162]), albeit they are quite large.
A further indication for the formation of a colloidal species is that at higher ionic strengths (already at
570 580 590 600 610 620 630 640
sample unfiltered filtrate after 1.2 µm-
membrane filtration filtrate after 0.2 µm-
membrane filtration
inte
nsity
[a.u
.]
wavelength [nm]
sample unfiltered filtrate after 1.2 µm-
membrane filtration filtrate after 0.2 µm-
membrane filtration
570 580 590 600 610 620 630 640
norm
aliz
ed in
tens
ity [a
.u.]
wavelength [nm]
580 600 620
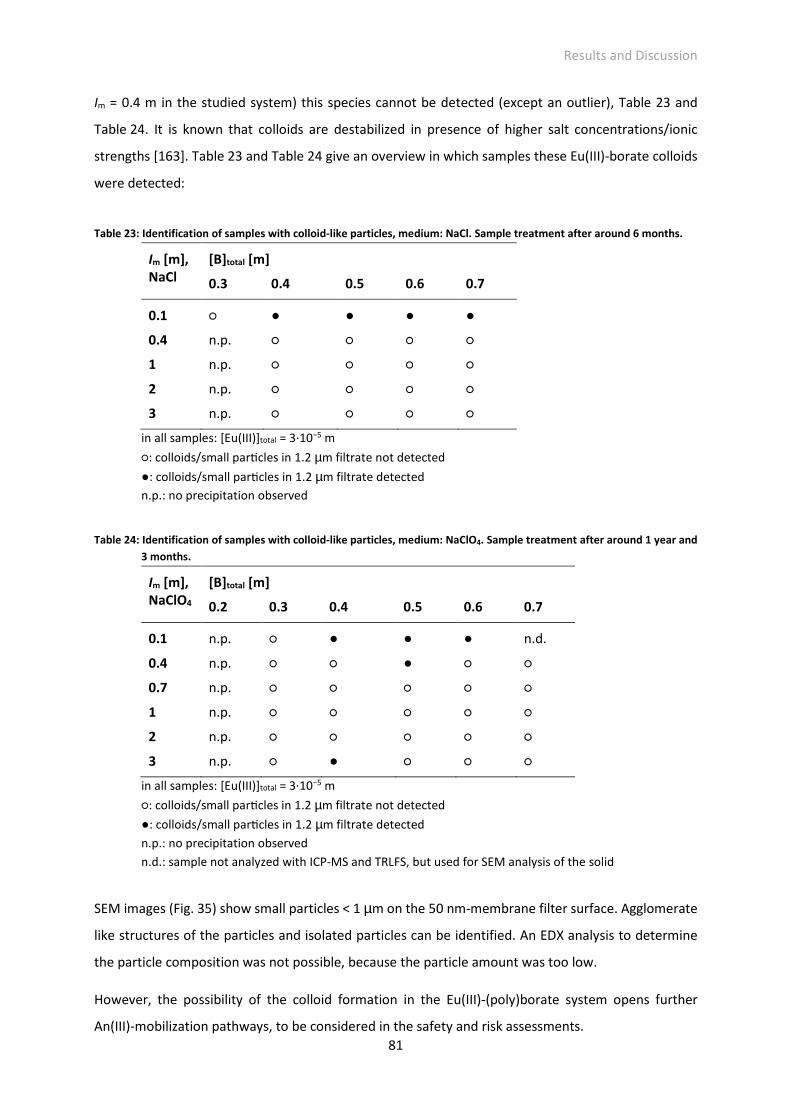
Results and Discussion
81
Im = 0.4 m in the studied system) this species cannot be detected (except an outlier), Table 23 and
Table 24. It is known that colloids are destabilized in presence of higher salt concentrations/ionic
strengths [163]. Table 23 and Table 24 give an overview in which samples these Eu(III)-borate colloids
were detected:
Table 23: Identification of samples with colloid-like particles, medium: NaCl. Sample treatment after around 6 months.
Im [m], NaCl
[B]total [m]
0.3 0.4 0.5 0.6 0.7
0.1 ○ ● ● ● ●
0.4 n.p. ○ ○ ○ ○
1 n.p. ○ ○ ○ ○
2 n.p. ○ ○ ○ ○
3 n.p. ○ ○ ○ ○
in all samples: [Eu(III)]total = 3·10−5 m
○: colloids/small par8cles in 1.2 µm filtrate not detected
●: colloids/small par8cles in 1.2 µm filtrate detected
n.p.: no precipitation observed
Table 24: Identification of samples with colloid-like particles, medium: NaClO4. Sample treatment after around 1 year and
3 months.
Im [m], NaClO4
[B]total [m]
0.2 0.3 0.4 0.5 0.6 0.7
0.1 n.p. ○ ● ● ● n.d.
0.4 n.p. ○ ○ ● ○ ○
0.7 n.p. ○ ○ ○ ○ ○
1 n.p. ○ ○ ○ ○ ○
2 n.p. ○ ○ ○ ○ ○
3 n.p. ○ ● ○ ○ ○
in all samples: [Eu(III)]total = 3·10−5 m
○: colloids/small par8cles in 1.2 µm filtrate not detected
●: colloids/small par8cles in 1.2 µm filtrate detected
n.p.: no precipitation observed
n.d.: sample not analyzed with ICP-MS and TRLFS, but used for SEM analysis of the solid
SEM images (Fig. 35) show small particles < 1 µm on the 50 nm-membrane filter surface. Agglomerate
like structures of the particles and isolated particles can be identified. An EDX analysis to determine
the particle composition was not possible, because the particle amount was too low.
However, the possibility of the colloid formation in the Eu(III)-(poly)borate system opens further
An(III)-mobilization pathways, to be considered in the safety and risk assessments.
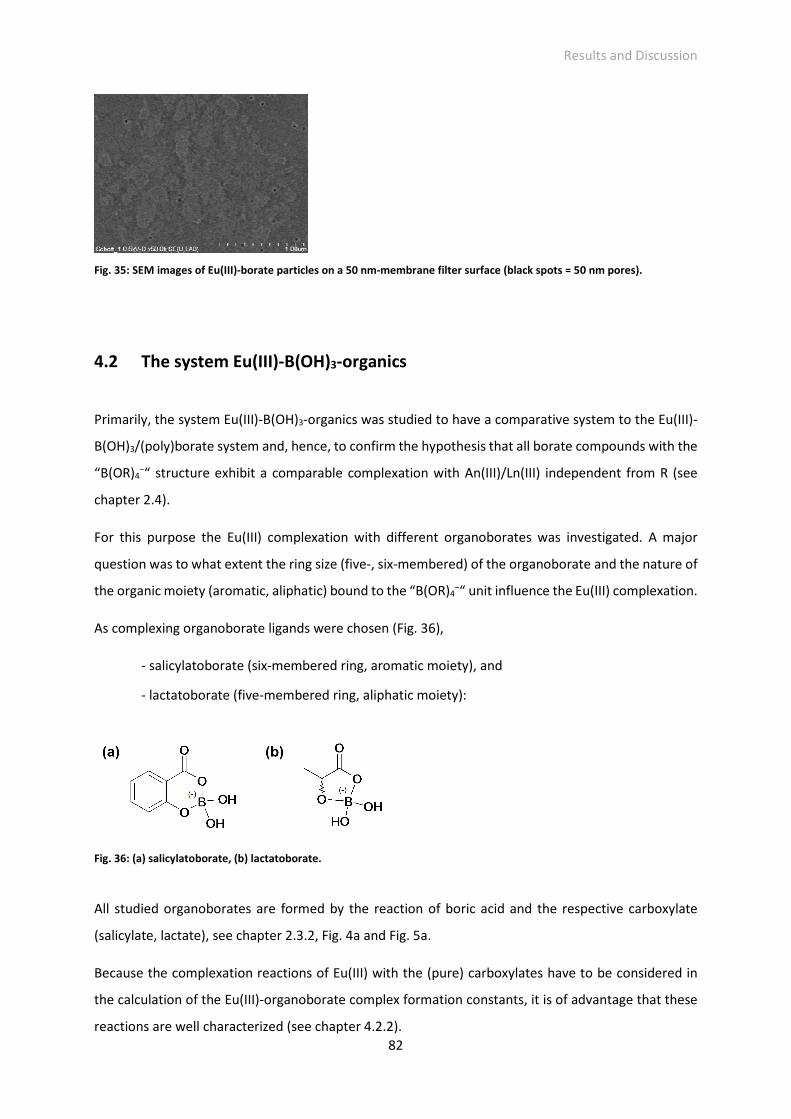
Results and Discussion
82
Fig. 35: SEM images of Eu(III)-borate particles on a 50 nm-membrane filter surface (black spots = 50 nm pores).
4.2 The system Eu(III)-B(OH)3-organics
Primarily, the system Eu(III)-B(OH)3-organics was studied to have a comparative system to the Eu(III)-
B(OH)3/(poly)borate system and, hence, to confirm the hypothesis that all borate compounds with the
“B(OR)4−“ structure exhibit a comparable complexation with An(III)/Ln(III) independent from R (see
chapter 2.4).
For this purpose the Eu(III) complexation with different organoborates was investigated. A major
question was to what extent the ring size (five-, six-membered) of the organoborate and the nature of
the organic moiety (aromatic, aliphatic) bound to the “B(OR)4−“ unit influence the Eu(III) complexation.
As complexing organoborate ligands were chosen (Fig. 36),
- salicylatoborate (six-membered ring, aromatic moiety), and
- lactatoborate (five-membered ring, aliphatic moiety):
Fig. 36: (a) salicylatoborate, (b) lactatoborate.
All studied organoborates are formed by the reaction of boric acid and the respective carboxylate
(salicylate, lactate), see chapter 2.3.2, Fig. 4a and Fig. 5a.
Because the complexation reactions of Eu(III) with the (pure) carboxylates have to be considered in
the calculation of the Eu(III)-organoborate complex formation constants, it is of advantage that these
reactions are well characterized (see chapter 4.2.2).
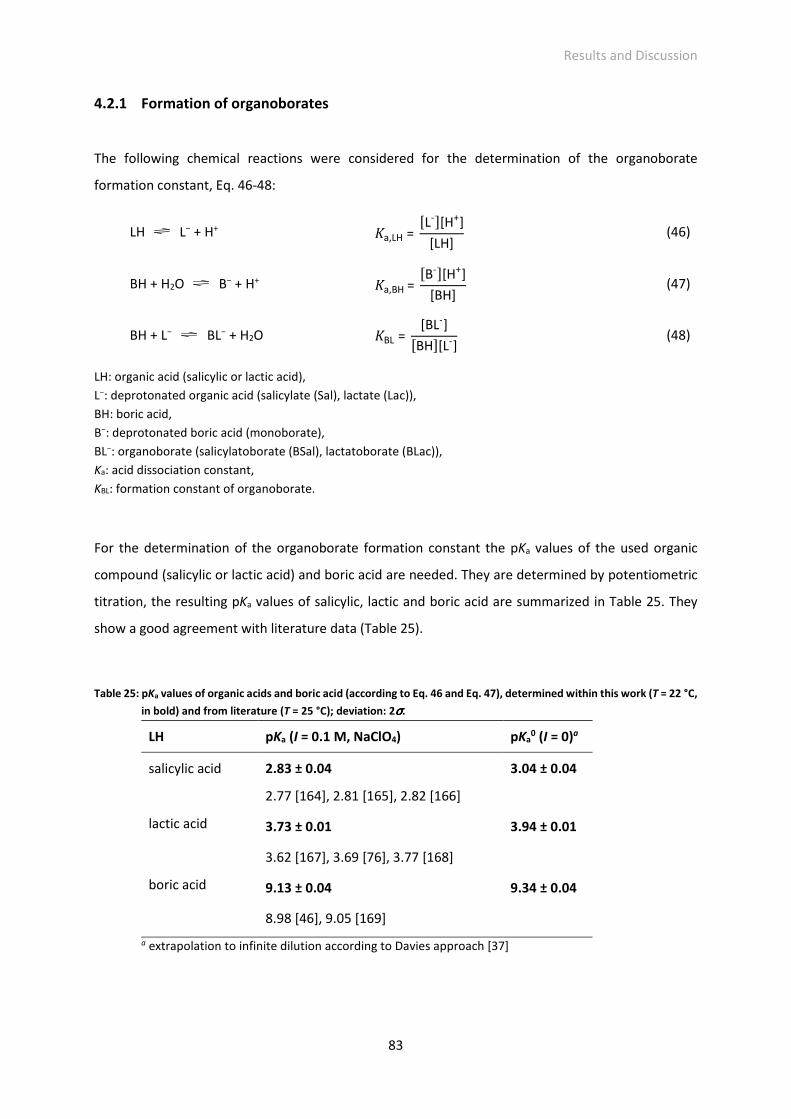
Results and Discussion
83
4.2.1 Formation of organoborates
The following chemical reactions were considered for the determination of the organoborate
formation constant, Eq. 46-48:
LH L− + H+ �a,LH = L-�[H+]
[LH] (46)
BH + H2O B− + H+ �a,BH = [B-][H+]
[BH] (47)
BH + L− BL− + H2O �BL = [BL-]
[BH][L-] (48)
LH: organic acid (salicylic or lactic acid),
L−: deprotonated organic acid (salicylate (Sal), lactate (Lac)),
BH: boric acid,
B−: deprotonated boric acid (monoborate),
BL−: organoborate (salicylatoborate (BSal), lactatoborate (BLac)),
Ka: acid dissociation constant,
KBL: formation constant of organoborate.
For the determination of the organoborate formation constant the pKa values of the used organic
compound (salicylic or lactic acid) and boric acid are needed. They are determined by potentiometric
titration, the resulting pKa values of salicylic, lactic and boric acid are summarized in Table 25. They
show a good agreement with literature data (Table 25).
Table 25: pKa values of organic acids and boric acid (according to Eq. 46 and Eq. 47), determined within this work (T = 22 °C,
in bold) and from literature (T = 25 °C); deviation: 2σσσσ.
LH pKa (I = 0.1 M, NaClO4) pKa0 (I = 0)a
salicylic acid 2.83 ± 0.04 3.04 ± 0.04
2.77 [164], 2.81 [165], 2.82 [166]
lactic acid 3.73 ± 0.01 3.94 ± 0.01
3.62 [167], 3.69 [76], 3.77 [168]
boric acid 9.13 ± 0.04 9.34 ± 0.04
8.98 [46], 9.05 [169]
a extrapolation to infinite dilution according to Davies approach [37]
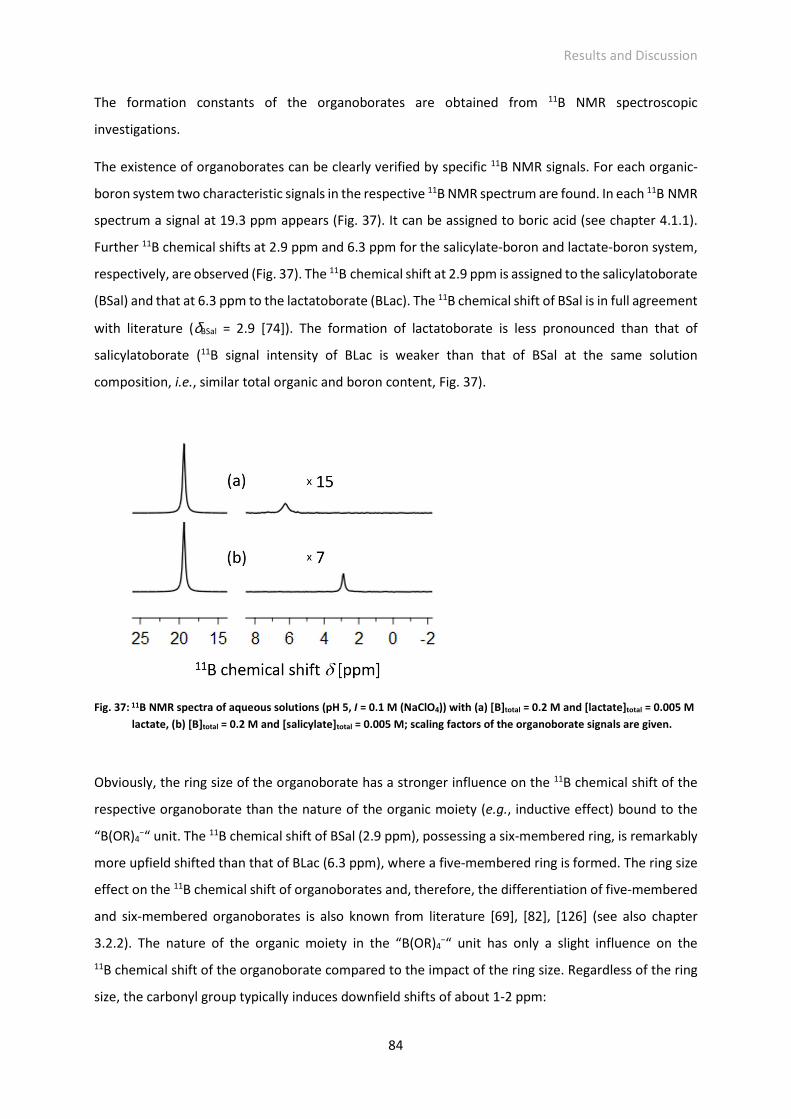
Results and Discussion
84
The formation constants of the organoborates are obtained from 11B NMR spectroscopic
investigations.
The existence of organoborates can be clearly verified by specific 11B NMR signals. For each organic-
boron system two characteristic signals in the respective 11B NMR spectrum are found. In each 11B NMR
spectrum a signal at 19.3 ppm appears (Fig. 37). It can be assigned to boric acid (see chapter 4.1.1).
Further 11B chemical shifts at 2.9 ppm and 6.3 ppm for the salicylate-boron and lactate-boron system,
respectively, are observed (Fig. 37). The 11B chemical shift at 2.9 ppm is assigned to the salicylatoborate
(BSal) and that at 6.3 ppm to the lactatoborate (BLac). The 11B chemical shift of BSal is in full agreement
with literature (δBSal = 2.9 [74]). The formation of lactatoborate is less pronounced than that of
salicylatoborate (11B signal intensity of BLac is weaker than that of BSal at the same solution
composition, i.e., similar total organic and boron content, Fig. 37).
Fig. 37: 11B NMR spectra of aqueous solutions (pH 5, I = 0.1 M (NaClO4)) with (a) [B]total = 0.2 M and [lactate]total = 0.005 M
lactate, (b) [B]total = 0.2 M and [salicylate]total = 0.005 M; scaling factors of the organoborate signals are given.
Obviously, the ring size of the organoborate has a stronger influence on the 11B chemical shift of the
respective organoborate than the nature of the organic moiety (e.g., inductive effect) bound to the
“B(OR)4−“ unit. The 11B chemical shift of BSal (2.9 ppm), possessing a six-membered ring, is remarkably
more upfield shifted than that of BLac (6.3 ppm), where a five-membered ring is formed. The ring size
effect on the 11B chemical shift of organoborates and, therefore, the differentiation of five-membered
and six-membered organoborates is also known from literature [69], [82], [126] (see also chapter
3.2.2). The nature of the organic moiety in the “B(OR)4−“ unit has only a slight influence on the
11B chemical shift of the organoborate compared to the impact of the ring size. Regardless of the ring
size, the carbonyl group typically induces downfield shifts of about 1-2 ppm:
Results and Discussion
85
BLac (five-membered ring, carbonyl group): δ = 6.3 ppm,
ethane-1,2-diol borate (five-membered ring, no carbonyl group): δ = 5.6 ppm [69],
BSal (six-membered ring, carbonyl group): δ = 2.9 ppm,
propane-1,3-diol borate (six-membered ring, no carbonyl group): δ = 1.0 ppm [69].
Regarding the working hypothesis (see chapter 2.4), from the 11B NMR studies of organoborates it can
be stated that the Eu(III) complexation with organoborates should be not significantly influenced by
the nature of the organic moieties at the “B(OR)4−“ unit. The possible effect of the organoborate ring
size on the reactivity of the “B(OR)4−“ unit concerning Eu(III) interaction is at that time not assessable
and will be discussed later (see chapter 4.2.2).
The average formation constants KBL of BSal and BLac according to Eq. 48 are given in Table 26:
Table 26: Average formation constants KBL (according to Eq. 48) of salicylatoborate and lactatoborate determined within
this work (values in bold), pH = 5, I = 0.1 M (NaClO4), T = 22 °C, deviation: 2σσσσ....
organo-
borate lg KBL lg K0
BLa
salicylato-
borate
1.10 ± 0.14b
1.04c [165], 1.05b [74], 1.03c [170],
1.23d [171], 1.28c [172]
1.10 ± 0.14
lactato-
borate
0.57 ± 0.22b
0.60d [167], 0.96d [173], 0.52b [174]
0.57 ± 0.22
a extrapolation to infinite dilution according to Davies approach [37], b NMR spectroscopy, c photometry, d potentiometry
Single values for KBL determined for different composed solutions are given in Table A-4 (see appendix).
With these values the average value of KBL in Table 26 are calculated.
For BSal and BLac averaged formation constants lg KBL = 1.10 ± 0.14 and 0.57 ± 0.22, respectively, were
obtained. These values are comparable with literature data (see Table 26). The reaction according to
Eq. 48 is isocoulombic. Hence, the extrapolation to infinite dilution by the Davies approach [37] does
not change the value of lg KBL determined at I = 0.1 M.
A speciation calculation for the salicylate-boron and lactate-boron systems is shown in Fig. 38. In each
case the amount of the respective organoborate reaches its maximum at pH 5-6. At pH > 8 the
organoborate content distinctly decreases, because the concentration of available boric acid decreases
(Eq. 47). Thus, the optimum pH for the existence of organoborates is in the range pKa(organic acid) <
pH < pKa(boric acid). This correlation is described in detail by Van Duin et al. [70].
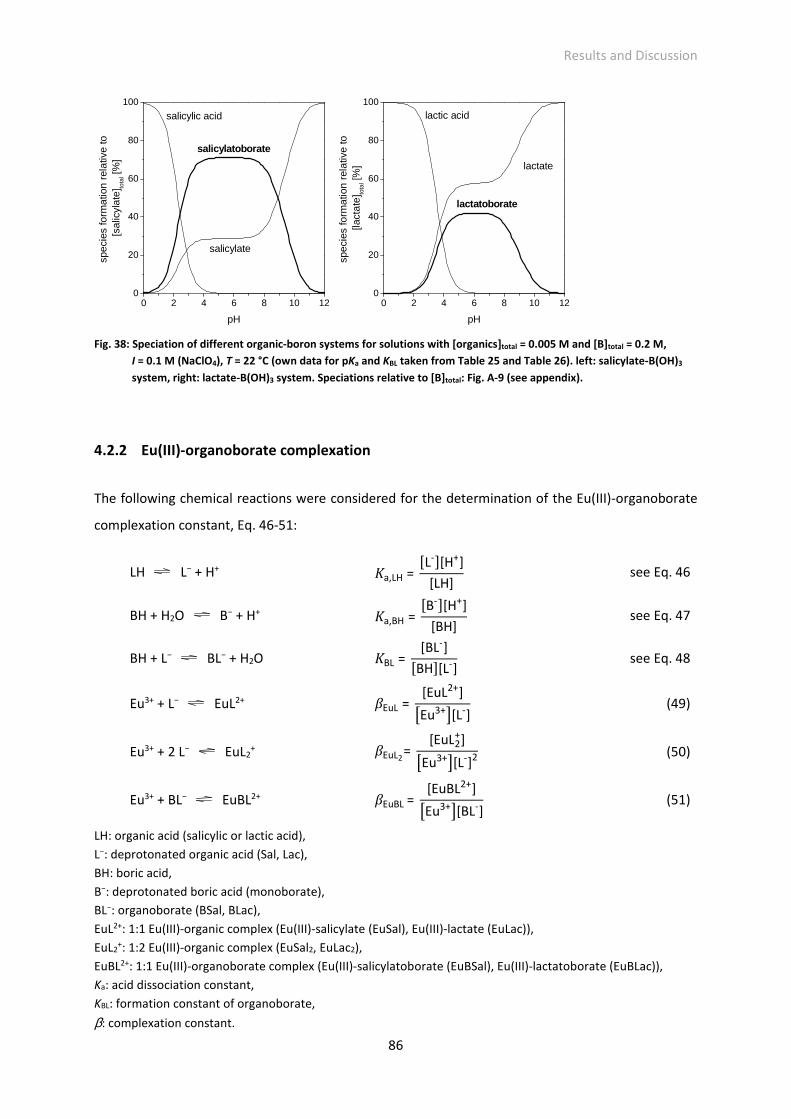
Results and Discussion
86
Fig. 38: Speciation of different organic-boron systems for solutions with [organics]total = 0.005 M and [B]total = 0.2 M,
I = 0.1 M (NaClO4), T = 22 °C (own data for pKa and KBL taken from Table 25 and Table 26). left: salicylate-B(OH)3
system, right: lactate-B(OH)3 system. Speciations relative to [B]total: Fig. A-9 (see appendix).
4.2.2 Eu(III)-organoborate complexation
The following chemical reactions were considered for the determination of the Eu(III)-organoborate
complexation constant, Eq. 46-51:
LH L− + H+ �a,LH = [L-][H+]
[LH] see Eq. 46
BH + H2O B− + H+ �a,BH = [B-][H+]
[BH] see Eq. 47
BH + L− BL− + H2O �BL = [BL-]
[BH][L-] see Eq. 48
Eu3+ + L− EuL2+ �EuL = [EuL2+]
REu3+S[L-] (49)
Eu3+ + 2 L− EuL2+ �EuL2
= [EuL2
+]
REu3+S[L-]2 (50)
Eu3+ + BL− EuBL2+ �EuBL = [EuBL2+]
REu3+S[BL-] (51)
LH: organic acid (salicylic or lactic acid),
L−: deprotonated organic acid (Sal, Lac),
BH: boric acid,
B−: deprotonated boric acid (monoborate),
BL−: organoborate (BSal, BLac),
EuL2+: 1:1 Eu(III)-organic complex (Eu(III)-salicylate (EuSal), Eu(III)-lactate (EuLac)),
EuL2+: 1:2 Eu(III)-organic complex (EuSal2, EuLac2),
EuBL2+: 1:1 Eu(III)-organoborate complex (Eu(III)-salicylatoborate (EuBSal), Eu(III)-lactatoborate (EuBLac)),
Ka: acid dissociation constant,
KBL: formation constant of organoborate,
β: complexation constant.
0 2 4 6 8 10 120
20
40
60
80
100
spec
ies
form
atio
n re
lativ
e to
[s
alic
ylat
e]to
tal [%
]
pH
0 2 4 6 8 10 120
20
40
60
80
100
lactatoborate
lactate
lactic acid
salicylate
salicylatoborate
salicylic acid
spec
ies
form
atio
n re
lativ
e to
[la
ctat
e]to
tal [
%]
pH
Results and Discussion
87
The required pKa values for the organic acids and boric acid, and organoborate formation constants KBL
for the determination of the Eu(III)-organoborate complexation constant are given in Table 25 and
Table 26, respectively.
For the determination of the Eu(III)-organoborate complexation constant the reaction of incompletely
converted carboxylate into the respective organoborate with Eu(III) have to be considered. The Eu(III)-
salicylate and Eu(III)-lactate complexation constants are determined with TRLFS or obtained from
literature. Values for βEuLn (L = Sal/Lac, n = 1, 2) are summarized in Table 27. Own determined values
show a good agreement with literature data (Table 27). These Eu(III)-organic complexation constants
and spectroscopic data are involved in the determination of βEuBL. Particularly for the lactate system,
the 1:2 Eu(III) complex is required (see Eu(III)-salicylate/lactate speciation calculations, Fig. A-10, see
appendix), because this species (in contrast to the EuSal2 species) is a dominant species under the used
conditions.
Table 27: Eu(III) complexation constants ββββEuL and ββββEuL2 (according to Eq. 49 and Eq. 50), I = 0.1 M (NaClO4), T = 22-25 °C,
deviation: 2σσσσ.
L− lg ββββEuL lg ββββ0000EuL
a lg ββββEuL2
salicylate 2.10 ± 0.26b,c 2.74 ± 0.26b,c
1.84c [175]
2.02d [34]
3.56c [175]
3.84d [34]
lactate 2.51c [33]
3.09d,e [176]
4.45c [33]
5.38d,e [176]
a extrapolation to infinite dilution according to Davies approach [37], b own determined value, c TRLFS, d potentiometry, e Dy(III) instead of Eu(III)
Obviously, βLnLac and βLnLac2 determined with different experimental methods deviate significantly from
each other [177]. Therefore, upper and lower limits for βEuLac and βEuLac2 were used to determine upper
and lower limits of βEuBLac.
Eu(III)-salicylatoborate (EuBSal) complexation
The presence of boric acid influences the Eu(III)-salicylate system.
The luminescence spectrum of the Eu(III)-salicylate solution (Fig. 39, I) clearly differs from the spectrum
in presence of boric acid under the same conditions (Fig. 39, II). An intensity decrease of the 5D0 → 7F0
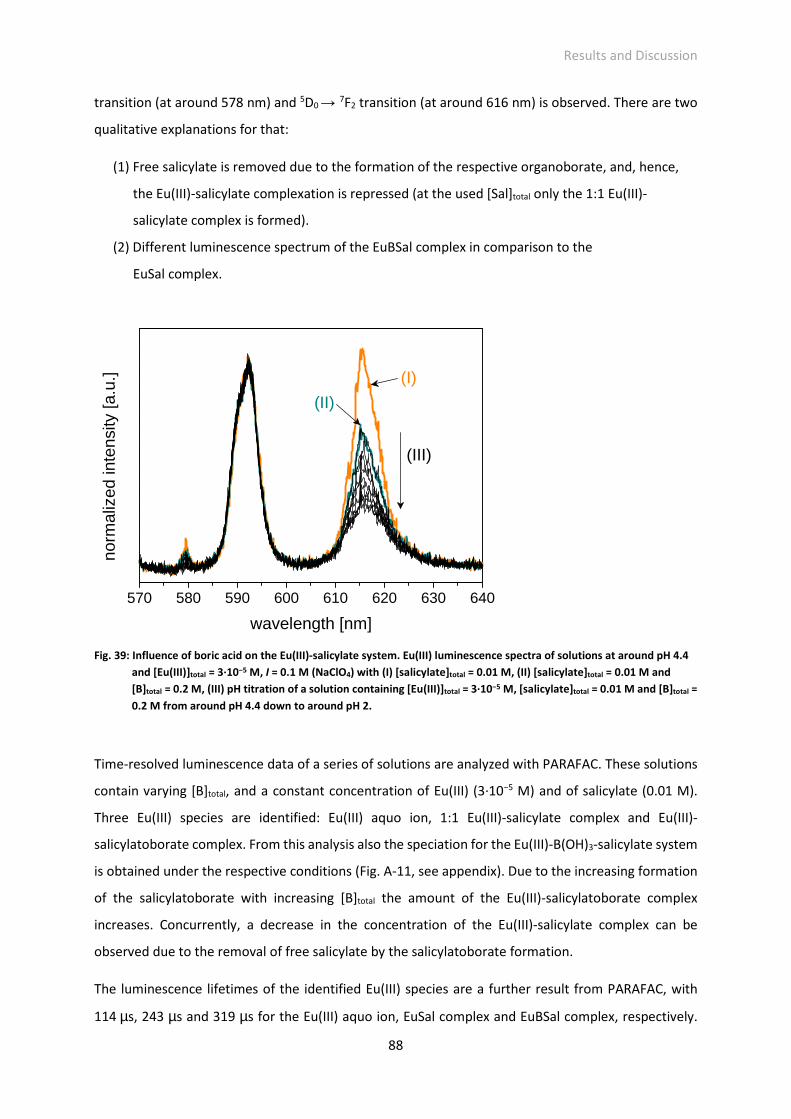
Results and Discussion
88
transition (at around 578 nm) and 5D0 → 7F2 transition (at around 616 nm) is observed. There are two
qualitative explanations for that:
(1) Free salicylate is removed due to the formation of the respective organoborate, and, hence,
the Eu(III)-salicylate complexation is repressed (at the used [Sal]total only the 1:1 Eu(III)-
salicylate complex is formed).
(2) Different luminescence spectrum of the EuBSal complex in comparison to the
EuSal complex.
Fig. 39: Influence of boric acid on the Eu(III)-salicylate system. Eu(III) luminescence spectra of solutions at around pH 4.4
and [Eu(III)]total = 3·10−5 M, I = 0.1 M (NaClO4) with (I) [salicylate]total = 0.01 M, (II) [salicylate]total = 0.01 M and
[B]total = 0.2 M, (III) pH titration of a solution containing [Eu(III)]total = 3·10−5 M, [salicylate]total = 0.01 M and [B]total =
0.2 M from around pH 4.4 down to around pH 2.
Time-resolved luminescence data of a series of solutions are analyzed with PARAFAC. These solutions
contain varying [B]total, and a constant concentration of Eu(III) (3·10−5 M) and of salicylate (0.01 M).
Three Eu(III) species are identified: Eu(III) aquo ion, 1:1 Eu(III)-salicylate complex and Eu(III)-
salicylatoborate complex. From this analysis also the speciation for the Eu(III)-B(OH)3-salicylate system
is obtained under the respective conditions (Fig. A-11, see appendix). Due to the increasing formation
of the salicylatoborate with increasing [B]total the amount of the Eu(III)-salicylatoborate complex
increases. Concurrently, a decrease in the concentration of the Eu(III)-salicylate complex can be
observed due to the removal of free salicylate by the salicylatoborate formation.
The luminescence lifetimes of the identified Eu(III) species are a further result from PARAFAC, with
114 µs, 243 µs and 319 µs for the Eu(III) aquo ion, EuSal complex and EuBSal complex, respectively.
570 580 590 600 610 620 630 640
(II)
(I)
(III)
norm
aliz
ed in
tens
ity [a
.u.]
wavelength [nm]
Results and Discussion
89
The luminescence lifetime (interpreted as an indication for the comparability of Eu(III)-borate
complexes) of EuBSal does not agree with the Eu(III)-(poly)borate complex exhibiting a lifetime of
around 150 µs (determined with PARAFAC). The luminescence lifetime of the EuBSal complex is
strongly increased in comparison to the Eu(III)-(poly)borate complex. However, a Eu(III) complexation
with BSal similar to other borate ligands (BLac, (poly)borate) is expected (see the hypothesis, chapter
2.4). The strongly enhanced luminescence lifetime of EuBSal in comparison to the Eu(III) aquo ion
expresses a significant loss of water (6 to 7 water molecules) from the first hydration shell of Eu(III).
This high water loss caused by a single ligand is interpreted as an exceeding required space of the BSal
ligand. Already the 1:1 EuSal complex exhibits a strongly raised luminescence lifetime (for that a loss
of 5 to 6 water molecules is calculated) in comparison to, for instance, the 1:1 EuLac complex (146 µs
(see below), corresponding to a loss of 2 to 3 water molecules), with lactate as a smaller compound
and stronger ligand.
TRLFS pH titration series of solutions with 3·10−5 M Eu(III) and variable [B]total as well [salicylate]total
were carried out (I = 0.1 M, NaClO4). For each titration step a stationary luminescence spectrum was
measured (e.g., Fig. 39, III). Their analysis yielded values of lg βEuBSal (I = 0.1 M, NaClO4) according to
Eq. 51. They are listed in Table A-5 (see appendix). For the EuBSal complex an average of lg β0EuBSal =
2.57 ± 0.48 was determined (Table 28).
Eu(III) speciation (Fig. A-11, see appendix) obtained by PARAFAC of time-resolved luminescence data
([Eu(III)]total = 3·10−5 M, [salicylate]total = 0.01 M, [B]total = variable) and analysis of it provided a value of
lg β0EuBSal = 2.75 ± 0.32 (Table 28).
In the following the results of 11B NMR spectroscopic studies are presented. It can be shown that Eu(III)
induces a shift of the 11B NMR signal of the salicylatoborate (Fig. 40). This Eu(III) induced NMR signal
shift is used to determine βEuBSal according to Eq. 51. The procedure is described in Schott et al. [108].
The resulting lg βEuBSal from two different NMR data sets (Table A-6, see appendix) are summarized in
Table 28.
The complexation constant for the EuBSal complex deduced from TRLFS and 11B NMR spectroscopic
data agree very well (Table 28) and βEuBSal can be reproduced by both methods. Eventually, this gave
lg β0EuBSal = 2.69 ± 0.17 (averaged over all lg βEuBSal values (TRLFS, NMR and PARAFAC) of Table 28).
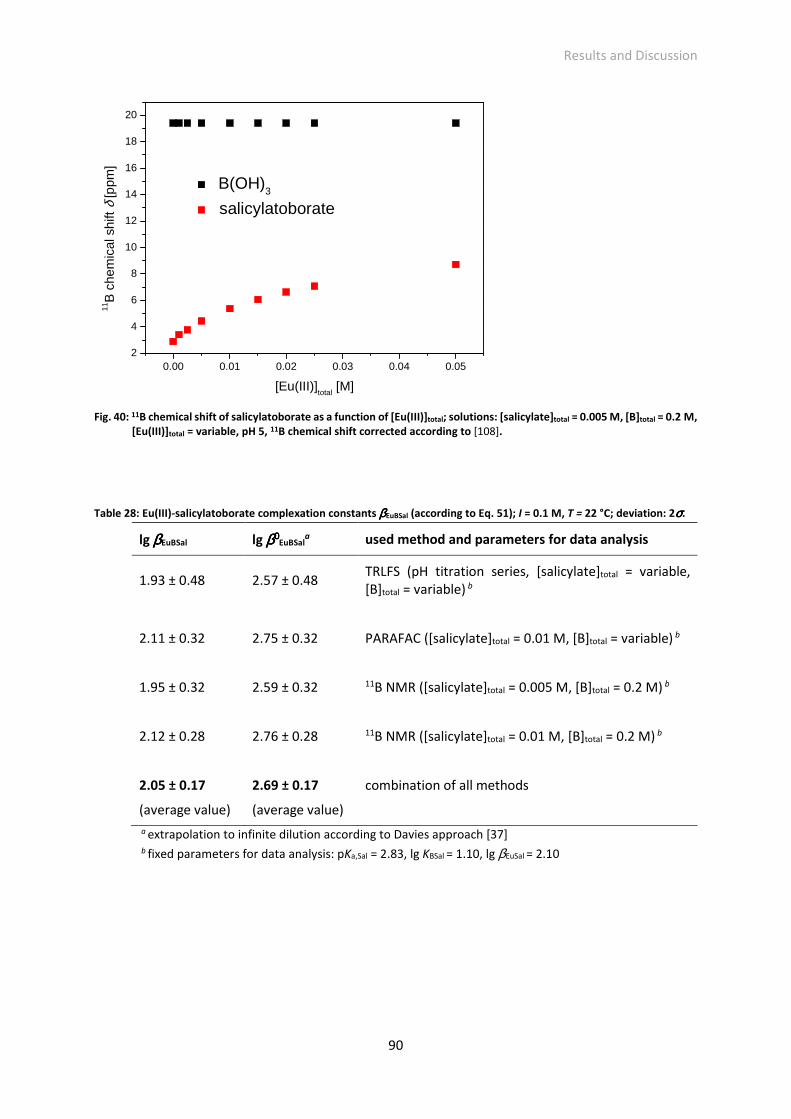
Results and Discussion
90
Fig. 40: 11B chemical shift of salicylatoborate as a function of [Eu(III)]total; solutions: [salicylate]total = 0.005 M, [B]total = 0.2 M, [Eu(III)]total = variable, pH 5, 11B chemical shift corrected according to [108].
Table 28: Eu(III)-salicylatoborate complexation constants ββββEuBSal (according to Eq. 51); I = 0.1 M, T = 22 °C; deviation: 2σσσσ.
lg ββββEuBSal lg ββββ0000EuBSal
a used method and parameters for data analysis
1.93 ± 0.48 2.57 ± 0.48 TRLFS (pH titration series, [salicylate]total = variable, [B]total = variable) b
2.11 ± 0.32 2.75 ± 0.32 PARAFAC ([salicylate]total = 0.01 M, [B]total = variable) b
1.95 ± 0.32 2.59 ± 0.32 11B NMR ([salicylate]total = 0.005 M, [B]total = 0.2 M) b
2.12 ± 0.28 2.76 ± 0.28 11B NMR ([salicylate]total = 0.01 M, [B]total = 0.2 M) b
2.05 ± 0.17
(average value)
2.69 ± 0.17
(average value)
combination of all methods
a extrapolation to infinite dilution according to Davies approach [37] b fixed parameters for data analysis: pKa,Sal = 2.83, lg KBSal = 1.10, lg βEuSal = 2.10
0.00 0.01 0.02 0.03 0.04 0.052
4
6
8
10
12
14
16
18
20
B(OH)3
salicylatoborate
11B
che
mic
al s
hift
δ [p
pm]
[Eu(III)]total
[M]
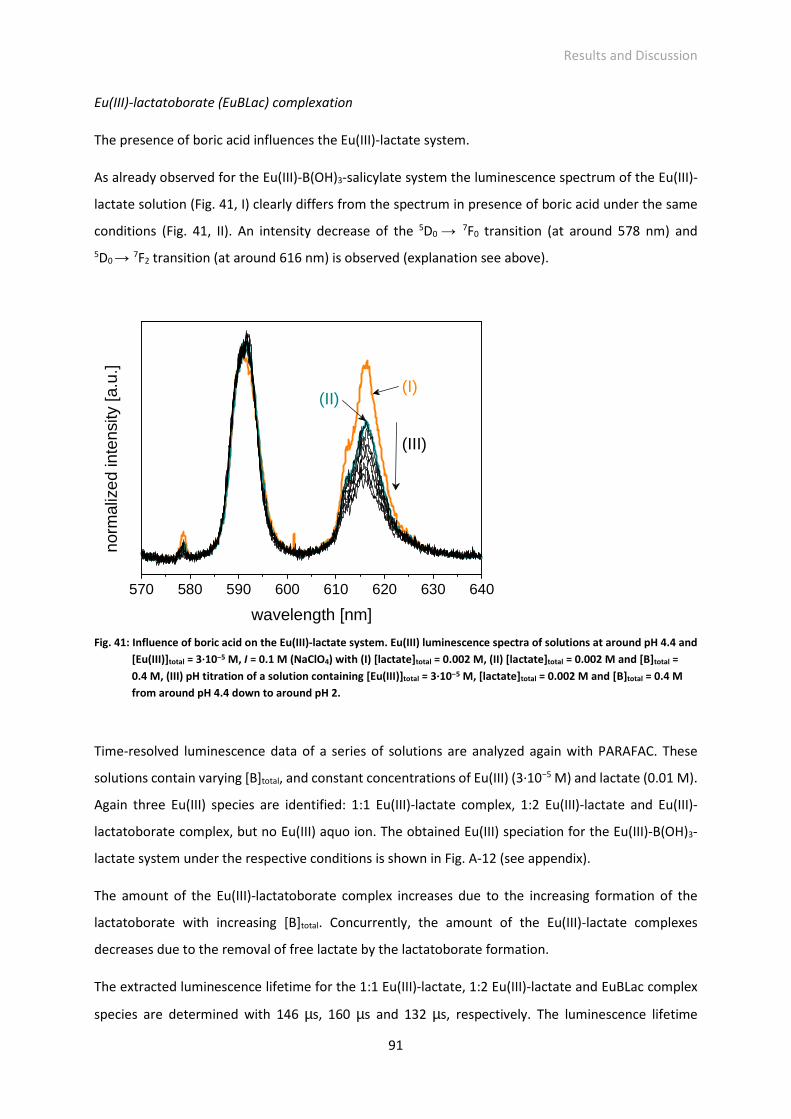
Results and Discussion
91
Eu(III)-lactatoborate (EuBLac) complexation
The presence of boric acid influences the Eu(III)-lactate system.
As already observed for the Eu(III)-B(OH)3-salicylate system the luminescence spectrum of the Eu(III)-
lactate solution (Fig. 41, I) clearly differs from the spectrum in presence of boric acid under the same
conditions (Fig. 41, II). An intensity decrease of the 5D0 → 7F0 transition (at around 578 nm) and
5D0 → 7F2 transition (at around 616 nm) is observed (explanation see above).
Fig. 41: Influence of boric acid on the Eu(III)-lactate system. Eu(III) luminescence spectra of solutions at around pH 4.4 and
[Eu(III)]total = 3·10−5 M, I = 0.1 M (NaClO4) with (I) [lactate]total = 0.002 M, (II) [lactate]total = 0.002 M and [B]total =
0.4 M, (III) pH titration of a solution containing [Eu(III)]total = 3·10−5 M, [lactate]total = 0.002 M and [B]total = 0.4 M
from around pH 4.4 down to around pH 2.
Time-resolved luminescence data of a series of solutions are analyzed again with PARAFAC. These
solutions contain varying [B]total, and constant concentrations of Eu(III) (3·10−5 M) and lactate (0.01 M).
Again three Eu(III) species are identified: 1:1 Eu(III)-lactate complex, 1:2 Eu(III)-lactate and Eu(III)-
lactatoborate complex, but no Eu(III) aquo ion. The obtained Eu(III) speciation for the Eu(III)-B(OH)3-
lactate system under the respective conditions is shown in Fig. A-12 (see appendix).
The amount of the Eu(III)-lactatoborate complex increases due to the increasing formation of the
lactatoborate with increasing [B]total. Concurrently, the amount of the Eu(III)-lactate complexes
decreases due to the removal of free lactate by the lactatoborate formation.
The extracted luminescence lifetime for the 1:1 Eu(III)-lactate, 1:2 Eu(III)-lactate and EuBLac complex
species are determined with 146 µs, 160 µs and 132 µs, respectively. The luminescence lifetime
570 580 590 600 610 620 630 640
(III)
(II)(I)
norm
aliz
ed in
tens
ity [a
.u.]
wavelength [nm]
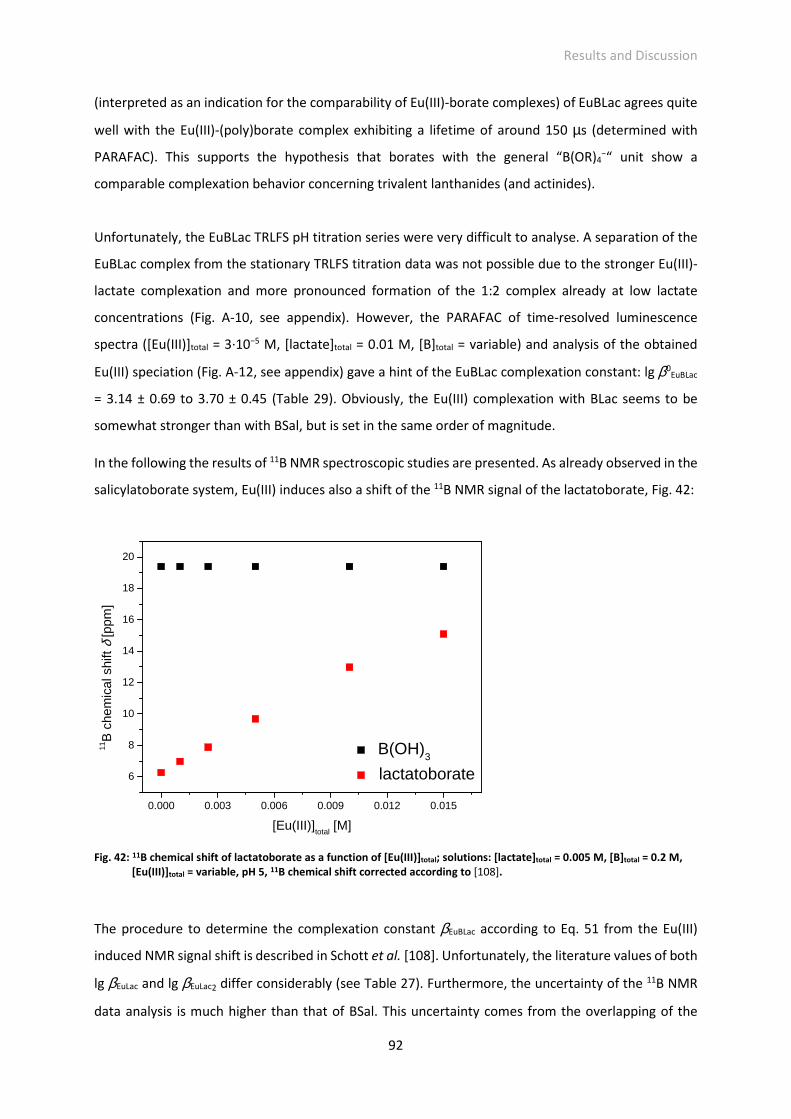
Results and Discussion
92
(interpreted as an indication for the comparability of Eu(III)-borate complexes) of EuBLac agrees quite
well with the Eu(III)-(poly)borate complex exhibiting a lifetime of around 150 µs (determined with
PARAFAC). This supports the hypothesis that borates with the general “B(OR)4−“ unit show a
comparable complexation behavior concerning trivalent lanthanides (and actinides).
Unfortunately, the EuBLac TRLFS pH titration series were very difficult to analyse. A separation of the
EuBLac complex from the stationary TRLFS titration data was not possible due to the stronger Eu(III)-
lactate complexation and more pronounced formation of the 1:2 complex already at low lactate
concentrations (Fig. A-10, see appendix). However, the PARAFAC of time-resolved luminescence
spectra ([Eu(III)]total = 3·10−5 M, [lactate]total = 0.01 M, [B]total = variable) and analysis of the obtained
Eu(III) speciation (Fig. A-12, see appendix) gave a hint of the EuBLac complexation constant: lg β0EuBLac
= 3.14 ± 0.69 to 3.70 ± 0.45 (Table 29). Obviously, the Eu(III) complexation with BLac seems to be
somewhat stronger than with BSal, but is set in the same order of magnitude.
In the following the results of 11B NMR spectroscopic studies are presented. As already observed in the
salicylatoborate system, Eu(III) induces also a shift of the 11B NMR signal of the lactatoborate, Fig. 42:
Fig. 42: 11B chemical shift of lactatoborate as a function of [Eu(III)]total; solutions: [lactate]total = 0.005 M, [B]total = 0.2 M, [Eu(III)]total = variable, pH 5, 11B chemical shift corrected according to [108].
The procedure to determine the complexation constant βEuBLac according to Eq. 51 from the Eu(III)
induced NMR signal shift is described in Schott et al. [108]. Unfortunately, the literature values of both
lg βEuLac and lg βEuLac2 differ considerably (see Table 27). Furthermore, the uncertainty of the 11B NMR
data analysis is much higher than that of BSal. This uncertainty comes from the overlapping of the
0.000 0.003 0.006 0.009 0.012 0.015
6
8
10
12
14
16
18
20
B(OH)3
lactatoborate
11B
che
mic
al s
hift
δ [p
pm]
[Eu(III)]total
[M]
Results and Discussion
93
11B NMR signals of BLac and B(OH)3 with increasing Eu(III) concentration (Fig. 42). Even the
replacement of Eu(III) by Pr(III) or Dy(III) did not succeed: The expected upfield shift of the 11B NMR
signal of BLac (as in the case of 1H NMR signals [110]) did not occur. The signal separation of BLac and
B(OH)3 is possible only up to [Eu(III)]total = 0.015 M.
In the frame of the described uncertainties (overlapping of NMR signals, deviation in literature data
for βEuLac and βEuLac2) a lg βEuBLac range from NMR data (Table A-6, see appendix) is derived (Table 29). If
the lower limits of the Eu(III)-lactate complexation constants are valid (e.g., lg βEuLac = 2.51 and lg βEuLac2
= 4.45 from [33]) lg β0EuBLac ranges from 2.58 ± 0.22 to 2.82 ± 0.26. If, in contrast, the upper limits of
βEuLac and βEuLac2 are valid (e.g., lg βDyLac = 3.09 and lg βDyLac2 = 5.38 [176]; Dy(III) as Eu(III) analog) lg β0
EuBLac
ranges from 3.01 ± 0.26 to 3.25 ± 0.15. These results are summarized in Table 29:
Table 29: Eu(III)-lactatoborate complexation constants ββββEuBLac (according to Eq. 51); I = 0.1 M, T = 22 °C; deviation: 2σσσσ.
lg ββββEuBLac lg ββββ0000EuBLac
a used method and parameters for data analysis
1.94 ± 0.22
to
2.18 ± 0.26
2.58 ± 0.22
to
2.82 ± 0.26
11B NMR ([lactate]total = 0.005 M, [B]total = 0.2 M) b
2.37 ± 0.26
to
2.61 ± 0.15
3.01 ± 0.26
to
3.25 ± 0.15
11B NMR ([lactate]total = 0.005 M, [B]total = 0.2 M) c
2.50 ± 0.69 3.14 ± 0.69 PARAFAC ([lactate]total = 0.01 M, [B]total = variable) b
3.06 ± 0.45 3.70 ± 0.45 PARAFAC ([lactate]total = 0.01 M, [B]total = variable) c
a extrapolation to infinite dilution according to Davies approach [37] b fixed parameters for data analysis: pKa,Lac = 3.73, lg KBLac = 0.57, lg βEuLac = 2.51 [33], lg βEuLac2
= 4.45 [33] c fixed parameters for data analysis: pKa,Lac = 3.73, lg KBLac = 0.57, lg βDyLac = 3.09 [176], lg βDyLac2
= 5.38 [176]
Taking into account the uncertainties, the complexation constants of both EuBSal and EuBLac are in
the range lg β0EuBL = 2.6 to 3.3. Higher deviations are a result from the high complexity of the
equilibrium systems combined with the uncertainties of all involved constants.
The ring size of the organoborate and the organic moieties bound to the “B(OR)4−“ unit seem to have
only a small influence on lg βEuBL.
The complexation constants of the studied Eu(III)-organoborate complexes are well comparable to the
complexation constant of the Eu(III)-(poly)borate complex (lg β01 = 2.7-3.2) studied in this work (see
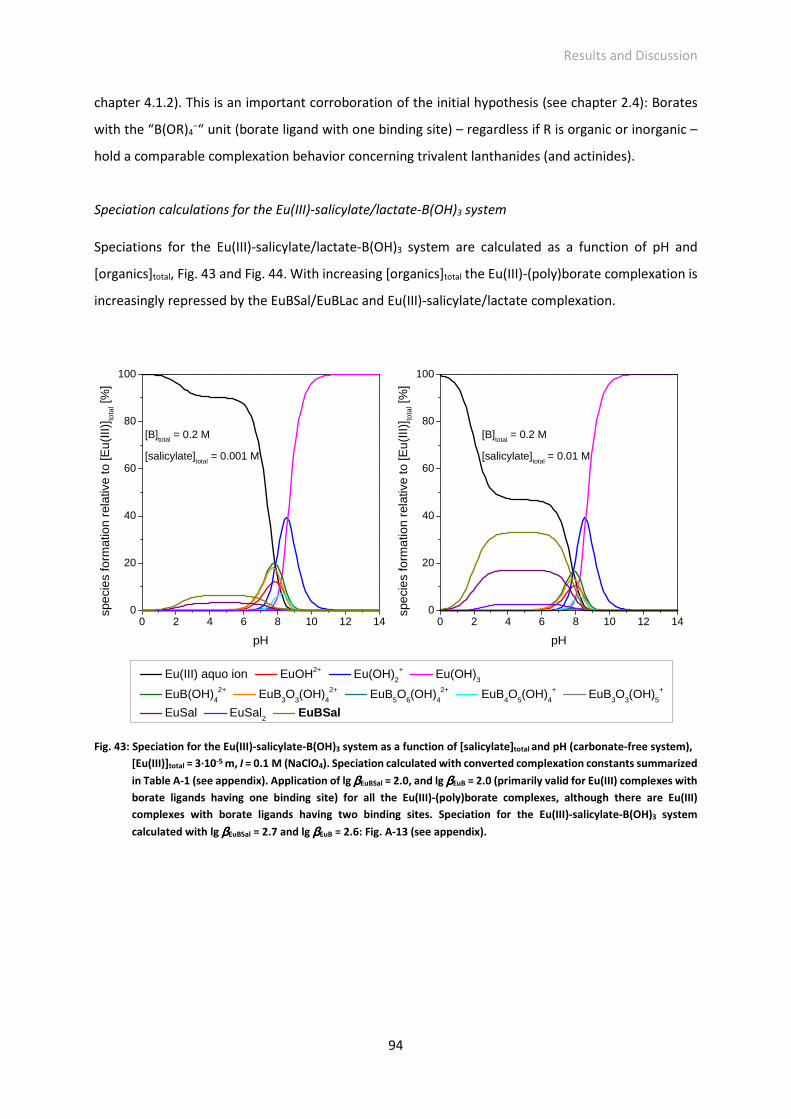
Results and Discussion
94
chapter 4.1.2). This is an important corroboration of the initial hypothesis (see chapter 2.4): Borates
with the “B(OR)4−“ unit (borate ligand with one binding site) – regardless if R is organic or inorganic –
hold a comparable complexation behavior concerning trivalent lanthanides (and actinides).
Speciation calculations for the Eu(III)-salicylate/lactate-B(OH)3 system
Speciations for the Eu(III)-salicylate/lactate-B(OH)3 system are calculated as a function of pH and
[organics]total, Fig. 43 and Fig. 44. With increasing [organics]total the Eu(III)-(poly)borate complexation is
increasingly repressed by the EuBSal/EuBLac and Eu(III)-salicylate/lactate complexation.
Fig. 43: Speciation for the Eu(III)-salicylate-B(OH)3 system as a function of [salicylate]total and pH (carbonate-free system),
[Eu(III)]total = 3·10-5 m, I = 0.1 M (NaClO4). Speciation calculated with converted complexation constants summarized
in Table A-1 (see appendix). Application of lg ββββEuBSal = 2.0, and lg ββββEuB = 2.0 (primarily valid for Eu(III) complexes with
borate ligands having one binding site) for all the Eu(III)-(poly)borate complexes, although there are Eu(III)
complexes with borate ligands having two binding sites. Speciation for the Eu(III)-salicylate-B(OH)3 system
calculated with lg ββββEuBSal = 2.7 and lg ββββEuB = 2.6: Fig. A-13 (see appendix).
0 2 4 6 8 10 12 140
20
40
60
80
100
[B]total
= 0.2 M
[salicylate]total
= 0.01 M
spec
ies
form
atio
n re
lativ
e to
[Eu(
III)]
tota
l [%
]
pH
Eu(III) aquo ion EuOH2+ Eu(OH)
2+ Eu(OH)
3
EuB(OH)42+
EuB3O
3(OH)
42+
EuB5O
6(OH)
42+
EuB4O
5(OH)
4+ EuB
3O
3(OH)
5+
EuSal EuSal2 EuBSal
[B]total = 0.2 M
[salicylate]total
= 0.001 M
0 2 4 6 8 10 12 140
20
40
60
80
100
spec
ies
form
atio
n re
lativ
e to
[Eu(
III)]
tota
l [%
]
pH
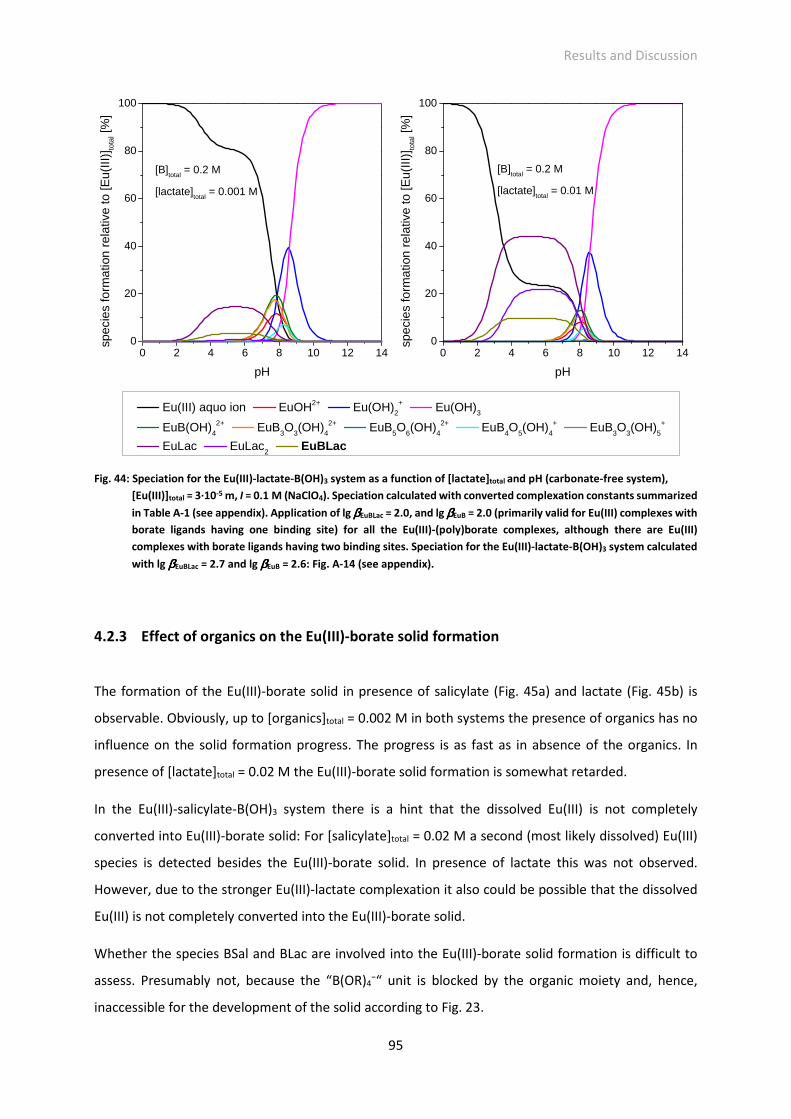
Results and Discussion
95
Fig. 44: Speciation for the Eu(III)-lactate-B(OH)3 system as a function of [lactate]total and pH (carbonate-free system),
[Eu(III)]total = 3·10-5 m, I = 0.1 M (NaClO4). Speciation calculated with converted complexation constants summarized
in Table A-1 (see appendix). Application of lg ββββEuBLac = 2.0, and lg ββββEuB = 2.0 (primarily valid for Eu(III) complexes with
borate ligands having one binding site) for all the Eu(III)-(poly)borate complexes, although there are Eu(III)
complexes with borate ligands having two binding sites. Speciation for the Eu(III)-lactate-B(OH)3 system calculated
with lg ββββEuBLac = 2.7 and lg ββββEuB = 2.6: Fig. A-14 (see appendix).
4.2.3 Effect of organics on the Eu(III)-borate solid formation
The formation of the Eu(III)-borate solid in presence of salicylate (Fig. 45a) and lactate (Fig. 45b) is
observable. Obviously, up to [organics]total = 0.002 M in both systems the presence of organics has no
influence on the solid formation progress. The progress is as fast as in absence of the organics. In
presence of [lactate]total = 0.02 M the Eu(III)-borate solid formation is somewhat retarded.
In the Eu(III)-salicylate-B(OH)3 system there is a hint that the dissolved Eu(III) is not completely
converted into Eu(III)-borate solid: For [salicylate]total = 0.02 M a second (most likely dissolved) Eu(III)
species is detected besides the Eu(III)-borate solid. In presence of lactate this was not observed.
However, due to the stronger Eu(III)-lactate complexation it also could be possible that the dissolved
Eu(III) is not completely converted into the Eu(III)-borate solid.
Whether the species BSal and BLac are involved into the Eu(III)-borate solid formation is difficult to
assess. Presumably not, because the “B(OR)4−“ unit is blocked by the organic moiety and, hence,
inaccessible for the development of the solid according to Fig. 23.
0 2 4 6 8 10 12 140
20
40
60
80
100
[B]total
= 0.2 M
[lactate]total
= 0.01 M
spec
ies
form
atio
n re
lativ
e to
[Eu(
III)]
tota
l [%
]
pH
Eu(III) aquo ion EuOH2+ Eu(OH)2
+ Eu(OH)3
EuB(OH)42+
EuB3O
3(OH)
42+
EuB5O
6(OH)
42+
EuB4O
5(OH)
4+ EuB
3O
3(OH)
5+
EuLac EuLac2 EuBLac
[B]total
= 0.2 M
[lactate]total
= 0.001 M
0 2 4 6 8 10 12 140
20
40
60
80
100
spec
ies
form
atio
n re
lativ
e to
[Eu(
III)]
tota
l [%
]
pH
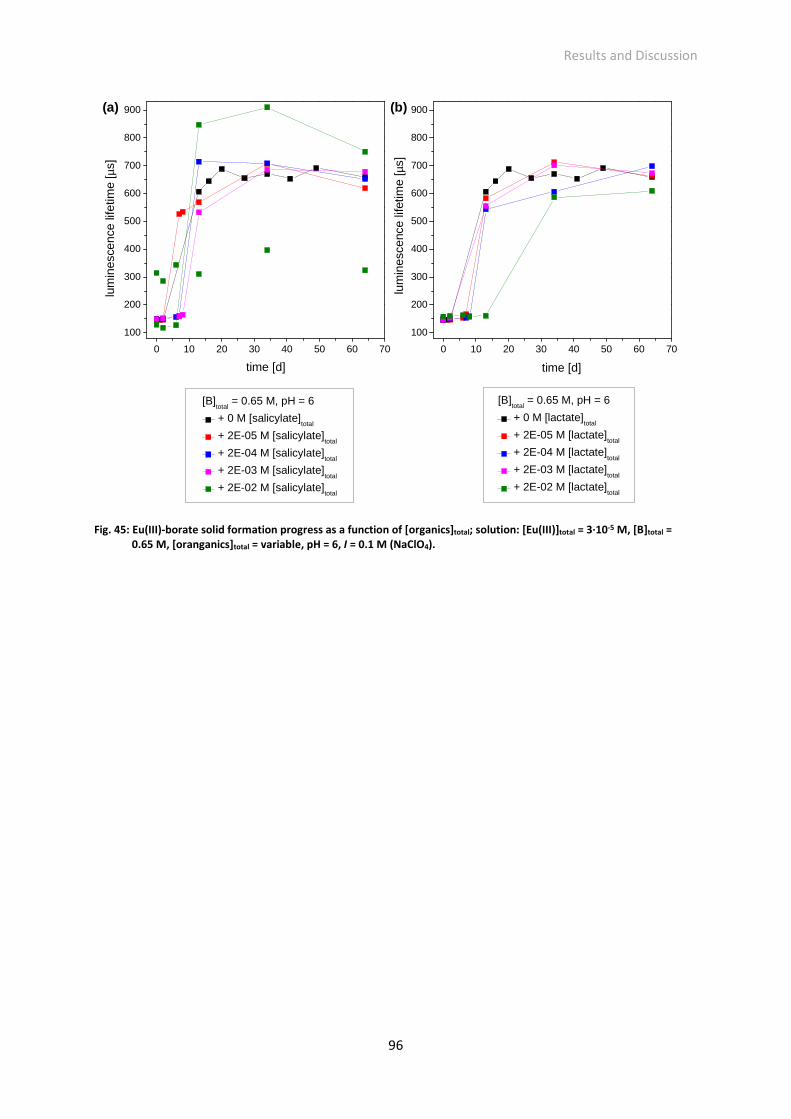
Results and Discussion
96
Fig. 45: Eu(III)-borate solid formation progress as a function of [organics]total; solution: [Eu(III)]total = 3·10-5 M, [B]total = 0.65 M, [oranganics]total = variable, pH = 6, I = 0.1 M (NaClO4).
0 10 20 30 40 50 60 70
100
200
300
400
500
600
700
800
900 (b)
[B]total
= 0.65 M, pH = 6
+ 0 M [lactate]total
+ 2E-05 M [lactate]total
+ 2E-04 M [lactate]total
+ 2E-03 M [lactate]total
+ 2E-02 M [lactate]total
time [d]
lum
ines
cenc
e lif
etim
e [µ
s][B]
total = 0.65 M, pH = 6
+ 0 M [salicylate]total
+ 2E-05 M [salicylate]total
+ 2E-04 M [salicylate]total
+ 2E-03 M [salicylate]total
+ 2E-02 M [salicylate]total
lum
ines
cenc
e lif
etim
e [µ
s]
time [d]
(a)
0 10 20 30 40 50 60 70
100
200
300
400
500
600
700
800
900
Conclusion and Outlook
97
5 Conclusion and outlook
The aim of this work was to determine a valid An(III)/Ln(III)-borate complexation constant based on a
molecular process understanding. For this purpose the complexation of Eu(III) with different borate
species was studied. At the beginning of these studies there were no reference points and
contradictory opinions concerning the An(III)/Ln(III)-borate complexation. Furthermore, the
experimental conditions were difficult to set (e.g., hydrolysis as strongly competing reaction). Hence,
different approaches were worked out: The Eu(III) complexation was studied in the presence of
polyborate and organoborate species in the acidic pH range. Both approaches for the complexation
studies came to the same result: The Eu(III)-borate complexation is in the range lg β0 = 2.6 – 3.3. The
application of different experimental approaches and complementary spectroscopic methods provides
a high confidence in this range. The value (range) can now serve as a generic An(III)/Ln(III)-borate
complexation constant to be used in modelling efforts.
The Eu(III)-borate complexation is weak. The potential of dissolved borate species to mobilize trivalent
actinides and lanthanides in a nuclear waste repository is estimated to be low in comparison to other,
much stronger complexing agents being present, e.g., hydroxide, carbonate, citrate, or EDTA.
However, this statement strongly depends on the concentration relations of a brine formed due to a
possible water ingress. Of course, the An(III)/Ln(III)-borate complexation can become dominant if
borate compounds occur in high amounts and are a pronounced solution species (see Fig. 19).
Furthermore, the formation of Eu(III)-(poly)borate solid phases already at slight acidic pH assists the
retention of trivalent actinides and lanthanides in a nuclear waste repository. On the contrary, colloid-
like An(III)/Ln(III)-borate particles, formed at low ionic strengths, and the presence of organics, e.g.,
lactate and salicylate, delaying and repressing the Eu(III)-borate solid formation could enhance the
An(III)/Ln(III) mobility.
Further investigations on the actinide/lanthanide-borate interactions are definitely required to get a
comprehensive view on this system. In the following possible directions and suggestions for future
research on this system are given.
An insight into the complexation reaction between trivalent europium and borate species in the acidic
pH range is given within this work and the order of magnitude of this complexation is ascertained. A
further challenge would be the quantification of this complexation in the alkaline pH range, where
higher complexes (1:2, 1:3) and ternary complexes (e.g., borate-hydroxide species) can be expected.
Evidence for An(III)/Ln(III)-ligand-hydroxide complexes are, for instance, the Cm(III)-NO3 system, where
the ternary Cm(III)-OH-NO3 species is formed [178], and the Cm(III)-glycolate system, where a ternary
Cm(III)-hydroxide-glycolate complex was found [179] under alkaline conditions.
Conclusion and Outlook
98
The knowledge got from the Eu(III)-borate system should be transferred to An(III)-borate systems to
confirm the lanthanide-actinide analogy. First complexation experimentsXVI with Cm(III) and Am(III) in
polyborate solution yielded a good agreement with results of the Eu(III)-borate complexation (weak
complexation). However, these studies should be expanded and reproduced.
Furthermore, the complexation studies should be expanded to other actinides such as uranium and
oxidation states of actinides above +3. Concurrently, it should be investigated whether solid formation
processes are also observable for other actinides and oxidation states as described in this work.
Temperature has an effect on all equilibrium reactions. Hence, in the context of nuclear waste
repositories, where higher temperatures are expectedXVII, the effect of this parameter on the actinide-
borate complexation and, where necessary, precipitation has to be studied. This requires knowledge
about the borate speciation at elevated temperatures.
Unfortunately, it was not possible to grow single crystals of the found Eu(III)-borate solid, thus direct
information about the solid structure is still missing. However, under ambient conditions such a
preparation is a challenge (at hydrothermal conditions several crystalline Ln/An-borate compounds
were already synthesized, see chapter 2.3.4). A Y(III)-borate, produced in an analogous manner as the
Eu(III)-borate, precipitates as amorphous solid converting into very small crystals (too small or grow
together for X-ray diffraction analysis). Parameter variation (temperature, concentration, solvent, etc.)
could yield bigger crystals.
Very interesting is the detection of small colloid-like particles of the Eu(III)-borate solid at an ionic
strength of 0.1 m (NaClO4/NaCl). Their occurrence could be a mobilization pathway for An(III)/Ln(III) in
a nuclear waste repository. It is worthwhile to characterize these colloid-like particles properly
(determination of the size (distribution), composition, structure, etc.) and to comprehend their
existence and stability ranges (as a function of ionic strength, concentration, temperature, etc.). It
would be also interesting, whether these particles are detectable also in actinide (various oxidation
states) systems.
As a part of cement borate compounds could play a role in the mobilization or immobilization of
actinide waste stored in such a concrete waste form. In which direction the mobilization potential of
borate compound in cement systems develops should be part of future research projects.
XVI Am(III)/Cm(III)-(poly)borate complexation studies, in part as a function of ionic strength (NaCl), were carried out in a project extension after the Ph.D. studies. A publication to these investigations is planned. At least the results are published in a final report of the BMWi funded project “Rückhaltung endlagerrelevanter Radionuklide im natürlichen Tongestein und in salinaren Systemen” (Contract No. 02E11021). XVII Peak value up to 200°C in salt deposit based repositories, up to 100°C in clay rock based repositories [1].
Experimental details
99
6 Experimental details
Chemicals and Materials. Chemicals of analytical grade and deionized water were used for the
preparation of solutions. Europium oxide Eu2O3, europium chlorid EuCl3·6H2O, sodium salicylate,
sodium L-lactate (all from Sigma-Aldrich), and boric acid B(OH)3 (Merck) were used without further
purification. The total boron concentration, [B]total, was adjusted with boric acid. Solutions were
prepared under ambient conditions (T = 22 °C, pCO2 = 10−3.5 bar). The ionic strength of the solutions
was adjusted with sodium perchlorate NaClO4·H2O (Merck) or sodium chloride NaCl (Roth). A 0.03 M
Eu(III) stock solution was prepared by dissolving Eu2O3 in 0.1 M HClO4. Its concentration was verified
with ICP-MS (Elan 9000, Perkin Elmer). The pH measurements (adjustment, potentiometric titration)
were carried out with a glass electrode (SCHOTT), which was calibrated with buffer solutions (NIST/PTB
standard buffers). The pH of the solutions was adjusted with NaOH or HClO4 (both from Merck) of
various concentration (0.1-2 M).
Determination of pKa of boric, salicylic and lactic acid. Potentiometric titrations of solutions containing
varying concentrations of boric acid, sodium salicylate or sodium lactate were carried out. The
solutions were prepared at around pH 2 and I = 0.1 M (NaClO4) under ambient conditions. 20 mL of
each solution were automatically titrated (736 GP Titrino/TiNet 2.50, Metrohm) up to pH 12 under N2-
atmosphere in a temperature adjustable titration vessel at 22 °C by adding 0.1 M NaOH (carbonate-
free). The dynamic titration procedure was used. 60 seconds after adding of NaOH the pH
measurements were initiated. The titration data were analyzed with the computer program
Hyperquad2008 [135] to determine the pKa values of boric, salicylic and lactic acid.
B(OH)3-polyborate speciation studies. Samples with variable [B]total (0.02 m to 0.7 m) were prepared
under ambient conditions at pHc 5 and pHc 6, Im = 0.1 m (NaClO4/NaCl). The high total boron
concentrations (up to 0.7 M) were used to induce the formation of polyborate species. After the
dissolution of boric acid the samples were stored at least for one week to establish the boric acid-
polyborate equilibrium. Then, appropriate amounts of NaClO4·H2O or NaCl were added to the B(OH)3-
polyborate solutions to adjust Im = 1 m and Im = 3 m. These solutions were equilibrated at least one
week again. Then, the samples were measured by means of 11B NMR spectroscopy.
Eu(III)-(poly)borate complexation studies. Samples with variable [B]total (up to 0.7 m) were prepared at
around pHc 6 and Im = 0.1 m (NaClO4) as described for the solutions prepared for the B(OH)3-polyborate
speciation studies. 2 g of a polyborate containing solution were transferred into a quartz cuvette and
the 0.03 m Eu(III) stock solution was added to adjust a total Eu(III) concentration of 3·10-5 m. The
samples were titrated at the same day (to exclude precipitation) from around pHc 6 down to around
Experimental details
100
pHc 2 by adding appropriate amounts of HClO4. After each titration step a stationary europium
luminescence spectrum was measured. The complex formation constant of the Eu(III)-(poly)borate
complex were determined from the stationary TRLFS data with the computer program HypSpec
(version 1.1.18) [136]. Simplifications and approximations for the calculations of this complexation
system are described in the chapter 4.1.2.
Eu(III)-borate solid formation studies in suspension. Samples with variable [B]total (0.2 m to 0.7 m) were
prepared at pHc 5 and pHc 6, and variable ionic strength (Im = 0.1 m to 3 m, NaClO4/NaCl) as described
for the solution prepared for the B(OH)3-polyborate speciation studies. A total Eu(III) concentration of
3·10-5 m was adjusted with the 0.03 m Eu(III) stock solution. Directly after the addition of the Eu(III) a
part of each solution was retained and stored. The remaining part of each solution was observed over
a year in increasing intervals (days, weeks, months) and in each investigation date stationary and time-
resolved europium luminescence spectra were recorded.
The stationary and time-resolved spectra of each solution recorded one day after the Eu(III) addition
(Eu(III)-borate solid formation can be excluded) were used for the determination of complexation
constants with the computer program HypSpec (version 1.1.18) [136] and to identify the amount of
species with PARAFAC. PARAFAC was carried out by Björn Drobot (Helmholtz-Zentrum Dresden-
Rossendorf, Institute of Resource Ecology) using the N-way toolbox for Matlab [180]. The applied
settings for the analysis are described in Drobot et al. [138].
The retained samples were studied in a final analysis after a year and more. They were filtered through
different membranes (1.2 µm and 0.2 µm pore size). The initial solution and its filtrates were studied
with TRLFS (determination of europium species), DLS (confirmation of particles) and ICP-MS
(determination of europium content).
Synthesis and isolation of the Eu(III)-borate solid. A solution containing [B]total = 0.7 m was prepared at
pHc 6 and variable ionic strength (Im = 0.1 m, 1 m, 3 m, NaClO4/NaCl) as described for the solution
prepared for the B(OH)3-polyborate speciation studies. Then, EuCl3·6H2O (solid) was added to adjust
0.01 m total Eu(III) concentration. The pH had to be re-adjusted after the Eu(III) addition. A white solid
precipitated rapidly. The solid was stored in its solution for three weeks and then separated from the
liquid phase by centrifugation. The solid was washed several times with deionized water and then dried
by lyophilization.
The Eu(III)-borate solid was studied with XRD, IR spectroscopy, solid-state 11B NMR spectroscopy and
solid-state site-selective TRLFS.
Formation of organoborates. Solutions with varying [B]total and total salicylate/lactate content were
prepared at pH 5 and I = 0.1 M (NaClO4) under ambient conditions and equilibrated for one day. [B]total
Experimental details
101
was in large excess so the 1:1 organoborate compound is formed exclusively. Then, 11B NMR
measurements of the solutions were carried out. The organoborate formation constants KBL were
calculated from the 11B NMR data by means of the software HySS (version 4.0.31) [137]. The
equilibrium reactions Eq. 46 to Eq. 48 (see chapter 4.2.1) were considered for the analysis procedure.
KBL was iteratively determined by varying the KBL value until the calculated free boric acid and
organoborate concentrations were equal to those determined by 11B NMR spectroscopy (integration
of the concentration proportional 11B signal areas).
Eu(III)-salicylate complexation studies. Solutions with variable total salicylate concentration were
prepared at pH 5.5 and I = 0.1 M (NaClO4) under ambient conditions. 2 mL of each solution were
transferred into a quartz cuvette. 2 µL of the 0.03 M Eu(III) stock solution were added to this volume
to set a total Eu(III) concentration of 3·10−5 M. The samples were titrated from pH 5.5 down to around
pH 2 by adding HClO4. After each titration step a stationary europium TRLFS spectrum was recorded.
The data sets were analyzed with the software HypSpec (version 1.1.18) [136] to determine the
complexation constants of the EuSal complex βEuSal (requirement for the Eu(III)-organoborate
complexation studies).
Eu(III)-organoborate complexation studies. For the TRLFS studies solutions with variable total
salicylate/lactate content and [B]total were prepared at around pH 5 and I = 0.1 M (NaClO4) under
ambient conditions. [B]total was adjusted up to 0.4 M to provide high-level conversion of the organic
compound into the respective organoborate. One day after the solution preparation, 2 mL of a solution
with adjusted total organic content and [B]total were transferred into a quartz cuvette. 2 µL of the
0.03 M Eu(III) stock solution were added to this volume to adjust a total Eu(III) concentration of
3·10−5 M. The samples were titrated from around pH 5 down to around pH 2 by adding HClO4. After
each titration step a stationary and, in some cases, also a time-resolved europium luminescence
spectrum was recorded. The stationary TRLFS data from the pH titration series were analyzed with the
software HypSpec (version 1.1.18) [136] to determine the complexation constants of the EuBSal
complex.
The time-resolved luminescence spectra of the Eu(III)-salicylate/lactate-B(OH)3 system were analyzed
with PARAFAC (carried out by Björn Drobot, Helmholtz-Zentrum Dresden-Rossendorf, Institute of
Resource Ecology, using the N-way toolbox for Matlab [180]). The applied settings for the analysis are
described in Drobot et al. [138]. From PARAFAC the luminescence lifetimes of pure Eu(III) species,
individual luminescence spectra and Eu(III) species distributions were obtained. The Eu(III) species
distributions serve as basis to calculate the complexation constant for the Eu(III)-organoborate
complexes. βEuBL was determined by an iterative procedure using the program HySS (version 4.0.31)
[137]. The equilibrium reactions Eq. 46 to Eq. 51 (see chapter 4.2.2) were considered for the analysis
Experimental details
102
procedure. βEuBL was iteratively determined by varying the βEuBL value until the calculated
concentrations of the Eu(III) species in the respective system were equal to those determined by
PARAFAC.
For the 11B NMR measurements solutions with constant total organic content (0.005 M or 0.01 M
salicylate; 0.005 M lactate) and [B]total (0.2 M) were prepared at pH 5 under ambient conditions. One
day after EuCl3·6H2O was added to adjust a total Eu(III) concentration up to 0.05 M. The complexation
constants of the Eu(III)-organoborate complexes βEuBL were calculated from 11B NMR spectroscopic
data by analyzing the Eu(III) concentration dependent chemical shift of the organoborate. A detailed
description of this procedure is given in Schott et al. [108]. Knowing the information of the fractions of
free and Eu(III) bound organoborate complexation constants were determined by the an iterative
procedure using the speciation program HySS (version 4.0.31) [137]. The complexation constant βEuBL
of the Eu(III)-organoborate in the speciation model was varied until the calculated free and Eu(III)
bound organoborate concentrations are equal to those determined by 11B NMR spectroscopy.
11B nuclear magnetic resonance spectroscopy (11B NMR). 11B NMR spectra of boron containing solutions
were recorded on a Varian Unity Inova 400 spectrometer and an Agilent DD2-600 MHz NMR system
with a field strength of 9.4 T (corresponding 11B resonance frequency: 128.4 MHz) and 14.1 T
(corresponding 11B resonance frequency: 192.4 MHz), respectively. A 5 mm broadband probe was
used. The 11B chemical shifts (δ) are referenced externally with respect to BF3 etherate in CDCl3. A 5 mm
NMR tube (quartz), containing the aqueous solution and a D2O filled coaxial insert for deuterium lock,
was used. As the investigations were performed in H2O the 1H water signal was suppressed. In presence
of Eu(III) the observed 11B chemical shift was corrected by subtraction of the bulk susceptibility
contribution term (∆δsusc) [108]. The NMR measurements were carried out in cooperation with Jérôme
Kretzschmar (Helmholtz-Zentrum Dresden-Rossendorf, Institute of Resource Ecology).
Solid-state 11B NMR experiments were carried out on a Bruker Ascend 800 spectrometer, operating at
17.6 T (corresponding 11B resonance frequency: 256.8 MHz). A CP/MAS TriGamma probe and a 2.5 mm
ZrO2 rotor were used. The sample was rotated at a spinning frequency of 16 kHz. The solid-state NMR
measurements were carried out in cooperation with Prof. Dr. Eike Brunner and Dr. Silvia Paasch at the
Technische Universität Dresden, Institute of Bioanalytical Chemistry.
The NMR spectra were qualitatively and quantitatively analyzed (peak search and integration) with the
computer program MestReNova (version 6.0.2) [181] by Jérôme Kretzschmar (Helmholtz-Zentrum
Dresden-Rossendorf, Institute of Resource Ecology).
Experimental details
103
Time-resolved laser-induced fluorescence spectroscopy (TRLFS). All measurements were carried out
using a time gated detection mode to avoid contributions from strayed and scattered light and to
resolve the temporal characteristics of the europium luminescence.
Measurements of the europium containing solutions/suspensions were carried out with a Nd:YAG-
OPO laser system (Continuum). Europium luminescence spectra of the stirred solutions/suspensions
were recorded with a constant excitation wavelength of 394 nm, a time window of 1 ms, a pulse energy
of 2-3 mJ and an optical multichannel analyzer (monochromator and spectrograph MS 257 and iCCD
camera Andor iStar, all LOT-Oriel). Recording conditions for stationary spectra: wavelength range
565 nm to 650 nm, 1200 line mm-1 grating, 0.2 nm resolution, 3000 accumulations. Recording
conditions for time-resolved spectra: wavelength range 440 nm to 780 nm, 300 line mm-1 grating,
0.7 nm resolution, 100 accumulations, delay time steps 15 µs to 90 µs.
The solid-state TRLFS measurements at room temperature (22 °C) were performed using a Nd:YAG-
OPO laser system (Nd:YAG: Quanta Ray, Spectra Physics; OPO: Flexi Scan, GWU-Lasertechnik). A Eu(III)-
borate solid sample was placed into a self-made sample holder. The europium luminescence was
detected with a spectrograph (MS 257, LOT-Oriel) equipped with an iCCD camera (iStar DH720, Andor
Technology).
For the solid-state TRLFS measurements at low temperature (T < 5 K) a Eu(III)-borate solid sample was
placed in a copper sample holder on top of a cooling head. The low temperature was achieved using a
closed cycle helium cryostate (Helium compressor unit CKW-21, Sumitomi Heavy Industries Ltd.;
Turbolab 80, Oerlikon Leybod Vacuum; Model 331 Temperature Controller, Lakeshore). As excitation
source a dye laser (Cobra Stretch, Sirah Laser- und Plasmatechnik) and as laser dye Pyrromethen 597
(Sirah Laser- und Plasamatechnik) were used. The laser dye was excited by the second harmonic output
of a Nd:YAG laser (Quanta Ray, Spectra Physics). The excitation light was guided through an optical
fiber to the Eu(III) sample. The emitted luminescence light was transferred through the same optical
fiber to a spectrograph (Shamrock SR-303i, Andor Technology) equipped with an iCCD camera (iStar
DH 720, Andor Technology).
The solid-state TRLFS measurements were carried out at the University of Potsdam, Institute of
Chemistry (Physical Chemistry), in cooperation with Prof. Dr. Michael U. Kumke and Dr. Sascha Eidner.
TRLFS data analysis. Different luminescence transition bands characterize the europium luminescence
spectrum. In particular the 5D0 → 7F0 (at around 578 nm; forbidden for the Eu(III) aquo ion), 5D0 → 7F1
(at around 592 nm) and 5D0 → 7F2 (at around 616 nm) transition bands are analyzed. TRLFS spectra
were analyzed with the software Origin™ (version 7.5G, OriginLab Corporation). Stationary and time-
resolved raw spectra were baseline corrected. Stationary luminescence spectra were normalized to
Experimental details
104
the 5D0 → 7F1 transition band, because the luminescence intensity of this transition is independent
from the chemical environment of Eu(III) [117]. Furthermore, the F1/F2 ratio can be calculated.
The luminescence lifetimes were determined according to the exponential decay equation, Eq. 33 (see
chapter 3.1.1).
Depending on the characteristic of the luminescence decay, monoexponential or biexponential decay
equations were used to fit the luminescence decay curves.
The luminescence lifetime of europium depends on the number of water molecules in the first
coordination shell of europium. They act as luminescence quenchers. In general, their substitution by
other ligands leads to an increase of the luminescence lifetime τ, except for, e.g., hydroxide, amine
and amide ligands [123]. The luminescence lifetime τ and the amount of water molecules in the first
coordination shell of Eu(III) are correlated by an empirical equation: see Eq. 34, chapter 3.1.2.
Series of time-resolved europium luminescence spectra and excitation spectra were analyzed with
PARAFAC. The PARAFAC was carried out by Björn Drobot (Helmholtz-Zentrum Dresden-Rossendorf,
Institute of Resource Ecology) using the N-way toolbox for Matlab [180]. The applied settings for the
analysis are described in Drobot et al. [138].
Infrared spectroscopy (IR). FT-IR spectra were recorded on a Bruker Vertex 70v Fourier transform
infrared spectrometer in the range 7500 cm-1 - 370 cm-1 with a resolution of 4 cm-1. The samples were
prepared as KBr pellets. The IR measurements were carried out by Karsten Heim (Helmholtz-Zentrum
Dresden-Rossendorf, Institute of Resource Ecology).
Powder X-ray diffraction (powder XRD). The experiments (under proposal I-20130337) were performed
at the PETRA III synchrotron radiation source at DESY Hamburg, Germany (High Resolution Powder
Diffraction, P02.1) [182]. Synchrotron radiation with an energy of 60 keV (corresponding to λ = 0.207 Å)
was used. Diffraction patterns were collected in Debye-Scherrer-geometry with a PerkinElmer XRD
1621 area detector. The diffraction patterns were processed with the software FIT2D [183] employing
a CeO2 standard for calibration. The measurement and spectrum analysis were initiated and carried
out by Dr. Christoph Hennig (Helmholtz-Zentrum Dresden-Rossendorf, Institute of Resource Ecology)
and Dr. Sabrina Labs (Forschungszentrum Jülich, Insitute of Energy and Climate Research (IEK-6),
Nuclear Waste Management).
Scanning electron microscopy (SEM). The sample was prepared on a membrane filter (50 nm pore size)
by filtrating a Eu(III)-borate solid suspension ([B]total = 0.7 m, [Eu(III)]total = 3·10−5 m, pHc = 6). The sample
preparation was carried out by Stephan Weiss (Helmholtz-Zentrum Dresden-Rossendorf, Institute of
Resource Ecology). Scanning electron microscopy was carried out with a Hitachi S-4800 operating at
Experimental details
105
an accelerating voltage of 0.5 kV and a magnification of 50000. The SEM measurements were
performed by Elfi Christalle (Helmholtz-Zentrum Dresden-Rossendorf, Institute of Ion Beam Physics
and Material Research).
Dynamic Light Scattering (DLS). The scattered light intensity of Eu(III)-borate solid suspensions ([B]total
= 0.2 m to 0.7 m, [Eu(III)]total = 3·10−5 m, pHc = 6, Im up to 3 m NaCl/NaClO4) was detected with a photon
correlation spectrometer (Brookhaven Instruments) equipped with a laser source (argon ion laser from
LEXEL Laser) or with the Zetasizer Nano ZS (Malvern Instruments). The latter device was used to
determine particle size distributions. The DLS investigations were supervised by Stephan Weiss
(Helmholtz-Zentrum Dresden-Rossendorf, Institute of Resource Ecology).
Inductively Coupled Plasma Mass Spectrometry (ICP-MS). The determination of the europium and
boron content in a sample were performed with ICP-MS (Elan 9000, Perkin Elmer). The measurements
were carried out by the analytic department at the Institute of Resource Ecology, Helmholtz-Zentrum
Dresden-Rossendorf.
Miscellaneous. The determined values of pKa, lg KBL and lg β were extrapolated to infinite dilution,
following the extended Debye-Hückel approach as published by Davies [37]. Throughout this thesis all
given uncertainties correspond to 2σ, i.e., 95% confidence level.
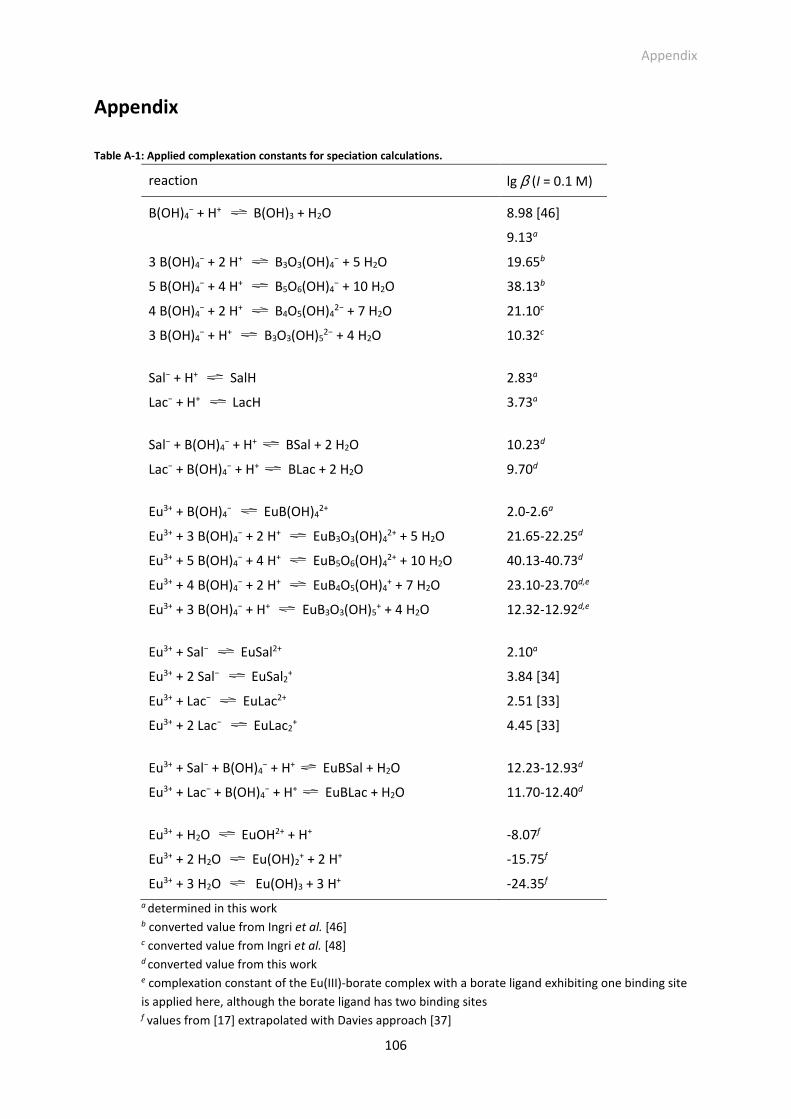
Appendix
106
Appendix
Table A-1: Applied complexation constants for speciation calculations.
reaction lg β (I = 0.1 M)
B(OH)4− + H+ B(OH)3 + H2O 8.98 [46]
9.13a
3 B(OH)4− + 2 H+ B3O3(OH)4
− + 5 H2O 19.65b
5 B(OH)4− + 4 H+ B5O6(OH)4
− + 10 H2O 38.13b
4 B(OH)4− + 2 H+ B4O5(OH)4
2− + 7 H2O 21.10c
3 B(OH)4− + H+ B3O3(OH)5
2− + 4 H2O 10.32c
Sal− + H+ SalH 2.83a
Lac− + H+ LacH 3.73a
Sal− + B(OH)4− + H+ BSal + 2 H2O 10.23d
Lac− + B(OH)4− + H+ BLac + 2 H2O 9.70d
Eu3+ + B(OH)4− EuB(OH)4
2+ 2.0-2.6a
Eu3+ + 3 B(OH)4− + 2 H+ EuB3O3(OH)4
2+ + 5 H2O 21.65-22.25d
Eu3+ + 5 B(OH)4− + 4 H+ EuB5O6(OH)4
2+ + 10 H2O 40.13-40.73d
Eu3+ + 4 B(OH)4− + 2 H+ EuB4O5(OH)4
+ + 7 H2O 23.10-23.70d,e
Eu3+ + 3 B(OH)4− + H+ EuB3O3(OH)5
+ + 4 H2O 12.32-12.92d,e
Eu3+ + Sal− EuSal2+ 2.10a
Eu3+ + 2 Sal− EuSal2+ 3.84 [34]
Eu3+ + Lac− EuLac2+ 2.51 [33]
Eu3+ + 2 Lac− EuLac2+ 4.45 [33]
Eu3+ + Sal− + B(OH)4− + H+ EuBSal + H2O 12.23-12.93d
Eu3+ + Lac− + B(OH)4− + H+ EuBLac + H2O 11.70-12.40d
Eu3+ + H2O EuOH2+ + H+ -8.07f
Eu3+ + 2 H2O Eu(OH)2+ + 2 H+ -15.75f
Eu3+ + 3 H2O Eu(OH)3 + 3 H+ -24.35f
a determined in this work b converted value from Ingri et al. [46] c converted value from Ingri et al. [48] d converted value from this work e complexation constant of the Eu(III)-borate complex with a borate ligand exhibiting one binding site
is applied here, although the borate ligand has two binding sites f values from [17] extrapolated with Davies approach [37]
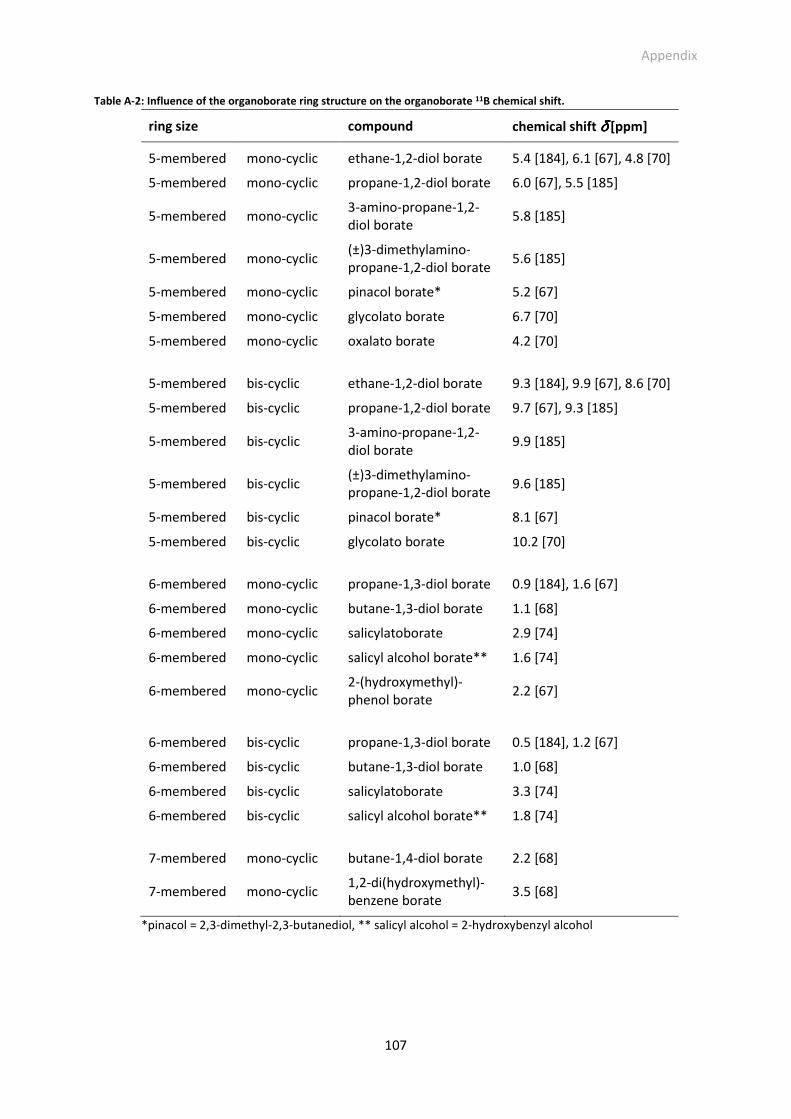
Appendix
107
Table A-2: Influence of the organoborate ring structure on the organoborate 11B chemical shift.
ring size compound chemical shift δδδδ [ppm]
5-membered mono-cyclic ethane-1,2-diol borate 5.4 [184], 6.1 [67], 4.8 [70]
5-membered mono-cyclic propane-1,2-diol borate 6.0 [67], 5.5 [185]
5-membered mono-cyclic 3-amino-propane-1,2-diol borate
5.8 [185]
5-membered mono-cyclic (±)3-dimethylamino-propane-1,2-diol borate
5.6 [185]
5-membered mono-cyclic pinacol borate* 5.2 [67]
5-membered mono-cyclic glycolato borate 6.7 [70]
5-membered mono-cyclic oxalato borate 4.2 [70]
5-membered bis-cyclic ethane-1,2-diol borate 9.3 [184], 9.9 [67], 8.6 [70]
5-membered bis-cyclic propane-1,2-diol borate 9.7 [67], 9.3 [185]
5-membered bis-cyclic 3-amino-propane-1,2-diol borate
9.9 [185]
5-membered bis-cyclic (±)3-dimethylamino-propane-1,2-diol borate
9.6 [185]
5-membered bis-cyclic pinacol borate* 8.1 [67]
5-membered bis-cyclic glycolato borate 10.2 [70]
6-membered mono-cyclic propane-1,3-diol borate 0.9 [184], 1.6 [67]
6-membered mono-cyclic butane-1,3-diol borate 1.1 [68]
6-membered mono-cyclic salicylatoborate 2.9 [74]
6-membered mono-cyclic salicyl alcohol borate** 1.6 [74]
6-membered mono-cyclic 2-(hydroxymethyl)-phenol borate
2.2 [67]
6-membered bis-cyclic propane-1,3-diol borate 0.5 [184], 1.2 [67]
6-membered bis-cyclic butane-1,3-diol borate 1.0 [68]
6-membered bis-cyclic salicylatoborate 3.3 [74]
6-membered bis-cyclic salicyl alcohol borate** 1.8 [74]
7-membered mono-cyclic butane-1,4-diol borate 2.2 [68]
7-membered mono-cyclic 1,2-di(hydroxymethyl)-benzene borate
3.5 [68]
*pinacol = 2,3-dimethyl-2,3-butanediol, ** salicyl alcohol = 2-hydroxybenzyl alcohol
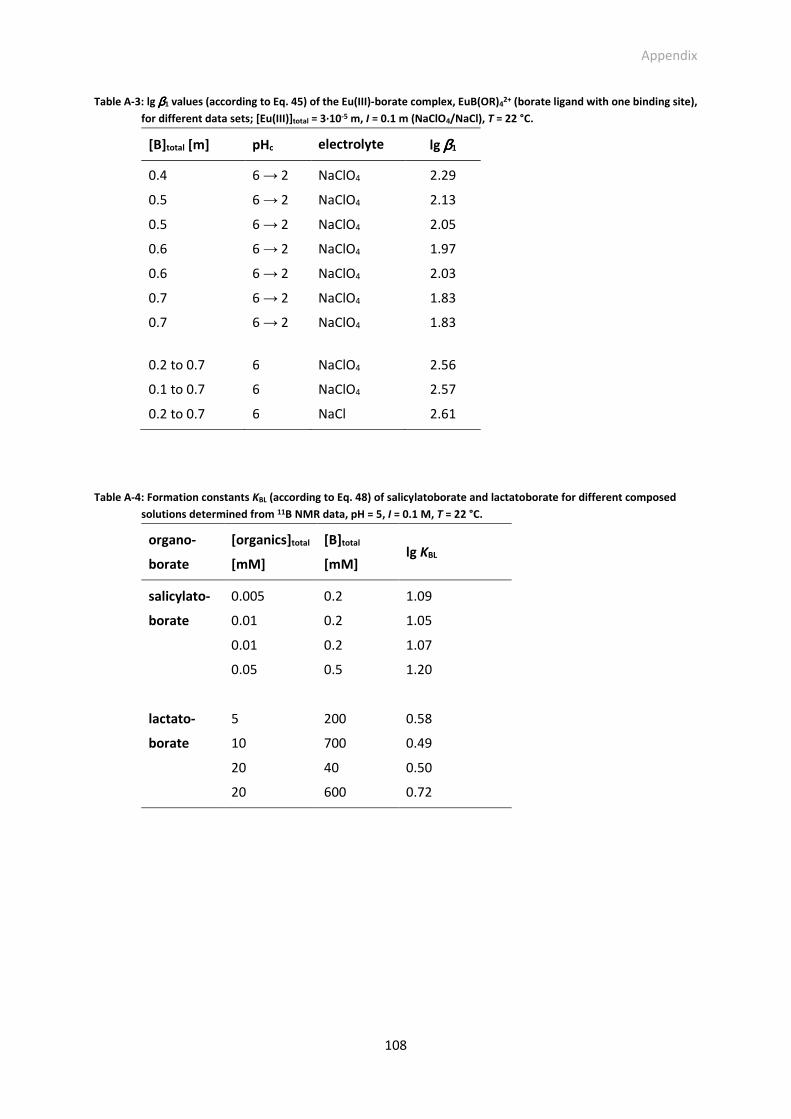
Appendix
108
Table A-3: lg ββββ1 values (according to Eq. 45) of the Eu(III)-borate complex, EuB(OR)42+ (borate ligand with one binding site),
for different data sets; [Eu(III)]total = 3·10-5 m, I = 0.1 m (NaClO4/NaCl), T = 22 °C.
[B]total [m] pHc electrolyte lg ββββ1
0.4 6 → 2 NaClO4 2.29
0.5 6 → 2 NaClO4 2.13
0.5 6 → 2 NaClO4 2.05
0.6 6 → 2 NaClO4 1.97
0.6 6 → 2 NaClO4 2.03
0.7 6 → 2 NaClO4 1.83
0.7 6 → 2 NaClO4 1.83
0.2 to 0.7 6 NaClO4 2.56
0.1 to 0.7 6 NaClO4 2.57
0.2 to 0.7 6 NaCl 2.61
Table A-4: Formation constants KBL (according to Eq. 48) of salicylatoborate and lactatoborate for different composed
solutions determined from 11B NMR data, pH = 5, I = 0.1 M, T = 22 °C.
organo-
borate
[organics]total
[mM]
[B]total
[mM] lg KBL
salicylato-
borate
0.005 0.2 1.09
0.01 0.2 1.05
0.01 0.2 1.07
0.05 0.5 1.20
lactato-
borate
5 200 0.58
10 700 0.49
20 40 0.50
20 600 0.72
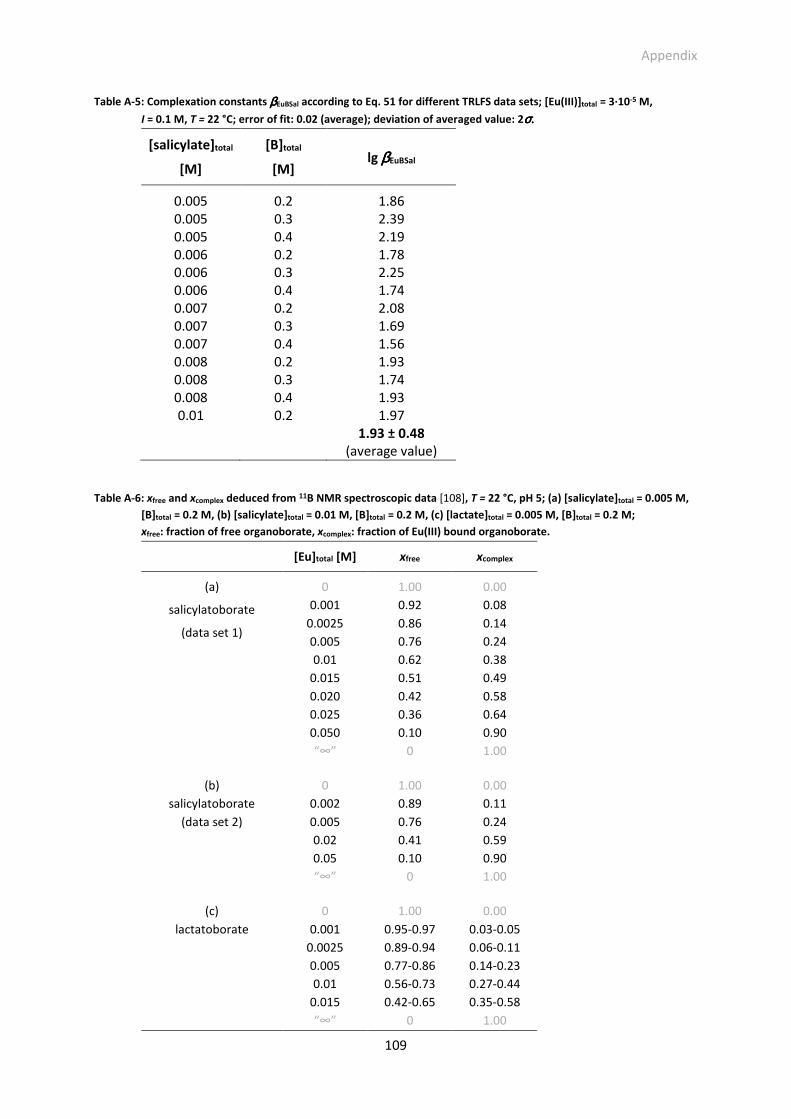
Appendix
109
Table A-5: Complexation constants ββββEuBSal according to Eq. 51 for different TRLFS data sets; [Eu(III)]total = 3·10-5 M,
I = 0.1 M, T = 22 °C; error of fit: 0.02 (average); deviation of averaged value: 2σσσσ....
[salicylate]total
[M]
[B]total
[M] lg ββββEuBSal
0.005 0.2 1.86 0.005 0.3 2.39 0.005 0.4 2.19 0.006 0.2 1.78 0.006 0.3 2.25 0.006 0.4 1.74 0.007 0.2 2.08 0.007 0.3 1.69 0.007 0.4 1.56 0.008 0.2 1.93 0.008 0.3 1.74 0.008 0.4 1.93 0.01 0.2 1.97
1.93 ± 0.48
(average value)
Table A-6: xfree and xcomplex deduced from 11B NMR spectroscopic data [108], T = 22 °C, pH 5; (a) [salicylate]total = 0.005 M,
[B]total = 0.2 M, (b) [salicylate]total = 0.01 M, [B]total = 0.2 M, (c) [lactate]total = 0.005 M, [B]total = 0.2 M;
xfree: fraction of free organoborate, xcomplex: fraction of Eu(III) bound organoborate.
[Eu]total [M] xfree xcomplex
(a)
salicylatoborate
(data set 1)
0 1.00 0.00
0.001 0.92 0.08
0.0025 0.86 0.14
0.005 0.76 0.24
0.01 0.62 0.38
0.015 0.51 0.49
0.020 0.42 0.58
0.025 0.36 0.64
0.050 0.10 0.90
“∞” 0 1.00
(b)
salicylatoborate
(data set 2)
0 1.00 0.00
0.002 0.89 0.11
0.005 0.76 0.24
0.02 0.41 0.59
0.05 0.10 0.90
“∞” 0 1.00
(c)
lactatoborate
0 1.00 0.00
0.001 0.95-0.97 0.03-0.05
0.0025 0.89-0.94 0.06-0.11
0.005 0.77-0.86 0.14-0.23
0.01 0.56-0.73 0.27-0.44
0.015 0.42-0.65 0.35-0.58
“∞” 0 1.00
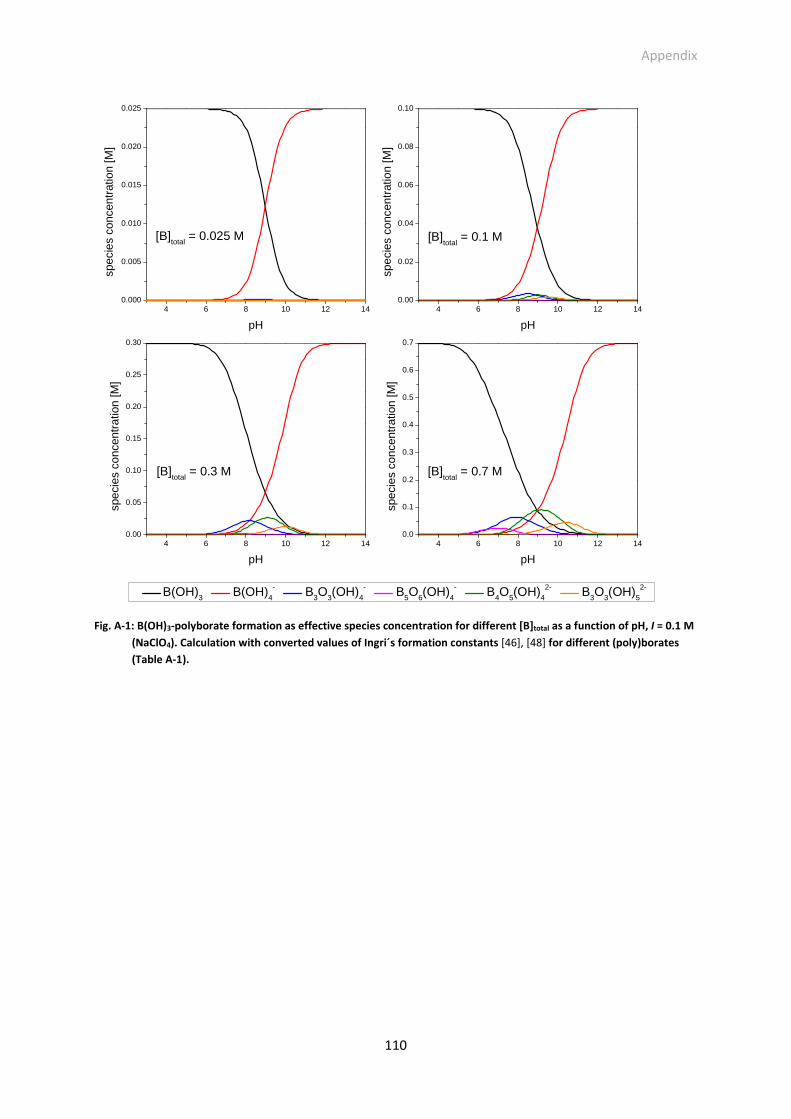
Appendix
110
Fig. A-1: B(OH)3-polyborate formation as effective species concentration for different [B]total as a function of pH, I = 0.1 M
(NaClO4). Calculation with converted values of Ingri´s formation constants [46], [48] for different (poly)borates
(Table A-1).
4 6 8 10 12 140.000
0.005
0.010
0.015
0.020
0.025
sp
ecie
s co
ncen
trat
ion
[M]
pH
4 6 8 10 12 140.00
0.02
0.04
0.06
0.08
0.10
spec
ies
conc
entr
atio
n [M
]
pH
4 6 8 10 12 140.00
0.05
0.10
0.15
0.20
0.25
0.30
spec
ies
conc
entr
atio
n [M
]
pH
4 6 8 10 12 140.0
0.1
0.2
0.3
0.4
0.5
0.6
0.7
[B]total
= 0.7 M[B]total = 0.3 M
[B]total
= 0.1 M
B(OH)3 B(OH)4- B3O3(OH)4
- B5O6(OH)4
- B4O5(OH)4
2- B3O3(OH)5
2-
spec
ies
conc
entr
atio
n [M
]
pH
[B]total = 0.025 M
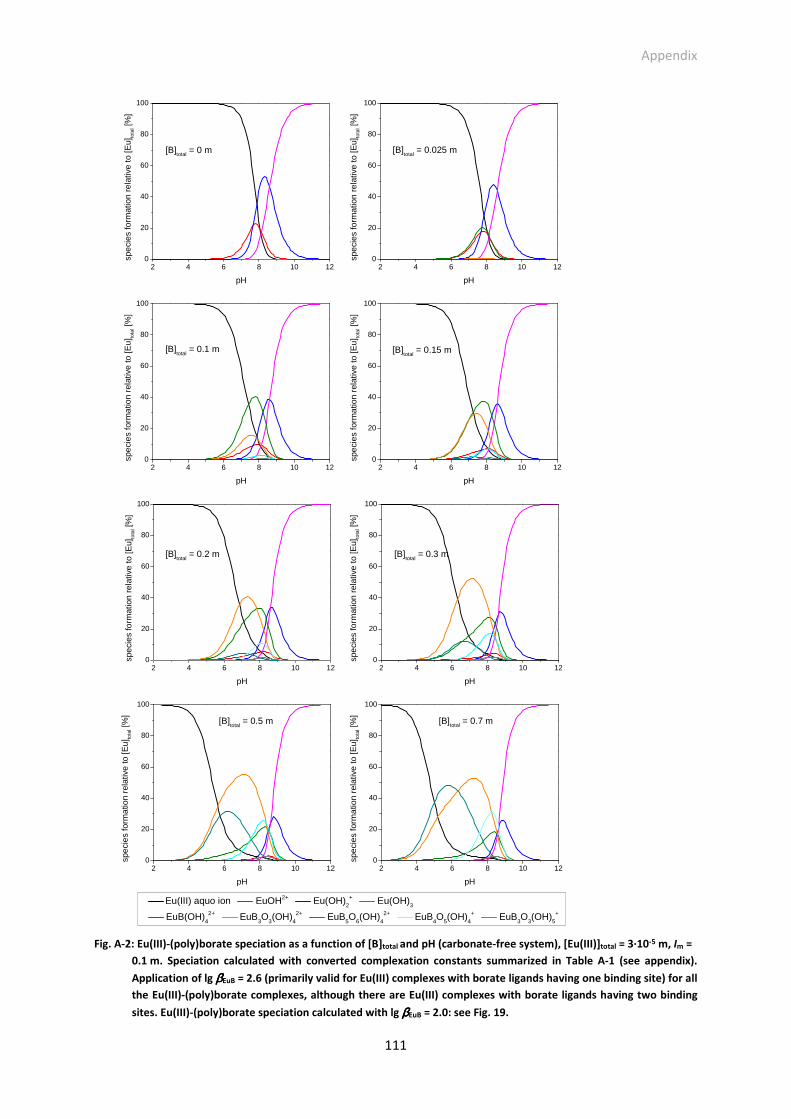
Appendix
111
Fig. A-2: Eu(III)-(poly)borate speciation as a function of [B]total and pH (carbonate-free system), [Eu(III)]total = 3·10-5 m, Im =
0.1 m. Speciation calculated with converted complexation constants summarized in Table A-1 (see appendix).
Application of lg ββββEuB = 2.6 (primarily valid for Eu(III) complexes with borate ligands having one binding site) for all
the Eu(III)-(poly)borate complexes, although there are Eu(III) complexes with borate ligands having two binding
sites. Eu(III)-(poly)borate speciation calculated with lg ββββEuB = 2.0: see Fig. 19.
2 4 6 8 10 120
20
40
60
80
100
[B]total = 0 m
spec
ies
form
atio
n re
lativ
e to
[Eu]
tota
l [%
]
pH
2 4 6 8 10 120
20
40
60
80
100
[B]total
= 0.025 m
spec
ies
form
atio
n re
lativ
e to
[Eu]
tota
l [%
]
pH
2 4 6 8 10 120
20
40
60
80
100
[B]total
= 0.15 m[B]total
= 0.1 m
spec
ies
form
atio
n re
lativ
e to
[Eu]
tota
l [%
]
pH
2 4 6 8 10 120
20
40
60
80
100
spec
ies
form
atio
n re
lativ
e to
[Eu]
tota
l [%
]
pH
2 4 6 8 10 120
20
40
60
80
100
spec
ies
form
atio
n re
lativ
e to
[Eu]
tota
l [%
]
pH
2 4 6 8 10 120
20
40
60
80
100
spec
ies
form
atio
n re
lativ
e to
[Eu]
tota
l [%
]
pH
2 4 6 8 10 120
20
40
60
80
100
spec
ies
form
atio
n re
lativ
e to
[Eu]
tota
l [%
]
pH
2 4 6 8 10 120
20
40
60
80
100
[B]total
= 0.3 m[B]total
= 0.2 m
[B]total
= 0.5 m
Eu(III) aquo ion EuOH2+ Eu(OH)
2+ Eu(OH)
3
EuB(OH)42+
EuB3O
3(OH)
42+
EuB5O
6(OH)
42+
EuB4O
5(OH)
4+ EuB
3O
3(OH)
5+
spec
ies
form
atio
n re
lativ
e to
[Eu]
tota
l [%
]
pH
[B]total = 0.7 m
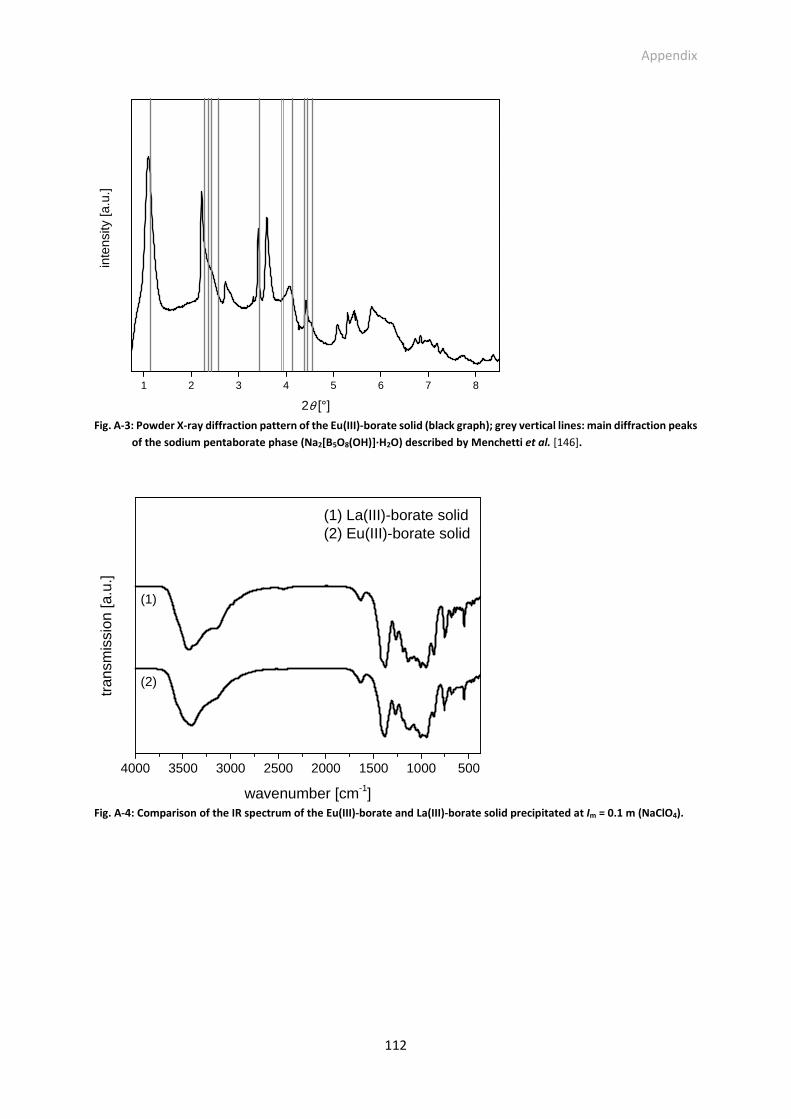
Appendix
112
Fig. A-3: Powder X-ray diffraction pattern of the Eu(III)-borate solid (black graph); grey vertical lines: main diffraction peaks
of the sodium pentaborate phase (Na2[B5O8(OH)]·H2O) described by Menchetti et al. [146].
Fig. A-4: Comparison of the IR spectrum of the Eu(III)-borate and La(III)-borate solid precipitated at Im = 0.1 m (NaClO4).
1 2 3 4 5 6 7 8
inte
nsity
[a.u
.]
2θ [°]
4000 3500 3000 2500 2000 1500 1000 500
(2)
tran
smis
sion
[a.u
.]
wavenumber [cm-1]
(1) La(III)-borate solid(2) Eu(III)-borate solid
(1)
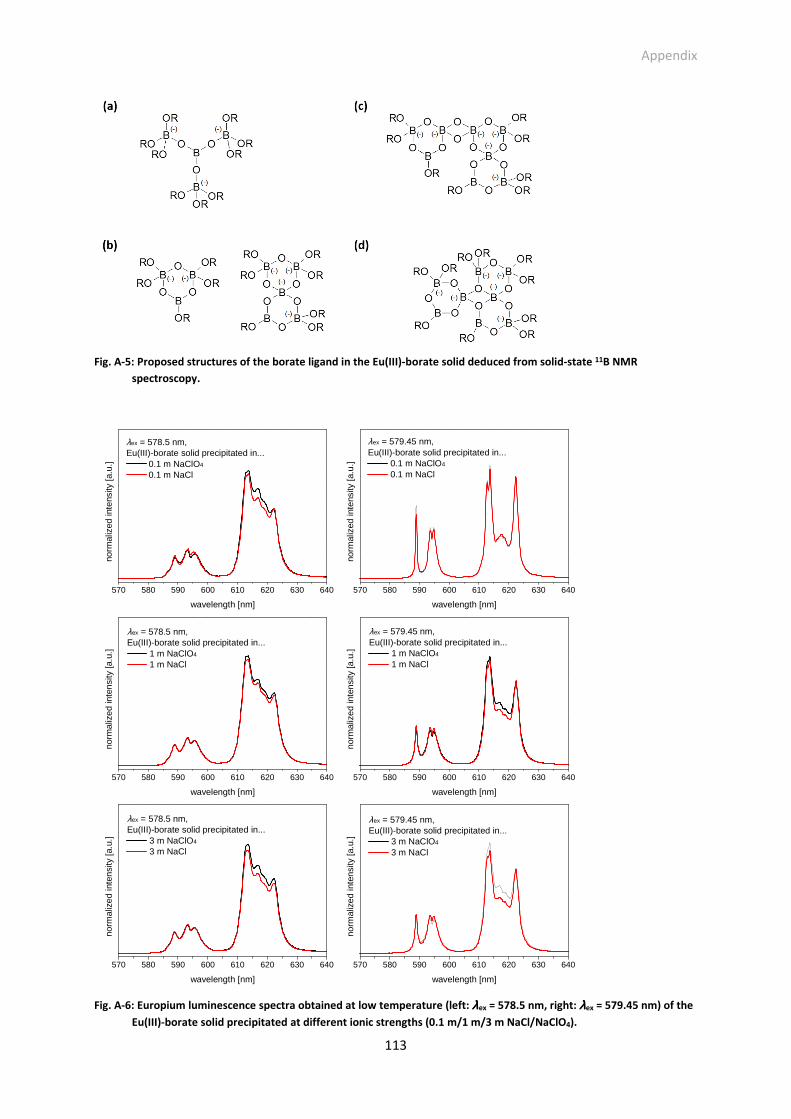
Appendix
113
Fig. A-5: Proposed structures of the borate ligand in the Eu(III)-borate solid deduced from solid-state 11B NMR
spectroscopy.
Fig. A-6: Europium luminescence spectra obtained at low temperature (left: λλλλex = 578.5 nm, right: λλλλex = 579.45 nm) of the
Eu(III)-borate solid precipitated at different ionic strengths (0.1 m/1 m/3 m NaCl/NaClO4).
570 580 590 600 610 620 630 640
λex = 579.45 nm,Eu(III)-borate solid precipitated in...
3 m NaClO4
3 m NaCl
λex = 578.5 nm,Eu(III)-borate solid precipitated in...
3 m NaClO4
3 m NaCl
λex = 579.45 nm,Eu(III)-borate solid precipitated in...
1 m NaClO4
1 m NaCl
λex = 578.5 nm,Eu(III)-borate solid precipitated in...
1 m NaClO4
1 m NaCl
λex = 579.45 nm,Eu(III)-borate solid precipitated in...
0.1 m NaClO4
0.1 m NaCl
norm
aliz
ed in
tens
ity [a
.u.]
wavelength [nm]
λex = 578.5 nm,Eu(III)-borate solid precipitated in...
0.1 m NaClO4
0.1 m NaCl
570 580 590 600 610 620 630 640
norm
aliz
ed in
tens
ity [a
.u.]
wavelength [nm]
570 580 590 600 610 620 630 640
norm
aliz
ed in
tens
ity [a
.u.]
wavelength [nm]
570 580 590 600 610 620 630 640
norm
aliz
ed in
tens
ity [a
.u.]
wavelength [nm]
570 580 590 600 610 620 630 640
norm
aliz
ed in
tens
ity [a
.u.]
wavelength [nm]
570 580 590 600 610 620 630 640
norm
aliz
ed in
tens
ity [a
.u.]
wavelength [nm]
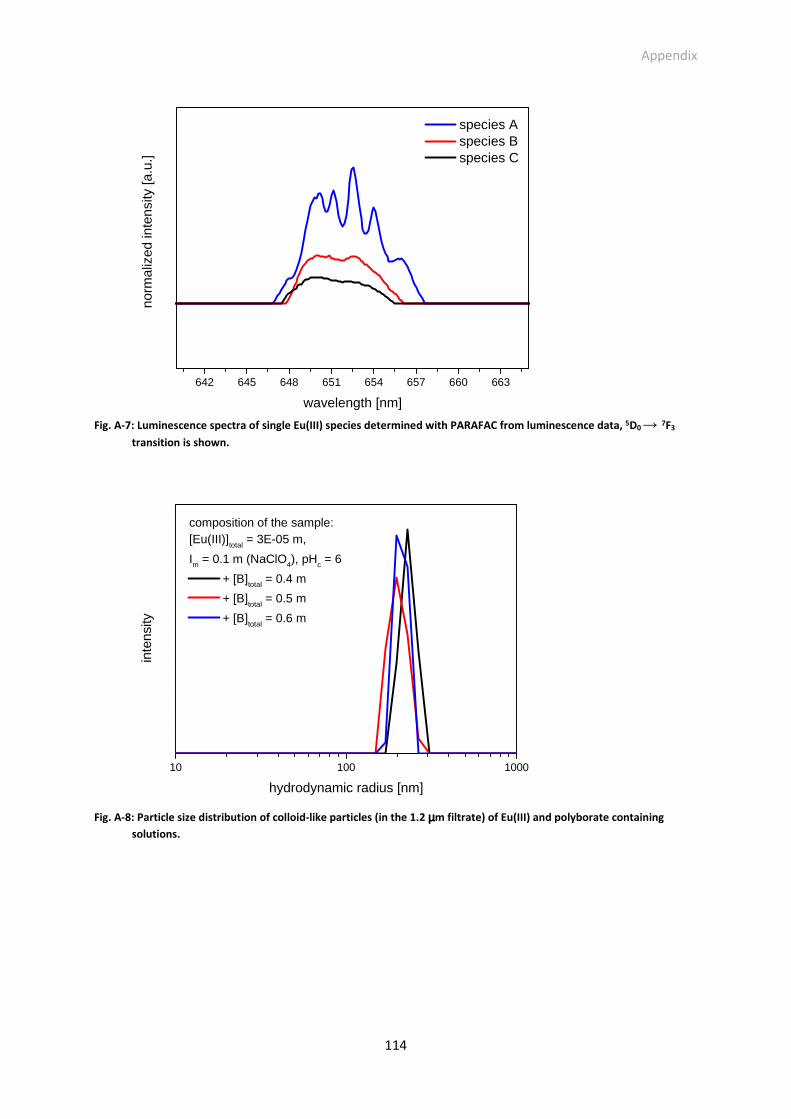
Appendix
114
Fig. A-7: Luminescence spectra of single Eu(III) species determined with PARAFAC from luminescence data, 5D0 → 7F3
transition is shown.
Fig. A-8: Particle size distribution of colloid-like particles (in the 1.2 µµµµm filtrate) of Eu(III) and polyborate containing
solutions.
642 645 648 651 654 657 660 663
norm
aliz
ed in
tens
ity [a
.u.]
wavelength [nm]
species A species B species C
10 100 1000
inte
nsity
hydrodynamic radius [nm]
composition of the sample:[Eu(III)]
total = 3E-05 m,
Im = 0.1 m (NaClO4), pHc = 6
+ [B]total = 0.4 m
+ [B]total
= 0.5 m
+ [B]total
= 0.6 m
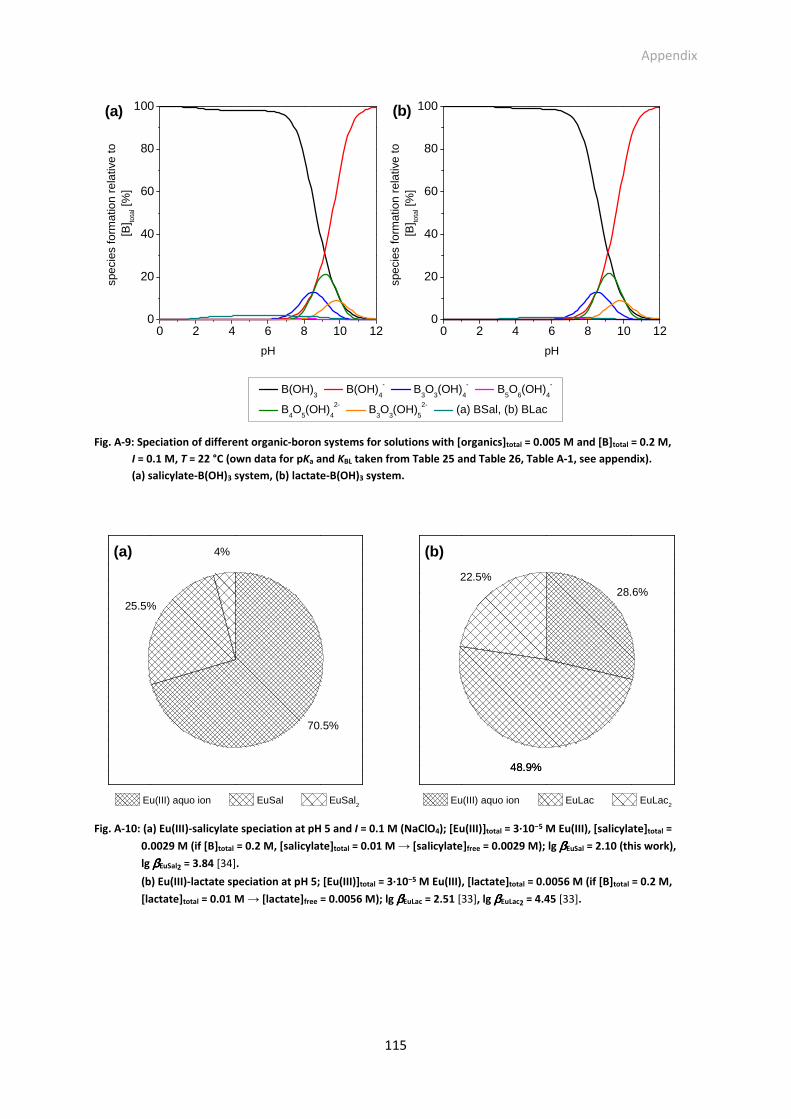
Appendix
115
Fig. A-9: Speciation of different organic-boron systems for solutions with [organics]total = 0.005 M and [B]total = 0.2 M,
I = 0.1 M, T = 22 °C (own data for pKa and KBL taken from Table 25 and Table 26, Table A-1, see appendix).
(a) salicylate-B(OH)3 system, (b) lactate-B(OH)3 system.
Fig. A-10: (a) Eu(III)-salicylate speciation at pH 5 and I = 0.1 M (NaClO4); [Eu(III)]total = 3·10−5 M Eu(III), [salicylate]total =
0.0029 M (if [B]total = 0.2 M, [salicylate]total = 0.01 M → [salicylate]free = 0.0029 M); lg ββββEuSal = 2.10 (this work),
lg ββββEuSal2 = 3.84 [34].
(b) Eu(III)-lactate speciation at pH 5; [Eu(III)]total = 3·10−5 M Eu(III), [lactate]total = 0.0056 M (if [B]total = 0.2 M,
[lactate]total = 0.01 M → [lactate]free = 0.0056 M); lg ββββEuLac = 2.51 [33], lg ββββEuLac2 = 4.45 [33].
0 2 4 6 8 10 120
20
40
60
80
100 (b)
B(OH)3 B(OH)
4
- B
3O
3(OH)
4
- B
5O
6(OH)
4
-
B4O
5(OH)
4
2- B
3O
3(OH)
5
2- (a) BSal, (b) BLac
spec
ies
form
atio
n re
lativ
e to
[B
] tota
l [%]
pH
(a)
0 2 4 6 8 10 120
20
40
60
80
100
spec
ies
form
atio
n re
lativ
e to
[B
] tota
l [%]
pH
4%
25.5%
70.5%
Eu(III) aquo ion EuSal EuSal2
48.9%
(b)
22.5%
48.9%
28.6%
Eu(III) aquo ion EuLac EuLac2
(a)
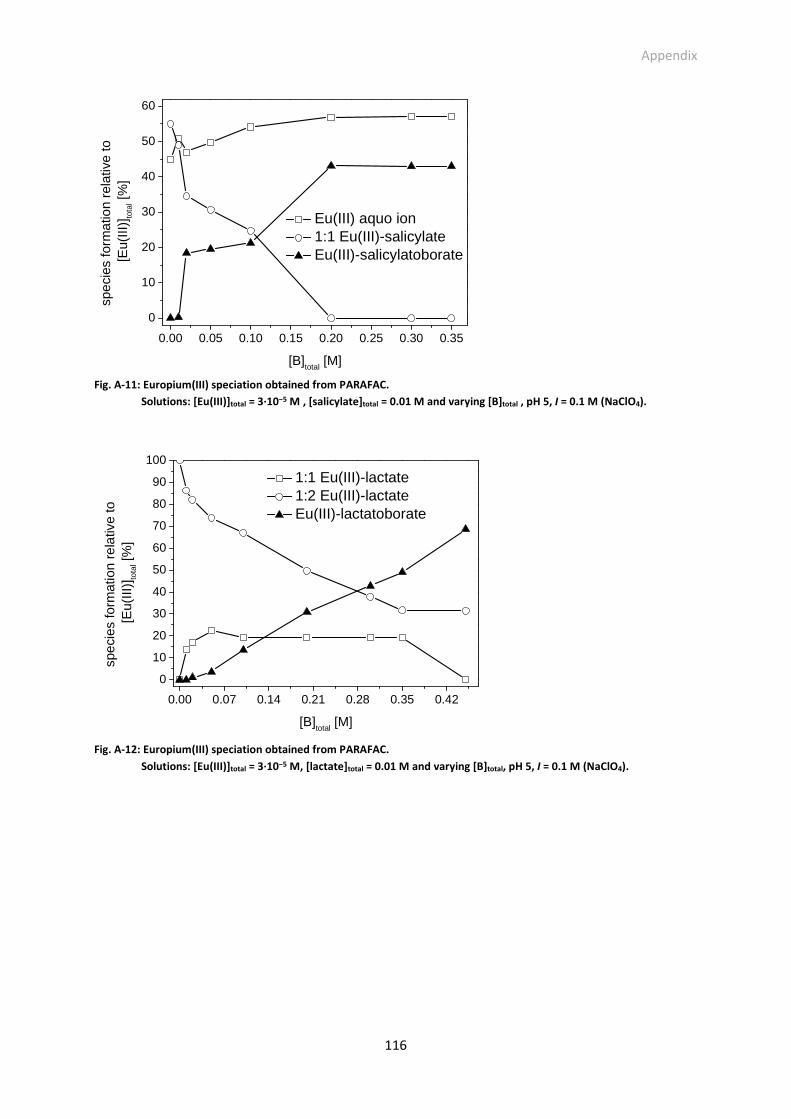
Appendix
116
Fig. A-11: Europium(III) speciation obtained from PARAFAC.
Solutions: [Eu(III)]total = 3·10−5 M , [salicylate]total = 0.01 M and varying [B]total , pH 5, I = 0.1 M (NaClO4).
Fig. A-12: Europium(III) speciation obtained from PARAFAC.
Solutions: [Eu(III)]total = 3·10−5 M, [lactate]total = 0.01 M and varying [B]total, pH 5, I = 0.1 M (NaClO4).
0.00 0.05 0.10 0.15 0.20 0.25 0.30 0.35
0
10
20
30
40
50
60
Eu(III) aquo ion 1:1 Eu(III)-salicylate Eu(III)-salicylatoborate
spec
ies
form
atio
n re
lativ
e to
[E
u(III
)]to
tal [
%]
[B]total
[M]
0.00 0.07 0.14 0.21 0.28 0.35 0.42
0
10
20
30
40
50
60
70
80
90
100
1:1 Eu(III)-lactate 1:2 Eu(III)-lactate Eu(III)-lactatoborate
spec
ies
form
atio
n re
lativ
e to
[E
u(III
)]to
tal [
%]
[B]total
[M]
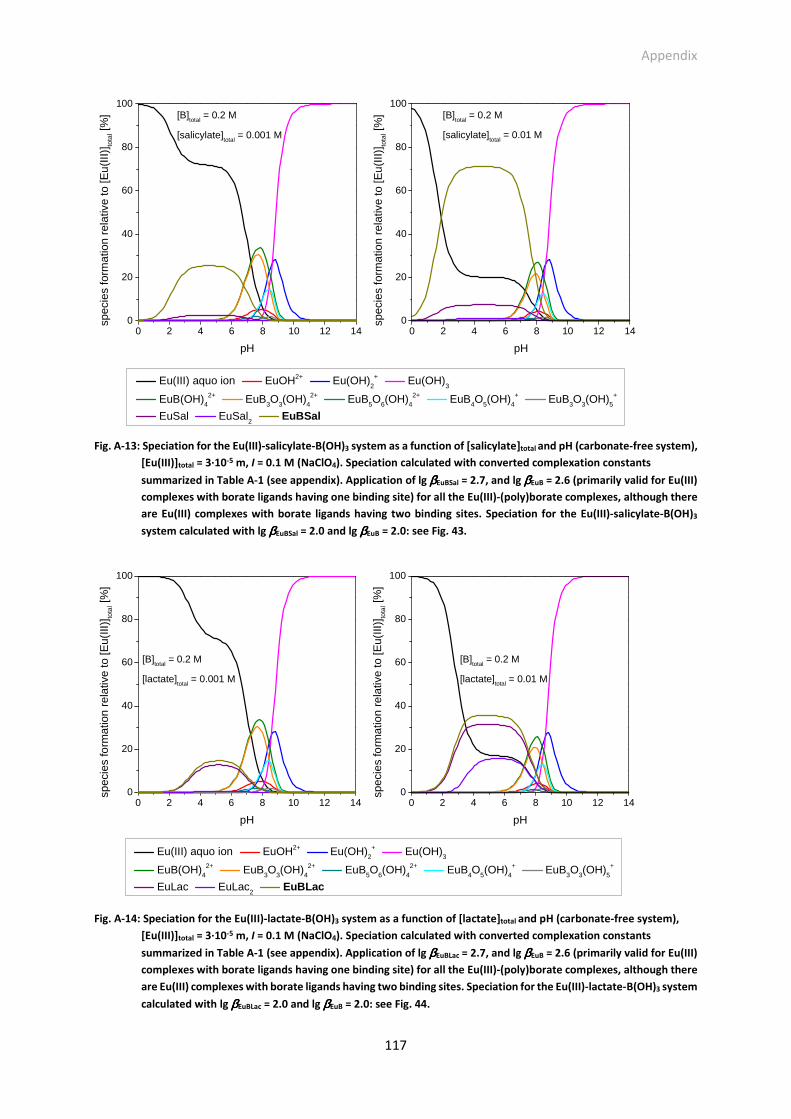
Appendix
117
Fig. A-13: Speciation for the Eu(III)-salicylate-B(OH)3 system as a function of [salicylate]total and pH (carbonate-free system),
[Eu(III)]total = 3·10-5 m, I = 0.1 M (NaClO4). Speciation calculated with converted complexation constants
summarized in Table A-1 (see appendix). Application of lg ββββEuBSal = 2.7, and lg ββββEuB = 2.6 (primarily valid for Eu(III)
complexes with borate ligands having one binding site) for all the Eu(III)-(poly)borate complexes, although there
are Eu(III) complexes with borate ligands having two binding sites. Speciation for the Eu(III)-salicylate-B(OH)3
system calculated with lg ββββEuBSal = 2.0 and lg ββββEuB = 2.0: see Fig. 43.
Fig. A-14: Speciation for the Eu(III)-lactate-B(OH)3 system as a function of [lactate]total and pH (carbonate-free system),
[Eu(III)]total = 3·10-5 m, I = 0.1 M (NaClO4). Speciation calculated with converted complexation constants
summarized in Table A-1 (see appendix). Application of lg ββββEuBLac = 2.7, and lg ββββEuB = 2.6 (primarily valid for Eu(III)
complexes with borate ligands having one binding site) for all the Eu(III)-(poly)borate complexes, although there
are Eu(III) complexes with borate ligands having two binding sites. Speciation for the Eu(III)-lactate-B(OH)3 system
calculated with lg ββββEuBLac = 2.0 and lg ββββEuB = 2.0: see Fig. 44.
0 2 4 6 8 10 12 140
20
40
60
80
100[B]
total = 0.2 M
[salicylate]total
= 0.01 M
sp
ecie
s fo
rmat
ion
rela
tive
to [E
u(III
)]to
tal [
%]
pH
Eu(III) aquo ion EuOH2+ Eu(OH)
2+ Eu(OH)
3
EuB(OH)42+
EuB3O3(OH)42+
EuB5O6(OH)42+
EuB4O5(OH)4+ EuB3O3(OH)5
+
EuSal EuSal2 EuBSal
[B]total
= 0.2 M
[salicylate]total
= 0.001 M
0 2 4 6 8 10 12 140
20
40
60
80
100
spec
ies
form
atio
n re
lativ
e to
[Eu(
III)]
tota
l [%
]
pH
0 2 4 6 8 10 12 140
20
40
60
80
100
[B]total
= 0.2 M
[lactate]total = 0.01 M
spec
ies
form
atio
n re
lativ
e to
[Eu(
III)]
tota
l [%
]
pH
Eu(III) aquo ion EuOH2+ Eu(OH)
2+ Eu(OH)
3
EuB(OH)4
2+ EuB
3O
3(OH)
42+
EuB5O
6(OH)
42+
EuB4O
5(OH)
4+ EuB
3O
3(OH)
5+
EuLac EuLac2 EuBLac
[B]total
= 0.2 M
[lactate]total
= 0.001 M
0 2 4 6 8 10 12 140
20
40
60
80
100
spec
ies
form
atio
n re
lativ
e to
[Eu(
III)]
tota
l [%
]
pH
References
118
References
[1] T. Brasser, J. Droste, I. Müller-Lyda, J. Neles, M. Sailer, G. Schmidt, and M. Steinhoff, “Endlagerung wärmeentwickelnder radioaktiver Abfälle in Deutschland, Hauptband,” Öko-Institut e.V. (Institut für angewandte Ökologie, Institute for Applied Ecology), Gesellschaft für Anlagen- und Reaktorsicherheit (GRS) mbH, 2008.
[2] J. Neles, S. Mohr, and G. Schmidt, “Endlagerung wärmeentwickelnder radioaktiver Abfälle in Deutschland, Anhang Abfälle,” Öko-Institut e.V. (Institut für angewandte Ökologie, Institute for Applied Ecology), Gesellschaft für Anlagen- und Reaktorsicherheit (GRS) mbH, 2008.
[3] D. Pelte, Die Zukunft unserer Energieversorgung - Eine Analyse aus mathematisch-
naturwissenschaftlicher Sicht, 2. Auflage. Wiesbaden: Springer Vieweg, 2014.
[4] H. Geckeis, J. Lützenkirchen, R. Polly, T. Rabung, and M. Schmidt, “Mineral-Water Interface Reactions of Actinides,” Chem. Rev., vol. 113, pp. 1016–1062, 2013.
[5] H. Geckeis, K.-J. Röhlig, and K. Mengel, “Endlagerung radioaktiver Abfälle, Chemie im Endlagersystem,” Chem. Unserer Zeit, vol. 46, pp. 282–293, 2012.
[6] V. Metz, H. Geckeis, E. Gonzalez-Robles, A. Loida, C. Bube, and B. Kienzler, “Radionuclide behaviour in the near-field of a geological repository for spent nuclear fuel,” Radiochim. Acta, vol. 100, pp. 699–713, 2012.
[7] A. C. Snider, “Verification of the Definition of Generic Weep Brine and the Development of a
Recipe for this Brine,” Sandia National Laboratories, Carlsbad, NM, Report ERMS 527505, 2003.
[8] M. Borkowski, J.-F. Lucchini, M. K. Richmann, and D. T. Reed, “Actinide(III) Solubility in WIPP Brine: Data Summary and Recommendations,” Los Alamos National Laboratory, Los Alamos, NM, Report LA-14360, 2009.
[9] M. Borkowski, M. Richmann, D. T. Reed, and Y. Xiong, “Complexation of Nd(III) with tetraborate
ion and its effect on actinide(III) solubility in WIPP brine,” Radiochim. Acta, vol. 98, pp. 577–582,
2010.
[10] M. Altmaier, X. Gaona, and T. Fanghänel, “Recent Advances in Aqueous Actinide Chemistry and
Thermodynamics,” Chem. Rev., vol. 113, pp. 901–943, 2013.
[11] J.-F. Lucchini, M. Borkowski, M. K. Richmann, S. Ballard, and D. T. Reed, “Solubility of Nd3+ and UO22+ in WIPP brines as oxidation-state invariant analogs for plutonium,” J. Alloys Compd., vol. 444/445, pp. 506–511, 2007.
[12] L. Zhang, “Experimentelle Untersuchungen zur Bildung von Boraten im Mg-reichen Milieu der marinen Evaporite,” Technische Universität Clausthal, Dissertation, 2011.
[13] E. Curti, J. L. Crovisier, G. Morvan, and A. M. Karpoff, “Long-term corrosion of two nuclear waste reference glasses (MW and SON68): A kinetic and mineral alteration study,” Appl. Geochem., vol. 21, pp. 1152–1168, 2006.
[14] B. Kienzler, B. Luckscheiter, and S. Wilhelm, “Waste form corrosion modeling: comparison with
experimental results,” Waste Manag., vol. 21, pp. 741–752, 2001.
[15] M. Bolz, A. Speck, F. Böttcher, and S. Riehm, “Einfluss des Lastfolgebetriebs auf die Chemie des
Primär- und Sekundärkreislaufs eines Kernkraftwerks mit Druckwasserreaktor,” Atw - Int. Z. Für
Kernenerg., vol. 58, pp. 440–445, 2013.
[16] R. O. Abdel Rahman, R. Z. Rakhimov, N. R. Rakhimova, and M. I. Ojovan, Cementitious Materials
for Nuclear Waste Immobilization. Chichester, West Sussex, UK: John Wiley & Sons, 2015.
[17] W. Hummel, U. Berner, E. Curti, F. J. Pearson, and T. Thoenen, “Nagra/PSI Chemical
Thermodynamic Data Base 01/01,” Nagra, Wettingen, Technical Report 02-16, 2002.
[18] K. Hinz, M. Altmaier, X. Gaona, T. Rabung, D. Schild, M. Richmann, D. T. Reed, E. V. Alekseev, and
H. Geckeis, “Interaction of Nd(III) and Cm(III) with borate in dilute to concentrated alkaline NaCl,
MgCl2 and CaCl2 solutions: solubility and TRLFS studies,” New J. Chem., vol. 39, pp. 849–859,
2015.
[19] J. Eikenberg, “On the Problem of Silica Solubility at High pH,” Nagra/PSI, Villigen, Technical
Report 90-36, 1990.
References
119
[20] M. H. Bradbury and B. Baeyens, “Project Opalinus Clay. Sorption Data Bases for Opalinus Clay Influenced by a High pH Plume,” Nagra/PSI, Villigen, Technical Report 03-12, 2004.
[21] G. R. Choppin and E. M. Rizkalla, - Solution Chemistry of Actinides and Lanthanides - in: Handbook
on the Physics and Chemistry of Rare Earths, Volume 18: Lanthanides/Actinides: Chemistry.
North-Holland, Amsterdam: Elsevier Science B.V., Eds. K. A. Gschneidner, Jr., L. Eyring, G. R. Choppin and G. H. Lander, 1994.
[22] G. T. Seaborg, - Origin of the Actinide Concept - in: Handbook on the Physics and Chemistry of
Rare Earths, Volume 18: Lanthanides/Actinides: Chemistry. North-Holland, Amsterdam: Elsevier Science B.V., Eds. K. A. Gschneidner, Jr., L. Eyring, G. R. Choppin and G. H. Lander, 1994.
[23] E. Riedel, Anorganische Chemie, 6. Auflage. Berlin: Walter de Gruyter, 2004.
[24] S. Cotton, Lanthanide and Actinide Chemistry. Chichester, West Sussex, UK: John Wiley & Sons,
2006.
[25] R. G. Pearson, “Hard and Soft Acids and Bases,” J. Am. Chem. Soc., vol. 85, pp. 3533–3539, 1963.
[26] T. Kimura, Y. Kato, H. Takeishi, and G. R. Choppin, “Comparative study on the hydration states of
Cm(III) and Eu(III) in solution and in cation exchange resin,” J. Alloys Compd., vol. 271–273, pp.
719–722, 1998.
[27] T. Kimura and G. R. Choppin, “Luminescence study on determination of the hydration number of
Cm(III),” J. Alloys Compd., vol. 213/214, pp. 313–317, 1994.
[28] R. Guillaumont, T. Fanghänel, J. Fuger, I. Grenthe, V. Neck, D. A. Palmer, and M. H. Rand,
“Chemical Thermodynamics Series Volume 5, Update on the Chemical Thermodynamics of
Uranium, Neptunium, Plutonium, Americium and Technetium,” OECD, NEA-TDB, Elsevier, North Holland, Amsterdam, 2003.
[29] G. R. Choppin, “Comparison of the solution chemistry of the actinides and lanthanides,” J. Common Met., vol. 93, pp. 323–330, 1983.
[30] T. Thoenen, W. Hummel, U. Berner, and E. Curti, “The PSI/Nagra Chemical Thermodynamic
Database 12/07,” PSI, Villigen, PSI Bericht 14-04, 2014.
[31] R. J. Lemire, J. Fuger, H. Nitsche, P. Potter, M. H. Rand, J. Rydberg, K. Spahiu, J. C. Sullivan, W. J.
Ullman, P. Vitorge, and H. Wanner, “Chemical Thermodynamics Series Volume 4, Chemical
Thermodynamics of Neptunium and Plutonium,” OECD, NEA-TDB, Elsevier, North Holland, Amsterdam, 2001.
[32] P. Thakur, D. K. Singh, and G. R. Choppin, “Polymerization study of o-Si(OH)4 and complexation with Am(III), Eu(III) and Cm(III),” Inorganica Chim. Acta, vol. 360, pp. 3705–3711, 2007.
[33] A. Barkleit, J. Kretzschmar, S. Tsushima, and M. Acker, “Americium(III) and europium(III) complex
formation with lactate at elevated temperatures studied by spectroscopy and quantum chemical
calculations,” Dalton Trans., vol. 43, pp. 11221–11232, 2014.
[34] Y. Hasegawa, Y. Morita, M. Hase, and M. Nagata, “Complexation of lanthanoid(III) with
substituted benzoic or phenylacetic acids and extraction of these acids,” Bull. Chem. Soc. Jpn.,
vol. 62, pp. 1486–1491, 1989.
[35] M. Müller, M. Acker, S. Taut, and G. Bernhard, “Complex formation of trivalent americium with
salicylic acid at very low concentrations,” J. Radioanal. Nucl. Chem., vol. 286, pp. 175–180, 2010.
[36] K. Cernochova, J. N. Mathur, and G. R. Choppin, “Chemical speciation of Am, Cm and Eu with
EDTA at high ionic strength: thermodynamics and laser fluorescence spectroscopy studies,”
Radiochim. Acta, vol. 93, pp. 733–739, 2005.
[37] C. W. Davies, Ion Association. London: Butterworths, 1962.
[38] M. Laffitte, “A report of IUPAC commission I.2 on thermodynamics: Notation for states and
processes, significance of the word ‘standard’ in chemical thermodynamics, and remarks on
commonly tabulated forms of thermodynamic functions,” J. Chem. Thermodyn., vol. 14, pp.
805–815, 1982.
[39] P. W. Atkins, Physikalische Chemie, 3. Auflage. Weinheim: Wiley-VCH, 2001.
[40] J. N. Bronsted, “Studies of solubility: IV. The principle of specific interactions of ions,” J. Am.
Chem. Soc., vol. 44, pp. 877–898, 1922.
References
120
[41] J. N. Bronsted, “Calculation of the osmotic and activity functions in solutions of uni-univalent salts,” J. Am. Chem. Soc., vol. 44, pp. 938–948, 1922.
[42] G. Scatchard, “Concentrated solutions of strong electrolytes,” Chem. Rev., vol. 19, pp. 309–327,
1936.
[43] E. A. Guggenheim, Applications of Statistical Mechanics. Oxford: Clarendon Press, 1966.
[44] G. R. Choppin and W. F. Strazik, “Complexes of Trivalent Lanthanide and Actinide Ions. I. Outer-Sphere Ion Pairs,” Inorg. Chem., vol. 4, pp. 1250–1254, 1965.
[45] G. R. Choppin and A. J. Graffeo, “Complexes of Trivalent Lanthanide and Actinide Ions. II. Inner-Sphere Complexes,” Inorg. Chem., vol. 4, pp. 1254–1257, 1965.
[46] N. Ingri, “Equilibrium Studies of Polyanions, 8. On the First Equilibrium Steps in the Hydrolysis of
Boric Acid, a Comparison between Equilibria in 0.1 M and 3.0 M NaClO4,” Acta Chem. Scand., vol.
16, pp. 439–448, 1962.
[47] N. Ingri, G. Lagerström, M. Frydman, and L. G. Sillén, “Equilibrium Studies of Polyanions, II
Polyborates in NaClO4 Medium,” Acta Chem. Scand., vol. 11, pp. 1034–1058, 1957.
[48] N. Ingri, “Equilibrium Studies of Polyanions, 11. Polyborates in 3.0 M Na(Br), 3.0 M Li(Br) and 3.0
M K(Br), a Comparison with Data Obtained in 3.0 M Na(ClO4),” Acta Chem. Scand., vol. 17, pp.
581–589, 1963.
[49] I. Tsuyumoto, T. Oshio, and K. Katayama, “Preparation of highly concentrated aqueous solution
of sodium borate,” Inorg. Chem. Commun., vol. 10, pp. 20–22, 2007.
[50] J. O. Edwards and V. Ross, “Structural principles of the Hydrated Polyborates,” J. Inorg. Nucl.
Chem., vol. 15, pp. 329–337, 1960.
[51] C. L. Christ and J. R. Clark, “A Crystal-Chemical Classification of Borate Structures with Emphasis on Hydrated Borates,” Phys. Chem. Miner., vol. 2, pp. 59–87, 1977.
[52] R. E. Mesmer, C. F. Baes, and F. H. Sweeton, “Acidity measurements at elevated temperatures.
VI. Boric acid equilibria,” Inorg. Chem., vol. 11, pp. 537–543, 1972.
[53] C. L. Christ, “Crystal Chemistry and Systematic Classification of Hydrated Borate Minerals,” Am.
Mineral., vol. 45, pp. 334–340, 1960.
[54] L. Maya, “Identification of Polyborate and Fluoropolyborate Ions in Solution by Raman
Spectroscopy,” Inorg. Chem., vol. 15, pp. 2179–2184, 1976.
[55] T. Hirao, M. Kotaka, and H. Kakihana, “Raman spectra of polyborate ions in aqueous solution,” J.
Inorg. Nucl. Chem., vol. 41, pp. 1217–1220, 1979.
[56] R. Janda and G. Heller, “Ramanspektroskopische Untersuchungen an festen und in Wasser
gelösten Polyboraten,” Z. Naturforschung, vol. 34b, pp. 585–590, 1979.
[57] R. Janda and G. Heller, “11B-NMR-spektroskopische Untersuchungen an wäßrigen Polyboratlösungen,” Z. Naturforschung, vol. 34b, pp. 1078–1083, 1979.
[58] R. K. Momii and N. H. Nachtrieb, “Nuclear Magnetic Resonance Study of Borate-Polyborate Equilibria in Aqueous Solution,” Inorg. Chem., vol. 6, pp. 1189–1192, 1967.
[59] C. G. Salentine, “High-Field 11B NMR of Alkali Borates. Aqueous Polyborate Equilibria,” Inorg.
Chem., vol. 22, pp. 3920–3924, 1983.
[60] J. E. Spessard, “Investigations of borate equilibria in neutral salt solutions,” J. Inorg. Nucl. Chem.,
vol. 32, pp. 2607–2613, 1970.
[61] Yongquan Zhou, Chunhui Fang, Yan Fang, and Fayan Zhu, “Polyborates in aqueous borate
solution: A Raman and DFT theory investigation,” Spectrochim. Acta Part A, vol. 83, pp. 82–87,
2011.
[62] Y. Q. Zhou, C. H. Fang, Y. Fang, F. Y. Zhu, and L. D. Cao, “Polyborates in Aqueous Sodium Borate
Solution at 298.15 K,” Asian J. Chem., vol. 24, pp. 29–32, 2012.
[63] A. Hertam, “Ramanspektroskopische Untersuchungen zum Lösungszustand von Boraten in
konzentrierten Salzlösungen,” Research paper, Freiberg University of Mining and Technology,
2010.
[64] Jia Yongzhong, Gao Shiyang, Xia Shuping, and Li Jun, “FT-IR spectroscopy of supersaturated aqueous solutions of magnesium borate,” Spectrochim. Acta Part A, vol. 56, pp. 1291–1297,
2000.
References
121
[65] R. Larsson and G. Nunziata, “An infrared spectroscopic investigation on the complexes formed between boric acid and lactic acid in aqueous solution,” Acta Chem. Scand., vol. 24, pp. 2156–
2168, 1970.
[66] R. Larsson and G. Nunziata, “An infrared spectroscopic investigation on the complexes formed
between boric acid and salicylate ions,” Acta Chem. Scand., vol. 26, pp. 1503–1509, 1972.
[67] W. G. Henderson, M. J. How, G. R. Kennedy, and E. F. Mooney, “The interconversion of aqueous
boron species and the interaction of borate with diols: A 11B N.M.R study,” Carbohydr. Res., vol.
28, pp. 1–12, 1973.
[68] T. Takeda and T. Oi, “11B NMR spectroscopic observation of a borate ion-diol complex with a seven-membered ring and comparison of stability among complexes with different ring sizes,” Bull. Chem. Soc. Jpn., vol. 67, pp. 1485–1487, 1994.
[69] Y. Miyazaki, T. Fujimori, H. Okita, T. Hirano, and K. Yoshimura, “Thermodynamics of
complexation reactions of borate and phenylboronate with diol, triol and tetritol,” Dalton Trans.,
vol. 42, pp. 10473–10486, 2013.
[70] M. Van Duin, J. A. Peters, A. P. G. Kieboom, and H. Van Bekkum, “Studies on borate esters I: The
pH dependence of the stability of esters of boric acid and borate in aqueous medium as studied
by 11B NMR,” Tetrahedron, vol. 40, pp. 2901–2911, 1984.
[71] A. Gaspar, M. Harir, M. Lucio, N. Hertkorn, and P. Schmitt-Kopplin, “Targeted borate complex formation as followed with electrospray ionization Fourier transform ion cyclotron mass spectrometry: monomolecular model system and polyborate formation,” Rapid Commun. Mass
Spectrom., vol. 22, pp. 3119–3129, 2008.
[72] J. Bassett and P. J. Matthews, “The preparation and properties of some bis (salicylato) borate (III)
salts with large cations,” J. Inorg. Nucl. Chem., vol. 40, pp. 987–992, 1978.
[73] D. A. Köse, B. Zümreoglu-Karan, and T. Hökelek, “A comparative examination of mono- and bis-chelate salicylatoborate complexes and the crystal structure of layered magnesium bis-salicylatoborate,” Inorganica Chim. Acta, vol. 375, pp. 236–241, 2011.
[74] Y. Miyazaki, H. Matsuo, T. Fujimori, H. Takemura, S. Matsuoka, T. Okobira, K. Uezu, and K.
Yoshimura, “Interaction of boric acid with salicyl derivatives as an anchor group of boron-selective adsorbents,” Polyhedron, vol. 27, pp. 2785–2790, 2008.
[75] L. Babcock and R. Pizer, “Dynamics of Boron Acid Complexation Reactions. Formation of 1:1
Boron Acid-Ligand Complexes,” Inorg. Chem., vol. 19, pp. 56–61, 1980.
[76] S. Friedman, B. Pace, and R. Pizer, “Complexation of Phenylboronic Acid with Lactic Acid.
Stability Constant and Reaction Kinetics,” J. Am. Chem. Soc., vol. 96, pp. 5381–5384, 1974.
[77] S. Friedman and R. Pizer, “Mechanism of the Complexation of Phenylboronic Acid with Oxalic
Acid. A Reaction Which Requires Ligand Donor Atom Protonation,” J. Am. Chem. Soc., vol. 97, pp.
6059–6062, 1975.
[78] G. R. Kennedy and M. J. How, “The interaction of sugars with borate: An N.M.R. spectroscopic
study,” Carbohydr. Res., vol. 28, pp. 13–19, 1973.
[79] D. A. Köse and B. Zümreoglu-Karan, “Complexation of boric acid with vitamin C,” New J. Chem., vol. 33, pp. 1874–1881, 2009.
[80] D. A. Köse and B. Zümreoglu-Karan, “Mixed-ligand complexes of boric acid with organic biomolecules,” Chem. Pap., vol. 66, pp. 54–60, 2012.
[81] D. A. Köse, B. Zümreoglu-Karan, T. Hökelek, and E. Sahin, “Boric acid complexes with organic biomolecules: Mono-chelate complexes with salicylic and glucuronic acids,” Inorganica Chim.
Acta, vol. 363, pp. 4031–4037, 2010.
[82] M. Van Duin, J. A. Peters, A. P. G. Kieboom, and H. Van Bekkum, “Studies on borate esters II:
Structure and stability of borate esters of polyhydroxycarboxylates and related polyols in
aqueous alkaline media as studied by 11B NMR,” Tetrahedron, vol. 41, pp. 3411–3421, 1985.
[83] A. Bousher, “Review: Unidentate complexes involving borate,” J. Coord. Chem., vol. 34, pp. 1–11,
1995.
[84] C. M. G. van den Berg, “Speciation of boron with Cu2+, Zn2+, Cd2+ and Pb2+ in 0.7 M KNO3 and
in sea-water,” Geochim. Cosmochim. Acta, vol. 48, pp. 2613–2617, 1984.
References
122
[85] R. M. Smith and A. E. Martell, Critical Stability Constants, Vol. 4. New York: Plenum Press, 1976.
[86] Autorenkollektiv, Structural Chemistry of Boron and Silicon. Berlin: Akademie-Verlag Berlin, 1986.
[87] G. Chadeyron, R. Mahiou, A. Arbus, and J. C. Cousseins, “Optical characteristics of Y3BO6
activated by Eu3+,” Eur. J. Solid State Inorg. Chem., vol. 34, pp. 25–39, 1997.
[88] B. Munirathnam and J. Madhavan, “Influence of Lanthanum(III) Dopant on Structure, Linear and
Non-Linear Optical Properties of Ammonium Pentaborate Crystals,” Asian J. Chem., vol. 22, pp. 189–193, 2010.
[89] G. Pasupathi and P. Philominathan, “Growth and Characterization of Sodium Penta Borate Single
Crystals: an Inorganic NLO Material.,” Int. J. Electron. Eng. Res., vol. 2, pp. 79–85, 2010.
[90] R. Janda and G. Heller, “IR- und Ramanspektren isotop markierter Tetra- und Pentaborate,” Spectrochim. Acta Part A, vol. 36, pp. 997–1001, 1980.
[91] Li Jun, Xia Shuping, and Gao Shiyang, “FT-IR and Raman spectroscopic study of hydrated borates,” Spectrochim. Acta Part A, vol. 51, pp. 519–532, 1995.
[92] M. J. Polinski, S. Wang, E. V. Alekseev, J. N. Cross, W. Depmeier, and T. E. Albrecht-Schmitt, “Effect of pH and Reaction Time on the Structures of Early Lanthanide(III) Borate Perchlorates,” Inorg. Chem., vol. 51, pp. 11541–11548, 2012.
[93] M. J. Polinski, S. Wang, J. N. Cross, E. V. Alekseev, W. Depmeier, and T. E. Albrecht-Schmitt, “Effects of Large Halides on the Structures of Lanthanide(III) and Plutonium(III) Borates,” Inorg.
Chem., vol. 51, pp. 7859–7866, 2012.
[94] S. Wang, E. V. Alekseev, W. Depmeier, and T. E. Albrecht-Schmitt, “Surprising Coordination for Plutonium in the First Plutonium(III) Borate,” Inorg. Chem., vol. 50, pp. 2079–2081, 2011.
[95] S. Wang, E. V. Alekseev, W. Depmeier, and T. E. Albrecht-Schmitt, “Recent progress in actinide borate chemistry,” Chem. Commun., vol. 47, pp. 10874–10885, 2011.
[96] M. J. Polinski, E. M. Villa, and T. E. Albrecht-Schmitt, “Oxoanion systems containing trivalent actinides,” Coord. Chem. Rev., vol. 266–267, pp. 16–27, 2014.
[97] M. J. Polinski, K. A. Pace, J. T. Stritzinger, J. Ling, J. N. Cross, S. K. Cary, S. M. Van Cleve, E. V.
Alekseev, and T. E. Albrecht-Schmitt, “Chirality and Polarity in the f-Block Borates M4[B16O26(OH)4(H2O)3Cl4] (M = Sm, Eu, Gd, Pu, Am, Cm, and Cf),” Chem. Eur. J., vol. 20, pp. 9892–9896, 2014.
[98] M. J. Polinski, D. J. Grant, S. Wang, E. V. Alekseev, J. N. Cross, E. M. Villa, W. Depmeier, L. Gagliardi, and T. E. Albrecht-Schmitt, “Differentiating between Trivalent Lanthanides and Actinides,” J. Am. Chem. Soc., vol. 134, pp. 10682–10692, 2012.
[99] M. J. Polinski, S. Wang, E. V. Alekseev, W. Depmeier, and T. E. Albrecht-Schmitt, “Bonding Changes in Plutonium(III) and Americium(III) Borates,” Angew. Chem. Int. Ed., vol. 50, pp. 8891–8894, 2011.
[100] M. J. Polinski, S. Wang, E. V. Alekseev, W. Depmeier, G. Liu, R. G. Haire, and T. E. Albrecht-Schmitt, “Curium(III) Borate Shows Coordination Environments of Both Plutonium(III) and Americium(III) Borates,” Angew. Chem. Int. Ed., vol. 51, pp. 1869–1872, 2012.
[101] M. J. Polinski, E. B. Garner, R. Maurice, N. Planas, J. T. Stritzinger, T. G. Parker, J. N. Cross, T. D. Green, E. V. Alekseev, S. M. Van Cleve, W. Depmeier, L. Gagliardi, M. Shatruk, K. L. Knappenberger, G. Liu, S. Skanthakumar, L. Soderholm, D. A. Dixon, and T. E. Albrecht-Schmitt, “Unusual structure, bonding and properties in a californium borate,” Nat. Chem., vol. 6, pp. 387–392, 2014.
[102] S. Wang, E. V. Alekseev, H. M. Miller, W. Depmeier, and T. E. Albrecht-Schmitt, “Boronic Acid Flux Synthesis and Crystal Growth of Uranium and Neptunium Boronates and Borates: A Low-Temperature Route to the First Neptunium(V) Borate,” Inorg. Chem., vol. 49, pp. 9755–9757, 2010.
[103] S. Wang, J. Diwu, A. Simonetti, C. H. Booth, and T. E. Albrecht-Schmitt, “Interstitial Incorporation of Plutonium into a Low-Dimensional Potassium Borate,” Environ. Sci. Technol., vol. 45, pp. 9457–9463, 2011.
[104] S. Wang, E. V. Alekseev, J. Ling, S. Skanthakumar, L. Soderholm, W. Depmeier, and T. E. Albrecht-Schmitt, “Neptunium Diverges Sharply from Uranium and Plutonium in Crystalline
References
123
Borate Matrixes: Insights into the Complex Behavior of the Early Actinides Relevant to Nuclear Waste Storage,” Angew. Chem., vol. 122, pp. 1285–1288, 2010.
[105] S. Wang, E. V. Alekseev, W. Depmeier, and T. E. Albrecht-Schmitt, “New Neptunium(V) Borates That Exhibit the Alexandrite Effect,” Inorg. Chem., vol. 51, pp. 7–9, 2012.
[106] S. Wang, E. M. Villa, J. Diwu, E. V. Alekseev, W. Depmeier, and T. E. Albrecht-Schmitt, “Role of Anions and Reaction Conditions in the Preparation of Uranium(VI), Neptunium(VI), and Plutonium(VI) Borates,” Inorg. Chem., vol. 50, pp. 2527–2533, 2011.
[107] V. Neck, M. Altmaier, T. Rabung, J. Lützenkirchen, and T. Fanghänel, “Thermodynamics of
trivalent actinides and neodymium in NaCl, MgCl2, and CaCl2 solutions: Solubility, hydrolysis,
and ternary Ca–M(III)–OH complexes,” Pure Appl. Chem., vol. 81, pp. 1555–1568, 2009.
[108] J. Schott, J. Kretzschmar, S. Tsushima, B. Drobot, M. Acker, A. Barkleit, S. Taut, V. Brendler,
and T. Stumpf, “The interaction of Eu(III) with organoborates – a further approach to understand
the complexation in the An/Ln(III)-borate system,” Dalton Trans., vol. 44, pp. 11095–11108,
2015.
[109] C. C. Hinckley, “Paramagnetic shifts in solutions of cholesterol and the dipyridine adduct of
trisdipivalomethanatoeuropium(III). A shift reagent,” J. Am. Chem. Soc., vol. 91, pp. 5160–5162,
1969.
[110] B. C. Mayo, “Lanthanide shift reagents in nuclear magnetic resonance spectroscopy,” Chem.
Soc. Rev., vol. 2, pp. 49–74, 1973.
[111] J. D. Roberts, G. E. Hawkes, J. Husar, A. W. Roberts, and D. W. Roberts, “Nuclear magnetic
resonance spectroscopy: Lanthanide shift reagents. Useful tools for study of conformational
equilibria in solution?,” Tetrahedron, vol. 30, pp. 1833–1844, 1974.
[112] A. F. Cockerill, G. L. O. Davies, R. C. Harden, and D. M. Rackham, “Lanthanide shift reagents
for nuclear magnetic resonance spectroscopy,” Chem. Rev., vol. 73, pp. 553–588, 1973.
[113] J. R. Lakowicz, Principles of Fluorescence Spectroscopy, Third Edition. New York: Springer
Science+Business Media, LLC, 2006.
[114] M. Otto, Analytische Chemie, 3. Auflage. Weinheim: Wiley-VCH, 2006. [115] W. T. Carnall, P. R. Fields, and K. Rajnak, “Electronic Energy Levels of the Trivalent Lanthanide
Aquo Ions. IV. Eu3+,” J. Chem. Phys., vol. 49, pp. 4450–4455, 1968.
[116] W. D. Horrocks, Jr. and D. R. Sudnick, “Lanthanide ion probes of structure in biology. Laser-induced luminescence decay constants provide a direct measure of the number of metal-coordinated water molecules,” J. Am. Chem. Soc., vol. 101, pp. 334–340, 1979.
[117] J.-C. G. Bünzli, - Luminescent Probes - in: Lanthanide Probes in Life, Chemical and Earth
Sciences: Theory and Practice. Amsterdam: Elsevier Science Publishers B. V., Eds. J.-C. G. Bünzli and G. R. Choppin, 1989.
[118] K. Binnemans, “Interpretation of europium(III) spectra,” Coord. Chem. Rev., vol. 295, pp. 1–
45, 2015.
[119] F. S. Richardson, “Terbium(III) and Europium(III) Ions as Luminescent Probes and Stains for
Biomolecular Systems,” Chem. Rev., vol. 82, pp. 541–552, 1982.
[120] G. Plancque, V. Moulin, P. Toulhoat, and C. Moulin, “Europium speciation by time-resolved laser-induced fluorescence,” Anal. Chim. Acta, vol. 478, pp. 11–22, 2003.
[121] C. Moulin, J. Wei, P. Van Iseghem, I. Laszak, G. Plancque, and V. Moulin, “Europium
complexes investigations in natural waters by time-resolved laser-induced fluorescence,” Anal.
Chim. Acta, vol. 396, pp. 253–261, 1999.
[122] M. Schmidt, T. Stumpf, C. Walther, H. Geckeis, and T. Fanghänel, “Incorporation versus
adsorption: substitution of Ca2+ by Eu3+ and Cm3+ in aragonite and gypsum,” Dalton Trans., vol.
33, pp. 6645–6650, 2009.
[123] R. M. Supkowski and W. D. Horrocks, Jr., “On the determination of the number of water
molecules, q, coordinated to europium(III) ions in solution from luminescence decay lifetimes,”
Inorganica Chim. Acta, vol. 340, pp. 44–48, 2002.
[124] H. Günther, NMR Spectroscopy / Basic Principles, Concepts and Applications in Chemistry,
Third edition. Weinheim: Wiley-VCH, 2013.
References
124
[125] H. Friebolin, Ein- und zweidimensionale NMR-Spektroskopie / Eine Einführung, 3. Auflage. Weinheim: Wiley-VCH, 1999.
[126] Y. Miyazaki, K. Yoshimura, Y. Miura, H. Sakashita, and K. Ishimaru, “11B NMR investigation of
the complexation behavior of borate with polysaccharides in aqueous solution,” Polyhedron, vol.
22, pp. 909–916, 2003.
[127] K. J. D. MacKenzie and M. E. Smith, Multinuclear solid-state NMR of inorganic materials,
Pergamon Materials Series Volume 6. Amsterdam: Pergamon (Elsevier Science), R. W. Cahn
(Series Editor), 2002.
[128] D. Müller, A.-R. Grimmer, U. Timper, G. Heller, and M. Shakibaie-Moghadam, “11B-MAS-NMR-Untersuchungen zur Anionenstruktur von Boraten,” Z. Für Anorg. Allg. Chem., vol. 619, pp.
1262–1268, 1993.
[129] S. F. Dec and G. E. Maciel, “High-Speed MAS NMR Spectra of Quadrupolar Nuclides at High Magnetic Fields,” J. Magn. Reson., vol. 87, pp. 153–159, 1990.
[130] Bing Zhou, Zhaohua Sun, Yefeng Yao, and Yuanming Pan, “Correlation between 11B NMR
parameters and structural characters in borate and borosilicate minerals investigated by high-resolution MAS NMR and ab initio calculations,” Phys. Chem. Miner., vol. 39, pp. 363–372, 2012.
[131] G. L. Turner, K. A. Smith, R. J. Kirkpatrick, and E. Oldfield, “Boron-11 Nuclear Magnetic Resonance Spectroscopic Study of Borate and Borosilicate Minerals and a Borosilicate Glass,” J. Magn. Reson., vol. 67, pp. 544–550, 1986.
[132] K.-F. Arndt and G. Müller, Polymercharakterisierung. München, Wien: Carl Hanser Verlag, 1996.
[133] D. A. Skoog and J. J. Leary, Instrumentelle Analytik / Grundlagen - Geräte - Anwendungen. Berlin, Heidelberg: Springer-Verlag, 1996.
[134] P. Gans, A. Sabatini, and A. Vacca, “Investigation of equilibria in solution. Determination of
equilibrium constants with the HYPERQUAD suite of programs,” Talanta, vol. 43, pp. 1739–1753,
1996.
[135] P. Gans, A. Sabatini, and A. Vacca, Hyperquad2008, Hyperquad suite of programs, Protonic
Software. Leeds, 2008.
[136] P. Gans, A. Sabatini, and A. Vacca, HypSpec, Hyperquad suite of programs, Protonic Software.
Leeds, 2008.
[137] P. Gans, A. Sabatini, and A. Vacca, Hyperquad Simulation and Speciation (HySS), Hyperquad
suite of programs, Protonic Software. Leeds, 2009.
[138] B. Drobot, R. Steudtner, J. Raff, G. Geipel, V. Brendler, and S. Tsushima, “Combining
luminescence spectroscopy, parallel factor analysis and quantum chemistry to reveal metal
speciation – a case study of uranyl(VI) hydrolysis,” Chem. Sci., vol. 6, pp. 964–972, 2015.
[139] T. Saito, H. Sao, K. Ishida, N. Aoyagi, T. Kimura, S. Nagasaki, and S. Tanaka, “Application of
Parallel Factor Analysis for Time-Resolved Laser Fluorescence Spectroscopy: Implication for Metal Speciation Study,” Environ. Sci. Technol., vol. 44, pp. 5055–5060, 2010.
[140] K. Ishida, T. Saito, N. Aoyagi, T. Kimura, R. Nagaishi, S. Nagasaki, and S. Tanaka, “Surface
speciation of Eu3+ adsorbed on kaolinite by time-resolved laser fluorescence spectroscopy (TRLFS) and parallel factor analysis (PARAFAC),” J. Colloid Interface Sci., vol. 374, pp. 258–266, 2012.
[141] R. Bro, “Tutorial PARAFAC. Tutorial and applications,” Chemom. Intell. Lab. Syst., vol. 38, pp. 149–171, 1997.
[142] R. Bro and H. A. L. Kiers, “A new efficient method for determining the number of components
in PARAFAC models,” J. Chemom., vol. 17, pp. 274–286, 2003.
[143] J. Schott, J. Kretzschmar, M. Acker, S. Eidner, M. U. Kumke, B. Drobot, A. Barkleit, S. Taut, V.
Brendler, and T. Stumpf, “Formation of a Eu(III) borate solid species from a weak Eu(III) borate
complex in aqueous solution,” Dalton Trans., vol. 43, pp. 11516–11528, 2014.
[144] A. Hertam, “11B-NMR spektroskopische Untersuchungen zum Lösungszustand von Boraten in konzentrierten Salzlösungen,” Diploma thesis, Freiberg University of Mining and Technology, 2011.
References
125
[145] W. Hummel, G. Anderegg, I. Puigdomènech, L. Rao, and O. Tochiyama (OECD, NEA-TDB), “Chemical Thermodynamics Vol. 9, Chemical Thermodynamics of Compounds and Complexes of U, Np, Pu, Am, Tc, Se, Ni and Zr with Selected Organic Ligands,” Elsevier, Amsterdam, 2005.
[146] S. Menchetti, C. Sabelli, A. Stoppioni, and R. Trosti-Ferroni, “Hydrothermal synthesis at 250°C and X-ray study of resulting products in the NaOH-B2O3-H2O system,” Neues Jahrb. Mineral.
Abh., vol. 148, pp. 163–180, 1983.
[147] J. L. Parsons and M. E. Milberg, “Vibrational Spectra of Vitreous B2O3*xH2O,” J. Am. Ceram.
Soc., vol. 43, pp. 326–330, 1960.
[148] D. E. Bethell and N. Sheppard, “The infra-red spectrum and structure of boric acid,” Trans.
Faraday Soc., vol. 51, pp. 9–15, 1955.
[149] E. L. Belokoneva, A. G. Ivanova, S. Y. Stefanovich, O. V. Dimitrova, and V. S. Kurazhkovskaya,
“New Ln[B6O9(OH)3] borates (Ln = Sm-Lu): Structure, properties, and structural relation to cationic Li4[B7O12]Cl conductors (Li-boracites),” Crystallogr. Rep., vol. 49, pp. 603–613, 2004.
[150] Sun Hua-Yu, Zhou Yan, Huang Ya-Xi, Sun Wei, and Mi Jin-Xiao, “Synthesis, Crystal Structure, Vibrational Spectroscopy, and Thermal Behavior of Y[B2O3(OH)]3,” Chin. J. Struct. Chem., vol. 29, pp. 1387–1393, 2010.
[151] S. Lemanceau, G. Bertrand-Chadeyron, R. Mahiou, M. El-Ghozzi, J. C. Cousseins, P. Conflant, and R. N. Vannier, “Synthesis and Characterization of H-LnBO3 Orthoborates (Ln = La, Nd, Sm, and Eu),” J. Solid State Chem., vol. 148, pp. 229–235, 1999.
[152] Zhu Lixia, Yue Tao, Wang Jiang, and Gao Shiyang, “FT-IR and Raman Spectroscopic Study of Hydrated Rubidium (Cesium) Borates and Alkali Double Borates,” Russ. J. Inorg. Chem., vol. 52, pp. 1786–1792, 2007.
[153] E. F. Medvedev and A. S. Komarevskaya, “IR spectroscopic study of the phase composition of
boric acid as a component of glass batch,” Glass Ceram., vol. 64, pp. 42–46, 2007.
[154] S. Kuke, B. Marmodée, S. Eidner, U. Schilde, and M. U. Kumke, “Intramolecular deactivation
processes in complexes of salicylic acid or glycolic acid with Eu(III),” Spectrochim. Acta Part A,
vol. 75, pp. 1333–1340, 2010.
[155] K. S. Holliday and T. Stumpf, “Using time resolved laser fluorescence spectroscopy as an
internal probe for the phase changes in zirconium oxides,” Environ. Radiochem. Anal., vol. IV, pp.
30–39, 2011.
[156] C. Görller-Walrand and K. Binnemans, - Rationalization of crystal-field parametrization - in:
Handbook on the Physics and Chemistry of Rare Earths, Volume 23. Amsterdam: Elsevier Science B. V., Eds. K. A. Gschneidner, Jr. and L. Eyring, 1996.
[157] R. Ternane, M. Ferid, G. Panczer, M. Trabelsi-Ayadi, and G. Boulon, “Site-selective spectroscopy of Eu3+-doped orthorhombic lanthanum and monoclinic yttrium polyphosphates,” Opt. Mater., vol. 27, pp. 1832–1838, 2005.
[158] B. Piriou, A. Elfakir, and M. Quarton, “Site-selective spectroscopy of Eu3+-doped sodium lead phosphate apatite,” J. Lumin., vol. 93, pp. 17–26, 2001.
[159] J.-C. G. Bünzli and S. V. Eliseeva in, - Basics of Lanthanide Photophysics - in: Lanthanide
Luminescence. Photophysical, Analytical and Biological Aspects. Springer Series on Fluorescence,
Vol. 7. Berlin, Heidelberg: Springer-Verlag, Eds. P. Hänninen and H. Härmä, 2011.
[160] J.-C. G. Bünzli, A.-S. Chauvin, C. D. B. Vandevyver, S. Bo, and S. Comby, “Lanthanide Bimetallic Helicates for in Vitro Imaging and Sensing,” Ann. N. Y. Acad. Sci., vol. 1130, pp. 97–105, 2008.
[161] M. Elhabiri, R. Scopelliti, J.-C. G. Bünzli, and C. Piguet, “Lanthanide helicates self-assembled in water: a new class of highly stable and luminescent dimetallic carboxylates,” J. Am. Chem. Soc., vol. 121, pp. 10747–10762, 1999.
[162] D. H. Everett, “Manual of Symbols and Terminology for Physicochemical Quantities and Units,
Appendix II, Definitions, Terminology and Symbols in Colloid and Surface Chemistry, Part I,” Pure
Appl. Chem., vol. 31, pp. 577–638, 1972.
[163] T. Hofmann, “Die Welt der vernachlässigten Dimensionen / Kolloide,” Chem. Unserer Zeit,
vol. 38, pp. 24–35, 2004.
References
126
[164] R. Corigli, F. Secco, and M. Venturini, “Equilibriums and kinetics of complex formation at gallium(III). Evidence for an associative mode of activation,” Inorg. Chem., vol. 21, pp. 2992–
2998, 1982.
[165] O. Lukkari and J. Tamminen, “Equilibria of nitrosalicylic acids. Complex formation between
boric acid and salicylic acid and nitrosalicylic acids,” Finn. Chem. Lett., vol. 15, pp. 13–17, 1988.
[166] M. L. S. Goncalves and A. M. Mota, “Complexes of vanadyl and uranyl ions with the chelating
groups of humic matter,” Talanta, vol. 34, pp. 839–847, 1987.
[167] T. Paal and M. Mate, “Stability of lactic acid-borate complexes,” Magy. Kem. Folyoirat, vol. 94, pp. 143–144, 1988.
[168] S. H. Eberle and J. B. Schaefer, “Stabilitätskonstanten der Komplexe des neptunyl(V)-ions mit α-hydroxykarbonsäuren,” J. Inorg. Nucl. Chem., vol. 31, pp. 1523–1527, 1969.
[169] K. Yoshimura, Y. Miyazaki, F. Ota, S. Matsuoka, and H. Sakashita, “Complexation of boric acid
with the N-methyl-D-glucamine group in solution and in crosslinked polymer,” J. Chem. Soc.
Faraday Trans., vol. 94, pp. 683–689, 1998.
[170] A. Queen, “The kinetics of the reaction of boric acid with salicylic acid,” Can. J. Chem., vol. 55,
pp. 3035–3039, 1977.
[171] M. Mikesova and M. Bartusek, “Reaction of boric acid with salicylic and chromotropic acids
and with their derivates,” Chem. Zvesti, vol. 32, pp. 472–477, 1978.
[172] T. Paal and M. Mate, “Stability of the salicylic acid-borate complex,” Magy. Kem. Folyoirat, vol. 91, pp. 569–570, 1985.
[173] R. Pizer and R. Selzer, “The Boric Acid/Lactic Acid System. Equilibria and Reaction
Mechanism,” Inorg. Chem., vol. 23, pp. 3023–3026, 1984.
[174] R. Pizer and P. J. Ricatto, “Thermodynamics of Several 1:1 and 1:2 Complexation Reactions of
the Borate Ion with Bidentate Ligands. 11B NMR Spectroscopic Studies,” Inorg. Chem., vol. 33,
pp. 2402–2406, 1994.
[175] A. Barkleit, M. Acker, and G. Bernhard, “Europium(III) complexation with salicylic acid at
elevated temperatures,” Inorganica Chim. Acta, vol. 394, pp. 535–541, 2013.
[176] M. A. Gouveia and R. Guedes de Carvalho, “Formation constants of lanthanide lactate
complexes,” J. Inorg. Nucl. Chem., vol. 28, pp. 1683–1688, 1966.
[177] R. Portanova, L. H. J. Lajunen, M. Tolazzi, and J. Piispanen, “Critical evaluation of stability
constants for alpha-hydroxycarboxylic acid complexes with protons and metal ions and the accompanying enthalpy changes, Part II. Aliphatic 2-hydroxycarboxylic acids,” Pure Appl. Chem., vol. 75, pp. 495–540, 2003.
[178] M. Herm, X. Gaona, T. Rabung, C. Crepin, V. Metz, M. Altmaier, and H. Geckeis, “Solubility and TRLFS Study of Nd(III) and Cm(III) in Dilute to Concentrated Alkaline NaCl-NaNO3 and MgCl2-Mg(NO3)2 Solutions in: Book of Abstracts of the Migration 2013,” Brighton (UK), 2013.
[179] T. Stumpf, T. Fanghänel, and I. Grenthe, “Complexation of trivalent actinide and lanthanide
ions by glycolic acid: a TRLFS study,” J. Chem. Soc. Dalton Trans., vol. 20, pp. 3799–3804, 2002.
[180] C. A. Andersson and R. Bro, “The N-way Toolbox for MATLAB,” Chemom. Intell. Lab. Syst., vol. 52, pp. 1–4, 2000.
[181] MestReNova, Mestrelab Research S.L. 2009.
[182] T. Straaso, A.-C. Dippel, J. Becker, and J. Als-Nielsen, “Model-independent structure factors from powder X-ray diffraction: a novel approach,” J. Synchrotron Radiat., vol. 21, pp. 119–126,
2014.
[183] A. P. Hammersley, S. O. Svensson, M. Hanfland, A. N. Fitch, and D. Häusermann, “Two-Dimensional Detector Software: From Real Detector to Idealised Image or Two-Theta Scan,” High
Press. Res., vol. 14, pp. 235–248, 1996.
[184] J. M. Coddington and M. J. Taylor, “High Field 11B and 13C NMR Investigations of aqueous
borate solutions and borate-diol complexes,” J. Coord. Chem., vol. 20, pp. 27–38, 1989.
[185] T. Oi, T. Takeda, and H. Kakihana, “Esterification of Boric Acid with 1,2-Propanediol, 3-Amino-1,2-propanediol, and (+/-)-3-Dimethylamino-1,2-propandiol as Studied by 11B NMR Spectroscopy,” Bull. Chem. Soc. Jpn., vol. 65, pp. 1903–1909, 1992.
List of Publications
127
List of Publications
Articles
J. Schott, J. Kretzschmar, S. Tsushima, B. Drobot, M. Acker, A. Barkleit, S. Taut, V. Brendler,
T. Stumpf: The interacZon of Eu(III) with organoborates ― a further approach to understand the
complexation in the An/Ln(III)-borate system, Dalton Transactions, 44, 11095-11108 (2015).
J. Schott, J. Kretzschmar, M. Acker, S. Eidner, M. U. Kumke, B. Drobot, A. Barkleit, S. Taut,
V. Brendler, T. Stumpf: Formation of a Eu(III) borate solid species from a weak Eu(III) borate
complex in aqueous solution, Dalton Transactions, 43, 11516-11528 (2014).
J. Schott, M. Acker, A. Barkleit, V. Brendler, S. Taut, G. Bernhard: The influence of temperature and
small organic ligands on the sorption of Eu(III) on Opalinus Clay, Radiochimica Acta, 100, 315-324
(2012).
Talks
J. Schott, M. Acker, J. Kretzschmar, A. Barkleit, S. Taut, V. Brendler, G. Bernhard: Investigation of
the System Ln(III)/An(III)-B(OH)3-Organics, 14th International Conference on the Chemistry and
Migration Behaviour of Actinides and Fission Products in the Geosphere (Migration), Brighton, GB,
2013.
J. Schott, M. Acker, J. Kretzschmar, A. Barkleit, S. Taut, V. Brendler, G. Bernhard: Eu(III)-B(OH)3-
organic system at increased Salt Concentrations, Third International Workshop on Actinide and
Brine Chemistry in a Salt-Based Repository (ABC-Salt III), Santa Fe, New Mexico, USA, 2013.
J. Schott, M. Acker, A. Barkleit, V. Brendler, G. Bernhard: The Sorption of Eu(III) on Opalinus Clay
at elevated Temperatures and in Presence of Organics, Jahrestagung Kerntechnik (Annualing
Meeting on Nuclear Technology), Kompetenzerhaltung in der Kerntechnik, Stuttgart, DE, 2012.
J. Schott, K. Schmeide, M. Acker, A. Barkleit, V. Brendler, G. Bernhard: The Influence of
Temperature and Clay Organics on the Retention Behavior of Opalinus Clay concerning
Radionuclides, HZDR-PSI-Meeting, Villigen, CH, 2011.
List of Publications
128
Poster presentations
J. Schott, J. Kretzschmar, M. Acker, A. Barkleit, S. Taut, V. Brendler, T. Stumpf: The Ionic Strength
Dependency of the Eu(III)-(Poly)borate Complexation in different Salt Media, Fourth International
Workshop on Actinide and Brine Chemistry in a Salt-Based Repository (ABC-Salt IV), Heidelberg, DE,
2015.
J. Schott, J. Kretzschmar, M. Acker, S. Tsushima, B. Drobot, S. Eidner, M. U. Kumke, A. Barkleit,
V. Brendler, S. Taut, T. Stumpf: Insight into the An/Ln(III)-Borate-Organic System ― CombinaZon
of different Spectroscopic Techniques and Theory is the key, International workshop on Advanced
Techniques in Actinide Spectrocopy (ATAS), Dresden, DE, 2014.
J. Schott, M. Acker, A. Barkleit, V. Brendler, S. Taut, G. Bernhard: Temperature Depending
Investigations to the Sorption of Eu(III) on Opalinus Clay, High Temperature Aqueous Chemistry
(HiTAC), Karlsruhe, DE, 2011.
Versicherung
Hiermit versichere ich, dass ich die vorliegende Arbeit ohne unzulässige Hilfe Dritter und ohne
Benutzung anderer als der angegebenen Hilfsmittel angefertigt habe; die aus fremden Quellen direkt
oder indirekt übernommenen Gedanken sind als solche kenntlich gemacht. Die Arbeit wurde bisher
weder im Inland noch im Ausland in gleicher oder ähnlicher Form einer anderen Prüfungsbehörde
vorgelegt.
Die Dissertation wurde in der Zeit von November 2010 bis Mai 2014 am Helmholtz-Zentrum Dresden-
Rossendorf, Institut für Ressourcenökologie, sowie am Sachgebiet Strahlenschutz der Technischen
Universität Dresden, Zentrales Radionuklidlabor, unter der wissenschaftlichen Betreuung von Prof. Dr.
Gert Bernhard und Prof. Dr. Thorsten Stumpf angefertigt.
Promotionsverfahren haben bisher nicht stattgefunden.
Ich erkenne die Promotionsordnung der Fakultät Mathematik und Naturwissenschaften der
Technischen Universität Dresden vom 23.02.2011 in geänderter Fassung vom 15.06.2011 und
18.06.2014 an.
__________________________ Datum, Unterschrift


