Embed Size (px)
Citation preview
Distance Learning for Similarity EstimationJie Yu, Member, IEEE, Jaume Amores, Nicu Sebe, Member, IEEE, Petia Radeva, and
Qi Tian, Senior Member, IEEE
Abstract—In this paper, we present a general guideline to find a better distance measure for similarity estimation based on statistical
analysis of distribution models and distance functions. A new set of distance measures are derived from the harmonic distance, the
geometric distance, and their generalized variants according to the Maximum Likelihood theory. These measures can provide a more
accurate feature model than the classical euclidean and Manhattan distances. We also find that the feature elements are often from
heterogeneous sources that may have different influence on similarity estimation. Therefore, the assumption of single isotropic distribution
model is often inappropriate. To alleviate this problem, we use a boosted distance measure framework that finds multiple distance
measures, which fit the distribution of selected feature elements best for accurate similarity estimation. The new distance measures for
similarity estimation are tested on two applications: stereo matching and motion tracking in video sequences. The performance of boosted
distance measure is further evaluated on several benchmark data sets from the UCI repository and two image retrieval applications. In all
the experiments, robust results are obtained based on the proposed methods.
Index Terms—Image classification, information retrieval, pattern recognition, artificial intelligence, algorithms.
Ç
1 INTRODUCTION
SIMILARITY has been a research topic in the field ofpsychology for decades (see Wallach [1] and Tversky
and Krantz [2]), but recently, there has been a hugeresurgence in the topic. Similarity judgments are consideredto be a valuable tool in the study of human perception andcognition and play a central role in the theories of humanknowledge representation, behavior, and problem solving.Tversky [3] describes the similarity concept as “an organiz-ing principle by which individuals classify objects, formconcepts, and make generalizations.”
1.1 Similarity Estimation in Image Retrieval
Retrieval of images by similarity, that is, retrieving imagesthat are similar to an already retrieved image (retrieval byexample) or to a model or schema, is a relatively old idea.Some might date it to antiquity, but more seriously, itappeared in specialized geographic information systemsdatabases around 1980, in particular, in the “Query byPictorial Example” system of IMAID [4]. From the start, it wasclear that retrieval by similarity called for specific definitions
of what it means to be similar. In the mapping system, asatellite image was matched to existing map images from thepoint of view of similarity of road and river networks, easilyextracted from images by edge detection. Apart fromtheoretical models [5], it was only in the beginning of the1990s that researchers started to look at retrieval by similarityin large sets of heterogeneous images with no specific modelof their semantic contents. The prototype systems of Kato [6],followed by the availability of the QBIC commercial systemusing several types of similarities [7], contributed to makingthis idea more and more popular.
Typically, a system for retrieval by similarity rests onthree components:
. Extraction of features or image signatures from theimages and an efficient representation and storagestrategy for this precomputed data.
. A set of similarity measures, each of which capturessome perceptively meaningful definition of similarityand which should be efficiently computable whenmatching an example with the whole database.
. A user interface for the choice of which definition ofsimilarity should be applied for retrieval, presenta-tion of retrieved images, and supporting relevancefeedback.
The research in the area has made the following evident:
. A large number of meaningful types of similaritycan be defined. Only part of these definitions isassociated with efficient feature extraction mechan-isms and (dis)similarity measures.
. Since there are many definitions of similarity and thediscriminating power of each of the measures is likelyto degrade significantly for large image databases, theuser interaction and the feature storage strategycomponents of the systems will play an important role.
. Visual content-based retrieval is best used whencombined with the traditional search, both at the userinterface and at the system level. The basic reason forthis is that content-based retrieval is not seen as a
IEEE TRANSACTIONS ON PATTERN ANALYSIS AND MACHINE INTELLIGENCE, VOL. 30, NO. 3, MARCH 2008 451
. J. Yu is with the Intelligent Systems Group, Kodak Research Labs, 1999Lake Ave., Mail Code: 02103, Rochester, NY 14615.E-mail: [email protected].
. J. Amores is with the IMEDIA Research Group, Institut National deRecherche en Informatique et en Automatique (INRIA), France.E-mail: [email protected].
. N. Sebe is with the Faculty of Science, University of Amsterdam,Room F 0.06, Kruislaan 403, 1098 SJ Amsterdam, The Netherlands.E-mail: [email protected].
. P. Radeva is with the Universitat Autonoma de Barcelona, Department ofInformatica, Computer Vision Center, Edifici O, 08193 Bellaterra(Barcelona), Catalunya, Spain. E-mail: [email protected].
. Q. Tian is with the Department of Computer Science, University of Texasat San Antonio, One UTSA Circle, San Antonio, TX 78249.E-mail: [email protected].
Manuscript received 6 July 2006; revised 4 Jan. 2007; accepted 2 May 2007;published online 7 June 2007.Recommended for acceptance by J. Luo.For information on obtaining reprints of this article, please send e-mail to:[email protected], and reference IEEECS Log Number TPAMI-0503-0706.Digital Object Identifier no. 10.1109/TPAMI.2007.70714.
0162-8828/08/$25.00 � 2008 IEEE Published by the IEEE Computer Society
replacement of parametric (SQL), text, and keywordssearch. The key is to apply content-based retrievalwhere appropriate, which is typically where the use oftext and keywords is suboptimal. Examples of suchapplications are where visual appearance (for exam-ple, color, texture, and motion) is the primary attributeas in stock photo/video, art, and so forth.
Gudivada and Raghavan [8] listed different possible typesof similarity for retrieval: color similarity, texture similarity,shape similarity, spatial similarity, and so forth. Some of thesetypes can be considered in all or only part of one image, can beconsidered independently of scale or angle or not, dependingon whether one is interested in the scene represented by theimage or in the image itself. Representation of features ofimages, such as color, texture, shape, motion, is a funda-mental problem in visual information retrieval. Imageanalysis and pattern recognition algorithms provide themeans to extract numeric descriptors that give a quantitativemeasure of these features. Computer vision enables objectand motion identification by comparing extracted patternswith predefined models.
1.2 Distance Measure for Similarity Estimation
In many science and engineering fields, the similaritybetween two features is determined by computing thedistance between them using a certain distance measure. Incomputer vision, as well as some other applications, theeuclidean distance or sum of the squared differences(L2—SSD) is one of the most widely used measures.However, it has been suggested that it is not appropriate formany problems [9]. From a maximum likelihood (ML)perspective, it is well known that the SSD is justified whenthe feature data distribution is Gaussian [10], whereas theManhattan distance or sum of the absolute differences(L1—SAD), another commonly used measure, is justifiedwhen the feature data distribution is Exponential (double ortwo-sided exponential). Therefore, which measure to use canbe determined if the underlying data distribution is known orwell estimated. The common assumption is that the realdistribution should fit either the Gaussian or the Exponential.However, in many applications, this assumption is invalid.Finding a suitable distance measure becomes a challengingproblem when the underlying distribution is unknown andcould be neither Gaussian nor Exponential [10].
In content-based image retrieval [11], feature elements areextracted for different statistical properties associated withthe entire digital images or perhaps with a specific region ofinterest. The heterogeneous sources suggest that the elementsmay be from different distributions. In previous work, mostof the attention focused on extracting low-level featureelements such as color-histogram [12], wavelet-based texture[13], [14], and shape [15] with little or no consideration of theirdistributions. The most commonly used method for calculat-ing the similarity between two feature vectors is still tocompare the euclidean distance between them.
Although some work has been done to utilize the datamodel in similarity image retrieval [16], [17], [18], [10], therelation between the distribution model and the distancemeasure has not been fully studied yet. It has been justifiedthat Gaussian, Exponential, and Cauchy distribution result inL2, L1, and Cauchy metrics, respectively. However, distancemeasures that fit other distribution models have not beenstudied yet. The similarity estimation based on featureelements from unknown distributions is an even moredifficult problem.
In this paper, based on previous work [16], [17], [18], wepropose a guideline to learn a robust distance measure foraccurate similarity estimation. The novelty and contributionof our work lie on two folds. First, we study the relation ofdata distribution, distance function, and similarity estima-tion. We prove that the well-known euclidean and Manhattandistances are not the optimal choices when the datadistribution is neither Gaussian nor Exponential. Further,our study on the relation between mean estimation and datadistribution found a new set of distance measures. Theycorrespond to a set of distributions that cannot be mathema-tically formulated and have not been reported in literaturebefore. Our experiments show that these new distancemeasures perform better than traditional distance measures,which implies that the new distributions model the databetter than the well-known Gaussian and Exponentialdistributions. Second, a boosted distance measure frameworkis used to automatically find the best distance functions froma set of given measures and choose the feature elements thatare most useful for similarity estimation. It is especiallyrobust to small sample set problem because the best measuresare learned on each selected feature elements. Experimentalresults show the superior performance of the proposedmethod. It is also worth mentioning that arbitrary distancefunctions can be plugged into the boosting framework, whichmay provide more accurate similarity estimation.
The rest of this paper is organized as follows: Section 2presents a distance measure analysis using the ML approach.Section 3 describes the boosted distance measure. InSection 4, we apply the new distance measures to estimatethe similarity in a stereo matching application, motiontracking in a video sequence, and content-based imageretrieval. Discussion and conclusions are given in Section 5.
2 DISTANCE MEASURE ANALYSIS
2.1 Maximum Likelihood Approach
The additive model is a widely used model in computervision regarding ML estimation. Haralick and Shapiro [19]consider this model in defining the M-estimate: “Anyestimate � defined by a minimization problem of the formmin
Pi fðxi � �Þ is called an M-estimate.” Note that the
operation “–” between the estimate and the real data impliesan additive model. The variable� is either the estimated meanof a distribution or, for simplicity, one of the samples fromthat distribution.
Maximum Likelihood theory [19] allows us to relate adata distribution to a distance measure. From the mathe-matical-statistical point of view, the problem of finding theright measure for the distance comes down to themaximization of the similarity probability.
We use image retrieval as an example for illustration.Consider first, the two subsets ofN images from the databaseðDÞ : XXXX � D, YYYY � D, which according to the ground truth aresimilar
XXXX � YYYY or xxxxi � yyyyi; i ¼ 1; . . . ; N; ð1Þ
where xxxxi 2 XXXX and yyyyi 2 YYYY represent the images from thecorresponding subsets.
Equation (1) can be rewritten as
xxxxi ¼ yyyyi þ ddddi; i ¼ 1; . . . ; N; ð2Þ
where ddddi represents the “distance” image obtained as thedifference between image xxxxi and yyyyi.
452 IEEE TRANSACTIONS ON PATTERN ANALYSIS AND MACHINE INTELLIGENCE, VOL. 30, NO. 3, MARCH 2008
In this context, the similarity probability between twosets of images XXXX and YYYY can be defined
P ðXXXX;YYYY Þ ¼YNi¼1
pðxxxxi; yyyyiÞ; ð3Þ
where pðxxxx; yyyyÞdescribes the similarity between imagesxxxx and yyyy(measured by the probability density function of thedifference between xxxx and yyyy). Independence across images isassumed. We define
fðxxxxi; yyyyiÞ ¼ � log pðxxxxi; yyyyiÞ: ð4Þ
Equation (3) becomes
P ðXXXX;YYYY Þ ¼YNi¼1
exp½�fðxxxxi; yyyyiÞ�f g; ð5Þ
where the function f is the negative logarithm of theprobability density function of xxxx and yyyy.
According to (5), we have to find the function f thatmaximizes the similarity probability. This is the MaximumLikelihood estimator for XXXX, given YYYY [19].
Taking the logarithm of (5), we find that we have tominimize the expression
XNi¼1
fðxxxxi; yyyyiÞ: ð6Þ
In our case, according to (2) the function f does notdepend individually on its two arguments, query image xxxxi,and the predicated one yyyyi but only on their difference. Wehave thus a local estimator, and we can use fðddddiÞ instead offðxxxxi; yyyyiÞ, where ddddi ¼ xxxxi � yyyyi and the operation “–” denotespixel-by-pixel difference between the images or an equiva-lent operation in feature space. Therefore, minimizing (6) isequivalent to minimizing
XNi¼1
fðddddiÞ: ð7Þ
Maximum Likelihood estimation shows a direct relationbetween the data distribution and the comparison measure.One can note that the Gaussian model is related to L2 metric,whereas the Exponential model is related to L1 metric and sois Cauchy metric, respectively [16], [10]. Note that althoughwe consider images as an example, this notion can beextended to feature vectors associated with the images whenwe are working with image features or, even, can be extendedto pixel values in the images.
2.2 Distance Measure Analysis
The Gaussian, Exponential, and Cauchy distribution modelsresult in the L2 metric, L1 metric, and Cauchy metric,respectively [10]. It is reasonable to assume that there may beother distance measures that fit the unknown real distribu-tion better. More accurate similarity estimation is expected ifthe measure could reflect the real distribution. We call thisproblem of finding the best distance measure distance measureanalysis. It can be mathematically formulated as follows.
Suppose we have observations xi1 from a certain
distribution
xi ¼ �þ di; ð8Þ
where di, i ¼ 1; � � � ; N are data components and � is thedistribution mean or a sample from the same class if it isconsidered as center of a subclass from a locality point ofview. In most cases, � is unknown and may be approxi-mated for similarity estimation. For a distance function
fðx; �Þ � 0; ð9Þ
which satisfies the condition fð�; �Þ ¼ 0, � can be estimatedby � which minimizes
" ¼XNi¼1
fðx; �Þ: ð10Þ
It is equivalent to satisfy
XNi¼1
d
d�fðxi; �Þ ¼ 0: ð11Þ
For some specific distributions, the estimated mean � ¼gðx1; x2; � � � ; xNÞ has a closed form solution. The arithmeticmean, median, harmonic mean, and geometric mean inTable 1 are in this category.
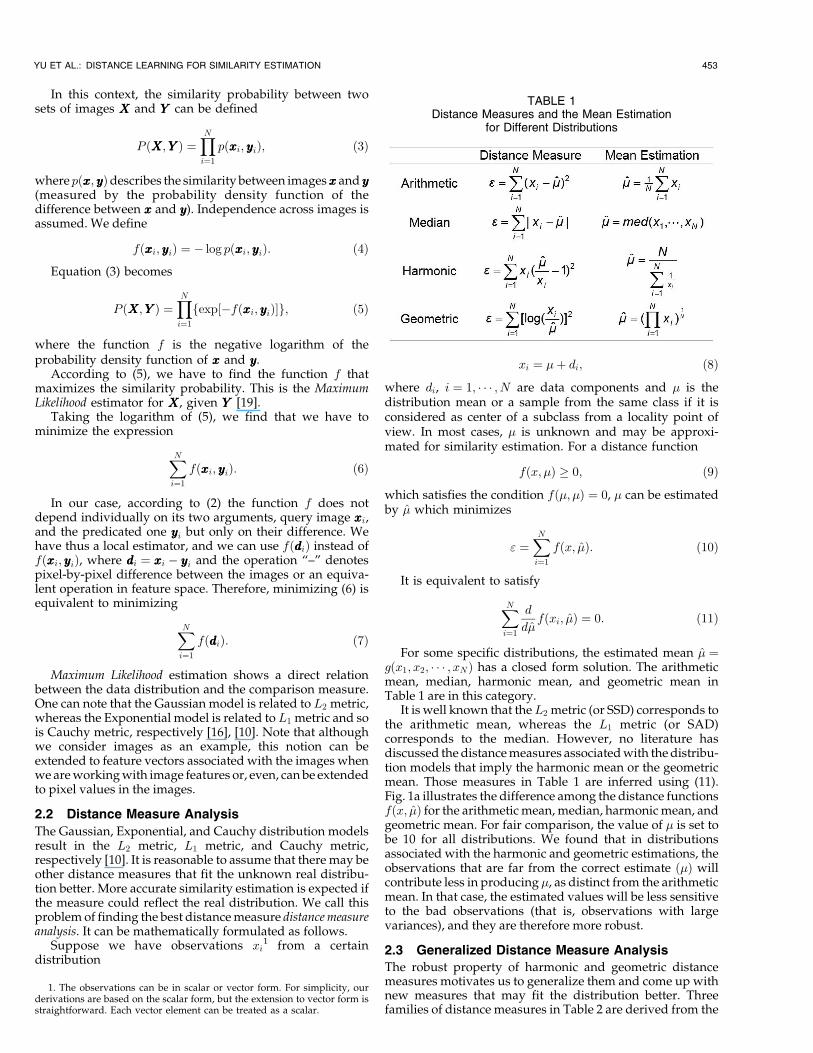
It is well known that theL2 metric (or SSD) corresponds tothe arithmetic mean, whereas the L1 metric (or SAD)corresponds to the median. However, no literature hasdiscussed the distance measures associated with the distribu-tion models that imply the harmonic mean or the geometricmean. Those measures in Table 1 are inferred using (11).Fig. 1a illustrates the difference among the distance functionsfðx; �Þ for the arithmetic mean, median, harmonic mean, andgeometric mean. For fair comparison, the value of � is set tobe 10 for all distributions. We found that in distributionsassociated with the harmonic and geometric estimations, theobservations that are far from the correct estimate ð�Þ willcontribute less in producing �, as distinct from the arithmeticmean. In that case, the estimated values will be less sensitiveto the bad observations (that is, observations with largevariances), and they are therefore more robust.
2.3 Generalized Distance Measure Analysis
The robust property of harmonic and geometric distancemeasures motivates us to generalize them and come up withnew measures that may fit the distribution better. Threefamilies of distance measures in Table 2 are derived from the
YU ET AL.: DISTANCE LEARNING FOR SIMILARITY ESTIMATION 453
TABLE 1Distance Measures and the Mean Estimation
for Different Distributions
1. The observations can be in scalar or vector form. For simplicity, ourderivations are based on the scalar form, but the extension to vector form isstraightforward. Each vector element can be treated as a scalar.
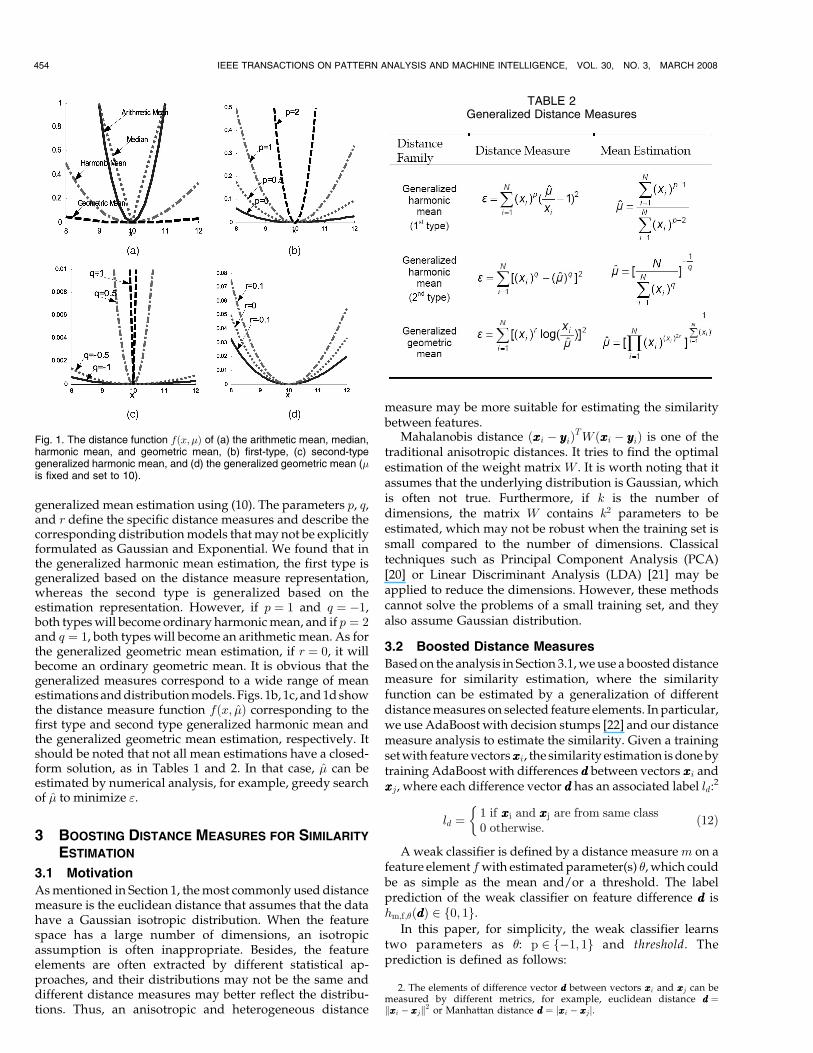
generalized mean estimation using (10). The parameters p, q,and r define the specific distance measures and describe thecorresponding distribution models that may not be explicitlyformulated as Gaussian and Exponential. We found that inthe generalized harmonic mean estimation, the first type isgeneralized based on the distance measure representation,whereas the second type is generalized based on theestimation representation. However, if p ¼ 1 and q ¼ �1,both types will become ordinary harmonic mean, and if p ¼ 2and q ¼ 1, both types will become an arithmetic mean. As forthe generalized geometric mean estimation, if r ¼ 0, it willbecome an ordinary geometric mean. It is obvious that thegeneralized measures correspond to a wide range of meanestimations and distribution models. Figs. 1b, 1c, and 1d showthe distance measure function fðx; �Þ corresponding to thefirst type and second type generalized harmonic mean andthe generalized geometric mean estimation, respectively. Itshould be noted that not all mean estimations have a closed-form solution, as in Tables 1 and 2. In that case, � can beestimated by numerical analysis, for example, greedy searchof � to minimize ".
3 BOOSTING DISTANCE MEASURES FOR SIMILARITY
ESTIMATION
3.1 Motivation
As mentioned in Section 1, the most commonly used distancemeasure is the euclidean distance that assumes that the datahave a Gaussian isotropic distribution. When the featurespace has a large number of dimensions, an isotropicassumption is often inappropriate. Besides, the featureelements are often extracted by different statistical ap-proaches, and their distributions may not be the same anddifferent distance measures may better reflect the distribu-tions. Thus, an anisotropic and heterogeneous distance
measure may be more suitable for estimating the similaritybetween features.
Mahalanobis distance ðxxxxi � yyyyiÞTWðxxxxi � yyyyiÞ is one of thetraditional anisotropic distances. It tries to find the optimalestimation of the weight matrix W . It is worth noting that itassumes that the underlying distribution is Gaussian, whichis often not true. Furthermore, if k is the number ofdimensions, the matrix W contains k2 parameters to beestimated, which may not be robust when the training set issmall compared to the number of dimensions. Classicaltechniques such as Principal Component Analysis (PCA)[20] or Linear Discriminant Analysis (LDA) [21] may beapplied to reduce the dimensions. However, these methodscannot solve the problems of a small training set, and theyalso assume Gaussian distribution.
3.2 Boosted Distance Measures
Based on the analysis in Section 3.1, we use a boosted distancemeasure for similarity estimation, where the similarityfunction can be estimated by a generalization of differentdistance measures on selected feature elements. In particular,we use AdaBoost with decision stumps [22] and our distancemeasure analysis to estimate the similarity. Given a trainingset with feature vectorsxxxxi, the similarity estimation is done bytraining AdaBoost with differences dddd between vectors xxxxi andxxxxj, where each difference vector dddd has an associated label ld:
2
ld ¼1 if xxxxi and xxxxj are from same class0 otherwise:
�ð12Þ
A weak classifier is defined by a distance measure m on afeature element f with estimated parameter(s) �, which couldbe as simple as the mean and/or a threshold. The labelprediction of the weak classifier on feature difference dddd ishm;f;�ðddddÞ 2 f0; 1g.
In this paper, for simplicity, the weak classifier learnstwo parameters as �: p 2 f�1; 1g and threshold. Theprediction is defined as follows:
454 IEEE TRANSACTIONS ON PATTERN ANALYSIS AND MACHINE INTELLIGENCE, VOL. 30, NO. 3, MARCH 2008
Fig. 1. The distance function fðx; �Þ of (a) the arithmetic mean, median,harmonic mean, and geometric mean, (b) first-type, (c) second-typegeneralized harmonic mean, and (d) the generalized geometric mean (�is fixed and set to 10).
TABLE 2Generalized Distance Measures
2. The elements of difference vector dddd between vectors xxxxi and xxxxj can bemeasured by different metrics, for example, euclidean distance dddd ¼kxxxxi � xxxxjk2 or Manhattan distance dddd ¼ jxxxxi � xxxxjj.
hðddddÞ ¼ 1 if df � p < threshold � p0 otherwise:
�ð13Þ
The boosted distance measureHðddddÞ is learned by weightedtraining with different distance measures on each featureelement and by selecting the most important feature elementsfor similarity estimation iteratively. Consequently, we derivea predicted similarity Sðxxxx; yyyyÞ ¼ HðddddÞ that is optimal in aclassification context. The brief algorithm is listed below.
Please note that the resulting similarity Sðxxxx; yyyyÞ may notbe a traditional metric. It does not have the metricproperties such as symmetry and triangular inequality.However, it is not necessarily a disadvantage because theproposed application of similarity estimation does not relyon the metric properties. Indeed, nonmetric distancesmeasure can be more accurate for comparing complexobjects, as have been studied recently in [23].
Boosting Distance Measure AlgorithmGiven: Pairwise difference vector set D and the
corresponding label LNumber of iterations TWeak classifiers based on each distance measure mfor each feature element FE
Initialization: weight wi;t¼1 ¼ 1=jDj, i ¼ 1; . . . ; DBoosting:For t ¼ 1; . . . ; T
. Train the weak classifier on the weighted sample set.
. Select the best weak classifier giving the smallest errorrate:
"t ¼ minm;FE;�
Pi
wi;tjhm;FE;�ðddddiÞ � lij:
. Let ht ¼ hmt;FEt;�t with mt, FEt, �t minimizing errorrate.
. Compute the weights of classifiers ð�tÞ based on itsclassification error rate:
Let �t ¼ "t1�"t , �t ¼ 1
logð�tÞ:
. Update and normalize the weight for each sample:
wi;tþ1 ¼ wi;t�1�jht;i�lijt
wi;tþ1 ¼ wi;tþ1=P
i wi;tþ1:
end for tFinal prediction HðddddÞ ¼
Pt�thtðddddÞ:
The method has three main advantages: 1) the similarityestimation uses only a small set of elements that is most usefulfor similarity estimation, 2) for each element, the distancemeasure that best fits its distribution is learned, and 3) it addseffectiveness and robustness to the classifier when we have asmall training set compared to the number of dimensions.
Because the feature elements may be from differentsources, they may be modeled as different distributions.Actually, the correlation of distribution is very difficult to bemathematically modeled even if we assume the samedistribution for different features as in Relevant ComponentAnalysis (RCA) and [24]. The boosting scheme alleviates thatproblem because the feature elements selected have compli-mentary properties in similarity estimation and, conse-quently, the correlation among the selected feature elementsshould be low. Furthermore, since the training iteration T isusually much less than the original data dimension, theboosted distance measure works as a nonlinear dimensionreduction technique similar to Viola and Jones [25], whichkeeps the most important elements to similarity judgment. It
could be very helpful to overcome the small sample setproblem [26]. It is worth mentioning that the proposedmethod is general and can be plugged into many similarityestimation techniques, such as widely used K-NN [27].
Compared with other distance measures proposed for K-NN, the boosted similarity is especially suitable when thetraining set is small. Two factors contribute to this. First, ifN isthe size of the original training set, this is augmented by usinga new training set withOðN2Þ relations between vectors. Thismakes AdaBoost more robust against overfitting. Second,AdaBoost complements K-NN by providing an optimalsimilarity. Increasing the effectiveness for small training setsis necessary in many real classification problems, and inparticular, it is necessary in applications such as retrievalwhere the user provides a small training set online.
3.3 Related work
We notice that there have been several works on estimatingthe distance to solve certain pattern recognition problems.Domeniconi et al. [28] and Peng et al. [29] propose specificestimations designed for theK-NN classifier. They obtain ananisotropic distance based on local neighborhoods that arenarrower along relevant dimensions and more elongatedalong nonrelevant ones. Xing et al. [30] propose estimatingthe matrix W of a Mahalanobis distance by solving a convexoptimization problem. They apply the resulting distance toimprove theK-means behavior. Bar-Hillel et al. [31] also use aweight matrix W to estimate the distance by RCA. Theyimprove the Gaussian Mixture EM algorithm by applying theestimated distance along with equivalence constraints.
The work by Athitsos et al. [32] and Hertz et al. [33]resemble the boosting part of our method, although theirapproach is conceptually different. Athitsos et al. [32]proposed a method called BoostMap to estimate a distancethat approximates a certain distance, for example, EMDdistance by Ruber et al. [46] but with a much smallercomputational cost. Our method does not approximate oremulate any given distance. What we want to do is to learn anew distance function that is accurate for our problem.Hertz’s work [33] uses AdaBoost to estimate a distancefunction in a product space (with pairs of vectors), whereasthe weak classifier minimizes an error in the original featurespace. Therefore, the weak classifier minimizes a differenterror than the one minimized by the strong classifierAdaBoost. In contrast, our framework utilizes AdaBoost withweak classifiers that minimize the same error as AdaBoostand in the same space. Apart from this conceptual difference,Hertz et al. [33] use Expectation-Maximization of GaussianMixture as a weak classifier, where they assume that the datahave a Gaussian Mixture distribution and estimate severalcovariance matrices, which may not work well when the realdistribution is not Gaussian or the training set is smallcompared to the dimensionality of the data.
4 EXPERIMENTS AND ANALYSIS
4.1 Distance Measure Analysis in Stereo Matching
Stereo matching is the process of finding correspondencesbetween entities in images with overlapping scene content.The images are typically taken from cameras at differentviewpoints, which imply that the intensity of correspondingpixels may not be the same.
In stereo data sets, the ground truth for matchingcorresponding points may be provided by the laboratorywhere these images were taken. This ground truth is a result of
YU ET AL.: DISTANCE LEARNING FOR SIMILARITY ESTIMATION 455
mapping the world coordinates, in which the camera ismoving tothe imagecoordinates, usingthethree-dimensionalgeometry relations of the scene. In this case, an automaticstereomatcher,whichisabletodetect thecorrespondingpointpairs registered in the stereo images of the test set scenes canbe tested. For this stereo matcher, it is possible to determinethe best measure when comparing different image regionsto find the similar ones. The optimum measure in this casewill give the most accurate stereo matcher.
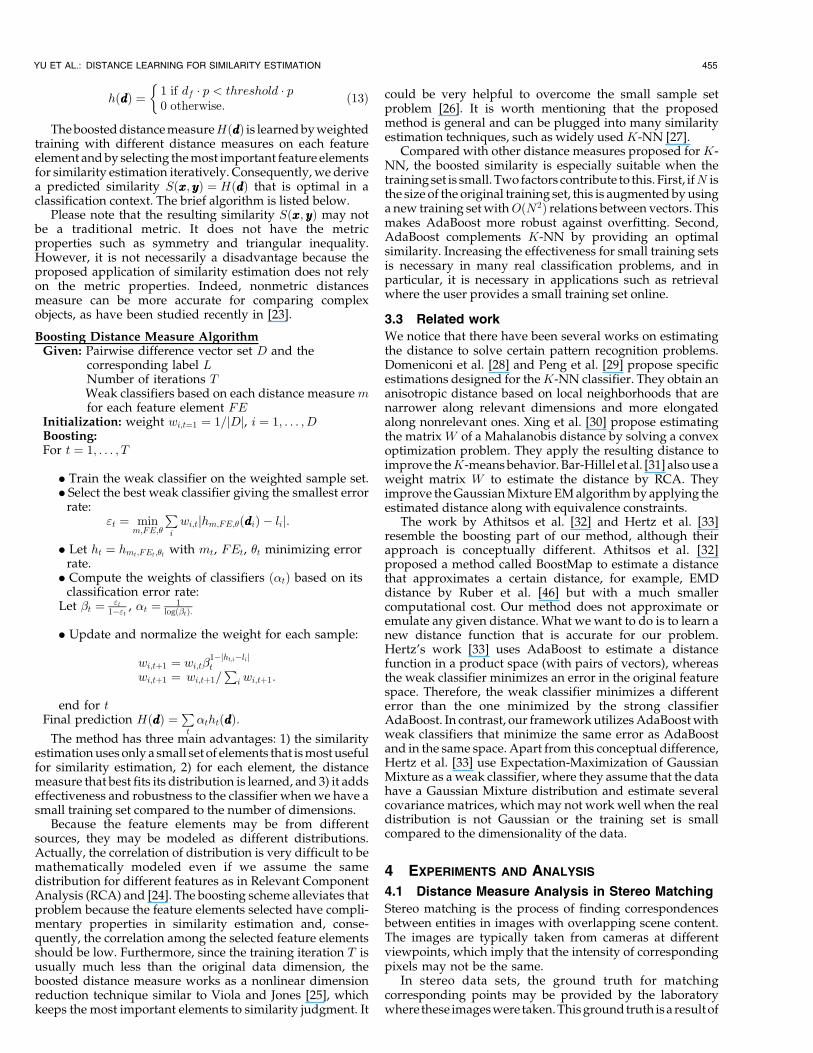
We use two standard stereo data sets (Castle set and Towerset) provided by Carnegie Mellon University. These data setscontain multiple images of static scenes with accurateinformation about object locations in 3D. The images aretaken with a scientific camera in an indoor setting, theCalibrated Imaging Laboratory at CMU. The 3D locations aregiven in X � Y � Z coordinates with a simple text descrip-tion (at best accurate to 0.3 mm), and the corresponding imagecoordinates (the ground truth) are provided for all 11 imagestaken for each scene. For each image, there are 28 pointsprovided as ground truth in the Castle set and 18 points in theTower set. An example of two stereo images from the Castledata set is given in Fig. 2.
In each of the images, we consider the points, which aregiven by the ground truth, and we want to find the propersimilarity estimation, which will ensure the best accuracyin finding the corresponding points according to theground truth.
We cannot use a single pixel information but have to use aregion around it, so we will perform template matching. Ourautomatic stereo matcher will match a template definedaround one point from an image with the templates aroundpoints in the other images to find similar ones. If the resultingpoints are equivalent to those provided by the ground truth,we consider that we have a hit; otherwise, we have a miss. Theaccuracy is given by the number of the hits divided by thenumber of possible hits (number of corresponding pointpairs). Because the ground truth is provided with subpixelaccuracy, we consider that we have a hit when thecorresponding point lies in the neighborhood of one pixelaround the point provided by the ground truth. Our intentionis to try distance measures other than SSD, that is, L2, (whichis used in the original algorithms) in calculating the disparitymap. The algorithm is described in the following:
1. Obtain the ground truth similarity distance distribu-tion A template of size 5� 5 is applied around eachground truth point (that is, 28 points for each image),and the real distance is obtained by calculating thedifference of pixel intensities within the templatebetween sequential frames, which is the differencebetween frame 2 and frame 1, frame 3 and frame 2, andso on.
2. Obtain the estimated similarity using distance mea-sure analysis:
a. Given the 28 ground truth points in one frame,say, frame k, the template matching centered ata ground-truth point is applied to find itscorresponding point in frame kþ 1.
– To find the corresponding point in framekþ 1, we search a band centered at the rowcoordinate of the pixel provided by the testframe k with a height of seven pixels andwidth equal to the image dimension. Thetemplate size is 5� 5.
– The corresponding point is determined tominimize the quantity of distance, which isdefined by distance measures. For example,the distance under L1 metric is the summedas the absolute difference between the in-tensity of each pixel in the template andthat in the searching area, that is,
P25i¼1
jxi;kþ1 � xi;kj, and the distance under L2 isthe summed squared difference betweeneach pixel intensity in the template andthat in the searching area, that is,
P25i¼1
ðxi;kþ1 � xi;kÞ2. For other distance measures,", see Tables 1 and 2.
b. Apply the template centered at the ground-truthpoint in frame k and its tracked point in framekþ 1 to calculate pixel intensity difference as theestimated similarity measurement.
3. Apply the Chi-square test [34].
The estimated distance and the real distance are comparedusing Chi-square test.
DistBoost [33] and the Boosted Distance are also testedfor comparison. Note that Chi-square test cannot be appliedon these two techniques. For the parameterized measures,we should choose the parameter value that minimizes theChi-square test. As our first attempt, the parameters of p, q,and r are tested in the range of �5 to 5 with step size 0.1.Two thirds of the reference points pairs are randomlyselected for training, and the rest are used for testing.
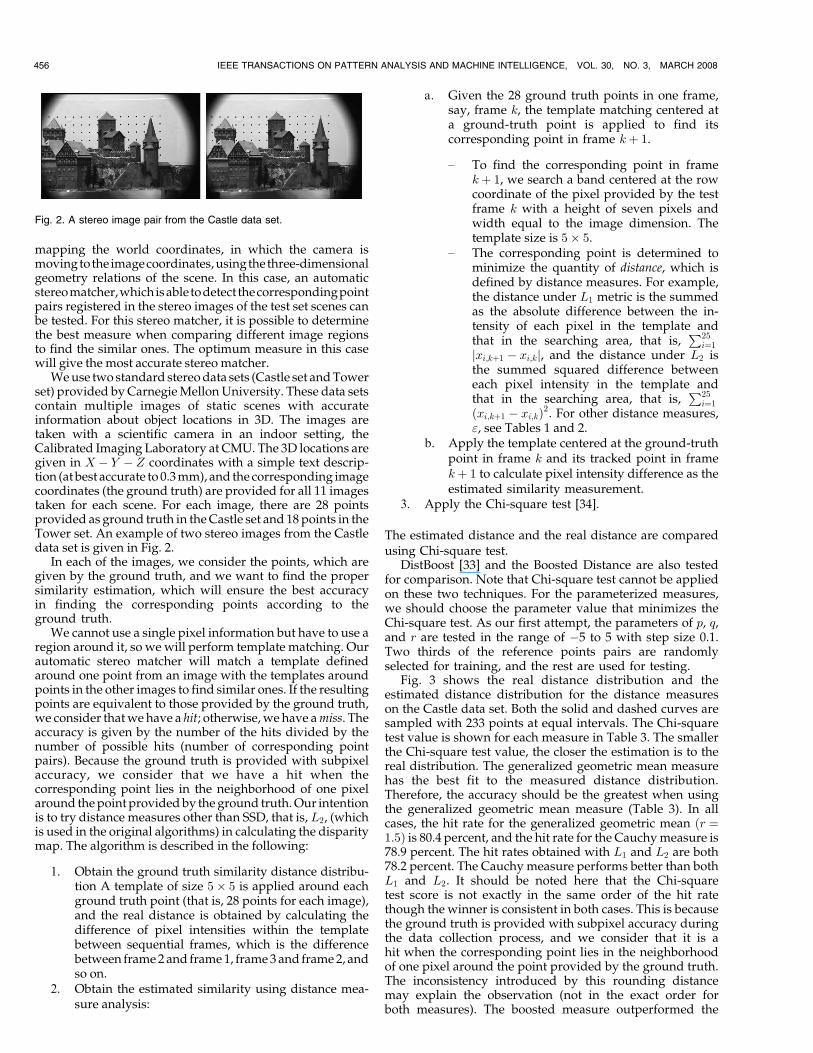
Fig. 3 shows the real distance distribution and theestimated distance distribution for the distance measureson the Castle data set. Both the solid and dashed curves aresampled with 233 points at equal intervals. The Chi-squaretest value is shown for each measure in Table 3. The smallerthe Chi-square test value, the closer the estimation is to thereal distribution. The generalized geometric mean measurehas the best fit to the measured distance distribution.Therefore, the accuracy should be the greatest when usingthe generalized geometric mean measure (Table 3). In allcases, the hit rate for the generalized geometric mean ðr ¼1:5Þ is 80.4 percent, and the hit rate for the Cauchy measure is78.9 percent. The hit rates obtained with L1 and L2 are both78.2 percent. The Cauchy measure performs better than bothL1 and L2. It should be noted here that the Chi-squaretest score is not exactly in the same order of the hit ratethough the winner is consistent in both cases. This is becausethe ground truth is provided with subpixel accuracy duringthe data collection process, and we consider that it is ahit when the corresponding point lies in the neighborhoodof one pixel around the point provided by the ground truth.The inconsistency introduced by this rounding distancemay explain the observation (not in the exact order forboth measures). The boosted measure outperformed the
456 IEEE TRANSACTIONS ON PATTERN ANALYSIS AND MACHINE INTELLIGENCE, VOL. 30, NO. 3, MARCH 2008
Fig. 2. A stereo image pair from the Castle data set.
DistBoost. Similar results were obtained for the Tower set,and they are not shown here.
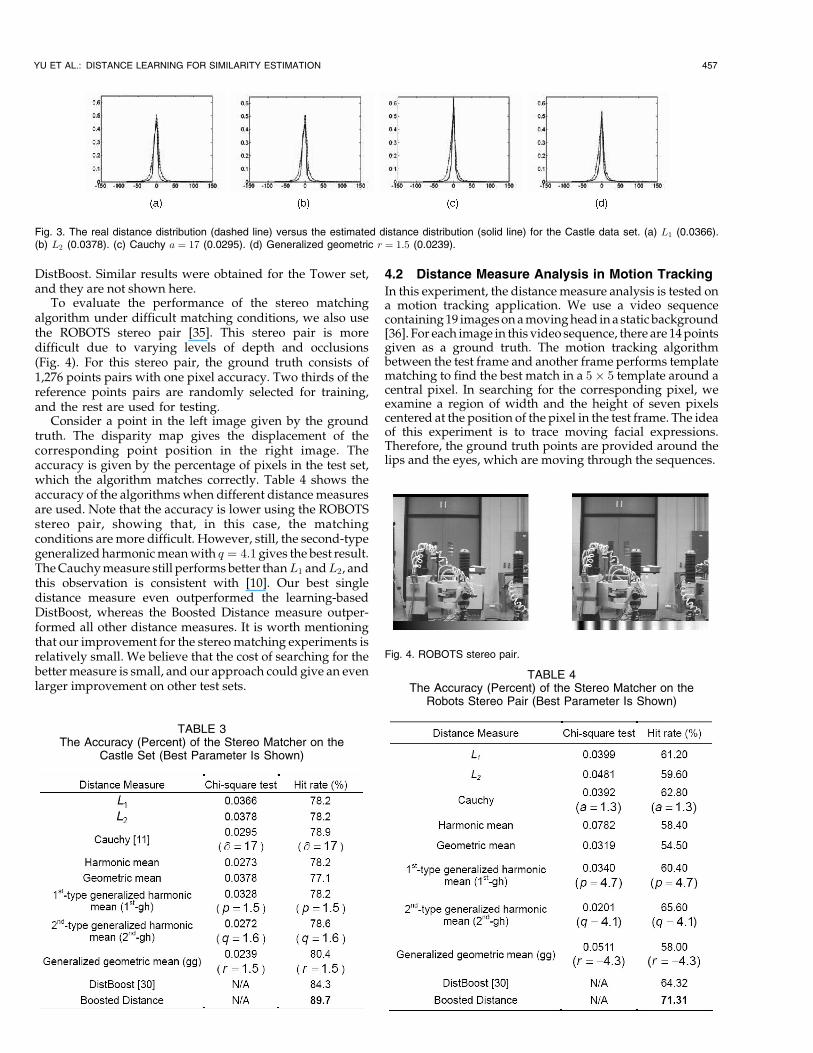
To evaluate the performance of the stereo matchingalgorithm under difficult matching conditions, we also usethe ROBOTS stereo pair [35]. This stereo pair is moredifficult due to varying levels of depth and occlusions(Fig. 4). For this stereo pair, the ground truth consists of1,276 points pairs with one pixel accuracy. Two thirds of thereference points pairs are randomly selected for training,and the rest are used for testing.
Consider a point in the left image given by the groundtruth. The disparity map gives the displacement of thecorresponding point position in the right image. Theaccuracy is given by the percentage of pixels in the test set,which the algorithm matches correctly. Table 4 shows theaccuracy of the algorithms when different distance measuresare used. Note that the accuracy is lower using the ROBOTSstereo pair, showing that, in this case, the matchingconditions are more difficult. However, still, the second-typegeneralized harmonic mean with q ¼ 4:1 gives the best result.The Cauchy measure still performs better thanL1 andL2, andthis observation is consistent with [10]. Our best singledistance measure even outperformed the learning-basedDistBoost, whereas the Boosted Distance measure outper-formed all other distance measures. It is worth mentioningthat our improvement for the stereo matching experiments isrelatively small. We believe that the cost of searching for thebetter measure is small, and our approach could give an evenlarger improvement on other test sets.
4.2 Distance Measure Analysis in Motion Tracking
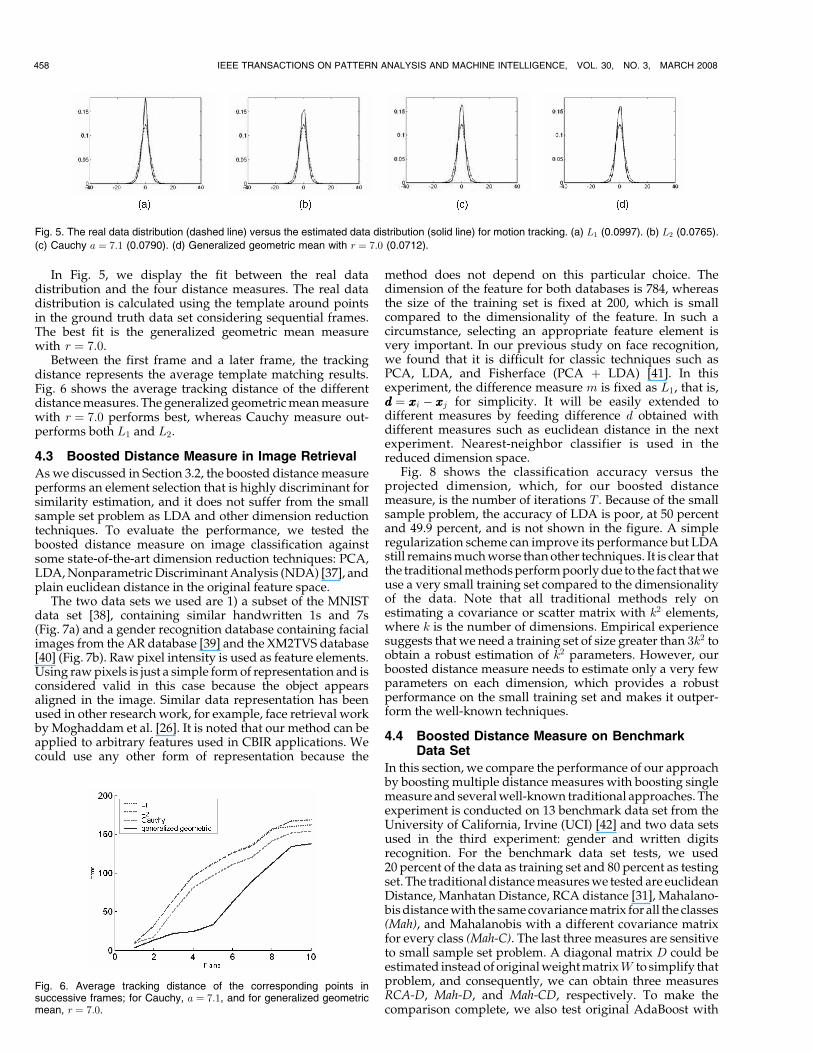
In this experiment, the distance measure analysis is tested ona motion tracking application. We use a video sequencecontaining 19 images on a moving head in a static background[36]. For each image in this video sequence, there are 14 pointsgiven as a ground truth. The motion tracking algorithmbetween the test frame and another frame performs templatematching to find the best match in a 5� 5 template around acentral pixel. In searching for the corresponding pixel, weexamine a region of width and the height of seven pixelscentered at the position of the pixel in the test frame. The ideaof this experiment is to trace moving facial expressions.Therefore, the ground truth points are provided around thelips and the eyes, which are moving through the sequences.
YU ET AL.: DISTANCE LEARNING FOR SIMILARITY ESTIMATION 457
Fig. 3. The real distance distribution (dashed line) versus the estimated distance distribution (solid line) for the Castle data set. (a) L1 (0.0366).(b) L2 (0.0378). (c) Cauchy a ¼ 17 (0.0295). (d) Generalized geometric r ¼ 1:5 (0.0239).
TABLE 3The Accuracy (Percent) of the Stereo Matcher on the
Castle Set (Best Parameter Is Shown)
TABLE 4The Accuracy (Percent) of the Stereo Matcher on the
Robots Stereo Pair (Best Parameter Is Shown)
Fig. 4. ROBOTS stereo pair.
In Fig. 5, we display the fit between the real datadistribution and the four distance measures. The real datadistribution is calculated using the template around pointsin the ground truth data set considering sequential frames.The best fit is the generalized geometric mean measurewith r ¼ 7:0.
Between the first frame and a later frame, the trackingdistance represents the average template matching results.Fig. 6 shows the average tracking distance of the differentdistance measures. The generalized geometric mean measurewith r ¼ 7:0 performs best, whereas Cauchy measure out-performs both L1 and L2.
4.3 Boosted Distance Measure in Image Retrieval
As we discussed in Section 3.2, the boosted distance measureperforms an element selection that is highly discriminant forsimilarity estimation, and it does not suffer from the smallsample set problem as LDA and other dimension reductiontechniques. To evaluate the performance, we tested theboosted distance measure on image classification againstsome state-of-the-art dimension reduction techniques: PCA,LDA, Nonparametric Discriminant Analysis (NDA) [37], andplain euclidean distance in the original feature space.
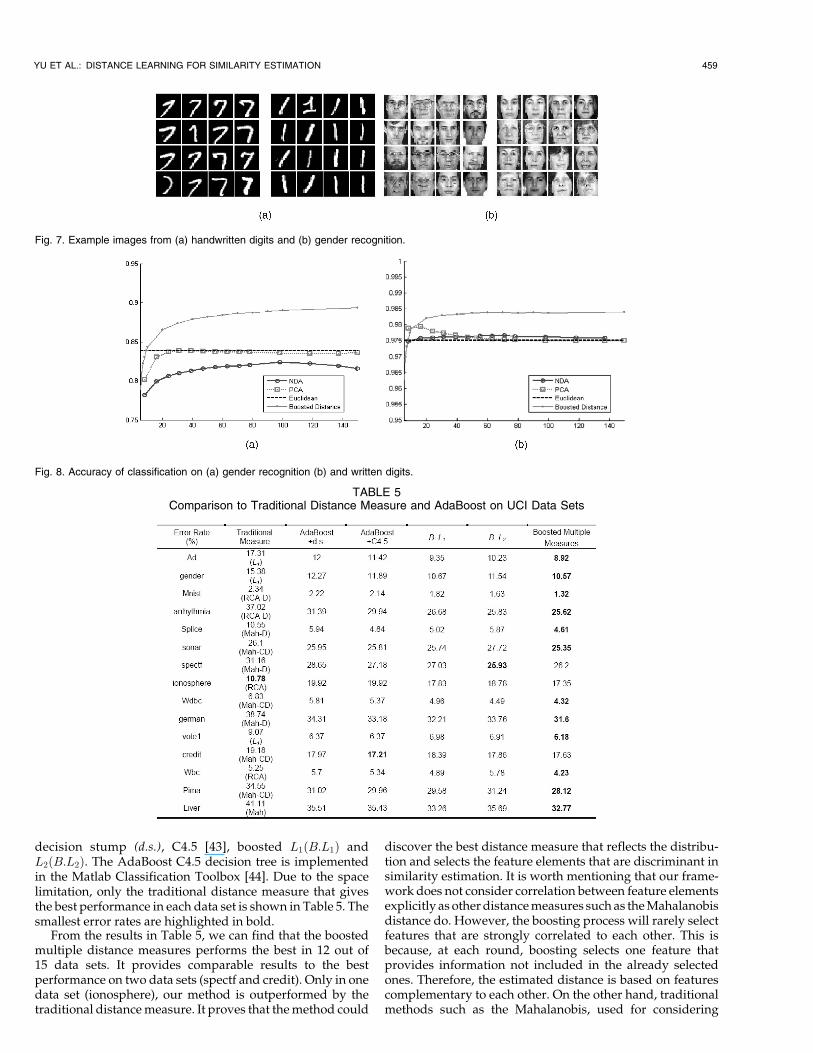
The two data sets we used are 1) a subset of the MNISTdata set [38], containing similar handwritten 1s and 7s(Fig. 7a) and a gender recognition database containing facialimages from the AR database [39] and the XM2TVS database[40] (Fig. 7b). Raw pixel intensity is used as feature elements.Using raw pixels is just a simple form of representation and isconsidered valid in this case because the object appearsaligned in the image. Similar data representation has beenused in other research work, for example, face retrieval workby Moghaddam et al. [26]. It is noted that our method can beapplied to arbitrary features used in CBIR applications. Wecould use any other form of representation because the
method does not depend on this particular choice. Thedimension of the feature for both databases is 784, whereasthe size of the training set is fixed at 200, which is smallcompared to the dimensionality of the feature. In such acircumstance, selecting an appropriate feature element isvery important. In our previous study on face recognition,we found that it is difficult for classic techniques such asPCA, LDA, and Fisherface (PCA þ LDA) [41]. In thisexperiment, the difference measure m is fixed as L1, that is,dddd ¼ xxxxi � xxxxj for simplicity. It will be easily extended todifferent measures by feeding difference d obtained withdifferent measures such as euclidean distance in the nextexperiment. Nearest-neighbor classifier is used in thereduced dimension space.
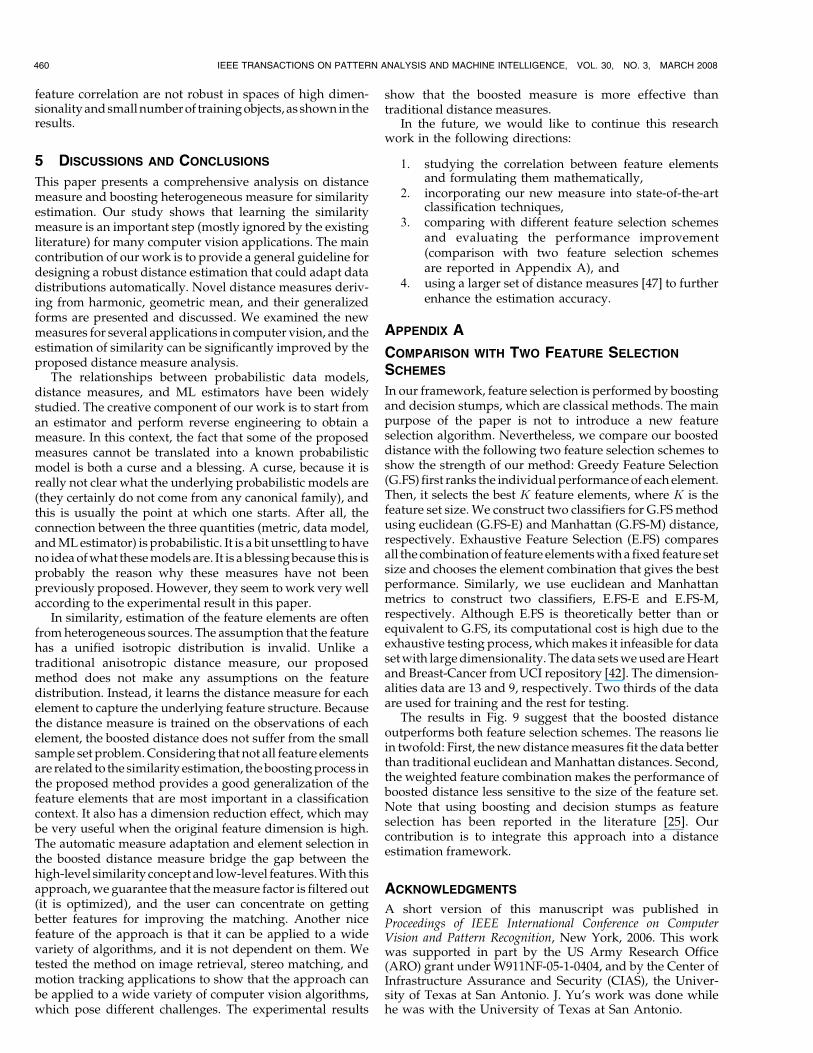
Fig. 8 shows the classification accuracy versus theprojected dimension, which, for our boosted distancemeasure, is the number of iterations T . Because of the smallsample problem, the accuracy of LDA is poor, at 50 percentand 49.9 percent, and is not shown in the figure. A simpleregularization scheme can improve its performance but LDAstill remains much worse than other techniques. It is clear thatthe traditional methods perform poorly due to the fact that weuse a very small training set compared to the dimensionalityof the data. Note that all traditional methods rely onestimating a covariance or scatter matrix with k2 elements,where k is the number of dimensions. Empirical experiencesuggests that we need a training set of size greater than 3k2 toobtain a robust estimation of k2 parameters. However, ourboosted distance measure needs to estimate only a very fewparameters on each dimension, which provides a robustperformance on the small training set and makes it outper-form the well-known techniques.
4.4 Boosted Distance Measure on BenchmarkData Set
In this section, we compare the performance of our approachby boosting multiple distance measures with boosting singlemeasure and several well-known traditional approaches. Theexperiment is conducted on 13 benchmark data set from theUniversity of California, Irvine (UCI) [42] and two data setsused in the third experiment: gender and written digitsrecognition. For the benchmark data set tests, we used20 percent of the data as training set and 80 percent as testingset. The traditional distance measures we tested are euclideanDistance, Manhatan Distance, RCA distance [31], Mahalano-bis distance with the same covariance matrix for all the classes(Mah), and Mahalanobis with a different covariance matrixfor every class (Mah-C). The last three measures are sensitiveto small sample set problem. A diagonal matrix D could beestimated instead of original weight matrixW to simplify thatproblem, and consequently, we can obtain three measuresRCA-D, Mah-D, and Mah-CD, respectively. To make thecomparison complete, we also test original AdaBoost with
458 IEEE TRANSACTIONS ON PATTERN ANALYSIS AND MACHINE INTELLIGENCE, VOL. 30, NO. 3, MARCH 2008
Fig. 5. The real data distribution (dashed line) versus the estimated data distribution (solid line) for motion tracking. (a) L1 (0.0997). (b) L2 (0.0765).
(c) Cauchy a ¼ 7:1 (0.0790). (d) Generalized geometric mean with r ¼ 7:0 (0.0712).
Fig. 6. Average tracking distance of the corresponding points insuccessive frames; for Cauchy, a ¼ 7:1, and for generalized geometricmean, r ¼ 7:0.
decision stump (d.s.), C4.5 [43], boosted L1ðB:L1Þ andL2ðB:L2Þ. The AdaBoost C4.5 decision tree is implementedin the Matlab Classification Toolbox [44]. Due to the spacelimitation, only the traditional distance measure that givesthe best performance in each data set is shown in Table 5. Thesmallest error rates are highlighted in bold.
From the results in Table 5, we can find that the boostedmultiple distance measures performs the best in 12 out of15 data sets. It provides comparable results to the bestperformance on two data sets (spectf and credit). Only in onedata set (ionosphere), our method is outperformed by thetraditional distance measure. It proves that the method could
discover the best distance measure that reflects the distribu-tion and selects the feature elements that are discriminant insimilarity estimation. It is worth mentioning that our frame-work does not consider correlation between feature elementsexplicitly as other distance measures such as the Mahalanobisdistance do. However, the boosting process will rarely selectfeatures that are strongly correlated to each other. This isbecause, at each round, boosting selects one feature thatprovides information not included in the already selectedones. Therefore, the estimated distance is based on featurescomplementary to each other. On the other hand, traditionalmethods such as the Mahalanobis, used for considering
YU ET AL.: DISTANCE LEARNING FOR SIMILARITY ESTIMATION 459
Fig. 7. Example images from (a) handwritten digits and (b) gender recognition.
Fig. 8. Accuracy of classification on (a) gender recognition (b) and written digits.
TABLE 5Comparison to Traditional Distance Measure and AdaBoost on UCI Data Sets
feature correlation are not robust in spaces of high dimen-sionality and small number of training objects, as shown in theresults.
5 DISCUSSIONS AND CONCLUSIONS
This paper presents a comprehensive analysis on distancemeasure and boosting heterogeneous measure for similarityestimation. Our study shows that learning the similaritymeasure is an important step (mostly ignored by the existingliterature) for many computer vision applications. The maincontribution of our work is to provide a general guideline fordesigning a robust distance estimation that could adapt datadistributions automatically. Novel distance measures deriv-ing from harmonic, geometric mean, and their generalizedforms are presented and discussed. We examined the newmeasures for several applications in computer vision, and theestimation of similarity can be significantly improved by theproposed distance measure analysis.
The relationships between probabilistic data models,distance measures, and ML estimators have been widelystudied. The creative component of our work is to start froman estimator and perform reverse engineering to obtain ameasure. In this context, the fact that some of the proposedmeasures cannot be translated into a known probabilisticmodel is both a curse and a blessing. A curse, because it isreally not clear what the underlying probabilistic models are(they certainly do not come from any canonical family), andthis is usually the point at which one starts. After all, theconnection between the three quantities (metric, data model,and ML estimator) is probabilistic. It is a bit unsettling to haveno idea of what these models are. It is a blessing because this isprobably the reason why these measures have not beenpreviously proposed. However, they seem to work very wellaccording to the experimental result in this paper.
In similarity, estimation of the feature elements are oftenfrom heterogeneous sources. The assumption that the featurehas a unified isotropic distribution is invalid. Unlike atraditional anisotropic distance measure, our proposedmethod does not make any assumptions on the featuredistribution. Instead, it learns the distance measure for eachelement to capture the underlying feature structure. Becausethe distance measure is trained on the observations of eachelement, the boosted distance does not suffer from the smallsample set problem. Considering that not all feature elementsare related to the similarity estimation, the boosting process inthe proposed method provides a good generalization of thefeature elements that are most important in a classificationcontext. It also has a dimension reduction effect, which maybe very useful when the original feature dimension is high.The automatic measure adaptation and element selection inthe boosted distance measure bridge the gap between thehigh-level similarity concept and low-level features. With thisapproach, we guarantee that the measure factor is filtered out(it is optimized), and the user can concentrate on gettingbetter features for improving the matching. Another nicefeature of the approach is that it can be applied to a widevariety of algorithms, and it is not dependent on them. Wetested the method on image retrieval, stereo matching, andmotion tracking applications to show that the approach canbe applied to a wide variety of computer vision algorithms,which pose different challenges. The experimental results
show that the boosted measure is more effective thantraditional distance measures.
In the future, we would like to continue this researchwork in the following directions:
1. studying the correlation between feature elementsand formulating them mathematically,
2. incorporating our new measure into state-of-the-artclassification techniques,
3. comparing with different feature selection schemesand evaluating the performance improvement(comparison with two feature selection schemesare reported in Appendix A), and
4. using a larger set of distance measures [47] to furtherenhance the estimation accuracy.
APPENDIX A
COMPARISON WITH TWO FEATURE SELECTION
SCHEMES
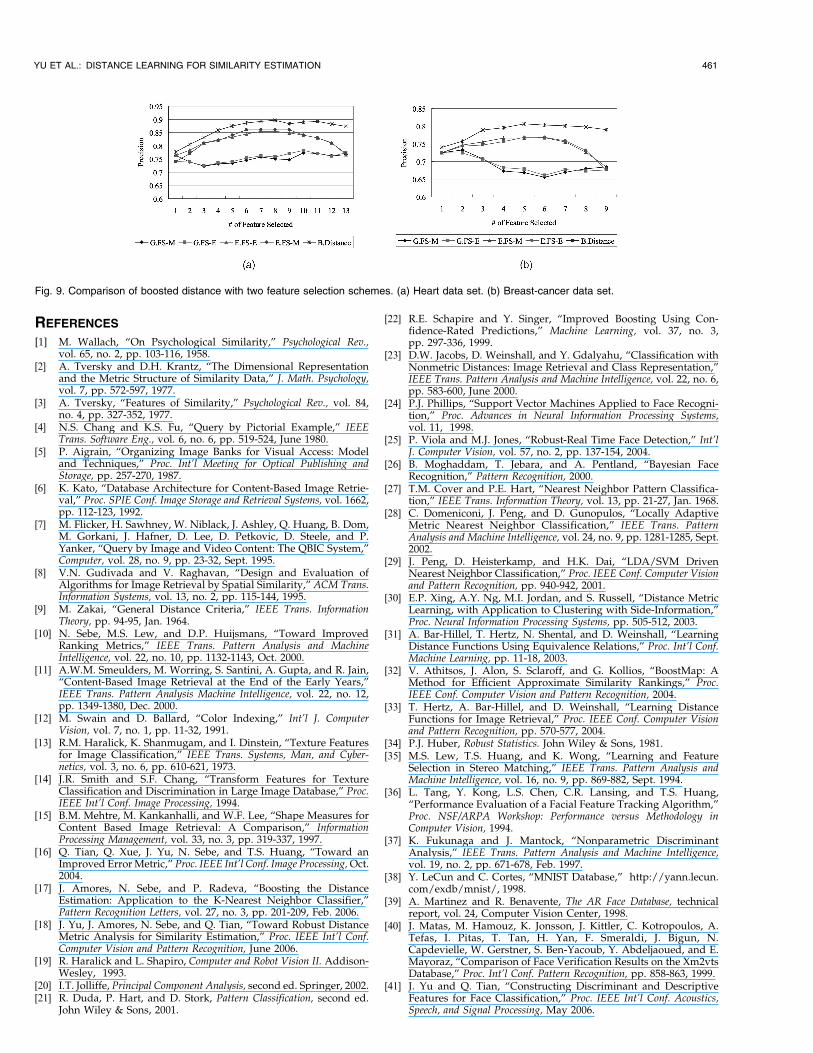
In our framework, feature selection is performed by boostingand decision stumps, which are classical methods. The mainpurpose of the paper is not to introduce a new featureselection algorithm. Nevertheless, we compare our boosteddistance with the following two feature selection schemes toshow the strength of our method: Greedy Feature Selection(G.FS) first ranks the individual performance of each element.Then, it selects the best K feature elements, where K is thefeature set size. We construct two classifiers for G.FS methodusing euclidean (G.FS-E) and Manhattan (G.FS-M) distance,respectively. Exhaustive Feature Selection (E.FS) comparesall the combination of feature elements with a fixed feature setsize and chooses the element combination that gives the bestperformance. Similarly, we use euclidean and Manhattanmetrics to construct two classifiers, E.FS-E and E.FS-M,respectively. Although E.FS is theoretically better than orequivalent to G.FS, its computational cost is high due to theexhaustive testing process, which makes it infeasible for dataset with large dimensionality. The data sets we used are Heartand Breast-Cancer from UCI repository [42]. The dimension-alities data are 13 and 9, respectively. Two thirds of the dataare used for training and the rest for testing.
The results in Fig. 9 suggest that the boosted distanceoutperforms both feature selection schemes. The reasons liein twofold: First, the new distance measures fit the data betterthan traditional euclidean and Manhattan distances. Second,the weighted feature combination makes the performance ofboosted distance less sensitive to the size of the feature set.Note that using boosting and decision stumps as featureselection has been reported in the literature [25]. Ourcontribution is to integrate this approach into a distanceestimation framework.
ACKNOWLEDGMENTS
A short version of this manuscript was published inProceedings of IEEE International Conference on ComputerVision and Pattern Recognition, New York, 2006. This workwas supported in part by the US Army Research Office(ARO) grant under W911NF-05-1-0404, and by the Center ofInfrastructure Assurance and Security (CIAS), the Univer-sity of Texas at San Antonio. J. Yu’s work was done whilehe was with the University of Texas at San Antonio.
460 IEEE TRANSACTIONS ON PATTERN ANALYSIS AND MACHINE INTELLIGENCE, VOL. 30, NO. 3, MARCH 2008
REFERENCES
[1] M. Wallach, “On Psychological Similarity,” Psychological Rev.,vol. 65, no. 2, pp. 103-116, 1958.
[2] A. Tversky and D.H. Krantz, “The Dimensional Representationand the Metric Structure of Similarity Data,” J. Math. Psychology,vol. 7, pp. 572-597, 1977.
[3] A. Tversky, “Features of Similarity,” Psychological Rev., vol. 84,no. 4, pp. 327-352, 1977.
[4] N.S. Chang and K.S. Fu, “Query by Pictorial Example,” IEEETrans. Software Eng., vol. 6, no. 6, pp. 519-524, June 1980.
[5] P. Aigrain, “Organizing Image Banks for Visual Access: Modeland Techniques,” Proc. Int’l Meeting for Optical Publishing andStorage, pp. 257-270, 1987.
[6] K. Kato, “Database Architecture for Content-Based Image Retrie-val,” Proc. SPIE Conf. Image Storage and Retrieval Systems, vol. 1662,pp. 112-123, 1992.
[7] M. Flicker, H. Sawhney, W. Niblack, J. Ashley, Q. Huang, B. Dom,M. Gorkani, J. Hafner, D. Lee, D. Petkovic, D. Steele, and P.Yanker, “Query by Image and Video Content: The QBIC System,”Computer, vol. 28, no. 9, pp. 23-32, Sept. 1995.
[8] V.N. Gudivada and V. Raghavan, “Design and Evaluation ofAlgorithms for Image Retrieval by Spatial Similarity,” ACM Trans.Information Systems, vol. 13, no. 2, pp. 115-144, 1995.
[9] M. Zakai, “General Distance Criteria,” IEEE Trans. InformationTheory, pp. 94-95, Jan. 1964.
[10] N. Sebe, M.S. Lew, and D.P. Huijsmans, “Toward ImprovedRanking Metrics,” IEEE Trans. Pattern Analysis and MachineIntelligence, vol. 22, no. 10, pp. 1132-1143, Oct. 2000.
[11] A.W.M. Smeulders, M. Worring, S. Santini, A. Gupta, and R. Jain,“Content-Based Image Retrieval at the End of the Early Years,”IEEE Trans. Pattern Analysis Machine Intelligence, vol. 22, no. 12,pp. 1349-1380, Dec. 2000.
[12] M. Swain and D. Ballard, “Color Indexing,” Int’l J. ComputerVision, vol. 7, no. 1, pp. 11-32, 1991.
[13] R.M. Haralick, K. Shanmugam, and I. Dinstein, “Texture Featuresfor Image Classification,” IEEE Trans. Systems, Man, and Cyber-netics, vol. 3, no. 6, pp. 610-621, 1973.
[14] J.R. Smith and S.F. Chang, “Transform Features for TextureClassification and Discrimination in Large Image Database,” Proc.IEEE Int’l Conf. Image Processing, 1994.
[15] B.M. Mehtre, M. Kankanhalli, and W.F. Lee, “Shape Measures forContent Based Image Retrieval: A Comparison,” InformationProcessing Management, vol. 33, no. 3, pp. 319-337, 1997.
[16] Q. Tian, Q. Xue, J. Yu, N. Sebe, and T.S. Huang, “Toward anImproved Error Metric,” Proc. IEEE Int’l Conf. Image Processing, Oct.2004.
[17] J. Amores, N. Sebe, and P. Radeva, “Boosting the DistanceEstimation: Application to the K-Nearest Neighbor Classifier,”Pattern Recognition Letters, vol. 27, no. 3, pp. 201-209, Feb. 2006.
[18] J. Yu, J. Amores, N. Sebe, and Q. Tian, “Toward Robust DistanceMetric Analysis for Similarity Estimation,” Proc. IEEE Int’l Conf.Computer Vision and Pattern Recognition, June 2006.
[19] R. Haralick and L. Shapiro, Computer and Robot Vision II. Addison-Wesley, 1993.
[20] I.T. Jolliffe, Principal Component Analysis, second ed. Springer, 2002.[21] R. Duda, P. Hart, and D. Stork, Pattern Classification, second ed.
John Wiley & Sons, 2001.
[22] R.E. Schapire and Y. Singer, “Improved Boosting Using Con-fidence-Rated Predictions,” Machine Learning, vol. 37, no. 3,pp. 297-336, 1999.
[23] D.W. Jacobs, D. Weinshall, and Y. Gdalyahu, “Classification withNonmetric Distances: Image Retrieval and Class Representation,”IEEE Trans. Pattern Analysis and Machine Intelligence, vol. 22, no. 6,pp. 583-600, June 2000.
[24] P.J. Phillips, “Support Vector Machines Applied to Face Recogni-tion,” Proc. Advances in Neural Information Processing Systems,vol. 11, 1998.
[25] P. Viola and M.J. Jones, “Robust-Real Time Face Detection,” Int’lJ. Computer Vision, vol. 57, no. 2, pp. 137-154, 2004.
[26] B. Moghaddam, T. Jebara, and A. Pentland, “Bayesian FaceRecognition,” Pattern Recognition, 2000.
[27] T.M. Cover and P.E. Hart, “Nearest Neighbor Pattern Classifica-tion,” IEEE Trans. Information Theory, vol. 13, pp. 21-27, Jan. 1968.
[28] C. Domeniconi, J. Peng, and D. Gunopulos, “Locally AdaptiveMetric Nearest Neighbor Classification,” IEEE Trans. PatternAnalysis and Machine Intelligence, vol. 24, no. 9, pp. 1281-1285, Sept.2002.
[29] J. Peng, D. Heisterkamp, and H.K. Dai, “LDA/SVM DrivenNearest Neighbor Classification,” Proc. IEEE Conf. Computer Visionand Pattern Recognition, pp. 940-942, 2001.
[30] E.P. Xing, A.Y. Ng, M.I. Jordan, and S. Russell, “Distance MetricLearning, with Application to Clustering with Side-Information,”Proc. Neural Information Processing Systems, pp. 505-512, 2003.
[31] A. Bar-Hillel, T. Hertz, N. Shental, and D. Weinshall, “LearningDistance Functions Using Equivalence Relations,” Proc. Int’l Conf.Machine Learning, pp. 11-18, 2003.
[32] V. Athitsos, J. Alon, S. Sclaroff, and G. Kollios, “BoostMap: AMethod for Efficient Approximate Similarity Rankings,” Proc.IEEE Conf. Computer Vision and Pattern Recognition, 2004.
[33] T. Hertz, A. Bar-Hillel, and D. Weinshall, “Learning DistanceFunctions for Image Retrieval,” Proc. IEEE Conf. Computer Visionand Pattern Recognition, pp. 570-577, 2004.
[34] P.J. Huber, Robust Statistics. John Wiley & Sons, 1981.[35] M.S. Lew, T.S. Huang, and K. Wong, “Learning and Feature
Selection in Stereo Matching,” IEEE Trans. Pattern Analysis andMachine Intelligence, vol. 16, no. 9, pp. 869-882, Sept. 1994.
[36] L. Tang, Y. Kong, L.S. Chen, C.R. Lansing, and T.S. Huang,“Performance Evaluation of a Facial Feature Tracking Algorithm,”Proc. NSF/ARPA Workshop: Performance versus Methodology inComputer Vision, 1994.
[37] K. Fukunaga and J. Mantock, “Nonparametric DiscriminantAnalysis,” IEEE Trans. Pattern Analysis and Machine Intelligence,vol. 19, no. 2, pp. 671-678, Feb. 1997.
[38] Y. LeCun and C. Cortes, “MNIST Database,” http://yann.lecun.com/exdb/mnist/, 1998.
[39] A. Martinez and R. Benavente, The AR Face Database, technicalreport, vol. 24, Computer Vision Center, 1998.
[40] J. Matas, M. Hamouz, K. Jonsson, J. Kittler, C. Kotropoulos, A.Tefas, I. Pitas, T. Tan, H. Yan, F. Smeraldi, J. Bigun, N.Capdevielle, W. Gerstner, S. Ben-Yacoub, Y. Abdeljaoued, and E.Mayoraz, “Comparison of Face Verification Results on the Xm2vtsDatabase,” Proc. Int’l Conf. Pattern Recognition, pp. 858-863, 1999.
[41] J. Yu and Q. Tian, “Constructing Discriminant and DescriptiveFeatures for Face Classification,” Proc. IEEE Int’l Conf. Acoustics,Speech, and Signal Processing, May 2006.
YU ET AL.: DISTANCE LEARNING FOR SIMILARITY ESTIMATION 461
Fig. 9. Comparison of boosted distance with two feature selection schemes. (a) Heart data set. (b) Breast-cancer data set.
[42] C. Merz and P. Murphy, “UCI Repository of Machine LearningDatabases,” http://www.ics.uci.edu/mlearn/MLRepository.html, 1998.
[43] J.R. Quinlan, “Bagging, Boosting, and C4.5,” Proc. Nat’l Conf.Artificial Intelligence, pp. 725-730, 1996.
[44] D.G. Stork and E. Yom-Tov, “Computer Manual in MATLAB toAccompany,” Pattern Classification, John Wiley & Sons, 2004.
[45] T. Hertz, A. Hillel, and D. Weinshall, “Learning a Kernel Functionfor Classification with Small Training Samples,” Proc. ACM Int’lConf. Machine Learning, 2006.
[46] Y. Rubner, C. Tomasi, and L.J. Guibas, “The Earth Mover’s Distanceas a Metric for Image Retrieval,” Int’l J. Computer Vision, 2000.
[47] J. Lafferty, V. Pietra, and S. Pietra, “Statistical Learning Algo-rithms Based on Bregman Distances,” Proc. Canadian WorkshopInformation Theory, 1997.
Jie Yu received the BE degree in electricalengineering from Dong Hua University, Shang-hai, China, in 2000 and the PhD degree incomputer science at the University of Texas atSan Antonio (UTSA), San Antonio, in 2007. He isa research scientist in the Intelligence SystemsGroup at Kodak Research Labs. His researchinterests include multimedia information retrieval,machine learning, computer vision, and patternrecognition. He has published 18 journal articles,
conference papers, and book chapters in these fields. He is the recipientof the Student Paper Contest Winner Award of IEEE ICASSP 2006 andthe Presidential Dissertation Award of UTSA in 2006. He is a member ofthe IEEE and the ACM.
Jaumes Amores received the BSc degree incomputer science from the University of Valen-cia, Spain, in 2000 and the MSc degree incomputer science and the PhD degree from theComputer Vision Center, Autonomous Universityof Barcelona (UAB), Spain, in 2003 and 2006,respectively. Recently, he has moved to theInstitut National de Recherche enInformatique eten Automatique (INRIA), France, where he holds
a postdoctoral position in the IMEDIA Research Group under the directionof Dr. N. Boujemaa. His research interests include statistical learning,content-based image retrieval, object recognition, and medical imageregistration and retrieval.
Nicu Sebe is with the Faculty of Science,University of Amsterdam, the Netherlands. Hisresearch interests include multimedia informationretrieval and human-computer interaction incomputer vision applications. He is the author oftwo books and has published more than 100 tech-nical papers in the areas of computer vision,content-based retrieval, pattern recognition, andhuman-computer interaction. He has organizedseveral conferences and workshops in these
areas, including the International Conference Image and Video Retrieval(CIVR ’07) and was a guest editor of special issues in IEEE Computer,Computer Vision and Image Understanding, ACM Transactions onMultimedia Computing, Communication, and Applications, and ACMMultimedia Systems and Image and Vision Computing. He is anassociated editor of the Machine Vision and Application Journal and isthe general cochair of the IEEE International Conference on AutomaticFace and Gesture Recognition 2008. He is a member of the IEEE.
Petia Reveda received the bachelor’s degree inapplied mathematics and computer science atthe University of Sofia, Bulgaria, in 1989, the MSdegree in 1993, and the PhD degree at theUniversitat Autonoma de Barcelona (UAB) in1998, working on the development of physics-based models applied to image analysis. Shejoined the Computer Science Department, UABin 1991, as a teaching professor. Currently, she isa research project manager at the Computer
Vision Center (CVC), an R&D institute founded by the UAB and theGeneralitat de Catalunya. She has been and is the principal researcher orcoordinator of several European and national research and industrialprojects related to computer vision technologies. She has more than120 international publications in international journals and proceedings inthe field of medical imaging, image segmentation, pattern recognition,and computer vision. Her present research interests include developmentof physics-based approaches (in particular, statistics methods anddeformable models) for medical image analysis, industrial vision, andremote sensing.
Qi Tian received the BE degree in electronicengineering from Tsinghua University, China, in1992 and the PhD degree in electrical andcomputer engineering from the University ofIllinois, Urbana–Champaign in 2002. He is anassistant professor in the Department of Com-puter Science, University of Texas at SanAntonio (UTSA) and an adjunct assistant pro-fessor in the Department of Radiation Oncology,the University of Texas Health Science Center at
San Antonio. He was a summer intern (2000, 2001) and a visitingresearcher (2001) at the Mitsubishi Electric Research Laboratories(MERL), Cambridge, Massachusetts. He was a visiting professor in theMultimodal Information Access and Synthesis (MIAS) center (May–June2007), University of Illinois, Urbana–Champaign (UIUC), a visitingresearcher in the Web Mining and Search Group (Summer 2007),Microsoft Research Asia (MSRA), and a visiting professor in the VideoMedia Understanding Group (Summer 2003), NEC LaboratoriesAmerica, Inc., Cupertino, California. His research interests includemultimedia information retrieval, computer vision, and pattern recogni-tion. He has published more than 70 refereed book chapters, journals,and conference papers in these fields. His research projects are fundedby the US Army Research Office (ARO), Department of HomelandSecurity (DHS), San Antonio Life Science Institute (SALSI), Center ofInfrastructure Assurance and Security (CIAS), and UTSA. He was thecoauthor of the Best Student Paper with Jie Yu in IEEE ICASSP 2006.He has been in the International Steering Committee for ACM WorkshopMultimedia Information Retrieval (MIR) (2006-2009), ICME 2006 BestPaper Committee member, conference chair for Visual InformationProcessing (VIP ’07), Fifth International Conference on IntelligentMultimedia and Ambient Intelligence (IMAI 2007), ACM WorkshopMultimedia Information Retrieval (2005), SPIE Internet MultimediaManagement Systems (2005), and Eighth Multimedia Systems andApplications, SPIE’s International Symposium on Optics East (2006),publicity cochairs of ACM Multimedia (2006) and ACM InternationalConference of Image and Video Retrieval (2007), special session chairof the Pacific-rim Conference on Multimedia (2007), track chair ofmultimedia content analysis at the IEEE International Conference onMultimedia and Expo (2006). He also served as the session/specialsession chair and TPC members in more than 60 IEEE and ACMconferences including ACM Multimedia, ICME, ICPR, ICASSP, PCM,CIVR, MIR, HCI, and VCIP. He is the guest coeditor of Computer Visionand Image Understanding for a special issue on similarity matching incomputer vision and multimedia is in the editorial board of the Journal ofMultimedia. He is a senior member of the IEEE and a member ofthe ACM.
. For more information on this or any other computing topic,please visit our Digital Library at www.computer.org/publications/dlib.
462 IEEE TRANSACTIONS ON PATTERN ANALYSIS AND MACHINE INTELLIGENCE, VOL. 30, NO. 3, MARCH 2008


