Embed Size (px)
Citation preview
Available on CMS information server CMS NOTE -2009/013
The Compact Muon Solenoid Experiment
Mailing address: CMS CERN, CH-1211 GENEVA 23, Switzerland
CMS Note
05 August 2009 (v3, 21 August 2009)
Distributed Analysis in CMS
A.Fanfani A.Afaq J.Afonso Sanches J.Andreeva G.Bagliesi L.Bauerdick S.Belforte P.Bittencourt SampaioK.Bloom B.Blumenfeld D.Bonacorsi C.Brew M.Calloni D.Cesini M.Cinquilli G.Codispoti J.D’Hondt L.Dong
D.Dongiovanni G.Donvito D.Dykstra E.Edelmann R.Egeland P.Elmer D.Evans F.Fanzago F.Farina D.FeichtingerI.Fisk J.Flix C.Grandi Y.Guo K.Happonen J.M.Hernandez C.-H.Huang K.Kang E.Karavakis M.Kasemann
C.Kavka A.Khan B.Kim J.Klem J.Koivumaki T.Kress P.Kreuzer T.Kurca V.Kuznetsov S.LacapraraK.Lassila-Perini J.Letts T.Linden L.Lueking J.Maes N.Magini G.Maier P.Mcbride S.Metson V.Miccio S.Padhi
H.Pi H.Riahi D.Riley P.Rossman P.Saiz A.Sartirana A.Sciaba V.Sekhri D.Spiga L.Tuura E.VaanderingL.Vanelderen P.Van Mulders A.Vedaee I.Villella E.Wicklund T.Wildish Ch.Wissing F.Wurthwein
Abstract
CMS expects to manage several Pbytes of data each year, distributing them over many computing sitesaround the world and enabling data access at those centers for analysis. CMS has identified the dis-tributed sites as the primary location for physics analysis to support a wide community of users, withpotentially as many as 3000 users. This represents an unprecedented scale of distributed computingresources and number of users. An overview of the computing architecture, the software tools and thedistributed infrastructure deployed is reported. Summaries of the experience in establishing efficientand scalable operations to prepare for CMS distributed analysis are presented, followed by the userexperience in their current analysis activities.

JournalofGridComputing manuscript No.(will be inserted by the editor)
Distributed Analysis in CMS
Alessandra Fanfani · Anzar Afaq · Jose
Afonso Sanches · Julia Andreeva · Giusepppe
Bagliesi · Lothar Bauerdick · Stefano
Belforte · Patricia Bittencourt Sampaio ·Ken Bloom · Barry Blumenfeld · Daniele
Bonacorsi · Chris Brew · Marco Calloni ·Daniele Cesini · Mattia Cinquilli · Giuseppe
Codispoti · Jorgen D’Hondt · Liang Dong ·Danilo Dongiovanni · Giacinto Donvito ·David Dykstra · Erik Edelmann · Ricky
Egeland · Peter Elmer · Dave Evans ·Federica Fanzago · Fabio Farina · Derek
Feichtinger · Ian Fisk · Josep Flix · Claudio
Grandi · Yuyi Guo · Kalle Happonen ·Jose’ M. Hernandez · Chih-Hao Huang ·Kejing Kang · Edward Karavakis · Matthias
Kasemann · Carlos Kavka · Akram Khan ·Bockjoo Kim · Jukka Klem · Jesper
Koivumaki · Thomas Kress · Peter Kreuzer ·Tibor Kurca · Valentin Kuznetsov · Stefano
Lacaprara · Kati Lassila-Perini · James
Letts · Tomas Linden · Lee Lueking · Joris
Maes · Nicolo’ Magini · Gerhild Maier ·Patricia Mcbride · Simon Metson · Vincenzo
Miccio · Sanjay Padhi · Haifeng Pi · Hassen
Riahi · Daniel Riley · Paul Rossman · Pablo
Saiz · Andrea Sartirana · Andrea Sciaba ·Vijay Sekhri · Daniele Spiga · Lassi Tuura ·Eric Vaandering · Lukas Vanelderen · Petra
Van Mulders · Aresh Vedaee · Ilaria
Villella · Eric Wicklund · Tony Wildish ·Christoph Wissing · Frank Wurthwein
Received: date / Accepted: date
A. Fanfani · D. Bonacorsi · G. Codispoti · C. GrandiINFN and University of Bologna, viale Berti Pichat 6/2, 40127 Bologna, ItalyTel.: +39-51-2095232 Fax: +39-51-209XXXXE-mail: [email protected]
G. DonvitoINFN and University of Bari
S. MetsonBristol University, UK

2
E.Karavakis · A.KhanBrunel University, UK
J. D’Hondt · J.Maes · P. Van Mulders · I. VillellaBrussel University, Belgium
M. Calloni · D. Spiga · A.Sciaba · J. Andreeva · P. SaizCERN, Switzerland
N. Magini · V. MiccioCERN, Switzerland and INFN-CNAF, Italy
J. M. HernandezCIEMAT, Madrid, Spain
J. FlixCIEMAT, Madrid, Spain and PIC, Barcelona, Spain
D. Cesini · D. DongiovanniINFN-CNAF, Italy
L. DongInstitute of High Energy Physics, Chinese Academy of Sciences Academia Sinica, China
V. Kuznetsov · D. RileyCornell University, Ithaca, NY, USA
M. Kasemann · Ch. WissingDESY, Germany
A. Afaq · L. Bauerdick · D. Dykstra · D. Evans · I. Fisk · Y. Guo · C. Huang · L. Lueking ·P.Mcbride · P.Rossman · V. Sekhri · E.Vaandering · E.WicklundFermilab, Batavia, IL, USA
B. KimUniversity of Florida, Gainesville, FL, USA
L. VanelderenUniversity of Gent, Belgium
E. Edelmann · K. Happonen · J. Klem · J. Koivumaki · K. Lassila-Perini · T. LindenHelsinki Institute of Physics, Finland
S. LacapraraLegnaro INFN, Italy
G.MaierUniversity of Linz, Austria
T. KurcaInstitut de Physique Nucleaire de Lyon, France
F. FarinaMilano Bicocca INFN, Italy
R. EgelandUniversity of Minnesota, Twin Cities, MN, USA
K. BloomUniversity of Nebraska, NE, USA
L. TuuraUniversity of Northeastern, Boston, MA, USA
B. BlumenfeldJohns Hopkins University, Baltimore, MD, USA
F. FanzagoPadova INFN, Italy

3
Abstract CMS expects to manage several Pbytes of data each year, distributing them
over many computing sites around the world and enabling data access at those centers
for analysis. CMS has identified the distributed sites as the primary location for physics
analysis to support a wide community of users, with potentially as many as 3000
users. This represents an unprecedented scale of distributed computing resources and
number of users. An overview of the computing architecture, the software tools and
the distributed infrastructure deployed is reported. Summaries of the experience in
establishing efficient and scalable operations to prepare for CMS distributed analysis
are presented, followed by the user experience in their current analysis activities.
Keywords LHC · CMS · Distributed Analysis
1 Introduction
The Compact Muon Solenoid (CMS) [1] is a general-purpose detector that will collect
data at the Large Hadron Collider (LHC),located at CERN (Geneva). The beams will
collide at intervals of 25 ns and CMS will record only the collisions that pass a set of
online trigger decisions with an expected rate around 300Hz and an average event size
of 1-2 MB. A nominal year worth of data taking corresponds to about 2-6 PB of storage
prior to any processing. Data will have to be accessed for reprocessing and analysis
by a large experimental community with more than 3000 collaborators distributed
worldwide across 40 countries. This imposes an unprecedented computing challenge
for data management and processing.
K. KangPeking University, Cina
M. Cinquilli · H. Riahi · A. VedaeePerugia INFN, Italy
G. BagliesiPisa INFN, Italy
A. SartiranaEcole Polytechnique, Paris, France
P. Elmer · T. WildishPrinceton University, Princeton, NJ, USA
D. FeichtingerPaul Scherrer Institut (PSI), Switzerland
C. BrewRutherford Appleton Laboratory, UK
T. Kress · P. KreuzerRWTH , Germany
P. Bittencourt Sampaio · J. Afonso SanchesUniversity of Rio De Janeiro UERJ, Brasil
J. Letts · S. Padhi · H. Pi · F. WurthweinUniversity of California San Diego, LaJolla, CA, USA
S. Belforte · C. KavkaTrieste INFN, Italy

4
2 The CMS Computing Model
The CMS distributed computing and analysis model [2] is designed to serve, pro-
cess and archive the large number of events that will be generated when the CMS
detector starts taking data. The computing resources are geographically distributed,
interconnected via high throughput networks and accessed by means of Grid software.
The choice of a distributed system allows delegation of responsibilities to local CMS
communities, access to additional funding channels and ensures load balancing of the
available resources while replicating the interesting data in different sites.
A multi-Tier hierarchical distributed model is adopted in CMS with specific func-
tionality at different levels.
Tier-0: The Tier-0 centre at CERN accepts data from the CMS online system, archives
the data, performs prompt first pass reconstruction. Reconstructed data at the Tier-0
together with the corresponding raw data are distributed to Tier-1s over the Optical
Private Network that is the backbone network specifically built for LHC to intercon-
nect CERN and the Tier-1s. In addition to the Tier-0 centre, CERN hosts the CMS
Analysis Facility (CAF) that is focused on latency-critical detector, trigger and cali-
bration activities. Roughly 20% of the computing capacity is located at CERN, while
the remainder is distributed.
Tier-1: Each Tier-1 centre assures the custodial storage of a fraction of the raw
data produced by the CMS detector and of the simulated data produced at the con-
nected Tier-2 centres. Tier-1 centres provide computing resources for their further
re-processing (re-reconstruction, skimming, etc) and for high priority analysis. They
control the data transfer to the Tier-2 centres for analysis. There are 7 Tier-1 centres
located in France, Germany, Italy, Spain, Taiwan, United Kingdom and United States.
Tier-2: Tier-2 centers, more than 50 sites around the world, provide capacity for user
data analysis and for production of simulated data. In CMS data transfer to Tier-2
can occur from any Tier-1. A significant effort is required in commissioning all possible
transfer links, as described in section 4.2.2, as well as improving site availability, as
described in section 4.2.1.
3 Framework for CMS Distributed Analysis
The CMS analysis model foresees activites driven by data location. Data are distributed
over many computing centers according to CMS data placement policies. Processing
takes place where data are located. In order to enable distributed analysis a set of
Workload and Data Management tools have been developed, building CMS-specific
services on top of existing Grid services.
3.1 Data Management
The CMS Data Management System provides the basic infrastructure and tools nec-
essary to manage the large amounts of data produced, processed and analysed in a
distributed computing environment. In order to simplify bulk data management, files
5
are grouped together into file-blocks of a convenient size for data transfer. File-blocks
are in turn grouped in datasets whose size is driven by physics. The file-block is the
unit of data location and replication. The tracking of data location is file-block based
and it provides the name of sites hosting the data, not the physical location of con-
stituent files at the sites nor the composition of file-blocks. The file-block contains files
that can be processed and analyzed together. The packaging of events into files is done
so that the average file size is kept reasonably large (e.g. at least 1GB), in order to
avoid scaling issues with storage and tape systems and to optimize data transfer. This
is achieved by merging small output file produced by individual jobs into fewer larger
files.
The CMS Data Management System is made of a set of loosely coupled components
as described in the following sections.
3.1.1 DBS
The Dataset Bookkeeping Service (DBS)[3] provides the means to describe, discover
and use CMS event data. It catalogs CMS specific data definitions such as run number,
the algorithms and configurations used to process the data together with the infor-
mation regarding the processing parentage of the data it describes. The DBS stores
information about CMS data in a queryable format. The supported queries allow dis-
covery of available data and how they are organized logically in term of packaging
units like files and file-blocks. The information available from queries to DBS are site
independent.
The DBS is used for data discovery and job configuration by the production and
analysis systems through a DBS API. Users can discover what data exists using a Web
browser or Command Line Interface. The DBS is usable in multiple scopes:
– A Global scope DBS is a single instance describing data CMS-wide
– Many local scopes are established to describe data produced by MonteCarlo produc-
tion, Physics groups or individuals. Data produced in local scope may be migrated
to global scope as needed.
The DBS system is a multi-tier web application with a modular design. This makes it
easily adaptable to multiple database technologies. The supported types of database
(ORACLE, MySQL and SQLite) enable the DBS deployment in a range of environ-
ments from general CMS at large installations to specific personal installations. XML
is used for the format of the HTTP payload exchanged with the client.
The Global DBS is hosted at CERN and its database engine is the CERN Oracle
RAC (Real Application Cluster) server for CMS. Some local scope DBS instances
that catalog data from Physics groups are also hosted at CERN. There are also DBS
instances installed at other sites for private use.
3.1.2 Local Data Catalogue
A CMS application only knows about logical files and relies on a local catalogue service
to have access to the physical files. Each CMS site has a Trivial File Catalogue made
of simple rules to build site-specific physical paths starting from logical file names and
access protocols.

6
3.1.3 Conditions Data
The data describing the alignment and calibration of the detector are known as ”condi-
tions data”. Since the same conditions data need to be accessed by many processing jobs
worldwide CMS uses a caching system called Frontier [4]. Frontier translates database
queries into HTTP, looks up the results in a central database at CERN, and caches the
results in an industry-standard HTTP proxy/caching server called Squid. Squid servers
are deployed at each site. Conditions data is read by the applications from these Squid
servers.
3.1.4 PhEDEx
The CMS data placement and transfer systems are implemented by PhEDEx[5]. The
data placement system provides an interface to define, execute and monitor adminis-
trative decisions of data movement such as where experimental data is to be located,
which copies are custodial, and the physics analysis group a given set of data is repli-
cated for at a given site. Data are distributed according to available resources and
physics interests at sites as determined by CMS Data Operations, physics analysis
groups, and/or the members of the ”local” CMS community the site serves.
In PhEDEx, distinct storage areas (grid sites or disk/tape areas within a site)
are represented by a node. Links between the nodes define the transfer topology. The
transfer workflow begins when a user makes a transfer request of some data to some
node via the web page, which is then approved by that node’s Data Manager. In the
request, the user only specifies the destination node, and the optimal source node is
determined from among the available file replicas. To do this, PhEDEx uses Dijkstra’s
algorithm to calculate the path of least cost, where cost of transfer for each link is
determined by the recent transfer rate and the size of the current queue over that link.
Using this method, PhEDEx balances exports among multiple sources when the same
data is requested to multiple nodes, and is also fault-tolerant when links fail to perform
and another source replica is available.
Technically PhEDEx is based on software agents storing their state and communi-
cating via a central “black board” database hosted in the CERN Oracle RAC (Real
Application Clusters). A set of service agents run centrally at CERN while each site
in general runs only the agents that interact with the storage at the site. The usual
method of transfer execution is to submit a job to File Transfer System (FTS), which is
managed by the site download agent using the FTS backend. Download agent backends
for other transfer methods are available, making PhEDEx technology independent. A
web site offers various management tools, including the request creation and approval
interfaces, and allows users and site administrators to monitor current and historical
transfer conditions. File deletion and on-demand consistency checking are also provided
by agents running at the site receiving work queues from the central database. A web
data service provides machine-readable XML or JSON data from the database, which
is used to integrate PhEDEx with other CMS computing components. For instance,
PhEDEx keeps track of data location in the distributed computing system and the
analysis system relies on the data service to obtain the locations of the data when
submitting jobs.
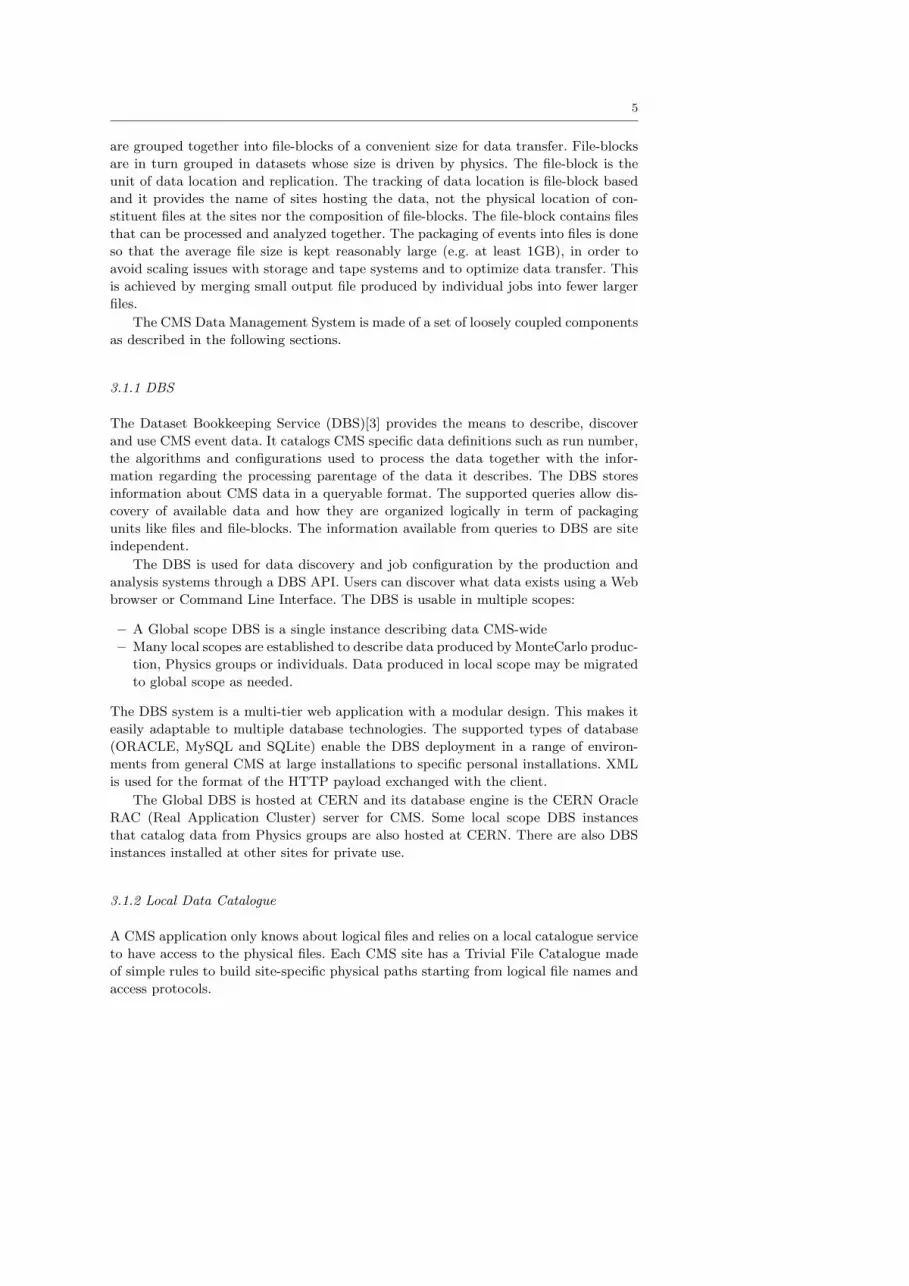
Using PhEDEx, CMS has transferred over 87 PB of data since the project began
in 2004. Figure 1 shows the average daily transfer volume per month of data managed
by PhEDEx from mid-2004 until July 2009. Varios challenge periods are highlighted,
7
Fig. 1 Average daily transfer volume per month using PhEDEx since the project began.
and in particular the SC4, CSA06 [17], and LoadTest/Debug periods resulted in large
increases in average transfer volume. “General” transfers include transferring of Monte
Carlo or cosmics raw data for physics analysis. “Debug” and “LoadTest” transfers
are of randomly generated data for the purpose of debugging and commissioning the
transfer fabric. In the first 6 months of 2009 PhEDEx has maintained average daily
transfer volumes of over 80 TB per day, where roughly 40% of the traffic has been
“General” production/analysis traffic and the remaining 60% “Debug” commissioning
traffic. Expected burst levels during LHC data taking are at 200 TB per day, and such
levels have already been demonstrated by PhEDEx in late February 2008 during the
Common Computing Readiness Challenge (CCRC08) challenge.
3.2 Workload Management
The role of the CMS Workload Management system includes the interpretation of user
processing requests, the creation of the jobs that process the data, the submission of
the jobs to local or distributed systems, the monitoring of the jobs and the retrieval
of their outputs. The Production Agent (ProdAgent)[6] is a tool optimized to perform
these operations in a controlled environment i.e. at the Tier-0 and at the Tier-1 centres.
The CMS Remote Analysis Builder (CRAB) is optimized for user analysis.
3.2.1 CRAB
The CMS Remote Analysis Builder (CRAB)[7] has been developed as a user-friendly
interface to handle data analysis in a local or distributed environment, hiding the
complexity of interactions with the Grid and CMS services. It allows the user to run
over large distributed data samples with the same analysis code he has developed
locally in a small scale test.
The functionalities that CRAB provides, as schematically illustrated in Fig. 2, are:
– Data discovery and location: Facilitate queries of the experiment data catalogues
(DBS and PhEDEx) to find what data exists and where it can be accessed.

8
Fig. 2 CRAB workflow. WMS can stand either for gLite WMS or glidein WMS.
– Job preparation: Pack local user code and the environment to be sent to remote
sites where the CMS software is pre-installed as described in 4.1.3.
– Job splitting: Decide how to configure each job to access a subset of files in the
dataset to effectively use the Tier-2s resources.
– Job submission: Submit to Grid sites hosting the required data.
– Job monitoring: Monitor the status of the submitted jobs by querying Grid services.
– Handling Output data: Copy the produced output to a remote Tier-2 the user
is associated with or return it to the user for small files (few MB). Publish the
produced data with their description and provenance into a local DBS so that the
data can be used in further analysis and shared with colleagues.
CRAB is coded in Python. The interface to the Grid middlewares and local batch
systems is provided by a Python library named BOSSLite[9]. It relies on a database to
track and log information about the user requested task into an entity-relation schema.
An abstract interface is used to access the database through safe sessions and connec-
tion pools to grant safe operation in a multiprocessing/multi threaded environment.
The current implementation supports MySQL and SQLite databases. Standard op-
erations such as job submission, tracking, cancellation and output retrieval are also
performed via a generic abstract interface. Scheduler-specific (batch system or grid)
interfaces are implemented as plug-ins, loaded at run-time. Presently, plug-ins are im-
plemented for the Grid middleware EGEE (gLite) [10], OSG [11] both direct Condor-G
submission or a pilot based job submission system(glideinWMS[12]), and ARC (Nor-
duGrid)[13].In addition plug-ins for batch systems such as LSF and SGE are provided.
The interaction with the Grid can be either direct with a thin CRAB client or using
an intermediate CRAB Analysis Server [7] (see Fig. 2). The CRAB Analysis Server au-
tomates the user analysis workflow with resubmissions, error handling, output retrieval
thus leaving to the user just the preparation of the configuration file and notifying him
of the output availability. In addition it has the capability of implementing advanced
analysis use cases. The Analysis Server is made of a set of independent components
communicating asynchronously through a shared messaging service and cooperating
to carry out the analysis workflow. The communication between client and server is
implemented using the gSOAP framework and Grid credentials of users are delegated
to server. The Analysis Server is coupled with an external GridFTP server that stores
the user input and output data, allowing implementation of CMS policies on sandbox
sizes, bypassing for instance the gLite WMS limits.

9
3.3 Job Monitoring
Monitoring tools are critical to the success of the highly distributed analysis scenario in
CMS. Good monitoring has allowed CMS to evolve tool development and operational
structure from vision and anedoctal driven to a fact based approach. A few main points
drove the development of monitoring tools:
– no reliance on local site monitoring.
– a single high level view of the usage from which to drill down to single job level
– keep the system lean and flexible: even if a few jobs are not properly reported
– record enough information about failures so that plans and actions are set based
on quantitative facts and that effectiveness of solutions can be metered
– detect overall usage patterns to guide management in making choices and plans
about how and where to steer user activities and how to plan for the future
– do not try to define a priori all the relevant metrics
Job monitoring is built around the idea of instrumented application: CMS jobs
and tools send messages to a central collector. Only jobs that use the instrumented
submission framework can be monitored in this way, a small penalty in the CMS case
where almost all user jobs are submitted using the CRAB tool. The implementation
is based on a database running on an Oracle server, a set of information collectors
feeding from various sources, and a few web interfaces (views) providing access with
different levels of detail, aggregation and flexibility, customized to typical use cases. It
is possible to cross link and navigate from one view to another providing both extreme
flexibility and fast access to desired informations. This set of tools is called ”the CMS
Dashboard”.
3.3.1 History View
The aim here is to present time history of relevant metrics to highlight overall patterns
and trends.The list of viewable metrics is predefined, and the interface uses aggregated
tables in the DB to provide efficient access to old information with a limited amount
of detail. Data can be viewed divided according to the used site(s) or job type or job
completion status, among others.
3.3.2 Task Monitoring for Analysis user
A user centric view where the user is initially presented the list of tasks he submitted
in the last two days, both in tabular and graphical format (see Fig. 3).
The user can then expand one selected task to get a graphical overall summary of
execution/completion progress and access details of each job (see Fig. 4).
3.3.3 Interactive Interface
This was the first view to be developed, based on vision more then experience, therefore
emphasis was put on flexibility. It is a job-centric view aimed at understanding and
debugging what happens “now”. The entry point is the number of jobs submitted or
terminated in a chosen time period (see Fig. 5). The interactive interface allows to drill
down expanding the set of jobs by various relevant properties (execution site, grid gate-
way, submitter user, completions status, grid workload management host, activity type,

10
Fig. 3 All user’s tasks in last 2 daysFig. 4 Expanded view of one task
Fig. 5 Dashboard Interactive Interface
used dataset etc.), until all details stored in the database about a choosen (set of) job(s)
can be accessed. The interface reports success/failure according to grid/site/application
problem, and information on used wall and cpu time of jobs.
4 Operation of CMS Distributed Analysis
4.1 Distributed Infrastructure
The tools described above operate on a distributed infrastructure of sites offering uni-
form access via standard Grid services. Moreover CMS maintains sofware libraries at
each site to get a uniform execution environment. A small database is used to keep
track of information specific to each site and relevant for CMS operations.
4.1.1 Grid services
The access to CMS resources is controlled by grid services provided by the WLCG
project. Authorization is based on X.509 certificates extended with VOMS attributes
that certify the membership of users in the CMS Virtual Organization and possibly to
CMS groups and the roles they have. VOMS servers are provided by the WLCG project.
Data are stored on systems exposing an SRM interface (Storage Elements). The specific
implementation of the storage system is left to the sites (e.g. d-Cache, DPM, Castor,
Storm, etc...). In CMS Tier-1s the storage systems also have a tape-based back-end to
fulfil their custodial responsibilities, while at Tier-2s they are disk-based.
11
The access to computing resources (Compute Elements) is based on the Globus
gatekeeper (on EGEE via its LCG-CE implementation) or on the ARC-CE on Nor-
duGrid. The CMS workload management system (CRAB and ProdAgent) may use,
via the BossLite layer, several high level workload management tools provided by the
different infrastructures (see 3.2.1).
All computing and storage resources publish information on their characteristics
and state to an Information System based on the BDII provided by WLCG. The
information is used both for monitoring and for resource selection.
The CMS data transfer system is implemented by PhEDEx that in turn depends
on the gLite File Transfer System (FTS). WLCG maintains a number of FTS servers
(at Tier-0 and Tier-1 sites) that provide the transfer channels on which the transfers
take place.
4.1.2 SiteDB
SiteDB is a catalogue of all CMS computing Tiers. It records the CMS resources at
the site, the resources pledged for the future, and it keeps track of CMS personnel
at each site, including the roles and duties they fulfill in the collaboration. CMS has
designed and built SiteDB because CMS relies on close contact to the sites it uses.
The distributed nature of CMS computing makes it very useful to track the people’s
responsibilities, and to contact them on the basis of their role. Some site roles are
technical (for instance running PhEDEx) others are related to CMS computing policy
(e.g. the site’s Data Manager).
4.1.3 Software Installation
Distributed analysis relies on the experiment software being pre-installed on the remote
sites for each release. The CMS software is packaged using the RedHat Package Man-
ager (RPM), which is used by some major Linux distributions. Dependencies between
packages are resolved with the help of the apt-get tool, which is also widely used in the
Linux community. The whole CMS software suite is installed on a filesystem shared
among all worker nodes of a site.
During the first setup of CMS software (“bootstrap”) the underlying operating
system is checked for all required packages. These are imported into a meta-RPM,
which is installed in the CMS software area. From that point on all CMS installations
are independent of the underlying operating system. In addition to the actual CMS
software (CMSSW) releases some “external” packages are installed, e.g. clients for
databases, various ROOT versions and GEANT4.
The installations itself are performed by high priority Grid jobs. Those jobs are
sent using a dedicated VOMS role in order gain write access to the CMS software area.
Once a release is installed a tag is set on the site that publishes the availability of
the release. The tags are used by the workload management systems to submit jobs to
sites that provide the requested CMS release. Typically, there are about 10 production
releases installed at a time at all sites. This requires roughly 50 GB of disk space.
All software deployment and removal activities are handled centrally using two
different instances, one for OSG based sites and one for gLite and ARC based sites.
Including Tier-1, Tier-2 and Tier-3 sites about 80 sites are served routinely.

12
4.2 Infrastructure readiness
Operation of the CMS distributed infrastructure requires a stable and reliable be-
haviour of the services. CMS has established a procedure routinely operated by the
Facilities Operations team to extensively test all relevant aspects of sites supporting
CMS [14], such as the ability to efficiently use their network to transfer data, the func-
tionality of all the site services relevant for CMS and the capability to sustain the
various CMS computing workflows at the required scale.
4.2.1 Sites
Every day the following quantities are monitored: the CMS Service Availability Mon-
itoring (SAM) tests to check sites basic functionality and local CMS software and
configuration; the success rate of the Job Robot, a load generator simulating user data
analysis; the number and the quality of the data transfer links used in production by
the site; the downtimes scheduled by the site. If any of the metrics based on the above
information is not satisfied the site is declared in error state. A site is allowed to be in
error state not more than two days over the last week, then it is declared ”not ready”.
To recover from a ”not ready state” the site needs to be ok for at least two consecutive
days. In this way temporary glitches are allowed if recovered promptly.
4.2.2 Data transfer links
A site needs to have sufficient data transfer connections to other sites in order to
perform CMS workflows. An ad-hoc task force (Debugging Data Transfers, DDT)[15]
was created in 2007 to coordinate the debugging of data transfer links, in order to
commission most crucial transfer routes among CMS Tiers by designing and enforcing
a clear procedure to debug problematic links.
A LoadTest infrastructure was set up in a separate debug environment of PhEDEx
to handle DDT test traffic. The task force was charged with scheduling LoadTest trans-
fers, assisting site administrators with the configuration of data transfer middleware,
troubleshooting transfer issues, and documenting common problems and solutions. The
DDT procedures are now regularly used to certify links quality.
In order to pass commissioning criteria, a data link from Tier-0 or Tier-1s must
demonstrate a rate of at least 20 MB/s over 24 hours. Recognizing that uplinks from
Tier-2 to Tier-1 sites have a lower requirement in the computing model, they are only
required to transfer 5 MB/s. Links were routinely exercised and were only decommis-
sioned if they failed to meet these requirements for three days in a row. Transfer quality
on commissioned links is continuously monitored with low rate transfers.
All Tier-0/1 to Tier-1 links are currently commissioned. 37 Tier-2 sites have all of
their downlinks from Tier-1 sites commissioned, and 2 more have seven out of eight
links commissioned. 47 Tier-2 sites have at least two commissioned uplinks to Tier-1
sites.

13
4.3 Analysis Organization at CMS Sites
4.3.1 Organized Analysis Activities
In order to optimize the processing chain, CMS performs as many processing steps as
possible in an organized way. Besides the re-processing on the raw data when improved
reconstruction algorithms are available, a standard set of analysis passes is agreed with
the physics groups and is performed promptly at the Tier-1 sites as the data arrive
from the Tier-0 (or Tier-2 in case of simulated data). This step, known as skimming,
performs data reduction both in terms of event size and number of events. The samples
produced in this way are made available to the CMS physicists at the Tier-2s.
Normally only the team dealing with data processing operations (Data Operation)
has access to the Tier-1 resources but in some special cases a physicist may need access
to large samples of raw data, which can not be hosted at Tier-2’s. Examples of this
kind of activity are the detector calibration or the Data Quality Monitor validation. A
special VOMS role has been created to grant access to the Tier-1s to those physicists.
4.3.2 Physics groups and Users Activities
Physicists are organized in Physics groups, each with its own internal organization.
Each Physics group is associated with a few Tier-2 sites that support it by providing
storage space and processing power. Each Tier-2 supports one or more Physics groups
depending on its size. Currently, the association of Physics groups to sites is only
reflected in policies for data location, but it is also foreseen to exploit VOMS groups
to prioritize CPU usage at sites.
A nominal Tier-2 in 2008 had 200TB of disk-based storage. Making efficient use
of the overall space is a challenging data management exercise. The current approach
is decentralized administration with central oversight. The knowledge of the needs is
aggregated in the group leaders who will decide which data should be hosted at Tier-2
for their community. To help them in the process, each Physics group is allocated a
limited number of ’quanta’, each being currently 30TB of disk and enough CPU to
process it, hosted at few Tier-2s.
Each Tier-2 site also supports a local community of users, providing them a common
space for data of local interest and a grid-enabled storage for each user where to e.g.
receive output from CRAB jobs running at other sites. Each CMS user can access any
data hosted at any Tier-2, but can only write at the Tier-2 that supports him as a
local user.
The user-produced data stored at a Tier2 can also be published into a local DBS
in order to allow access to other colleagues. The data that is going to be accessed by
many users or transferred among sites, for instance the Physics Group specific event
filtering and selections, could be exposed to the entire collaboration by registering it
in Global DBS and performing its transfer with PhEDEx. User data is typically not
produced with files large enough for wide area transfers or suitable for storage systems.
Therefore a migration process involving the merge of the files and the validation of the
data is foreseen before the registration in Global DBS and PhEDEx occurs.

14
4.3.3 Storage hierarchy at Tier-2
In order to support all the functionalities the CMS model requires the Tier-2 storage
is divided into 4 logical pieces:
– Local Group and User Space: roughly 30TB for the local community and additional
1TB per user.
– Physics Group Space: 60-90TB of space is allocated to serve 2-3 Physics Groups.
Representatives from the groups serve as data managers for the space and make
subscription and deletion requests. The space for each group will increase with time
as datasets grow.
– Centrally Controlled Space: 30TB of space is identified at each Tier-2 under the
control of CMS centrally. This is used to ensure complete copies of the reconstruc-
tion datasets are available across the Tier-2s. This space can be further used as a
flexible buffer to deal with operational issues and difficulties in the short term.
– Simulation Staging and Temporary Space: 20TB is identified to stage simulation
produced at the Tier-2s and other temporary files before they can be transferred
to the permanent home.
4.4 User support model
User documentation is provided by a set of twiki pages composing the so called CMS
Workbook. Documentation about the distributed environment and CRAB usage are
available, as well as a troubleshouting guide. Tutorials including hands-on session are
periodically organized. The day by day support is currently performed mainly via
a mailing list (HyperNews) where users reports the problems they are facing. The
reported problems range from problems with the infrastructure, site related issues to
user’s mistakes in tools configuration or real bug report that are feed back to developers.
The CMS Savannah Computing Infrastructure portal is used to report problems across
the distributed infrastructure such as data access problems, problem on specific CMS
software version at sites etc.
5 Experience with CMS Distributed Analysis
Distributed Analysis has been ongoing for several years, passing through sequentially
planned steps of increasing complexity, the so called data and physics challenges [17]. It
has been used extensively during studies to prepare the CMS Physics Technical Design
Report [16] and various detector commissioning activities. Last year’s experience both
in term of dedicated commissioning tests and real users analysis is reported in the
following sections.
5.1 Analysis exercises within Common Computing Readiness Challenge
During the Common Computing Readiness Challenge (CCRC08) in May 2008 various
analysis exercises were performed to gain an overall understanding of the performance
and readiness of the Tier-2 sites for CMS data analysis. Centrally organized job sub-
missions were carried out both to understand the site performance characteristics and
to exercise closely the kind of workflows expected by the physics groups.

15
Site performance measurement Different types of jobs, with increasing complexity,
were used:
– long-running CPU intensive jobs with moderate I/O. This tests the basic submis-
sion and execution of an analysis job with no strenuous requirements on either
submit rate, or I/O, or stageout. The goal here was to fill all batch slots available
for the analysis at a given site without stressing the site.
– long-running I/O intensive jobs provided some non negligible stress on the storage
infrastructure at the sites.
– short-running jobs O(10 min) with local stage out of O(10 MB) file as output.
These jobs run for a short time, with many jobs finishing per hour, thus leading to
a significant write request rate at large sites.
Up to 40 sites were involved across EGEE, OSG, and NorduGrid. More than 100,000
jobs succeeded throughout the challenge. The error rates were very mixed, ranging
from less than 1% at many sites to up to 50% at a few sites due to catastrophic storage
failures. The failures were predominantly due to storage problems at sites. In most but
not all cases, those problems were detected and fixed by the site administrators within
24 hours. Ignoring the storage failures, the success rate in this exercise was found to
be better than 99%. Overall success rate including the storage issues, ranged between
92-99% for these exercises.
Simualtion of physics group workflows An exercise to mimic realistic physics group
activities running on a list of associated Tier2s was conducted. The CRAB server was
used to submit realistic physics group tasks: analysis-like jobs reading a dataset at all
sites and running for about 4 hours with remote stageout of a O(20 MB) output file
to a subset of T2 sites. This simulates the computing model where each user has space
at a T2 while the datasets are generally distributed throughout the world. More than
100,000 jobs on about 30 sites were submitted in two weeks and the CRAB Server
provided the needed functionality for job submission and tracking. Most failures were
problems accessing the input data, from 0.1%-10% up to 50% for pathological cases,
and remote stageout issues were due to old Grid clients affecting from 100% to few %
per site. These stageout issues were promptly fixed by the site administrators. During
the second week, sites with efficiency above 90% significantly increased, as shown in
Figure 6.
Chaotic job submissions People from T2 sites were encouraged to submit jobs to other
T2 sites, to mimic a chaotic job submission pattern. This activity was clearly visible in
the CMS Dashboard, showing lots of user activities at several sites. Figure 7 summarizes
the number of active users per site, including Tier-1s, Tier-2s, Tier-3s and opportunistic
usage. Around 60 sites participated in these tests.
The CCRC08 analysis challenge drove the level of activity and participation at
Tier2s to an unprecedented scale in CMS.
5.2 CRAB Analysis server stress test
In order to test the CRAB Analysis server scalability and reliability up to the expected
CMS operational rates a dedicated test environment was set up in October 2008. The
Storage Element, based on GridFTP, that CRAB server relies on was installed on a

16
Fig. 6 Distribution of the job efficiency bysite, when simulating physics groups work-flows on CCRC08
Fig. 7 Distribution of the number ofusers in a site, during the Chaotic phaseinCCRC08
different machine with respect to the machine hosting the CRAB Server components.
The aim was to decouple the load due the shipping of input/output sandboxes and the
core workflow management. The machine hosting the Storage Element and the CRAB
server were both 4 CPU 2000 MHz Dual Core AMD Opterons with 4 GB RAM. The
test was performed in the gLite context using two dedicated gLite WMS. Monitoring
information was collected from various sources like the CRAB Server database tracking
the job flow and the CPU usage of its components, as well as from underlying services
like MySQL and GridFTP server and gLite WMS internal monitoring. The kind of
jobs submitted were very short jobs running for less than a few minutes, not reading a
dataset and without stage-out. This choice was made to provide a harsher environment
for job handling due to higher rate of finished jobs and to limit the resource usage at
sites.
Controlled submissions from different user certificates, thus emulating the CRAB
Server usage in a multi-users environment, were performed. Different submission pat-
terns were adopted by the 12 users involved. For example a user submitting 100 jobs
every 15 minutes, another 500 jobs every 20 minutes, another 2000 jobs every 6 hours
etc. plus a couple of users submitting randomly at their will. No CRAB Server misbe-
haviour was identified due to the multi-user environment. Jobs were submitted to more
than 50 sites with a rate above 50,000 jobs/day. This helped identify some limitations
in the communication between the components responsible for job outpul retrieval and
handling that caused a backlog of jobs without output retrieved. This effect is more evi-
dent for homogeneous very short jobs, such as those used in the test, that have a higher
finishing rate than real user’s jobs which tend to finish at different times. Nonetheless,
the backlog was absorbed in a few hours. This issue was taken into account in the
development cycle and the code was optimized. About 120,000 jobs were successfully
handled in 48 hours, as shown in Figure 8. The CPU load due to MySQL proved to be
stable regardless of the database size increase with more jobs in the system. Overall
the breakdown of CPU load usage is 2 CPUs for MySQL, about 1.5 CPUs for GridFTP
and about 1 CPU for all the CRAB Server components, thus outlining the need of at
least a 4 CPU machine. The load due to GridFTP is such that it’s not compulsory
to have the GridFTP server decoupled from the machine hosting the CRAB Server
components.
The number of users currently using a CRAB Analysis Server is significantly in-
creased with respect to the stress test scale, e.g. the growing number of real users using
a CRAB Analysis Server instance over the last 5 months is shown in Fig. 9. Currently

17
Fig. 8 Cumulative distribution of jobs sub-mitted to CRAB Server during the multi-usertest phase.
Fig. 9 Number of distinct users using aCRAB server instance during last 5 months
Fig. 10 Cumulative number of distinctCRAB users starting from 2008. Fig. 11 Number of CRAB daily users in
2008.
the whole CMS analysis amounts to 30,000 jobs/day and the CMS Computing model
expectation is to reach around 100,000-200,000 jobs/day. Some CRAB Server instances
deployed at different sites to serve Physics group activities and a regional community,
as foreseen, can cope with analysis needs.
5.3 Sustained Analysis
Distributed analysis is regularly performed by users for studies of the CMS physics
discovery potential based on MC simulation and of the cosmic data collected in detector
commissioning activities. The number of users is increasing over time. For instance since
2008 the number of distinct CRAB users has continously grown to more than 1000,
as shown in Figure 10. This indicates a very broad usage of CRAB since it represents
roughly 30% of the whole CMS community. The day by day distribution of CRAB
users is shown in Figure 11. An average of 95 different users per day use CRAB to
submit their analysis jobs.
During last year about 11 million analysis jobs were submitted. Peaks of more
than 100,000 jobs per day have been reached, with an average of 30,000 jobs per day,
as shown in Figure 12. The distribution of analysis jobs at Tier-2s over the year is
shown in Figure 13. Current analysis activities has spontaneously surpassed, both in

18
Fig. 12 Number of daily jobs terminated in 2008.
terms of number of jobs and number of sites, the scale reached in CCRC08 dedicated
tests.
The distribution of analysis job efficiency over time is shown in Fig. 14. The average
success rate is 61% with 4% of cancelled jobs, 10% of grid failures and 25% application
failures. Most of the failures faced by the users are due to remote stageout issues, user
application errors and errors reading data at the site. Part of the failures are somehow
expected, since analysis jobs run user code which may not have been thoroughly tested.
For instance memory leaks or crash in rare events might be hard to spot in the small
scale test typically done by the users.
Failures in stage out of the data output files to remote storage can be due to
users misconfiguring the remote destination to use or to transfer problems. A hanging
or failing stage out represents a waste of CPU since it occurs at the end of the job
processing, so an approach to decouple the job processing and the remote stage out is
under development. At job finishing the output will be stored locally at the site and
the remote stage out will occur in an asynchronous step.
Failures accessing data at the site mainly expose problems with the storage at the
site or inconsistencies between the data catalogue and what has been deleted at the
site. Periodically data consistency and integrity checks at all Tier-2 sites are performed.
This check verifies that the contents of the disks at the Tier-2 sites are consistent with
the PhEDEx databases and DBS and reduce the rate of data access errors.
Grid failures are due to the underlying grid system but also reflect site problems
or jobs that spend too much time on the worker node and are killed by the local batch
system, appearing as aborted by the Grid.
About 78% of the CMS analysis jobs were submitted using gLite WMS. Since the
gLite architecture is such that the system scales linearly with the number of gLite
WMSs used, analysis jobs are balanced currently over 7 WMS. The rest of the analysis
jobs are submitted using Condor-G.
CRAB Analysis Server instances have been deployed in several countries (CERN,
Italy, France). A couple of them are open to worldwide distributed CMS users. Other
instances are being used by local communities or specific physics groups.
A complete example of analysis activity during the year has been the analysis of real
cosmic data collected during a long period of data-taking, called CRAFT (Cosmics Run

19
Fig. 13 Number of analysis jobs by Tier2s duringlast year from CMS dashboard History view. Eachcolor refers to a site.
Fig. 14 Analysis job efficiency during lastyear.
Fig. 15 Number of users analyzing CRAFTdata using the CAF (light gray) or the Tier2s(dark gray).
Fig. 16 Number of jobs analyzing CRAFTdata using the CAF (light gray) or the Tier2s(dark grey).
At Four Tesla) to commission the detector in preparation for LHC collisions. About 300
million events of cosmic muons were taken and their analysis is meant to assess detector
perfomance and perfom physics studies. The raw data were transferred to Tier-1s where
several re-processing and data skimming passes took place. The reconstructed data were
all shipped to the CAF where calibration and alignment studies were performed in order
to provide better conditions to be used in subsequent re-processing. Reconstructed data
and their skims were also spread to Tier-2s, manily to those associated with Muon
and Tracker group although overall about 20 sites hosted CRAFT data. The overall
amount of CRAFT data transferred to Tier-2s was more than 300TB. The number of
users analysing CRAFT data during the year is shown in Fig. 15 where the breakdown
of users using the CAF and those using the Tier2s is also reported. The distribution
of analysis jobs is shown in Fig. 16, roughly two thirds at Tier-2s and one third at the
CAF. The job efficiency at Tier-2s is lower than that at CAF because, on top of the
application errors, there are grid failures and the stage out errors mentioned above.
Real user analysis jobs show worse job efficiency (around 60%) with respect to the
efficiencies obtained during dedicated and controlled submissions such as computing
challenge and Job Robot activities, described in 5.1 and 4.2.1 respectivelly. Analysis
specific operations are being defined to improve the success rate and user experience
when utilizing the distributed computing environment and to ensure a functional sys-
tem with a more efficient use of CMS resources on sustained user activities.

20
6 Conclusions
Commissioning a distributed analysis system of the scale required by CMS in terms of
distribution and number of expected users is a unique challenge. In order to prepare for
large scale physics analysis CMS has established a set of operations to extensively test
all relevant aspects of the distributed infrastructure to support CMS workflows, such as
performance and readiness of sites and transfer links. The Workload Management and
Data Management components of the Computing Model are now well established and
are constantly being exercised and improved through CMS-wide computing challenges,
and first real cosmic data taking exercises, in preparation for the LHC collision data
taking.
7 Acknowledgements
We thank the technical and administrative staff of CERN and CMS Institutes, Tier-1
and Tier-2 centres and acknowledge their support.
References
1. CMS Collaboration R. Adolphi et al., The CMS experiment at the CERN LHC, JINST,0803, S08004 (2008)
2. C.Grandi, D.Stickland, L.Taylor et al., The CMS Computing Model, CERN-LHCC-2004-035/G-083 (2004)
3. A. Afaq et al., The CMS dataset bookkeeping service, J.Phys.Conf.Ser, 119, 072001 (2008)4. B. Blumenfeld,D. Dykstra,L. Lueking,E. Wicklund, CMS conditions data access usingFroN-
Tier, J.Phys.Conf.Ser, 119, 072007 (2008)5. R. Egeland et al., Data transfer infrastructure for CMS data taking, Proceedings of Science,
PoS(ACAT08)033 (2008)L. Tuura et al., Scaling CMS data transfer system for LHC start-up, J.Phys.Conf.Ser, 119,072030 (2008)
6. D. Evans et al., The CMS Monte Carlo production system: Development and design,Nucl.Phys.Proc.Suppl.177-178, 285-286 (2008)
7. D. Spiga et al., The CMS Remote Analysis Builder CRAB, 14th Int. Conf. on High Perfor-mance Computing ISBN/ISSN: 978-3-540-77219-4 , 4873, 580-586 (2007)
8. LCG Computing Grid Technical Design Report, LCG-TDR-001 CERN/LHCC 2005-024(2005)
9. G. Codispoti et al., Use of the gLite-WMS in CMS for production and analysis, Proceedingsof International Conference On Computing In High Energy Physics And Nuclear Physics(2009).
10. P. Andreetto et al., The gLite Workload Management System, J.Phys.Conf.Ser, 119,062007 (2008)
11. R. Pordes et al, The Open Science Grid, J.Phys.Conf.Ser, 78, 012057 (2007)12. I. Sfiligoi et al., glideinWMS - A generic pilot-based Workload Management System,
J.Phys.Conf.Ser., 119, 062044 (2008)13. M.Ellertet al., Advanced Resource Connector middleware for lightweight computational
Grids, Future Generation Computer Systems, 23, 219-240 (2007)14. J.Flix, A. Sciaba et al., The commissioning of CMS computing centres in the worldwide
LHC computing Grid, Conference Record N29-5 session Grid Computing, Nuclear ScienceSymposium IEEE , Dresden (2008)
15. N. Magini et al., The CMS Data Transfer Test Environment in Preparation for LHC DataTaking, Conference Record N67-2 session Applied Computing Techniques, Nuclear ScienceSymposium IEEE , Dresden (2008)
16. G.L. Bayatian et al., CMS Technical Design Report volume II: physics performance, Jour-nal of Physics G: Nuclear and Particle Physics., 34, 995-1579 (2007)

21
17. CMS collaboration, CMS Computing, Software and Analysis Challenge in 2006 (CSA06)Summary , CERN/LHCC 2007-010 (2007)N.DeFilippis et al., The CMS analysis chain in a distributed environment,Nucl.Instrum.Meth. A559, 38-42 (2006)A.Fanfani et al.,Distributed computing Grid experiences in CMS, IEEETrans.Nucl.Sci.52,884-890 (2005)