Embed Size (px)
Citation preview
Seabird distribution
- 22 -
CHAPTER TWO
DISTRIBUTION PATTERNS OF SEABIRDS IN BELGIAN MARINE WATERS
Jan Seys1*, Henk Offringa2, Jeroen Van Waeyenberge1, Patrick Meire3, Magda Vincx4 & Eckhart Kuijken1
1 Institute of Nature Conservation, Kliniekstraat 25, B-1070 Brussel, Belgium 2 Ministry of Transport, Public Works and Water Management, Directorate General of Public Works and
Water Management, North Sea Directorate, P.O.Box 5807, 2280 HV Rijswijk, The Netherlands 3University Antwerpen, Department Biology, Universiteitsplein 1, B-2610 Wilrijk, Belgium
4University Gent, Biology Department, Marine Biology Section, K.L.Ledeganckstraat 35, B-9000 Gent, Belgium * present adress: Flanders Marine Institute (VLIZ), Victorialaan 3, B-8400 Oostende, Belgium

Seabird distribution
- 23 -
Distribution patterns of seabirds in Belgian marine waters
J. Seys, H. Offringa, J. Van Waeyenberge, P. Meire, M. Vincx & E. Kuijken
ABSTRACT Intensive seabird surveying during seven years (1992-98) in the Belgian part of the southern North Sea revealed the existence of a land-sea and a longitudinal gradient from the Schelde estuary in the east to the deeper, less turbid waters in the west. Piscivorous species preferring clear water and mid- to offshore conditions (auks, Kittiwake and Northern Gannet) are more abundant in the west. Divers, grebes and Larus-gulls are commoner in the more turbid waters near the mouth of the Schelde estuary. Depth and topography are less dominant as explanatory variables for the distribution of most of the 17 dominant species/taxa. Multivariate and correlative analysis of the abundance of these species could not reveal strong temporal or spatial coherence of seabirds in communities. Highest correlations were found among Larus-gulls scavenging at trawlers, and in the group of auks, Kittiwake and Little Gull. The auks (Razorbill, Common Guillemot) and both gull species were often seen in short-lived multi-species feeding associations over presumed fish shoals. Razorbill is the species that associated most frequently (in 28% of all observations) and it appeared to be a more ‘attractive’ target for Kittiwake (34%) and Little Gull (23%) than the Common Guillemot. Kleptoparasitic behaviour was rarely observed (2.9-6.3% of the observations in skuas). The impact of fishery activities on the distribution of scavenging seabirds (8 of the 17 dominant species) is large. Some 65-70% of all large gulls in the study area were observed in association with trawlers. The general patterns of distribution described in this paper provide the basis for new future research. Major emphasis should go to the interactions between hydrography, prey-availability (pelagic fish) and the specific geomorphologic characteristics of this study-area. Priority species for more detailed research are proposed. INTRODUCTION
Since the start of systematic seabird counting in the North Sea in the late 1970s, eight atlases have been published of the area (BAPTIST & WOLF 1993, CARTER et al. 1993, CAMPHUYSEN & LEOPOLD 1994, ANONYMOUS 1995, CAMPHUYSEN et al. 1995, SKOV et al. 1995, STONE et al. 1995, OFFRINGA et al. 1996). The maps produced in these publications are very often based on smoothing small-scale data over large areas and time-intervals, obscuring the detailed spatial and temporal patterns. As a result the generalised and rather rough pictures have only a limited value for those interested in the community structure and interactions between seabirds and their environment (CAMPHUYSEN 1996). Seabirds may use very fine-scale cues in exploiting the environment, often much finer or more ephemeral than those that can be detected with large-scale surveys (BEGG & REID 1997, RIBIC et al. 1997, TASKER & REID 1997, WANLESS et al. 1997, CAMPHUYSEN & WEBB 1999).
The unique geomorphologic characteristics of
the Belgian marine waters - with four major formations of linear sand ridges (‘sandbank systems’) each with its own strike, distance to the coast and topography -, and its location in between the Straits of Dover and the mouth of the Schelde estuary, hold prospects to investigate distribution patterns of seabirds in more detail. During extensive seabird surveys in Belgian marine waters from September 1992 till December
1998, we put in a great effort (16,000 km) in a relatively short period and clear patterns in occurrence of seabirds could be observed. In this paper we want to analyse the spatial and temporal distribution patterns and try to find out whether communities of seabirds can be distinguished in relation to environmental conditions. The analysis will focus on how distance to the coast, longitude (distance to the Schelde estuary and the Straits of Dover), depth, topography (swale, slope or crest of a sandbank) and period of surveying may structure seabird populations.
By studying coexistence patterns of seabird species, we will try to gain more insight in the relationships among species and in the coherence of communities. Do communities of seabirds at sea exist or are they basically the artificial result of lumping and smoothing seabird data over large time-spans and areas, creating pictures of coexistence in species that are rarely found together? An analysis of associations and correlations between species can also help to answer whether certain seabird species may behave as ‘umbrella species’, i.e.: species with such demanding habitat requirements that saving it will automatically save many other species (SIMBERLOFF 1998). In general certain species might tell more about their environment or about associated species than others, and deserve more attention in the future in terms of research investment.

Seabird distribution
- 24 -
MATERIAL & METHODS STUDY AREA
The study-area is situated in the southern North Sea, characterised by its shallowness and well-mixed waters. It forms the main and central part of what is internationally referred to as the ‘Flemish Banks’ (OSPAR
COMMISSION 2000). Belgian marine waters occupy a small area (3500 km2), are intensively used (MAES et al. 2000) and near to important sources of water input (situated at c. 55-75 km east of the Straits of Dover and immediately west of the mouth of the Schelde estuary). The structural variation in topography is unique for the North Sea (HOUBOLT 1968, EISMA et al.
1979), with various sand ridges resulting from sediment and melt water displacements during several glacial periods. Six subregions – including four major sandbank systems each with a characteristic strike, profile and distance to the coast – can be distinguished (Fig. 1, Table 1, CATTRIJSSE & VINCX 2001). These subregions were further divided in 36 ‘sandbanks’, each split up into three strata. The strata ‘crest’, ‘slope’ and ‘swale’ are defined as <10 m deep, 10-20 m and > 20 m, except for the inshore Oostkust- and Westkustbanken where < 5m, 5-10 m and >10m respectively.
Fig. 1. Belgian marine waters with: a) setting within the Southern Bight of the North Sea; b) subdivision in six subregions and 35 sandbanks; c) most important sandbanks

Seabird distribution
- 25 -
Table 1. General characteristics of the Belgian marine waters, divided into six subregions on the basis of the occurrence of sandbank systems: OK=Oostkustbanken, WK=Westkustbanken, VB=Vlaamse Banken, ZB=Zeelandbanken, HB=Hinderbanken, DW=Deepwater
subregion. The figures indicated with Seys et al this study, have been derived from the official maritime charts and from a GIS application tool.
VARIABLE OK WK VB ZB HB DW SOURCE
Area (km2) 310 270 600 740 1210 370 SEYS et al. this study Mean depth (m MLLWS) 0-10 0-10 5-25 5-25 5-35 30-40 SEYS et al. this study
Minimal depth (m MLLWS) 0 0 3 6 5 20 SEYS et al. this study Mean elevation sandbanks to seafloor (m) 2-5 2-5 15-20 10-20 25-30 - SEYS et al. this study
Length sandbanks (km) 10-20 2-15 10-30 20-30 15-25 - SEYS et al. this study Distance to coast (km) 0-13 0-10 10-30 10-40 25-60 60-80 SEYS et al. this study
Strike of the sandbanks (°) 70 70 40 70 40 - SEYS et al. this study Mean surface temperature in February (°C) 4.0 5.5 6.0 4.0 4.5 6.5 OTTO et al. 1990
Mean surface salinity in February (‰) 30.5 32.0 33.0 32.0 33.5 34.8 BENNEKOM & WETSTEYN 1990 Max. tidal current velocity at surface (m.s-1) 1.8 1.5 1.0 1.2 1.0 1.0 OTTO et al. 1990 Depth 1% daylight penetration in Dec. (m) <5 5-10 10-20 <5 5-10 >20 VISSER 1969
Non-living suspended matter (ppm) 40 30 25 20 10 2 EISMA et al. 1979
Two dominant physical features characterise the area, resulting in distinct west-east and inshore-offshore gradients. To the east the Schelde estuary has a major impact on current velocities, sediment and water characteristics. To the west the Straits of Dover are an inlet for high saline, Atlantic water into the southernmost part of the North Sea. Both phenomena interfere in the area of the ‘Flemish Banks’. The study area is rich in fish, edible for seabirds. During the International Bottom Trawl Surveys in the mid 1980s, Herring Clupea harengus, Sprat Sprattus sprattus, Cod Gadus morhua, Whiting Merlangius merlangus, Bib Trisopterus luscus, Poor Cod Trisopterus minutus and Sandeel Ammodytidae were all abundant in the area (KNIJN et al. 1993). Densities of pelagic Herring (<15 cm) and Sprat (<10cm) peak in February-March (OFFRINGA et al. 1996). Bivalve populations are particularly abundant in the coastal and most western part of the Belgian marine waters (GOVAERE 1978, DEGRAER 1999).
DATA Bird survey methods The analysis is based on all ship-based surveys carried out in Belgian marine waters between September 1992 and December 1998. A standard strip transect method for counting seabirds at sea has been applied (TASKER et al. 1984), using a snapshot count for flying birds. In order to compensate for missed small and dark birds, the mean density of swimming birds has been multiplied with a correction factor (STONE et al. 1995). Regular surveys throughout the study-area were carried out on board the research vessels Belgica and Ter Streep. In addition seabirds were counted on fixed routes on a monthly basis (frequency much higher in wintertime) on board ferries of the companies RMT (Regie voor Maritiem Transport) and Sally Lines. Those trips embarked in Oostende (Belgium) with destination Dover (1992-93) or Ramsgate (1994-98). Four trained ornithologists, eventually assisted by other seabird watchers, carried out all ship-based surveys. The number of observers during each trip was small (one: 63%, two: 27%, more: 10%).
Table 2. Seabird survey effort by season in the six subregions of the Belgian marine waters during 1992-1998. The relative effort is the
absolute effort divided by the area (km2).
Season Effort Deep water
subregion
Hinder banken
Zeeland banken
Vlaamse Banken
Westkust banken
Oostkust banken
Belgian marine waters
Winter absolute effort (km2) 7 251 269 768 309 160 1771 (Dec-Feb) relative effort 0.02 0.21 0.36 1.28 1.14 0.52 0.51
Spring absolute effort (km2) 2 104 141 343 172 77 841 (Mar-May) relative effort 0.01 0.09 0.19 0.57 0.64 0.25 0.24 Summer absolute effort (km2) 6 107 106 238 108 65 633
(Jun-Aug) relative effort 0.02 0.09 0.14 0.40 0.40 0.21 0.18 Autumn absolute effort (km2) 17 122 216 695 354 165 1571
(Sep-Nov) relative effort 0.05 0.10 0.29 1.16 1.31 0.53 0.45 TOTAL absolute effort (km2) 32 584 732 2045 945 468 4817
relative effort 0.09 0.48 0.99 3.41 3.50 1.51 1.38

Seabird distribution
- 26 -
Effort During the study-period about 16,000 km or a total transect area of 4817 km2 was surveyed within the Belgian marine waters (Table 2). Only the deepwater subregion in the far north has been poorly covered (32 km2). The Vlaamse Banken were the best-surveyed subregion (2045 km2). Taking into account the area of the subregion, the Westkustbanken received as much attention as the Vlaamse Banken. On average every km2 on the entire Belgian part of the North Sea has been surveyed 1.4 times during the six and a half year of the study. Twenty percent of the travelled distance refers to counts on board ferries from Oostende to Dover or Ramsgate. Winter and autumn received more than twice as much attention as spring and summer (Table 2). Monthly effort dropped to less than 500 km2 in April-July. In February (1566 km2), October (1317 km2), August (1286 km2) and March (1085 km2) seabird watchers were allowed on board the Belgica for targeted surveys of 1-2 weeks, resulting in important survey efforts. During the rest of the year the observers were allowed on board but could not influence the survey route. Data-analysis The original bird data, collected within a 300 m transect width, were transformed into densities of birds (N km-2 ) per counting unit. Counting units usually comprised ten minutes, equalling a travelled distance of c. 3 km at a speed of 10 knots. Interrupted counts of less than 1 km were not considered for further analysis. Only those 17 species/taxa were included that were observed at least 40 times in Belgian marine waters during the ship-based surveys (Fig. 2). Due to potentially unreliable identifications, all divers were grouped into ‘divers species’. The same happened to Common Terns Sterna hirundo, Arctic Terns S.arctica and unidentified ‘comic terns’. We considered ‘seabirds’ as: all divers, grebes, petrels, storm-petrels,
cormorants, gannets, seaducks, skuas, gulls, terns and auks. ‘Coastal birds’ include the waders and other waterbirds. The remaining species are treated as ‘terrestrial birds’ (see Appendix I). For a subdivision in taxonomic groups we followed STOWE (1982). One of the most obvious and abundant functional groups of seabirds at sea are the scavengers. As scavengers we included species that occur very regularly at the trawl: Fulmar, Northern Gannet, Great Skua, Lesser Black-backed Gull, Great Black-backed Gull, Herring Gull, Common Gull and Kittiwake. Species that do so only occasionally (other skuas, shearwaters, Little Gull, Black-headed Gull, terns, auks and cormorants) were not included (CAMPHUYSEN et al. 1995). In order to study the relationship between seabird communities and the environment, each counting unit of ten minutes was assigned a value for each of the following environmental variable classes, by using a GIS application tool (Fig. 1): 1) topography: ‘crest’, ‘slope’ or ‘swale’ (see above) 2) depth: ‘0-10 m’, ‘10-20 m’, ‘20-40 m’ 3) distance to the coast: ‘0-5 km’, ‘5-10 km’, ‘10-20
km’, ‘20-30 km’, ‘30-40 km’, ‘40-50 km’, ‘50-60 km’ 4) longitude: ‘2°10-2°20 E’, ‘2°20-2°30’, ‘2°30-2°40’,
‘2°40-2°50’, ‘2°50-3°00’, ‘3°00-3°10’, ‘3°10-3°20’ Weighted correlations between environmental variables revealed high values for depth and topography (0.734) and depth vs. distance to the coast (0.579). Due to the shape of the study-area, longitude showed an inverse correlation with distance to the coast (-0.419). With a multiple regression analysis on the log(x+1) transformed data, we assessed which explanatory variables contributed most to a species response and which explanatory variables appeared to be unimportant.
0,0 0,5 1,0 1,5 2,0 2,5 3,0 3,5 4,0 4,5
Uria aalgeLarus fuscus
Larus argentatusLarus canus
Larus marinusRissa tridactyla
Larus minutusPodiceps cristatus
Gavia stellata/arcticaMorus bassanus
Alca tordaLarus ridibundus
Fulmarus glacialisMelanitta nigra
Sterna hirundo/paradisaeaSterna sandvicensis
Uria aalge/Alca torda sp.Stercorarius skua
Somateria mollissimaStercorarius parasiticus
Sturnus vulgarisPhalacrocorax carbo
Anas penelopePuffinus griseus
Stercorarius pomarinusLarus melanocephalusAnser anser
Melanitta fuscaAnas platyrhynchosAnthus pratensis
log N observations
Fig. 2. Number of observations (log N) of the most common bird species above Belgian marine waters during ship-based surveys in
1992-98.

Seabird distribution
- 27 -
RESULTS GENERAL DESCRIPTION OF SEABIRD DISTRIBUTION IN BELGIAN MARINE WATERS Species-diversity During the study-period 1992-98, 124 bird species were observed in Belgian marine waters. Migration periods (autumn, spring) showed the highest overall number of observed species (94 and 71, respectively); winter and summer had lower N0 values (57 and 43 resp.). The mean number of species observed by bankstratum by season was comparable for autumn,
winter and spring (13.4, 11.2 and 12.2 resp.) and only markedly reduced in summer (6.1). Throughout the year the number of species observed at the offshore Hinderbanken and in the deepwater subregion was much lower than in the more coastal zones (Fig. 3). This may at least partly be attributed to the large distance to the coast and hence the lower probability to observe land-oriented migrating birds here.
Westkustbanken
Oostkustbanken
Zeelandbanken
Vlaamse Banken
Hinderbanken
Deepwater zone
0 5 10 15 20
AUTUMN
N0 diversity
Westkustbanken
Oostkustbanken
Zeelandbanken
Vlaamse Banken
Hinderbanken
Deepwater zone
0 5 10 15 20
WINTER
N0 diversity
Westkustbanken
Oostkustbanken
Zeelandbanken
Vlaamse Banken
Hinderbanken
Deepwater zone
0 5 10 15 20
SPRING
N0 diversity
Westkustbanken
Oostkustbanken
Zeelandbanken
Vlaamse Banken
Hinderbanken
Deepwater zone
0 5 10 15 20
SUMMER
N0 diversity
Fig. 3. Mean bird diversity (N0) by bankstratum by season for each of the six subregions in the Belgian marine waters during 1992-98.
Overall density Averaged over the entire study-period and study-area, the density of birds amounted to 6.89 km-2 (range: 0-1151 km-2), of which 98.1% were seabirds. Larus-gulls were most common (3.48 km-2), then auks (1.34 km-2), Kittiwake (0.57 km-2), scoters (0.48 km-2) and grebes (0.29 km-2). At a species level, the Common Guillemot attained the highest mean densities (1.06 km-
2), higher than those of Lesser Black-backed Gull (0.92 km-2), Herring Gull (0.74 km-2), Common Gull (0.71 km-
2), Kittiwake (0.57 km-2), Common Scoter (0.48 km-2), Great Black-backed Gull (0.44 km-2), Little Gull (0.39 km-2), Great Crested Grebe (0.29 km-2), Black-headed Gull (0.28 km-2), Razorbill (0.25 km-2), Northern Gannet (0.15 km-2) and Red-throated Diver (0.12 km-2). The year-round average density of all other species was lower than 0.10 km-2. We did not observe a single brid within transect during 39% of all 5360 count units (of c. 10 minutes each).
SPECIES DISTRIBUTION Year-to-year and month-to-month variability A Detrended Correspondence Analysis (DCA) on the mean densities of the 17 most abundant species/taxa per year and per month showed that major temporal variability is polarized along axis 1 (eigenvalue: 0.527)(Fig. 4). Samples of the months November-March were all grouped at the lower end of the first axis, those of April-October at the opposite side. In a TWINSPAN analysis on the same dataset, a similar division occurred with Great-crested Grebe, divers and Common Guillemot as indicators for the winter samples, and ‘comic’ Tern for the summer group. Data of certain years and individual months did not cluster, indicating that for further analysis all years could be combined and months could be regrouped in two major periods: a winter block (Nov-Mar) and a summer block (Apr-Oct).

Seabird distribution
- 28 -
Fig. 4. Ordination diagram of a DCA analysis on the monthly density data of the 17 most abundant species/taxa per year (see labels).
Distribution in relation to distance to the coast, depth, topography and longitude A multiple regression analysis on the log (x+1) transformed density data shows which explanatory variables contributed most to a species response and which explanatory variables appear to be unimportant
(Table 3). For most species/taxa the ‘distance to the coast’ is the variable that performed best in explaining the distribution, followed by the ‘month’ of the year and the ‘longitude’. That ‘depth’ and ‘topography’ are only of minor importance is rather surprising; for ‘year’ these findings are consistent with results obtained above.
Table 3. Contribution of various environmental factors in the distribution of seabird species/taxa in Belgian marine waters during 1992-98. The table summarizes the result of a multiple regression analysis on the log (x+1) transformed density data and the environmental
factors depth class (D), longitude class (L), topography (crest, slope, swale: T), year (Y), month (M) and distance to the coast class (A). The sequence of the importance of the variables for each species was determined by a forward stepwise selection procedure. For each variable the slope (b) of the regression and the significance (P) are given. For the selected set of environmental variables, the Radj is
added.
Species Var1 b P Var2 b P Var3 b P Var4 b P Radj G.stellata/arctica M -.09 *** D -.06 *** Y -.03 * L -.03 * 0.012
P.cristatus A -.10 *** M -.16 *** D -.09 *** L .04 ** 0.060 F.glacialis A .19 *** Y .06 *** 0.045
M.bassanus A .17 *** M .11 *** L -.06 *** 0.049 M.nigra A -.13 *** M -.08 *** Y .03 ** 0.019 S.skua A .05 *** M .05 *** 0.046
L.minutus A -.08 *** M .04 ** 0.008 L.ridibundus A -.08 *** L .07 *** D -.05 * 0.027
L.canus T -.09 *** M -.09 *** L .08 *** Y .07 *** 0.027 L.fuscus M .11 *** L .09 *** 0.023
L.argentatus L .07 *** D -.06 *** M -.05 *** Y .03 * 0.013 L.marinus M .12 *** Y -.03 * 0.014
R.tridactyla A .16 *** M .03 * 0.024 S.sandvicensis L .04 ** 0.001
S.hirundo/paradisaea L .09 *** M .05 *** T -.04 ** Y .03 * 0.014 U.aalge A .16 *** M -.17 *** L -.11 *** Y -.05 *** 0.090 A.torda L -.09 *** M -.07 *** A .07 *** 0.023

Seabird distribution
- 29 -
In our study-area we can distinguish three groups of seabirds on the basis of the observed densities in distance strips of 10 km (Fig. 1): (1) inshore species: species such as Great-crested Grebe, Common Scoter, Black-headed Gull and terns that are most abundant within 10 km from the shoreline in all seasons (Fig. 5, Appendix IV). (2) offshore species: species such as Fulmar, Northern Gannet, Great Skua and Kittiwake, that are rarely observed within 10 km from the coast and are most common beyond a distance of 20 km. (3) midshore taxa: a mixed group of auks, divers and Larus-gulls that occur in a wide front and that are well-presented at a midshore distance of 10-20 km from the coast, compared to further on- or offshore areas.
Generally spoken, inshore species are most abundant in the Kustbanken subregion, offshore species in the Hinderbanken subregion and midshore taxa (mixed group) are well-represented on the Vlaamse Banken and Zeeland ridges. In some species the distribution pattern changes with season. Little Gull, Lesser Black-backed Gull and Herring Gull have a more inshore distribution between April and October than during winter. And Kittiwake and Northern Gannet peak on average ten kilometres more inshore during November-March.
INSHORE dominant (0-10 km) MIXED group OFFSHORE dominant (30-60 km)
0,0
0,2
0,4
0,6
0-5 5-10
10-20
20-30 30
-4040
-5050
-60
G .stel lata/arct ica
N k
m-2
0,00
0,05
0,10
0,15
0,20
0-5 5-10
10-20
20-30 30
-4040
-5050
-60
S.skua
N k
m-2
0,0
0,5
1,0
1,5
0-5 5-10
10-20
20-30 30
-4040
-5050
-60
P.cristatus
N k
m-2
0
1
2
3
4
0-5 5-10
10-20
20-30 30
-4040
-5050
-60
L.fuscus
N k
m-2
0,0
0,2
0,4
0,6
0,8
0-5 5-10
10-20
20-30 30
-4040
-5050
-60
F.glacialis
N k
m-2
0,0
0,5
1,0
1,5
2,0
2,5
0-5 5-10
10-20
20-30 30
-4040
-5050
-60
L.ridibundus
N k
m-2
0
1
2
3
4
5
6
0-5 5-10
10-20
20-30 30
-4040
-5050
-60
L.argentatus
N k
m-2
0,0
0,5
1,0
0-5 5-10
10-20
20-30 30
-4040
-5050
-60
M.bassanus
N k
m-2
0
1
2
3
0-5 5-10
10-20
20-30 30
-4040
-5050
-60
L.canus
N k
m-2
0
1
2
3
4
0-5 5-10
10-20
20-30 30
-4040
-5050
-60
L.marinus
N k
m-2
0
1
2
3
4
5
0-5 5-10
10-20
20-30 30
-4040
-5050
-60
R.tridactyla
N k
m-2
0
1
2
3
4
0-5 5-10
10-20
20-30 30
-4040
-5050
-60
M .nigra
N k
m-2

Seabird distribution
- 30 -
0,00
0,05
0,10
0,15
0,20
0-5 5-10
10-20
20-30 30
-4040
-5050
-60
S.sandvicensis
N k
m-2
0
1
2
3
0-5 5-10
10-20
20-30 30
-4040
-5050
-60
U.aalge
N k
m-2
0,0
0,1
0,2
0,3
0-5 5-10
10-20
20-30 30
-4040
-5050
-60
S.hirundo/paradisaea
N k
m-2
0,0
0,5
1,0
0-5 5-10
10-20
20-30 30-
4040
-5050-
60
A.torda
N k
m-2
0,0
0,5
1,0
1,5
0-5 5-10
10-20
20-30 30-
4040-
5050-
60
L.minutus
N k
m-2
Fig. 5. Mean density (N km-2 ± SE) of 17 dominant species/taxa in Belgian marine waters at various distances to the coast. Values are presented separately for the winter Nov-Mar (grey bars) and the summer period Apr-Oct (white bars).
The distribution of seabirds in relation to depth (and to a lesser extent also to the underwater topography, classified as ‘crest’, ‘slope’ and ‘swale’) is consistent with the observed gradient in distance to the coast (Appendices IV, V & VI). The fact that in a stepwise multiple regression analysis depth and topography appeared of less influence on the distribution of 17 dominant seabird species/taxa than distance to the coast – to which it is obviously related – indicates that other environmental variables (turbidity, currents, food availability, etc…) might play a much more important role. Few species reach their highest densities on the sandbank crests (divers in winter, Lesser Black-backed Gull and Northern Gannet in summer) or in the swales (typical offshore species, including auks). The transition zone (‘slope’) has the highest overall density in seabirds (Appendix VI). Seabirds are bound to a certain area where they find food, shelter or suitable nesting opportunities. Scoters and other seaducks are concentrated in the coastal strip west of Oostende, where major bivalve
populations are found. Flocks of other waterbirds (e.g. Mallard Anas platyrhynchos and Wigeon A. penelope) often occur in the immediate vicinity of the outer harbour of Zeebrugge, where they concentrate and roost when disturbed in the port or inland. The west-east distribution of terns is primarily caused by the location of the Zeebrugge breeding colony at the east coast and the specific limitations in feeding ranges. Sandwich Terns, who make long feeding trips (in contrast to Common and Little Tern) and take advantage of the rich foraging opportunities in the Westkust- and Vlaamse Banken area, do not show a clear correlation with longitude. Other more widespread species are distributed in response to the gradient formed by the influence of the Channel in the west and the Schelde estuary in the east (Appendix VII). Some of these patterns may arise rather artificially. Due to the shape of the Belgian marine waters, longitude is inversely correlated with distance to the coast: the most western longitude strip (2°20-2°30 E) has no inshore component, the most eastern longitude strip (3°10-3°20 E) consists of the harbour of Zeebrugge

Seabird distribution
- 31 -
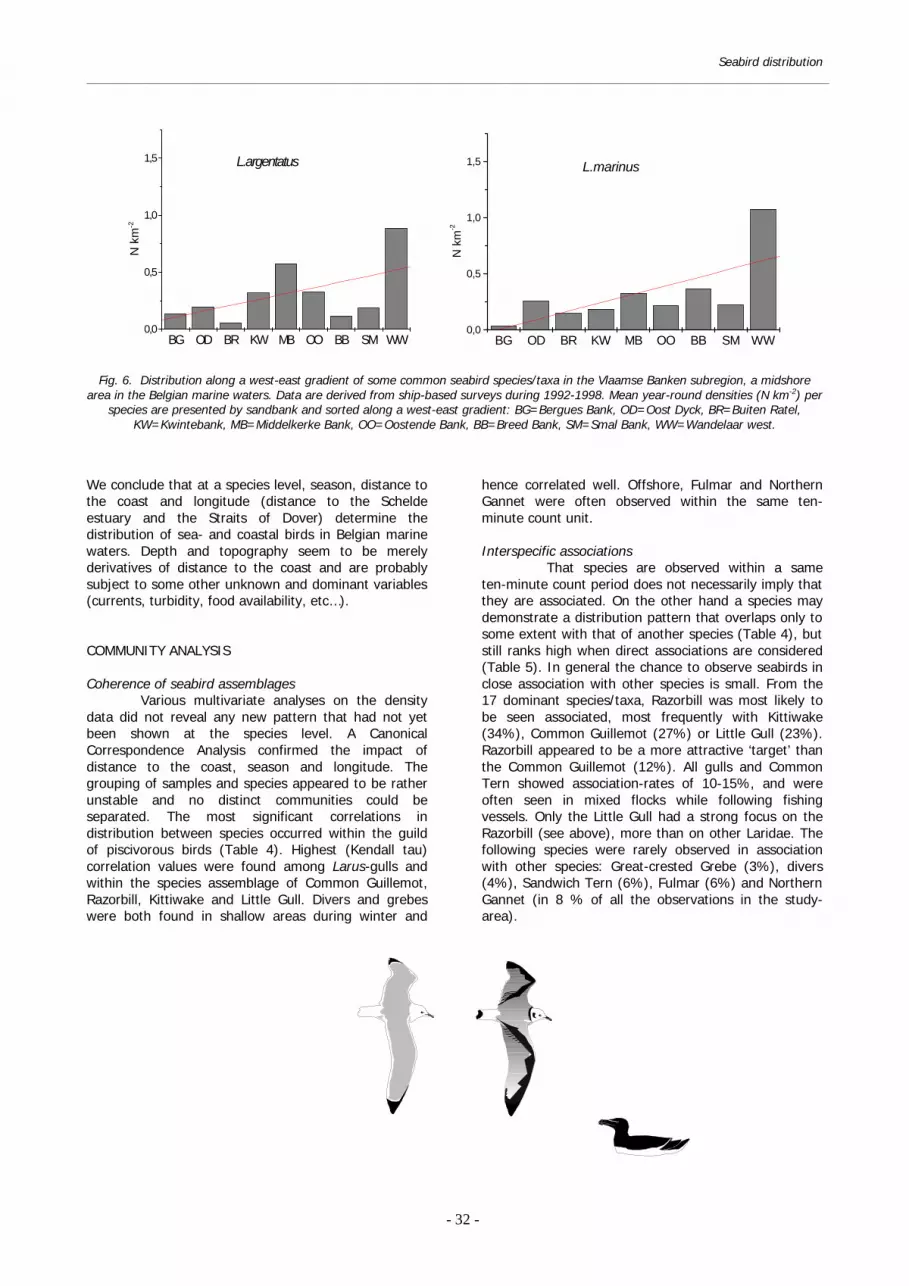
and the deepwater channels to the Schelde estuary. It is beyond doubt that this has created some of the patterns listed in Appendix VII, such as the high densities of gulls and grebes in the easternmost longitude strip. However, that true longitudinal gradients do exist has been observed in the field and can be demonstrated from an analysis of the seabird distribution on the Vlaamse Banken (west-east oriented). Piscivorous species who prefer clear water
and mid- to offshore conditions (Common Guillemot, Razorbill, Kittiwake and Northern Gannet) are more abundant on the western Vlaamse Banken, in accordance with the more offshore character, deeper water and smaller distance to the Straits of Dover of these sandbanks. Divers, grebes, scoters and Larus-gulls are commoner in the more turbid waters of the eastern Vlaamse Banken (Oostende Bank/ Middelkerke Bank) and on the inshore Smal Bank (Fig. 6).
BG OD BR KW MB OO BB SM WW0,0
0,5
1,0
1,5
U.aalge
N k
m-2
BG OD BR KW MB OO BB SM WW0,0
0,5
1,0
1,5 A.torda
N k
m-2
BG OD BR KW MB OO BB SM WW0,0
0,5
1,0
1,5R.tridactyla
2.44
N k
m-2
BG OD BR KW MB OO BB SM WW0,0
0,5
1,0
1,5 M.bassanus
N k
m-2
BG OD BR KW MB OO BB SM WW0,0
0,5
1,0
1,5Gavia sp.
N k
m-2
BG OD BR KW MB OO BB SM WW0,0
0,5
1,0
1,5L.minutus
N k
m-2
Seabird distribution
- 32 -
BG OD BR KW MB OO BB SM WW0,0
0,5
1,0
1,5 L.argentatus
N k
m-2
BG OD BR KW MB OO BB SM WW0,0
0,5
1,0
1,5 L.marinus
N k
m-2
Fig. 6. Distribution along a west-east gradient of some common seabird species/taxa in the Vlaamse Banken subregion, a midshore
area in the Belgian marine waters. Data are derived from ship-based surveys during 1992-1998. Mean year-round densities (N km-2) per species are presented by sandbank and sorted along a west-east gradient: BG=Bergues Bank, OD=Oost Dyck, BR=Buiten Ratel,
KW=Kwintebank, MB=Middelkerke Bank, OO=Oostende Bank, BB=Breed Bank, SM=Smal Bank, WW=Wandelaar west.
We conclude that at a species level, season, distance to the coast and longitude (distance to the Schelde estuary and the Straits of Dover) determine the distribution of sea- and coastal birds in Belgian marine waters. Depth and topography seem to be merely derivatives of distance to the coast and are probably subject to some other unknown and dominant variables (currents, turbidity, food availability, etc…). COMMUNITY ANALYSIS Coherence of seabird assemblages
Various multivariate analyses on the density data did not reveal any new pattern that had not yet been shown at the species level. A Canonical Correspondence Analysis confirmed the impact of distance to the coast, season and longitude. The grouping of samples and species appeared to be rather unstable and no distinct communities could be separated. The most significant correlations in distribution between species occurred within the guild of piscivorous birds (Table 4). Highest (Kendall tau) correlation values were found among Larus-gulls and within the species assemblage of Common Guillemot, Razorbill, Kittiwake and Little Gull. Divers and grebes were both found in shallow areas during winter and
hence correlated well. Offshore, Fulmar and Northern Gannet were often observed within the same ten-minute count unit.
Interspecific associations That species are observed within a same ten-minute count period does not necessarily imply that they are associated. On the other hand a species may demonstrate a distribution pattern that overlaps only to some extent with that of another species (Table 4), but still ranks high when direct associations are considered (Table 5). In general the chance to observe seabirds in close association with other species is small. From the 17 dominant species/taxa, Razorbill was most likely to be seen associated, most frequently with Kittiwake (34%), Common Guillemot (27%) or Little Gull (23%). Razorbill appeared to be a more attractive ‘target’ than the Common Guillemot (12%). All gulls and Common Tern showed association-rates of 10-15%, and were often seen in mixed flocks while following fishing vessels. Only the Little Gull had a strong focus on the Razorbill (see above), more than on other Laridae. The following species were rarely observed in association with other species: Great-crested Grebe (3%), divers (4%), Sandwich Tern (6%), Fulmar (6%) and Northern Gannet (in 8 % of all the observations in the study-area).

Seabird distribution
- 33 -
Table 4. Interspecific correlation (Kendall tau) of densities of the 17 most common species/taxa in Belgian marine waters in winter (Nov-March) and summer (April-October). Correlation is based on co-occurrence within ten-minute count periods during ship-based
surveys in 1992-98. Significant (P<0.05) positive correlations are marked with: +, negative correlations with: -. In addition, significant correlations at P<0.01 are highlighted: Light grey: |t -values| < 0.10 Grey: |t -values| = 0.10.
WINTER
SUMMER
P.cr
ista
tus
M.n
igra
S.hi
rund
o/pa
radi
saea
S.sa
ndvi
cens
is
Gav
ia s
p.
L.m
inut
us
L.rid
ibun
dus
L.ca
nus
L.ar
gent
atus
L.fu
scus
L.m
arin
us
R.t
ridac
tyla
U.a
alge
A.to
rda
M.b
assa
nus
S.sk
ua
F.gl
acia
lis
P.cristatus + + - + + - - - - - - M.nigra + + - - - -
S.hirundo/paradisaea S.sandvicensis +
Gavia sp. + + + + - + - L.minutus + + + + + + + + + + + -
L.ridibundus + + + + + + + - - - - L.canus + + + + + + + + + - - -
L.argentatus + + + + + + + + + L.fuscus + + + + + + + + + + + +
L.marinus + + + + + + + + + + + R.tridactyla + + + + + + + + +
U.aalge + - - + + + + + A.torda - + + + +
M.bassanus - + + + + S.skua + - + +
F.glacialis - - - - - + + + + +
Table 5. Seabird associations during ship-based surveys in 1992-98. Shown are the proportion of associated sightings on the total number of observations, the number of ‘group’ observations and the top-2 most associated species for the 17 dominant species/taxa.
Species Frequency of associations
with other species (%) Two most associated species (%) Nr of ‘group’
observations (N) M.nigra 16% S.mollissima: 30%, M.fusca: 22% 131
L.minutus 13% A.torda: 23%, R.tridactyla: 14% 331 F.glacialis 6% L.fuscus: 22%, R.tridactyla: 18% 141
S.skua 14% L.marinus: 19%, R.tridactyla: 16% 46 M.bassanus 8% L.marinus: 24%, R.tridactyla: 21% 497 L.ridibundus 12% L.canus: 31%, L.argentatus: 24% 245
L.canus 10% L.argentatus: 26%, L.marinus: 17% 590 L.fuscus 16% L.argentatus: 29%, L.marinus: 22% 916
L.argentatus 15% L.fuscus: 28%, L.marinus: 21% 916 L.marinus 12% L.fuscus: 23%, L.argentatus: 23% 758
R.tridactyla 12% L.argentatus: 15%, L.marinus: 15% 893 Gavia sp. 4% P.cristatus: 23%, R.tridactyla: 18% 68 P.cristatus 3% L.canus: 22%, divers: 19% 37
S.sandvicensis 6% L.fuscus: 26%, L.argentatus: 17% 35 S.hirundo/paradisaea 12% L.fuscus: 24%, L.minutus: 22% 44
U.aalge 12% R.tridactyla: 43%, A.torda: 22% 997 A.torda 28% R.tridactyla: 34%, U.aalge: 27% 378
Skuas are often associated with other species (Great Skua: 14%, Arctic Skua: 17% of the sightings), but merely 2.9% (Great Skua) up to 6.3% (Arctic Skua) of the observed specimens were actually observed while pursuing and kleptoparasiting other birds (Table 6). Main victims were Kittiwake and ‘comic’ terns in the case of Arctic Skua, and Great Black-backed Gull and Northern Gannet in Great Skua. Observations of kleptoparasiting Pomarine and Long-tailed Skua were scarce and generally in line with what was found in Arctic Skua: twice we saw a Pomarine Skua targeting a
Kittiwake, once we observed a Long-tailed Skua during a purchase of an Arctic Tern. Other species rarely attack seabirds in the way skuas do. Fulmar and most gulls showed kleptoparasitic behaviour in less than 0.5% of all the sightings. The species that suffered most from kleptoparasitic attacks from any kind of seabird were the Kittiwake (20%), Great Black-backed Gull (16%), Lesser Black-backed Gull (13%), Herring Gull (10%) and Northern Gannet (8%). In nearly 40% of the pursuits the attack was directed towards a fish
Seabird distribution
- 34 -
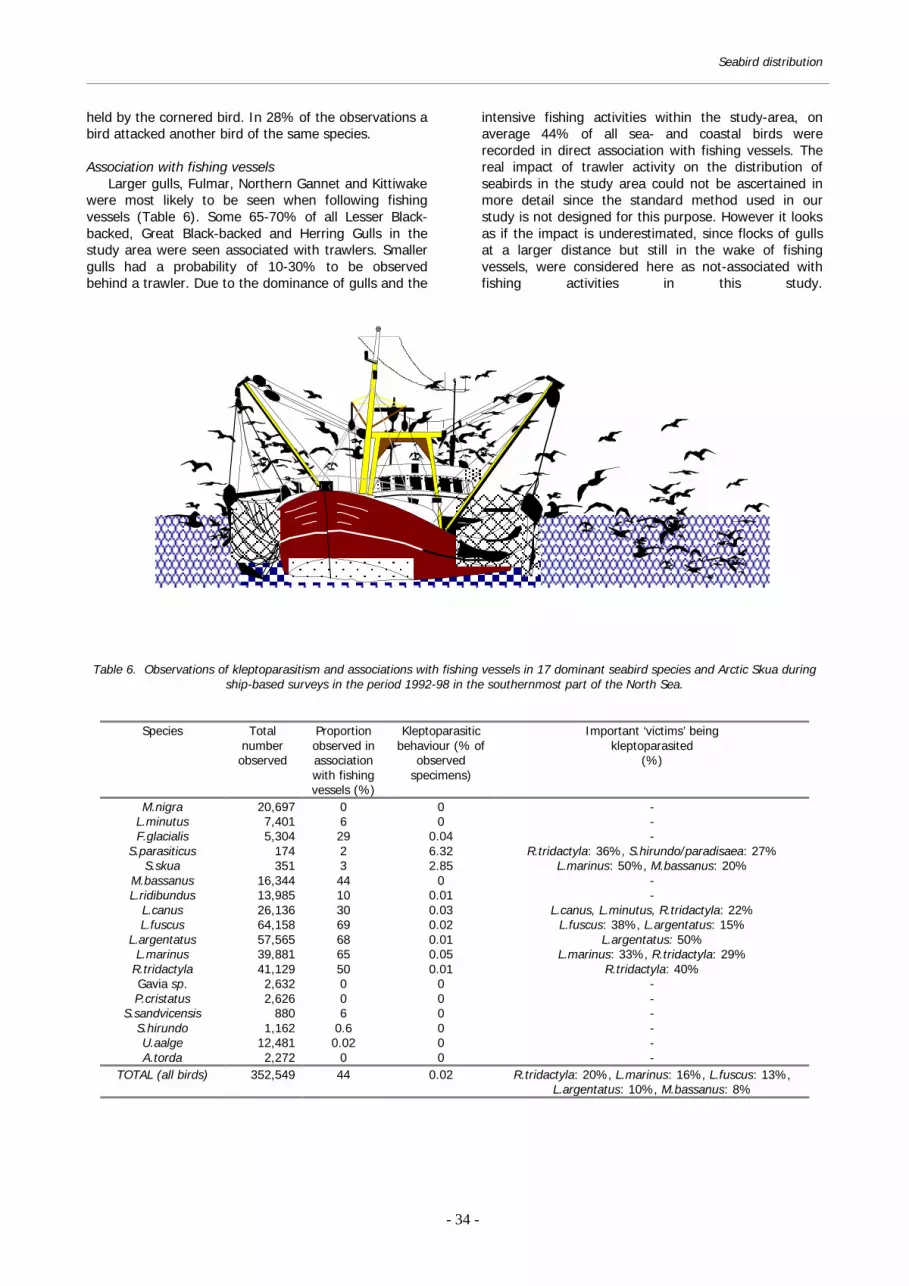
held by the cornered bird. In 28% of the observations a bird attacked another bird of the same species. Association with fishing vessels Larger gulls, Fulmar, Northern Gannet and Kittiwake were most likely to be seen when following fishing vessels (Table 6). Some 65-70% of all Lesser Black-backed, Great Black-backed and Herring Gulls in the study area were seen associated with trawlers. Smaller gulls had a probability of 10-30% to be observed behind a trawler. Due to the dominance of gulls and the
intensive fishing activities within the study-area, on average 44% of all sea- and coastal birds were recorded in direct association with fishing vessels. The real impact of trawler activity on the distribution of seabirds in the study area could not be ascertained in more detail since the standard method used in our study is not designed for this purpose. However it looks as if the impact is underestimated, since flocks of gulls at a larger distance but still in the wake of fishing vessels, were considered here as not-associated with fishing activities in this study.
Table 6. Observations of kleptoparasitism and associations with fishing vessels in 17 dominant seabird species and Arctic Skua during
ship-based surveys in the period 1992-98 in the southernmost part of the North Sea.
Species Total number observed
Proportion observed in association with fishing vessels (%)
Kleptoparasitic behaviour (% of
observed specimens)
Important ‘victims’ being kleptoparasited
(%)
M.nigra 20,697 0 0 - L.minutus 7,401 6 0 - F.glacialis 5,304 29 0.04 -
S.parasiticus 174 2 6.32 R.tridactyla: 36%, S.hirundo/paradisaea: 27% S.skua 351 3 2.85 L.marinus: 50%, M.bassanus: 20%
M.bassanus 16,344 44 0 - L.ridibundus 13,985 10 0.01 -
L.canus 26,136 30 0.03 L.canus, L.minutus, R.tridactyla: 22% L.fuscus 64,158 69 0.02 L.fuscus: 38%, L.argentatus: 15%
L.argentatus 57,565 68 0.01 L.argentatus: 50% L.marinus 39,881 65 0.05 L.marinus: 33%, R.tridactyla: 29%
R.tridactyla 41,129 50 0.01 R.tridactyla: 40% Gavia sp. 2,632 0 0 - P.cristatus 2,626 0 0 -
S.sandvicensis 880 6 0 - S.hirundo 1,162 0.6 0 - U.aalge 12,481 0.02 0 - A.torda 2,272 0 0 -
TOTAL (all birds) 352,549 44 0.02 R.tridactyla: 20%, L.marinus: 16%, L.fuscus: 13%, L.argentatus: 10%, M.bassanus: 8%

Seabird distribution
- 35 -
DISCUSSION DISTRIBUTION PATTERNS
Opposing results can emerge when studying seabird distribution at various temporal and spatial scales (HUNT & SCHNEIDER 1987, BEGG & BLOOR 1996, LOGERWELL & HARGREAVES 1996, RIBIC et al. 1997). Often seabirds use much finer-scaled cues in exploiting the environment than those that can be detected with large-scale surveys (BEGG & REID 1997, TASKER & REID
1997, WANLESS et al. 1997, CAMPHUYSEN & WEBB 1999). Therefore it is essential to study seabird distribution in enough detail in areas of special interest. During seven years of ship-based surveys, we surveyed the small and geomorphologic varied Belgian marine waters intensively. Analysis of the data revealed that spatial and seasonal patterns were more pronounced than year-to-year variations, so that data from several years could be combined. Within two major periods (‘winter’: Nov-Mar; ‘summer’: Apr-Oct), most of the 17 dominant species/taxa showed significant variations in density over a 60 km inshore-offshore gradient and many became gradually more abundant over a longitudinal gradient of merely 30-65 km. Scoters, grebes and Black-headed Gull were virtually restricted to the nearest 10 km from the shoreline. Terns, Little Gull and Common Gull are most common inshore but can also be found at a larger distance to the coast. Great Skua and Fulmar are usually observed beyond 30 km and hence can be considered as true offshore species. Auks and Northern Gannet are distributed over a wider front, but clearly avoid inshore waters. Finally all other gulls, Kittiwake and small divers occur throughout the Belgian marine waters and peak at various distances to the coast. Variations in density along a longitudinal gradient are not clear for species that are bound to specific locations to feed (scoters cf. bivalve populations) or to breed (terns). That inshore/midshore species groups (divers, grebes, most Larus-gulls) were more common in the eastern part near the mouth of the Schelde estuary and offshore species (Fulmar, Northern Gannet, Great Skua, Great Black-backed Gull, Razorbill) preferred the deeper waters towards the Straits of Dover, is in line with what has earlier been demonstrated by OFFRINGA et al. (1996) for the Southern Bight of the North Sea. At larger (North Sea) scales (TASKER et al. 1988, CAMPHUYSEN & LEOPOLD 1994, SKOV et al. 1995, STONE et al. 1995) these patterns are barely detectable.
A remarkable characteristic of the southernmost part of the North Sea is the presence of various sand ridges, aligned in four major groups each with their own strike, steepness and bottom characteristics. Very shallow bank crests (0-5 m below MLLWS) are found next to channels of up to 40 m deep, running in between the sand ridges. Sand waves occur in well defined fields on the slopes and crests of the banks, having a length of several hundreds of metres and heights of 1-8 m (DE MOOR & LANCKNEUS
1988). In the more offshore sand ridges, the bank crests and the north-western, steep slopes are composed of well-sorted sands due to a strong erosion
activity. The gentle eastern slopes know a slight sedimentation. In the swales, sediments are not displaced under normal tidal conditions and benthic communities are usually well developed here (HOUTHUYS
1990). Though underwater conditions obviously vary largely in this habitat, topography and depth showed of minor importance in structuring the seabird communities, compared to distance to the coast and seasonality. An explanation can probably be found in the mobility of prey-items (mainly pelagic fish), the changing conditions with tides, the drift of the birds due to currents and the precision of the counting methods (units of 10 minutes, i.e. c. 3 km in terms of travelled distance). The fact that both divers - generally referred to as ‘inshore’ seabirds - and the ‘offshore’ auks are particularly common on the Vlaamse Banken at a distance of 10-30 km (i.e. midshore), instead of being spatially separated as in Dutch marine waters (CAMPHUYSEN & LEOPOLD 1994), indicates a remarkable coincidence of different living conditions among these sand ridges. Scanning of the banks with echo sounders often revealed high densities of pelagic fish echos on the slopes of the sand ridges. How the complex geomorphology and hydrography affects availability of prey and how the estuarine plume from the Schelde estuary interferes with it remains yet to be studied. Although there is a wealth of literature on the impact of hydrography on seabird distribution worldwide (e.g. POCKLINGTON 1979, JENSEN & JOIRIS 1983, HANEY 1986, FOLLESTAD 1990, SCHNEIDER 1990, ELPHICK & HUNT 1993, LEOPOLD 1993, SKOV & DURINCK 1995, DECKER & HUNT
1996, BEGG & REID 1997, GARTHE 1997, HUNT 1997, RIBIC
& AINLEY 1997, SPRINGER et al. 1999), not a single study describes the small-scale structuring impact of currents on seabirds within linear sand ridge complexes. Most of the studies mentioned above concern traditional upwelling zones, large-scale gyres or tidal fronts between mixed and stratified waters (e.g. CAMPHUYSEN & WEBB 1999). Only three studies deal with seabird aggregations at estuarine fronts. In a study of SKOV & PRINS (2001), the distribution of Red-throated and Black-throated Diver in German coastal waters is satisfactorily explained by the Jutland Coastal Current, an estuarine water mass from the Elbe moving northwards along the German coast. The current is distinguished from North Sea water masses by its low surface temperature, high turbidity and a salinity below 34 psu, more or less the way the Schelde estuary outflow affects the Belgian marine waters and the southern part of the Dutch coast (NIHOUL & RONDAY
1976, NIHOUL 1980). SKOV & PRINS (2001) also mention that the highest densities of divers are found where the estuarine surface water mass circulation breaks down in the eddy fields of deeper waters. The way the estuarine plume from the Schelde interferes with the highly structured sand ridges immediately to the west and determines the spatio-temporal availability of food for seabirds warrants further study.

Seabird distribution
- 36 -
CONSTANCY OF SEABIRD COMMUNITIES Seabirds are highly mobile organisms and generally do not aggregate in long-lasting communities of coexisting species. They rather occur solitary or in short-lived multi-species feeding associations (MSFA’s) around fishing vessels, cetaceans or over fish shoals (HOFFMANN et al. 1981, CAMPHUYSEN & WEBB 1999). The first type is common in the North Sea, where fishery activities usually attract large flocks of gulls, Fulmar and Northern Gannet and where fishery waste probably supports 2.5-3.5 million of these scavenging seabirds (FURNESS et al. 1992, CAMPHUYSEN 1995, CAMPHUYSEN et al. 1995, GARTHE & HÜPPOP 1998). In our study-area we found 65-70% of all Lesser Black-backed, Great Black-backed and Herring Gulls associated with trawlers, and 10-40% of smaller gulls, Northern Gannet and Fulmar. These high values clearly indicate how strongly fishery activities affect the spatio-temporal distribution of seabirds - and particularly of the larger gulls - in this part of the North Sea. This is in accordance with CAMPHUYSEN et al. (1995), who pointed out that Great Black-backed Gull, Herring Gull and Lesser Black-backed Gull are the only species of which the overall distribution in the North Sea was clearly positively influenced by the presence of fishing vessels. CAMPHUYSEN et al. (1995), GARTHE et al (1996), CAMPHUYSEN & GARTHE (1997) and PHILLIPS et al. (1999) found that variations in distribution of Fulmar, Northern Gannet, Great Skua and Kittiwake could not be explained by differences in fishing vessel abundance. In the German Bight of the North Sea, GARTHE (1997) describes how seven environmental components explain 71% of the variance in seabird numbers. The occurrence of a land-sea gradient (including distance to the nearest colony/land, water transparency, water depth) turned out to be the most important one and trawler abundance as the second most important explanatory variable. In our small study-area, the high mobility of the large gulls in response to intensive trawling and their numerical dominance at sea and on the shoreline (DEVOS & DEBRUYNE 1990,1991, SPANOGHE
1999) explains at least to some extent the noise that arises when performing multivariate analyses in order to distinguish distinct communities of seabirds. Natural flocking over fish shoals is described in detail by CAMPHUYSEN & WEBB (1999). They describe how relatively small and diverse MSFA’s may suddenly develop and break down over near-front waters off the Scottish east coast and at the frontal zone. It appears that synchronised diving auks most often cause the formation of MSFA’s (‘producers’), with Kittiwakes being the first to join and instigate other species (‘catalysts’) to exploit prey chased to the surface by the auks. MSFA’s were a very widespread phenomenon and usually broke down rapidly, when auks ceased to drive prey to the surface or when too many scrounging (‘suppressors’) large gulls moved in. It might well be that the presence of the auks set the limits of the foraging range of Kittiwakes, by making prey available that would normally be out of reach. We observed similar MSFA’s in Belgian marine waters during winter, with auks attracting small numbers of Kittiwake or Little
Gull. Association rates - including those with other auks - were more than twice as high for Razorbill (28%) compared to Common Guillemot (12%). For both species associations with the other auk species and with Kittiwake amounted to more than 60% of all grouped observations. Little Gull showed the same frequency of associations (13%) with other species as demonstrated by the Kittiwake (12%), but apparently preferred the neighbourhood of Razorbill (23% of all associations) to Common Guillemot (9%). Several authors commented on the feeding association of Little Gulls and auks (MADGE 1965, SCOTT 1972, DATHE 1981, EVANS 1989). The former two authors described how juvenile Little Gulls formed feeding associations with Razorbill, contesting amongst congenerics or other species, which should consort with a particular Razorbill. During winter both Common Guillemot and Razorbill (CAMPHUYSEN 1996,1998a) predominantly feed on small fish in the North Sea, while some data suggest that in the southern North Sea Razorbill might take a higher share of non-clupeid fish. It might well be that slightly different feeding strategies among auk species – resulting from slight differences in prey-choice - result in the observed difference in associations with small gull species. Our data suggest that associations between seabird species are predominantly triggered by trawling activities and feeding opportunities created over natural fish shoals. Kleptoparasitic behaviour known from skuas is directed towards other gulls and terns. The smaller species focus on small gulls and terns, the Great Skua choose its targets among large gulls and Northern Gannet (see also TASKER et al. 1995). In an analysis of associations of Great Skuas with other seabird species in the North Sea, TASKER et al (1995) found associations in natural MSFA’s and with fishing vessels to account for 65-90% of all grouped observations. Kleptoparasitic behaviour occurred in only 0-21% of all observations, a range that covers the 3-6% we found for skuas in our study-area. Recommendations for future research Seven years of intensive seabird surveying in the small Belgian marine waters resulted in a good knowledge of general distribution patterns, providing a sound basis for more detailed research in the future. It is clear that seabird communities are mobile and often short-lived assemblages, reacting to local conditions of hydrography and food availability. In order to fully understand the way seabirds interact with their environment in the southernmost part of the North Sea, specific studies should be developed to disentangle how the estuarine front from the Schelde estuary meets the area of sand ridges and how this affects the feeding opportunities for various species of seabirds. Therefore we would suggest to focus research on the complex relationship between seabird distribution and pelagic fish distribution and behaviour. So far there is a serious gap in our knowledge of pelagic fish distribution in this part of the North Sea. There is a need to focus on the temporal and spatial distribution of the fish amid the sand ridges and along the natural gradient from the

Seabird distribution
- 37 -
deep Straits of Dover to the mouth of the Schelde estuary. The data obtained in an indirect way by echosounding during integral campaigns in the period 1994-1998 should be complemented with direct sampling of pelagic fish species. Attention should also go to small-scale temporal distribution patterns in piscivorous birds. Recent studies indicate that self-fishing seabirds tend to target predictable prey concentrations in the winter (SKOV et al. 2000) and that tidal and diurnal activity patterns may arise (HANEY & SCHAUER 1994, CAMPHUYSEN 1998b). The use of focal species is attractive because their use promises to maximize information return from minimal financial commitments to research and monitoring. It definitely makes no sense to monitor only particular species of interest during seabirds at sea surveys. With the standard method all species can be counted without increasing the effort. However, some species provide better research opportunities and behave more as ‘umbrella species’ than others. These species should get priority in terms of research effort.
The correlation- and association rates we calculated for various species may be put forward as one of the potential criteria for selection of ‘umbrella-like’ seabird species, the way FLEISHMAN et al. (2000) used a mean percentage of co-occurring species to select umbrella butterfly species in North-America. Other criteria might be that the species is sufficiently abundant and easy to survey, that its distribution is not influenced thoroughly by human activities (unless you want indicators for these activities), that it is a focal species for conservation purposes or that additional information on mortality and condition can be obtained e.g. through studies at breeding colonies or during beached bird surveys. In Table 7 we ranked the 17 dominant species for Belgian marine waters and the Little Tern according to an ‘indicator score’. This score is the sum of scores from 0-2 for five different criteria, considered of major importance in a selection process of focal species. The highest-ranking species in each group are those we consider most appropriate to focus future research upon.
Table 7. Selection of focal species by feeding guild in Belgian marine waters, based on five criteria: (1) the species should be abundant and easy to survey (abundance classes= maximum numbers in Belgian marine waters, see SEYS et al., submitted: 0= <1000; 1=1000-10,000; 2=>10,000; all species are easily surveyed except seaducks and divers); (2) patterns in occurrence are well-delineated (e.g. self-fishing species and benthivores are distributed in a more predictable way than most gulls and other species relying on discards
from fisheries activities); (3) the ‘umbrella’ effect: species often found in association with other species (Table 5); (4) selected as focal species for conservation purposes, i.e. rare and threatened species in Belgian marine waters, or as locally important species, see SEYS et al., submitted; (5) additional information on mortality and condition of the species is available, through studies in the breeding colonies
*, or as a result of large beached bird numbers in the 1990s, see SEYS et al., in press: 0= <50 specimens collected, 1=50-150, 2=>150).
Species/taxon Feeding type (season when most
abundant/ (1) (2) (3) (4) (5) Total
‘Indicator’ score
S.hirundo self-fishing (summer/inshore) 2* 2 2 2 2* 10 S.sandvicensis self-fishing (summer/inshore) 2* 2 0 2 2* 8
S.albifrons self-fishing (summer/inshore) 1* 2 0 2 2* 7 P.cristatus self-fishing (winter/inshore) 2 2 0 1 1 6
A.torda self-fishing (winter/mid-offshore) 2 2 2 1 2 9 U.aalge self-fishing (winter/mid-offshore) 2 2 2 0 2 8 divers self-fishing (winter/midshore) 1 2 0 2 1 6
L.ridibundus scavenger (yearround/inshore) 2 2 2 0 2 8 L.argentatus scavenger (yearround/midshore) 2 1 2 1 2 8
L.fuscus scavenger (summer/midshore) 2 1 2 1 2* 8 L.marinus scavenger (winter/midshore) 2 1 2 1 1 7 L.canus scavenger (winter/inshore) 2 1 2 0 2 7
R.tridactyla scavenger (yearround/offshore) 2 1 2 0 2 7 F.glacialis scavenger (yearround/offshore) 2 1 1 0 2 6
M.bassanus scavenger (yearround/offshore) 2 1 1 0 1 5 S.skua scavenger (winter/offshore) 1 0 2 1 0 4
L.minutus omnivorous (yearround/midshore) 2 1 2 2 0 7 M.nigra benthivorous (winter/inshore) 1 2 2 2 1 8
ACKNOWLEDGEMENTS Between 1992 and 1999, the seabird survey programme in Belgium has been financed successively by the World Wide Fund for Nature (WWF-Belgium), the Management Unit of the Mathematical Model for the North Sea (BMM) and the federal Services for Scientific, Technical and Cultural affairs (DWTC). We were able to collect the information thanks to the management and crews of the ferries of the Regie Maritime Transport (RMT) and Sally Lines, the oceanographic vessel Belgica and the hydrographic vessel Ter Streep. We are also indebted to several seabird watchers who assisted during the offshore work, in particular to Wim Van den Bossche who carried out most of the surveys during November 1993 and the end of 1994. Kees Camphuysen (NIOZ-Texel) invited us for a seabird training on board the Tridens at the start of the programme in 1992, and was always willing to assist wherever possible.

Seabird distribution
- 38 -
REFERENCES ANONYMOUS (1995). An atlas of seabird distribution in North-west European waters – Electronic version 2.1. Joint Nature Conservation
Committee, Peterborough. BAPTIST, H.J.M. & WOLF, P.A. (1993). Atlas van de vogels van het Nederlands Continentaal Plat. Rapport DGW-93.013, Dienst
Getijdewateren, Rijkswaterstaat, Middelburg. BEGG, G. & BLOOR, P. (1996). Scale-dependence in the spatial distribution of seabirds. In: ICES & JNCC, Seabirds in the Marine
Environment, p. 10. BEGG, G.S. & REID, J.B. (1997). Spatial variation in seabird density at shallow sea tidal mixing front in the Irish Sea.
ICES J. mar. Sci. 54: 552-565. CAMPHUYSEN, C.J. (1996). The spatial distribution of seabirds in the North Sea: towards understanding patterns. Sula 10 (special issue):
41-88 (in Dutch with English summary). CAMPHUYSEN, C.J. (1998a). Diurnal activity patterns and nocturnal group formation of wintering Common Murres in the central North
Sea. Colonial Waterbirds 21: 406-413. CAMPHUYSEN, C.J. (1998b). Het voorkomen van de Alk Alca torda in Nederlandse wateren. Limosa 71: 69-77. CAMPHUYSEN, C.J. & GARTHE, S. (1997). An evaluation of the distribution and scavenging habits of northern fulmars (Fulmarus glacialis)
in the North Sea. ICES J. mar. Sci. 54: 654-683. CAMPHUYSEN, C.J. & LEOPOLD, M.F. (1994). Atlas of seabirds in the southern North Sea. IBN Research Report 64/6, NIOZ-Report 1994-8,
Institute for Forestry and Nature Research, Dutch Seabird Group and Neth. Inst. for Sea Res., Texel: 126 pp. CAMPHUYSEN, C.J. & WEBB, A. (1999). Multi-species feeding associations in North Sea seabirds: jointly exploiting a patchy environment.
Ardea 87: 177-198. CAMPHUYSEN, C.J., CALVO, B., DURINCK, J., ENSOR, K., FOLLESTAD, A., FURNESS, R.W., GARTHE, S., LEAPER, G., SKOV, H., TASKER, M.L. &
WINTER, C.J.N. (1995). Consumption of discards by seabirds in the North Sea. Final report to the European Comm., study contract BIOECO/93/10, NIOZ-Report 1995-5, Netherlands Institute for Sea Research, Texel.
CARTER, I.C., WILLIAMS, J.M., WEBB, A. & TASKER, M.L. (1993). Seabird concentrations in the North Sea: an atlas of vulnerability to Surface pollutants. Joint Nature Conservation Committee, Aberdeen.
CATTRYSSE, A. & VINCX, M. (2001). Biodiversity of the benthos and the avifauna of the Belgian coastal waters: summary data collected between 1970 and 1998. Sustainable Management of the North Sea. Federal Office for Scientifc, Technical and Cultural Affairs: Brussel, Belgium. 48pp.
DATHE, H. (1981). Zwergmöwen, Larus minutus, als Nahrungsschmarotzer. Beitr. Vogelk. 27: 231. DE MOOR, G. & LANCKNEUS, J. (1988). Acoustic teledetection of sea-bottom structures in the Southern Bight. Bull. Soc. Belge de Géol. 97:
199-210. DECKER, M.B. & HUNT, G.L. (1996). Foraging by murres (Uria spp.) at tidal fronts surrounding the Pribilof Islands, Alaska, USA. Marine
Ecology Progress Series 139: 1-10. DEGRAER, S. (1999). Macrobenthos of shallow marine habitats (Belgian coast) and its use in coastal zone management. PhD thesis
University Gent, Gent: 158pp.. DEVOS, K. & DEBRUYNE, R. (1990). Overwinterende meeuwen langs de Vlaamse kust: een totaaltelling in december 1989.
Mergus 4: 2-13. DEVOS, K. & DEBRUYNE, R. (1991). Totaaltellingen van meeuwen langs de Vlaamse kust in juli en september 1990. Mergus 5: 97-108. EISMA, D., JANSEN, J.H.F. & VAN WEERING, T.C.E. (1979). Sea-floor morphology and recent sediment movement in the North_Sea. In:
Oele E., Schutterhelm R.T.E. & Wiggers A.J. (eds.), The Quarternary history of the North Sea, pp. 217-31. Acta Univ. Ups. Symp. Univ. Ups. ann. quing. Celebr.
ELPHICK, C.S. & HUNT, JR. G.L. (1993). Variations in the distributions of marine birds with water mass in the northern Bering Sea. Condor 95: 33-44.
EVANS, C. (1989). Little Gull associating with auks in winter. Brit. Birds 82: 373. FLEISHMAN, E., MURPHY, D.D. & BRUSSARD P.F. (2000). A new method for selection of umbrella species for conservation planning.
Ecological Applications 10: 569-579. FOLLESTAD, A. (1990). The pelagic distribution of Little Auk Alle alle in relation to a frontal system off central Norway, March/April 1988.
Polar Research 8: 23-28. FURNESS, R.W., ENSOR, K. & HUDSON, A.V. (1992). The use of fishery waste by gull populations around the British Isles.
Ardea 80: 105-113. GARTHE, S. (1997). Influence of hydrography, fishing activity and colony location on summer seabird distribution in the south-eastern
North Sea. ICES J. mar. Sci. 54: 566-577. GARTHE, S., CAMPHUYSEN, C.J. & FURNESS, R.W. (1996). Amounts of discards by commercial fisheries and their significance as food for
seabirds in the North Sea. Marine Ecology Progress Series 136: 1-11. GARTHE, S. & HÜPPOP, O. (1998). Foraging success, kleptoparasitism and feeding techniques in scavenging seabirds: does crime play?
Helgol. Meeresunters. 52: 187-196. GOVAERE, J.C.R. (1978). Numerieke analyse van het makrobenthos in de Southern Bight (Noordzee). Doctoraatthesis R.U. Gent, Gent. HANEY, J.C. (1986). Seabird affinities for Gulf Stream frontal eddies: responses of mobile marine consumers to episodic upwelling.
Journal of Marine Research 44: 361-384. HANEY, J.C. & SCHAUER, A.E.S. (1994). Environmental variability facilitates coexistence within an alcid community at sea.
Mar. Ecol. Progr. Ser. 103: 221-237. HOFFMAN, W., HEINEMANN, D. & WIENS, J.A. (1981). The ecology of seabird feeding flocks in Alaska. Auk 98: 437-456. HOUBOLT, J.J.H.C. (1968). Recent sediments in the Southern Bight of the North Sea. Geol. Mijnbouw 47: 245-273. HOUTHUYS, R. (1990). Vergelijkende studie van de afzettingsstruktuur van getijdenzanden uit het Eoceen en van de huidige Vlaamse
banken. Aardkundige Mededelingen. 5: 137. HUNT, JR. G.L. (1997). Physics, zooplankton and the distribution of Least Auklets in the Bering Sea - a review.
ICES J. mar. Sci. 54: 600-607. HUNT, JR. G.L. & SCHNEIDER, D.C. (1987). Scale-dependent processes in the physical and biological environment of marine birds.
In: Croxall J.C. (ed.), Seabirds: feeding biology and role in marine ecosystems, pp. 7-41. Cambridge University Press: Cambridge.

Seabird distribution
- 39 -
JENSEN, H. & JOIRIS, C.R. (1983). Winter distribution of seabirds in the North Sea: an oceanological interpretation. De Giervalk 73: 107-123.
KNIJN, R.J., BOON, T.V., HEESSEN, H.J. & HISLOP, J.R.G. (1993). Atlas of the North Sea Fishes. Based on bottom-trawl survey data for the years 1985-1987. Copenhagen, Denmark, International Counsil for the Exploration of the Sea.
LEOPOLD, M. F. (1993). Het Friese Front: hydrografie, geologie en biologie, met nadruk op zeevogels. Sula 7: 5-18. LOGERWELL, E.A. & HARGREAVES, B. (1996). The distribution of seabirds relative to their fish prey off Vancouver Islan: opposing results at
large and small scales. Fish. Oceanogr. 5: 163-175. MADGE, S.G. (1965). Little Gull associating with feeding Razorbills. Brit. Birds 58: 192. MAES, F., CLIQUET, A., SEYS, J., MEIRE, P. & OFFRINGA, H. (2000). Limited Atlas of the Belgian Part of the North Sea. Maritime Institute,
Institute of Nature Conservation, DWTC. NIHOUL, J.C.J. (1980). Residual circulation, long waves and mesoscale eddies in the North Sea. Oceanologica Acta 3: 309-316. NIHOUL, J.C.J. & RONDAY, F. (1976). Hydrodynamic models of the North Sea. Mémoires de la Société Royale des Sciences de Liège 10:
61-96. OFFRINGA, H., SEYS, J., VAN DEN BOSSCHE, W. & MEIRE, P. (1996). Seabirds on the Channel doormat. De Giervalk 86: 3-71. OSPAR COMMISSION (2000). Quality Status Report 2000, Region II – Greater North Sea. OSPAR Commission, London. 136 + xiii pp. OTTO, L., ZIMMERMAN, J.T.F., FURNES, G.K., MORK, M., SÆTRE, R. & BECKER, G. (1990). Review of the physical oceanography of the North
Sea. Neth. J. Sea R. 26: 161-238. PHILLIPS, R.A., PETERSEN, M.K., LILLIENDAHL, K., SOLMUNDSSON, J., HAMER, K.C., CAMPHUYSEN, C.J. & ZONFRILLO, B. (1999). Diet of the
northern fulmar Fulmarus glacialis: reliance on commercial fisheries? Marine Biology 135: 159-170. POCKLINGTON, R. (1979). An oceanographic interpretation of seabird distributions in the Indian Ocean. Marine Biology 51: 9-21. RIBIC, C.A. & AINLEY, D.G. (1997). The relationships of seabird assemblages to physical habitat features in Pacific equatorial waters
during spring 1984-1991. ICES J. mar. Sci. 54: 593-599. RIBIC, C.A., AINLEY, D.G. & SPEAR, L.B. (1997). Seabird associations in Pacific equatorial waters. Ibis 139: 482-487. SCHNEIDER, D.C. (1990). Seabirds and fronts: a brief overview. Polar Research 8: 17-21. SCOTT, R.E. (1972). Little Gulls associating with feeding Razorbills. Brit. Birds 65: 259. SEYS, J., MEIRE, P. & KUIJKEN, E. (submitted). Conservation value of the linear sand ridge complexes in the southernmost part of the
North Sea: focal seabird species and the designation of marine protected areas in Belgium. SEYS, J., OFFRINGA, H., VAN WAEYENBERGE, J., MEIRE, P. & KUIJKEN, E. (in press). Beached bird surveys in Belgium during 1962-1999: a
presentation of the data. Report Institute of Nature Conservation. SIMBERLOFF, D. (1998). Flagships, umbrellas, and keystones: is single-species management passé in the landscape era?
Biol. Conservation 83 (3): 247-257. SKOV, H. & DURINCK, J. (1995). Associations between the distribution of Fulmars Fulmarus glacialis, Little auks Alle alle and surface
hydrography in the North Sea. Limosa 68: 124. SKOV, H. & PRINS, E. (2001). Impact of estuarine fronts on the dispersal of piscivorous birds in the German Bight. Mar. Ecol. Progr. Ser.
214: 279-287. SKOV, H., DURINCK, J., LEOPOLD, M.F. & TASKER, M.L. (1995). Important bird areas for seabirds in the North Sea. Birdlife International,
Cambridge. SKOV, H., DURINCK, J. & ANDELL, P. (2000). Associations between wintering avian predators and schooling fish in the Skagerrak-Kattegat
suggest reliance on predictable aggregations of herring Clupea harengus. Journal of Avian Biology 31: 135-143. SPANOGHE, G. (1999). Aantallen en verspreiding, gedrag en habitatkeuze van meeuwen (Laridae) aan de Vlaamse kust in het
winterhalfjaar. Licentiaatsthesis Universiteit Gent, Gent. SPRINGER, A.M., PIATT, J.F., SHUNTOV, V.P., VAN VLIET, G.B., VLADIMIROV, V.L., KUZIN, A.E. & PERLOV, A.S. (1999). Marine birds and
mammals of the Pacific Subarctic Gyres. Progress in Oceanography 43: 443-487. STONE, C.J., WEBB, A., BARTON, C., RATCLIFFE, N., CAMPHUYSEN, C.J., REED, T.C., TASKER, M.L. & PIENKOWSKI, M.W. (1995). An atlas of
seabird distribution in North-west European waters. Joint Nature Conservation Committee, Peterborough. STOWE, T.J. (1982). Beached Bird Surveys and Surveillance of Cliff-breeding Seabirds. RSPB report to the NCC, Sandy. TASKER, M.L., JONES, P.H., DIXON, T.J. & BLAKE, B.F. (1984). Counting seabirds at sea from ships: a review of methods employed and a
suggestion for a standardized approach. Auk 101: 567-577. TASKER, M.L., JONES, P.H., BLAKE, B.F. & DIXON, T.J. (1985). Distribution and feeding habits of the Great Skua Catharacta skua in the
North Sea. Seabird 8: 34-43. TASKER, M.L. & REID, J.B. (1997). Seabirds in the Marine Environment: Introduction. ICES J. mar. Sci. 54: 505-506. TASKER, M.L., WEBB, A., HALL, A.J., PIENKOWSKI, M.W. & LANGSLOW, D.R. (1988). Seabirds in the North Sea. Final report of phase 2 of the
Nature Conservancy Council Seabirds at Sea Project November 1983 - October 1986. VISSER, M.P. (1969). The turbidity of the Southern North Sea. Dtsch. hydrogr. Z. 23: 97-117. WANLESS, S., BACON, P.J., HARRIS, M.P., WEBB, A.D., GREENSTREET, S.P.R. & WEBB, A. (1997). Modelling environmental and energetic
effects on feeding performances and distribution of shags (Phalocrocorax aristotelis): integrating telemetry, geographical information systems, and modelling techniques. ICES J. mar. Sci. 54: 524-544.


![Het gebruik van DNA-onderzoek in strafzaken [Belgian Law]](https://img.pdfslide.net/doc/110x75/631c33cbd5372c006e04526d/het-gebruik-van-dna-onderzoek-in-strafzaken-belgian-law.jpg)


