Embed Size (px)
Citation preview
Distributions of observed death tolls governsensitivity to human fatalitiesChristopher Y. Olivolaa,b,1 and Namika Sagarac,d,e
aDepartment of Cognitive, Perceptual, and Brain Sciences, University College London, London WC1H 0AP, United Kingdom; bEconomic and Social ResearchCouncil, Centre for Economic Learning and Social Evolution, London WC1H 0AN, United Kingdom; cLundquist College of Business and dDepartment ofPsychology, University of Oregon, Eugene, OR 97403; and eDecision Research, Eugene, OR 97401
Edited by Dale Purves, Duke University Medical Center, Durham, NC, and approved October 28, 2009 (received for review August 7, 2009)
How we react to humanitarian crises, epidemics, and other tragicevents involving the loss of human lives depends largely on theextent to which we are moved by the size of their associated deathtolls. Many studies have demonstrated that people generallyexhibit a diminishing sensitivity to the number of human fatalitiesand, equivalently, a preference for risky (vs. sure) alternatives indecisions under risk involving human losses. However, the reasonfor this tendency remains unknown. Here we show that thedistributions of event-related death tolls that people observegovern their evaluations of, and risk preferences concerning,human fatalities. In particular, we show that our diminishingsensitivity to human fatalities follows from the fact that thesedeath tolls are approximately power-law distributed. We furthershow that, by manipulating the distribution of mortality-relatedevents that people observe, we can alter their risk preferences indecisions involving fatalities. Finally, we show that the tendency tobe risk-seeking in mortality-related decisions is lower in countriesin which high-mortality events are more frequently observed. Ourresults support a model of magnitude evaluation based on memorysampling and relative judgment. This model departs from theutility-based approaches typically encountered in psychology andeconomics in that it does not rely on stable, underlying valuerepresentations to explain valuation and choice, or on choicebehavior to derive value functions. Instead, preferences concern-ing human fatalities emerge spontaneously from the distributionsof sampled events and the relative nature of the evaluationprocess.
decision-making � psychophysics � risk preferences � value of humanlives � decision by sampling
Every year, millions of human lives are lost to accidents,disasters, armed conflicts, and other deadly causes. Our
reactions to these tragic events—including our willingness toprovide aid and demand that our governments intervene—depend largely on the extent to which we are moved by the sizeof their associated death tolls (1). Research in psychology (1–4)and economics (5–7) has demonstrated that people tend to showa diminishing sensitivity to the number of human fatalities and,equivalently, a preference for risky (vs. sure) alternatives indecisions under risk involving human losses. As a result, policymakers charged with responding to humanitarian crises orpreventing unnecessary deaths may inadvertently fail to maxi-mize the number of lives saved (1). Although well documented,and despite its grave implications, the reason for this tendencyis not well understood.
The standard way of explaining valuation and choice, even forhuman fatalities, has been to assume the existence of underlyingutility functions (i.e., stable representations of value) that driveobserved preferences (8). Although utility-based approacheshave provided important constraints on the set of possibletheories that can describe people’s preferences, they are none-theless limited in several ways. Most importantly, utility func-tions do not really explain preferences but merely redescribethem in mathematical terms (unless one assumes that such
functions are directly represented in our mental architecture,which seems computationally implausible). Our understandingof valuation and choice concerning human fatalities wouldtherefore greatly benefit from a process-level theory, whichmoves past the limitations of utility-based theories while stillbeing able to accurately predict people’s preferences.
In this article, we provide such an account and report empir-ical evidence to support it. Our account capitalizes on parallelsbetween perception and decision-making (2, 9, 10). In particular,sensitivity to changes in a perceptual stimulus (e.g., brightness)or decision outcome (e.g., wealth) generally diminishes as thestimulus’s initial magnitude increases (2, 9). This diminishingsensitivity implies that, in perception and decision-making alike,the relationship between objective magnitude and subjectiveevaluation is often a concave function that is monotonicallyincreasing but marginally decreasing. As we noted earlier, anumber of studies have shown that this psychophysical relation-ship even extends to evaluations of human fatalities: as an event’sdeath toll increases, our sensitivity to the loss of life decreases,so that each additional death has a diminishing affective impact(1, 3, 4). Other studies have shown a general preference for riskyalternatives in decisions under risk involving human losses (2),which also implies a concave disutility function for humanfatalities (2, 8, 9).
Model Description. The model we describe builds on a recentlydeveloped theoretical framework (11–13) that uses fundamentalpsychological principles to explain how we evaluate relativelyabstract magnitudes such as money (11, 12), time (11), proba-bility (11, 12), color (14), and luminance (15). According to thisframework, the evaluation process is governed by a few simplecognitive operations (11, 12): To evaluate the death toll associ-ated with a specific target event (or ‘‘event-associated death-toll’’; EADT), people first draw upon a sample of comparableevents from their memory. Specifically, they sample from amixture of previously observed events (i.e., long-term memorysampling) and events in their recent or immediate context (i.e.,short-term memory or working memory sampling) to obtain aset of comparison death tolls. Then they compare the targetEADT with all those in the sampled set. For example, a personmight compare a target EADT with other EADTs that he or shehas recently learned about from watching the news, reading anewspaper, or conversing with family, friends, or colleagues. Thedisutility or ‘‘shock’’ associated with a target EADT is simply theproportion of pair-wise comparisons in which it dominates orties, which is its percentile rank among the sampled events (i.e.,the proportion of sampled EADTs that are smaller than or equal
Author contributions: C.Y.O. designed research; C.Y.O. and N.S. performed research; C.Y.O.analyzed data; and C.Y.O. wrote the paper.
The authors declare no conflict of interest.
This article is a PNAS Direct Submission.
1To whom correspondence should be addressed. Email: [email protected].
This article contains supporting information online at www.pnas.org/cgi/content/full/0908980106/DCSupplemental.
www.pnas.org�cgi�doi�10.1073�pnas.0908980106 PNAS � December 29, 2009 � vol. 106 � no. 52 � 22151–22156
PSYC
HO
LOG
ICA
LA
ND
COG
NIT
IVE
SCIE
NCE
S
to the target). (A formal description of the model is provided inthe SI Text.) Thus, a target EADT is considered large if it ranksabove most sampled EADTs (and small if it ranks below most ofthem) regardless of its absolute magnitude. The sampling pro-cess is psychologically plausible given evidence that humans andother animals efficiently encode and recall frequencies (16). Andthe relative nature of the evaluation process is supported byextensive evidence that people are much better able to providerelative, rather than absolute, judgments (17, 18). For ourcurrent purposes, this model can remain agnostic about whetherthe memory sampling and pair-wise comparison operations arefast, unconscious, and automatic or slow, conscious, and delib-erate processes (future research will be needed to answer thisquestion). For simplicity, we start by assuming that the samplingprocess is uniformly random, so that every EADT in memory isequally likely to be selected for comparison.
This model implies that the disutility associated with a targetEADT will be determined by the distribution of comparisonEADTs from which a person can draw, which will be a functionof his or her accumulated experiences and the recent or imme-diate context surrounding the evaluation. This allows the modelto parsimoniously explain individual and contextual differencesin reactions to human fatalities. Specifically, as an EADT’sdisutility is equal to the probability that it is larger than or equalto another randomly sampled EADT, the psychophysical (ordisutility) function relating human fatalities to their associatedshock values is equivalent to the cumulative probability distri-bution of EADTs that one has observed (see SI Text). Andbecause risk preferences follow from these disutility functions (2,8, 9, 19) (see SI Text), the model should be able to predictpeople’s choices in decisions under risk involving human losses,
as long as the distribution of sampled EADTs is approximatelyknown.
This led us to make three predictions. First, diminishingsensitivity to human fatalities and risk-seeking preferences in thedomain of human losses should be reflected in the distributionof EADTs that people generally observe. Specifically, for themodel to explain existing results, the cumulative probabilitydistribution of observed EADTs must be concave. In addition,the model makes two unique predictions: (i) that altering thedistribution of observed EADTs will lead to predictable changesin people’s risk-preferences and (ii) that risk preferences willvary between countries with different EADT distributions. Wetested these predictions in three separate studies.
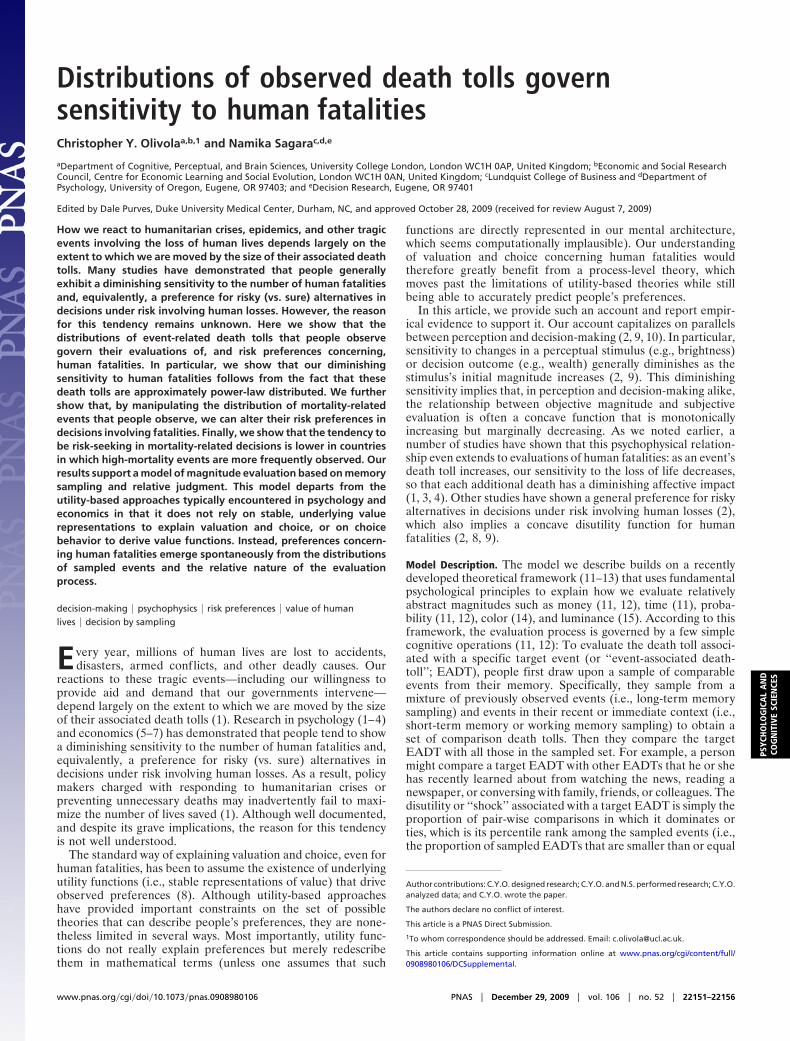
Study 1. First, we hypothesized that the cumulative probabilitydistribution of EADTs that people typically observe is concave.To test this prediction, we analyzed data from three sources: (i)a global survey of disasters and their associated death tolls (Study1A), (ii) a measure of the frequency with which EADTs arementioned in the media (Study 1B), and (iii) the examplesprovided by a sample of respondents who were asked to recallEADTs from memory (Study 1C). This first prediction is wellsupported: all three cumulative probability distributions aremonotonically increasing and marginally decreasing (Fig. 1A–C). This concavity is a direct result of the fact that EADTfrequencies are reasonably well approximated by a power-lawdistribution (Fig. 1 A–C). Power-laws are characterized by anumber of interesting properties, such as scale invariance (20,21), and may provide important clues about the underlyinggeneration process (22, 23). With regard to the psychophysics ofhuman life valuation, they have one particularly useful property:integrating over them yields cumulative probability functions
Fig. 1. Log-log plots of EADT frequency distributions (Top) and their corresponding cumulative probability distributions shown up to 100 deaths (Bottom). Solidlines (Top) are best-fitting power-functions of the frequency data, with the associated power parameter estimate (�) and model fit (R2) displayed (Top Right).(A) Fatalities from natural and industrial disasters occurring in 2003 through 2007. The power-law function is fitted to events involving 10 or more deaths (dots)because frequencies are underestimated for events involving fewer than 10 deaths (triangles; see SI Text). The cumulative probability distribution plot is basedon all of the data (triangles and dots). (B) Media attention (in 2000–2007) to mortality-related events. The power-law function is fitted to events involving twoor more deaths (dots) because media attention to events involving a single death (triangle) is likely underestimated (see SI Text). The cumulative probabilitydistribution plot is based on all the data (triangle and dots), as well as estimated frequencies for events involving more than 1,000 deaths (see SI Text). (C) Meanrecalled EADTs occurring in a person’s lifetime. Mean frequencies and mean percentile-ranks were obtained by repeatedly and randomly sampling the eventsthat respondents recalled (see SI Text).
22152 � www.pnas.org�cgi�doi�10.1073�pnas.0908980106 Olivola and Sagara
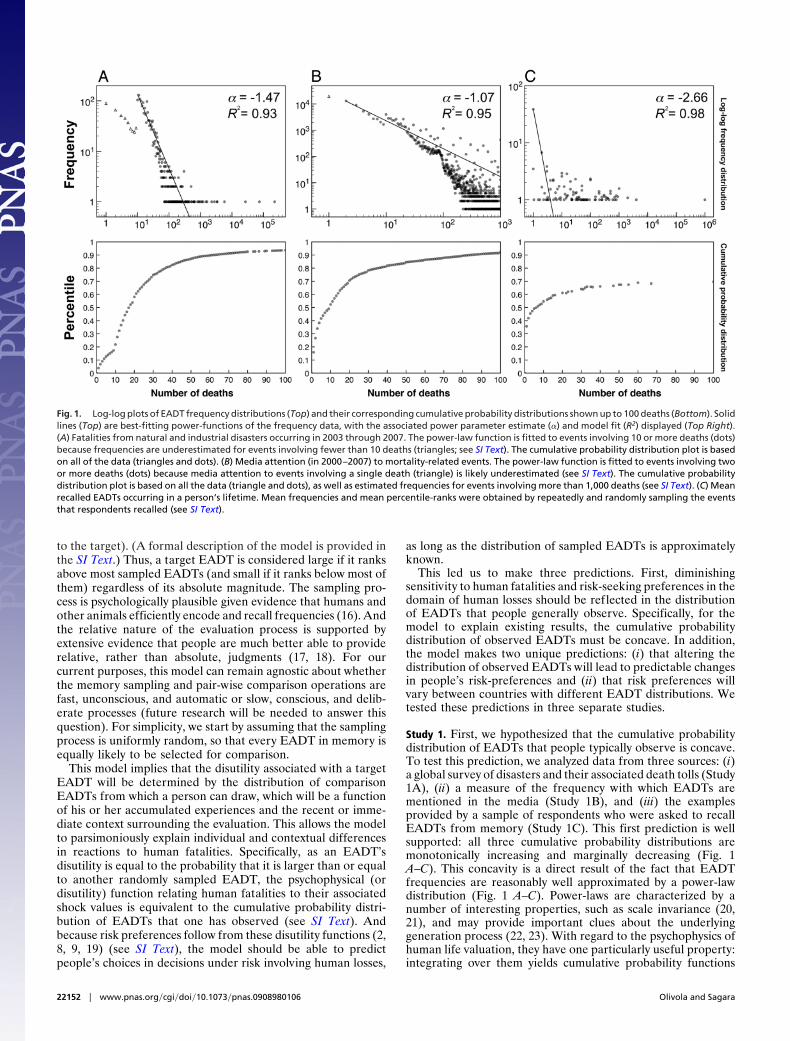
that are equivalent to the constant relative risk aversion (CRRA)utility functions often used in economics to describe preferences(19, 24) (see SI Text). In fact, one result of the model we describeis that the best-fitting power-law parameter provides a reason-ably good measure of disutility curvature, which quantifies boththe rate at which sensitivity to human life decreases and theresulting level of risk preference (see SI Text). The best fittingestimate of the power-law parameter for each dataset is negative(Fig. 1 A–C) and therefore implies a concave disutility functionand a preference for risky alternatives (see SI Text). Further-more, an examination of media attention to the number ofhuman lives that are saved (rather than lost) reveals that thecumulative distribution of human ‘‘gains’’ is also concave but lesssteep than the cumulative distribution of lives lost (Fig. 2). Wewould therefore predict that the utility associated with livessaved is concave, leading to risk-averse choices (2, 9), and that
human losses receive more weight than equivalent gains (9). Infact, both predictions are empirically supported (2, 25, 26).
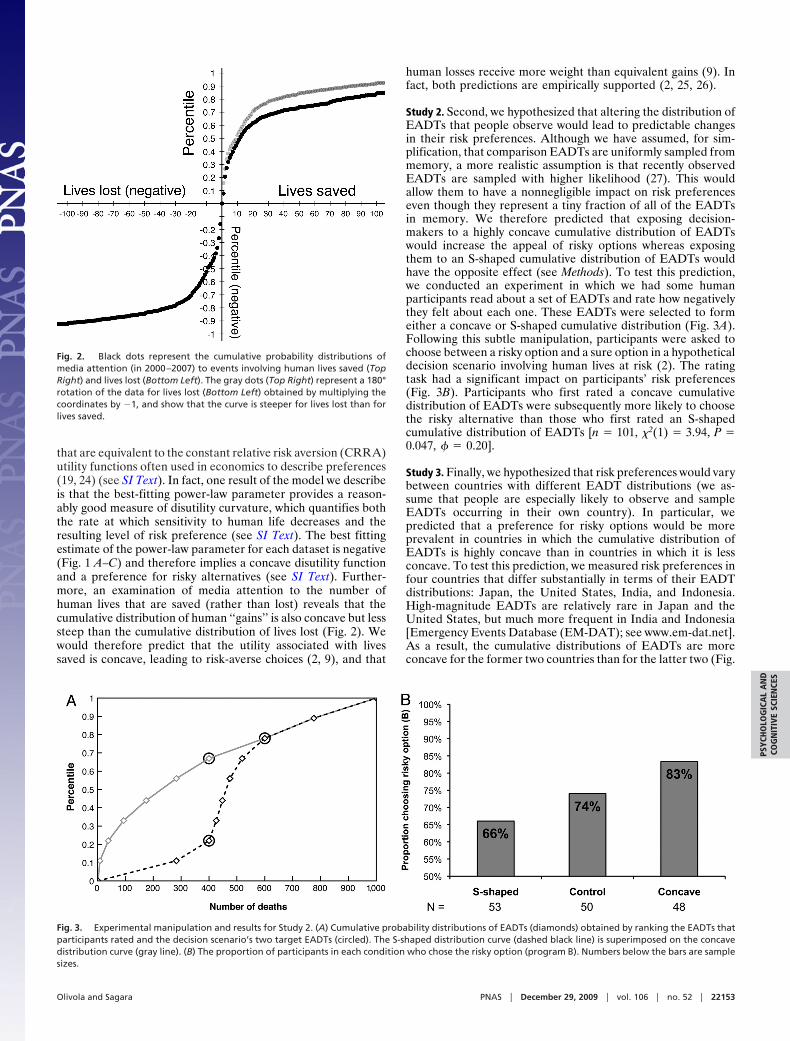
Study 2. Second, we hypothesized that altering the distribution ofEADTs that people observe would lead to predictable changesin their risk preferences. Although we have assumed, for sim-plification, that comparison EADTs are uniformly sampled frommemory, a more realistic assumption is that recently observedEADTs are sampled with higher likelihood (27). This wouldallow them to have a nonnegligible impact on risk preferenceseven though they represent a tiny fraction of all of the EADTsin memory. We therefore predicted that exposing decision-makers to a highly concave cumulative distribution of EADTswould increase the appeal of risky options whereas exposingthem to an S-shaped cumulative distribution of EADTs wouldhave the opposite effect (see Methods). To test this prediction,we conducted an experiment in which we had some humanparticipants read about a set of EADTs and rate how negativelythey felt about each one. These EADTs were selected to formeither a concave or S-shaped cumulative distribution (Fig. 3A).Following this subtle manipulation, participants were asked tochoose between a risky option and a sure option in a hypotheticaldecision scenario involving human lives at risk (2). The ratingtask had a significant impact on participants’ risk preferences(Fig. 3B). Participants who first rated a concave cumulativedistribution of EADTs were subsequently more likely to choosethe risky alternative than those who first rated an S-shapedcumulative distribution of EADTs [n � 101, �2(1) � 3.94, P �0.047, � � 0.20].
Study 3. Finally, we hypothesized that risk preferences would varybetween countries with different EADT distributions (we as-sume that people are especially likely to observe and sampleEADTs occurring in their own country). In particular, wepredicted that a preference for risky options would be moreprevalent in countries in which the cumulative distribution ofEADTs is highly concave than in countries in which it is lessconcave. To test this prediction, we measured risk preferences infour countries that differ substantially in terms of their EADTdistributions: Japan, the United States, India, and Indonesia.High-magnitude EADTs are relatively rare in Japan and theUnited States, but much more frequent in India and Indonesia[Emergency Events Database (EM-DAT); see www.em-dat.net].As a result, the cumulative distributions of EADTs are moreconcave for the former two countries than for the latter two (Fig.
Fig. 2. Black dots represent the cumulative probability distributions ofmedia attention (in 2000–2007) to events involving human lives saved (TopRight) and lives lost (Bottom Left). The gray dots (Top Right) represent a 180°rotation of the data for lives lost (Bottom Left) obtained by multiplying thecoordinates by �1, and show that the curve is steeper for lives lost than forlives saved.
Fig. 3. Experimental manipulation and results for Study 2. (A) Cumulative probability distributions of EADTs (diamonds) obtained by ranking the EADTs thatparticipants rated and the decision scenario’s two target EADTs (circled). The S-shaped distribution curve (dashed black line) is superimposed on the concavedistribution curve (gray line). (B) The proportion of participants in each condition who chose the risky option (program B). Numbers below the bars are samplesizes.
Olivola and Sagara PNAS � December 29, 2009 � vol. 106 � no. 52 � 22153
PSYC
HO
LOG
ICA
LA
ND
COG
NIT
IVE
SCIE
NCE
S
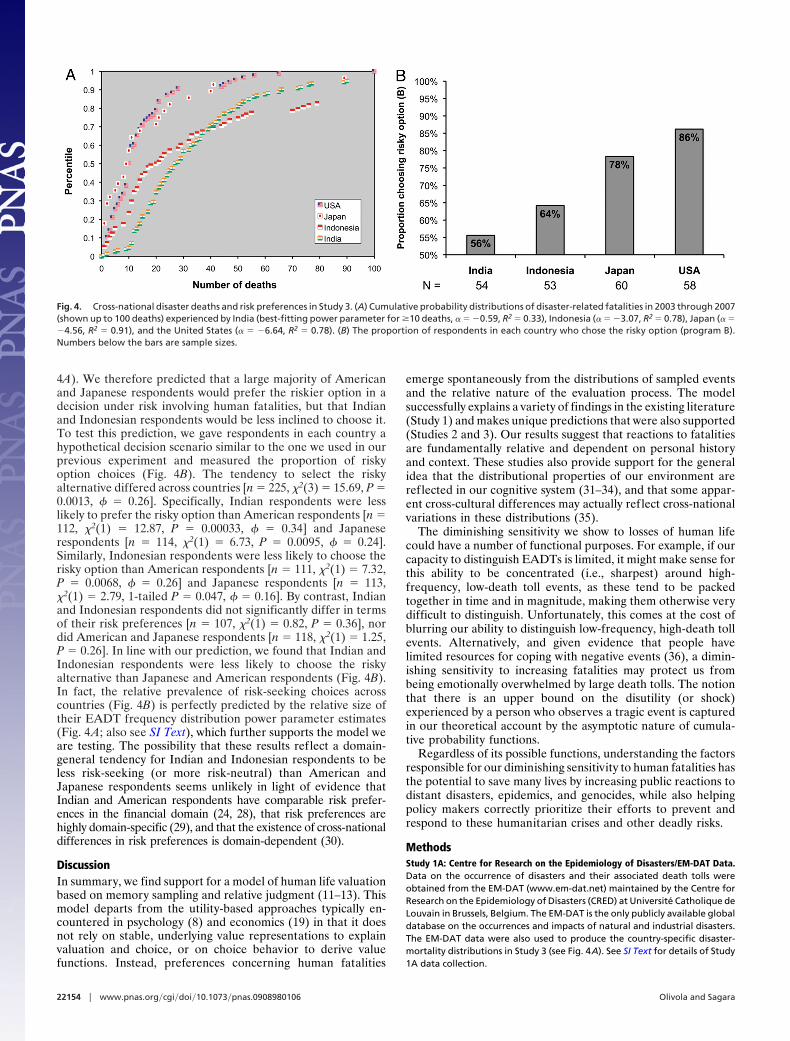
4A). We therefore predicted that a large majority of Americanand Japanese respondents would prefer the riskier option in adecision under risk involving human fatalities, but that Indianand Indonesian respondents would be less inclined to choose it.To test this prediction, we gave respondents in each country ahypothetical decision scenario similar to the one we used in ourprevious experiment and measured the proportion of riskyoption choices (Fig. 4B). The tendency to select the riskyalternative differed across countries [n � 225, �2(3) � 15.69, P �0.0013, � � 0.26]. Specifically, Indian respondents were lesslikely to prefer the risky option than American respondents [n �112, �2(1) � 12.87, P � 0.00033, � � 0.34] and Japaneserespondents [n � 114, �2(1) � 6.73, P � 0.0095, � � 0.24].Similarly, Indonesian respondents were less likely to choose therisky option than American respondents [n � 111, �2(1) � 7.32,P � 0.0068, � � 0.26] and Japanese respondents [n � 113,�2(1) � 2.79, 1-tailed P � 0.047, � � 0.16]. By contrast, Indianand Indonesian respondents did not significantly differ in termsof their risk preferences [n � 107, �2(1) � 0.82, P � 0.36], nordid American and Japanese respondents [n � 118, �2(1) � 1.25,P � 0.26]. In line with our prediction, we found that Indian andIndonesian respondents were less likely to choose the riskyalternative than Japanese and American respondents (Fig. 4B).In fact, the relative prevalence of risk-seeking choices acrosscountries (Fig. 4B) is perfectly predicted by the relative size oftheir EADT frequency distribution power parameter estimates(Fig. 4A; also see SI Text), which further supports the model weare testing. The possibility that these results reflect a domain-general tendency for Indian and Indonesian respondents to beless risk-seeking (or more risk-neutral) than American andJapanese respondents seems unlikely in light of evidence thatIndian and American respondents have comparable risk prefer-ences in the financial domain (24, 28), that risk preferences arehighly domain-specific (29), and that the existence of cross-nationaldifferences in risk preferences is domain-dependent (30).
DiscussionIn summary, we find support for a model of human life valuationbased on memory sampling and relative judgment (11–13). Thismodel departs from the utility-based approaches typically en-countered in psychology (8) and economics (19) in that it doesnot rely on stable, underlying value representations to explainvaluation and choice, or on choice behavior to derive valuefunctions. Instead, preferences concerning human fatalities
emerge spontaneously from the distributions of sampled eventsand the relative nature of the evaluation process. The modelsuccessfully explains a variety of findings in the existing literature(Study 1) and makes unique predictions that were also supported(Studies 2 and 3). Our results suggest that reactions to fatalitiesare fundamentally relative and dependent on personal historyand context. These studies also provide support for the generalidea that the distributional properties of our environment arereflected in our cognitive system (31–34), and that some appar-ent cross-cultural differences may actually reflect cross-nationalvariations in these distributions (35).
The diminishing sensitivity we show to losses of human lifecould have a number of functional purposes. For example, if ourcapacity to distinguish EADTs is limited, it might make sense forthis ability to be concentrated (i.e., sharpest) around high-frequency, low-death toll events, as these tend to be packedtogether in time and in magnitude, making them otherwise verydifficult to distinguish. Unfortunately, this comes at the cost ofblurring our ability to distinguish low-frequency, high-death tollevents. Alternatively, and given evidence that people havelimited resources for coping with negative events (36), a dimin-ishing sensitivity to increasing fatalities may protect us frombeing emotionally overwhelmed by large death tolls. The notionthat there is an upper bound on the disutility (or shock)experienced by a person who observes a tragic event is capturedin our theoretical account by the asymptotic nature of cumula-tive probability functions.
Regardless of its possible functions, understanding the factorsresponsible for our diminishing sensitivity to human fatalities hasthe potential to save many lives by increasing public reactions todistant disasters, epidemics, and genocides, while also helpingpolicy makers correctly prioritize their efforts to prevent andrespond to these humanitarian crises and other deadly risks.
MethodsStudy 1A: Centre for Research on the Epidemiology of Disasters/EM-DAT Data.Data on the occurrence of disasters and their associated death tolls wereobtained from the EM-DAT (www.em-dat.net) maintained by the Centre forResearch on the Epidemiology of Disasters (CRED) at Universite Catholique deLouvain in Brussels, Belgium. The EM-DAT is the only publicly available globaldatabase on the occurrences and impacts of natural and industrial disasters.The EM-DAT data were also used to produce the country-specific disaster-mortality distributions in Study 3 (see Fig. 4A). See SI Text for details of Study1A data collection.
Fig. 4. Cross-national disaster deaths and risk preferences in Study 3. (A) Cumulative probability distributions of disaster-related fatalities in 2003 through 2007(shown up to 100 deaths) experienced by India (best-fitting power parameter for �10 deaths, � � �0.59, R2 � 0.33), Indonesia (� � �3.07, R2 � 0.78), Japan (� ��4.56, R2 � 0.91), and the United States (� � �6.64, R2 � 0.78). (B) The proportion of respondents in each country who chose the risky option (program B).Numbers below the bars are sample sizes.
22154 � www.pnas.org�cgi�doi�10.1073�pnas.0908980106 Olivola and Sagara
Study 1B: Google News Archive Data. Data on media attention to eventsinvolving human deaths (i.e., EADTs) were obtained by iterative search of theGoogle News Archives (GNA; see http://news.google.com/archivesearch) fornews articles whose titles contained keywords related to losses (e.g., ‘‘10people died’’) or ‘‘gains’’ (e.g., ‘‘10 people survived’’) in human lives. For eachsearch, the number of relevant articles returned (i.e., the number of ‘‘hits’’)was recorded, thus providing a measure of the total media attention allocatedto events associated with a given loss (or gain) in human lives. See SI Text fordetails of Study 1B data collection.
Study 1C: Recalled EADTs. Data on recalled EADTs were obtained by adminis-tering a survey that asked respondents to recall events involving humandeaths. We then repeatedly sampled these events to estimate the averagefrequency and cumulative probability distribution of recalled EADTs. See SIText for details of Study 1C data collection.
This study and all future studies reported in this paper were approved byPrinceton University’s Institutional Review Panel for Human Subjects and/orthe University of Oregon’s Office for Protection of Human Subjects (in Study3, we also obtained approval from the overseas institutions where we admin-istered surveys). Written or oral consent was also obtained from all ourparticipants.
Study 2: Experimental Manipulation of Observed EADTs. Participants were 157adults (56% female; age range, 18–77 y) recruited from a large shopping mallin the northeastern United States, who were paid for their participation.
The entire experiment was conducted using a paper questionnaire thatparticipants read and completed on their own. The questionnaire’s cover pagecontained written instructions and the final page asked participants to reportvarious demographic characteristics. The manipulation and the decision sce-nario were presented on separate pages (with the former directly precedingthe latter).
To manipulate the distribution of comparison EADTs from which theywould sample, participants were alternately assigned to one of three condi-tions (concave distribution, S-shaped distribution, and control). Participants inthe two treatment groups were first presented with eight randomly orderedsingle-sentence descriptions of disasters and accidents whose death tollsranged from two to 1,000 (see Table S2). The top of the page containing themanipulation explained that these events represented a random sample of allof the natural and industrial disasters that had occurred in the past year (inreality, these events were all fictional). Participants were instructed to firstread all the event descriptions carefully, and then to indicate how each eventmade them feel, using a 10-point rating scale that ranged from ‘‘neutral’’ to‘‘very negative.’’ The purpose of this exercise was to provide a subtle channelthrough which participants would encode these EADTs. The two distributionsof EADTs were selected so that, if sampled, they would either increase ordecrease the distance (relative to baseline), in percentile-ranks, between thetwo key magnitudes that participants had to evaluate in the subsequentdecision scenario (400 deaths and 600 deaths; as discussed later).
Participants in the concave distribution condition were presented witheight EADTs that, if used as comparison magnitudes, would decrease thedistance between the percentile-ranks of the two options presented in thesubsequent decision scenario, thereby making the risky option more appeal-ing (according to the model we are testing). Specifically, these EADTs were allselected to be either less than 400 or greater than 600, thus reducing thedifference in ranks between the two target EADTs (Fig. 3A). Participants in theS-shaped distribution condition were presented with eight EADTs that, if usedas comparison magnitudes, would increase the distance between the percen-tile-ranks of the two options presented in the subsequent decision scenario,thereby reducing the appeal of the risky option (according to the model weare testing). Specifically, these EADTs were selected so that many of them fellbetween 400 and 600, thus increasing the difference in ranks between the twotarget EADTs (Fig. 3A).
Following this manipulation, participants in both treatment conditionsadvanced to the decision scenario, which was presented on the next page ofthe questionnaire. To establish a baseline, a third, control group of partici-pants was not exposed to either distribution manipulation and instead ad-vanced directly to the decision scenario.
The decision scenario used to measure risk preferences was a modificationof the ‘‘loss frame’’ version of the ‘‘Asian disease’’ problem (2, 8), which asksrespondents to imagine a choice between two programs for combating theoutbreak of a disease that is expected to kill 600 people. One program (thesure option) leads to 400 deaths with certainty, whereas the other (the riskyoption) offers a one-third chance that no one will die, but a two-thirds chancethat all 600 will die. Our scenario referred to a real disease (the West Nile virus)rather than an imaginary ‘‘Asian disease,’’ but this was the only notable
modification. One respondent did not provide a response to the diseasescenario and was therefore excluded from the analysis. We also excluded datafrom five respondents who recognized the disease scenario (all five wereuniversity students). The exact scenario is presented in Fig. S1.
Although both programs have the same expected value (both lead to 400deaths, on average), previous research (2) found that the majority (78%) ofrespondents preferred the risky option when these choices were framed interms of lives lost, implying a diminishing sensitivity (i.e., marginally dimin-ishing disutility) for the loss of human lives (a result that we replicated with ourcontrol group; see Fig. 3B). In particular, people seem to perceive the disutilityassociated with a sure loss of 400 lives to be greater than the expecteddisutility associated with a two-thirds probability of 600 deaths. In otherwords, for most respondents, the subjective shock produced by the knowl-edge that 400 people will die (or have died) seems to be greater than twothirds of the subjective shock associated with 600 deaths.
However, we expected that the share of respondents preferring the riskyoption in this scenario would decrease as the subjective distance (in terms ofpsychological shock) between 400 deaths and 600 deaths increased. Similarly,the share of respondents preferring the risky option was expected to increaseas this subjective distance decreased. According to the model we are testing,participants assigned to the concave distribution condition would thereforebe more likely to choose the risky alternative than participants assigned to theS-shaped distribution condition, which is what we found (Fig. 3B).
We should note that, strictly speaking, our manipulation varied not onlythe relative ranks of the target EADTs within the distributions that partici-pants were exposed to, but also the means of these distributions. One mighttherefore attribute our results to a difference in means rather than ranks. Thisalternative explanation, however, is unlikely for at least three reasons. First, itseems implausible that participants calculated the means of these EADTdistributions, let alone used this information to inform their subsequentchoices. Second, research shows that rank-based accounts are better able toexplain the effects of observed distributions on people’s attitudes and pref-erences compared with mean-based accounts (37). Finally, an account basedon differences between means fails to explain the results of Study 3 as, forexample, Indonesia experienced a much higher mean EADT (1,813 deaths, onaverage, between 2003 and 2007) than the other three countries (includingIndia, which was second with an average of 153 deaths), yet Indonesianrespondents were neither the least, nor the most, likely to choose the riskyalternative.
Study 3: Cross-National Differences in Risk-Preferences. Data on EADT frequen-cies in each country were obtained from the EM-DAT (www.em-dat.net), asdescribed earlier (Study 1A in Methods). Responses to the risky-decisionscenario were collected from 249 university students in four countries. TheIndian sample consisted of students at the University of Delhi (n � 60; 55%female). The Indonesian sample consisted of students at Pelita HarapanUniversity and Ciputra University (n � 56; 73% female). The Japanese sampleconsisted of students at Rissyo University (n � 62; 65% female). The Americansample consisted of students at the University of Oregon (n � 71; 61% female).
The procedure was similar across countries: paper questionnaires contain-ing the decision scenario were administered to respondents who were re-cruited in their classrooms (some American respondents instead completed aWeb-based version of the questionnaire in exchange for course credit). Thequestionnaire’s cover page contained written instructions and the final pageasked participants to report various demographic characteristics, includingwhether they had lived their entire life in the country where they wererecruited. Those respondents who reported having lived outside the countryin which the data were collected (n � 24) were excluded from the analysis.
The decision scenario was similar to the one used in Study 2 except for threemodifications: First, the disease in question was not a specific epidemic butwas simply described as ‘‘an unusual disease.’’ Second, the disease was spe-cifically described as affecting the country in which the data were collected(this was the only feature that differed across countries). Third, the outbreakin the scenario was expected to kill 40 people, and the sure option led to 20deaths with certainty whereas the risky option offered a 50% probability thatall 40 would die and a 50% chance that none would die. These numbers werechosen because they represented values for which the four countries differedstrongly in terms of EADT percentile-ranks (Fig. 4A) and because a 50%probability is easier to understand and compute than the one-third andtwo-thirds probabilities used in the original scenario. A 50% probability can,for example, be conceptualized as equivalent to flipping a fair coin to deter-mine the outcome of the risky option. As before, the expected value, in termsof lives lost, was the same for both programs (20 deaths on average). English,Indonesian, and Japanese versions of the scenario are presented in Figs. S2–S4.
Olivola and Sagara PNAS � December 29, 2009 � vol. 106 � no. 52 � 22155
PSYC
HO
LOG
ICA
LA
ND
COG
NIT
IVE
SCIE
NCE
S
The survey was written in English for the American and Indian samples andtranslated for the Japanese and Indonesian samples. Two steps were taken toensure that translations were as similar as possible in terms of the informationconveyed: First, the survey was translated into Japanese and Indonesian byone pair of translators, then back-translated into English by a separate pair oftranslators. This was done to identify any meaningful distortions produced bythe translation process. In addition, the three versions (English, Japanese, andIndonesian) of the survey were iteratively modified to accommodate eachlanguage’s unique constraints until they converged on a shared meaning.These steps were repeated until we were satisfied that the three versions wereas semantically similar as possible, and that they properly communicated thescenario.
ACKNOWLEDGMENTS. We thank N. Chater, Y.C. Lim, D.M. Oppenheimer, D.Purves, P. Slovic, A.B. Sussman, and two anonymous reviewers for helpfulsuggestions; C. Hsu and N. Oosterhof for help with GNA searches; B. Barooah,M. Das, A. Deshpande, N. Gupta, M. Jain, J.V. Meenakshi, A. Nath, R. Ray, andthe University of Delhi for help with data collection in India; S. Budiyuwono,D.K. Halim, I. Kurniawan, J.E. Kurniawan, J.L. Setiawan, K. Tanjung, Universi-tas Ciputra, and Universitas Pelita Harapan for help with data collection inIndonesia; S. Matsubara and Rissyo University for help with data collection inJapan; and J. Harris, H. Ishii, and J. Zemla for help with data collection in theUnited States. C.Y.O. was supported by funding from Princeton University’sGlobal Network on Inequality and a Princeton University Centre for HumanValues Laurance S. Rockefeller Graduate Prize Fellowship. N.S. was supportedby a Calvin Reed Smith Research Grant and a Merle King Smith Scholar Award.
1. Slovic P (2007) ‘‘If I look at the mass I will never act’’: Psychic numbing and genocide.Judgment Decis Making 2:79–95.
2. Tversky A, Kahneman D (1981) The framing of decisions and the psychology of choice.Science 211:453–458.
3. Fetherstonhaugh D, Slovic P, Johnson SM, Friedrich J (1997) Insensitivity to the value ofhuman life: A study of psychophysical numbing. J Risk Uncertain 14:283–300.
4. Friedrich J, et al. (1999) Psychophysical numbing: When lives are valued less as the livesat risk increase. J Consum Psychol 8:277–299.
5. de Blaeij A, Florax RJGM, Rietveld P, Verhoef E (2003) The value of statistical life in roadsafety: A meta-analysis. Accid Anal Prev 35:973–986.
6. Viscusi WK, Aldy JE (2003) The value of a statistical life: A critical review of marketestimates throughout the world. J Risk Uncertain 27:5–76.
7. Stromberg D (2007) Natural disasters, economic development, and humanitarian aid.J Econ Perspect 21:199–222.
8. Kahneman D, Tversky A (2000) Choices, Values and Frames (Cambridge Univ Press, NewYork).
9. Kahneman D, Tversky A (1979) Prospect theory: An analysis of decision under risk.Econometrica 47:263–291.
10. Galanter E (1962) The direct measurement of utility and subjective probability. Am JPsychol 75:208–220.
11. Stewart N, Chater N, Brown GDA (2006) Decision by sampling. Cogn Psychol 53:1–26.12. Stewart N (2009) Decision by sampling: The role of the decision environment in risky
choice. Q J Exp Psychol 62:1041–1062.13. Howe CQ, Lotto RB, Purves D (2006) Comparison of Bayesian and empirical ranking
approaches to visual perception. J Theory Biol 241:866–875.14. Long F, Yang Z, Purves D (2006) Spectral statistics in natural scenes predict hue,
saturation, and brightness. Proc Natl Acad Sci USA 103:6013–6018.15. Yang Z, Purves D (2004) The statistical structure of natural light patterns determines
perceived light intensity. Proc Natl Acad Sci USA 101:8745–8750.16. Sedlmeier P, Betsch T (2002) Etc. Frequency Processing and Cognition (Oxford Univ
Press, New York).17. Stewart N, Brown GDA, Chater N (2005) Absolute identification by relative judgment.
Psychol Rev 112:881–911.18. Stewart N, Chater N, Stott HP, Reimers S (2003) Prospect relativity: How choice options
influence decision under risk. J Exp Psychol Gen 132:23–46.19. Wakker PP (2008) Explaining the characteristics of the power (CRRA) utility family.
Health Econ 17:1329–1344.
20. Chater N, Brown GDA (1999) Scale-invariance as a unifying psychological principle.Cognition 69:B17–B24.
21. Enquist BJ, Niklas KJ (2001) Invariant scaling relations across tree-dominated commu-nities. Nature 401:655–660.
22. Chater N, Brown GDA (2008) From universal laws of cognition to specific cognitivemodels. Cognit Sci 32:36–67.
23. Reed WJ, Hughes BD (2002) From gene families and genera to incomes and internet filesizes: Why power laws are so common in nature. Phys Rev E 66:067103.
24. Holt CA, Laury SK (2002) Risk aversion and incentive effects. Am Econ Rev 92:1644–1655.
25. Guria J, Leung J, Jones-Lee M, Loomes G (2005) The willingness to accept value ofstatistical life relative to the willingness to pay value: Evidence and policy implications.Environ Resour Econ 32:113–127.
26. McDaniels TL (1992) Reference points, loss aversion, and contingent values for autosafety. J Risk Uncertain 5:187–200.
27. Greene RL (1986) Sources of recency effects in free recall. Psychol Bull 99:221–228.28. Binswanger HP (1980) Attitudes toward risk: Experimental measurement in rural India.
Am J Agricultural Econ 62:395–407.29. Blais AR, Weber EU (2006) A domain-specific risk-taking (DOSPERT) scale for adult
populations. Judgment Decis Making 1:33–47.30. Hsee CK, Weber EU (1999) Cross-national differences in risk preference and lay pre-
dictions. J Behav Decis Making 12:165–179.31. Shepard RN (2001) Perceptual-cognitive universals as reflections of the world. Behav
Brain Sci 24:581–601.32. Anderson JR (1990) The Adaptive Character of Thought (Lawrence Erlbaum Associates,
Hillsdale, NJ).33. Purves D, Lotto RB (2003) Why We See What We Do: An Empirical Theory of Vision
(Sinauer, Sunderland, MA).34. Howe CQ, Purves D (2005) Perceiving Geometry: Geometrical Illusions Explained by
Natural Scene Statistics (Springer, New York).35. Miyamoto Y, Nisbett RE, Masuda T (2006) Culture and the physical environment:
Holistic versus analytic perceptual affordances. Psychol Sci 17:113–119.36. Linville PW, Fischer GW (1991) Preferences for separating or combining events. J Pers
Soc Psychol 60:5–23.37. Brown GDA, Gardner J, Oswald AJ, Qian J (2008) Does wage rank affect employees’
well-being? Industrial Relations 47:355–389.
22156 � www.pnas.org�cgi�doi�10.1073�pnas.0908980106 Olivola and Sagara


