Embed Size (px)
Citation preview
Distributive h-Indices for Measuring Multilevel Impact
Star X. Zhao, Alice M. Tan, and Fred Y. YeDepartment of Information Resource Management, Zhejiang University, 38 Zheda Rd., Hangzhou, 310027China. E-mail: {starzhao, alicetan, yye}@zju.edu.cn
For measuring multilevel impact, we introduce the dis-tributive h-indices, which balance two important compo-nents (breadth and strength) of multilevel impact atvarious citing levels. After exploring the theoreticalproperties of these indices, we studied two cases: 57library and information science (LIS) journals and socialscience research in 38 European countries/territories.Results reveal that there are approximate power-lawrelations between distributive h-indices and someunderlying citation indicators, such as total citations,total citing entities, and the h-index. Distributiveh-indices provide comprehensive measures for multi-level impact, and lead to a potential tool for citationanalysis, particularly at aggregative levels.
Introduction
Taking into account different cited levels, such as author,journal, institution/university, and country/territory, there isa variety of citation indicators for measuring academicimpact, including total citation, average citation, h-index(Hirsch, 2005), and their improved variations, e.g., relativecitation (Moed, 2010; Moed, Debruin, & Van Leeuwen,1995; Waltman, van Eck, van Leeuwen, Visser, & van Raan,2011) and weighted citation (Gonzalez-Pereira, Guerrero-Bote, & Moya-Anegon, 2010; Leydesdorff & Bornmann,2011; West, Bergstrom, & Bergstrom, 2010). Most of theseindicators focus on the number of citations and the numberof publications. However, the number of citations for a spe-cific entity often comes from various citing sources. Forinstance, both Journal A and Journal B have 100 citationsfrom other journals, but Journal A is cited by five citingjournals and Journal B is cited by 30 citing journals, thus,the distribution of these two journals’ citing sources is sig-nificantly different. The phenomenon that cited entitiespossess the same number of citations and different distribu-tive citing sources occurs frequently in citation analysis.
Although the cited entities are abundant from micro levels(publication/author) to meso levels (journal/institution/university) to macro levels (country/territory etc.), the citing
entities are mostly limited to publications, i.e., an underlyinglevel. In most cases, when one refers to the number ofcitations of an entity, it generally means how many timesthis entity was cited by publications. As the methods ofcomplex networks and social networks have become usefultools in informetrics (Börner, Sanyal, & Vespignani, 2007;Otte & Rousseau, 2002), the actors or nodes in the citationnetwork have been varied. New types of citation networks,such as author citation networks (Ding, 2011) and journalcitation networks (Zhang, Glänzel, & Liang, 2009), indicatethat the impact has cross-level features. For example, whenJournal A is cited 100 times, the citing source of this journalis not only publications or journals, but also a variety ofentities (such as authors, research groups, institutions/universities, and countries/territories). Hence, a more com-prehensive view of multilevel impact of a certain cited entitycan be revealed by exploring the citations at various citinglevels.
In recent years, the h-index (Hirsch, 2005) has attractedmuch interest. Beyond the original author level, it is used inthe evaluation of other academic entities, e.g., journals(Braun, Glänzel, & Schubert, 2006), institutions (Prathap,2006), countries/territories (Csajbok, Berhidi, Vasas, &Schubert, 2007), and science funds (Zhao & Ye, 2011), aswell as other extensive objects, e.g., biodiversity (Rousseau,2009), network analysis (Schubert, 2012; Zhao, Rousseau, &Ye, 2011), and commercial funds (Bystrüm, 2011). Schubertintroduced successive h-indices, leading to an interestingh-index series at aggregation levels such as journal–publishing group–country and researcher–department–institution hierarchy (Arencibia-Jorge, Barrios-Almaguer,Fernandez-Hernandez, & Carvajal-Espino, 2008; Egghe,2008; Schubert, 2007). This indicates that the h-index can besimultaneously used at various cited levels.
No single citation measure is perfect, and the h-indexalso has limitations (Gianoli & Molina-Montenegro, 2009;Waltman & Van Eck, 2011; Zhivotovsky & Krutovsky,2008). However, the success of the h-index is largely due toits special features in citation analysis (Bornmann, 2011;Egghe, 2010; Ye, Tang, & Zhao, 2011), including the com-bination of publications and citations, robustness againstsmall errors, the simple algorithm and meaning, and theemphasis on key parts of a natural number ranking. These
Received December 27, 2011; revised February 22, 2012; accepted
February 22, 2012
© 2012 ASIS&T • Published online in Wiley Online Library(wileyonlinelibrary.com). DOI: 10.1002/asi.22682
JOURNAL OF THE AMERICAN SOCIETY FOR INFORMATION SCIENCE AND TECHNOLOGY, 63(10):2074–2086, 2012
advantages make the h-index a simple and effective methodfor balancing the item number and size, which can be usedto develop a method for measuring multilevel impact atvarious citing levels.
In this article, we introduce the distributive h-indices,which are designed to measure multilevel impact at variousaggregative citing levels. The work is organized as follows: theMethod section describes the definition, cases, and propertiesof the index set; two data sets are presented in the Data section,library and information science (LIS) journals and socialscience research in major European countries/territories, fol-lowed by an analysis of the data in the Results and Analysissection; and finally the Discussion and Conclusion sectiondiscusses the features and limitations of distributive h-indicesand possible future research directions.
Method
Definition of Distributive h-Indices
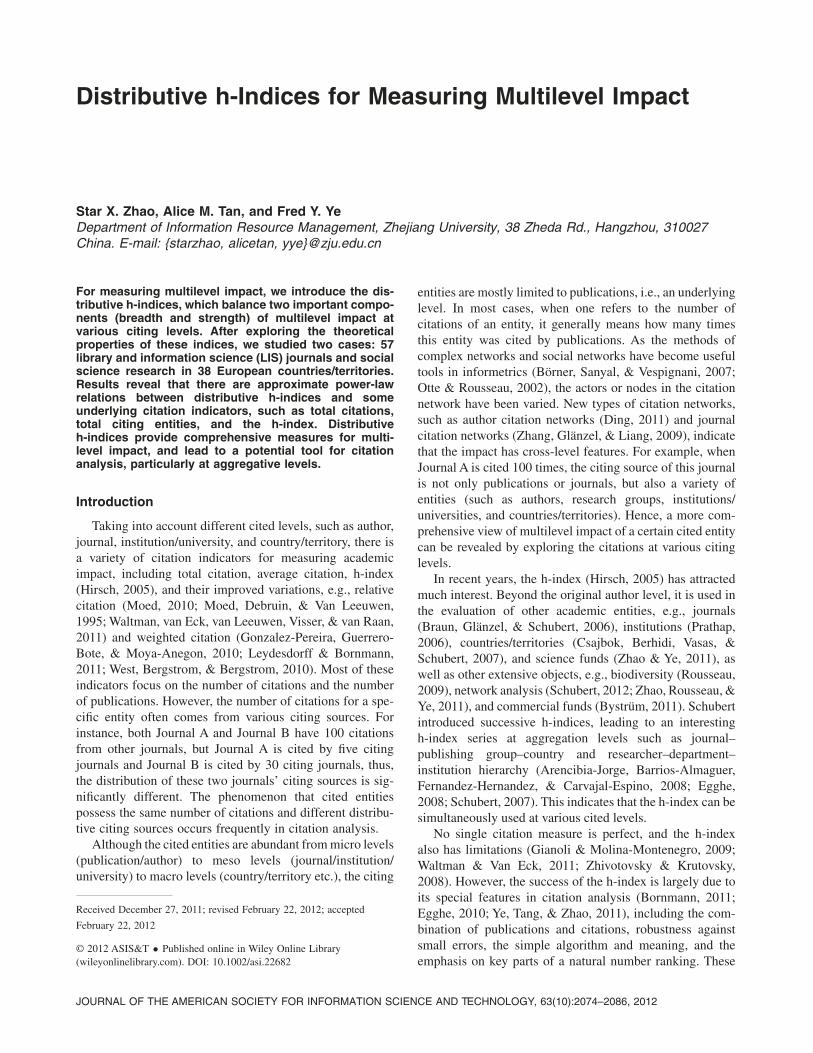
In citation analysis, the cited entities usually come fromvarious cited levels. In view of the multilevel impact of acited entity, various citing levels can also be taken intoconsideration, as shown in Figure 1.
For measuring the multilevel impact on various citinglevels, the distributive h-index of an entity (hd) at a givencited level can be defined as follows:
The distributive h-index of a cited entity at cited level xand citing level y is equal to hd
xy, if hdxy is the largest natural
number such that this cited entity has at least hdxy citing enti-
ties at a citing level y each with number of citations at leastequal to hd
xy.
Distributive h-indices are actually a set of h-indiceson different cited and citing levels. One of the main differ-ences between distributive h-indices and the original h-indexis that the ranking units are enriched from publications tomany other types of entities at various citing levels (seeTable 1).
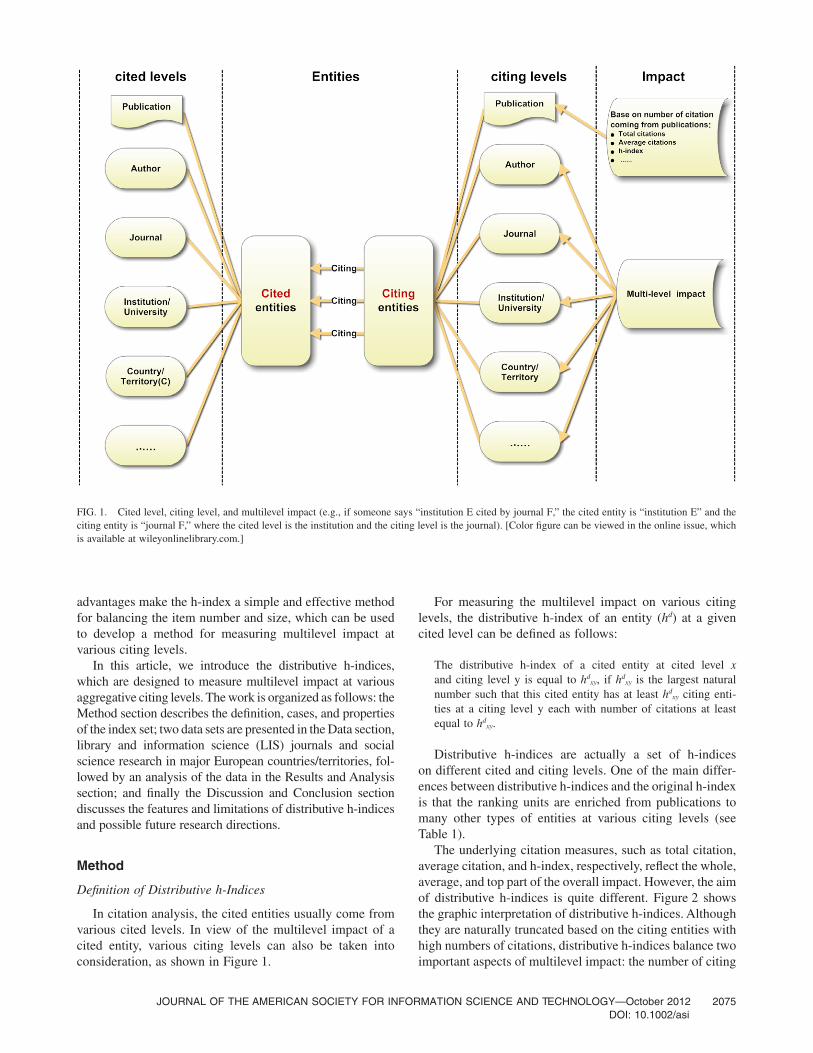
The underlying citation measures, such as total citation,average citation, and h-index, respectively, reflect the whole,average, and top part of the overall impact. However, the aimof distributive h-indices is quite different. Figure 2 showsthe graphic interpretation of distributive h-indices. Althoughthey are naturally truncated based on the citing entities withhigh numbers of citations, distributive h-indices balance twoimportant aspects of multilevel impact: the number of citing
FIG. 1. Cited level, citing level, and multilevel impact (e.g., if someone says “institution E cited by journal F,” the cited entity is “institution E” and theciting entity is “journal F,” where the cited level is the institution and the citing level is the journal). [Color figure can be viewed in the online issue, whichis available at wileyonlinelibrary.com.]
JOURNAL OF THE AMERICAN SOCIETY FOR INFORMATION SCIENCE AND TECHNOLOGY—October 2012 2075DOI: 10.1002/asi
entities and the strength of those citing. They also involvethe breadth and strength of citations coming from a varietyof citing levels. In Figure 2, the cited level is kept fixed. Inmost cases, using different citing levels leads to differentvalues of hd.
An entity with a high hd at a citing level y indicates thatits multilevel impact not only distributes widely, but alsostrongly influences a few entities at citing level y. If anentity has a set of high distributive h-indices at all citinglevels, it should perform well on the multilevel impact. Themain difference between Schubert’s successive h-indicesand distributive h-indices is that the former focuses onvarious and successive cited levels whereas the latter con-cerns different citing levels (and levels need not besuccessive). Distributive h-indices are designed to give acomprehensive view on the distribution of impact, and theycan be applied to many contents and objects.
Examples of Distributive h-Indices: Nature versus Science
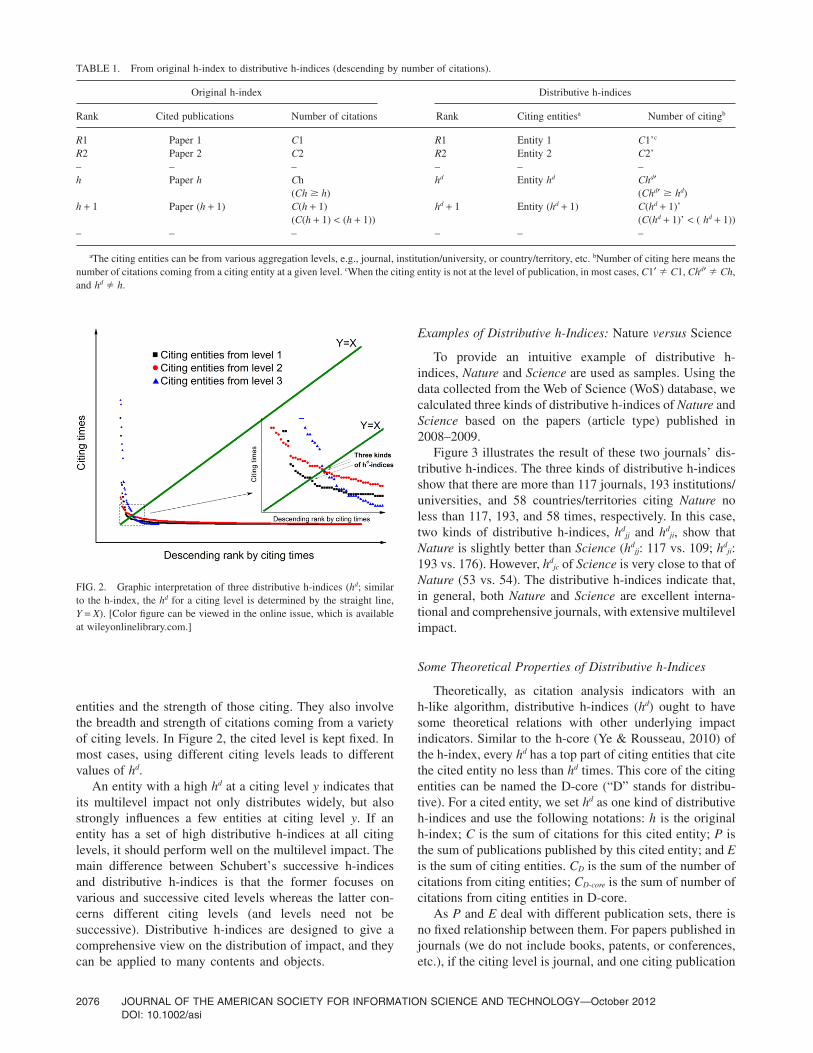
To provide an intuitive example of distributive h-indices, Nature and Science are used as samples. Using thedata collected from the Web of Science (WoS) database, wecalculated three kinds of distributive h-indices of Nature andScience based on the papers (article type) published in2008–2009.
Figure 3 illustrates the result of these two journals’ dis-tributive h-indices. The three kinds of distributive h-indicesshow that there are more than 117 journals, 193 institutions/universities, and 58 countries/territories citing Nature noless than 117, 193, and 58 times, respectively. In this case,two kinds of distributive h-indices, hd
jj and hdji, show that
Nature is slightly better than Science (hdjj: 117 vs. 109; hd
ji:193 vs. 176). However, hd
jc of Science is very close to that ofNature (53 vs. 54). The distributive h-indices indicate that,in general, both Nature and Science are excellent interna-tional and comprehensive journals, with extensive multilevelimpact.
Some Theoretical Properties of Distributive h-Indices
Theoretically, as citation analysis indicators with anh-like algorithm, distributive h-indices (hd) ought to havesome theoretical relations with other underlying impactindicators. Similar to the h-core (Ye & Rousseau, 2010) ofthe h-index, every hd has a top part of citing entities that citethe cited entity no less than hd times. This core of the citingentities can be named the D-core (“D” stands for distribu-tive). For a cited entity, we set hd as one kind of distributiveh-indices and use the following notations: h is the originalh-index; C is the sum of citations for this cited entity; P isthe sum of publications published by this cited entity; and Eis the sum of citing entities. CD is the sum of the number ofcitations from citing entities; CD-core is the sum of number ofcitations from citing entities in D-core.
As P and E deal with different publication sets, there isno fixed relationship between them. For papers published injournals (we do not include books, patents, or conferences,etc.), if the citing level is journal, and one citing publication
TABLE 1. From original h-index to distributive h-indices (descending by number of citations).
Original h-index Distributive h-indices
Rank Cited publications Number of citations Rank Citing entitiesa Number of citingb
R1 Paper 1 C1 R1 Entity 1 C1’c
R2 Paper 2 C2 R2 Entity 2 C2’– – – – – –h Paper h Ch
(Ch � h)hd Entity hd Chd′
(Chd′ � hd)h + 1 Paper (h + 1) C(h + 1)
(C(h + 1) < (h + 1))hd + 1 Entity (hd + 1) C(hd + 1)’
(C(hd + 1)’ < ( hd + 1))– – – – – –
aThe citing entities can be from various aggregation levels, e.g., journal, institution/university, or country/territory, etc. bNumber of citing here means thenumber of citations coming from a citing entity at a given level. cWhen the citing entity is not at the level of publication, in most cases, C1′ � C1, Chd′ � Ch,and hd � h.
FIG. 2. Graphic interpretation of three distributive h-indices (hd; similarto the h-index, the hd for a citing level is determined by the straight line,Y = X). [Color figure can be viewed in the online issue, which is availableat wileyonlinelibrary.com.]
2076 JOURNAL OF THE AMERICAN SOCIETY FOR INFORMATION SCIENCE AND TECHNOLOGY—October 2012DOI: 10.1002/asi
ought to published in one journal only, then C = CD, whereCD means the sum of number of citing from journals.However, in many other instances, one citing publicationrefers to multiple relevant levels, such as authors and insti-tutions, thus, C � CD. For example, an entity is cited by apaper (C = 1) with four coauthors, and these authors belongto three institutions. Thus, for the citing level author, CD = 4;for the citing level institutions, CD = 3.
Moreover, we always have the following propositionsabout hd:
Proposition 1. An entity’s hd is always smaller than or equalto the sum of its citing entities (E): 0 � hd � E.
Proof. Because the number of citations is ranked in descend-ing order, hd is a rank number that belongs to [0,+•] and Eis the largest rank number, 0 � hd � E.
In Proposition 1, when there is no citing relation from theciting entities, hd = 0. When all the numbers of citations arebigger than or equal to E, hd = E.
Proposition 2. An entity’s hd always satisfies the followinginequality:
h h C Cd dD core D≤ ( ) ≤ ≤−
2(1)
Proof. CD-core is the top part of CD, so CD-core � CD. Thereare hd citing entities in the D-core, and all the numbersof citations in CD-core are bigger than or equal to hd,then hd � (hd)2 � CD-core. Thus, hd � (hd)2 � (hd)2 � CD-core
� CD.In Proposition 2, when hd = 0, hd = (hd)2 = CD-core =
CD = 0. When hd = 1, hd = (hd)2 = 1 and CD-core = CD. Whenall the number of citations in the D-core are equal to hd,
then h h Cd dD core= = −( )2 . When all the number of cita-
tions in the D-core are equal to hd and all the numberof citations out of the D-core are equal to 0, we have
h h C Cd dD core D= = =−( )2 .
Although the sources of citing are changed, the algorithmof distributive h-indices is similar to that of the h-index.Consequently, there ought to be some theoretical relationsbetween distributive h-indices and other underlying citationparameters.
The first famous model for the relationship between theh-index another basic single indicator based on Lotkaian
FIG. 3. Three distributive h-indices of the journals Nature and Science (hdjj, hd
ji, and hdjc, respectively, refer to three different citing levels: journal,
institution/university, and country/territory). [Color figure can be viewed in the online issue, which is available at wileyonlinelibrary.com.]
JOURNAL OF THE AMERICAN SOCIETY FOR INFORMATION SCIENCE AND TECHNOLOGY—October 2012 2077DOI: 10.1002/asi
informetrics (Egghe, 2005) was developed by Egghe andRousseau (2006). This model reveals the power-law relationof h and P as h ~ P1/a, where a is the Lotka coefficient.Based on this model, Egghe (2008) also developed a power-law type model of successive h-indices. It appears that thepower-law relation is a common phenomenon in informet-rics (Egghe, 2005; Milojevic, 2010; Naranan, 1989).Another fundamental power-law mode occurs in the relationbetween h and C, which was originally introduced byHirsch (2005), and was recently explored in the unifiedmodel of the h-index (Ye, 2011). This model can be written
as h C∼ +α α/( )2 1 . The empirical research has shown that it fitsgroups of actual data well (Zhao & Gao, 2011). This leads tothe following first hypothesis.
Similar to the h-C power-law model and the h-like algo-rithm of hd, we may have hd ~ CD
h, where h is a powerexponent. In a data set, when the research area and timewindow are given, the average number of relevant units suchas authors and institutions is determined as a constant d1.Hence, there is an approximate linear relationship betweenC and CD, as CD ~ d1C. We then have a power-law relation ofhd and C. However, because the citing entities are changing,the power exponent needs to be altered in accordance withthem. Therefore, we hypothesize that
Hypothesis 1. For an hd, there is a power-law relationbetween hd and the sum of number of citations (C):
h Cd ∼ β1 (2)
where b1 is a power exponent.
In the framework of multilevel impact (as shown inFigure 1), the original h-index can be regarded as the specialcase of distributive h-index at ground level, where the citinglevel is publication and the number of citing entities (E) isassociated with (sometimes equal to) C. Thus, accordingto the h-C power-law model and Hypothesis 1, we cansuppose that
Hypothesis 2. For an hd, there is a power-law relationbetween hd and the sum of citing entities (E):
h Ed ∼ β2 (3)
where b2 is a power exponent.
The power law between P and C (P ~ C�, where � is thepower exponent) is one of the basic empirical laws in infor-metrics (Katz, 1999; Redner, 1998), also known as Heaps’law or Herdan’s law (Egghe, 2007). By combining this law
and Hypothesis 1, we have h Pd ~ ( )−σ β1. This leads to thethird hypothesis:
Hypothesis 3. For an hd, there is a power-law relationbetween hd and the sum of publications (P):
h Pd ∼ β3 (4)
where b3 = -b2 � constructs another power exponent.
According to the power-law model among h, P, and C, aswell as Hypotheses 1 and 3, we find that the relation between
h and distributive h-indices also fits a power-law model witha power exponent b4, as follows:
Hypothesis 4. For an hd, there is a power-law relationbetween hd and h-index (h):
h hd ~ β4 (5)
There are several kinds of distributive h-indices. Let hdx1
and hdx2 be two kinds of distributive h-indices at a cited
level y. Based on Hypothesis 4, we have h hdx1
4∼ ′β andh hd
x24∼ ′′β . Then, the relationship between hd
x1 and hdx2 is
h hdx
dx1 2
4 4∼ − ′′ ′( )β β . This leads to the fifth hypothesis.
Hypothesis 5. For different hd (hdx1 and hd
x2) at the same citedlevel n, there is a power-law relation between them:
h hdx
dx1 2
5∼ β (6)
It is worth noting that the power exponent (b1 ~ b5) shouldbe different for various citing levels. As these five hypothesesare based on empirical laws empirical tests are indispensable.
Data
In this work, we explore three typical distributiveh-indices, hd
nj, hdni, and hd
nc, which, respectively, refer tothree different citing levels: journal, institution/university,and country/territory. First, we collected two sets of data thatcontain two common cited levels, journals (meso level) andcountries/territories (macro level), using the WoS database.
LIS journals. This data set includes five years of researcharticles from 2005–2009 in 57 LIS journals indexed by theSocial Sciences Citation Index (SSCI; Thomson Reuters,Philadelphia, PA). The data collection procedure is asfollows:
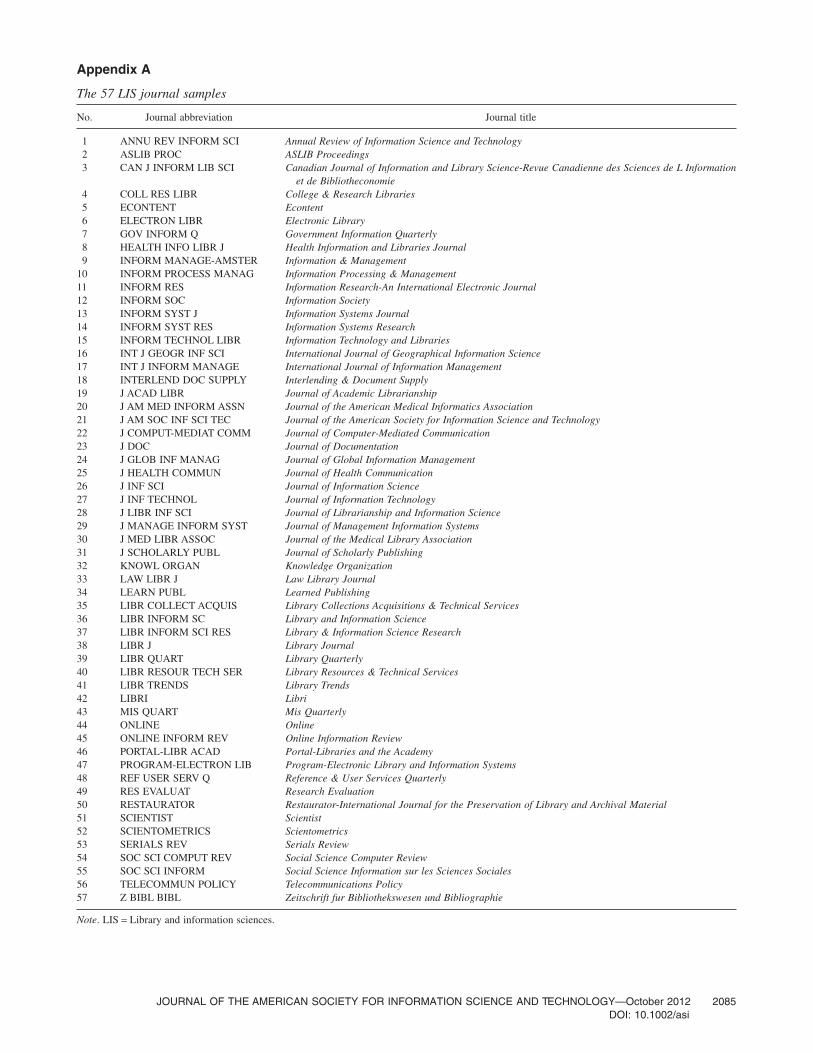
1. In the WoS, according to the search strategy“SO=‘journals name’ AND PY=2005–2009 AND Docu-ment Type=(Article),” retrieve the paper data of 66 jour-nals in LIS subject category of Journal Citation Reports2009 (JCR 2009; Thomson Reuters). Because the 2005–2009 WoS data for nine journals are not complete, thereare 57 appropriate samples (shown in Appendix A).
2. Analyze the paper set of search results, and obtain thecitation indicators and citing paper set of each journal.
3. Analyze the citing paper set, and calculate three distribu-tive h-indices of hd
jj, hdji, and hd
jc according to the analysisresults obtained above.
Social science research in European countries/territories. This sample set includes the social scienceresearch articles from 38 major European countries andterritories encompassed by SSCI in 2006. The concrete stepsare:
1. In the WoS, according to the search strategy “PY=(2006)AND CU=(Countries/Territories name) AND DocumentType=(Article). Databases=SSCI.”, retrieve the article
2078 JOURNAL OF THE AMERICAN SOCIETY FOR INFORMATION SCIENCE AND TECHNOLOGY—October 2012DOI: 10.1002/asi
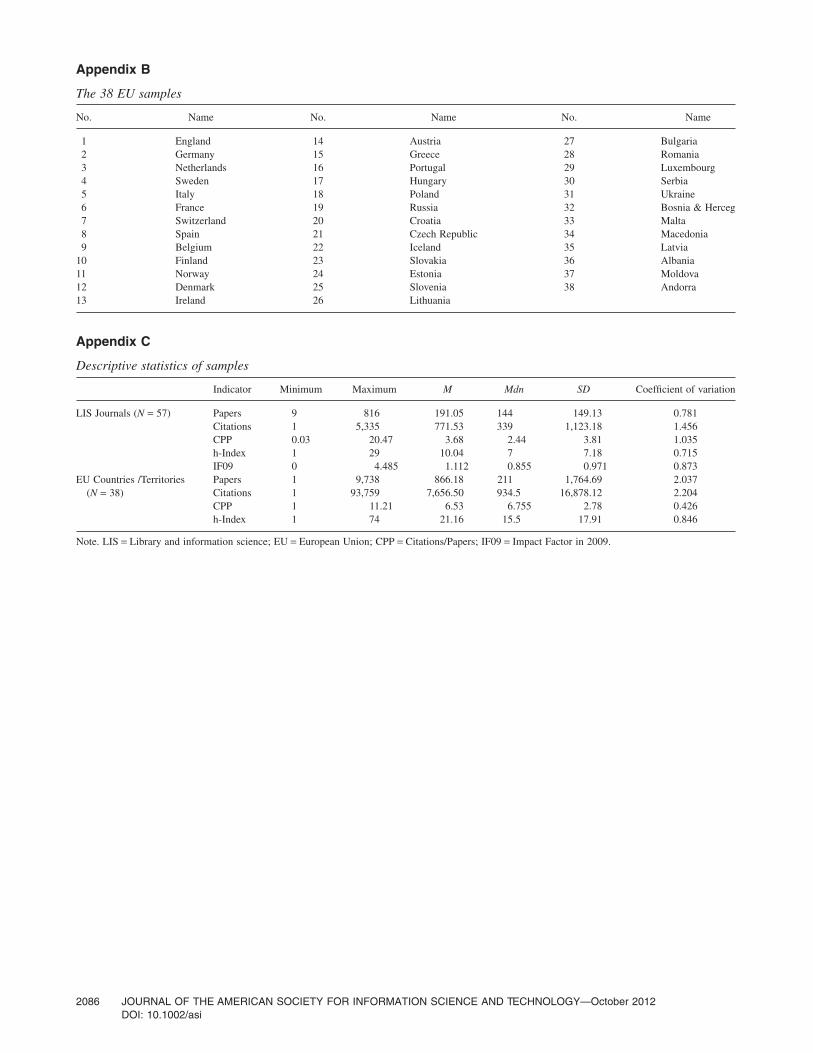
data of all the European countries indexed by SSCI in2006. However, six of the European countries or territo-ries have no such article records in 2006, thus we deletedthese samples. The remaining 38 samples are shown inAppendix B.
2. As in Step 2 for LIS journals, analyze the paper set ofsearch results, and obtain the citation indicators and citingpaper set of each country or territory.
3. Analyze the citing paper set, and calculate three distribu-tive h-indices of hd
cj, hdci, and hd
cc.
The descriptive statistics of the two sets of data are shownin Appendix C.
Results and Analysis
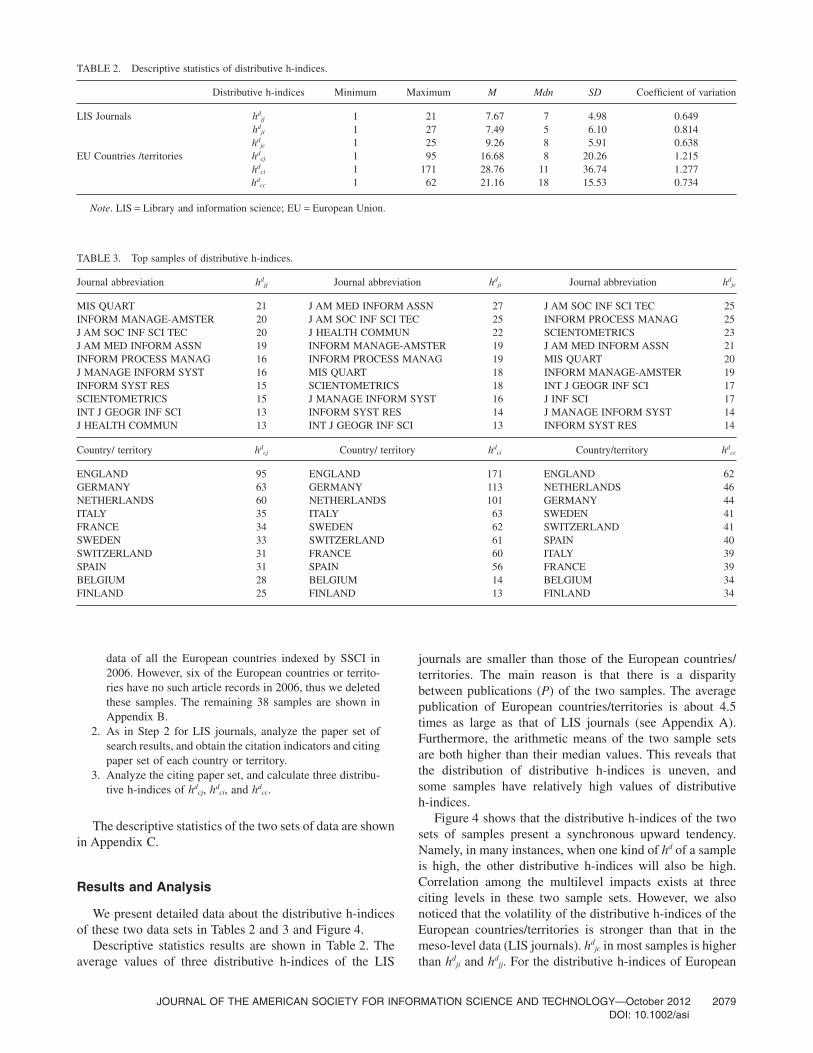
We present detailed data about the distributive h-indicesof these two data sets in Tables 2 and 3 and Figure 4.
Descriptive statistics results are shown in Table 2. Theaverage values of three distributive h-indices of the LIS
journals are smaller than those of the European countries/territories. The main reason is that there is a disparitybetween publications (P) of the two samples. The averagepublication of European countries/territories is about 4.5times as large as that of LIS journals (see Appendix A).Furthermore, the arithmetic means of the two sample setsare both higher than their median values. This reveals thatthe distribution of distributive h-indices is uneven, andsome samples have relatively high values of distributiveh-indices.
Figure 4 shows that the distributive h-indices of the twosets of samples present a synchronous upward tendency.Namely, in many instances, when one kind of hd of a sampleis high, the other distributive h-indices will also be high.Correlation among the multilevel impacts exists at threeciting levels in these two sample sets. However, we alsonoticed that the volatility of the distributive h-indices of theEuropean countries/territories is stronger than that in themeso-level data (LIS journals). hd
jc in most samples is higherthan hd
ji and hdjj. For the distributive h-indices of European
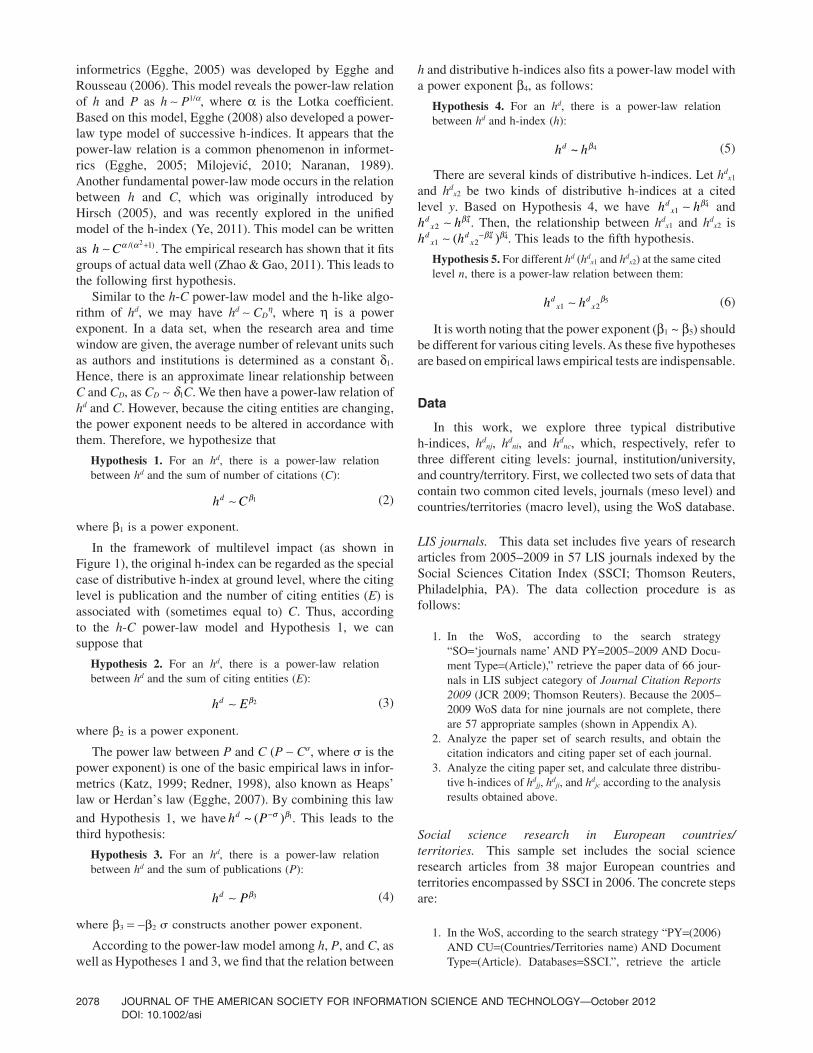
TABLE 2. Descriptive statistics of distributive h-indices.
Distributive h-indices Minimum Maximum M Mdn SD Coefficient of variation
LIS Journals hdjj 1 21 7.67 7 4.98 0.649
hdji 1 27 7.49 5 6.10 0.814
hdjc 1 25 9.26 8 5.91 0.638
EU Countries /territories hdcj 1 95 16.68 8 20.26 1.215
hdci 1 171 28.76 11 36.74 1.277
hdcc 1 62 21.16 18 15.53 0.734
Note. LIS = Library and information science; EU = European Union.
TABLE 3. Top samples of distributive h-indices.
Journal abbreviation hdjj Journal abbreviation hd
ji Journal abbreviation hdjc
MIS QUART 21 J AM MED INFORM ASSN 27 J AM SOC INF SCI TEC 25INFORM MANAGE-AMSTER 20 J AM SOC INF SCI TEC 25 INFORM PROCESS MANAG 25J AM SOC INF SCI TEC 20 J HEALTH COMMUN 22 SCIENTOMETRICS 23J AM MED INFORM ASSN 19 INFORM MANAGE-AMSTER 19 J AM MED INFORM ASSN 21INFORM PROCESS MANAG 16 INFORM PROCESS MANAG 19 MIS QUART 20J MANAGE INFORM SYST 16 MIS QUART 18 INFORM MANAGE-AMSTER 19INFORM SYST RES 15 SCIENTOMETRICS 18 INT J GEOGR INF SCI 17SCIENTOMETRICS 15 J MANAGE INFORM SYST 16 J INF SCI 17INT J GEOGR INF SCI 13 INFORM SYST RES 14 J MANAGE INFORM SYST 14J HEALTH COMMUN 13 INT J GEOGR INF SCI 13 INFORM SYST RES 14
Country/ territory hdcj Country/ territory hd
ci Country/territory hdcc
ENGLAND 95 ENGLAND 171 ENGLAND 62GERMANY 63 GERMANY 113 NETHERLANDS 46NETHERLANDS 60 NETHERLANDS 101 GERMANY 44ITALY 35 ITALY 63 SWEDEN 41FRANCE 34 SWEDEN 62 SWITZERLAND 41SWEDEN 33 SWITZERLAND 61 SPAIN 40SWITZERLAND 31 FRANCE 60 ITALY 39SPAIN 31 SPAIN 56 FRANCE 39BELGIUM 28 BELGIUM 14 BELGIUM 34FINLAND 25 FINLAND 13 FINLAND 34
JOURNAL OF THE AMERICAN SOCIETY FOR INFORMATION SCIENCE AND TECHNOLOGY—October 2012 2079DOI: 10.1002/asi
countries/territories, hdci in most samples is higher than hd
cc
and hdcj. In addition, the gap between the top and tail in hd
ci
is most remarkable; this gap in hdcc is relatively small. One
possible reason is that the total amount of countries/territories as citing entities is limited, and the total numberof institutions is much greater than the numbers of journalsand countries/territories.
Table 3 contains the top samples of distributive h-indicesin two data sets. The six kinds of distributive h-indices,respectively, describe the multilevel impact of LIS journalsand European Union (EU) countries/territories’ socialscience research at various levels. In LIS journals, J AMSOC INF SCI TEC (Journal of the American Society forInformation Science and Technology) is usually ranked, bypeer review, as the top journal on this subject (Nisonger &Davis, 2005), but the famous impact indicator of journals,the Impact Factor (IF), does not truly reflect this journal’ssignificant academic standing in LIS. In the latest JournalCitation Reports’ LIS subject categories (2010), J AM SOCINF SCI TEC’s IF (2.137) was ranked only 11th. However,the distributive h-indices demonstrate that this journalindeed has an extensive impact. All three distributiveh-indices were ranked as Top 2 in the subject (includingjuxtaposition). Distributive h-indices that focus on the mul-tilevel impact can be a useful supplement for the traditionalindicator.
Some interdisciplinary journals, such as J AM MEDINFORMASSN (Journal of the American Medical Informat-ics Association) and MIS QUART (Management InformationSystems Quarterly), also have good performance on distribu-tive h-indices. Partly because the contents of their publica-
tions involve multiple disciplines, they have higher multilevelimpact. SCIENTOMETRICS is another interesting case. Itshd at a macro citing level (hd
jc) is ranked higher than that at ameso level (hd
jj and hdji).Although the distribution of its citing
journals and institutions/universities is not narrow, the distri-bution of its citing countries is broad. For the three distribu-tive h-indices, England, Germany, and the Netherlands tookover the top three positions in the EU countries/territories.The advantage of England is obvious, not only because it isthe first in the three distributive h-indices, but also for thevalues of distributive h-indices, which greatly exceed thesecond country. Generally, in the top samples, the differenceamong the distributive h-indices ranking of EU countries/territories is smaller than that of LIS journals.
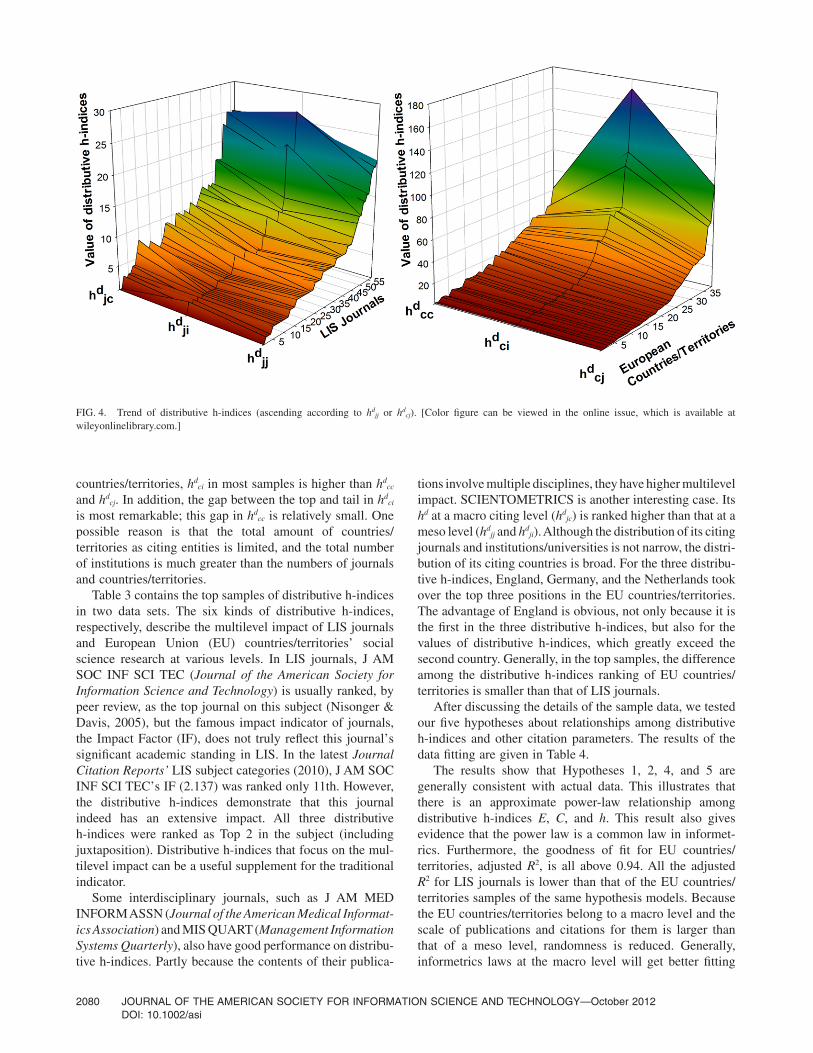
After discussing the details of the sample data, we testedour five hypotheses about relationships among distributiveh-indices and other citation parameters. The results of thedata fitting are given in Table 4.
The results show that Hypotheses 1, 2, 4, and 5 aregenerally consistent with actual data. This illustrates thatthere is an approximate power-law relationship amongdistributive h-indices E, C, and h. This result also givesevidence that the power law is a common law in informet-rics. Furthermore, the goodness of fit for EU countries/territories, adjusted R2, is all above 0.94. All the adjustedR2 for LIS journals is lower than that of the EU countries/territories samples of the same hypothesis models. Becausethe EU countries/territories belong to a macro level and thescale of publications and citations for them is larger thanthat of a meso level, randomness is reduced. Generally,informetrics laws at the macro level will get better fitting
FIG. 4. Trend of distributive h-indices (ascending according to hdjj or hd
cj). [Color figure can be viewed in the online issue, which is available atwileyonlinelibrary.com.]
2080 JOURNAL OF THE AMERICAN SOCIETY FOR INFORMATION SCIENCE AND TECHNOLOGY—October 2012DOI: 10.1002/asi
results than at the meso level or micro level. On the otherhand, the category of LIS journals contains many inter-disciplinary journals; hence, their focus is on multiplesubjects. There are explicit differences among interdisci-plinary journals and traditional LIS journals, which, for thewhole sample set, results in a decrease of goodness of fit.
However, Hypothesis 3, which refers to the relationshipbetween hd and P, was supported by the data of EU countries/territories, and not confirmed in the data of LIS journals. Oneof the main reasons is that hd are measures reflecting impact,but P is the indicator for the quantity of research outputs.Actually, the relationship between P and hd depends on therelationship between P and C. Therefore, Hypothesis 3 mustbe supported by the power law of P and C. The fitting resultfor the P-C power-law model of LIS data is
C P Adj R∼ =1 270 2 0 505. ( . . ) (7)
The adjusted R2 in Equation 7 is also low. It shows thatthe P-C power law is originally not observed in LIS journals,so that the P-hd power law is not clear. However, as shown inEquation 8, the P-C power law has a good fitting result inEU countries/territories at the macro level.
C P Adj R∼ =1 058 2 0 990. ( . . ) (8)
As a result, the P-hd power law was confirmed by the dataof 38 EU countries/territories.
Another application of the empirical model is that afterthe sample set is presented in a two-dimension chart, itssingular case can be found clearly. As shown in Figure 5,dispersion degrees in the sample of LIS journals are gener-
ally higher than in the sample of EU countries/territories.Related to the law of the whole samples, Journal of HealthCommunication is a typical singular point. It has an advan-tage of impact at institutions/universities. MIS Quarterly andInformation Processing & Management, which place moreemphasis on information technology, influence more jour-nals and countries, respectively. Samples of EU countries/territories follow the power law of the whole samplegenerally, in which Germany and the Netherlands influencemany institutions/universities and journals.
Discussion and Conclusion
The distributive h-indices were developed to meet twoimportant components of multilevel impact: breadth andstrength. They present a comprehensive impact for entities atvarious citing levels, and provide a potential tool inthe citation analysis. The h-like algorithm of distributiveh-indices leads to some possible merits inherited from theh-index. For instance, it is easy to calculate them using WoS,Scopus, and other databases. The algorithm is natural, and itsrobustness is also strong. The possible applications include notonly academic articles, but also extensive informetric relationsor objects, e.g., patents, weblinks, and co-occurrence phenom-ena such as cross-level collaborations.
Moreover, the parameter set is an open and developingsystem, in which researchers can set up various distributiveh-indices for their own research needs. In particular, if weinvestigate both cited entities and citing entities at a mul-tilevel, a more systematic and multilevel impact may bedeveloped. For instance, if we set cited level (n) as a row,citing level (m) as a column, and hd
nm as an element in amatrix, a measure set called the distributive h-indicesmatrix can be set up, as shown Figure 6. In general, if thenumbers of cited levels and citing levels are fixed and equalto L, the size of this matrix is L*L. Figure 6 illustrates adistributive h-indices matrix including four cited and citinglevels.
Regarding a distributive h-indices matrix:
1. A distributive h-indices matrix is not unique or fixed.Researchers can build their own distributive h-indicesmatrix for different research purposes or by another hier-archical framework of scientometric level, and both thecited levels and citing levels should be chosen accordingto the research demand. In some cases, the cited entitylocates at a given level, and a one-row matrix can supplythe demand. On the contrary, sometimes one may needone kind of citing level and a one-column distributiveh-indices matrix.
2. In a distributive h-indices matrix in which the number ofcited levels is exactly the same as that of citing levels (suchas the distributive h-indices matrix in Figure 6), distribu-tive h-indices can be divided into two categories. Thediagonal elements characterize the entities’ impact at thesame cited and citing level, whereas other elementsmeasure the cross-level impact. If the cited and citinglevels are the same, this type of distributive h-indices is
TABLE 4. Test for the five hypotheses of distributive h-indices.
Hypotheses
LIS journals EU countries/territories
Fitting results Adj. R2 Fitting results Adj. R2
Hypothesis 1:h Cd ∼ β2
hdjj ~ C0.436 0.890 hd
jc ~ C0.556 0.995hd
ji ~ C0.557 0.916 hdci ~ C0.570 0.996
hdjc ~ C0.427 0.910 hd
cc ~ C0.293 0.972
Hypothesis 2:h Ed ∼ β1
hdjj ~ Ej
0.534 0.801 hdcj ~ Ej
0.011 0.963hd
ji ~ Ei0.755 0.916 hd
ci ~ Ei0.878 0.992
hdjc ~ Ec
1.442 0.828 hdcc ~ Ec
1.354 0.974
Hypothesis 3:h Pd ∼ β3
hdjj ~ P0.500 0.291 hd
jc ~ P0.604 0.980hd
ji ~ P0.659 0.340 hdci ~ P0.620 0.979
hdjc ~ P0.542 0.348 hd
cc ~ P0.330 0.947
Hypothesis 4:h hd ∼ β4
hdjj ~ h0.872 0.891 hd
jc ~ h1.676 0.990hd
ji ~ h1.124 0.924 hdci ~ h1.717 0.990
hdjc ~ h0.811 0.865 hd
cc ~ h0.801 0.976
Hypothesis 5:h hd
nd
n1 25∼ β
hdjj ~ hd
ji0.749 0.880 hd
jc ~ hdci
0.972 0.996hd
jj ~ hdjc
0.939 0.798 hdjc ~ hd
cc2.158 0.954
hdji ~ hd
jc0.194 0.787 hd
ci ~ hdcc
2.221 0.966
Note. LIS = Library and information science; EU = European Union;hd = distributive h-indices; hd
xy = the specific distributive h-indices for citedlevel x and citing level y; E = sum of citing entities; C = sum of citations;P = sum of publications; h = the original h-index. Ej, Ei, and Ec, respec-tively, refer to the different citing levels as journal, institution/university,country/territory and field.
JOURNAL OF THE AMERICAN SOCIETY FOR INFORMATION SCIENCE AND TECHNOLOGY—October 2012 2081DOI: 10.1002/asi
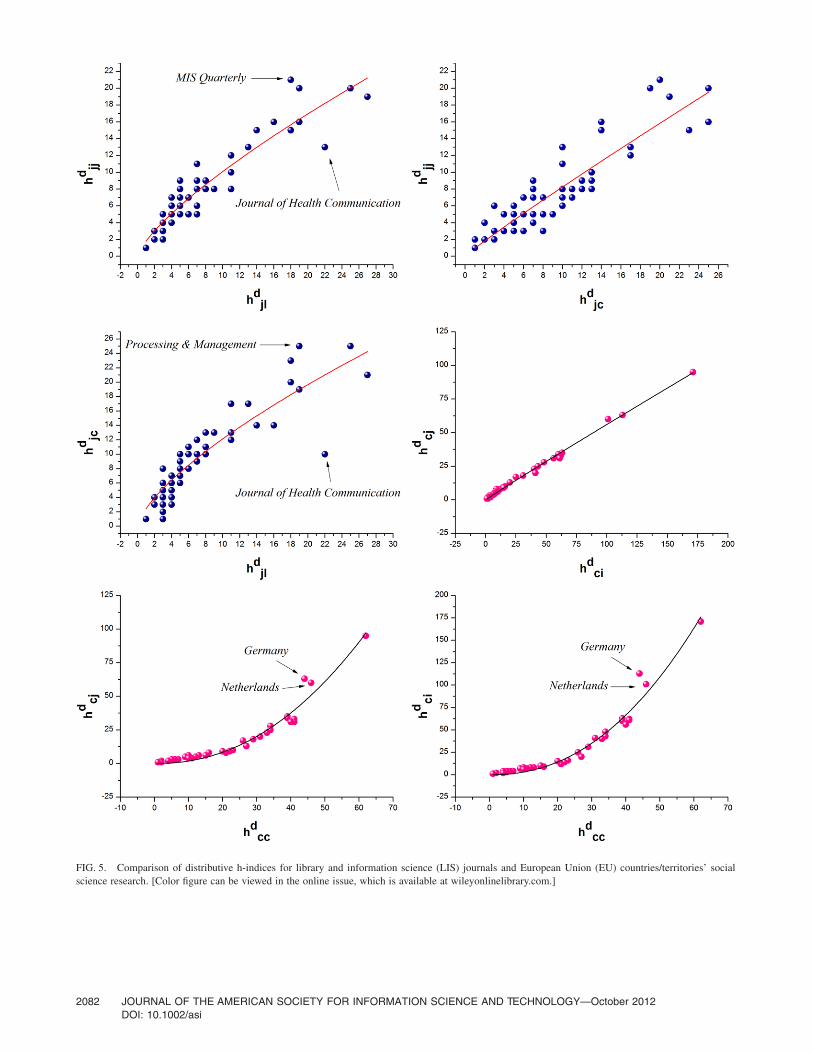
FIG. 5. Comparison of distributive h-indices for library and information science (LIS) journals and European Union (EU) countries/territories’ socialscience research. [Color figure can be viewed in the online issue, which is available at wileyonlinelibrary.com.]
2082 JOURNAL OF THE AMERICAN SOCIETY FOR INFORMATION SCIENCE AND TECHNOLOGY—October 2012DOI: 10.1002/asi
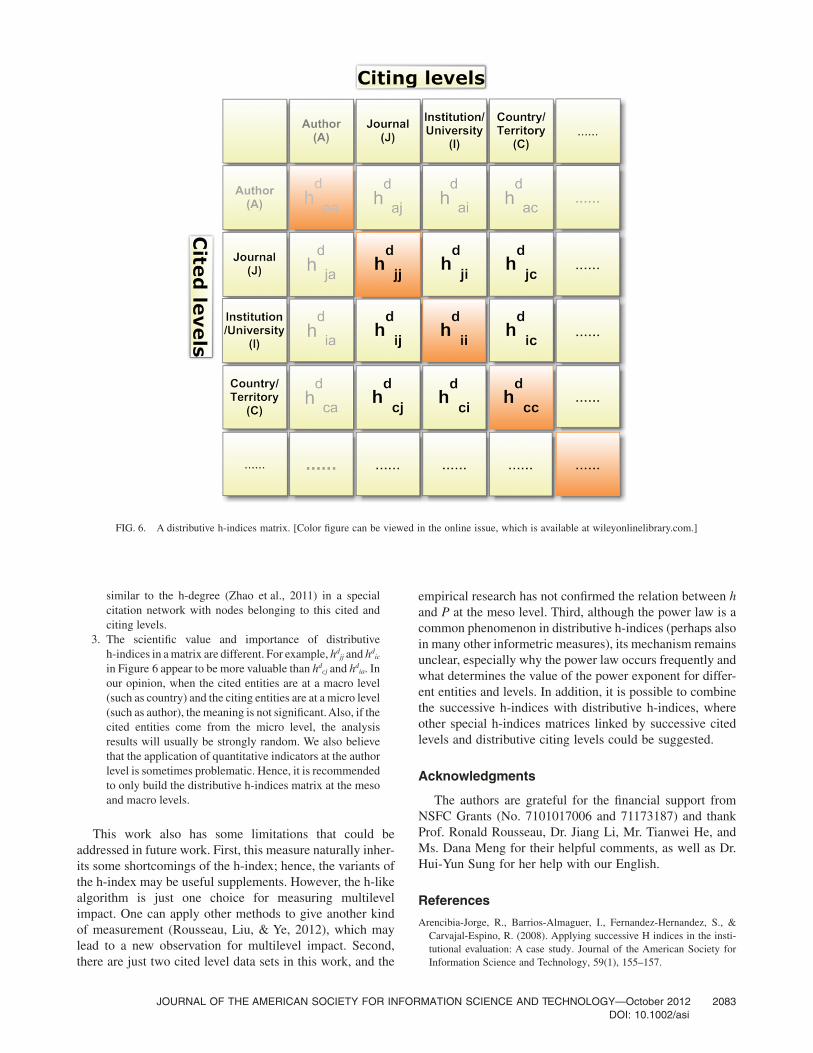
similar to the h-degree (Zhao et al., 2011) in a specialcitation network with nodes belonging to this cited andciting levels.
3. The scientific value and importance of distributiveh-indices in a matrix are different. For example, hd
jj and hdic
in Figure 6 appear to be more valuable than hdcj and hd
ia. Inour opinion, when the cited entities are at a macro level(such as country) and the citing entities are at a micro level(such as author), the meaning is not significant. Also, if thecited entities come from the micro level, the analysisresults will usually be strongly random. We also believethat the application of quantitative indicators at the authorlevel is sometimes problematic. Hence, it is recommendedto only build the distributive h-indices matrix at the mesoand macro levels.
This work also has some limitations that could beaddressed in future work. First, this measure naturally inher-its some shortcomings of the h-index; hence, the variants ofthe h-index may be useful supplements. However, the h-likealgorithm is just one choice for measuring multilevelimpact. One can apply other methods to give another kindof measurement (Rousseau, Liu, & Ye, 2012), which maylead to a new observation for multilevel impact. Second,there are just two cited level data sets in this work, and the
empirical research has not confirmed the relation between hand P at the meso level. Third, although the power law is acommon phenomenon in distributive h-indices (perhaps alsoin many other informetric measures), its mechanism remainsunclear, especially why the power law occurs frequently andwhat determines the value of the power exponent for differ-ent entities and levels. In addition, it is possible to combinethe successive h-indices with distributive h-indices, whereother special h-indices matrices linked by successive citedlevels and distributive citing levels could be suggested.
Acknowledgments
The authors are grateful for the financial support fromNSFC Grants (No. 7101017006 and 71173187) and thankProf. Ronald Rousseau, Dr. Jiang Li, Mr. Tianwei He, andMs. Dana Meng for their helpful comments, as well as Dr.Hui-Yun Sung for her help with our English.
References
Arencibia-Jorge, R., Barrios-Almaguer, I., Fernandez-Hernandez, S., &Carvajal-Espino, R. (2008). Applying successive H indices in the insti-tutional evaluation: A case study. Journal of the American Society forInformation Science and Technology, 59(1), 155–157.
FIG. 6. A distributive h-indices matrix. [Color figure can be viewed in the online issue, which is available at wileyonlinelibrary.com.]
JOURNAL OF THE AMERICAN SOCIETY FOR INFORMATION SCIENCE AND TECHNOLOGY—October 2012 2083DOI: 10.1002/asi
Börner, K., Sanyal, S., & Vespignani, A. (2007). Network science. AnnualReview of Information Science and Technology, 41, 537–607.
Bornmann, L. (2011). Do we need the E-index in addition to the h-indexand its variants? Journal of the American Society for Information Scienceand Technology, 62(7), 1433–1434.
Braun, T., Glänzel, W., & Schubert, A. (2006). A Hirsch-type index forjournals. Scientometrics, 69(1), 169–173.
Byström, H. (2011). An index to evaluate fund and fund manager perfor-mance. Applied Economics Letters, 18(14), 1311–1314.
Csajbok, E., Berhidi, A., Vasas, L., & Schubert, A. (2007). Hirsch-index forcountries based on essential science indicators data. Scientometrics,73(1), 91–117.
Ding, Y. (2011). Applying weighted pagerank to author citation networks.Journal of the American Society for Information Science and Technol-ogy, 62(2), 236–245.
Egghe, L. (2005). Power laws in the information production process:Lotkaian informetrics. Oxford, England: Elsevier.
Egghe, L. (2007). Untangling Herdan’s law and Heaps’ law: Mathematicaland informetric arguments. Journal of American Society for InformationScience and Technology, 58(5), 702–709.
Egghe, L. (2008). Modelling successive h-indices. Scientometrics, 77(3),377–387.
Egghe, L. (2010). The Hirsch index and related impact measures. AnnualReview of Information Science and Technology, 44, 65–114.
Egghe, L., & Rousseau, R. (2006). An informetric model for the Hirsch-index. Scientometrics, 69(1), 121–129.
Gianoli, E., & Molina-Montenegro, M.A. (2009). Insights into the relation-ship between the h-index and self-citations. Journal of the AmericanSociety for Information Science and Technology, 60(6), 1283–1285.
Gonzalez-Pereira, B., Guerrero-Bote, V.P., & Moya-Anegon, F. (2010). Anew approach to the metric of journals’ scientific prestige: The SJRindicator. Journal of Informetrics, 4(3), 379–391.
Hirsch, J.E. (2005). An index to quantify an individual’s scientific researchoutput. Proceedings of the National Academy of Sciences of the UnitedStates of America, 102(46), 16569–16572.
Katz, J.S. (1999). The self-similar science system. Research Policy, 28(5),501–517.
Leydesdorff, L., & Bornmann, L. (2011). Integrated impact indicators com-pared with impact factors: An alternative research design with policyimplications. Journal of the American Society for Information Scienceand Technology, 62(11), 2133–2146.
Milojevic, S. (2010). Power law distributions in information science:Making the case for logarithmic binning. Journal of the AmericanSociety for Information Science and Technology, 61(12), 2417–2425.
Moed, H.F. (2010). Measuring contextual citation impact of scientific jour-nals. Journal of Informetrics, 4(3), 265–277.
Moed, H.F., Debruin, R.E., & Vanleeuwen, T.N. (1995). New bibliometrictools for the assessment of national research performance—Databasedescription, overview of indicators and first applications. Scientometrics,33(3), 381–422.
Naranan, S. (1989). Power law version of Bradford law—statistical testsand methods of estimation. Scientometrics, 17(3–4), 211–226.
Nisonger, T.E., & Davis, C.H. (2005). The perception of library and infor-mation science journals by LIS education deans and ARL library direc-tors: A replication of the Kohl-Davis study. College & ResearchLibraries, 66(4), 341–377.
Otte, E., & Rousseau, R. (2002). Social network analysis: A powerfulstrategy, also for the information sciences. Journal of InformationScience, 28(6), 441–453.
Prathap, G. (2006). Hirsch-type indices for ranking institutions’ scientificresearch output. Current Science, 91(11), 1439.
Redner, S. (1998). How popular is your paper? An empirical study of thecitation distribution. European Physical Journal B, 4(2), 131–134.
Rousseau, R. (2009). The h-index as a biodiversity index. Current Science,97(7), 980–981.
Rousseau, R., Liu, Y.X., & Ye, F.Y. (2012). A preliminary investigation ondiffusion through a layered system. Journal of Informetrics, 6(1), 177–191.
Schubert, A. (2007). Successive h-indices. Scientometrics, 70(1), 201–205.Schubert, A. (2012). A Hirsch-type index of co-author partnership ability.
Scientometrics, 91(1), 303–308.Waltman, L., & Van Eck, N.J. (2011). The inconsistency of the h-index.
Journal of the American Society for Information Science and Technol-ogy, 63(2), 406–415.
Waltman, L., van Eck, N.J., van Leeuwen, T.N., Visser, M.S., & van Raan,A. (2011). Towards a new crown indicator: An empirical analysis. Sci-entometrics, 87(3), 467–481.
West, J.D., Bergstrom, T.C., & Bergstrom, C.T. (2010). The EigenfactorMetrics (TM): A network approach to assessing scholarly journals.College & Research Libraries, 71(3), 236–244.
Ye, F.Y. (2011). A unification of three models for the h-index. Journal of theAmerican Society for Information Science and Technology, 62(1), 205–207.
Ye, F.Y., & Rousseau, R. (2010). Probing the h-core: An investigationof the tail-core ratio for rank distributions. Scientometrics, 84(2), 431–439.
Ye, Y., Tang J.H., & Zhao, X. (2011). Studies on the h-index and h-typeindices. Beijing: Science Press. (in Chinese)
Zhang, L., Glänzel, W., & Liang, L.M. (2009). Tracing the role of indi-vidual journals in a cross-citation network based on different indicators.Scientometrics, 81(3), 821–838.
Zhao, S.X., & Ye, F.Y. (2011). H-Efficiency: Measuring input-output per-formance of research funds. Current Science, 101(1), 21–22.
Zhao, S.X., Rousseau, R., & Ye, F.Y. (2011). H-Degree as a basic measurein weighted networks. Journal of Informetrics, 5(4), 668–677.
Zhao, X., & Gao, X.Q. (2011). The power-law model of h-C: Theoreticaldeduction and parameter analysis. Journal of the China Society for Sci-entific and Technical Information, 30(1), 83–86. (in Chinese)
Zhivotovsky, L.A., & Krutovsky, K.V. (2008). Self-citation can inflateh-index. Scientometrics, 77(2), 373–375.
2084 JOURNAL OF THE AMERICAN SOCIETY FOR INFORMATION SCIENCE AND TECHNOLOGY—October 2012DOI: 10.1002/asi
Appendix A
The 57 LIS journal samples
No. Journal abbreviation Journal title
1 ANNU REV INFORM SCI Annual Review of Information Science and Technology2 ASLIB PROC ASLIB Proceedings3 CAN J INFORM LIB SCI Canadian Journal of Information and Library Science-Revue Canadienne des Sciences de L Information
et de Bibliotheconomie4 COLL RES LIBR College & Research Libraries5 ECONTENT Econtent6 ELECTRON LIBR Electronic Library7 GOV INFORM Q Government Information Quarterly8 HEALTH INFO LIBR J Health Information and Libraries Journal9 INFORM MANAGE-AMSTER Information & Management
10 INFORM PROCESS MANAG Information Processing & Management11 INFORM RES Information Research-An International Electronic Journal12 INFORM SOC Information Society13 INFORM SYST J Information Systems Journal14 INFORM SYST RES Information Systems Research15 INFORM TECHNOL LIBR Information Technology and Libraries16 INT J GEOGR INF SCI International Journal of Geographical Information Science17 INT J INFORM MANAGE International Journal of Information Management18 INTERLEND DOC SUPPLY Interlending & Document Supply19 J ACAD LIBR Journal of Academic Librarianship20 J AM MED INFORM ASSN Journal of the American Medical Informatics Association21 J AM SOC INF SCI TEC Journal of the American Society for Information Science and Technology22 J COMPUT-MEDIAT COMM Journal of Computer-Mediated Communication23 J DOC Journal of Documentation24 J GLOB INF MANAG Journal of Global Information Management25 J HEALTH COMMUN Journal of Health Communication26 J INF SCI Journal of Information Science27 J INF TECHNOL Journal of Information Technology28 J LIBR INF SCI Journal of Librarianship and Information Science29 J MANAGE INFORM SYST Journal of Management Information Systems30 J MED LIBR ASSOC Journal of the Medical Library Association31 J SCHOLARLY PUBL Journal of Scholarly Publishing32 KNOWL ORGAN Knowledge Organization33 LAW LIBR J Law Library Journal34 LEARN PUBL Learned Publishing35 LIBR COLLECT ACQUIS Library Collections Acquisitions & Technical Services36 LIBR INFORM SC Library and Information Science37 LIBR INFORM SCI RES Library & Information Science Research38 LIBR J Library Journal39 LIBR QUART Library Quarterly40 LIBR RESOUR TECH SER Library Resources & Technical Services41 LIBR TRENDS Library Trends42 LIBRI Libri43 MIS QUART Mis Quarterly44 ONLINE Online45 ONLINE INFORM REV Online Information Review46 PORTAL-LIBR ACAD Portal-Libraries and the Academy47 PROGRAM-ELECTRON LIB Program-Electronic Library and Information Systems48 REF USER SERV Q Reference & User Services Quarterly49 RES EVALUAT Research Evaluation50 RESTAURATOR Restaurator-International Journal for the Preservation of Library and Archival Material51 SCIENTIST Scientist52 SCIENTOMETRICS Scientometrics53 SERIALS REV Serials Review54 SOC SCI COMPUT REV Social Science Computer Review55 SOC SCI INFORM Social Science Information sur les Sciences Sociales56 TELECOMMUN POLICY Telecommunications Policy57 Z BIBL BIBL Zeitschrift fur Bibliothekswesen und Bibliographie
Note. LIS = Library and information sciences.
JOURNAL OF THE AMERICAN SOCIETY FOR INFORMATION SCIENCE AND TECHNOLOGY—October 2012 2085DOI: 10.1002/asi
Appendix B
The 38 EU samples
No. Name No. Name No. Name
1 England 14 Austria 27 Bulgaria2 Germany 15 Greece 28 Romania3 Netherlands 16 Portugal 29 Luxembourg4 Sweden 17 Hungary 30 Serbia5 Italy 18 Poland 31 Ukraine6 France 19 Russia 32 Bosnia & Herceg7 Switzerland 20 Croatia 33 Malta8 Spain 21 Czech Republic 34 Macedonia9 Belgium 22 Iceland 35 Latvia
10 Finland 23 Slovakia 36 Albania11 Norway 24 Estonia 37 Moldova12 Denmark 25 Slovenia 38 Andorra13 Ireland 26 Lithuania
Appendix C
Descriptive statistics of samples
Indicator Minimum Maximum M Mdn SD Coefficient of variation
LIS Journals (N = 57) Papers 9 816 191.05 144 149.13 0.781Citations 1 5,335 771.53 339 1,123.18 1.456CPP 0.03 20.47 3.68 2.44 3.81 1.035h-Index 1 29 10.04 7 7.18 0.715IF09 0 4.485 1.112 0.855 0.971 0.873
EU Countries /Territories(N = 38)
Papers 1 9,738 866.18 211 1,764.69 2.037Citations 1 93,759 7,656.50 934.5 16,878.12 2.204CPP 1 11.21 6.53 6.755 2.78 0.426h-Index 1 74 21.16 15.5 17.91 0.846
Note. LIS = Library and information science; EU = European Union; CPP = Citations/Papers; IF09 = Impact Factor in 2009.
2086 JOURNAL OF THE AMERICAN SOCIETY FOR INFORMATION SCIENCE AND TECHNOLOGY—October 2012DOI: 10.1002/asi


