Embed Size (px)
Citation preview
DISTRICT STATISTICAL HANDBOOK
DISTRICT PLANNING AND MONITORING UNIT
( Price : Rs.25.00 )
GOVERNMENT OF ODISHA
DISTRICT STATISTICAL HANDBOOK
KORAPUT
2011
DISTRICT PLANNING AND MONITORING UNIT
KORAPUT
DISTRICT STATISTICAL HANDBOOK
DISTRICT PLANNING AND MONITORING UNIT
Table No. SUBJECT PAGE
( 1 ) ( 2 ) ( 3 )
Socio-Economic Profile : Koraput … 1
Administrative set up … 4
I POSITION OF DISTRICT IN THE STATE
1.01 Geographical Area … 5
1.02 District wise Population with Rural Urban and their proportion of Odishaas per 2011 Census
… 6
1.03 District-wise SC & ST Population with percentage to total population of Odishaas per 2011Census
… 8
1.04 Population by Sex, Density & Growth rate … 10
1.05 District wise sex ratio among all category, SC & ST by residence of Odishaas per 2011 Census.
… 11
1.06 District wise Literacy rate, 2011 Census … 12
1.07 Child population in the age Group 0-6 in different district of Odisha as per 2011 Census … 13
II AREA AND POPULATION
2.01 Geographical Area, Households and Number of Census Villages in different Blocks and ULBs of the District ( 2001 Census )
… 14
2.02 Classification of Workers ( Main and Marginal ) … 15
2.03 Total workers and work participation by residence … 17
III CLIMATE
3.01 Month wise Rainfall in different Rain gauge Stations in the District … 18
3.02 Month wise Temperature and Relative Humidity of the district, 2010 & 2011 … 20
IV AGRICULTURE
4.01 Blockwise Land Utlisation pattern of the district during 2010-11 … 21
4.02 Season wise Estimated Area,Yield rate and Production of Paddy in different Blocks and ULBs of the district.
… 23
4.03 Estimated Area, Yield rate and Production of different programmedMinor crops in the district.
… 25
4.04 Source wise Irrigation Potential Created in different Blocks of the district … 26
4.05 Achievement of Pani Panchayat of different Blocks of thedistrict … 27
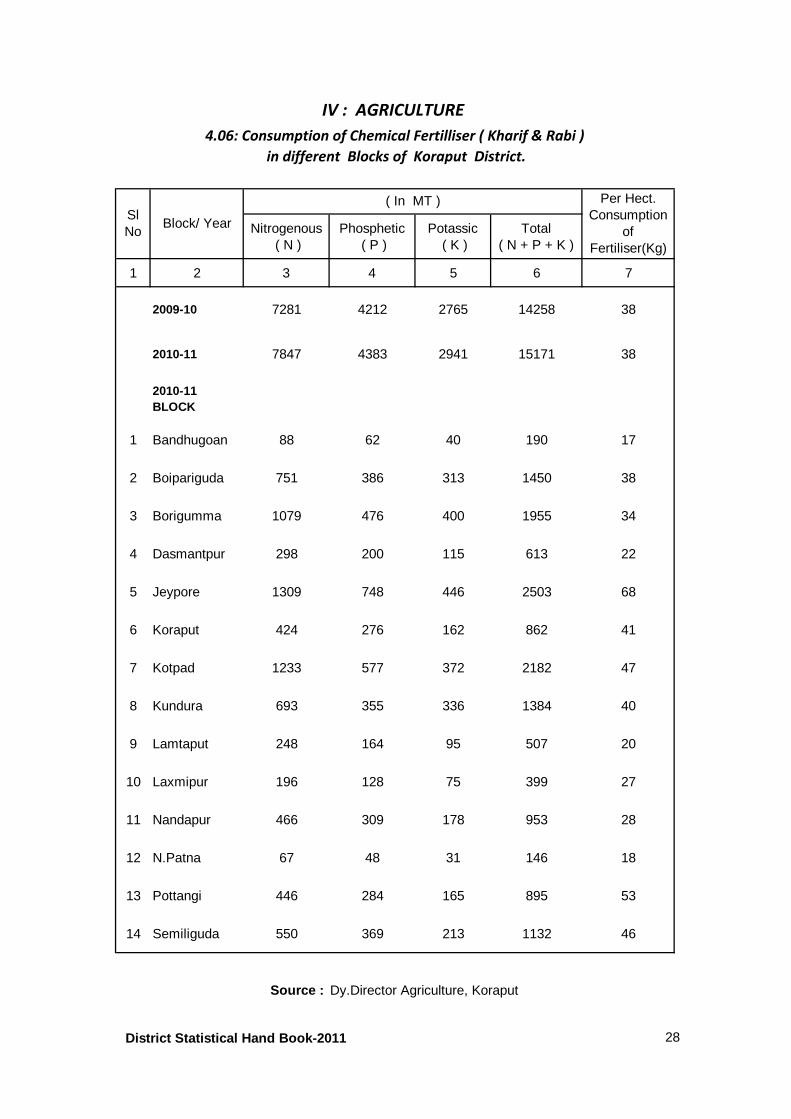
4.06 Consumption of Chemical Fertiliser ( Kharif and Rabi ) in different Blocks of the district
… 28
CONTENTSCONTENTSCONTENTSCONTENTS
[ 2 ]
Table No. SUBJECT PAGE
( 1 ) ( 2 ) ( 3 )
V CO-OPERATION
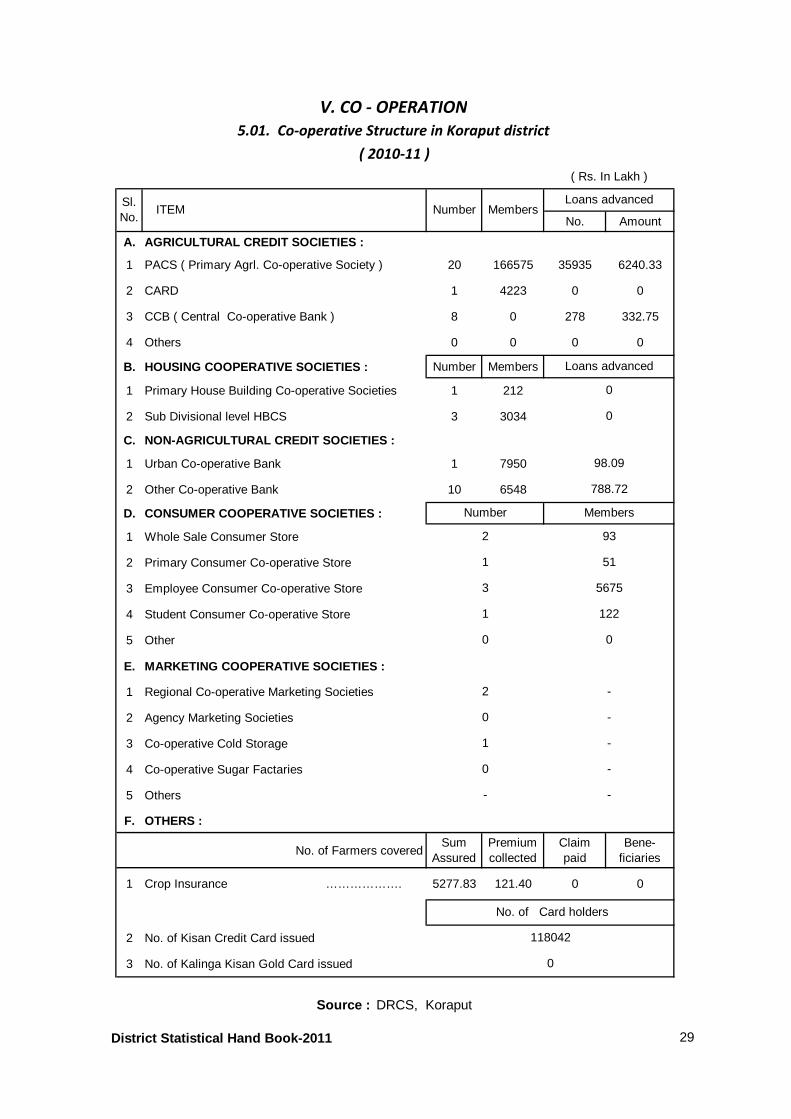
5.01 Co-operative Structure in the district ( 2010-11 ) … 29
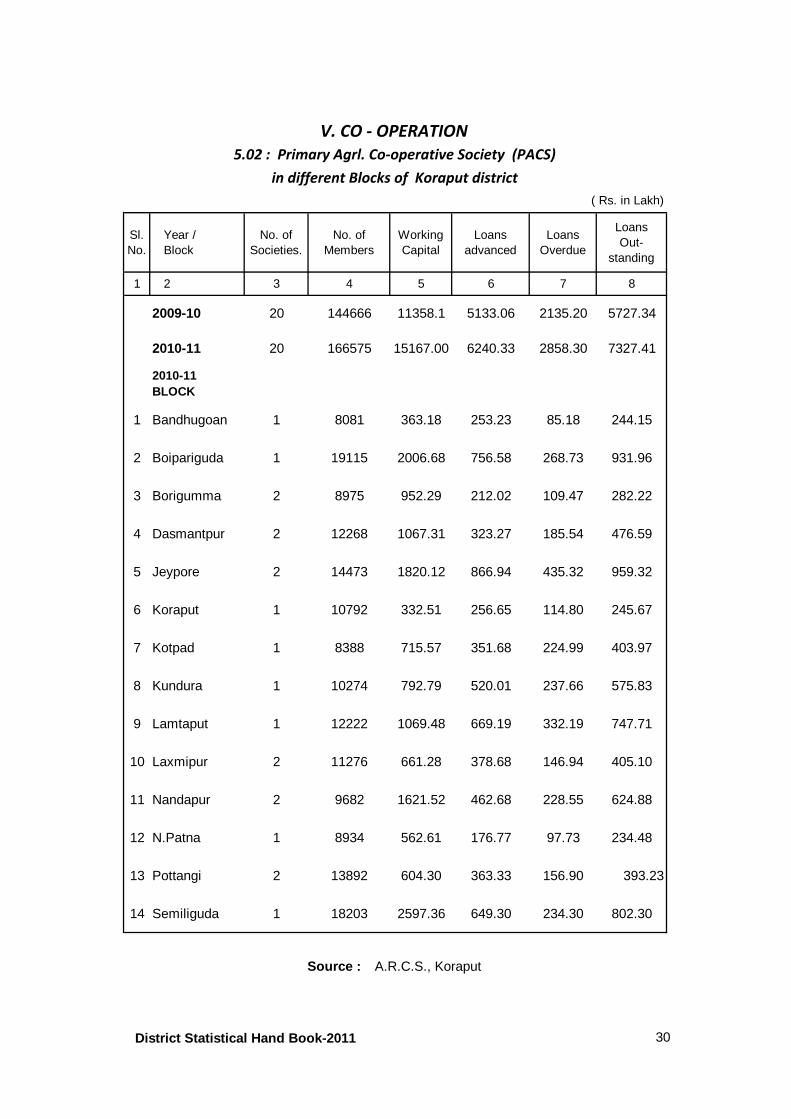
5.02 Activities of Primary Agrl. Co-operative Society (PACS) indifferent Blocks of the district
… 30
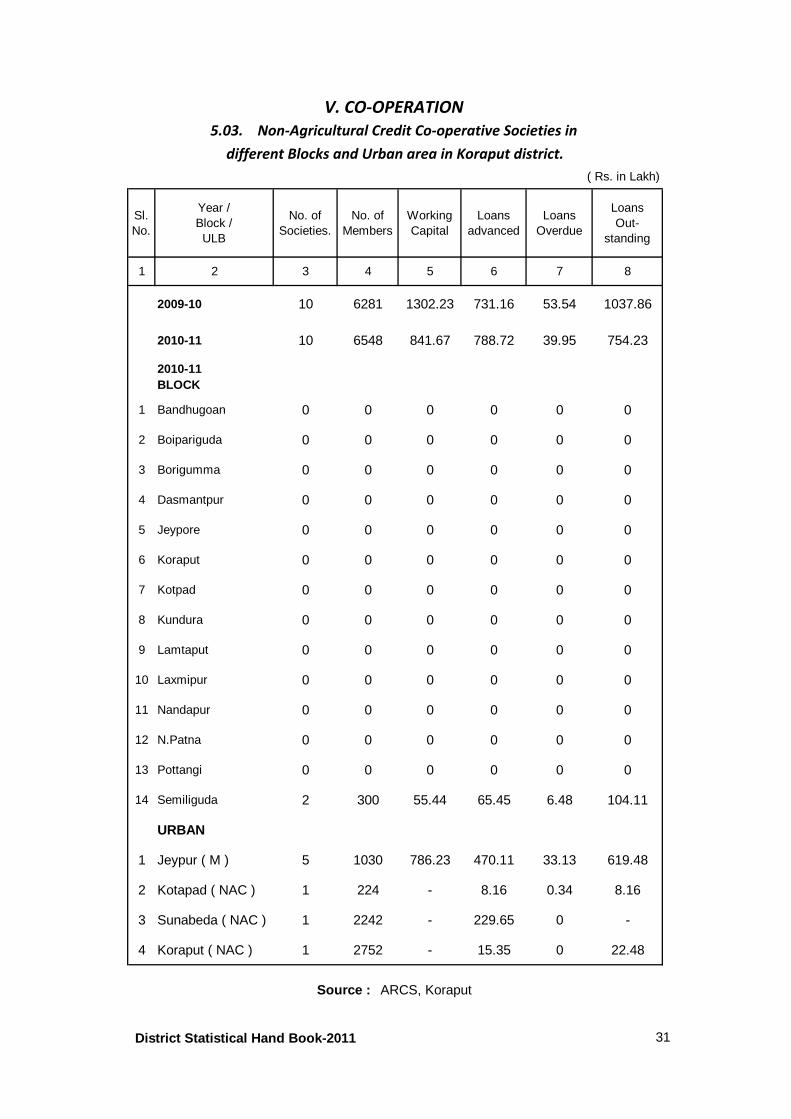
5.03 Non-Agricultural Credit Society in different Blocks & Urban areas of the district … 31
5.04 Marketing Co-operative Societies in different Blocks and Urban areas of the district
… 32
VI FOREST
6.01 Classification of forest Area by legal status in the district … 33
VII FISHERY
7.01 Block-wise Production of Fish in different Blocks of the district … 34
VIII LIVE STOCK AND ANIMAL HUSBANDRY
8.01 District wise Livestock Population as per 2007 (Quick Reports) Livestock Census … 35
8.02 Veterinary Institutions and personnel in different Blocks and Urban areas of the district
… 37
8.03 Treatment of Animal and Progeny Born in different Blocks andUrban areas of the districts.
… 38
8.04 District wise Production of Milk, Meat and Egg in the year 2010-11 … 39
IX INDUSTRY AND MINING
9.01 Activities of Small Scale, Handicrafts & Cottage and Handloom Industries in the district … 42
9.02 Mining Activities in Odisha, 2010-11 … 43
X POWER
10.01 Division- wise Consumption of Electricity in the district during the year 2010-11 … 49
10.02 Villages Electrified in Odisha at the end of the year 2011-12 … 50
XI TRANSPORT AND COMMUNICATION
11.01 Postal Net-work different Block and ULBs of th district, 2011-12 … 51
11.02 Telecommunication Service in different Block and ULBs of the district … 52
11.03 Distance of Sub Divisional Hqrs / Block Hqrs / Main Hats ( Market) fromDistrict Hqrs of the district ( 2010-11 )
… 53
11.04 Motor Vehicles Registered in the district. … 54
11.05 District- wise Railway routes and No. of Railway Stations in the state of Orissa for the year 2011
… 55
11.06 Length of different categories of Roads in the Districts … 56
11.07 Important Tourist Spots of the district ( 2010-11 ) … 57
[ 3 ]
Table No. SUBJECT PAGE
( 1 ) ( 2 ) ( 3 )
XII EDUCATION
12.01 No. of different Educational Institution, Teachers / Lectures and Enrollment of students in the district ( 2010-11)
… 58
12.02 No. of Primary Schools,Teachers and Students in differentBlock and Urban area of the district
… 59
12.03 No. of Middle Schools,Teachers and Students in different Block and Urban area of the district
… 61
12.04 No. of Secondary Schools,Teachers and Students in different Block and Urban area of the district
… 63
12.05 No. of Colleges for General education, Lectures and Students in different Block and Urban area of the districts.
… 65
12.06 Literacy rate by Sex and Social Groups in different Blocks andUrban ares of the district as per 2001 Census.
… 67
XIII HEALTH AND FAMILY WELFARE
13.01Health care infrastructures ( Allopathic ) in different Blocks and Urban areas of the district.
… 68
13.02Ayush infrastructures ( Homoeopathic) , Patients treated in different blocksand urban areas of the district.
… 70
13.03Ayush infrastructures ( Ayurvedic / Uanani ) Patients treated in differentBlocks and Urban areas of the district.
… 71
13.04 Family welfare,Maternity and Child health programmes of the district. … 72
13.05 No. of Births, Deaths and Infant Deaths registered in the district. … 73
13.06 Achievement under Health Control Programmes in the districts., 2011 … 74
13.07 Availability of Drinking Water facilities in different Block of the district. … 76
XIV BANKING
14.01No. of Reporting Offices, Aggrigate Deposits and Gross Bank Creditof Schedule Commercial Banks in the district.
… 77
XV REVENUE
15.01 Collection of Land revenue Statistics in the district. … 78
15.02 Collection of different type of Tax in the district. … 79
[ 4 ]
Table No. SUBJECT PAGE
( 1 ) ( 2 ) ( 3 )
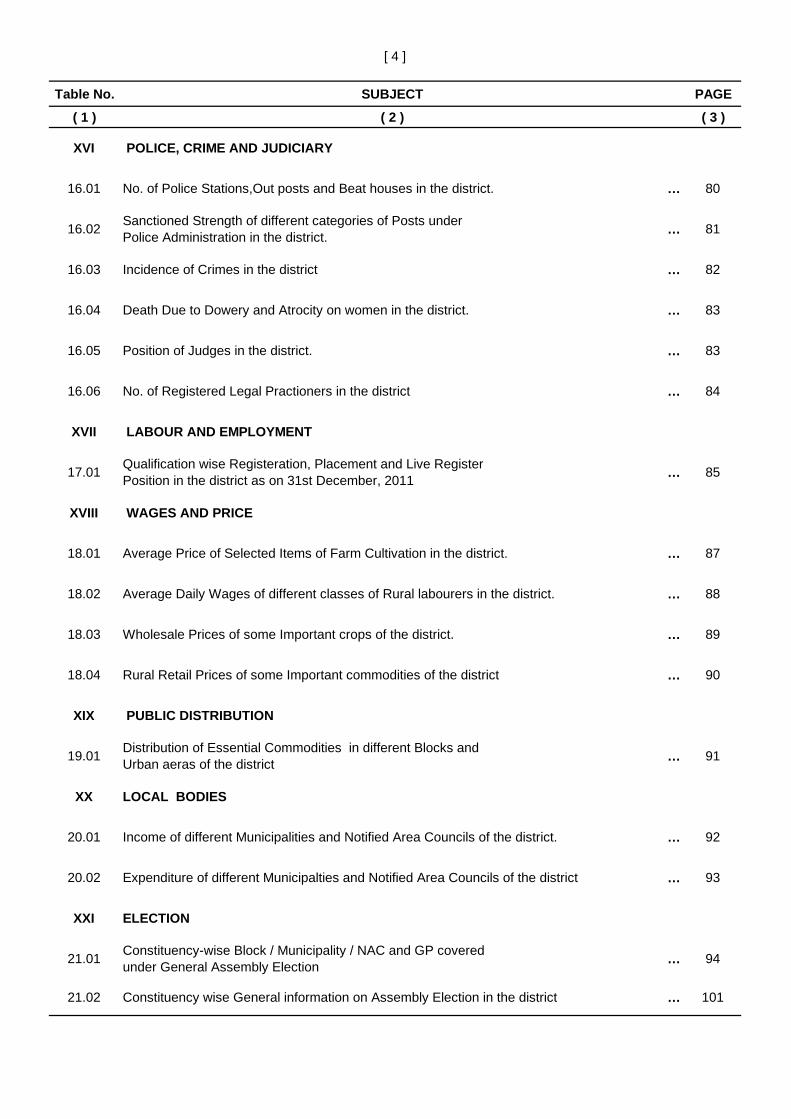
XVI POLICE, CRIME AND JUDICIARY
16.01 No. of Police Stations,Out posts and Beat houses in the district. … 80
16.02Sanctioned Strength of different categories of Posts under Police Administration in the district.
… 81
16.03 Incidence of Crimes in the district … 82
16.04 Death Due to Dowery and Atrocity on women in the district. … 83
16.05 Position of Judges in the district. … 83
16.06 No. of Registered Legal Practioners in the district … 84
XVII LABOUR AND EMPLOYMENT
17.01Qualification wise Registeration, Placement and Live RegisterPosition in the district as on 31st December, 2011
… 85
XVIII WAGES AND PRICE
18.01 Average Price of Selected Items of Farm Cultivation in the district. … 87
18.02 Average Daily Wages of different classes of Rural labourers in the district. … 88
18.03 Wholesale Prices of some Important crops of the district. … 89
18.04 Rural Retail Prices of some Important commodities of the district … 90
XIX PUBLIC DISTRIBUTION
19.01Distribution of Essential Commodities in different Blocks andUrban aeras of the district
… 91
XX LOCAL BODIES
20.01 Income of different Municipalities and Notified Area Councils of the district. … 92
20.02 Expenditure of different Municipalties and Notified Area Councils of the district … 93
XXI ELECTION
21.01Constituency-wise Block / Municipality / NAC and GP covered under General Assembly Election
… 94
21.02 Constituency wise General information on Assembly Election in the district … 101
[ 5 ]
Table No. SUBJECT PAGE
( 1 ) ( 2 ) ( 3 )
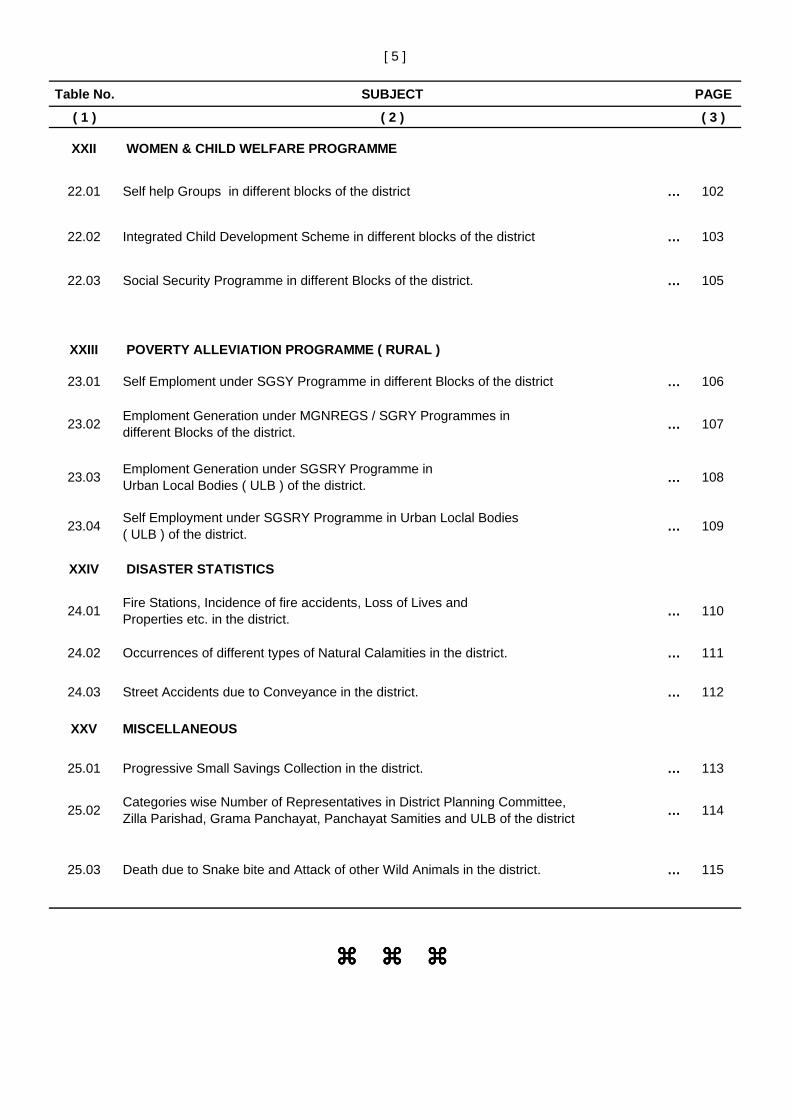
XXII WOMEN & CHILD WELFARE PROGRAMME
22.01 Self help Groups in different blocks of the district … 102
22.02 Integrated Child Development Scheme in different blocks of the district … 103
22.03 Social Security Programme in different Blocks of the district. … 105
XXIII POVERTY ALLEVIATION PROGRAMME ( RURAL )
23.01 Self Emploment under SGSY Programme in different Blocks of the district … 106
23.02Emploment Generation under MGNREGS / SGRY Programmes in different Blocks of the district.
… 107
23.03Emploment Generation under SGSRY Programme inUrban Local Bodies ( ULB ) of the district.
… 108
23.04Self Employment under SGSRY Programme in Urban Loclal Bodies( ULB ) of the district.
… 109
XXIV DISASTER STATISTICS
24.01Fire Stations, Incidence of fire accidents, Loss of Lives andProperties etc. in the district.
… 110
24.02 Occurrences of different types of Natural Calamities in the district. … 111
24.03 Street Accidents due to Conveyance in the district. … 112
XXV MISCELLANEOUS
25.01 Progressive Small Savings Collection in the district. … 113
25.02Categories wise Number of Representatives in District Planning Committee,Zilla Parishad, Grama Panchayat, Panchayat Samities and ULB of the district
… 114
25.03 Death due to Snake bite and Attack of other Wild Animals in the district. … 115
� � �� � �� � �� � �
District Statistical Hand – Book, 2011 1
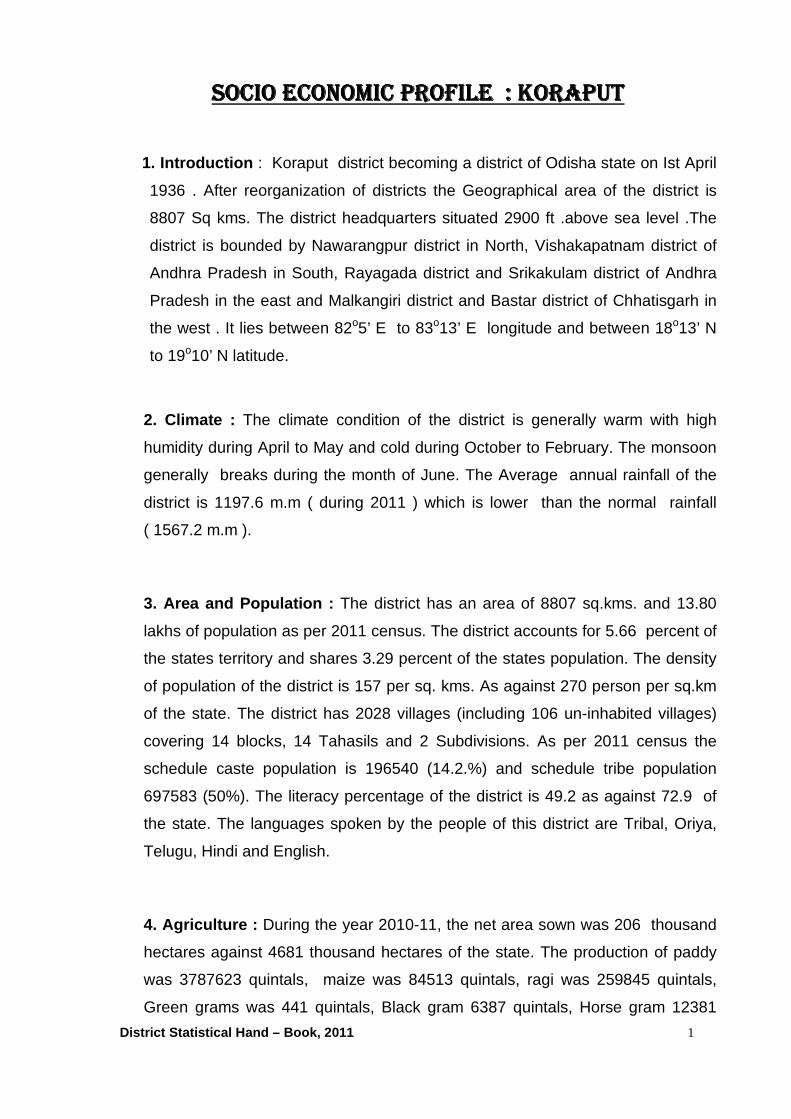
SOCIO ECONOMIC PROFILE SOCIO ECONOMIC PROFILE SOCIO ECONOMIC PROFILE SOCIO ECONOMIC PROFILE : KORAPUT: KORAPUT: KORAPUT: KORAPUT
1. Introduction : Koraput district becoming a district of Odisha state on Ist April
1936 . After reorganization of districts the Geographical area of the district is
8807 Sq kms. The district headquarters situated 2900 ft .above sea level .The
district is bounded by Nawarangpur district in North, Vishakapatnam district of
Andhra Pradesh in South, Rayagada district and Srikakulam district of Andhra
Pradesh in the east and Malkangiri district and Bastar district of Chhatisgarh in
the west . It lies between 82o5’ E to 83o13’ E longitude and between 18o13’ N
to 19o10’ N latitude.
2. Climate : The climate condition of the district is generally warm with high
humidity during April to May and cold during October to February. The monsoon
generally breaks during the month of June. The Average annual rainfall of the
district is 1197.6 m.m ( during 2011 ) which is lower than the normal rainfall
( 1567.2 m.m ).
3. Area and Population : The district has an area of 8807 sq.kms. and 13.80
lakhs of population as per 2011 census. The district accounts for 5.66 percent of
the states territory and shares 3.29 percent of the states population. The density
of population of the district is 157 per sq. kms. As against 270 person per sq.km
of the state. The district has 2028 villages (including 106 un-inhabited villages)
covering 14 blocks, 14 Tahasils and 2 Subdivisions. As per 2011 census the
schedule caste population is 196540 (14.2.%) and schedule tribe population
697583 (50%). The literacy percentage of the district is 49.2 as against 72.9 of
the state. The languages spoken by the people of this district are Tribal, Oriya,
Telugu, Hindi and English.
4. Agriculture : During the year 2010-11, the net area sown was 206 thousand
hectares against 4681 thousand hectares of the state. The production of paddy
was 3787623 quintals, maize was 84513 quintals, ragi was 259845 quintals,
Green grams was 441 quintals, Black gram 6387 quintals, Horse gram 12381
District Statistical Hand – Book, 2011 2
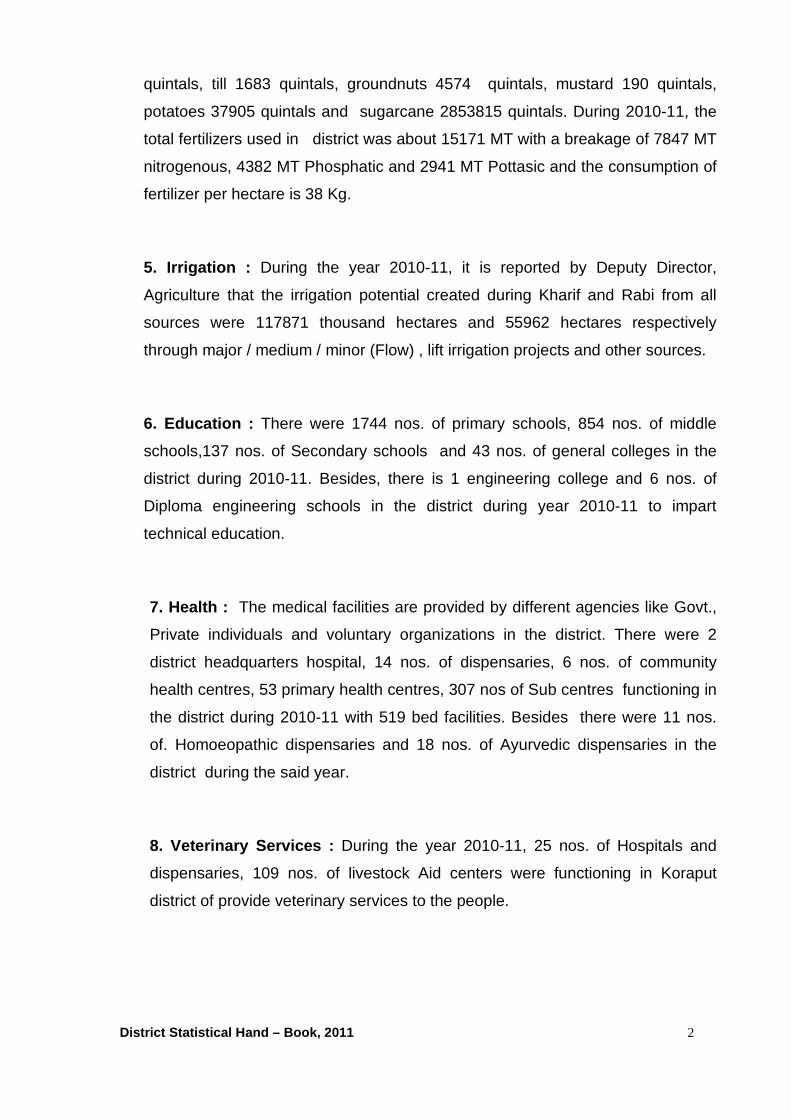
quintals, till 1683 quintals, groundnuts 4574 quintals, mustard 190 quintals,
potatoes 37905 quintals and sugarcane 2853815 quintals. During 2010-11, the
total fertilizers used in district was about 15171 MT with a breakage of 7847 MT
nitrogenous, 4382 MT Phosphatic and 2941 MT Pottasic and the consumption of
fertilizer per hectare is 38 Kg.
5. Irrigation : During the year 2010-11, it is reported by Deputy Director,
Agriculture that the irrigation potential created during Kharif and Rabi from all
sources were 117871 thousand hectares and 55962 hectares respectively
through major / medium / minor (Flow) , lift irrigation projects and other sources.
6. Education : There were 1744 nos. of primary schools, 854 nos. of middle
schools,137 nos. of Secondary schools and 43 nos. of general colleges in the
district during 2010-11. Besides, there is 1 engineering college and 6 nos. of
Diploma engineering schools in the district during year 2010-11 to impart
technical education.
7. Health : The medical facilities are provided by different agencies like Govt.,
Private individuals and voluntary organizations in the district. There were 2
district headquarters hospital, 14 nos. of dispensaries, 6 nos. of community
health centres, 53 primary health centres, 307 nos of Sub centres functioning in
the district during 2010-11 with 519 bed facilities. Besides there were 11 nos.
of. Homoeopathic dispensaries and 18 nos. of Ayurvedic dispensaries in the
district during the said year.
8. Veterinary Services : During the year 2010-11, 25 nos. of Hospitals and
dispensaries, 109 nos. of livestock Aid centers were functioning in Koraput
district of provide veterinary services to the people.
District Statistical Hand – Book, 2011 3
9. Industry and Mining : During the year 2010-11, 126 nos. of small scale
industries have established with total capital investment of about Rs. 514.00
lakhs and 773 nos. of Employment generated in the district.
10. Power : Consumption of electricity in Koraput district during the year 2010-
11 was 280.813 million units and villages so far electrified as on 2010-11 was
131 revenue villages which constitutes 7 % to the total inhabited villages of the
district.
11. Tourist : There are 13 nos. of tourist center in the district such as Bagra,
Deomali, Duduma, Gupteswar, Jalaput, Koraput, Nandapur, Subai, Sunabeda,
Kechha Bagra Cave, Gulmi and Raja Cave identified by department of
Tourism and Culture, Odisha. The number of Domestic tourists and foreign
tourists who visited the tourists spots of the district during 2011 were 724192
and 482 respectively. Some major rivers of Odisha pass through the district
Koraput like Machhakunda, Bansadhara and kolab. It also contains laegest
mountain of Odisha called Deomali along with Chandragiri mountain.
12. Transport & Communication : During 2010-11, 174 Kms. of National
Highways, 93 Kms. of state highways, 330 Kms. major district roads, 270 kms
of other district roads, 1143 Kms. of Panchayat samiti roads, 5967(P) Kms of
Gram Panchayat roads and 209 Kms of forest roads are operating in the
district. Besides, 281 kms. of Railway lines with 27 nos. of railway stations
including passenger halts are continuing in the district.
13. Banking : As on 31 March 2011, there were 76 nos. of schedule
commercial banks having Rs.2106 crores rupees deposit and Rs.721 crores of
credit in the district.
� � �
Sl. No.
Item Unit Magnitude
1 2 3 4
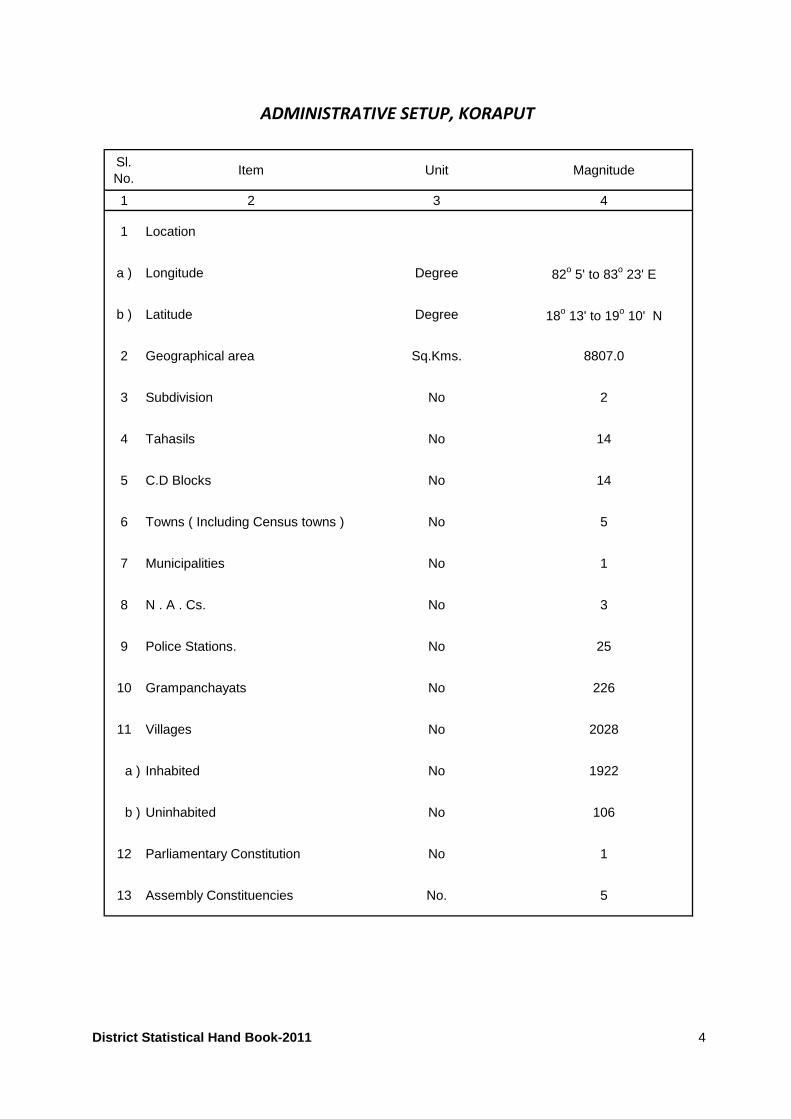
1 Location
a ) Longitude Degree 82o 5' to 83o 23' E
b ) Latitude Degree 18o 13' to 19o 10' N
2 Geographical area Sq.Kms. 8807.0
3 Subdivision No 2
4 Tahasils No 14
5 C.D Blocks No 14
6 Towns ( Including Census towns ) No 5
7 Municipalities No 1
8 N . A . Cs. No 3
9 Police Stations. No 25
10 Grampanchayats No 226
11 Villages No 2028
a ) Inhabited No 1922
b ) Uninhabited No 106
12 Parliamentary Constitution No 1
13 Assembly Constituencies No. 5
ADMINISTRATIVE SETUP, KORAPUT
District Statistical Hand Book-2011 4
Sl.No.
Name of theDistrict
GeographicalArea
( Sq.Km.)
Distributionof land
areas ( % )Rank
1 2 3 4 5
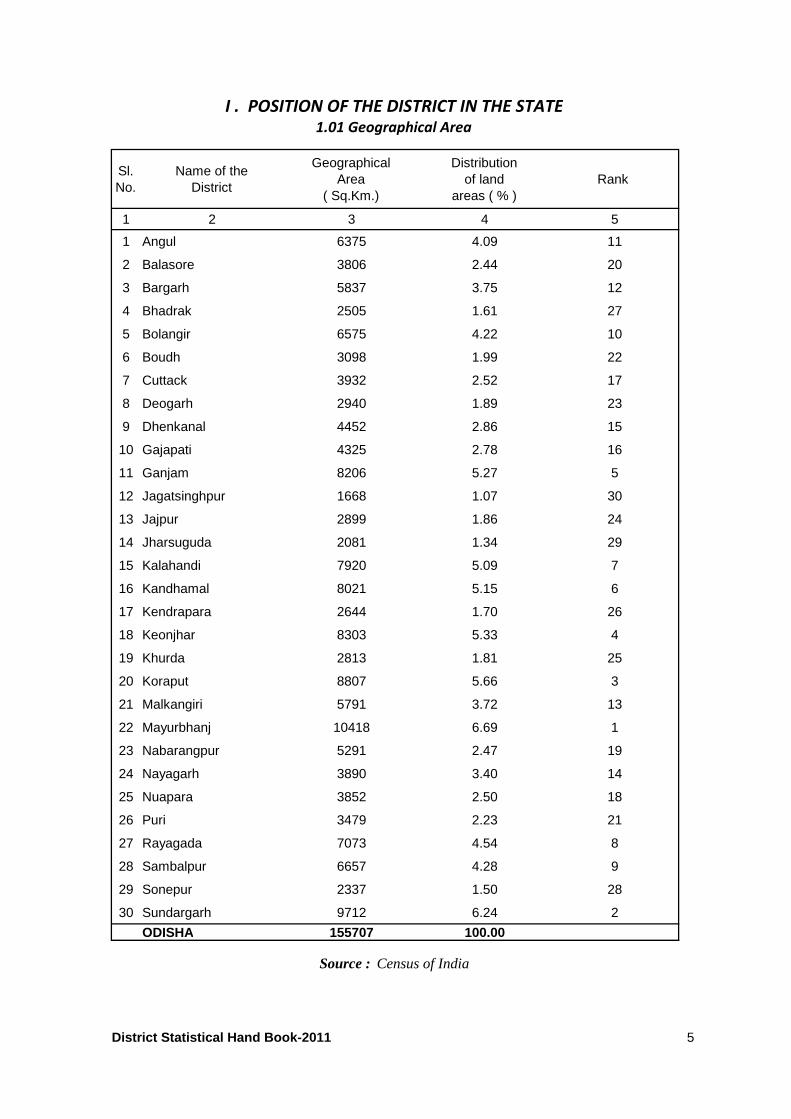
1 Angul 6375 4.09 11
2 Balasore 3806 2.44 20
3 Bargarh 5837 3.75 12
4 Bhadrak 2505 1.61 27
5 Bolangir 6575 4.22 10
6 Boudh 3098 1.99 22
7 Cuttack 3932 2.52 17
8 Deogarh 2940 1.89 23
9 Dhenkanal 4452 2.86 15
10 Gajapati 4325 2.78 16
11 Ganjam 8206 5.27 5
12 Jagatsinghpur 1668 1.07 30
13 Jajpur 2899 1.86 24
14 Jharsuguda 2081 1.34 29
15 Kalahandi 7920 5.09 7
16 Kandhamal 8021 5.15 6
17 Kendrapara 2644 1.70 26
18 Keonjhar 8303 5.33 4
19 Khurda 2813 1.81 25
20 Koraput 8807 5.66 3
21 Malkangiri 5791 3.72 13
22 Mayurbhanj 10418 6.69 1
23 Nabarangpur 5291 2.47 19
24 Nayagarh 3890 3.40 14
25 Nuapara 3852 2.50 18
26 Puri 3479 2.23 21
27 Rayagada 7073 4.54 8
28 Sambalpur 6657 4.28 9
29 Sonepur 2337 1.50 28
30 Sundargarh 9712 6.24 2
ODISHA 155707 100.00
I . POSITION OF THE DISTRICT IN THE STATE
1.01 Geographical Area
Source : Census of India
District Statistical Hand Book-2011 5
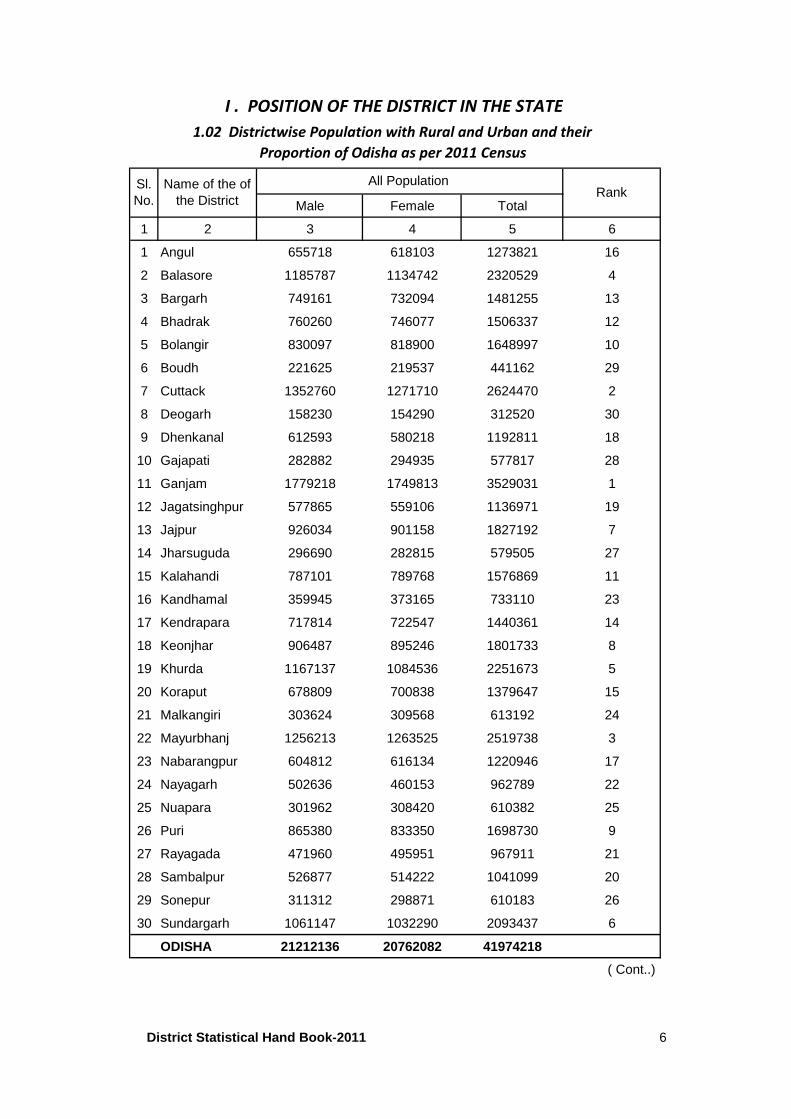
Male Female Total
1 2 3 4 5 6
1 Angul 655718 618103 1273821 16
2 Balasore 1185787 1134742 2320529 4
3 Bargarh 749161 732094 1481255 13
4 Bhadrak 760260 746077 1506337 12
5 Bolangir 830097 818900 1648997 10
6 Boudh 221625 219537 441162 29
7 Cuttack 1352760 1271710 2624470 2
8 Deogarh 158230 154290 312520 30
9 Dhenkanal 612593 580218 1192811 18
10 Gajapati 282882 294935 577817 28
11 Ganjam 1779218 1749813 3529031 1
12 Jagatsinghpur 577865 559106 1136971 19
13 Jajpur 926034 901158 1827192 7
14 Jharsuguda 296690 282815 579505 27
15 Kalahandi 787101 789768 1576869 11
16 Kandhamal 359945 373165 733110 23
17 Kendrapara 717814 722547 1440361 14
18 Keonjhar 906487 895246 1801733 8
19 Khurda 1167137 1084536 2251673 5
20 Koraput 678809 700838 1379647 15
21 Malkangiri 303624 309568 613192 24
22 Mayurbhanj 1256213 1263525 2519738 3
23 Nabarangpur 604812 616134 1220946 17
24 Nayagarh 502636 460153 962789 22
25 Nuapara 301962 308420 610382 25
26 Puri 865380 833350 1698730 9
27 Rayagada 471960 495951 967911 21
28 Sambalpur 526877 514222 1041099 20
29 Sonepur 311312 298871 610183 26
30 Sundargarh 1061147 1032290 2093437 6
ODISHA 21212136 20762082 41974218
( Cont..)
Sl. No.
Name of the of the District
I . POSITION OF THE DISTRICT IN THE STATE
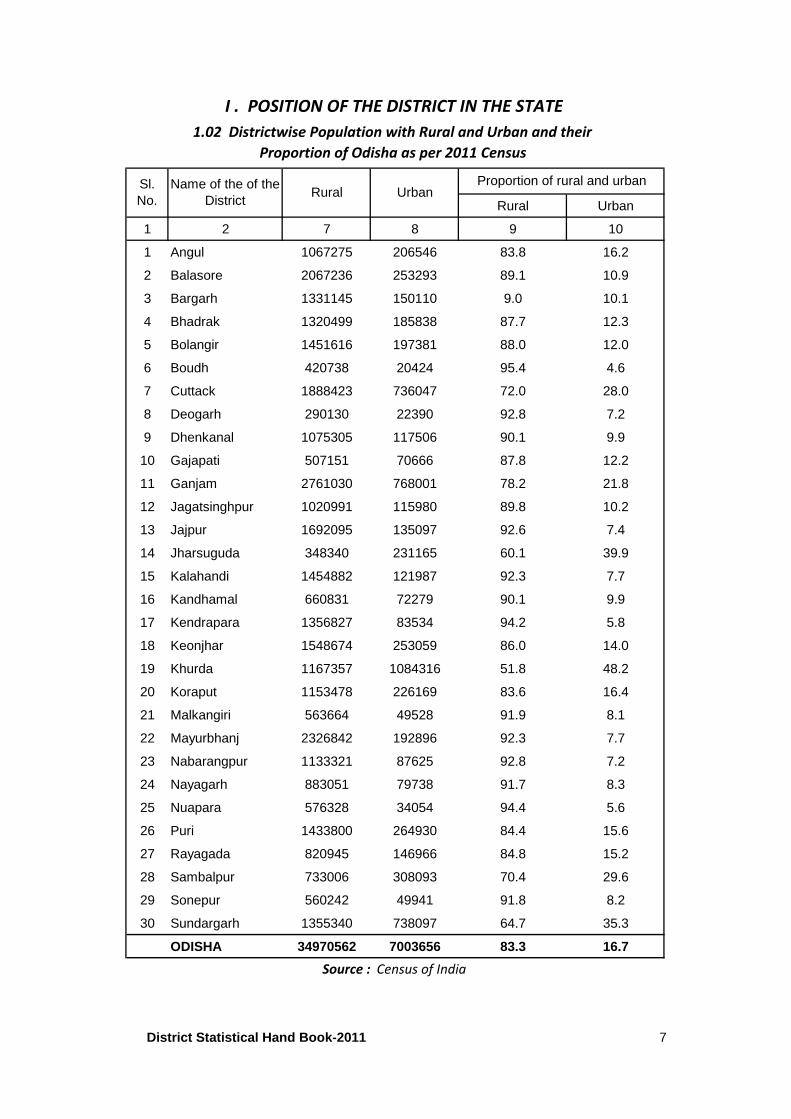
1.02 Districtwise Population with Rural and Urban and their
Proportion of Odisha as per 2011 Census
All Population Rank
District Statistical Hand Book-2011 6
Rural Urban
1 2 7 8 9 10
1 Angul 1067275 206546 83.8 16.2
2 Balasore 2067236 253293 89.1 10.9
3 Bargarh 1331145 150110 9.0 10.1
4 Bhadrak 1320499 185838 87.7 12.3
5 Bolangir 1451616 197381 88.0 12.0
6 Boudh 420738 20424 95.4 4.6
7 Cuttack 1888423 736047 72.0 28.0
8 Deogarh 290130 22390 92.8 7.2
9 Dhenkanal 1075305 117506 90.1 9.9
10 Gajapati 507151 70666 87.8 12.2
11 Ganjam 2761030 768001 78.2 21.8
12 Jagatsinghpur 1020991 115980 89.8 10.2
13 Jajpur 1692095 135097 92.6 7.4
14 Jharsuguda 348340 231165 60.1 39.9
15 Kalahandi 1454882 121987 92.3 7.7
16 Kandhamal 660831 72279 90.1 9.9
17 Kendrapara 1356827 83534 94.2 5.8
18 Keonjhar 1548674 253059 86.0 14.0
19 Khurda 1167357 1084316 51.8 48.2
20 Koraput 1153478 226169 83.6 16.4
21 Malkangiri 563664 49528 91.9 8.1
22 Mayurbhanj 2326842 192896 92.3 7.7
23 Nabarangpur 1133321 87625 92.8 7.2
24 Nayagarh 883051 79738 91.7 8.3
25 Nuapara 576328 34054 94.4 5.6
26 Puri 1433800 264930 84.4 15.6
27 Rayagada 820945 146966 84.8 15.2
28 Sambalpur 733006 308093 70.4 29.6
29 Sonepur 560242 49941 91.8 8.2
30 Sundargarh 1355340 738097 64.7 35.3
ODISHA 34970562 7003656 83.3 16.7
Sl. No.
Name of the of the District
Rural UrbanProportion of rural and urban
Source : Census of India
I . POSITION OF THE DISTRICT IN THE STATE
1.02 Districtwise Population with Rural and Urban and their
Proportion of Odisha as per 2011 Census
District Statistical Hand Book-2011 7
Total Males Females Rural Urban
1 2 3 4 5 6 7 8
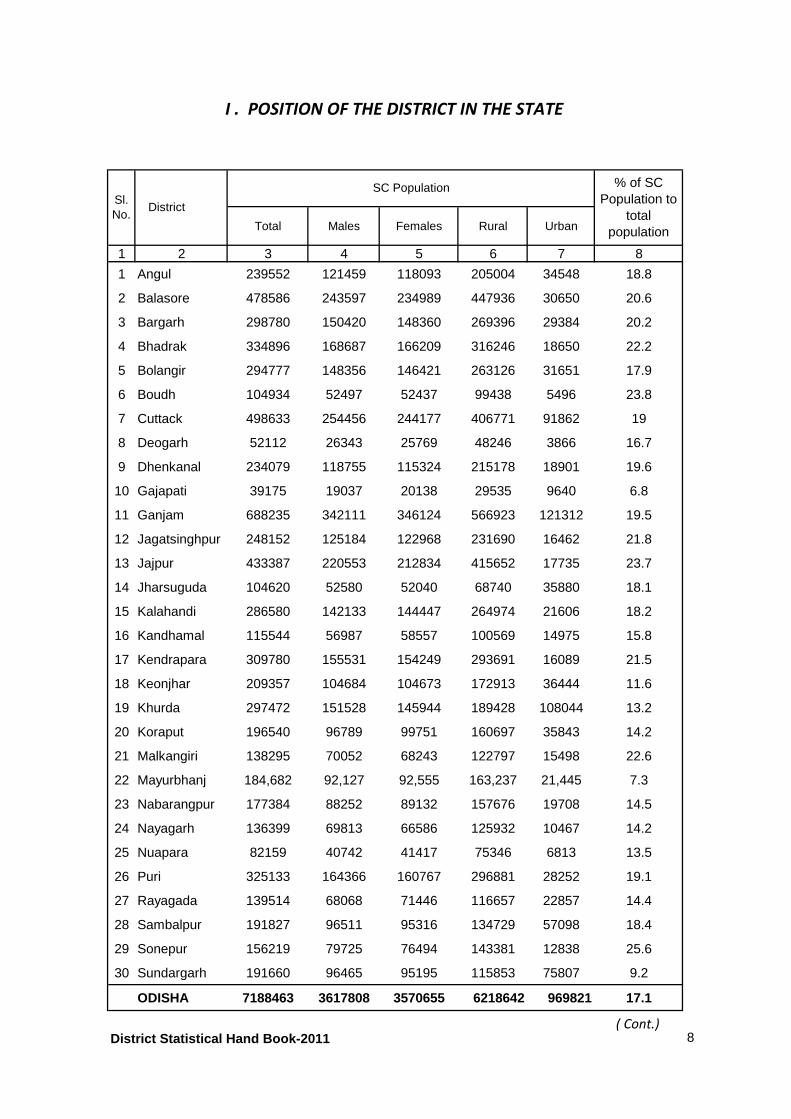
1 Angul 239552 121459 118093 205004 34548 18.8
2 Balasore 478586 243597 234989 447936 30650 20.6
3 Bargarh 298780 150420 148360 269396 29384 20.2
4 Bhadrak 334896 168687 166209 316246 18650 22.2
5 Bolangir 294777 148356 146421 263126 31651 17.9
6 Boudh 104934 52497 52437 99438 5496 23.8
7 Cuttack 498633 254456 244177 406771 91862 19
8 Deogarh 52112 26343 25769 48246 3866 16.7
9 Dhenkanal 234079 118755 115324 215178 18901 19.6
10 Gajapati 39175 19037 20138 29535 9640 6.8
11 Ganjam 688235 342111 346124 566923 121312 19.5
12 Jagatsinghpur 248152 125184 122968 231690 16462 21.8
13 Jajpur 433387 220553 212834 415652 17735 23.7
14 Jharsuguda 104620 52580 52040 68740 35880 18.1
15 Kalahandi 286580 142133 144447 264974 21606 18.2
16 Kandhamal 115544 56987 58557 100569 14975 15.8
17 Kendrapara 309780 155531 154249 293691 16089 21.5
18 Keonjhar 209357 104684 104673 172913 36444 11.6
19 Khurda 297472 151528 145944 189428 108044 13.2
20 Koraput 196540 96789 99751 160697 35843 14.2
21 Malkangiri 138295 70052 68243 122797 15498 22.6
22 Mayurbhanj 184,682 92,127 92,555 163,237 21,445 7.3
23 Nabarangpur 177384 88252 89132 157676 19708 14.5
24 Nayagarh 136399 69813 66586 125932 10467 14.2
25 Nuapara 82159 40742 41417 75346 6813 13.5
26 Puri 325133 164366 160767 296881 28252 19.1
27 Rayagada 139514 68068 71446 116657 22857 14.4
28 Sambalpur 191827 96511 95316 134729 57098 18.4
29 Sonepur 156219 79725 76494 143381 12838 25.6
30 Sundargarh 191660 96465 95195 115853 75807 9.2
ODISHA 7188463 3617808 3570655 6218642 969821 17.1
( Cont.)
% of SC Population to
total population
Sl.No.
District
I . POSITION OF THE DISTRICT IN THE STATE
SC Population
District Statistical Hand Book-2011 8
Sl. Name of the
No. District Total Male Female Rural Urban
1 2 9 10 11 12 13 14
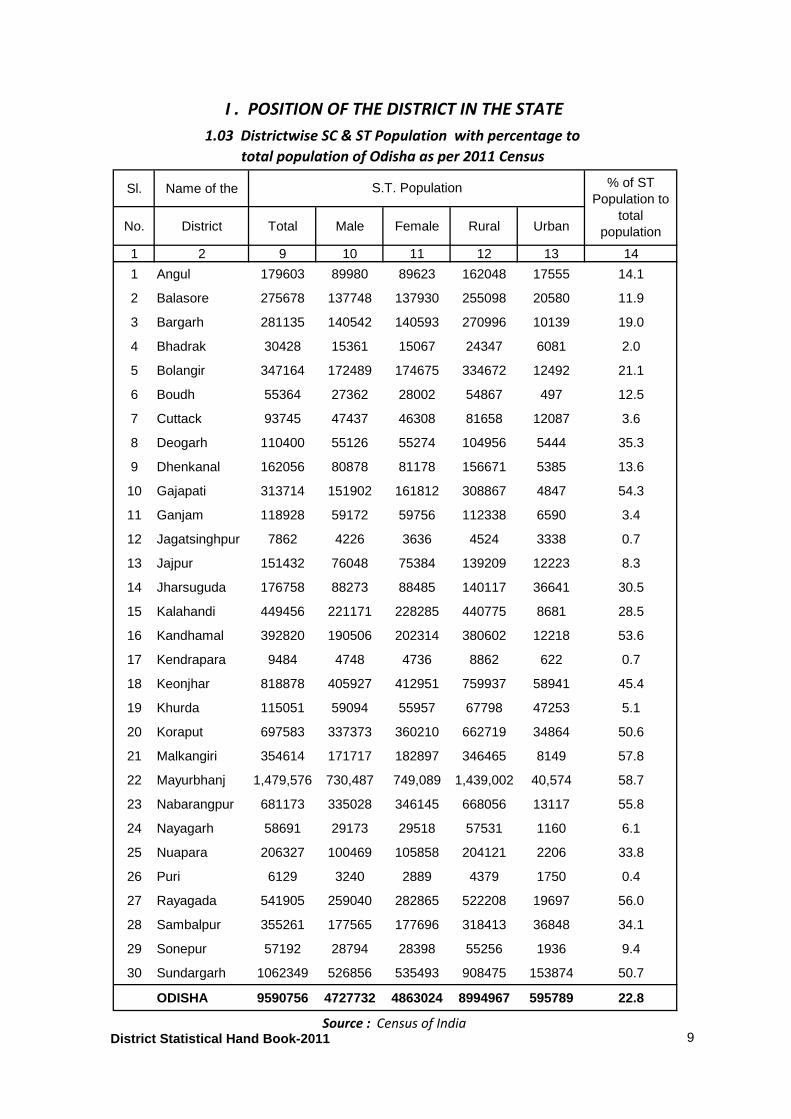
1 Angul 179603 89980 89623 162048 17555 14.1
2 Balasore 275678 137748 137930 255098 20580 11.9
3 Bargarh 281135 140542 140593 270996 10139 19.0
4 Bhadrak 30428 15361 15067 24347 6081 2.0
5 Bolangir 347164 172489 174675 334672 12492 21.1
6 Boudh 55364 27362 28002 54867 497 12.5
7 Cuttack 93745 47437 46308 81658 12087 3.6
8 Deogarh 110400 55126 55274 104956 5444 35.3
9 Dhenkanal 162056 80878 81178 156671 5385 13.6
10 Gajapati 313714 151902 161812 308867 4847 54.3
11 Ganjam 118928 59172 59756 112338 6590 3.4
12 Jagatsinghpur 7862 4226 3636 4524 3338 0.7
13 Jajpur 151432 76048 75384 139209 12223 8.3
14 Jharsuguda 176758 88273 88485 140117 36641 30.5
15 Kalahandi 449456 221171 228285 440775 8681 28.5
16 Kandhamal 392820 190506 202314 380602 12218 53.6
17 Kendrapara 9484 4748 4736 8862 622 0.7
18 Keonjhar 818878 405927 412951 759937 58941 45.4
19 Khurda 115051 59094 55957 67798 47253 5.1
20 Koraput 697583 337373 360210 662719 34864 50.6
21 Malkangiri 354614 171717 182897 346465 8149 57.8
22 Mayurbhanj 1,479,576 730,487 749,089 1,439,002 40,574 58.7
23 Nabarangpur 681173 335028 346145 668056 13117 55.8
24 Nayagarh 58691 29173 29518 57531 1160 6.1
25 Nuapara 206327 100469 105858 204121 2206 33.8
26 Puri 6129 3240 2889 4379 1750 0.4
27 Rayagada 541905 259040 282865 522208 19697 56.0
28 Sambalpur 355261 177565 177696 318413 36848 34.1
29 Sonepur 57192 28794 28398 55256 1936 9.4
30 Sundargarh 1062349 526856 535493 908475 153874 50.7
ODISHA 9590756 4727732 4863024 8994967 595789 22.8
S.T. Population % of ST Population to
total population
Source : Census of India
I . POSITION OF THE DISTRICT IN THE STATE
1.03 Districtwise SC & ST Population with percentage to
total population of Odisha as per 2011 Census
District Statistical Hand Book-2011 9
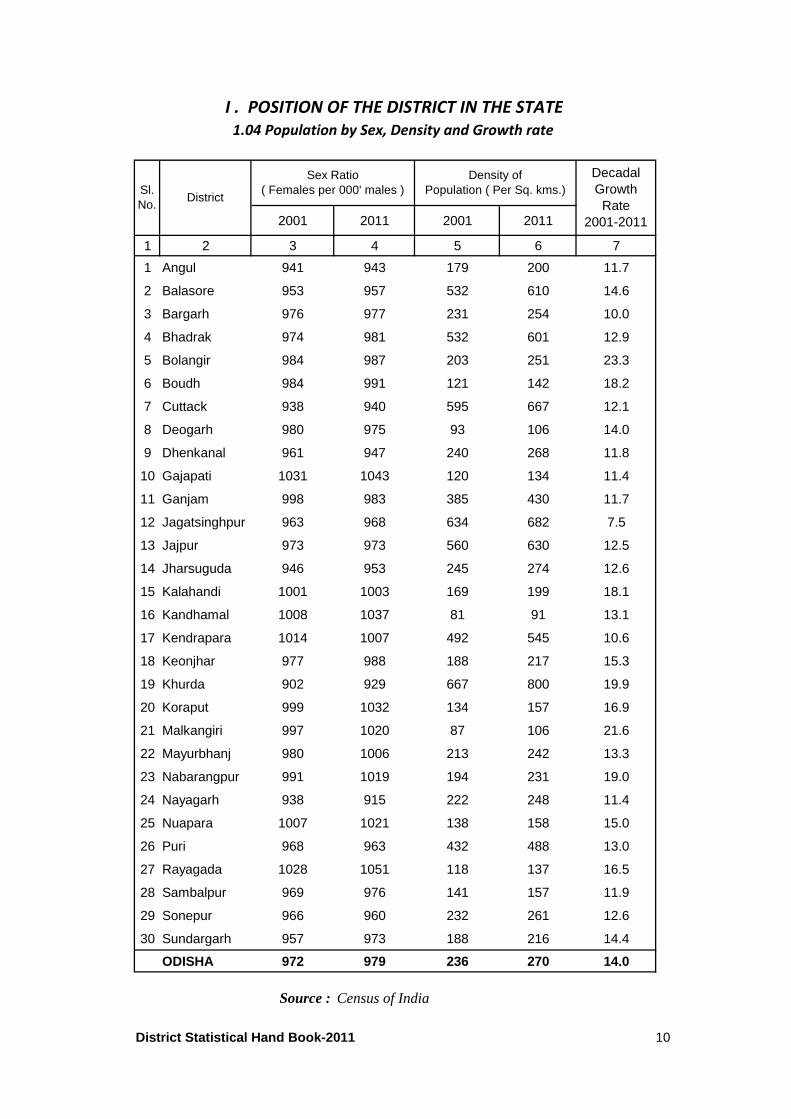
2001 2011 2001 2011
1 2 3 4 5 6 7
1 Angul 941 943 179 200 11.7
2 Balasore 953 957 532 610 14.6
3 Bargarh 976 977 231 254 10.0
4 Bhadrak 974 981 532 601 12.9
5 Bolangir 984 987 203 251 23.3
6 Boudh 984 991 121 142 18.2
7 Cuttack 938 940 595 667 12.1
8 Deogarh 980 975 93 106 14.0
9 Dhenkanal 961 947 240 268 11.8
10 Gajapati 1031 1043 120 134 11.4
11 Ganjam 998 983 385 430 11.7
12 Jagatsinghpur 963 968 634 682 7.5
13 Jajpur 973 973 560 630 12.5
14 Jharsuguda 946 953 245 274 12.6
15 Kalahandi 1001 1003 169 199 18.1
16 Kandhamal 1008 1037 81 91 13.1
17 Kendrapara 1014 1007 492 545 10.6
18 Keonjhar 977 988 188 217 15.3
19 Khurda 902 929 667 800 19.9
20 Koraput 999 1032 134 157 16.9
21 Malkangiri 997 1020 87 106 21.6
22 Mayurbhanj 980 1006 213 242 13.3
23 Nabarangpur 991 1019 194 231 19.0
24 Nayagarh 938 915 222 248 11.4
25 Nuapara 1007 1021 138 158 15.0
26 Puri 968 963 432 488 13.0
27 Rayagada 1028 1051 118 137 16.5
28 Sambalpur 969 976 141 157 11.9
29 Sonepur 966 960 232 261 12.6
30 Sundargarh 957 973 188 216 14.4
ODISHA 972 979 236 270 14.0
DistrictSl.No.
Source : Census of India
I . POSITION OF THE DISTRICT IN THE STATE
1.04 Population by Sex, Density and Growth rate
Sex Ratio( Females per 000' males )
Density ofPopulation ( Per Sq. kms.)
DecadalGrowthRate
2001-2011
District Statistical Hand Book-2011 10
Total Rural Urban Total Rural Urban Total Rural Urban
1 2 3 4 5 6 7 8 9 10 11
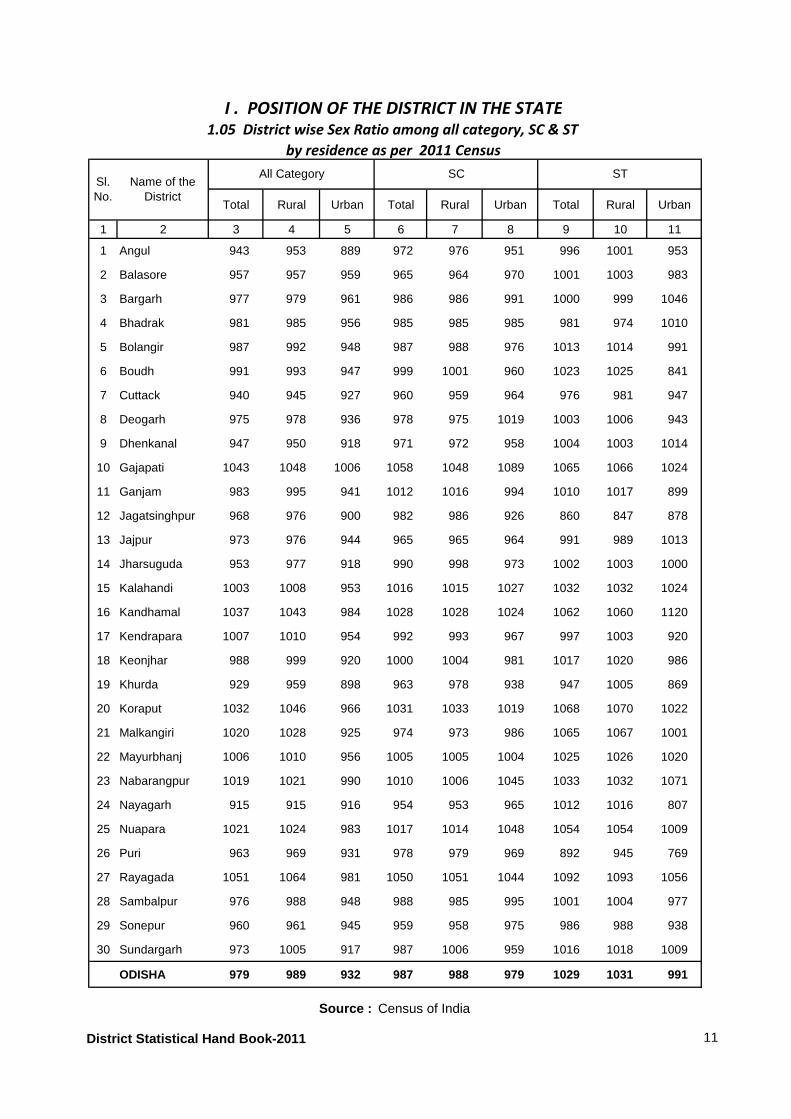
1 Angul 943 953 889 972 976 951 996 1001 953
2 Balasore 957 957 959 965 964 970 1001 1003 983
3 Bargarh 977 979 961 986 986 991 1000 999 1046
4 Bhadrak 981 985 956 985 985 985 981 974 1010
5 Bolangir 987 992 948 987 988 976 1013 1014 991
6 Boudh 991 993 947 999 1001 960 1023 1025 841
7 Cuttack 940 945 927 960 959 964 976 981 947
8 Deogarh 975 978 936 978 975 1019 1003 1006 943
9 Dhenkanal 947 950 918 971 972 958 1004 1003 1014
10 Gajapati 1043 1048 1006 1058 1048 1089 1065 1066 1024
11 Ganjam 983 995 941 1012 1016 994 1010 1017 899
12 Jagatsinghpur 968 976 900 982 986 926 860 847 878
13 Jajpur 973 976 944 965 965 964 991 989 1013
14 Jharsuguda 953 977 918 990 998 973 1002 1003 1000
15 Kalahandi 1003 1008 953 1016 1015 1027 1032 1032 1024
16 Kandhamal 1037 1043 984 1028 1028 1024 1062 1060 1120
17 Kendrapara 1007 1010 954 992 993 967 997 1003 920
18 Keonjhar 988 999 920 1000 1004 981 1017 1020 986
19 Khurda 929 959 898 963 978 938 947 1005 869
20 Koraput 1032 1046 966 1031 1033 1019 1068 1070 1022
21 Malkangiri 1020 1028 925 974 973 986 1065 1067 1001
22 Mayurbhanj 1006 1010 956 1005 1005 1004 1025 1026 1020
23 Nabarangpur 1019 1021 990 1010 1006 1045 1033 1032 1071
24 Nayagarh 915 915 916 954 953 965 1012 1016 807
25 Nuapara 1021 1024 983 1017 1014 1048 1054 1054 1009
26 Puri 963 969 931 978 979 969 892 945 769
27 Rayagada 1051 1064 981 1050 1051 1044 1092 1093 1056
28 Sambalpur 976 988 948 988 985 995 1001 1004 977
29 Sonepur 960 961 945 959 958 975 986 988 938
30 Sundargarh 973 1005 917 987 1006 959 1016 1018 1009
ODISHA 979 989 932 987 988 979 1029 1031 991
Source : Census of India
I . POSITION OF THE DISTRICT IN THE STATE
1.05 District wise Sex Ratio among all category, SC & ST
by residence as per 2011 Census
All Category SC STSl.No.
Name of theDistrict
District Statistical Hand Book-2011 11
Total Male Female Total Male Female Total Male Female
1 2 3 4 5 6 7 8 9 10 11
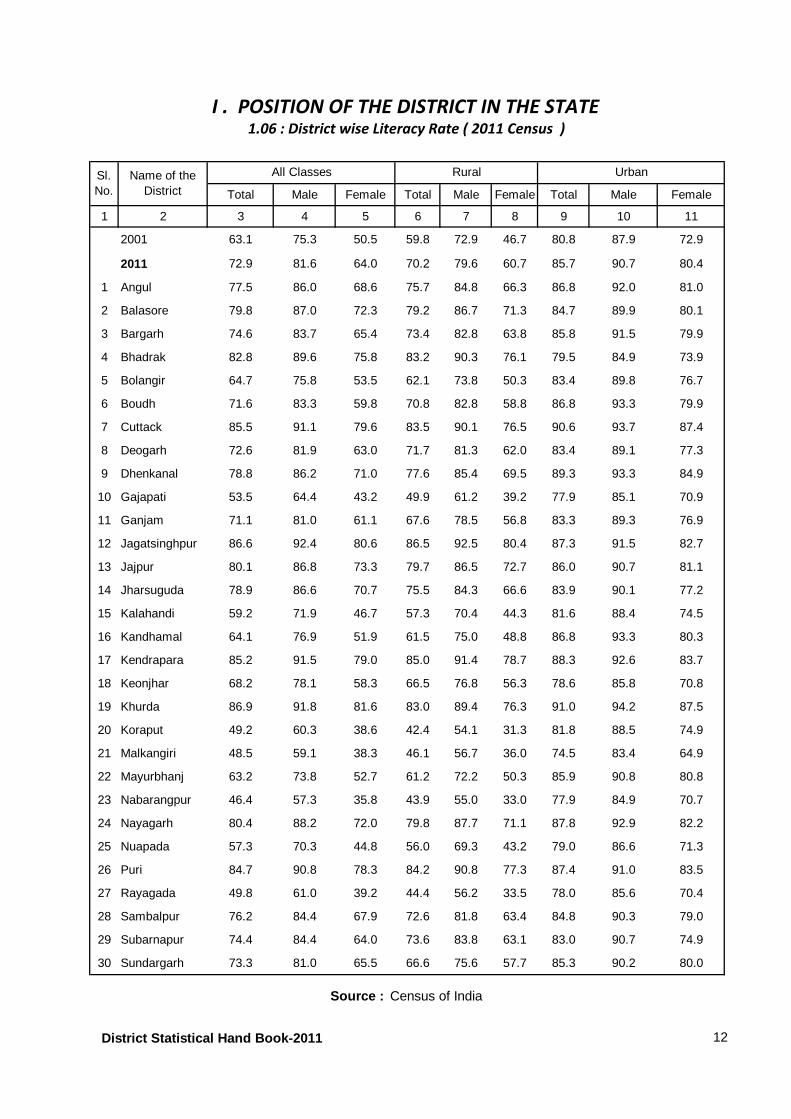
2001 63.1 75.3 50.5 59.8 72.9 46.7 80.8 87.9 72.9
2011 72.9 81.6 64.0 70.2 79.6 60.7 85.7 90.7 80.4
1 Angul 77.5 86.0 68.6 75.7 84.8 66.3 86.8 92.0 81.0
2 Balasore 79.8 87.0 72.3 79.2 86.7 71.3 84.7 89.9 80.1
3 Bargarh 74.6 83.7 65.4 73.4 82.8 63.8 85.8 91.5 79.9
4 Bhadrak 82.8 89.6 75.8 83.2 90.3 76.1 79.5 84.9 73.9
5 Bolangir 64.7 75.8 53.5 62.1 73.8 50.3 83.4 89.8 76.7
6 Boudh 71.6 83.3 59.8 70.8 82.8 58.8 86.8 93.3 79.9
7 Cuttack 85.5 91.1 79.6 83.5 90.1 76.5 90.6 93.7 87.4
8 Deogarh 72.6 81.9 63.0 71.7 81.3 62.0 83.4 89.1 77.3
9 Dhenkanal 78.8 86.2 71.0 77.6 85.4 69.5 89.3 93.3 84.9
10 Gajapati 53.5 64.4 43.2 49.9 61.2 39.2 77.9 85.1 70.9
11 Ganjam 71.1 81.0 61.1 67.6 78.5 56.8 83.3 89.3 76.9
12 Jagatsinghpur 86.6 92.4 80.6 86.5 92.5 80.4 87.3 91.5 82.7
13 Jajpur 80.1 86.8 73.3 79.7 86.5 72.7 86.0 90.7 81.1
14 Jharsuguda 78.9 86.6 70.7 75.5 84.3 66.6 83.9 90.1 77.2
15 Kalahandi 59.2 71.9 46.7 57.3 70.4 44.3 81.6 88.4 74.5
16 Kandhamal 64.1 76.9 51.9 61.5 75.0 48.8 86.8 93.3 80.3
17 Kendrapara 85.2 91.5 79.0 85.0 91.4 78.7 88.3 92.6 83.7
18 Keonjhar 68.2 78.1 58.3 66.5 76.8 56.3 78.6 85.8 70.8
19 Khurda 86.9 91.8 81.6 83.0 89.4 76.3 91.0 94.2 87.5
20 Koraput 49.2 60.3 38.6 42.4 54.1 31.3 81.8 88.5 74.9
21 Malkangiri 48.5 59.1 38.3 46.1 56.7 36.0 74.5 83.4 64.9
22 Mayurbhanj 63.2 73.8 52.7 61.2 72.2 50.3 85.9 90.8 80.8
23 Nabarangpur 46.4 57.3 35.8 43.9 55.0 33.0 77.9 84.9 70.7
24 Nayagarh 80.4 88.2 72.0 79.8 87.7 71.1 87.8 92.9 82.2
25 Nuapada 57.3 70.3 44.8 56.0 69.3 43.2 79.0 86.6 71.3
26 Puri 84.7 90.8 78.3 84.2 90.8 77.3 87.4 91.0 83.5
27 Rayagada 49.8 61.0 39.2 44.4 56.2 33.5 78.0 85.6 70.4
28 Sambalpur 76.2 84.4 67.9 72.6 81.8 63.4 84.8 90.3 79.0
29 Subarnapur 74.4 84.4 64.0 73.6 83.8 63.1 83.0 90.7 74.9
30 Sundargarh 73.3 81.0 65.5 66.6 75.6 57.7 85.3 90.2 80.0
Source : Census of India
I . POSITION OF THE DISTRICT IN THE STATE1.06 : District wise Literacy Rate ( 2011 Census )
All Classes Rural UrbanSl.No.
Name of theDistrict
District Statistical Hand Book-2011 12
Total Male Female Male Female Male Female
1 2 3 4 5 6 7 8 9
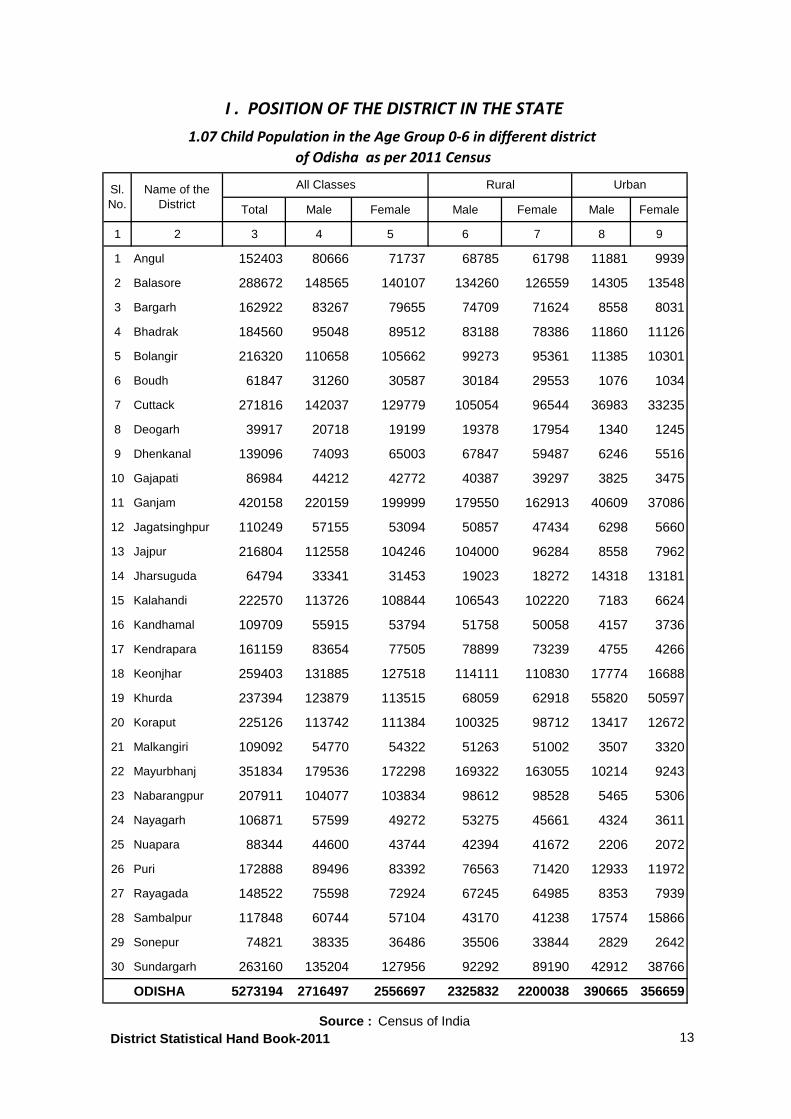
1 Angul 152403 80666 71737 68785 61798 11881 9939
2 Balasore 288672 148565 140107 134260 126559 14305 13548
3 Bargarh 162922 83267 79655 74709 71624 8558 8031
4 Bhadrak 184560 95048 89512 83188 78386 11860 11126
5 Bolangir 216320 110658 105662 99273 95361 11385 10301
6 Boudh 61847 31260 30587 30184 29553 1076 1034
7 Cuttack 271816 142037 129779 105054 96544 36983 33235
8 Deogarh 39917 20718 19199 19378 17954 1340 1245
9 Dhenkanal 139096 74093 65003 67847 59487 6246 5516
10 Gajapati 86984 44212 42772 40387 39297 3825 3475
11 Ganjam 420158 220159 199999 179550 162913 40609 37086
12 Jagatsinghpur 110249 57155 53094 50857 47434 6298 5660
13 Jajpur 216804 112558 104246 104000 96284 8558 7962
14 Jharsuguda 64794 33341 31453 19023 18272 14318 13181
15 Kalahandi 222570 113726 108844 106543 102220 7183 6624
16 Kandhamal 109709 55915 53794 51758 50058 4157 3736
17 Kendrapara 161159 83654 77505 78899 73239 4755 4266
18 Keonjhar 259403 131885 127518 114111 110830 17774 16688
19 Khurda 237394 123879 113515 68059 62918 55820 50597
20 Koraput 225126 113742 111384 100325 98712 13417 12672
21 Malkangiri 109092 54770 54322 51263 51002 3507 3320
22 Mayurbhanj 351834 179536 172298 169322 163055 10214 9243
23 Nabarangpur 207911 104077 103834 98612 98528 5465 5306
24 Nayagarh 106871 57599 49272 53275 45661 4324 3611
25 Nuapara 88344 44600 43744 42394 41672 2206 2072
26 Puri 172888 89496 83392 76563 71420 12933 11972
27 Rayagada 148522 75598 72924 67245 64985 8353 7939
28 Sambalpur 117848 60744 57104 43170 41238 17574 15866
29 Sonepur 74821 38335 36486 35506 33844 2829 2642
30 Sundargarh 263160 135204 127956 92292 89190 42912 38766
ODISHA 5273194 2716497 2556697 2325832 2200038 390665 356659
All Classes Rural Urban
Source : Census of India
I . POSITION OF THE DISTRICT IN THE STATE
1.07 Child Population in the Age Group 0-6 in different district
of Odisha as per 2011 Census
Sl.No.
Name of theDistrict
District Statistical Hand Book-2011 13
InhabitedUn-
inhabitedTotal
1 2 3 4 5 6 7
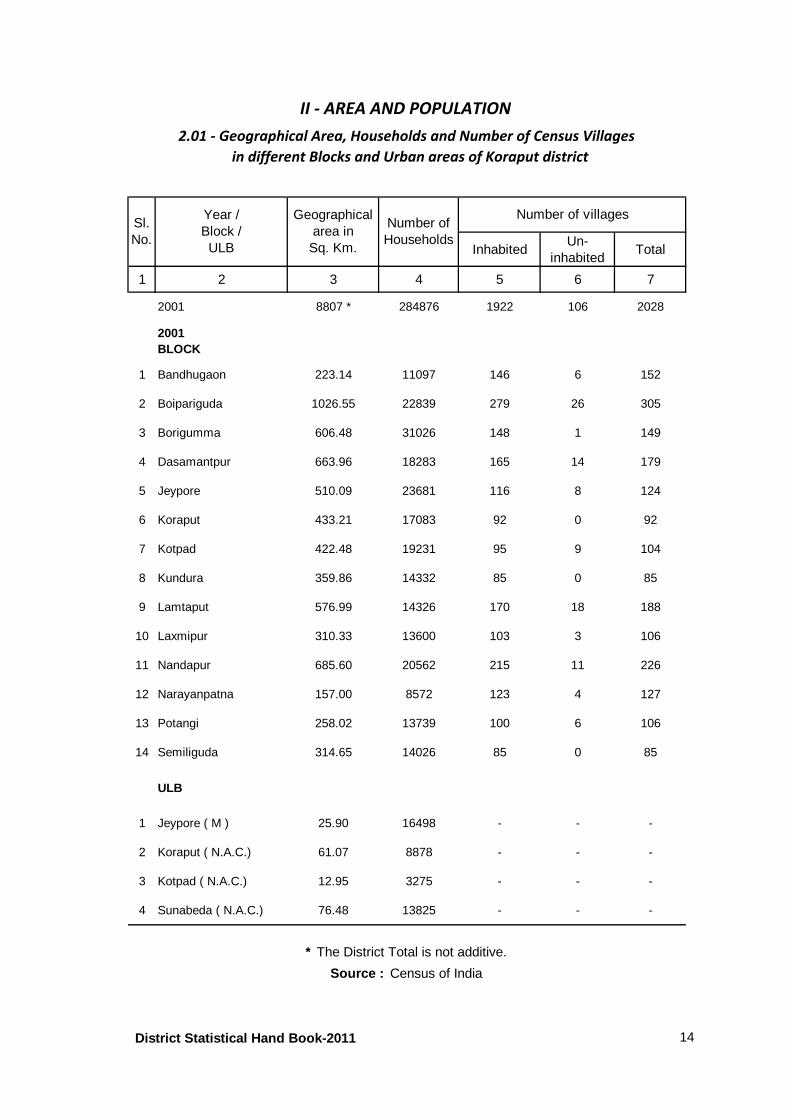
2001 8807 * 284876 1922 106 2028
2001BLOCK
1 Bandhugaon 223.14 11097 146 6 152
2 Boipariguda 1026.55 22839 279 26 305
3 Borigumma 606.48 31026 148 1 149
4 Dasamantpur 663.96 18283 165 14 179
5 Jeypore 510.09 23681 116 8 124
6 Koraput 433.21 17083 92 0 92
7 Kotpad 422.48 19231 95 9 104
8 Kundura 359.86 14332 85 0 85
9 Lamtaput 576.99 14326 170 18 188
10 Laxmipur 310.33 13600 103 3 106
11 Nandapur 685.60 20562 215 11 226
12 Narayanpatna 157.00 8572 123 4 127
13 Potangi 258.02 13739 100 6 106
14 Semiliguda 314.65 14026 85 0 85
ULB
1 Jeypore ( M ) 25.90 16498 - - -
2 Koraput ( N.A.C.) 61.07 8878 - - -
3 Kotpad ( N.A.C.) 12.95 3275 - - -
4 Sunabeda ( N.A.C.) 76.48 13825 - - -
II - AREA AND POPULATION
2.01 - Geographical Area, Households and Number of Census Villages
in different Blocks and Urban areas of Koraput district
Number of villages
Source : Census of India
Year /Block /ULB
Geographicalarea in
Sq. Km.
Number ofHouseholds
* The District Total is not additive.
Sl.No.
District Statistical Hand Book-2011 14
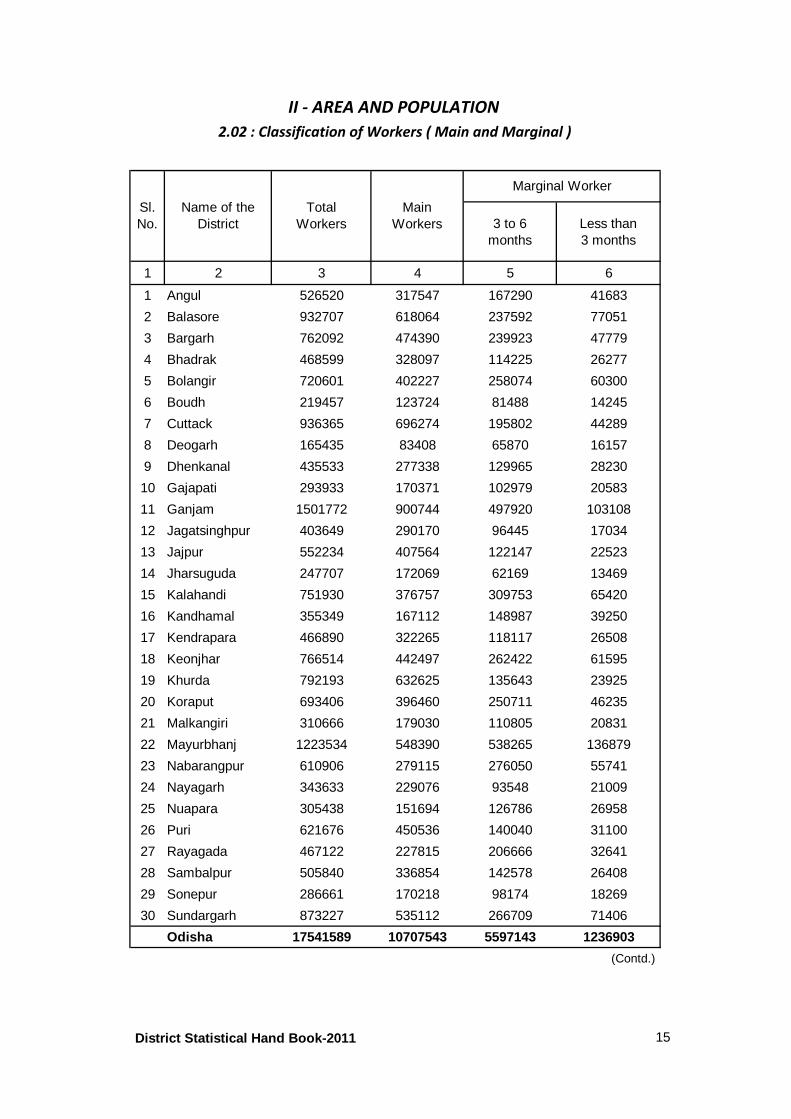
3 to 6months
Less than3 months
1 2 3 4 5 6
1 Angul 526520 317547 167290 41683
2 Balasore 932707 618064 237592 77051
3 Bargarh 762092 474390 239923 47779
4 Bhadrak 468599 328097 114225 26277
5 Bolangir 720601 402227 258074 60300
6 Boudh 219457 123724 81488 14245
7 Cuttack 936365 696274 195802 44289
8 Deogarh 165435 83408 65870 16157
9 Dhenkanal 435533 277338 129965 28230
10 Gajapati 293933 170371 102979 20583
11 Ganjam 1501772 900744 497920 103108
12 Jagatsinghpur 403649 290170 96445 17034
13 Jajpur 552234 407564 122147 22523
14 Jharsuguda 247707 172069 62169 13469
15 Kalahandi 751930 376757 309753 65420
16 Kandhamal 355349 167112 148987 39250
17 Kendrapara 466890 322265 118117 26508
18 Keonjhar 766514 442497 262422 61595
19 Khurda 792193 632625 135643 23925
20 Koraput 693406 396460 250711 46235
21 Malkangiri 310666 179030 110805 20831
22 Mayurbhanj 1223534 548390 538265 136879
23 Nabarangpur 610906 279115 276050 55741
24 Nayagarh 343633 229076 93548 21009
25 Nuapara 305438 151694 126786 26958
26 Puri 621676 450536 140040 31100
27 Rayagada 467122 227815 206666 32641
28 Sambalpur 505840 336854 142578 26408
29 Sonepur 286661 170218 98174 18269
30 Sundargarh 873227 535112 266709 71406
Odisha 17541589 10707543 5597143 1236903
(Contd.)
Sl.No.
Name of theDistrict
MainWorkers
Total Workers
II - AREA AND POPULATION
2.02 : Classification of Workers ( Main and Marginal )
Marginal Worker
District Statistical Hand Book-2011 15
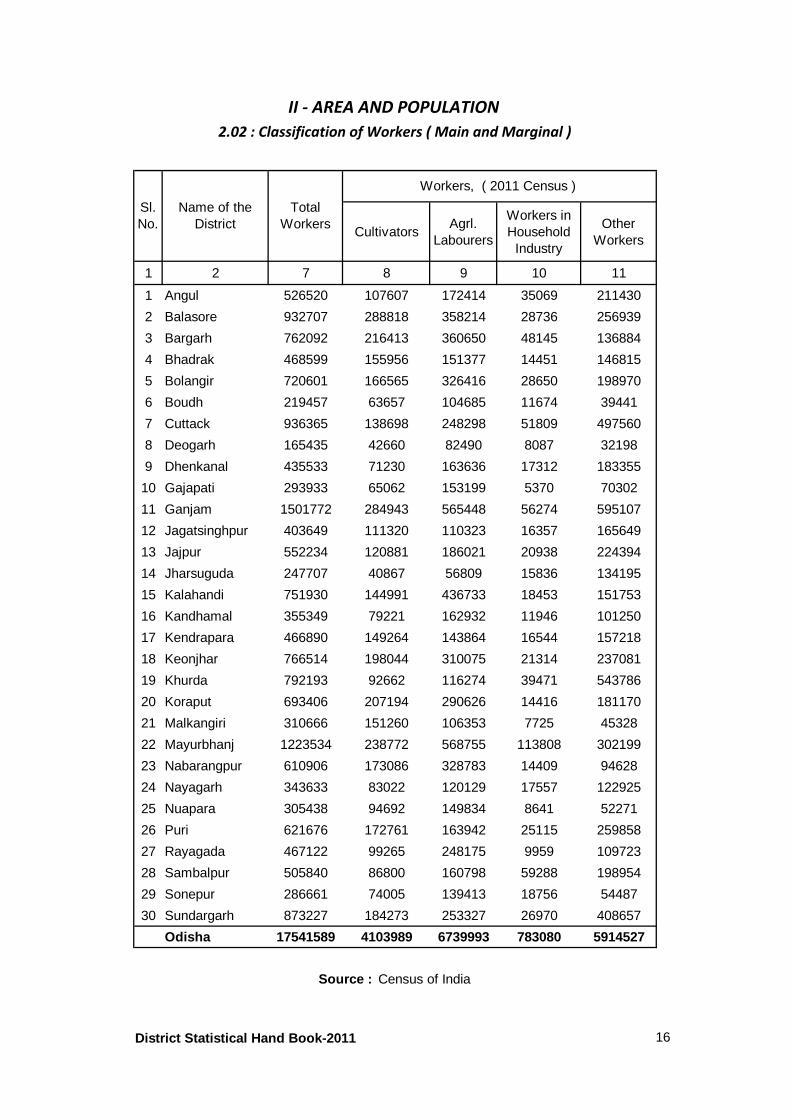
CultivatorsAgrl.
Labourers
Workers inHousehold
Industry
OtherWorkers
1 2 7 8 9 10 11
1 Angul 526520 107607 172414 35069 211430
2 Balasore 932707 288818 358214 28736 256939
3 Bargarh 762092 216413 360650 48145 136884
4 Bhadrak 468599 155956 151377 14451 146815
5 Bolangir 720601 166565 326416 28650 198970
6 Boudh 219457 63657 104685 11674 39441
7 Cuttack 936365 138698 248298 51809 497560
8 Deogarh 165435 42660 82490 8087 32198
9 Dhenkanal 435533 71230 163636 17312 183355
10 Gajapati 293933 65062 153199 5370 70302
11 Ganjam 1501772 284943 565448 56274 595107
12 Jagatsinghpur 403649 111320 110323 16357 165649
13 Jajpur 552234 120881 186021 20938 224394
14 Jharsuguda 247707 40867 56809 15836 134195
15 Kalahandi 751930 144991 436733 18453 151753
16 Kandhamal 355349 79221 162932 11946 101250
17 Kendrapara 466890 149264 143864 16544 157218
18 Keonjhar 766514 198044 310075 21314 237081
19 Khurda 792193 92662 116274 39471 543786
20 Koraput 693406 207194 290626 14416 181170
21 Malkangiri 310666 151260 106353 7725 45328
22 Mayurbhanj 1223534 238772 568755 113808 302199
23 Nabarangpur 610906 173086 328783 14409 94628
24 Nayagarh 343633 83022 120129 17557 122925
25 Nuapara 305438 94692 149834 8641 52271
26 Puri 621676 172761 163942 25115 259858
27 Rayagada 467122 99265 248175 9959 109723
28 Sambalpur 505840 86800 160798 59288 198954
29 Sonepur 286661 74005 139413 18756 54487
30 Sundargarh 873227 184273 253327 26970 408657
Odisha 17541589 4103989 6739993 783080 5914527
II - AREA AND POPULATION
2.02 : Classification of Workers ( Main and Marginal )
Workers, ( 2011 Census )
Source : Census of India
Sl.No.
Name of theDistrict
Total Workers
District Statistical Hand Book-2011 16
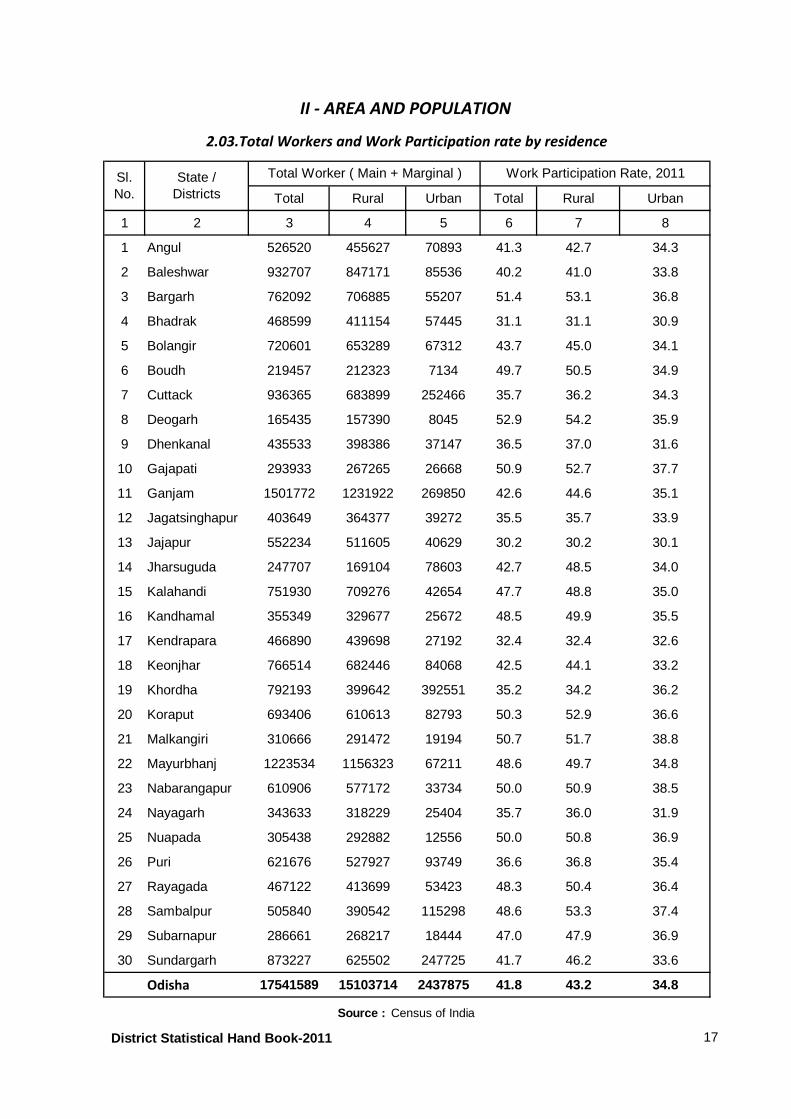
Total Rural Urban Total Rural Urban
1 2 3 4 5 6 7 8
1 Angul 526520 455627 70893 41.3 42.7 34.3
2 Baleshwar 932707 847171 85536 40.2 41.0 33.8
3 Bargarh 762092 706885 55207 51.4 53.1 36.8
4 Bhadrak 468599 411154 57445 31.1 31.1 30.9
5 Bolangir 720601 653289 67312 43.7 45.0 34.1
6 Boudh 219457 212323 7134 49.7 50.5 34.9
7 Cuttack 936365 683899 252466 35.7 36.2 34.3
8 Deogarh 165435 157390 8045 52.9 54.2 35.9
9 Dhenkanal 435533 398386 37147 36.5 37.0 31.6
10 Gajapati 293933 267265 26668 50.9 52.7 37.7
11 Ganjam 1501772 1231922 269850 42.6 44.6 35.1
12 Jagatsinghapur 403649 364377 39272 35.5 35.7 33.9
13 Jajapur 552234 511605 40629 30.2 30.2 30.1
14 Jharsuguda 247707 169104 78603 42.7 48.5 34.0
15 Kalahandi 751930 709276 42654 47.7 48.8 35.0
16 Kandhamal 355349 329677 25672 48.5 49.9 35.5
17 Kendrapara 466890 439698 27192 32.4 32.4 32.6
18 Keonjhar 766514 682446 84068 42.5 44.1 33.2
19 Khordha 792193 399642 392551 35.2 34.2 36.2
20 Koraput 693406 610613 82793 50.3 52.9 36.6
21 Malkangiri 310666 291472 19194 50.7 51.7 38.8
22 Mayurbhanj 1223534 1156323 67211 48.6 49.7 34.8
23 Nabarangapur 610906 577172 33734 50.0 50.9 38.5
24 Nayagarh 343633 318229 25404 35.7 36.0 31.9
25 Nuapada 305438 292882 12556 50.0 50.8 36.9
26 Puri 621676 527927 93749 36.6 36.8 35.4
27 Rayagada 467122 413699 53423 48.3 50.4 36.4
28 Sambalpur 505840 390542 115298 48.6 53.3 37.4
29 Subarnapur 286661 268217 18444 47.0 47.9 36.9
30 Sundargarh 873227 625502 247725 41.7 46.2 33.6
Odisha 17541589 15103714 2437875 41.8 43.2 34.8
State /Districts
Source : Census of India
II - AREA AND POPULATION
2.03.Total Workers and Work Participation rate by residence
Total Worker ( Main + Marginal ) Work Participation Rate, 2011Sl.No.
District Statistical Hand Book-2011 17
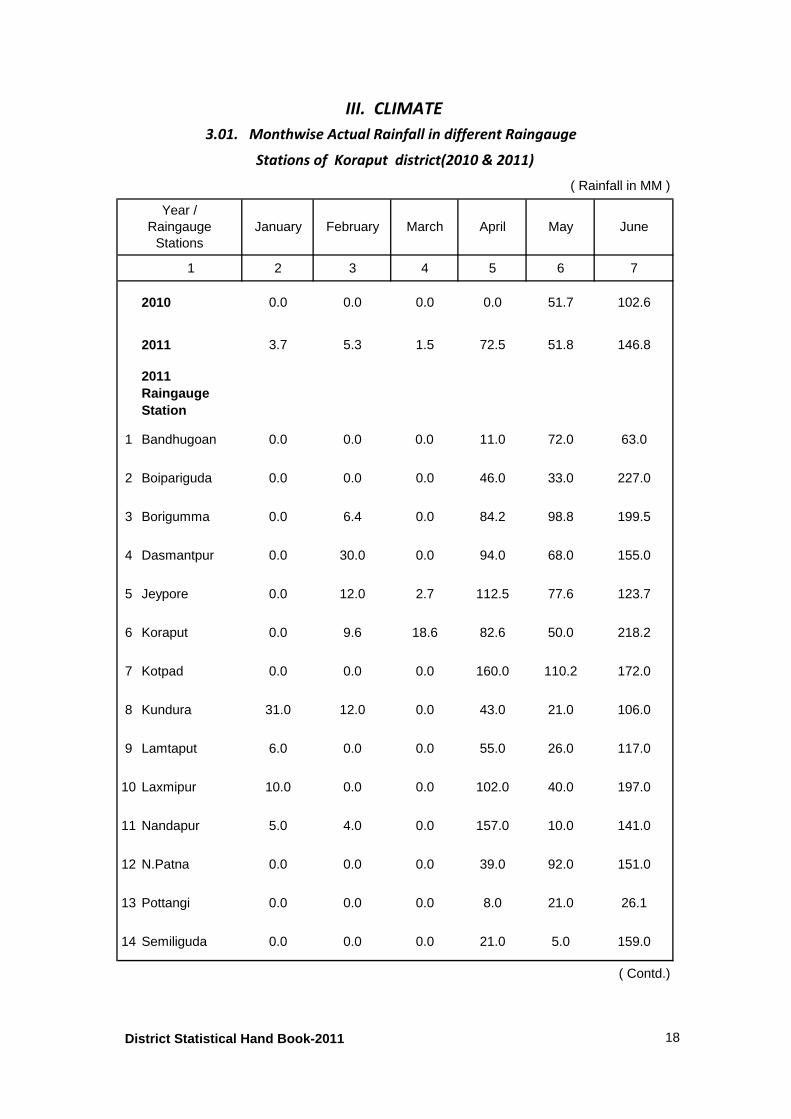
1 2 3 4 5 6 7
2010 0.0 0.0 0.0 0.0 51.7 102.6
2011 3.7 5.3 1.5 72.5 51.8 146.8
2011 Raingauge Station
1 Bandhugoan 0.0 0.0 0.0 11.0 72.0 63.0
2 Boipariguda 0.0 0.0 0.0 46.0 33.0 227.0
3 Borigumma 0.0 6.4 0.0 84.2 98.8 199.5
4 Dasmantpur 0.0 30.0 0.0 94.0 68.0 155.0
5 Jeypore 0.0 12.0 2.7 112.5 77.6 123.7
6 Koraput 0.0 9.6 18.6 82.6 50.0 218.2
7 Kotpad 0.0 0.0 0.0 160.0 110.2 172.0
8 Kundura 31.0 12.0 0.0 43.0 21.0 106.0
9 Lamtaput 6.0 0.0 0.0 55.0 26.0 117.0
10 Laxmipur 10.0 0.0 0.0 102.0 40.0 197.0
11 Nandapur 5.0 4.0 0.0 157.0 10.0 141.0
12 N.Patna 0.0 0.0 0.0 39.0 92.0 151.0
13 Pottangi 0.0 0.0 0.0 8.0 21.0 26.1
14 Semiliguda 0.0 0.0 0.0 21.0 5.0 159.0
( Contd.)
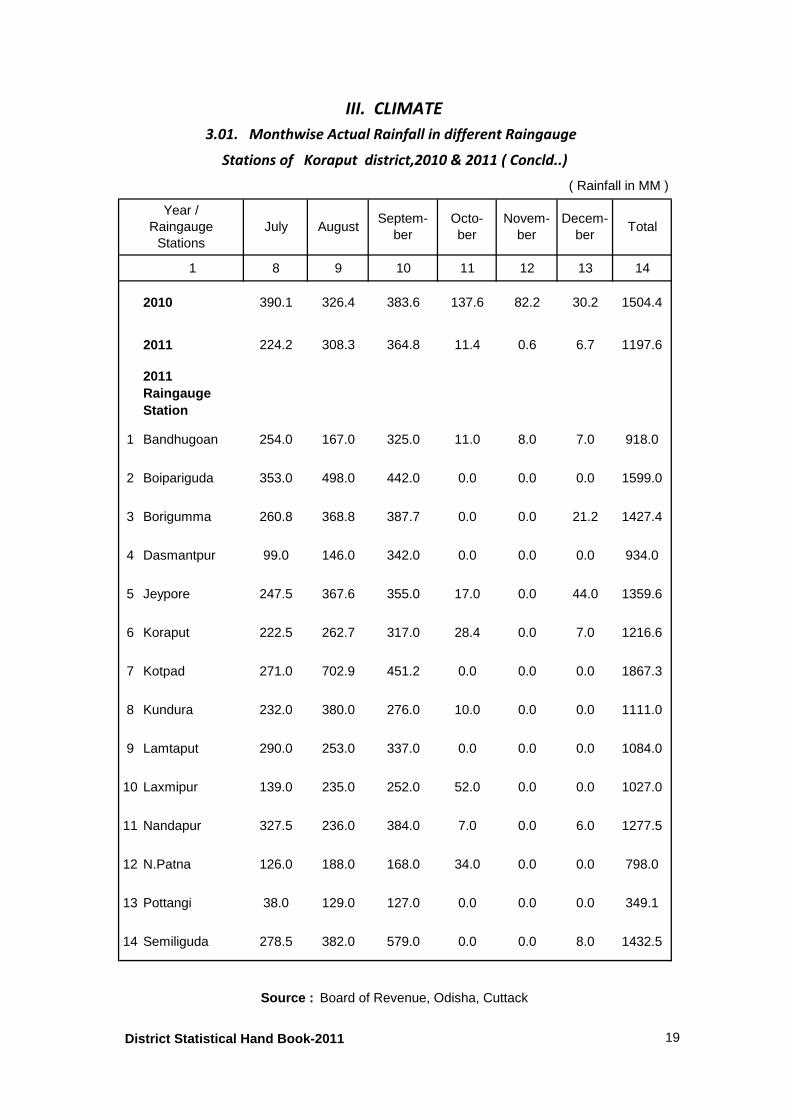
III. CLIMATE
3.01. Monthwise Actual Rainfall in different Raingauge
Stations of Koraput district(2010 & 2011)
( Rainfall in MM )
Year /Raingauge
StationsJanuary February March April May June
District Statistical Hand Book-2011 18
1 8 9 10 11 12 13 14
2010 390.1 326.4 383.6 137.6 82.2 30.2 1504.4
2011 224.2 308.3 364.8 11.4 0.6 6.7 1197.6
2011 Raingauge Station
1 Bandhugoan 254.0 167.0 325.0 11.0 8.0 7.0 918.0
2 Boipariguda 353.0 498.0 442.0 0.0 0.0 0.0 1599.0
3 Borigumma 260.8 368.8 387.7 0.0 0.0 21.2 1427.4
4 Dasmantpur 99.0 146.0 342.0 0.0 0.0 0.0 934.0
5 Jeypore 247.5 367.6 355.0 17.0 0.0 44.0 1359.6
6 Koraput 222.5 262.7 317.0 28.4 0.0 7.0 1216.6
7 Kotpad 271.0 702.9 451.2 0.0 0.0 0.0 1867.3
8 Kundura 232.0 380.0 276.0 10.0 0.0 0.0 1111.0
9 Lamtaput 290.0 253.0 337.0 0.0 0.0 0.0 1084.0
10 Laxmipur 139.0 235.0 252.0 52.0 0.0 0.0 1027.0
11 Nandapur 327.5 236.0 384.0 7.0 0.0 6.0 1277.5
12 N.Patna 126.0 188.0 168.0 34.0 0.0 0.0 798.0
13 Pottangi 38.0 129.0 127.0 0.0 0.0 0.0 349.1
14 Semiliguda 278.5 382.0 579.0 0.0 0.0 8.0 1432.5
III. CLIMATE
3.01. Monthwise Actual Rainfall in different Raingauge
Stations of Koraput district,2010 & 2011 ( Concld..)
( Rainfall in MM )
Year /Raingauge
StationsTotal
Source : Board of Revenue, Odisha, Cuttack
July AugustSeptem-
berOcto-ber
Novem-ber
Decem-ber
District Statistical Hand Book-2011 19
Max. Min. 8.30 AM 17.30 PM Max. Min. 8.30 AM 17.30 PM
1 2 3 4 5 6 7 8 9
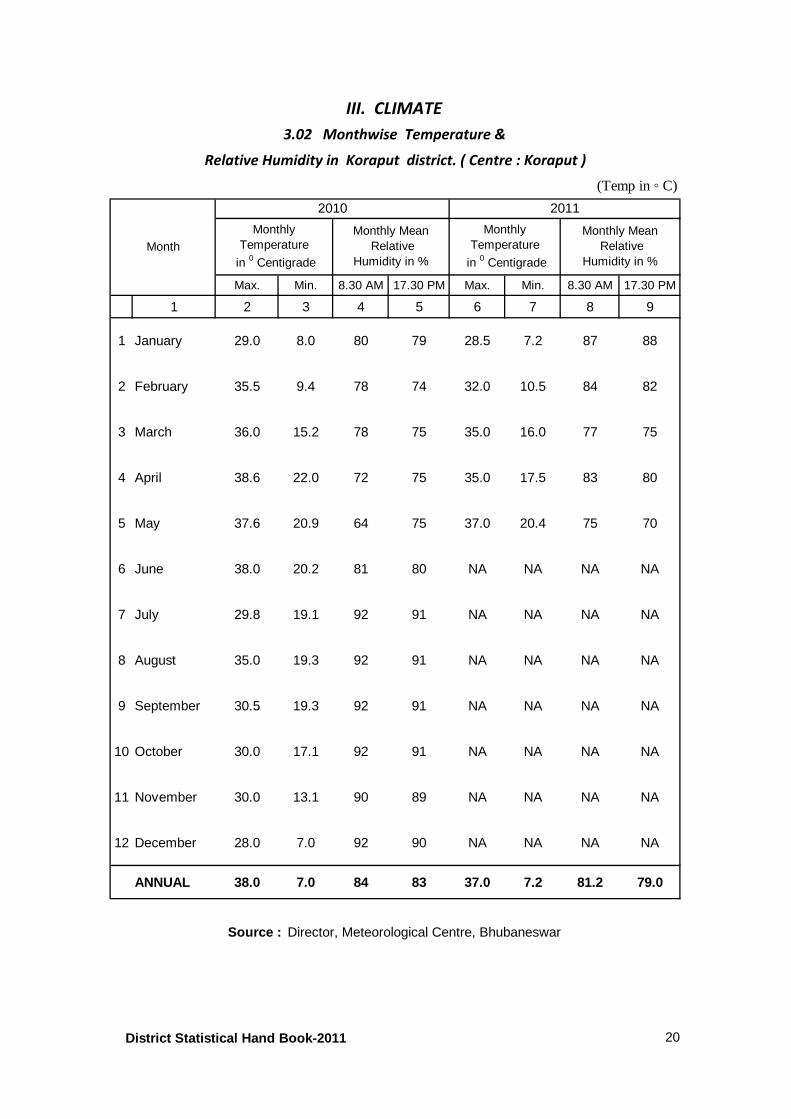
1 January 29.0 8.0 80 79 28.5 7.2 87 88
2 February 35.5 9.4 78 74 32.0 10.5 84 82
3 March 36.0 15.2 78 75 35.0 16.0 77 75
4 April 38.6 22.0 72 75 35.0 17.5 83 80
5 May 37.6 20.9 64 75 37.0 20.4 75 70
6 June 38.0 20.2 81 80 NA NA NA NA
7 July 29.8 19.1 92 91 NA NA NA NA
8 August 35.0 19.3 92 91 NA NA NA NA
9 September 30.5 19.3 92 91 NA NA NA NA
10 October 30.0 17.1 92 91 NA NA NA NA
11 November 30.0 13.1 90 89 NA NA NA NA
12 December 28.0 7.0 92 90 NA NA NA NA
ANNUAL 38.0 7.0 84 83 37.0 7.2 81.2 79.0
III. CLIMATE
3.02 Monthwise Temperature &
Relative Humidity in Koraput district. ( Centre : Koraput )
(Temp in ◦ C)
2010
Month
2011
Monthly Temperature
in 0 Centigrade
Monthly Mean Relative
Humidity in %
Monthly Temperature
in 0 Centigrade
Monthly Mean Relative
Humidity in %
Source : Director, Meteorological Centre, Bhubaneswar
District Statistical Hand Book-2011 20
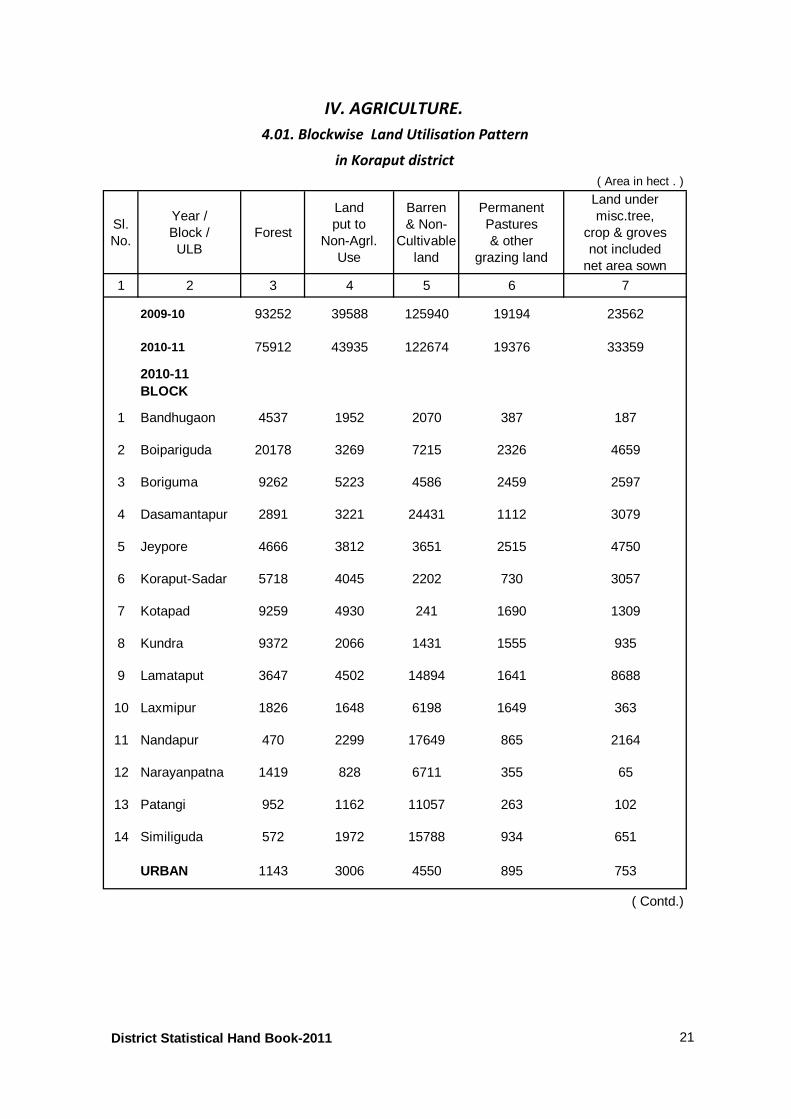
Sl.No.
Year /Block /ULB
Forest
Land put to
Non-Agrl.Use
Barren& Non-
Cultivableland
Permanent Pastures & other
grazing land
Land under misc.tree,
crop & grovesnot included
net area sown
1 2 3 4 5 6 7
2009-10 93252 39588 125940 19194 23562
2010-11 75912 43935 122674 19376 33359
2010-11BLOCK
1 Bandhugaon 4537 1952 2070 387 187
2 Boipariguda 20178 3269 7215 2326 4659
3 Boriguma 9262 5223 4586 2459 2597
4 Dasamantapur 2891 3221 24431 1112 3079
5 Jeypore 4666 3812 3651 2515 4750
6 Koraput-Sadar 5718 4045 2202 730 3057
7 Kotapad 9259 4930 241 1690 1309
8 Kundra 9372 2066 1431 1555 935
9 Lamataput 3647 4502 14894 1641 8688
10 Laxmipur 1826 1648 6198 1649 363
11 Nandapur 470 2299 17649 865 2164
12 Narayanpatna 1419 828 6711 355 65
13 Patangi 952 1162 11057 263 102
14 Similiguda 572 1972 15788 934 651
URBAN 1143 3006 4550 895 753
( Contd.)
IV. AGRICULTURE.
4.01. Blockwise Land Utilisation Pattern
in Koraput district
( Area in hect . )
District Statistical Hand Book-2011 21
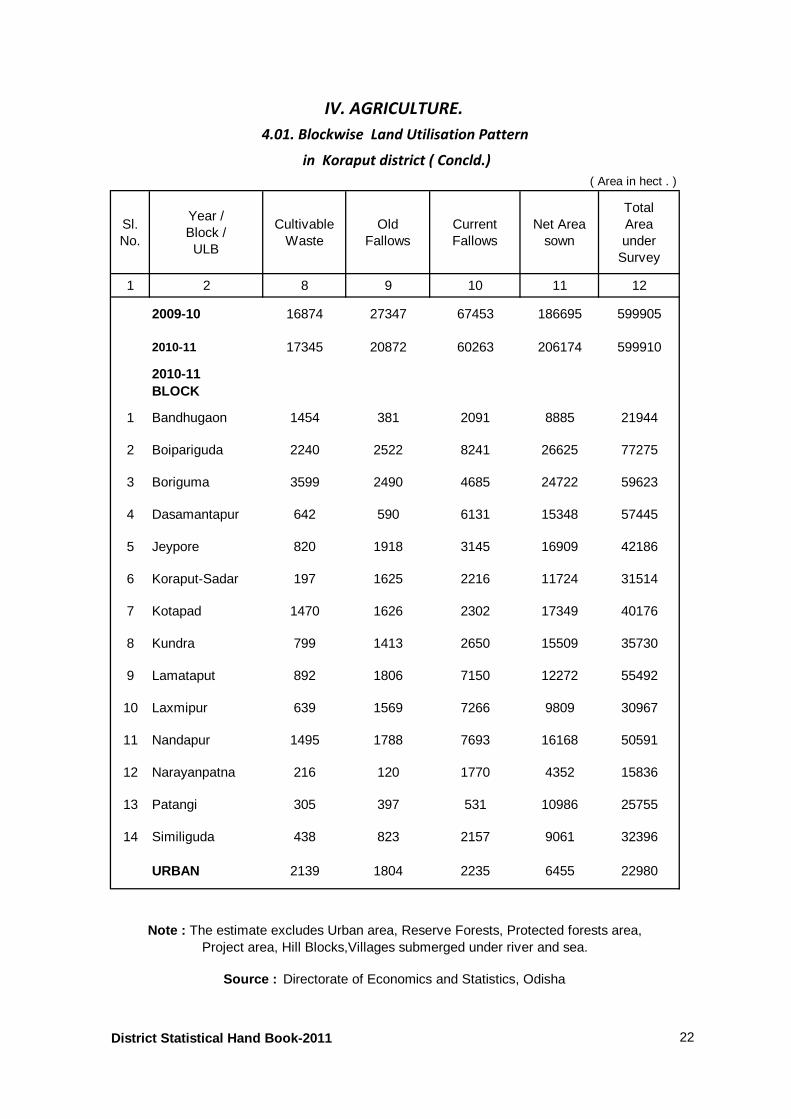
Sl.No.
Year /Block /ULB
Cultivable Waste
Old Fallows
CurrentFallows
Net Areasown
Total Areaunder
Survey
1 2 8 9 10 11 12
2009-10 16874 27347 67453 186695 599905
2010-11 17345 20872 60263 206174 599910
2010-11BLOCK
1 Bandhugaon 1454 381 2091 8885 21944
2 Boipariguda 2240 2522 8241 26625 77275
3 Boriguma 3599 2490 4685 24722 59623
4 Dasamantapur 642 590 6131 15348 57445
5 Jeypore 820 1918 3145 16909 42186
6 Koraput-Sadar 197 1625 2216 11724 31514
7 Kotapad 1470 1626 2302 17349 40176
8 Kundra 799 1413 2650 15509 35730
9 Lamataput 892 1806 7150 12272 55492
10 Laxmipur 639 1569 7266 9809 30967
11 Nandapur 1495 1788 7693 16168 50591
12 Narayanpatna 216 120 1770 4352 15836
13 Patangi 305 397 531 10986 25755
14 Similiguda 438 823 2157 9061 32396
URBAN 2139 1804 2235 6455 22980
IV. AGRICULTURE.
4.01. Blockwise Land Utilisation Pattern
Note : The estimate excludes Urban area, Reserve Forests, Protected forests area, Project area, Hill Blocks,Villages submerged under river and sea.
in Koraput district ( Concld.)
( Area in hect . )
Source : Directorate of Economics and Statistics, Odisha
District Statistical Hand Book-2011 22
Area YieldProdu-ction
Area YieldProdu-ction
1 2 3 4 5 6 7 8
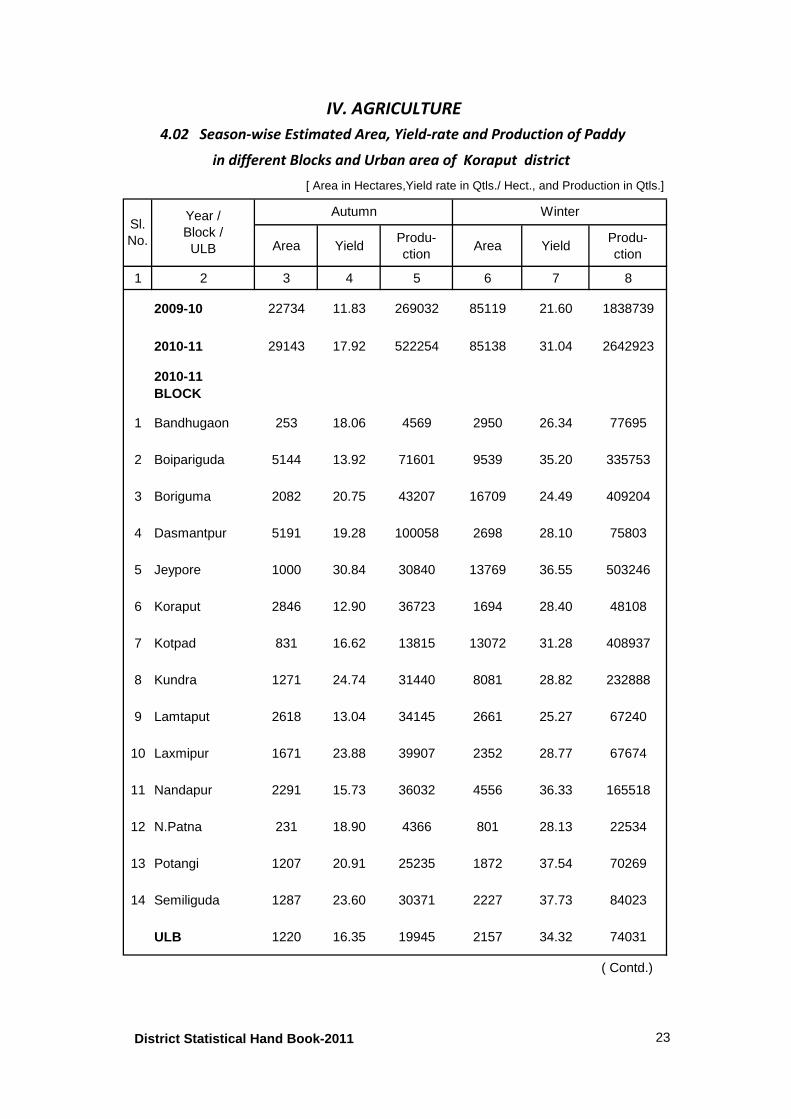
2009-10 22734 11.83 269032 85119 21.60 1838739
2010-11 29143 17.92 522254 85138 31.04 2642923
2010-11BLOCK
1 Bandhugaon 253 18.06 4569 2950 26.34 77695
2 Boipariguda 5144 13.92 71601 9539 35.20 335753
3 Boriguma 2082 20.75 43207 16709 24.49 409204
4 Dasmantpur 5191 19.28 100058 2698 28.10 75803
5 Jeypore 1000 30.84 30840 13769 36.55 503246
6 Koraput 2846 12.90 36723 1694 28.40 48108
7 Kotpad 831 16.62 13815 13072 31.28 408937
8 Kundra 1271 24.74 31440 8081 28.82 232888
9 Lamtaput 2618 13.04 34145 2661 25.27 67240
10 Laxmipur 1671 23.88 39907 2352 28.77 67674
11 Nandapur 2291 15.73 36032 4556 36.33 165518
12 N.Patna 231 18.90 4366 801 28.13 22534
13 Potangi 1207 20.91 25235 1872 37.54 70269
14 Semiliguda 1287 23.60 30371 2227 37.73 84023
ULB 1220 16.35 19945 2157 34.32 74031
( Contd.)
Year /Block /ULB
IV. AGRICULTURE
4.02 Season-wise Estimated Area, Yield-rate and Production of Paddy
in different Blocks and Urban area of Koraput district
[ Area in Hectares,Yield rate in Qtls./ Hect., and Production in Qtls.]
Autumn WinterSl.No.
District Statistical Hand Book-2011 23

AreaYield-rate
Produ-ction
AreaYield-rate
Produ-ction
1 2 9 10 11 12 13 14
2009-10 9316 28.43 264850 117169 20.25 2372621
2010-11 20065 31.02 622446 134346 28.19 3787623
2010-11BLOCK
1 Bandhugaon 117 19.24 2251 3320 25.46 84515
2 Boipariguda 168 23.00 3864 14851 27.69 411218
3 Boriguma 418 20.42 8535 19209 24.00 460946
4 Dasmantpur 494 30.38 15008 8383 22.77 190869
5 Jeypore 11257 32.86 369884 26026 34.73 903970
6 Koraput 229 26.01 5955 4769 19.04 90786
7 Kotpad 3344 30.86 103190 17247 30.49 525942
8 Kundra 375 24.81 9303 9727 28.13 273631
9 Lamtaput 411 30.99 12737 5690 20.06 114122
10 Laxmipur 760 28.49 21650 4783 27.02 129231
11 Nandapur 854 30.62 26149 7701 29.57 227699
12 N.Patna 273 20.30 5541 1305 24.86 32441
13 Potangi 472 28.67 13533 3551 30.71 109037
14 Semiliguda 446 26.41 11780 3960 31.86 126174
ULB 447 29.23 13066 3824 27.99 107042
IV. AGRICULTURE
4.02 Season-wise Estimated Area, Yield-rate and Production of Paddy
in different Blocks and Urban area of Koraput district ( Concld.)
Source : Directorate of Economics and Statistics, Odisha, Bhubaneswar.
[ Area in Hectares,Yield rate in Qtls./ Hect. and Production in Qtls.]
Summer TotalSl.No.
Year /Block /ULB
District Statistical Hand Book-2011 24
Total Autumn Winter Summer
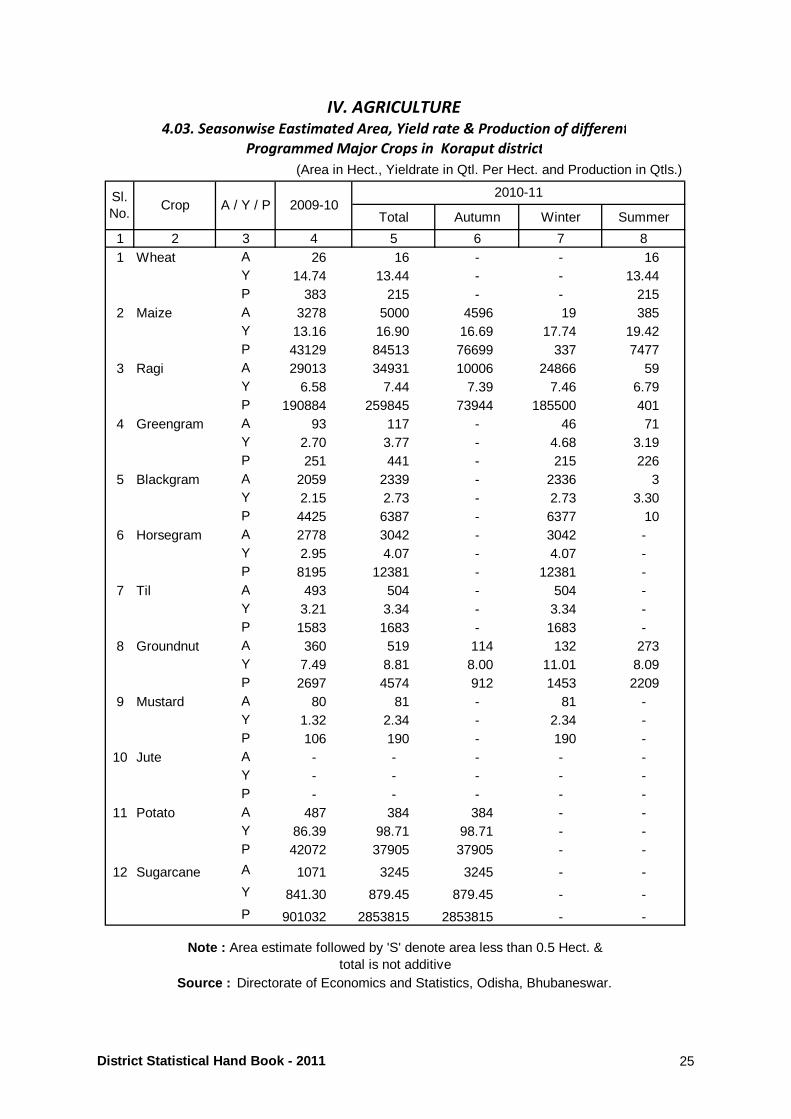
1 2 3 4 5 6 7 81 Wheat A 26 16 - - 16
Y 14.74 13.44 - - 13.44P 383 215 - - 215
2 Maize A 3278 5000 4596 19 385Y 13.16 16.90 16.69 17.74 19.42P 43129 84513 76699 337 7477
3 Ragi A 29013 34931 10006 24866 59Y 6.58 7.44 7.39 7.46 6.79P 190884 259845 73944 185500 401
4 Greengram A 93 117 - 46 71Y 2.70 3.77 - 4.68 3.19P 251 441 - 215 226
5 Blackgram A 2059 2339 - 2336 3Y 2.15 2.73 - 2.73 3.30P 4425 6387 - 6377 10
6 Horsegram A 2778 3042 - 3042 -Y 2.95 4.07 - 4.07 -P 8195 12381 - 12381 -
7 Til A 493 504 - 504 -Y 3.21 3.34 - 3.34 -P 1583 1683 - 1683 -
8 Groundnut A 360 519 114 132 273Y 7.49 8.81 8.00 11.01 8.09P 2697 4574 912 1453 2209
9 Mustard A 80 81 - 81 -Y 1.32 2.34 - 2.34 -P 106 190 - 190 -
10 Jute A - - - - -Y - - - - -P - - - - -
11 Potato A 487 384 384 - -Y 86.39 98.71 98.71 - -P 42072 37905 37905 - -
12 Sugarcane A 1071 3245 3245 - -
Y 841.30 879.45 879.45 - -
P 901032 2853815 2853815 - -
Sl.No.
Note : Area estimate followed by 'S' denote area less than 0.5 Hect. & total is not additive
Source : Directorate of Economics and Statistics, Odisha, Bhubaneswar.
2010-11
IV. AGRICULTURE
Programmed Major Crops in Koraput district
4.03. Seasonwise Eastimated Area, Yield rate & Production of different
(Area in Hect., Yieldrate in Qtl. Per Hect. and Production in Qtls.)
2009-10A / Y / PCrop
District Statistical Hand Book - 2011 25
Kharif Rabi Kharif Rabi Kharif Rabi Kharif Rabi Kharif Rabi
1 2 3 4 5 6 7 8 9 10 11 12
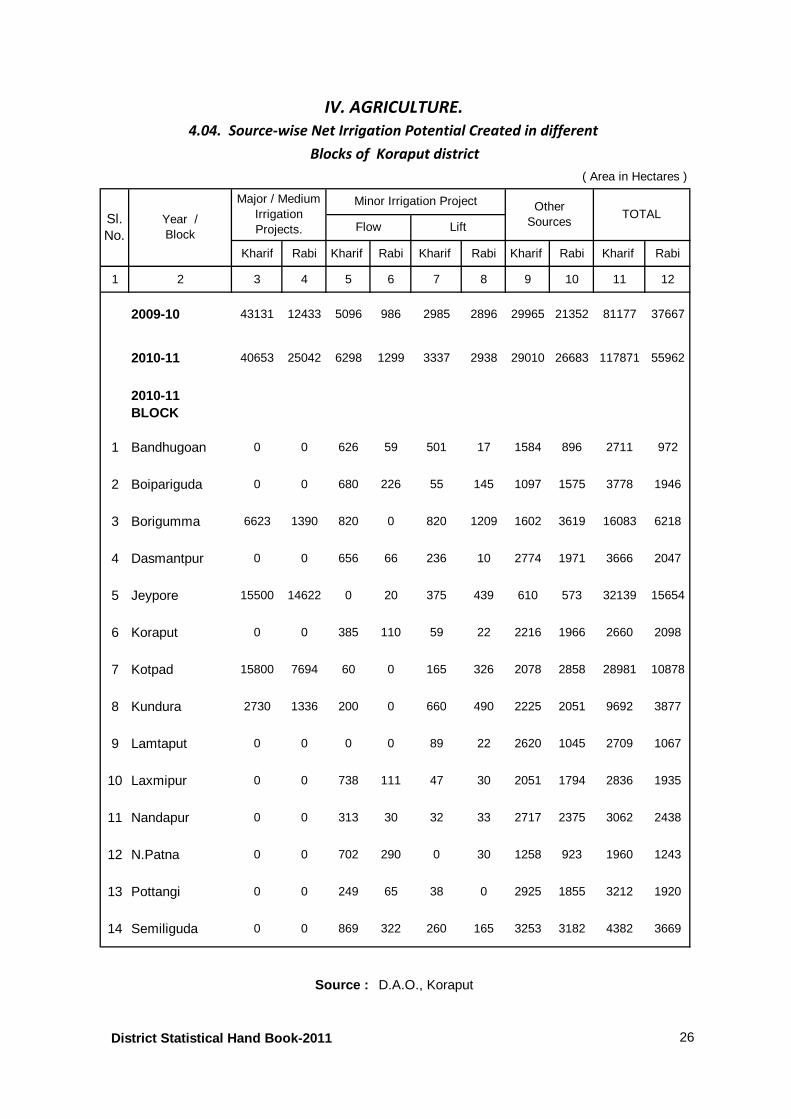
2009-10 43131 12433 5096 986 2985 2896 29965 21352 81177 37667
2010-11 40653 25042 6298 1299 3337 2938 29010 26683 117871 55962
2010-11BLOCK
1 Bandhugoan 0 0 626 59 501 17 1584 896 2711 972
2 Boipariguda 0 0 680 226 55 145 1097 1575 3778 1946
3 Borigumma 6623 1390 820 0 820 1209 1602 3619 16083 6218
4 Dasmantpur 0 0 656 66 236 10 2774 1971 3666 2047
5 Jeypore 15500 14622 0 20 375 439 610 573 32139 15654
6 Koraput 0 0 385 110 59 22 2216 1966 2660 2098
7 Kotpad 15800 7694 60 0 165 326 2078 2858 28981 10878
8 Kundura 2730 1336 200 0 660 490 2225 2051 9692 3877
9 Lamtaput 0 0 0 0 89 22 2620 1045 2709 1067
10 Laxmipur 0 0 738 111 47 30 2051 1794 2836 1935
11 Nandapur 0 0 313 30 32 33 2717 2375 3062 2438
12 N.Patna 0 0 702 290 0 30 1258 923 1960 1243
13 Pottangi 0 0 249 65 38 0 2925 1855 3212 1920
14 Semiliguda 0 0 869 322 260 165 3253 3182 4382 3669
Sl.No.
OtherSources
TOTALFlow Lift
Source : D.A.O., Koraput
IV. AGRICULTURE.
4.04. Source-wise Net Irrigation Potential Created in different
Blocks of Koraput district
( Area in Hectares )
Major / MediumIrrigation Projects.
Minor Irrigation Project
Year /Block
District Statistical Hand Book-2011 26
Kharif Rabi
1 2 3 4 5 6 7
2009-10 N.A. N.A. N.A. N.A. N.A.
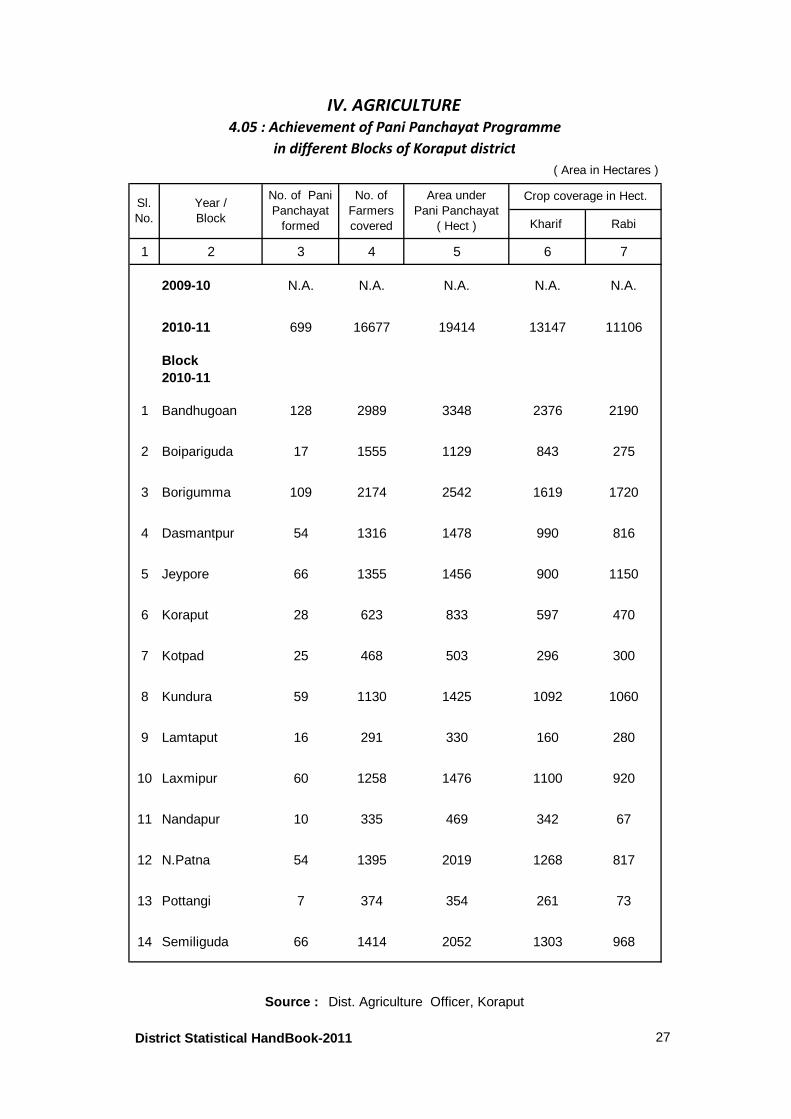
2010-11 699 16677 19414 13147 11106
Block 2010-11
1 Bandhugoan 128 2989 3348 2376 2190
2 Boipariguda 17 1555 1129 843 275
3 Borigumma 109 2174 2542 1619 1720
4 Dasmantpur 54 1316 1478 990 816
5 Jeypore 66 1355 1456 900 1150
6 Koraput 28 623 833 597 470
7 Kotpad 25 468 503 296 300
8 Kundura 59 1130 1425 1092 1060
9 Lamtaput 16 291 330 160 280
10 Laxmipur 60 1258 1476 1100 920
11 Nandapur 10 335 469 342 67
12 N.Patna 54 1395 2019 1268 817
13 Pottangi 7 374 354 261 73
14 Semiliguda 66 1414 2052 1303 968
No. ofFarmerscovered
Area underPani Panchayat
( Hect )
Crop coverage in Hect.
IV. AGRICULTURE
Source : Dist. Agriculture Officer, Koraput
Sl.No.
4.05 : Achievement of Pani Panchayat Programme
in different Blocks of Koraput district
( Area in Hectares )
Year / Block
No. of Pani Panchayat
formed
District Statistical HandBook-2011 27
Nitrogenous ( N )
Phosphetic ( P )
Potassic ( K )
Total( N + P + K )
1 2 3 4 5 6 7
2009-10 7281 4212 2765 14258 38
2010-11 7847 4383 2941 15171 38
2010-11BLOCK
1 Bandhugoan 88 62 40 190 17
2 Boipariguda 751 386 313 1450 38
3 Borigumma 1079 476 400 1955 34
4 Dasmantpur 298 200 115 613 22
5 Jeypore 1309 748 446 2503 68
6 Koraput 424 276 162 862 41
7 Kotpad 1233 577 372 2182 47
8 Kundura 693 355 336 1384 40
9 Lamtaput 248 164 95 507 20
10 Laxmipur 196 128 75 399 27
11 Nandapur 466 309 178 953 28
12 N.Patna 67 48 31 146 18
13 Pottangi 446 284 165 895 53
14 Semiliguda 550 369 213 1132 46
IV : AGRICULTURE
Source : Dy.Director Agriculture, Koraput
4.06: Consumption of Chemical Fertilliser ( Kharif & Rabi )
in different Blocks of Koraput District.
Sl No
Block/ Year
( In MT ) Per Hect. Consumption
of Fertiliser(Kg)
District Statistical Hand Book-2011 28
No. Amount
A. AGRICULTURAL CREDIT SOCIETIES :
1 PACS ( Primary Agrl. Co-operative Society ) 20 166575 35935 6240.33
2 CARD 1 4223 0 0
3 CCB ( Central Co-operative Bank ) 8 0 278 332.75
4 Others 0 0 0 0
B. HOUSING COOPERATIVE SOCIETIES : Number Members
1 Primary House Building Co-operative Societies 1 212
2 Sub Divisional level HBCS 3 3034
C. NON-AGRICULTURAL CREDIT SOCIETIES :
1 Urban Co-operative Bank 1 7950
2 Other Co-operative Bank 10 6548
D. CONSUMER COOPERATIVE SOCIETIES :
1 Whole Sale Consumer Store
2 Primary Consumer Co-operative Store
3 Employee Consumer Co-operative Store
4 Student Consumer Co-operative Store
5 Other
E. MARKETING COOPERATIVE SOCIETIES :
1 Regional Co-operative Marketing Societies
2 Agency Marketing Societies
3 Co-operative Cold Storage
4 Co-operative Sugar Factaries
5 Others
F. OTHERS :
No. of Farmers coveredSum
AssuredPremiumcollected
Claimpaid
Bene-ficiaries
1 Crop Insurance ………………. 5277.83 121.40 0 0
2 No. of Kisan Credit Card issued
3 No. of Kalinga Kisan Gold Card issued
Loans advanced
0
0
98.09
788.72
V. CO - OPERATION
5.01. Co-operative Structure in Koraput district
( 2010-11 )
( Rs. In Lakh )
Sl.No.
ITEM Number MembersLoans advanced
Number Members
2 93
1 51
3 5675
1 122
0 0
0
Source : DRCS, Koraput
1 -
0 -
- -
No. of Card holders
118042
2 -
0 -
District Statistical Hand Book-2011 29
Sl.No.
Year /Block
No. ofSocieties.
No. ofMembers
WorkingCapital
Loansadvanced
LoansOverdue
LoansOut-
standing
1 2 3 4 5 6 7 8
2009-10 20 144666 11358.1 5133.06 2135.20 5727.34
2010-11 20 166575 15167.00 6240.33 2858.30 7327.41
2010-11BLOCK
1 Bandhugoan 1 8081 363.18 253.23 85.18 244.15
2 Boipariguda 1 19115 2006.68 756.58 268.73 931.96
3 Borigumma 2 8975 952.29 212.02 109.47 282.22
4 Dasmantpur 2 12268 1067.31 323.27 185.54 476.59
5 Jeypore 2 14473 1820.12 866.94 435.32 959.32
6 Koraput 1 10792 332.51 256.65 114.80 245.67
7 Kotpad 1 8388 715.57 351.68 224.99 403.97
8 Kundura 1 10274 792.79 520.01 237.66 575.83
9 Lamtaput 1 12222 1069.48 669.19 332.19 747.71
10 Laxmipur 2 11276 661.28 378.68 146.94 405.10
11 Nandapur 2 9682 1621.52 462.68 228.55 624.88
12 N.Patna 1 8934 562.61 176.77 97.73 234.48
13 Pottangi 2 13892 604.30 363.33 156.90 393.23
14 Semiliguda 1 18203 2597.36 649.30 234.30 802.30
V. CO - OPERATION
5.02 : Primary Agrl. Co-operative Society (PACS)
in different Blocks of Koraput district
( Rs. in Lakh)
Source : A.R.C.S., Koraput
District Statistical Hand Book-2011 30
Sl.No.
Year /Block /ULB
No. ofSocieties.
No. ofMembers
WorkingCapital
Loansadvanced
LoansOverdue
LoansOut-
standing
1 2 3 4 5 6 7 8
2009-10 10 6281 1302.23 731.16 53.54 1037.86
2010-11 10 6548 841.67 788.72 39.95 754.23
2010-11BLOCK
1 Bandhugoan 0 0 0 0 0 0
2 Boipariguda 0 0 0 0 0 0
3 Borigumma 0 0 0 0 0 0
4 Dasmantpur 0 0 0 0 0 0
5 Jeypore 0 0 0 0 0 0
6 Koraput 0 0 0 0 0 0
7 Kotpad 0 0 0 0 0 0
8 Kundura 0 0 0 0 0 0
9 Lamtaput 0 0 0 0 0 0
10 Laxmipur 0 0 0 0 0 0
11 Nandapur 0 0 0 0 0 0
12 N.Patna 0 0 0 0 0 0
13 Pottangi 0 0 0 0 0 0
14 Semiliguda 2 300 55.44 65.45 6.48 104.11
URBAN
1 Jeypur ( M ) 5 1030 786.23 470.11 33.13 619.48
2 Kotapad ( NAC ) 1 224 - 8.16 0.34 8.16
3 Sunabeda ( NAC ) 1 2242 - 229.65 0 -
4 Koraput ( NAC ) 1 2752 - 15.35 0 22.48
V. CO-OPERATION
5.03. Non-Agricultural Credit Co-operative Societies in
different Blocks and Urban area in Koraput district.
( Rs. in Lakh)
Source : ARCS, Koraput
District Statistical Hand Book-2011 31
Sl.No.
Year /Block /ULB
No. ofSocieties.
No. ofMembers
ShareCapital
by Govt.
WorkingCapital
BusinessTurnover
Profit ( + )or
Loss ( - )
1 2 3 4 5 6 7 8
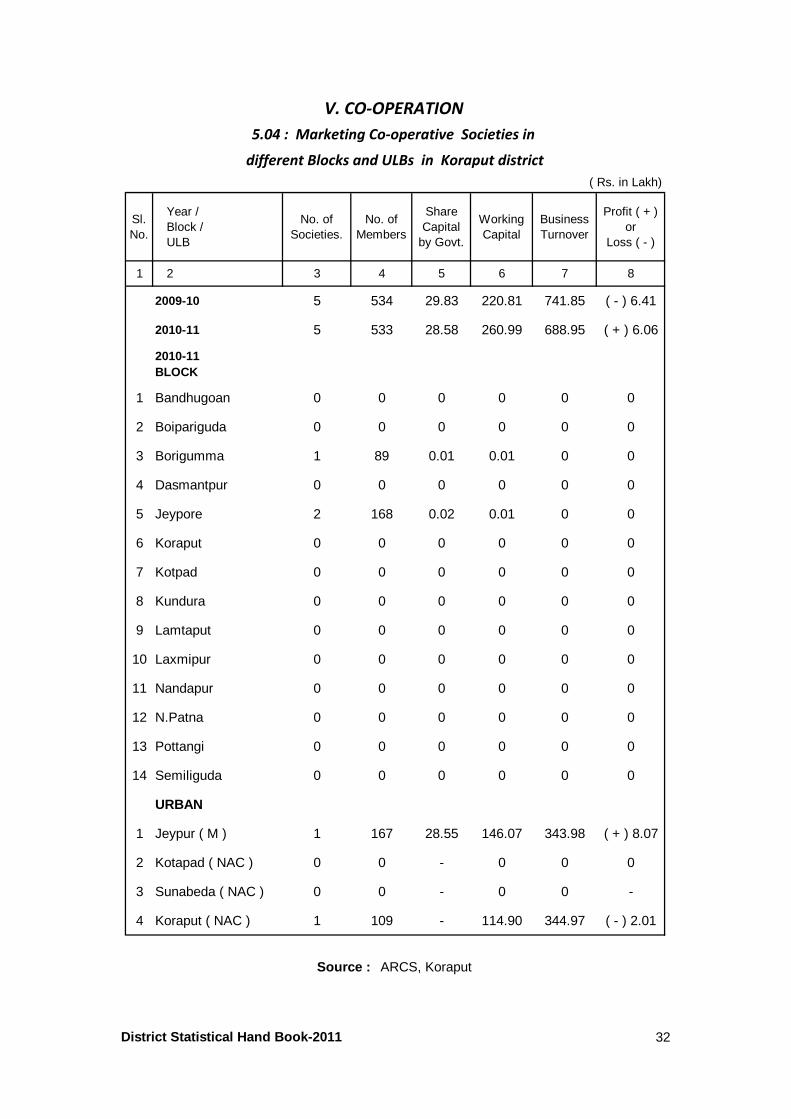
2009-10 5 534 29.83 220.81 741.85 ( - ) 6.41
2010-11 5 533 28.58 260.99 688.95 ( + ) 6.06
2010-11BLOCK
1 Bandhugoan 0 0 0 0 0 0
2 Boipariguda 0 0 0 0 0 0
3 Borigumma 1 89 0.01 0.01 0 0
4 Dasmantpur 0 0 0 0 0 0
5 Jeypore 2 168 0.02 0.01 0 0
6 Koraput 0 0 0 0 0 0
7 Kotpad 0 0 0 0 0 0
8 Kundura 0 0 0 0 0 0
9 Lamtaput 0 0 0 0 0 0
10 Laxmipur 0 0 0 0 0 0
11 Nandapur 0 0 0 0 0 0
12 N.Patna 0 0 0 0 0 0
13 Pottangi 0 0 0 0 0 0
14 Semiliguda 0 0 0 0 0 0
URBAN
1 Jeypur ( M ) 1 167 28.55 146.07 343.98 ( + ) 8.07
2 Kotapad ( NAC ) 0 0 - 0 0 0
3 Sunabeda ( NAC ) 0 0 - 0 0 -
4 Koraput ( NAC ) 1 109 - 114.90 344.97 ( - ) 2.01
V. CO-OPERATION
5.04 : Marketing Co-operative Societies in
different Blocks and ULBs in Koraput district
( Rs. in Lakh)
Source : ARCS, Koraput
District Statistical Hand Book-2011 32
Sl.No.
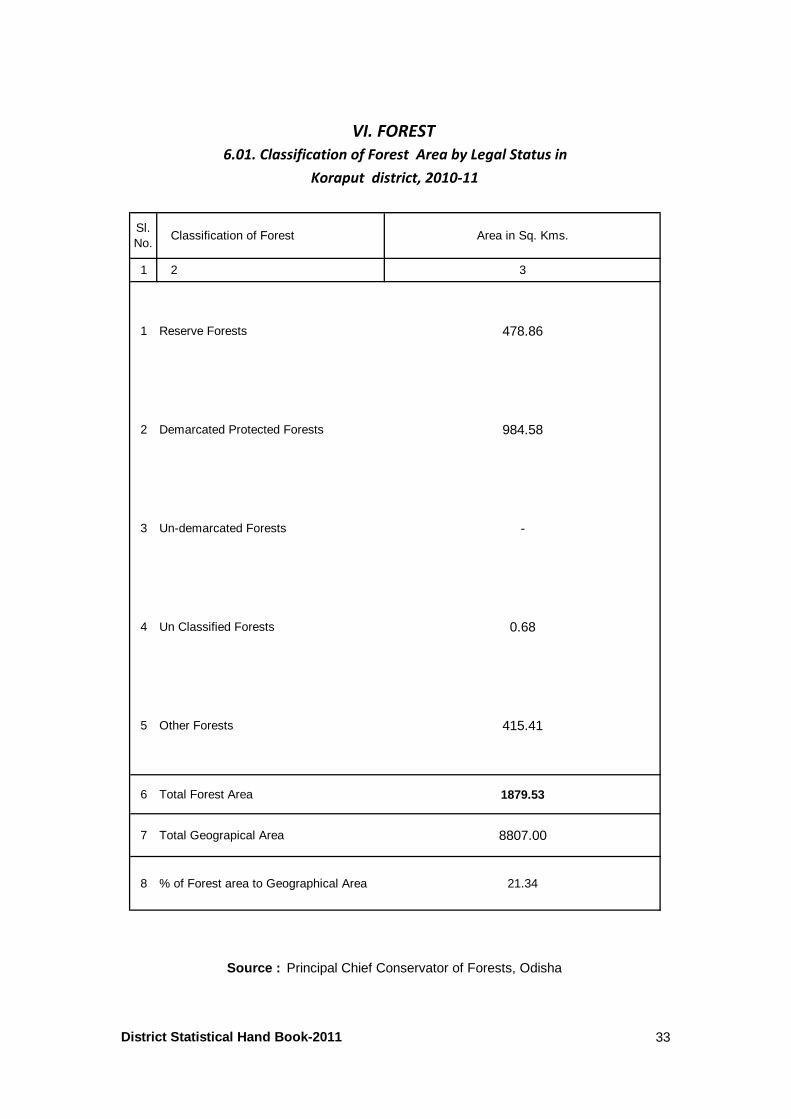
Classification of Forest Area in Sq. Kms.
1 2 3
1 Reserve Forests 478.86
2 Demarcated Protected Forests 984.58
3 Un-demarcated Forests -
4 Un Classified Forests 0.68
5 Other Forests 415.41
6 Total Forest Area 1879.53
7 Total Geograpical Area 8807.00
8 % of Forest area to Geographical Area 21.34
Source : Principal Chief Conservator of Forests, Odisha
VI. FOREST
6.01. Classification of Forest Area by Legal Status in
Koraput district, 2010-11
District Statistical Hand Book-2011 33
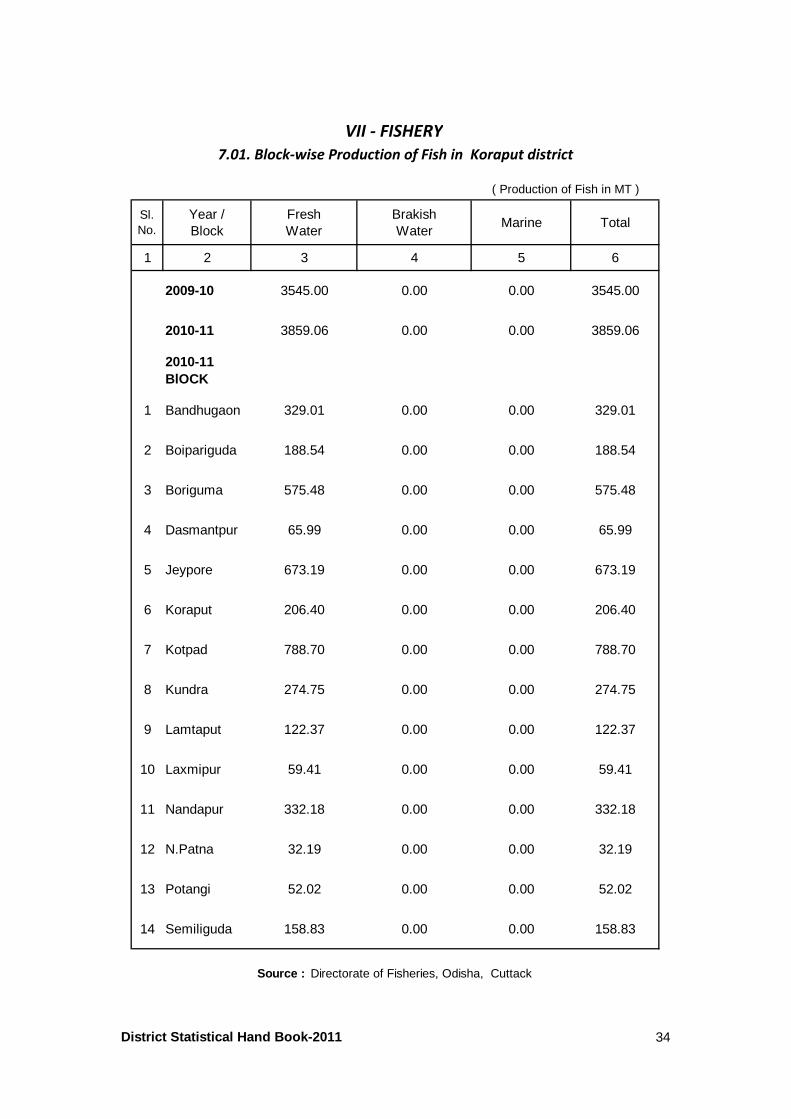
Sl.No.
Year /Block
FreshWater
BrakishWater
Marine Total
1 2 3 4 5 6
2009-10 3545.00 0.00 0.00 3545.00
2010-11 3859.06 0.00 0.00 3859.06
2010-11BlOCK
1 Bandhugaon 329.01 0.00 0.00 329.01
2 Boipariguda 188.54 0.00 0.00 188.54
3 Boriguma 575.48 0.00 0.00 575.48
4 Dasmantpur 65.99 0.00 0.00 65.99
5 Jeypore 673.19 0.00 0.00 673.19
6 Koraput 206.40 0.00 0.00 206.40
7 Kotpad 788.70 0.00 0.00 788.70
8 Kundra 274.75 0.00 0.00 274.75
9 Lamtaput 122.37 0.00 0.00 122.37
10 Laxmipur 59.41 0.00 0.00 59.41
11 Nandapur 332.18 0.00 0.00 332.18
12 N.Patna 32.19 0.00 0.00 32.19
13 Potangi 52.02 0.00 0.00 52.02
14 Semiliguda 158.83 0.00 0.00 158.83
7.01. Block-wise Production of Fish in Koraput district
Source : Directorate of Fisheries, Odisha, Cuttack
VII - FISHERY
( Production of Fish in MT )
District Statistical Hand Book-2011 34
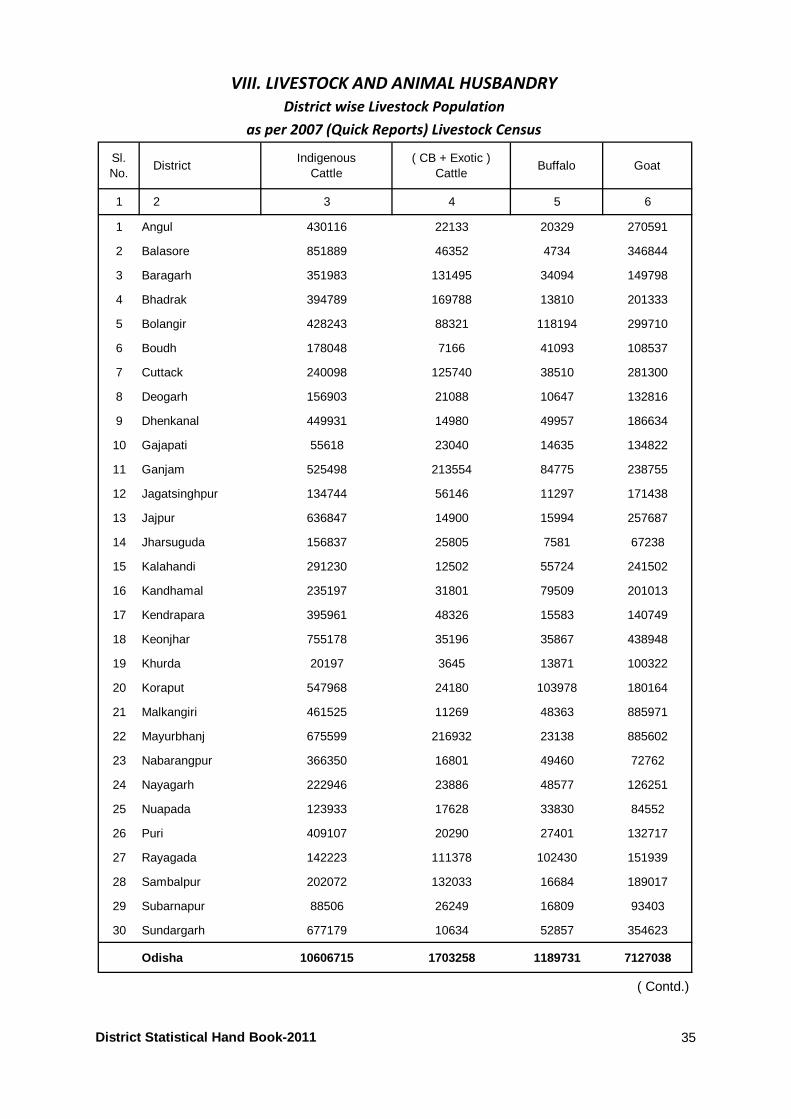
Sl.No.
DistrictIndigenous
Cattle( CB + Exotic )
CattleBuffalo Goat
1 2 3 4 5 6
1 Angul 430116 22133 20329 270591
2 Balasore 851889 46352 4734 346844
3 Baragarh 351983 131495 34094 149798
4 Bhadrak 394789 169788 13810 201333
5 Bolangir 428243 88321 118194 299710
6 Boudh 178048 7166 41093 108537
7 Cuttack 240098 125740 38510 281300
8 Deogarh 156903 21088 10647 132816
9 Dhenkanal 449931 14980 49957 186634
10 Gajapati 55618 23040 14635 134822
11 Ganjam 525498 213554 84775 238755
12 Jagatsinghpur 134744 56146 11297 171438
13 Jajpur 636847 14900 15994 257687
14 Jharsuguda 156837 25805 7581 67238
15 Kalahandi 291230 12502 55724 241502
16 Kandhamal 235197 31801 79509 201013
17 Kendrapara 395961 48326 15583 140749
18 Keonjhar 755178 35196 35867 438948
19 Khurda 20197 3645 13871 100322
20 Koraput 547968 24180 103978 180164
21 Malkangiri 461525 11269 48363 885971
22 Mayurbhanj 675599 216932 23138 885602
23 Nabarangpur 366350 16801 49460 72762
24 Nayagarh 222946 23886 48577 126251
25 Nuapada 123933 17628 33830 84552
26 Puri 409107 20290 27401 132717
27 Rayagada 142223 111378 102430 151939
28 Sambalpur 202072 132033 16684 189017
29 Subarnapur 88506 26249 16809 93403
30 Sundargarh 677179 10634 52857 354623
Odisha 10606715 1703258 1189731 7127038
( Contd.)
VIII. LIVESTOCK AND ANIMAL HUSBANDRY
District wise Livestock Population
as per 2007 (Quick Reports) Livestock Census
District Statistical Hand Book-2011 35
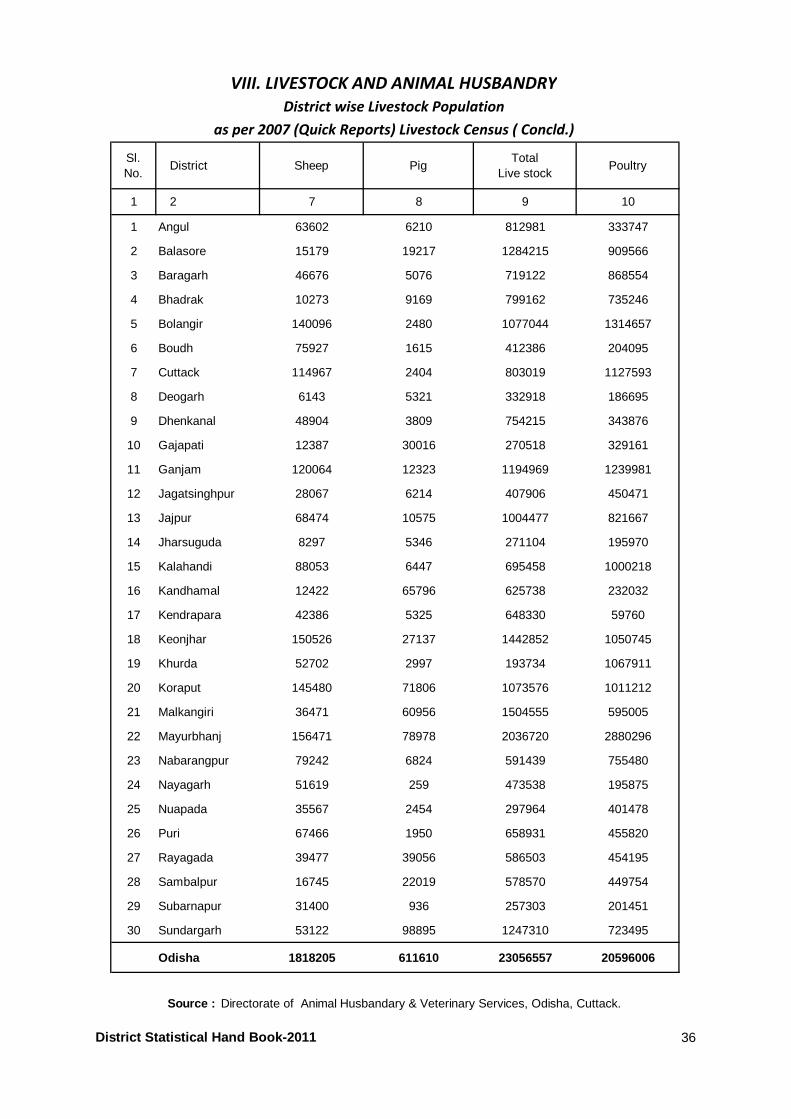
Sl.No.
District Sheep PigTotal
Live stockPoultry
1 2 7 8 9 10
1 Angul 63602 6210 812981 333747
2 Balasore 15179 19217 1284215 909566
3 Baragarh 46676 5076 719122 868554
4 Bhadrak 10273 9169 799162 735246
5 Bolangir 140096 2480 1077044 1314657
6 Boudh 75927 1615 412386 204095
7 Cuttack 114967 2404 803019 1127593
8 Deogarh 6143 5321 332918 186695
9 Dhenkanal 48904 3809 754215 343876
10 Gajapati 12387 30016 270518 329161
11 Ganjam 120064 12323 1194969 1239981
12 Jagatsinghpur 28067 6214 407906 450471
13 Jajpur 68474 10575 1004477 821667
14 Jharsuguda 8297 5346 271104 195970
15 Kalahandi 88053 6447 695458 1000218
16 Kandhamal 12422 65796 625738 232032
17 Kendrapara 42386 5325 648330 59760
18 Keonjhar 150526 27137 1442852 1050745
19 Khurda 52702 2997 193734 1067911
20 Koraput 145480 71806 1073576 1011212
21 Malkangiri 36471 60956 1504555 595005
22 Mayurbhanj 156471 78978 2036720 2880296
23 Nabarangpur 79242 6824 591439 755480
24 Nayagarh 51619 259 473538 195875
25 Nuapada 35567 2454 297964 401478
26 Puri 67466 1950 658931 455820
27 Rayagada 39477 39056 586503 454195
28 Sambalpur 16745 22019 578570 449754
29 Subarnapur 31400 936 257303 201451
30 Sundargarh 53122 98895 1247310 723495
Odisha 1818205 611610 23056557 20596006
Source : Directorate of Animal Husbandary & Veterinary Services, Odisha, Cuttack.
VIII. LIVESTOCK AND ANIMAL HUSBANDRY
District wise Livestock Population
as per 2007 (Quick Reports) Livestock Census ( Concld.)
District Statistical Hand Book-2011 36
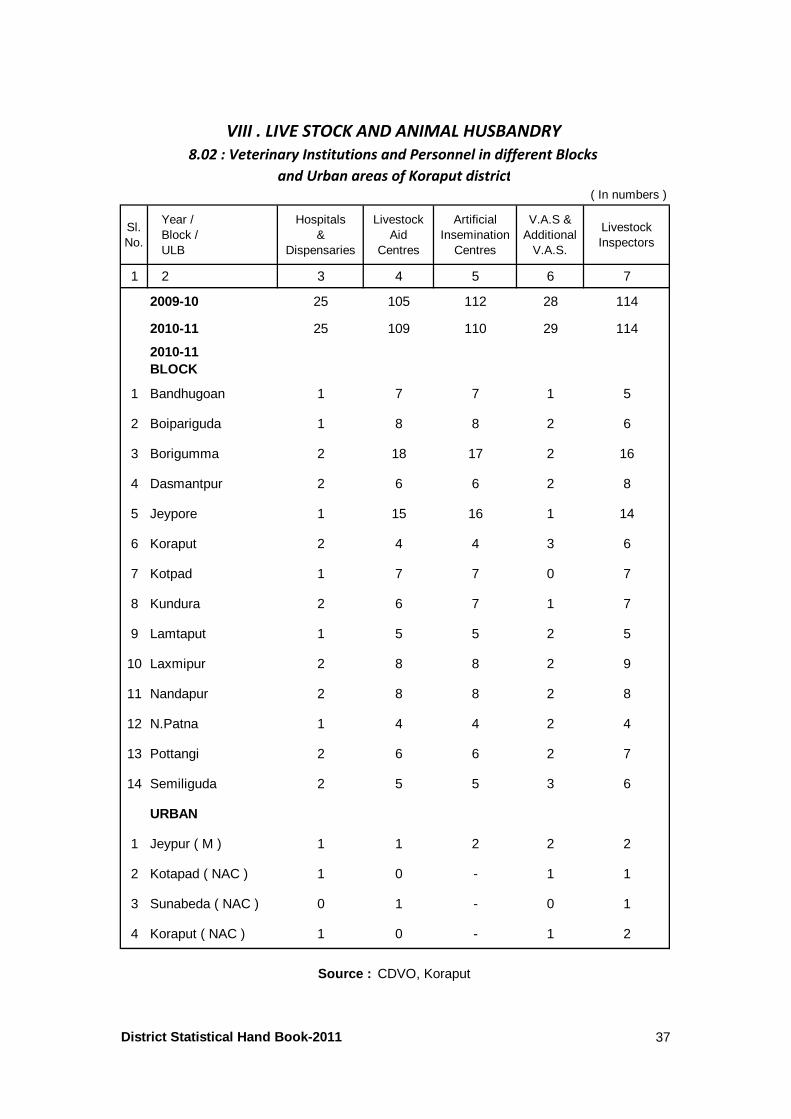
Sl.No.
Year /Block /ULB
Hospitals&
Dispensaries
LivestockAid
Centres
ArtificialInsemination
Centres
V.A.S &Additional
V.A.S.
LivestockInspectors
1 2 3 4 5 6 7
2009-10 25 105 112 28 114
2010-11 25 109 110 29 114
2010-11BLOCK
1 Bandhugoan 1 7 7 1 5
2 Boipariguda 1 8 8 2 6
3 Borigumma 2 18 17 2 16
4 Dasmantpur 2 6 6 2 8
5 Jeypore 1 15 16 1 14
6 Koraput 2 4 4 3 6
7 Kotpad 1 7 7 0 7
8 Kundura 2 6 7 1 7
9 Lamtaput 1 5 5 2 5
10 Laxmipur 2 8 8 2 9
11 Nandapur 2 8 8 2 8
12 N.Patna 1 4 4 2 4
13 Pottangi 2 6 6 2 7
14 Semiliguda 2 5 5 3 6
URBAN
1 Jeypur ( M ) 1 1 2 2 2
2 Kotapad ( NAC ) 1 0 - 1 1
3 Sunabeda ( NAC ) 0 1 - 0 1
4 Koraput ( NAC ) 1 0 - 1 2
VIII . LIVE STOCK AND ANIMAL HUSBANDRY
8.02 : Veterinary Institutions and Personnel in different Blocks
and Urban areas of Koraput district
( In numbers )
Source : CDVO, Koraput
District Statistical Hand Book-2011 37
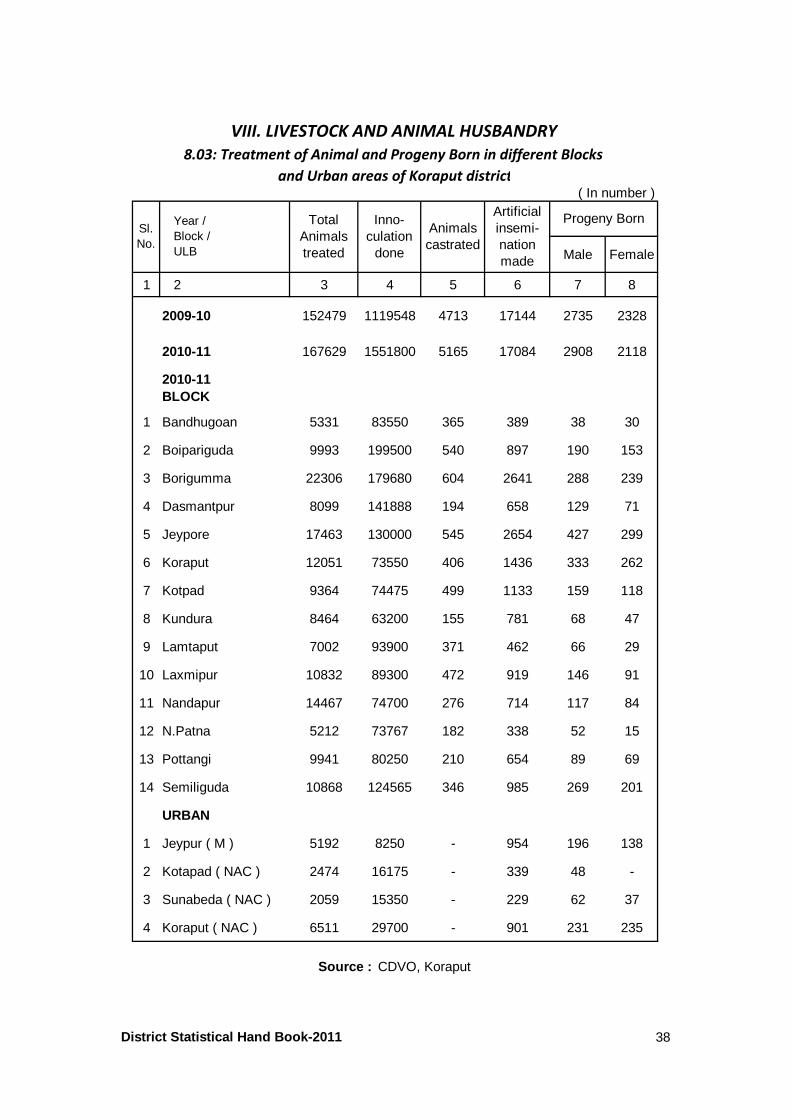
Male Female
1 2 3 4 5 6 7 8
2009-10 152479 1119548 4713 17144 2735 2328
2010-11 167629 1551800 5165 17084 2908 2118
2010-11BLOCK
1 Bandhugoan 5331 83550 365 389 38 30
2 Boipariguda 9993 199500 540 897 190 153
3 Borigumma 22306 179680 604 2641 288 239
4 Dasmantpur 8099 141888 194 658 129 71
5 Jeypore 17463 130000 545 2654 427 299
6 Koraput 12051 73550 406 1436 333 262
7 Kotpad 9364 74475 499 1133 159 118
8 Kundura 8464 63200 155 781 68 47
9 Lamtaput 7002 93900 371 462 66 29
10 Laxmipur 10832 89300 472 919 146 91
11 Nandapur 14467 74700 276 714 117 84
12 N.Patna 5212 73767 182 338 52 15
13 Pottangi 9941 80250 210 654 89 69
14 Semiliguda 10868 124565 346 985 269 201
URBAN
1 Jeypur ( M ) 5192 8250 - 954 196 138
2 Kotapad ( NAC ) 2474 16175 - 339 48 -
3 Sunabeda ( NAC ) 2059 15350 - 229 62 37
4 Koraput ( NAC ) 6511 29700 - 901 231 235
Source : CDVO, Koraput
Total Animals treated
Inno-culation
done
Animals castrated
Artificialinsemi-nationmade
( In number )
Year /Block /ULB
VIII. LIVESTOCK AND ANIMAL HUSBANDRY
8.03: Treatment of Animal and Progeny Born in different Blocks
and Urban areas of Koraput district
Progeny BornSl.No.
District Statistical Hand Book-2011 38
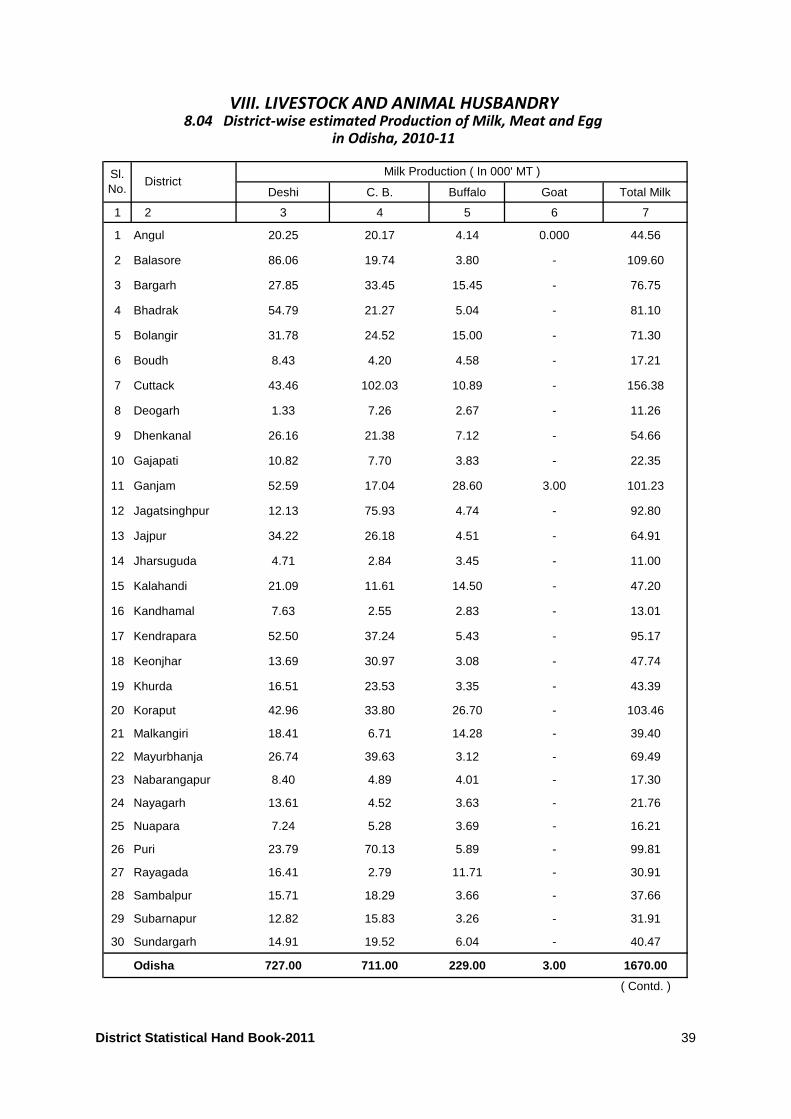
Deshi C. B. Buffalo Goat Total Milk
1 2 3 4 5 6 7
1 Angul 20.25 20.17 4.14 0.000 44.56
2 Balasore 86.06 19.74 3.80 - 109.60
3 Bargarh 27.85 33.45 15.45 - 76.75
4 Bhadrak 54.79 21.27 5.04 - 81.10
5 Bolangir 31.78 24.52 15.00 - 71.30
6 Boudh 8.43 4.20 4.58 - 17.21
7 Cuttack 43.46 102.03 10.89 - 156.38
8 Deogarh 1.33 7.26 2.67 - 11.26
9 Dhenkanal 26.16 21.38 7.12 - 54.66
10 Gajapati 10.82 7.70 3.83 - 22.35
11 Ganjam 52.59 17.04 28.60 3.00 101.23
12 Jagatsinghpur 12.13 75.93 4.74 - 92.80
13 Jajpur 34.22 26.18 4.51 - 64.91
14 Jharsuguda 4.71 2.84 3.45 - 11.00
15 Kalahandi 21.09 11.61 14.50 - 47.20
16 Kandhamal 7.63 2.55 2.83 - 13.01
17 Kendrapara 52.50 37.24 5.43 - 95.17
18 Keonjhar 13.69 30.97 3.08 - 47.74
19 Khurda 16.51 23.53 3.35 - 43.39
20 Koraput 42.96 33.80 26.70 - 103.46
21 Malkangiri 18.41 6.71 14.28 - 39.40
22 Mayurbhanja 26.74 39.63 3.12 - 69.49
23 Nabarangapur 8.40 4.89 4.01 - 17.30
24 Nayagarh 13.61 4.52 3.63 - 21.76
25 Nuapara 7.24 5.28 3.69 - 16.21
26 Puri 23.79 70.13 5.89 - 99.81
27 Rayagada 16.41 2.79 11.71 - 30.91
28 Sambalpur 15.71 18.29 3.66 - 37.66
29 Subarnapur 12.82 15.83 3.26 - 31.91
30 Sundargarh 14.91 19.52 6.04 - 40.47
Odisha 727.00 711.00 229.00 3.00 1670.00
( Contd. )
Sl.No.
DistrictMilk Production ( In 000' MT )
in Odisha, 2010-11
VIII. LIVESTOCK AND ANIMAL HUSBANDRY8.04 District-wise estimated Production of Milk, Meat and Egg
District Statistical Hand Book-2011 39
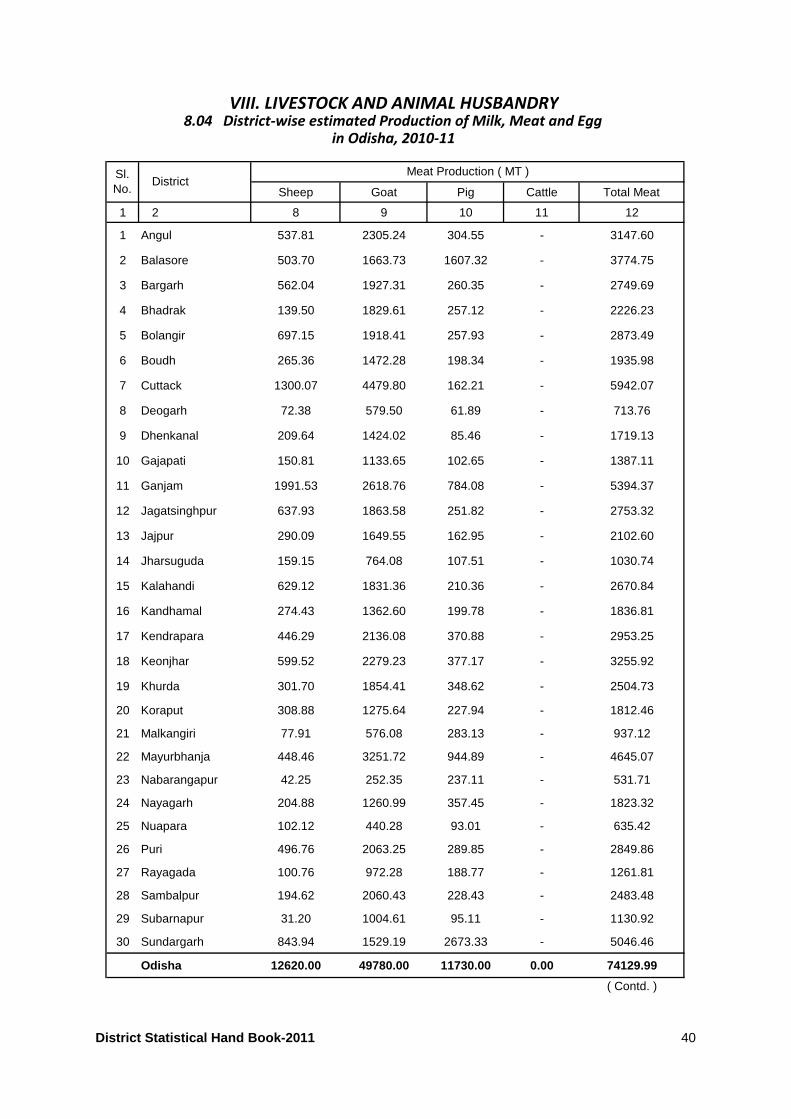
Sheep Goat Pig Cattle Total Meat
1 2 8 9 10 11 12
1 Angul 537.81 2305.24 304.55 - 3147.60
2 Balasore 503.70 1663.73 1607.32 - 3774.75
3 Bargarh 562.04 1927.31 260.35 - 2749.69
4 Bhadrak 139.50 1829.61 257.12 - 2226.23
5 Bolangir 697.15 1918.41 257.93 - 2873.49
6 Boudh 265.36 1472.28 198.34 - 1935.98
7 Cuttack 1300.07 4479.80 162.21 - 5942.07
8 Deogarh 72.38 579.50 61.89 - 713.76
9 Dhenkanal 209.64 1424.02 85.46 - 1719.13
10 Gajapati 150.81 1133.65 102.65 - 1387.11
11 Ganjam 1991.53 2618.76 784.08 - 5394.37
12 Jagatsinghpur 637.93 1863.58 251.82 - 2753.32
13 Jajpur 290.09 1649.55 162.95 - 2102.60
14 Jharsuguda 159.15 764.08 107.51 - 1030.74
15 Kalahandi 629.12 1831.36 210.36 - 2670.84
16 Kandhamal 274.43 1362.60 199.78 - 1836.81
17 Kendrapara 446.29 2136.08 370.88 - 2953.25
18 Keonjhar 599.52 2279.23 377.17 - 3255.92
19 Khurda 301.70 1854.41 348.62 - 2504.73
20 Koraput 308.88 1275.64 227.94 - 1812.46
21 Malkangiri 77.91 576.08 283.13 - 937.12
22 Mayurbhanja 448.46 3251.72 944.89 - 4645.07
23 Nabarangapur 42.25 252.35 237.11 - 531.71
24 Nayagarh 204.88 1260.99 357.45 - 1823.32
25 Nuapara 102.12 440.28 93.01 - 635.42
26 Puri 496.76 2063.25 289.85 - 2849.86
27 Rayagada 100.76 972.28 188.77 - 1261.81
28 Sambalpur 194.62 2060.43 228.43 - 2483.48
29 Subarnapur 31.20 1004.61 95.11 - 1130.92
30 Sundargarh 843.94 1529.19 2673.33 - 5046.46
Odisha 12620.00 49780.00 11730.00 0.00 74129.99
( Contd. )
Sl.No.
DistrictMeat Production ( MT )
in Odisha, 2010-11
VIII. LIVESTOCK AND ANIMAL HUSBANDRY8.04 District-wise estimated Production of Milk, Meat and Egg
District Statistical Hand Book-2011 40
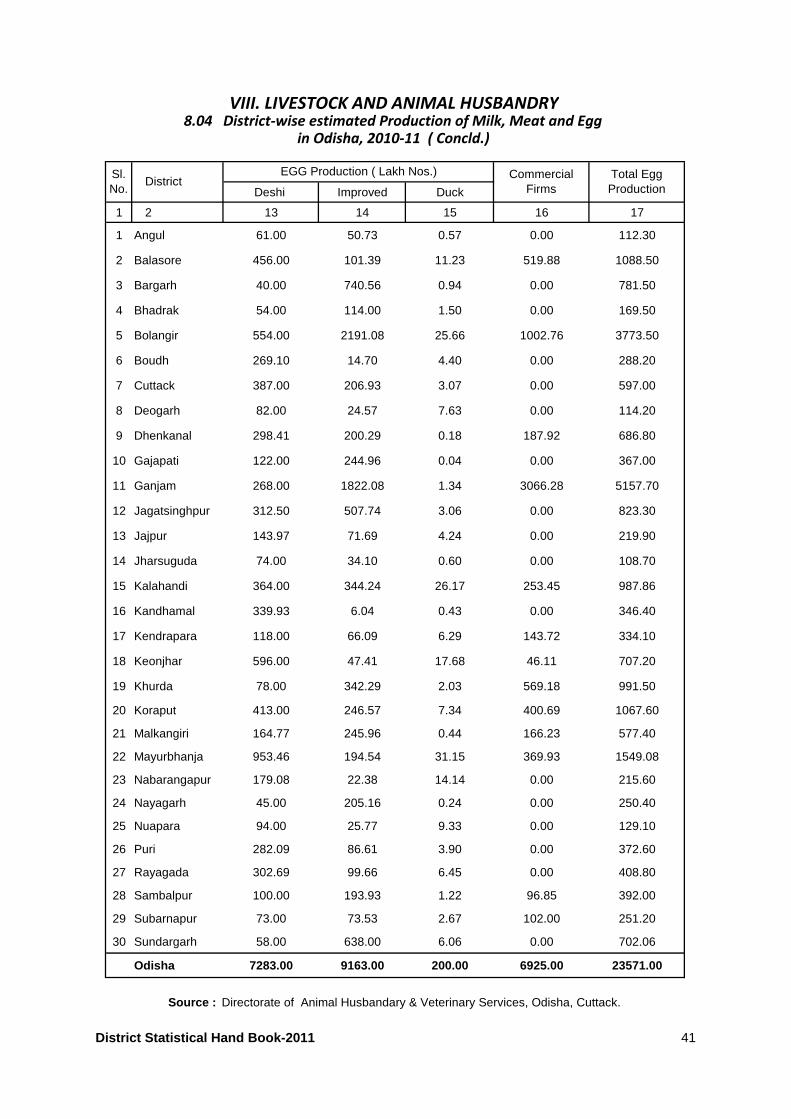
Deshi Improved Duck
1 2 13 14 15 16 17
1 Angul 61.00 50.73 0.57 0.00 112.30
2 Balasore 456.00 101.39 11.23 519.88 1088.50
3 Bargarh 40.00 740.56 0.94 0.00 781.50
4 Bhadrak 54.00 114.00 1.50 0.00 169.50
5 Bolangir 554.00 2191.08 25.66 1002.76 3773.50
6 Boudh 269.10 14.70 4.40 0.00 288.20
7 Cuttack 387.00 206.93 3.07 0.00 597.00
8 Deogarh 82.00 24.57 7.63 0.00 114.20
9 Dhenkanal 298.41 200.29 0.18 187.92 686.80
10 Gajapati 122.00 244.96 0.04 0.00 367.00
11 Ganjam 268.00 1822.08 1.34 3066.28 5157.70
12 Jagatsinghpur 312.50 507.74 3.06 0.00 823.30
13 Jajpur 143.97 71.69 4.24 0.00 219.90
14 Jharsuguda 74.00 34.10 0.60 0.00 108.70
15 Kalahandi 364.00 344.24 26.17 253.45 987.86
16 Kandhamal 339.93 6.04 0.43 0.00 346.40
17 Kendrapara 118.00 66.09 6.29 143.72 334.10
18 Keonjhar 596.00 47.41 17.68 46.11 707.20
19 Khurda 78.00 342.29 2.03 569.18 991.50
20 Koraput 413.00 246.57 7.34 400.69 1067.60
21 Malkangiri 164.77 245.96 0.44 166.23 577.40
22 Mayurbhanja 953.46 194.54 31.15 369.93 1549.08
23 Nabarangapur 179.08 22.38 14.14 0.00 215.60
24 Nayagarh 45.00 205.16 0.24 0.00 250.40
25 Nuapara 94.00 25.77 9.33 0.00 129.10
26 Puri 282.09 86.61 3.90 0.00 372.60
27 Rayagada 302.69 99.66 6.45 0.00 408.80
28 Sambalpur 100.00 193.93 1.22 96.85 392.00
29 Subarnapur 73.00 73.53 2.67 102.00 251.20
30 Sundargarh 58.00 638.00 6.06 0.00 702.06
Odisha 7283.00 9163.00 200.00 6925.00 23571.00
Sl.No.
DistrictEGG Production ( Lakh Nos.) Commercial
FirmsTotal EggProduction
Source : Directorate of Animal Husbandary & Veterinary Services, Odisha, Cuttack.
in Odisha, 2010-11 ( Concld.)
VIII. LIVESTOCK AND ANIMAL HUSBANDRY8.04 District-wise estimated Production of Milk, Meat and Egg
District Statistical Hand Book-2011 41
Sl.No.
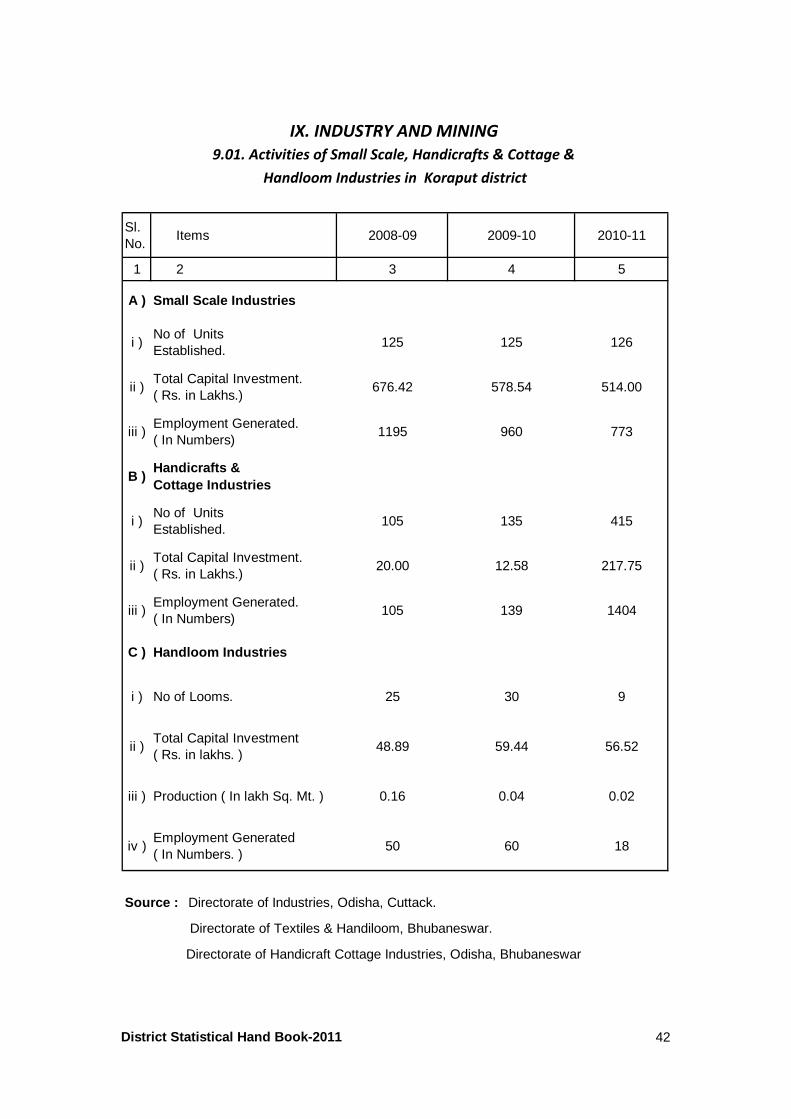
Items 2008-09 2009-10 2010-11
1 2 3 4 5
A ) Small Scale Industries
i )No of Units Established.
125 125 126
ii )Total Capital Investment. ( Rs. in Lakhs.)
676.42 578.54 514.00
iii )Employment Generated.( In Numbers)
1195 960 773
B )Handicrafts &Cottage Industries
i )No of Units Established.
105 135 415
ii )Total Capital Investment. ( Rs. in Lakhs.)
20.00 12.58 217.75
iii )Employment Generated.( In Numbers)
105 139 1404
C ) Handloom Industries
i ) No of Looms. 25 30 9
ii )Total Capital Investment ( Rs. in lakhs. )
48.89 59.44 56.52
iii ) Production ( In lakh Sq. Mt. ) 0.16 0.04 0.02
iv )Employment Generated ( In Numbers. )
50 60 18
Directorate of Textiles & Handiloom, Bhubaneswar.
Directorate of Handicraft Cottage Industries, Odisha, Bhubaneswar
IX. INDUSTRY AND MINING
9.01. Activities of Small Scale, Handicrafts & Cottage &
Source : Directorate of Industries, Odisha, Cuttack.
Handloom Industries in Koraput district
District Statistical Hand Book-2011 42
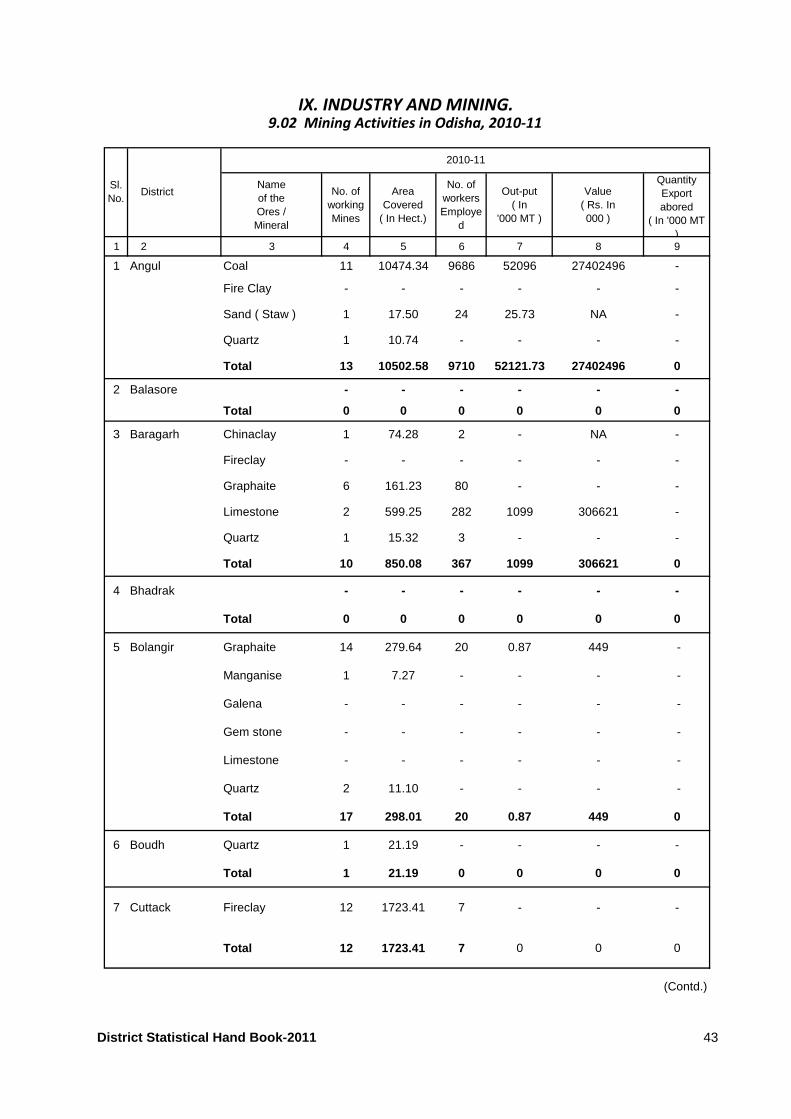
Nameof theOres /Mineral
No. of workingMines
Area Covered
( In Hect.)
No. of workersEmploye
d
Out-put( In
'000 MT )
Value( Rs. In000 )
Quantity Exportabored
( In '000 MT )
1 2 3 4 5 6 7 8 9
1 Angul Coal 11 10474.34 9686 52096 27402496 -
Fire Clay - - - - - -
Sand ( Staw ) 1 17.50 24 25.73 NA -
Quartz 1 10.74 - - - -
Total 13 10502.58 9710 52121.73 27402496 0
2 Balasore - - - - - -
Total 0 0 0 0 0 0
3 Baragarh Chinaclay 1 74.28 2 - NA -
Fireclay - - - - - -
Graphaite 6 161.23 80 - - -
Limestone 2 599.25 282 1099 306621 -
Quartz 1 15.32 3 - - -
Total 10 850.08 367 1099 306621 0
4 Bhadrak - - - - - -
Total 0 0 0 0 0 0
5 Bolangir Graphaite 14 279.64 20 0.87 449 -
Manganise 1 7.27 - - - -
Galena - - - - - -
Gem stone - - - - - -
Limestone - - - - - -
Quartz 2 11.10 - - - -
Total 17 298.01 20 0.87 449 0
6 Boudh Quartz 1 21.19 - - - -
Total 1 21.19 0 0 0 0
7 Cuttack Fireclay 12 1723.41 7 - - -
Total 12 1723.41 7 0 0 0
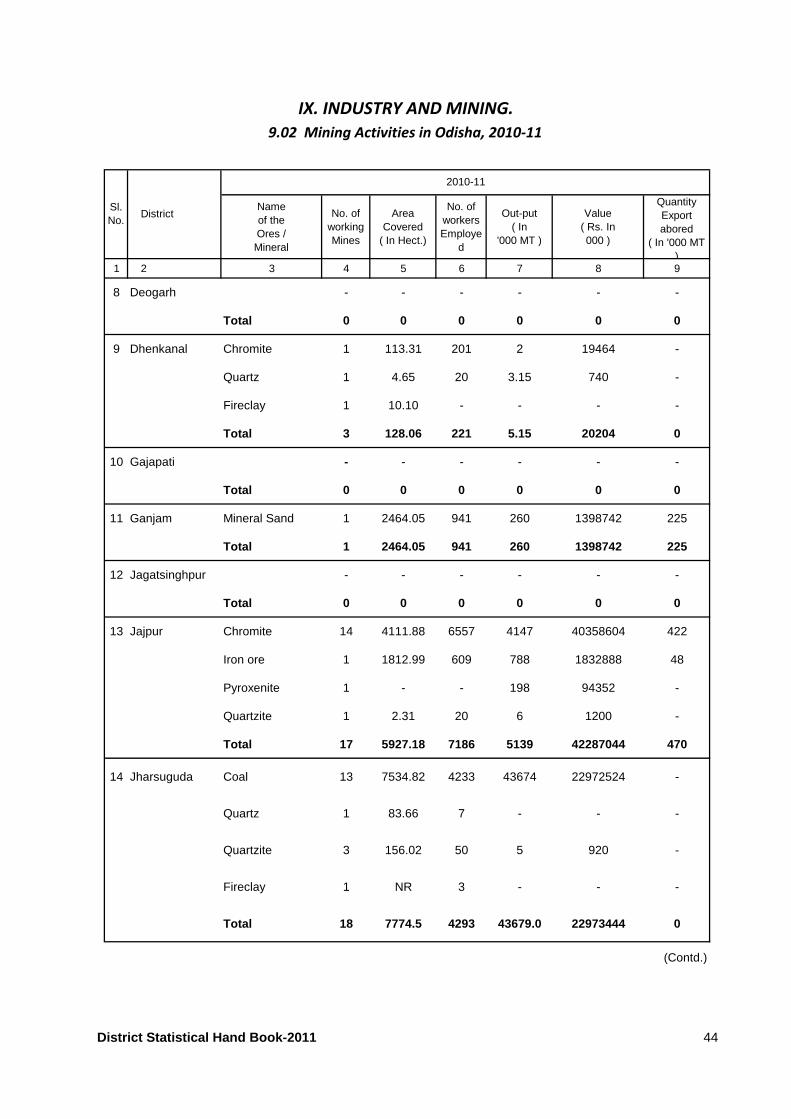
IX. INDUSTRY AND MINING.9.02 Mining Activities in Odisha, 2010-11
Sl. No.
District
2010-11
(Contd.)
District Statistical Hand Book-2011 43
Nameof theOres /Mineral
No. of workingMines
Area Covered
( In Hect.)
No. of workersEmploye
d
Out-put( In
'000 MT )
Value( Rs. In000 )
Quantity Exportabored
( In '000 MT )
1 2 3 4 5 6 7 8 9
8 Deogarh - - - - - -
Total 0 0 0 0 0 0
9 Dhenkanal Chromite 1 113.31 201 2 19464 -
Quartz 1 4.65 20 3.15 740 -
Fireclay 1 10.10 - - - -
Total 3 128.06 221 5.15 20204 0
10 Gajapati - - - - - -
Total 0 0 0 0 0 0
11 Ganjam Mineral Sand 1 2464.05 941 260 1398742 225
Total 1 2464.05 941 260 1398742 225
12 Jagatsinghpur - - - - - -
Total 0 0 0 0 0 0
13 Jajpur Chromite 14 4111.88 6557 4147 40358604 422
Iron ore 1 1812.99 609 788 1832888 48
Pyroxenite 1 - - 198 94352 -
Quartzite 1 2.31 20 6 1200 -
Total 17 5927.18 7186 5139 42287044 470
14 Jharsuguda Coal 13 7534.82 4233 43674 22972524 -
Quartz 1 83.66 7 - - -
Quartzite 3 156.02 50 5 920 -
Fireclay 1 NR 3 - - -
Total 18 7774.5 4293 43679.0 22973444 0
IX. INDUSTRY AND MINING.
9.02 Mining Activities in Odisha, 2010-11
Sl. No.
District
2010-11
(Contd.)
District Statistical Hand Book-2011 44
Nameof theOres /Mineral
No. of workingMines
Area Covered
( In Hect.)
No. of workersEmploye
d
Out-put( In
'000 MT )
Value( Rs. In000 )
Quantity Exportabored
( In '000 MT )
1 2 3 4 5 6 7 8 9
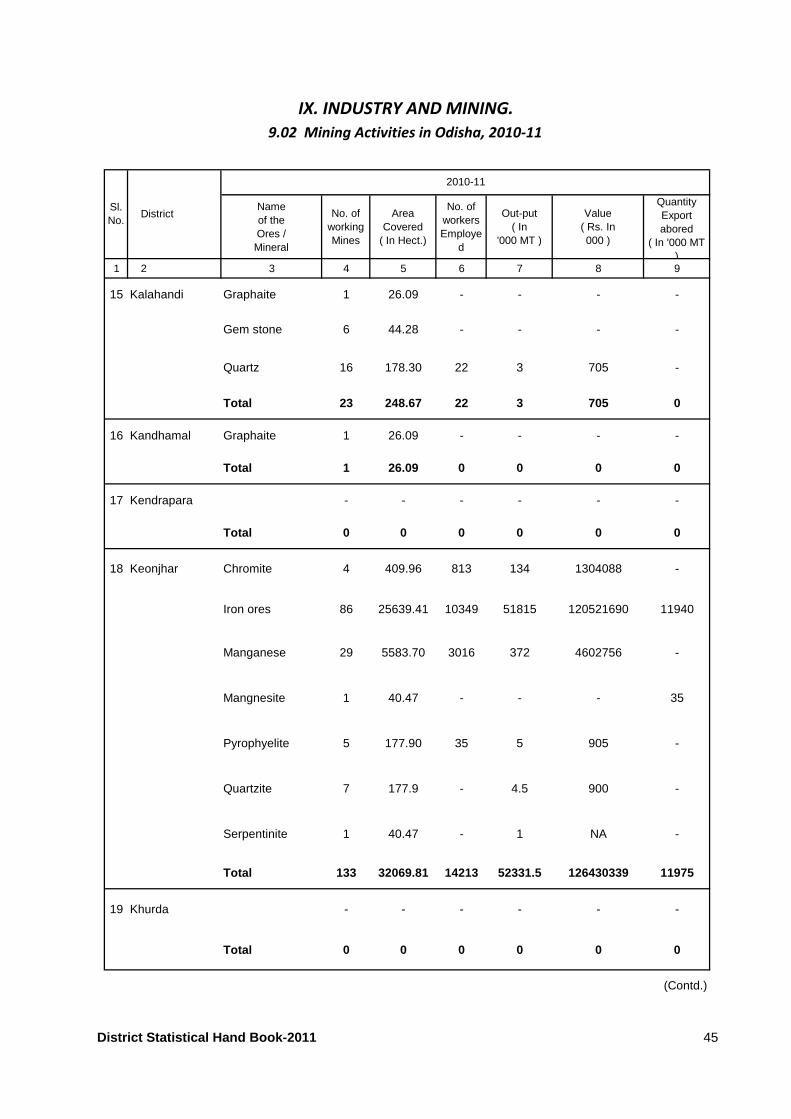
15 Kalahandi Graphaite 1 26.09 - - - -
Gem stone 6 44.28 - - - -
Quartz 16 178.30 22 3 705 -
Total 23 248.67 22 3 705 0
16 Kandhamal Graphaite 1 26.09 - - - -
Total 1 26.09 0 0 0 0
17 Kendrapara - - - - - -
Total 0 0 0 0 0 0
18 Keonjhar Chromite 4 409.96 813 134 1304088 -
Iron ores 86 25639.41 10349 51815 120521690 11940
Manganese 29 5583.70 3016 372 4602756 -
Mangnesite 1 40.47 - - - 35
Pyrophyelite 5 177.90 35 5 905 -
Quartzite 7 177.9 - 4.5 900 -
Serpentinite 1 40.47 - 1 NA -
Total 133 32069.81 14213 52331.5 126430339 11975
19 Khurda - - - - - -
Total 0 0 0 0 0 0
IX. INDUSTRY AND MINING.
9.02 Mining Activities in Odisha, 2010-11
Sl. No.
District
2010-11
(Contd.)
District Statistical Hand Book-2011 45
Nameof theOres /Mineral
No. of workingMines
Area Covered
( In Hect.)
No. of workersEmploye
d
Out-put( In
'000 MT )
Value( Rs. In000 )
Quantity Exportabored
( In '000 MT )
1 2 3 4 5 6 7 8 9
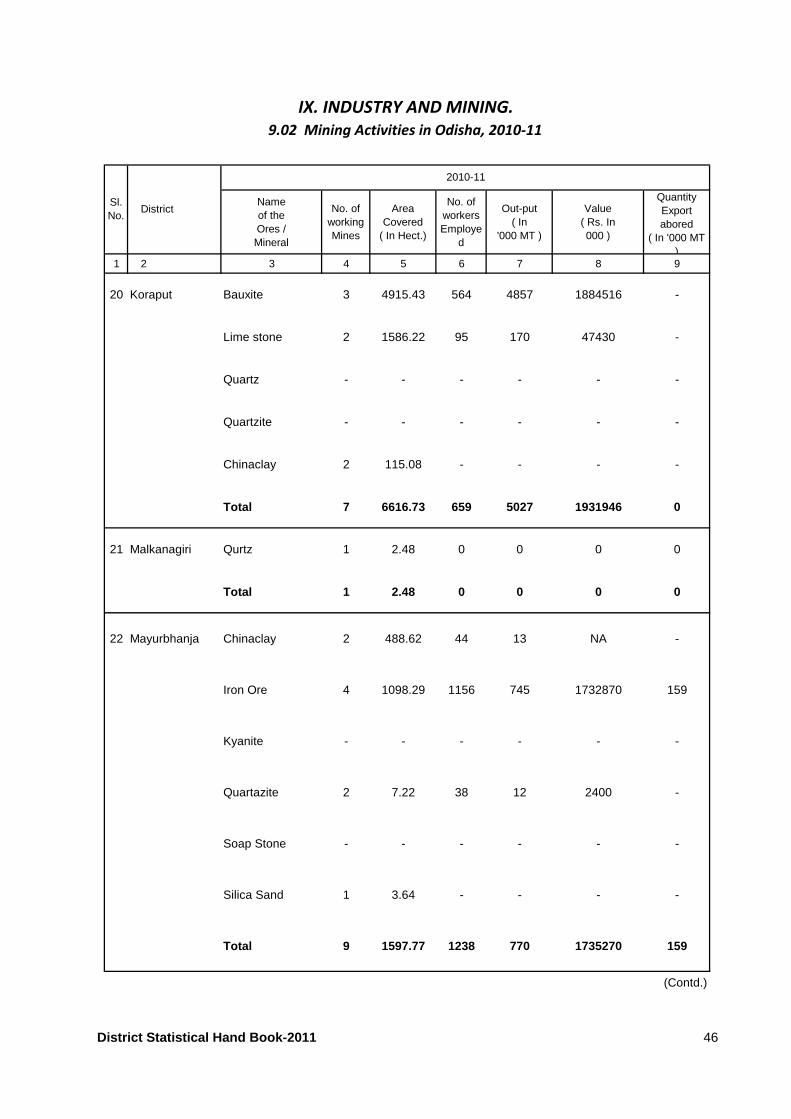
20 Koraput Bauxite 3 4915.43 564 4857 1884516 -
Lime stone 2 1586.22 95 170 47430 -
Quartz - - - - - -
Quartzite - - - - - -
Chinaclay 2 115.08 - - - -
Total 7 6616.73 659 5027 1931946 0
21 Malkanagiri Qurtz 1 2.48 0 0 0 0
Total 1 2.48 0 0 0 0
22 Mayurbhanja Chinaclay 2 488.62 44 13 NA -
Iron Ore 4 1098.29 1156 745 1732870 159
Kyanite - - - - - -
Quartazite 2 7.22 38 12 2400 -
Soap Stone - - - - - -
Silica Sand 1 3.64 - - - -
Total 9 1597.77 1238 770 1735270 159
IX. INDUSTRY AND MINING.
9.02 Mining Activities in Odisha, 2010-11
Sl. No.
District
2010-11
(Contd.)
District Statistical Hand Book-2011 46
Nameof theOres /Mineral
No. of workingMines
Area Covered
( In Hect.)
No. of workersEmploye
d
Out-put( In
'000 MT )
Value( Rs. In000 )
Quantity Exportabored
( In '000 MT )
1 2 3 4 5 6 7 8 9
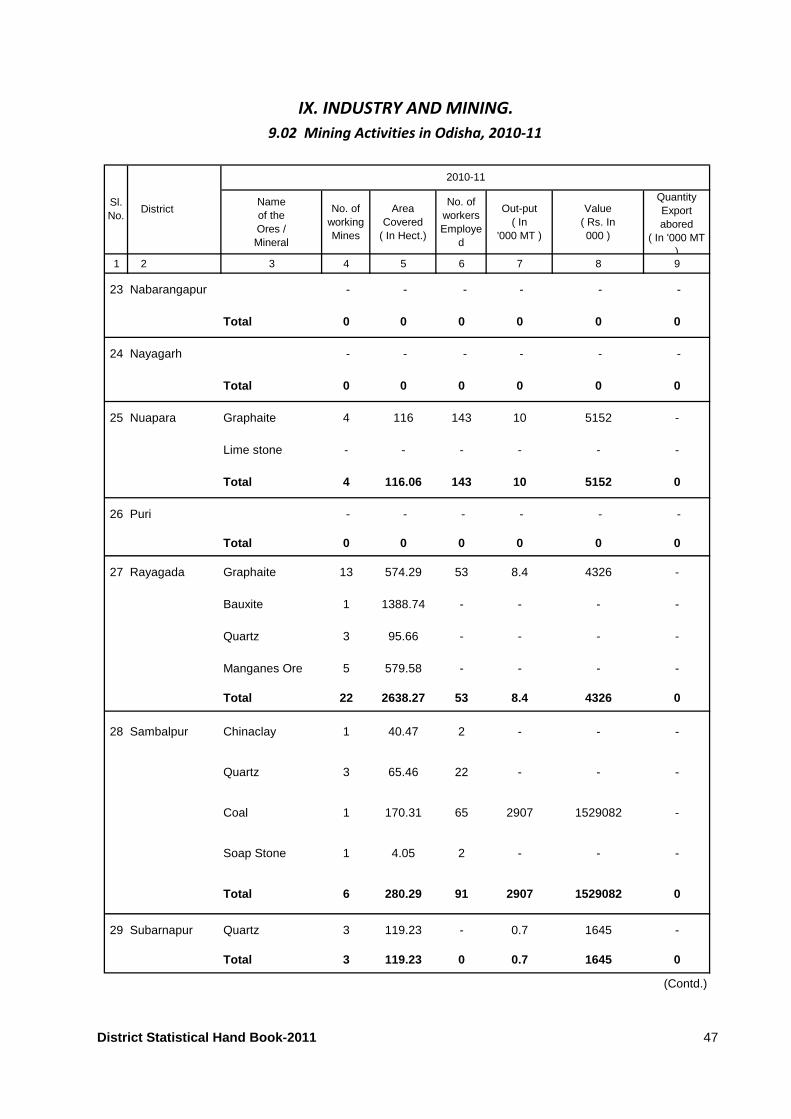
23 Nabarangapur - - - - - -
Total 0 0 0 0 0 0
24 Nayagarh - - - - - -
Total 0 0 0 0 0 0
25 Nuapara Graphaite 4 116 143 10 5152 -
Lime stone - - - - - -
Total 4 116.06 143 10 5152 0
26 Puri - - - - - -
Total 0 0 0 0 0 0
27 Rayagada Graphaite 13 574.29 53 8.4 4326 -
Bauxite 1 1388.74 - - - -
Quartz 3 95.66 - - - -
Manganes Ore 5 579.58 - - - -
Total 22 2638.27 53 8.4 4326 0
28 Sambalpur Chinaclay 1 40.47 2 - - -
Quartz 3 65.46 22 - - -
Coal 1 170.31 65 2907 1529082 -
Soap Stone 1 4.05 2 - - -
Total 6 280.29 91 2907 1529082 0
29 Subarnapur Quartz 3 119.23 - 0.7 1645 -
Total 3 119.23 0 0.7 1645 0
IX. INDUSTRY AND MINING.
9.02 Mining Activities in Odisha, 2010-11
Sl. No.
District
2010-11
(Contd.)
District Statistical Hand Book-2011 47
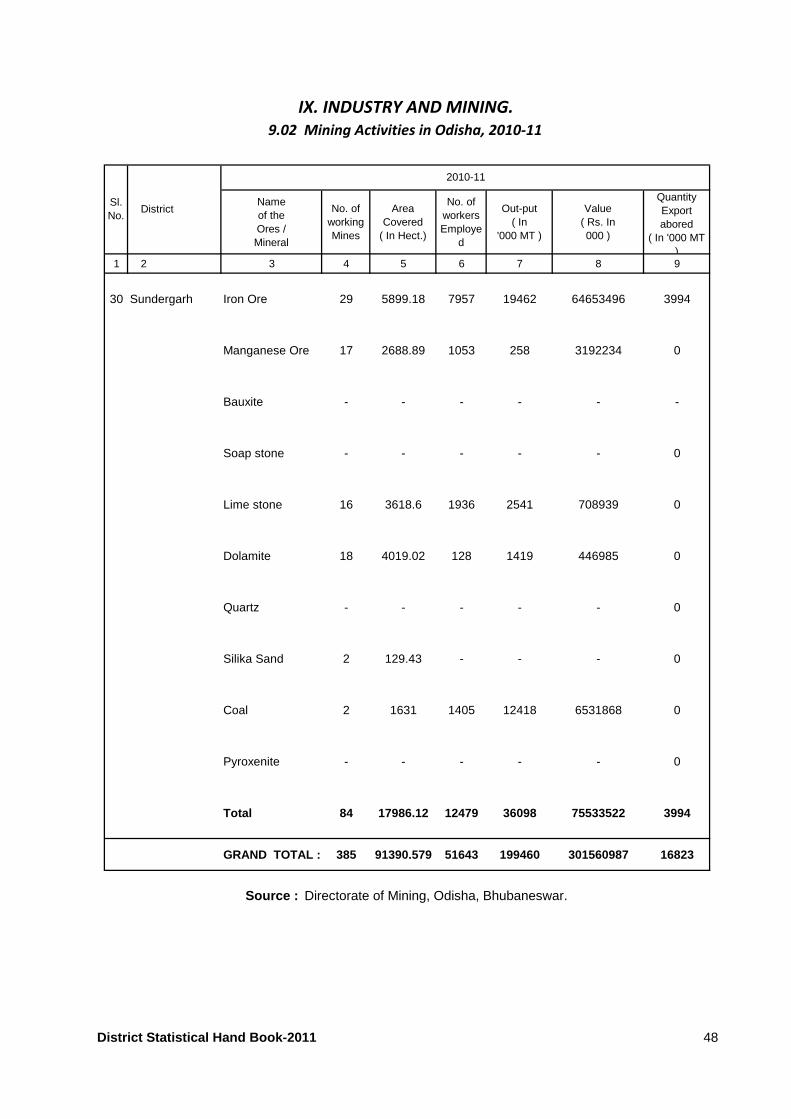
Nameof theOres /Mineral
No. of workingMines
Area Covered
( In Hect.)
No. of workersEmploye
d
Out-put( In
'000 MT )
Value( Rs. In000 )
Quantity Exportabored
( In '000 MT )
1 2 3 4 5 6 7 8 9
30 Sundergarh Iron Ore 29 5899.18 7957 19462 64653496 3994
Manganese Ore 17 2688.89 1053 258 3192234 0
Bauxite - - - - - -
Soap stone - - - - - 0
Lime stone 16 3618.6 1936 2541 708939 0
Dolamite 18 4019.02 128 1419 446985 0
Quartz - - - - - 0
Silika Sand 2 129.43 - - - 0
Coal 2 1631 1405 12418 6531868 0
Pyroxenite - - - - - 0
Total 84 17986.12 12479 36098 75533522 3994
GRAND TOTAL : 385 91390.579 51643 199460 301560987 16823
IX. INDUSTRY AND MINING.
9.02 Mining Activities in Odisha, 2010-11
Sl. No.
District
2010-11
Source : Directorate of Mining, Odisha, Bhubaneswar.
District Statistical Hand Book-2011 48
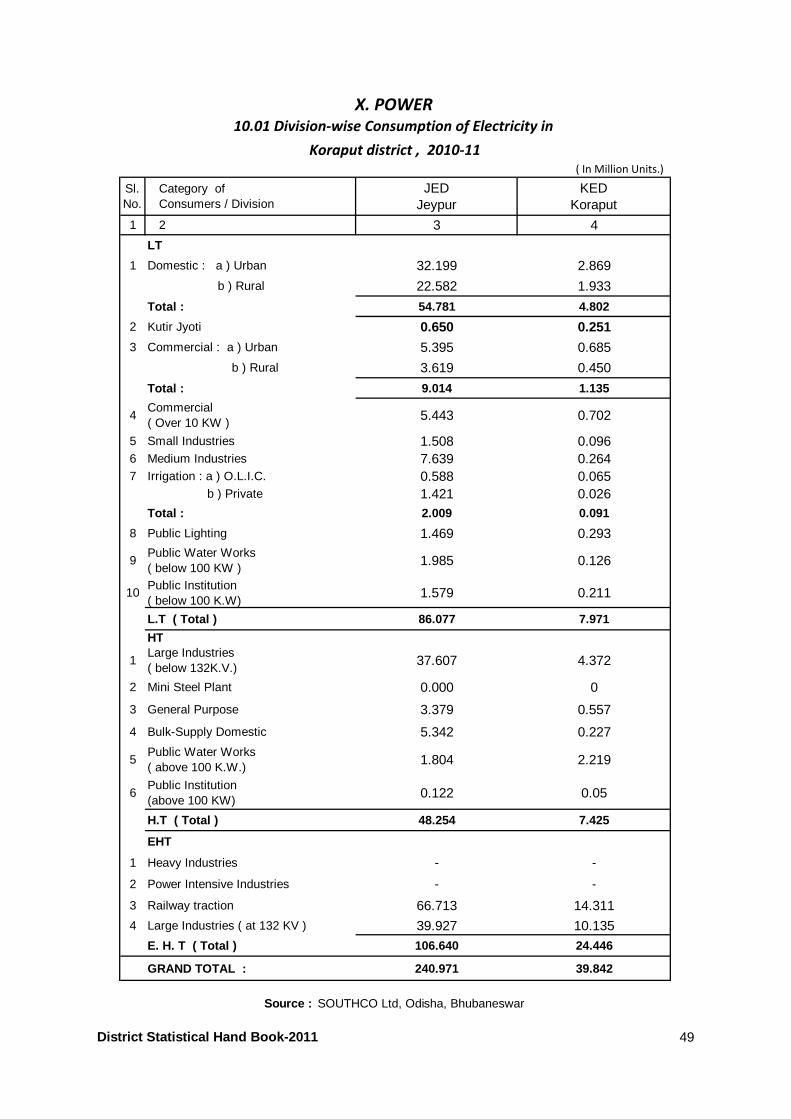
Sl.No.
Category of Consumers / Division
JEDJeypur
KED Koraput
1 2 3 4
LT
1 Domestic : a ) Urban 32.199 2.869
b ) Rural 22.582 1.933
Total : 54.781 4.802
2 Kutir Jyoti 0.650 0.2513 Commercial : a ) Urban 5.395 0.685
b ) Rural 3.619 0.450
Total : 9.014 1.135
4Commercial ( Over 10 KW )
5.443 0.702
5 Small Industries 1.508 0.0966 Medium Industries 7.639 0.2647 Irrigation : a ) O.L.I.C. 0.588 0.065
b ) Private 1.421 0.026Total : 2.009 0.091
8 Public Lighting 1.469 0.293
9Public Water Works( below 100 KW )
1.985 0.126
10Public Institution ( below 100 K.W)
1.579 0.211
L.T ( Total ) 86.077 7.971
HT
1Large Industries ( below 132K.V.)
37.607 4.372
2 Mini Steel Plant 0.000 0
3 General Purpose 3.379 0.557
4 Bulk-Supply Domestic 5.342 0.227
5Public Water Works ( above 100 K.W.)
1.804 2.219
6Public Institution(above 100 KW)
0.122 0.05
H.T ( Total ) 48.254 7.425
EHT
1 Heavy Industries - -
2 Power Intensive Industries - -
3 Railway traction 66.713 14.311
4 Large Industries ( at 132 KV ) 39.927 10.135
E. H. T ( Total ) 106.640 24.446
GRAND TOTAL : 240.971 39.842
Source : SOUTHCO Ltd, Odisha, Bhubaneswar
X. POWER
10.01 Division-wise Consumption of Electricity in
Koraput district , 2010-11
( In Million Units.)
District Statistical Hand Book-2011 49
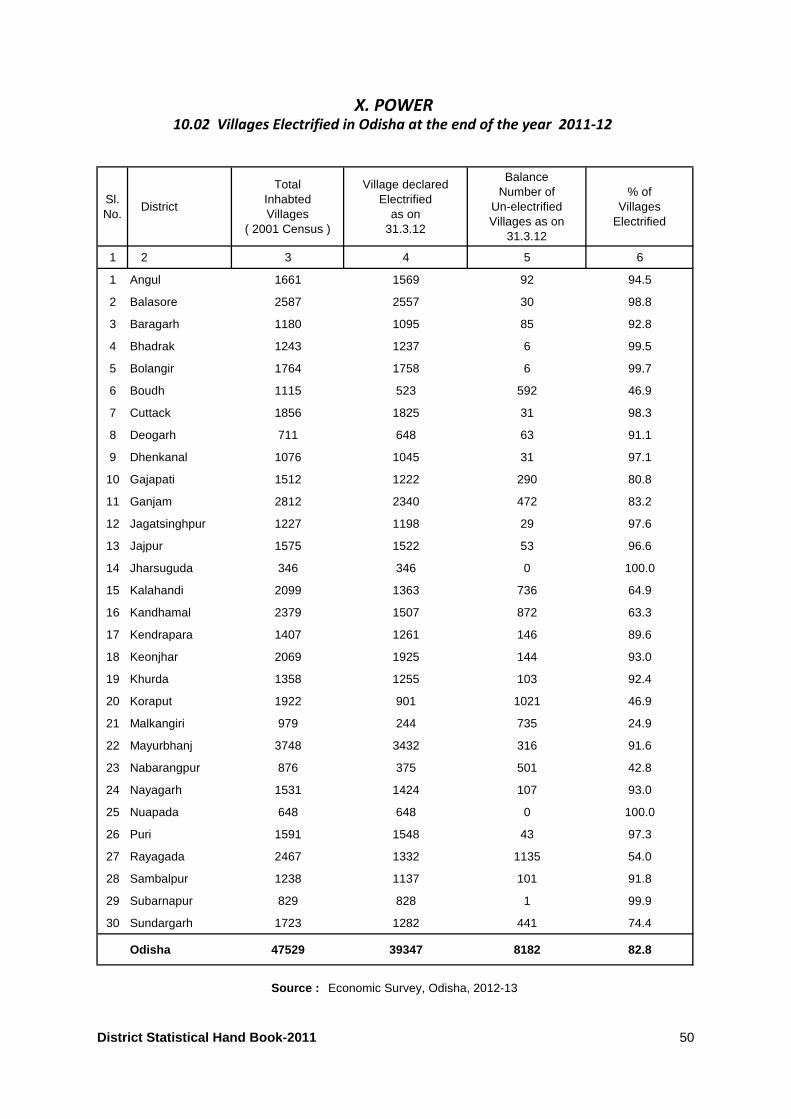
Sl.No.
District
TotalInhabted Villages
( 2001 Census )
Village declaredElectrified
as on31.3.12
Balance Number of
Un-electrified Villages as on
31.3.12
% ofVillages
Electrified
1 2 3 4 5 6
1 Angul 1661 1569 92 94.5
2 Balasore 2587 2557 30 98.8
3 Baragarh 1180 1095 85 92.8
4 Bhadrak 1243 1237 6 99.5
5 Bolangir 1764 1758 6 99.7
6 Boudh 1115 523 592 46.9
7 Cuttack 1856 1825 31 98.3
8 Deogarh 711 648 63 91.1
9 Dhenkanal 1076 1045 31 97.1
10 Gajapati 1512 1222 290 80.8
11 Ganjam 2812 2340 472 83.2
12 Jagatsinghpur 1227 1198 29 97.6
13 Jajpur 1575 1522 53 96.6
14 Jharsuguda 346 346 0 100.0
15 Kalahandi 2099 1363 736 64.9
16 Kandhamal 2379 1507 872 63.3
17 Kendrapara 1407 1261 146 89.6
18 Keonjhar 2069 1925 144 93.0
19 Khurda 1358 1255 103 92.4
20 Koraput 1922 901 1021 46.9
21 Malkangiri 979 244 735 24.9
22 Mayurbhanj 3748 3432 316 91.6
23 Nabarangpur 876 375 501 42.8
24 Nayagarh 1531 1424 107 93.0
25 Nuapada 648 648 0 100.0
26 Puri 1591 1548 43 97.3
27 Rayagada 2467 1332 1135 54.0
28 Sambalpur 1238 1137 101 91.8
29 Subarnapur 829 828 1 99.9
30 Sundargarh 1723 1282 441 74.4
Odisha 47529 39347 8182 82.8
X. POWER10.02 Villages Electrified in Odisha at the end of the year 2011-12
Source : Economic Survey, Odisha, 2012-13
District Statistical Hand Book-2011 50
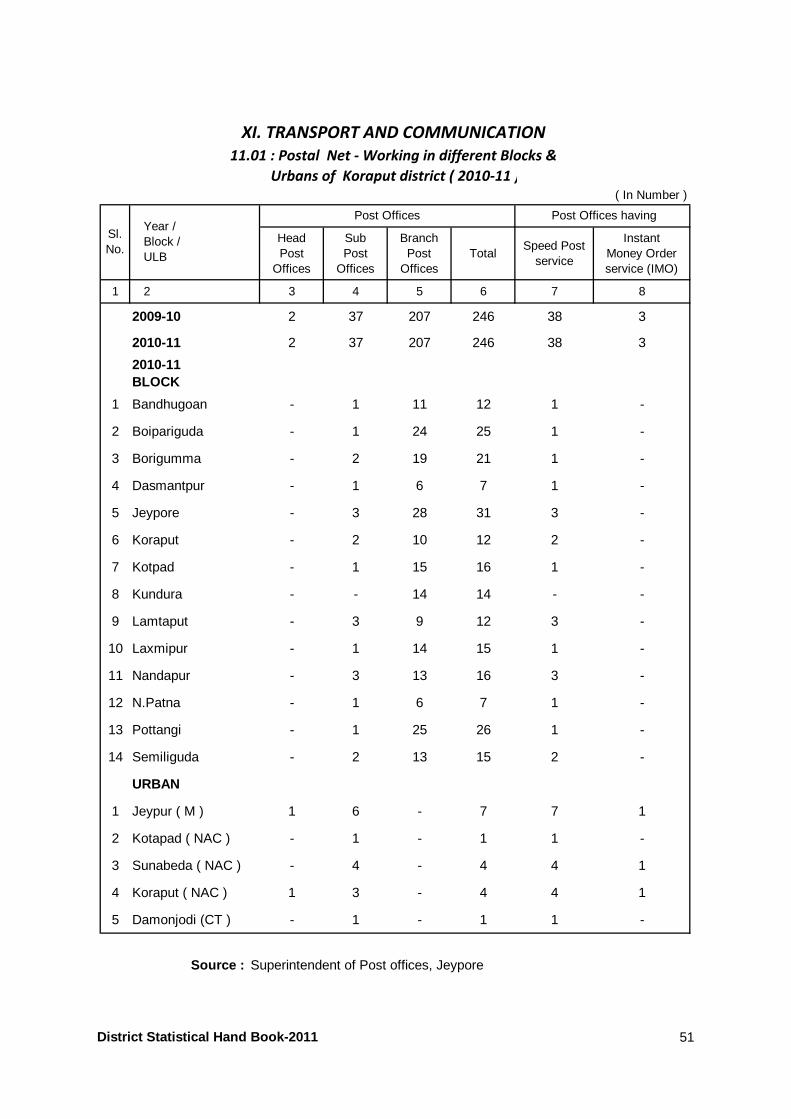
HeadPost
Offices
SubPost
Offices
BranchPost
OfficesTotal
Speed Post service
InstantMoney Orderservice (IMO)
1 2 3 4 5 6 7 8
2009-10 2 37 207 246 38 3
2010-11 2 37 207 246 38 3
2010-11BLOCK
1 Bandhugoan - 1 11 12 1 -
2 Boipariguda - 1 24 25 1 -
3 Borigumma - 2 19 21 1 -
4 Dasmantpur - 1 6 7 1 -
5 Jeypore - 3 28 31 3 -
6 Koraput - 2 10 12 2 -
7 Kotpad - 1 15 16 1 -
8 Kundura - - 14 14 - -
9 Lamtaput - 3 9 12 3 -
10 Laxmipur - 1 14 15 1 -
11 Nandapur - 3 13 16 3 -
12 N.Patna - 1 6 7 1 -
13 Pottangi - 1 25 26 1 -
14 Semiliguda - 2 13 15 2 -
URBAN
1 Jeypur ( M ) 1 6 - 7 7 1
2 Kotapad ( NAC ) - 1 - 1 1 -
3 Sunabeda ( NAC ) - 4 - 4 4 1
4 Koraput ( NAC ) 1 3 - 4 4 1
5 Damonjodi (CT ) - 1 - 1 1 -
XI. TRANSPORT AND COMMUNICATION
Urbans of Koraput district ( 2010-11 )
11.01 : Postal Net - Working in different Blocks &
( In Number )
Source : Superintendent of Post offices, Jeypore
Year /Block /ULB
Post Offices having
Sl.No.
Post Offices
District Statistical Hand Book-2011 51
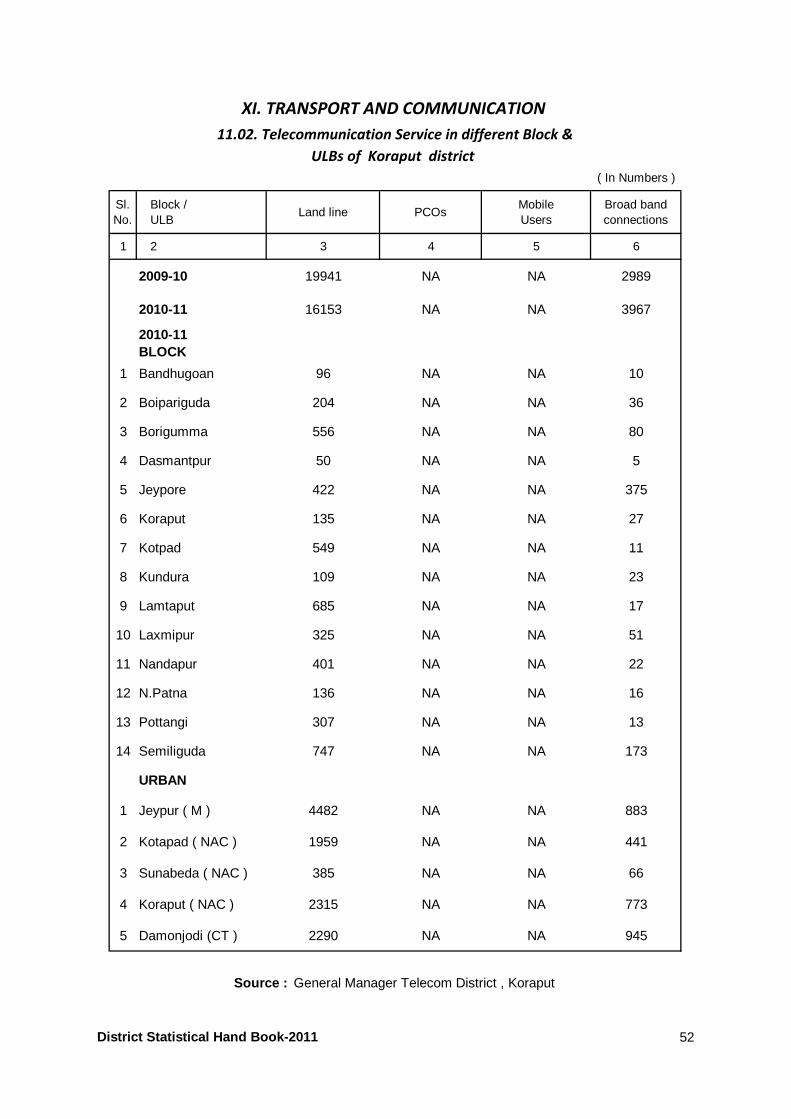
( In Numbers )
Sl.No.
Block /ULB
Land line PCOsMobileUsers
Broad bandconnections
1 2 3 4 5 6
2009-10 19941 NA NA 2989
2010-11 16153 NA NA 3967
2010-11BLOCK
1 Bandhugoan 96 NA NA 10
2 Boipariguda 204 NA NA 36
3 Borigumma 556 NA NA 80
4 Dasmantpur 50 NA NA 5
5 Jeypore 422 NA NA 375
6 Koraput 135 NA NA 27
7 Kotpad 549 NA NA 11
8 Kundura 109 NA NA 23
9 Lamtaput 685 NA NA 17
10 Laxmipur 325 NA NA 51
11 Nandapur 401 NA NA 22
12 N.Patna 136 NA NA 16
13 Pottangi 307 NA NA 13
14 Semiliguda 747 NA NA 173
URBAN
1 Jeypur ( M ) 4482 NA NA 883
2 Kotapad ( NAC ) 1959 NA NA 441
3 Sunabeda ( NAC ) 385 NA NA 66
4 Koraput ( NAC ) 2315 NA NA 773
5 Damonjodi (CT ) 2290 NA NA 945
XI. TRANSPORT AND COMMUNICATION
11.02. Telecommunication Service in different Block &
ULBs of Koraput district
Source : General Manager Telecom District , Koraput
District Statistical Hand Book-2011 52
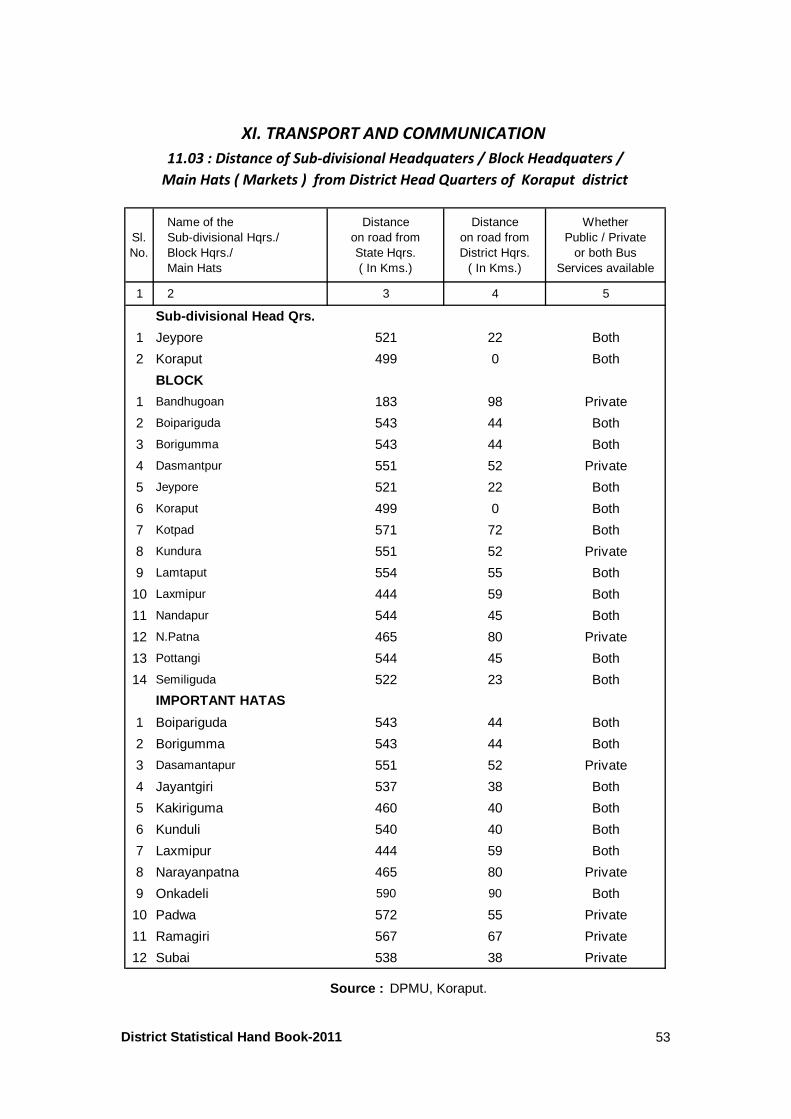
Sl.No.
Name of the Sub-divisional Hqrs./Block Hqrs./Main Hats
Distanceon road from State Hqrs.( In Kms.)
Distanceon road from District Hqrs.
( In Kms.)
Whether Public / Private
or both BusServices available
1 2 3 4 5
Sub-divisional Head Qrs.
1 Jeypore 521 22 Both
2 Koraput 499 0 Both
BLOCK
1 Bandhugoan 183 98 Private
2 Boipariguda 543 44 Both
3 Borigumma 543 44 Both
4 Dasmantpur 551 52 Private
5 Jeypore 521 22 Both
6 Koraput 499 0 Both
7 Kotpad 571 72 Both
8 Kundura 551 52 Private
9 Lamtaput 554 55 Both
10 Laxmipur 444 59 Both
11 Nandapur 544 45 Both
12 N.Patna 465 80 Private
13 Pottangi 544 45 Both
14 Semiliguda 522 23 Both
1 Boipariguda 543 44 Both
2 Borigumma 543 44 Both
3 Dasamantapur 551 52 Private
4 Jayantgiri 537 38 Both
5 Kakiriguma 460 40 Both
6 Kunduli 540 40 Both
7 Laxmipur 444 59 Both
8 Narayanpatna 465 80 Private
9 Onkadeli 590 90 Both
10 Padwa 572 55 Private
11 Ramagiri 567 67 Private
12 Subai 538 38 Private
Source : DPMU, Koraput.
XI. TRANSPORT AND COMMUNICATION
11.03 : Distance of Sub-divisional Headquaters / Block Headquaters /
Main Hats ( Markets ) from District Head Quarters of Koraput district
IMPORTANT HATAS
District Statistical Hand Book-2011 53
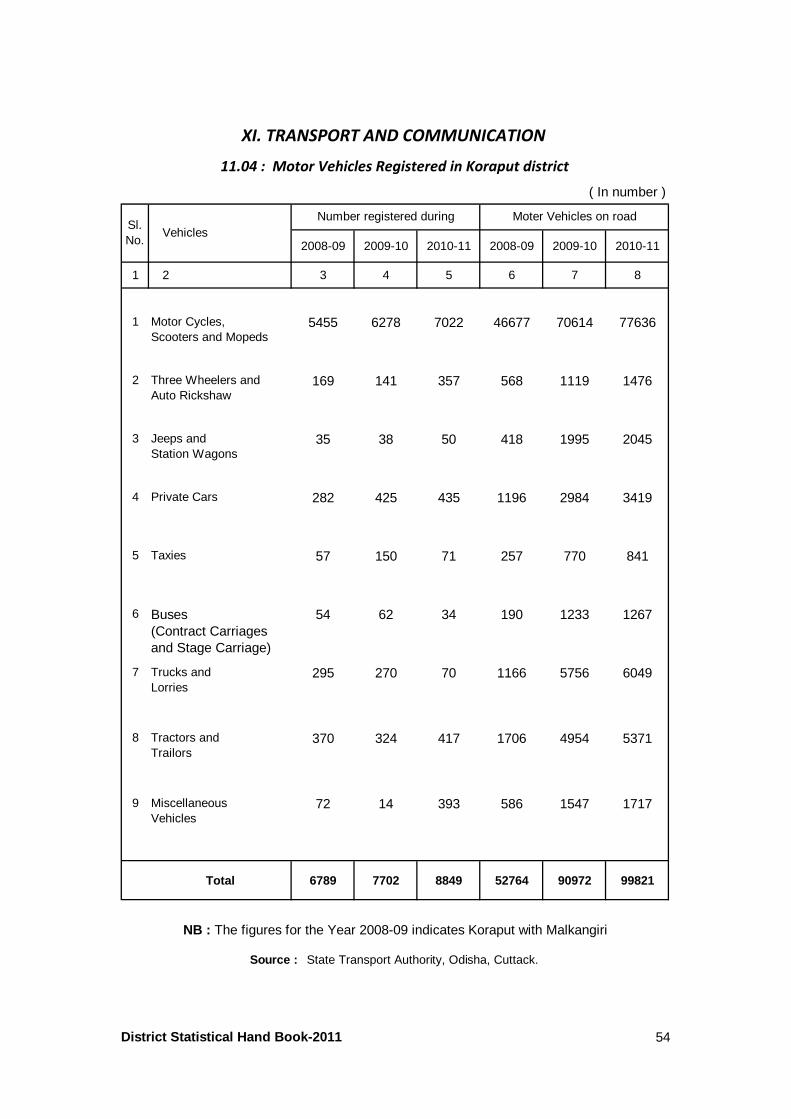
2008-09 2009-10 2010-11 2008-09 2009-10 2010-11
1 2 3 4 5 6 7 8
1 Motor Cycles, Scooters and Mopeds
5455 6278 7022 46677 70614 77636
2 Three Wheelers andAuto Rickshaw
169 141 357 568 1119 1476
3 Jeeps and Station Wagons
35 38 50 418 1995 2045
4 Private Cars 282 425 435 1196 2984 3419
5 Taxies 57 150 71 257 770 841
6 Buses(Contract Carriages and Stage Carriage)
54 62 34 190 1233 1267
7 Trucks and Lorries
295 270 70 1166 5756 6049
8 Tractors and Trailors
370 324 417 1706 4954 5371
9 MiscellaneousVehicles
72 14 393 586 1547 1717
Total 6789 7702 8849 52764 90972 99821
Source : State Transport Authority, Odisha, Cuttack.
XI. TRANSPORT AND COMMUNICATION
11.04 : Motor Vehicles Registered in Koraput district
( In number )
Moter Vehicles on road
NB : The figures for the Year 2008-09 indicates Koraput with Malkangiri
Number registered duringVehicles
Sl.No.
District Statistical Hand Book-2011 54
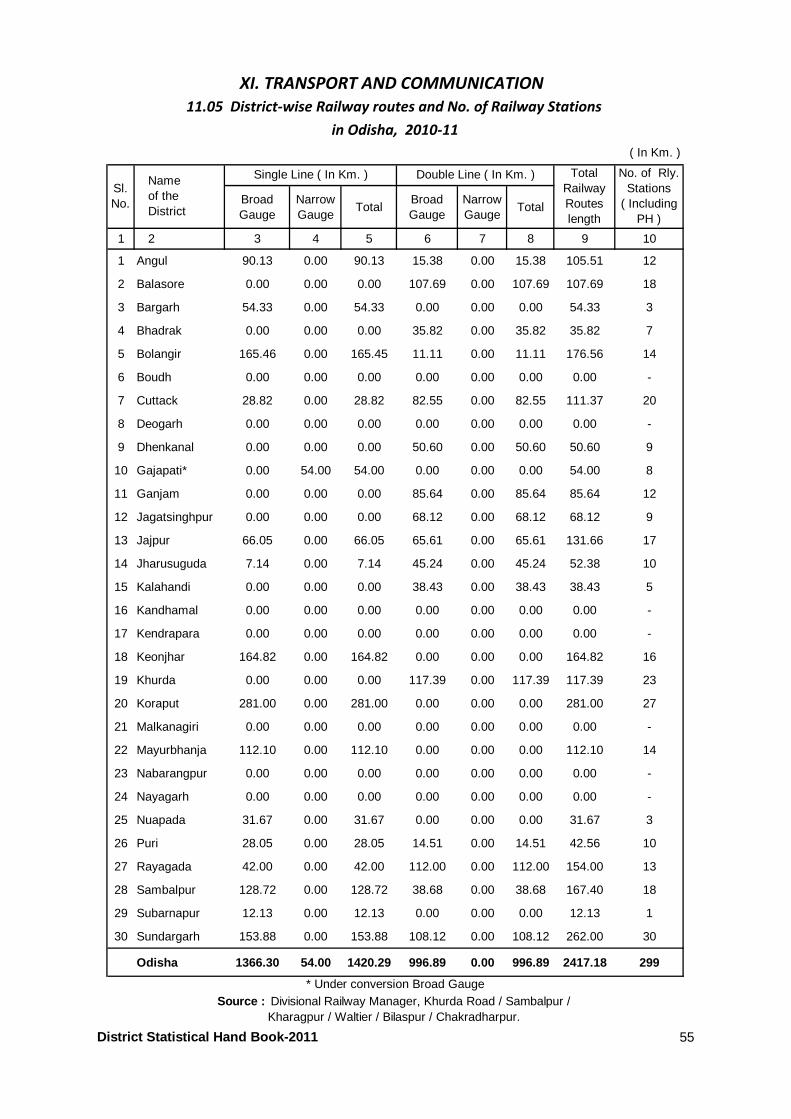
BroadGauge
NarrowGauge
TotalBroadGauge
NarrowGauge
Total
1 2 3 4 5 6 7 8 9 10
1 Angul 90.13 0.00 90.13 15.38 0.00 15.38 105.51 12
2 Balasore 0.00 0.00 0.00 107.69 0.00 107.69 107.69 18
3 Bargarh 54.33 0.00 54.33 0.00 0.00 0.00 54.33 3
4 Bhadrak 0.00 0.00 0.00 35.82 0.00 35.82 35.82 7
5 Bolangir 165.46 0.00 165.45 11.11 0.00 11.11 176.56 14
6 Boudh 0.00 0.00 0.00 0.00 0.00 0.00 0.00 -
7 Cuttack 28.82 0.00 28.82 82.55 0.00 82.55 111.37 20
8 Deogarh 0.00 0.00 0.00 0.00 0.00 0.00 0.00 -
9 Dhenkanal 0.00 0.00 0.00 50.60 0.00 50.60 50.60 9
10 Gajapati* 0.00 54.00 54.00 0.00 0.00 0.00 54.00 8
11 Ganjam 0.00 0.00 0.00 85.64 0.00 85.64 85.64 12
12 Jagatsinghpur 0.00 0.00 0.00 68.12 0.00 68.12 68.12 9
13 Jajpur 66.05 0.00 66.05 65.61 0.00 65.61 131.66 17
14 Jharusuguda 7.14 0.00 7.14 45.24 0.00 45.24 52.38 10
15 Kalahandi 0.00 0.00 0.00 38.43 0.00 38.43 38.43 5
16 Kandhamal 0.00 0.00 0.00 0.00 0.00 0.00 0.00 -
17 Kendrapara 0.00 0.00 0.00 0.00 0.00 0.00 0.00 -
18 Keonjhar 164.82 0.00 164.82 0.00 0.00 0.00 164.82 16
19 Khurda 0.00 0.00 0.00 117.39 0.00 117.39 117.39 23
20 Koraput 281.00 0.00 281.00 0.00 0.00 0.00 281.00 27
21 Malkanagiri 0.00 0.00 0.00 0.00 0.00 0.00 0.00 -
22 Mayurbhanja 112.10 0.00 112.10 0.00 0.00 0.00 112.10 14
23 Nabarangpur 0.00 0.00 0.00 0.00 0.00 0.00 0.00 -
24 Nayagarh 0.00 0.00 0.00 0.00 0.00 0.00 0.00 -
25 Nuapada 31.67 0.00 31.67 0.00 0.00 0.00 31.67 3
26 Puri 28.05 0.00 28.05 14.51 0.00 14.51 42.56 10
27 Rayagada 42.00 0.00 42.00 112.00 0.00 112.00 154.00 13
28 Sambalpur 128.72 0.00 128.72 38.68 0.00 38.68 167.40 18
29 Subarnapur 12.13 0.00 12.13 0.00 0.00 0.00 12.13 1
30 Sundargarh 153.88 0.00 153.88 108.12 0.00 108.12 262.00 30
Odisha 1366.30 54.00 1420.29 996.89 0.00 996.89 2417.18 299
Double Line ( In Km. ) Total RailwayRouteslength
No. of Rly.Stations
( IncludingPH )
* Under conversion Broad GaugeSource : Divisional Railway Manager, Khurda Road / Sambalpur /
Kharagpur / Waltier / Bilaspur / Chakradharpur.
XI. TRANSPORT AND COMMUNICATION
11.05 District-wise Railway routes and No. of Railway Stations
in Odisha, 2010-11
( In Km. )
Sl.No.
Nameof theDistrict
Single Line ( In Km. )
District Statistical Hand Book-2011 55
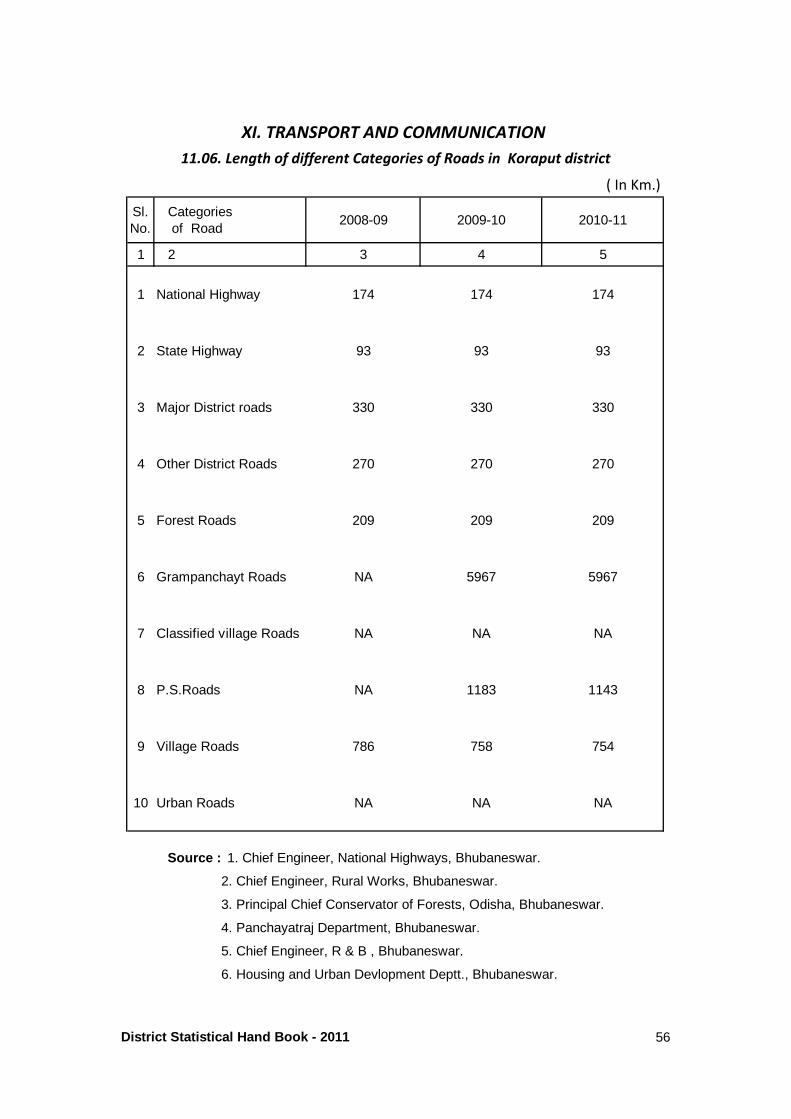
( In Km.)
Sl.No.
Categories of Road
2008-09 2009-10 2010-11
1 2 3 4 5
1 National Highway 174 174 174
2 State Highway 93 93 93
3 Major District roads 330 330 330
4 Other District Roads 270 270 270
5 Forest Roads 209 209 209
6 Grampanchayt Roads NA 5967 5967
7 Classified village Roads NA NA NA
8 P.S.Roads NA 1183 1143
9 Village Roads 786 758 754
10 Urban Roads NA NA NA
4. Panchayatraj Department, Bhubaneswar.
5. Chief Engineer, R & B , Bhubaneswar.
6. Housing and Urban Devlopment Deptt., Bhubaneswar.
XI. TRANSPORT AND COMMUNICATION
11.06. Length of different Categories of Roads in Koraput district
Source : 1. Chief Engineer, National Highways, Bhubaneswar.
2. Chief Engineer, Rural Works, Bhubaneswar.
3. Principal Chief Conservator of Forests, Odisha, Bhubaneswar.
District Statistical Hand Book - 2011 56
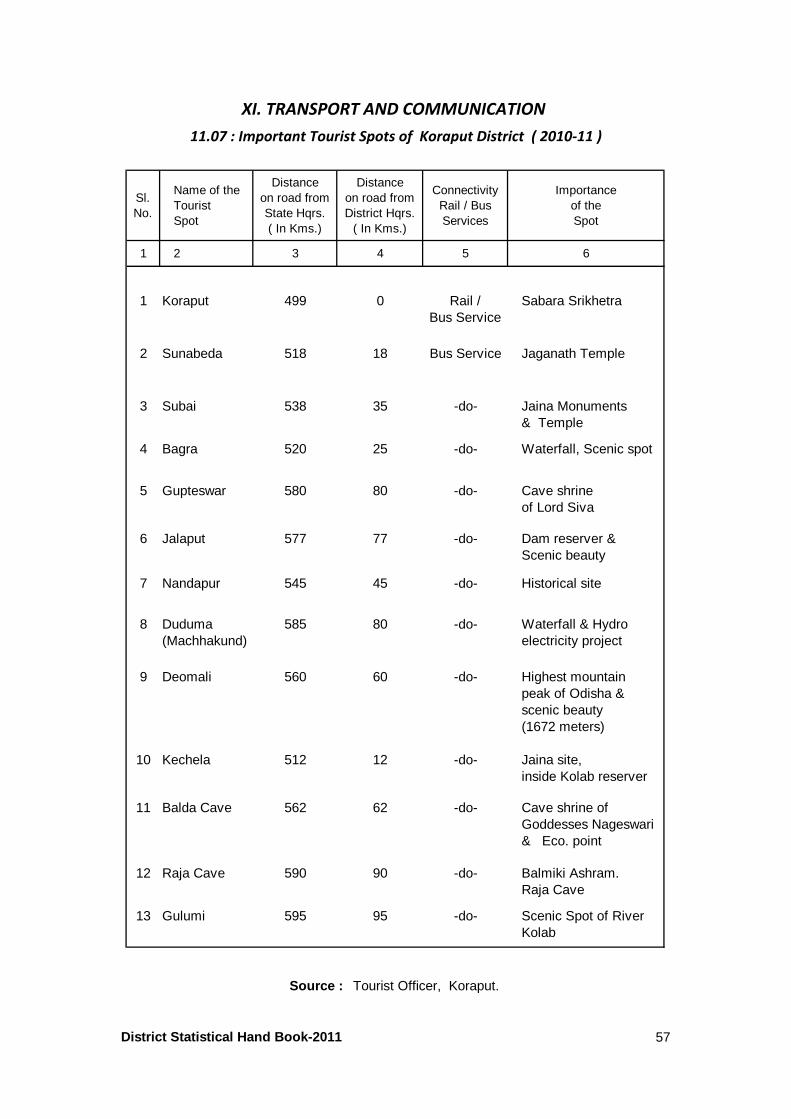
Sl.No.
Name of theTouristSpot
Distanceon road fromState Hqrs.( In Kms.)
Distanceon road fromDistrict Hqrs.
( In Kms.)
ConnectivityRail / BusServices
Importanceof theSpot
1 2 3 4 5 6
1 Koraput 499 0 Rail /Bus Service
Sabara Srikhetra
2 Sunabeda 518 18 Bus Service Jaganath Temple
3 Subai 538 35 -do- Jaina Monuments& Temple
4 Bagra 520 25 -do- Waterfall, Scenic spot
5 Gupteswar 580 80 -do- Cave shrine of Lord Siva
6 Jalaput 577 77 -do- Dam reserver & Scenic beauty
7 Nandapur 545 45 -do- Historical site
8 Duduma (Machhakund)
585 80 -do- Waterfall & Hydroelectricity project
9 Deomali 560 60 -do- Highest mountainpeak of Odisha & scenic beauty(1672 meters)
10 Kechela 512 12 -do- Jaina site, inside Kolab reserver
11 Balda Cave 562 62 -do- Cave shrine of Goddesses Nageswari& Eco. point
12 Raja Cave 590 90 -do- Balmiki Ashram. Raja Cave
13 Gulumi 595 95 -do- Scenic Spot of River Kolab
XI. TRANSPORT AND COMMUNICATION
11.07 : Important Tourist Spots of Koraput District ( 2010-11 )
Source : Tourist Officer, Koraput.
District Statistical Hand Book-2011 57
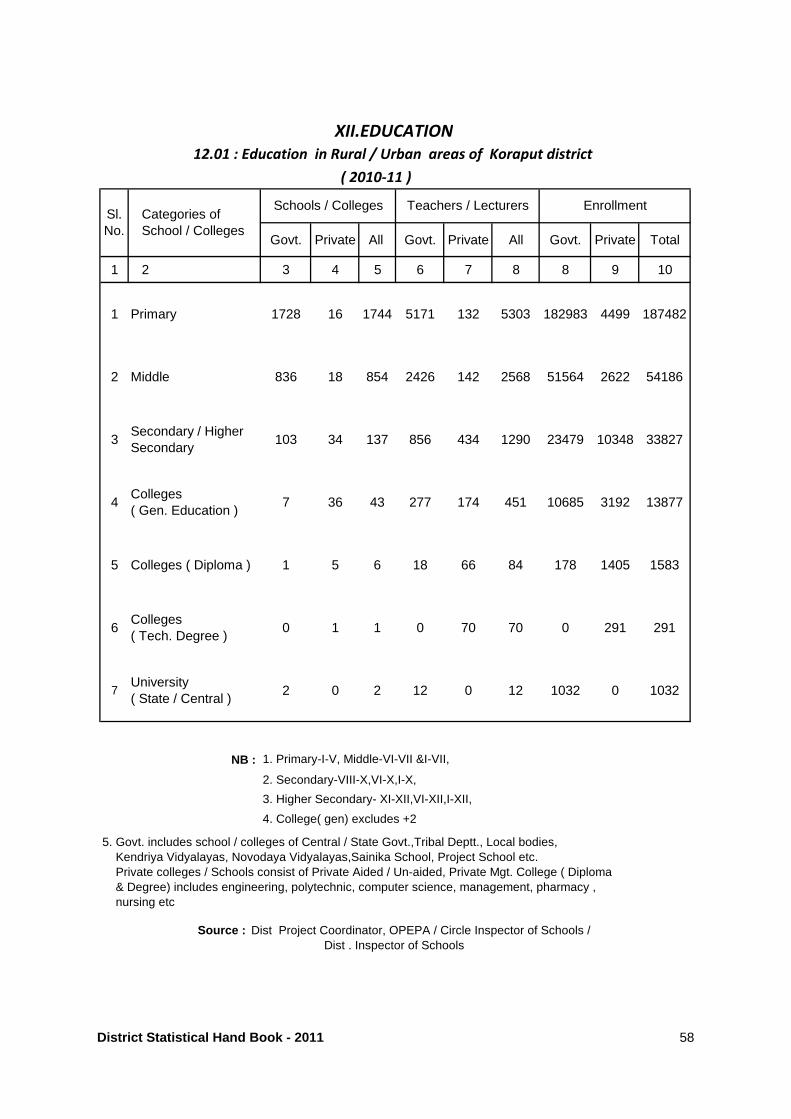
Govt. Private All Govt. Private All Govt. Private Total
1 2 3 4 5 6 7 8 8 9 10
1 Primary 1728 16 1744 5171 132 5303 182983 4499 187482
2 Middle 836 18 854 2426 142 2568 51564 2622 54186
3Secondary / Higher Secondary
103 34 137 856 434 1290 23479 10348 33827
4Colleges ( Gen. Education )
7 36 43 277 174 451 10685 3192 13877
5 Colleges ( Diploma ) 1 5 6 18 66 84 178 1405 1583
6Colleges( Tech. Degree )
0 1 1 0 70 70 0 291 291
7University( State / Central )
2 0 2 12 0 12 1032 0 1032
NB : 1. Primary-I-V, Middle-VI-VII &I-VII,
2. Secondary-VIII-X,VI-X,I-X,
3. Higher Secondary- XI-XII,VI-XII,I-XII,
4. College( gen) excludes +2
Source : Dist Project Coordinator, OPEPA / Circle Inspector of Schools /Dist . Inspector of Schools
XII.EDUCATION
12.01 : Education in Rural / Urban areas of Koraput district
5. Govt. includes school / colleges of Central / State Govt.,Tribal Deptt., Local bodies, Kendriya Vidyalayas, Novodaya Vidyalayas,Sainika School, Project School etc. Private colleges / Schools consist of Private Aided / Un-aided, Private Mgt. College ( Diploma & Degree) includes engineering, polytechnic, computer science, management, pharmacy , nursing etc
Teachers / Lecturers EnrollmentSchools / CollegesCategories ofSchool / Colleges
Sl.No.
( 2010-11 )
District Statistical Hand Book - 2011 58
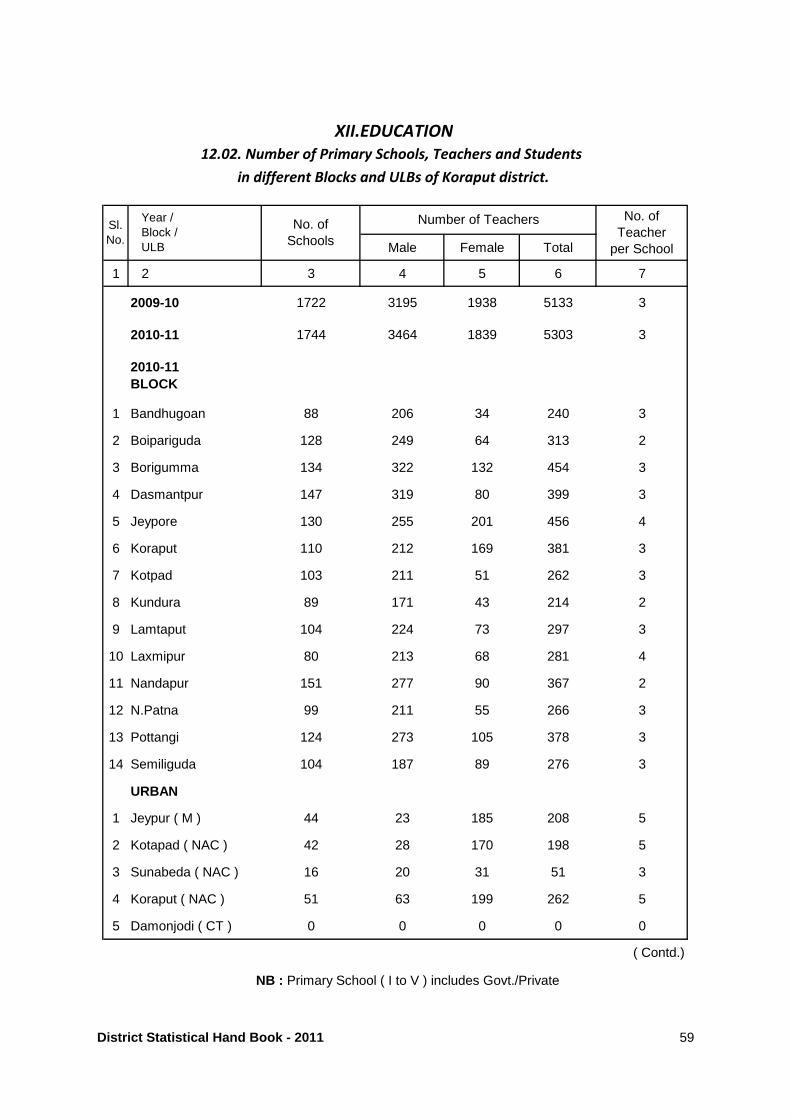
Male Female Total
1 2 3 4 5 6 7
2009-10 1722 3195 1938 5133 3
2010-11 1744 3464 1839 5303 3
2010-11BLOCK
1 Bandhugoan 88 206 34 240 3
2 Boipariguda 128 249 64 313 2
3 Borigumma 134 322 132 454 3
4 Dasmantpur 147 319 80 399 3
5 Jeypore 130 255 201 456 4
6 Koraput 110 212 169 381 3
7 Kotpad 103 211 51 262 3
8 Kundura 89 171 43 214 2
9 Lamtaput 104 224 73 297 3
10 Laxmipur 80 213 68 281 4
11 Nandapur 151 277 90 367 2
12 N.Patna 99 211 55 266 3
13 Pottangi 124 273 105 378 3
14 Semiliguda 104 187 89 276 3
URBAN
1 Jeypur ( M ) 44 23 185 208 5
2 Kotapad ( NAC ) 42 28 170 198 5
3 Sunabeda ( NAC ) 16 20 31 51 3
4 Koraput ( NAC ) 51 63 199 262 5
5 Damonjodi ( CT ) 0 0 0 0 0
( Contd.)
NB : Primary School ( I to V ) includes Govt./Private
XII.EDUCATION
Sl.No.
Year /Block /ULB
Number of Teachers
12.02. Number of Primary Schools, Teachers and Students
in different Blocks and ULBs of Koraput district.
No. ofTeacher
per School
No. of Schools
District Statistical Hand Book - 2011 59
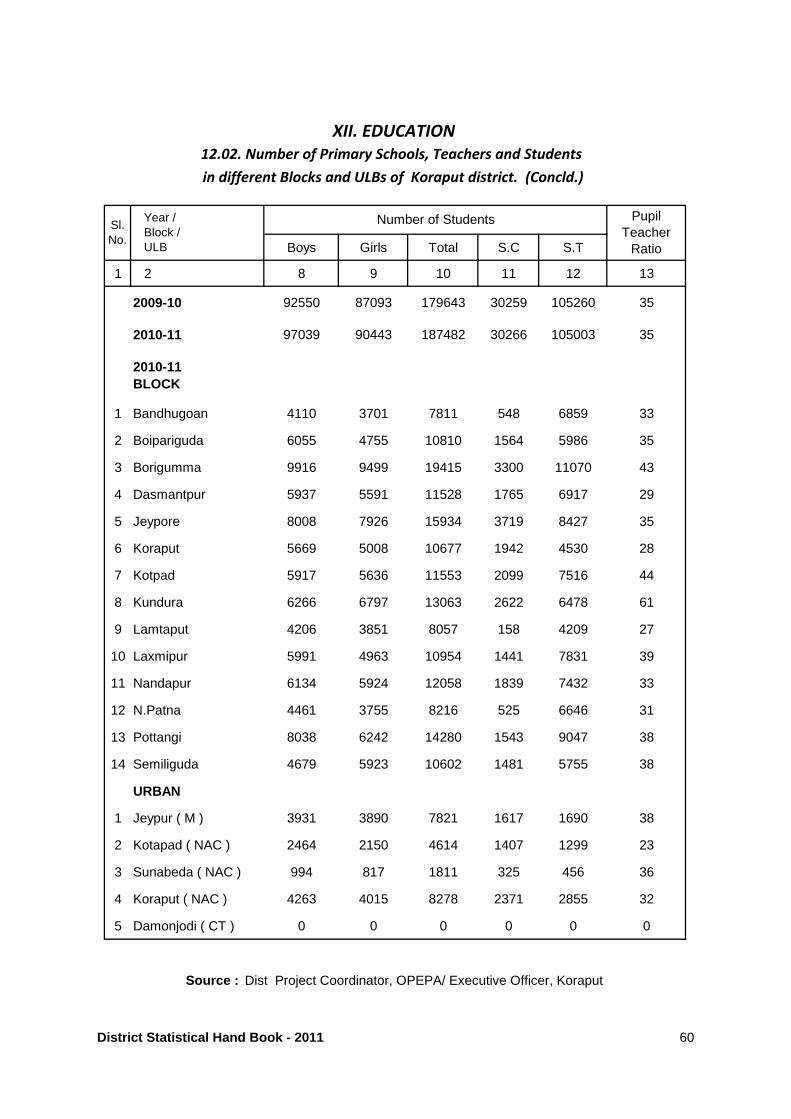
Boys Girls Total S.C S.T
1 2 8 9 10 11 12 13
2009-10 92550 87093 179643 30259 105260 35
2010-11 97039 90443 187482 30266 105003 35
2010-11BLOCK
1 Bandhugoan 4110 3701 7811 548 6859 33
2 Boipariguda 6055 4755 10810 1564 5986 35
3 Borigumma 9916 9499 19415 3300 11070 43
4 Dasmantpur 5937 5591 11528 1765 6917 29
5 Jeypore 8008 7926 15934 3719 8427 35
6 Koraput 5669 5008 10677 1942 4530 28
7 Kotpad 5917 5636 11553 2099 7516 44
8 Kundura 6266 6797 13063 2622 6478 61
9 Lamtaput 4206 3851 8057 158 4209 27
10 Laxmipur 5991 4963 10954 1441 7831 39
11 Nandapur 6134 5924 12058 1839 7432 33
12 N.Patna 4461 3755 8216 525 6646 31
13 Pottangi 8038 6242 14280 1543 9047 38
14 Semiliguda 4679 5923 10602 1481 5755 38
URBAN
1 Jeypur ( M ) 3931 3890 7821 1617 1690 38
2 Kotapad ( NAC ) 2464 2150 4614 1407 1299 23
3 Sunabeda ( NAC ) 994 817 1811 325 456 36
4 Koraput ( NAC ) 4263 4015 8278 2371 2855 32
5 Damonjodi ( CT ) 0 0 0 0 0 0
XII. EDUCATION
Sl.No.
Year /Block /ULB
in different Blocks and ULBs of Koraput district. (Concld.)
PupilTeacher
Ratio
Number of Students
Source : Dist Project Coordinator, OPEPA/ Executive Officer, Koraput
12.02. Number of Primary Schools, Teachers and Students
District Statistical Hand Book - 2011 60
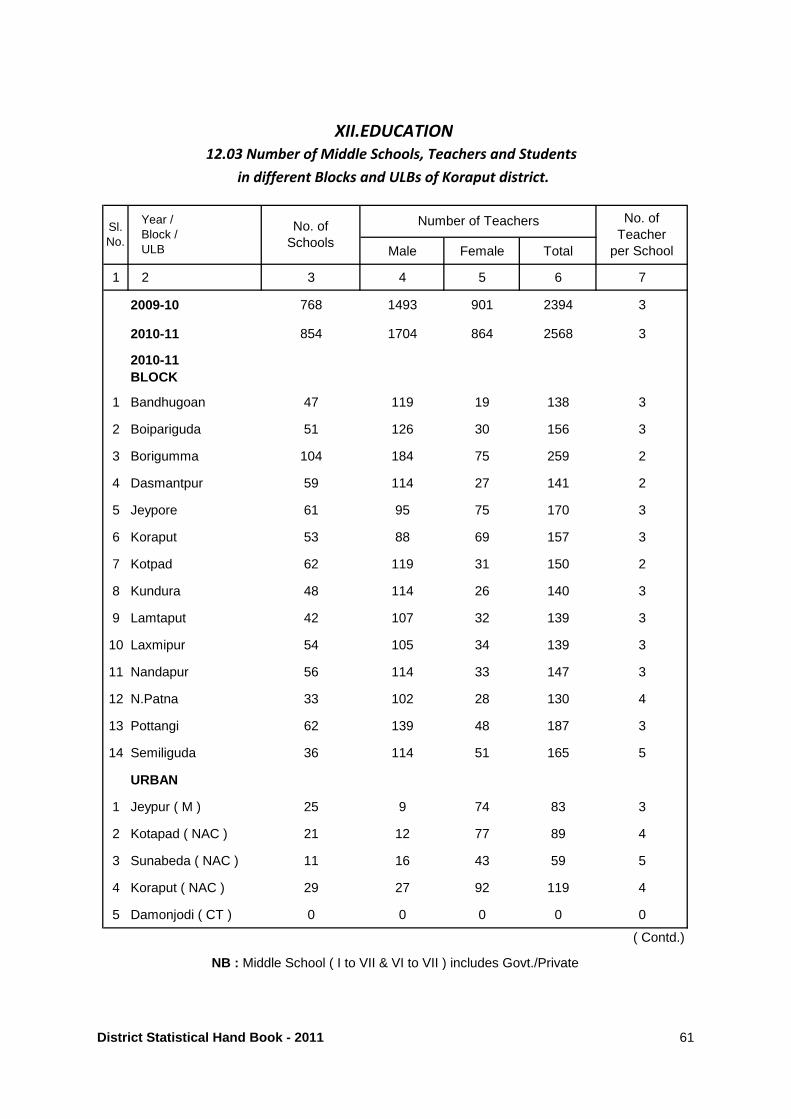
Male Female Total
1 2 3 4 5 6 7
2009-10 768 1493 901 2394 3
2010-11 854 1704 864 2568 3
2010-11BLOCK
1 Bandhugoan 47 119 19 138 3
2 Boipariguda 51 126 30 156 3
3 Borigumma 104 184 75 259 2
4 Dasmantpur 59 114 27 141 2
5 Jeypore 61 95 75 170 3
6 Koraput 53 88 69 157 3
7 Kotpad 62 119 31 150 2
8 Kundura 48 114 26 140 3
9 Lamtaput 42 107 32 139 3
10 Laxmipur 54 105 34 139 3
11 Nandapur 56 114 33 147 3
12 N.Patna 33 102 28 130 4
13 Pottangi 62 139 48 187 3
14 Semiliguda 36 114 51 165 5
URBAN
1 Jeypur ( M ) 25 9 74 83 3
2 Kotapad ( NAC ) 21 12 77 89 4
3 Sunabeda ( NAC ) 11 16 43 59 5
4 Koraput ( NAC ) 29 27 92 119 4
5 Damonjodi ( CT ) 0 0 0 0 0
( Contd.)
Year /Block /ULB
NB : Middle School ( I to VII & VI to VII ) includes Govt./Private
No. of Schools
XII.EDUCATION
Sl.No.
Number of Teachers No. ofTeacher
per School
12.03 Number of Middle Schools, Teachers and Students
in different Blocks and ULBs of Koraput district.
District Statistical Hand Book - 2011 61
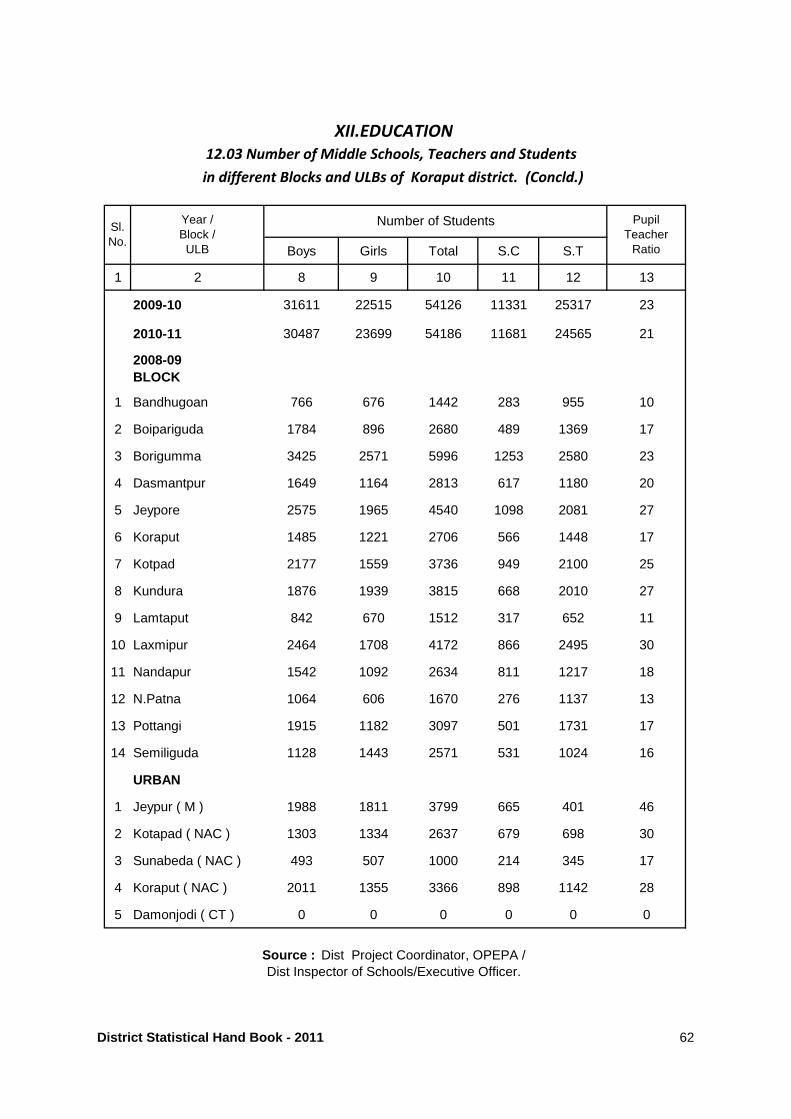
Boys Girls Total S.C S.T
1 2 8 9 10 11 12 13
2009-10 31611 22515 54126 11331 25317 23
2010-11 30487 23699 54186 11681 24565 21
2008-09BLOCK
1 Bandhugoan 766 676 1442 283 955 10
2 Boipariguda 1784 896 2680 489 1369 17
3 Borigumma 3425 2571 5996 1253 2580 23
4 Dasmantpur 1649 1164 2813 617 1180 20
5 Jeypore 2575 1965 4540 1098 2081 27
6 Koraput 1485 1221 2706 566 1448 17
7 Kotpad 2177 1559 3736 949 2100 25
8 Kundura 1876 1939 3815 668 2010 27
9 Lamtaput 842 670 1512 317 652 11
10 Laxmipur 2464 1708 4172 866 2495 30
11 Nandapur 1542 1092 2634 811 1217 18
12 N.Patna 1064 606 1670 276 1137 13
13 Pottangi 1915 1182 3097 501 1731 17
14 Semiliguda 1128 1443 2571 531 1024 16
URBAN
1 Jeypur ( M ) 1988 1811 3799 665 401 46
2 Kotapad ( NAC ) 1303 1334 2637 679 698 30
3 Sunabeda ( NAC ) 493 507 1000 214 345 17
4 Koraput ( NAC ) 2011 1355 3366 898 1142 28
5 Damonjodi ( CT ) 0 0 0 0 0 0
Source : Dist Project Coordinator, OPEPA /Dist Inspector of Schools/Executive Officer.
Year /Block /ULB
Number of Students PupilTeacher
Ratio
XII.EDUCATION
Sl.No.
12.03 Number of Middle Schools, Teachers and Students
in different Blocks and ULBs of Koraput district. (Concld.)
District Statistical Hand Book - 2011 62
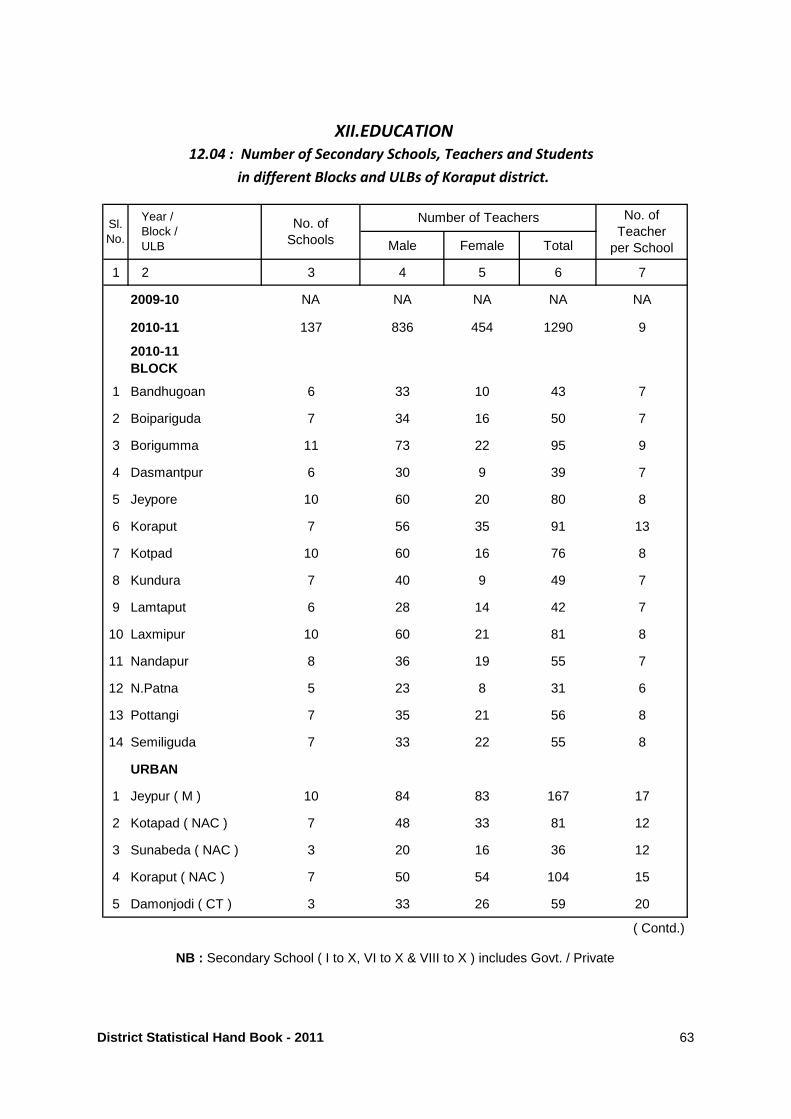
Male Female Total
1 2 3 4 5 6 7
2009-10 NA NA NA NA NA
2010-11 137 836 454 1290 9
2010-11BLOCK
1 Bandhugoan 6 33 10 43 7
2 Boipariguda 7 34 16 50 7
3 Borigumma 11 73 22 95 9
4 Dasmantpur 6 30 9 39 7
5 Jeypore 10 60 20 80 8
6 Koraput 7 56 35 91 13
7 Kotpad 10 60 16 76 8
8 Kundura 7 40 9 49 7
9 Lamtaput 6 28 14 42 7
10 Laxmipur 10 60 21 81 8
11 Nandapur 8 36 19 55 7
12 N.Patna 5 23 8 31 6
13 Pottangi 7 35 21 56 8
14 Semiliguda 7 33 22 55 8
URBAN
1 Jeypur ( M ) 10 84 83 167 17
2 Kotapad ( NAC ) 7 48 33 81 12
3 Sunabeda ( NAC ) 3 20 16 36 12
4 Koraput ( NAC ) 7 50 54 104 15
5 Damonjodi ( CT ) 3 33 26 59 20
( Contd.)
NB : Secondary School ( I to X, VI to X & VIII to X ) includes Govt. / Private
XII.EDUCATION
12.04 : Number of Secondary Schools, Teachers and Students
in different Blocks and ULBs of Koraput district.
Sl.No.
Year /Block /ULB
Number of Teachers No. ofTeacher
per School
No. of Schools
District Statistical Hand Book - 2011 63
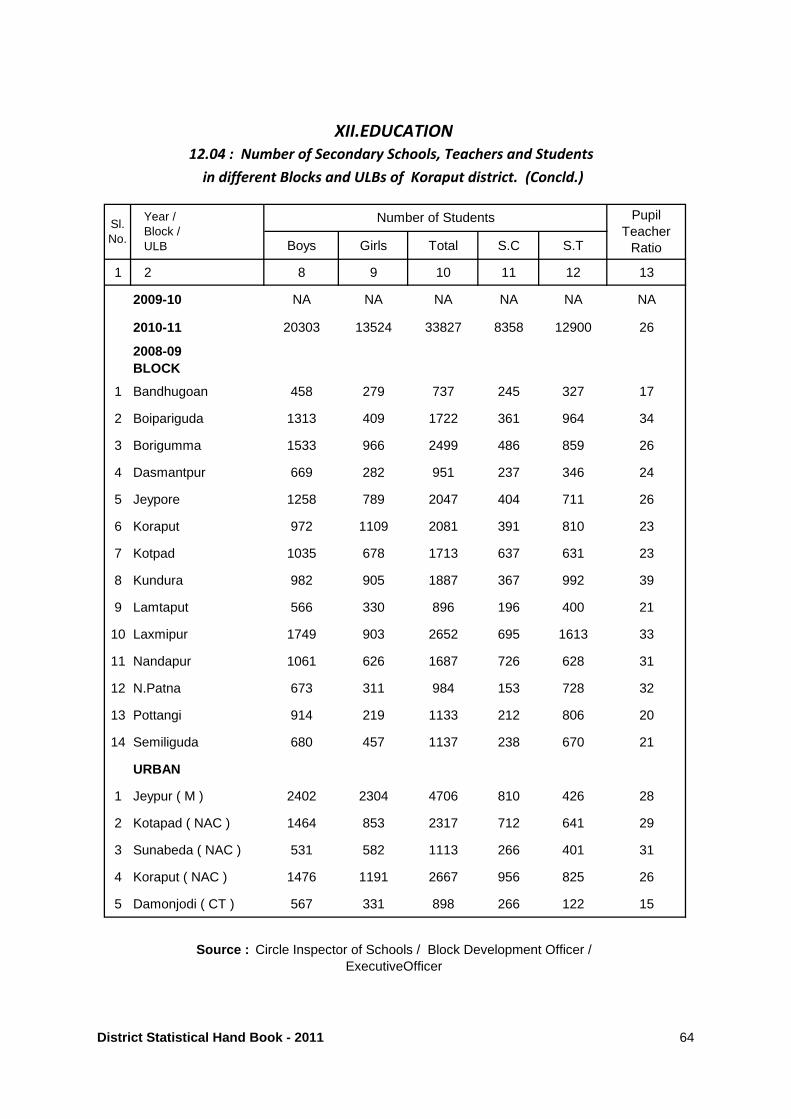
Boys Girls Total S.C S.T
1 2 8 9 10 11 12 13
2009-10 NA NA NA NA NA NA
2010-11 20303 13524 33827 8358 12900 26
2008-09BLOCK
1 Bandhugoan 458 279 737 245 327 17
2 Boipariguda 1313 409 1722 361 964 34
3 Borigumma 1533 966 2499 486 859 26
4 Dasmantpur 669 282 951 237 346 24
5 Jeypore 1258 789 2047 404 711 26
6 Koraput 972 1109 2081 391 810 23
7 Kotpad 1035 678 1713 637 631 23
8 Kundura 982 905 1887 367 992 39
9 Lamtaput 566 330 896 196 400 21
10 Laxmipur 1749 903 2652 695 1613 33
11 Nandapur 1061 626 1687 726 628 31
12 N.Patna 673 311 984 153 728 32
13 Pottangi 914 219 1133 212 806 20
14 Semiliguda 680 457 1137 238 670 21
URBAN
1 Jeypur ( M ) 2402 2304 4706 810 426 28
2 Kotapad ( NAC ) 1464 853 2317 712 641 29
3 Sunabeda ( NAC ) 531 582 1113 266 401 31
4 Koraput ( NAC ) 1476 1191 2667 956 825 26
5 Damonjodi ( CT ) 567 331 898 266 122 15
Sl.No.
Source : Circle Inspector of Schools / Block Development Officer / ExecutiveOfficer
XII.EDUCATION
12.04 : Number of Secondary Schools, Teachers and Students
in different Blocks and ULBs of Koraput district. (Concld.)
Year /Block /ULB
Number of Students PupilTeacher
Ratio
District Statistical Hand Book - 2011 64
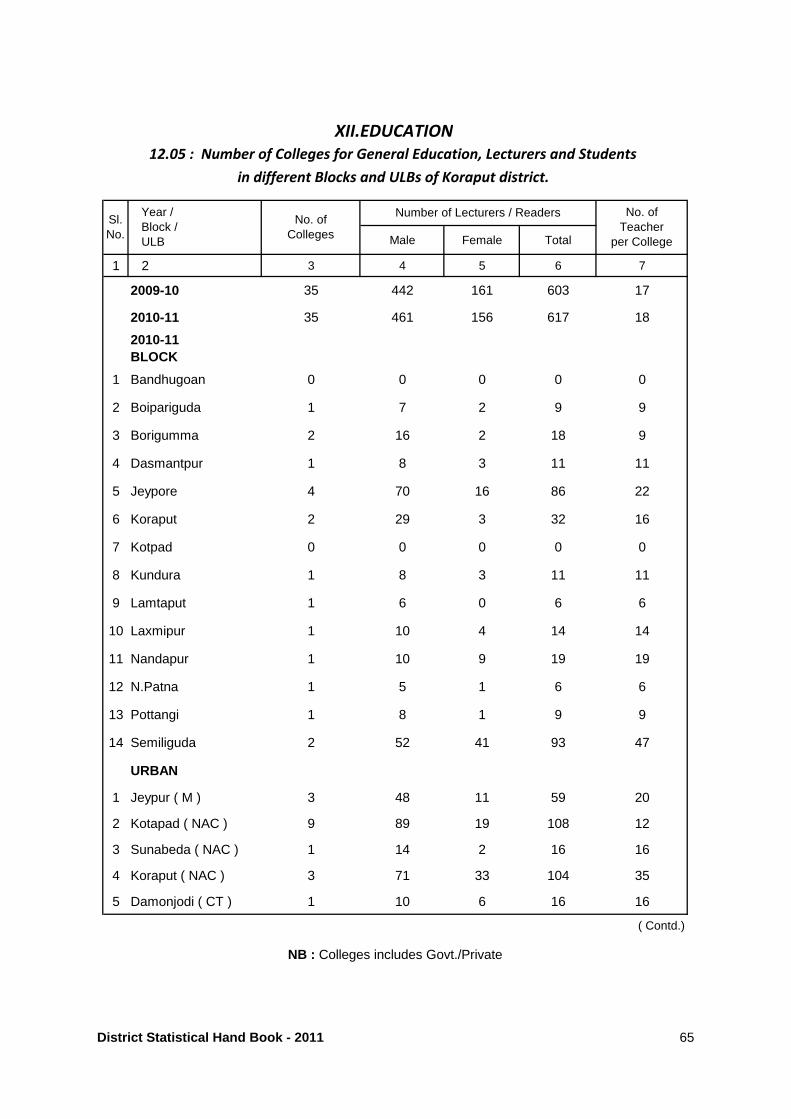
Male Female Total
1 2 3 4 5 6 7
2009-10 35 442 161 603 17
2010-11 35 461 156 617 18
2010-11BLOCK
1 Bandhugoan 0 0 0 0 0
2 Boipariguda 1 7 2 9 9
3 Borigumma 2 16 2 18 9
4 Dasmantpur 1 8 3 11 11
5 Jeypore 4 70 16 86 22
6 Koraput 2 29 3 32 16
7 Kotpad 0 0 0 0 0
8 Kundura 1 8 3 11 11
9 Lamtaput 1 6 0 6 6
10 Laxmipur 1 10 4 14 14
11 Nandapur 1 10 9 19 19
12 N.Patna 1 5 1 6 6
13 Pottangi 1 8 1 9 9
14 Semiliguda 2 52 41 93 47
URBAN
1 Jeypur ( M ) 3 48 11 59 20
2 Kotapad ( NAC ) 9 89 19 108 12
3 Sunabeda ( NAC ) 1 14 2 16 16
4 Koraput ( NAC ) 3 71 33 104 35
5 Damonjodi ( CT ) 1 10 6 16 16
( Contd.)
NB : Colleges includes Govt./Private
Sl.No.
Year /Block /ULB
No. of Colleges
Number of Lecturers / Readers No. ofTeacher
per College
XII.EDUCATION
12.05 : Number of Colleges for General Education, Lecturers and Students
in different Blocks and ULBs of Koraput district.
District Statistical Hand Book - 2011 65
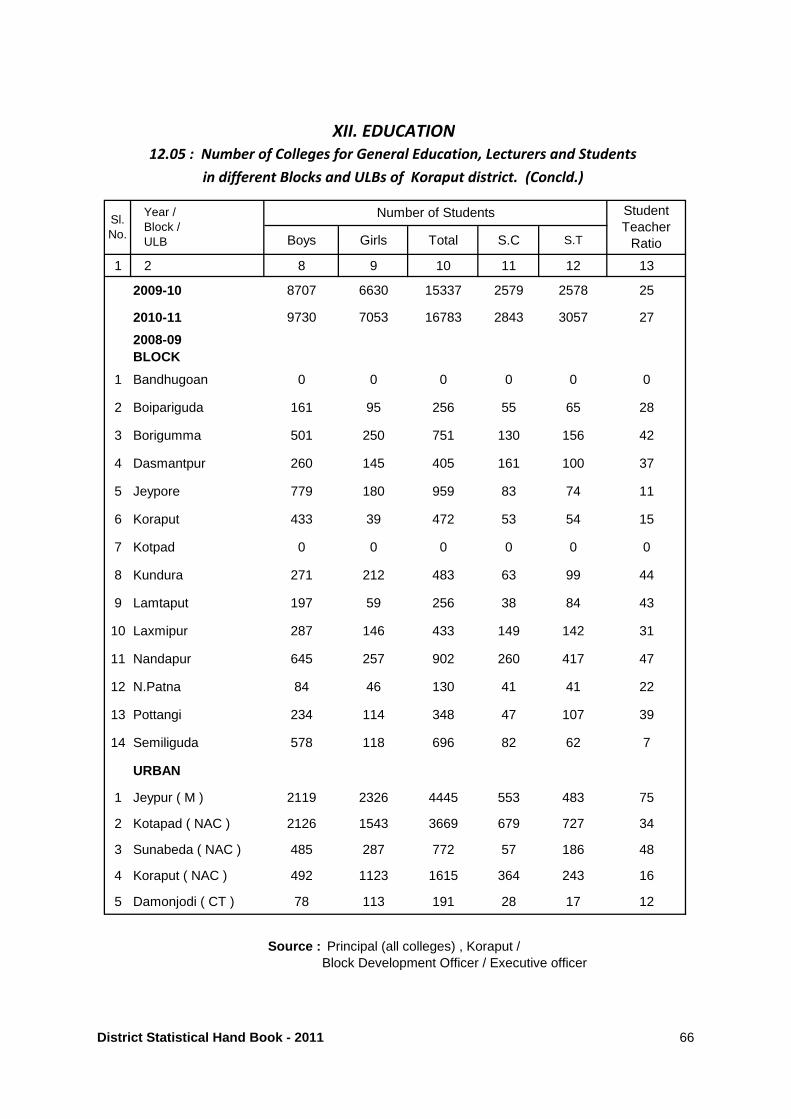
Boys Girls Total S.C S.T
1 2 8 9 10 11 12 13
2009-10 8707 6630 15337 2579 2578 25
2010-11 9730 7053 16783 2843 3057 27
2008-09BLOCK
1 Bandhugoan 0 0 0 0 0 0
2 Boipariguda 161 95 256 55 65 28
3 Borigumma 501 250 751 130 156 42
4 Dasmantpur 260 145 405 161 100 37
5 Jeypore 779 180 959 83 74 11
6 Koraput 433 39 472 53 54 15
7 Kotpad 0 0 0 0 0 0
8 Kundura 271 212 483 63 99 44
9 Lamtaput 197 59 256 38 84 43
10 Laxmipur 287 146 433 149 142 31
11 Nandapur 645 257 902 260 417 47
12 N.Patna 84 46 130 41 41 22
13 Pottangi 234 114 348 47 107 39
14 Semiliguda 578 118 696 82 62 7
URBAN
1 Jeypur ( M ) 2119 2326 4445 553 483 75
2 Kotapad ( NAC ) 2126 1543 3669 679 727 34
3 Sunabeda ( NAC ) 485 287 772 57 186 48
4 Koraput ( NAC ) 492 1123 1615 364 243 16
5 Damonjodi ( CT ) 78 113 191 28 17 12
Source : Principal (all colleges) , Koraput / Block Development Officer / Executive officer
Sl.No.
Year /Block /ULB
Number of Students
XII. EDUCATION
12.05 : Number of Colleges for General Education, Lecturers and Students
in different Blocks and ULBs of Koraput district. (Concld.)
StudentTeacher
Ratio
District Statistical Hand Book - 2011 66
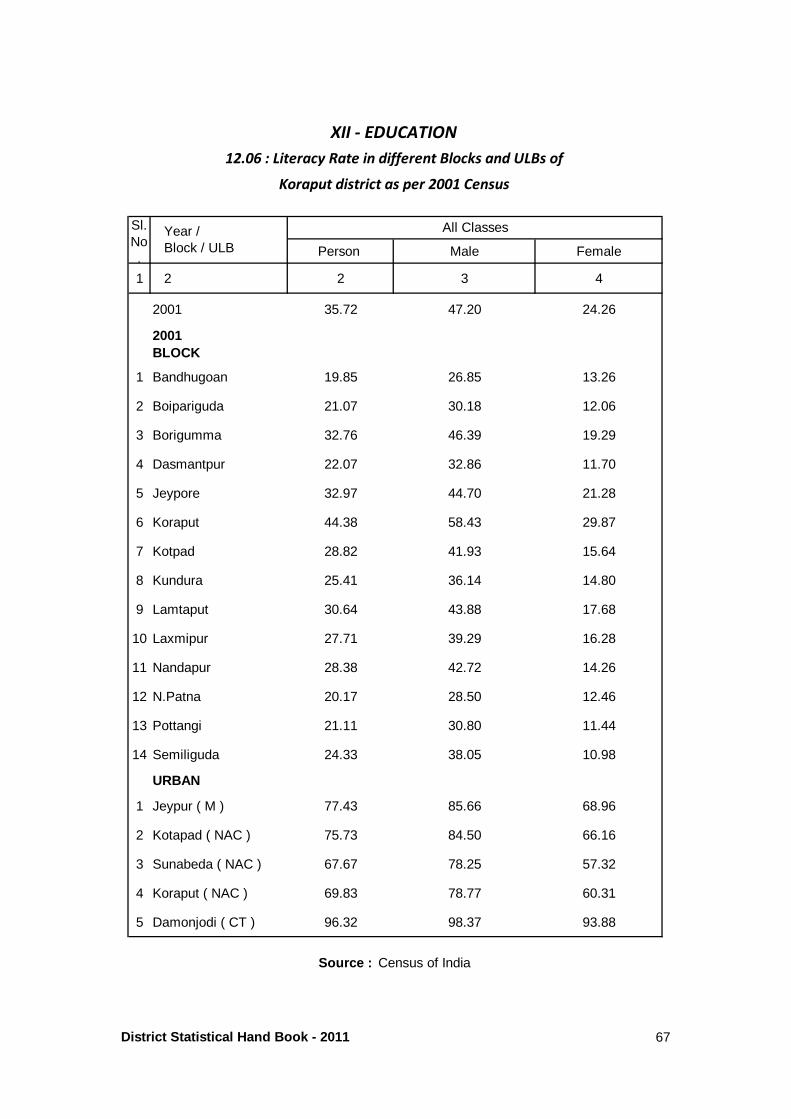
Person Male Female
1 2 2 3 4
2001 35.72 47.20 24.26
2001BLOCK
1 Bandhugoan 19.85 26.85 13.26
2 Boipariguda 21.07 30.18 12.06
3 Borigumma 32.76 46.39 19.29
4 Dasmantpur 22.07 32.86 11.70
5 Jeypore 32.97 44.70 21.28
6 Koraput 44.38 58.43 29.87
7 Kotpad 28.82 41.93 15.64
8 Kundura 25.41 36.14 14.80
9 Lamtaput 30.64 43.88 17.68
10 Laxmipur 27.71 39.29 16.28
11 Nandapur 28.38 42.72 14.26
12 N.Patna 20.17 28.50 12.46
13 Pottangi 21.11 30.80 11.44
14 Semiliguda 24.33 38.05 10.98
URBAN
1 Jeypur ( M ) 77.43 85.66 68.96
2 Kotapad ( NAC ) 75.73 84.50 66.16
3 Sunabeda ( NAC ) 67.67 78.25 57.32
4 Koraput ( NAC ) 69.83 78.77 60.31
5 Damonjodi ( CT ) 96.32 98.37 93.88
Source : Census of India
XII - EDUCATION
12.06 : Literacy Rate in different Blocks and ULBs of
Koraput district as per 2001 Census
All ClassesSl.No.
Year /Block / ULB
District Statistical Hand Book - 2011 67
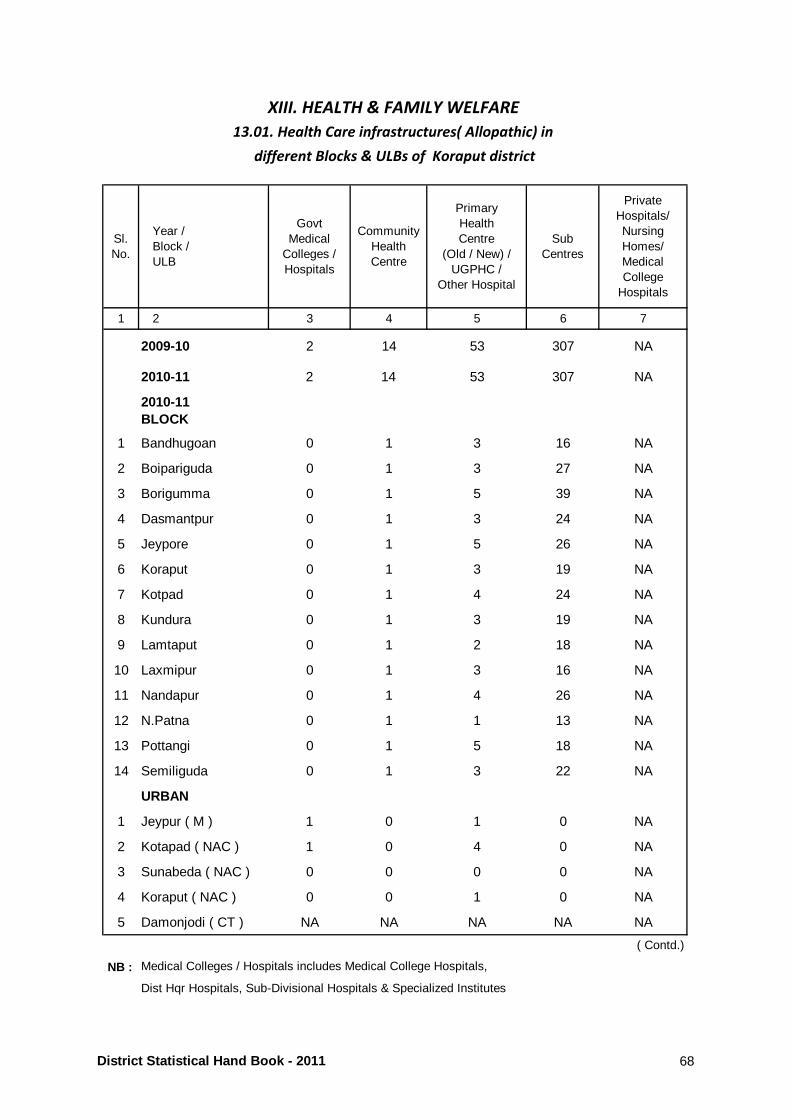
Sl.No.
Year /Block /ULB
GovtMedical
Colleges /Hospitals
CommunityHealthCentre
Primary Health Centre
(Old / New) /UGPHC /
Other Hospital
SubCentres
Private Hospitals/Nursing Homes/Medical College
Hospitals
1 2 3 4 5 6 7
2009-10 2 14 53 307 NA
2010-11 2 14 53 307 NA
2010-11BLOCK
1 Bandhugoan 0 1 3 16 NA
2 Boipariguda 0 1 3 27 NA
3 Borigumma 0 1 5 39 NA
4 Dasmantpur 0 1 3 24 NA
5 Jeypore 0 1 5 26 NA
6 Koraput 0 1 3 19 NA
7 Kotpad 0 1 4 24 NA
8 Kundura 0 1 3 19 NA
9 Lamtaput 0 1 2 18 NA
10 Laxmipur 0 1 3 16 NA
11 Nandapur 0 1 4 26 NA
12 N.Patna 0 1 1 13 NA
13 Pottangi 0 1 5 18 NA
14 Semiliguda 0 1 3 22 NA
URBAN
1 Jeypur ( M ) 1 0 1 0 NA
2 Kotapad ( NAC ) 1 0 4 0 NA
3 Sunabeda ( NAC ) 0 0 0 0 NA
4 Koraput ( NAC ) 0 0 1 0 NA
5 Damonjodi ( CT ) NA NA NA NA NA
( Contd.)
NB : Medical Colleges / Hospitals includes Medical College Hospitals,
Dist Hqr Hospitals, Sub-Divisional Hospitals & Specialized Institutes
13.01. Health Care infrastructures( Allopathic) in
XIII. HEALTH & FAMILY WELFARE
different Blocks & ULBs of Koraput district
District Statistical Hand Book - 2011 68
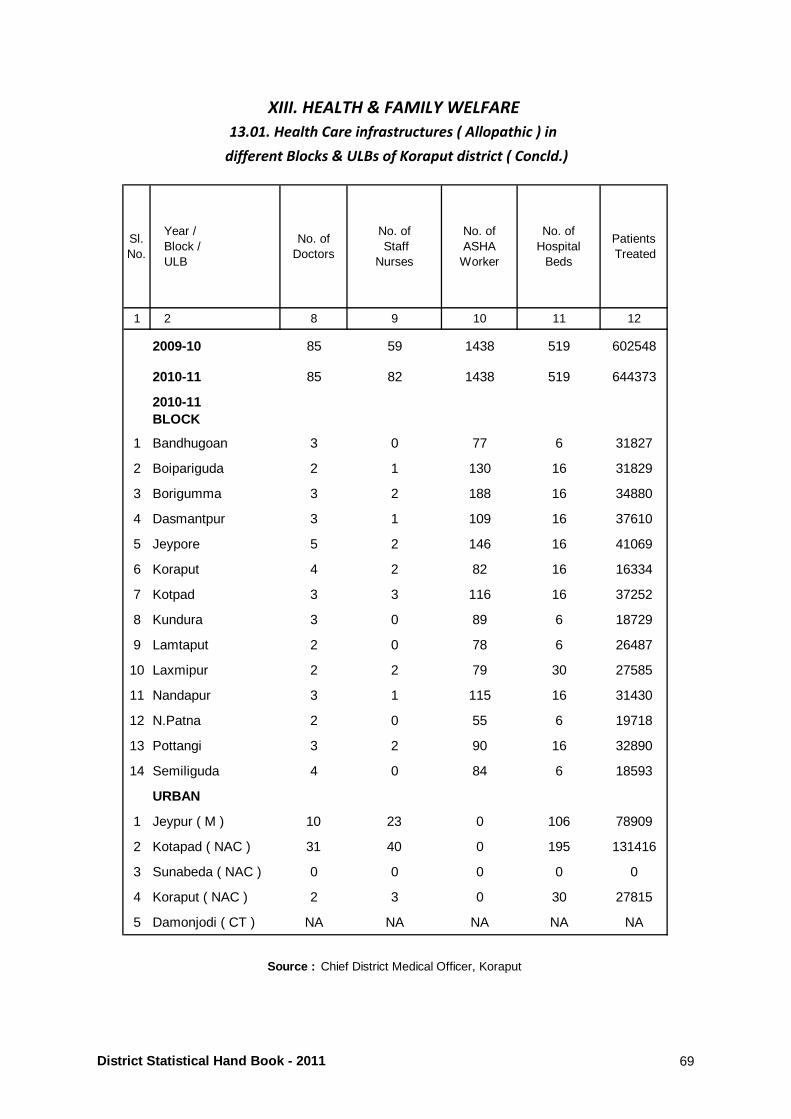
Sl.No.
Year /Block /ULB
No. of Doctors
No. of Staff
Nurses
No. of ASHA
Worker
No. of Hospital
Beds
Patients Treated
1 2 8 9 10 11 12
2009-10 85 59 1438 519 602548
2010-11 85 82 1438 519 644373
2010-11BLOCK
1 Bandhugoan 3 0 77 6 31827
2 Boipariguda 2 1 130 16 31829
3 Borigumma 3 2 188 16 34880
4 Dasmantpur 3 1 109 16 37610
5 Jeypore 5 2 146 16 41069
6 Koraput 4 2 82 16 16334
7 Kotpad 3 3 116 16 37252
8 Kundura 3 0 89 6 18729
9 Lamtaput 2 0 78 6 26487
10 Laxmipur 2 2 79 30 27585
11 Nandapur 3 1 115 16 31430
12 N.Patna 2 0 55 6 19718
13 Pottangi 3 2 90 16 32890
14 Semiliguda 4 0 84 6 18593
URBAN
1 Jeypur ( M ) 10 23 0 106 78909
2 Kotapad ( NAC ) 31 40 0 195 131416
3 Sunabeda ( NAC ) 0 0 0 0 0
4 Koraput ( NAC ) 2 3 0 30 27815
5 Damonjodi ( CT ) NA NA NA NA NA
different Blocks & ULBs of Koraput district ( Concld.)
Source : Chief District Medical Officer, Koraput
XIII. HEALTH & FAMILY WELFARE
13.01. Health Care infrastructures ( Allopathic ) in
District Statistical Hand Book - 2011 69
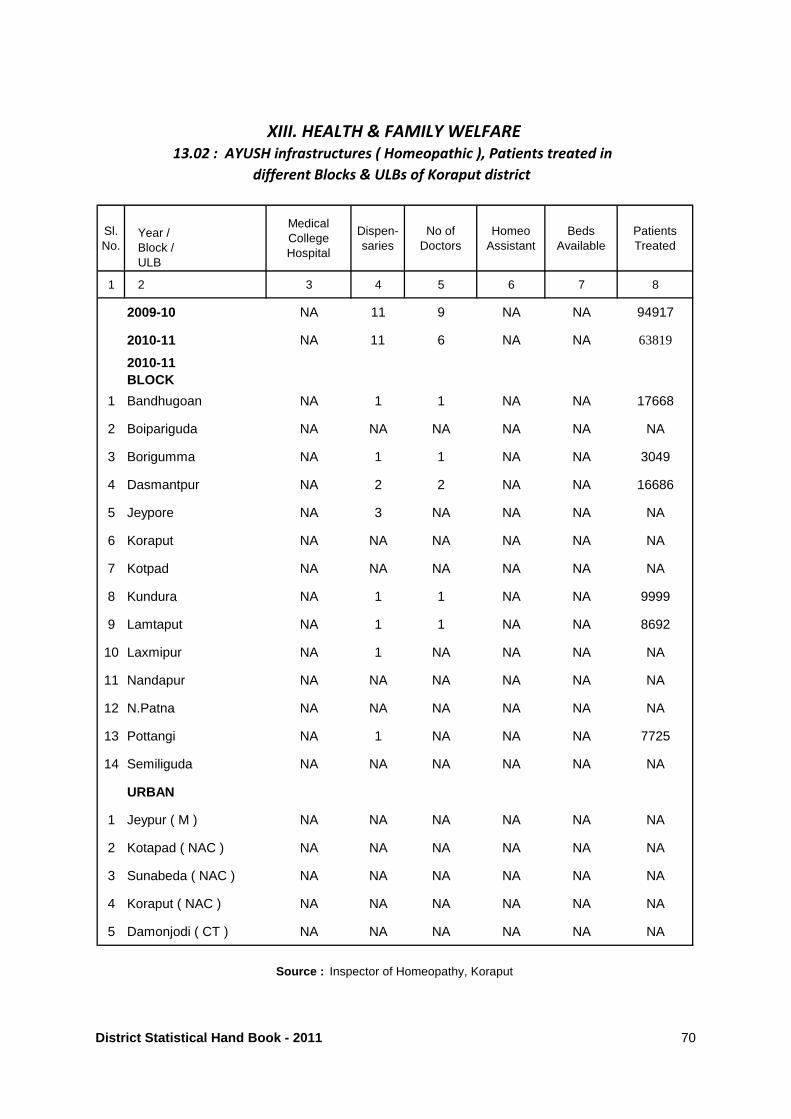
Sl.No.
Year /Block /ULB
Medical CollegeHospital
Dispen-saries
No of Doctors
HomeoAssistant
Beds Available
Patients Treated
1 2 3 4 5 6 7 8
2009-10 NA 11 9 NA NA 94917
2010-11 NA 11 6 NA NA 63819
2010-11BLOCK
1 Bandhugoan NA 1 1 NA NA 17668
2 Boipariguda NA NA NA NA NA NA
3 Borigumma NA 1 1 NA NA 3049
4 Dasmantpur NA 2 2 NA NA 16686
5 Jeypore NA 3 NA NA NA NA
6 Koraput NA NA NA NA NA NA
7 Kotpad NA NA NA NA NA NA
8 Kundura NA 1 1 NA NA 9999
9 Lamtaput NA 1 1 NA NA 8692
10 Laxmipur NA 1 NA NA NA NA
11 Nandapur NA NA NA NA NA NA
12 N.Patna NA NA NA NA NA NA
13 Pottangi NA 1 NA NA NA 7725
14 Semiliguda NA NA NA NA NA NA
URBAN
1 Jeypur ( M ) NA NA NA NA NA NA
2 Kotapad ( NAC ) NA NA NA NA NA NA
3 Sunabeda ( NAC ) NA NA NA NA NA NA
4 Koraput ( NAC ) NA NA NA NA NA NA
5 Damonjodi ( CT ) NA NA NA NA NA NA
13.02 : AYUSH infrastructures ( Homeopathic ), Patients treated in
different Blocks & ULBs of Koraput district
XIII. HEALTH & FAMILY WELFARE
Source : Inspector of Homeopathy, Koraput
District Statistical Hand Book - 2011 70

Sl.No.
BlockMedical College/ Hospital
Dispen-saries
No of Doctors
Ayurvedic / Unani
Assistant
Beds Available
PatientsTreated
1 2 3 4 5 6 7 8
2009-10 NA 18 13 3 NA 89109
2010-11 NA 18 6 3 NA 64378
2010-11BLOCK
1 Bandhugoan NA NA NA NA NA NA
2 Boipariguda NA 1 NA NA NA NA
3 Borigumma NA 2 1 NA NA 4248
4 Dasmantpur NA 1 NA NA NA NA
5 Jeypore NA 2 NA 1 NA 9496
6 Koraput NA 2 1 NA NA 9101
7 Kotpad NA 2 1 NA NA 5407
8 Kundura NA 2 NA 1 NA 5124
9 Lamtaput NA 3 NA NA NA 9511
10 Laxmipur NA NA NA NA NA NA
11 Nandapur NA 1 1 NA NA 7171
12 N.Patna NA NA NA NA NA NA
13 Pottangi NA NA NA NA NA NA
14 Semiliguda NA 2 2 1 NA 14320
URBAN
1 Jeypur ( M ) NA NA NA NA NA NA
2 Kotapad ( NAC ) NA NA NA NA NA NA
3 Sunabeda ( NAC ) NA NA NA NA NA NA
4 Koraput ( NAC ) NA NA NA NA NA NA
5 Damonjodi ( CT ) NA NA NA NA NA NA
13.03 : AYUSH infrastructures ( Ayurvedic / Unani ), Patients treated in
Source : Inspector of Ayurvedic, Koraput
different Blocks & ULBs of Koraput district
XIII. HEALTH & FAMILY WELFARE
District Statistical Hand Book - 2011 71
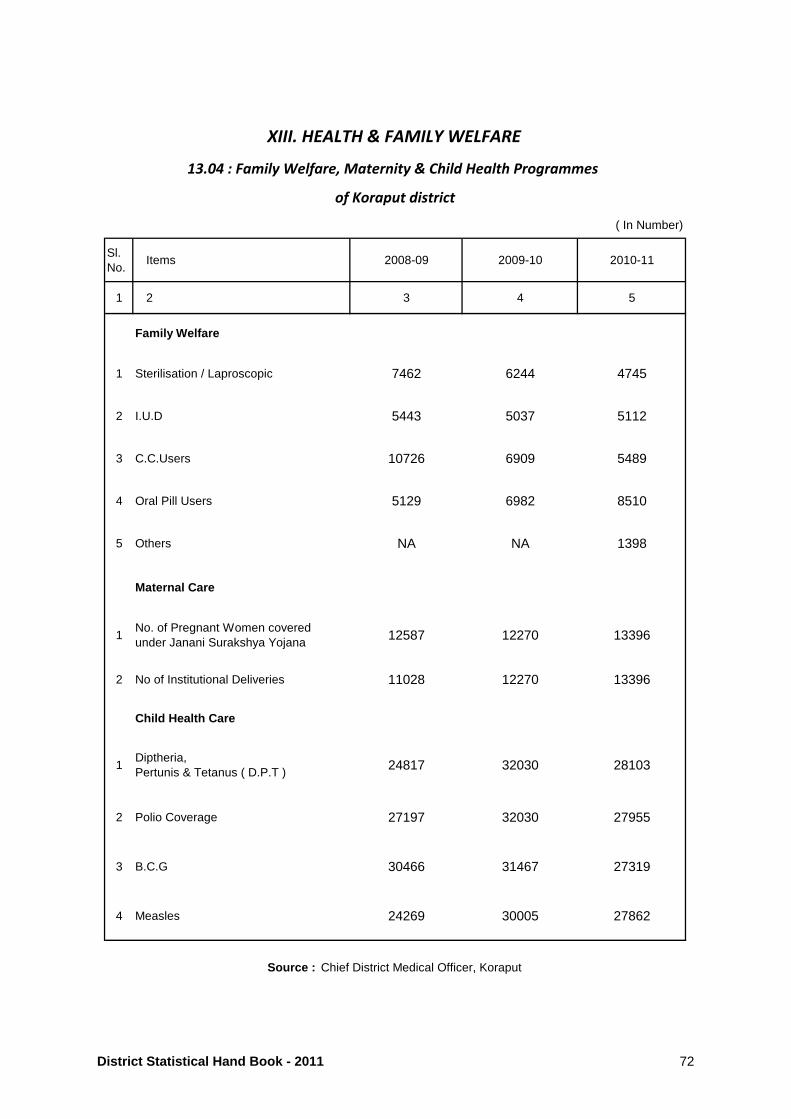
( In Number)
Sl.No.
Items 2008-09 2009-10 2010-11
1 2 3 4 5
Family Welfare
1 Sterilisation / Laproscopic 7462 6244 4745
2 I.U.D 5443 5037 5112
3 C.C.Users 10726 6909 5489
4 Oral Pill Users 5129 6982 8510
5 Others NA NA 1398
Maternal Care
1No. of Pregnant Women coveredunder Janani Surakshya Yojana 12587 12270 13396
2 No of Institutional Deliveries 11028 12270 13396
Child Health Care
1Diptheria, Pertunis & Tetanus ( D.P.T ) 24817 32030 28103
2 Polio Coverage 27197 32030 27955
3 B.C.G 30466 31467 27319
4 Measles 24269 30005 27862
XIII. HEALTH & FAMILY WELFARE
Source : Chief District Medical Officer, Koraput
of Koraput district
13.04 : Family Welfare, Maternity & Child Health Programmes
District Statistical Hand Book - 2011 72
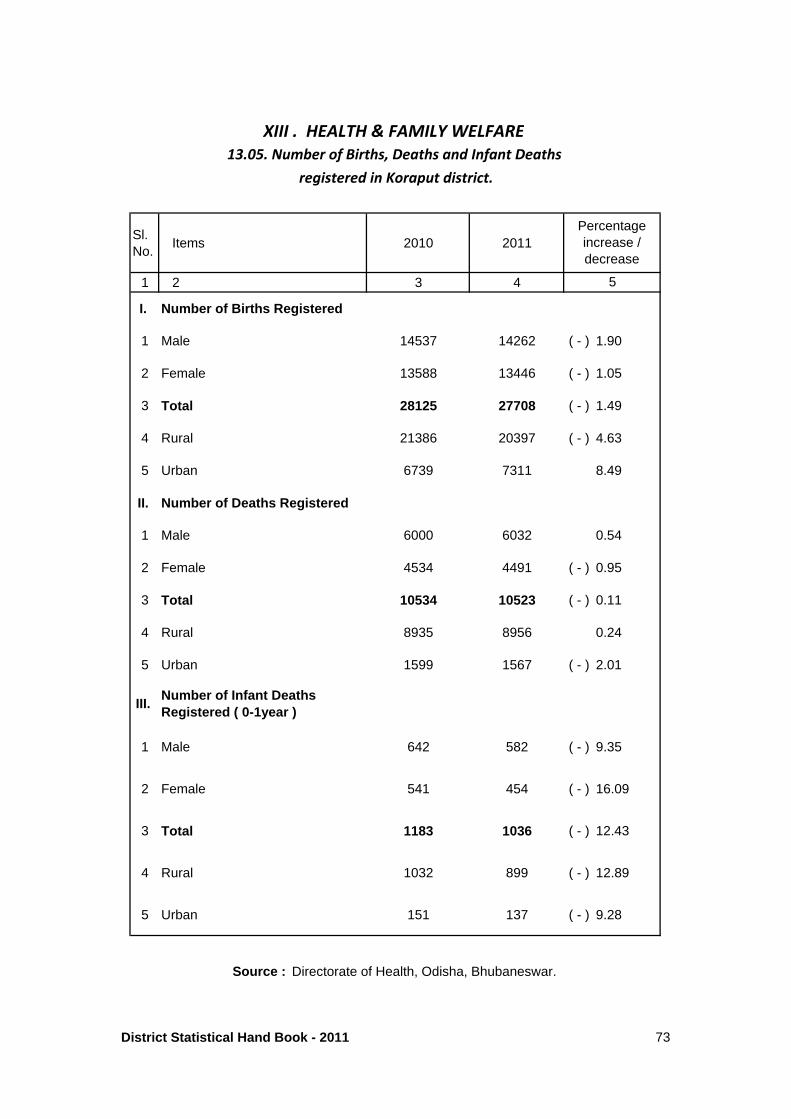
Sl.No.
Items 2010 2011
1 2 3 4
I. Number of Births Registered
1 Male 14537 14262 ( - ) 1.90
2 Female 13588 13446 ( - ) 1.05
3 Total 28125 27708 ( - ) 1.49
4 Rural 21386 20397 ( - ) 4.63
5 Urban 6739 7311 8.49
II. Number of Deaths Registered
1 Male 6000 6032 0.54
2 Female 4534 4491 ( - ) 0.95
3 Total 10534 10523 ( - ) 0.11
4 Rural 8935 8956 0.24
5 Urban 1599 1567 ( - ) 2.01
III. Number of Infant Deaths Registered ( 0-1year )
1 Male 642 582 ( - ) 9.35
2 Female 541 454 ( - ) 16.09
3 Total 1183 1036 ( - ) 12.43
4 Rural 1032 899 ( - ) 12.89
5 Urban 151 137 ( - ) 9.28
XIII . HEALTH & FAMILY WELFARE
13.05. Number of Births, Deaths and Infant Deaths
registered in Koraput district.
Source : Directorate of Health, Odisha, Bhubaneswar.
Percentage increase / decrease
5
District Statistical Hand Book - 2011 73

Sl.No.
Year /Block /ULB
Medical CollegeHospital
Dispen-saries
No of Doctors
HomeoAssistant
Beds Available
Patients Treated
1 2 3 4 5 6 7 8
2009-10 NA 11 9 NA NA 94917
2010-11 NA 11 6 NA NA 63819
2010-11BLOCK
1 Bandhugoan NA 1 1 NA NA 17668
2 Boipariguda NA NA NA NA NA NA
3 Borigumma NA 1 1 NA NA 3049
4 Dasmantpur NA 2 2 NA NA 16686
5 Jeypore NA 3 NA NA NA NA
6 Koraput NA NA NA NA NA NA
7 Kotpad NA NA NA NA NA NA
8 Kundura NA 1 1 NA NA 9999
9 Lamtaput NA 1 1 NA NA 8692
10 Laxmipur NA 1 NA NA NA NA
11 Nandapur NA NA NA NA NA NA
12 N.Patna NA NA NA NA NA NA
13 Pottangi NA 1 NA NA NA 7725
14 Semiliguda NA NA NA NA NA NA
URBAN
1 Jeypur ( M ) NA NA NA NA NA NA
2 Kotapad ( NAC ) NA NA NA NA NA NA
3 Sunabeda ( NAC ) NA NA NA NA NA NA
4 Koraput ( NAC ) NA NA NA NA NA NA
5 Damonjodi ( CT ) NA NA NA NA NA NA
13.02 : AYUSH infrastructures ( Homeopathic ), Patients treated in
different Blocks & ULBs of Koraput district
XIII. HEALTH & FAMILY WELFARE
Source : Inspector of Homeopathy, Koraput
District Statistical Hand Book - 2011 70
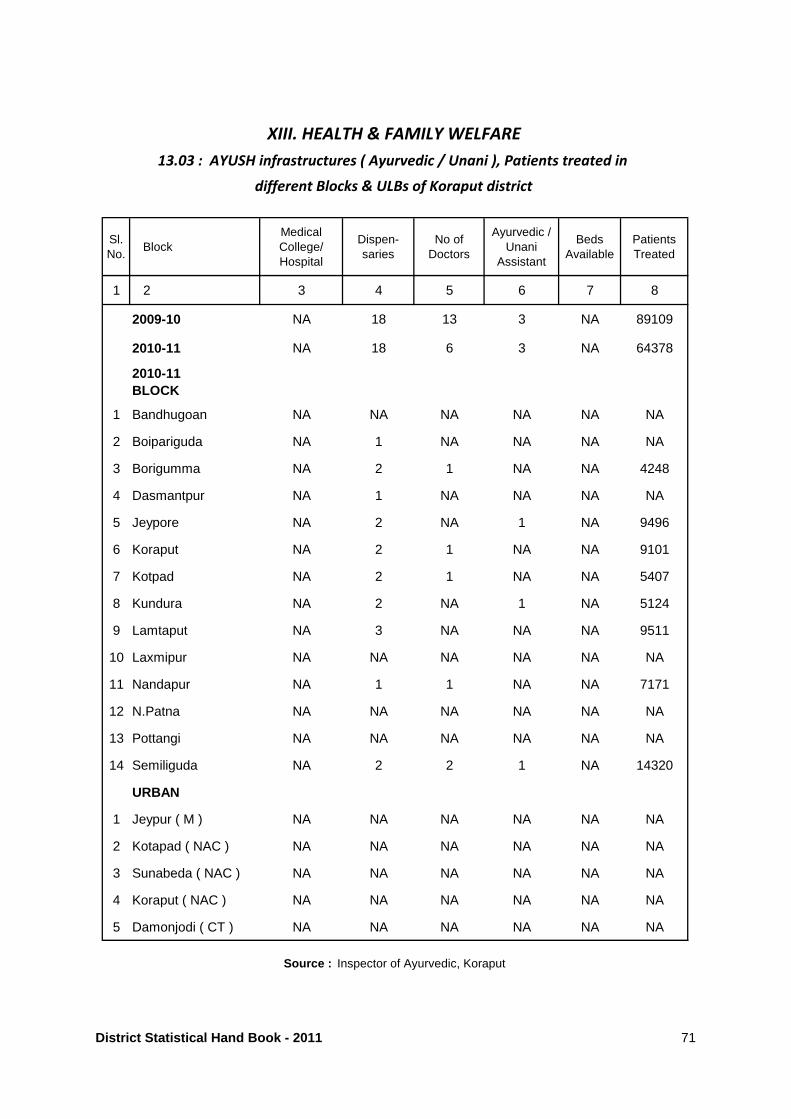
Sl.No.
BlockMedical College/ Hospital
Dispen-saries
No of Doctors
Ayurvedic / Unani
Assistant
Beds Available
PatientsTreated
1 2 3 4 5 6 7 8
2009-10 NA 18 13 3 NA 89109
2010-11 NA 18 6 3 NA 64378
2010-11BLOCK
1 Bandhugoan NA NA NA NA NA NA
2 Boipariguda NA 1 NA NA NA NA
3 Borigumma NA 2 1 NA NA 4248
4 Dasmantpur NA 1 NA NA NA NA
5 Jeypore NA 2 NA 1 NA 9496
6 Koraput NA 2 1 NA NA 9101
7 Kotpad NA 2 1 NA NA 5407
8 Kundura NA 2 NA 1 NA 5124
9 Lamtaput NA 3 NA NA NA 9511
10 Laxmipur NA NA NA NA NA NA
11 Nandapur NA 1 1 NA NA 7171
12 N.Patna NA NA NA NA NA NA
13 Pottangi NA NA NA NA NA NA
14 Semiliguda NA 2 2 1 NA 14320
URBAN
1 Jeypur ( M ) NA NA NA NA NA NA
2 Kotapad ( NAC ) NA NA NA NA NA NA
3 Sunabeda ( NAC ) NA NA NA NA NA NA
4 Koraput ( NAC ) NA NA NA NA NA NA
5 Damonjodi ( CT ) NA NA NA NA NA NA
13.03 : AYUSH infrastructures ( Ayurvedic / Unani ), Patients treated in
Source : Inspector of Ayurvedic, Koraput
different Blocks & ULBs of Koraput district
XIII. HEALTH & FAMILY WELFARE
District Statistical Hand Book - 2011 71

( In Number)
Sl.No.
Items 2008-09 2009-10 2010-11
1 2 3 4 5
Family Welfare
1 Sterilisation / Laproscopic 7462 6244 4745
2 I.U.D 5443 5037 5112
3 C.C.Users 10726 6909 5489
4 Oral Pill Users 5129 6982 8510
5 Others NA NA 1398
Maternal Care
1No. of Pregnant Women coveredunder Janani Surakshya Yojana 12587 12270 13396
2 No of Institutional Deliveries 11028 12270 13396
Child Health Care
1Diptheria, Pertunis & Tetanus ( D.P.T ) 24817 32030 28103
2 Polio Coverage 27197 32030 27955
3 B.C.G 30466 31467 27319
4 Measles 24269 30005 27862
XIII. HEALTH & FAMILY WELFARE
Source : Chief District Medical Officer, Koraput
of Koraput district
13.04 : Family Welfare, Maternity & Child Health Programmes
District Statistical Hand Book - 2011 72

Sl.No.
Items 2010 2011
1 2 3 4
I. Number of Births Registered
1 Male 14537 14262 ( - ) 1.90
2 Female 13588 13446 ( - ) 1.05
3 Total 28125 27708 ( - ) 1.49
4 Rural 21386 20397 ( - ) 4.63
5 Urban 6739 7311 8.49
II. Number of Deaths Registered
1 Male 6000 6032 0.54
2 Female 4534 4491 ( - ) 0.95
3 Total 10534 10523 ( - ) 0.11
4 Rural 8935 8956 0.24
5 Urban 1599 1567 ( - ) 2.01
III. Number of Infant Deaths Registered ( 0-1year )
1 Male 642 582 ( - ) 9.35
2 Female 541 454 ( - ) 16.09
3 Total 1183 1036 ( - ) 12.43
4 Rural 1032 899 ( - ) 12.89
5 Urban 151 137 ( - ) 9.28
XIII . HEALTH & FAMILY WELFARE
13.05. Number of Births, Deaths and Infant Deaths
registered in Koraput district.
Source : Directorate of Health, Odisha, Bhubaneswar.
Percentage increase / decrease
5
District Statistical Hand Book - 2011 73
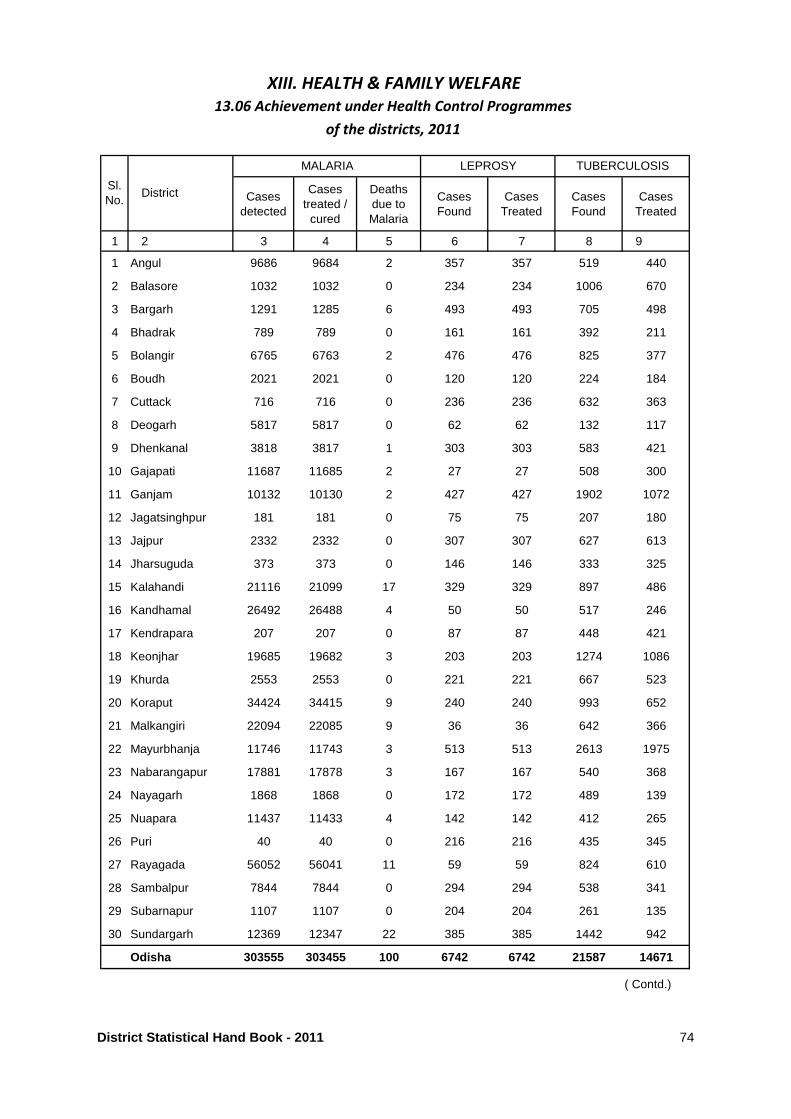
Cases detected
Casestreated /
cured
Deathsdue toMalaria
CasesFound
CasesTreated
CasesFound
CasesTreated
1 2 3 4 5 6 7 8 9
1 Angul 9686 9684 2 357 357 519 440
2 Balasore 1032 1032 0 234 234 1006 670
3 Bargarh 1291 1285 6 493 493 705 498
4 Bhadrak 789 789 0 161 161 392 211
5 Bolangir 6765 6763 2 476 476 825 377
6 Boudh 2021 2021 0 120 120 224 184
7 Cuttack 716 716 0 236 236 632 363
8 Deogarh 5817 5817 0 62 62 132 117
9 Dhenkanal 3818 3817 1 303 303 583 421
10 Gajapati 11687 11685 2 27 27 508 300
11 Ganjam 10132 10130 2 427 427 1902 1072
12 Jagatsinghpur 181 181 0 75 75 207 180
13 Jajpur 2332 2332 0 307 307 627 613
14 Jharsuguda 373 373 0 146 146 333 325
15 Kalahandi 21116 21099 17 329 329 897 486
16 Kandhamal 26492 26488 4 50 50 517 246
17 Kendrapara 207 207 0 87 87 448 421
18 Keonjhar 19685 19682 3 203 203 1274 1086
19 Khurda 2553 2553 0 221 221 667 523
20 Koraput 34424 34415 9 240 240 993 652
21 Malkangiri 22094 22085 9 36 36 642 366
22 Mayurbhanja 11746 11743 3 513 513 2613 1975
23 Nabarangapur 17881 17878 3 167 167 540 368
24 Nayagarh 1868 1868 0 172 172 489 139
25 Nuapara 11437 11433 4 142 142 412 265
26 Puri 40 40 0 216 216 435 345
27 Rayagada 56052 56041 11 59 59 824 610
28 Sambalpur 7844 7844 0 294 294 538 341
29 Subarnapur 1107 1107 0 204 204 261 135
30 Sundargarh 12369 12347 22 385 385 1442 942
Odisha 303555 303455 100 6742 6742 21587 14671
( Contd.)
XIII. HEALTH & FAMILY WELFARE
13.06 Achievement under Health Control Programmes
of the districts, 2011
Sl.No.
District
MALARIA LEPROSY TUBERCULOSIS
District Statistical Hand Book - 2011 74
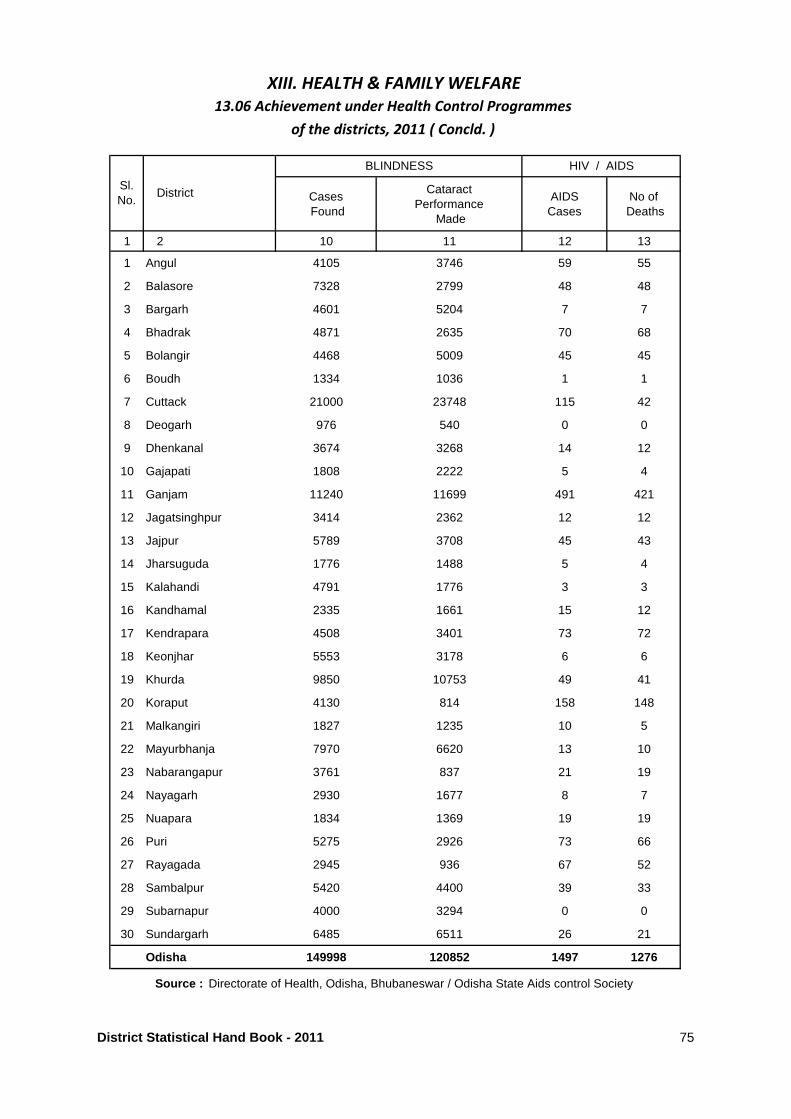
Cases Found
Cataract Performance
Made
AIDSCases
No of Deaths
1 2 10 11 12 13
1 Angul 4105 3746 59 55
2 Balasore 7328 2799 48 48
3 Bargarh 4601 5204 7 7
4 Bhadrak 4871 2635 70 68
5 Bolangir 4468 5009 45 45
6 Boudh 1334 1036 1 1
7 Cuttack 21000 23748 115 42
8 Deogarh 976 540 0 0
9 Dhenkanal 3674 3268 14 12
10 Gajapati 1808 2222 5 4
11 Ganjam 11240 11699 491 421
12 Jagatsinghpur 3414 2362 12 12
13 Jajpur 5789 3708 45 43
14 Jharsuguda 1776 1488 5 4
15 Kalahandi 4791 1776 3 3
16 Kandhamal 2335 1661 15 12
17 Kendrapara 4508 3401 73 72
18 Keonjhar 5553 3178 6 6
19 Khurda 9850 10753 49 41
20 Koraput 4130 814 158 148
21 Malkangiri 1827 1235 10 5
22 Mayurbhanja 7970 6620 13 10
23 Nabarangapur 3761 837 21 19
24 Nayagarh 2930 1677 8 7
25 Nuapara 1834 1369 19 19
26 Puri 5275 2926 73 66
27 Rayagada 2945 936 67 52
28 Sambalpur 5420 4400 39 33
29 Subarnapur 4000 3294 0 0
30 Sundargarh 6485 6511 26 21
Odisha 149998 120852 1497 1276
HIV / AIDS
XIII. HEALTH & FAMILY WELFARE
13.06 Achievement under Health Control Programmes
of the districts, 2011 ( Concld. )
Source : Directorate of Health, Odisha, Bhubaneswar / Odisha State Aids control Society
Sl.No.
District
BLINDNESS
District Statistical Hand Book - 2011 75
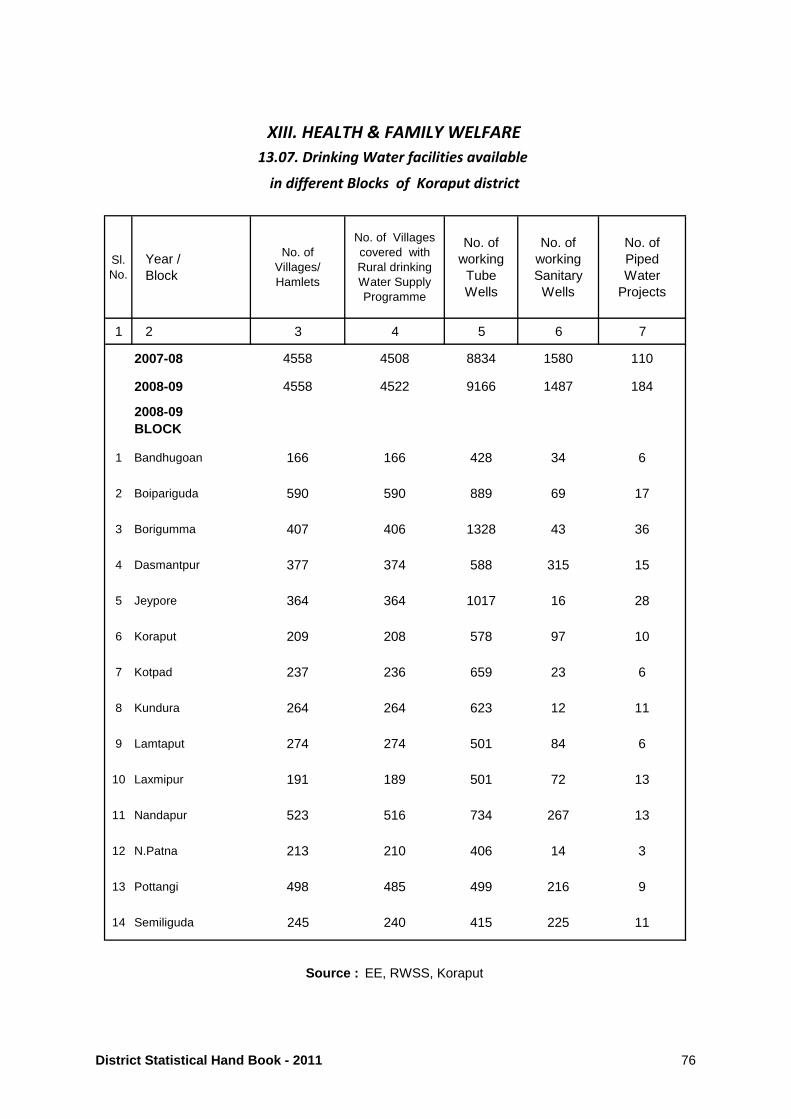
Sl.No.
Year /Block
No. of Villages/ Hamlets
No. of Villagescovered with Rural drinkingWater Supply Programme
No. of working
Tube Wells
No. of working Sanitary
Wells
No. of Piped Water
Projects
1 2 3 4 5 6 7
2007-08 4558 4508 8834 1580 110
2008-09 4558 4522 9166 1487 184
2008-09BLOCK
1 Bandhugoan 166 166 428 34 6
2 Boipariguda 590 590 889 69 17
3 Borigumma 407 406 1328 43 36
4 Dasmantpur 377 374 588 315 15
5 Jeypore 364 364 1017 16 28
6 Koraput 209 208 578 97 10
7 Kotpad 237 236 659 23 6
8 Kundura 264 264 623 12 11
9 Lamtaput 274 274 501 84 6
10 Laxmipur 191 189 501 72 13
11 Nandapur 523 516 734 267 13
12 N.Patna 213 210 406 14 3
13 Pottangi 498 485 499 216 9
14 Semiliguda 245 240 415 225 11
XIII. HEALTH & FAMILY WELFARE
13.07. Drinking Water facilities available
in different Blocks of Koraput district
Source : EE, RWSS, Koraput
District Statistical Hand Book - 2011 76
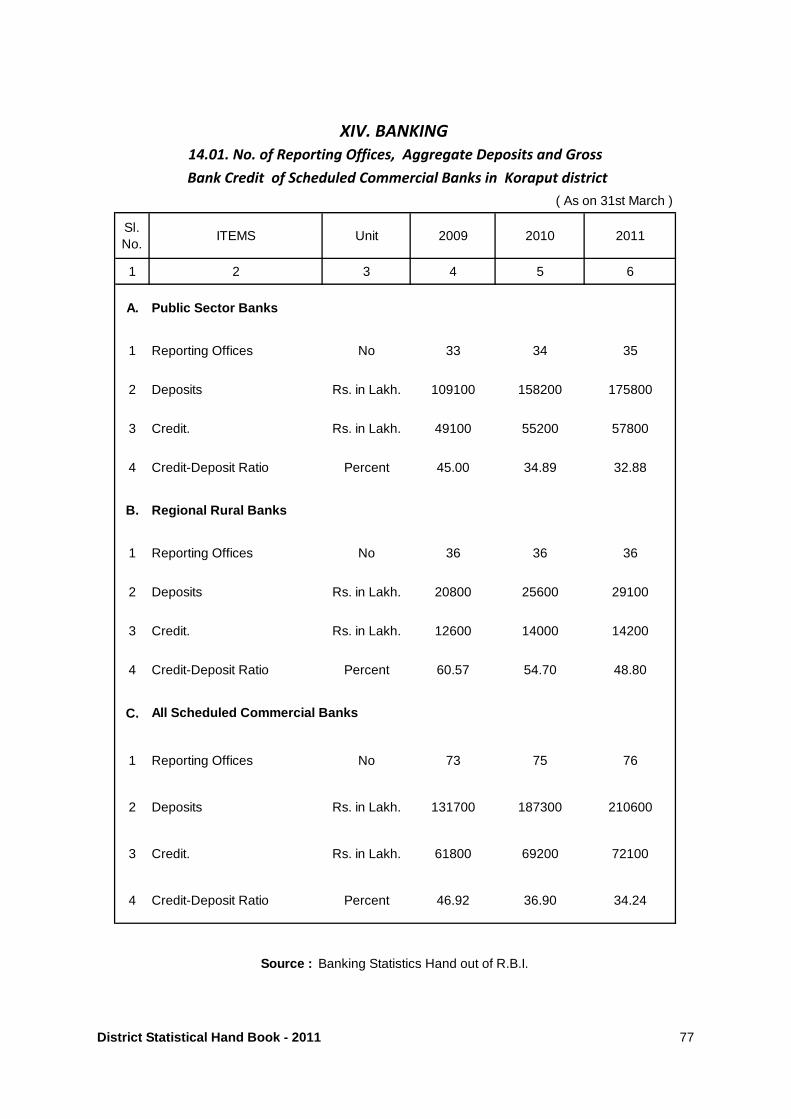
Sl.No.
ITEMS Unit 2009 2010 2011
1 2 3 4 5 6
A. Public Sector Banks
1 Reporting Offices No 33 34 35
2 Deposits Rs. in Lakh. 109100 158200 175800
3 Credit. Rs. in Lakh. 49100 55200 57800
4 Credit-Deposit Ratio Percent 45.00 34.89 32.88
B. Regional Rural Banks
1 Reporting Offices No 36 36 36
2 Deposits Rs. in Lakh. 20800 25600 29100
3 Credit. Rs. in Lakh. 12600 14000 14200
4 Credit-Deposit Ratio Percent 60.57 54.70 48.80
C.
1 Reporting Offices No 73 75 76
2 Deposits Rs. in Lakh. 131700 187300 210600
3 Credit. Rs. in Lakh. 61800 69200 72100
4 Credit-Deposit Ratio Percent 46.92 36.90 34.24
XIV. BANKING
14.01. No. of Reporting Offices, Aggregate Deposits and Gross
Bank Credit of Scheduled Commercial Banks in Koraput district
Source : Banking Statistics Hand out of R.B.I.
All Scheduled Commercial Banks
( As on 31st March )
District Statistical Hand Book - 2011 77
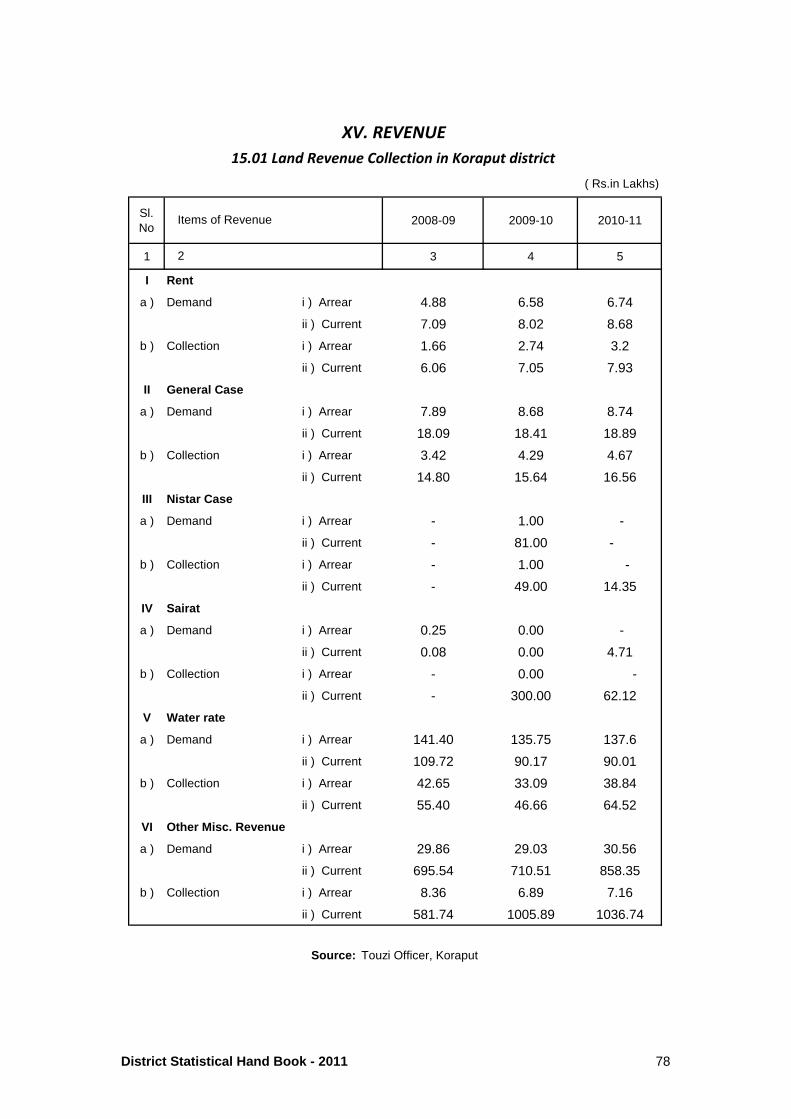
Sl. No
2008-09 2009-10 2010-11
1 3 4 5
I Rent
a ) Demand i ) Arrear 4.88 6.58 6.74
ii ) Current 7.09 8.02 8.68
b ) Collection i ) Arrear 1.66 2.74 3.2
ii ) Current 6.06 7.05 7.93
II General Case
a ) Demand i ) Arrear 7.89 8.68 8.74
ii ) Current 18.09 18.41 18.89
b ) Collection i ) Arrear 3.42 4.29 4.67
ii ) Current 14.80 15.64 16.56
III Nistar Case
a ) Demand i ) Arrear - 1.00 -
ii ) Current - 81.00 -
b ) Collection i ) Arrear - 1.00 -
ii ) Current - 49.00 14.35
IV Sairat
a ) Demand i ) Arrear 0.25 0.00 -
ii ) Current 0.08 0.00 4.71
b ) Collection i ) Arrear - 0.00 -
ii ) Current - 300.00 62.12
V Water rate
a ) Demand i ) Arrear 141.40 135.75 137.6
ii ) Current 109.72 90.17 90.01
b ) Collection i ) Arrear 42.65 33.09 38.84
ii ) Current 55.40 46.66 64.52
VI Other Misc. Revenue
a ) Demand i ) Arrear 29.86 29.03 30.56
ii ) Current 695.54 710.51 858.35
b ) Collection i ) Arrear 8.36 6.89 7.16
ii ) Current 581.74 1005.89 1036.74
XV. REVENUE
15.01 Land Revenue Collection in Koraput district
( Rs.in Lakhs)
Items of Revenue
2
Source: Touzi Officer, Koraput
District Statistical Hand Book - 2011 78
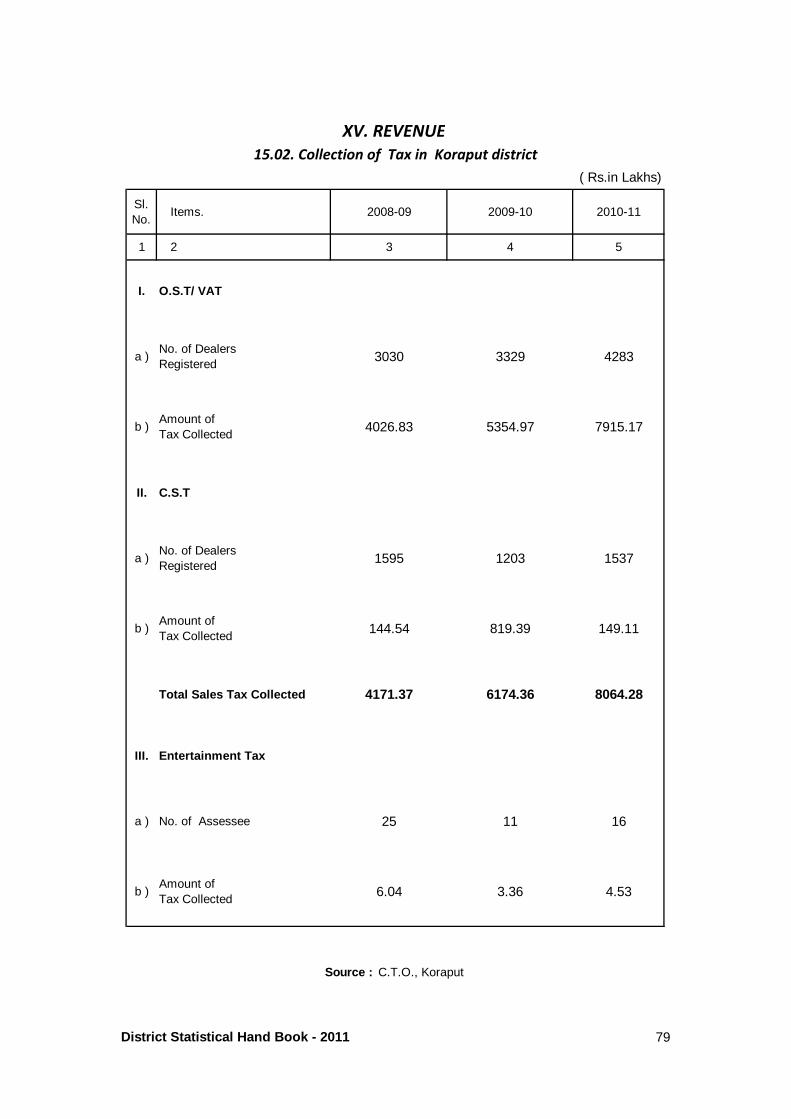
Sl.No.
Items. 2008-09 2009-10 2010-11
1 2 3 4 5
I. O.S.T/ VAT
a )No. of Dealers Registered
3030 3329 4283
b )Amount of Tax Collected
4026.83 5354.97 7915.17
II. C.S.T
a )No. of Dealers Registered
1595 1203 1537
b )Amount of Tax Collected
144.54 819.39 149.11
Total Sales Tax Collected 4171.37 6174.36 8064.28
III. Entertainment Tax
a ) No. of Assessee 25 11 16
b )Amount of Tax Collected
6.04 3.36 4.53
XV. REVENUE
15.02. Collection of Tax in Koraput district
Source : C.T.O., Koraput
( Rs.in Lakhs)
District Statistical Hand Book - 2011 79
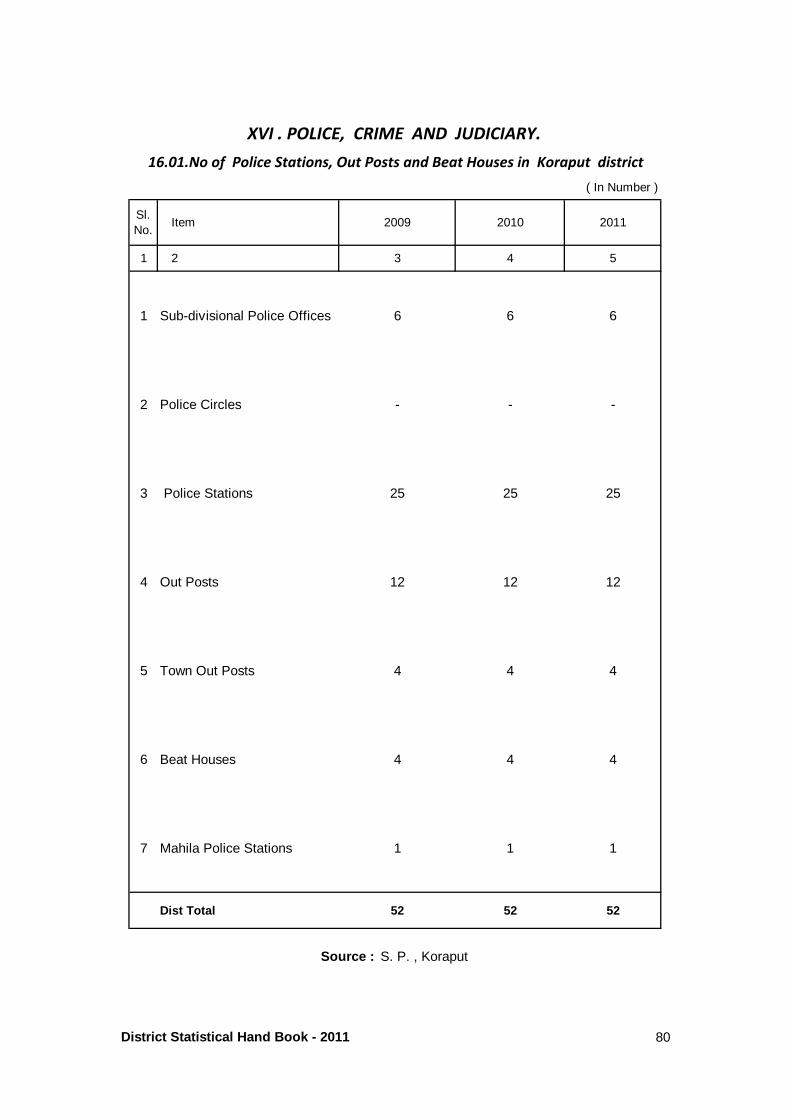
Sl.No.
Item 2009 2010 2011
1 2 3 4 5
1 Sub-divisional Police Offices 6 6 6
2 Police Circles - - -
3 Police Stations 25 25 25
4 Out Posts 12 12 12
5 Town Out Posts 4 4 4
6 Beat Houses 4 4 4
7 Mahila Police Stations 1 1 1
Dist Total 52 52 52
XVI . POLICE, CRIME AND JUDICIARY.
( In Number )
16.01.No of Police Stations, Out Posts and Beat Houses in Koraput district
Source : S. P. , Koraput
District Statistical Hand Book - 2011 80
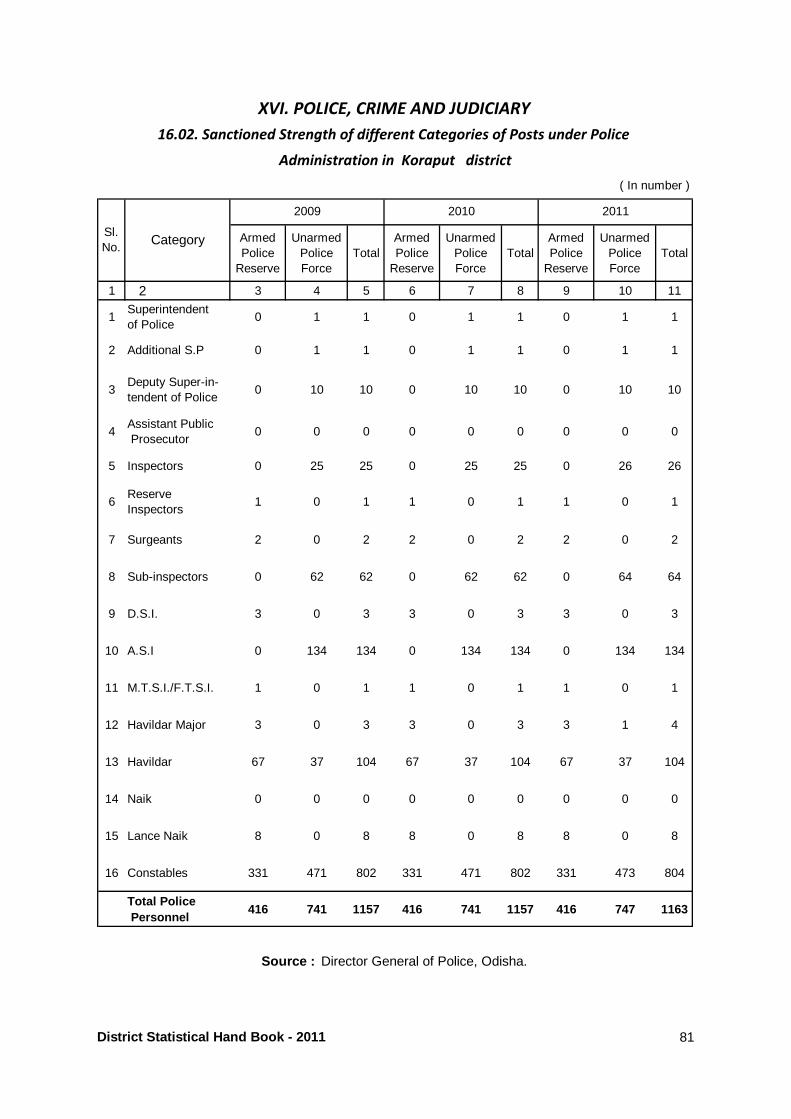
ArmedPolice
Reserve
UnarmedPoliceForce
TotalArmedPolice
Reserve
UnarmedPoliceForce
TotalArmedPolice
Reserve
UnarmedPoliceForce
Total
1 2 3 4 5 6 7 8 9 10 11
1Superintendent of Police
0 1 1 0 1 1 0 1 1
2 Additional S.P 0 1 1 0 1 1 0 1 1
3Deputy Super-in-tendent of Police
0 10 10 0 10 10 0 10 10
4Assistant Public Prosecutor
0 0 0 0 0 0 0 0 0
5 Inspectors 0 25 25 0 25 25 0 26 26
6Reserve Inspectors
1 0 1 1 0 1 1 0 1
7 Surgeants 2 0 2 2 0 2 2 0 2
8 Sub-inspectors 0 62 62 0 62 62 0 64 64
9 D.S.I. 3 0 3 3 0 3 3 0 3
10 A.S.I 0 134 134 0 134 134 0 134 134
11 M.T.S.I./F.T.S.I. 1 0 1 1 0 1 1 0 1
12 Havildar Major 3 0 3 3 0 3 3 1 4
13 Havildar 67 37 104 67 37 104 67 37 104
14 Naik 0 0 0 0 0 0 0 0 0
15 Lance Naik 8 0 8 8 0 8 8 0 8
16 Constables 331 471 802 331 471 802 331 473 804
Total Police Personnel
416 741 1157 416 741 1157 416 747 1163
Source : Director General of Police, Odisha.
2010 2011
XVI. POLICE, CRIME AND JUDICIARY
16.02. Sanctioned Strength of different Categories of Posts under Police
Administration in Koraput district
( In number )
2009
Sl.No.
Category
District Statistical Hand Book - 2011 81
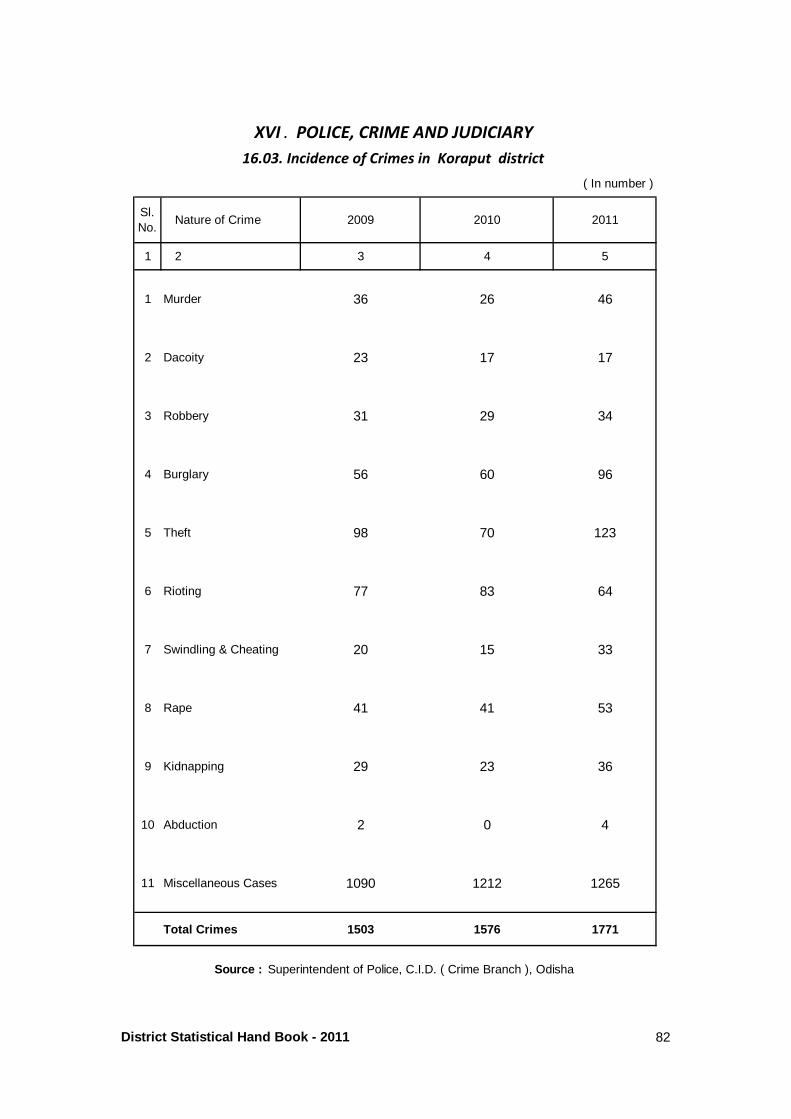
Sl.No.
Nature of Crime 2009 2010 2011
1 2 3 4 5
1 Murder 36 26 46
2 Dacoity 23 17 17
3 Robbery 31 29 34
4 Burglary 56 60 96
5 Theft 98 70 123
6 Rioting 77 83 64
7 Swindling & Cheating 20 15 33
8 Rape 41 41 53
9 Kidnapping 29 23 36
10 Abduction 2 0 4
11 Miscellaneous Cases 1090 1212 1265
Total Crimes 1503 1576 1771
XVI . POLICE, CRIME AND JUDICIARY
16.03. Incidence of Crimes in Koraput district
( In number )
Source : Superintendent of Police, C.I.D. ( Crime Branch ), Odisha
District Statistical Hand Book - 2011 82
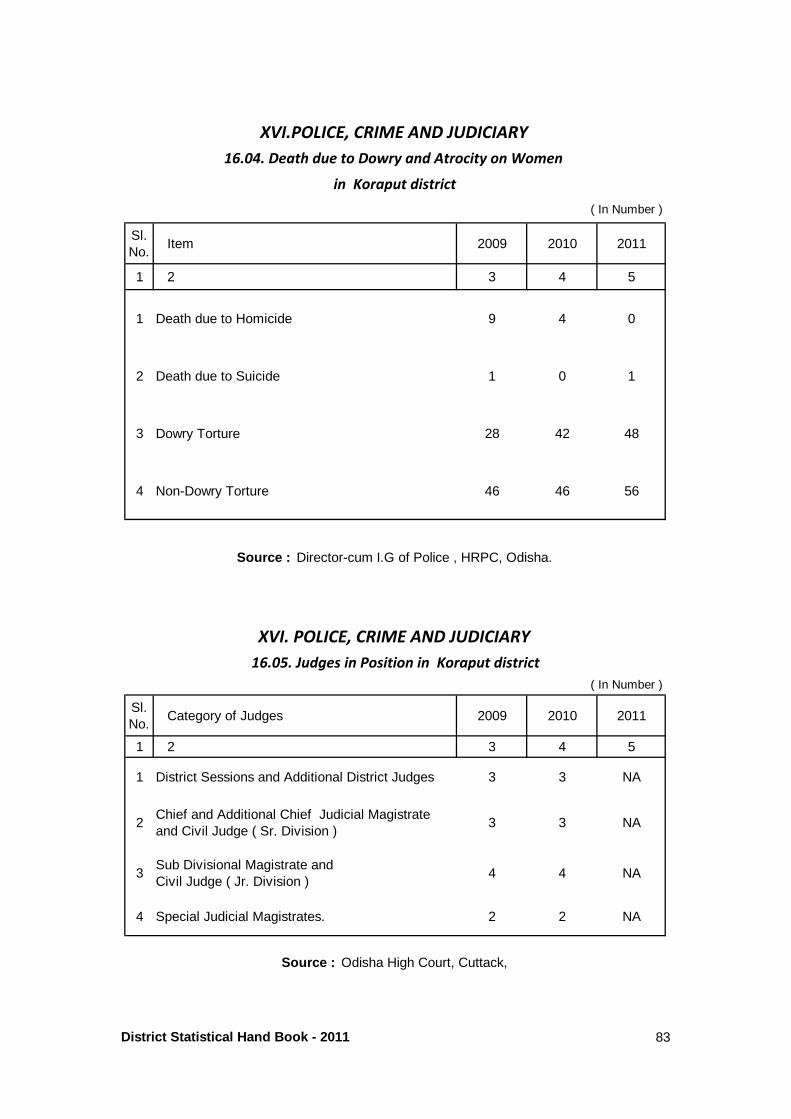
Sl.No.
Item 2009 2010 2011
1 2 3 4 5
1 Death due to Homicide 9 4 0
2 Death due to Suicide 1 0 1
3 Dowry Torture 28 42 48
4 Non-Dowry Torture 46 46 56
Sl.No.
Category of Judges 2009 2010 2011
1 2 3 4 5
1 District Sessions and Additional District Judges 3 3 NA
2Chief and Additional Chief Judicial Magistrateand Civil Judge ( Sr. Division )
3 3 NA
3Sub Divisional Magistrate andCivil Judge ( Jr. Division )
4 4 NA
4 Special Judicial Magistrates. 2 2 NA
16.05. Judges in Position in Koraput district
( In Number )
Source : Odisha High Court, Cuttack,
XVI.POLICE, CRIME AND JUDICIARY
16.04. Death due to Dowry and Atrocity on Women
in Koraput district
( In Number )
Source : Director-cum I.G of Police , HRPC, Odisha.
XVI. POLICE, CRIME AND JUDICIARY
District Statistical Hand Book - 2011 83
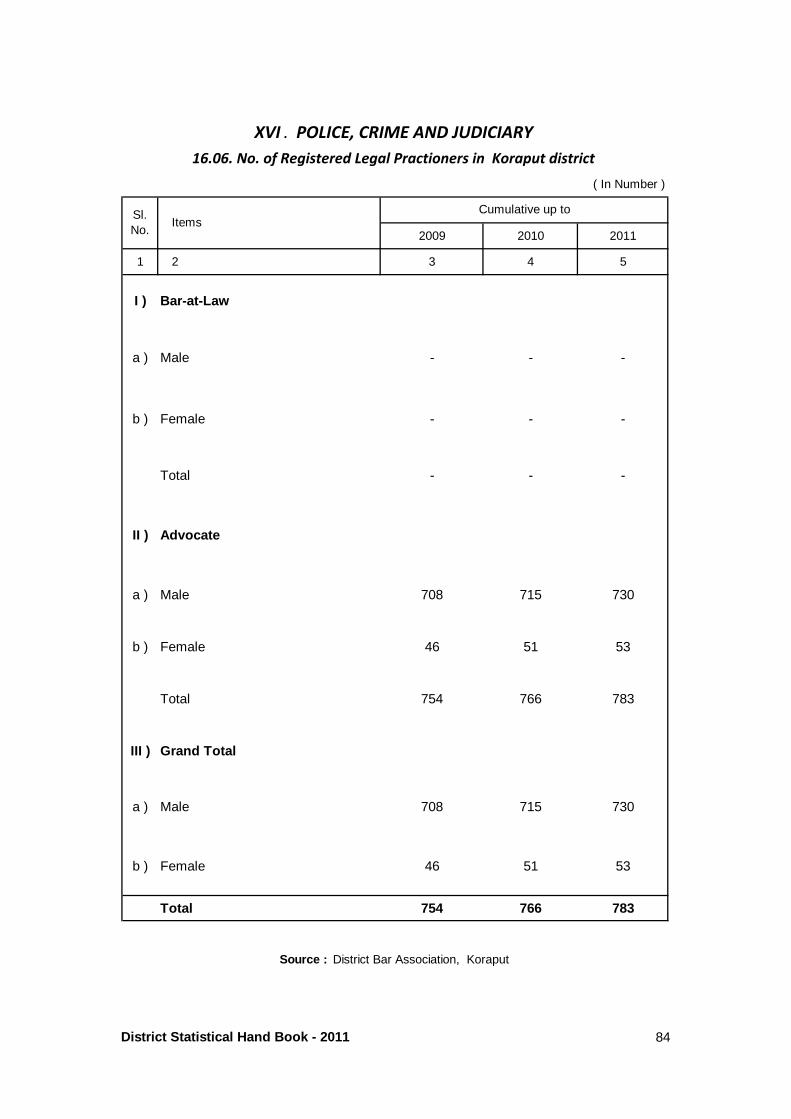
( In Number )
2009 2010 2011
1 2 3 4 5
I ) Bar-at-Law
a ) Male - - -
b ) Female - - -
Total - - -
II ) Advocate
a ) Male 708 715 730
b ) Female 46 51 53
Total 754 766 783
III ) Grand Total
a ) Male 708 715 730
b ) Female 46 51 53
Total 754 766 783
Cumulative up to
Source : District Bar Association, Koraput
XVI . POLICE, CRIME AND JUDICIARY
16.06. No. of Registered Legal Practioners in Koraput district
ItemsSl.No.
District Statistical Hand Book - 2011 84
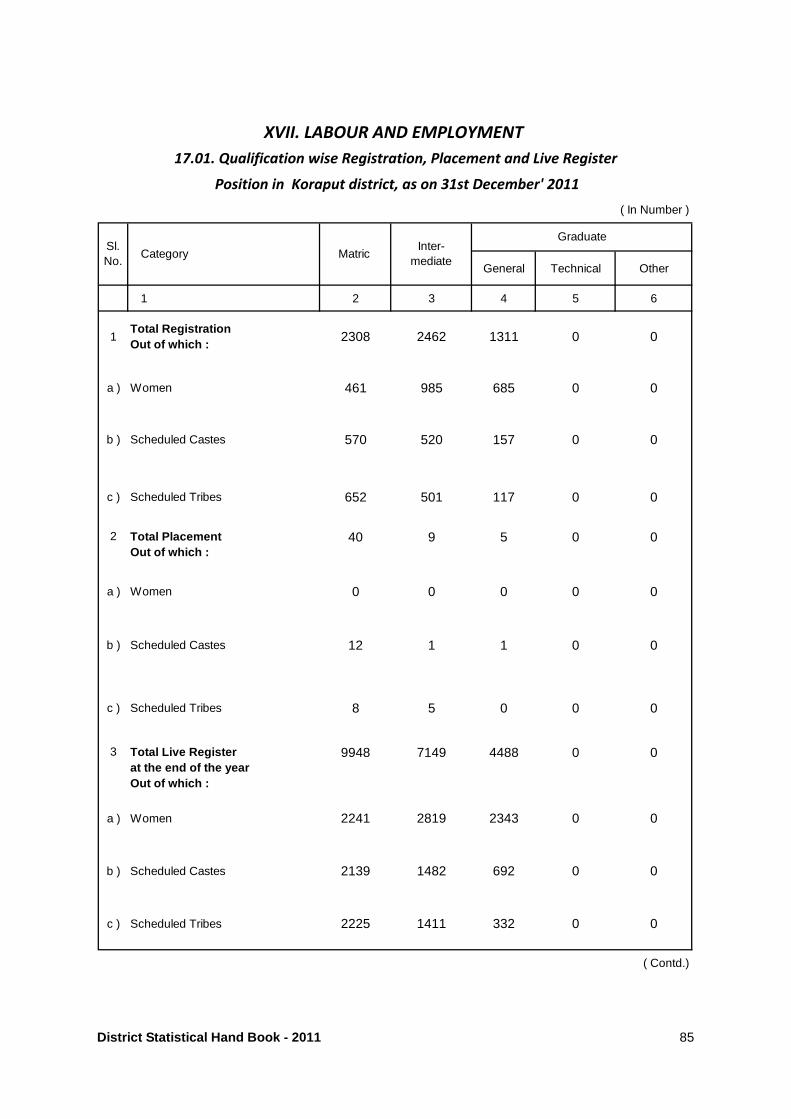
General Technical Other
1 2 3 4 5 6
1Total RegistrationOut of which :
2308 2462 1311 0 0
a ) Women 461 985 685 0 0
b ) Scheduled Castes 570 520 157 0 0
c ) Scheduled Tribes 652 501 117 0 0
2 Total PlacementOut of which :
40 9 5 0 0
a ) Women 0 0 0 0 0
b ) Scheduled Castes 12 1 1 0 0
c ) Scheduled Tribes 8 5 0 0 0
3 Total Live Register at the end of the yearOut of which :
9948 7149 4488 0 0
a ) Women 2241 2819 2343 0 0
b ) Scheduled Castes 2139 1482 692 0 0
c ) Scheduled Tribes 2225 1411 332 0 0
Category
XVII. LABOUR AND EMPLOYMENT
17.01. Qualification wise Registration, Placement and Live Register
Position in Koraput district, as on 31st December' 2011
Sl.No.
( Contd.)
( In Number )
Matric Inter-
mediate
Graduate
District Statistical Hand Book - 2011 85
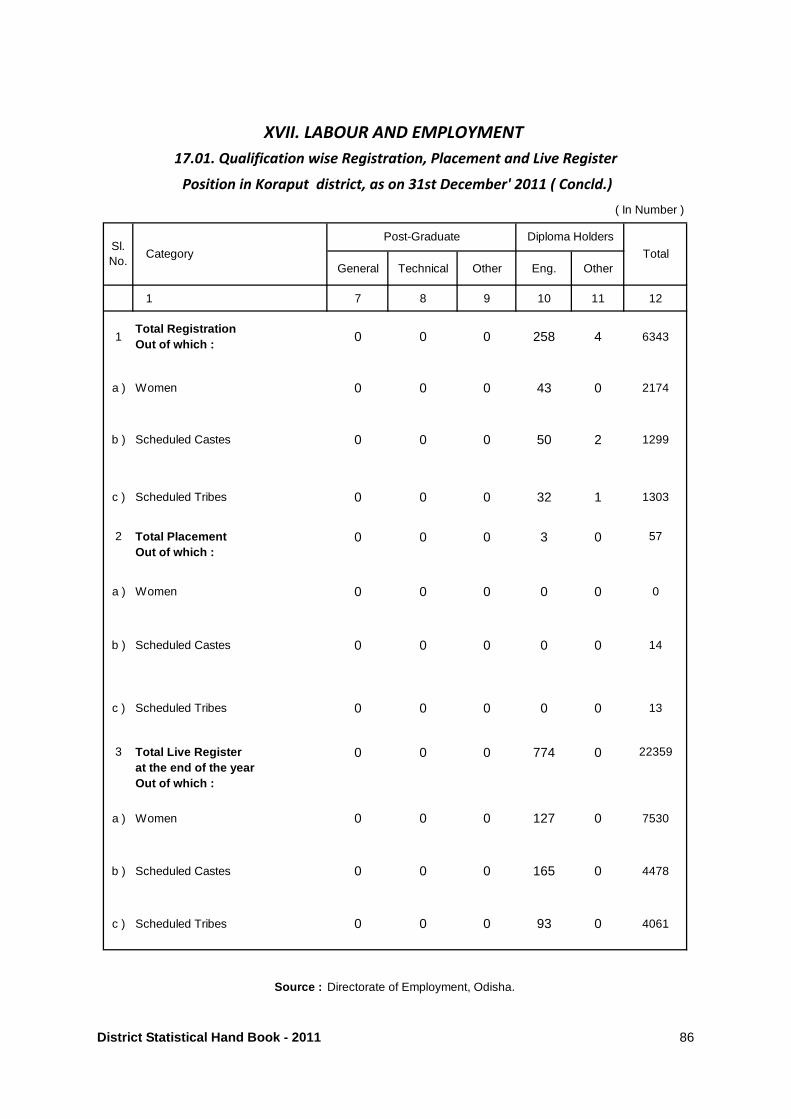
General Technical Other Eng. Other
1 7 8 9 10 11 12
1Total RegistrationOut of which :
0 0 0 258 4 6343
a ) Women 0 0 0 43 0 2174
b ) Scheduled Castes 0 0 0 50 2 1299
c ) Scheduled Tribes 0 0 0 32 1 1303
2 Total PlacementOut of which :
0 0 0 3 0 57
a ) Women 0 0 0 0 0 0
b ) Scheduled Castes 0 0 0 0 0 14
c ) Scheduled Tribes 0 0 0 0 0 13
3 Total Live Register at the end of the yearOut of which :
0 0 0 774 0 22359
a ) Women 0 0 0 127 0 7530
b ) Scheduled Castes 0 0 0 165 0 4478
c ) Scheduled Tribes 0 0 0 93 0 4061
Category
XVII. LABOUR AND EMPLOYMENT
17.01. Qualification wise Registration, Placement and Live Register
Position in Koraput district, as on 31st December' 2011 ( Concld.)
Sl.No.
Source : Directorate of Employment, Odisha.
( In Number )
Post-Graduate Diploma Holders
Total
District Statistical Hand Book - 2011 86
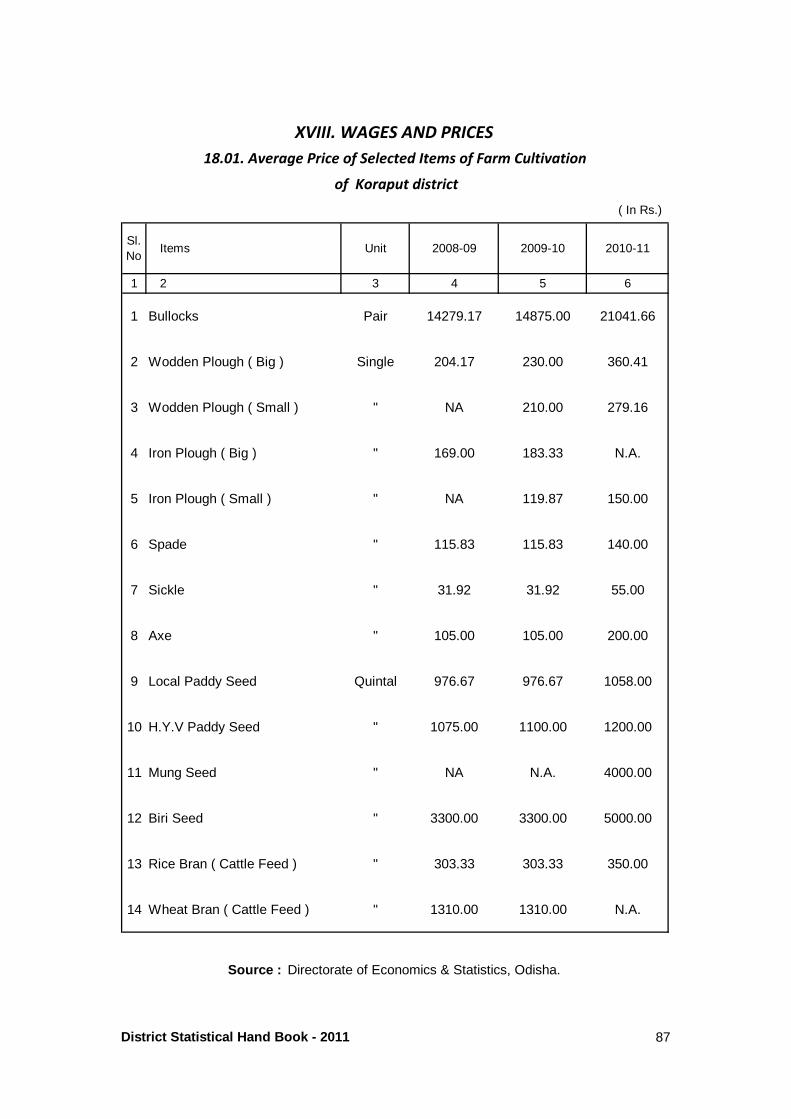
( In Rs.)
Sl.No
Items Unit 2008-09 2009-10 2010-11
1 2 3 4 5 6
1 Bullocks Pair 14279.17 14875.00 21041.66
2 Wodden Plough ( Big ) Single 204.17 230.00 360.41
3 Wodden Plough ( Small ) " NA 210.00 279.16
4 Iron Plough ( Big ) " 169.00 183.33 N.A.
5 Iron Plough ( Small ) " NA 119.87 150.00
6 Spade " 115.83 115.83 140.00
7 Sickle " 31.92 31.92 55.00
8 Axe " 105.00 105.00 200.00
9 Local Paddy Seed Quintal 976.67 976.67 1058.00
10 H.Y.V Paddy Seed " 1075.00 1100.00 1200.00
11 Mung Seed " NA N.A. 4000.00
12 Biri Seed " 3300.00 3300.00 5000.00
13 Rice Bran ( Cattle Feed ) " 303.33 303.33 350.00
14 Wheat Bran ( Cattle Feed ) " 1310.00 1310.00 N.A.
XVIII. WAGES AND PRICES
18.01. Average Price of Selected Items of Farm Cultivation
Source : Directorate of Economics & Statistics, Odisha.
of Koraput district
District Statistical Hand Book - 2011 87
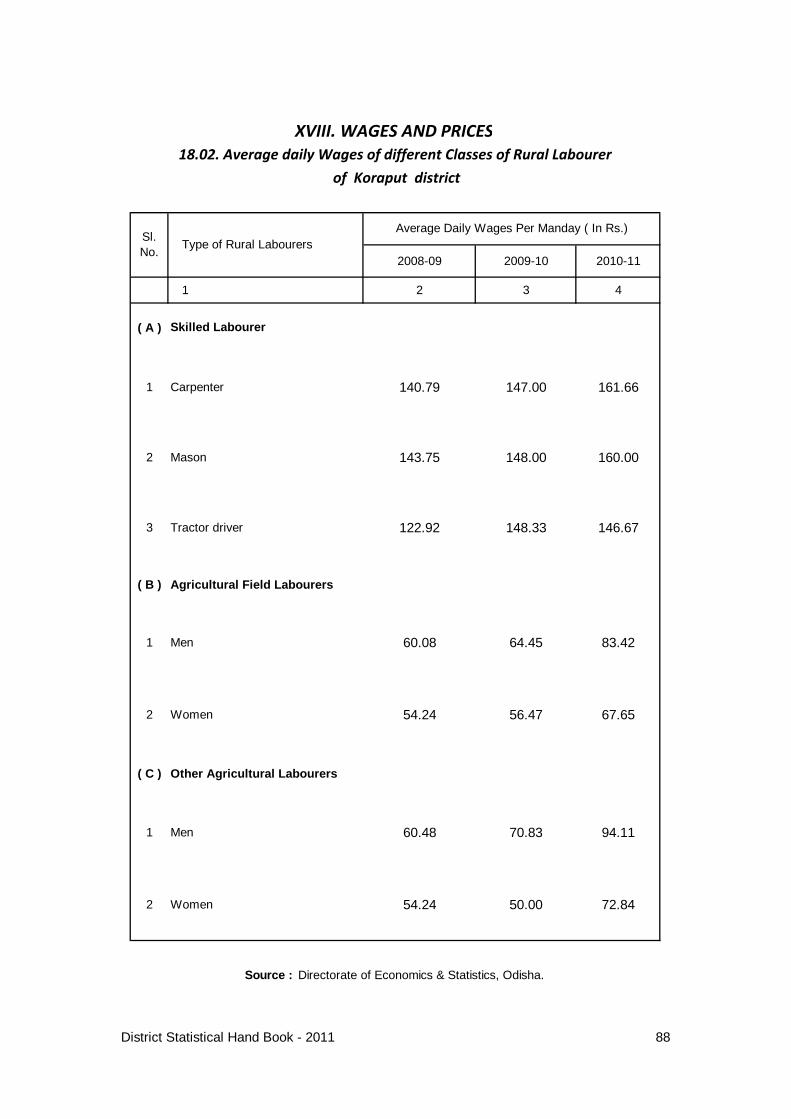
2008-09 2009-10 2010-11
1 2 3 4
( A )
1 Carpenter 140.79 147.00 161.66
2 Mason 143.75 148.00 160.00
3 Tractor driver 122.92 148.33 146.67
( B ) Agricultural Field Labourers
1 Men 60.08 64.45 83.42
2 Women 54.24 56.47 67.65
( C ) Other Agricultural Labourers
1 Men 60.48 70.83 94.11
2 Women 54.24 50.00 72.84
Source : Directorate of Economics & Statistics, Odisha.
Sl.No.
XVIII. WAGES AND PRICES
18.02. Average daily Wages of different Classes of Rural Labourer
of Koraput district
Average Daily Wages Per Manday ( In Rs.)Type of Rural Labourers
Skilled Labourer
District Statistical Hand Book - 2011 88
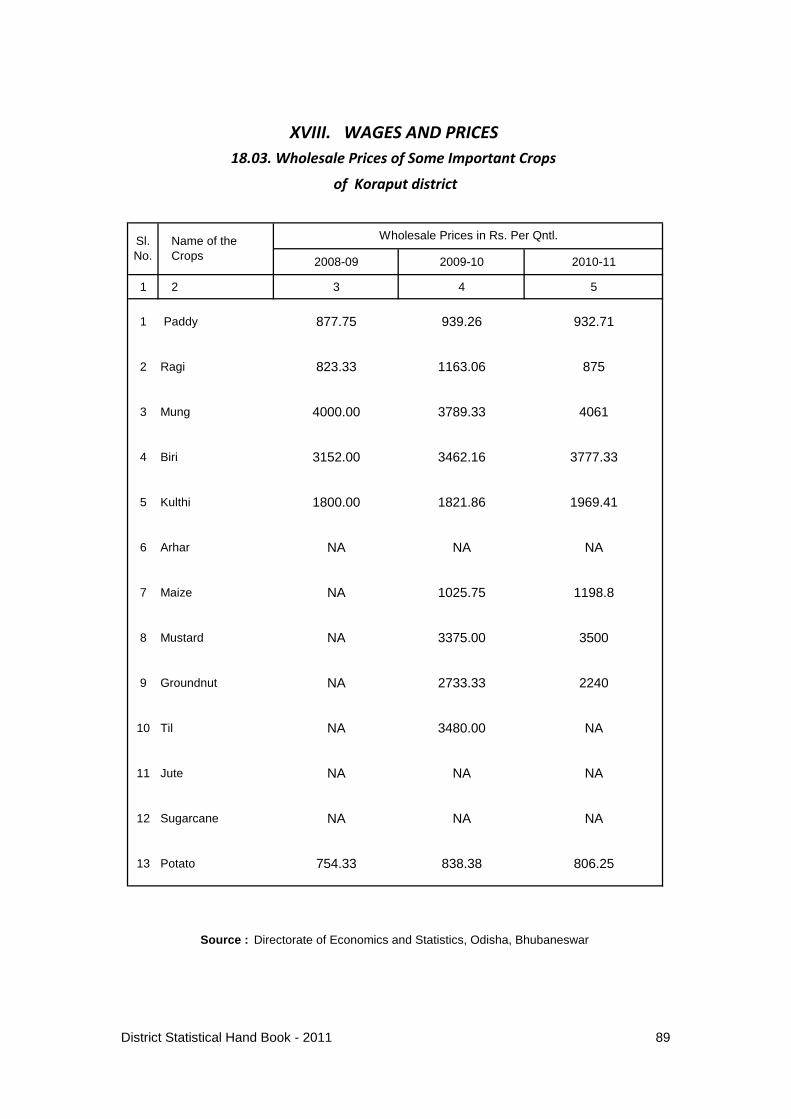
2008-09 2009-10 2010-11
1 2 3 4 5
1 Paddy 877.75 939.26 932.71
2 Ragi 823.33 1163.06 875
3 Mung 4000.00 3789.33 4061
4 Biri 3152.00 3462.16 3777.33
5 Kulthi 1800.00 1821.86 1969.41
6 Arhar NA NA NA
7 Maize NA 1025.75 1198.8
8 Mustard NA 3375.00 3500
9 Groundnut NA 2733.33 2240
10 Til NA 3480.00 NA
11 Jute NA NA NA
12 Sugarcane NA NA NA
13 Potato 754.33 838.38 806.25
XVIII. WAGES AND PRICES
18.03. Wholesale Prices of Some Important Crops
Wholesale Prices in Rs. Per Qntl.
of Koraput district
Name of theCrops
Sl.No.
Source : Directorate of Economics and Statistics, Odisha, Bhubaneswar
District Statistical Hand Book - 2011 89
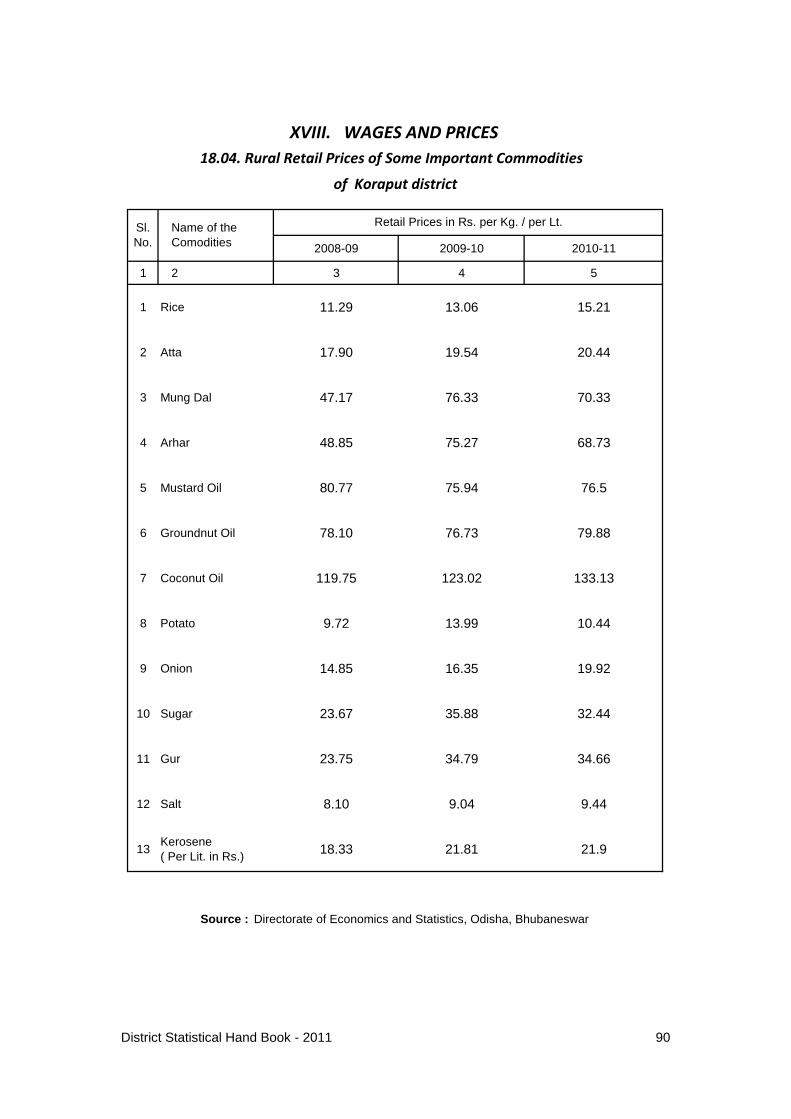
2008-09 2009-10 2010-11
1 2 3 4 5
1 Rice 11.29 13.06 15.21
2 Atta 17.90 19.54 20.44
3 Mung Dal 47.17 76.33 70.33
4 Arhar 48.85 75.27 68.73
5 Mustard Oil 80.77 75.94 76.5
6 Groundnut Oil 78.10 76.73 79.88
7 Coconut Oil 119.75 123.02 133.13
8 Potato 9.72 13.99 10.44
9 Onion 14.85 16.35 19.92
10 Sugar 23.67 35.88 32.44
11 Gur 23.75 34.79 34.66
12 Salt 8.10 9.04 9.44
13Kerosene ( Per Lit. in Rs.) 18.33 21.81 21.9
Retail Prices in Rs. per Kg. / per Lt.
of Koraput district
18.04. Rural Retail Prices of Some Important Commodities
XVIII. WAGES AND PRICES
Name of theComodities
Sl.No.
Source : Directorate of Economics and Statistics, Odisha, Bhubaneswar
District Statistical Hand Book - 2011 90
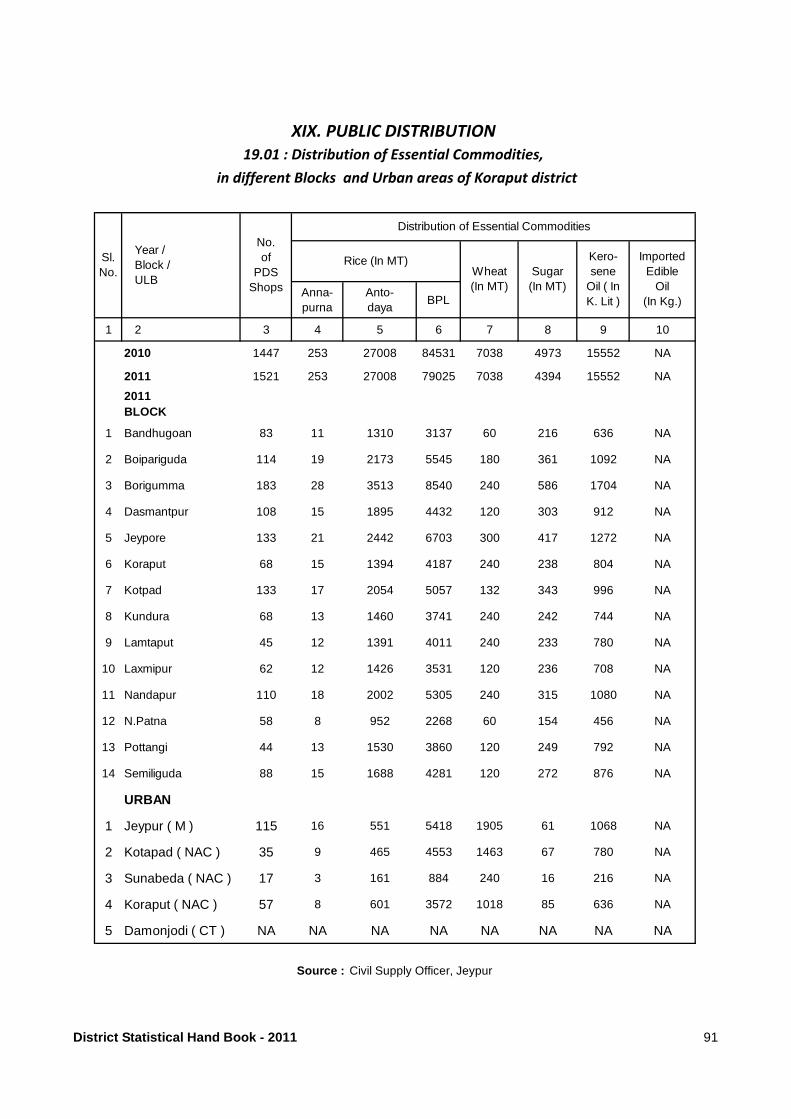
Anna-purna
Anto-daya
BPL
1 2 3 4 5 6 7 8 9 10
2010 1447 253 27008 84531 7038 4973 15552 NA
2011 1521 253 27008 79025 7038 4394 15552 NA
2011BLOCK
1 Bandhugoan 83 11 1310 3137 60 216 636 NA
2 Boipariguda 114 19 2173 5545 180 361 1092 NA
3 Borigumma 183 28 3513 8540 240 586 1704 NA
4 Dasmantpur 108 15 1895 4432 120 303 912 NA
5 Jeypore 133 21 2442 6703 300 417 1272 NA
6 Koraput 68 15 1394 4187 240 238 804 NA
7 Kotpad 133 17 2054 5057 132 343 996 NA
8 Kundura 68 13 1460 3741 240 242 744 NA
9 Lamtaput 45 12 1391 4011 240 233 780 NA
10 Laxmipur 62 12 1426 3531 120 236 708 NA
11 Nandapur 110 18 2002 5305 240 315 1080 NA
12 N.Patna 58 8 952 2268 60 154 456 NA
13 Pottangi 44 13 1530 3860 120 249 792 NA
14 Semiliguda 88 15 1688 4281 120 272 876 NA
URBAN
1 Jeypur ( M ) 115 16 551 5418 1905 61 1068 NA
2 Kotapad ( NAC ) 35 9 465 4553 1463 67 780 NA
3 Sunabeda ( NAC ) 17 3 161 884 240 16 216 NA
4 Koraput ( NAC ) 57 8 601 3572 1018 85 636 NA
5 Damonjodi ( CT ) NA NA NA NA NA NA NA NA
XIX. PUBLIC DISTRIBUTION
19.01 : Distribution of Essential Commodities,
in different Blocks and Urban areas of Koraput district
Rice (In MT)Sl.No.
No.of
PDSShops
Distribution of Essential Commodities
Year /Block /ULB
Wheat(In MT)
Sugar(In MT)
Kero-sene
Oil ( InK. Lit )
ImportedEdible
Oil(In Kg.)
Source : Civil Supply Officer, Jeypur
District Statistical Hand Book - 2011 91
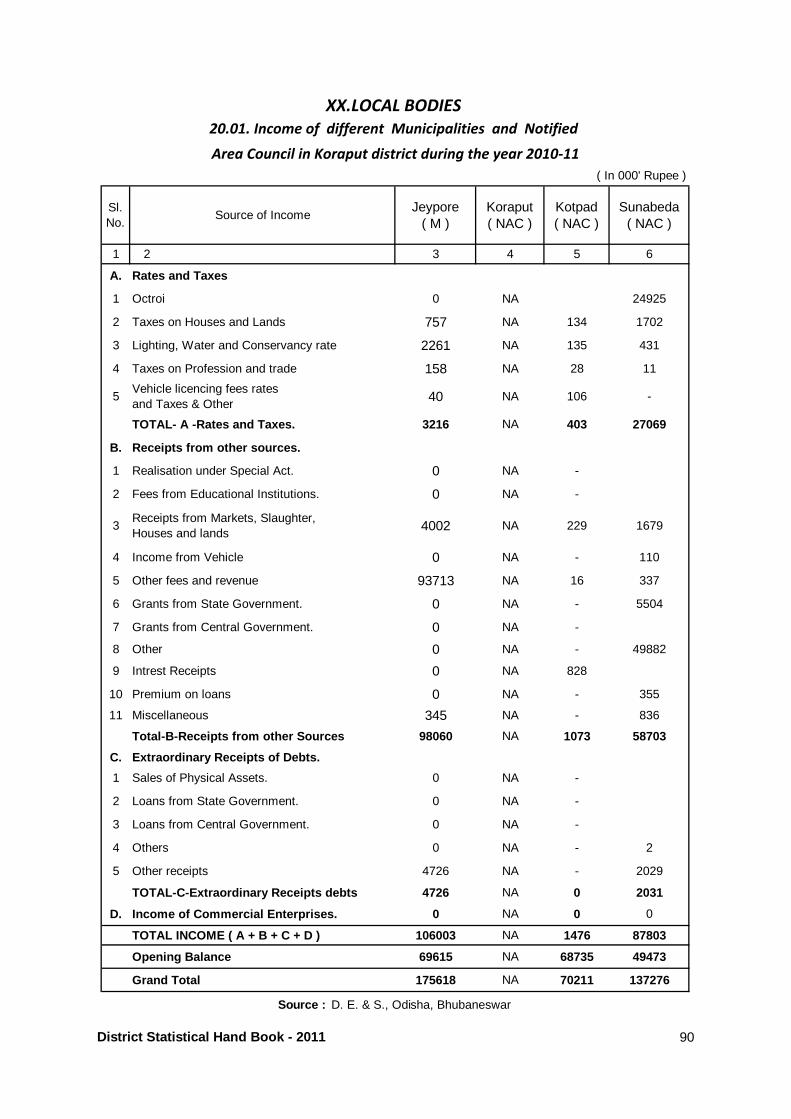
Sl. No.
Source of IncomeJeypore
( M )Koraput( NAC )
Kotpad( NAC )
Sunabeda( NAC )
1 2 3 4 5 6
A. Rates and Taxes
1 Octroi 0 NA 24925
2 Taxes on Houses and Lands 757 NA 134 1702
3 Lighting, Water and Conservancy rate 2261 NA 135 431
4 Taxes on Profession and trade 158 NA 28 11
5Vehicle licencing fees rates and Taxes & Other
40 NA 106 -
TOTAL- A -Rates and Taxes. 3216 NA 403 27069
B. Receipts from other sources.
1 Realisation under Special Act. 0 NA -
2 Fees from Educational Institutions. 0 NA -
3Receipts from Markets, Slaughter,Houses and lands
4002 NA 229 1679
4 Income from Vehicle 0 NA - 110
5 Other fees and revenue 93713 NA 16 337
6 Grants from State Government. 0 NA - 5504
7 Grants from Central Government. 0 NA -
8 Other 0 NA - 49882
9 Intrest Receipts 0 NA 828
10 Premium on loans 0 NA - 355
11 Miscellaneous 345 NA - 836
Total-B-Receipts from other Sources 98060 NA 1073 58703
C. Extraordinary Receipts of Debts.
1 Sales of Physical Assets. 0 NA -
2 Loans from State Government. 0 NA -
3 Loans from Central Government. 0 NA -
4 Others 0 NA - 2
5 Other receipts 4726 NA - 2029
TOTAL-C-Extraordinary Receipts debts 4726 NA 0 2031
D. Income of Commercial Enterprises. 0 NA 0 0
TOTAL INCOME ( A + B + C + D ) 106003 NA 1476 87803
Opening Balance 69615 NA 68735 49473
Grand Total 175618 NA 70211 137276
Source : D. E. & S., Odisha, Bhubaneswar
( In 000' Rupee )
XX.LOCAL BODIES
20.01. Income of different Municipalities and Notified
Area Council in Koraput district during the year 2010-11
District Statistical Hand Book - 2011 90
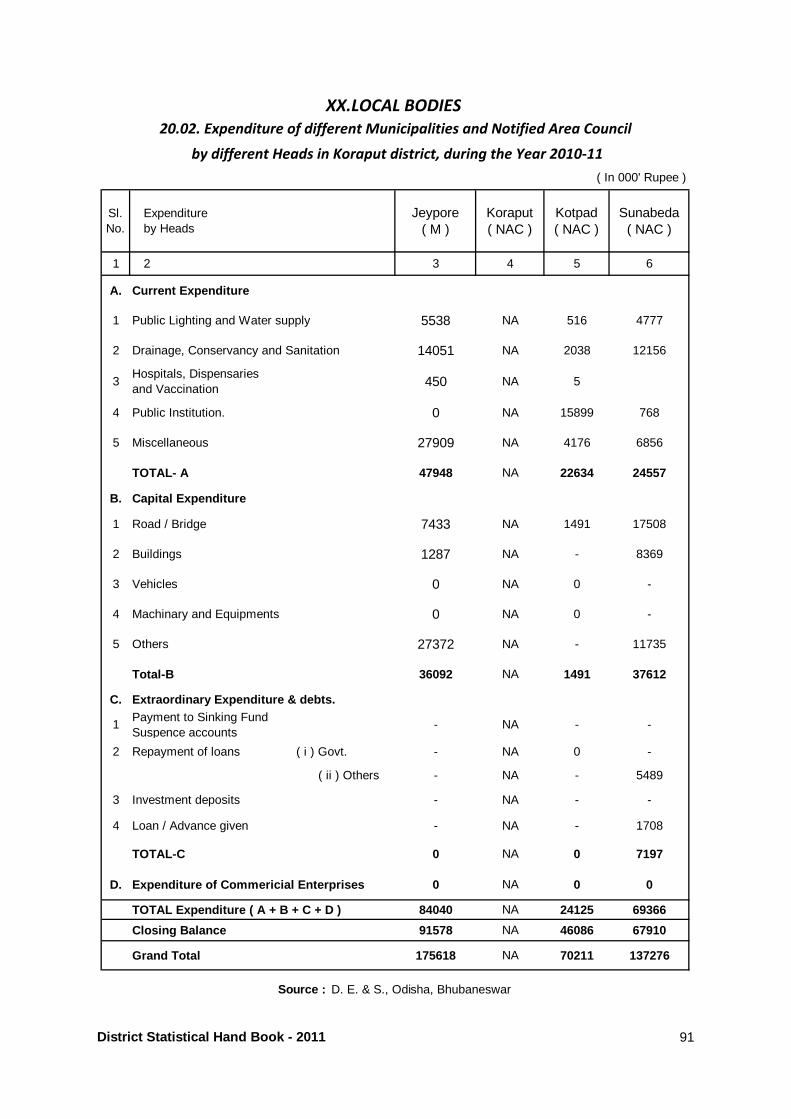
Sl. No.
Expenditureby Heads
Jeypore( M )
Koraput( NAC )
Kotpad( NAC )
Sunabeda( NAC )
1 2 3 4 5 6
A. Current Expenditure
1 Public Lighting and Water supply 5538 NA 516 4777
2 Drainage, Conservancy and Sanitation 14051 NA 2038 12156
3Hospitals, Dispensaries and Vaccination
450 NA 5
4 Public Institution. 0 NA 15899 768
5 Miscellaneous 27909 NA 4176 6856
TOTAL- A 47948 NA 22634 24557
B. Capital Expenditure
1 Road / Bridge 7433 NA 1491 17508
2 Buildings 1287 NA - 8369
3 Vehicles 0 NA 0 -
4 Machinary and Equipments 0 NA 0 -
5 Others 27372 NA - 11735
Total-B 36092 NA 1491 37612
C. Extraordinary Expenditure & debts.
1Payment to Sinking Fund Suspence accounts
- NA - -
2 Repayment of loans ( i ) Govt. - NA 0 -
( ii ) Others - NA - 5489
3 Investment deposits - NA - -
4 Loan / Advance given - NA - 1708
TOTAL-C 0 NA 0 7197
D. Expenditure of Commericial Enterprises 0 NA 0 0
TOTAL Expenditure ( A + B + C + D ) 84040 NA 24125 69366
Closing Balance 91578 NA 46086 67910
Grand Total 175618 NA 70211 137276
( In 000' Rupee )
Source : D. E. & S., Odisha, Bhubaneswar
20.02. Expenditure of different Municipalities and Notified Area Council
by different Heads in Koraput district, during the Year 2010-11
XX.LOCAL BODIES
District Statistical Hand Book - 2011 91
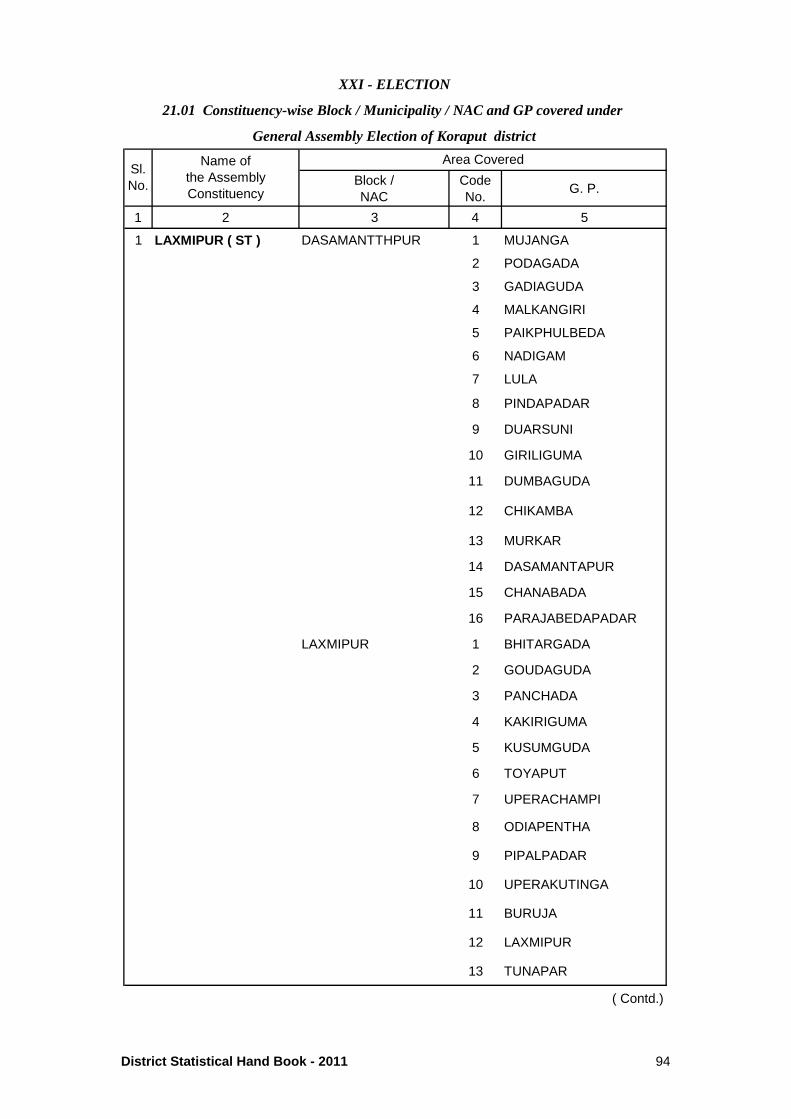
Block /NAC
CodeNo.
G. P.
1 2 3 4 5
1 LAXMIPUR ( ST ) DASAMANTTHPUR 1 MUJANGA
2 PODAGADA
3 GADIAGUDA
4 MALKANGIRI
5 PAIKPHULBEDA
6 NADIGAM
7 LULA
8 PINDAPADAR
9 DUARSUNI
10 GIRILIGUMA
11 DUMBAGUDA
12 CHIKAMBA
13 MURKAR
14 DASAMANTAPUR
15 CHANABADA
16 PARAJABEDAPADAR
LAXMIPUR 1 BHITARGADA
2 GOUDAGUDA
3 PANCHADA
4 KAKIRIGUMA
5 KUSUMGUDA
6 TOYAPUT
7 UPERACHAMPI
8 ODIAPENTHA
9 PIPALPADAR
10 UPERAKUTINGA
11 BURUJA
12 LAXMIPUR
13 TUNAPAR
( Contd.)
XXI - ELECTION
21.01 Constituency-wise Block / Municipality / NAC and GP covered under
General Assembly Election of Koraput district
Sl.No.
Name ofthe AssemblyConstituency
Area Covered
District Statistical Hand Book - 2011 94
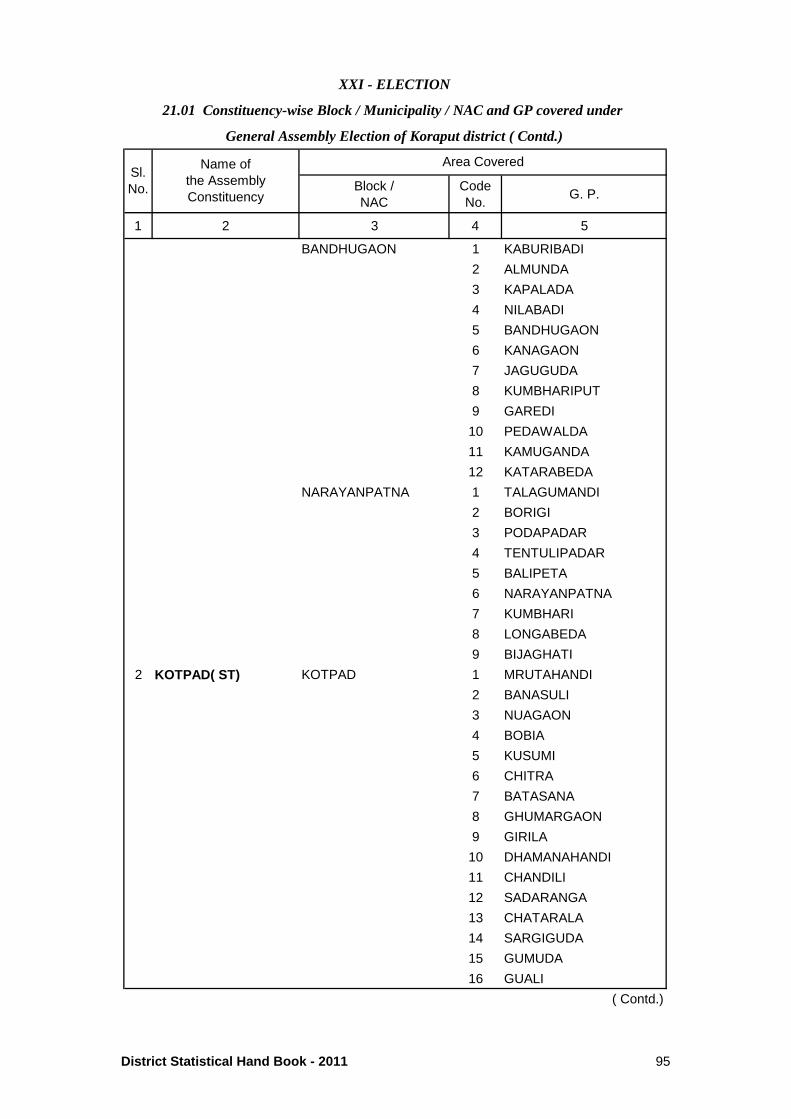
Block /NAC
CodeNo.
G. P.
1 2 3 4 5
BANDHUGAON 1 KABURIBADI
2 ALMUNDA
3 KAPALADA
4 NILABADI
5 BANDHUGAON
6 KANAGAON
7 JAGUGUDA
8 KUMBHARIPUT
9 GAREDI
10 PEDAWALDA
11 KAMUGANDA
12 KATARABEDA
NARAYANPATNA 1 TALAGUMANDI
2 BORIGI
3 PODAPADAR
4 TENTULIPADAR
5 BALIPETA
6 NARAYANPATNA
7 KUMBHARI
8 LONGABEDA
9 BIJAGHATI
2 KOTPAD( ST) KOTPAD 1 MRUTAHANDI
2 BANASULI
3 NUAGAON
4 BOBIA
5 KUSUMI
6 CHITRA
7 BATASANA
8 GHUMARGAON
9 GIRILA
10 DHAMANAHANDI
11 CHANDILI
12 SADARANGA
13 CHATARALA
14 SARGIGUDA
15 GUMUDA
16 GUALI
( Contd.)
XXI - ELECTION
21.01 Constituency-wise Block / Municipality / NAC and GP covered under
General Assembly Election of Koraput district ( Contd.)
Sl.No.
Name ofthe AssemblyConstituency
Area Covered
District Statistical Hand Book - 2011 95
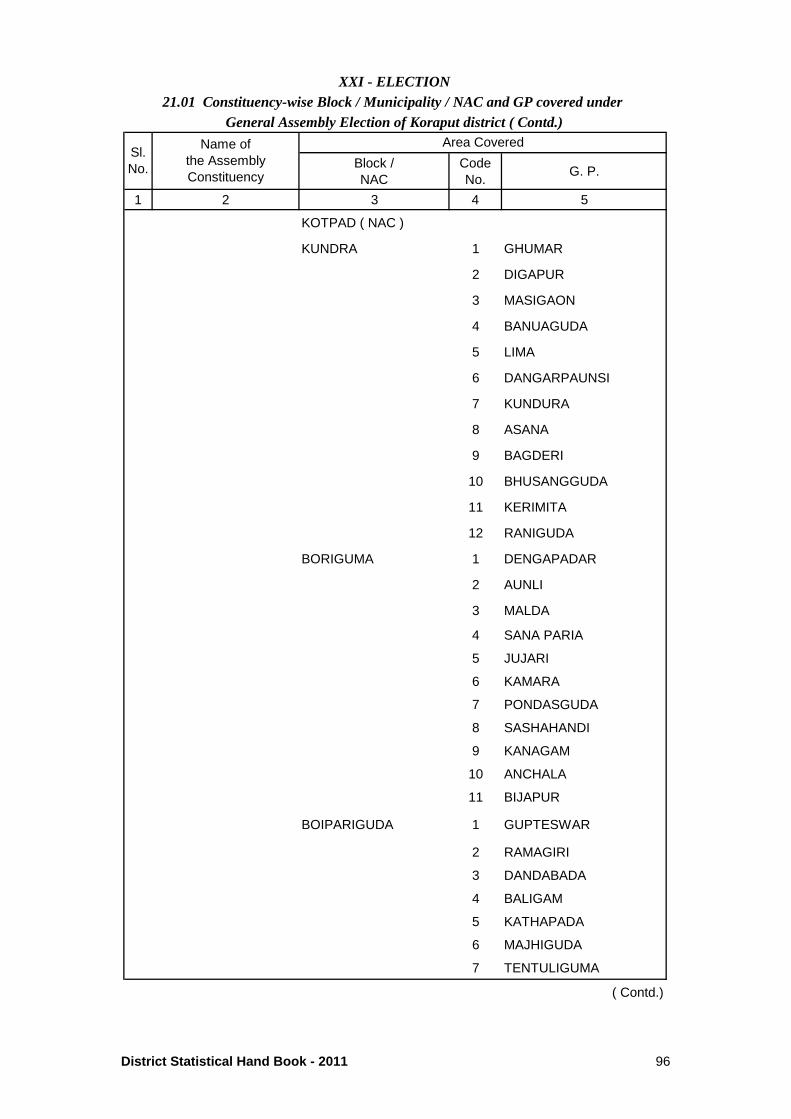
Block /NAC
CodeNo.
G. P.
1 2 3 4 5
KOTPAD ( NAC )
KUNDRA 1 GHUMAR
2 DIGAPUR
3 MASIGAON
4 BANUAGUDA
5 LIMA
6 DANGARPAUNSI
7 KUNDURA
8 ASANA
9 BAGDERI
10 BHUSANGGUDA
11 KERIMITA
12 RANIGUDA
BORIGUMA 1 DENGAPADAR
2 AUNLI
3 MALDA
4 SANA PARIA
5 JUJARI
6 KAMARA
7 PONDASGUDA
8 SASHAHANDI
9 KANAGAM
10 ANCHALA
11 BIJAPUR
BOIPARIGUDA 1 GUPTESWAR
2 RAMAGIRI
3 DANDABADA
4 BALIGAM
5 KATHAPADA
6 MAJHIGUDA
7 TENTULIGUMA
( Contd.)
XXI - ELECTION21.01 Constituency-wise Block / Municipality / NAC and GP covered under
General Assembly Election of Koraput district ( Contd.)
Sl.No.
Name ofthe AssemblyConstituency
Area Covered
District Statistical Hand Book - 2011 96
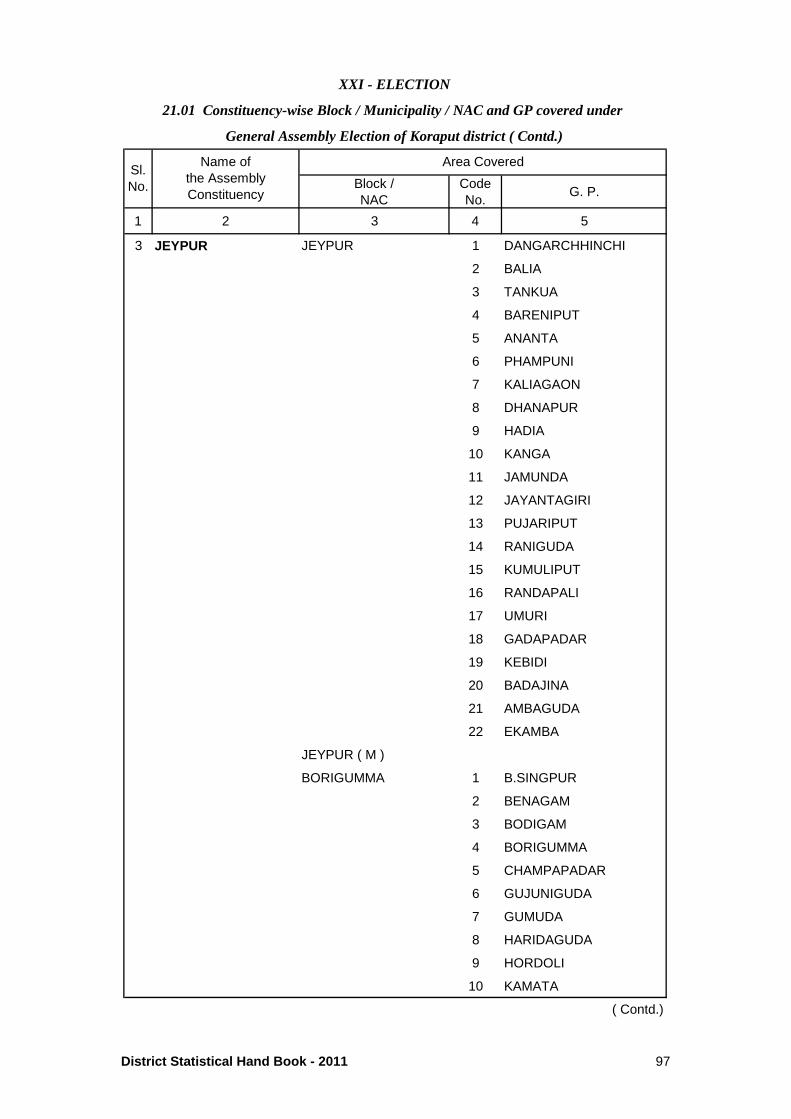
Block /NAC
CodeNo.
G. P.
1 2 3 4 5
3 JEYPUR JEYPUR 1 DANGARCHHINCHI
2 BALIA
3 TANKUA
4 BARENIPUT
5 ANANTA
6 PHAMPUNI
7 KALIAGAON
8 DHANAPUR
9 HADIA
10 KANGA
11 JAMUNDA
12 JAYANTAGIRI
13 PUJARIPUT
14 RANIGUDA
15 KUMULIPUT
16 RANDAPALI
17 UMURI
18 GADAPADAR
19 KEBIDI
20 BADAJINA
21 AMBAGUDA
22 EKAMBA
JEYPUR ( M )
BORIGUMMA 1 B.SINGPUR
2 BENAGAM
3 BODIGAM
4 BORIGUMMA
5 CHAMPAPADAR
6 GUJUNIGUDA
7 GUMUDA
8 HARIDAGUDA
9 HORDOLI
10 KAMATA
( Contd.)
XXI - ELECTION
21.01 Constituency-wise Block / Municipality / NAC and GP covered under
General Assembly Election of Koraput district ( Contd.)
Sl.No.
Name ofthe AssemblyConstituency
Area Covered
District Statistical Hand Book - 2011 97
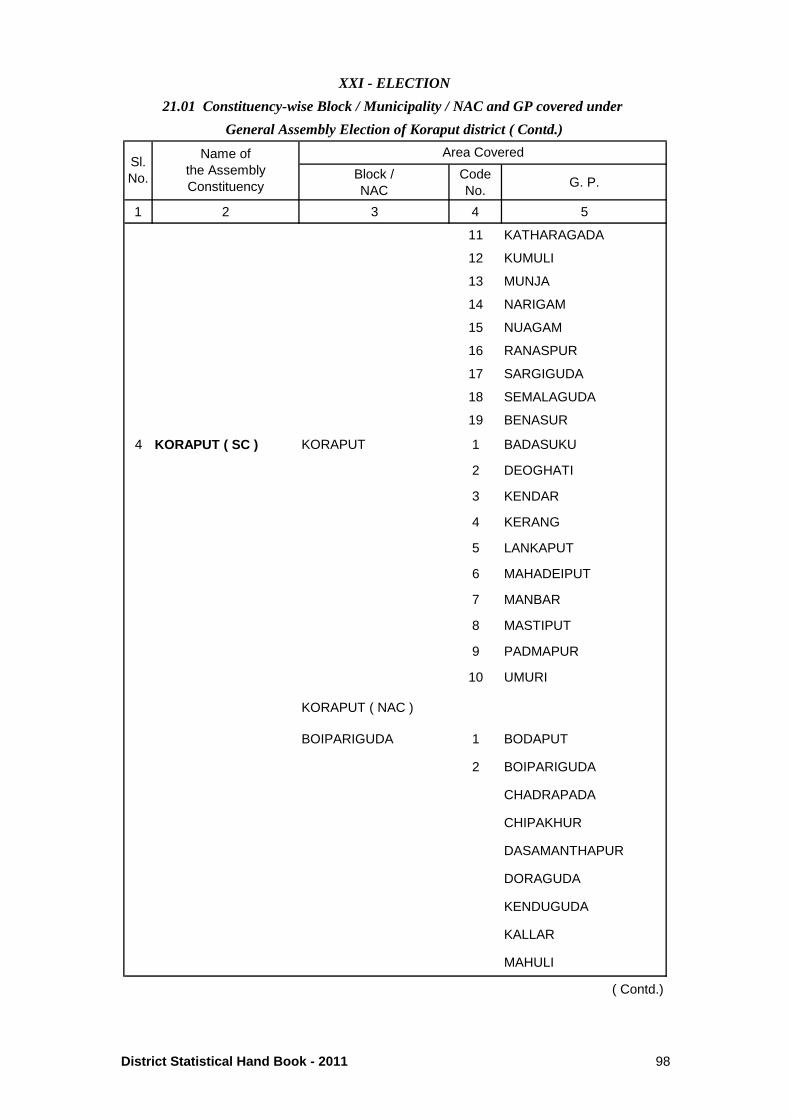
Block /NAC
CodeNo.
G. P.
1 2 3 4 5
11 KATHARAGADA
12 KUMULI
13 MUNJA
14 NARIGAM
15 NUAGAM
16 RANASPUR
17 SARGIGUDA
18 SEMALAGUDA
19 BENASUR
4 KORAPUT ( SC ) KORAPUT 1 BADASUKU
2 DEOGHATI
3 KENDAR
4 KERANG
5 LANKAPUT
6 MAHADEIPUT
7 MANBAR
8 MASTIPUT
9 PADMAPUR
10 UMURI
KORAPUT ( NAC )
BOIPARIGUDA 1 BODAPUT
2 BOIPARIGUDA
CHADRAPADA
CHIPAKHUR
DASAMANTHAPUR
DORAGUDA
KENDUGUDA
KALLAR
MAHULI
( Contd.)
XXI - ELECTION
21.01 Constituency-wise Block / Municipality / NAC and GP covered under
General Assembly Election of Koraput district ( Contd.)
Sl.No.
Name ofthe AssemblyConstituency
Area Covered
District Statistical Hand Book - 2011 98
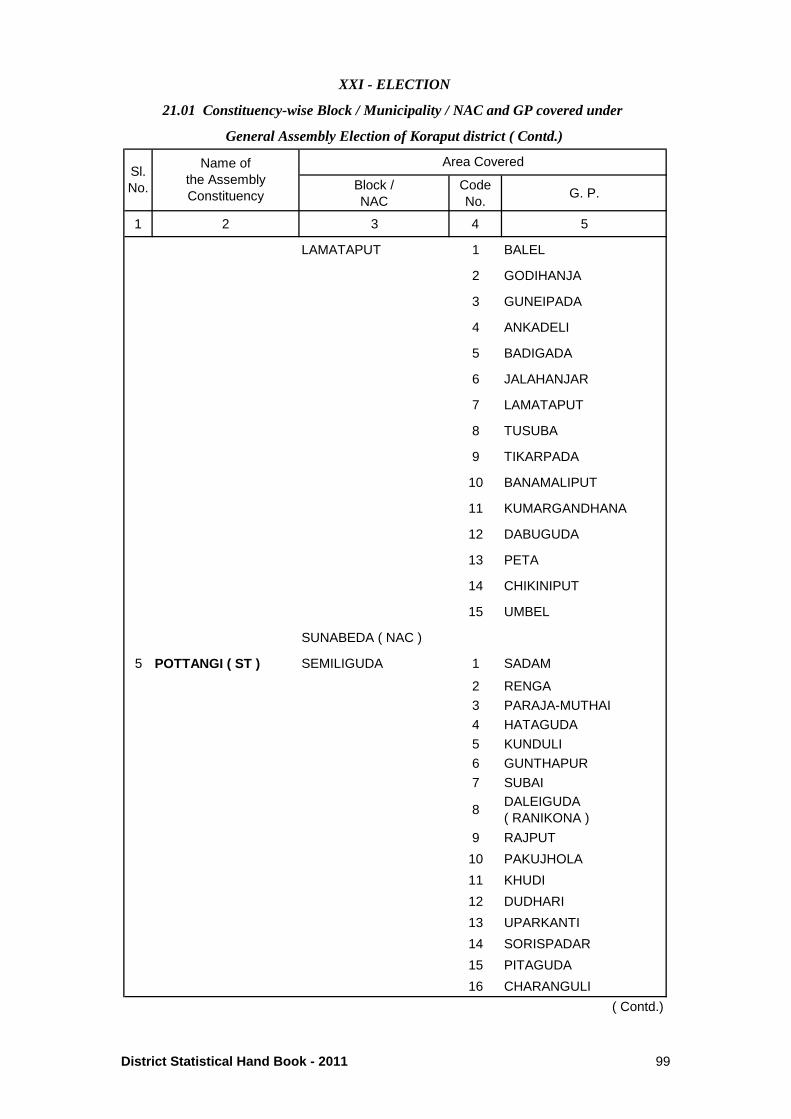
Block /NAC
CodeNo.
G. P.
1 2 3 4 5
LAMATAPUT 1 BALEL
2 GODIHANJA
3 GUNEIPADA
4 ANKADELI
5 BADIGADA
6 JALAHANJAR
7 LAMATAPUT
8 TUSUBA
9 TIKARPADA
10 BANAMALIPUT
11 KUMARGANDHANA
12 DABUGUDA
13 PETA
14 CHIKINIPUT
15 UMBEL
SUNABEDA ( NAC )
5 POTTANGI ( ST ) SEMILIGUDA 1 SADAM
2 RENGA
3 PARAJA-MUTHAI
4 HATAGUDA
5 KUNDULI
6 GUNTHAPUR
7 SUBAI
8DALEIGUDA( RANIKONA )
9 RAJPUT
10 PAKUJHOLA
11 KHUDI
12 DUDHARI
13 UPARKANTI
14 SORISPADAR
15 PITAGUDA
16 CHARANGULI
( Contd.)
XXI - ELECTION
21.01 Constituency-wise Block / Municipality / NAC and GP covered under
General Assembly Election of Koraput district ( Contd.)
Sl.No.
Name ofthe AssemblyConstituency
Area Covered
District Statistical Hand Book - 2011 99
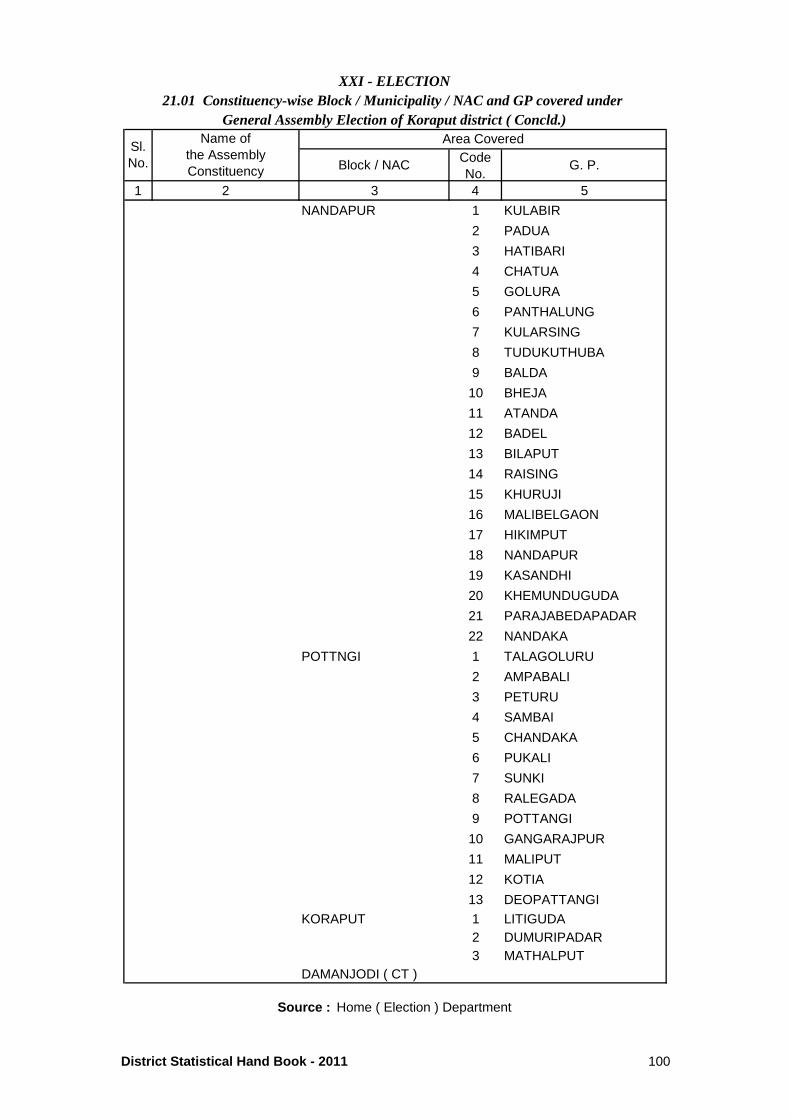
Block / NACCodeNo.
G. P.
1 2 3 4 5
NANDAPUR 1 KULABIR
2 PADUA
3 HATIBARI
4 CHATUA
5 GOLURA
6 PANTHALUNG
7 KULARSING
8 TUDUKUTHUBA
9 BALDA
10 BHEJA
11 ATANDA
12 BADEL
13 BILAPUT
14 RAISING
15 KHURUJI
16 MALIBELGAON
17 HIKIMPUT
18 NANDAPUR
19 KASANDHI
20 KHEMUNDUGUDA
21 PARAJABEDAPADAR
22 NANDAKA
POTTNGI 1 TALAGOLURU
2 AMPABALI
3 PETURU
4 SAMBAI
5 CHANDAKA
6 PUKALI
7 SUNKI
8 RALEGADA
9 POTTANGI
10 GANGARAJPUR
11 MALIPUT
12 KOTIA
13 DEOPATTANGI
KORAPUT 1 LITIGUDA2 DUMURIPADAR3 MATHALPUT
DAMANJODI ( CT )
Source : Home ( Election ) Department
XXI - ELECTION21.01 Constituency-wise Block / Municipality / NAC and GP covered under
General Assembly Election of Koraput district ( Concld.)
Sl.No.
Name ofthe AssemblyConstituency
Area Covered
District Statistical Hand Book - 2011 100
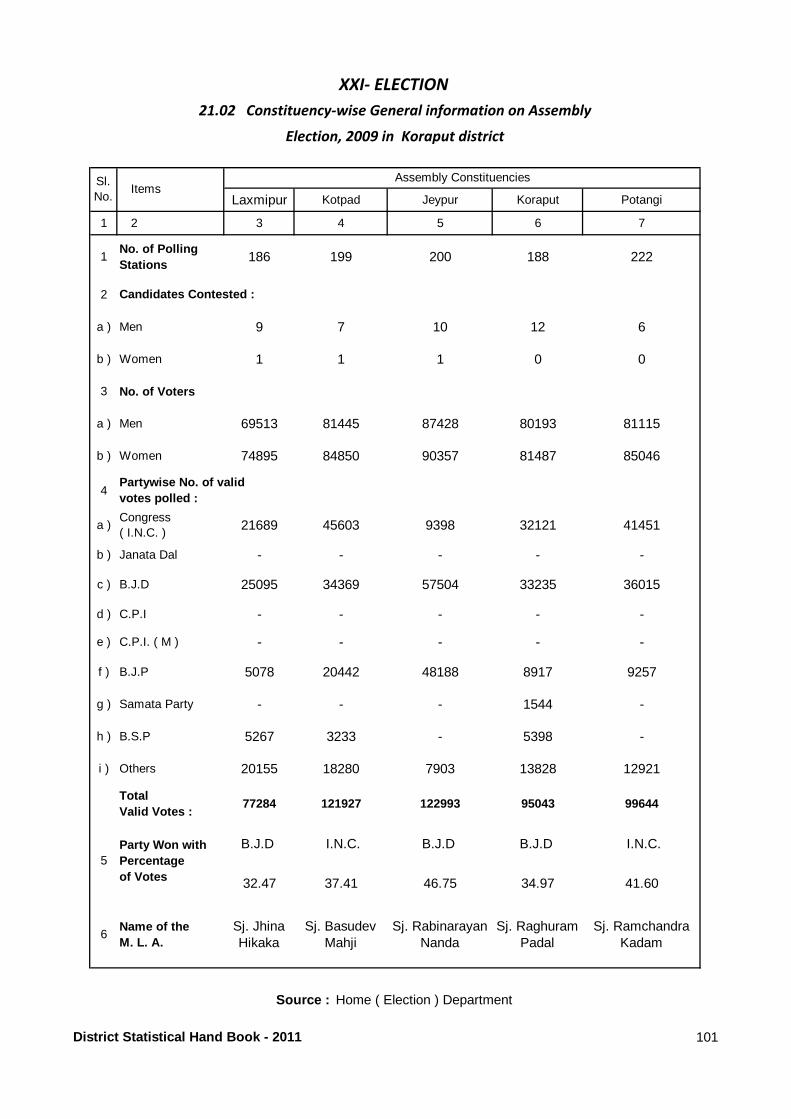
Laxmipur Kotpad Jeypur Koraput Potangi
1 2 3 4 5 6 7
1No. of Polling Stations
186 199 200 188 222
2
a ) Men 9 7 10 12 6
b ) Women 1 1 1 0 0
3 No. of Voters
a ) Men 69513 81445 87428 80193 81115
b ) Women 74895 84850 90357 81487 85046
4
a )Congress( I.N.C. )
21689 45603 9398 32121 41451
b ) Janata Dal - - - - -
c ) B.J.D 25095 34369 57504 33235 36015
d ) C.P.I - - - - -
e ) C.P.I. ( M ) - - - - -
f ) B.J.P 5078 20442 48188 8917 9257
g ) Samata Party - - - 1544 -
h ) B.S.P 5267 3233 - 5398 -
i ) Others 20155 18280 7903 13828 12921
Total Valid Votes :
77284 121927 122993 95043 99644
B.J.D I.N.C. B.J.D B.J.D I.N.C.
32.47 37.41 46.75 34.97 41.60
6Name of the M. L. A.
Sj. JhinaHikaka
Sj. Basudev Mahji
Sj. RabinarayanNanda
Sj. RaghuramPadal
Sj. RamchandraKadam
ItemsSl.No.
Source : Home ( Election ) Department
XXI- ELECTION
21.02 Constituency-wise General information on Assembly
Election, 2009 in Koraput district
Assembly Constituencies
Party Won withPercentageof Votes
5
Candidates Contested :
Partywise No. of validvotes polled :
District Statistical Hand Book - 2011 101
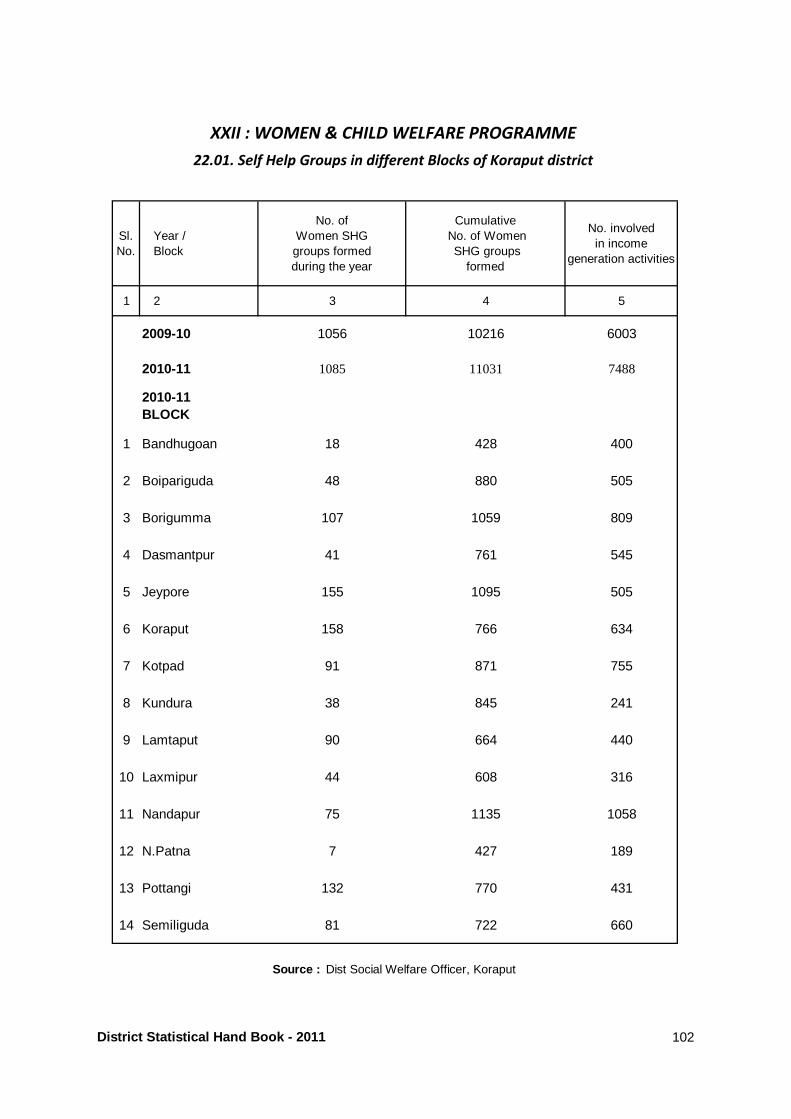
Sl.No.
Year /Block
No. ofWomen SHGgroups formed during the year
Cumulative No. of Women SHG groups
formed
No. involvedin income
generation activities
1 2 3 4 5
2009-10 1056 10216 6003
2010-11 1085 11031 7488
2010-11BLOCK
1 Bandhugoan 18 428 400
2 Boipariguda 48 880 505
3 Borigumma 107 1059 809
4 Dasmantpur 41 761 545
5 Jeypore 155 1095 505
6 Koraput 158 766 634
7 Kotpad 91 871 755
8 Kundura 38 845 241
9 Lamtaput 90 664 440
10 Laxmipur 44 608 316
11 Nandapur 75 1135 1058
12 N.Patna 7 427 189
13 Pottangi 132 770 431
14 Semiliguda 81 722 660
XXII : WOMEN & CHILD WELFARE PROGRAMME
22.01. Self Help Groups in different Blocks of Koraput district
Source : Dist Social Welfare Officer, Koraput
District Statistical Hand Book - 2011 102
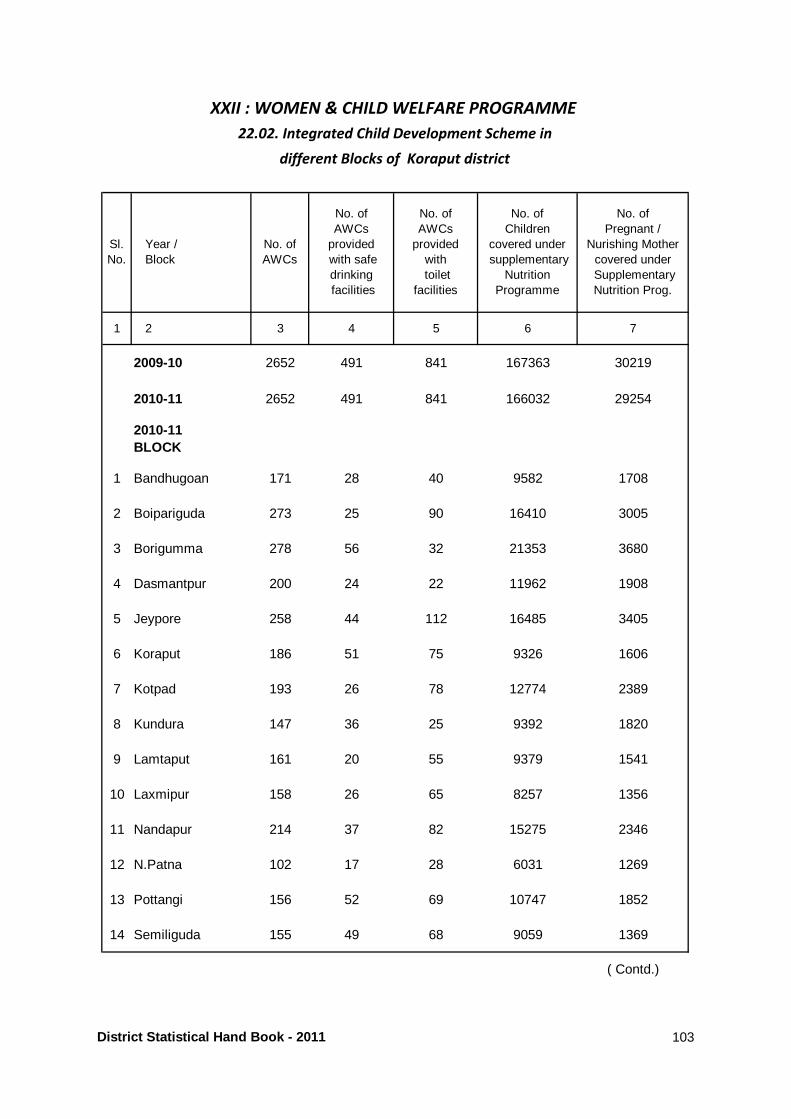
1 2 3 4 5 6 7
2009-10 2652 491 841 167363 30219
2010-11 2652 491 841 166032 29254
2010-11BLOCK
1 Bandhugoan 171 28 40 9582 1708
2 Boipariguda 273 25 90 16410 3005
3 Borigumma 278 56 32 21353 3680
4 Dasmantpur 200 24 22 11962 1908
5 Jeypore 258 44 112 16485 3405
6 Koraput 186 51 75 9326 1606
7 Kotpad 193 26 78 12774 2389
8 Kundura 147 36 25 9392 1820
9 Lamtaput 161 20 55 9379 1541
10 Laxmipur 158 26 65 8257 1356
11 Nandapur 214 37 82 15275 2346
12 N.Patna 102 17 28 6031 1269
13 Pottangi 156 52 69 10747 1852
14 Semiliguda 155 49 68 9059 1369
( Contd.)
No. ofAWCs
provided with safe drinking facilities
Year /Block
No. ofAWCs
No. ofAWCs
provided with
toiletfacilities
XXII : WOMEN & CHILD WELFARE PROGRAMME
No. of Pregnant /
Nurishing Mother covered under
Supplementary Nutrition Prog.
Sl.No.
22.02. Integrated Child Development Scheme in
different Blocks of Koraput district
No. ofChildren
covered under supplementary
Nutrition Programme
District Statistical Hand Book - 2011 103
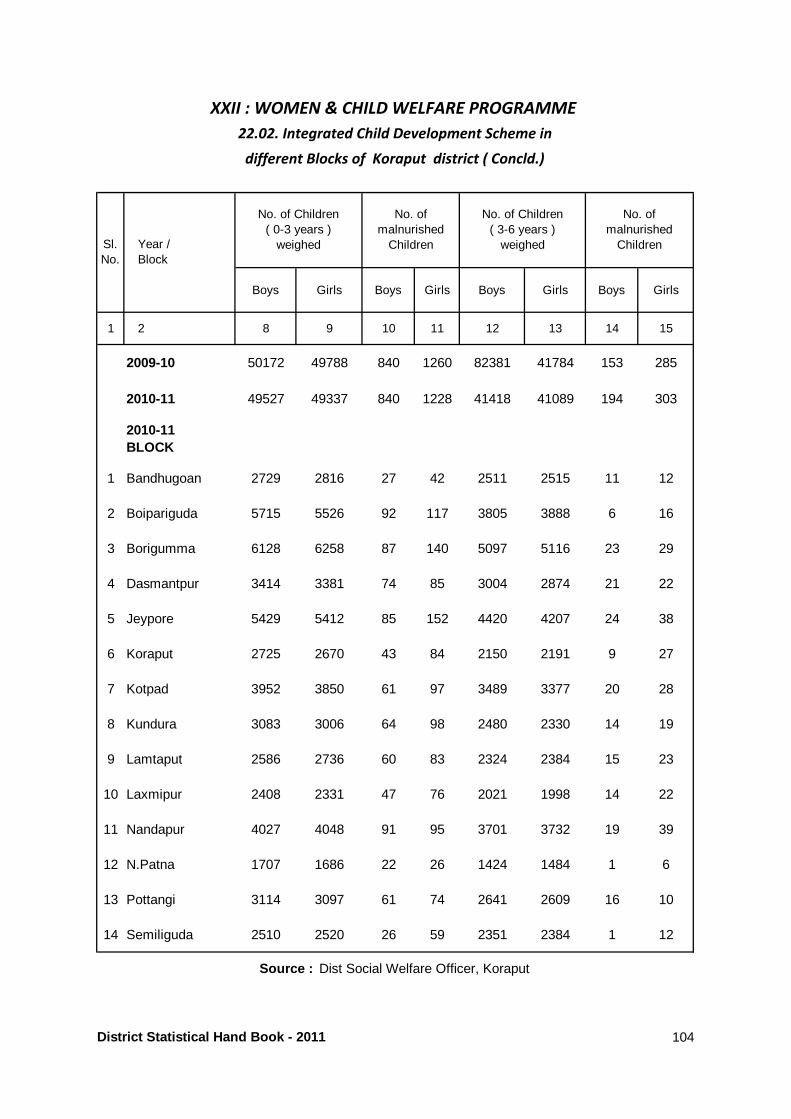
Boys Girls Boys Girls Boys Girls Boys Girls
1 2 8 9 10 11 12 13 14 15
2009-10 50172 49788 840 1260 82381 41784 153 285
2010-11 49527 49337 840 1228 41418 41089 194 303
2010-11BLOCK
1 Bandhugoan 2729 2816 27 42 2511 2515 11 12
2 Boipariguda 5715 5526 92 117 3805 3888 6 16
3 Borigumma 6128 6258 87 140 5097 5116 23 29
4 Dasmantpur 3414 3381 74 85 3004 2874 21 22
5 Jeypore 5429 5412 85 152 4420 4207 24 38
6 Koraput 2725 2670 43 84 2150 2191 9 27
7 Kotpad 3952 3850 61 97 3489 3377 20 28
8 Kundura 3083 3006 64 98 2480 2330 14 19
9 Lamtaput 2586 2736 60 83 2324 2384 15 23
10 Laxmipur 2408 2331 47 76 2021 1998 14 22
11 Nandapur 4027 4048 91 95 3701 3732 19 39
12 N.Patna 1707 1686 22 26 1424 1484 1 6
13 Pottangi 3114 3097 61 74 2641 2609 16 10
14 Semiliguda 2510 2520 26 59 2351 2384 1 12
No. ofmalnurished
Children
No. ofmalnurished
Children
No. of Children( 3-6 years )
weighedSl.No.
Source : Dist Social Welfare Officer, Koraput
XXII : WOMEN & CHILD WELFARE PROGRAMME
different Blocks of Koraput district ( Concld.)
Year /Block
No. of Children( 0-3 years )
weighed
22.02. Integrated Child Development Scheme in
District Statistical Hand Book - 2011 104
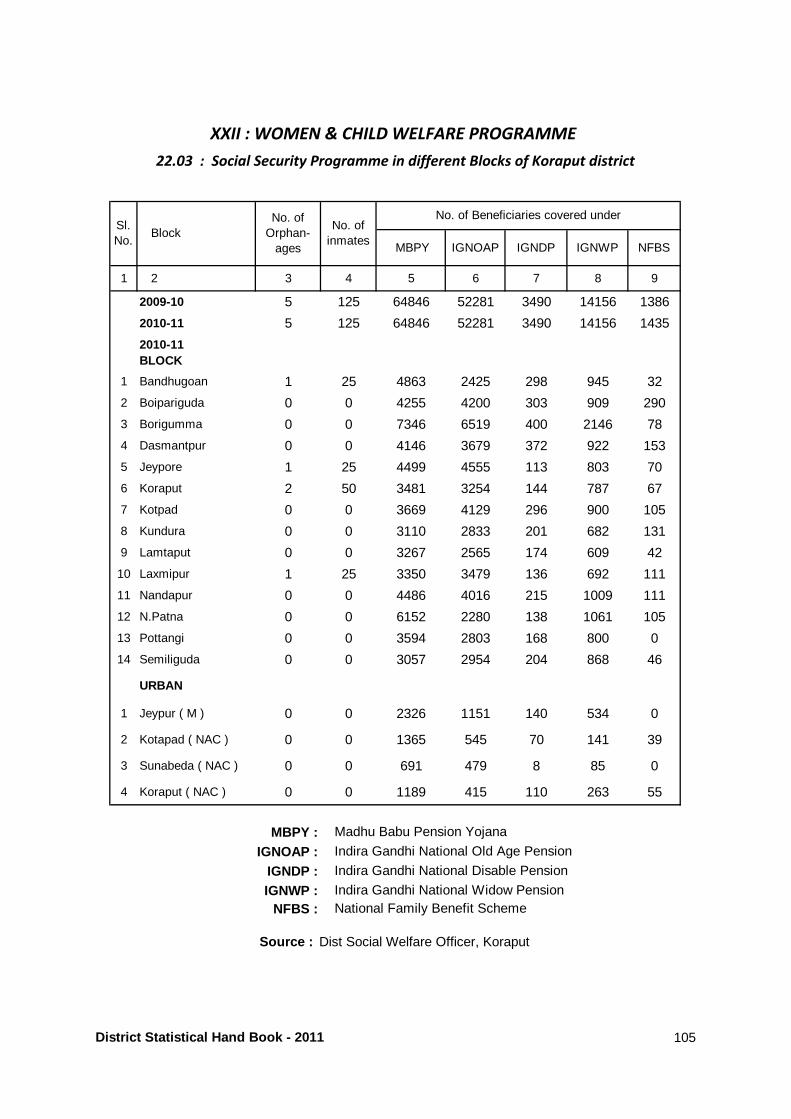
MBPY IGNOAP IGNDP IGNWP NFBS
1 2 3 4 5 6 7 8 9
2009-10 5 125 64846 52281 3490 14156 1386
2010-11 5 125 64846 52281 3490 14156 1435
2010-11BLOCK
1 Bandhugoan 1 25 4863 2425 298 945 32
2 Boipariguda 0 0 4255 4200 303 909 290
3 Borigumma 0 0 7346 6519 400 2146 78
4 Dasmantpur 0 0 4146 3679 372 922 153
5 Jeypore 1 25 4499 4555 113 803 70
6 Koraput 2 50 3481 3254 144 787 67
7 Kotpad 0 0 3669 4129 296 900 105
8 Kundura 0 0 3110 2833 201 682 131
9 Lamtaput 0 0 3267 2565 174 609 42
10 Laxmipur 1 25 3350 3479 136 692 111
11 Nandapur 0 0 4486 4016 215 1009 111
12 N.Patna 0 0 6152 2280 138 1061 105
13 Pottangi 0 0 3594 2803 168 800 0
14 Semiliguda 0 0 3057 2954 204 868 46
URBAN
1 Jeypur ( M ) 0 0 2326 1151 140 534 0
2 Kotapad ( NAC ) 0 0 1365 545 70 141 39
3 Sunabeda ( NAC ) 0 0 691 479 8 85 0
4 Koraput ( NAC ) 0 0 1189 415 110 263 55
MBPY :IGNOAP :
IGNDP :IGNWP :
NFBS :
Source : Dist Social Welfare Officer, Koraput
National Family Benefit Scheme
Indira Gandhi National Old Age Pension
Indira Gandhi National Disable Pension
Indira Gandhi National Widow Pension
Madhu Babu Pension Yojana
XXII : WOMEN & CHILD WELFARE PROGRAMME
22.03 : Social Security Programme in different Blocks of Koraput district
No. of Beneficiaries covered underNo. ofOrphan-
ages
No. ofinmates
BlockSl.No.
District Statistical Hand Book - 2011 105
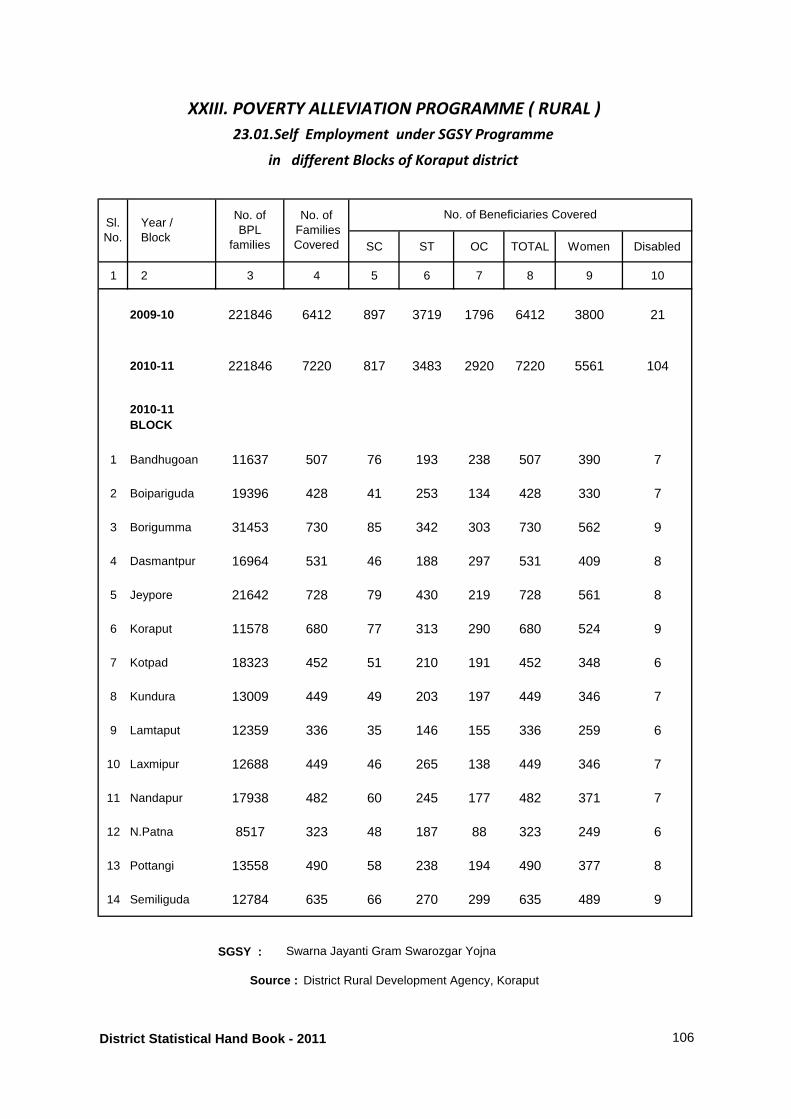
SC ST OC TOTAL Women Disabled
1 2 3 4 5 6 7 8 9 10
2009-10 221846 6412 897 3719 1796 6412 3800 21
2010-11 221846 7220 817 3483 2920 7220 5561 104
2010-11BLOCK
1 Bandhugoan 11637 507 76 193 238 507 390 7
2 Boipariguda 19396 428 41 253 134 428 330 7
3 Borigumma 31453 730 85 342 303 730 562 9
4 Dasmantpur 16964 531 46 188 297 531 409 8
5 Jeypore 21642 728 79 430 219 728 561 8
6 Koraput 11578 680 77 313 290 680 524 9
7 Kotpad 18323 452 51 210 191 452 348 6
8 Kundura 13009 449 49 203 197 449 346 7
9 Lamtaput 12359 336 35 146 155 336 259 6
10 Laxmipur 12688 449 46 265 138 449 346 7
11 Nandapur 17938 482 60 245 177 482 371 7
12 N.Patna 8517 323 48 187 88 323 249 6
13 Pottangi 13558 490 58 238 194 490 377 8
14 Semiliguda 12784 635 66 270 299 635 489 9
SGSY :
Source : District Rural Development Agency, Koraput
Swarna Jayanti Gram Swarozgar Yojna
Sl.No.
Year /Block
No. of BPL
families
No. of Families Covered
XXIII. POVERTY ALLEVIATION PROGRAMME ( RURAL )
23.01.Self Employment under SGSY Programme
in different Blocks of Koraput district
No. of Beneficiaries Covered
District Statistical Hand Book - 2011 106
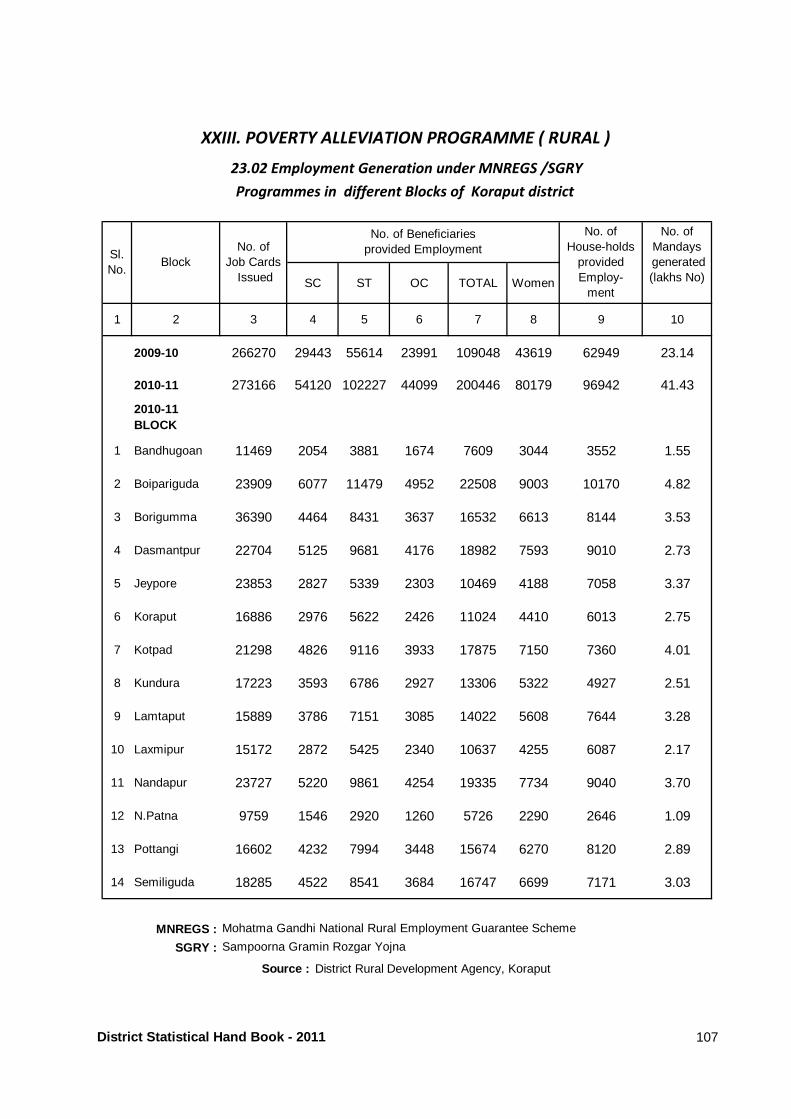
SC ST OC TOTAL Women
1 2 3 4 5 6 7 8 9 10
2009-10 266270 29443 55614 23991 109048 43619 62949 23.14
2010-11 273166 54120 102227 44099 200446 80179 96942 41.43
2010-11BLOCK
1 Bandhugoan 11469 2054 3881 1674 7609 3044 3552 1.55
2 Boipariguda 23909 6077 11479 4952 22508 9003 10170 4.82
3 Borigumma 36390 4464 8431 3637 16532 6613 8144 3.53
4 Dasmantpur 22704 5125 9681 4176 18982 7593 9010 2.73
5 Jeypore 23853 2827 5339 2303 10469 4188 7058 3.37
6 Koraput 16886 2976 5622 2426 11024 4410 6013 2.75
7 Kotpad 21298 4826 9116 3933 17875 7150 7360 4.01
8 Kundura 17223 3593 6786 2927 13306 5322 4927 2.51
9 Lamtaput 15889 3786 7151 3085 14022 5608 7644 3.28
10 Laxmipur 15172 2872 5425 2340 10637 4255 6087 2.17
11 Nandapur 23727 5220 9861 4254 19335 7734 9040 3.70
12 N.Patna 9759 1546 2920 1260 5726 2290 2646 1.09
13 Pottangi 16602 4232 7994 3448 15674 6270 8120 2.89
14 Semiliguda 18285 4522 8541 3684 16747 6699 7171 3.03
MNREGS :
SGRY :
Source : District Rural Development Agency, Koraput
No. ofJob Cards
Issued
Mohatma Gandhi National Rural Employment Guarantee Scheme
Sampoorna Gramin Rozgar Yojna
No. of Mandays
generated (lakhs No)
XXIII. POVERTY ALLEVIATION PROGRAMME ( RURAL )
No. of House-holds
providedEmploy-
ment
Sl.No.
Block
No. of Beneficiariesprovided Employment
23.02 Employment Generation under MNREGS /SGRY
Programmes in different Blocks of Koraput district
District Statistical Hand Book - 2011 107
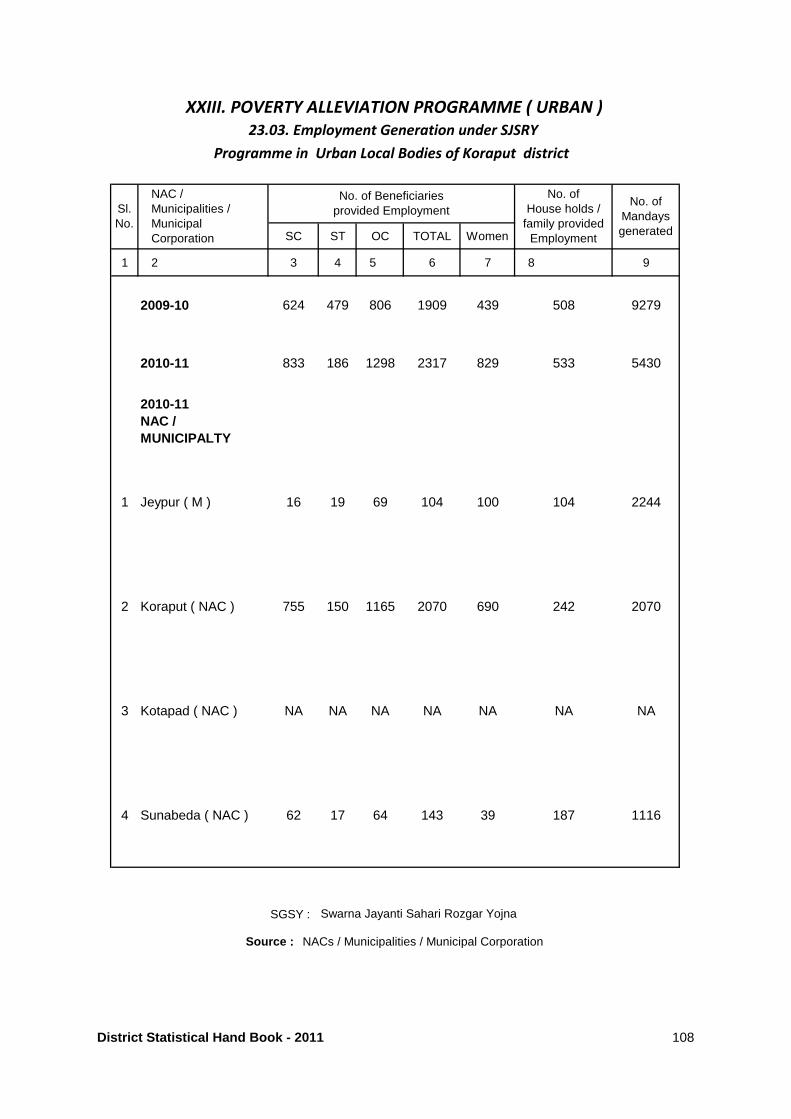
SC ST OC TOTAL Women
1 2 3 4 5 6 7 8 9
2009-10 624 479 806 1909 439 508 9279
2010-11 833 186 1298 2317 829 533 5430
2010-11NAC / MUNICIPALTY
1 Jeypur ( M ) 16 19 69 104 100 104 2244
2 Koraput ( NAC ) 755 150 1165 2070 690 242 2070
3 Kotapad ( NAC ) NA NA NA NA NA NA NA
4 Sunabeda ( NAC ) 62 17 64 143 39 187 1116
SGSY :
XXIII. POVERTY ALLEVIATION PROGRAMME ( URBAN )
23.03. Employment Generation under SJSRY
Programme in Urban Local Bodies of Koraput district
No. of Beneficiariesprovided Employment
No. of House holds /
family providedEmployment
Swarna Jayanti Sahari Rozgar Yojna
Source : NACs / Municipalities / Municipal Corporation
No. of Mandaysgenerated
Sl.No.
NAC /Municipalities /Municipal Corporation
District Statistical Hand Book - 2011 108
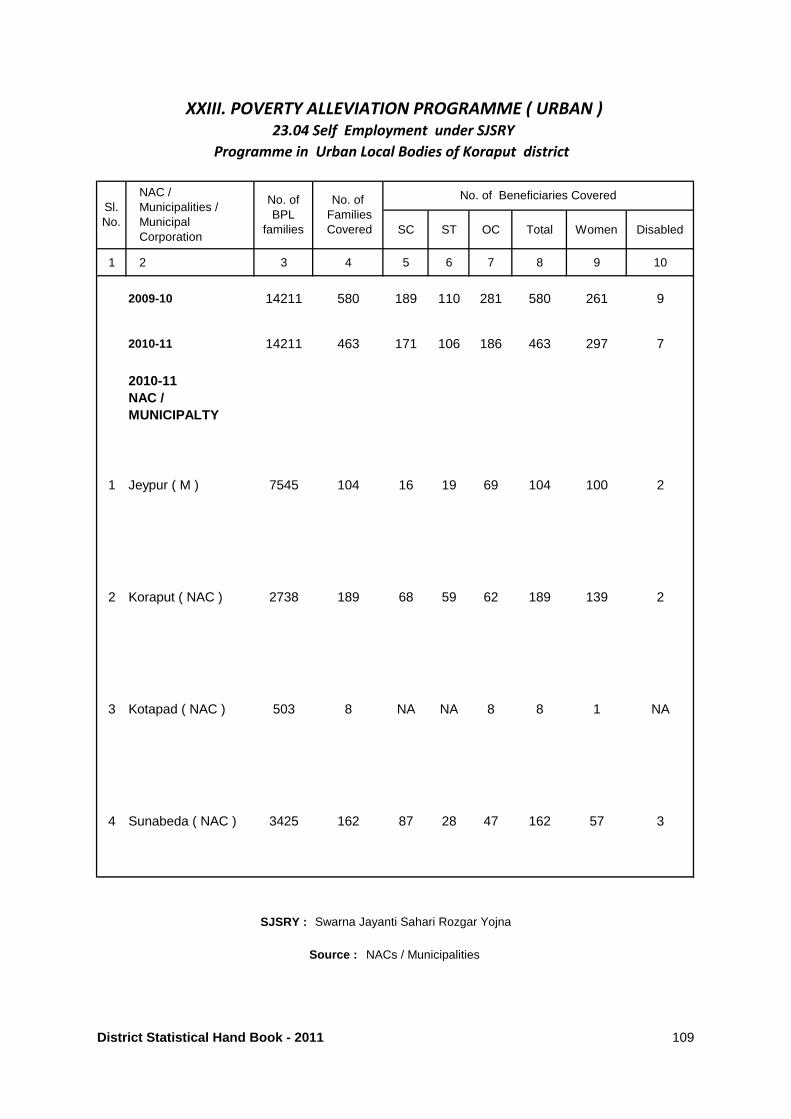
SC ST OC Total Women Disabled
1 2 3 4 5 6 7 8 9 10
2009-10 14211 580 189 110 281 580 261 9
2010-11 14211 463 171 106 186 463 297 7
2010-11NAC / MUNICIPALTY
1 Jeypur ( M ) 7545 104 16 19 69 104 100 2
2 Koraput ( NAC ) 2738 189 68 59 62 189 139 2
3 Kotapad ( NAC ) 503 8 NA NA 8 8 1 NA
4 Sunabeda ( NAC ) 3425 162 87 28 47 162 57 3
XXIII. POVERTY ALLEVIATION PROGRAMME ( URBAN )
23.04 Self Employment under SJSRY
Programme in Urban Local Bodies of Koraput district
Swarna Jayanti Sahari Rozgar Yojna
Source : NACs / Municipalities
Sl.No.
NAC /Municipalities /Municipal Corporation
No. of Beneficiaries CoveredNo. of BPL
families
No. of Families Covered
SJSRY :
District Statistical Hand Book - 2011 109
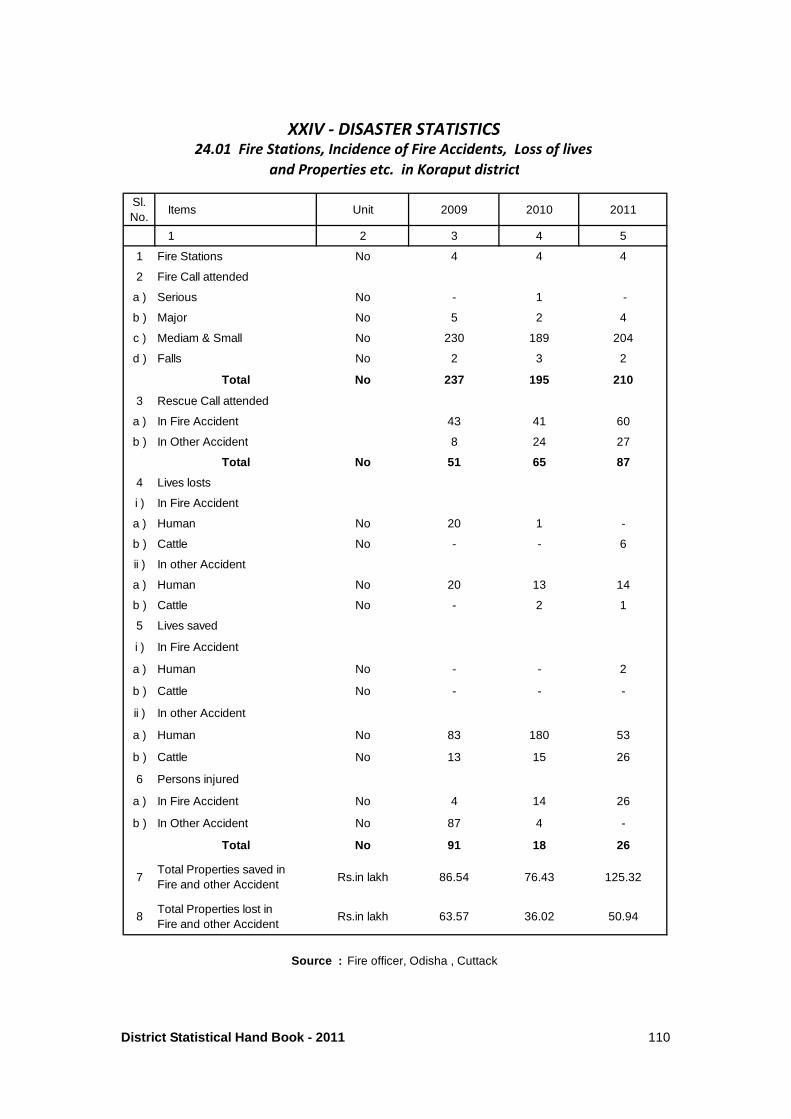
Sl.No.
Items Unit 2009 2010 2011
1 2 3 4 5
1 Fire Stations No 4 4 4
2 Fire Call attended
a ) Serious No - 1 -
b ) Major No 5 2 4
c ) Mediam & Small No 230 189 204
d ) Falls No 2 3 2
Total No 237 195 210
3 Rescue Call attended
a ) In Fire Accident 43 41 60
b ) In Other Accident 8 24 27
Total No 51 65 87
4 Lives losts
i ) In Fire Accident
a ) Human No 20 1 -
b ) Cattle No - - 6
ii ) In other Accident
a ) Human No 20 13 14
b ) Cattle No - 2 1
5 Lives saved
i ) In Fire Accident
a ) Human No - - 2
b ) Cattle No - - -
ii ) In other Accident
a ) Human No 83 180 53
b ) Cattle No 13 15 26
6 Persons injured
a ) In Fire Accident No 4 14 26
b ) In Other Accident No 87 4 -
Total No 91 18 26
7Total Properties saved in Fire and other Accident
Rs.in lakh 86.54 76.43 125.32
8Total Properties lost in Fire and other Accident
Rs.in lakh 63.57 36.02 50.94
XXIV - DISASTER STATISTICS24.01 Fire Stations, Incidence of Fire Accidents, Loss of lives
and Properties etc. in Koraput district
Source : Fire officer, Odisha , Cuttack
District Statistical Hand Book - 2011 110
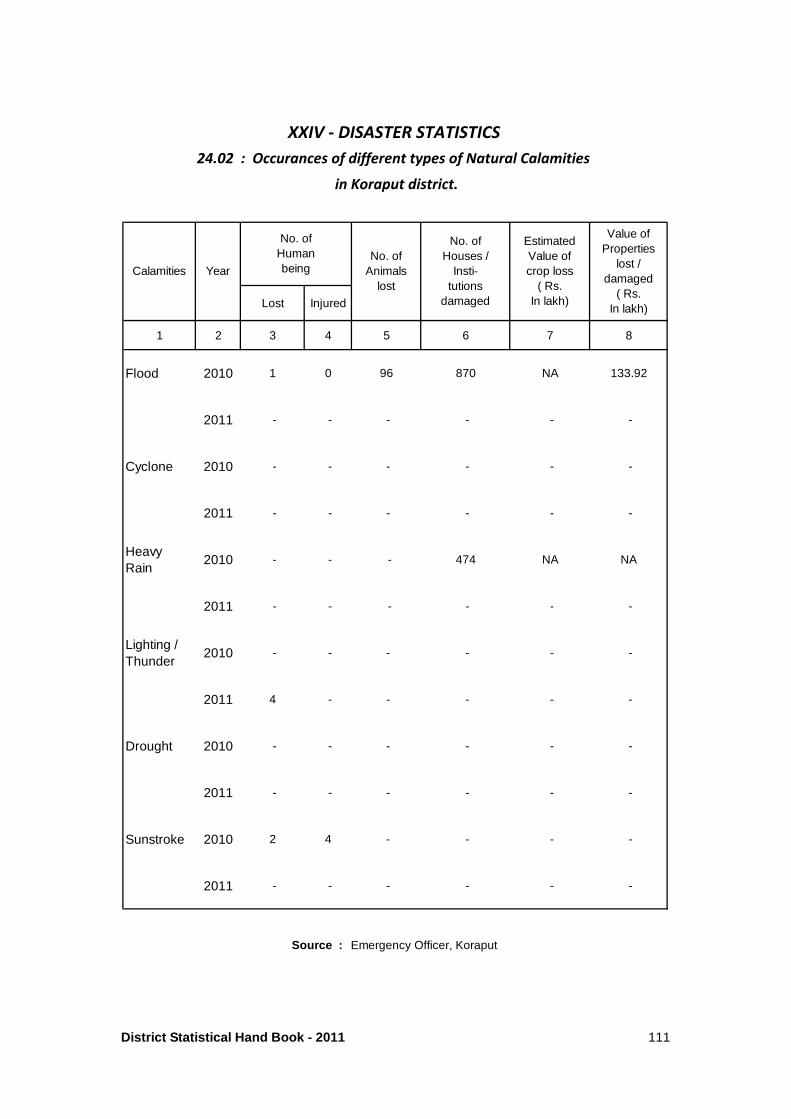
Lost Injured
1 2 3 4 5 6 7 8
Flood 2010 1 0 96 870 NA 133.92
2011 - - - - - -
Cyclone 2010 - - - - - -
2011 - - - - - -
Heavy Rain
2010 - - - 474 NA NA
2011 - - - - - -
Lighting / Thunder
2010 - - - - - -
2011 4 - - - - -
Drought 2010 - - - - - -
2011 - - - - - -
Sunstroke 2010 2 4 - - - -
2011 - - - - - -
No. of Houses /
Insti-tutions
damaged
EstimatedValue of crop loss
( Rs. In lakh)
Value ofProperties
lost / damaged
( Rs. In lakh)
XXIV - DISASTER STATISTICS
24.02 : Occurances of different types of Natural Calamities
No. ofHumanbeing
Source : Emergency Officer, Koraput
in Koraput district.
YearCalamitiesNo. of
Animalslost
District Statistical Hand Book - 2011 111
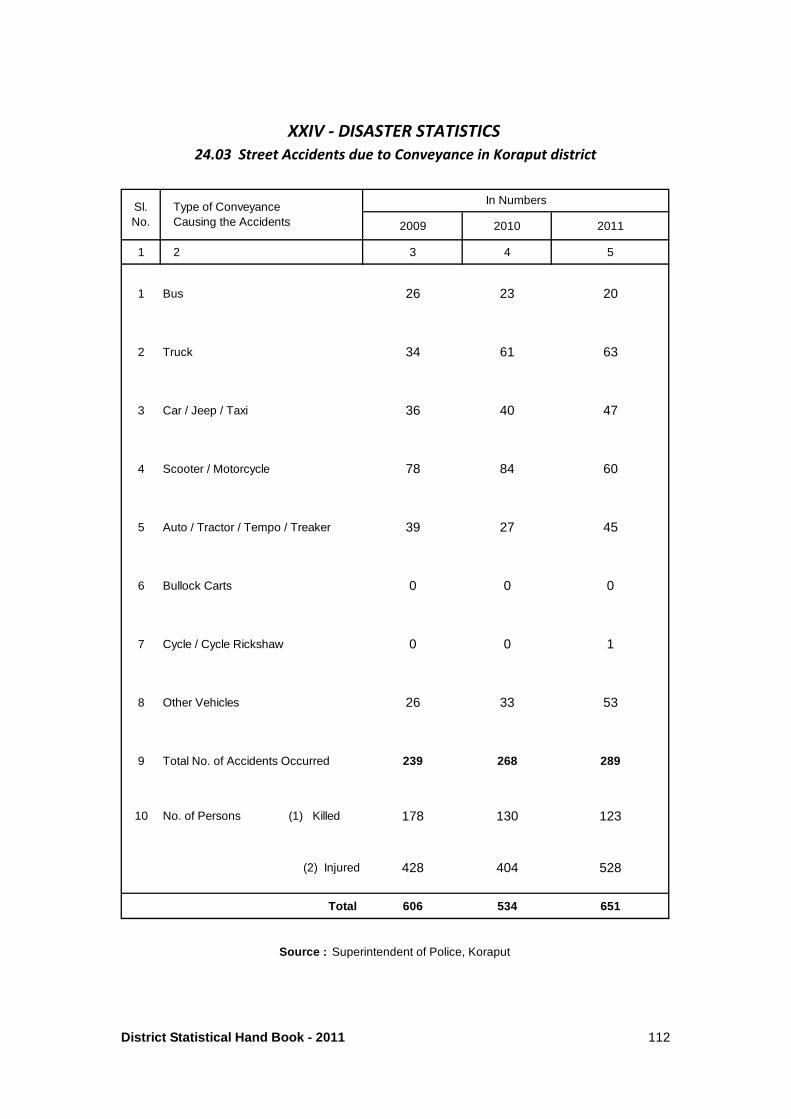
2009 2010 2011
1 2 3 4 5
1 Bus 26 23 20
2 Truck 34 61 63
3 Car / Jeep / Taxi 36 40 47
4 Scooter / Motorcycle 78 84 60
5 Auto / Tractor / Tempo / Treaker 39 27 45
6 Bullock Carts 0 0 0
7 Cycle / Cycle Rickshaw 0 0 1
8 Other Vehicles 26 33 53
9 Total No. of Accidents Occurred 239 268 289
10 No. of Persons (1) Killed 178 130 123
(2) Injured 428 404 528
Total 606 534 651
In Numbers
24.03 Street Accidents due to Conveyance in Koraput district
Source : Superintendent of Police, Koraput
XXIV - DISASTER STATISTICS
Type of ConveyanceCausing the Accidents
Sl.No.
District Statistical Hand Book - 2011 112
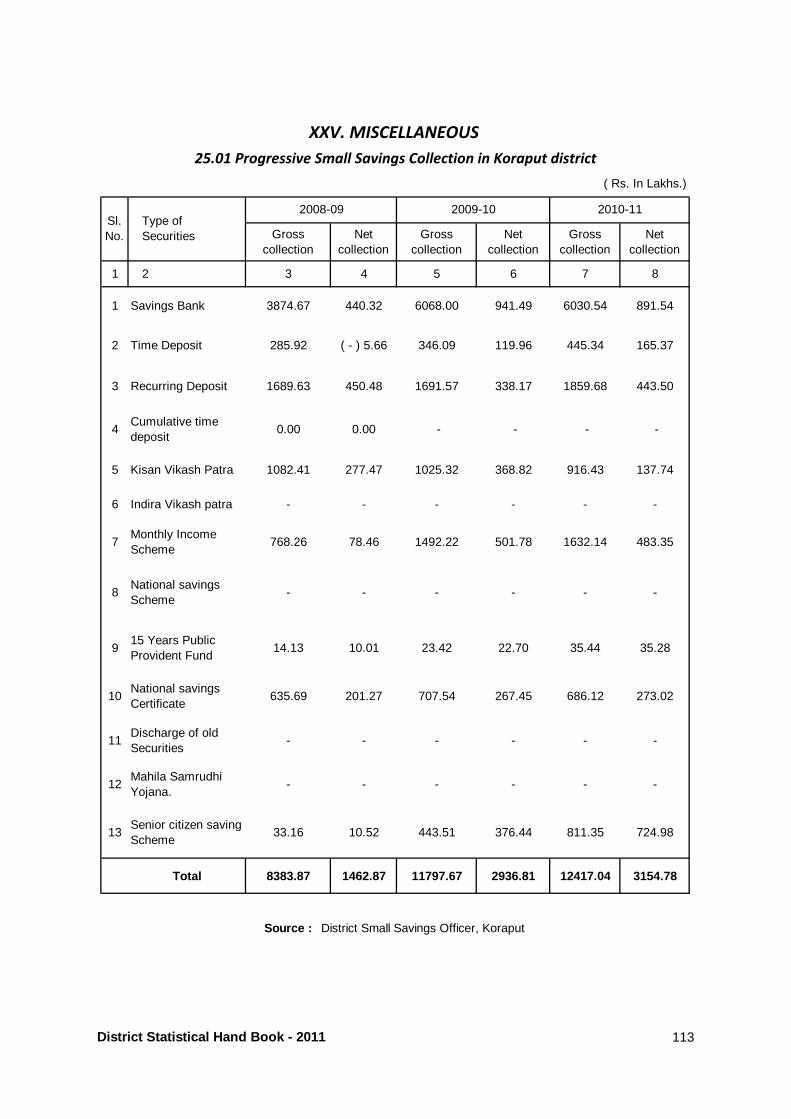
Grosscollection
Netcollection
Grosscollection
Netcollection
Grosscollection
Netcollection
1 2 3 4 5 6 7 8
1 Savings Bank 3874.67 440.32 6068.00 941.49 6030.54 891.54
2 Time Deposit 285.92 ( - ) 5.66 346.09 119.96 445.34 165.37
3 Recurring Deposit 1689.63 450.48 1691.57 338.17 1859.68 443.50
4Cumulative time deposit
0.00 0.00 - - - -
5 Kisan Vikash Patra 1082.41 277.47 1025.32 368.82 916.43 137.74
6 Indira Vikash patra - - - - - -
7Monthly Income Scheme
768.26 78.46 1492.22 501.78 1632.14 483.35
8National savings Scheme
- - - - - -
915 Years PublicProvident Fund
14.13 10.01 23.42 22.70 35.44 35.28
10National savings Certificate
635.69 201.27 707.54 267.45 686.12 273.02
11Discharge of old Securities
- - - - - -
12Mahila Samrudhi Yojana.
- - - - - -
13Senior citizen saving Scheme
33.16 10.52 443.51 376.44 811.35 724.98
Total 8383.87 1462.87 11797.67 2936.81 12417.04 3154.78
Source : District Small Savings Officer, Koraput
2009-102008-09Type of Securities
XXV. MISCELLANEOUS
25.01 Progressive Small Savings Collection in Koraput district
Sl.No.
( Rs. In Lakhs.)
2010-11
District Statistical Hand Book - 2011 113
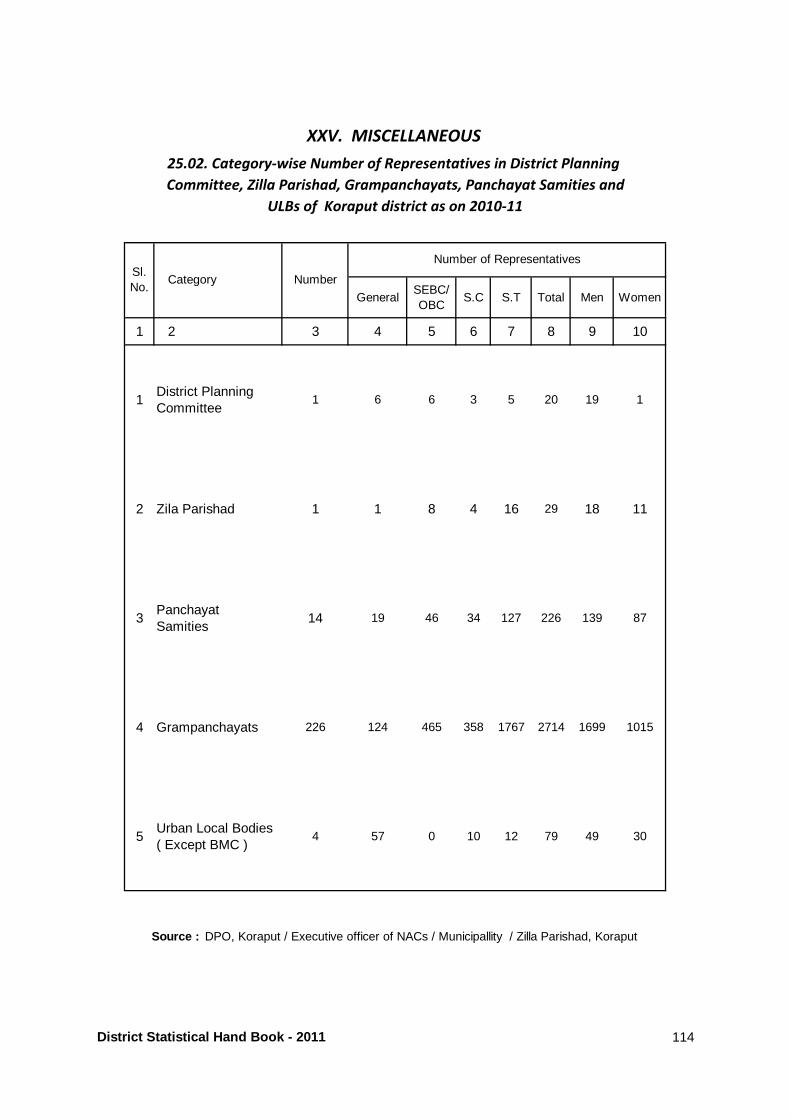
GeneralSEBC/ OBC
S.C S.T Total Men Women
1 2 3 4 5 6 7 8 9 10
1District Planning Committee
1 6 6 3 5 20 19 1
2 Zila Parishad 1 1 8 4 16 29 18 11
3Panchayat Samities
14 19 46 34 127 226 139 87
4 Grampanchayats 226 124 465 358 1767 2714 1699 1015
5Urban Local Bodies( Except BMC )
4 57 0 10 12 79 49 30
Sl.No.
Source : DPO, Koraput / Executive officer of NACs / Municipallity / Zilla Parishad, Koraput
ULBs of Koraput district as on 2010-11
XXV. MISCELLANEOUS
25.02. Category-wise Number of Representatives in District Planning
Committee, Zilla Parishad, Grampanchayats, Panchayat Samities and
Number of Representatives
Category Number
District Statistical Hand Book - 2011 114
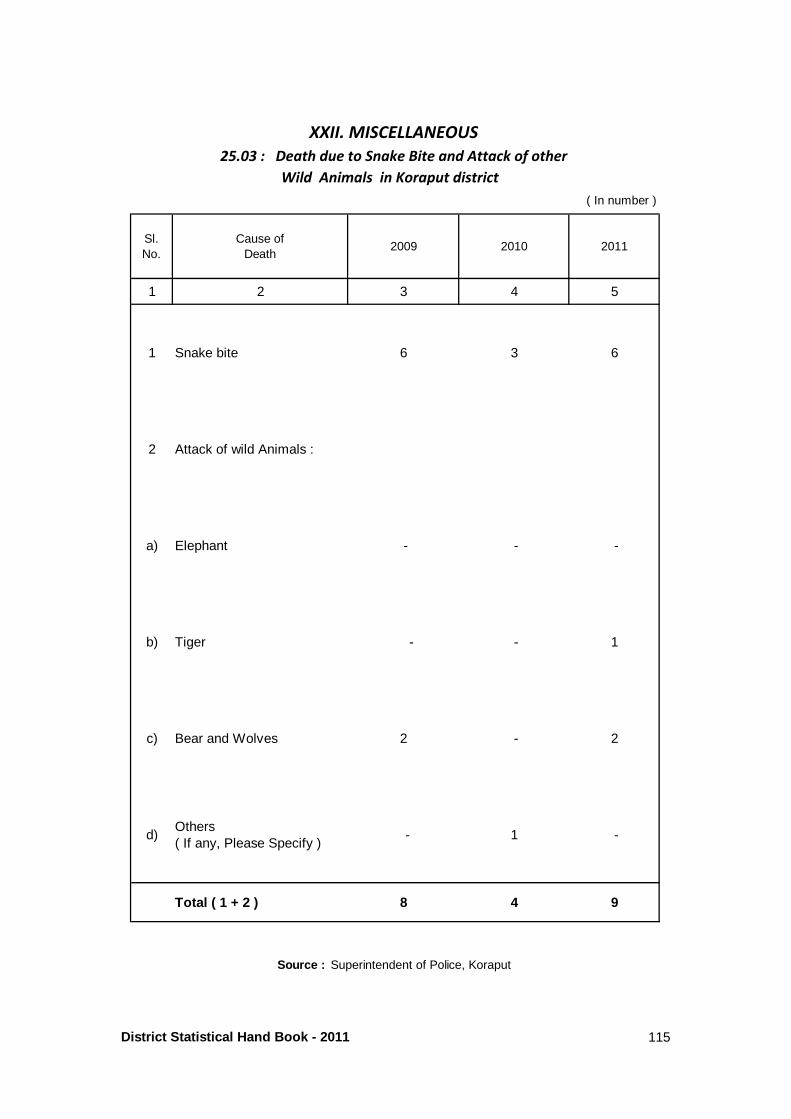
Sl.No.
Cause of Death
2009 2010 2011
1 2 3 4 5
1 Snake bite 6 3 6
2 Attack of wild Animals :
a) Elephant - - -
b) Tiger - - 1
c) Bear and Wolves 2 - 2
d)Others( If any, Please Specify )
- 1 -
Total ( 1 + 2 ) 8 4 9
XXII. MISCELLANEOUS
25.03 : Death due to Snake Bite and Attack of other
Wild Animals in Koraput district
( In number )
Source : Superintendent of Police, Koraput
District Statistical Hand Book - 2011 115
Processed in DTP at PUBLICATION SECTION
Directorate of Economics and Statistics, Odisha, Bhubaneswar
PRINTED AT ODISHA GOVERNMENT PRESS, MADHUPATNA, CUTTACK - 10
Processed in DTP at PUBLICATION SECTION
DIRECTORATE OF ECONOMICS & STATISTICS, ODISHA, BHUBANESWAR