Embed Size (px)
Citation preview
10/27/2013
1
بـــسم هللا الرحمن الرحيـــم
Diurnal Variation of IOP
Marwa Abd El-Kader Fouly Research Institute of
Ophthalmology
10/27/2013
2
Supervised by
Dr. Mohamed Adel Abdelshafik Professor of Ophthalmology,
Faculty of medicine Ain Shams University
Dr. Sherein Shafik Wahba Asst. Professor of ophthalmology,
Faculty of medicine Ain Shams University
Dr. Ahmad Khalil Khalil Professor of Ophthalmology,
Research Institute of Ophthalmology
Thesis
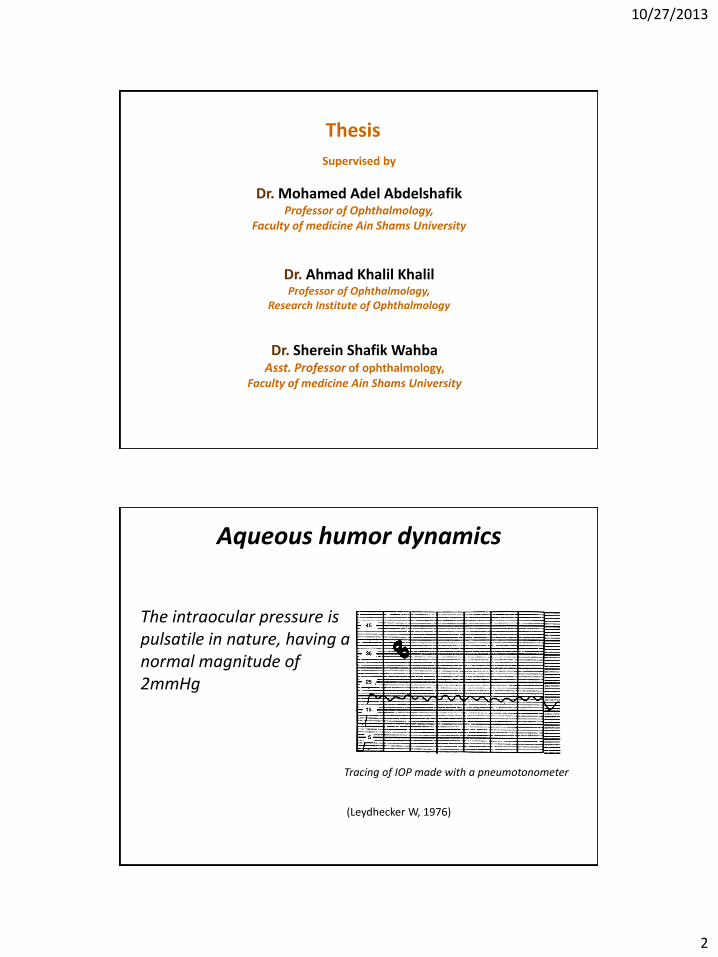
Aqueous humor dynamics
The intraocular pressure is pulsatile in nature, having a normal magnitude of 2mmHg
Tracing of IOP made with a pneumotonometer
(Leydhecker W, 1976)
10/27/2013
3
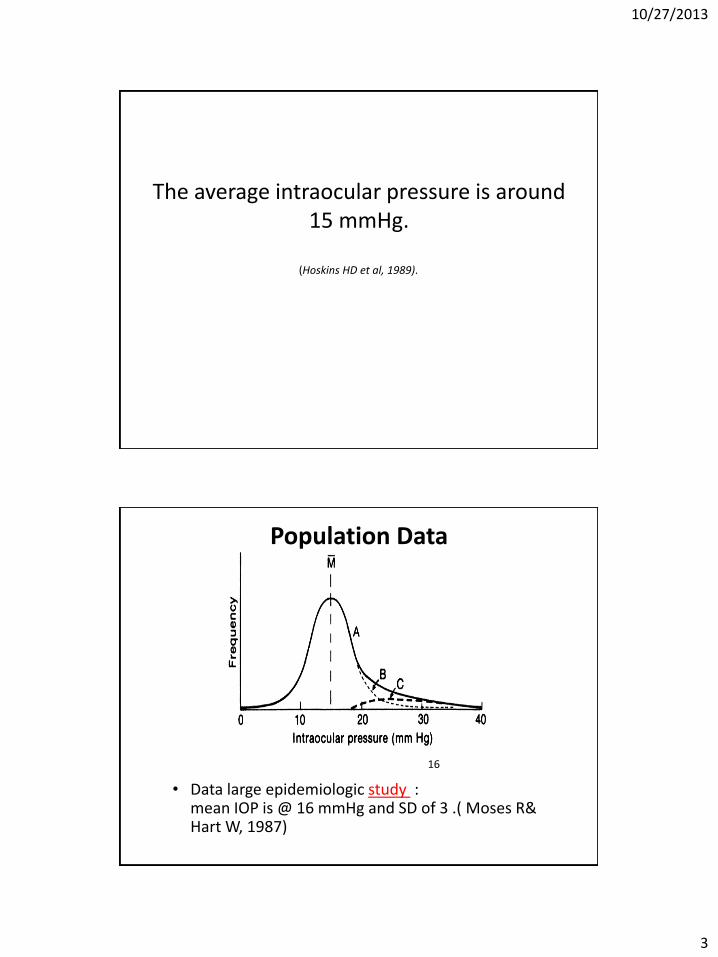
The average intraocular pressure is around 15 mmHg.
(Hoskins HD et al, 1989).
Population Data
• Data large epidemiologic study : mean IOP is @ 16 mmHg and SD of 3 .( Moses R& Hart W, 1987)
16
10/27/2013
4
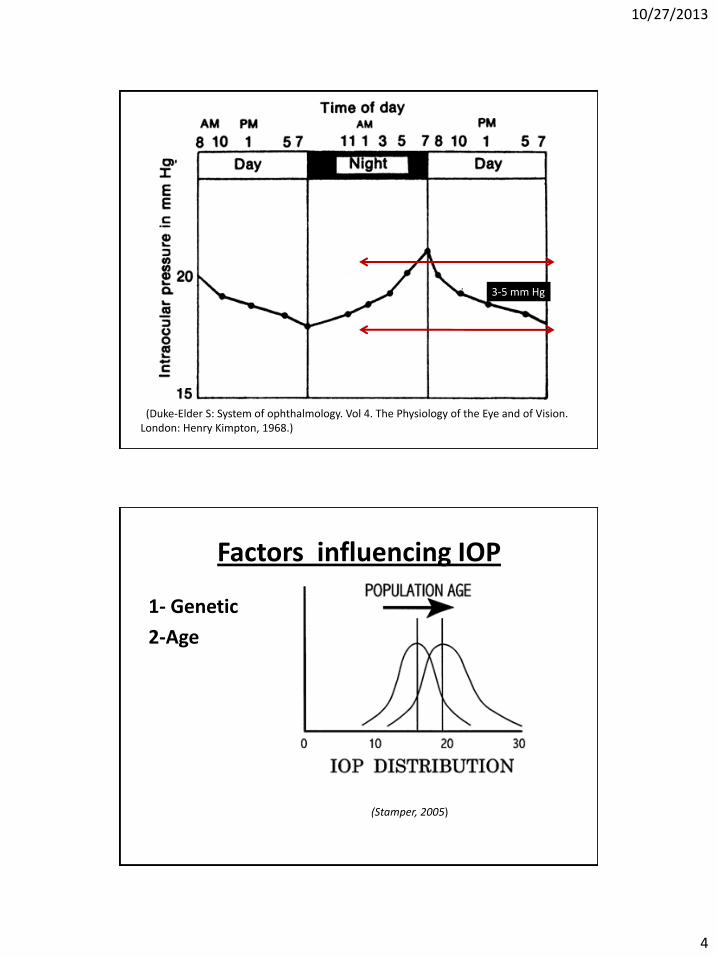
3-5 mm Hg
(Duke-Elder S: System of ophthalmology. Vol 4. The Physiology of the Eye and of Vision. London: Henry Kimpton, 1968.)
Factors influencing IOP
1- Genetic
2-Age
(Stamper, 2005)
10/27/2013
5
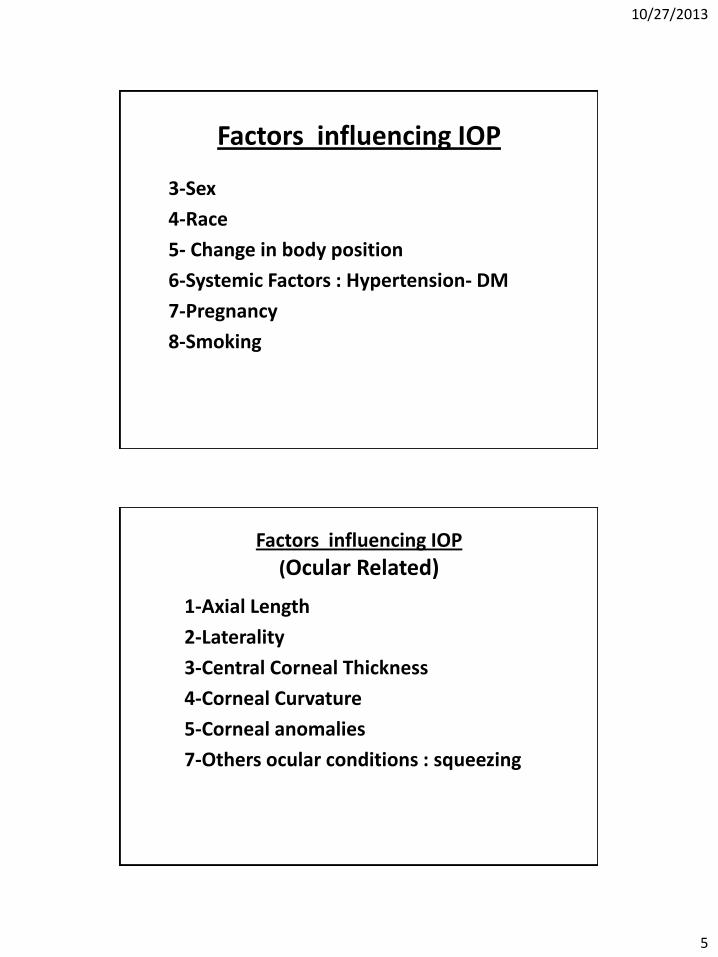
Factors influencing IOP
3-Sex
4-Race
5- Change in body position
6-Systemic Factors : Hypertension- DM
7-Pregnancy
8-Smoking
Factors influencing IOP
(Ocular Related)
1-Axial Length
2-Laterality
3-Central Corneal Thickness
4-Corneal Curvature
5-Corneal anomalies
7-Others ocular conditions : squeezing
10/27/2013
6
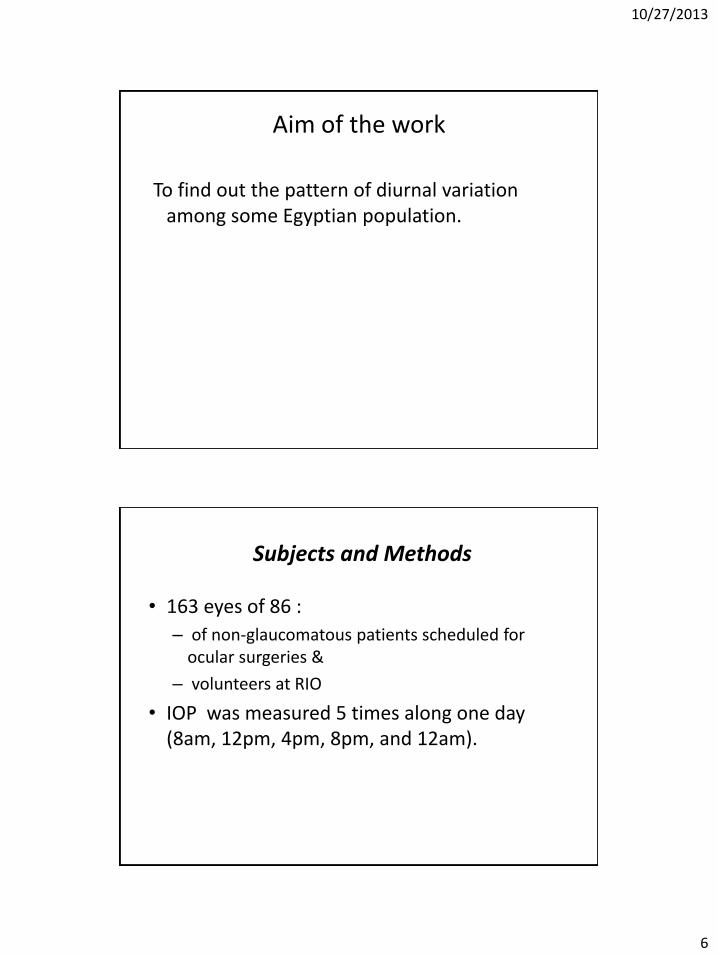
Aim of the work
To find out the pattern of diurnal variation among some Egyptian population.
Subjects and Methods
• 163 eyes of 86 :
– of non-glaucomatous patients scheduled for ocular surgeries &
– volunteers at RIO
• IOP was measured 5 times along one day (8am, 12pm, 4pm, 8pm, and 12am).
10/27/2013
7
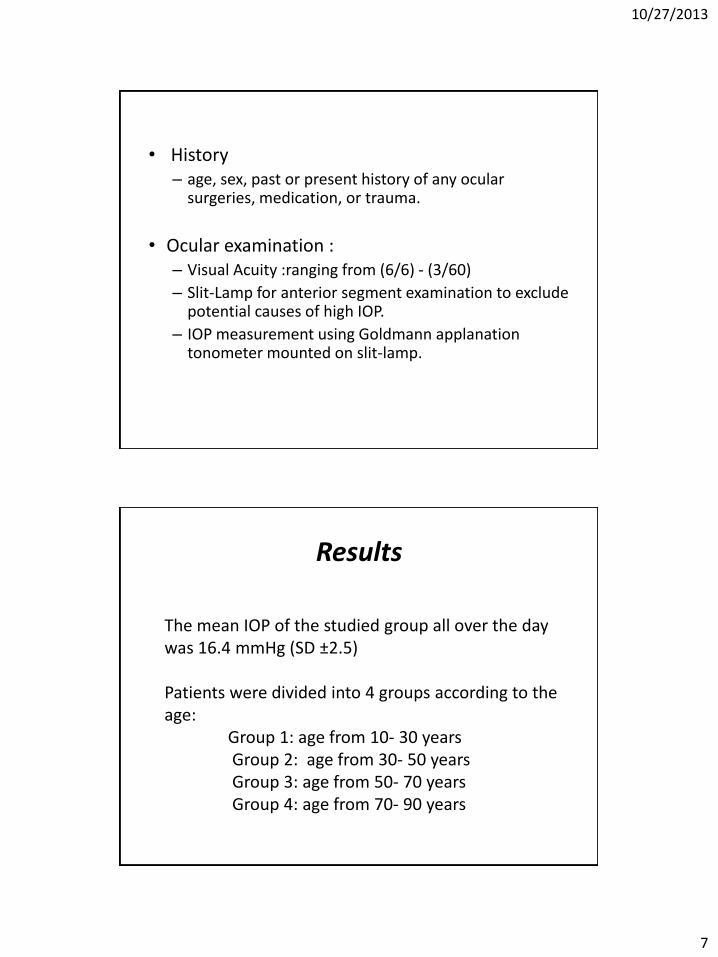
• History – age, sex, past or present history of any ocular
surgeries, medication, or trauma.
• Ocular examination : – Visual Acuity :ranging from (6/6) - (3/60)
– Slit-Lamp for anterior segment examination to exclude potential causes of high IOP.
– IOP measurement using Goldmann applanation tonometer mounted on slit-lamp.
Results
The mean IOP of the studied group all over the day was 16.4 mmHg (SD ±2.5) Patients were divided into 4 groups according to the age: Group 1: age from 10- 30 years Group 2: age from 30- 50 years Group 3: age from 50- 70 years Group 4: age from 70- 90 years
10/27/2013
8
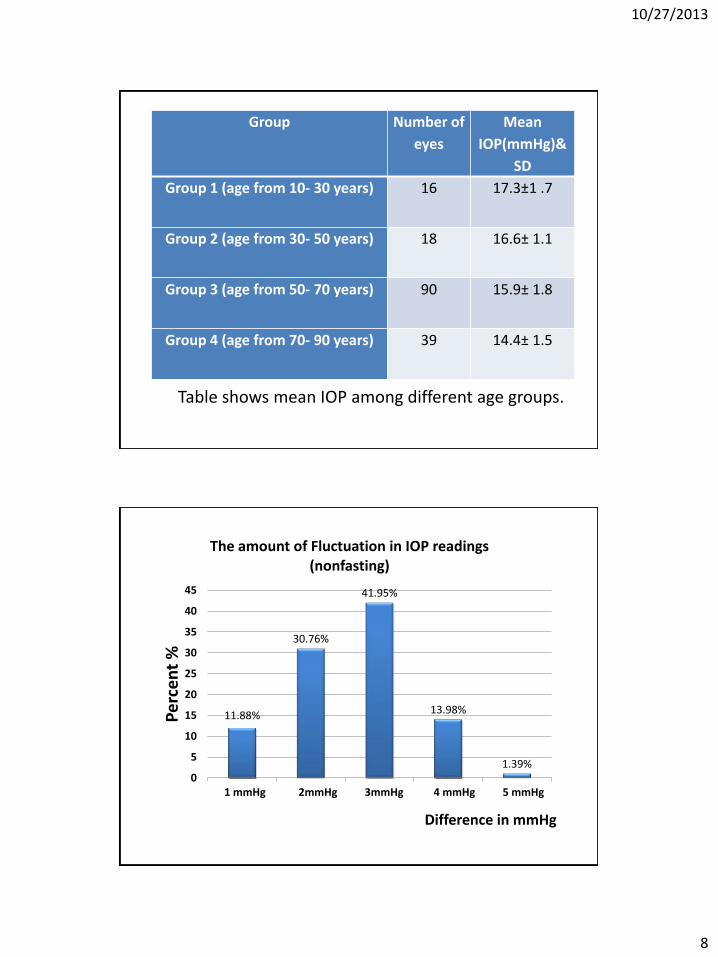
Table shows mean IOP among different age groups.
Group Number of
eyes
Mean
IOP(mmHg)&
SD
Group 1 (age from 10- 30 years) 16 17.3±1 .7
Group 2 (age from 30- 50 years) 18 16.6± 1.1
Group 3 (age from 50- 70 years) 90 15.9± 1.8
Group 4 (age from 70- 90 years) 39 14.4± 1.5
11.88%
30.76%
41.95%
13.98%
1.39% 0
5
10
15
20
25
30
35
40
45
mmHg 1 mmHg 2 mmHg 3 mmHg 4 mmHg 5
Pe
rce
nt
%
Difference in mmHg
The amount of Fluctuation in IOP readings (nonfasting)
1 mmHg 2mmHg 3mmHg 4 mmHg 5 mmHg
10/27/2013
9
11.88%
30.76%
41.95%
13.98%
1.39% 0
5
10
15
20
25
30
35
40
45
mmHg 1 mmHg 2 mmHg 3 mmHg 4 mmHg 5
Pe
rce
nt
%
Difference in mmHg
The amount of Fluctuation in IOP readings (nonfasting)
1 mmHg 2mmHg 3mmHg 4 mmHg 5 mmHg
11.88%
30.76%
41.95%
13.98%
1.39%
0
5
10
15
20
25
30
35
40
45
mmHg 1 mmHg 2 mmHg 3 mmHg 4 mmHg 5
Pe
rce
nt
%
Difference in mmHg
The amount of Fluctuation in IOP readings (nonfasting)
1 mmHg 2mmHg 3mmHg 4 mmHg 5 mmHg
10/27/2013
10
76.92%
27.97%
18.18% 13.98%
3.49%
0
10
20
30
40
50
60
70
80
90
8:00 AM 12:00 PM 4:00 PM 8:00 PM 12:00 AM
Pe
rce
nt
Time
Incidence of highest IOP (nonfasting)
76.92%
27.97%
18.18% 13.98%
3.49%
0
10
20
30
40
50
60
70
80
90
8:00 AM 12:00 PM 4:00 PM 8:00 PM 12:00 AM
Pe
rce
nt
Time
Incidence of highest IOP (nonfasting)
10/27/2013
11
76.92%
27.97%
18.18% 13.98%
3.49% 0
10
20
30
40
50
60
70
80
90
8:00 AM 12:00 PM 4:00 PM 8:00 PM 12:00 AM
Pe
rce
nt
Time
Incidence of highest IOP (nonfasting)
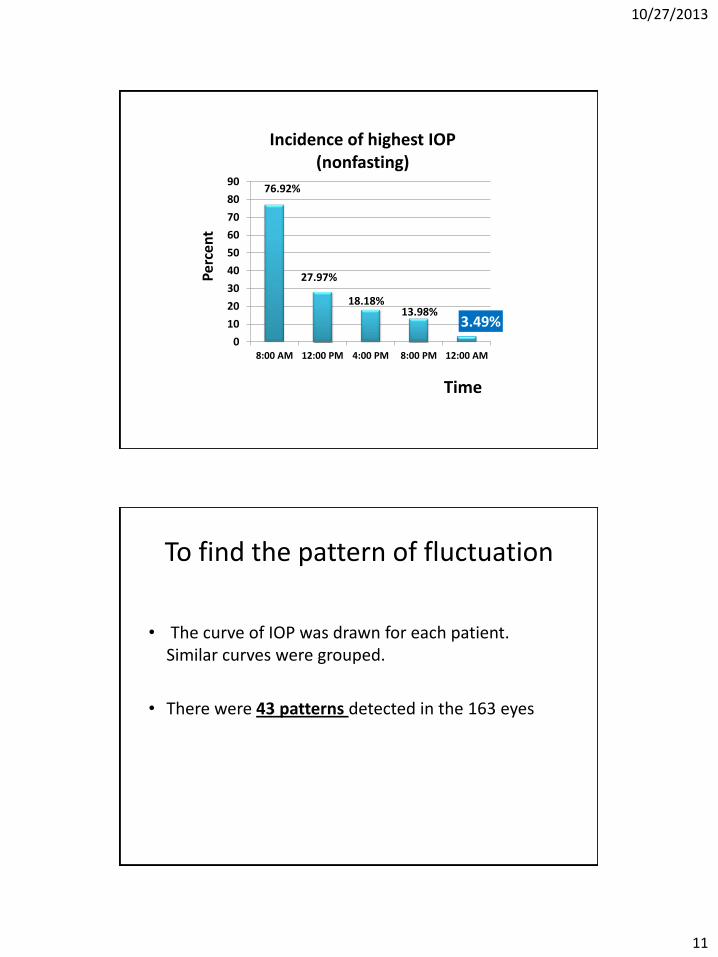
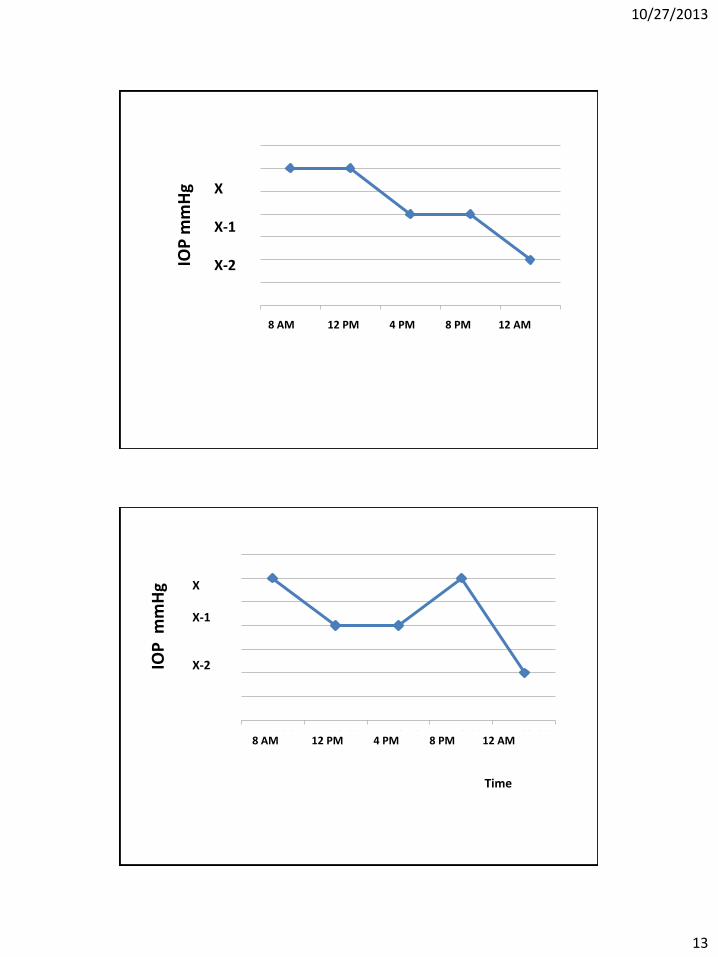
To find the pattern of fluctuation
• The curve of IOP was drawn for each patient. Similar curves were grouped.
• There were 43 patterns detected in the 163 eyes
10/27/2013
12
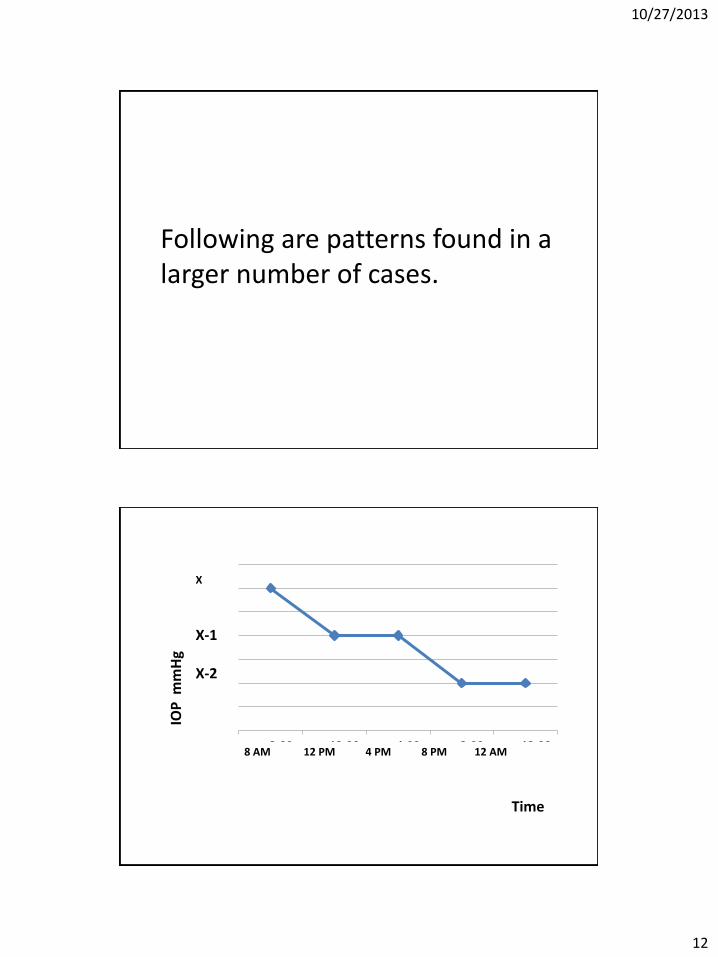
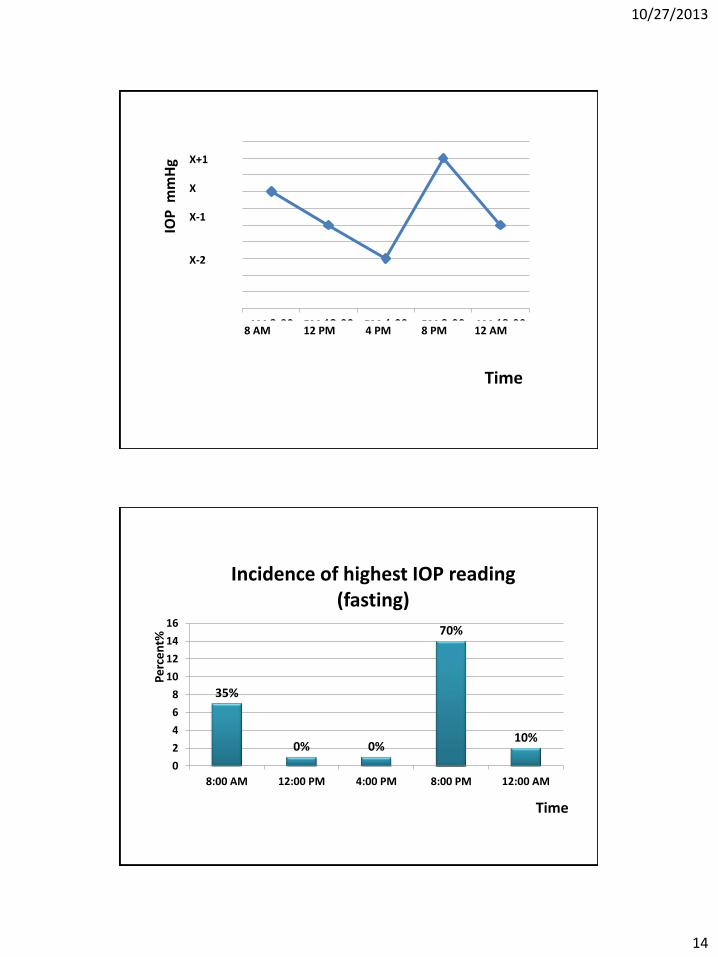
Following are patterns found in a larger number of cases.
8:00 AM 12:00 PM 4:00 PM 8:00 PM 12:00 AM
IOP
mm
Hg
Time
X
X-1 X-2
8 AM 12 PM 4 PM 8 PM 12 AM
10/27/2013
13
8:00 AM 12:00 PM 4:00 PM 8:00 PM 12:00 AM
IOP
mm
Hg X
X-1 X-2
8 AM 12 PM 4 PM 8 PM 12 AM
8:00 AM 12:00 PM 4:00 PM 8:00 PM 12:00 AM
IOP
mm
Hg
Time
X X-1 X-2
8 AM 12 PM 4 PM 8 PM 12 AM
10/27/2013
14
8:00 AM 12:00 PM 4:00 PM 8:00 PM 12:00 AM
IOP
mm
Hg
Time
X+1 X
X-1 X-2
8 AM 12 PM 4 PM 8 PM 12 AM
35%
0% 0%
70%
10%
0
2
4
6
8
10
12
14
16
8:00 AM 12:00 PM 4:00 PM 8:00 PM 12:00 AM
Pe
rce
nt%
Time
Incidence of highest IOP reading (fasting)
10/27/2013
15
0%
5%
10%
15%
20%
25%
30%
35%
40%
45%
50%
1 mmHg 2mmHg 3 mmHg 4 mmHg 5 mmHg
Nu
mb
er
of
pat
ien
ts
IOP in mmHg
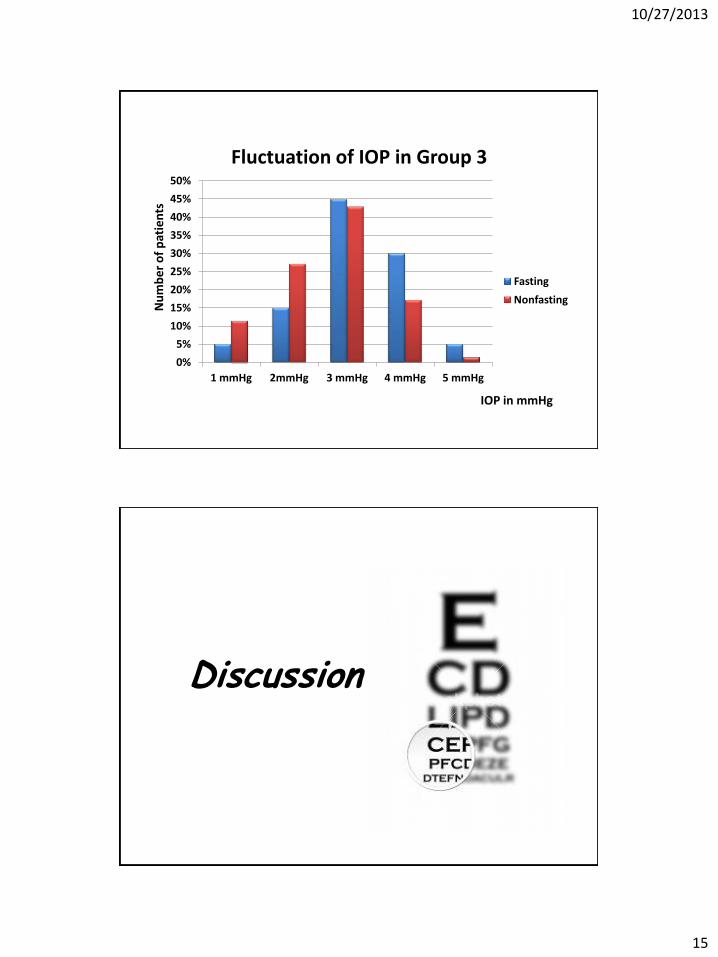
Fluctuation of IOP in Group 3
Fasting
Nonfasting
Discussion
10/27/2013
16
Age
• The present study showed that the IOP decreases with age
• This does not agree with the generally accepted notion that IOP in the elderly is higher than that in the young adult, at least during the light/wake period (Shields et al, 2005)
• This could be due to small sample size
RIGHT VERSUS LEFT
10/27/2013
17
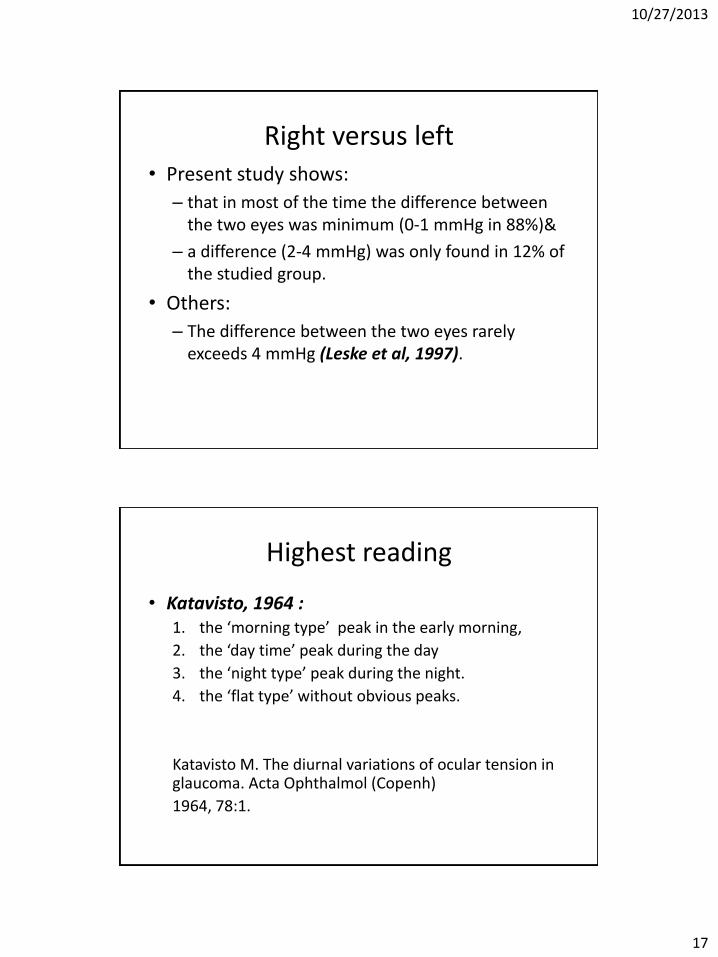
Right versus left • Present study shows:
– that in most of the time the difference between the two eyes was minimum (0-1 mmHg in 88%)&
– a difference (2-4 mmHg) was only found in 12% of the studied group.
• Others:
– The difference between the two eyes rarely exceeds 4 mmHg (Leske et al, 1997).
• Katavisto, 1964 : 1. the ‘morning type’ peak in the early morning,
2. the ‘day time’ peak during the day
3. the ‘night type’ peak during the night.
4. the ‘flat type’ without obvious peaks.
Katavisto M. The diurnal variations of ocular tension in glaucoma. Acta Ophthalmol (Copenh)
1964, 78:1.
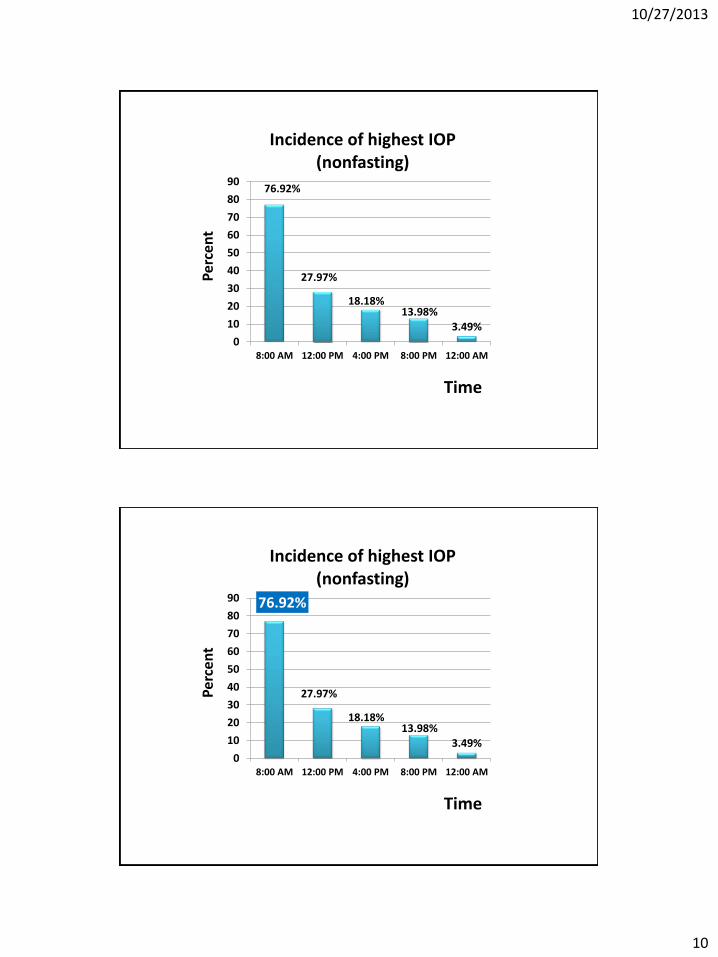
Highest reading
10/27/2013
18
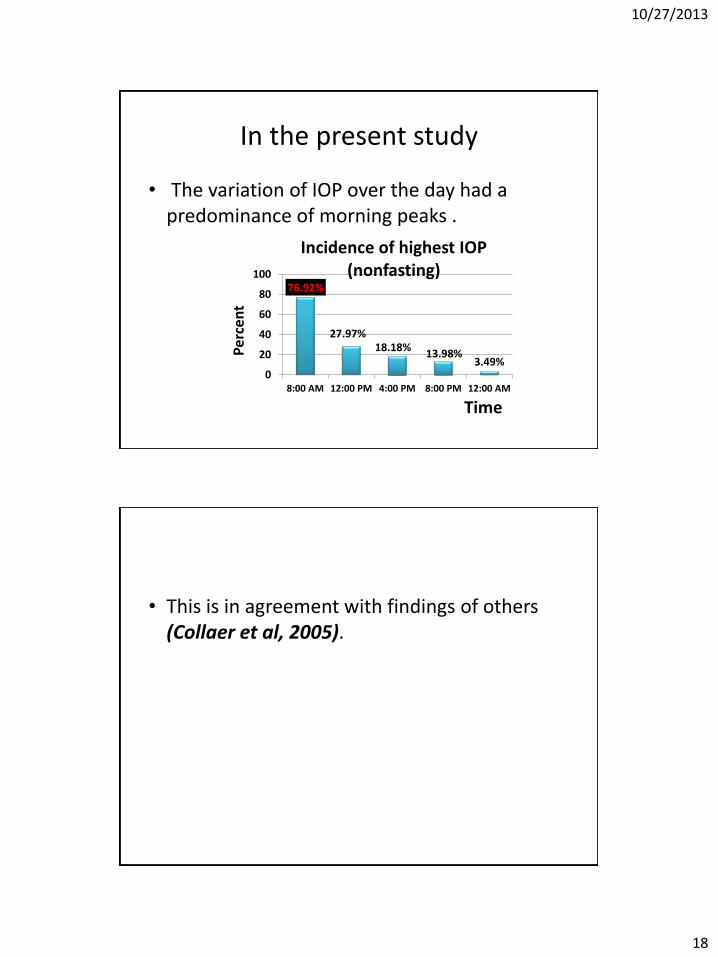
In the present study
• The variation of IOP over the day had a predominance of morning peaks .
76.92%
27.97% 18.18%
13.98% 3.49%
0
20
40
60
80
100
8:00 AM 12:00 PM 4:00 PM 8:00 PM 12:00 AM
Pe
rce
nt
Time
Incidence of highest IOP (nonfasting)
• This is in agreement with findings of others (Collaer et al, 2005).
10/27/2013
19
“This morning peak”
• So probability of catching the high IOP is more in the morning.
• Measure IOP in the early working office hours rather than by the end of the day to catch the highest reading of the day.
HIGHEST READING WHILE FASTING !
10/27/2013
20
35%
0% 0%
70%
10%
0
2
4
6
8
10
12
14
16
8:00 AM 12:00 PM 4:00 PM 8:00 PM 12:00 AM
Pe
rce
nt%
Time
Incidence of highest IOP reading (fasting)
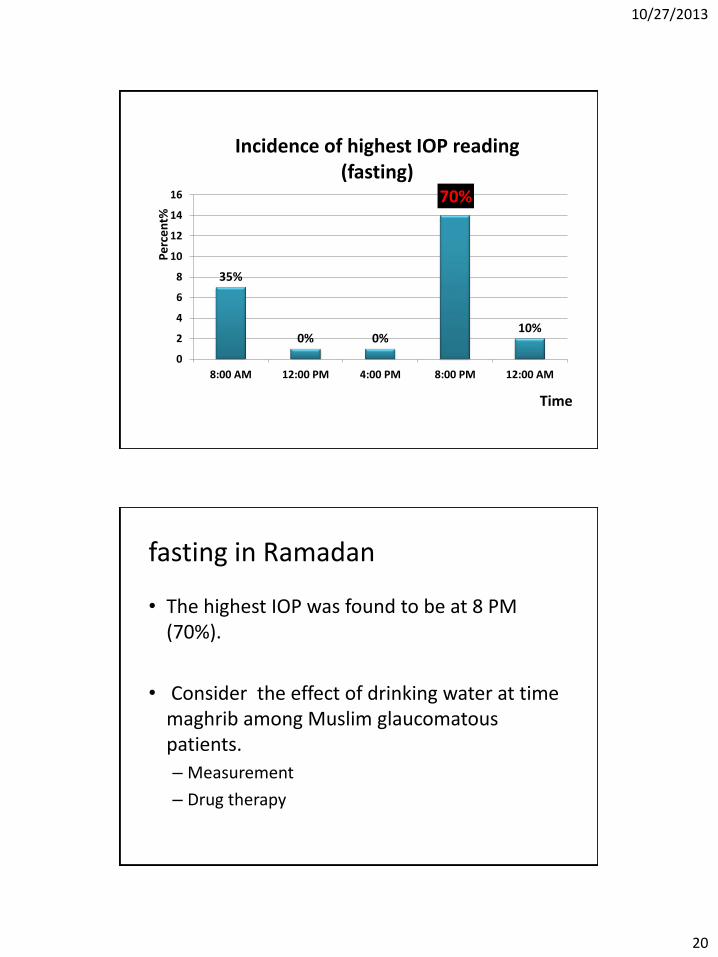
fasting in Ramadan
• The highest IOP was found to be at 8 PM (70%).
• Consider the effect of drinking water at time maghrib among Muslim glaucomatous patients.
– Measurement
– Drug therapy
10/27/2013
21
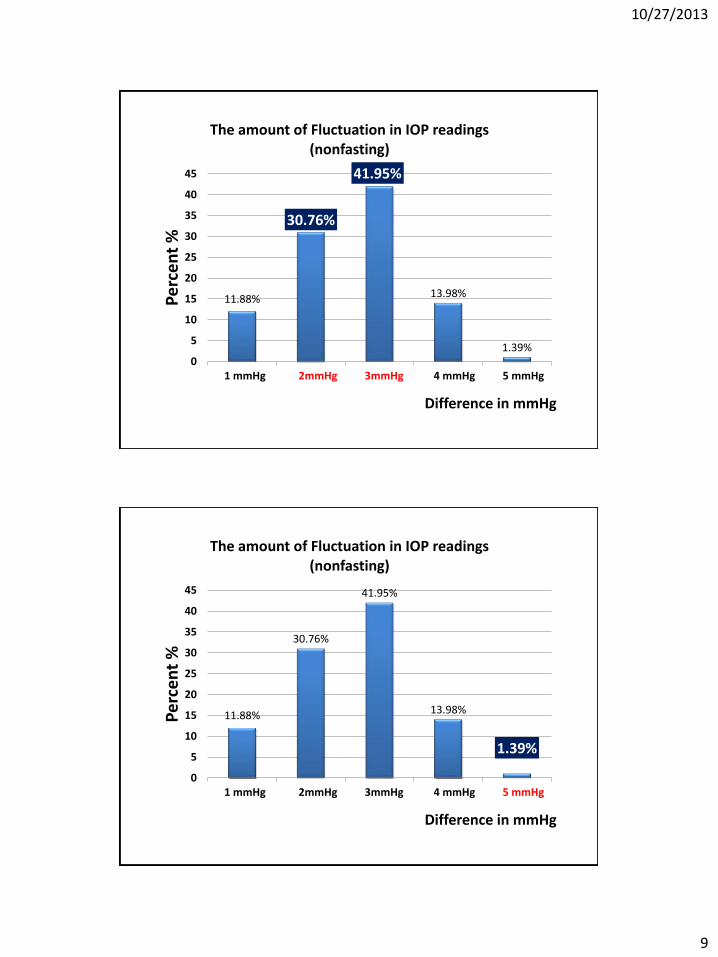
FLUCTUATION (FASTING VS NON FASTING )
(Dueker, 2005) : In normal individual IOP varies 2-6 mmHg over a 24 hours period
In the present study :
In the nonfasting group (143patients) it ranges from 1-5 mmHg.
10/27/2013
22
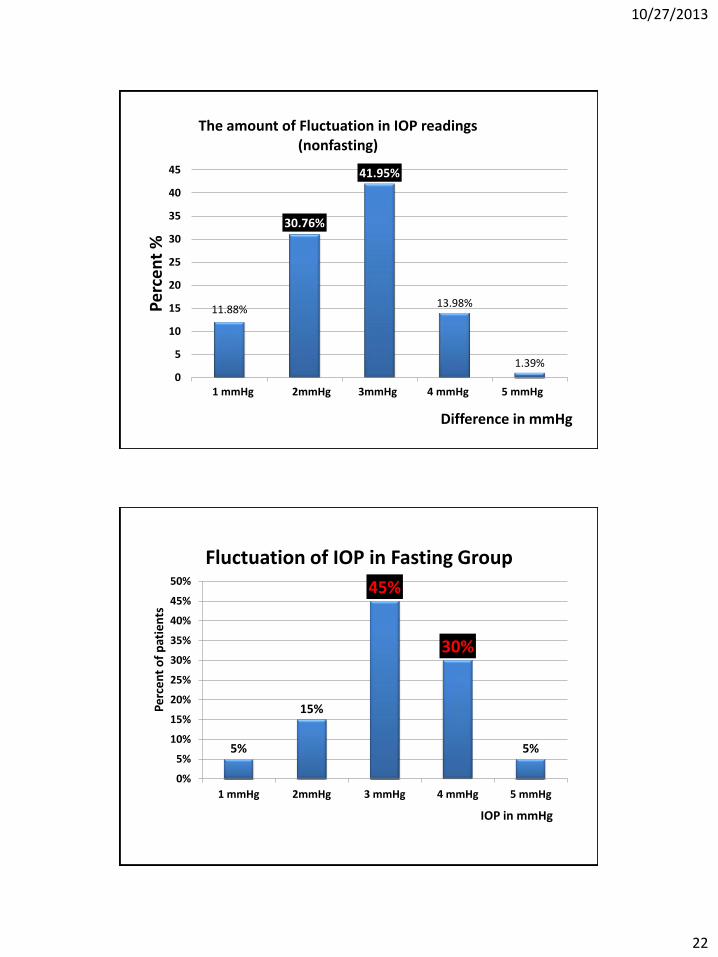
11.88%
30.76%
41.95%
13.98%
1.39% 0
5
10
15
20
25
30
35
40
45
mmHg 1 mmHg 2 mmHg 3 mmHg 4 mmHg 5
Pe
rce
nt
%
Difference in mmHg
The amount of Fluctuation in IOP readings (nonfasting)
1 mmHg 2mmHg 3mmHg 4 mmHg 5 mmHg
5%
15%
45%
30%
5%
0%
5%
10%
15%
20%
25%
30%
35%
40%
45%
50%
1 mmHg 2mmHg 3 mmHg 4 mmHg 5 mmHg
Pe
rce
nt
of
pat
ien
ts
IOP in mmHg
Fluctuation of IOP in Fasting Group
10/27/2013
23
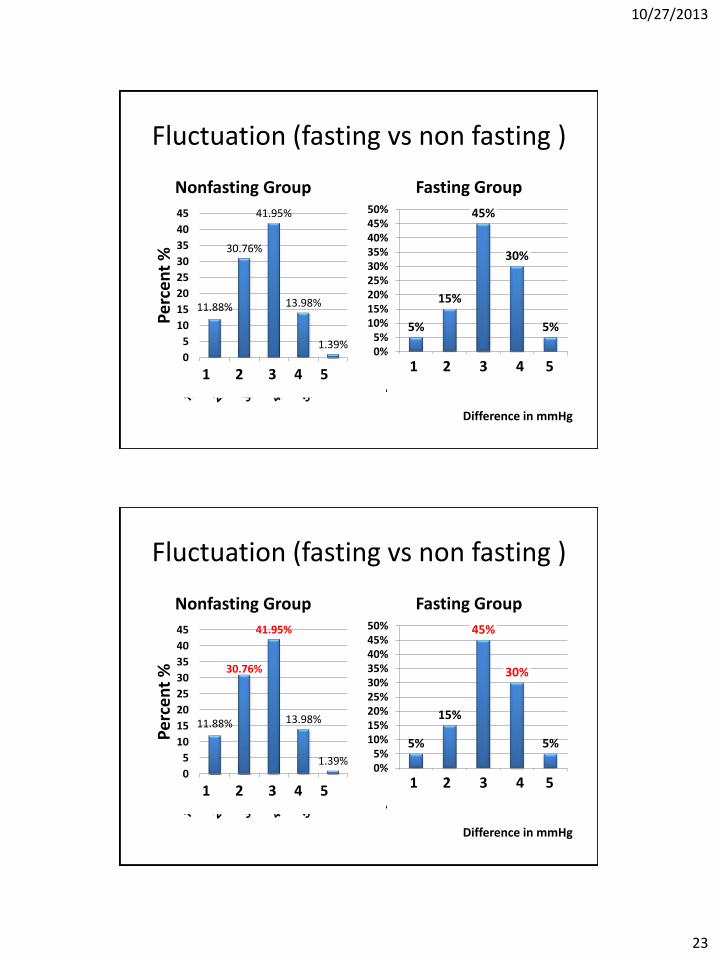
Fluctuation (fasting vs non fasting )
11.88%
30.76%
41.95%
13.98%
1.39% 0
5
10
15
20
25
30
35
40
45
Pe
rce
nt
%
Nonfasting Group
1 2 3 4 5
5%
15%
45%
30%
5%
0% 5%
10% 15% 20% 25% 30% 35% 40% 45% 50%
Difference in mmHg
Fasting Group
1 2 3 4 5
Fluctuation (fasting vs non fasting )
11.88%
30.76%
41.95%
13.98%
1.39% 0
5
10
15
20
25
30
35
40
45
Pe
rce
nt
%
Nonfasting Group
1 2 3 4 5
5%
15%
45%
30%
5%
0% 5%
10% 15% 20% 25% 30% 35% 40% 45% 50%
Difference in mmHg
Fasting Group
1 2 3 4 5
10/27/2013
24
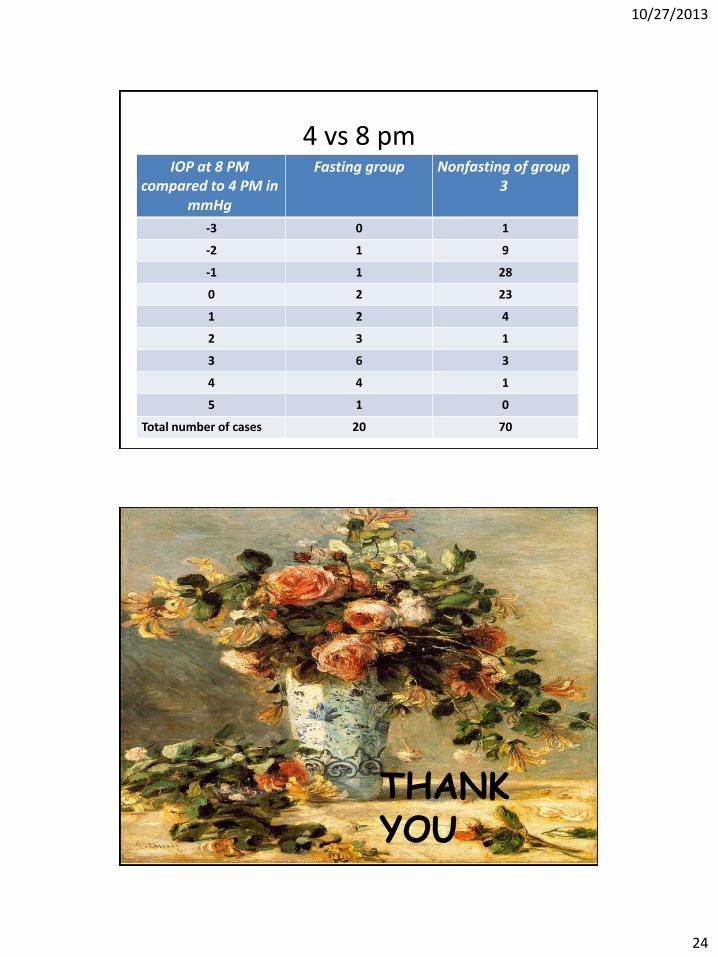
4 vs 8 pm
Nonfasting of group 3
Fasting group IOP at 8 PM compared to 4 PM in
mmHg
1 0 -3
9 1 -2
28 1 -1
23 2 0
4 2 1
1 3 2
3 6 3
1 4 4
0 1 5
70 20 Total number of cases
THANK YOU

10/27/2013
25
Thank You


![12[1]. IOP (1)](https://img.pdfslide.net/doc/110x75/633637de64d291d2a302ccb1/121-iop-1.jpg)


