Embed Size (px)
Citation preview
Diverse Redox Chemistry of Photo/Ferrioxalate System
Journal: RSC Advances
Manuscript ID: RA-COM-07-2014-007153.R1
Article Type: Communication
Date Submitted by the Author: 03-Sep-2014
Complete List of Authors: Wang, Zhaohui; Donghua University,
Xiao, Dongxue; Donghua University, Liu, Jianshe; Donghua University,
RSC Advances
Journal Name RSCPublishing
COMMUNICATION
This journal is © The Royal Society of Chemistry 2012 J . Na m e ., 2 012, 0 0, 1 -3 | 1
Cite this: DOI: 10.1039/x0xx00000x
Received 00th January 2012,
Accepted 00th January 2012
DOI: 10.1039/x0xx00000x
www.rsc.org/
Diverse Redox Chemistry of Photo/Ferrioxalate System
Zhaohui Wang*, Dongxue Xiao and Jianshe Liu
The di ve rse re dox processes of photo/fe rrioxalate syste m
(PFS) we re investigate d by varying the concentrations of
Fe(III), oxalate and oxygen. Photoreacti vity of PFS is
dete rmined by the pre valence of the most photolabile Fe(III)
and abundance of Fe(III) and oxalate, which is critical for
operation optimization of PFS in wastewater treatment.
Introduction
Ferrioxalate complex, first known as a chemical actinometer,
recently finds its photochemical application in wastewater
treatment.1-4 Various reactive intermediates, such as Fe(II) and
reactive oxygen species (ROS) including O2•-, •OH and H2O2, are
generated with Fe(III)-oxalate complexes (photo/ferrioxalate system,
PFS) being photolyzed (Eqs. 1-7).5-9 Photoproduced •OH is
significant for the oxidative decontamination of organic substances
in natural and engineered systems.1,6,9 The high treatment efficiency
can be sustained with UV irradiation in the presence of excess oxalate.
3 -
3 2 2[Fe(Ox) ] [Fe(Ox) ] 2COhv (1)
3 2 -
3 2 2 4[Fe(Ox) ] [Fe(Ox) ] C Ohv (2)
- 3 2 2
2 3 2 2 2 4CO [Fe(Ox) ] [Fe(Ox) ] CO C O (3)
222
-
2 OCO OCO (4)
22 HO HO (5)
2222 OOH 2HO (6)
OHOH Fe(III) OHFe(II) 22 (7)
Although the application of PFS in water purification is well-
known, the mechanism of photolysis and subsequent reactions in PFS remains controversial.7-9 There are two different basic ideas on
the mechanism of the primary photolysis reaction of ferrioxalate.
Excitation of ferrioxalate is followed by photodissolution without
electron transfer between iron and oxalate ligand (Eq.1)7, or by an intramolecular ligand-to-metal charge transfer (LMCT) process
(Eq.2).5,6,8 Despite a debatable argument on the two pathways, both
mechanisms will lead to the formation of Fe(II) and at least one
radical anion (C2O4•-/CO2
•-). CO2•- is a strong reducing agent (E0=-
1.8 V vs NHE) and can react with another ferrioxalate molecule or instead reduce O2 to superoxide anion (O2
•-) at near-diffusion-
controlled rate (k = 2.4×10⁹ M -1 s-1).10 Oxalate can form three kinds
of complex with Fe(III), Fe(Ox)+, Fe(Ox)2- and Fe(Ox)3
3-, with
different proportions depending on the pH and the Fe(III)-to-oxalate
ratio. Vincze and Papp11 measured quantum yields at 254 nm of 0,
1.18 and 1.60 for Fe(Ox)+, Fe(Ox)2- and Fe(Ox)3
3-, respectively. In
view of their markedly different photoactivity, a diverse photoredox chemistry of PFS is expected with the changes in Fe speciation
caused by rapid consumption of oxalate. However, most of related
work was done in the presence of excess oxalate.1-7 Few
investigations focus on the photochemistry of PFS at low
Fe(III)/oxalate ratio to resemble the scenario of oxalate depletion, despite its importance in understanding the fundamental reaction
mechanism and practical operation.
In this study, the photoredox processes of PFS at different
Fe(III)/oxalate ratios was investigated by determining the
photoproduction of Fe(II) and H2O2. AO7, a non-biodegradable organic pollutant, was selected to probe the •OH photoproduction. A
preliminary mechanism was proposed based on the results of Fe
speciation and Electron spin resonance (ESR).
Experimental section
Chemicals Iron(III) perchlorate hydrate and Acid Orange 7 (AO7:
C16H11N2O4SNa) were purchased from Aldrich. 5, 5-dimethyl-1-
pyrroline-N-oxide (DMPO) and N, N-Diethyl-p-phenylenediamine
(DPD) were from Sigma Chemical Co. Horseradish peroxidase
(POD) was purchased from Huamei Biologic Engineering, China. Oxalic acid (Ox), sodium hydroxide, perchloric acid, potassium
phosphate monobasic (KH2PO4), sodium phosphate monobasic
(NaH2PO4) and 1, 10-phenanthroline, were of reagent grade and
used as supplied. Barnstead UltraPure water (18.3 M Ω cm) was used
for all experiments. Experimental procedures
All photochemical experiments were conducted in a 70 mL
cylindrical Pyrex vessel (3.8 cm diameter, containing 50 mL
solution) under continuous magnetic stirring. The ultraviolet
irradiation source was a 100 W Hg lamp (Toshiba SHL-100UVQ-2) as specified elsewhere.12 The UV light, which had wavelengths
below 290 nm, was filtered with the Pyrex glass. The reaction
mixture for photolysis was freshly prepared by dilution of stock
solutions of 0.01 M oxalic acid, 5 mM Fe(III) at pH 1.5 (HClO4).
AO7 (50 μM) was used as a probe compound for hydroxyl radicals. The initial pH was adjusted with dilute HClO4 or NaOH. The pH
Page 1 of 5 RSC Advances
COMMUNICATION Journal Name
2 | J. Nam e. , 2012, 0 0, 1 -3 This journal is © The Royal Society of Chemistry 2012
variations during all experiments were less than ±0.2 pH units.
Deaeration, when desired, was accomplished by argon bubbling for
at least 20 min before irradiation and throughout the experiments.
During the each kinetic experiment, 1 mL (for determination of Fe(II) and H2O2) or 2 mL (for dye measurement) aliquots were
sampled with a new syringe each time and immediately disposed for
the consequent analysis.
Methods and Analysis
The concentration of Fe(II) was monitored spectrophotometrically by a modified phenanthroline method.12,13
H2O2 determination was performed using a POD/DPD method.14
The dye decoloration was monitored by measuring the absorbance at
485 nm on a Hitachi U-2900 spectrophotometer.15 The
photodegradation rates were well described by pseudo-first-order model. TOC was determined on a Tekmar Dohrmann Apllo 9000
TOC analyzer. ESR spectra of DMPO spin-trapping radicals were
recorded at room temperature on a Bruker EPR ELEXSYS 500
spectrometer equipped with an in situ irradiation source (a Quanta-
Ray ND:YAG laser system λ=355 nm). The simulations of ESR spectra were obtained with the use of WinSim EPR simulation
software. The spin adduct assignment was based on its distinctive
hyperfine splitting parameters (similarity>90%). The detailed
parameters were reported previously.12 Fe speciation was calculated
using the MEDUSA software, a chemical equilibrium program with a built-in thermodynamic database.16
Results and discussion
Formation of H2O2 and Fe(II)
H2O2 and Fe(II) are the major long-lived photolyzed products of
Fe(III)-oxalato complexes.5 Their concentrations at different concentrations of Fe(III) and oxalate (Fe(III), 100 and 200 μM;
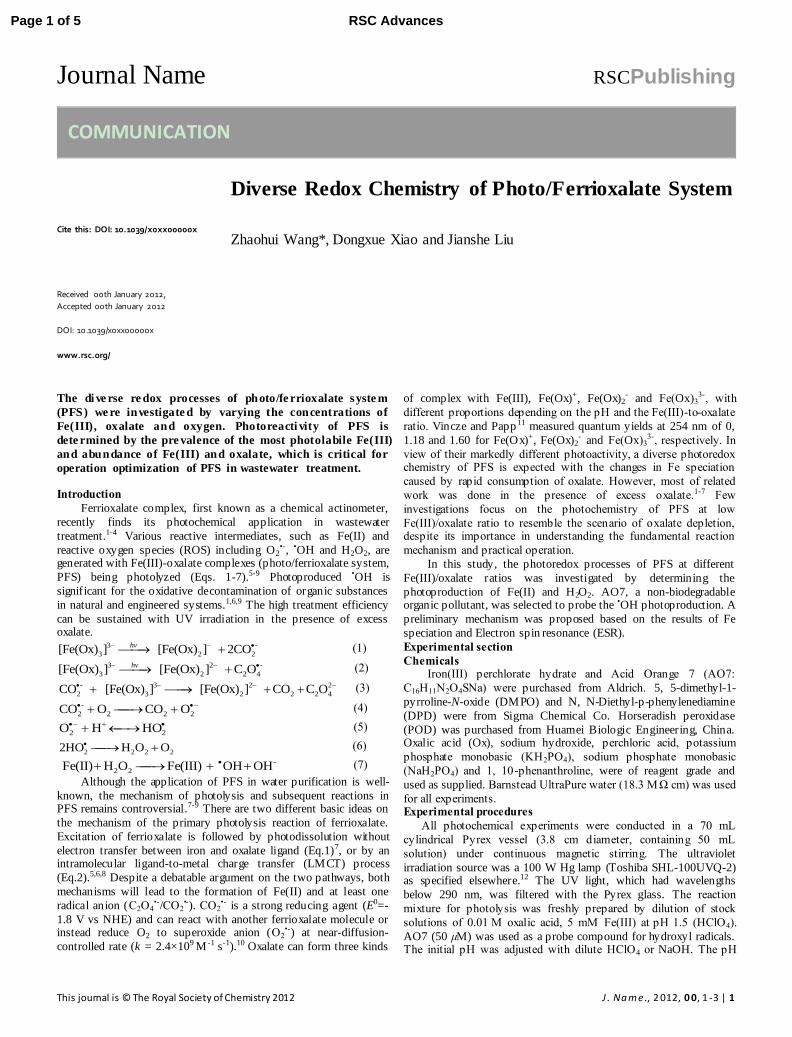
oxalate, 100-1000 μM) were monitored (Fig.1). Fig.1a shows that
amount of H2O2 only can be measured at the low Fe(III)
concentration during 30 min of irradiation. It should be noted that all
the concentrations of H2O2 measured were accumulated concentrations, that is, these just represented the net outcome of
H2O2 formed and decomposed by a subsequent rapid dark reaction
with residual Fe(II).5 Therefore, no evidence of H2O2 accumulation
at 200 μM Fe(III) did not mean no formation of H2O2, but probably
indicated a rapid consumption of H2O2 after formation. Fig.1b shows that a large amount of Fe(II) was generated at 200
μM Fe(III), with the consumption of oxalate (Fig. S1), indicating
that a typical photolysis proceeded even at a high Fe(III) level. Since
Fe(II)-oxalate complex (k= 3.1×10⁴ M-1s-1) reacts with H2O2 three
orders of magnitude faster than Fenton reaction (k=53-76 M-1 s-1)17, the newly generated H2O2 was expected to be rapidly consumed by
Fe(II). Therefore, the extremely low levels of H2O2 at high Fe(III)
dosage should not be ascribed to the poor photoreactivity of Fe(III)-
oxalate complex, but should be partially resulted from the rapid
decomposition of H2O2. AO7 degradation kinetics
The most important feature of PFS is efficient generation of highly
reactive •OH radicals.1-3 The photoproduction of •OH was
determined with the addition of AO7 as a •OH scavenger
(k•OH+AO7=(1.10±0.04)×1010 M-1 s-1).18 The reaction of AO7 with CO2
•- is not considered under aerated conditions because of the rapid
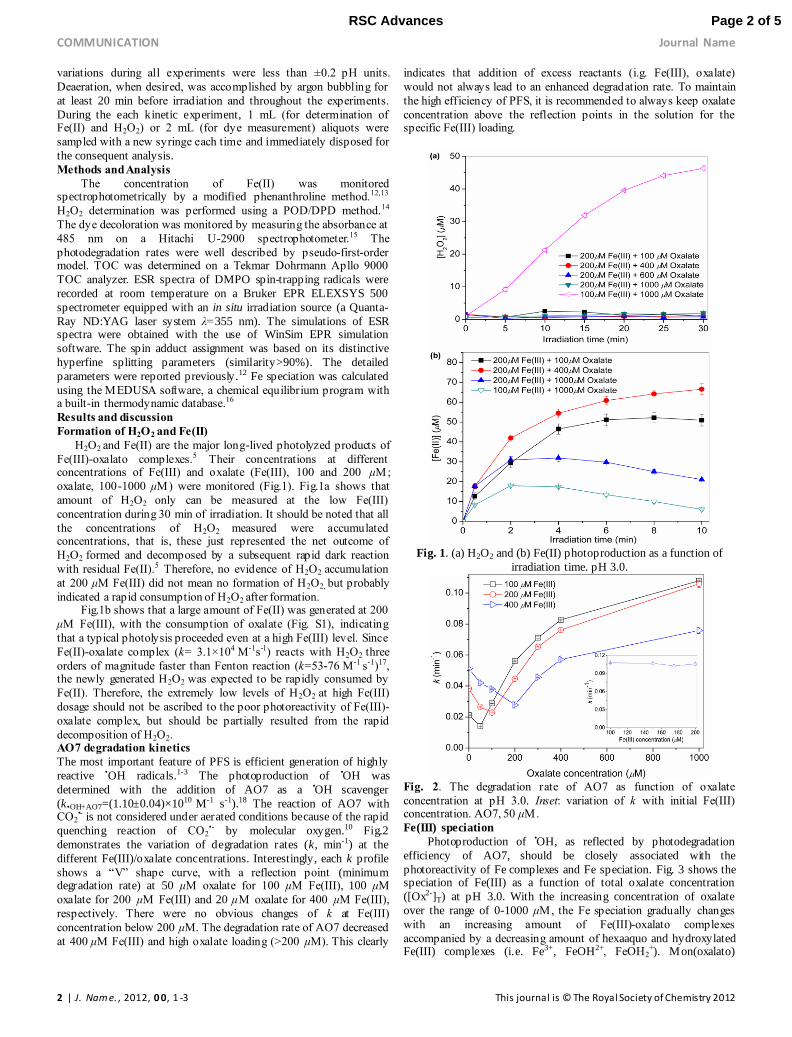
quenching reaction of CO2•- by molecular oxygen.10 Fig.2
demonstrates the variation of degradation rates (k, min-1) at the
different Fe(III)/oxalate concentrations. Interestingly, each k profile
shows a “V” shape curve, with a reflection point (minimum degradation rate) at 50 μM oxalate for 100 μM Fe(III), 100 μM
oxalate for 200 μM Fe(III) and 20 μM oxalate for 400 μM Fe(III),
respectively. There were no obvious changes of k at Fe(III)
concentration below 200 μM. The degradation rate of AO7 decreased
at 400 μM Fe(III) and high oxalate loading (>200 μM). This clearly
indicates that addition of excess reactants (i.g. Fe(III), oxalate)
would not always lead to an enhanced degradation rate. To maintain
the high efficiency of PFS, it is recommended to always keep oxalate
concentration above the reflection points in the solution for the specific Fe(III) loading.
Fig. 1. (a) H2O2 and (b) Fe(II) photoproduction as a function of
irradiation time. pH 3.0.
Fig. 2. The degradation rate of AO7 as function of oxalate
concentration at pH 3.0. Inset: variation of k with initial Fe(III) concentration. AO7, 50 μM.
Fe(III) speciation
Photoproduction of •OH, as reflected by photodegradation
efficiency of AO7, should be closely associated with the
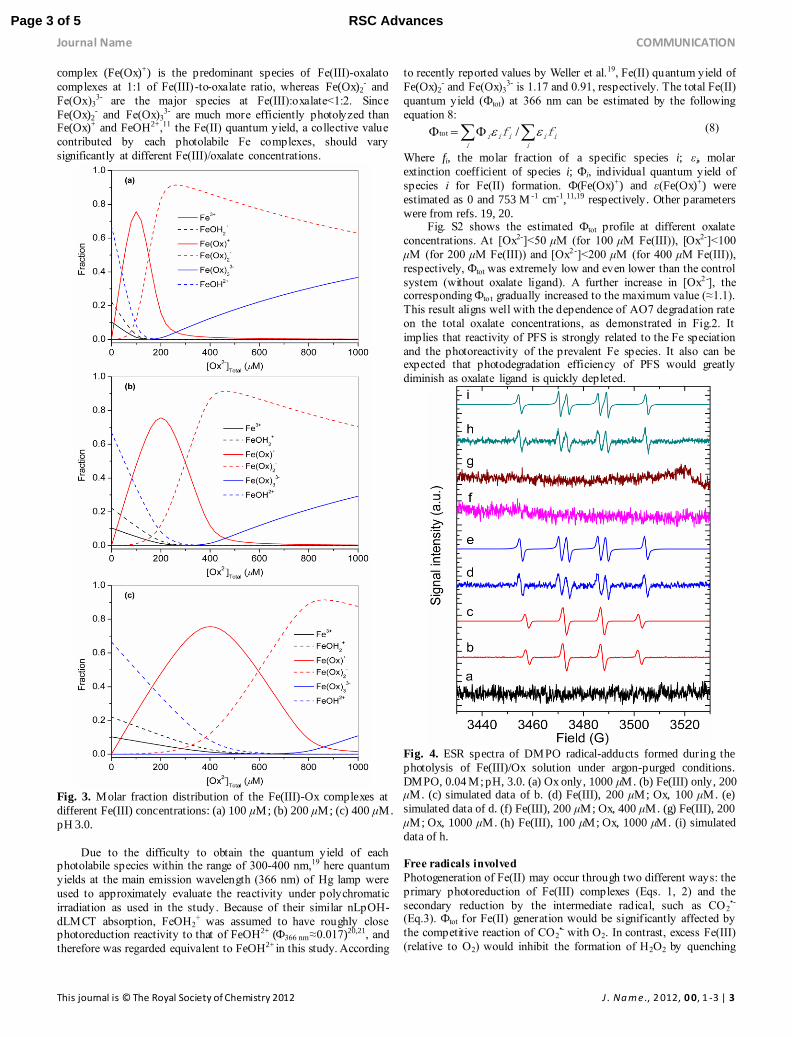
photoreactivity of Fe complexes and Fe speciation. Fig. 3 shows the speciation of Fe(III) as a function of total oxalate concentration
([Ox2-]T) at pH 3.0. With the increasing concentration of oxalate
over the range of 0-1000 μM, the Fe speciation gradually changes
with an increasing amount of Fe(III)-oxalato complexes
accompanied by a decreasing amount of hexaaquo and hydroxylated Fe(III) complexes (i.e. Fe3+, FeOH2+, FeOH2
+). Mon(oxalato)
Page 2 of 5RSC Advances
Journal Name COMMUNICATION
This journal is © The Royal Society of Chemistry 2012 J . Na m e ., 2 012, 0 0, 1 -3 | 3
complex (Fe(Ox)+) is the predominant species of Fe(III)-oxalato
complexes at 1:1 of Fe(III) -to-oxalate ratio, whereas Fe(Ox)2- and
Fe(Ox)33- are the major species at Fe(III):oxalate<1:2. Since
Fe(Ox)2- and Fe(Ox)3
3- are much more efficiently photolyzed than Fe(Ox)+ and FeOH2+,11 the Fe(II) quantum yield, a collective value
contributed by each photolabile Fe complexes, should vary
significantly at different Fe(III)/oxalate concentrations.
Fig. 3. Molar fraction distribution of the Fe(III)-Ox complexes at
different Fe(III) concentrations: (a) 100 μM; (b) 200 μM; (c) 400 μM.
pH 3.0.
Due to the difficulty to obtain the quantum yield of each photolabile species within the range of 300-400 nm,19 here quantum
yields at the main emission wavelength (366 nm) of Hg lamp were
used to approximately evaluate the reactivity under polychromatic
irradiation as used in the study. Because of their similar nLpOH-
dLMCT absorption, FeOH2+ was assumed to have roughly close
photoreduction reactivity to that of FeOH2+ (Ф366 nm≈0.017)20,21, and
therefore was regarded equivalent to FeOH2+ in this study. According
to recently reported values by Weller et al.19, Fe(II) quantum yield of
Fe(Ox)2- and Fe(Ox)3
3- is 1.17 and 0.91, respectively. The total Fe(II)
quantum yield (Фtot) at 366 nm can be estimated by the following
equation 8:
i i
iiiii ff /tot (8)
Where fi, the molar fraction of a specific species i; εi, molar
extinction coefficient of species i; Фi, individual quantum yield of
species i for Fe(II) formation. Ф(Fe(Ox)+) and ε(Fe(Ox)+) were
estimated as 0 and 753 M -1 cm-1,11,19 respectively. Other parameters
were from refs. 19, 20. Fig. S2 shows the estimated Фtot profile at different oxalate
concentrations. At [Ox2-]<50 μM (for 100 μM Fe(III)), [Ox2-]<100
μM (for 200 μM Fe(III)) and [Ox2 -]<200 μM (for 400 μM Fe(III)),
respectively, Фtot was extremely low and even lower than the control
system (without oxalate ligand). A further increase in [Ox2 -], the corresponding Фto t gradually increased to the maximum value (≈1.1).
This result aligns well with the dependence of AO7 degradation rate
on the total oxalate concentrations, as demonstrated in Fig.2. It
implies that reactivity of PFS is strongly related to the Fe speciation
and the photoreactivity of the prevalent Fe species. It also can be expected that photodegradation efficiency of PFS would greatly
diminish as oxalate ligand is quickly depleted.
Fig. 4. ESR spectra of DMPO radical-adducts formed during the
photolysis of Fe(III)/Ox solution under argon-purged conditions.
DMPO, 0.04 M; pH, 3.0. (a) Ox only, 1000 μM. (b) Fe(III) only, 200 μM. (c) simulated data of b. (d) Fe(III), 200 μM; Ox, 100 μM. (e)
simulated data of d. (f) Fe(III), 200 μM; Ox, 400 μM. (g) Fe(III), 200
μM; Ox, 1000 μM. (h) Fe(III), 100 μM; Ox, 1000 μM. (i) simulated
data of h.
Free radicals involved
Photogeneration of Fe(II) may occur through two different ways: the
primary photoreduction of Fe(III) complexes (Eqs. 1, 2) and the
secondary reduction by the intermediate radical, such as CO2•-
(Eq.3). Фtot for Fe(II) generation would be significantly affected by
the competitive reaction of CO2•- with O2. In contrast, excess Fe(III)
(relative to O2) would inhibit the formation of H2O2 by quenching
Page 3 of 5 RSC Advances
COMMUNICATION Journal Name
4 | J. Nam e. , 2012, 0 0, 1 -3 This journal is © The Royal Society of Chemistry 2012
CO2•-. Here ESR with DMPO as spin-trapping reagent was
employed to determine reactive radicals involved in the reaction
systems. To avoid the interference of dioxygen with carbon-centered
radicals measurement, the ESR experiments were conducted under anaerobic conditions. As shown in Fig.4, two kinds of radicals were
identified. The six-line ESR signal was assigned to DMPO-CO2•-
adduct22 (αH=18.9 G, αN=15.8 G) (Fig.4d, 4h), while the four -line
one was known to be DMPO-•OH (αN=αH=14.8 G)23 (Fig. 4b). In the
absence of oxalate, photolysis of hydroxylated Fe(III) complexes generates •OH radicals (Fig. 4b). With addition of 100 μM oxalate,
the signal of DMPO-CO2•- adduct appeared. According to Fig.3b,
about 40% of Fe(III) was present as photo-inert Fe(Ox)+,
hydroxylated Fe(III) complexes being half of total Fe(III). Thus,
CO2•- should not be originated from photolysis of Fe(Ox)+, but from
the attack of oxalate by photogenerated •OH (Eq. 9).24 Interestingly,
a further increase of oxalate concentration (i.e. 400 μM and 1000
μM) led to disappearance of CO2•- signal (Fig. 4f, 4g). However,
CO2•- was measurable in the presence of 100 μM Fe(III) and 1000
μM oxalate (Fig. 4h). This significant comparison indicates the yield of CO2
•- was closely related to the abundance of Fe(III). DMPO
might efficiently trap CO2•- at a lower Fe(III) content, but it is not the
case at a higher level of Fe(III) where photoproduced CO2•- might be
promptly captured by its adjacent Fe(III)-oxalato complexes. -
2
-
2
-2
42 OHCOCO OH OC (9)
Conclusion
In this study, photochemistry of Fe(III)-oxalato complexes was
investigated at varied levels of Fe(III) and oxalate. There was no
measurable H2O2 accumulated at 200 μM Fe(III), partly due to the decrease of H2O2 formation resulted from CO2
•- capture by excess
Fe(III) and rapid consumption of H2O2 by photogenerated Fe(II).
With the increase of oxalate concentration, photo-inert Fe(Ox)+,
most photoactive Fe(Ox)2- and Fe(Ox)3
3- dominated the Fe(III)
speciation and thus controlled the overall photochemical reactivity of Fe complexes. At Fe(III):oxalate<1:2, •OH photoproduction
efficiency, as probed by AO7 decoloration rate, was quite low
compared with those with excess oxalate ligand. This result is very
important for optimizing operation of photo/ferrioxalate system in its
application of water treatment.
Acknowledgments
This work was financially supported by National Natural
Science Foundation of China (NSFC) (Grant Nos. 41273108
and 21377023) and Fundament al Research funds for Central Univers ities Central (2232013A3-08). Z.H.W wishes to thank
Prof. Jincai Zhao at ICCAS for his generous support for ESR
measurements.
Notes and references State Environmental Protection Engineering Center for Pollution
Treatment and Control in Textile Industry, College of Environmental Science and Engineering, Donghua University, Shanghai, 201620,
China *Corresponding author. fax +86-21-6779-2522. E-mail:
[email protected] (Z. Wang)
Electronic Supplementary Information (ESI) available: [TOC result;
Estimated quantum yield at 366 nm]. See DOI: 10.1039/c000000x/
1. M.E. Balmer and B. Sulzberger. Environ. Sci. Technol. 1992, 26,
1014.
2. J. Jeong and J. Yoon. Water Res. 2005, 39, 2893.
3. J. Jeong and J. Yoon. Water Res. 2004, 38, 3531.
4. G. Liu, S. Zheng, X. Xing, Y. Li, D. Yin, Y. Ding and W. Pang.
Chemosphere 2010, 78, 402.
5. B. C. Faust and R. G. Zepp. Environ. Sci. Technol. 1993, 27, 2517.
6. Y. Zuo and J. Hoigné. Environ. Sci. Technol. 1992, 26, 1014.
7. J. Chen, H. Zhang, I. V. Tomov and P. M. Rentzepis. Inorg. Chem.
2008, 47, 2024.
8. I. P. Pozdnyakov, O. V. Kel, V. F. Plyusnin, V. P. Grivin and N. M.
Bazhin. J. Phys. Chem. A 2008, 112, 8316.
9. Z. Wang, C. Chen, W. Ma and J. Zhao. J. Phys. Chem. Lett. 2012, 3,
2044.
10. P. S. Surdhar, S. T . Mezyk and D. A. Armstrong. J. Phys. Chem .
1989, 93, 3360.
11. L. Vincze and S. Papp. J. Photochem . 1987, 36, 289.
12. Z. Wang, X. Chen, W. Ma, C. Chen and J. Zhao. Environ. Sci.
Technol. 2010, 44, 263.
13. H. Tamura, K. Goto, T . Yotsuyanagi and M. Nagayama. Talanta
1974, 21, 314.
14. H. Bander, V. Sturzenegger and J. Hoigne. Water Res. 1988, 22,
1109.
15. Z. Wang, R. Yuan, Y. Guo, L. Xu and J. Liu. J. Hazard. Mater. 2011,
190, 1083.
16. I. Puigdomenech. MEDUSA-Make Equilibrium Diagrams Using
Sophisticated Algorithms. 2010. Available at:
http://www.kemi.kth.se/medusa/.
17. D. L. Sedlak and J. Hoigné. Atmos. Environ. 1993, 27A, 2173.
18. S. Hammami, N. Bellakhal, N. Oturan, M. A. Oturan and M.
Dachraoui. Chemosphere 2008, 73, 678.
19. C. Weller, S. Horn and H. Herrmann. J. Photochem. Photobiol. A
Chem . 2013, 255, 41.
20. B. C., Faust and J. Hoigné. Atmos. Environ. 1990, 24, 79.
21. H-J. Benkelberg and P. Warneck. J. Phys. Chem . 1995, 99, 5214.
22. F. A.Villamena, E.J. Locigno, A. Rockenbauer, C.M. Hadad and J.L.
Zweier. J. Phys. Chem. A. 2006, 110, 13253.
23. S. J. Klebanoff, A. M. Waltersdorph, B. R. Michel and H. Rose. J.
Biol. Chem . 1989, 264, 19765.
24. G. V. Buxton, C. L. Greenstock, W. P. Helman and A. B. Ross. J.
Phys. Chem. Ref. Data. 1988, 17, 513.
Page 4 of 5RSC Advances
Journal Name COMMUNICATION
This journal is © The Royal Society of Chemistry 2012 J . Na m e ., 2 012, 0 0, 1 -3 | 5
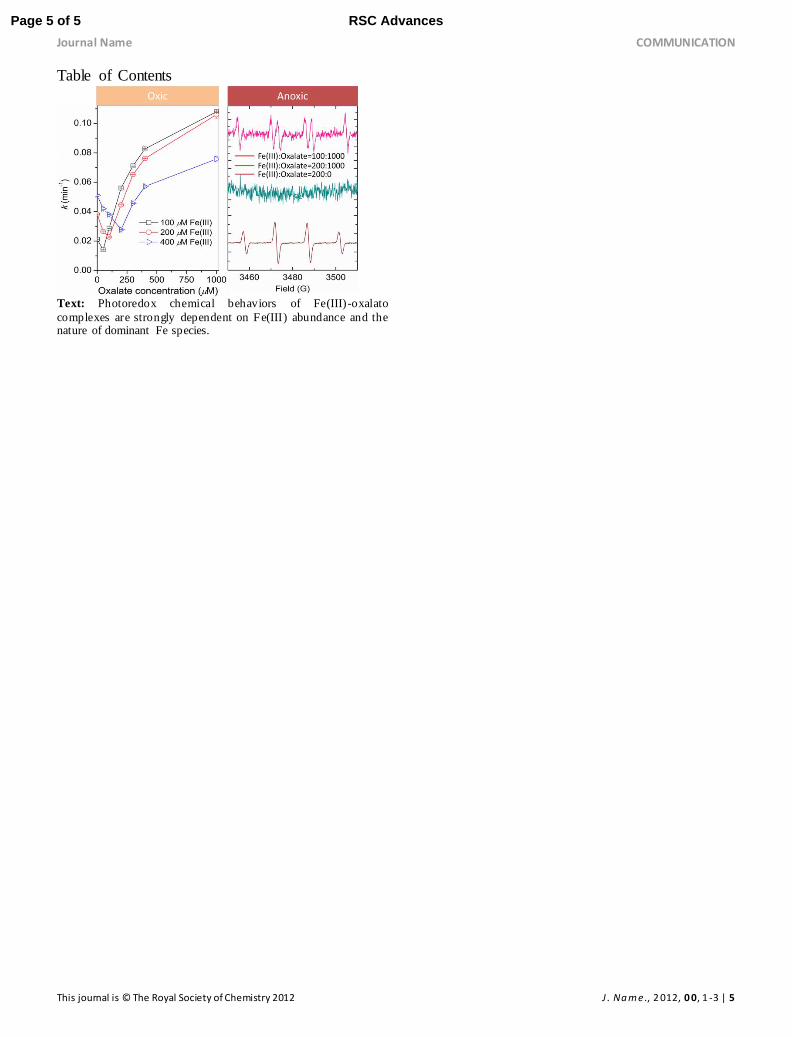
Table of Contents
Text: Photoredox chemical behaviors of Fe(III)-oxalato
complexes are strongly dependent on Fe(III) abundance and the nature of dominant Fe species.
Page 5 of 5 RSC Advances