Embed Size (px)
Citation preview
Does a country’s scientific ‘productivity’ dependcritically on the number of country journals indexed?
Aparna Basu
Received: 11 May 2009 / Published online: 10 February 2010� Akademiai Kiado, Budapest, Hungary 2010
Abstract In this paper, we examine the question whether it is meaningful to talk about
the scientific productivity of nations based on indexes like the Science Citation Index or
Scopus, when the journal set covered by them keeps changing with time. We hypothesize
from the illustrative case of India’s declining productivity in the 1980s which correlated
with a fall in its journals indexed, that an apparent increase/decrease in productivity for any
country, based on observed change in its share of papers could, in fact, be an effect
resulting from the inclusion of more/less journals from the country. To verify our
hypothesis we have used SCIMAGO data. We found that for a set of 90 countries, the share
of journals regressed on the share of papers gave a linear relationship that explained 80%
of the variance. However, we also show that in the case of China’s unusual rise in world
scientific productivity (to second rank crossing several other countries), there is yet another
factor that needs to be taken into account. We define a new indicator—the JOURNAL
PACKING DENSITY (JPD) or average number of papers in journals from a given country.
We show that the packing density of Chinese journals has steadily increased over the last
few years. Currently, Chinese journals have the highest ‘packing density’ in the world,
almost twice the world average which is about 100 papers per journal per annum. The
deviation of the JPD from the world average is another indicator which will affect so called
‘national productivities’ in addition to the number of national journals indexed. We con-
clude that in the context of a five fold increase in the number of journals indexed over
20 years, the simplistic notion of ‘scientific productivity’ as equivalent to papers indexed
needs to be re-examined.
Keywords Bibliometrics � Publications � Country share � Journals �Scopus � SCImago � Web of Science � China � India
A. Basu (&)CSIR, Rafi Marg, New Delhi 110001, Indiae-mail: [email protected]
123
Scientometrics (2010) 82:507–516DOI 10.1007/s11192-010-0186-8
Introduction
The Science Citation Index, which was initially developed by Eugene Garfield in the
nineteen sixties as a research aid, came to be used extensively after the seventies as a
source for bibliometric studies. At the time of starting, the Science Citation Index included
less than a thousand international journals from several fields of science. Some criteria
were set for the inclusion of journals, such as quality (reputation and acceptance among
scientists), timeliness of publications, etc. In fact inclusion in the Science Citation Index
was synonymous with high quality. The average citedness of a journal gave a quantitative
indicator, the Impact Factor, which is now widely accepted as indicating journal quality.
The country share of papers is also routinely used as a measure of the scientific produc-
tivity of nations.
Over the years, the number of journals included in the SCI has steadily increased, partly
due to editors’ continued endeavour to ensure that more journals, both old and new, are
included by SCI, and partly due to ISI’s (now Thomson Reuters) own need to widen its
coverage of scientific journals. The proportion of internationally authored articles in some
of these journals can be quite low, with most papers being authored by scientists from
within the country of publication (Moed 2002). This in turn could produce a dispropor-
tionately high figure for the number of articles published from the country, leading to the
conclusion that the country’s productivity has increased, while in fact what has happened is
that an additional set of papers from the country have acquired visibility simply on account
of the inclusion of some journals in the SCI. This raises two related questions, (i) how valid
is it to look for temporal changes in the productivity of countries if the journal mix and
country share of journals indexed has changed, and (ii) how valid is it to compare the
productivity of countries when the country shares of journals are different, and the journal
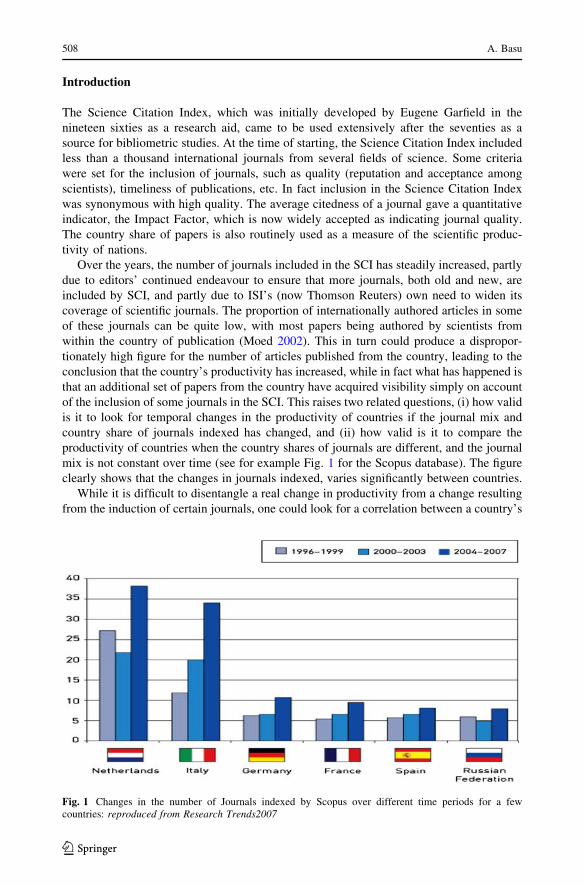
mix is not constant over time (see for example Fig. 1 for the Scopus database). The figure
clearly shows that the changes in journals indexed, varies significantly between countries.
While it is difficult to disentangle a real change in productivity from a change resulting
from the induction of certain journals, one could look for a correlation between a country’s
Fig. 1 Changes in the number of Journals indexed by Scopus over different time periods for a fewcountries: reproduced from Research Trends2007
508 A. Basu
123
share of journals and its share of papers. This would support the hypothesis that in spite of
the projected international nature of science, in general, the major contribution to a
country’s papers comes from its own journals. While this is to be expected, it nevertheless
raises questions about bibliometric inferences drawn.
Background: India’s declining productivity in the 1980s
In 1996, a Nature paper Raghuram and Madhavi commented upon India’s declining
ranking in terms of share of papers in SCI. It also pointed out that not only the share but the
annual output of papers fell in absolute terms during the 1980s. This was attributed to the
falling productivity of Indian scientists, and it became a subject of debate among scientists
and science managers. All policy prescriptions were aligned towards creating conditions
for raising productivity levels, and the entire discussion centred on poor research condi-
tions in laboratories, need to change strategies, improving funding in universities, etc.
A closer look at the SCI data revealed that the number of journals from India indexed in
SCI grew from less than 10 journals to 40 gradually in the 20 year period 1960–1980 and
thereafter fell from 40 to about 10–11. The fall in papers coincided approximately with the
fall in the number of journals indexed. In several papers refuting the inferences on falling
productivity in the Nature paper, we argued that India’s share of scientific publications fell
from close to 3% of world publications to less than 1.5% in the given time period, not
because of causes internal to the science system as had been claimed, but possibly due to a
fall in the journals indexed (Basu 1999a, b). It was shown that India’s share of scientific
papers declined over the 1980s when the number of journals indexed fell by more than
half. In the 1990s, the number of Indian journals indexed remained fairly constant and the
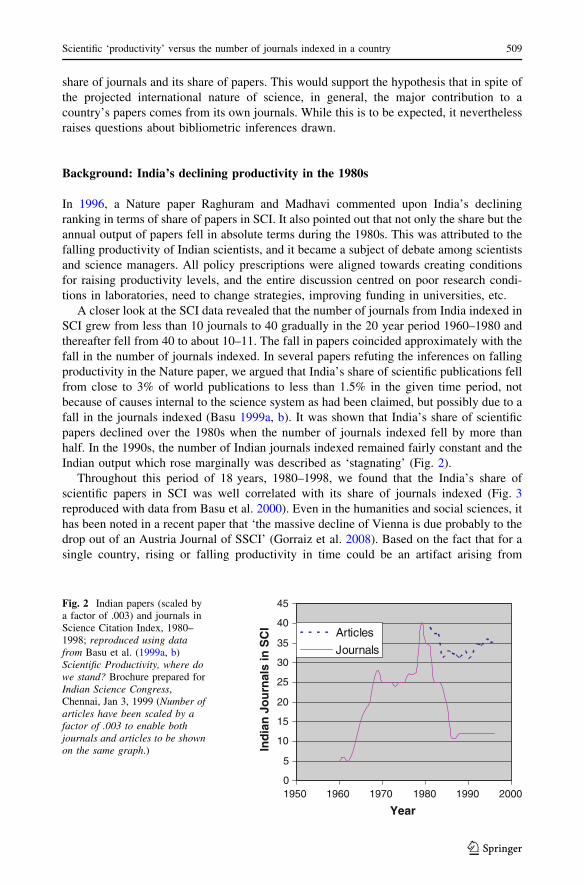
Indian output which rose marginally was described as ‘stagnating’ (Fig. 2).
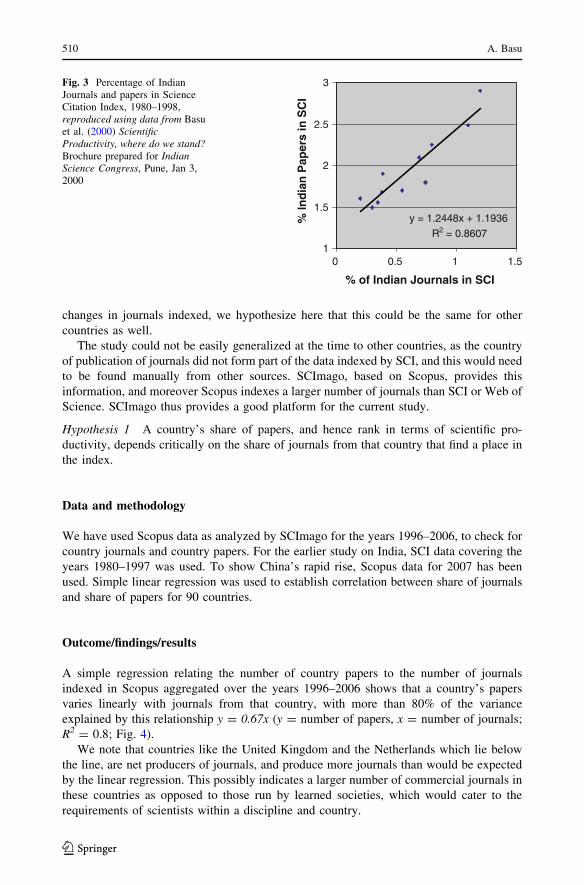
Throughout this period of 18 years, 1980–1998, we found that the India’s share of
scientific papers in SCI was well correlated with its share of journals indexed (Fig. 3
reproduced with data from Basu et al. 2000). Even in the humanities and social sciences, it
has been noted in a recent paper that ‘the massive decline of Vienna is due probably to the
drop out of an Austria Journal of SSCI’ (Gorraiz et al. 2008). Based on the fact that for a
single country, rising or falling productivity in time could be an artifact arising from
0
5
10
15
20
25
30
35
40
45
1950 1960 1970 1980 1990 2000
Year
Ind
ian
Jo
urn
als
in S
CI Articles
Journals
Fig. 2 Indian papers (scaled bya factor of .003) and journals inScience Citation Index, 1980–1998; reproduced using datafrom Basu et al. (1999a, b)Scientific Productivity, where dowe stand? Brochure prepared forIndian Science Congress,Chennai, Jan 3, 1999 (Number ofarticles have been scaled by afactor of .003 to enable bothjournals and articles to be shownon the same graph.)
Scientific ‘productivity’ versus the number of journals indexed in a country 509
123
changes in journals indexed, we hypothesize here that this could be the same for other
countries as well.
The study could not be easily generalized at the time to other countries, as the country
of publication of journals did not form part of the data indexed by SCI, and this would need
to be found manually from other sources. SCImago, based on Scopus, provides this
information, and moreover Scopus indexes a larger number of journals than SCI or Web of
Science. SCImago thus provides a good platform for the current study.
Hypothesis 1 A country’s share of papers, and hence rank in terms of scientific pro-
ductivity, depends critically on the share of journals from that country that find a place in
the index.
Data and methodology
We have used Scopus data as analyzed by SCImago for the years 1996–2006, to check for
country journals and country papers. For the earlier study on India, SCI data covering the
years 1980–1997 was used. To show China’s rapid rise, Scopus data for 2007 has been
used. Simple linear regression was used to establish correlation between share of journals
and share of papers for 90 countries.
Outcome/findings/results
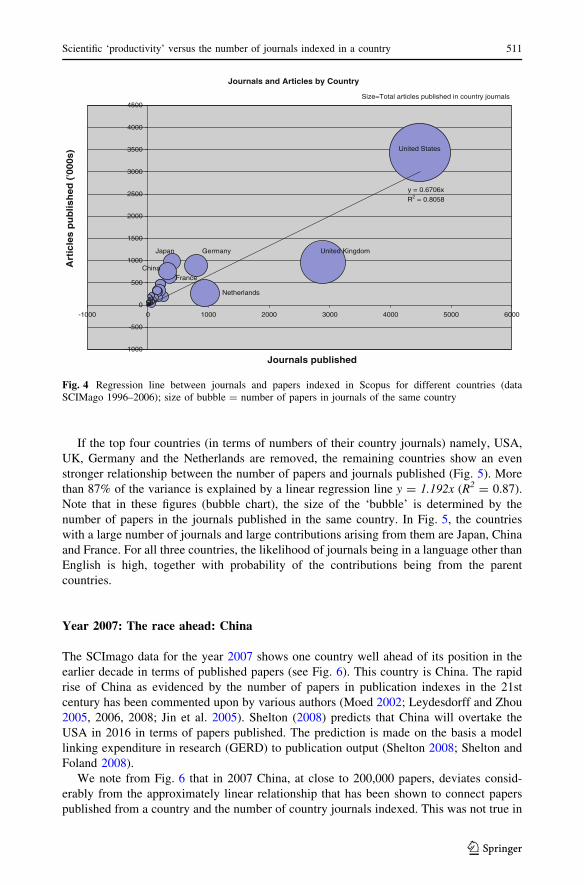
A simple regression relating the number of country papers to the number of journals
indexed in Scopus aggregated over the years 1996–2006 shows that a country’s papers
varies linearly with journals from that country, with more than 80% of the variance
explained by this relationship y = 0.67x (y = number of papers, x = number of journals;
R2 = 0.8; Fig. 4).
We note that countries like the United Kingdom and the Netherlands which lie below
the line, are net producers of journals, and produce more journals than would be expected
by the linear regression. This possibly indicates a larger number of commercial journals in
these countries as opposed to those run by learned societies, which would cater to the
requirements of scientists within a discipline and country.
y = 1.2448x + 1.1936
R2 = 0.86071
1.5
2
2.5
3
0 0.5 1 1.5
% of Indian Journals in SCI
% In
dia
n P
aper
s in
SC
I
Fig. 3 Percentage of IndianJournals and papers in ScienceCitation Index, 1980–1998,reproduced using data from Basuet al. (2000) ScientificProductivity, where do we stand?Brochure prepared for IndianScience Congress, Pune, Jan 3,2000
510 A. Basu
123
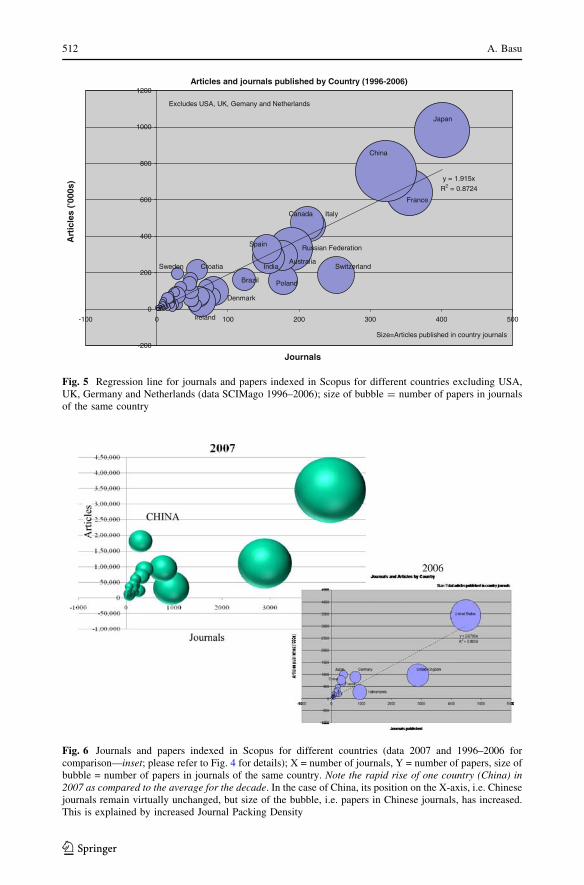
If the top four countries (in terms of numbers of their country journals) namely, USA,
UK, Germany and the Netherlands are removed, the remaining countries show an even
stronger relationship between the number of papers and journals published (Fig. 5). More
than 87% of the variance is explained by a linear regression line y = 1.192x (R2 = 0.87).
Note that in these figures (bubble chart), the size of the ‘bubble’ is determined by the
number of papers in the journals published in the same country. In Fig. 5, the countries
with a large number of journals and large contributions arising from them are Japan, China
and France. For all three countries, the likelihood of journals being in a language other than
English is high, together with probability of the contributions being from the parent
countries.
Year 2007: The race ahead: China
The SCImago data for the year 2007 shows one country well ahead of its position in the
earlier decade in terms of published papers (see Fig. 6). This country is China. The rapid
rise of China as evidenced by the number of papers in publication indexes in the 21st
century has been commented upon by various authors (Moed 2002; Leydesdorff and Zhou
2005, 2006, 2008; Jin et al. 2005). Shelton (2008) predicts that China will overtake the
USA in 2016 in terms of papers published. The prediction is made on the basis a model
linking expenditure in research (GERD) to publication output (Shelton 2008; Shelton and
Foland 2008).
We note from Fig. 6 that in 2007 China, at close to 200,000 papers, deviates consid-
erably from the approximately linear relationship that has been shown to connect papers
published from a country and the number of country journals indexed. This was not true in
Journals and Articles by Country
y = 0.6706x
R2 = 0.8058
-1000
-500
0
500
1000
1500
2000
2500
3000
3500
4000
4500
-1000 0 1000 2000 3000 4000 5000 6000
Journals published
Art
icle
s p
ub
lish
ed (
'000
s)
United States
United KingdomJapan Germany
Netherlands
Size=Total articles published in country journals
China
France
Fig. 4 Regression line between journals and papers indexed in Scopus for different countries (dataSCIMago 1996–2006); size of bubble = number of papers in journals of the same country
Scientific ‘productivity’ versus the number of journals indexed in a country 511
123
Articles and journals published by Country (1996-2006)
y = 1.915x
R2 = 0.8724
-200
0
200
400
600
800
1000
1200
-100 0 100 200 300 400 500
Journals
Art
icle
s ('0
00s)
Excludes USA, UK, Gemany and Netherlands
Japan
France
China
Switzerland
ItalyCanada
Russian Federation
Poland
Australia
Spain
India
Brazil
Denmark
CroatiaSweden
ireland
Size=Articles published in country journals
Fig. 5 Regression line for journals and papers indexed in Scopus for different countries excluding USA,UK, Germany and Netherlands (data SCIMago 1996–2006); size of bubble = number of papers in journalsof the same country
Fig. 6 Journals and papers indexed in Scopus for different countries (data 2007 and 1996–2006 forcomparison—inset; please refer to Fig. 4 for details); X = number of journals, Y = number of papers, size ofbubble = number of papers in journals of the same country. Note the rapid rise of one country (China) in2007 as compared to the average for the decade. In the case of China, its position on the X-axis, i.e. Chinesejournals remain virtually unchanged, but size of the bubble, i.e. papers in Chinese journals, has increased.This is explained by increased Journal Packing Density
512 A. Basu
123
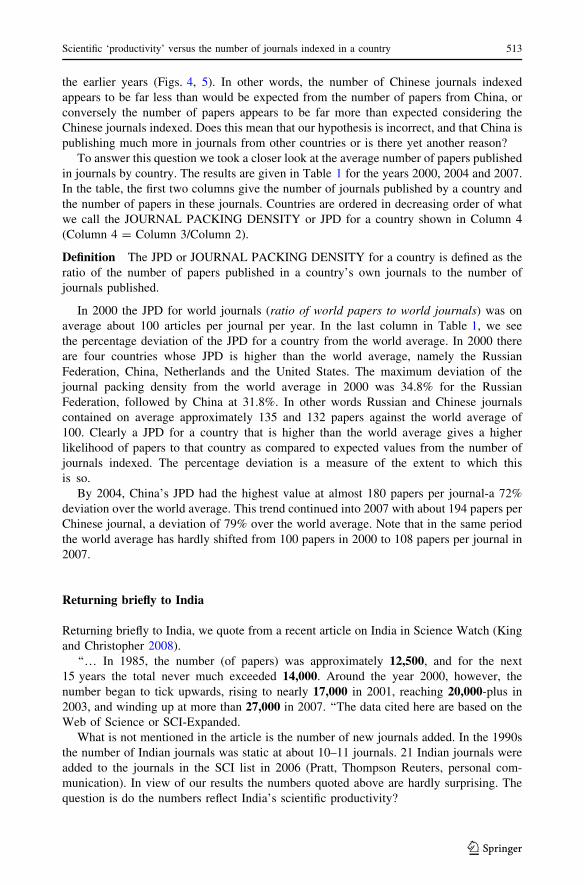
the earlier years (Figs. 4, 5). In other words, the number of Chinese journals indexed
appears to be far less than would be expected from the number of papers from China, or
conversely the number of papers appears to be far more than expected considering the
Chinese journals indexed. Does this mean that our hypothesis is incorrect, and that China is
publishing much more in journals from other countries or is there yet another reason?
To answer this question we took a closer look at the average number of papers published
in journals by country. The results are given in Table 1 for the years 2000, 2004 and 2007.
In the table, the first two columns give the number of journals published by a country and
the number of papers in these journals. Countries are ordered in decreasing order of what
we call the JOURNAL PACKING DENSITY or JPD for a country shown in Column 4
(Column 4 = Column 3/Column 2).
Definition The JPD or JOURNAL PACKING DENSITY for a country is defined as the
ratio of the number of papers published in a country’s own journals to the number of
journals published.
In 2000 the JPD for world journals (ratio of world papers to world journals) was on
average about 100 articles per journal per year. In the last column in Table 1, we see
the percentage deviation of the JPD for a country from the world average. In 2000 there
are four countries whose JPD is higher than the world average, namely the Russian
Federation, China, Netherlands and the United States. The maximum deviation of the
journal packing density from the world average in 2000 was 34.8% for the Russian
Federation, followed by China at 31.8%. In other words Russian and Chinese journals
contained on average approximately 135 and 132 papers against the world average of
100. Clearly a JPD for a country that is higher than the world average gives a higher
likelihood of papers to that country as compared to expected values from the number of
journals indexed. The percentage deviation is a measure of the extent to which this
is so.
By 2004, China’s JPD had the highest value at almost 180 papers per journal-a 72%
deviation over the world average. This trend continued into 2007 with about 194 papers per
Chinese journal, a deviation of 79% over the world average. Note that in the same period
the world average has hardly shifted from 100 papers in 2000 to 108 papers per journal in
2007.
Returning briefly to India
Returning briefly to India, we quote from a recent article on India in Science Watch (King
and Christopher 2008).
‘‘… In 1985, the number (of papers) was approximately 12,500, and for the next
15 years the total never much exceeded 14,000. Around the year 2000, however, the
number began to tick upwards, rising to nearly 17,000 in 2001, reaching 20,000-plus in
2003, and winding up at more than 27,000 in 2007. ‘‘The data cited here are based on the
Web of Science or SCI-Expanded.
What is not mentioned in the article is the number of new journals added. In the 1990s
the number of Indian journals was static at about 10–11 journals. 21 Indian journals were
added to the journals in the SCI list in 2006 (Pratt, Thompson Reuters, personal com-
munication). In view of our results the numbers quoted above are hardly surprising. The
question is do the numbers reflect India’s scientific productivity?
Scientific ‘productivity’ versus the number of journals indexed in a country 513
123
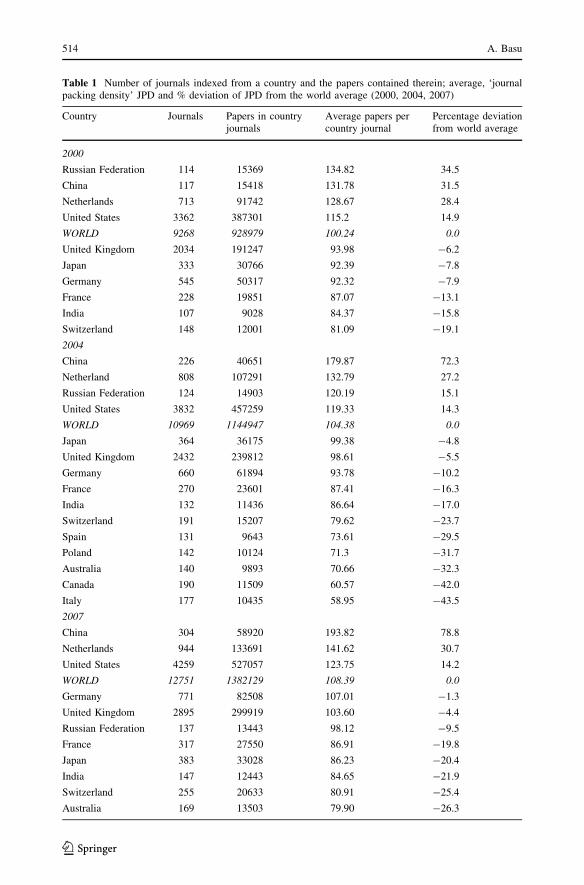
Table 1 Number of journals indexed from a country and the papers contained therein; average, ‘journalpacking density’ JPD and % deviation of JPD from the world average (2000, 2004, 2007)
Country Journals Papers in countryjournals
Average papers percountry journal
Percentage deviationfrom world average
2000
Russian Federation 114 15369 134.82 34.5
China 117 15418 131.78 31.5
Netherlands 713 91742 128.67 28.4
United States 3362 387301 115.2 14.9
WORLD 9268 928979 100.24 0.0
United Kingdom 2034 191247 93.98 -6.2
Japan 333 30766 92.39 -7.8
Germany 545 50317 92.32 -7.9
France 228 19851 87.07 -13.1
India 107 9028 84.37 -15.8
Switzerland 148 12001 81.09 -19.1
2004
China 226 40651 179.87 72.3
Netherland 808 107291 132.79 27.2
Russian Federation 124 14903 120.19 15.1
United States 3832 457259 119.33 14.3
WORLD 10969 1144947 104.38 0.0
Japan 364 36175 99.38 -4.8
United Kingdom 2432 239812 98.61 -5.5
Germany 660 61894 93.78 -10.2
France 270 23601 87.41 -16.3
India 132 11436 86.64 -17.0
Switzerland 191 15207 79.62 -23.7
Spain 131 9643 73.61 -29.5
Poland 142 10124 71.3 -31.7
Australia 140 9893 70.66 -32.3
Canada 190 11509 60.57 -42.0
Italy 177 10435 58.95 -43.5
2007
China 304 58920 193.82 78.8
Netherlands 944 133691 141.62 30.7
United States 4259 527057 123.75 14.2
WORLD 12751 1382129 108.39 0.0
Germany 771 82508 107.01 -1.3
United Kingdom 2895 299919 103.60 -4.4
Russian Federation 137 13443 98.12 -9.5
France 317 27550 86.91 -19.8
Japan 383 33028 86.23 -20.4
India 147 12443 84.65 -21.9
Switzerland 255 20633 80.91 -25.4
Australia 169 13503 79.90 -26.3
514 A. Basu
123
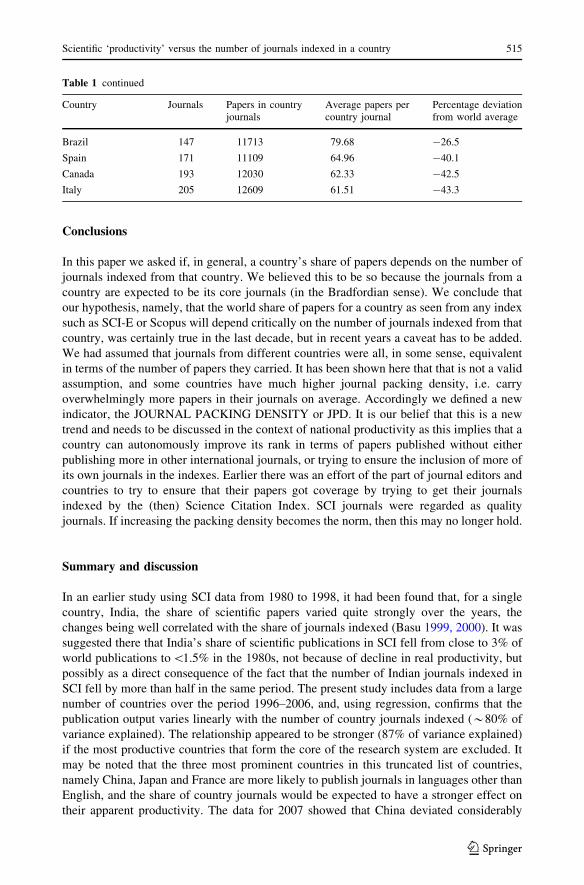
Conclusions
In this paper we asked if, in general, a country’s share of papers depends on the number of
journals indexed from that country. We believed this to be so because the journals from a
country are expected to be its core journals (in the Bradfordian sense). We conclude that
our hypothesis, namely, that the world share of papers for a country as seen from any index
such as SCI-E or Scopus will depend critically on the number of journals indexed from that
country, was certainly true in the last decade, but in recent years a caveat has to be added.
We had assumed that journals from different countries were all, in some sense, equivalent
in terms of the number of papers they carried. It has been shown here that that is not a valid
assumption, and some countries have much higher journal packing density, i.e. carry
overwhelmingly more papers in their journals on average. Accordingly we defined a new
indicator, the JOURNAL PACKING DENSITY or JPD. It is our belief that this is a new
trend and needs to be discussed in the context of national productivity as this implies that a
country can autonomously improve its rank in terms of papers published without either
publishing more in other international journals, or trying to ensure the inclusion of more of
its own journals in the indexes. Earlier there was an effort of the part of journal editors and
countries to try to ensure that their papers got coverage by trying to get their journals
indexed by the (then) Science Citation Index. SCI journals were regarded as quality
journals. If increasing the packing density becomes the norm, then this may no longer hold.
Summary and discussion
In an earlier study using SCI data from 1980 to 1998, it had been found that, for a single
country, India, the share of scientific papers varied quite strongly over the years, the
changes being well correlated with the share of journals indexed (Basu 1999, 2000). It was
suggested there that India’s share of scientific publications in SCI fell from close to 3% of
world publications to\1.5% in the 1980s, not because of decline in real productivity, but
possibly as a direct consequence of the fact that the number of Indian journals indexed in
SCI fell by more than half in the same period. The present study includes data from a large
number of countries over the period 1996–2006, and, using regression, confirms that the
publication output varies linearly with the number of country journals indexed (*80% of
variance explained). The relationship appeared to be stronger (87% of variance explained)
if the most productive countries that form the core of the research system are excluded. It
may be noted that the three most prominent countries in this truncated list of countries,
namely China, Japan and France are more likely to publish journals in languages other than
English, and the share of country journals would be expected to have a stronger effect on
their apparent productivity. The data for 2007 showed that China deviated considerably
Table 1 continued
Country Journals Papers in countryjournals
Average papers percountry journal
Percentage deviationfrom world average
Brazil 147 11713 79.68 -26.5
Spain 171 11109 64.96 -40.1
Canada 193 12030 62.33 -42.5
Italy 205 12609 61.51 -43.3
Scientific ‘productivity’ versus the number of journals indexed in a country 515
123
from the proposed linear relationship with many more papers than expected given the
number of Chinese journals indexed. This was attributed to increasing JOURNAL
PACKING DENSITY (JPD) whereby Chinese journals appeared to have continuously
increased in size in successive time periods in recent years.
Having said this, we are now faced with the question as to whether scientific produc-
tivity at the national level, as it is currently defined, is indeed a meaningful indicator of a
country’s performance, or is it merely an artifact of policies governing the data sources,
journals indexed and publication practices in journals (such as increasing packing density)?
The databases are designed primarily to cater to the needs of researchers/scientists and will
need to increase their coverage. Other commercial reasons can influence the decisions of
inclusion/exclusion of journals. As long as there was only a single data source, the ISI, this
question was tautological, but now with multiple sources, this question needs to be dis-
cussed. Clearly, in the context of a five fold increase in the number of journals indexed
over 20 years, the simplistic notion of ‘scientific productivity’ as equivalent to papers
indexed needs to be re-examined.
References
Basu, A. (1999a). Are Indian scientist’s losing in the world publishing race? A refutation. In P. S. Nagpaul,et al. (Eds.), Emerging trends in scientometrics. New Delhi: Allied Publishers.
Basu, A. (1999b). Science publication indicators for India: Questions of interpretation. Scientometrics, 44,347–360.
Basu, A. et al. (1999, 2000). Scientific Productivity, where do we stand?, Brief reports on Indian sciencebased on bibliometric indicators, prepared for Indian Science Congress, Chennai Jan 1999 and Pune,Jan 2000 (reprinted in Information Today and Tommrrow, 1999).
Gorraiz, J., Greil, M., Mayer, W., Reimann, R., Sturn, D., & Schiebel, E. (2008). International publicationoutput and research impact in the social sciences: Comparison of the universities of Vienna, Zurich andOslo in Excellence and Emergence: A new challenge for the combination of quantitative and quali-tative approaches, Book of Abstracts, tenth international conference on science and technology indi-cators, Vienna, p. 236.
Jin, B., & Rousseau, R. (2005). China’s quantitative expansion phase: Exponential growth, but low impact.Proceedings of the 10th international conference on scientometrics and informetrics, Stockholm.
King, C. (2008). India’s new millennium in science, Science Watch, Sep–Oct 2008.Leydesdorff, L., & Zhou, P. (2005). Are the contributions of China and Korea upsetting the world system of
science? Scientometrics, 63, 617–630.Moed, H. (2002). Measuring China’s research performance using the science citation index. Scientometrics,
53, 281–296.Raghuram, N., & Madhavi, Y. (1996). India’s declining ranking. Nature, 383, 572.SCImago. (2007). SJR—SCImago journal and country rank. Retrieved April 23, 2008 from http://www.
scimagojr.com.Shelton, R. D. (2008). China forecast to lead the U.S. in scientific publications within ten years, poster, tenth
international conference on science and technology indicators, Vienna, Sept. 2008. Working Paper:CpaperSummary9.12.8.doc.
Shelton, R. D., & Foland, P. (2008). National efficiencies in publishing scientific papers, in excellence andemergence: A new challenge for the combination of quantitative and qualitative approaches, Book ofAbstracts, tenth international conference on science and technology indicators, Vienna.
Scopus. http://www.scopus.com/scopus/home.url (Retrieved April 23, 2008).Science Citation Index. http://www.scientific.thomsonreuters.com/products/sci/.Thomson Scientific. (2007). Scientific output in china is growing. http://scientific.thomson.com/press/
2007/8423909/.Web of Science. http://www.scientific.thomson.com/products/wos/.Zhou, P., & Leydesdorff, P. (2000). China Ranks Second In Scientific Publications Since 2006, ISSI
Newsletter March 2000.Zhou, P., & Leydesdorff, L. (2006). The emergence of China as a leading nation in science. Research
Policy, 35(1), 83–104.
516 A. Basu
123


