Embed Size (px)
Citation preview
Strategic Management Journal Strat. Mgmt. J., 22: 221-235 (2001)
DOES GROUP MEMBERSHIP MATTER? EVIDENCE FROM THE JAPANESE STEEL INDUSTRY ANIL NAIR1* and SURESH KOTHA2 College of Business and Public Administration, Old Dominion University, Norfolk,
Virginia, U.S.A. 2University of Washington Business School, Seattle, Washington, U.S.A.
In this study we address criticism that performance differences among strategic groups found in past research may be spurious and attributable to firm effects. The Japanese steel industry provides the setting for the study. Our analysis is based on data from the carbon steel sector of the Japanese steel industry for the periods 1980-87 and 1988-93. A one-way ANOVA indicated that the average performance of firms in the two technology-based groups in this industry-the integrated mills and the minimills-were significantly different during the two periods. Subsequently, we performed a regression analysis to examine the residual group effect after controlling for both environment and firm-specific effects. We found that even after controlling for both environment and firm-specific effects group membership was significantly associated with firm performance. Copyright ? 2001 John Wiley & Sons, Ltd.
A strategic group comprises firms within an industry that have similar cost structures, degrees of product diversification, formal organization, or resource profiles (Bogner, Mahoney and Thomas, 1994; McGee and Thomas, 1986). Firms within a group are considered similar to each other compared to firms outside the group and within the same industry (Thomas and Venkatraman, 1988). Strategic groups within an industry are mutually exclusive and collectively exhaustive.
Starting with Hunt's (1972) identification of groups in the U.S. home appliance industry, research on strategic groups has grown substan- tially. This growth perhaps supports Thomas and Venkatraman's (1988) observation that strategic group research is a useful intermediate level of analysis between the firm and the industry. How- ever, despite the growing body of work that has
Key words: strategic groups; firm performance *Correspondence to: Anil Nair, College of Buisness and Public Administration, Old Dominion University, Hughes Hall 2008, Norfolk, VA 23529, U.S.A.
established the presence of groups in different industries, research on strategic groups has been the target of considerable criticism.
Several researchers (cf. Barney and Hoskisson, 1990; Cool, 1985; Cool and Schendel, 1988; Hatten and Hatten, 1987; Reger and Huff, 1993; Thomas and Venkatraman, 1988) have expressed concern over the different sets of variables and clustering algorithms used to identify groups. Bar- ney and Hoskisson (1990), for example, argued that the identification of groups within an industry is a mere methodological artifact, dependent pri- marily on the particular clustering algorithm used to generate them.
Another widely shared concern in strategic group literature is the mixed support for the relationship between group membership and per- formance (Lawless and Tegarden, 1991). Although some studies have found performance difference among groups (e.g., Dess and Davis, 1984; Oster, 1982), others have found no signifi- cant differences in performance (cf. Cool and Schendel, 1987; Cool and Schendel, 1988; Frazier and Howell, 1983).
Copyright ? 2001 John Wiley & Sons, Ltd. Received 20 June 1996 Final revision received 3 October 2000
f
I
222 A. Nair and S. Kotha
Cool and Schendel (1988) suggested that the conflicting findings may be because of improper identification of mobility barriers. But Barney and Hoskisson (1990) demonstrated that the perfor- mance differences between groups exist even when different sets of variables, irrespective of mobility barriers, were used to identify groups within an industry. They concluded that perform- ance differentials among groups may be the result of idiosyncratic firm attributes and may have little to do with group membership per se.
Such concerns about the existence of groups and their impact on firm performance are serious, because they undermine the very concept of stra- tegic groups and its meaningfulness to strategy research. Perhaps it is such concerns that led Dranove, Peteraf and Shanley (1998) to go so far as to assert that a strategic group exists only if the performance of members is an outcome of group characteristics, after controlling for firm and industry characteristics.
This study is an attempt to contribute to group- level research by addressing some of the concerns raised above. It primarily focuses on the following question: Does membership in a group affect firm- level performance? Employing data from the car- bon steel sector of the Japanese steel industry (JSI), this study attempts to isolate the direct effect of group affiliation on performance, after con- trolling for environment and firm-specific factors.
Two factors make the JSI an ideal setting in which to examine the direct effect of group membership on performance. First, this industry has two distinct groups-the integrated mills and the minimills-that produce ordinary or carbon steel.1 The presence of two distinct groups in this industry (as explained in greater detail below) is due to the different technological processes that firms in this industry use to produce steel. Thus, it helps us identify groups without resorting to any clustering algorithms.
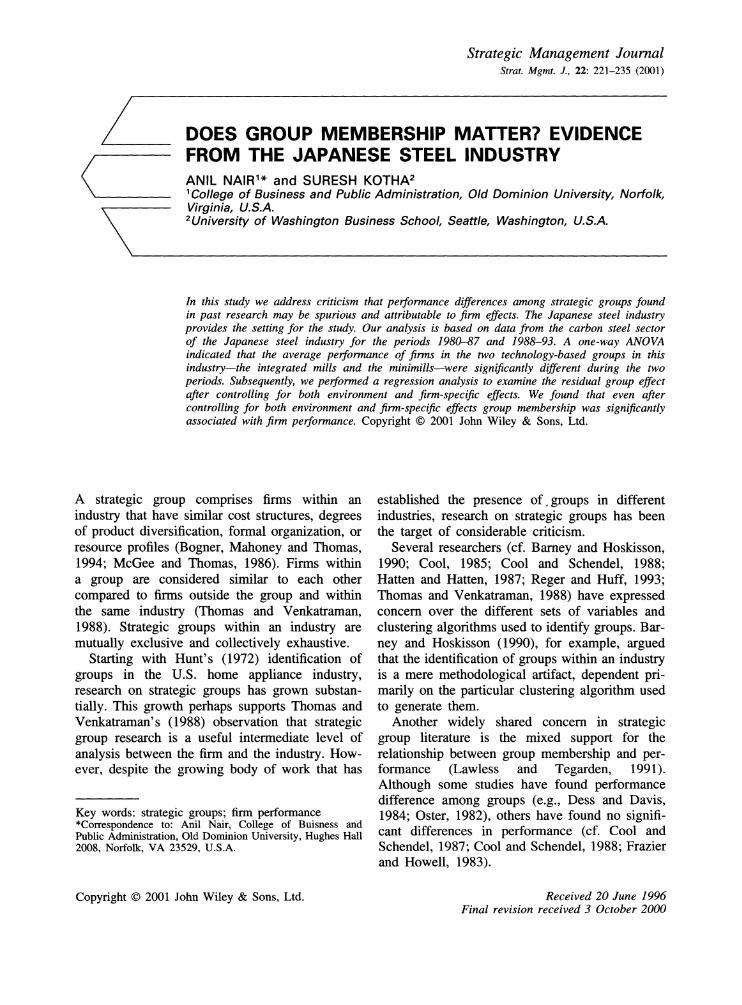
Second, the financial performance (measured as return on sales) of the two groups has changed
1 Steel products come in many grades and are classified into two broad groups: ordinary steel and specialty steel. Ordinary, or carbon steel, contains less than 0.6 percent carbon by weight. In contrast, specialty steel, in addition to the carbon content, contains many alloying elements like molybdenum, tungsten, vanadium, chromium, nickel, and manganese that provide it with special mechanical, physical, and corrosion- resistant properties. In 1993, special steel comprised approxi- mately 17.58% of total steel production. In the rest of our discussion, 'steel' refers to carbon steel.
over time (see Figure 1). The integrated mills outperformed the minimills during 1980-87. However, the minimills, as a group, outperformed their integrated counterparts during 1988-93. A priori knowledge that the two groups in the JSI differed in their mean performance levels pro- vides a stylized setting to examine whether per- formances of firms in the industry were directly associated with group membership. Thus, this study explicitly addresses Barney and Hoskisson's (1990) concern about the lack of clear evidence of the 'group effect' in past studies that have examined performance difference among groups.
We organize this paper as follows. First, we provide a brief history of the JSI and describe the two groups in this industry. Next, we discuss the theory and hypothesis driving our study. Then we describe the sample, methodology, and analy- ses. Finally, we present the results of our analyses and discuss their implications for strategic- groups research.
INDUSTRY BACKGROUND AND PRESENCE OF GROUPS
Before World War II, Japan had 35 blast furnaces and 280 open-hearth furnaces (OHF) that pro- duced approximately 7.65 million metric tons of steel. However, by the conclusion of World War II, only three blast furnaces and 22 OHFs were operating. Together these furnaces produced 557,000 metric tons of steel, less than 10 percent of the pre-World War II levels. In other words, by the end of World War II the production of steel in Japan collapsed.
Starting in 1946, the Economic Stabilization Board, a Japanese government agency, in consul- tation with the Supreme Commander of the Allied Powers, started programs to rebuild the core industries such as coal, electric power, and steel.
20 18 16 14 12
^ 10 8 6 4 2 0
+ +
0
+-
0 0
+ a
+
a
+ +
+ +
+ a
nl
Q
a a
a
0
80 82 84 86 88 90 92
Year
o Integrated + Minimill
Figure 1. Performance changes over time in JSI
Copyright ? 2001 John Wiley & Sons, Ltd. Strat. Mgmt. J., 22: 221-235 (2001)
Does Group Membership Matter? 223
In an effort to revive the steel industry, the Reconstruction Finance Bank of Japan provided financial funding for the acquisition of capital goods and working capital to firms in the industry (JISF, 1968). Additionally, many subsidies were extended to firms in the industry by other Japanese governmental agencies for the purchase of raw materials such as iron ore and coal, both of which were imported into Japan.
Despite these subsidies in 1950, the domestic prices of steel products in Japan were more than 50 percent higher than those in other industrialized nations. In order to make the JSI competitive, the Japanese government encouraged industry leaders to modernize equipment and improve their produc- tivity. This modernization program lasted from 1951 until 1955. It resulted in higher steel-making capacity and improved productivity.
Following the success of the first program, the Japanese government initiated a second moderni- zation program. This program, which lasted from 1956 until 1960, resulted in the setting up of several new steel plants. The number of blast furnaces increased from 21 to 34, the number of OHFs from 134 to 149, the number of basic- oxygen furnaces (BOFs) from zero to 13, and the number of electric-arc furnaces (EAFs) from 513 to 662. Due to such efforts and subsidies, the Japanese steel-makers became extremely com- petitive with the world's leading steel producers by the end of 1960.
Groups in the Japanese steel industry
The JSI has been dominated by the integrated mills. The integrated mills produce steel by first converting iron ore into pig iron in blast furnaces and subsequently reducing the pig iron into steel in BOFs. Japan also had a number of small steel producers starting as early as the 1920s. In contrast to the integrated producers, many of these small firms primarily used the EAFs for producing steel. The viability of small firms in competition with the well-financed larger firms was possible due to the availability of: (1) inexpensive ferrous scrap imported mainly from India and the United States; (2) cheap domestic labor; and (3) low-cost electric power during off-peak hours in Japan.2
2 In 1993, 31.2 percent of crude steel production in the JSI was done through the EAF process. This includes both carbon and special steel products.
Copyright ? 2001 John Wiley & Sons, Ltd.
After World War II, the main source of inputs for the small firms in the industry came from ferrous scrap left over from the war effort and imports from the United States. The war scrap was ultimately exhausted and, at the same time, imports became less dependable. As a result, the price of ferrous scrap in Japan became one of the highest in the world. This rise in ferrous scrap prices adversely affected the operating costs of small steel mills. However, the switch to BOF technology from OHF by the large integrated steel mills during the late 1950s and early 1960s considerably reduced their (integrated mills) dependency on ferrous scrap as an input to pro- duce steel. The earlier OHF technology deployed by the integrated producers required a 1:1 ratio of ferrous scrap and pig iron to produce carbon steel. In contrast, the newly adopted BOF tech- nology permitted the integrated mills to use a mere 1:9 ratio of ferrous scrap and pig iron to produce carbon steel.
By the late 1960s, as more and more integrated mills installed BOFs, the price of domestic fer- rous scrap dropped considerably, and at the same time Japan's dependency on imported ferrous scrap was also reduced. Furthermore, improve- ments in EAF technology in terms of furnace lining, transformer capacity, and electrode design occurred during the same period, increasing the capacity and quality of steel produced by the EAFs. Thus, the switch to BOF by the large integrated mills and changes in EAF technology benefited the small steel mills, and it ensured their long-term survival and attractiveness within the JSI (JISF, 1995). These changes ensured the presence of two distinct groups within the steel industry: the integrated mills and the minimills.
The two groups differ in their use of tech- nology, and critical inputs employed in the pro- duction of steel. The sunk costs and differences in technology create differences in resource endowments (Bogner et al., 1994), which in turn enable the existence of two separate groups. Additionally, the core-melting technology serves as a mobility barrier that prevents firms from switching groups.
Existential basis of groups
Perhaps responding to Barney and Hoskisson's (1990) concerns about the tendency of clustering algorithms to generate frivolous groups, Peteraf
Strat. Mgmt. J., 22: 221-235 (2001)
224 A. Nair and S. Kotha
and Shanley (1997) have suggested more robust criteria to establish the existence of groups. They argued that group members should have shared identities. Peteraf and Shanley (1997) assert that strategic group identities are shaped by similar and shared macro- and micro-level processes. According to them, macro-level processes com- prise institutional, economic, and historical forces. Whereas historical forces create irrevocable struc- tures that emerge out of path dependencies, eco- nomic forces create distinctions among firms based on characteristics such as scale, resource endowments, and technology (Peteraf and Shan- ley, 1997). Finally, institutional forces such as 'mimetic' and 'normative' pressures (DiMaggio and Powell, 1983) tend to produce convergence over time in firm behavior within a group.
In contrast to the above, micro-level processes that create homogeneity in behavior comprise the following: social identity, learning, and categoriza tion. Categorization processes result from man- agers' trying to make sense of a complex environ- ment (Fombrun and Zajac, 1987; Lant and Baum, 1995; Porac, Thomas and Baden-Fuller, 1989; Reger and Huff, 1993). Vicarious learning proc- esses, wherein firms use peers from their own groups as referent others, lead to convergence of member repertoire of strategies over time (Bandura, 1989). Finally, social identity processes reinforce the notion of membership in a group, and over time firm behavior tends to follow the group's norms. Thus, according to Peteraf and Shanley (1997) it is these macro- and micro-level forces that give rise to distinct group identities and form the existential basis of groups.
Groups in the JSI were subject to several of the macro processes discussed above. The two groups-integrated and minimills-were shaped by distinct historical forces. Integrated mills emerged out of institutionally coordinated efforts following World War II; the minimills, in con- trast, have existed since the early 1920s, and have a shared history based on their dependence on common inputs comprising electric power and ferrous scrap.
The differences in the technology adopted by the two groups (i.e., EAF vs. BOF) meant that they were subject to different economic forces. For example, differences in steel-melting tech- nology between the groups translate into differ- ences in economies of scale-integrated mills need larger capacities to achieve scale economies
Copyright ? 2001 John Wiley & Sons, Ltd.
compared to minimills. Finally, the two groups were also subject to different institutional pres- sures. As government agencies such as the Eco- nomic Stabilization Board, MITI, and the Recon- struction Finance Bank of Japan played a more critical role in the coordination and growth of the integrated mills, they were subject to different normative and coercive pressures than those belonging to the minimill group.
While we did not collect any direct evidence of micro-level processes, evidence of the outcome of both macro and micro processes are observed in the conduct of the two groups. For instance, according to O'Brien (1989), during the 1960s when the Ministry of International Trade and Industry's (MITI) power had declined, coordi- nation among firms continued through Jishu Cho- sei (self-regulation). Under this system, managers from leading Japanese steel companies met regu- larly at the Japan Iron and Steel Federation to coordinate production, pricing, export, and invest- ment plans. Also, when the integrated mills experienced a downturn in the mid-1980s, all but one of the firms started diversifying into the semiconductor business (The Economist, 1994). More recently, integrated mills have jointly attempted to develop the direct iron ore smelting reduction process (DIOS) (Iron Age New Steel, 1994). Thus, by virtue of their shared identities, the integrated and minimills constitute two dis- tinct groups within the JSI.
The above use of core-melting technology to identify groups overcomes the problems associated with the use of clustering methods to classify firms into groups (Barney and Hoskisson, 1990; Wiggins and Ruefli, 1995).3
3 The method we used here to identify the two groups may ignore the presence of finer groupings within the industry. An anonymous reviewer referred to this issue as the 'group within group within group' problem. To test if there were such finer groupings, we performed a cluster analysis of firms in JSI for the 1980-93 period using Ward's method. We followed decision rules developed by Fiegenbaum, Sudarshan, and Thomas (1990) to determine the number of groups. We performed the analysis using different sets of scope and resource commitment variables. The number of groups iden- tified each year ranged from three to six. The shifts in the number of groups identified, the lack of any meaningful interpretability of the groups based on industry reports, and discussion with analysts cause us to be suspicious of these groupings. Moreover, we could not assess the extent to which these groups had experienced distinct shared identities. In addition, such an approach violates Cool and Schendel's (1988) suggestion that groups should be identified on the basis of mobility barriers, which in this industry is the tech-
Strat. Mgmt. J., 22: 221-235 (2001)
Does Group Membership Matter? 225
THEORY AND HYPOTHESIS
The principal thrust of strategic groups research has been on examining the relationship between group membership and firm performance. This thrust reflects strategy researchers' orientation towards identifying factors that affect firm per- formance. As Thomas and Venkatraman (1988): 541) have aptly argued:
... strategic management is centrally concerned with issues of organizational performance ... and strategies are often evaluated in terms of perfor- mance implications ... Indeed, we go as far as to note that if strategic groups are to be truly useful for theory construction in strategic man- agement, then there should be a relationship between strategic group membership and per- formance criteria.
Recently Dranove et al. (1998) went so far as to assert that a strategic group exists only if the performance of members is an outcome of group characteristics, after controlling for firm and environment characteristics.
Group membership and performance
Group membership may be associated with firm performance for the following reasons: (1) differ- ences in intragroup competition; (2) asymmetrical impact of intergroup competition; (3) differences in the bargaining power of group members vis- a-vis customers and suppliers; and (4) the pres- ence of mobility barriers.
Intragroup competition
Firms within a strategic group may generate above-normal returns if the group characteristics prevent the emergence of perfect competition within it. In other words, some groups resemble oligopolies and are able to generate superior per- formance (Newman, 1978). Factors affecting oli- gopolistic coordination may include the number and size of firms within a group and their shared history (Porter, 1980). For example, a small num- ber of firms in a group may recognize their mutual interdependence and be able to achieve
nology used to melt steel. Thus, we proceeded with the technology-based grouping. Results of cluster analysis avail- able from authors on request.
Copyright ? 2001 John Wiley & Sons, Ltd.
tacit coordination and avoid excessive competition in product and factor markets, enabling members to generate above normal rents.
Intergroup competition
Intergroup competition in an industry depends upon the extent of market interdependence, num- ber of groups, and industry growth, among other factors (Porter, 1980). Excessive intergroup com- petition can reduce any above-normal profits that a firm could generate because of its unique strate- gies or intragroup factors discussed above. More- over, performance difference among groups might be caused if the effect of intergroup rivalry is asymmetrical. Asymmetries can exist when differ- ent groups possess different cost structures, diver- sification, or market power (Bogner et al., 1994; Nayyar, 1989). For example, in the brewing industry, excessive competition had differential effects on local, regional, and national brewers (Boeker, 1991).
Differences in bargaining power
Differences in bargaining power that the groups have vis-a-vis their suppliers and customers could also generate differences in profitability (Porter, 1980). This is especially true when factor or product markets are partitioned or do not com- pletely overlap. Under such conditions, groups within an industry may face different sets of suppliers and customers. The size of suppliers or customers, concentration, availability of substi- tutes, differentiation, and switching costs would influence the bargaining power that group mem- bers may have in product or factor markets (Porter, 1980). Differences in bargaining power among groups can create differences in rents generated by members in different groups (Dranove, Peteraf and Shanley, 1993).
Mobility barriers
Performance differences that emerge because of asymmetries in intra- or intergroup competition, or bargaining power in factor and product mar- kets, may disappear unless they are sustained by mobility barriers among groups. Mobility barriers are factors which deter or inhibit the movement of a firm from one strategic group to another (Caves and Porter, 1977; McGee and Thomas,
Strat. Mgmt. J., 22: 221-235 (2001)
226 A. Nair and S. Kotha
1986; Porter, 1980). These barriers prevent firms from low-performing groups from moving into high-performing groups and sustains performance difference among groups. In the absence of mobility barriers, firms from low-performing groups could easily move into the high- performing groups, increase intragroup compe- tition, and reduce the profitability of group mem- bers.
Performance in the JSI
In the JSI, several of the factors discussed above appear to be present. Mobility barriers are clearly high and asymmetrical in the JSI. Entry into the integrated group is extremely difficult because of the high investment costs-upwards of $5 billion. Entry barriers into the minimills group are rela- tively low at about $60 million.
In addition, the number and size of firms in the two groups differed considerably, creating differences in intragroup competition.4 There were seven integrated mills and nineteen minimills that produced carbon steel. In 1993, integrated mills had on average 18,460 employees and ?1.075 billion in sales. The minimills on average had 1307 employees and sales of Y119 million. The smaller number of firms in the integrated group increases the likelihood of achieving greater oli- gopolistic coordination.
The two groups also differed considerably in their product markets and cost structures that may create asymmetries in impact of intergroup competition. The integrated mills produce steel plates and I-section beams, in addition to bars and rods; whereas the minimills are predomi- nantly focused on the bar and rod segments of the product market. Because of the greater market overlap in the bar and rod segments, the minimill group members are more vulnerable to compe- tition from the integrated mills in these segments. On the other hand, differences in scale and over- head cost structures make the integrated group members more vulnerable during periods of decline in steel demand.
Partitioned factor markets, where the integrated mills principally use iron ore and coke as the
4 Whereas there were 45 blast furnaces in December 1994 in Japan, the number of EAFs was 480 (JISF, 1995). Each firm usually operates more than one furnace, and many of the EAFs are exclusively used to manufacture special or alloy steels.
Copyright ? 2001 John Wiley & Sons, Ltd.
input raw materials, while the minimills use fer- rous scrap, and the differences in the number and size of firms in the two groups (mentioned earlier) have resulted in differences in bargaining power that the two group members have with their suppliers. For example, the integrated mills were able to institute coordinated procurement of raw materials by acting as a single customer in inter- national markets (Mohan and Berkowitz, 1988). In contrast, the market for ferrous scrap, the key input for the minimills, is highly volatile because of the large number of EAF furnaces (carbon and special steel), and fluctuations in supply.5
In sum, the two groups in the JSI differ in terms of the number and size of firms in their groups, face asymmetric intergroup competition, have different bargaining powers in factor mar- kets, and are separated by substantial mobility barriers. Thus:
Principal Hypothesis: After controlling for firn- and environment-specific effects, group membership will be associated with firm-level performance.
METHODS
Sample and data
We collected data from publicly traded firms listed on the Tokyo, Osaka, and Nagoya Stock Exchanges. Our main source of data was the Analysts' Guide, one of the most respected and comprehensive sources of information on Japanese firms available today. This guide is published annually by Daiwa Securities, a leading financial services firm in Japan. Data from this guide have been used by other researchers (e.g., Lieberman, Lau and Williams, 1990; Kotha and Nair, 1995). This guide provides information on all the publicly traded companies on Japan's three most important stock exchanges: Tokyo, Osaka, and Nagoya.
To ensure the reliability of our data, we cross- checked the data obtained from this source with data available from the Japan Company Hand-
5 The ferrous-scrap requirements of the JSI are now increas- ingly met from domestic sources. Fluctuations in scrap supply depend on the demand for steel. In periods of high steel demand, scrap supply falls and prices rise; in periods of low steel demand, scrap supply is high and prices fall.
Strat. Mgmt. J., 22: 221-235 (2001)
Does Group Membership Matter? 227
book (JCH). JCH is another well-known source for data on Japanese firms. This guide is pub- lished quarterly by Toyo Keizai Inc. This investi- gation found no discrepancies between the two data sets.6
We focused on data for the period 1980-93. We chose 1980 as our starting year for the analyses because, by then, firms in the JSI had completely rebounded from the effects of the 1973 recession created by the global oil crisis caused by the Arab Oil Embargo. The oil embargo and the resultant increase in oil prices created tremendous hardships for Japanese firms because many of them were heavily dependent on imported oil as their primary energy source. Overall, the 12 firms in our sample together accounted for more than 90 percent of carbon steel sales in the JSI in 1993.
Group membership We operationalized membership in a group using two dummy variables: 'Group 1' and 'Group 2.' The Group 1 variable was assigned a value of '1' if a firm belonged to the integrated group and '0' otherwise. Similarly, 'Group 2' was assigned a value of '1' if a firm belonged to the minimills group and '0' otherwise. In a sample where only two categories exist, as in this case, only one dummy variable is included in the regression analysis. The excluded group thus becomes a reference group, and the regression coefficient will express the difference between the two group means (Hardy, 1993).
Performance
The financial performance measures employed in this study are return on sales (ROS) and return on assets (ROA). We assessed ROS as the ratio of operating income to total sales, and ROA as the ratio of operating income to total assets.7 Although these two measures may be distorted due to aggregations, it is generally acceptable
6 Although JCH is less comprehensive in its coverage of industry-level data than the Analysts' Guide, it is less expen- sive and widely available in most university libraries. We found no discrepancies between the two data sets. This was as expected since we were gathering financial and operating data on publicly traded companies. 7 It must be noted that Japanese firms tend, in general, to understate their asset values (Ito and Pucik, 1993).
when the firms in the sample are relatively undi- versified (Venkatraman and Ramanujam, 1986). In 1993, the most recent year in our sample, the average level of diversification for firms in our sample was less than 16 percent.
Control variables
Earlier we noted that many studies examining performance differences among strategic groups have failed to control for environment- and firm- specific effects. Controlling for such effects is important because without such controls it is impossible to isolate the direct effect of group membership on performance. Thus, we introduced the following environment- and firm-specific con- trol variables.
Environment variable
Environment-level changes have been shown to impact firm-level performance (Capon, Farley, and Hoenig, 1990). Additionally, such changes may have asymmetrical impact on the groups (and individual firms) within an industry. For instance, in periods when steel demand is high, scrap supply falls and prices rise; in periods of low steel demand, the availability of scrap supply is plentiful and hence prices tend to fall. As minimills are more dependent upon the price of ferrous scrap, the demand for steel has an asym- metric effect on the two groups.
We used 'environmental munificence' to con- trol for any changes in environment that may be associated with firm performance. 'Environmental munificence' describes the capacity of an environ- ment to support organizations in the market place (Yasai-Ardekani, 1989). We operationalized 'environmental munificence' as the change in gross domestic product (GDP) because GDP accounts for the magnitude of changes in resource availability between time periods.
Firm variables
To control for firm effects, we used firm-level realized strategy measures (Mintzberg, 1978), firm age, and firm size. We included firm size because this measure serves as a proxy for a variety of economic impediments related to mobility. We assessed size as the number of employees on the firm's payroll for each year. Firm age can help
Copyright ? 2001 John Wiley & Sons, Ltd. Strat. Mgmt. J., 22: 221-235 (2001)
228 A. Nair and S. Kotha
determine the efficiency of a firm's operations, equipment, and its access to and relationship with powerful networks that control distribution of steel products. Moreover, age serves as a proxy for tacit dimensions such as employee skills and organizational knowledge. We measured firm age as the chronological age of the firm since its founding.
In addition to age and size, we controlled for realized strategy measures such as employee productivity, capital expenditures, capital inten- sity, exports, and degree of diversification outside the steel industry (Hambrick, 1983). We oper- ationalized 'employee productivity,' a measure of realized firm-level efficiency, as price-index adjusted sales per employee for each year for each firm. 'Capital expenditures' and 'capital intensity' provide a measure of a firm's asset parsimony dimension (Hambrick, 1983). These two variables indicate a firm's commitment to employ technology to improve productivity and quality dimensions. We assessed 'capital expendi- tures' as net expenditures for plant and equip- ment, and 'capital intensity' as the ratio of total assets to the number of employees. We oper- ationalized a firm's 'exports' as the percentage of foreign sales to total sales, and 'diversification' as the percentage of total sales that it derived from businesses other than steel.
Each of these realized strategy variables was calculated for all firms in the sample for the period 1980-93.
Firm-specific effects While this study intends to control for firm-level variables (such as 'employee productivity'), it can be argued that some part of these variables can be attributed to the firm's membership in a group.8 Thus, to control for the true firm-level effects, the group effects have to be partialled out. Not doing so can result in double counting such effects in regression models that include both firm- and group-level variables. Further, there is also the possibility that having both sets of variables can induce collinearity problems in the analyses.9
8 We thank the reviewers for providing this insight. 9 Even a variable such as age can have a group component, i.e., firms that are founded during the same time reflect the technology and strategies of the period, and thereby belong to a group (Stinchombe, 1965).
To prevent such distortions, we first isolated the firm-specific effect by running a regression analysis with the firm-level variables (employee productivity, capital expenditures, exports, age, capital intensity, and diversification) as the depen- dent variables, and the group-level dummy vari- able (GR1) as the independent variable. The model specification was as follows:
Yi = K + i Xi + E (1)
Here Yi is the ith strategy of a firm. Xi is the group dummy variable. The residuals in the above model constitute the firm-specific effect after the group effect has been filtered out. These residuals were used to perform the analysis in Equation 2, described below.
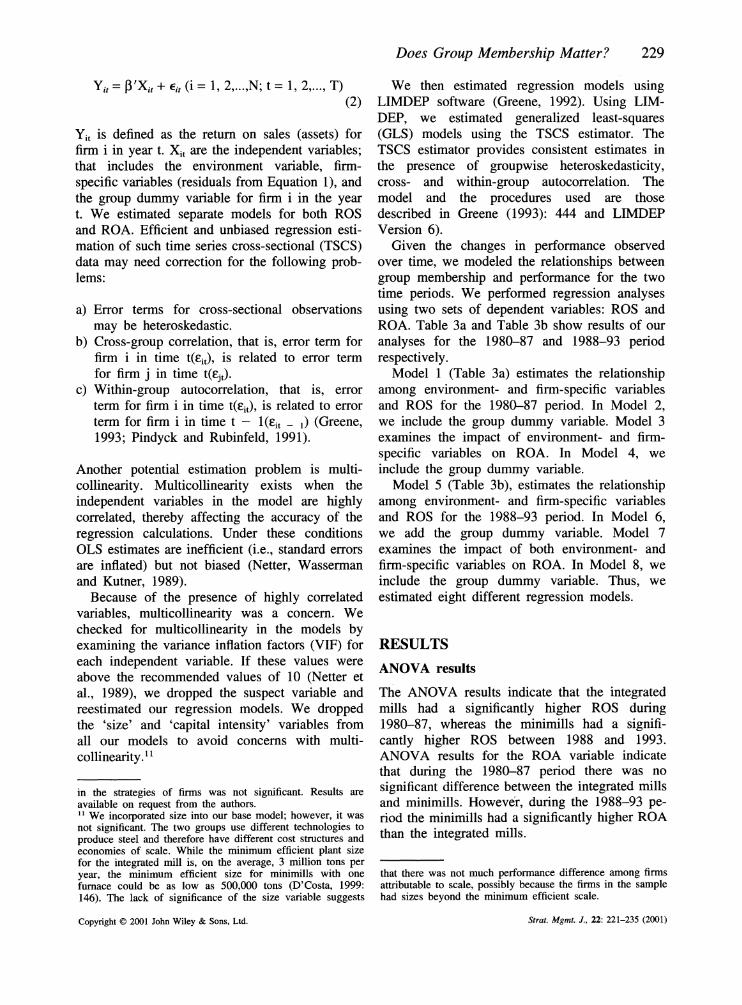
Analyses Table 1 provides the descriptive statistics and zero-order correlations among the dependent and independent variables.
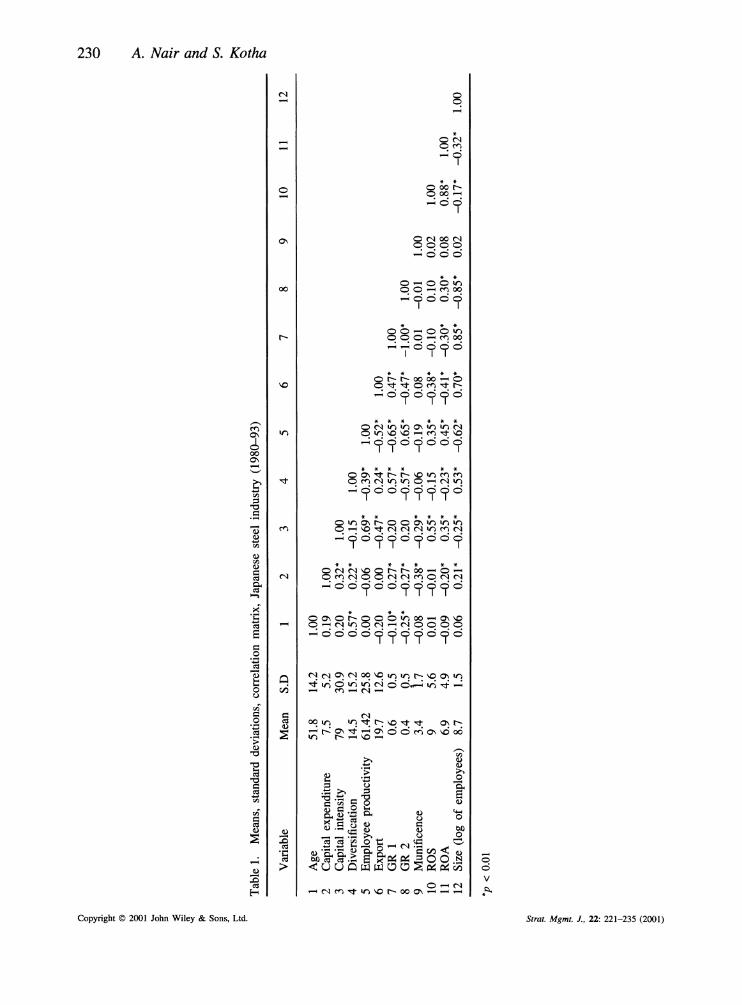
As illustrated in Figure 1, performance differ- ences (ROS) between the integrated mills and minimills changed considerably over time; inte- grated mills as a group outperformed minimills during the 1980-87 time period, and minimills outperformed their integrated counterparts during the 1988-93 time period.10 The results of the ANOVAs for the two time periods using ROS and ROA as the dependent variable and the mem- bership in group as the categorical variable are presented in Table 2. These results are consistent with the representation in Figure 1.
Model
The relationship between firm performance and the environment, firm-specific variables, and group dummy variable were modeled as follows:
10 We investigated whether the two time periods (1980-87 and 1988-93), identified based on performance difference, comprised distinct strategically stable time periods (SSTPs). Following Cool and Schendel (1988) and Fiegenbaum et al. (1990), we performed Bartlett's X2 test to examine the stability of the variance-covariance matrices of the strategy variables across the years (e.g., 1980-81; 1981-82; 1982-83, and so on until 1992-93). The stability of the variance-covariance matrix across each year pair indicates whether there is a relative shift in firm strategies that can alter the group compo- sition. The test coefficients indicate that the groups were stable over the period under study. That is, the relative change
Copyright ? 2001 John Wiley & Sons, Ltd. Strat. Mgmt. J., 22: 221-235 (2001)
Does Group Membership Matter? 229
Yit = P'Xit + Eit (i = 1, 2,...,N; t = 1, 2,..., T) (2)
Yit is defined as the return on sales (assets) for firm i in year t. Xit are the independent variables; that includes the environment variable, firm- specific variables (residuals from Equation 1), and the group dummy variable for firm i in the year t. We estimated separate models for both ROS and ROA. Efficient and unbiased regression esti- mation of such time series cross-sectional (TSCS) data may need correction for the following prob- lems:
a) Error terms for cross-sectional observations may be heteroskedastic.
b) Cross-group correlation, that is, error term for firm i in time t(?it), is related to error term for firm j in time t(ejt).
c) Within-group autocorrelation, that is, error term for firm i in time t(Eit), is related to error term for firm i in time t - l(eit _ ) (Greene, 1993; Pindyck and Rubinfeld, 1991).
Another potential estimation problem is multi- collinearity. Multicollinearity exists when the independent variables in the model are highly correlated, thereby affecting the accuracy of the regression calculations. Under these conditions OLS estimates are inefficient (i.e., standard errors are inflated) but not biased (Netter, Wasserman and Kutner, 1989).
Because of the presence of highly correlated variables, multicollinearity was a concern. We checked for multicollinearity in the models by examining the variance inflation factors (VIF) for each independent variable. If these values were above the recommended values of 10 (Netter et al., 1989), we dropped the suspect variable and reestimated our regression models. We dropped the 'size' and 'capital intensity' variables from all our models to avoid concerns with multi- collinearity.11
in the strategies of firms was not significant. Results are available on request from the authors. 11 We incorporated size into our base model; however, it was not significant. The two groups use different technologies to produce steel and therefore have different cost structures and economies of scale. While the minimum efficient plant size for the integrated mill is, on the average, 3 million tons per year, the minimum efficient size for minimills with one furnace could be as low as 500,000 tons (D'Costa, 1999: 146). The lack of significance of the size variable suggests
Copyright ? 2001 John Wiley & Sons, Ltd.
We then estimated regression models using LIMDEP software (Greene, 1992). Using LIM- DEP, we estimated generalized least-squares (GLS) models using the TSCS estimator. The TSCS estimator provides consistent estimates in the presence of groupwise heteroskedasticity, cross- and within-group autocorrelation. The model and the procedures used are those described in Greene (1993): 444 and LIMDEP Version 6).
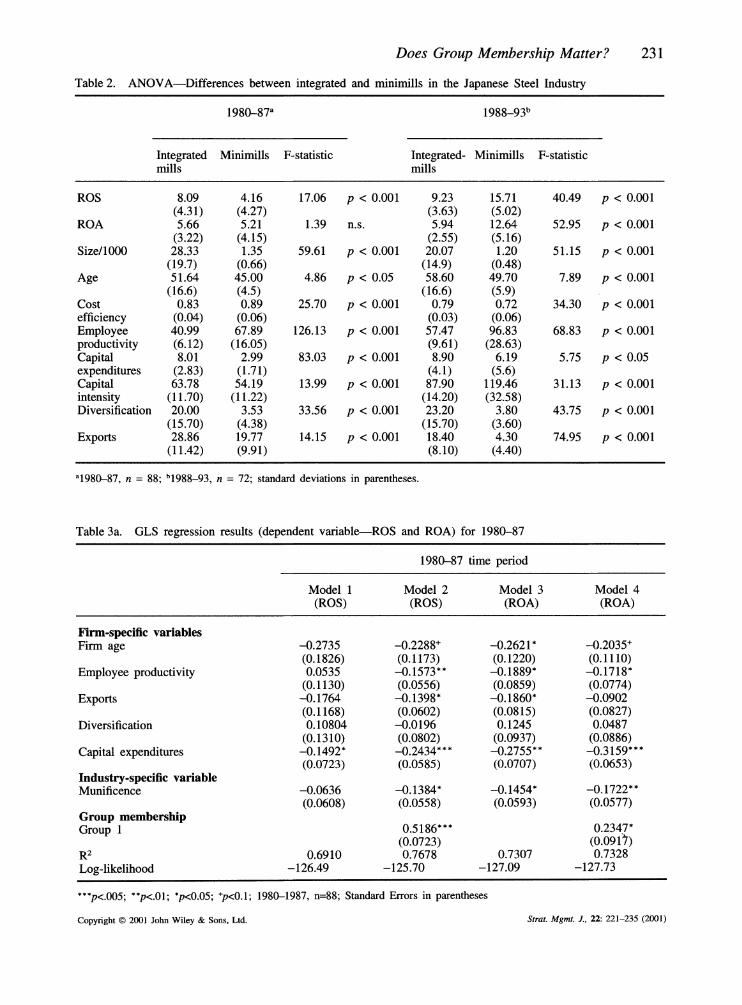
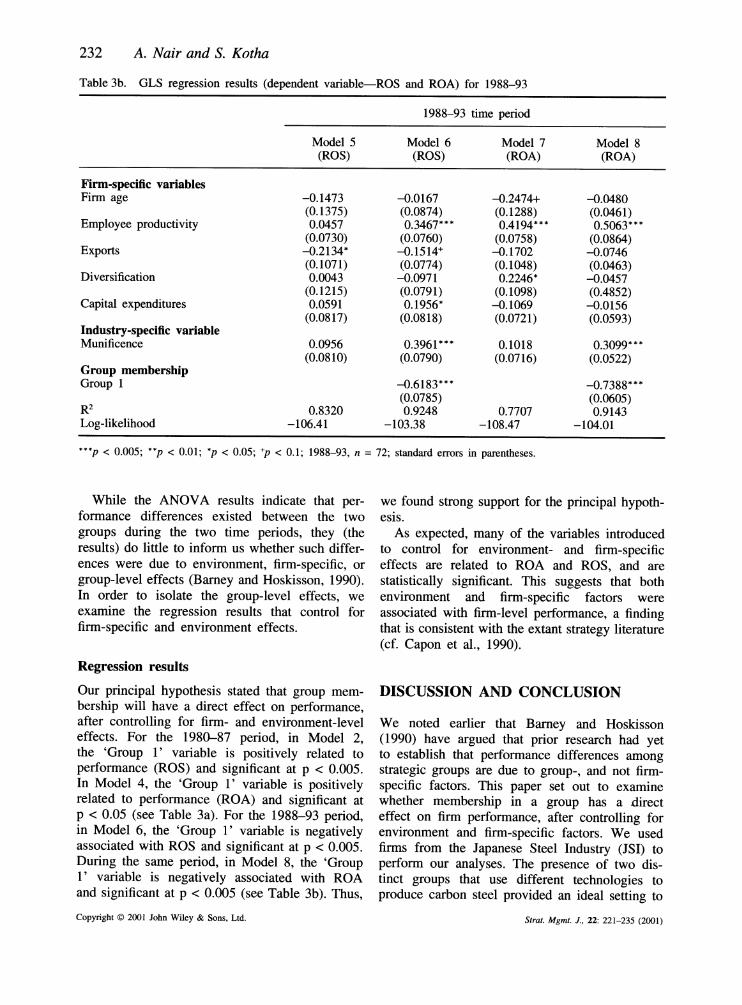
Given the changes in performance observed over time, we modeled the relationships between group membership and performance for the two time periods. We performed regression analyses using two sets of dependent variables: ROS and ROA. Table 3a and Table 3b show results of our analyses for the 1980-87 and 1988-93 period respectively.
Model 1 (Table 3a) estimates the relationship among environment- and firm-specific variables and ROS for the 1980-87 period. In Model 2, we include the group dummy variable. Model 3 examines the impact of environment- and firm- specific variables on ROA. In Model 4, we include the group dummy variable.
Model 5 (Table 3b), estimates the relationship among environment- and firm-specific variables and ROS for the 1988-93 period. In Model 6, we add the group dummy variable. Model 7 examines the impact of both environment- and firm-specific variables on ROA. In Model 8, we include the group dummy variable. Thus, we estimated eight different regression models.
RESULTS
ANOVA results
The ANOVA results indicate that the integrated mills had a significantly higher ROS during 1980-87, whereas the minimills had a signifi- cantly higher ROS between 1988 and 1993. ANOVA results for the ROA variable indicate that during the 1980-87 period there was no significant difference between the integrated mills and minimills. However, during the 1988-93 pe- riod the minimills had a significantly higher ROA than the integrated mills.
that there was not much performance difference among firms attributable to scale, possibly because the firms in the sample had sizes beyond the minimum efficient scale.
Strat. Mgmt. J., 22: 221-235 (2001)
C] o~~~~~~~~~~~~~~~~~~~~~~~~~~~~~~~~~~~~~to
Variable Mean S.D 1 2 3 4 5 10 11 12
_..^
o 6 Table 1. Means, standard deviations, correlation matrix, Japanese steel industry (1980-93) S*
Variable Mean S.D 1 2 3 4 5 6 7 8 9 10 11 12
1 Age 51.8 14.2 1.00 2 Capital expenditure 7.5 5.2 0.19 1.00 3 Capital intensity 79 30.9 0.20 0.32* 1.00 4 Diversification 14.5 15.2 0.57* 0.22* -0.15 1.00 5 Employee productivity 61.42 25.8 0.00 -0.06 0.69* -0.39* 1.00 6 Export 19.7 12.6 -0.20 0.00 -0.47* 0.24* -0.52* 1.00 7 GR 1 0.6 0.5 -0.10* 0.27* -0.20 0.57* -0.65* 0.47* 1.00 8 GR 2 0.4 0.5 -0.25* -0.27* 0.20 -0.57* 0.65* -0.47* -1.00* 1.00 9 Munificence 3.4 1.7 -0.08 -0.38* -0.29* -0.06 -0.19 0.08 0.01 -0.01 1.00 10 ROS 9 5.6 0.01 -0.01 0.55* -0.15 0.35* -0.38* -0.10 0.10 0.02 1.00 11 ROA 6.9 4.9 -0.09 -0.20* 0.35* -0.23* 0.45* -0.41* -0.30* 0.30* 0.08 0.88* 1.00 12 Size (log of employees) 8.7 1.5 0.06 0.21* -0.25* 0.53* -0.62* 0.70* 0.85* -0.85* 0.02 -0.17* -0.32* 1.00
*p < 0.01
.1
0s
i0
rd
Does Group Membership Matter? 231
Table 2. ANOVA-Differences between integrated and minimills in the Japanese Steel Industry
1980-87a 1988-93b
Integrated Minimills F-statistic Integrated- Minimills F-statistic mills mills
ROS 8.09 4.16 17.06 p < 0.001 9.23 15.71 40.49 p < 0.001 (4.31) (4.27) (3.63) (5.02)
ROA 5.66 5.21 1.39 n.s. 5.94 12.64 52.95 p < 0.001 (3.22) (4.15) (2.55) (5.16)
Size/1000 28.33 1.35 59.61 p < 0.001 20.07 1.20 51.15 p < 0.001 (19.7) (0.66) (14.9) (0.48)
Age 51.64 45.00 4.86 p < 0.05 58.60 49.70 7.89 p < 0.001 (16.6) (4.5) (16.6) (5.9)
Cost 0.83 0.89 25.70 p < 0.001 0.79 0.72 34.30 p < 0.001 efficiency (0.04) (0.06) (0.03) (0.06) Employee 40.99 67.89 126.13 p < 0.001 57.47 96.83 68.83 p < 0.001 productivity (6.12) (16.05) (9.61) (28.63) Capital 8.01 2.99 83.03 p < 0.001 8.90 6.19 5.75 p < 0.05 expenditures (2.83) (1.71) (4.1) (5.6) Capital 63.78 54.19 13.99 p < 0.001 87.90 119.46 31.13 p < 0.001 intensity (11.70) (11.22) (14.20) (32.58) Diversification 20.00 3.53 33.56 p < 0.001 23.20 3.80 43.75 p < 0.001
(15.70) (4.38) (15.70) (3.60) Exports 28.86 19.77 14.15 p < 0.001 18.40 4.30 74.95 p < 0.001
(11.42) (9.91) (8.10) (4.40)
a1980-87, n = 88; b1988-93, n = 72; standard deviations in parentheses.
Table 3a. GLS regression results (dependent variable-ROS and ROA) for 1980-87
1980-87 time period
Model 1 Model 2 Model 3 Model 4 (ROS) (ROS) (ROA) (ROA)
Firm-specific variables Firm age -0.2735 -0.2288+ -0.2621* -0.2035+
(0.1826) (0.1173) (0.1220) (0.1110) Employee productivity 0.0535 -0.1573** -0.1889* -0.1718*
(0.1130) (0.0556) (0.0859) (0.0774) Exports -0.1764 -0.1398* -0.1860* -0.0902
(0.1168) (0.0602) (0.0815) (0.0827) Diversification 0.10804 -0.0196 0.1245 0.0487
(0.1310) (0.0802) (0.0937) (0.0886) Capital expenditures -0.1492* -0.2434*** -0.2755** -0.3159***
(0.0723) (0.0585) (0.0707) (0.0653) Industry-specific variable Munificence -0.0636 -0.1384* -0.1454* -0.1722**
(0.0608) (0.0558) (0.0593) (0.0577) Group membership Group 1 0.5186*** 0.2347*
(0.0723) (0.0917) R2 0.6910 0.7678 0.7307 0.7328 Log-likelihood -126.49 -125.70 -127.09 -127.73
***p<.005; **p<.Ol; *p<0.05; p<0.1; 1980-1987, n=88; Standard Errors in parentheses
Copyright ? 2001 John Wiley & Sons, Ltd. Strat. Mgmt. J., 22: 221-235 (2001)
232 A. Nair and S. Kotha
Table 3b. GLS regression results (dependent variable-ROS and ROA) for 1988-93
1988-93 time period
Model 5 Model 6 Model 7 Model 8 (ROS) (ROS) (ROA) (ROA)
Firm-specific variables Firm age -0.1473 -0.0167 -0.2474+ -0.0480
(0.1375) (0.0874) (0.1288) (0.0461) Employee productivity 0.0457 0.3467*** 0.4194*** 0.5063***
(0.0730) (0.0760) (0.0758) (0.0864) Exports -0.2134* -0.1514+ -0.1702 -0.0746
(0.1071) (0.0774) (0.1048) (0.0463) Diversification 0.0043 -0.0971 0.2246* -0.0457
(0.1215) (0.0791) (0.1098) (0.4852) Capital expenditures 0.0591 0.1956* -0.1069 -0.0156
(0.0817) (0.0818) (0.0721) (0.0593) Industry-specific variable Munificence 0.0956 0.3961*** 0.1018 0.3099***
(0.0810) (0.0790) (0.0716) (0.0522) Group membership Group 1 -0.6183*** -0.7388***
(0.0785) (0.0605) R2 0.8320 0.9248 0.7707 0.9143 Log-likelihood -106.41 -103.38 -108.47 -104.01
***p < 0.005; **p < 0.01; *p < 0.05; +p < 0.1; 1988-93, n = 72; standard errors in parentheses.
While the ANOVA results indicate that per- formance differences existed between the two groups during the two time periods, they (the results) do little to inform us whether such differ- ences were due to environment, firm-specific, or group-level effects (Barney and Hoskisson, 1990). In order to isolate the group-level effects, we examine the regression results that control for firm-specific and environment effects.
Regression results
Our principal hypothesis stated that group mem- bership will have a direct effect on performance, after controlling for firm- and environment-level effects. For the 1980-87 period, in Model 2, the 'Group 1' variable is positively related to performance (ROS) and significant at p < 0.005. In Model 4, the 'Group 1' variable is positively related to performance (ROA) and significant at p < 0.05 (see Table 3a). For the 1988-93 period, in Model 6, the 'Group 1' variable is negatively associated with ROS and significant at p < 0.005. During the same period, in Model 8, the 'Group 1' variable is negatively associated with ROA and significant at p < 0.005 (see Table 3b). Thus,
we found strong support for the principal hypoth- esis.
As expected, many of the variables introduced to control for environment- and firm-specific effects are related to ROA and ROS, and are statistically significant. This suggests that both environment and firm-specific factors were associated with firm-level performance, a finding that is consistent with the extant strategy literature (cf. Capon et al., 1990).
DISCUSSION AND CONCLUSION
We noted earlier that Barney and Hoskisson (1990) have argued that prior research had yet to establish that performance differences among strategic groups are due to group-, and not firm- specific factors. This paper set out to examine whether membership in a group has a direct effect on firm performance, after controlling for environment and firm-specific factors. We used firms from the Japanese Steel Industry (JSI) to perform our analyses. The presence of two dis- tinct groups that use different technologies to produce carbon steel provided an ideal setting to
Copyright ? 2001 John Wiley & Sons, Ltd. Strat. Mgmt. J., 22: 221-235 (2001)
examine this issue. It allowed us to avoid the criticism leveled at past studies on groups-that the groups identified in such studies were mere methodological artifacts.
Results indicate that after controlling for environment- and firm-specific effects, group membership was associated with firm-level per- formance. Interestingly, we found that, while membership in the integrated group was posi- tively associated with firm performance during the 1980-87 period, membership in the group was negatively associated with performance during the 1988-93 period. Next, we elaborate on this shift in group effect. But, before we do that, we discuss the ANOVA and regression results to identify the nature of direct effects.
The analyses compared
A comparison of the ANOVA and regression results indicates that, except for one instance, the two analyses are generally consistent. It is only for the ROA analysis for the 1980-87 time period that we note a discrepancy in the ANOVA (Table 2) and regression (Table 3a) results. The ANOVA analysis does not indicate a significant difference between the integrated mills and minimills in ROA; however, the regression results indicate that membership in the integrated group is positively associated with ROA (Model 4, Table 3a). We suspect that in this instance controlling for firm- specific factors in the regression analysis etched out the group effects masked in the ANOVA.
Explaining turnaround in group effect
Membership in the integrated group was posi- tively associated with performance during the 1980-87 period, but had a relative negative impact during the 1988-93 period. As discussed earlier, differences in number and size of firms in the group, mobility barriers, and the bargaining power of the group members in the factor markets clearly benefited the integrated group members during the 1980-87 period.
However, our study of the industry suggests that three factors-that interestingly may have been beyond the control of JSI managers- appeared to have influenced the outcomes we observe in this paper during the 1988-93 period. First, the strengthening of the Japanese yen during the mid- to late 1980s had an adverse impact on
Copyright ? 2001 John Wiley & Sons, Ltd.
c
Is
Does Group Membership Matter? 233
240 220 200 180 160 140 120 100
80 81 82 83 84 85 86 87 88 89 90 91 92 93
Year
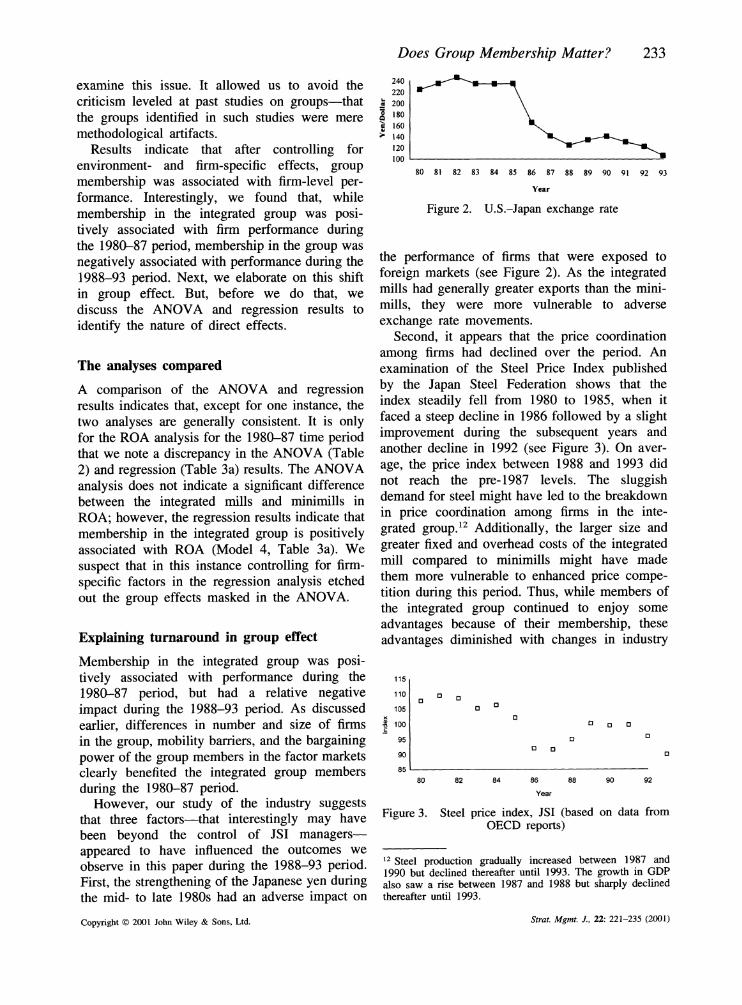
Figure 2. U.S.-Japan exchange rate
the performance of firms that were exposed to foreign markets (see Figure 2). As the integrated mills had generally greater exports than the mini- mills, they were more vulnerable to adverse exchange rate movements.
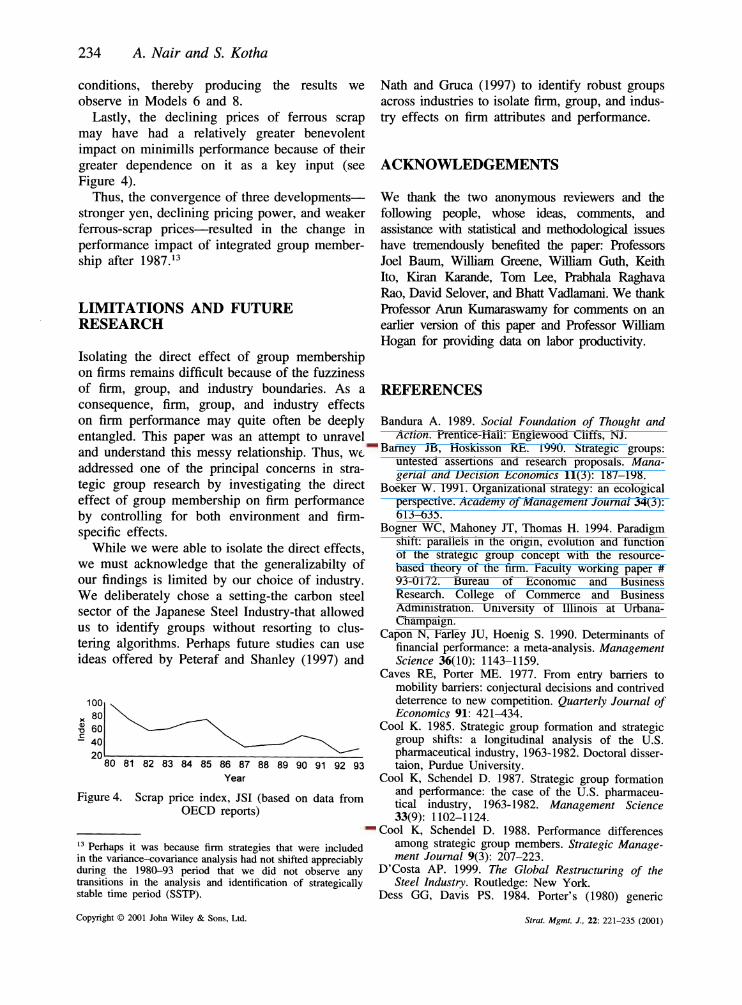
Second, it appears that the price coordination among firms had declined over the period. An examination of the Steel Price Index published by the Japan Steel Federation shows that the index steadily fell from 1980 to 1985, when it faced a steep decline in 1986 followed by a slight improvement during the subsequent years and another decline in 1992 (see Figure 3). On aver- age, the price index between 1988 and 1993 did not reach the pre-1987 levels. The sluggish demand for steel might have led to the breakdown in price coordination among firms in the inte- grated group.12 Additionally, the larger size and greater fixed and overhead costs of the integrated mill compared to minimills might have made them more vulnerable to enhanced price compe- tition during this period. Thus, while members of the integrated group continued to enjoy some advantages because of their membership, these advantages diminished with changes in industry
115
110
105 x
| 100
95
90
85
0 0 0 0 Cl []
a a 0
0 a 0 D
80 82 84 86 88 90 92
Year
Figure 3. Steel price index, JSI (based on data from OECD reports)
12 Steel production gradually increased between 1987 and 1990 but declined thereafter until 1993. The growth in GDP also saw a rise between 1987 and 1988 but sharply declined thereafter until 1993.
Strat. Mgmt. J., 22: 221-235 (2001)
234 A. Nair and S. Kotha
conditions, thereby producing the results we observe in Models 6 and 8.
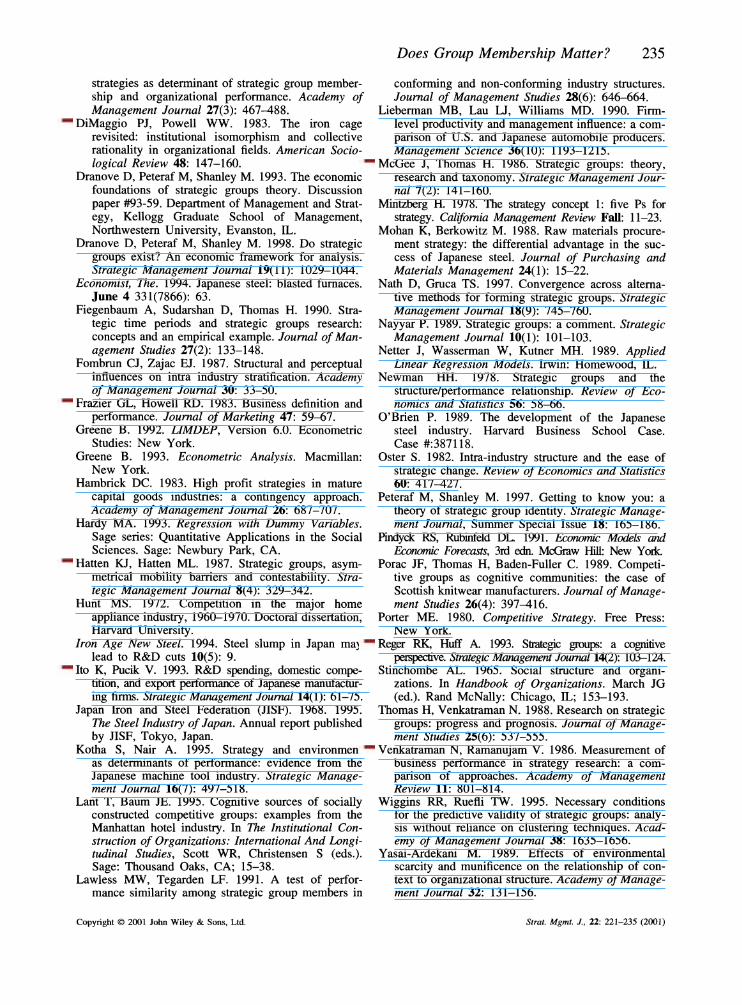
Lastly, the declining prices of ferrous scrap may have had a relatively greater benevolent impact on minimills performance because of their greater dependence on it as a key input (see Figure 4).
Thus, the convergence of three developments- stronger yen, declining pricing power, and weaker ferrous-scrap prices-resulted in the change in performance impact of integrated group member- ship after 1987.13
LIMITATIONS AND FUTURE RESEARCH
Isolating the direct effect of group membership on firms remains difficult because of the fuzziness of firm, group, and industry boundaries. As a consequence, firm, group, and industry effects on firm performance may quite often be deeply entangled. This paper was an attempt to unravel and understand this messy relationship. Thus, we addressed one of the principal concerns in stra- tegic group research by investigating the direct effect of group membership on firm performance by controlling for both environment and firm- specific effects.
While we were able to isolate the direct effects, we must acknowledge that the generalizabilty of our findings is limited by our choice of industry. We deliberately chose a setting-the carbon steel sector of the Japanese Steel Industry-that allowed us to identify groups without resorting to clus- tering algorithms. Perhaps future studies can use ideas offered by Peteraf and Shanley (1997) and
100
' 60 80 ~_~~ C
- 40 20
80 81 82 83 84 85 86 87 88 89 90 91 92 93 Year
Figure 4. Scrap price index, JSI (based on data from OECD reports)
13 Perhaps it was because firm strategies that were included in the variance-covariance analysis had not shifted appreciably during the 1980-93 period that we did not observe any transitions in the analysis and identification of strategically stable time period (SSTP).
Nath and Gruca (1997) to identify robust groups across industries to isolate firm, group, and indus- try effects on firm attributes and performance.
ACKNOWLEDGEMENTS
We thank the two anonymous reviewers and the following people, whose ideas, comments, and assistance with statistical and methodological issues have tremendously benefited the paper: Professors Joel Baum, William Greene, William Guth, Keith Ito, Kiran Karande, Tom Lee, Prabhala Raghava Rao, David Selover, and Bhatt Vadlamani. We thank Professor Arun Kumaraswamy for comments on an earlier version of this paper and Professor William Hogan for providing data on labor productivity.
REFERENCES
Bandura A. 1989. Social Foundation of Thought and Action. Prentice-Hall: Englewood Cliffs, NJ.
Barney JB, Hoskisson RE. 1990. Strategic groups: untested assertions and research proposals. Mana- gerial and Decision Economics 11(3): 187-198.
Boeker W. 1991. Organizational strategy: an ecological perspective. Academy of Management Journal 34(3): 613-635.
Bogner WC, Mahoney JT, Thomas H. 1994. Paradigm shift: parallels in the origin, evolution and function of the strategic group concept with the resource- based theory of the firm. Faculty working paper # 93-0172. Bureau of Economic and Business Research. College of Commerce and Business Administration. University of Illinois at Urbana- Champaign.
Capon N, Farley JU, Hoenig S. 1990. Determinants of financial performance: a meta-analysis. Management Science 36(10): 1143-1159.
Caves RE, Porter ME. 1977. From entry barriers to mobility barriers: conjectural decisions and contrived deterrence to new competition. Quarterly Journal of Economics 91: 421-434.
Cool K. 1985. Strategic group formation and strategic group shifts: a longitudinal analysis of the U.S. pharmaceutical industry, 1963-1982. Doctoral disser- taion, Purdue University.
Cool K, Schendel D. 1987. Strategic group formation and performance: the case of the U.S. pharmaceu- tical industry, 1963-1982. Management Science 33(9): 1102-1124.
Cool K, Schendel D. 1988. Performance differences among strategic group members. Strategic Manage- ment Journal 9(3): 207-223.
D'Costa AP. 1999. The Global Restructuring of the Steel Industry. Routledge: New York.
Dess GG, Davis PS. 1984. Porter's (1980) generic
Copyright ? 2001 John Wiley & Sons, Ltd. Strat. Mgmt. J., 22: 221-235 (2001)
Does Group Membership Matter? 235
strategies as determinant of strategic group member- ship and organizational performance. Academy of Management Journal 27(3): 467-488.
DiMaggio PJ, Powell WW. 1983. The iron cage revisited: institutional isomorphism and collective rationality in organizational fields. American Socio- logical Review 48: 147-160.
Dranove D, Peteraf M, Shanley M. 1993. The economic foundations of strategic groups theory. Discussion paper #93-59. Department of Management and Strat- egy, Kellogg Graduate School of Management, Northwestern University, Evanston, IL.
Dranove D, Peteraf M, Shanley M. 1998. Do strategic groups exist? An economic framework for analysis. Strategic Management Journal 19(11): 1029-1044.
Economist, The. 1994. Japanese steel: blasted furnaces. June 4 331(7866): 63.
Fiegenbaum A, Sudarshan D, Thomas H. 1990. Stra- tegic time periods and strategic groups research: concepts and an empirical example. Journal of Man- agement Studies 27(2): 133-148.
Fombrun CJ, Zajac EJ. 1987. Structural and perceptual influences on intra industry stratification. Academy of Management Journal 30: 33-50.
Frazier GL, Howell RD. 1983. Business definition and performance. Journal of Marketing 47: 59-67.
Greene B. 1992. LIMDEP, Version 6.0. Econometric Studies: New York.
Greene B. 1993. Econometric Analysis. Macmillan: New York.
Hambrick DC. 1983. High profit strategies in mature capital goods industries: a contingency approach. Academy of Management Journal 26: 687-707.
Hardy MA. 1993. Regression with Dummy Variables. Sage series: Quantitative Applications in the Social Sciences. Sage: Newbury Park, CA.
Hatten KJ, Hatten ML. 1987. Strategic groups, asym- metrical mobility barriers and contestability. Stra- tegic Management Journal 8(4): 329-342.
Hunt MS. 1972. Competition in the major home appliance industry, 1960-1970. Doctoral dissertation, Harvard University.
Iron Age New Steel. 1994. Steel slump in Japan may lead to R&D cuts 10(5): 9.
Ito K, Pucik V. 1993. R&D spending, domestic compe- tition, and export performance of Japanese manufactur- ing firms. Strategic Management Journal 14(1): 61-75.
Japan Iron and Steel Federation (JISF). 1968. 1995. The Steel Industry of Japan. Annual report published by JISF, Tokyo, Japan.
Kotha S, Nair A. 1995. Strategy and environment as determinants of performance: evidence from the Japanese machine tool industry. Strategic Manage- ment Journal 16(7): 497-518.
Lant T, Baum JE. 1995. Cognitive sources of socially constructed competitive groups: examples from the Manhattan hotel industry. In The Institutional Con- struction of Organizations: International And Longi- tudinal Studies, Scott WR, Christensen S (eds.). Sage: Thousand Oaks, CA; 15-38.
Lawless MW, Tegarden LF. 1991. A test of perfor- mance similarity among strategic group members in
conforming and non-conforming industry structures. Journal of Management Studies 28(6): 646-664.
Lieberman MB, Lau LJ, Williams MD. 1990. Firm- level productivity and management influence: a com- parison of U.S. and Japanese automobile producers. Management Science 36(10): 1193-1215.
McGee J, Thomas H. 1986. Strategic groups: theory, research and taxonomy. Strategic Management Jour- nal 7(2): 141-160.
Mintzberg H. 1978. The strategy concept 1: five Ps for strategy. Califoria Management Review Fall: 11-23.
Mohan K, Berkowitz M. 1988. Raw materials procure- ment strategy: the differential advantage in the suc- cess of Japanese steel. Journal of Purchasing and Materials Management 24(1): 15-22.
Nath D, Gruca TS. 1997. Convergence across alterna- tive methods for forming strategic groups. Strategic Management Journal 18(9): 745-760.
Nayyar P. 1989. Strategic groups: a comment. Strategic Management Journal 10(1): 101-103.
Netter J, Wasserman W, Kutner MH. 1989. Applied Linear Regression Models. Irwin: Homewood, IL.
Newman HH. 1978. Strategic groups and the structure/performance relationship. Review of Eco- nomics and Statistics 56: 58-66.
O'Brien P. 1989. The development of the Japanese steel industry. Harvard Business School Case. Case #:387118.
Oster S. 1982. Intra-industry structure and the ease of strategic change. Review of Economics and Statistics 60: 417-427.
Peteraf M, Shanley M. 1997. Getting to know you: a theory of strategic group identity. Strategic Manage- ment Journal, Summer Special Issue 18: 165-186.
Pindyck RS, Rubinfeld DL 1991. Economic Models and Economic Forecasts, 3rd edn. McGraw Hill: New York
Porac JF, Thomas H, Baden-Fuller C. 1989. Competi- tive groups as cognitive communities: the case of Scottish knitwear manufacturers. Journal of Manage- ment Studies 26(4): 397416.
Porter ME. 1980. Competitive Strategy. Free Press: New York.
Reger RK, Huff A. 1993. Strategic groups: a cognitive perspective. Strategic Management Journal 14(2): 103-124.
Stinchombe AL. 1965. Social structure and organi- zations. In Handbook of Organizations. March JG (ed.). Rand McNally: Chicago, IL; 153-193.
Thomas H, Venkatraman N. 1988. Research on strategic groups: progress and prognosis. Journal of Manage- ment Studies 25(6): 537-555.
Venkatraman N, Ramanujam V. 1986. Measurement of business performance in strategy research: a com- parison of approaches. Academy of Management Review 11: 801-814.
Wiggins RR, Ruefli TW. 1995. Necessary conditions for the predictive validity of strategic groups: analy- sis without reliance on clustering techniques. Acad- emy of Management Journal 38: 1635-1656.
Yasai-Ardekani M. 1989. Effects of environmental scarcity and munificence on the relationship of con- text to organizational structure. Academy of Manage- ment Journal 32: 131-156.
Copyright ? 2001 John Wiley & Sons, Ltd. Strat. Mgmt. J., 22: 221-235 (2001)