Embed Size (px)
Citation preview

Field Crops Research 116 (2010) 218–229
Does intercropping winter wheat (Triticum aestivum) with red fescue(Festuca rubra) as a cover crop improve agronomic and environmentalperformance? A modeling approach
I. Shili-Touzi a, S. De Tourdonnet b,*, M. Launay c, T. Dore b
a INRA, UMR211 Agronomie INRA-AgroParisTech, BP 01, F-78850 Thiverval-Grignon, Franceb AgroParisTech, UMR211 Agronomie INRA-AgroParisTech, BP 01, F-78850 Thiverval-Grignon, Francec INRA, Unite Agroclim, Site Agroparc, 84914 Avignon, cedex 9, France
A R T I C L E I N F O
Article history:
Received 25 May 2009
Received in revised form 2 November 2009
Accepted 12 November 2009
Keywords:
Competition
Facilitation
Relay intercropping
Yield
Biomass
Light
Water
Nitrogen
A B S T R A C T
The introduction of a living cover crop during a cash crop growth cycle (relay intercropping) and its
maintenance after the cash crop harvest may help to preserve biodiversity, increase soil organic matter
content and carbon sequestration and provide other ecosystem services, such as natural pest regulation
or nutrient recycling, by increasing useful biotic interactions within the agroecosystem. We studied the
impact of various approaches to manage a red fescue cover crop in a winter wheat crop in terms of light,
water and nitrogen competition, using the STICS crop model adapted for intercropping. The STICS model
for wheat/fescue intercropping was first evaluated on two years of experimental data obtained in the
field. It gave satisfactory statistical results for the prediction of dry matter, leaf area index (LAI) and
nitrogen accumulation in the two species, and for nitrogen and water dynamics in the soil. By simulating
unmeasured variables, such as transpiration, the model improves our understanding of the performance
of the intercrop in the field. For example, we showed that the intercropping system was more efficient
that wheat grown as a sole crop, in terms of nitrogen accumulation and decreasing soil nitrogen levels
before the leaching period. However, it also resulted in lower wheat yields. We then used the STICS
model to compare four intercropping management scenarios differing in terms of the date of red fescue
emergence, over 35 climatic years. We found that, in most climatic scenarios, the emergence of the
fescue crop during the late tillering phase of the wheat crop gave the best compromise between wheat
yield overall nitrogen accumulation and radiation interception.
� 2009 Elsevier B.V. All rights reserved.
Contents lists available at ScienceDirect
Field Crops Research
journal homepage: www.e lsev ier .com/ locate / fc r
1. Introduction
A cover crop, grown between two main crops, changes thephysical (Zibilske and Makus, 2009), chemical (Rinnofner et al.,2008) and biological (Isik et al., 2009) conditions of both the soiland the crop. The use of cover crops in cropping systems thereforehas interesting agronomic and environmental effects, includingprotecting the soil against erosion, contributing to the control ofweeds and diseases, providing the next crop with nitrogen andpreventing nitrate leaching (Hartwig and Ammon, 2002). Covercrops are frequently managed by sowing after the harvest of themain crop, with subsequent destruction by chemical or mechanicaltechniques. The introduction of a living cover crop during the cashcrop growth cycle (intercropping) and its maintenance after thecash crop harvest are less frequently observed. However, this
* Corresponding author.
E-mail address: [email protected] (S. De Tourdonnet).
0378-4290/$ – see front matter � 2009 Elsevier B.V. All rights reserved.
doi:10.1016/j.fcr.2009.11.007
approach has several advantages, including the preservation ofbiodiversity, increasing soil organic matter content and carbonsequestration (Scopel et al., 2005; Lahmar et al., 2006; Teasdale etal., 2007), and increasing biotic interactions within the agroeco-system (Hartwig and Ammon, 2002). Direct and indirect interac-tions between the cash crop and the cover crop generate opposingfacilitative and competitive effects. A facilitative effect is a positiveinteraction between the intercropping species (Vandermeer,1989). Such effects occur when one crop increases the availabilityof resources to the other crop. For example, a living cover crop candecrease weed growth in the cash crop (Brandsaeter et al., 1998;den Hollander et al., 2007), improve soil structure regeneration andprovide nitrogen to the following cash crop (if the cover crop is alegume). This may make it possible to reduce costs, by decreasingherbicides and N fertilizer requirements. However, when the cashcrop and the cover crop are intercropped during the cash cropgrowth cycle, they generally have to compete for the sameresources, which may decrease cash crop yields and returns (Carofet al., 2007a,b). The success of the intercropping system, which

Fig. 1. Weather data (cumulative daily mean temperature, cumulative rainfall and
cumulative solar radiation) calculated over the total period of simulation (10
October (year n) until 31 December (year n + 1)) for each climatic year (35 years
from 1970 to 2004) at Versailles, northern France. Open symbols correspond to the
two experimental years (1999 and 2000).
I. Shili-Touzi et al. / Field Crops Research 116 (2010) 218–229 219
may be combined with reduced or no-tillage systems (Holland,2004), therefore depends on maximizing facilitation and minimiz-ing competition between the two crops, in terms of light, water,and nutrients. Little is currently known about these aspects,particularly for temperate crops.
Modeling can be used to simulate and to improve ourunderstanding of the partitioning of resources in these complexsystems. It is therefore a useful tool for identifying ways to increasefacilitation or to curb competition. Most of the agronomicintercropping models studied to date are used as tools forachieving three main objectives. The first one of these objectivesis the analysis of biotic interactions and resource partitioning in anintercropping system (Berntsen et al., 2004; Tsubo et al., 2005a;Corre-Hellou et al., 2007). In this case, modeling provides astraightforward quantification of the processes involved infacilitative and competitive relationships, through the explicitrepresentation of fundamental processes such as photosynthesis,dry matter partitioning, leaf area growth, root growth, plantdevelopment, the nutrient cycle and energy balance. It is alsopossible to fine-tune interactions between light, water, andnitrogen on the basis of analyses of the relationships betweensupply and demand and between related indicators, such asnitrogen nutrition index (NNI) or interception efficiency. Thesecond objective of these models is to assess intercroppingperformances (Baumann et al., 2002a; Jensen, 2006; Whitmoreand Schroder, 2007). In this case, modeling provides access tointermediate variables that are of considerable importance forassessment but difficult to measure, such as nitrogen and waterfluxes between different compartments of the system. The thirdobjective is to use modeling to explore scenarios defined in termsof climate or management strategy (Tsubo et al., 2005b; Baumannet al., 2002b; Launay et al., 2009).
In this study, we used a modeling approach to investigatefacilitation and competition for resources in terms of light,water and nitrogen, in a cropping system based on theintercropping of winter wheat and red fescue. We investigatedthe extent to which the STICS model (Brisson et al., 2009)accurately reflected the functioning of the intercropping systemover a two-year period of experimentation (Picard et al., inpress), and used this model to test various cover cropmanagement strategies in terms of competition for light, waterand nitrogen, with the aim of enhancing the agronomic andenvironmental performances of the system.
2. Materials and methods
2.1. Model overview
The model used was an intercropping extension of the sole-cropmodel STICS (Brisson et al., 2009) considering the system to consistof two species rather than one (Brisson et al., 2004). This model isbased on a daily time-step that integrates input variables related toclimate, soil properties and cropping system, to calculate bothagricultural and environmental variables (Brisson et al., 2009).STICS is a generic model that can readily be adapted to various croptypes and is known to be robust, based on parameterizations invarious soil and weather conditions; this model also has a highlevel of plasticity, based on options in terms of formalism for bothphysiology and management (Brisson et al., 2009). The crop ischaracterized by its aerial biomass and leaf area index and in termsof the number and biomass of harvested organs. The soil is dividedinto a succession of horizontal layers, each of which is character-ized by its water and mineral N content. The soil environment isassumed to be identical for both crops in the intercropping system.Soil and crop interact through the roots, via the root densitydistribution in the soil profile.
STICS simulates daily biomass accumulation in the canopy andthe water and nitrogen balances of the system. Crop developmentis driven by thermal time and is used principally to calculate leafarea and to define the filling phase of the harvested organ. Thecorresponding phenological stages depend on the species andvariety. Crop growth is driven by plant carbon accumulation,through the interception of solar radiation by the canopy and itstransformation into biomass. This biomass is thus the net result ofthe processes of photosynthesis, respiration, and root/shootpartitioning. The STICS intercropping model simulates the sharingof light between the two crops, by calculating radiation transfer asa function of the volume of the canopy (height and width) of eachspecies (Brisson et al., 2004). The fraction of the photosyntheticallyactive radiation (PAR) actually absorbed by the two crops dependsgreatly on their respective heights, which depend in turn on boththe characteristics of the plants concerned and the growthconditions. Crop nitrogen content depends on carbon accumula-tion and soil nitrogen availability. The amount of nitrogen taken upby each species depends on root depth penetration, rootdistribution in the soil layers, and N demand. Daily absorptionof N by each species is determined by the smaller of two quantities:the amount of N available through the soil-root system or crop Nrequirements. Crop requirements are calculated with the Nconcentration/biomass relationship established from the upperlimit of N dilution curves. The possible existence of water stressand N stress is taken into account with indices decreasing leafgrowth and biomass accumulation in conditions of water ornutrient limitation (Brisson et al., 2009). Water is transporteddownwards in the soil when water content exceeds field capacityin a particular layer. For nitrate, transport within the soil profile issimulated with the ‘‘mixing cells’’ concept, which accounts forconvection and dispersion.
2.2. Experimental data
The results used for model parameterization and evaluationwere obtained in two field experiments carried out in the 1999–2000 (referred to as the 1999 experiment) and 2000–2001(referred to as 2000) growing seasons at the INRA Grignonexperimental station, located in northern France (488500N, 18560E).The soil was an orthic luvisol (FAO, 2006) containing 281 g kg�1
clay, 599 g kg�1 silt, and 120 g kg�1 sand in the 0–90 cm soil layer,in the 1999 experiment, and 261 g kg�1 clay, 649 g kg�1 silt, and90 g kg�1 sand in the 0–90 cm soil layer, in the 2000 experiment.Weather conditions during the experimental period are shown inFig. 1. Cumulative daily mean temperature and cumulative solarradiation were similar in 1999 and 2000 (4895 and 4891 degreedays, respectively, for temperature and 4259 and 4319 MJ m�2,
I. Shili-Touzi et al. / Field Crops Research 116 (2010) 218–229220
respectively, for solar radiation), whereas cumulative rainfall wasgreater in 1999 than in 2000 (1164 and 867 mm, respectively;Fig. 1). The preceding crop was barley in 1999 and rapeseed in2000. The experimental treatments were winter wheat grown as asole crop (Triticum aestivum, cv Isengrain), red fescue grown as asole crop (Festuca rubra, cv Sunset) and winter wheat intercroppedwith red fescue. The intercropped crops and sole crops were sownat the same time (14 October 1999 and 10 November 2000) and atthe same sites. The sowing density were 18 kg seed ha�1 for fescueand 150 plants m�2 for wheat. These crops were grown in mixtureswith an additive design in 1999 and 2000 (identical sowingdensities were used for sole-crop wheat and for intercroppedwheat). A split-plot design was used for both experiments, withcropping system as the main plot (sole crops and intercropping)and wheat variety as the subplot (cv Isengrain and Scipion). Weused only results for cv Isengrain in this study, because STICS hasbeen calibrated on this variety. Four experimental blocks wereused in the first experiment and six were used in the secondexperiment. Nitrogen fertilizer applications were similar for alltreatments of the two experiments, including sole-crop redfescue. The total amount of N fertilizer applied was 166 kg N ha�1
in 1999 and 160 kg N ha�1 in 2000. These amounts were applied intwo applications, between tillering and anthesis, in each year.Weeds, pests and diseases were controlled with appropriatepesticides. Wheat (both sole-crop and intercropped wheat) washarvested on 18 July 2000 for the 1999 experiment and on 23 July2001 for the 2000 experiment. The fescue was effectively mowedwhen the wheat was harvested, because the cutting bar was set ata height of 20 cm.
In each year, measurements were taken during two periods: theintercropping period (referred to hereafter as w 1) and after theharvest of the wheat crop, when the fescue was growing as a solecrop (w 2), until the end of the year. For these two periods, we
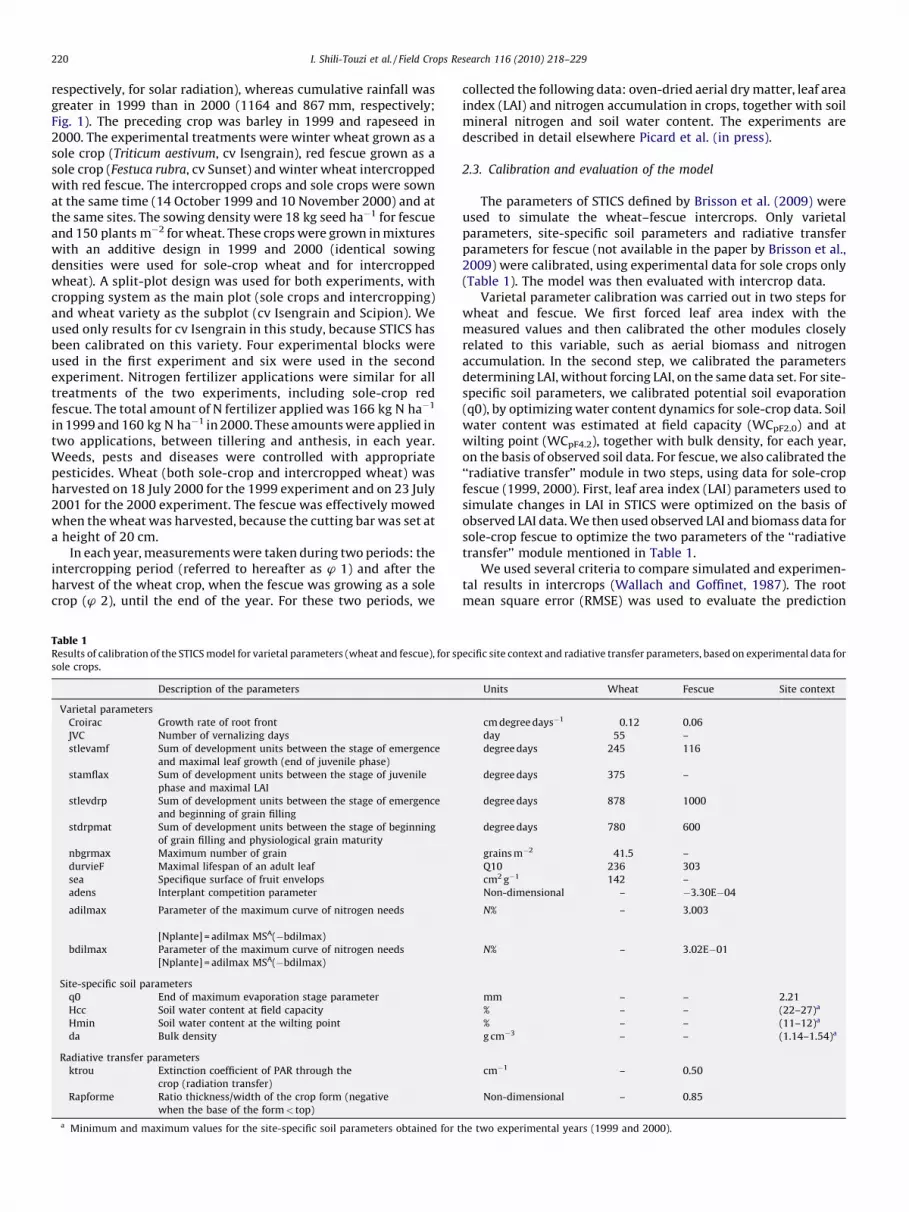
Table 1Results of calibration of the STICS model for varietal parameters (wheat and fescue), for sp
sole crops.
Description of the parameters
Varietal parameters
Croirac Growth rate of root front
JVC Number of vernalizing days
stlevamf Sum of development units between the stage of emergence
and maximal leaf growth (end of juvenile phase)
stamflax Sum of development units between the stage of juvenile
phase and maximal LAI
stlevdrp Sum of development units between the stage of emergence
and beginning of grain filling
stdrpmat Sum of development units between the stage of beginning
of grain filling and physiological grain maturity
nbgrmax Maximum number of grain
durvieF Maximal lifespan of an adult leaf
sea Specifique surface of fruit envelops
adens Interplant competition parameter
adilmax Parameter of the maximum curve of nitrogen needs
[Nplante] = adilmax MSA(�bdilmax)
bdilmax Parameter of the maximum curve of nitrogen needs
[Nplante] = adilmax MSA(�bdilmax)
Site-specific soil parameters
q0 End of maximum evaporation stage parameter
Hcc Soil water content at field capacity
Hmin Soil water content at the wilting point
da Bulk density
Radiative transfer parameters
ktrou Extinction coefficient of PAR through the
crop (radiation transfer)
Rapforme Ratio thickness/width of the crop form (negative
when the base of the form< top)
a Minimum and maximum values for the site-specific soil parameters obtained for t
collected the following data: oven-dried aerial dry matter, leaf areaindex (LAI) and nitrogen accumulation in crops, together with soilmineral nitrogen and soil water content. The experiments aredescribed in detail elsewhere Picard et al. (in press).
2.3. Calibration and evaluation of the model
The parameters of STICS defined by Brisson et al. (2009) wereused to simulate the wheat–fescue intercrops. Only varietalparameters, site-specific soil parameters and radiative transferparameters for fescue (not available in the paper by Brisson et al.,2009) were calibrated, using experimental data for sole crops only(Table 1). The model was then evaluated with intercrop data.
Varietal parameter calibration was carried out in two steps forwheat and fescue. We first forced leaf area index with themeasured values and then calibrated the other modules closelyrelated to this variable, such as aerial biomass and nitrogenaccumulation. In the second step, we calibrated the parametersdetermining LAI, without forcing LAI, on the same data set. For site-specific soil parameters, we calibrated potential soil evaporation(q0), by optimizing water content dynamics for sole-crop data. Soilwater content was estimated at field capacity (WCpF2.0) and atwilting point (WCpF4.2), together with bulk density, for each year,on the basis of observed soil data. For fescue, we also calibrated the‘‘radiative transfer’’ module in two steps, using data for sole-cropfescue (1999, 2000). First, leaf area index (LAI) parameters used tosimulate changes in LAI in STICS were optimized on the basis ofobserved LAI data. We then used observed LAI and biomass data forsole-crop fescue to optimize the two parameters of the ‘‘radiativetransfer’’ module mentioned in Table 1.
We used several criteria to compare simulated and experimen-tal results in intercrops (Wallach and Goffinet, 1987). The rootmean square error (RMSE) was used to evaluate the prediction
ecific site context and radiative transfer parameters, based on experimental data for
Units Wheat Fescue Site context
cm degree days�1 0.12 0.06
day 55 –
degree days 245 116
degree days 375 –
degree days 878 1000
degree days 780 600
grains m�2 41.5 –
Q10 236 303
cm2 g�1 142 –
Non-dimensional – �3.30E�04
N% – 3.003
N% – 3.02E�01
mm – – 2.21
% – – (22–27)a
% – – (11–12)a
g cm�3 – – (1.14–1.54)a
cm�1 – 0.50
Non-dimensional – 0.85
he two experimental years (1999 and 2000).

I. Shili-Touzi et al. / Field Crops Research 116 (2010) 218–229 221
error of the model, by heavily weighting large errors. We assessedthe predictive ability of the model by calculating the root meansquare error of prediction (RMSEP) and model efficiency (EF). Adetailed description of the estimation of these criteria wasprovided by Wallach et al. (2006).
2.4. The scenarios simulated
Simulations were used to study several management scenarios,to analyze the impact of the timing of the fescue cycle on theagronomic and environmental performance of the system. Thesesimulations were run over 35 years of climatic data (1970–2004)from Versailles (488480N, 28040E), which is situated close to theGrignon experimental station, to enable us to take climatevariability into account in the scenario assessment (Fig. 1). Wecompared four management scenarios, assessing the performanceof the system during the two phases considered (w 1 and w 2). Westopped the simulation on 31 December, because STICS cannot runsimulations over more than two consecutive years.
Scenario 0 simulated wheat grown as a sole crop and wastreated as the reference scenario against which the performance ofthe other three scenarios was assessed. In scenario 1, we simulatedfescue emergence one week after the harvest of the wheat crop (inJuly, precise date depending on wheat maturity), corresponding toa double-cropping system: sole-crop wheat followed by sole-cropfescue. In scenario 2, we simulated fescue emergence in the spring(18 March), corresponding to relay intercropping: wheat grown asa sole crop from October to March and then intercropped with
Fig. 2. Observed (obs) and simulated (sim) aerial dry matter accumulation (a), leaf area i
the two experimental years (1999 and 2000). Vertical bars indicate the least squares d
fescue. In scenario 3, we simulated the simultaneous emergence ofwheat and fescue (10 October), corresponding to full intercrop-ping. In scenarios 2 and 3, fescue was not destroyed after wheatharvest, therefore remaining alive during w 2.
Some of the other simulated cropping practices and initial datafor state variables were similar over the 35 years for the fourscenarios. Three applications of N fertilizer were carried out, on 25February, 25 March and 30 April. The amounts of N fertilizerapplied during the first and third applications were fixed at 50 and40 kg ha�1, respectively. The amount of N fertilizer applied duringthe second application was estimated with the balance-sheetmethod (Remy and Hebert, 1977), with a target yield of 9 t ha�1 foreach climatic year.
3. Results
3.1. Evaluation of the model
Good agreement was found between the observed andsimulated data obtained for wheat–fescue intercrops, for bothyears (Figs. 2 and 3), as indicated by the RMSE value and theefficiency (EF) of the model (Table 2). In both years ofexperimentation, the model reproduced the marked predomi-nance of wheat over fescue. Dry matter levels were much lower forfescue than for wheat (Fig. 2a): at harvest, mean observed wheatdry matter content was about 17.6 t ha�1 and mean observedfescue dry matter content was about 0.42 t ha�1, in both years. Thewheat developed leaf area more quickly than fescue during w 1
ndex (LAI) (b) and nitrogen (N) acquisition (c) in intercropped wheat plus fescue for
ifference (0.05) and the dashed vertical line shows the date of wheat harvest.

Fig. 3. Observed (line) and simulated (symbols) inorganic nitrogen in the soil (a) and soil water content (b) in wheat–fescue intercrops for the two experimental years. Vertical
bars are least squares differences (0.05) and the dashed vertical line shows the date of harvest.
I. Shili-Touzi et al. / Field Crops Research 116 (2010) 218–229222
(Fig. 2b). Just before the wheat harvest, wheat LAI decreased due tosenescence, leading to an increase in fescue LAI, which wasoverestimated by the model but with no effect on the simulation ofdry matter and N accumulation.
Wheat absorbed much more nitrogen than fescue during w 1(Fig. 2c). At harvest, the mean amount of nitrogen absorbed was190.7 kg N ha�1 for wheat and 6.5 kg N ha�1 for fescue. However,the fescue absorbed the residual soil mineral nitrogen just afterwheat harvest. The simulations for this variable were of betterquality for w 1 than for w 2. The model overestimated nitrogenaccumulation by fescue during this period. However, the
Table 2Root mean square error (RMSE) and efficiency (EF) of the model obtained for the
plant and soil variables for wheat–fescue intercrops, for the two experimental years
(1999 and 2000).
Variables Experiment RMSE EF
Plant variables
Wheat dry matter 1999 1.28 (t ha�1) 0.97
2000 0.98 (t ha�1) 0.97
Fescue dry matter 1999 0.40 (t ha�1) 0.56
2000 0.35 (t ha�1) 0.72
Wheat LAI 1999 0.47 (m m�2) 0.91
2000 0.86 (m m�2) 0.75
Fescue LAI 1999 0.15 (m m�2) 0.72
2000 0.37 (m m�2) 0.12
Wheat N acquisition 1999 20.6 (kg ha�1) 0.94
2000 18.4 (kg ha�1) 0.91
Fescue N acquisition 1999 7.44 (kg ha�1) 0.46
2000 9.71 (kg ha�1) 0.49
Soil variables
Soil inorganic N (0–120 cm) 1999 17.8 (kg ha�1) 0.59
2000 38.0 (kg ha�1) �0.34
Soil water (0–120 cm) 1999 105 (mm) 0.12
2000 255 (mm) �0.02
differences between the observed and simulated values remainedsmall. The observed and simulated yield values were 8.47 and10.7 t ha�1, respectively, in 1999 and 8.9 and 8.57 t ha�1,respectively, in 2000, giving a RMSEP of 2.27 t ha�1 (n = 2).
The agreement between the observed and simulated data forinorganic N in the soil (Fig. 3a) was less satisfactory than for theresults presented above, as indicated by the RMSE and the EF of themodel (Table 2). Nevertheless, the model reproduced the principalchanges in soil inorganic N and water content well until the wheatharvest. The model simulated overall changes in soil water contentwell during the two contrasting experimental years (Fig. 3b). Themodel also simulated accurately a dry period observed at the endof the summer of 1999 and at the end of the growth cycle in 2000.However, for 2000, the model tended to overestimate soil watercontent just after a dry period (beginning of June until October).However, the amount of water involved in this overestimate wasnot very large: the difference between observed and simulatedsoil water contents varied between 20 and 40 mm during thisperiod. After the dry period, the model accurately simulated thereconstitution of soil water stores.
3.2. Performance of wheat–fescue intercropping, as assessed
by the model
Simulation results showed that wheat yield was not overlyaffected by fescue development in the intercropping system (Table3): yield differences between sole-crop and intercropped wheatwere about 0.43 t ha�1 in 1999 and 0.39 t ha�1 in 2000, corre-sponding to a difference of less than 5%. The modeling resultsprovide an explanation for this difference, through analyses of thepartitioning of resources between the two crops. The modelprovides insight into the contribution of each species to dry matterproduction, light interception, water consumption and N acquisi-

Table 3Simulated results for the performance criteria of sole-crop wheat and wheat–fescue intercrops during the crop growth period and the interculture period for the two
experimental years.
Period Experiment Crop period (w 1) Interculture (w 2)
System Sole-crop Intercroppling Sole-crop Intercropping
Crops Wheat Wheat Fescue None Fescue Differencea
Crop production
Wheat yield (t ha�1) 1999 10.7 10.3 0 0 0 �4%
2000 8.57 8.18 0 0 0 �5%
Dry matter (t ha�1) 1999 21.8 21.4 0.59 0 2.19 11%
2000 18.6 18.2 0.49 0 1.69 10%
Light
PAR intercepted by the canopy (MJ m�1) 1999 854 854 51 0 178 27%
2000 729 764 35 0 119 21%
PAR transmitted to the soil (MJ m�1) at
harvest (w 1) and on 31 December (w 2)
1999 1556 1372 1596 1174 �19%
2000 1206 1121 1526 1204 �15%
Water
Crops water transpiration (mm) 1999 226 225 13 0 38 22%
2000 215 213 11 0 24 15%
Soil water evaporation (mm) at harvest (w 1)
and on 31 December (w 2)
1999 269 266 184 139 �11%
2000 185 186 163 120 �12%
Drainage (mm) at
harvest (w 1) and on 31 December (w 2)
1999 247 245 126 88 �11%
2000 325 320 14 4 �4%
Soil water (mm) 0–120 cm at harvest (w 1) and on 31 December (w 2) 1999 293 293 293 293 0%
2000 282 277 299 299 �1%
Nitrogen
N acquisition (kg ha�1) 1999 223 218 15 0 28 17%
2000 183 179 15 0 31 23%
Soil inorganic N (kg ha�1) 0–120 cm at harvest (w 1) and on 31 December (w2) 1999 13 5 47 8 �78%
2000 17 8 65 23 �63%
a Difference between the results obtained for the wheat plus fescue intercrop and sole-crop wheat during the simulation period (w l and w 2).
I. Shili-Touzi et al. / Field Crops Research 116 (2010) 218–229 223
tion in the intercropping system. The comparison betweensimulated aerial dry matter for intercropped wheat and sole-cropwheat showed that dry matter levels were slightly lower (about2%) for intercropped than for sole-crop wheat in both years.However, dry matter levels for wheat plus fescue were 11% and a9% higher than for sole-crop wheat, in both 1999 and 2000, due tothe growth of fescue during w 1 and, particularly, w 2. PARinterception by intercropped wheat was similar to that for sole-crop wheat in both years (Table 3). Nevertheless, over the completecycle (w 1 and w 2), the model simulates 27% and a 21% higherlevels of total absorbed radiation in 1999 and 2000, respectively,
Fig. 4. Simulated daily proportion of PAR intercepted by the sole-crop wheat (a) and whe
intercepted was observed in 1999.
due to the greater LAI of the fescue. Indeed, fescue intercepted 51and 35 MJ m�2 of light, respectively, in 1999 and 2000 during w 1,and about 178 and 119 MJ m�2, respectively, in 1999 and 2000during w 2 (Fig. 4). Thus, 19% and 15% less radiation reached the soilin the intercropped system in 1999 and 2000.
Simulation showed that the intercropped wheat absorbed 2% lessnitrogen in 1999 and 2000 than did sole-crop wheat (Table 3).However, overall nitrogen absorption by wheat plus fescue in theintercropped system was greater than nitrogen absorption by sole-crop wheat. Indeed, an additional 43 and 46 kg of nitrogen perhectare was absorbed by the fescue in 1999 and 2000, respectively,
at plus fescue intercrop (b) in 2000. The pattern of change in the proportion of light

I. Shili-Touzi et al. / Field Crops Research 116 (2010) 218–229224
during w 1 and w 2. The nitrogen absorbed by the two crops reducedresidual soil nitrogen levels by 8 and 9 units after harvest in 1999 and2000, respectively, and by 39 and 42 units by 31 December, in 1999and 2000, respectively (Table 3). This decrease in soil nitrogen storesbefore the end of December decreased the amounts of nitrogen likelyto be leached during January–April leaching period.
The simulated transpiration for intercropped wheat wasslightly lower (about 1%) than that for sole-crop wheat, in bothyears (Table 3). Nevertheless, the total water transpired by the twocrops over the whole cycle (w 1 and w 2) was 22% in 1999 and 15%higher in 2000 than that transpired by sole-crop wheat. This had adirect effect on evaporation from the soil: in both years,intercropping wheat and fescue resulted in 12% less evaporationfrom the soil than growing wheat as a sole crop. This differenceresults mostly from the presence of the fescue during w 2, whichlimits water loss by evaporation from the soil (Table 3). Thesimulated amount of below-ground water drainage differedconsiderably between the two experimental years (Table 3), dueto climatic differences. Drainage levels were 11% lower in 1999 andabout 4% lower in 2000 in intercropped wheat and fescue than insole-crop wheat.
Soil water content was slightly lower at harvest (5 mm) in 2000and complete replenishment occurred by the end of December inboth years (Table 3). Overall, the intercropping of fescue withwheat did not decrease the availability of water resources for thefollowing crop.
3.3. Analysis of four simulated scenarios for emergence dates
over 35 climatic years
The simulated yield for sole-crop wheat (scenario 0) variedfrom 7.60 to 10.9 t ha�1 (Fig. 5a), and simulated aerial dry mattervaried from 18.0 to 22.5 t ha�1 (Fig. 5b), depending on the yearconsidered. Yield (5.70 t ha�1) and dry matter (15.8 t ha�1) levelswere exceptionally low in 1975, due to the occurrence of a very dryseason with mean rainfall levels of 277 mm over the simulatedperiod, whereas mean rainfall over the 35 years was 540 mm. Overthe 35 years considered, intercropping fescue with wheat waspredicted to result in a 0.52 t ha�1 lower wheat yield, on average, inscenario 3 than obtained for wheat as a sole crop (scenario 0), witha high level of variability between years (Fig. 5a). If the fescueemerged in spring (scenario 2), wheat yield losses did not exceed0.5 t ha�1 (0.18 t ha�1 on average). No difference in wheat yieldwas predicted for scenario 1, in which the fescue was sown afterwheat harvest and could therefore not affect wheat growth. Yieldvariability over time was similar for all four scenarios. Aerial drymatter levels for intercropped wheat were systematically lower inscenarios 2 and 3 than for scenario 0: with a 0.5–1.75 t ha�1 yieldloss in scenario 3 and a loss of no more than 1 t ha�1 in scenario 2(results not shown). By contrast, overall dry matter production(wheat plus fescue) was greater than for sole-crop wheat, by 1.26,1.84 and 2.19 t ha�1 on average for scenarios 1, 2 and 3,respectively (Fig. 5b), due to the production of 1.26, 2.30,3.36 t ha�1 dry matter, on average, by fescue for scenarios 1, 2and 3, respectively (results not shown). The variability of drymatter production over time was slightly higher for earlier fescueemergence dates.
The difference between the scenarios is linked to differences inthe timing of fescue dry matter production, which varied from 0.8to 1.9 t ha�1 in scenario 1, from 0.5 to 1 t ha�1 in scenario 2 andfrom 1.5 to 2.5 t ha�1 in scenario 3, depending on the year (resultsnot shown). Analyses of intermediate variables related to resourcecapture (indices of nitrogen and water stress, radiation intercep-tion efficiency) identified no single major factor explaining theeffect of intercropping with fescue on wheat growth and yield. Thiseffect resulted from complex interactions between competition for
light, water and nitrogen, which differed from year to year over the35-year period.
The simulated PAR intercepted by wheat grown as a sole cropvaried from 636 to 892 MJ m�2, as a function of the yearconsidered. Regardless of the year considered, intercroppingfescue with wheat had no effect on the capacity of wheat tointercept light radiation (data not shown), but increased lightinterception by the whole canopy over the two phases considered(w 1 and w 2), with only low levels of variability over the 35 years(Fig. 5c). Overall light interception was a mean of 101, 234 and398 MJ m�2 higher, on average in scenarios 1, 2 and 3, respectively.Mean PAR interception over the 35 years was 13%, 31% and 52%higher in scenarios 1, 2 and 3, respectively, than for sole-cropwheat. The simulated PAR reaching ground level over the entiresimulated period varied with the year, from 2339 to 3119 MJ m�2
for sole-crop wheat. Adding fescue to the system decreasedradiation transmission by a mean of 201, 497 and 839 MJ m�2, forscenarios 1, 2 and 3, respectively, corresponding to decreases of 7%,18% and 31% of radiation available for weed growth, respectively(Fig. 5d).
Simulated transpiration levels from sole-crop wheat (scenar-io 0) varied over time, from 189 to 265 mm (Fig. 5e). Whenwheat was intercropped with fescue (scenarios 2 and 3), thewheat crop transpired less water than did sole-crop wheat: from0 to 15 mm in scenario 2 and from 15 to 35 mm in scenario 3(results not shown). However, overall canopy transpiration washigher when fescue was also sown, by 17, 50 and 55 mm onaverage in scenarios 1, 2 and 3, respectively (Fig. 5e). Thecalculation of water uptake per tone of dry matter for the twocrops showed that in scenarios 2 and 3 this variable was similar,for all years, over the 35-year period (11.35–13.75 mm t�1 of drymatter). The longer fescue growth cycle in scenario 3 did notaffect this variable. However, in scenario 1, in which fescueemerged after the wheat harvest, this ratio was smaller andvaried less (9.92–12.91 mm t�1 of dry matter). The simulatedwater evaporation from the ground varied between years, from222 to 400 mm for sole-crop wheat (Fig. 5f). Intercropping withfescue decreased evaporation, by a mean of 13, 68 and 89 mm inscenarios 1, 2 and 3, respectively.
Simulated below-ground water drainage varied from 108 to652 mm over time for sole-crop wheat (scenario 0). Intercrop-ping with fescue had a very slight effect on water drainage, whichdecreased in half the situations, and increased in the others(result not shown). In 95% of cases, the impact of intercroppingwas limited, corresponding to less than 10% of total waterdrainage in the soil profile. The balance between a higher level oftranspiration, a lower level of evaporation and similar levels ofdrainage when fescue was sown had only a very small effect onwater stores at the end of the two phases (w 1 and w 2) in thesethree scenarios, as shown by comparisons with sole-crop wheat:the differences simulated were less than 10 mm in 90% of cases(results not shown).
Simulated N acquisition by sole-crop wheat varied over time,from 200 to 242 kg N ha�1, except for 1975, when it wasexceptionally low, at 160 kg N ha�1. Intercropping wheat andfescue (scenarios 2 and 3) decreased N acquisition by the wheatcrop, by 10–35 kg N ha�1 in scenario 2 and by 40–75 kg N ha�1 inscenario 3 (data not shown). The difference in N acquisitionbetween scenarios 2 and 3 resulted from the greater nitrogenstress in scenario 3. Over the 35-year period, an increase in Nacquisition by both crops was possible only in scenarios 1 and 2(Fig. 5g), for which intercropping increased total N acquisition by amean of 30.5 and 21.6 kg N ha�1, respectively. In scenario 3,intercropping did not systematically increase N acquisition, andthe increases observed never exceeded 18 kg N ha�1. Resultsshowed that, in 50% of cases, N acquisition even decreased, by

Fig. 5. Frequency analysis for managing scenario 0 (sole-crop wheat), 1 (wheat–fescue double cropping), 2 (relay intercropping) and 3 (full intercropping) over the 35 climatic
years, for wheat yield (a), wheat–fescue aerial dry matter (b), PAR interception by crops (c), PAR transmitted to the soil (d), crop transpiration (e), soil evaporation (f), N
acquisition by crops (g), mineral nitrogen in the soil in the end of the simulation on 31 December (h).
I. Shili-Touzi et al. / Field Crops Research 116 (2010) 218–229 225

I. Shili-Touzi et al. / Field Crops Research 116 (2010) 218–229226
up to 20 kg N ha�1. At the end of the simulated period (31December), regardless of the scenario considered, intercroppingwith fescue resulted in lower soil inorganic N content than leavingthe soil bare after the wheat harvest (Fig. 5h). Mean soil inorganic Ncontent on 31 December was 40.2 kg N ha�1 for sole-crop wheat(scenario 0) and varied considerably over the years, reaching amean of 7.7, 13.1 and 18.9 kg N ha�1 in scenarios 1, 2 and 3, withlower levels of variability for scenario 3.
4. Discussion
4.1. Model performance
Our approach, based on parameterization of the model withexperimental data obtained for sole crops and evaluation of themodel with an intercropping system, has been adopted in variousstudies modeling intercropping (Baumann et al., 2002b; Berntsenet al., 2004; Corre-Hellou et al., 2007). This approach gave goodresults in our study, showing that the model essentially used thesame processes to describe the functioning of the system for bothsole crops and intercropping systems. The changes in statevariables observed for the intercropping system in this studytherefore resulted essentially from resource sharing and changesin growth conditions (simulated by STICS) rather than processesoccurring specifically in the intercropping system and relating toarchitectural plasticity or specific biotic constraints. Baumann etal. (2002b) showed that, in certain cases, the model makes errors,due to different leaf morphology responses in mixtures and in solecrops. In such cases, models parameterized for sole crops cannottake into account adaptations occurring in mixtures. In ourconditions, any morphological adaptations occurring in inter-cropped plants probably had only a very small effect on thesimulated processes, due to the very strong dominance of wheatover fescue. For example, the etiolation of fescue plants wouldprobably have been insufficient to increase their access toradiation.
Evaluation of the STICS model during the cropping cycle (w 1)indicated that this model accurately simulated biomass produc-tion, changes in leaf area and nitrogen accumulation for the twospecies. It also accurately simulated nitrogen and water fluxes.In other modeling studies based on the use of STICS and focusingon pea/barley intercropping systems (Jensen, 2006; Corre-Hellou et al., 2007, 2009; Launay et al., 2009), the modelaccurately reproduced the state variables of the intercroppedspecies, and gave RMSE values of the same order to thoseobtained here. These previous results were obtained forproduction levels well below ours (7–14 t ha�1 total biomass,versus 24 t ha�1 in our study), indicating that our results werebetter. Corre-Hellou et al. (2007) attributed the differencesbetween observed and simulated data to poor simulation of thepartitioning of radiation between the two species in cases inwhich the dominance relationship between the species wasinversed at the end of the cropping cycle. For our intercroppingsystem, no such inversion occurred, with wheat continuing todominate over fescue from sowing until harvest. Nitrogen andbiotic stresses were also weaker in our experimental conditions,which were not subject to the constraints of organic farming.This may account for the differences in the level of productionand the better performance of the model (as STICS modelscannot take biotic stresses into account) in our study.
During the intercropping period, the model tended tooverestimate the amount of mineral nitrogen taken up by thefescue after the wheat had been harvested (w 2). This decreases thequality of the model’s predictions for the variable ‘‘plant nitrogen’’for fescue during this period. It also implies a possible underesti-mation of the amount of mineral nitrogen remaining in the soil
during the winter period and therefore likely to be leached. Theresults obtained for simulations with the model indicate that themodel allowed the uptake of nitrogen by fescue roots whennitrogen levels in the soil were very low. Dorsainvil (2002)modeled intermediate crops and attributed the overestimation ofnitrogen uptake by crops in the STICS model during theintercropping period to this factor, which is a generic parameterof the model that we did not modify (we modified only site-specificparameters).
In this study, model calibration and validation were limited to aspecific form of multiple cropping – full intercropping – whereasthe long-term simulation study involved three multiple-croppingscenarios: double cropping, relay intercropping and full inter-cropping. However, the validity of the simulation model for relayintercropping remains unconfirmed. The use of modeling toexplore scenarios often leads to an enlargement of the climaticand cropping system conditions beyond those used for calibration(Baumann et al., 2002a; Launay et al., 2009). The STICS model hasalready been validated in double-cropping situations (Beaudoinet al., 2008; Gabrielle et al., 2001), in which it has been shown toperform well. However, STICS has less frequently been used tosimulate relay intercropping scenarios. Nevertheless, Corre-Hellouet al. (2009) and Launay et al. (2009) reported that this modelperformed well in simulations of relay intercropping in which thesecond crop was sown several weeks after the first. Moreover, inthe experiments used for model validation in this study, fescuesown at the same time as wheat began to grow during the spring—asituation not far removed from that for relay intercropping. Hence,the performance of the STICS model could be improved by morecomplete parameterization, but we feel that the error in theestimation of nitrogen absorption by fescue inherent to the STICSmodel is acceptable given the intended use of this model.
4.2. Effects of intercropping on plant growth
Although we simulated a strong domination of wheat overfescue, intercropping decreased wheat yields by about 5%. Thisyield-decreasing effect of intercropping on wheat has beenreported in studies of other types of mixed cultures involvingwheat and legumes, or on competition between wheat and weeds.In studies of competition between wheat and weeds, particularlyfor grass weeds, decreases in wheat yields of more than 20% havebeen systematically reported, with yield loss even reaching 90% insome cases, due to competition for environmental resources(Lemerle et al., 2004; Vandeleur and Gill, 2004; Blackshaw et al.,2005). In studies of wheat–legume intercropping, yield lossesgenerally vary between 10% and 30% with respect to sole-cropwheat sown at the same density (Bulson et al., 1997; Haymes andLee, 1999; Banik et al., 2006; Thorsted et al., 2006b; Carof et al.,2007a), but may reach 70% in some cases in which there is intensecompetition for resources (Haymes and Lee, 1999; Hiltbrunner etal., 2007). This variability may be accounted for principally by theintensity of competition between wheat, the leguminous crop andweeds. In studies in which wheat yields were little affected byintercropping, the authors generally attributed this result to adifference in the use of environmental resource niches by the twocrops (Anil et al., 1998) or to the complementary use of theseresources by the two species (Willey, 1979). For our intercroppingsystem involving two members of the grass family, the smalldecrease in wheat yields under intercropping is unlikely to beattributable to the use of different niches. Instead, it is due to thestrong dominance of wheat over fescue, resulting from an earlieronset of the growth cycle, with fescue emerging four months laterthan wheat. This difference in emergence times allowed the wheatcrop to outcompete the fescue, particularly for the interception ofsolar radiation.

I. Shili-Touzi et al. / Field Crops Research 116 (2010) 218–229 227
Intercropping may facilitate the better use of environmentalresources, thereby increasing productivity (Vandermeer, 1989;Willey, 1990). In the situation studied here, intercropping did notincrease total yields because the fescue was not harvested. Bycontrast, intercropping did increase the total amount of biomassproduced, consistent with the results of various studies onintercropping (Hauggaard-Nielsen et al., 2001; Thorsted et al.,2006c). Teasdale et al. (2007), in a long-term study of thefunctioning of an intercropping system involving a living covercrop, showed that the biomass produced accumulated in the soil,helping to increase the organic matter content of the soil. Weshowed that this increase in primary productivity resultedessentially from improvements in radiation interception whencrops were grown together, particularly after the wheat harvest,consistent with the results obtained for other combinations ofcrops (Tsubo et al., 2001; Carof et al., 2007b). Some of these authorssuggested that their results were due to the complementary natureof the aerial architecture of the two species. In our case, thiscomplementarity results primarily from the vertical distribution ofthe leaves, with the taller wheat crop shading the shorter fescue(simulated data not shown).
The dominance of wheat over fescue results from its geneticcharacteristics rather than from an adaptation of its aerialarchitecture during intercropping. The simulation results, con-firmed by experimental observations (Picard et al., in press),demonstrate that the LAI and height of wheat are similar in the solecrop and intercropping systems. This complementarity is alsoachieved through the offset of the growth cycles of the two crops,enabling the fescue to intercept solar radiation during wheatsenescence and after the wheat harvest (Fig. 4). This greaterradiation interception efficiency after the wheat harvest may resultin the suppression of weed populations (Bulson et al., 1997;Hauggaard-Nielsen et al., 2001; Thorsted et al., 2006c; denHollander et al., 2007; Hiltbrunner et al., 2007). However, somestudies have attributed this decrease in weed populations to anallelopathic effect observed in some crop combinations (White etal., 1989 cited by Banik et al., 2006).
4.3. Effect of intercropping on water and nitrogen fluxes
The presence of a second crop may also affect water balance, byincreasing transpiration by the canopy, as shown by severalauthors (Thorsted et al., 2006c). Morris and Garrity (1993) showedthat intercropping slightly modified water uptake, which variedbetween�6% and +7% of the levels recorded for sole crops, whereasthe intercropping system used water much more efficiently thansole crops. In our intercropping system, the water stress indicesobtained with the STICS model showed that, in the trial conditions,neither of the two crops experienced water stress during theintercropping trial. This finding may be accounted for in part by thelow levels of biomass production by the fescue during w 1. Fescuecontributed 2.5% of the total biomass produced during intercrop-ping. It may also be accounted for by the decrease in evaporationand drainage due to the presence of the fescue, resulting in anabsence of water deficiency in the climatic conditions occurringduring the experiments. Consistent with this finding, Carof et al.(2007b) showed that intercropping did not affect water availabilityto cultures in this type of climate.
The dominance of wheat at the start of the growth cycle limitedboth nitrogen availability to the fescue and the fescue’s nitrogendemand. Corre-Hellou (2005) showed, for the pea-barley combi-nation, that a species with a rapid growth rate at the start of thecycle could rapidly come to dominate in competition for thisresource. This is due to a difference in access to nitrogen, due to thedifference in rooting patterns between the two species. In oursituation, the dominance of wheat over fescue was also due to a
difference in root architecture. Simulation results showed that thewheat roots penetrated the soil to a depth of 120 cm, whereas thefescue roots remained in the first 30 cm of soil. Hauggaard-Nielsenand Jensen (2001) also observed, for a combination of pea andbarley, that the barley root system penetrated to greater depths inintercropping conditions than in sole crops. This difference inrooting pattern allows the barley crop to use resources moreeffectively, by exploring the soil more efficiently than barley grownas a sole crop. In our conditions, the simulation data, confirmed byexperimentation (not shown) showed no difference in root lengthbetween intercropped wheat and sole-crop wheat. Maintenance ofthe living fescue crop immediately after the wheat harvestsignificantly decreased nitrogen levels in the soil on December31 (Table 3). Fescue is thus an effective catch crop during thisperiod, like other members of the grass family (Dorsainvil, 2002;Kankanen and Eriksson, 2007).
4.4. Impact of the timing of the fescue growth cycle on the
performance of the system
Simulation results demonstrated that the system was highlysensitive to the timing of the fescue growth cycle, particularly interms of dry matter production, the interception of radiation andnitrogen capture (Fig. 5). Effects on yield were more limited andthere was almost no effect on water balance in this study. Theseresults are consistent with studies on the impact of the sowingdate of a cover crop after the main crop (Vos and Van der Putten,1997; Dorsainvil, 2002) or of an intercrop (Whitmore andSchroder, 2007; Launay et al., 2009). In the case of a cover cropintroduced after the harvest (our scenario 1), Dorsainvil (2002)showed that the establishment of grasses (ryegrass in the studiedconcerned) was very slow if they were sown just after the cerealharvest, resulting in low levels of biomass production, principallydue to water stress. We may have overestimated the emergencerate of fescue sown after the wheat harvest (scenario 1). Indeed,the simulation conditions for the emergence of a spring- orsummer-sown crop are poorly described in the model: STICS takesinto account only the mean water content of the soil layercontaining the seeds, but large gradients in water content areoften observed in the first few centimeters of the soil in summer.This might lead to the overestimation of fescue growth andresource uptake. In intercropping situations (our scenarios 2 and3) Launay et al. (2009) obtained results similar to ours for a pea-barley system, in which barley yields were 30% higher if barleywas sown two weeks before pea.
Advancing the sowing date of the fescue increases bothcompetition effects (decreasing wheat biomass and yield) andfacilitation effects (increasing total biomass and soil cover,decreasing the amount of solar radiation reaching the soil). Italso increases the efficiency of radiation and nitrogen use. Thesowing date for the fescue is therefore a key technical choicedetermining the balance between competition and facilitation.Other canopy management techniques can also be used to adjustthis balance. These techniques include the mechanical (Thorstedet al., 2006a) or chemical (Carof et al., 2007a) control of the covercrop during the growth cycle. We studied this balance over onlyone cropping and intercropping cycle. However, certain facilita-tion processes may occur more slowly. For example, the nitrogenabsorbed by the fescue during the intercropping period may besupplied to the next crop, thereby reducing its nitrogen fertilizerrequirements. Similarly, the increase in biomass production dueto the fescue may increase the organic matter content of the soil inthe medium term, thereby improving its fertility. Longer termexperimental and modeling studies are required to determine theconsequences of these processes for agronomic and environmen-tal performance.

I. Shili-Touzi et al. / Field Crops Research 116 (2010) 218–229228
5. Conclusion
The inclusion of a fescue as a cover crop in a wheatintercropping system therefore improves environmental perfor-mance, by favoring certain biotic processes, such as the productionof primary biomass, the interception of radiation that mightotherwise reach weeds and the recycling of nutrient elements. Acomparison of the simulated and observed results showed that the‘‘STICS intercropping’’ model accurately simulated these processesand can be used to evaluate their impact on the agronomic andenvironmental performance of the system for different climaticand technical scenarios. The simulated results show that the use offescue as a cover crop increases the efficiency of radiationinterception by up to 50%, thereby resulting in higher levels ofbiomass production and a decrease, by up to 30%, in the amount ofradiation reaching the ground and available to weeds. This makes itpossible to recycle mineral nitrogen efficiently during theintercropping period, with no effect on water balance in theclimatic conditions of the Parisian Basin. Despite the strongdominance of wheat over fescue, the simulation data nonethelessshowed mean yield losses of 2–6%, depending on the sowing datefor the fescue. Thus, the sowing date for the fescue appears to be akey technical choice for controlling the balance between competi-tion and facilitation. Agronomic performances are slightly affectedby competition in the short term, but may be improved in the longterm by the facilitation processes induced by cover crops, such asnutrient recycling, increases in soil organic matter content and theimprovement of soil structure. The design and assessment ofcropping patterns at the level of the rotation are thus essential tomaximize the benefits of facilitation. Further experimental andsimulated results are required to address important points, such asrotation management for both cash and cover crops (impact oncrop establishment and growth of the following crop, choice ofspecies for intercropping), weed and cover crop management inthe long term (efficiency of the cover crop for reducing weedpressure, risk of the cover crop itself becoming a weed) andnitrogen management (possibilities for reducing fertilizer require-ments through recycling and/or nitrogen fixation by the covercrop). These studies should provide useful information forextension of the results presented here and for the design ofcropping systems making use of facilitation through intercroppingwhile reducing competition with cash crops.
Acknowledgments
We would like to thank Didier Picard, Mouna Ghiloufi andPatrick Saulas for providing experimental data. We also thank theSTICS team of INRA Avignon for adapting the intercrop model. Weare grateful to S. Tanis-Plant for fruitful discussions and editorialadvice in English. The government of Tunisia and the Institut
National de la Recherche Agronomique (INRA, France) funded thescholarship of I. Shili-Touzi. This work was partly funded by theAgence Nationale de la Recherche under the Systera Program: ANR-08-STRA-10 (Ecological, technical and social innovation processesin Conservation Agriculture).
References
Anil, L., Park, J., Phipps, R.H., Miller, F.A., 1998. Temperate intercropping of cerealsfor forage: a review of the potential for growth and utilization with particularreference to the UK. Grass Forage Sci. 53, 301–317.
Banik, P., Midya, A., Sarkar, B.K., Ghose, S.S., 2006. Wheat and chickpea intercrop-ping systems in an additive series experiment: advantages and weed smother-ing. Eur. J. Agron. 24, 325–332.
Baumann, D.T., Bastiaans, L., Goudriaan, J., van Laar, H.H., Kropff, M.J., 2002a.Analysing crop yield and plant quality in an intercropping system using aneco-physiological model for interplant competition. Agric. Syst. 73, 173–203.
Baumann, D.T., Bastiaans, L., Kropff, M.J., 2002b. Intercropping system optimization
for yield, quality, and weed suppression combining mechanistic and descriptivemodels. Agron. J. 94, 734–742.
Beaudoin, N., Launay, M., Sauboua, E., Ponsardin, G., Mary, B., 2008. Evaluation of thesoil crop model STICS over 8 years against the ‘‘on farm’’ database of Bruyerescatchment. Eur. J. Agron. 29, 46–57.
Berntsen, J., Hauggard-Nielsen, H., Olesen, J.E., Petersen, B.M., Jensen, E.S., Thomsen,A., 2004. Modelling dry matter production and resource use in intercrops of peaand barley. Field Crops Res. 88, 69–83.
Blackshaw, R.E., Moyer, J.R., Huang, H.C., 2005. Beneficial effects of cover crops onsoil health and crop management. In: Pandalai, S.G. (Ed.), Recent ResearchDevelopments in Soil Science, vol. 1. pp. 15–35.
Brandsaeter, L.O., Netland, J., Meadow, R., 1998. Yields, weeds, pests and soilnitrogen in a white cabbage living mulch system. Biol. Agric. Hortic. 16,291–309.
Brisson, N., Bussiere, F., Ozier-Lafontaine, H., Tournebize, R., Sinoquet, H., 2004.Adaptation of the crop model STICS to intercropping. Theoretical basis andparameterisation. Agronomie 24, 409–421.
Brisson, N., Launay, M., Mary, B., Beaudoin, N., 2009. Conceptual Basis Formalisa-tions and Parameterization of the STICS Crop Model. Quae, Paris, 304 p.
Bulson, H.A., Snaydon, R.W., Stopes, C.E., 1997. Effects of plant density on inter-cropped wheat and field beans in an organic farming system. J. Agric. Sci. 128,59–71.
Carof, M., de Tourdonnet, S., Saulas, P., Le Floch, D., Roger-Estrade, J., 2007a.Undersowing wheat with different living mulches in a no-till system: yieldanalysis. Agron. Sustain. Dev. 27, 347–356.
Carof, M., de Tourdonnet, S., Saulas, P., Le Floch, D., Roger-Estrade, J., 2007b.Undersowing wheat with different living mulches in a no-till system: compe-tition for light and nitrogen. Agron. Sustain. Dev. 27, 357–365.
Corre-Hellou, G., 2005. Acquisition de l’azote dans des associations Pois-orge enrelation avec le fonctionnement du peuplement. Ph.D. Thesis, university ofAngers, France.
Corre-Hellou, G., Brisson, N., Launay, M., Fustec, J., Crozat, Y., 2007. Effect of rootdepth penetration on soil nitrogen competitive interactions and dry matterproduction in pea-barley intercrops given different soil nitrogen supplies. FieldCrops Res. 103, 76–85.
Corre-Hellou, G., Faure, M., Launay, M., Brisson, N., Crozat, Y., 2009. Adaptation ofthe STICS intercrop model to simulate crop growth and N accumulation in pea-barley intercrops. Field Crops Res. 113, 72–81.
den Hollander, N.G., Bastiaans, L., Kropff, M.J., 2007. Clover as a cover crop for weedsuppression in an intercropping design: I. Characteristics of several cloverspecies. Eur. J. Agron. 26, 92–103.
Dorsainvil, F., 2002. Evaluation, par modelisation, de l’impact environnemental desmodes de conduite des cultures intermediaires sur les bilans d’eau et d’azotedans les systemes de culture. Ph.D. Thesis, University of AgroparisTech, France.
FAO 2006. World Reference Base for Soil Resources. A Framework for InternationalClassification, Correlation and Communication. Rome, Italy: FAO. Availableonline at: http://www.fao.org/ag/agl/agll/wrb/doc/wrb2006final.pdf (verified2nd June, 2009).
Gabrielle, B., Mary, B., Roche, R., Smith, P., Gosse, G., 2001. Simulation of carbon andnitrogen dynamics in arable soils: a comparison of approaches. In: 2nd Inter-national Symposium on Modeling Cropping Systems, Elsevier Science, Florence,Italy, pp. 107–120.
Hartwig, N.L., Ammon, H.U., 2002. Cover crops and living mulches. Weed Sci. 50,688–699.
Hauggaard-Nielsen, H., Ambus, P., Jensen, E.S., 2001. Interspecific competition, Nuse and interference with weeds in pea-barley intercropping. Field Crops Res.70, 101–109.
Hauggaard-Nielsen, H., Jensen, E.S., 2001. Evaluating pea and barley cultivars forcomplementarity in intercropping at different levels of soil N availability. FieldCrops Res. 72, 185–196.
Haymes, R., Lee, H.C., 1999. Competition between autumn and spring planted grainintercrops of wheat (Triticum aestivum) and field bean (Vicia faba). Field CropsRes. 62, 167–176.
Hiltbrunner, J., Liedgens, M., Bloch, L., Stamp, P., Streit, B., 2007. Legume cover cropsas living mulches for winter wheat: components of biomass and the control ofweeds. Eur. J. Agron. 26, 21–29.
Holland, J.M., 2004. The environmental consequences of adopting conservationtillage in Europe: reviewing the evidence. Agric. Ecosyst. Environ. 103, 1–25.
Isik, D., Kaya, E., Ngouajio, M., Mennan, H., 2009. Weed suppression in organicpepper (Capsicum annuum L.) with winter cover crops. Crop Prot. 28, 356–363.
Jensen, E. S., 2006. Intercropping of cereals and grain legumes for increased forincreased production, weed control, improved production quality and precen-tion og N-losses in European organic farming systems. INTERCROP Report. [online] www.intercrop.dk.
Kankanen, H., Eriksson, C., 2007. Effects of undersown crops on soil mineral N andgrain yield of spring barley. Eur. J. Agron. 27, 25–34.
Lahmar, R., de Tourdonnet, S., Barz, P., During, R.A., Frielinghaus, M., Kolli, R., Kubat,J., Medvedev, V., Netland, J., Picard, D., 2006. Prospect for conservationagriculture in northern and eastern European countries. Lessons of KASSA.In: ESA (Eds.), Proceedings of the ninth ESA Congress, Warsaw, Poland, pp. 77–88.
Launay, M., Brisson, N., Satger, S., Hauggaard-Nielsen, H., Corre-Hellou, G., Kasy-nova, E., Ruske, R., Jensen, E.S., Gooding, M., 2009. Exploring options formanaging strategies for pea-barley intercropping using a modeling approach.Eur. J. Agron. 31, 85–98.

I. Shili-Touzi et al. / Field Crops Research 116 (2010) 218–229 229
Lemerle, D., Cousens, R.D., Gill, G.S., Peltzer, S.J., Moerkerk, M., Murphy, C.E., Collins,D., Cullis, B.R., 2004. Reliability of higher seeding rates of wheat for increasedcompetitiveness with weeds in low rainfall environments. J. Agric. Sci. 142,395–409.
Morris, R.A., Garrity, D.P., 1993. Resource capture and utilization in intercropping:water. Field Crops Res. 34, 303–317.
Picard, D., Ghiloufi, M., Saulas, P., de Tourdonnet, S., in press. Does undersowingwinter wheat with a cover crop increase competition for resources and is itcompatible with high yield? Field Crops Res.
Remy, J.C., Hebert, J., 1977. Le devenir des engrais azotes dans le sol. C. R. Acad. Agric.Fr. 63, 700–710.
Rinnofner, T., Friedel, J.K., Kruijff, R., Pietsch, d.G., Freyer, B., 2008. Effect of catchcrops on N dynamics and following crops in organic farming. Agron. Sustain.Dev. 28, 551–558.
Scopel, E., Findeling, A., Chavez Guerra, E., Corbeels, M., 2005. Impact of directsowing mulch-based cropping systems on soil carbon, soil erosion and maizeyield. Agron. Sustain. Dev. 25, 425–432.
Teasdale, J.R., Coffman, C.B., Mangum, R.W., 2007. Potential long-term benefits ofno-tillage and organic cropping systems for grain production and soil improve-ment. Agron. J. 99, 1297–1305.
Thorsted, M.D., Olesen, J., Weiner, J., 2006a. Mechanical control of clover improvesnitrogen supply and growth of wheat in winter wheat/white clover intercrop-ping. Eur. J. Agron. 24, 149–155.
Thorsted, M.D., Olesen, J.E., Weiner, J., 2006b. Width of clover strips and wheat rowsinfluence grain yield in winter wheat/white clover intercropping. Field CropsRes. 95, 280–290.
Thorsted, M.D., Weiner, J., Olesen, J.E., 2006c. Above- and below-ground competi-tion between intercropped winter wheat Triticum aestivum and white cloverTrifolium repens. J. Appl. Ecol. 43, 237–245.
Tsubo, M., Walker, S., Mukhala, E., 2001. Comparisons of radiation use efficiency ofmono-/inter-cropping systems with different row orientations. Field Crops Res.71, 17–29.
Tsubo, M., Walker, S., Ogindo, H.O., 2005a. A simulation model of cereal-legumeintercropping systems for semi-arid regions I. Model development. Field CropsRes. 93, 10–22.
Tsubo, M., Walker, S., Ogindo, H.O., 2005b. A simulation model of cereal-legumeintercropping systems for semi-arid regions: II. Model application. Field CropsRes. 93, 23–33.
Vandeleur, R.K., Gill, G.S., 2004. The impact of plant breeding on the grain yield andcompetitive ability of wheat in Australia. Aust. J. Agr. Res. 55, 855–861.
Vandermeer, J.H., 1989. The Ecology of Intercropping. Cambridge University Press,Cambridge (UK).
Vos, J., Van der Putten, P.E.L., 1997. Field observations on nitrogen catch crops, I.Potential and actual growth and nitrogen accumulation in relation to sowingdate and crop species. Plant Soil 195, 299–309.
Wallach, D., Goffinet, B., 1987. Mean Squared Error of Prediction in models forstudying ecological and agronomic systems. Biometrics 43, 561–573.
Wallach, D., Makowski, D., Jones, J.W., 2006. Working with Dynamic Crop Models:Evaluation, Analysis, Parametrization and Applications. Elsevier, Netherlands.
Whitmore, A.P., Schroder, J.J., 2007. Intercropping reduces nitrate leaching from underfield crops without loss of yield: a modelling study. Eur. J. Agron. 27, 81–88.
Willey, R., 1979. Intercropping—its importance and research needs, Part 1. Compe-tition and yield advantages. Field Crop Abstracts 32, 1–10.
Willey, R.W., 1990. Resource use in intercropping systems. Agric. Water Manage. 17,215–231.
Zibilske, L.M., Makus, D.J., 2009. Black oat cover crop management effects on soiltemperature and biological properties on a Mollisol in Texas, USA. Geoderma149, 379–385.


