Embed Size (px)
Citation preview
DO&MENT-RESUME
ED 248 260 TM 840 56D
AUTHOR 'Grubb, Henry. J.TITLE The Cultural'-Distance Perspective: -An Exploratory
Analysis of Its Effect on Learning andIntelligence.
PUB DATE Apr 84114p.; Paper presented at the Annual Meeting of theEastern Psychological Association (Baltimore,April 12 -15, 1984).
PUB YPE Speeches/Confeience Papers (150) -- ReportsResearch /Technical (143)
EDRS PRICE MF01/PC05 Plus Postage.DESCRIPTORS *Academic Achievement; *Cross Cultural Studies;
Cultural Influencesp Intelligence Quotient;*Intelligence Tests; Perfdrmance Factors;Postsecondary Education; Predictive Validity;*Subcultures; *Test Bias; Testing Prbblemsf TestUse
IDENTIFIERS *Cultural Distance Approach
ABSTRACT.The purpose .of 'this study is to examine the role of
the cultur1, distance hypothesis in determining groupdifferences bn.intelligence and performance scales in Black and White subjects. Thisvigw, the Cultural-Distance Approach, briefly stated is that asub=culture's distance from the major culture, on which testquestions of a test are based and validated, will determine thatsub-culture's group sub-score paitermin relation to the sub-scorepattern of the'norming population. Eighty pOst-secondary schooladults 48 White males and females, 32 Black males and females) wererecruited and administered a series of tests. Analysis of variance
'(AMOVA's) were calculated for each of the IQ measures. The resultssuggest that Although Blacks and Whites perform equally on learningtasks at either,the Level I or Level II dichotomy of intel ctualabilities, pirformance on' standardized tests of IQ do not equatelyreflect, this. equality of performance, possibly becaUse of he loadingof cultural bias.in the latter measures. A 93-item bibliography,supplementary forms, and statistical tables are appended.(Author/EGS)
4
** ********************************************************************
. reproductions supplied by EDRS are the best that can be made **
* from the original document. *
**************************************************************IW******
1
ti
THE CULTURAL- DISTANCE PERSPECTIVE: AN EXPLORATORY ANALYSIS OF ITS EFFECT ON
LEARNING AND INTELLIGENCE
NI) (ABSTRACT)
CX) %
The stance of the present investigation is an amalgamation of the environmental,
historical, and social-psychological points of view with the addition of current.
kno;rledge in the fields of socio-biology, clinical and developmental psychology.
Th.!.s view, the Cultural-Distance Approach, briefly stated is that'a sub culture's
distance'from the major culture, on which test questions of a tesp are based and
validated, will determine that sub-culture's group sub-score pattern in relation
to the sub-score pattern of the norming population. Therefore minority member
performance on tests based and validated on the major culture (or even validated
on membert of the society according to percentage representation of *all sub-
cultures in the supra-curAe) will show characteristic'patterns of group responding
...which are different from those of the norming sample. These'response patterns
are indications of what is salient to each minority sub-culture on the tests and
within the major culture, and what is net. This paper is an examination of some of
the socio-cultural factors which may lead to group performan*differences on IQ
tests and an attemptlto determine empirically if the Cultural - stance approach is
valid in its analysis of test bias. The resdlts suggest that although Blacks and
Whites perform equally on learning tasks at either the Level I or Leirel II dichotomy
r7).
of intellectual abilities, performance on standardized bests of IQ do not adequately
reflect this equality of performance, possibly because of the loading.of cuitural-
4b"
bias in the latter measures.
r.
U.S DEPARTMENT Of EDUCATION
NATIONAl. INSTITUTE Of EDUCATION
f VOCATIONAL FU IRCF S INFORMATION
tiN:ER WM!X (he, ,int loner it thn, bor, 1110 0410 r4 ti
revrct fff70 ih tionsath 'Of toganvatlohraflatirhatmq ItM.nr'f rhahtles haw. hew, entitle In tfhphrvis
."Piewtuitkert Pilhilrttj
Pntntn of vi4;v4 o* tipUIROV's 'ilAttlf! 71 this tkn.
morn fit, nut ,w iP4.11/V ,ftpHje8.? htltel Nit
postohh n png
**PERMISSION TO REPRODUCE THIS
MATERIAL 14A6NBEEN GRANTED BY
TO THE EDUCATIONAL RESOURCESINFORMATION CENTER (ERIC)
t/J Grew36$
THE CULTURAL-DISTANCE PERSPECTIVE: AN EXPLORATORY ANALYSIS OF ITS EFFECT ONLEARNING AND INTgLLIGENCE
INTRODUCTION
The purpose of this study is to examine the sociological, cultural, and environ-
mental determinants of group differences on measuresf of IQ. Specifically, the
difference in performance of Black and White post-secondary school adults, espec-
tally college students, is to be examined using a correlational approach while
holding most significant environmental differneces between the group constant.
The basic tenet of this paper is that the oft - recorded difference between groups
cli Black and White students is not the result of racial genetics but describes the
/ 1 .. I
dultural distance between the two groups.4
The recorded difference in Black and White scores on standardized IQ tests is
one of the-most discussed, and yet unresolved, issue's extant in psychology today.
Many explanations for this phenomenon have been posit*.
.
Biological Accounts .
For example, Jensen (1969) has suggested that genetics p;ay a central role inI
producing these differences. He argues that a "developmental lag," genetically .
determined, causes Black children to perPorm about two years below White children
of equal chronological age. Jensen exploi-ed the Black-White difference in some
detail. In °fie study (Jensen, 1977), he divided at White sample into two sub-groups
in order to control for cultural differeqces: one consisting bf subjects wbo
% .. 3 .
equalled the total White sample regarding theilpeap and staft4ardideviation, and one-,4
comps4ged of lower scoring Whites from the 0441 sample that lqualled the mean and.
standard deviation of the total Black sample: eklied..thi*seCond group a..
.
.
"pseudo race."
I
1
241
11
2
Jensen found thht the difference between the "pseudo race sub-group and
the sub-group equalling the whole White population was thi same as that observed
between the total Black sample and the total White sample, From these results
he argued that the diffetence between the two racial groups could not be explajned
by cultural differences between the races. The significant RxI (Race by Item)
interaction he obtained in his total comparisons could not be interpreted as bias1
in the test because a similar interaction was discovered beten the two White
sub-groups. However, Jensen is aware of a possible flaw in his conclusion, anda
thus he states that:
"the.only counter hypothesis to explain these results is that the lowerscoring Whites in the pseudo race comparison differi(rom the higherscoring Whites in the same way that Blacks differ frolt Whites, because
. the lower-scoring Whites, and the majority of Blacks resumab1 are both,
culturally disadvantaged and therefore share the stem biaies,"
4. 62-63).
This, of course, is a very real possiblity. By the very act of
sub-group of White subjects to Black subjects on test performance, Jensen may have
.
been de facto matching the vo pdpulations on the environmental and sociological
facto s which would-distinguish these two groups from the higher scoring White
sub-g oup. Unfortunately, Jensen did not purgue this lin; of reasoning. One thing
is fo certain however, racial genetics could nothave caused the equivalency of
'the B ack group and lower scoring White sub-group on the dependent measure. Jensen"
does of propose an answer to,this dilemma either. Jensen, in refutingmcultural
'cliff rence," raised more questions than he answere.
Jensen's argument represents a common error' type. He, and many test con-
4tr tors and users assume that, tests, especially those validat&An representative
sam les of the national population, are equally valid for all individuals regardless
of ultural background. Wheieas a teat Ma, adequately tap the present intellectual
Eu ctioning of a individual member of ty dominant culture group it may either
41.
.4°
I
341,
(1) accurately measure the intellectual ability of a minority group member or
(2) bla representation of his distance from the valUes, mores, perceptions, and
response patterns of the dominant culture. The fact that the White pseudo-race
scored coMparabketo the Black group could either signify the Whites "disadvant-
aged" status as suggested and ignored by Jensen or truly represent a reduction in
mental facility when compared to co- tac,ials. This however does not necessarily
reflect on the potential of the Black group.
Conwill (1980), suggests that Jensen beligved that, a boost of 20 to 30 IQ
points was Possible for children moved from extremely deprived environments to
ft*good or average environments; Jensen however, stated that he could find cot a
single case report of a child being given a permanently superior 'IQ by such means
(evidence demonstrating such increases will be given later in the text). Jensen
thlbtefore concluded4that environmental manipulation could only lead to large dif-
ferences in IQ scores when the, original environment is extremely inadequate and that
the child typically described hs "culturally disadvantaged" does not live in such
an extremely retar ding environment. In effect Jensen said the difference between
the environmentA of the'Middle-class and lower-class child was not important.
Herzog, Newcomb, and Cisin (1972), in &research paper titled "But Some are
,More Poor than Others: SES Differences in a Preschool Program," did however show
that factors other than the nutritional and environmental deficits posed by Jensen,
produce delete -ious effects on IQ scores. Their study dealt with a preschool en-s
richment program and its effect on children of families labeled as living in
poverty. The group of primary interest to this paper is the experimental group .(EG).
Themean income of families in this group was $3,360, with a range of about $1,000
to $5,770. Their findings medicated that "a broad control for income does not
control effectively for socio-economic status" within low-income populations. The.
\analysis. of their findings for the two -year nursery school program showed
4,
4
significant variationsin test scores and in pat;erns of IQ change related to SES
levels within this very low-income group.
Herzog et al. (1972) also divided each group, the experimental (EG) and control
(CG), into high and low, socioeconomic status (SES) subgroups based on a combination
of mother's education and people to room ratio. Further each grotip was divided
into high and low initial IQ (IIQ) sub-groups based on Stanford-Binet scores given
prior to the interventions. Thus, four new subgroups from the original groups were
created: (1) Hi-SES-Lo-IIQ, (2) Hi-SES-Hi-IIQ, (3) Lo-SES-Lo-IIQ, (4) Lo-.SES-Hi-
wben the original experimental group was read'alysed, results indicated that
the Hi-SES-Lo-IIQ subgroup showed significant gain from the preschool' enrichment
program, and sustained this gain.
These results demonstrate that categorizing children in gross classes based on
family earned income alone is not sufficient for a full understanding of'differences
in IQ scores between groups. Also, factors other than nutritional and environmental
deficiencies must have been at work in these children's environments, for it was the
Hi- SES -Lo --IIQ students in both groups who scored the lowest on the initial IQ
testing (IQ = 75), who gained the most (IQ = 107), and regressed the least on the
follow-up (final IQ = 98).
The physicati environment is not the only, or even most important environment
impaceing on the child's intellectual development. Watson (1970) explains that
"there is a kind of environmental influence- the psychological environment, if
you like, apart from poor health, or sheer deprivation - which has been shown in
limited experiments, to produce small but nevertheless significant influences on
intellectual, functioning."
The behavioral patterns and coping strategies of the poor parents of the most
improved children in Ne Herzog et al. (1972), study were very different from the
poor parents of the other children in the study.'. For one thing, the most improved
6
rchildren had. parents who were mare self-reliant than the others; they did not
bdrrow from relatives and friends on a regularbasis in order to survive. Those
parents also tended to keep their living quarters in better care. They were thus,
perhaps as not discouraged by and resigned to their condition: perhapa they were
not as distant' from the main-stream values and perceptions as were the other par- .
ents, and therefore their children were more prograMmed in a fashion enabling them
to adapt to and'learn from the super-culture-directed learning environment (the
school)'. Perhaps these children were somewhat able to escape "the way in which even
the flavor of race relations can sap the intellectual strength of minority groups"
(Watson, 1970) because of the efforts of their parents.
The genetic (heritability) theory of IQ has also been attacked on methodologi-
cal grounds. Hardy, Welcher, Mellits, and Kagan, (1976) found that four categories
of error, in addition to.lack of'knowledge, may contributp to the aforementioned
differences: (1) failure to comprehend the entire question; (2) failure to under-
stand because of speech perceptions- enunciation differences between the examiner and
child; (3) an incorrect frame of reference, a difference between the child's -ex-.
perience and that upon which the question was based.; and (4) inability to verbalize
(possibly due to limitations In the vocabulary of the child). The child bight
seem to know an atiewer but be unable to communicate it with the appropriate words.
Hardy et al. hypothesized that probing would eliminate all errors other than
those due to lack of knowledge,
/ .
They administered the WISC.to a
then after a per4od of rest:
thereby giving :a truer picture of intelligence.
group of 200 inner-city children (88% Black), and
(a) Selected questions from each (of five sales) .were readministered
and scored, in the standard manner. (b) A structured set of probing .
questions, designed to as4ereain the reason underlying the child's
response, was then, administered. If the readministration response
was incorrect,- an attempt was made to classify the child's error.
(c) The final resp4nse, at the completion of the probing questions,
was scored for correctness for that particular child.
4
6
Results of this study are presented Table 1 (all Tables are collected in
Appendix G).
0.
They- authors state that. their study was not designed to provide an estimate.
of global IQ scores that might have resulted framreadministration of all the WISC
questions. Instead it was designed to shop that "some children are penalized for
providing reasonable replies to'questions, but answers that, accordfng to the Manual,
of the test, are unacceptable and receive no credit." Table I strongly suggests that
much of the lower group scores of Blacks might be accounted for by these categories.'
Examples of some readministered questions and answers are enlightening. In
4.
the Information Subtest questions. 1, 4, 5, and 6,'were readministered.
Question 5. "What must you do to make water boil? At the time of
readminstration 47 of the 200 children made errors. By rephrasing
the question, "How do you boil water?" only 17 continued td obtain
no credit '(p. 47).
In the Comprehenqion Subtest five questions were readministered.
To question 1, "What is the thing to do if you cut your finger?",
most of the children (148 of 200) initially gave the correct
response: "Put-a bandaide on it." Thirty-seven were partially
correct, and 15were incorrect. Of the partially correct answers,28 (76%) w'ere considered to be frame of reference errors. A
frequent response was "Go to the hospital," which )1elded apartial score of 1 point. When the additional information wasprovided that it was a "little cut," the correct answer was given
by all but two childien. In most instances, where the child I
responded "Go to the hospital," he hid been treated at the hos-pital for a prio1C. injury. Of the 15 incorrect responses (0score), 14 were attributed to failure to comprthend the question:
"It bleeds" and "with a knife" were common responses. Upon
further questioning, it was apparent that all but,two children
knew the correct answer (p. 47.-48)4,
Living in a poor neighborhood where many cuts are the result of violent acts
4,
committed with knives and that requiemergency, medical aid, the original answer..
given by these children can by seen as "intelligent". It should also be.remembered
that being poor also correlates with lack of private'medidal services; poor people
receiving their primary health care not from family doctors but from hospital
emergency rooms. Thus the answers are "intelligent" when viewed from their
particular social circumstances. It is also reasonable to expect fewer households
to have the discretionary cash to purchase bandaids in a slum area than in more
.
affluent areas.
4
In the Vocabulary sub-test, eight questions were readministered. Two examples,
should be sufficiege.
e" Question 9, "What is fur?" yielded 18 correct 2-point, 96 1-point,and 86 no credit'answers among 200 children. The most frequentanswers "fur coat". and "fur hat" are hothno credit respo -s. The
follow-up question ''where does it come from?":produced th, orrectresponse from some children. While the majority of no cr tresponses apteared due to 1414 of knowledge, 26 (38%) had problemsverbalizing the answer. At the completion of the follow-up questions,the frequency of no credit respoOseS decreased from 46.3% to 27.5%.
Question 11, "What does join mean?" elicited only nine correct 2-point scores on readministration. About two-thirds' of the children
lacked knowledge necessary for a correct answer, and/the.remainingasildren made auditory perceptual errors. They heard "join" as ,
"Jo Anne," "John", or "Joy." They responded to.the word they heard,
r but when the psychologist repeated the question, many did not knowits meaning. Of the 134 originall obtaining a partial score, 127did not improve. ,Th* tended to use "join" in a phrase or sentence,such As "join'a,cleb," indicating a 'partial famlliarity with the
`word but inability to use its more 'abstract meaning, a verbalization
problem (p. 49).
These two questions, and the children's responses to them, demonstrate
another problem.in comparing different sub-cultures op standardized IQ tests. That
s
problem is the different way words, phrases, and sentences are pronounced and used
by different sub-cultures. Black urban children who for the most part are only
second ant third generations,removed from rural stputhern background pronounce words,
differently, and therefore attribute different meanings ,to'such words, than educit-.
ed nortkern and eastern psychologists. Additionally, the usual mode'of expression
and forms of.commUnication of these youngsters may be significantly different than
those-forms of communicating deem "proper".by test constructors and the supra-
culture in general.
Sociological Accounts
Should cultural variance-be the title cause of the reported differences, it would
follow that variations in IQ test scores
further removed from the general culture
should be greater between those groups
and the White standard, than those that
are more integrated with that standard. This is indeed the case. McShane and
Plas (1982) conducted a study of 142 American Indian children which was divided into
two sub-groups, traditional and acculturated. Their study hypothesized the ex-
istence of a unique pattern of Weschsler Seale Indian performance that differs from
that found intlearning disabled groups-or within the,norming (White) group. The
results were as expected. It was found that the-typical Indian ,child possesses
relatbiely smpertgr visual-perception abilities and depressed language skill as
assessed by the Wechsler scales.
But more important than the identifiable Indian profile was the fact that the
tradition4 children evidenced.the Indian pattern'of recategorized Weschsler subtest
performance, while the more acculturated groups did not. On the basis of the verbal-.
performance IQ ratio, 159 Indian children, drawn from three sources ( a group re-v I
ferred for psychological Servrces bcause sof edLational difficulties (N 105), a
group referred because.of hearing problems fotltis media) (N = 20), and a grodp
referred for giftedness'screening (N = 17) were assigned "traditional" or "accultur-
ated" status. A difference of 9.points was considered significant for Indian
populations, based on'previous.research (McShane. 1980). Those children with more
than a nine point difference in performance and verbal,IQ were classified as
traditional; those children with a nine point or less difference were considered
acculturated,
In order to ascertain-the validity of the relat ship between the nine-point
Wechsler -verbal- performance IQ difference-and level of acculturation for this
particular study, 'McShane and Plas (1982) inspected the households or measured. the
At
I 10
9
acculturation of the mothers of 37 children. Of the gifted group, six has 43:4.
Wechsler verbal-performance difference of nine points or less. These "ac-
,
culturated" Indian children each had one Whi,e parent,'or had parent(s) raised,
in the city,) or were raised in a foster hottie. The 11 students of this group
achieving a verbal-performance difference in excess of nine points had, both Indian
fathers and mothers and both child and parents had significant reservation contact.
Fifteen of the mothers with children in the hearing problem group- were given
a test, of accultU6tion developed by McShane, the Traditional Experience Scale
,(TES). Children of those mothers who scored as highly traditional on the TES had
a mean verbal -performance score difference of 25 points. The mean difference for
the children of moderately traditional mothers was 16 points. And the difference
for children of low traditional mothers was 0 points.
McShane and Plas conclude that acculturated Indian children exhibit smaller
Wechsler verbal-performance differences and a less identifiable Indian sub scale
pattern thando the traditional-raped children. From a cultural distatie per-
spective the Wechsler scales performance of Indian children can ire seen as viood a
measure of Anglo-acculturation as more traditional methods; and not simply as a
measure of intelligence. McShane and Plas come to.a like conclusion when they ask
that an explanation be found which integrates the Indian's child traditional.
heritage into an understanding of. his "intellectual style."
Not only is the fact of multiple sub-cultures a problem for test !construction
and intepretatidn in the United States, it presents a problem for other multi-
cultural western societies as well. Lieblich and Kugelmass (1981) have illustrated
that Israel has the same problem with her Arab minority. These authors found that
the Arab child in Israel shows a pronounced verbal over performance scale score
difference. on an Arabic translated version lof the Wechsler. The characteric
.difference is consistent up to fhe age of 12 in these children.
1D
Lieblich and Kugelmass' struggle to explain these circumstances and dismiss
the genetic for the environmental interpretation. They ask two related Questions
in the search of an explanation: "what are the factors involved in .producing'fbe
Verbal- superiority profile in the fitst place, and what are the factors which may
account for its disappearance toward adolescence?" They note that genetic theories
have been suggested to account for a "possibly related phenomenon of perceptual
deficit" among American Blacks and the maturational differences have been offered .'
to explain "gimilar findings" when comparing the intellectual achievements of boys
and girls. They however argue that a genetic explanation could not be plausibly
'maintained considering the disappearance of\the specific sub-scale pattern in Arab
children at the-age 12. A 1975 study (Lieblich, Kugelmass, and Ehrlich, 1975) ino
which Jewish and Arab children, aged 4 to 7, living in th4 same city and having
similar SES background evidenced very similar patterns and levels of chievements,
would negate the maturational hypothesis.
Lieblich and Kugelmass therefore suggest that the Arab culture and the environ-.
.)ment of the Arab child be, examined in order to provide answers to their previously
stated questions.
a
Historical Account&
It should be clear from the foregoing that environmental explanations of group
differences are the rule, not the exception. Why not so in America? 'could the
emphasis on heredity, in America be a result of the capitalist formulation of labor
as is advocated in Marxist doctrine? Levidpw (1978)isiells out what he terms,
"A Marxist critique of the IQ debate." In it, he describes the quantification of
- 1
intelligence as being the rebuIt of capitalist. historical development. He argues
that the use of IQ test is fah ,,realty a ploy of "racist" to scientifically in-
stitutionalike capitalist aims through the use of science. .IQ testing is'seen-at
a way of codtrolling labor. Levidow argues that thrtugh the reification of the
4.4 12
a
a,
41
11
r-trait of intelligence capitailsecreates for itself. certain social classes which
can be easily channelled into preordained labor positions. Levidow proposes that
by-mystifying abilities,-capital is ableto force deficits in performance r
/earning into the being-of inferior persons. Society is not'to be field responsible
fdr the.low social standing and exploitation of these people because it isthe poor
genetic make -up of these types which keep'them in their positions arservitude,
not the inactionor reaction of the. illidg clasies.
There are those in the field of social psychology other than marxists, who
believe that the science of human behavior is an historical endeavor. In his'
article, ';Social Psychology as History, " Gergen (1972), argues that social pay- s
'a* 1 4 4
chology is primarily an historical inquiry. He states that unlike that natural
sciences, social psychology deals with "facts" that are largely nonrepeatable and
that change as a result-of the progression of- time. He asserts that principles
based oh human interaction cannot easily be developed-thatMill prove useful over
time because the -underlying facts on which the principles are based will change as
the times change; In the final Analysis, states Gergen, social psychological
knowledge cannot accumulate in the usual scientific. sense because knowledge of
human interaction is a prisonerof its time%and setting.
.So here we have delineated two ways in which social science in general, and
psychology in particular, are intertwined with history. One is the effect the times
10
we live in have on scientific propositions and-Inquiries, which has been labelled"
.
"zeitgeist," and the other is the evolution of human behavior'over time. The first
is the historical effect the Marxists propose., The second effect of history is
changes'in the subjects under study. This too,is an historical reality. Jones
(1971) has captured the essence of both historical effects in his review concern-
ing the use of IQ tests from 1870 to 1910 to prove Blacks inlerior.
12r
Jones demonstrates the effect of the zeitgeist on scientific jnquiry during
this -period. He theorized that somewhere between Reconstruction and 1930 the
climate of thoight moved from one of innate equality of the races to one of Black-
inferiority. SoMe of the reasons behind this change listed by him are: (1)
Southern bitterness over Reconstruction, (2) Northern Capitalist,interest in the
SOuth, (3) the desire of Whites to put differences aside and reunite the country,
(4) Social Darwinism, (5).the rise of imperialism, (6) the "yellow.peril" a
militant Japan, and (7) the "red scare."
Jones goes on to showhaw the different kinds of "tests" these scientists used
(the sociological, the psychological-,tand the physiological) were in many cases
with metlilidolidgrdalf11011;''prtfinteri.contrattictory-resulter and
results were explained away oftentiz..es or suppressed Shen they did not agree with
the prevailing zeitgeist. Jones concludes that a vicious cycle was joined, the
White scientists-being adjoined with the public in this regard: "les believed
Blacks to be inferior. Therefore white scientists believed them inferior and their
experiments 'proved' them to be. The proof offered by these scientists reinforced
the beliefs 9f the general white population, and so on it went." A by-product of
this process was the fact that a number of Blacks came to believe in their inferior-
ity too.
The work of Jones briefly touched on the U.S. Army testing in the period he
studied. A more recent examination of World War One Army testing methods and re-
sults (Bronfenbrenner, 1980) demonstrates how the zeitgei't of the period worked to
perpetuate itself. These tests were used at the time to "prove" the inferiority
of the immigrant population from Eastern and Southern Europe and their offspring.
This was a result of the geileral feeling of the U.S. public that the flow of im-
migrants from the "underbelly"'of Europe should be halted, or at least drastically
reduced. By proving these populations deficient in certain areas such as morals
(the Black-Hand Society or Mafia was getting a great deal of press coverage) and
F
14
odi 13
intelligence, Congress was able to eventually reduce the flow.of such "undesirable
. elements ".. Today however, theudescendants of these "geneti4ally inferior types"
are considered equal in intelligence with other Whites. Here clearly is an ex-.
ample of both fotms of historical-psychological interactions in the process of
change: (1) the zeitgeist, and (2) the improvement of theaest scores of Whites
from Eastern and Southern Europe living in America.4
Apparently both the zeitgeist and the social reality as quantified by test
scores can change. One area in which test scores for Blacks have improved to a
.level equivalent with Whites is that of self - evaluation. Adam (1978) argues that
what is conceptualized as self-esteem has changed as rapidly and drastically as
the Areal" rise in Black esteem (an example of the zeitgeist and fhe quantifyable
changing in tandem). Taylor and Walsh (1979), along with other writers (Fu,
Korslund, and Hinkle, 1980; Pettigrew, 1978; Simmons,'1978), believe that there
hasAbeen real gain in the self-esteem of Blacks.
So the question remains, "why have not the IQ test 'scores of Blacks risen to
the national norms?" As cited earlier (Berry, 1982), Black norms-ail certain in-
telligence and aptitude test are rising slowly.
O 15
4
4
THE CULTURAL-DISTANCE APPROACH
w
This returns us to a previously discussed. topic and the main premise of this paper,-11
thatis: a 4lb-cultr' distance from the major cltre on which the test
qUestions are based and validated, will.determine that sub-culture's group mean in
relation to the jtorm main of the test as a whole and that 'sub'-cultures sub-score
pattern in relation to the sub-score pattern of the norming poptilation. So e
problem comes down to defining "cultural distance.".
this stance eliMinates die need to consider bias in order to improve the test.
Bras will henceforth be an,accepted fact in testing. "Tests are not unfair. . Life
is unfair and tests measure the results" (Sowell, 1977). This author accepts the
above assessment and presents beloV his forking definition for Cultural-Distance
and base of departure for the reminder a this treatise. Any sub-culture operating
according to yrinciples not equally operative in the major culture not existing in
the major, culture, or operating without the benefit- of a principle operative in the
major culture will be assumed to be attending to, processing, storing, retrieving,
and /or practicing functional information not exactly like that of the major culture.
_Therefore tests based and validated on the major culture (or even validated on mem-
bers of the society according to percentage representation of all sub-cultures in
the super-culture) will show characteristic patterns of group responding different
from those of the forming sample.. These response patterns are indications of what
is'salient to each minority sub-culturelin the tests and within the major cultUre,
and what is not. The tests are not responsive to what is salient to the sub-
culture but absent in the major culture, however.
The above underlined statement is both a definition of " cultural distance" and
an explanation of normative differences between social-culturally distinct groups.
14
-44
As a definition it proVides a base from which_ to.inves
,,.reported dif fereace*
e.14..between groups in the literature, and as an explanation, it lesides the theoretical
footing from which predictions and interpretations m' be ;Lade.*
The sub-test scores that comprise.the characteristic response pattern can
either be elevated or depressed 'as measured by the norming sample. The elevation
of the Arab-sub-culture group norm as compared to the major-culture norm Israel
(Lieblich and Kugelmass, 1981) in regards to Verbal ability On the Weschler scales
demonstrates an Arab distance
shows the relative importance
Lieblich and Kugelmass rep6rt:
froethe major-culture norm (Jewish) in Israel that
of Verbal patterns of behavior in the AraCculture.
Many cultural analyses have stressed the central role of the Arabic
language in both oral and written form on its users . . . Some even
imply that there may be disproportionate attention paid to the language
at the expense of other aspects of communication (p. 317).
In regards to the depressed Arab performance score, the same authors accurately
state that Arab attitudes toward time and speed may be causal factors involved here.
1
"Speed is from the devil," is a popular Arab saying. Lieblich and Kugelmass note
that Arabs are accustomed to working in a relaxed and unhurried Mehion (as they
assume most "relatively 'Less modernized societies" are), while the majority of the
Performance sub-tests re quire fast reactions and these sub-tests penalize slow
responses, even when co[rect.
Lieblich and Kugelmass are able to see differences qualitatively and not
strictly quantitatively. The cultural-distance approach would even predict the
disappearance of the relative verbal' superiority of the Arab child over his Israeli
Jewish counterpart at about the age of 12. This is around the age of manhood in
both.the Jewish and Moslem religious systems. At this age many Arab children
assumeanadult position in life. They acquire jobs and begin to acquire the .per-
formance habits which will enable them'to support standards for employment are.
Jewish and not Arabic, therefore at this age (12713 years), the child begins to
17
om
CI P
become more adept at quick responding relative to verbal responding,. -The tural
i
distance between the two groups is narrowed by environmental an -social forced .
i
1
16 0
a
It is proposed that similar analysis .bf all cross-cultural comparsiondata
could be accomplished from a cultural distance perspective. Predictions could be
made concerning wayS of improving the are of "deficie'fn minority cultures
alp about the factors dontributing to obslerved differences.
It is time that the American.z t changed, just as tle American social
.realfty is changing.. Instead of conside ing racial groups as distinct and separate' .
populations, Americans must come to grips with the continuing revelations on this
score. by social-biologists: Beliaev (1982) states:
The human beings populating our planet belong to the, single polytypical-species Homo sapiens. The racial differentiation of humanity and, evenmore so, national boundaries have not created mechanisms of reproductiveisolation, with the consequence that the exchange of genes exti6Adsthroughout the entire human race, resulting in a single genetic pool forthe Specids, constituting its basic wealth and the foundation in nature
00" for further progress and flourishing (p. 86).
ultu 1 distance and biolo
Robinson (1982) estimat s that in the United States, 95 percent of all Black peoplea
have some admixture o European genetic stock while at least 27 percent pf all
White people carry some African genes. Based on these facts, is genetics enough .
anymore to explain Black -White differences on IQ tests? Robinson, consideringA
these facts, asks the telling question, "which genes misbehaved?"
When performance differences and sub-scale patterns are approached from a
cultural distance perspective, the latest discoveries in social-biology are not
antagonistic to the understanding of these differences and patterns (as is social-14,
biology and the racial genetic theory), but agonistic. For example, the social-
C
biology. contention (Hamilton, 1964) that those traits most associated with fitness
have low heritability'Seems strongly at odds with the racial genetic viewpoint that
the proportion of genetic contribution to inXelligence (su ely a trait associated
18
4,
17
with survival in mankind-fitness) now stands at 68 to 70 percent (Das, 1977).
Social-Biology would argue that any trait of survival value (fitness) such as
intelligence would quickly spread throughout tie species via the process of.
natural selection. Thereaftef, any differences in phenotype observd between
sub-groups belonging to that species would be the result of environmental, and
, in to case of Homo sapiens, social influences. 'The cultural distance approach. .
4 ,-
not only agrees with this prediction, it is axiomatic, as can be seen in oura
definitional/explanatory statement, reprinted below:
NO
Any sub-culture operating according to principles not equally operativein the major-culttire, not existing in the major culture, or operatingwithout the benefit of a principle operative in the major-culture will-
functionalassumed to be attending to, processing, storing, and/or practicing
functional information not exactly like that of the major culture.
Differences between sub-cultures are assumed to be-the result of different cultural
values'and also as the result of each culture's symbolic interpretation of its
environment. Cultural distance as a perspective incorporates the latest social-
biological knowledge better than does the racial-genetic perspective.
American psychologists have been trying to fit a square peg into a round hole.
They have been quantifying when they should have been qualifying. They have been
trying to reduce to a single scale, abilities and social-cultural propensitii; that
are different in their very natures. Levidow (1978) takes a quote from Marx that
illustrates this prime ermAr.
What does a solely quantitative difference between things presuppose? .\
The identity of their qualities. . .Hence, the quantitative measure of labors presupposes theequivalence, the identity of their quty.
Karl Marx (Grundrisse, p: 173)
If we replace the phrase "measure of labors" in the above with 'the phrase
"measure of IQ scores" the statement summarizes the position under which present
advocates of universal testing o
/rate. But what is the IQ score measuring: what
1
is intelligence? Jensen (1960) made no claims to know what he was measuring. Re
19
AIL
4reasons that we need not-know: we need only know that it correlates highly with
18
income, schhool performance, etc. Well, so does bel)g a meMber of the dominant
group correlate highly with income, school performance, and IQ score., Yet "no one
would argue that white skin per se is an ability factor," also carrying information
on social status, school performance, or even "G" for IQ (McClelland, 1973)..
What is expressed in the conclusions of the hereditarian view is a very basic
philesophical mistake: ,an error of 'deductive reasoning. While the major premise
of their argument is correct, the minor premise and.the conclusion are false.
Their logic is as follows:
Major Premis:
Minor Premis:
Conclusion:
Quantitive differences presupposequalitative sameness.IQ scores measure and quantify
- differences. in..intalLtgenae .bete en, .
culturally different groups.Therefore, culturally diffeeentigroupspossess different amounts of'the same quality.
A . I. twa a toll..
But if you do now know what intelligence is; or you presume to know what
intelligence is (i.e., the ability to learn) but do not measure the same quality
equally for both groups, your minor premis, and therefore your conclusion are
invalid.
Cultural distance and test bias
Ignoring the ignorance or lack'of concern about the essence of intelligence for
awhile, let us-, for a moment, concern ourselves with the equivalent measure of this
concept in culturally different groups. Hunter and Schmidt (1976) in a review de-
voted to the "Critical Analysis of the Statistical and Ethnical Implications of
Various Definitions of Test Bias," concluded with the statement: "we feel that we
have shown that any purely statistical approach to the problem. of test bias is
doomed to rather immediate failure." They went on to state that they felt that
there is no way that the hereditary-environmental dispute could be objectively
resolved through statistical means.
20
19
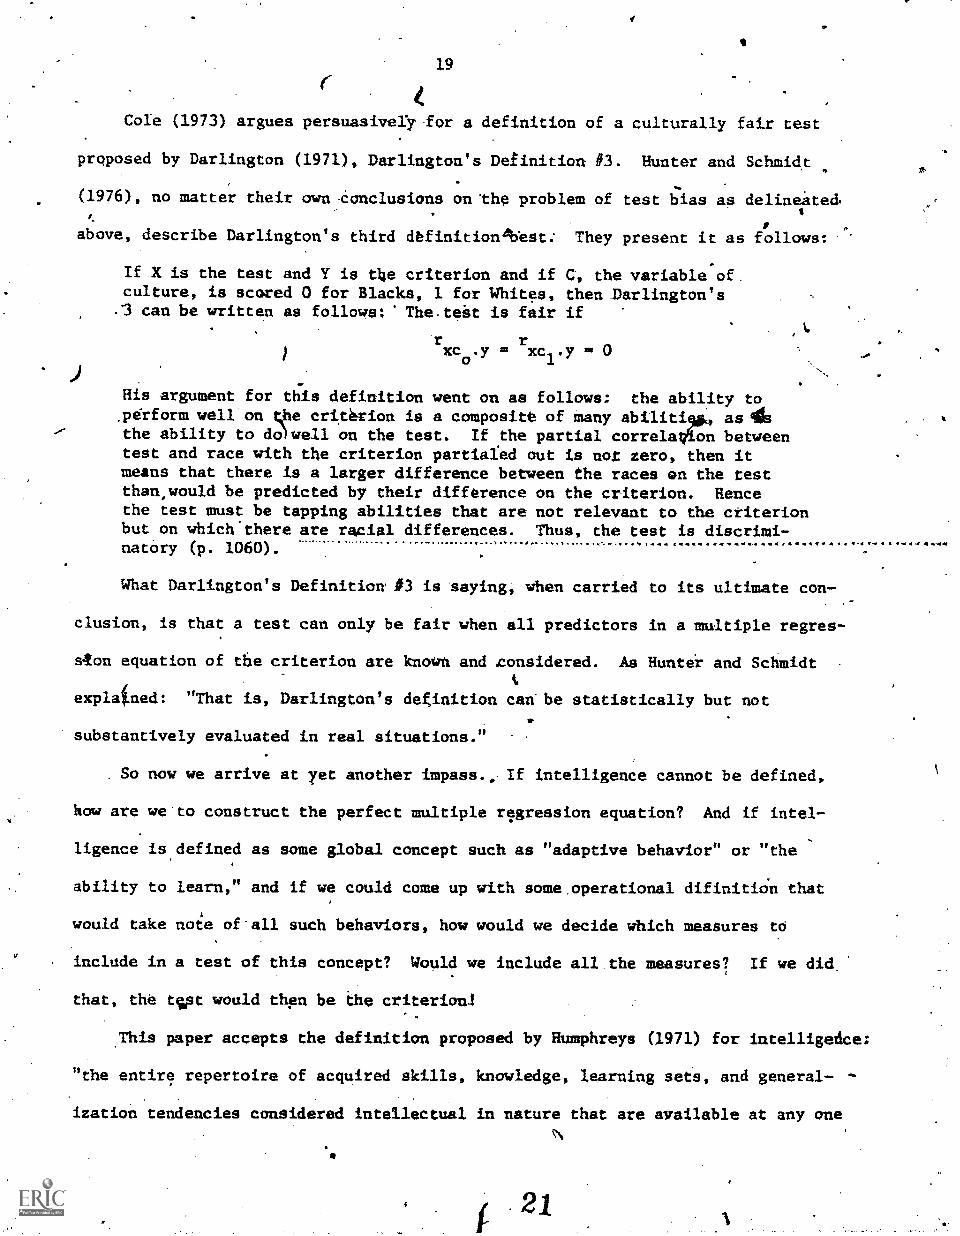
Cole (1973) argues persuasively -for a definition of a culturally fair test
proposed by Darlington (1971), Darlington's Definition #3. Hunter and Schmidt
(1976), no matter their own onclusions on the problem of test bias as delineated.
above, describe Darlington's third definitionibest: They present it as follows:
If X is the test and Y is the criterion and if C, the variable of.culture, is scored 0 for Blacks, 1 for Whites, then Darlington's.3 can be written as follows: The.teit is fair if
rxc
o.y =
rxc
1.y = 0
His argument for this definition went on as follows: the ability to.perform well on ;he criterion is a composite of many abilitiw, as itsthe ability to do)well on the test. If the partial correlailion betweentest and race with the criterion partia1ed out is not zero, then itmeans that there is a larger difference between the races en the testthan,would be predicted by their difference on the criterion. Hencethe test must be tapping abilities that are not relevant to the criterionbut on which there are racial differences. Thus, the test is discrimi-natory (p. 1060).
A
What Darlington's Definition' #3 is saying, when carried to its ultimate con-
clusion, is that a test can only be fair when all predictors in a multiple regres-
Rton equation of the criterion are knout and considered. As Huntei and Schmidt
explatned: "That is, Darlington's definition can be statistically but not
substantively evaluated in real situations."
So now we arrive at yet another impass., If intelligence cannot be defined,
how are we-to construct the perfect multiple regression equation? And if intel-
ligence is defined as some global concept such as "adaptive behavior" or "the
ability to learn," and if we could come up with some.operational difinitiOn that
would take note of-all such behaviors, how would we decide which measures to
include in a test of this concept? Would we include all.the measures? If we did.
that, the tejt would thgn be the criterioni
4 4 4.4 .t
This paper accepts the definition proposed by Humphreys (1971) for intelligedce:
"the entire repertoire of acquired skills, knowledge, learning sets, and general- -
ization tendencies considered intellectual in nature that are available at any one
21
21
This author believed that there is a legitime basis for test construction,
with certain reservations. Since what is important to functioning intelligently
in the society-as-a-whole will determine how one operates' in thaE society,. an
assessment of ones strengths and weakness as Measured by the norms of that society
can be very useful, both determininkin which areas one is likely to be )imccess-.
ful and determining in which areas one should practice the skills needed to
improve perforiance if one chooses to adapt those skills competively to an area
of persobal interest. Tests should however, not be used to denigrate, or even
revaluate, a separate population solely on the bases of differences n score pat-.
terns, or elevations and depressions, in comparison witl the whole pulation
(or other separate populations). Tests, should thereiore, be used t evaluate
and aid the indiVidual. Tests deed to determine group'differences based on 'any. ,
premise other than "cultural distapce" will lead only to invalid assumptions based
on "valid" data. Harvard biologist,Stephen Jay Gould agrees that this fact is
too often overlooked by the "hereditarians." He is quoted by Moho (1982) as. saying:
The hereditarians' .error. . .is to confuse within-group and between-group behay.ior. The classic studies-of heritable IQ. .".ate all withina single population. But variations among. individuals within a group,and differences in mean values between groups are entirely separatephenomena. One item provides no license for speculation about the other.IQ could be highly heritable within groups, and the average differencebetween whites and blacks in America might still only record theenvironmental disadvantage of blacks".(p. 22).
Argumenti that use data to demonstrate "that the items (of a test) that
best measure individual differences within each racial grimpare the same items
that discriminate the most between the racial' groups," (Jensen, 1976), and then
conclude this proves a lack of Cultural bias.in the instrument are-blinded by their
hypotheses. One could ultimately explain these circumatances by evaking "bi-
culturism." The minority persoseis surely aware of and proficient in'a number of
those attributes considered intellectual by the major culture. She would have to
be in order to even function maiiinally in the larger society. And'because she
A
22
22
is only allowd marginal participation in .the main-stream fabric
her knowledge of its intellectual sphere is "incomplete."'
nation,
This is the source of the "developmental lag" described by Jensen. But
instead 5f accessibility of lesd general major- culture knowleftebeing.inter-
preted as genetic default, it is in reality a sign of a smoothly functioning
intellectual mode. For,a bi-cultural organism to acquire an excess of unuseable
behaviors (even cognitive) unreasonable to expect. No, one would expect the
individual to only acquire those behaviors
environment (even social).'
that are allowed expression by the
Humankind lives in a fabricated:symbolic environment.
hereditarians to consider-ihis ecosystem. Apparently theye
area of human evlstence and source of evaluation. To know
quires that we leave no turf undisturbed. We must examine
ug as well as that. which puts.us in a bad light.
A
4r
ti
One would expect the
have "overlodked" this
the truth however, re-
that which flatters
# v
40,
4
4
The purpose of the rresent study is to examine Ehe role.of the cultural distance
THE PRESENT STUDY
hypothesis in dete uing group differences on intelligence and performance scales
in Black and Whir- subjects. It is hypothesized that the differences in Black
and White score- on IQ measures can be reduced from .5 to.1 standard deviation
... 4
\or eliminated completely by controlling for cultural distance through the man-
ipUlatian.of environmental factors.
Factors such as sex, socioeconomic status as determined by the occupation
of the head of household, region of residence in the U.S., and urban vs. rural
residence have already decreasgd the difference between Black and White IQ scoresa
on standard IQ tests from 1 standard deviation (seen in random samples on an
uncontrolled basis; Jensen (1971) to between .5 and .7 standard deviations
(Reynolds and Nigl, 1981). Kaufman and Kaufman (1973), matched Black and White
c hildren, between the ages 21/2 and 81/2, on these background variables: age, sex,.
father'; occupation, geographic area; urban vs rural residence, and school grade.
Their results indicated no significant difference b en Black and White pre-
schA-age children (the 21/2-"6 51/2- and 4 to 51/2-year old groups) on any of the
cognitive scales of the McCarthy Scales of Children's Abilities (MSCA). They did
however, find a significant racial difference for the 61/2- to 84-year old group.
These results would be expected when considered from a cultural-distance
peEspective, for two reasons: (1) the child learns more from and about her
culture as she grows and, since the average White child is learning more from and
about the major-culture as she grows than the average Black (who is learning from*
the major-culture but also her subculture), the cultural-distance between the W110t.
and Black child increases with age; and (2) intelligence is cumlative. If one doea
not learn to crawl, one will not learn to walk, and if one is not allowed to walk
often one will not learn to run well. The absence of.ini ifference between
the two groups is evidence of: (1) initial equality of the races; (2) highly
23
24
#1
k
24
similar inter -cultural early childhood learning and role expectancy, and; (3),-
a lack of psycho- social discrimination for such young ages.
Scarr (1976) investigated the IQ- scores of Black children of differing ages
adopted by White families and found that the mean IQ for this group was 16 po ints
,higher than that aCh3ved by "disadvantaged" Black children raised in their
families of origin in the same geographic areas. Scarr made sure that the com-
parison group did not fdiffer in any appreciable biological fashion, thus under'
cutting a possible hereditary explanation. It is also interesting to note that
the difference between the two Black groups is equal to what is usually observed
between random White and Black groups. This difference between racially ideiplcal
Black groups also parallels Jensen's Black-White pseudo race dichotomy discussed
above. Cultural-distance analysis of allthree comparisons would ptedict such
contrasts..
The other va riables known to affect IQ and/or school achievement differencii
are: father presence (Greenberg and Davidson, 1972; Carter and Walsh, 1980;
Deutsch, 1960; Lynn, 1974; Jants and Sciara, 1975); religion (Saigh, 1981;"
Bopegamage, 1979); contact of father with Whites (Orive and Gerard, 1975); educat-
ional level of parents (Greenberg and Davidson, 1972); care of home (Greenberg'
and Davidson, 1972); self-concept (Guardo, 1969); number in family (Olneck and
Bills, 1979); room/person ratio (Greenberg and Davidson, 1972); and educational
level of teachers (Lindsay, 1980).
Deutsch (1960) found that. black children from lower-class backgrounds
scored significantly more often below grade level on achievement tests when the
father was absent than when wt. Lynn (1974), in his book, The Father: His Role
in Child Development, reviewed the studies dealing with the effects of fathera.
absence: He noted that lowered quantitative and analytic skills were more readily
observed in fatherffabsent boys than father-absent girls. He alsa'determined,
from his review of the literature, that father-absence was more 'detrimental to the
3 25
II
4achievement potential of White children than*Of Black children.
4
Looking at their, conclusions in the light of cultural-distance, we might
reason that because children of the Black-race aretiore df ten faced with the
absence of a father than*are White children, as a group their'scores are affected
by this variable more at baseline than the)group.performance of the Whites.
.
Therefore, the absence-of.the father in any one individual White subject. will Pause
a greater d ference in his score from his within gtoup norm than that evidenced by.,
the difference etweenAany individual Black chIlilowithout a father in the home, andley 0.
her within group norm.
Father absence may .even hay .lootential,to.boost the IQ test performance of
male Black children. .Carterland 'Walsh (1980), while investigating the effects of1
father absence on early (grades 3-4-5) and middle (grades 6-7-8) childhood Black.
.
youngsters found a somewhat higher performance level in social studies of father-,.... t A ); oimaalN n .10 e. f
absent (FA) males over father present (FP) males in early childhood. They explain
these curious results by saying that the FA males' higher scores maybe reflecting
the influence of female language skills, which mar be transferred to boys more
easily in early childhood. The difference is not lasting however, with middle-
cgildhood FA and FP males scoring similarly in social studies exams.
The Carter and Walsh study cited above, interpreted from a cultural-distance
perspective", would suggest that Black-American boys raised in the poor Black
culture are being taught a more distant intelligence (as measured from'the supra-.
cultures's norm) than are Black-American girls. That is to ,say, the sub-culture of
the Black-American male is more distant from that of the American super- culture (or
White sub-culture) than is the sub-ymtture of the Black - American female. Arinoldo
(1981) supports this hypothesis. In studying age, race, and sex differences in the.
General Cognitive Index of the McCarthy Scales and full scale IQs of the WPPSI and
WISC-R, Arinoldo found that althoug0 the White group out-performed the Black group
at both Age levels (preschool,. 4-511;'school age 7-81/2) and on both tests, Black
26
26
. ,
. females in the preschool group outperformed White males in the same group on
both tests (McCarthy CCI, 94.0 to 91.2; WPPSI-FSIQ, 94.8 tof93.6), while Black
males already the lowest scoring sub-group in the study (McCarthy*GCI .., 87.0; WPPSI
FSIQ a 87.6). Black "bales at an early age are learningsamething different from
that which the dominant cultuie,deens important. Thus it seems that both race and
sex 'influence the learning to whith one is exposed and-the behaviors1which'are
learned. Sex plays a role in determining cultUral -distance. How can these and
similar results.(Reynolds, 1980a; Reynolds 1980b; Wrobel and Howells, 1982) be
explained from either a genetic or historical point-of-view?
The poor, and especially the male poor, have grave Obstacles to overcome
because of limitations set' on them by those with wealth and power. Because females
are often viewed as the "weaker sex" they are often allowed access to the domiciles
of the ruling classes as domestics and are thus privy to modeled behaviors often
unaccessible to the.male of the same class. Is.it any wonder that Black females
0240outperform Black males. Looking at the cultural implications would allow for the
disappearance of this effect as social class.became elevated because the modeled
behaviors would then Se equally accessibe to both Sexes.
Since the national social requirement of females,'regardless of race, is to
be,more expressive .(verbal and emotionally) but not.necessarily.
to be competent in.
the physical (manual dexterity) or philosophical plades (politics, science, higher
Mathematics), the reason for female and male dominance in these socially sanctioned
areas can be'attributed to cultural expectations.. It would of course follow that
Black fgaiales allowedto converse with the White cplture would be defined by both
race and sex, thus' acquiring higher supra-culture proficiency insexually-relevant
areas than in those areas deem sexually irrelevant. This increased behavioral'
proficiency would be transmitted to the Black females' off-spring unless countered
by other forces at work in the home (the-Black father -son relationship) or until
7:-a
.27
forces outside the.hOme begin to operate (society's definition of. male Blackness
for the Black child in the school system).
Religion of tester, testae, and attitudes of each toward and affected by the
perception of religious affiliation of each can also affect test scores (Saigh,
1981) and cultural distance (Bopegomage, 1979).
Beyond the presence or absence of father, the Black child is significAnrly
affected by the behaiioral patterns of a present father. Orive and Gerard (1975)
found that test performance of Slatkboys was significantly increased when the
father had frequent contact with Whited and the youngster was able to observe
these Black-White interactions. Black girls had, a similar reaction to decreased
father interaction with relatives. Mothers had little direct influence on the
test performance of either sex children.
Orive and Gerard search for an answer to the puzzle: why does the behavior
of the father affect performance of the children of both sexes but that of the
mother not affect either? Since the mothers in poor Black intact households spend
amore time with the children, they reason that they should affect them more. They
come to the the conclusion that the behavior of the father subtly affects the be-
havior of the mother, which in turn subtly affects the behavior of the children;
thud the mother is included in the equation.
The above results can be more satisfactorily explained by the use of.the
Cultural- Distance perspective. Since.in most families with a father present, the
male is the main support of the unit traditionally; while the mother is at home
with the offispring, the father is the family's interface with the larger society
outside the neighborhood (which is usually ethnic). Therefore the father will be
the transmitter through which out-culture behaviors mores, and perceptual styles
will be filtelmd. -Since the mother is more involved in "local" affairs and
inter -fly correspondence she will havelittle to bring directly to the children
from the major-culture; her role being the teacher of proper sub-cultural modes.
28
r
The answer is simple from the cultural-distance perspective: Black fathers
who deal with White men in the presence of their sons (leisure time) are mere
integrated into the White-culture than Black fathers who do not socialize with
Whites. As for girls;. Black men who do not associate as-often with the extended .
family are further removed from the Black sub-culture than fathers involved more
with the larger family. These fathers provide their sons with supra-culture role
models and a learning, atmosphere designed to produce enculturation. These fathers,
usually relocated away from the ancestral birthplace because of upward mobility,
force their daughters to form other female alliances beside the traditionally
strong "Black sisterhood" of female relatives. Thus, the integration of the father
into American society'leads directly to the integration.of his childrtn.
The educational level of the parents is of importance because in America,
education correlates with cultural-integration (Greenberg and Davidson, 1972; The
racial gap in SAT scores, 1982; Berry, 1982), as does the educational and motivational
level of the children's teachers (Lindsay, 1980; McGrath and Banta, 1982; Carey
and King, 1982; Williams, Foote, Ellis, King and Burgower, 1982).
Greenberg and Davidson (1972) found the care'taken to keep the home clean and
neat. and the room/person ration in the hoMe were two important factor's that dis-
tinguished 80 high from 80 low achieving fifth=grade "Black urban ghetto children."
The neater and cleaner home, and .the smaller room/person ratios were conducive to
high schlpl performance. Olneck and Bills (1979) found that smaller famili4Apro-
duce higher N-scoringchildken.
The intend of this study isto hold all the above environmental variables
constant across the two major racial groups. Variables that affect test perform-,
ance differently across the races due to the interaction of the test situation
will also be controlled. The influence of the race of the tester (Abramson, 1969;
Katz; Henchy, and Allen, 1968; Pryzwansky, Nichdlson, and Uhl, 1974; Settler,
1966; Terrell, Terrell, and Taylor, 1980; Turner, 1971), and order of race of
tester, when more than one test session is required (Watson, 1970), are two factors
taken into consideration. Abramson (1969) found that with kindergarten subjects,
the race of.the tester made no difference. _in fact each race 'did best with theeS
opposite race on the Peabody Picture Vocabulary Test, although non-significantly.
With first graders, however, die race of the tester was a significant factor, the
White examiner beingopreferred by both races (56.90 to 56.00 for Black first
graders and 58.38 to-57.45 for,White first graders). This study was conducted in
an integrated New York City school. Other results have been found in other areas.
Bias toward one's own race 'is the rule (Teirell, Terrell, and Taylor, 1980;
'Turner, 1971; Katz, lienchy, and Allen, 1968).
With the uncertain effect of this variable, it is surely one that should be
controlled for when comparing Black-White differences. Sex of tester is another
one. Turner (1971) found that "there are'strOng cross-sexual effects in motivat-
ional studies, and that different women have highly differential effects on
smpjects."
' Finally, the%type af test itself, giviNtO appraise IQ, will affect the
relative position of different sub-cultural groups (Hays and Smith, 1980; Sewell,
1979; Arinoldo, 1981): Certain IQ and aptitude tests are more culturally neutral
than4others.
METHOD
Subjects
The subjects for this study were 80 post- secondary school adults, primarily
college undergraduates attending Virginia Polytechnic Institute and State
University. A total of 48 White subjects (24 males, 24 females) and 32 Black
sOjects (16 males,. 16 females) were recruited and tested during the months
through August, 1983.
`Cultural Variables
Instruments
The subjects were given a 43-question Pirsonal Data Questionnaire (see Appendix.
A) prior to being given the series of tests. The questions in this schedule are
based in part on the U.S, Census Burekuls classification system of occupations
.(see Appendix B), and a Parent Interview Schedule' dealoped by Greenberg and
Davidson (1972) (see Appendix C). The majority of items are based on research
findings discussed in the text and the theory underlying this enterprise - Cultural -
Distance. The information obtained from this questionnaire provided the cultural
^factors which were used to test Hypothesis III (see below).
Measures
The following lteasures of IQ, learning, and performance were given each subject:
(1) Weschsler Adult Intelligence Scale - Revised (WAIS-0,(2) Peabody Picture Vocabulary Test (PPVT),(3) Booklet Category Test (BCT)(4) Memory Drum Recall, Test (MD #1)(5) Memory Drum Recognition Test DID #2).
The WAIS -R was chosen for inclusion in this study because of its wide use and
acceptance in measuring intelligence. The PPVT was chosen to be a part of this
investigation because of its moderate reliability (parallel forms, A ATI B, r .77)
and, correlation with the WISC (r,7 .60) (011endick et al., 1974; 1975) and be-
cause it combines verbal comprehension with performance responding.
31
The Booklet CategorNest (BCT) is a newly developed redesign of the
Halstead-Reitan Categories Test (part of a total neurological test battery). The
BCT consists of 208 /black -and white and colored plates% irranged in seven Separate
sub-tests. Within each sub-test there is one idea which will allow the subject
to choose a number between one and four that correctly represents the visual
image.1
The BCT is designed to assess brain damage but because it is a problem-
svf.
solving task, it was chosen for inclusion in this study. Results are)reported in
number of errors '(50 being a cutoff 'score for seill_ous neurological dysfunction).
hole_ two_Nemory Drum tasks Recall and Recognition, consist of testa of the. _ ..... _ _
abilityolieach subject to (1) remember and record three-letter syllables after
brief exposure and (2) recognize the same stimuli when presented in a field
equalling three-ti es the number of target stimuli.
Syllables were formed in the classical consonantvowel-consonant (CVC) style.
Vowels for each of the 48 nonsen syllables were chosen by randomly drawing, wig
replacement, one of five poker chips, on which were printed the vowels (A, E, I,
0, U), from a cup. The first and last letter of each CVC-syllable were formed
utilizing all the consonants in the alphabet save F (which resembled E),
(which resembled U), M (which resembled ), Q (which resembled 0), V and W (which
resembled U), and Y (which can beleither vowel or consonant) The 1-6 included
co'sonants were randomly drawn, with replacement, in the same fashion as used to
obtain the vowels to obtain the third letter of each syllable. Tha first con-""---
sonant of each syllable was formed by randomly selecting one of 16 poker chips
from the same cup, but without replaceMent. This last procedure allowed for at
least 16 different beginning letter. syllables.
The BCT and the two Memory Drum (MD #1, and MD #2) tasks are included in
order to assess subjects on both Level I (association) and Level II (transform-
ation) intellectual abilitits (Jensen, 1973),withOut the hypothesiZed interference
,.
32
of culturally weighted Material found in standardized tests of IQ.
Procedure
The 80 subjects were divided into four groups based on race and sex: (1) Black
males; (2) White males; (3) Black females; (4) White females. Four examiners,
2-Black males and 2-White males, were either graduate students in Clinical
.
Psychology or Educational Counseling. The tester-testee breakdown is presented
in Tile 2 (see Appendix G for all Tables).
All subjects were given the five dependent measures of intelligent behavior
in two settings according to the following formula. Each examiner gave half the
subjects he tested in each cell the WAIS-R on the first sitting, the other subjects
within that cell received the WATS-R administration during the second session
(the WAIS-R, because of time constraints, was always administered alone during a
session).
The other three measures (PPVT, BTC, and the verbal learning and memory tests)
were given within a single session, their order varied by the examiner from sub-
ject to subject in the fashion shown in Table 3 (Appendix G).
The actual combinations were left up to the individual. testers as long' as they
kept within the general guidelines (the order of all 4 tests were to vary com-
pletely within a cell). However, Memory Drum Recall Test (MD #1) always immediate-
ly preceeded Memory Drum Recognition Test (MD #2).
The WAIS-R, Peabody Picture Vocebulary Test, and the Booklet Category Test
were administered and scored according to the standard instructions accompanying
these. instruments.. The Memory Drum measures, Recall and Recognition, are tests
of the subjects short recall ability and recognition for old three-letter non-
a
Ala
sense syllables randomly set in a field of new syllables at the ratio of 1:2
(old:new) (see Appendix E).
33
es.
33
The Recall' and Recognition tests thus utilized the same paired.- associate
task consisting of 24 nponsense syllables (CVC type) presented mechanically by
a Schumann /Muller drum at the rate of one pair every two seconds. Two runs of
the same series were allowed eachtestee, with four seconds intervening between
the runs. After the second viewing of the 12-pair list, the subject was given4
the two tests included in Appendix E. The number of correct responses was the
score awarded the/subject on ,Memory Drum Task #1, while correct syllables circled
minus wrong responses divided by three constituted the score received on Memory
Drum Task #2.
Times of testing varied (morning/afternoon/evening & day of week) within
and between groups.ran4amly. The four male experimenters were also assigned times
and subjects on a random basis.'
Testers wore similar clothing, one color suits iich.ties devoid of jewelry
or of other ornamentation, when testing the subjects.; Testers also acted uniformly
in the ielivery of social praise during testing. Problems in these areas were
discussed at weekly tester meetings described below. Testers voiced no problemst
with the chosen reinforcements during the entire subject running phase. Because 4
of the age and educational level of the subjects very little prompting was required.
All testers were familiar with the instruments prior-to. the start of actual
subject testing. Practice on every test was begun two weeks prior to subject
(1with the four experimenters use of each other as testees. Review of acceptable
answers and scoring was also emphasized prior to actual subject contact. Possible
and actual non-manual responses were discussed in tester group meetings before
and after testing began until group consensus was reached on acceptable scoring.
The hypotheses of the study were never openly discussed with the three testers
assisting the author, but there was no effort to keep them totally blind. The
consent form (Appendix D) signed by each subject and the General Instructions for
(-1 testing (Appendix F) read to each subject contains some pertinent information.
I,
34
The subjects were tested in swill, sparsely furnished rooms; free of noise
and well lighted. The rooms were also windowless. A brief "get acquainted"
-session was allowed prior to commencement of testing. This period varied from
subject to subject and from session to session depending on the requirements
of the testee. Subjects were allowed a rest period between the tests; ten
minutes when requested.
Hypothesis ofthe present study
In line with the entire orienta)tion of .this_paper, based on the "cultural distance"
4interpretation of racial group comparisons, the following piedictions are made:
Hypothesis I:
Analysis of the raw IQ data scores between Black and White groups will show the
usual significant differences favoring Whites on die.four-measures of IQ.
Hypothesis II:
There will be no initial difference between the racial, groups on the three
memory/problem solving tasks.
Hypothesis III:
When certain cultural factors are covaried out of the test data, Black.and White
differences will dissip# e below the level of significance.
35
(N.
V
RESULTS
ANOVAs
Analyses of variance (ANOVA's) were calculated for'each of the four dependent
measures of IQ and the three memory/letrning tasks. Initially, three-way
ANOVA's (race of subject X sex of subject X race of examiner) were run on each
of the seven dependent measures.A
Table.4 (refer ba4r. to Appendix G for viewing of all Tables cited) shows
the various means of the different racial and sexual groups, and the grand4
Vears for the PPVT, WAIS -R Verbal, WAIS-R Performance, and WAIS-Rlull Scale IQ
scores. Also listed are the means of the raw scores of the same categories on
the BCT (error scores) and the Memory Drum paired-- associate recall pask plus
the calculated score means if the MemorxDrum- Recognition task. The same
table has marked those main effects (race and sex) which were determined to
have been significant at the .05 or .01 level.
Whites as a group outperformed the Blacks on three of-four dependent
measures of IQ. The White group out-peramed the Black group on the Peabody
Picture Vocabulary Test (p < .01).. The significance of'the racial means on the
WAIS-R Verbal IQ and Full-Scale IQ (p < .05) was not as great as is usually
observed between Black and White groups chosen at random. Since most of the
participants were college students at the time of testing a selection out of
lower performing Whites and Blacks was accomplished. The difference between
groups was therefore reduced from the often recorded 1 standard deviation to
less than .5 standard deviation on these measures.
As Table 4 shows, there were no main effects caused by gender in any of
the analyses. All analyses which resulted in any significant effects are
36
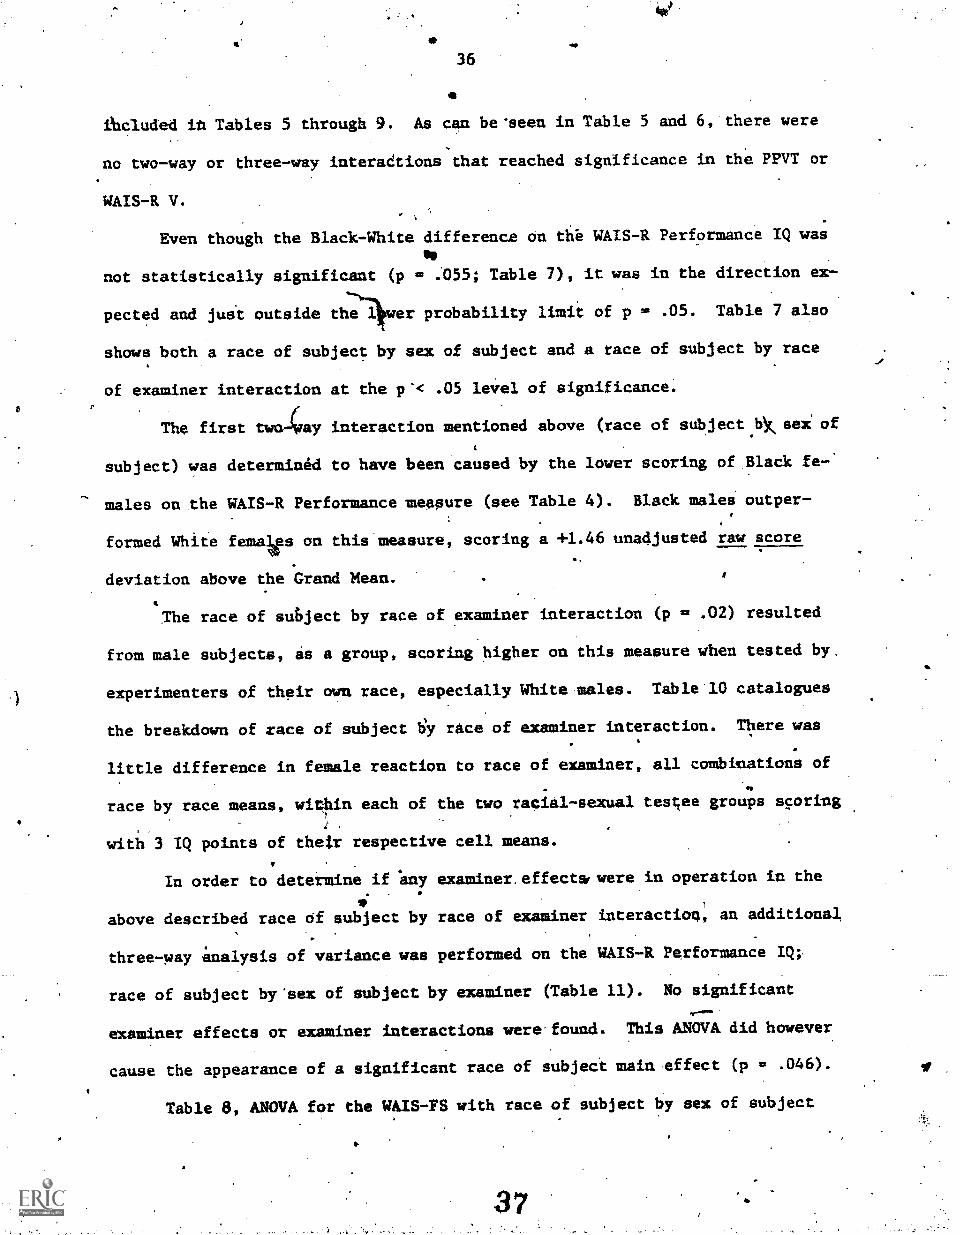
ihcluded itt Tables 5 through 9. As can be 'seen in Table 5 and 6, there were
no two-way or three-way interadtions that reached significance in the PPVT or
WAIS-R V.- ,
Even though the Black-White difference an thb WAIS-R Performance IQ was
not statistically significant (p .055; Table 7), it was in the direction ex-
pected and just outside the 11 er probability limit of p . .05. Table 7 also
shows both a race of subject by sex of subject and a race of subject by race
of examiner interaction at the p'< .05 level of significance.,
The first twahay interaction mentioned above (race of subject.Wsex: of
subject) was determined to have been caused by the lower scoring of Black fe-.
males on the WAIS-R Performance measure (see Table 4). Black males outper-4
formed White females on this measure, scoring a +1.46 unadjusted raw score
deviation above the Grand Mean.
The race of sut,ject by race of examiner interaction (p - .02) resulted
from male subjects, as a group, scoring higher on this measure when tested by,
experimenters of their own race, especially White males. Table'10 catalogues
the breakdown of race of subject ty race of examiner interaction. There was
little difference in female reaction to race of examiner, all combinations of
race by race means, within each of the two racial-sexual testee groups scoring
with 3 IQ points of their respective cell means.
In order to determine if any examiner.effectsfwere in operation in the
above described race af subject by race of examiner iateraction, an additional,
three-way analysis of variance was performed on the WAIS-R Performance IQ;.
race of subject by'sex of subject by examiner (Table 11). No significant,rmawa
examiner effects or examiner interactions were found. This ANOVA did however
cause the appearance of a significant race of subject main effect (p . .046).
Table 8, ANOVA for the WAIS-FS with race of subject by sex of subject
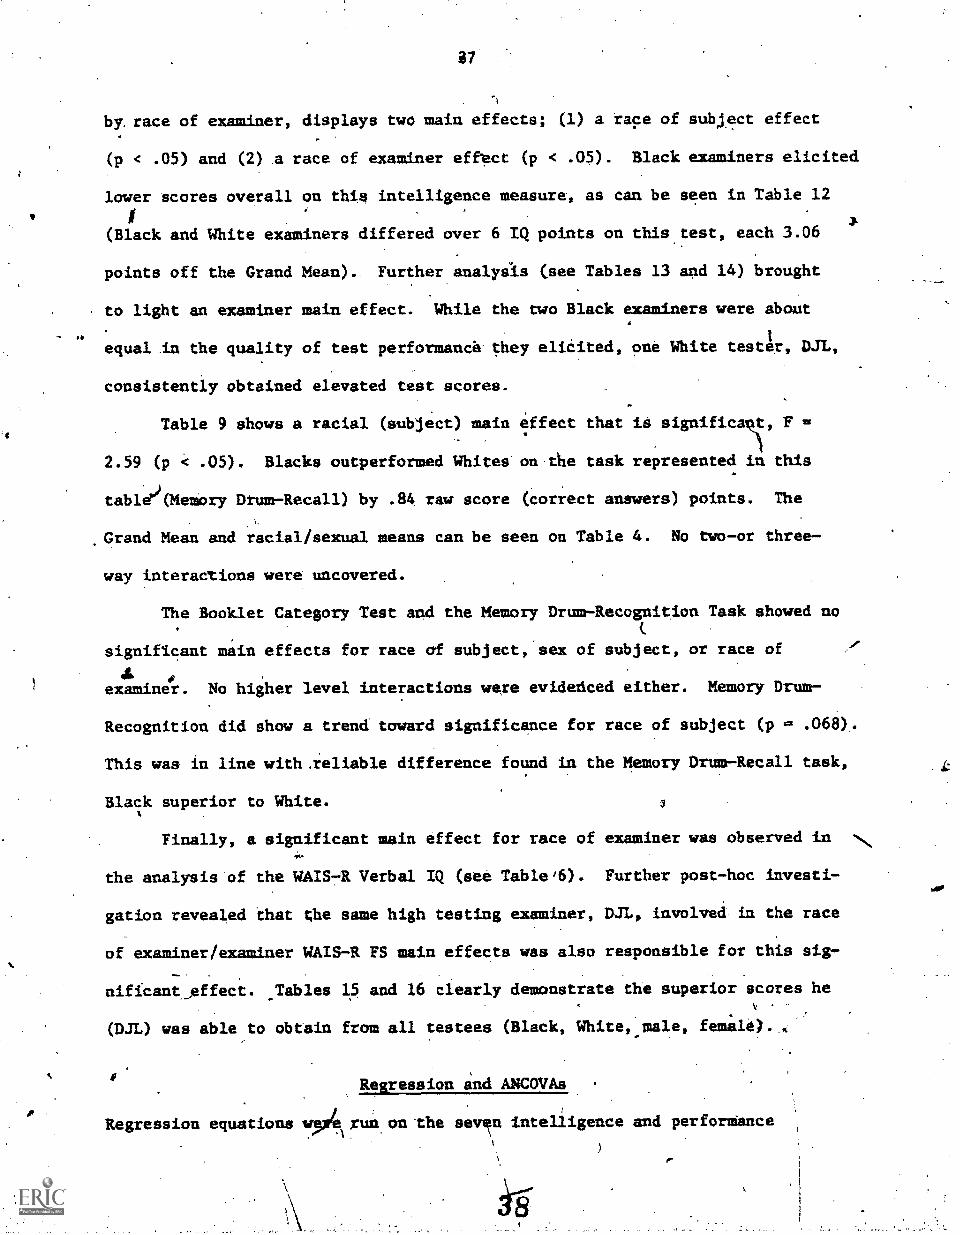
37
by. race of examiner, displays two main effects; (1) a race of subject effect
(p < .05) and (2) race of examiner effect (p < .05). Black examiners elicited
lower scores overall on thin intelligence measure, as can be seen in Table 12
(Black and White examiners differed over 6 IQ points on this test, each 3.06
points off the Grand Mean). Further analysis (see Tables 13 and 14) brought
to light an examiner main effect. While the two Black examiners were about
equal in the quality of test performance they elicited, one White tester, DJL,
consistently obtained elevated test scores.
Table 9 shows a racial (subject) main effect that is F
2.59 (p < .05). Blacks outperformed Whites on the task represented in this
tabld)(Memory Drum-Recall) by .84 raw score (correct answers) points. The
Grand Mean and racial/sexual means can be seen on Table 4. No two-or three-
way interactions were uncovered.
The Booklet Category Test and the Memory Drum-Recognition Task showed no
Significant main effects for race of subject, sex of subject, or race of
S
examiner. No higher level interactions were evidedced either. Memory Drum.
Recognition did show a trend toward significance for race of subject (p
This was in line with,reliable difference found in the Memory Drum4ecall task,
Black superior to White.
Finally, a significant main effect for race of examiner was observed in
the analysis of the WAIS7R Verbal IQ (see Table46). Further post-hoc investi-
gation revealed that the same high testing examiner, DJL, involved is the race
of examiner/examiner WAIS-R FS main effects was also responsible for this sig-
nificant_effect. _Tables 15 and 16 clearly demonstrate the superior scores he
(DJL) was able to obtain from all testees (Black, White,,male, female).
Regression and ANCOVAs
_1
Regression equations %/A run on 'the sev!n. intelligence and perforMance. .1
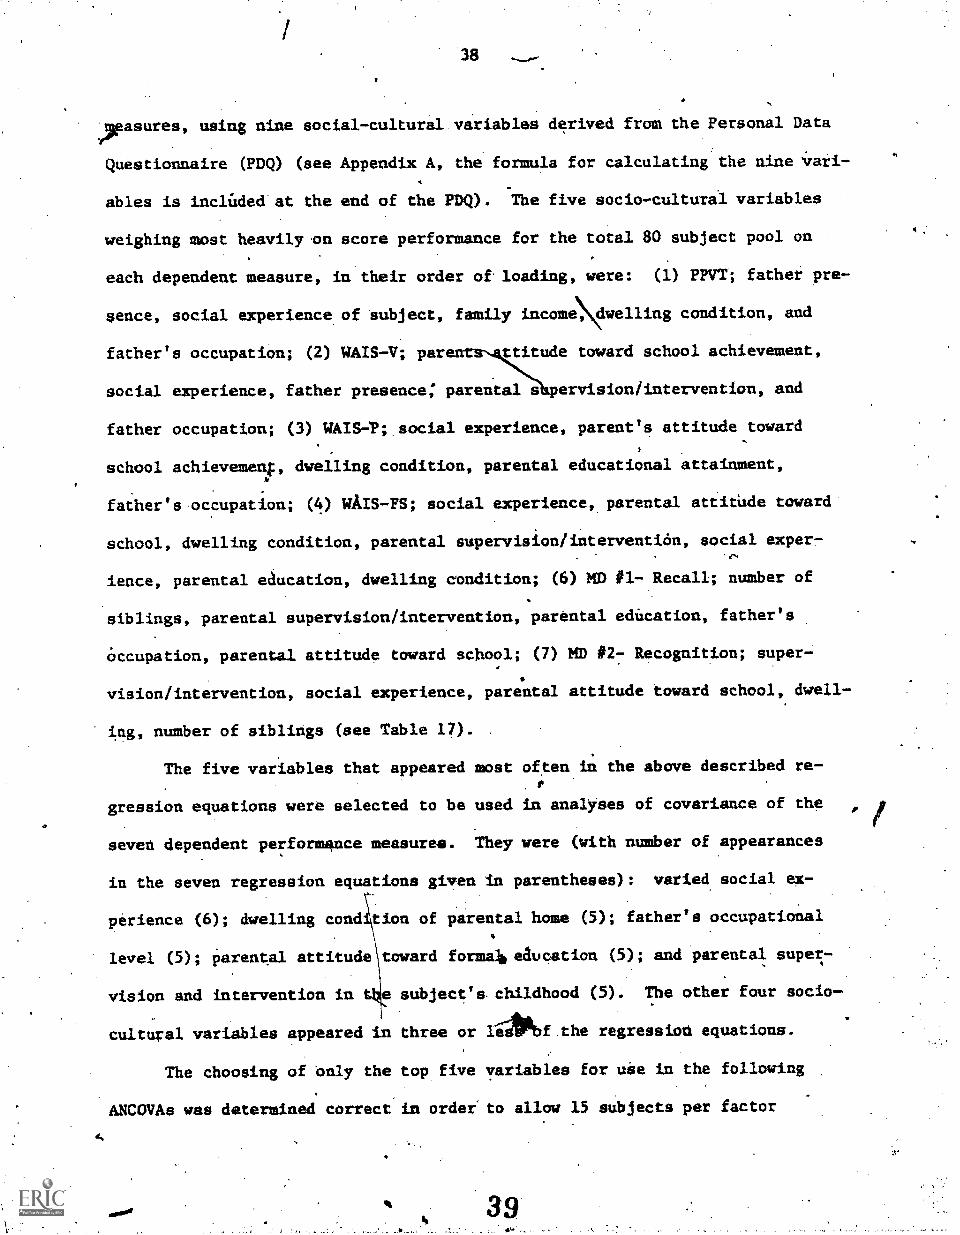
38
xasures, using nine social-cultural.variables derived from the Personal Data
Questionnaire (PDQ) (see Appendix A, the formula for calculating the nine 'reti-
ables is incladed'at the end of the PDQ). The five socio-cultural variables
weighing most heavily .on score performance for the total 80 subject pool on
each dependent measure, in their order of. loading, were: (1) PPM father pre-
sence, social experience of subject, family incomdwelling condition, and
father's occupation; (2) WAIS-V; par ttitude toward school achievement,
social experience, father presence; parental s pervision/intervention, and
father occupation; (3) WAIS4;.social experience, parent's attitude toward
school achievemeq, dwelling condition, parental educational attainment,
father's occupation; (4) WAIS-FS; social experience, parental attitude toward
school, dwelling condition, parental supervision/intervention, social exper7es,
ience, parental education, dwelling condition; (6) MD #1- Recall; number of
siblings, parental supervision/intervention, parental education, father's
occupation, parental attitude toward school; (7) MD #2- Recognition; super-
vision/intervention, social experience, parental attitude toward school, dwell-
ing, number of siblings (see Table 17).
The five variables that appeared most often in the above described re-r
gression equations were selected to be used in analyses of covariance of the
seven dependent performance measures. They were (With number of appearances
in the seven regression equations given in parentheses): varied social ex-
perience (6); dwelling cond tion of parental home (5); father's occupational4
level (5); parental attitude toward formaibeaucation (5); and parental super-,
vision and intervention in t e subject's childhood (5). The other four socio-
cultural variables appeared in three or iibliof.the regression equations.
The choosing of only the top five variables for uSe in the following
ANCOVAs was determined correct in order to allow 15 subjects per factor
39
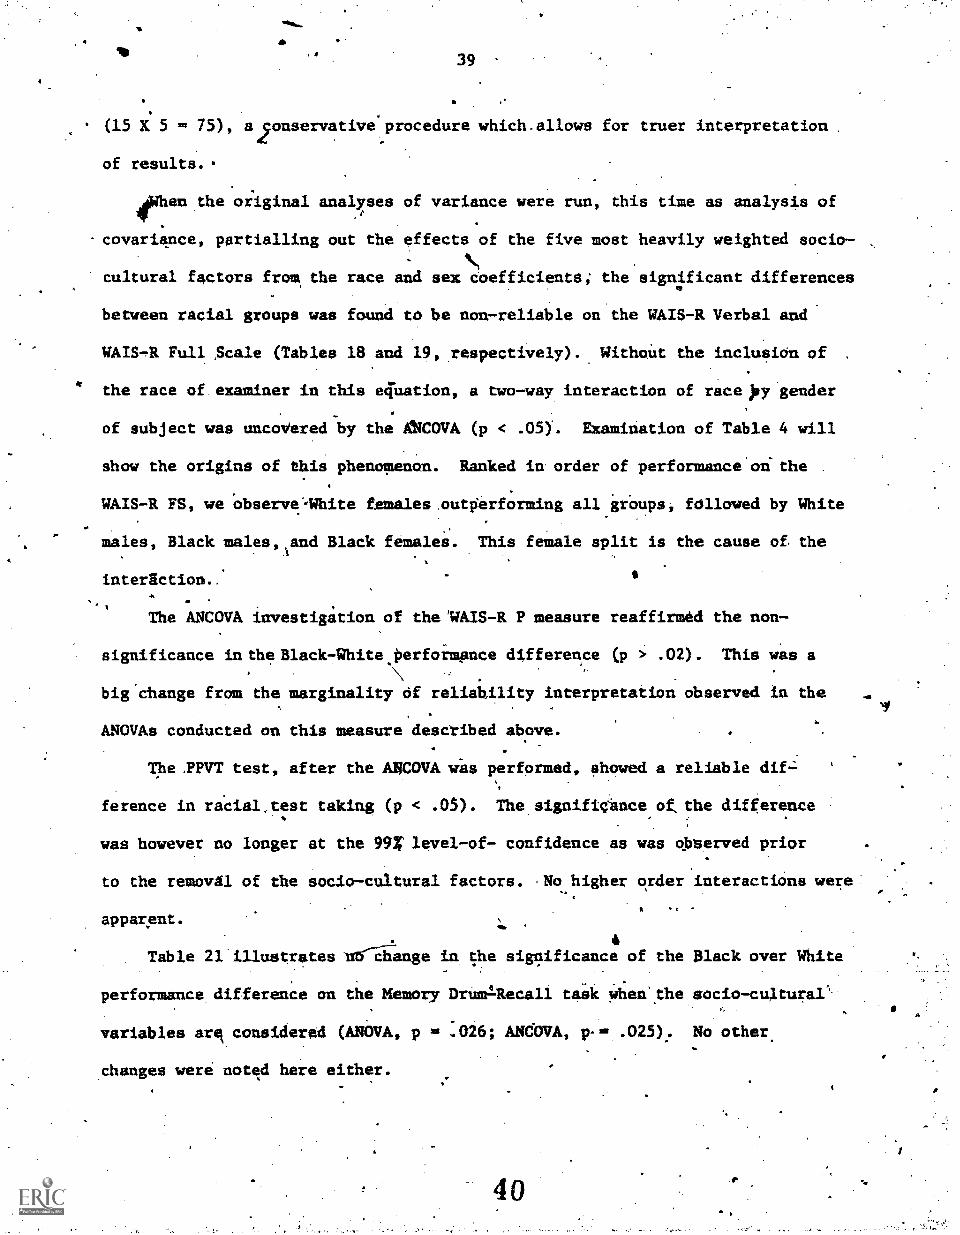
39
(15 X 5 = 75), a2onservative procedure which-allows for truer interpretation
of results.
4Whenthe original analyses of variance were run, this time as analysis of
covariance, partialling out the effects of the five most heavily weighted socio-k,
cultural factors from the race and sex coefficients; the significant differences
between racial groups was found to be non-reliable on the WAIS-R Verbal and
WATS,R Full Scale (Tables 18 and 19, respectively). Without the inclusion of
' the race of. examiner in this equation, a two-way interaction of race )13T gender
of subject was uncovered by the AC0VA (p < .05). Examination of Table 4 will
show the origins of this phenomenon. Ranked in. order of performance'onEthe
.
groups;WAIS-R FS, we observe--White females ,outperforming all groups; f011owed by White
males, Black males,land Black females. This female split is the cause of. the
interaction. 0
The ANCOVA investigation of the 'WAIS-R P measure reaffirmed the non-
significance in the Black7White,perfortkance difference (p > .02). This was a
Nbig Change from the marginality Of reliability interpretation observed in the
ANOVAs conducted on this measure described above.4
The TINT test, after the ANCOVA was performed, showed a reliable dif-
ference in racial,test taking (p < .05). The signifiCSnce of, the difference
was however no longer at the 99Z' level-of- confidence as was Observed prior
to the removX1 of the socio-cultural factors. No higher order interactions were:
.5apparent.
4Table 21 illustrates nrOrge in the significance of the Black over White
performance difference on the Memory Drum1Recall task Wiedthe socio-cultural'`
variables art considered (ANOVA, p = :026; ANOVA, p-= .025). No other.
changes were noted here either.
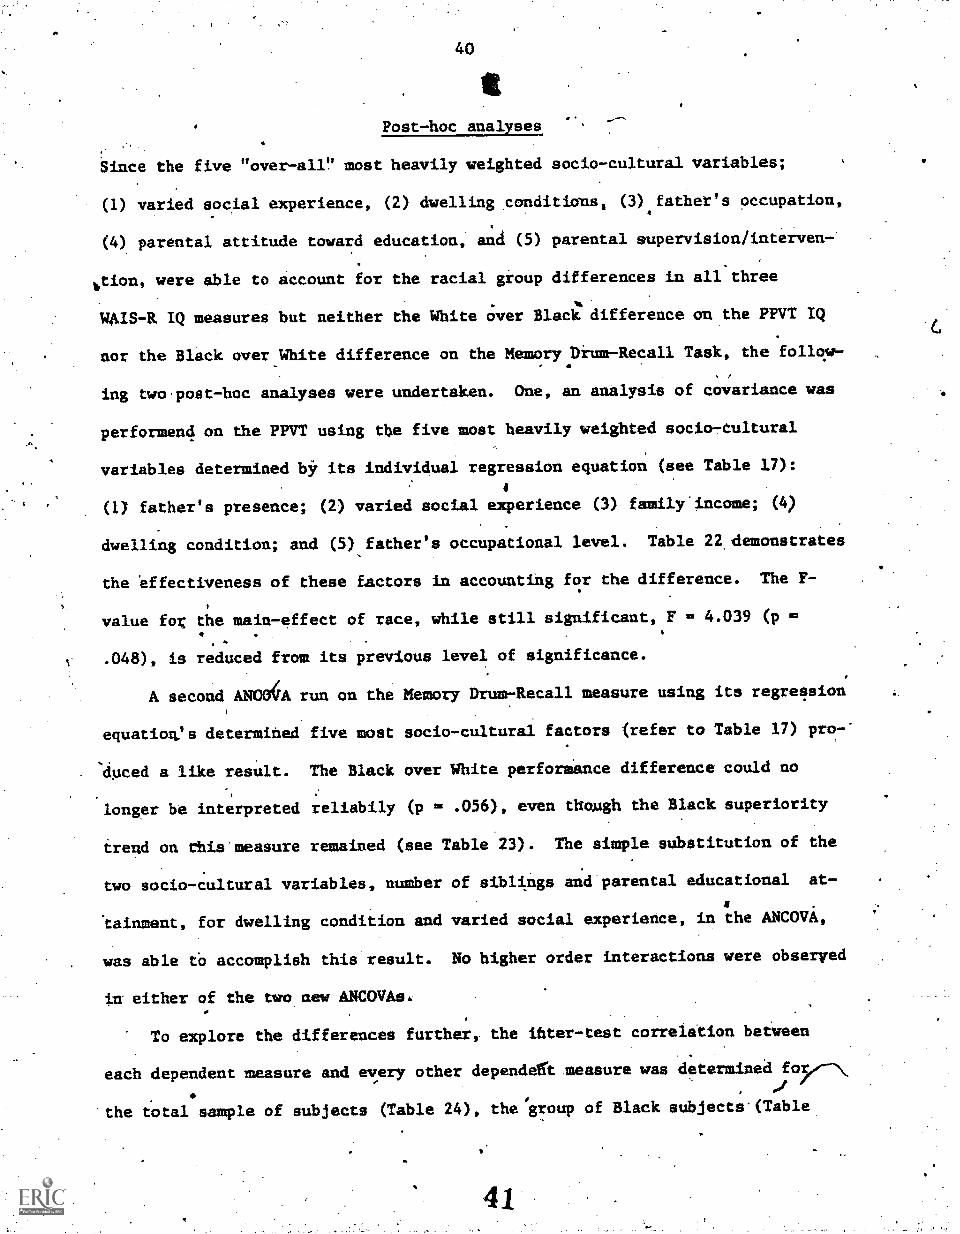
40
Post-hoc analyses
Since the five "over -all" most heavily weighted socio-cultural variables;
(1) varied social experience, (2) dwelling conditions, (3) father's occupation,
(4) parental attitude toward education, and (5) parental supervisioniinterven-
wtion, were able to account for the racial group differences in all three
WAIS-R IQ measures but neither the White over Black difference on the PPVT IQ
nor the Black over White difference on the Memory Drum-Recall Task, the follqw-
ing two,post-hoc analyses were undertaken. One, an analysis of covariance was
performend on the PPVT using t1e five most heavily weighted socio-Cultural
variables determined by its individual regression equation (see Table 17):
a
(1) father's presence; (2) varied social experience (3) family income; (4)
dwelling condition; and (5) father's occupational level. Table 22, demonstrates
the effectiveness of these factors in accounting for the difference. The F-
value fog the main-effect of race, while still significant, F 4.039 (p
.048), is reduced from its previous level of significance.
A second ANCOVA run on the Memory Drum - Recall measure using its regression
equation's determihed five most socio-cultural factors (refer to Table 17) pro-'
educed a like result. The Black over White performance difference could no
longer be interpreted reliabily (p .056), even though the Black superiority
trend on this'measure remained (see Table 23). The simple substitution of the
two socio-cultural variables, number of siblings and'parental educational at-
8
tainment, for dwelling condition and varied social experience, in the ANCOVA,
was able to accomplish this'result. No higher order interactions were observed
in either of the two new ANCOYAso-
To explore the differences further, the inter -test correlation between
each dependent measure and every other dependaft measure was determined foof
the total sample of subjects (Table 24), the 'group of Black subjects'(Table
41
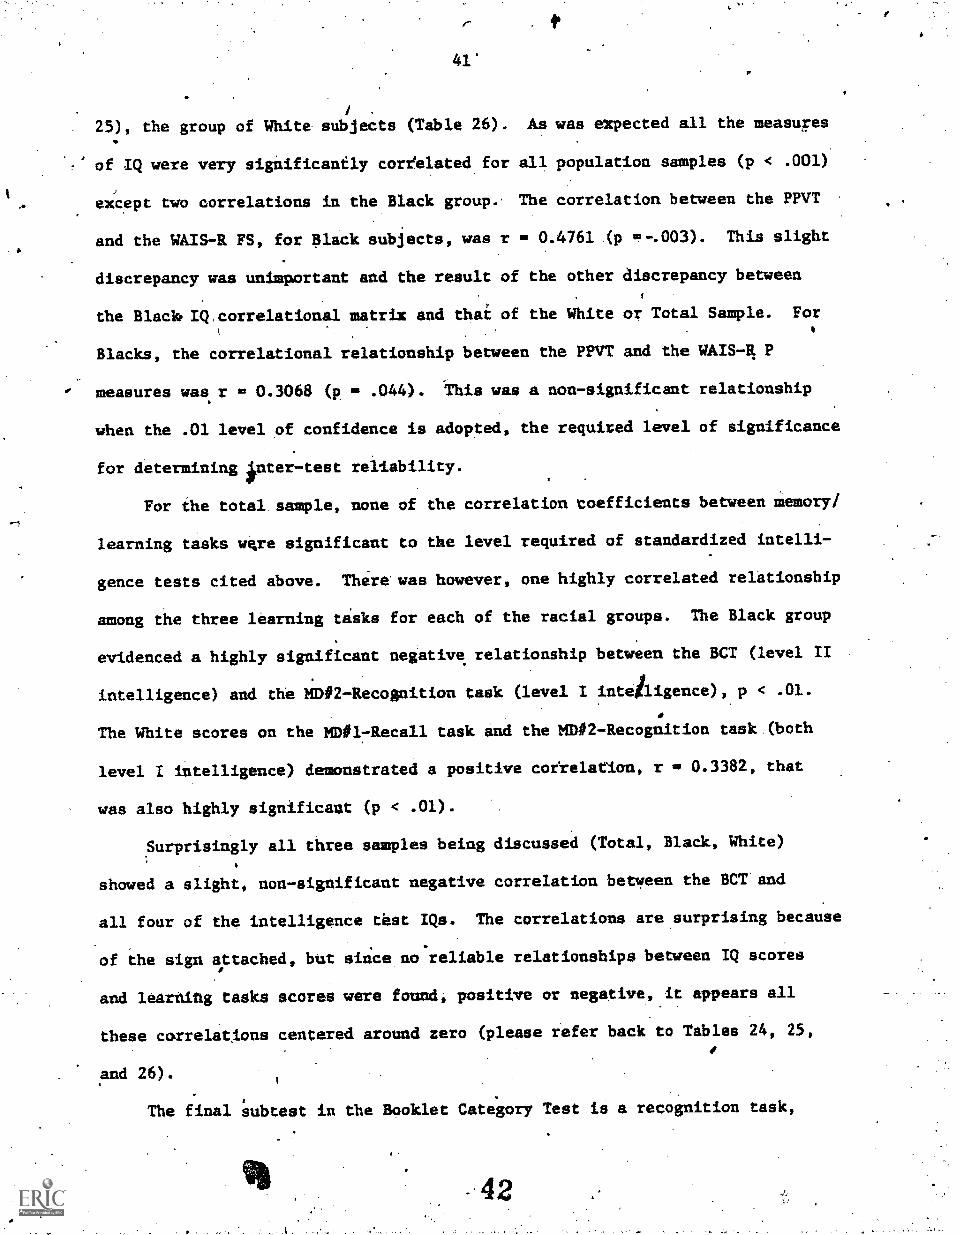
41'
/
25), the group of White subjects (Table 26). As was expected all the measures
of IQ were very significanily correlated for all population samples (p < .001)
except two correlations in the Black group. The correlation between the PPVT
and the WAIS-R FS, for Black subjects, was r - 0.4761.(p - .003). This slight
discrepancy was unimportant and the result of the other discrepancy between
the Black IQ.correlational matrix and thai of the White or Total Sample. For0
Blacks, the correlational relationship between the PPVT and the WAIS -4 P
measures was r = 0.3068 (p - .044). This was a non-significant relationship
when the .01 level of confidence is adopted, the requited level of significance
for determining inter-test reliability.
For the totalsample, none of the correlation coefficients between Memory/
learning tasks were significant to the level required of standardized intelli-
gence tests cited above. There' was however, one highly correlated relationship
among the three learning tasks for each of the racial groups. The Black group
evidenced a highly significant negative relationship between the BCT (level II
intelligence) and the MD#2-Recognition task (level I intelligence) p < .01.
The White scores on the MD #1- Recall task and the MD #2- Recognition task.(both
level I intelligence) demonstrated a positive correlation, r - 0.3382, that
was also highly significant (p < .01).
Surprisingly all three samples being discussed (Total, Black, White)
showed a slight, non-significant negative correlation between the BCT and
all four of the intelligence tast IQs. The correlations are surprising because
of the sign attached, but since no reliable relationships between IQ scores
and learning tasks scores were found, positive or negative, it appears all
these correlations centered around zero (please refer back to Tables 24, 25,I
and 26).
The final subtest in the Booklet Category Test is a recognition task,
42
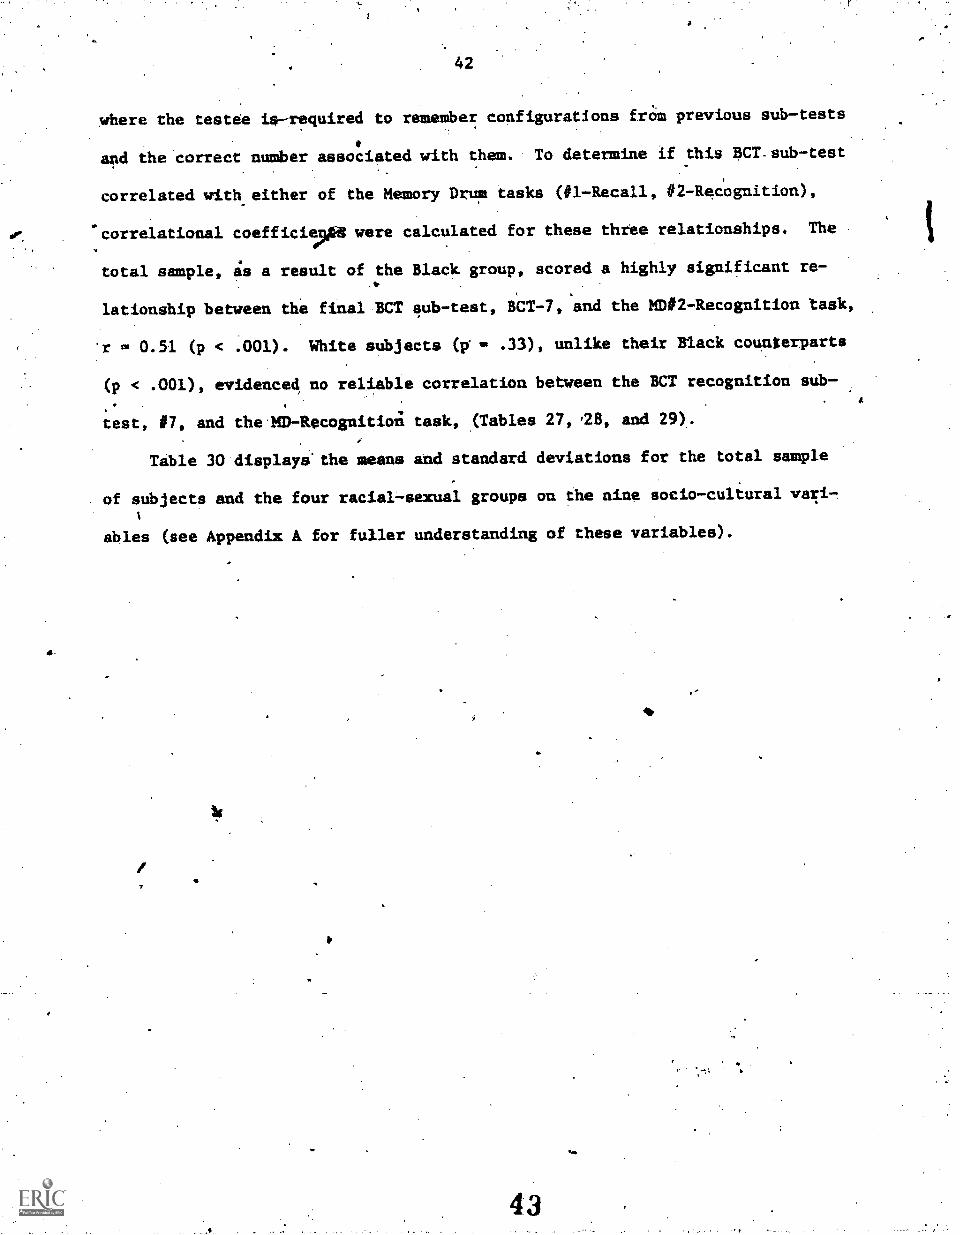
IV
42
where the testee is-required to remember configurations from previous sub-tests
and the correct number associated with them. To determine if this BCT.sub-test
correlated with either of the Memory Drum tasks (#1-Recall, #2-Recognition),
correlational coefficis90 were calculated for these three relationships. The
total sample, is a result of the Black group, scored a highly significant re-..
lationship between the final BCT sub -test, BCT-7, and the MD#2-Recognition task,
'r m 0.51 (p < .001). White subjects (p u. .33), unlike their Black counterparts
(p < .001), evidenced no reliable correlation between the BCT recognition sub-
test, #7, and the.MD-Recognitioi task, (Tables 27, ,28, and 29).
Table 30 displays'the means and standard deviations for the total sample
of subjects and the four racial-sexual groups on the nine socio-cultural
ables (see Appendix A for fuller understanding of these variables).
2!
43
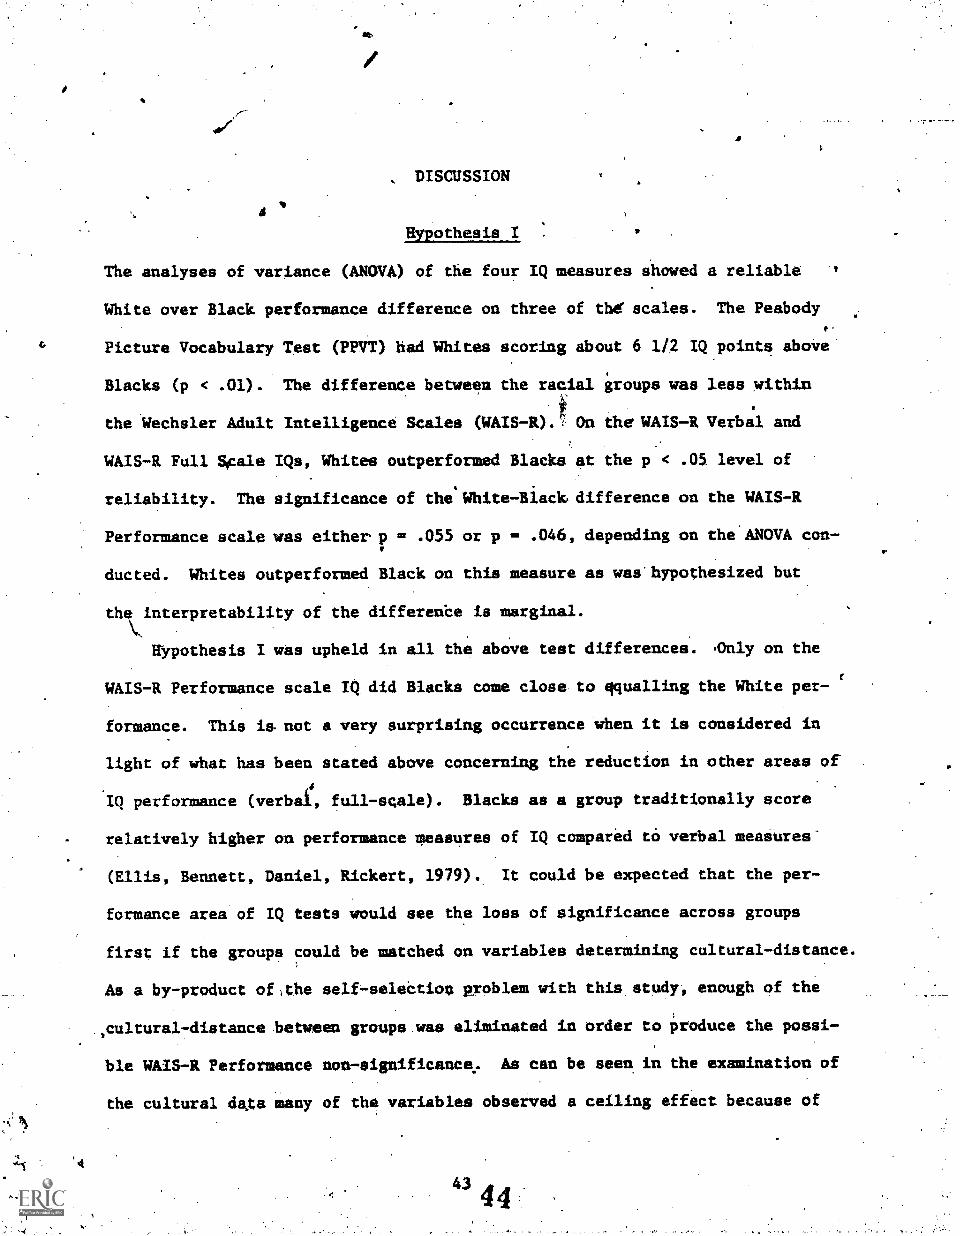
DISCUSSION
Hypothesis I
The analyses of variance (ANOVA) of the four IQ measures showed a reliable
White over Black performance difference on three of the scales. The Peabody
Picture Vocabulary Test (PPVT) had Whites scoring about 6 1/2 IQ points aboite
Blacks (p < .01). The difference between the racial groups was less within
the Wechsler Adult Intelligence Scales (WAIS -R). On the WAIS-R Verbal and
WAIS-R Full Sipale IQs, Whites outperformed Blacks at the p < .05 level of
reliability. The significance of the'White-Biack, difference on the WAIS-R
Performance scale was either p = .055 or p = .046, depending on the ANOVA con-.
ducted. Whites outperformed Black on this measure as was' hypothesized but
thinterpretability of the differenbe is marginal.
Hypothesis I was upheld in all the above test differences. -Only on the
WAIS-R Performance scale IQ. did Blacks come close to squalling the White per-
formance. This is. not a very surprising occurrence when it is considered in
light of what has been stated above concerning the reduction in other areas of
IQ performance (verbal, full-scale). Blacks as a group traditionally score
relatively higher on performance measures of IQ compared to verbal measures'
(Ellis, Bennett, Daniel, Rickert, 1979). It could be expected that the per-
formance area of IQ tests would see the loss of significance across groups
first if the groups could be matched on variables determining cultural-distance.
As a by-product ofithe self - selection problem with this study, enough of the
,cultural-distance between groups was eliminated in order to produce the possi-
ble WAIS-R Performance non- significance,. As can be seen in the examination of
the cultural data many of the variables observed a ceiling effect because of
444
d.
44
-this' confound-, substantiating the claim .of- a reduction-io-cnituTal-distanoeN
Hypothesis II 4,
Blacks and Whites scored equally well on the Booklet Category Test (BCT) and.."---
the Memory Drum #2-Recognitioil task (MD-RecOgniiion), according to separate .
three-way (race of subject by sex of subject by race of examiner) ANOVAs cal-
culatedculated for each ependent measure. Further, no higher order interactions were
discovered. In fac the effect of the race of examiner was lessened in these
etiks as compared to the IQ measures, being non - existent on the BCT (Level II
intelligence). This is an important finding because. examiner effect, especial-
ly racial/cultural examiner/examinee interactions (cited in the body of this
paper) can greatly affect the teat performance of subjects on standardized IQ
scales (also Level II intelligence 0).
It may be that tasks which actively involve' the Black subject in learning
non-cultural matlVal may do a great deal for reducing IQ differences between
the races which are examiner-caused. The fact that Blacks and Whites are able
to perform equally well with other-race male testers on ithese forms of asseSs-
ment should not be overlooked by those test manufacturers who truly wish to
develop' "culture free" tests, and still have them given on an individual basis.
Blacks did not outperform 'Whites on the Memory Drum #1-Recall task (MD-
Recall) at the .05 level of significance. Black superiority in the area of
memory recall is not uncommon (Jones, 1971;.Morse, 1914). Blacks and Whites
more often score equally on this particular task, however. Jensen (1980) calls
such tasks as the present MD #1 a measure of Level I mental ability.(associa-
tion). Re state.: I
Briefly, Level I involves rote learning and primary memory ability.requiring minimal transformation or manta nipulation of the in-
formational inputs prior to recall of the rial; Level II in-
volves transformation, mental manipulation, or reasoning. Level I
ierepitomized by the forward digit span test, Level II by the R.
45
"1"F"'t 776; t.,
t.; str,
45
factor.common to All tests of general intelligence . .
general, the ethnic groupe (White, Black, Ketixceu) differ fromone another, on the average, much less (or even, hardly at all)
in Level I ability than in Level II ability, on which thesegroups differ quite markedly, usually by about one standard
deviation or more (p. 42-4).
In line with the Black higher ranking on the MD-Recall task, Blacks as a
group outperformed Whites on thetMD-Recognition task, another Level I intelli-
genes indicator. The difference in the' latter measure was, as previously
stated, non-significant (p > .05), however. The two results tend to justify
the validity of one another and he fact, that for this particular sample of
adults, the Black group,was able to learn and recall or recognize three letter
non-sense syllables to a greater degree than the White group.
Just as intellectually superior Blacks would lessen the gap betweenlEhe
races normally seen between purely random samples of the two populations on
all 14 measures, but particularly on Black culturally relevant measures such
as the WAIS-R Performance scale, so too would it be expected that those tasks
on which random samples of Blacks and Whites are, equal, would favor the Black
growth when superior individuals are analyzed. This is so because of facts
given by Wats (1970), and elsewhere in the text, attesting to the fact that
Blacks score significantly lower than is their true test potential because
(1) most testers are White; (2) knowledge that the task is part of an IQ
test lowers the scoring; (3) presence'of culturally weighted material in the
sub-tests; and (4) culturally shaded means of communication between tester
and testae, etc.
In all; Hypothesis II was upheld, Blacks and Whites scored equally on
both Level I and Level II intellectual abilities when assessed by learning
tasks. The one Level I learning task where Blac reliably outperformed
Whites can be seen as anitrtifact on the self-selection ceiling affect. This
is not to dowq play the reality of Black over White performance on the MD-
46
46
Recall, for it' exists and is, equally as valid as the White over Black dif-,
Terence on the Peabody (PPVT) test of word knowledge. Both are racial re-
sponses to the pressures of their dominant cultures; Whites being print-
oriented (writing, reading -- two of the "big" 3-R's) while Blacks being de-
sceudants and inheritors of the oral tradition (storytellers, "name- garners ",16.4
spontaneous rhymers). It is pleasant to see that mastery of the dominant
American culture does not necessarily call for the abandonment of one's par-
ticular sub - culture.
Hypothesis III
Analyses of covariance (ANCOVAs)' were conducted on all seven dependent measures
using' the five most frequently included socio-cultural variables in regression
equations on"all dependent measures. When the ANCOVAs were run on the WAIS-R
Verbal, Performance, and Full Scale IQ scores, the significance of the White
above Black responding differences were non-significant. This change tends
to support the contentions that culture is at the room of the oft-observed
Black-White IQ per5ormance difference, at least on the WAIS-R.
Reanalysis of the Peabody Picture Vocabulary Test (PPVT) showed a change
in Black-White difference significance from the .01 level (p = .008) to the
.05 level (p = .040). Although, the White superiority on this scale was still
reliable (with 95Z co1fidence) it could no longer be accorded the weight of
the originaleNOVA-found difference (99% confidence).
No change was evidenced in the Memory Drum #1-Recall Task (MD-Recall)
when the five most heavily weighted cultural variables were factored out ofa
the analysis. It became .apparent that the White-written and Black-oral pro;
pensities were extremely strong. Unlike the broad Level II intellectual
abilities assessed by 71k WAIS-R IQ scales, the ?PVT and the MD-Recall task
were tapping a singular trait that could either be biological in" nature or the
47
47
result of a.particularly restricted set of sub-cultural factors (Jensen and
Inouye, 1980).
In order to test the second astumption, reanalyses of these two measures
were performed using their individually five most weighted socio- cu ]1tural
variables, as deterdined by their individual regression equations. ANCOVAs
thus constructed for the PPVT and MD-Recall were run. The White over Black
superiority on the PPVT was reduCe#, from a p-value of .008 (Table 5) to
p . .048 (Table 22). Father's presence (in year of childhood; 0 18 years)
and family income were added and parental attitudes about formal education and
parental supervision/intervention in the subjects' childhood life were dropped
from the equation. It would appear that Black children require the presence
of a fatherriathe, home in order to adequately gain the...White sub-culture
trait measured'by the Peabody. TwO reasons come to mind: (1) the ased
income a resident father brings to a home; specific PPVT- variable #2, and
(2) the. interface a father gives both sons and daughters with the dominant
society not usually furnished by a one-parent, female- headed household (dis-
cussed in the text).
With the substitution of two variables (number of siblings and parental
educational attainment) for dwelling condition of parental home and varied
social experience, a new analysis of .covariance was performed on the Memory
Drum #1-Recall Task (MD-Recall). Of all the variables in the new ANCOVA,
parental educational attainment and number of siblings were the first and
second most important for explained variation between the tworagLal-cultural
groups. The effect of parental educational attainment can be readily under-2
stood from the Cultural-Distance perspective. The more the parents have pro-
grassed through tkil 'supra- culture's formalized educational system, the more
they are likely todtilAze the supra-culture's wri;ten communication system
48
48.
and the less reliance need be placed in the oral tradition of inter-
generational contact. Children seeing this parental utilization of the nation-,
al nonmed information exchange (reading, record keeping) and being directly
exposed to it at an early age (being read "fairy tales" from books instead Of
having the "old folks tell impromptu ghost stories") would have this effect.
How increased sibling number influences increased Level I intelligence
is difficult to understand without the present hypothesis. From the cultural-
distance perspective, the increased family size of the Black family (in re-
lation to that'of the White family) has the following. effects which raises
the rote memory ability of its members; (1) larger families have less material
per child to go around, less books, paper, pencils, and all the-other material
possessions which one needs tb learn and practice the written/reading arts;
(2) members of larger groups must of necessity put more reliance in the oral
tradition for the holding and passing on of vital information; therefore (3)
sibling size would Correlate directly with proficient memory learning and (4)
correlate negatively with mechanical (i.e.-, reading) learning.10
When .all of the above is considered, a fairly strong case can be estab-
lished for the legitimacy of the Cultural-Distance perspective. In this regard,
Hypothesis III was upheld in all cases.
Post-hoc correlationalanklyses
The inter-correlation of the four IQ scales was fairly high, as was expected.
The WAIS-R Full Scale IQ correlated highest with the othex standatdized depen-
dent measures of IQ. This too was expected, since the WAIS-R FS taps into
more areas of intellectual functioning than any of the other three measures.
The fact that none of the memory/learning task scores were correlated in
the total genie is surpriling but is explained by the contradictory cor-.
felaiions among these three tasks the two sub-groups. Blacks evidenced
49
49
a highly significant negative correlation; (p < .01), between scores on the
Booklet Category Test (BCT) and the Memory Drum. #2- Recognition Task (MD-,
Recognition). The BCT is of course a Level II intelligence task while both
Memory Drum tasks measure Level I intelligence.
Whites on the tither hand, demonstrated high correlation between'the two
Level I intelligence tasks, Memory Drum #1-Recall (MD-Recall) and Memory Drum
#2-Recognition (MD-Recognition), (p. < .01). Thi correlation between these
two tasks cell be easily explained by the fact that they are'both Level I in-
telligence indicators. The seventh, sub-test in the BCT is also a recognitiona
task, yet in the White sample, scores on this sub-test did not correlate with
either the MD-Recall or the MD-Recognition task. Here the Black sample's
scores between the seventh BCT sub-test did correlate with that sample's
scores on the MD-ReCognition sub-test.,
Why these inconsistencies should appear are rather difficult to under-
A
stand at first glance. The Black and White groups must be utilizing dif-*
ferent learning strategies in performing these 7arious Level I and Level II.
tasks. The difference between Level I and Level II processing of information
would seem to be very different within Blacks.
Whites seem to use. two different strategies on the two different recog-
nition tasks (BCT-sub-test 7 and MD- Recognition), whereas the Black perfor-,
mance would point to a related strategy for both. Since the time between
learning and recognition was longer (up to 30 minutes) on the BCT-sub-test 7
than on the MD-Recognition index, Whites may have encoded the infOrmation on
the former in a different fashion than used on the latter. They may utilize.
their superior reading/writing/code usage-ability for such extended recall
work. Blacks ma,' be using the oral/rote memory procedure for both. Further
investigations into these differences should surely be planned.
its
CONCLUDING REHARKS(.
The implications of this study are several.. First,-and possibly the most im-
portant,,this. study has assembled in one project many df the known environ-
mental variables that affect IQ. -Since performance on the seven dependent
measures show no statistical difference when the socio-cultural factors are
covaried out, a step toward defining the environmental correlates of the
usually observed difference between Blacks and Whites has been taken.
study provides form and direction to the plea from many learning-psychol gist
that the environmental determinants of intelligence be substantiated illiams
and Johnston, 1981).
Crow. (1969) argues that studies concerning heritability that e conducted
on White populations and middle-class environments, can not be r event to other
cultural (and racial) minorities. He questions whether there i= very much ex-
ternal validity in ,such cases. By using both Black and White objects andI
statistically manipulating such an array of environmental va
hopes to have narrowed the cultural distance between our
iibles; this study
subject populations
(Black and White) while leaving the hereditary component n tact.
This study is also important because it examined B ack-White differences.
on Level I and Level II intellectual abilities and fo d no significant dif-
ferences between groups at either level. The Bookl Category. Test must cer-
tainly represent a Level II task and the result o the unadjusted'analysis of
Black and Whitegroups produced an insignificant difference for race. This
result only lends credence to the claim that g neral- G, as measured by na-
tional-normed IQ tests are indeed biased in ±avor of the major-culture group.
The fact that Blacks performed at a s erior level to Whites on the Memory
51
e
e_
51
Drum #1-Recall test, but that these results were also affected by holding con-
stant the cultural variables, in the same fashion that the addition of the
Icultural variables into ANCOVA's reduced the White over Black performance on
IQ'measures is also important./ The Cultural-Distance approach assumed and
predicted that standardized IQ sts would be culturally biased and therfore
%. means of group responding could be easily affected through the manipulation
;,, - _of factors representing ethnicity. It w's also previously stated that the
three learning task measures (MD #1, MD #2, and BCT) were not. heavily laden
with culturally significant meter al (by design). Therefore it.seems obvious
why task spedific factoring was r quired to eliminate the reliable group dif-
ference of central tendency fh the MD- Recall index. Because of the limited
scope of the PPVT, a like spec ficity' in cultural factoring was required in
order to diminish the White uperiority on this measure.
Taken together the r7ulti of the two learning/performance tests clearlytr;
show that this sample of Black aid White adults have relatively equal ability
on both Level I mid, /Level II tasks. NStandardized IQ tests, also measures of
Level II ability, are however not true reflections of minority group perfor-
mance because of the cultural overtones of the question involved.
For example, Wrobel and Howells (1982), in a study to determine the
accuracy with which clinicians and students are able to detect rectal bias
in questions on the WAIS -R, found the following five items biased in favor
of Whites in the,Information sub-test:
1-12: Who wrote Hamlet?1-13: Who was the president during the Civil War?1-14: Who was Amelia Earhart?1-15: Why are dark colored clothes warmer than light colored clothes?1-21: How does yeast cause'dough to rise?
Only one Information pub-test question was biased in favor of Blacks.
1-17: Who was Martin Luther King?.

52
All six of the above questions would seem to have the same relevance, or
irrelevance, for intelligent functioning of adults in day-to-day Allican life.
None seem to be more importint.to the survival value of the average assembly
line worker or university professor, Black or White, than any of the others.
Why then Should not the kqowledge inventoriedby national tests reflect an
1:
equal balance of White a Black biased knowledge?
There is no doubt't t the quest for better tests have begun already.
The call.put forth by Hardy et al. (1976) "that more precise tests be developed"
is beginning to be heard. And times change, and the zeitgeist changes, its
well as the social reality of human behavior, and it is evident that scientistsfl
studying human behavior conduct. their experiments in the context and limits of
their time aid record the results in like manner.
It is hoped that,this study will give increased inpetits to the formulation
of "culture-free" tests of intelligence. Possibly "cultural leveling" scales
may be designed and incorporated into future tests. These scales could be
Used for factoring out the influence of culture of nationally nonmed tests,
thus making their interpretation fairer and more accurate for all persons.
pakeIntelligence can many forms and it is time psychologists and edu-
cators realized tha this complex subject, intelligence, cannot, simply be
given a number on a unitary scale. It is so much more. It is as much culture
as electro-chemipl brain synapses, as much ethnicity as categorical knowledge,
as much a consequence of role defined behavior as it is a result of opportunity.
Spindle (1975) argues that cultures have to be understood from within,
on their own terms and by their awn standards. This study bopes to forward
that cause and to add it's bit of information to the flow of science. It
hopes to provide the discipline, psychology, with a different perspective on
an old problem. It also hopes to encourage other Black voices to lend their
I
53
MO
S3
distinctive and different perspective to the search for truth. It hates to
encourage Brown and Yellow voices to speak out, describing reality from those1
perspectives too.
What propels one culture or sub-culture may not be the force propelling
another culture or sub-culture. We may share certain intellectual propen-
sities because we are all members of a super-culture but we surely have unique
attributes in the cognitive sphere because of -our.membership in different sub-
cultures. It is hoped.that this study will cause others to investigate the
cultural determinants of group scores on IQ tests. More controlled studies
are of course required. Experimental designs conducted in school systems with
younger subjects is one clear Area for further research.
With the beginning made herein and the sound theoretical base provided by
the Cultural-Distance Approach, the'goal of producing culture-free tests and
trutheully analysing pretient measures of .IQ based on now-present "standard-,
ized tests" is within range.
a
azrzBENczs
Abransce T. The influence of examiner, race on first -grade-and kindergarden subjects* peabody picture vocabularyscores. Journal 21 Educational mummunit, 1969, 1(4),241-246.
Adam, B.D..Inferiorization and "self-esteem.on SocialPsvcholoav, 1978, 41(1), 47-53.
Arinoldo C.G. Black-white differences in the general,rognitive index of the BcCarthy scales and in the full
I
scale, IQs of the Vechsleils scales. 12g11al 2g ClinicalPsycholoav, July 1981, ;gm, 630-638.
Begley, S., Dallas, B., and Carey, J. A biological basis forIQ. Newsweek, 18 October T982, pp. 112.
Beliaev, D.K. Contemporary science and problems of the humanindividual. 211 Sollpt Review, 1982, 21(1), 84-108.
Bernal, E.N., Jr. A response to "educational uses of testswith disadvantaged subjects." Imam Psychologist,1975,-n, 93-95.
Berry, B.F. SATriddle: iLless both good news and bad newsin the test results. Roanoke Wag fisVor14 1112g, Sunday31 October 1982, pp. F-3.
Blakely, N. Take the loadpressures of the blackKent (Eds.),.2kg 'BlackBlack Position, 1976.
off, baby (psychoculturalschool child). In G. Brooks and G.?osition (no. 4) . Chicago: The
Bopegamage, A. Status seekers in India- A sociological studyof the neo-Buddhist sovement. Arching Aggpluggg AgSocioloctiqo 1979, 22(1), 19-39.
Bronfeuhrenner, 0. Intelligence in Black and White.(-Review of Dim by A.R. Jensen) .III Isuk Tiumf, April 1980.
Carey, J. and Ring, 'P. The rebirth of ps 61. Newsweek, 4October 1982, pp. 65.
54 55
55
Carter, D.E. and Walsh, J.A. Father absence and the blackchild: a multivariate analysis. 421Kail 21 NegroE&ucatiop, 1980, 12 (2), 134-143.
Cole, N. S. Bias in selection. Journal gf Es cpAioaalqqasurement7 1973, a, 237-255.
Conwill, W. The inheritance of IQ and scholasticachievement: further coiments'on the Jensen articleJournal 21 Negro /dgcatt9g, 1980, 12 (1), 97-104.
Crov, J. Genetic theories and influences: coements on thevalue of diversity. Bavay4 Educational, Igyill, 1969, 12,301-309.,
Darlington, R.B. knother look at "caltupal fairness,"Journa1 21 Educational Reasnrgment, 1971, A, 71-82.
Das, J.P. Cyril Wirt:, the inaccurate scientist. IndianJcurnal, , 1977, 22 (2), 103-107.
Denies, J.C., Plomin, R., Vandenberg, S.G. and Kuse, A.R.Parent-of fspriag re = ablance for cognitive abilities inColorado adoption p lect: biological, adoptive, andcontrol parents and e year old children. pstelligence,1981, 5, 245-277.
Deutsch, R. Rinority group and class status as relatedsocial and personality factors in scholastic achievement.RonoagapIN 21 /2s42422' mi Applied, 4nthrop4oav 1960,2, 1-32.
Ellis, Bennett, Daniel, Rickert. Psvchologv.21 learntnq AAAaenorv. New York: Brooks Cole, 1979.
Ferguson, G.1. Atat4stical analysis in psychology AAAeducation, (Ith sa.) New York: ScGraw-Rill 1981.
Fu, V.R. Korslund Hinkle, D.E. Ethnic'self -conceptduring aiddle childhood. 2111 J9arnal a 2svcio3togYs1980, In, 99-105.
Gargano K.J. Social psychology as history. Journal 21Personality, and agslaLl inaliglagm, 1972, 21 (2), 309-320.
Giebink, J. and Goodsell, L. Reading ability andassociative learning fora children with'a visionotor
-deficit. American Educatiomai, leggaggt angual, 1968, 54412-419.
56
Ikl ay/4004 school: Ihl Un4veplitv of WAR AI Austin,1981-1983.. Austin, Texas, The University of TexasPublication, 1981.
Greenberg, J.H. and Davidson, 8.8. Bone background andschool achievement of Black urban ghetto children.American Journal 4rthq-Paychiatrv, 1972, Az (5), 803-810.
Guardo, C.J. Socionetric status and self-concept in sixthgraders. 2h1 Journal 21 TheoleticAl Diolggi, 1969, §2,320-322.
Eaninon, W.D. The genetical evolution of social behavior(X). 312 1.210/1 stf 749oretical iiioX2sx. 1964, 20 1-25.
!tardy, Welcher, Ded1400 Bellits E.D., and Kagan, J.Pitfalls in the measurenent of intelligence: arestandard intelligence test valid instruments formeasuring the intellectual potential of urbab children?212 Journal ,off Penrcholocry, 1976, 21, 43-51.
Hays, J.R. and Saith, A.L Cpoaparison of WISC-R andculture fair intelligence test scores for three ethnicgroups of juvenile delinquents. Eughologigll Reports,1980, 46, 931-934.
110
Herzog, E., Newcomb, C., and Cisin, I.8. But some are morepoor than others: SW differences in a preschoolprogram. AmcKlicoq 12mal 2g DxlhamialiAlgiff 1972,12(1) 4-22.
Hood, E.P. The belt education for everyone. gc4iganchroutcal, Saturday. 18 September 1982, pp. 4.
Suaphrey L.D. Theory of intelligence. In R. Cranco (Ed)Gegetic gag milimigatal Influences, Rev
York Grune & Stratton, 1971.
Hunter, R. and Schmidt, E.L. Critical analysis of theat tical and ethnical implications of variousdelis ions of 12A1 bias. Psycholoui211 Bulletin, 1976,
(6), 1053-1071.
IT.: find no racial differences. ggrld. 19 December 1972,pp... 61.
Jackson, G.D. On the report of the ad hoc committee oneducational uses of tests with disadvantaged students(another psychological view from the association of blackpsychologists). America rt Egmk2122/4.1, 1975, 12, 88-93.
a
5'7
Jantz, R.K. and Sciara, F.J. Father absence and itsapparent effect on. the reading achievement of blackchildren from low income families. agsgna.k ag NegroAducation, 1974, 43, 221-227.
Jensen, A.R. An examination of cultural bias in thewonderlic personnel test. In%elligerm, 1977, 1, 51-64.
Jensen, A.R. Level I and Level II abilities in three ethnicgroups. Laerican Aducational Res'Arck Joirnal, 1973, 10,263-276.
Jensen, A.R. How much can we boost IQ and scholasticachievement? linv4c4 ZducatioAA1 RevAll 1969, 12, 1-123.
Jensen, A.R. How much can we boost IQ and scholasticachievement? Atlantic, tionthlv, 1971, (September), 43-64.
Jensen, A.R. Test bias and construct validity. phi DeltaImaa, 1976, lib 340-346.
Jensen, A.R. and Inouye, A.R. Level I and Level IIabilities in asian, white, and black children.Xnt'llitienee, 1980, 10.41-49.
Jones, R.S. The sociology of knowledge"; proving Blacksinferior, 1870-1930. Blact World, February 1971, pp.4-19.
Katz, I. , Jensen, i.R., Deutsch, R. (Eds.) Social, class,g AAA psvcholoaicai, ftgvelqement. New York, Holt,Rinehart & Winston, 1968..
Eatz, I., Henchy, T., and Allen, H. Effects of race tester,* approval-disapproval, and need oa Negro children's
learning. Journal gf Persgna44ty ARA PsvOoloov,1968, 8(1), 3842.
Kaufman, and &Wigan N.. L. Black-White differences at2 1/2-8 1/2 on the McCarthy Scales of Children'sAbilities. Journal, 21 Scho0,40svgholgaz, 1973, 11,196-206.
Kline, P. Psvcholletrics gsvcholism. London: AcademicPress, 1979.'
Knapp, P.A. and Seagrin, G.N. Visual memory in AustralianAboriginal children, and children of Edropean descent.International iguAA1 IfInusjaagma, 1981, 11, 213-231.
58
Lambert, N. Paired-associate learning, social status, andtests of logical concrete behavior as anivariate andaultivariate predictors of first-grade readingaggevesent. 1gagigA2 Sducationgl Besearck Journal,11401g 7, 511 -528.
Levidow, L.A. A marxist critique of IQ debate. dical1.22121c1 122KRAL, 1970. 112. .14-21-
Lieblich L., and lugelmass, S. Patterns of intellectualability of Arab school chit pen in Israel. Xntelligence,
'1,981, 2, 311-320.
Lieblich, Amp Kugelmass S., and Ehrlich, C. Patterns ofintellectual ability in Jewish and arab children inisrael. II urban matched samples.. aoltrual; 91 Cross:-Cultural Psvchnloo-tp 1975,A, 218-226.
Lindsay, B. .Educational testing in Kenya. Journal, 2Z IggE2Bducations, 1980, 12 a), 274 -288..
Lynn, D.B. 'ha father: k/a role la gkilg slevelooment.Monterey, California: Brooks Cole Publishing Co., 1974.
Nobs, R. IQ: new research shows that the Japaneseoutperform all others in intelligence tests. Are theyreally smarter? Discover, September, 1982, pp. 18-24.
Morse, J. Comparison of white and colored children measuredby the binet scale of 'intelligence. Popular ,scienceMonthlT, 1914, 2, 384-389.
mcClellan4 D.C. Testing for competence rather than forImerica; Psxcholouist, 1973, 211,
mcGrath, B. with Banta, N. Big business becomes bigbrother. Time, 1 November 1982, pp. 68.
McShane, D.A. A review of scores of American Indianchildren on the Wechsler intelligence scales. White;2,0114 Journ41, 1980, 1(4). 3 -10..
McShane, D.A., and Plias, J.E1. Wechsler scale performancepatterns of American Indian children. fsvchology, IA ,tom50o i8, 1982, 12, 8-17.
0
New IQ to designed to avoid cultural bias. 12AROAS =SAworld; no; August 25, 1982, p. 1-9. A
59
011endick, T.H., Finch, A. J, Jr., Ginn, F.V. Comparison ofPeabody, leiter, RISC, and academic achievement scoresamong emotionally distrubed children. J0'4;44121Mumma huslalgay, 1974 (1), 47-51.
011endick, D.G. Murphy, H. J4 011endick T.H. Peabodyindividual achievement test: concurrent validity withjuviaile delinguents#141110910(licAl 1222E I.16 1975, 31,935-938.
Olneck, H.R. and Bills, D.H. Family configuration andachievement; effects of birth order and famfly size in asample of brothers. Social ilvc1121.2g/ POkrerlv, 1979,11, 135-148.
orvine, R. andparents andociometri,
Gerard, ilL.B. Social.contact of minoritychildre Is acceptance by classmates.1975,' (4), 518 -524..m ,
Pettigrew, T.?... Placing Adam's argument inperspective: comment on the Adam paper.1111/111.2122.1. 1978, 11 (1), 58 -61..
Piers, R.V. and Harris, D.B. Age and other correlates ofself-concept in children. JoUJIA1 .21 AducationtaPsYcholoov; 1964,, Al, 91-95.
Pryzwansky, W.B., Nicholson, C.L. and Uhl, N.F. Theinfluence of examiner race on the cognitive functioningof urban and rural children of different races. 422KMAI21 Sch0411 kair121221. 1974, 12 (1). 2-7.
a broader§ocial
The racial gap in SAT scores. 18 October 1982,pp. 110.
Reynolds; C.R. Differential construct validity of apreschool battery for Blacks, Whites, spies, and feUales.Journal g gcb9o1 fsvcholoov, 1"980, 11(2) , 112-125.
Reynolds, C.R. An examtnation for bias in a preschool testbattery across race nd sex. Journal Ed4c44kiop41Measurement" 1980, Z7, 137-146.
Reynolds, C.R. and Gutkin multivariate comparisonof the intellectual performance of Black and Whitechildren matched on four demographic variables. PergonIndividual Di/oest, 198*, 2, 175 -180..
60
60
Reynolds, C.R. and Nigl, A.J. I regression analysis ofdifferential validity in intellectual assessment forBlack and White inner city children. J2urna.k 21 ClinicalChi14 Pscholoa, 1981, IQ. 176-179.
Robinson, J.A. Black-White job skills controversy.tricktaan Chronicle, Saturday 4 September, 1982, pp. 7(section 8).
0Saigh, P.A. The influence of religious symbols on the digit .
span performance of roman catholic elementary schoolstudgjOAI., ;mama' 21 Clinical /Auk2422/. 1981, 12,851-7855.
Sattler, J.R. Statistical reanalysis of Canady's theeffect of °rapport on the IQ: a new approach to theproblem of racial psychology." .2422A2121ical Report*,1966, 12, 1203-1206.
Scarr, S. IQ test performance of black children adopted bywhite families. American ?snip:42.4n, 1976, fl (10),726-739.
Sewell, T.E. Intelligence and learning tasks as predictorsof scholastic achievement in Black and White first-gradechildren. ;o4rnal al Schoql Psvchologv 1179, 12,325-332.
Silverstein, A. B. A corrected foriula for assessing thevalidity of WAIS, 'RISC, and WIWI short forms. .49grnni,'21 C1inic41 psvcholocix, 1971, 22, 212-213.
Simmons, R.G., Blacks and high self-esteem: a puzzle.Social Psvcholouv, 1978, Al (1), 54-57.
Sowell, T. New light on black IQ. The New Ig;k ZingsWazinge, 27 'arch 19774; pp. 10.
Spindler, L.G. In T.R. Williams (Ed.) Vachavical,Antropolooy. The Hague: Mouton, 1975.
Taylor, B.F. IQ heritability: a checklist ofmethodological fallacies. The Jourgal gtro-AmericanXesues, 1976, 1(1), 35-49,
61
4
;d-
61
Taylor, B.C. and Walsh, E. J. of Black selfesteem: some empirical tests. 5 gill PsyckologvQuarterly, 1979, a (3), 242-253.
. Terrell, F. Terrell, S.L., and Taylor,.J. Effects of raceof examiner and type of reinforcement on the intelligence ,
test performance of lower-class Black children. ,
Ppgclitolcap 1,3 1112 School!, 1980, us 270-272. 4
Mut scam ADA laiiii llama: 1.13222AGI to 04raeg j tAlNildqgitia/rn reoo 22 la. Princeton, New Jersey:Educational Testing Service, 1980.
.r,Turnee C. Effects of race of tester and need for approval
on childrengs learninsW, Joognal 2Z Vocational. Psycholoov, 1971, ju (3), 240-244.
Watson, P. Society at work: how race affects IQ. NevSociety, 16. July 1970, 116, 102-105.
Weiss, G. The tragedy of ethnocide: a reply to Hippler.American. Antromolvaist, 1981, 12 (4) , 899-900.
,
Williams, D.A., Foote, D., Ellis, W., King, P., andBurgower, B. Go to the head, of the class. fillwsweek, 4October 1982, pp. 64-65.
Williams, H.L. and Johnson, B.C. Progress in developingafrocentric measuring instruments. jouLtal, g Non-WhitqConcerns, 1981, 11'(1), 3-18.
Wrobel, T.A. and Howells, H.R. Sex and race bias in theV R: i content and empirical analysis. Paper
:::iiesented at-the meeting of the Midwestern Psychological
cation, Hinneapolis, Binnesota, 1982.
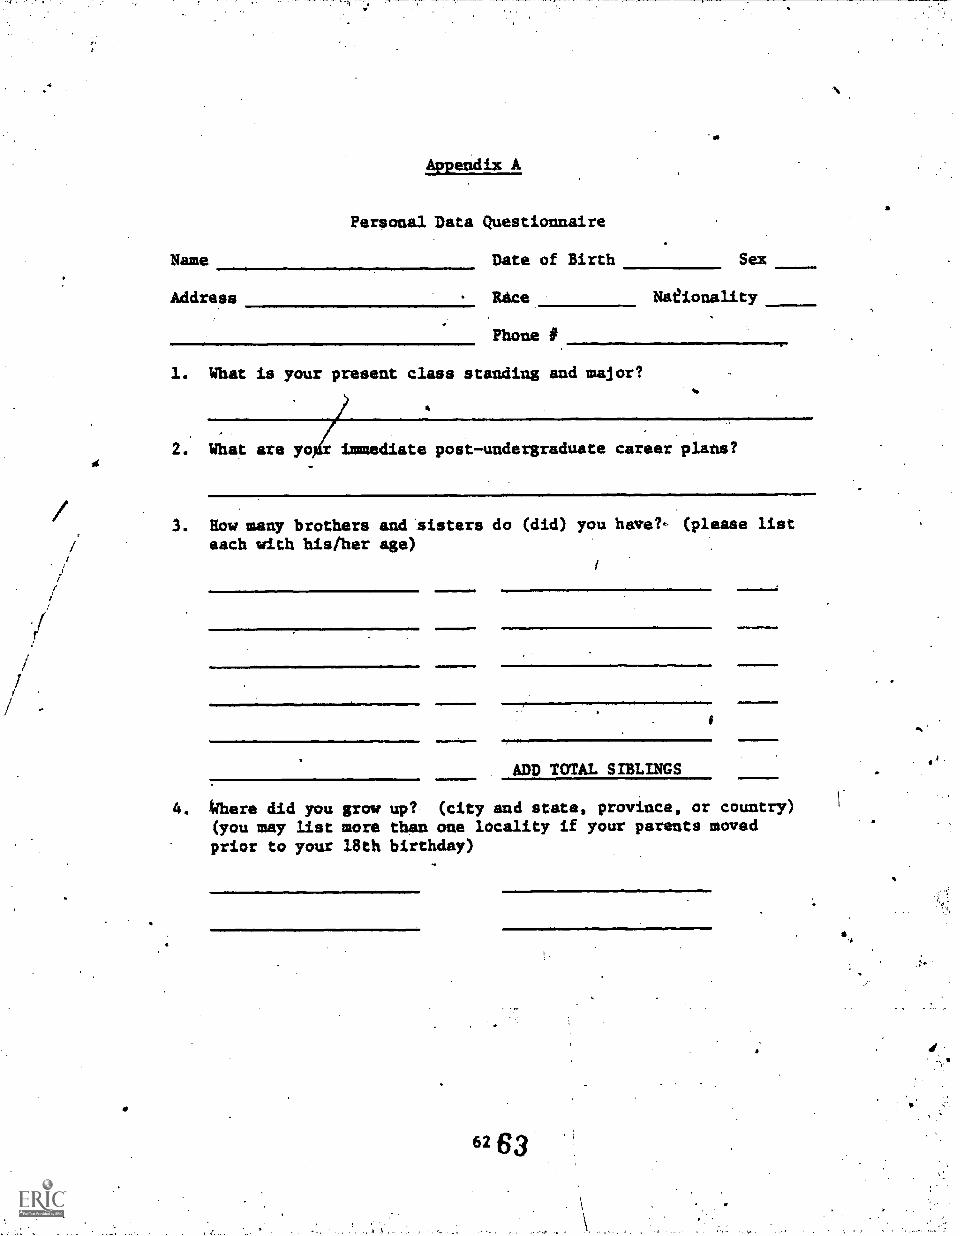
Name
Address
Appendix A
Personal Data Questionnaire
Date of Birth
Race
Sex
Nationality
Phone #.
1. That is your present class standing and major?
2. What are yo immediate post-undergraduate career plans?
3. How many brothers and sisters do (did) you have?- (please listeach with his/her age)
10111111111,MIMMMIIP
ADD TOTAL SIBLINGS
vidffalmmI1.011.00
ImIxerIIIImM .1.14. Where did you grow up? (city and state, province, or country)
(you may list more than one locality if your parents movedprior to your 18th birthday)
62 63
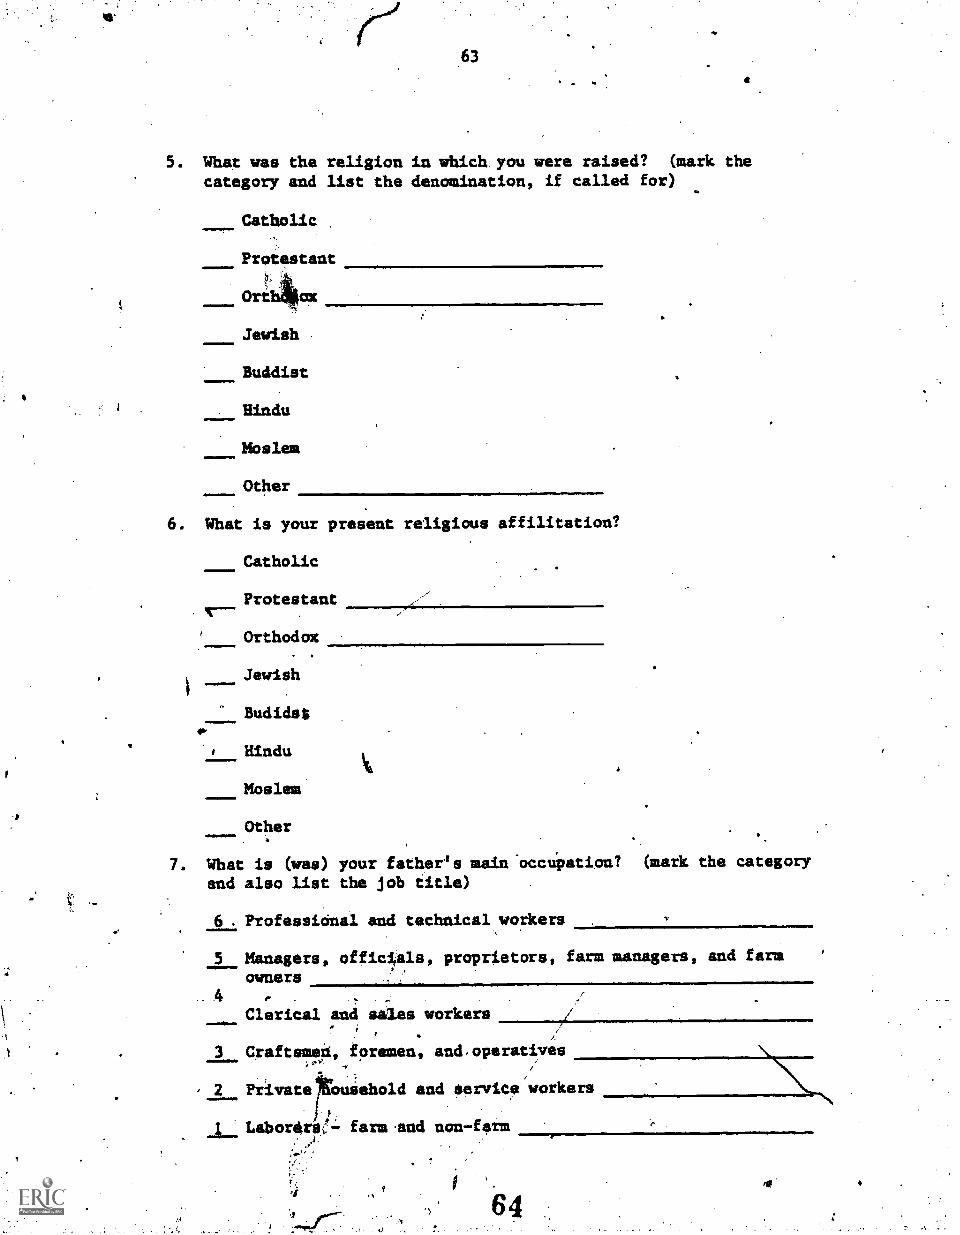
ler
63
5. What was the religion in which you were raised? (mark the
category and list the denomination, if called for)
Catholic
Protestant
Orb oxj4
Jewish
Buddist
Hindu
Moslem
Other
6. What is your present religious affilitation?
Catholic
Protestant
Orthodox
Jewish
Budidss
Hindu
Moslem
Other
14
7. What is (was) your father's main 'occupation? (mark the category
and also list the job title)
it
6 . Professional and technical workers
5 Managers, officials, proprietors, farm managers, and farmowners
4 ,
Clerical and sales workers;
3 Craftsmen, foremen, and operatives
, 2 Private ouiehold and Service workers
j_ Lab orèrs- farmAnd non-farm
:44"
1
64
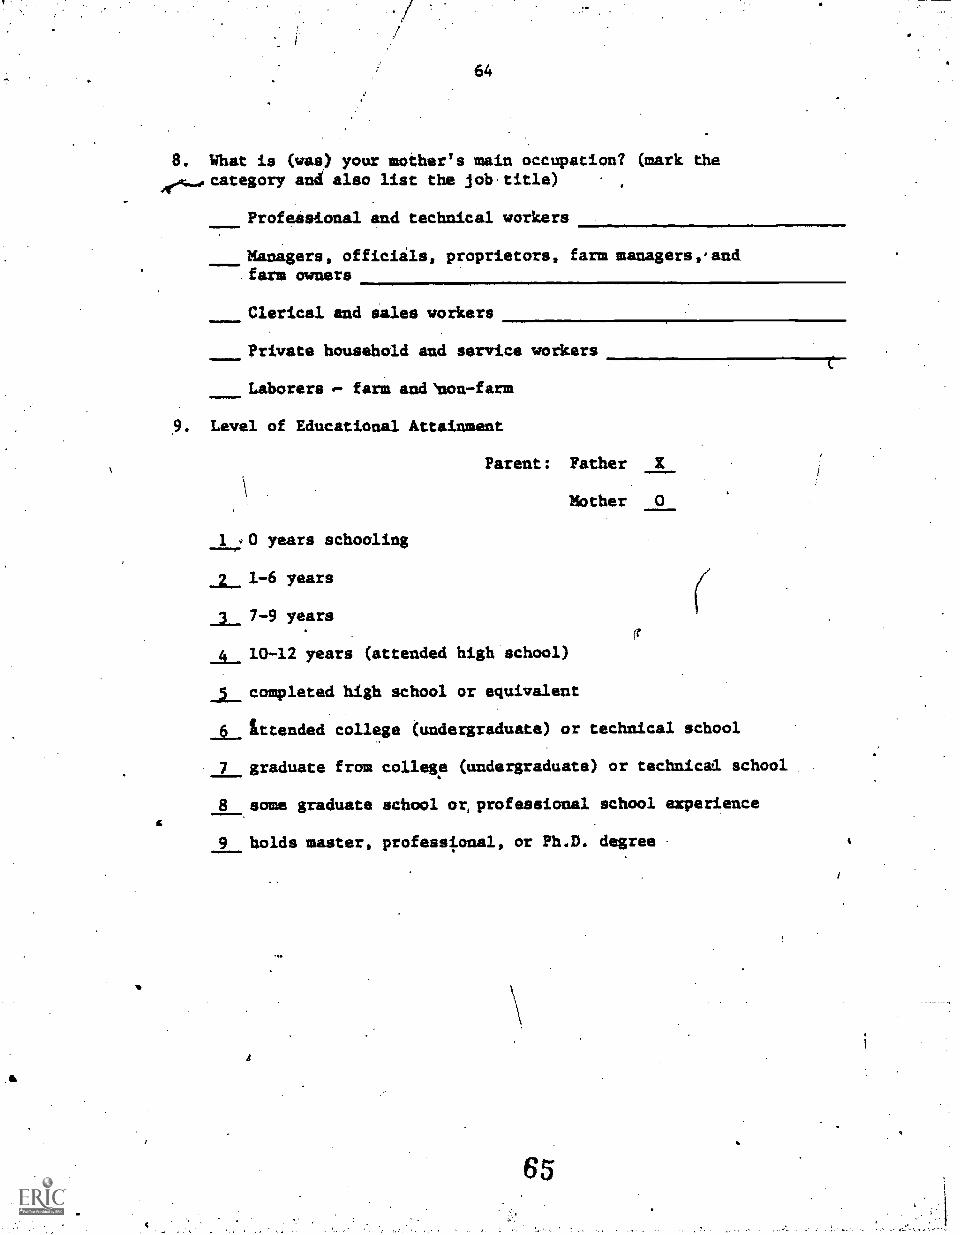
64
8. What is (was) your mother's main occupation? (mark the4..or._,category and also list the jobtitle)
Profeastonal and technical workers
.1111011111111111
Managers, officials, proprietors, farm managers,andfarm owners
Clerical and sales workers
?rivets household and service workers
Laborers 4- farm and 'non-farm
Level of Educational Attainment
Parent: Father X
Mother 0
1 0 years schooling
1-6 years
7-9 years
10-12 years (attended high school)
completed high school or equivalent
ittended college (undergraduate) or technical school
7 graduate from college (undergraduate) or technical school
8 some graduate school or, professional school experience
C
9 holds master, professional, or Ph.D. degree
65
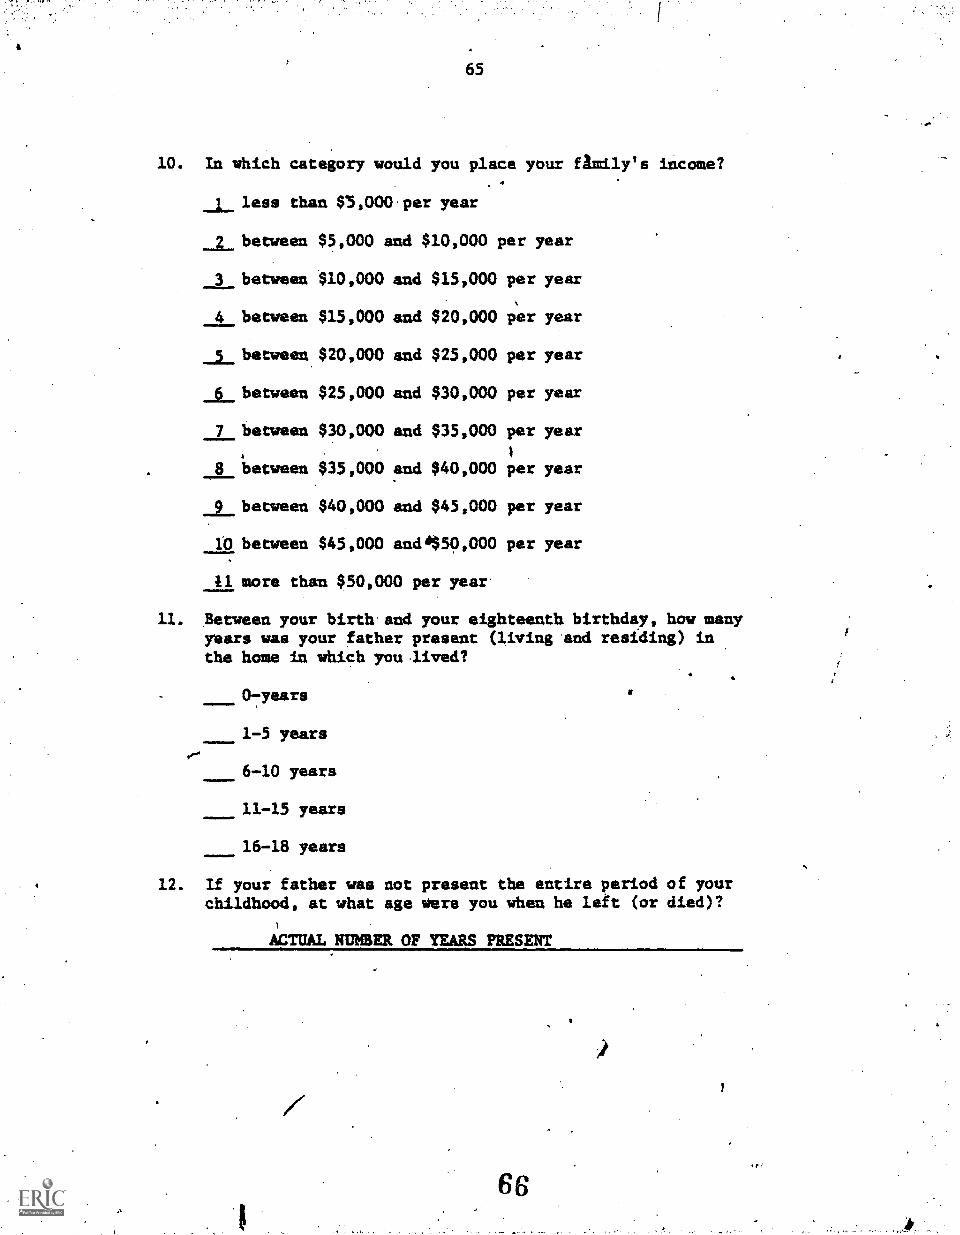
65
10. In which category would you place your family's income?
_l_ less than $5,000.per year
between $5,000 and $10,000 per year
3 between $10,000 and $15,000 per year
4 between $15,000 and $20,000 per year
_5_,between$20,000 and $25,000 per year
between $25,000 and $30,000 per year
7 between $30,000 and $35,000 per year
I
8 between $35,000 and $40,000 per year
_L between $40,000 and $45,000 per year
tO between $45,000 and 4$50,000 per year
11 more than $50,000 per year
11. Between your birth and your eighteenth birthday, how manyyears was your father present (living and residing) inthe home in which you lived?
0-years
1-5 years
6-10 years
11-15 years
16-18 years
12. If your father was not present the entire period of yourchildhood, at what age were you when he left (or died)?
1
ACTUAL NUMBER OF YEARS PRESENT
66
I
I
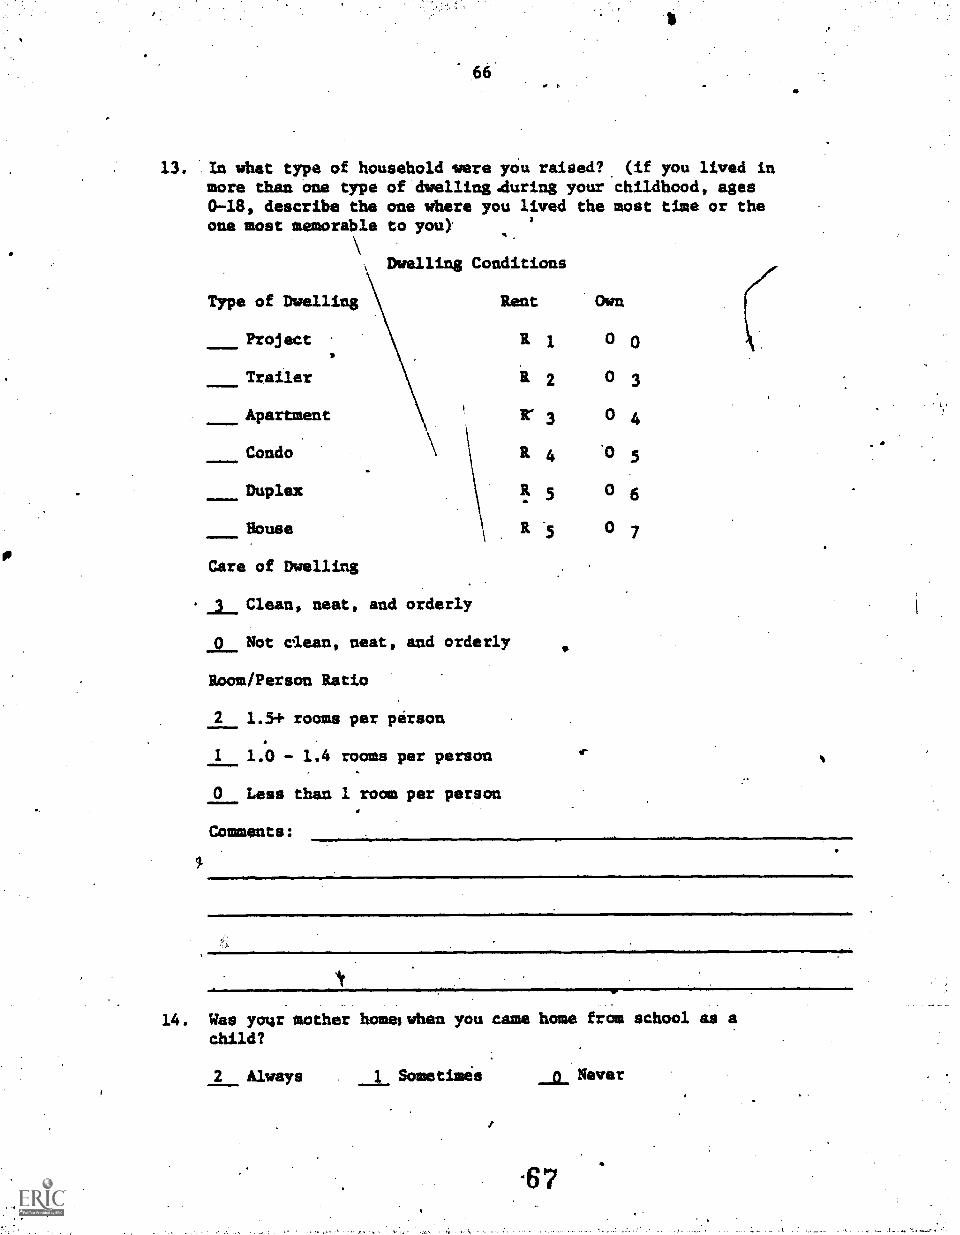
66
13. In what type of household were ',du raised?more than one type of dwelling .during your0-18, describe the one where you lived theone most memorable to yota
Dwelling Conditions
Type of Dwelling
Project
Trailer
Apartment
Condo
Duplex
House
Care of Dwelling
Clean, neat, and orderly
Not clean, neat,
Room/Person Ratio
Rent
(if you lived inchildhood, agesmost time or the
R 0 0
R 2 0 3
R.- 3 0 4
R 4 .0 5
R 5 0 6
'5 0 7
and orderly
2 1.5+ rooms per person
I 1.0 - 1.4 rooms per person
0 Less than 1 room per person
Comments:
14. Was your mother homes when you came home from school as a
child?
2 Always __1_ Sometimes Never
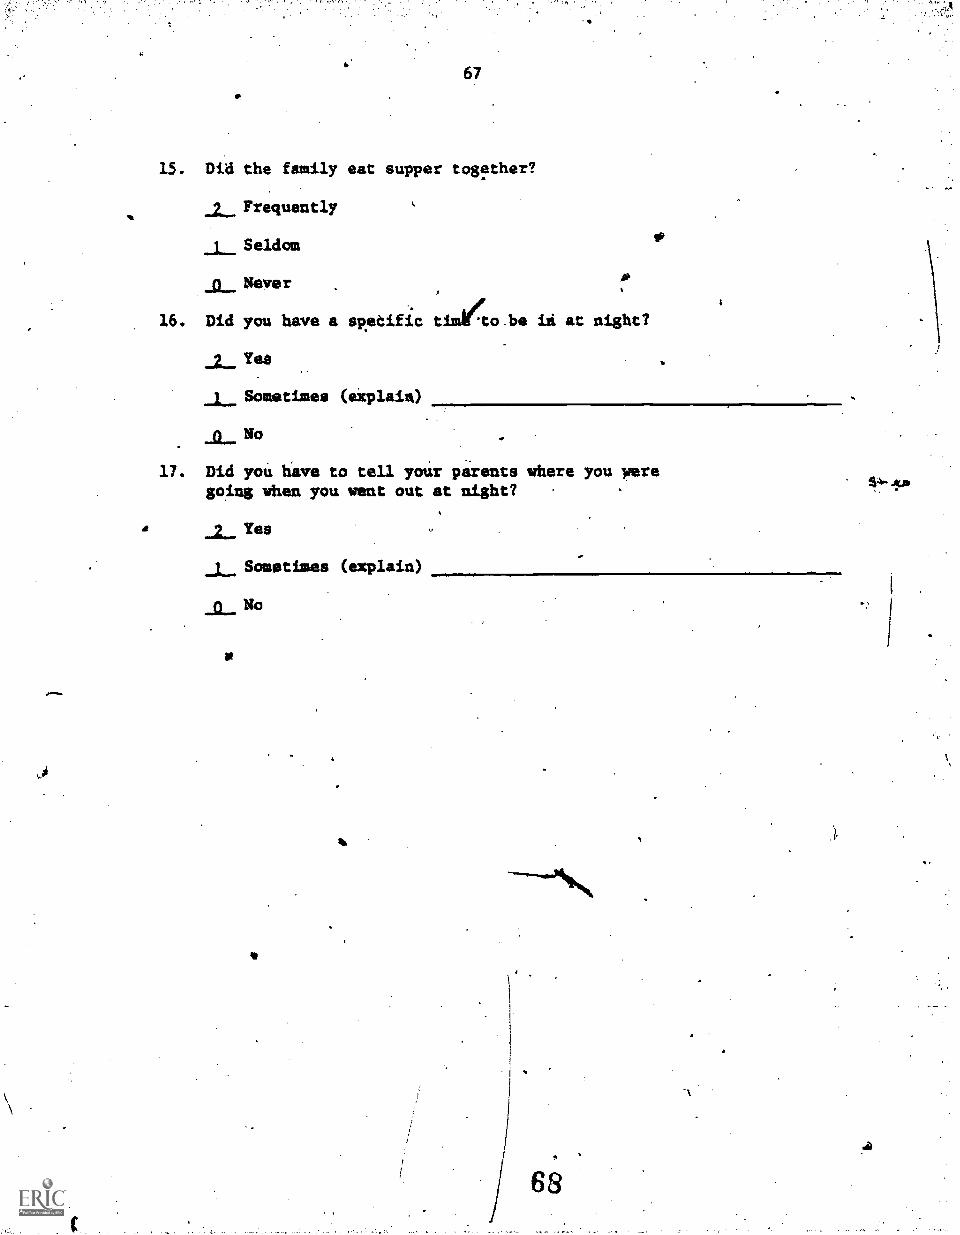
67
15. Did the family eat supper together?
a_. Frequently
Seldom
Never
16. Did you have a specific timi4o.be in at night?
Yes
Sometimes (exploit%)
No
17. Did you hive to tell your parents where you yeregoing when you went out at night?
-2- Yea
1 Sometimes (explain)
N°
e
68
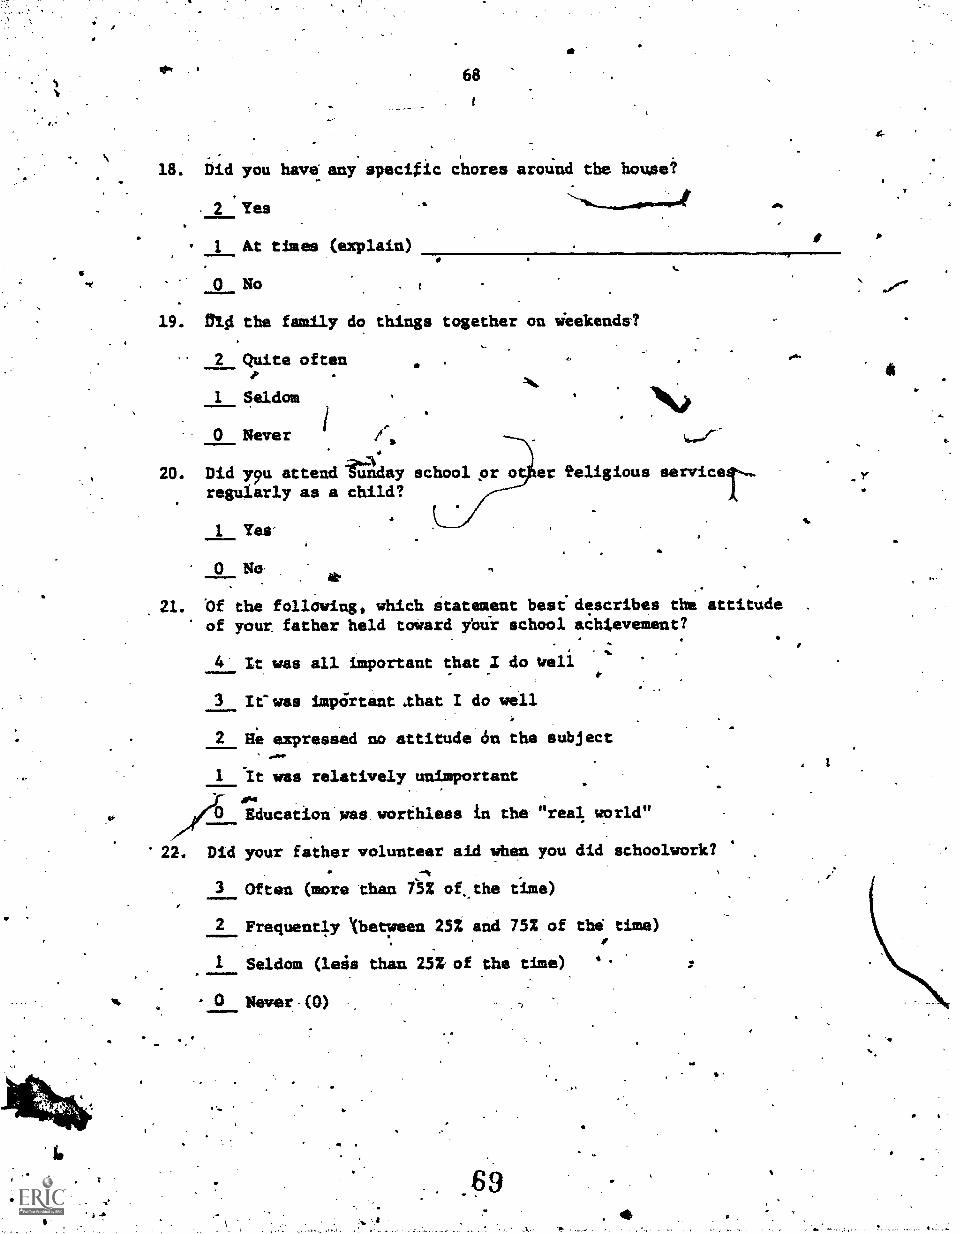
I..
68
.18. Did you have any specific chores around the house?
2 Yes
I At times (explain)
. s
0 No
19. nu the family do things together on wiekends1
2 Quite often
I Seldom
O Never
20. Did y9u attend sunday school or o er religious serviceregularly as a child?
I. Yes'
0 No. *a
21. Of the following, which Statement best describes the attitudeof your father held toward your school achtevement?
4 It was all important that I do well
3 It- was impOrtantathat I do well
2 Ee expressed no attitude do the subject
1 It was relatively unimportant
0.O Education was worthless in the "real world"
22. Did your father volunteer aid when you did schoolwork?
3 Often (more than 752 of, the time)
2 Frequently '(between 252 and 752 of thi time)F
1 Seldom (leis than 25% of the time)
0 Never -(0)
z
is
$.
-Y
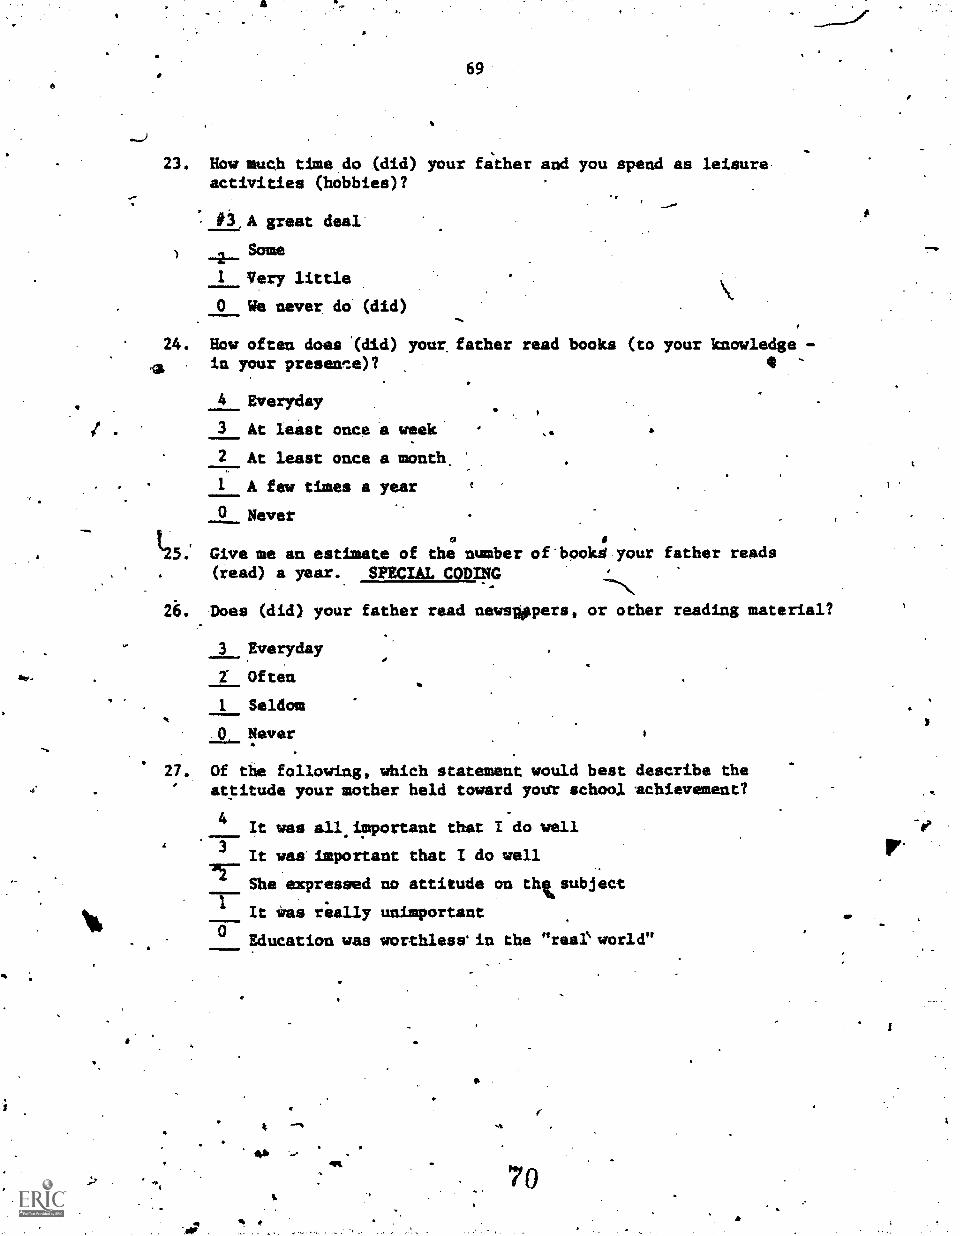
23. How much time do (did)activities (bobbies)?
#3,A great deal
Some
I Very little
0 We never do. (did)
69
your f4;ther and you spend as leisure
01,
24. How often does .(did) your father read books (to your knowledge -in your presente)? 4
4 Everyday
3 At least once a week'
2 At least once a month.
1 A few times a year
0 Never
I,25: Give me an estimate of the number of'book4 your father reads(read) a year. SPECIAL CODING
26. Does (did) your father read newspopers, or other reading material?
3 Everyday
2' Often
1. Seldom
0 Never
27. Of the following, which statement would best describe theattitude your mother held toward your school achievement?
4 It was all important that I do well3
It was' important that I do well
She expressed no attitude on thtsubject
It was rially unimportant0
Education was worthless` in the "real` world"=10EdimiI
4
41
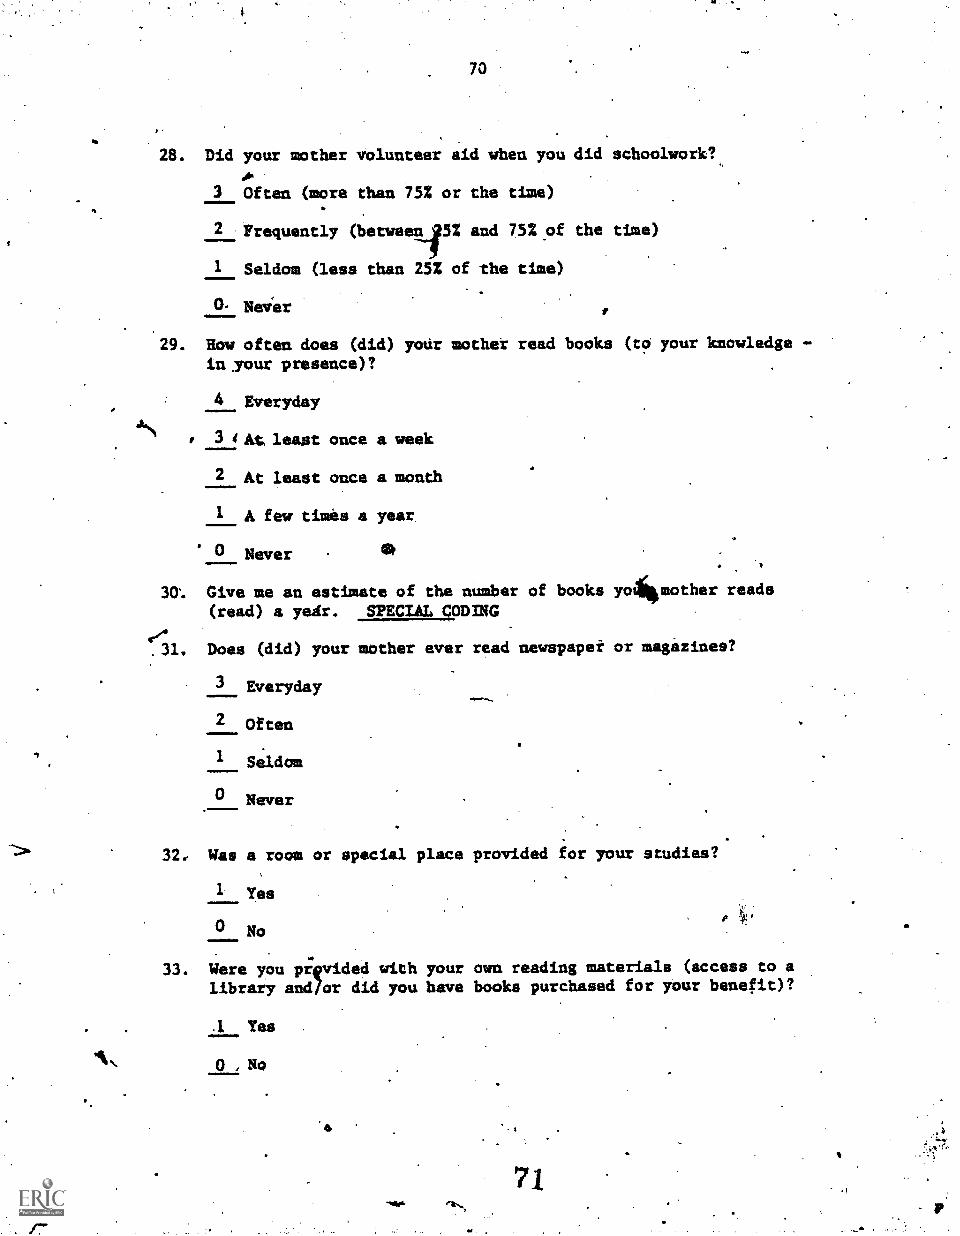
70
28. Did your mother volunteer aid when you did schoolwork?
3 Often (more than 75% or the time)
2 Frequently (betweeal,5% and 75% of the time)
1 Seldom (less than 25% of the time).
0- Never
29. How often does (did) yodr mother read books (to your knowledgein your presence)?
4 Everyday
3 4ALt least once a week
2 At least once a month
1 A few times a year
0 Never 14
30'. Give me an estimate of the number of books yollikmother reads
(read) a year. SPECIAL CODING
.31. Does (did) your mother ever read newspaper or magazines?
3 Everyday
2 Often
1 Seldom
° Never
32d Was a room or special place provided for your studies?
1 Yes
No
33. Were you provided with your own reading materials (access to alibrary andlor did you have books purchased for your benefit)?
1 Yes
Q, No
71
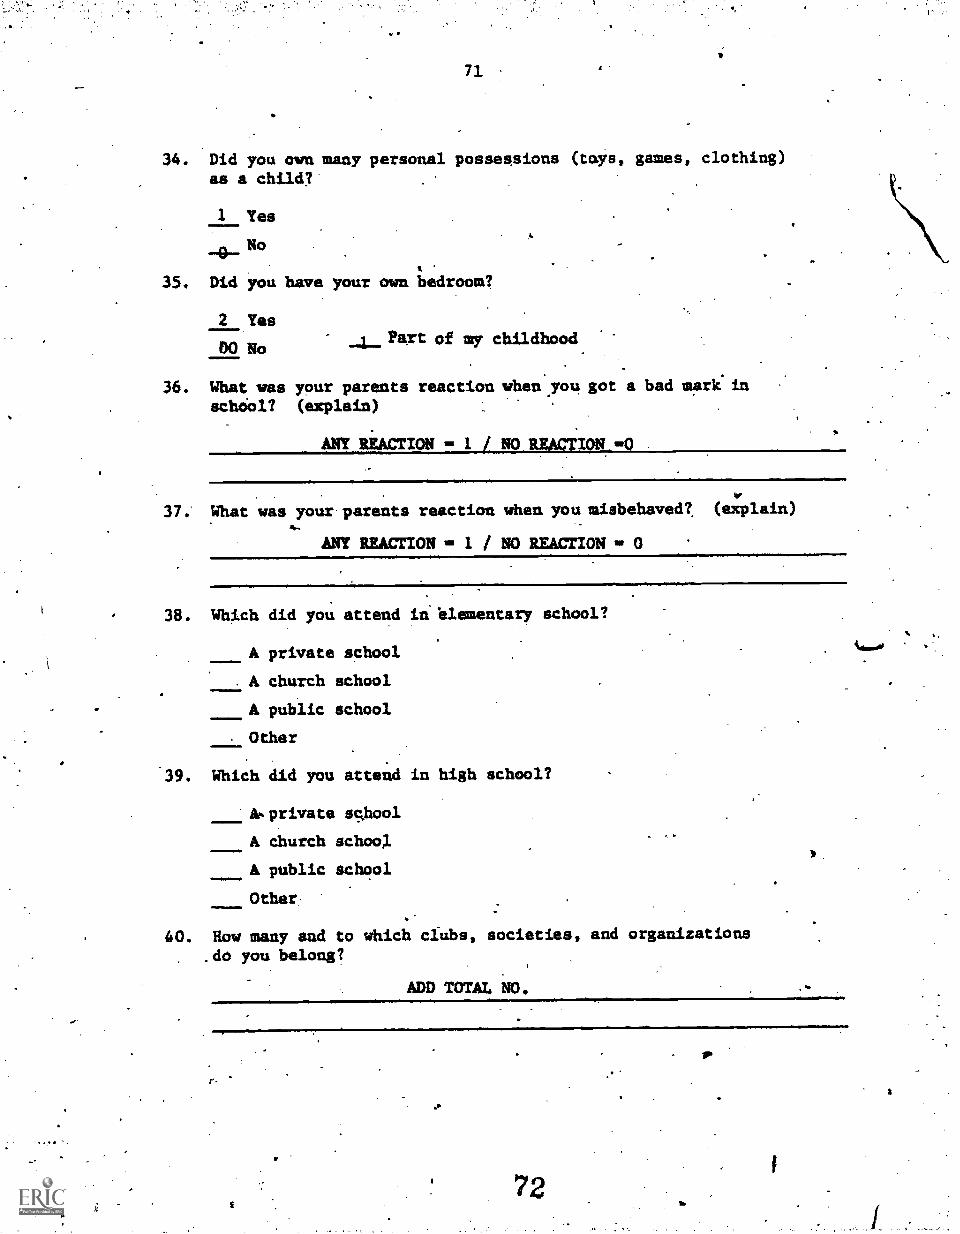
71
34. Did you own many personal possessions (toys, games, clothing)as a child?'
1 Yes
No
35. Did you have your own bedroom?
2 Yes
DO NO
36. What was your parents reaction when you got a bad mark in
School? (explain)
Fart of my childhood
ANY REACTION 1 / NO REACTION
37. What was your parents reaction when you misbehaved?. (explain)
ANY REACTION .1. 1 / NO REACTION m. 0
38. Which did you attend in elementary school?
A private school
. A church school
A public school
Other
39. Which did you attend in high school?
Ar.private school
A church schoo).
A public school
Other
40. Row many and to which clubs, societies, and organizations.do you belong?
ADD TOTAL NO.
r-
72I
/ .
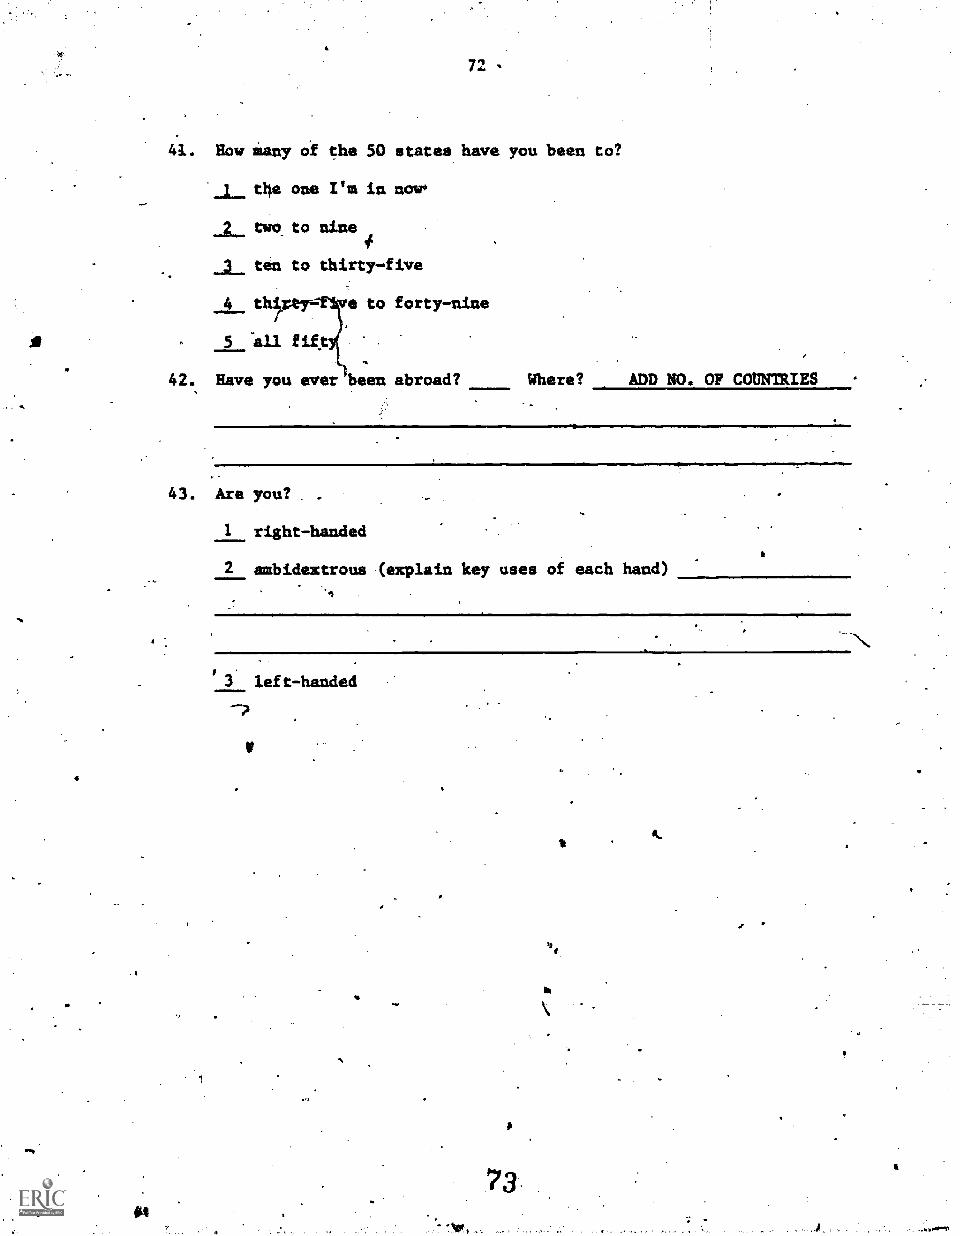
72
41. How Many of the 50 states have you been to?
the one I'm in nor
two to nine
ten to thirty-five
4 th Is to forty-nine
5 "all fift
42. Have you aver been abroad? Where? ADD NO. OF COMMIES
43. Are you?
1 right-handed
2 ambidextrous (explain key uses of each hand)
' 3 left-handed
73..
ak
4.
J.
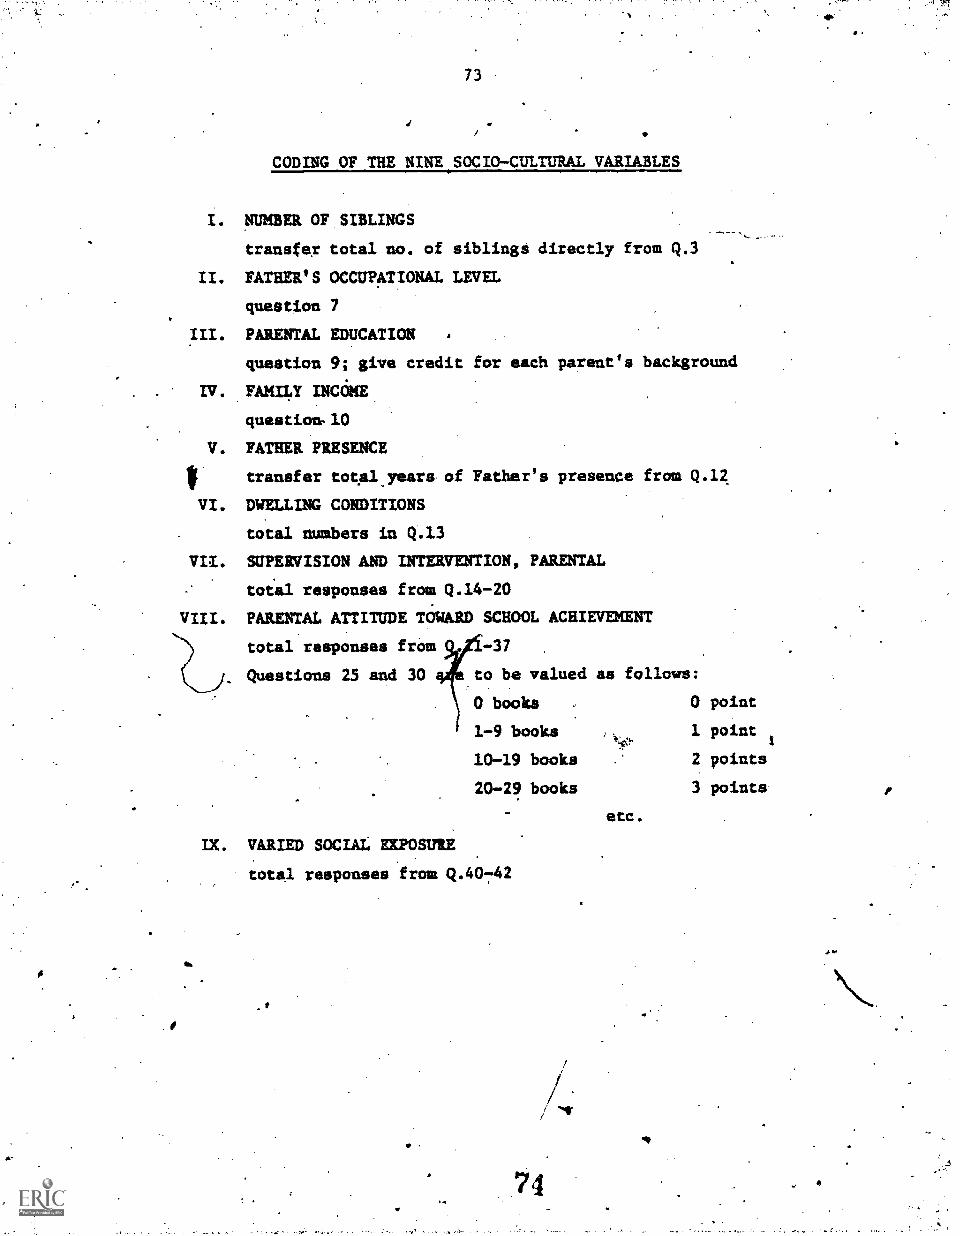
73
CODING OF THE NINESOCIO-CULTURAL VARIABLES
I. NUMBER OF SIBLINGS
transfer total no. of siblings directly from Q.3
II. FATHER'S OCCUPATIONAL LEVEL
question 7
III. PARENTAL EDUCATION
question 9; give credit for each parent's background
IV. FAMILY INthe
question- 10
V. FATHER PRESENCE
Itransfer total_years of Father's presence from Q.12
VI. DWELLING CONDITIONS
total numbers in Q.13
VII. SUPERVISION AND INTERVENTION, PARENTAL
total responses from Q.14-20
VIII. PARENTAL ATTITUDE TOWARD SCHOOL ACHIEVEMENT
Z,1
total responses from -37
Questions 25 and 30 to be valued as follows:
0 books . 0 point
1-9 books , 1 pointt
10-19 books 2 points
20-29 books 3 points
etc.
IX. VARIED SOCIAL EXPOSURE
total responses from Q.40742
A
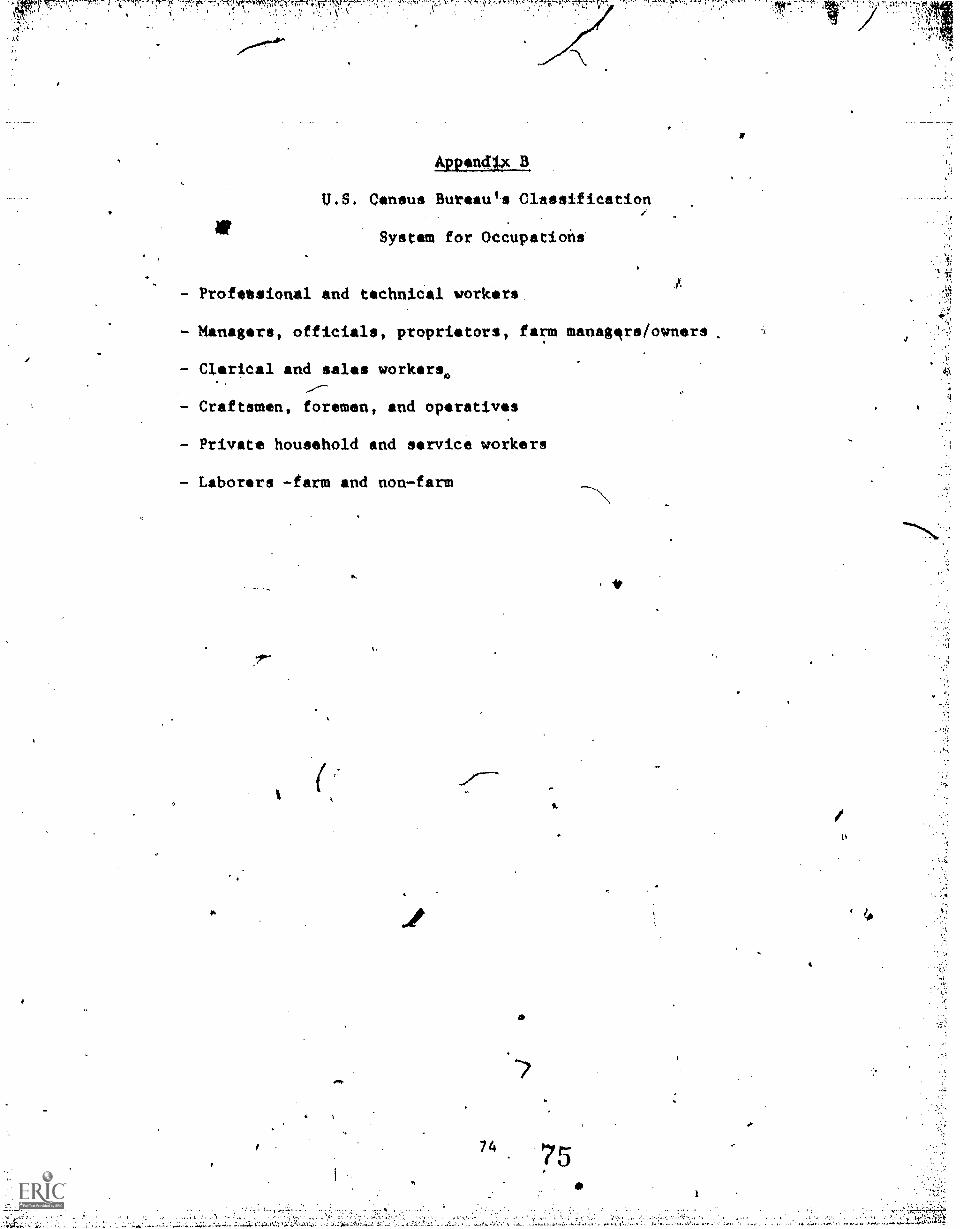
kT1' .". .
1`..'t'1174W)71.!0`
AppendB
U.S. Census Bureau's Classification
System for Occupations
Profossional and technical workersA
- Managers, officials, proprietors, farm managfrs/owners
- Clerical and sales workers.
Craftsmen, foremen, and operatives
- Private household and service workers
Laborers -farm and non-farm
I
t.
A.
74 75
I
4
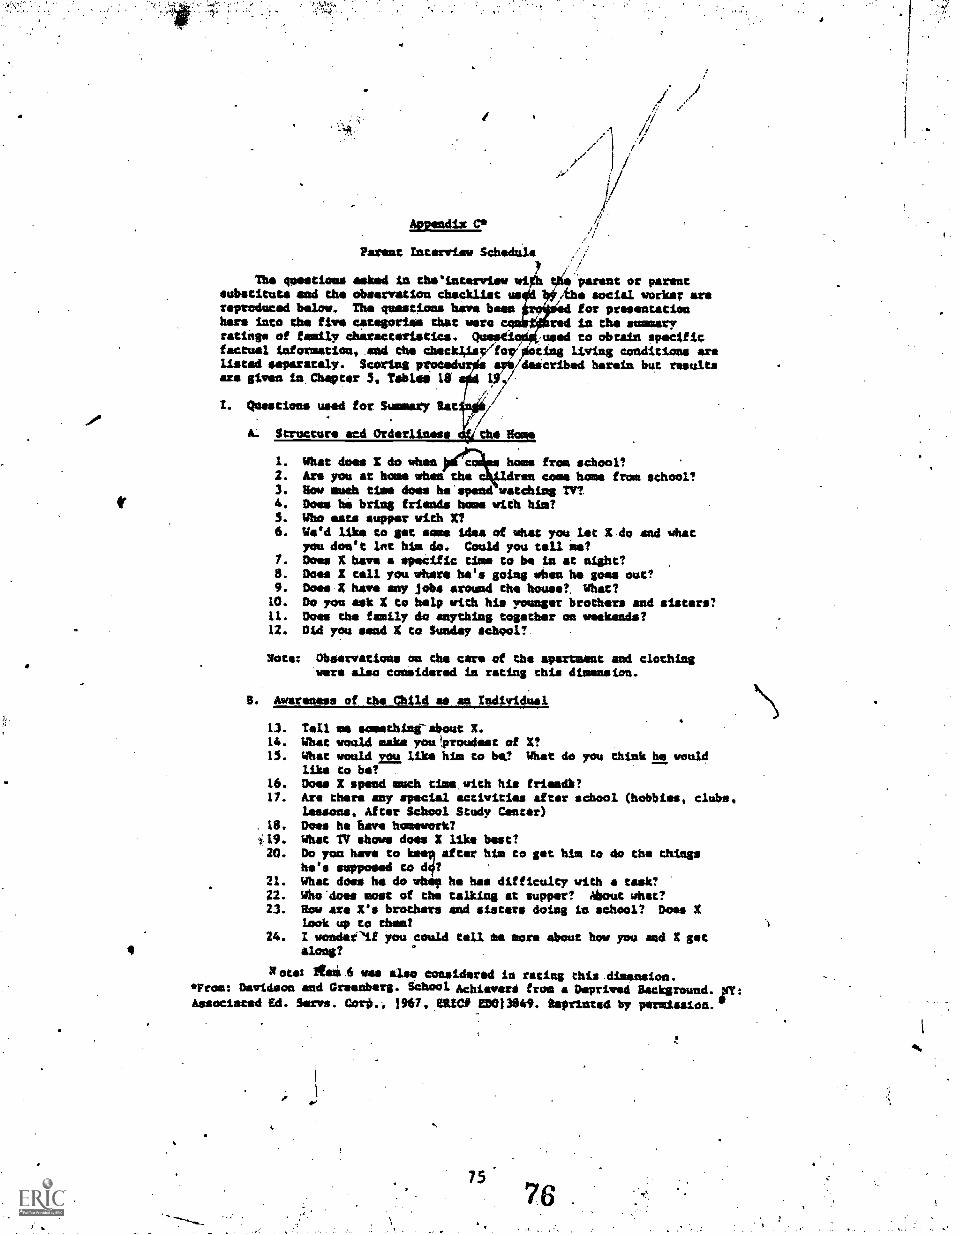
I
Appendix C
Parent Interview Schedule
The questions asked in thelinterviow wi the parent or parentsubscituta and the observation checklist ,che social works; arereproduced below. The questions have been for presentationhers into the five categorise that were red in the summarytimings of family tharacteristics. used to obtain specificfactual information, and the checkliPtly clog living conditions areListed separataly. Scoring p dascribed herein but resultsare given in Chapter 5, Table, 18 IS1
2. Questions used for Summary Bat
A. Structure and Orderlinsel the Home
1. What does I do when home from school?2. Are you at home when the ran come home from school?3. low meek time doss he spend watchimg TV?.4. Does he bring friends home with him?5. Who eats supper with X16. We'd like to get some idea of what you let X do and what
you don't lot him do. Could you tell me?7. Does I have a specific tine to be in at night?8. Does X tell you where he's going when he goes out?9. Does X have any jobs around the house?. What?10. Do you ask X to help with his younger brothers and sisters?11. Does the family do anything together on weekamds?12. Did you *sad X to Sunday school?
Sots: observations on the care of the apartmant and clothingwere also considered in rating this dimension.
8. Awareness of the Child as as Individual
13. Tell as something about X.14. What would sake youlercudost of X?15. What would m Ilk* his to be What do you think he would
like to be?16. Does X spend much ties with his friendb?17. Are there any special activities after school (hobbies, clubs.
lessons. After School Study Costar)18. Dees he have homework?19. What TV shows does X like best?20. Do you have to after his to get him to do the things
he's supposed to d ?21. What does he do whop he has difficulty with a task?22. Who does most of the talking at supper? Ahout what?23. Row are X's brothers and sisters doing in school? Does X
Look up to them?24. 1 wondeeif you could tell as more about how you and X get
4 elms?
Now #666 ma also considered in rating this dimension.*From: Davidson and Greenberg. School Achiever* from a Deprived Background. Iff:Associated Ed. Serve. Corp.; 1967, MCP £0013849. tievinced by permission.!
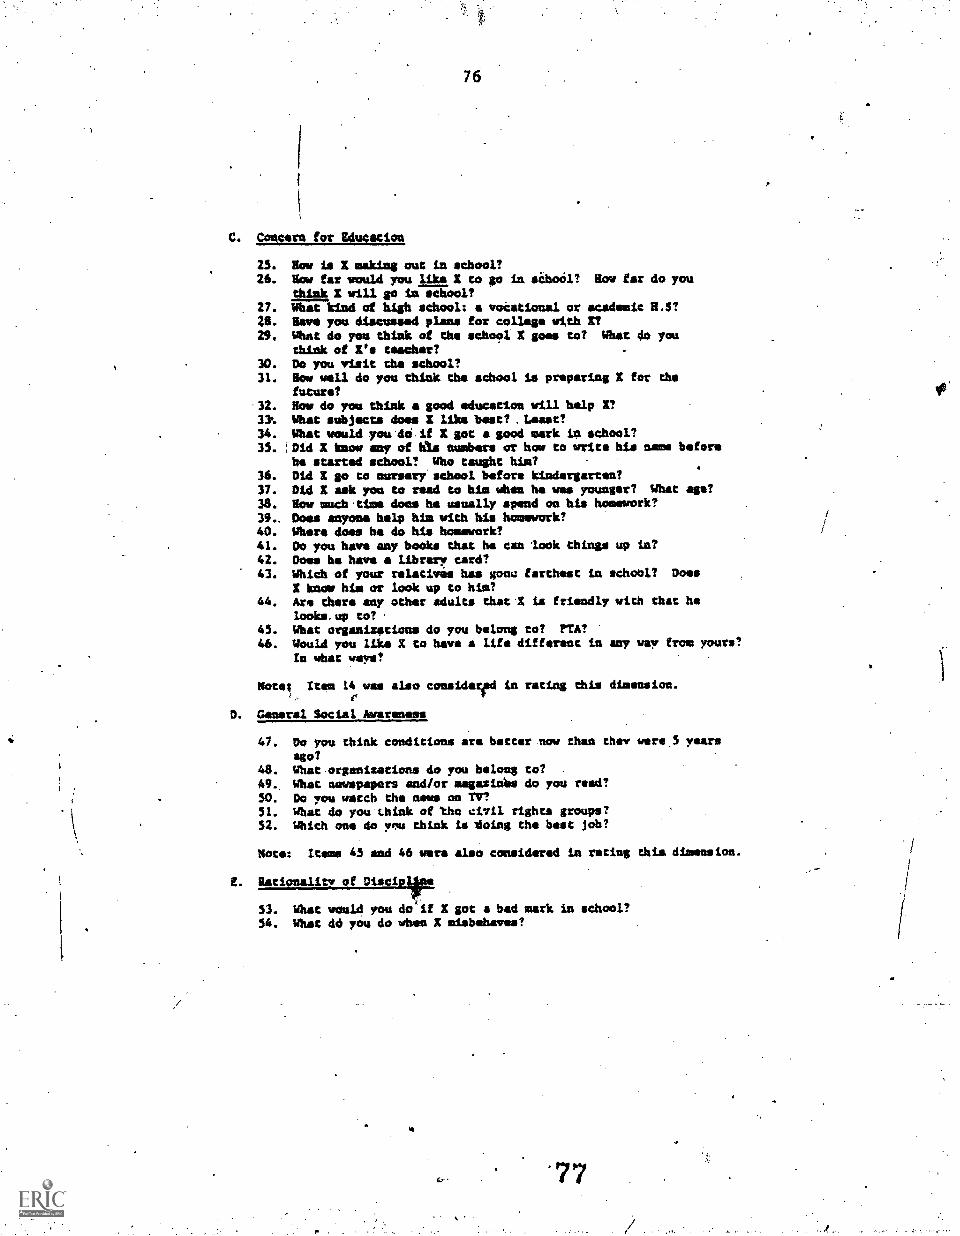
76
C. Coots= for Education
25. low is X making out in school?26. low far would you like X to go in sibool? low far do you
,hiia_k X will go ia school?27. What kind of high school: a vocational or academic R.S?28. Have you discussed plans for collage with I?29. What do yea think of the school X goes to? What do you
think of X's teackar?30. Do you visit the school?31. How well do you think the school is preparing X for the
future?32. Row do you think a good education will help X?33% What subjects does X like best? Least?34. What would pat do if X got a good mark ip school?35. ;Did X know any of hta numbers or how to write his name before
he started school? Who taught him?36. Did I go to nursery school before kindergarten?31. Did X ask you to read to his when he wee younger? Whet age?38. How much time doom ha usually spend on his homework?39. Does =yam help him with his homework?40. Where does be do his hosswork?41. Do you have any books that he can look things up in?42. Doss ha have a library card?43. Which of your relatives has gone farthest in school? Does
X know his or look up to him?44. Are there any other adults that X in friendly with that he
looks up to?45. What organisocions do you belong to? PTA?46. Would you like X to have a Life different in any way from yours?
In what ways?
Notes Item 14 was also conside9rd in rating this dimension.
0. General Social Awareness
47. Do you think conditions are better now than they were ,5 years
ago?48. What organisations do you belong to?49. Whist nowspepors and/or magasinhs do you read?50. Do you watch the news on TV?51. What do you think of the civil rights groups?52. Which one do ynu think is doing the best job?
Note: items 45 and 46 were also considered in rating this, dimension.
C. Rationality of Discilre
53. Whim would you do'if X got a bad mark in school?54. What dd you do when X misbehaves?
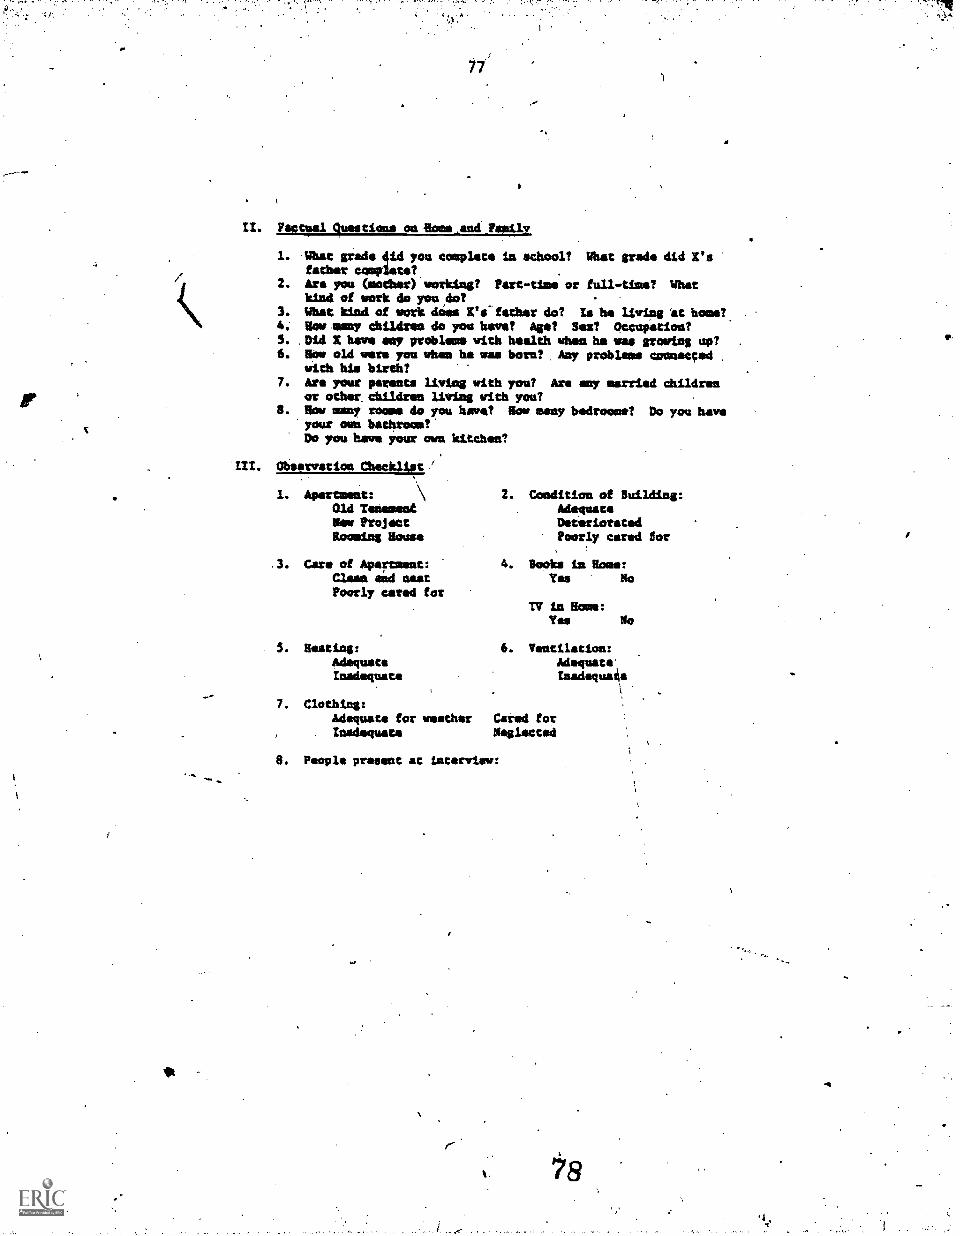
IP
it
77
Factual questions on MOme.and Family
1. What grade did you complete in school? Whet grade did X'sfather complete
2. Are you (mother) working? Part-time or full-time? Whatkind of work do you do?
3. What kind of work defies X's'father do? Is he living Lc home?A. Nov many children do you have? Age? Sear? Occupation?S. Did X have any problems with health whoa he was growing up?6. Row old wars you when ha was born? Any problem, connected
with his birth?7. Are your parents living with you? Are any married children
or other, children living with you?8. Row meny Moses do you have? Row many bedroom*? Do you have
your own bathroom?'Do you bow* your own kitchen?
III. Obsorgetion CheckliLt
1. Apartment:Old Ts:emendNew ProjectRooming Rouse
3. Care of Apartment:Clean and eastPoorly cared for
5. Heating:AdoquotsInadequate
7. Clothing:Adequate for weatherInadequate
2. Condition of Building:AdequateDeterioratedPoorly cared for
4. Books in Rome:Yes No
TV in Rome:Yes No
6. Ventilation:AdequateInadsquade
Cared forNeglected
8. People present at Uttar/Jew:
I-
t.
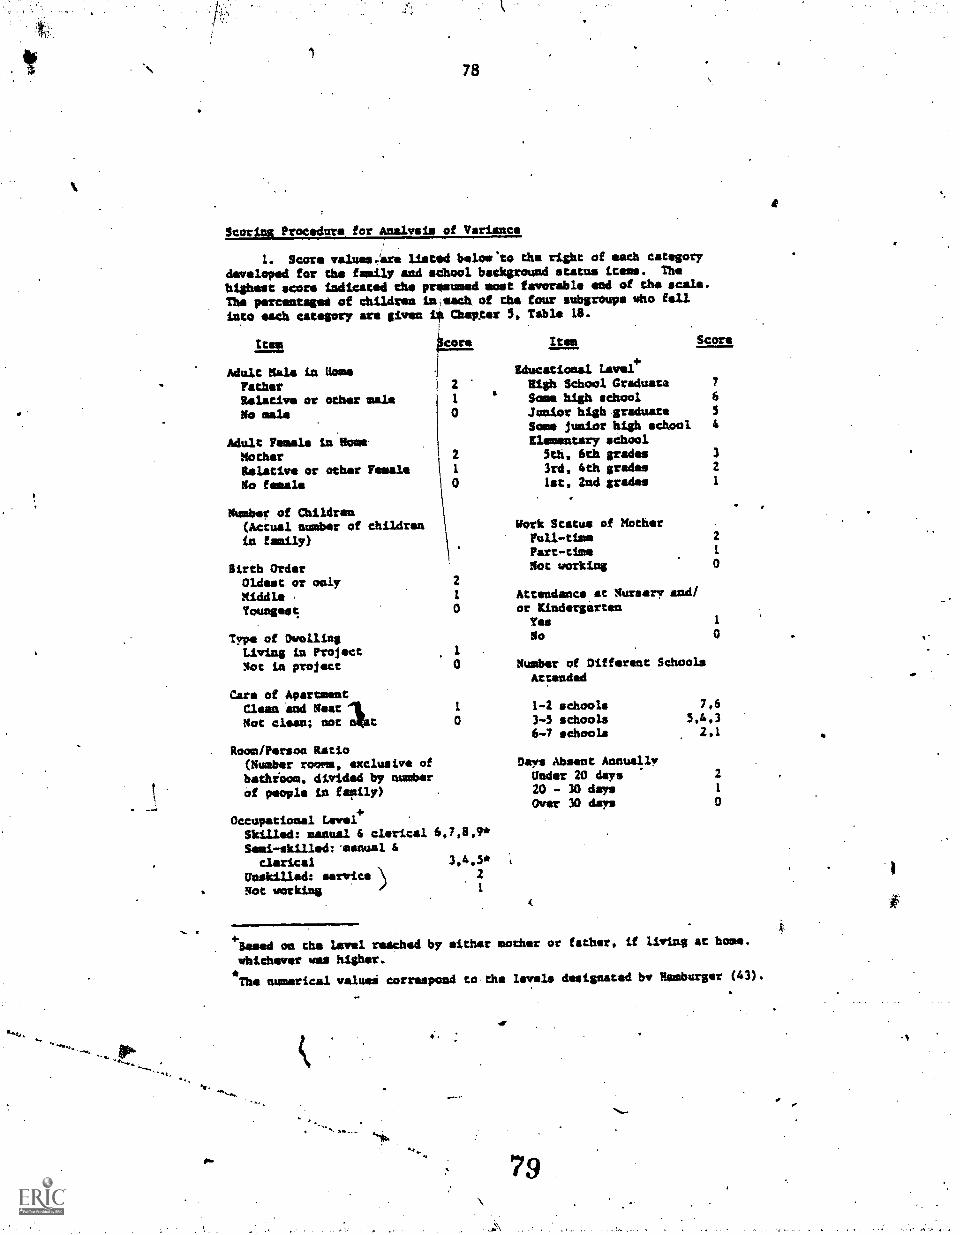
78
Scoring Procedure for Analvsis of Variance
1. Score values.gre listed beloe'to the right of each categorydeveloped for the family and school background status items. The
highest score indicated the presumed most favorable end of the scale.The percentage of children Wesel' of the four subgroups who fell
into each category are given Chapter 5, Table 111.
Adult Male in BomaFatherRelative or other maleNo sale
Adult Female in Moms.MotherRelative or otherNo female
Ore
2
1
0
Female i 1
0
Number of Children(Actual number of childrenis family)
Birth OrderOldest or mayMiddleYoungest
Type of DwellingLiving in ProjectNot is project
Care of ApartmentClean and NeatNot clean; not lat
2
1
0
Item Score
Sducstional Level+High School Graduate 7
Soma high school 6
Junior high graduateStem junior high school 4
Elementary school5th, 6th grades 3
3rd, 4th grades 2
1st, 2nd grades 1
Rork Status of MotherFull-theePart -time
Not working
Attendance at Nursery and/or Kindergarten
YesPo
I
O Number of DifferentAttended
1
0
Room/Person Ratio(Number rooms, exclusive ofbathroom, divided by numberof people in ferny)
Occupational Level*Skilled: manual 4 clerical 6,7,11,9*
Semi -skilled:vanualclerical 3,4,5*
Unskilled: service 2
Not working I
1-2 schools3-5 schools6-7 schools
Days Absent AnnuallyUnder 20 days20 - 30 daysOver 30 dale
Schools
2
1
0
1
0
7,6
5,4.32,1
2
I
0
+Based on the level retched by either mother or father, if living at hose.
whithever was higher.*The numerical valuei correspond to the levels designated by Hamburger (43).
79
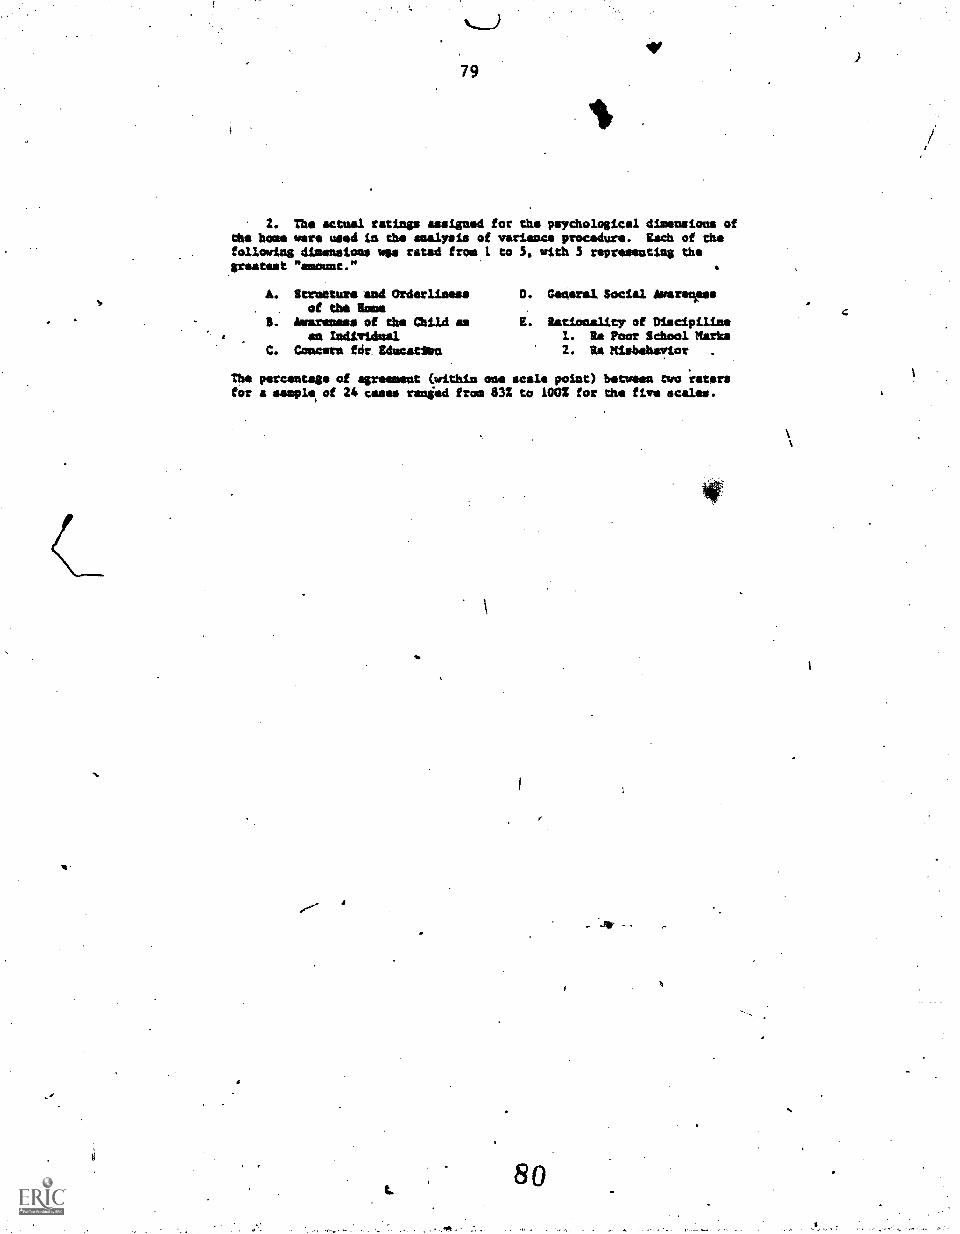
79
2. The actual ratings assigned for the psychological dimensions ofOka home were used in the analysis of variance procedure. Each of thefollowing dinensioos wee rated from 1 to 5, with 3 representing thegreatest "amount."
A. Streeture and Orderlimessof the Nome
0. 0egaral Social Awareness
5. Awareness of the Child asse tedividael
E. Rationality of DiscipiIimeI. Re ?OCT School Marta
C. Comers far. Zdecatian 2. Re Misbehavior .
The percentage of agreement (within one scale point) between two ratersfor a sample, of 24 cases ranged from 832 to 1002 for the five scales.
80
a
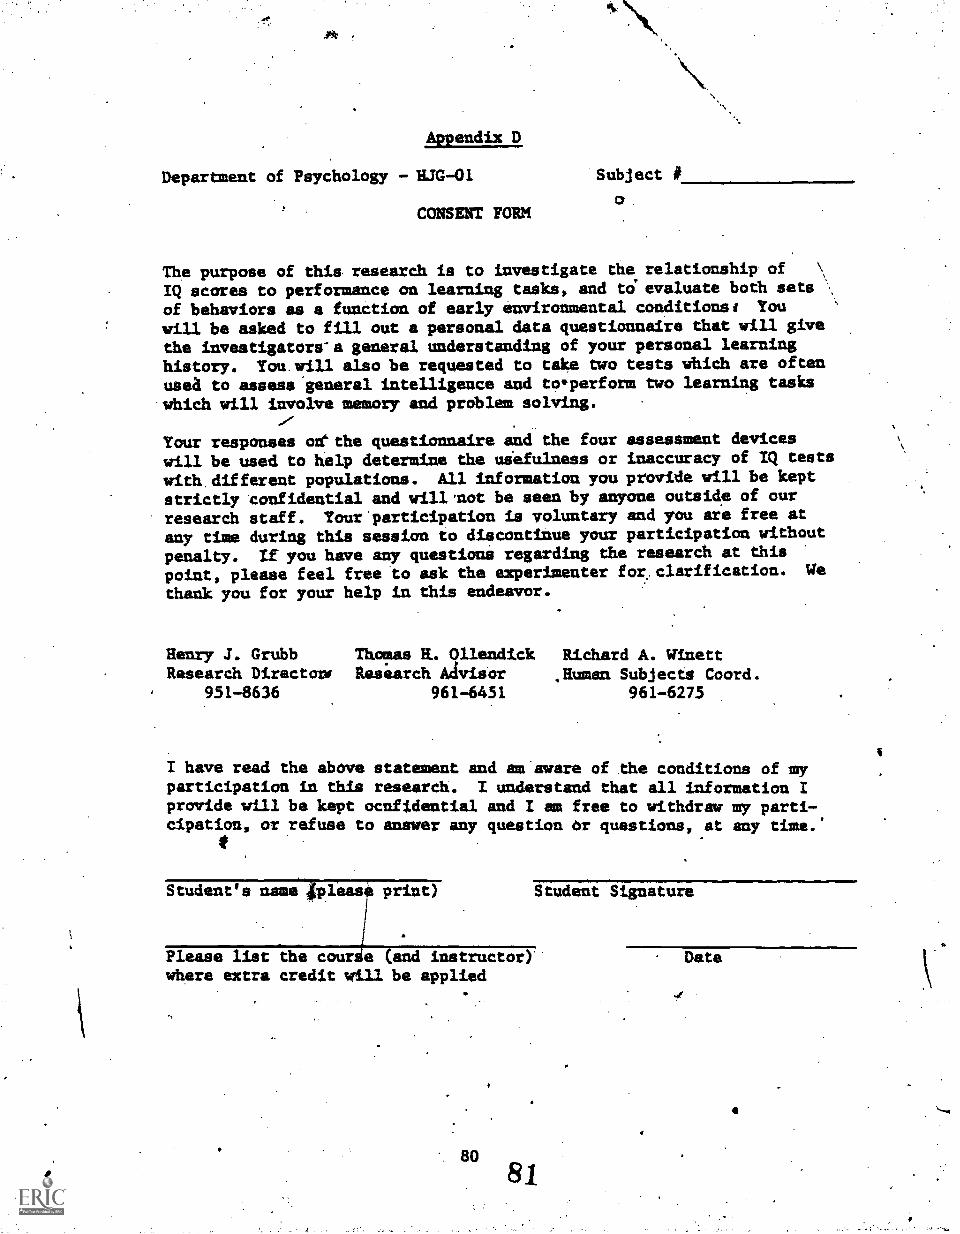
Appendix D
Department of Psychology - HJG-01
CONSENT FORM
Subject #
o.
The purpose of this research is to investigate the relationship. of \
IQ scores to performance on learning tasks, and to evaluate both sets
of behaviors as a function of early environmental conditions/ You
will be asked to fill out a personal data questionnaire that will givethe investigators-a general understanding of your personal learninghistory. You. will also be requested to take two tests which are oftenused to assess 'general intelligence and to perform two learning taskswhich will involve memory and problem solving.
Your responses on`the questionnaire and the four assessment devices
will be used to help determine the usefulness or inaccuracy of IQ tests
with ,different populations. All information you provide will be keptstrictly confidential and will.not be seen by anyone outside of our
research staff. Your'participation is voluntary and you are free at
any time during this session to discontinue your participation without
penalty. If you have any questioni regarding the research at thispoint, please feel free to ask the experimenter for,. clarification. We
thank you for your help in this endeavor.
Henry J. Grubb Thomas K. 011endick Richard A. WinettResearch Directom Research Advisor ,Human Subjects Coord.
951-8636 961-6451 961-6275
I have read the above statement and am'avare of the conditions of myparticipation in this research. I understand that all information Iprovide will be kept ocnfidential and / an free to withdraw my parti-cipation, or refuse to answer any question Or questions, at any time.'
0
Student's name print) Student Signature
Please list the dour e (and instructor) Datewhere extra credit will be applied
A
Appendix E
4.
Instructions for Memory Drum Task
You villlbe seeing a.list of twelve pairs of three letter
non -sense syllables. You will be allowed to see the list twice.
The pairs will be presented at a rate Of 1-pair every'two seconds.
At the end of the first viewing of the twelve pair list you will
see two rows of steak and then the same twelve pairs will be
presented to you again, in the same order.
At the end of the second viewing you will be given two taaki
to perform. One, you will be given a list of the.isyllables on
the left side of the pairs viewed and asked ,to write in the syl-
lable ne*t to it which you remember being there. Second, you will
be given appage containing 36 three letter syllables and asked to
circle those you remember viewing in the right hand position.
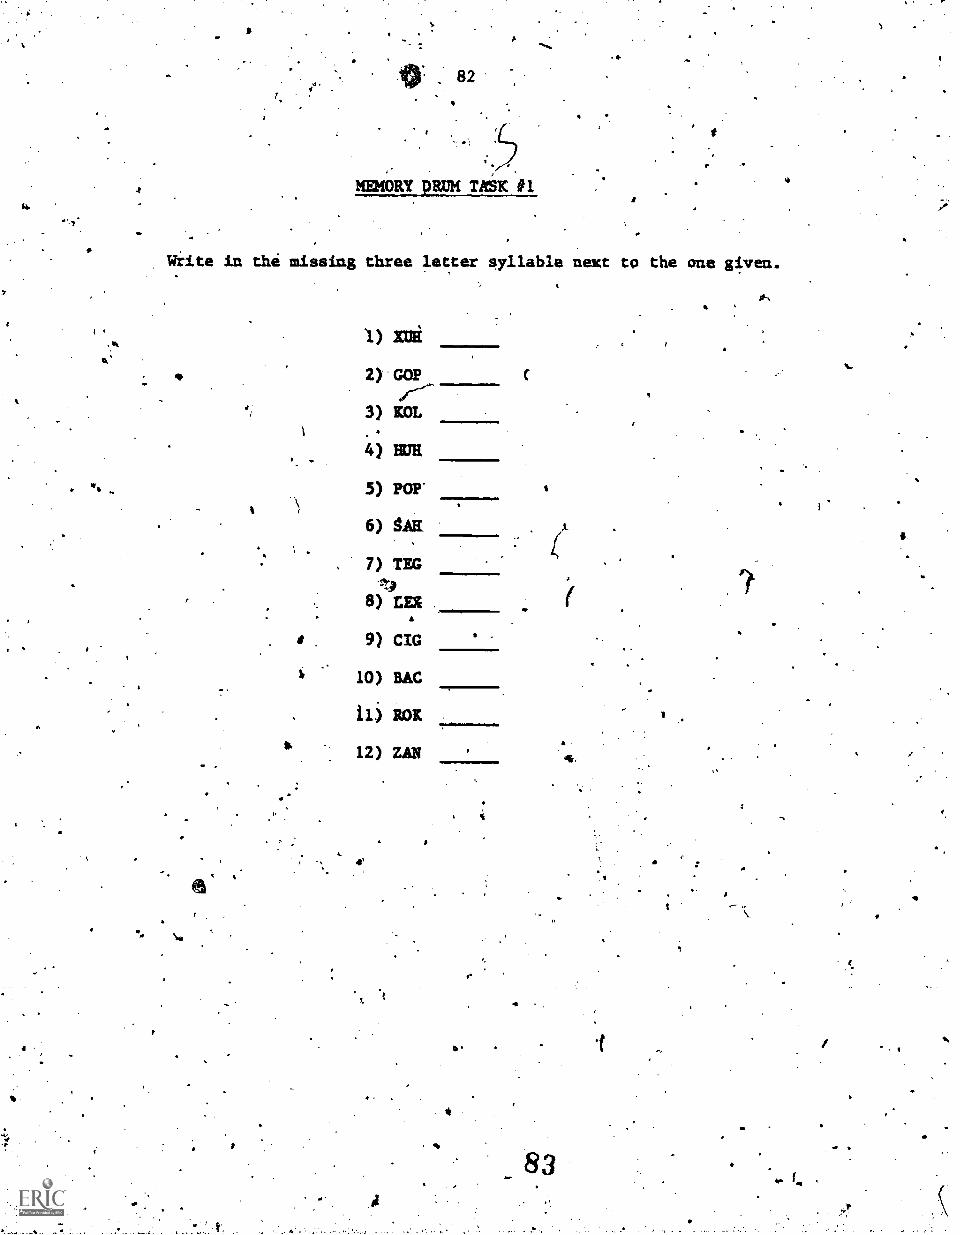
MEMORY DRUM Tilix41S
Write in thi missing three letter syllable next to the one given.
1031i
2) GOP
3) ROL
4) HUH
5) POP'
6) gam.
7) TEG11
8) LEI
9) CIG
10) RAG
ii) P0K
12) ZAN
4=110
..11,
tb
4
C
83
1
1
83
mon- DRUM TASK #1 - ANSWER SHEET,
-Oa
I). NUL
2) HAN
3) GIB
4). XAH
5)TIL
6) SDT
7) RAG
8) LEL
9) KIM
10) ZEK
11) BUP
12) PAS'
A
84
4
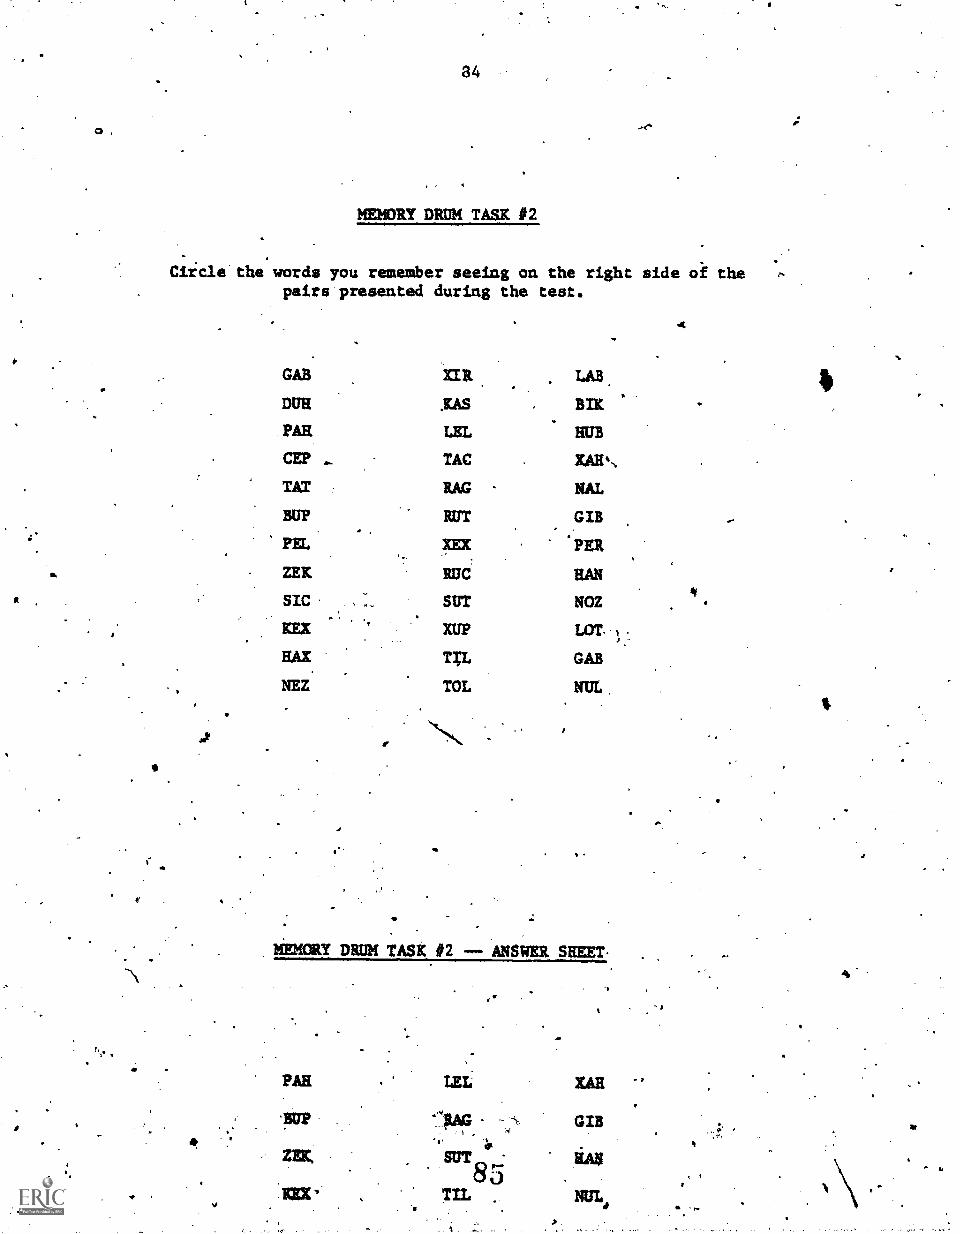
t
st,
34
MEMORY DRUM TASK #2
Ciicle the words you remember seeing on the right side of thepairs presented during the test.
V
GAB SIR LAB.
DUR US BIK
PAR LEL HUB
CEP ... TAE XAR\
TAT RAG NAL
BUP RUT GIB
PEL XEX PER
ZEK RUC* HAN
SIC SOT NOZ
KEX XUP LOT
HAS T. GAB
NEZ TOL NUL
MEMORY DRUM TASK #2 -- ANSWER SHEET.
LEL. XAR
GIB
HAS
NUL
-
1.1
4
3
4
41
"44
ARpendixr
General Instructions
You are going to-be given two intelligence tests and twolearning tasks during this and one other period. The totaltime Involved is about three hours. You will also fie given aPersonal Data Questionnaire to fill out.
The questionnaire is about the environmental and familyaspects of your childhood,. ages birth to 18. The entire as-se -sment you will undergo is to be used in,determining theaccuracy or inaccuracy of IQ tests with certain populationsbased on demographic data and learning histories.
.,
If you have any questions at this time please feel freeto ask them. Once the test procedures begin,.I wi be limitedto the responses I can make specified by the instru ons andguidelines of the individual tests.
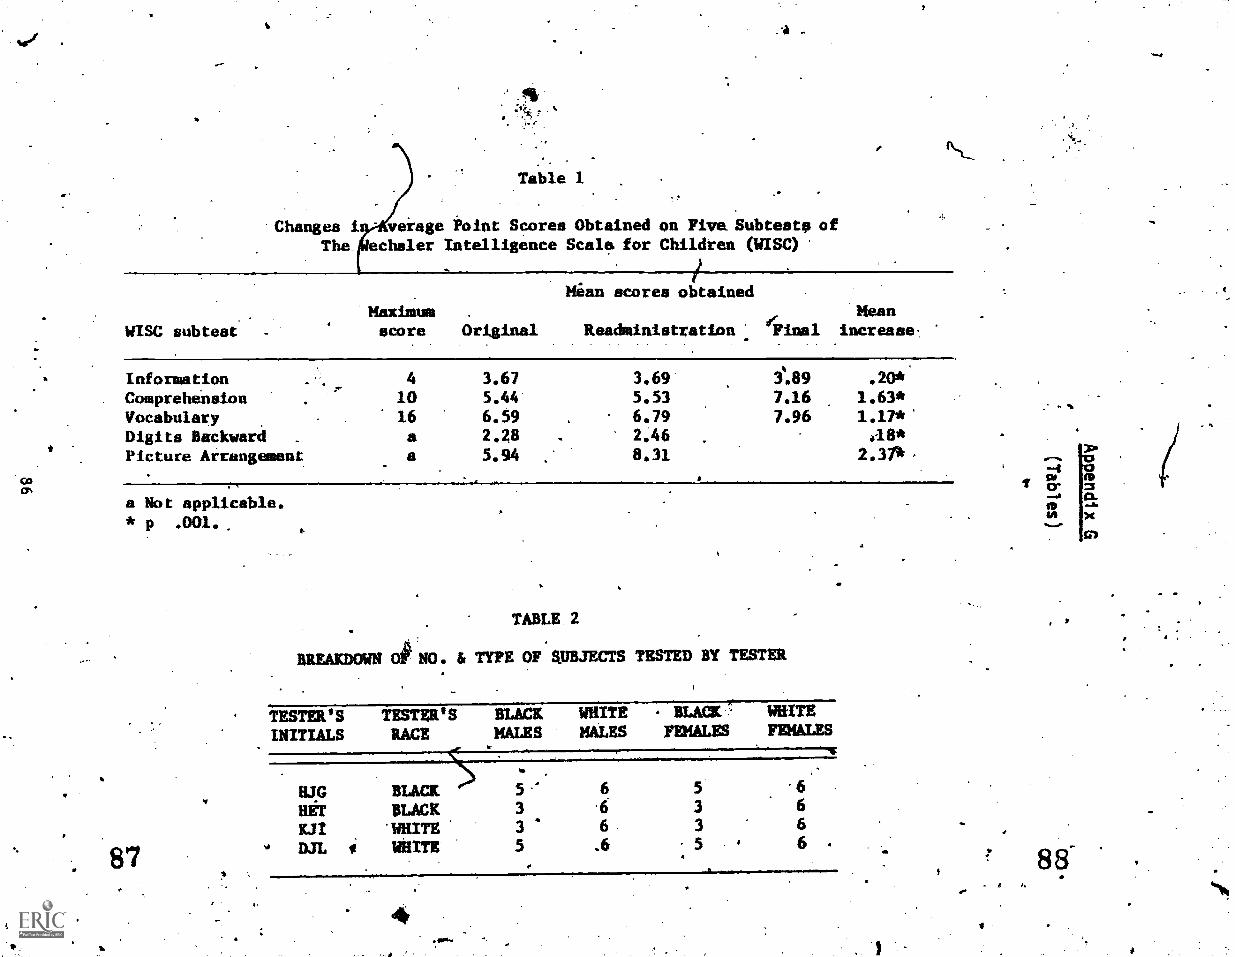
Table 1
Changes i veiage Point Scores Obtained on Five, Subtests of
The choler Intelligence Scala for Children (WISC)
WISC subtest
Hian scores obtainedMaximum Meanscore Original Read ministration Final increase
Information 4 3.67 3.69. 3.89 .20*
Comprehension . 10 5.44 5.53 7.16 1.63*Vocabulary 16 6.59 6.79 7.96 1.17*'Digits Backward , a 2,g8 . 2.46 418*
Picture Arrangement a 5.94 8.31 2.31k,
a Not applicable.* p .001.
87
TABLE .2
BREAKDOWN OiNO. & TYPE OF SUBJECTS TESTED BY TESTER
TESTER'S TUTU' S BLACK WRITE BLACK MUTE
INITIALS RACE MALES MALES FEMALES FEMALES
LIG BLACK 5 ." 6 5 6
HET MACK 3 .6 3 6K.I! MUTE 3 6 3 6DJL p //T6 5 .6 5 8 6.
.1
..
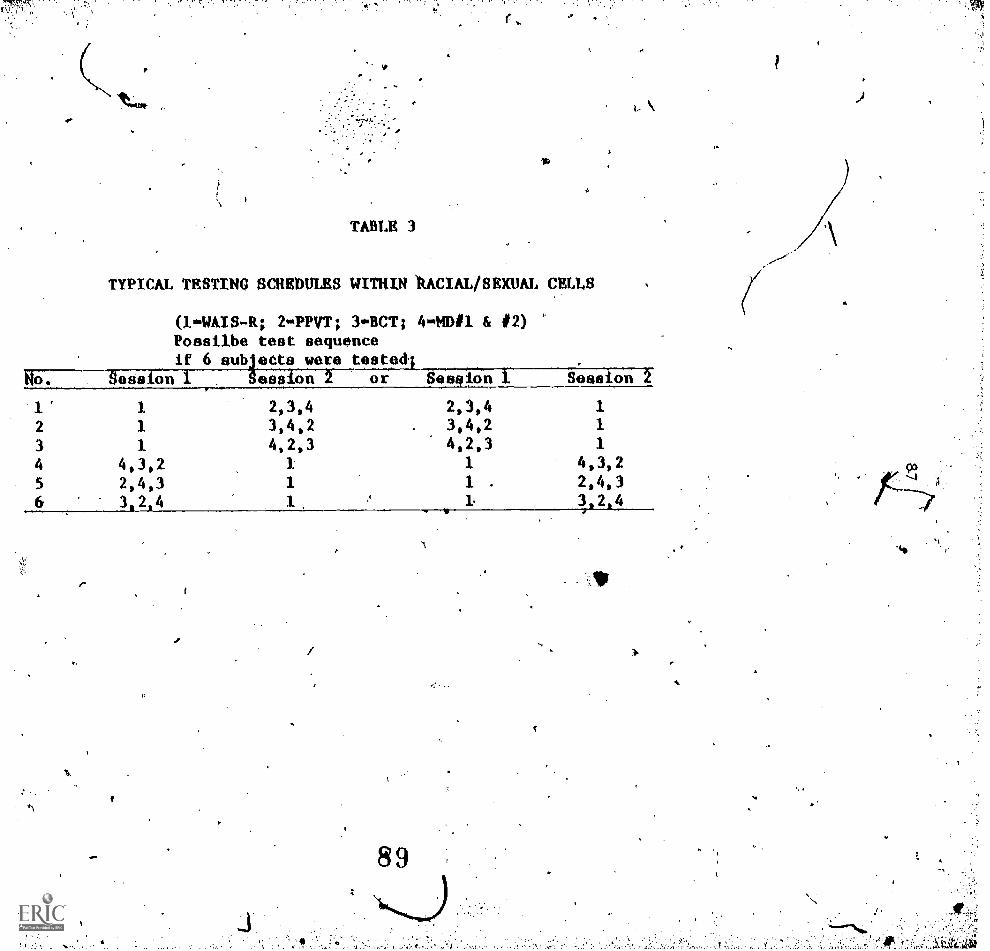
4.
TABLE 3
TYPICAL TESTING SCHEDULES WITHIN 'RACIAL/SEXUAL CELLS
(J. '.WAIS-R; 2 "PPVT; 3IIBCT; 44101 & #2)
Possilbe test sequenceif 6 subjects were tested;
No. Session i Session 2 or Session 1 Session
1' 1 2,3,4 2,3,4 1
2 1 3,4,2 3,4,2 1
3 1 4,2,3 4,2,3 1
4 4,3,2 1 1 4,3,2
5 2,4,3 1 1 . 2,4,36 3,2,4 1
-3,2,4
41
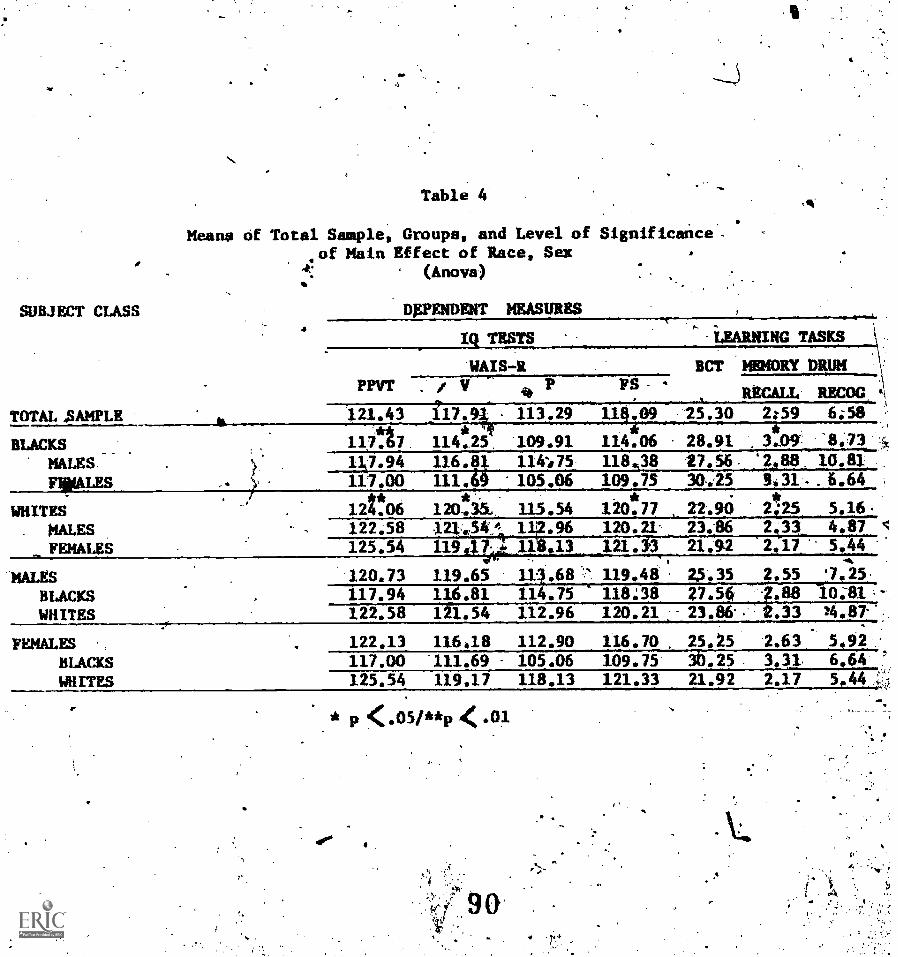
SUBJECT CLASS
Table 4
Means of Total Sample, Groups, and Level ofof Main Effect of Race, Sex
(Anova)
DEPENDENT MEASURES
Significance.-
4
PPVT
TOTAL .SAMPLE 121.43
BLACKS 117417
MALES. 1;7.94
FINALES 117.00
WHITES 12.06MALES 122.58FEMALES 125.54
WAS 120.73BLACKS 117.94WHITES 122.58
FEMALES 122.13BLACKS 117.00
WHITES 125.54
IQ TESTS
WAIS-R
V
17.9
114.25.
116.8111.49
124541.
46)
113.29
'109.91
114;75105.06
FS
LEARNING TASKS
BCT MEMORY DRUM
RECALL RECOG11:.09 25.30 2;59 6.58
114.06 28.91
118,38 7.56109.75 31.25
11941 7._
119.65116.8101.54
116.18111.69119.17
115.54 12011.'77 22.90
1;2.96 120.21- 23.86
.11843 _121 21.92
3.09: -8:73
'2,68. mat .
2i25 5.16.203L 4.872.17__' 5,44
'7,25.
10.-81;-M.871.
111.68114.75112.96
112.90105.06118.13
P <AS/1"p .01
1: 119,48 2.5.35 2.55118.38 27.56 2.88
120.21 23.81 2.33
116.70. 25.25 2.63109.75' 313.25. 3.11121.33 21.92 2.17
5.926.64 .
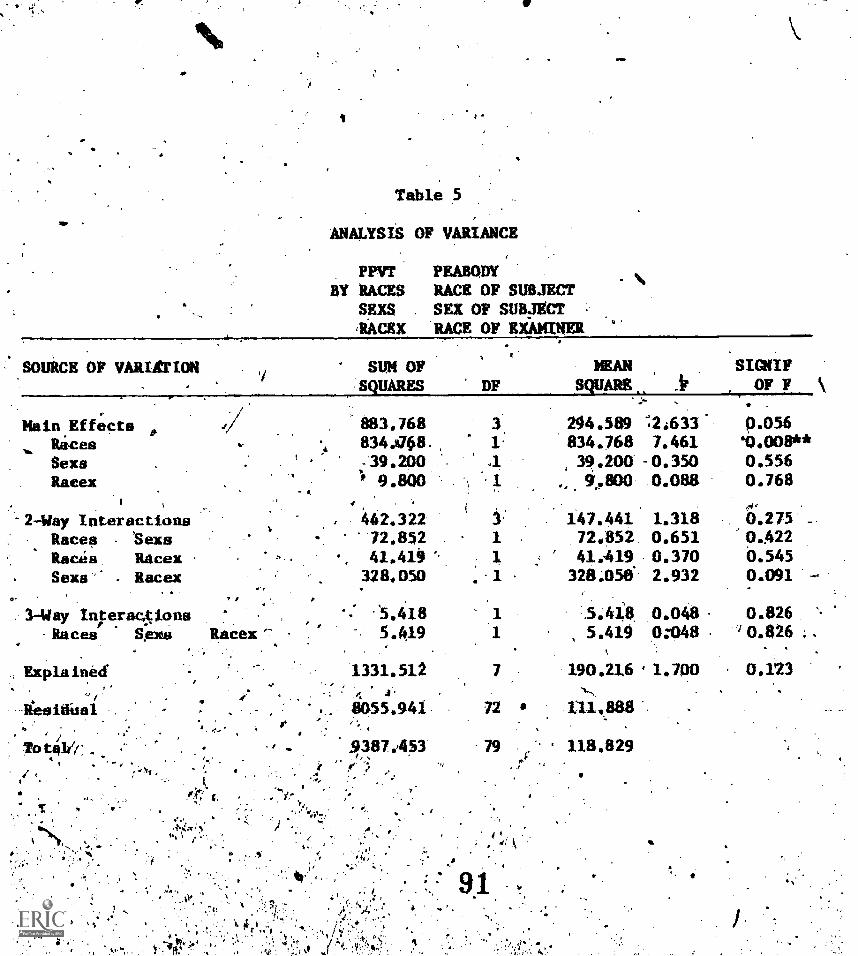
Table 5
ANALYSIS OF VARIANCE
PPVTBY RACES
SEXS,RACIX
PEABODY'RACE OF SUBJECTSEX OF SUBJECTRACE OF EXAMINER
..
SOURCE OF VARIATION SUM OFSQUARES DF
MEAN
SQUARE
Main Effects88.
RicesSexaRacex
-2-Way InteractionsRaces 'SaxeRaceis RacexSexa Racex
r3-Way Ifleract-cions
Races Sens
Explained-/
Reeidial
/
8,
r
RaCex
.1
1..
O
A
,
*."
883.768834.068.39.2009.800
.
442.322.72.85241.419
328.050
5.4185.419
1331.512A.
805.941,
*)87.453
(
31.-1
. 1
11
'11
7
72
.79 ,".
294.589 12;633834.768 7.46139.200 -0.350
8, .9,.800 0.088
147.441 1.31872.852. 0.65141.419 0.370
328.058.- 2.932
0.0485.419 0:048
190.21,6 1.700
111..888
118.829
t'
t 4 1, ik
4
SIGNIFOF F
9.056`0.008**0.5560.768.4%.
0.275 -.0.422
0.091
0.826'0.826 ;
0.123
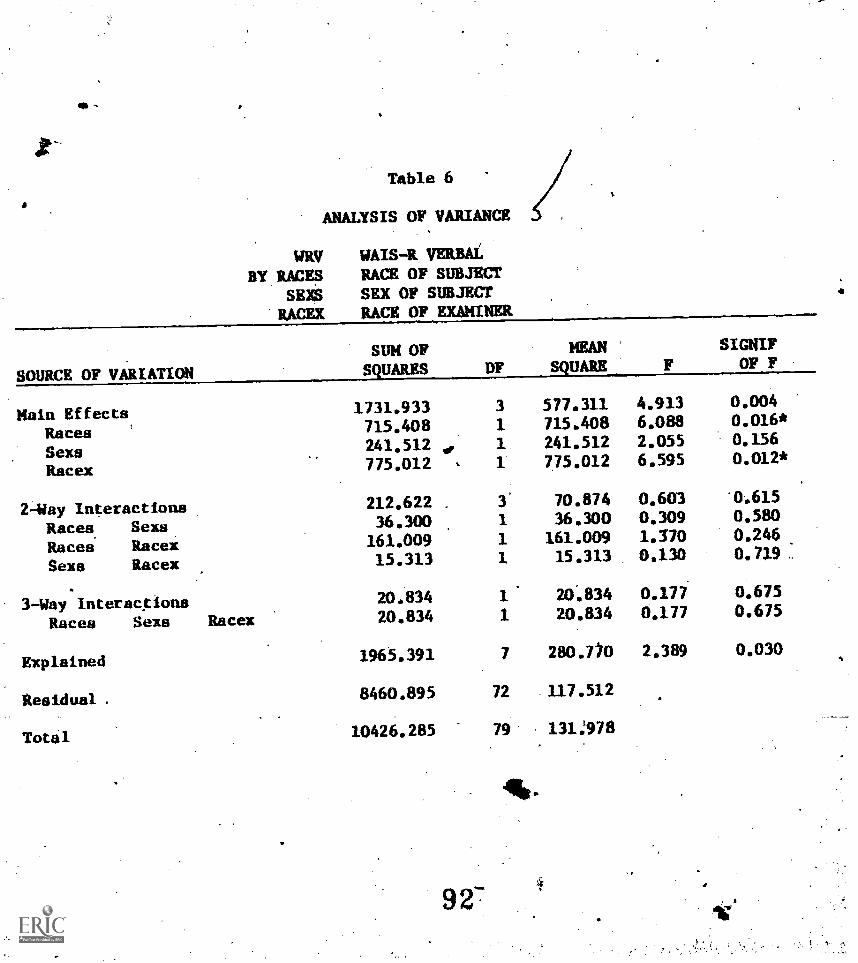
S.
Table 6
ANALYSIS OF VARIANCE
WRVBY RACES
SE] S
'RACEX
WAIS-R VERBAL.RACE OF SUBJECTSEX OF SUBJECTRACE OF EXAMINER
SOURCE OF VARIATION
SUM OFSQUARES DF
MEANSQUARE F
SIGN!.?
OF F
Main Effects,
Races
1731.933715.408
3
1
577.311715.408
4.9136.088
0.0040.016*
Sexs 241.512 of 1. 241.512 2.055 0.156
Racex 775.012 1 775.012 6.595 0.012*
2-Way Interactions 212.622 . 3' 70.874 0.603 0.615
Races. Sexs 36.300 1 36.300 0.309 0.580
Races Racex 161.009 1 161.009 1.370 0.246
Sexs Racex 15.313 1 15.313 0.130 0.719"
3-Way Interactions 20.834 1 20.834 0.177 0.675
Races Sexs Racex 20.834 1 20.834 0.177 0.675
Explained 1965.391 7 280.7,0 2.389 0.030
Residual . 8460.895 72 117.512
Total 10426.285 79 131:978
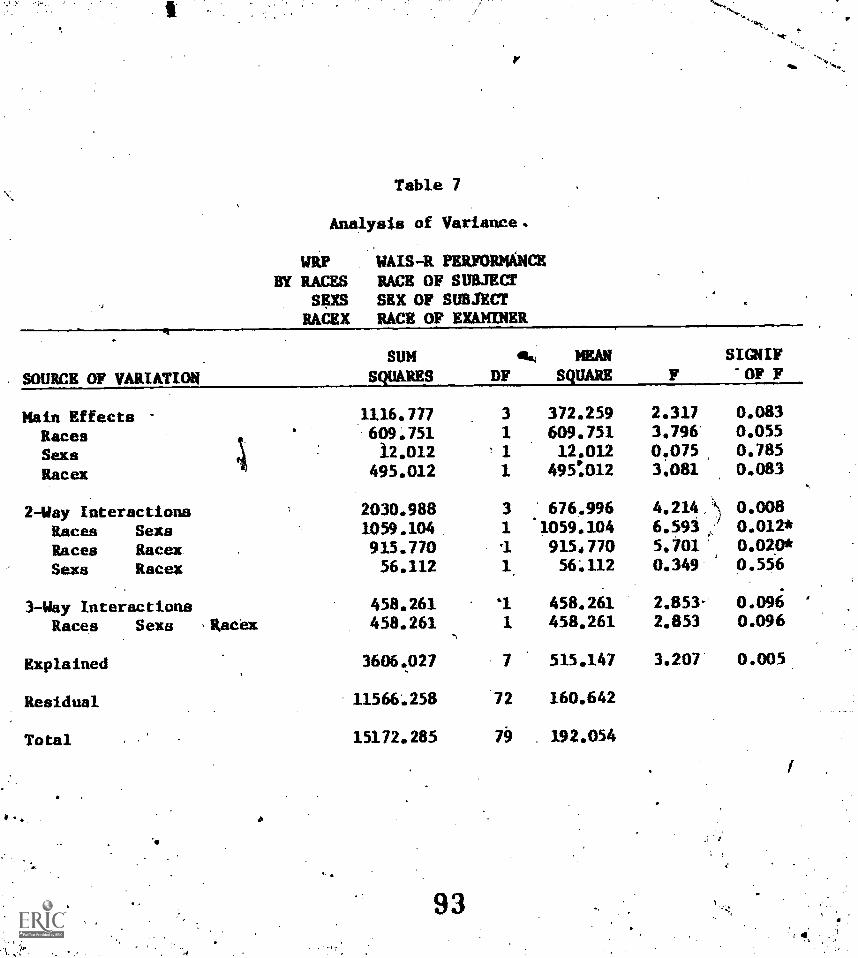
.
.
Table 7
Analysis of Variance.
WRP WAIS-R PERFORMANCEBY RACES RACE OF SUBJECT
spcs SEX OF SUBJECTRACEX RACK OF EXAMINER
SOURCE OF VARIATION
SUM
SQUARES DFea. MEAN
, SQUARE FSIGNIF
OF F
Main Effects 1116.777 3 372.259 2.317 0.083
Races 609,751 1 609.751 3.796' 0.055
Saxe 12.012 ' 1 12.012 0.075 0.785
Racex 495.012 1 495:012 3.081 0.083
2-Way Interactions 2030.988 3 676.996 4.214, 0.008
Races Sexs 1059.104 1 1059.104 6.593 0.012*
Races Racex. 915.770 -1 9154 770 5.701 0.020*
Sexa Racex 56.112 1 56:112 0.349 0.556
3-Way Interactions 458.261 "1 458.261 2.853- 0.096
Races Sexa 'Racer 458.261 1 458.261 2.853 0.096
Explained 3606.027 7 515.147 3.207. 0.005.
Residual 11566.258 72 160.642
Total 15172.285 79 . 192.054
93
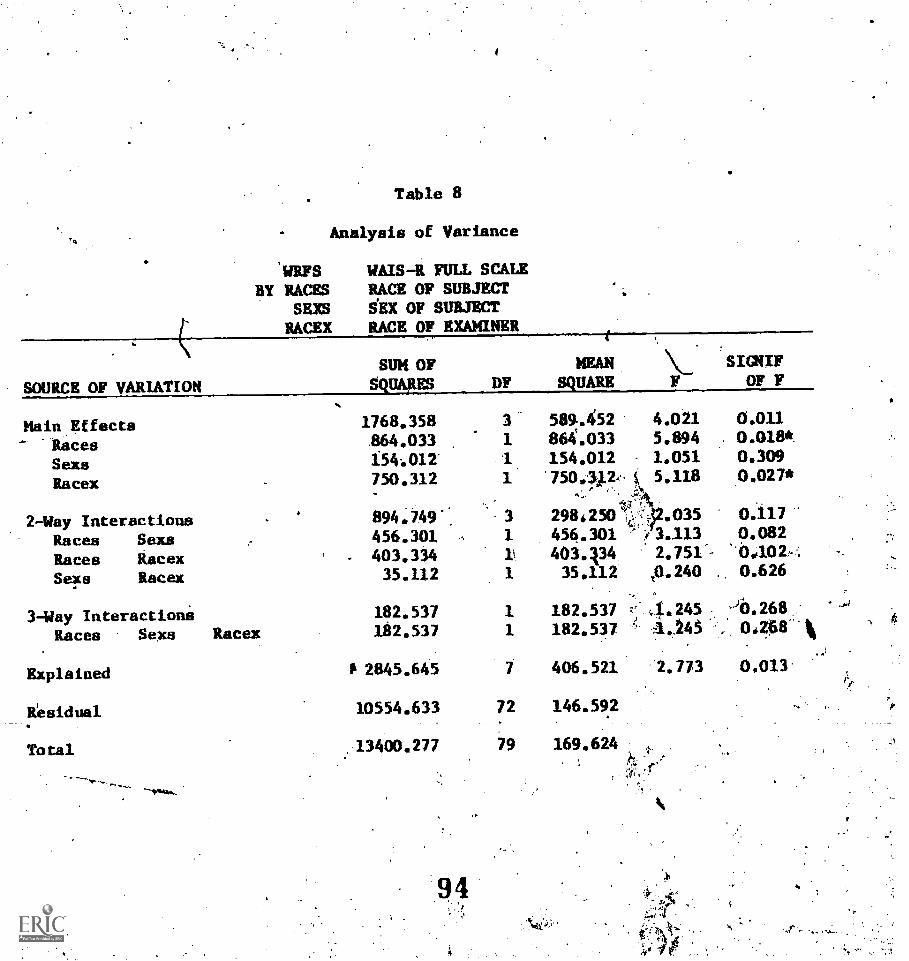
Table 8
Analysis of Variance
WRFSBY RACES
SEXSRACEX
WAIS-R FULL SCALERACE OF SUBJECTSEX OF SUBJECTRACE OF EXAMINER
SOURCE OF VARIATION
SUM OFSQUARES DF
Main Effects-Races
1768.358164.033
3
1
Seas 154:012' I
Racex 750.312 1
2-Way Interactions 894.749 3
Races Seas 456.301 1
Races Racex 403.334
Seas Racex 35.112 1
3-Way Interactions 182.537 1
Races Seas Racex 182.537
Explained 2845.645 7
Residual 10554.633 72
Total 13400.277 79
MEAN
SQUARE
SIGNIFOF F
589.452 4.021
864.033 5.894154.012 1.051750.42.-
S5.118
298250j2.035456.301 ,e 3.113
403.134.35.112 ,0.240
182.537 A.245182.537 4445
406.521
146.592
169.624
2.773
0.0110.018*0.3090.027*
0.1170.082
0.626
'36.268
0.248
0.013-
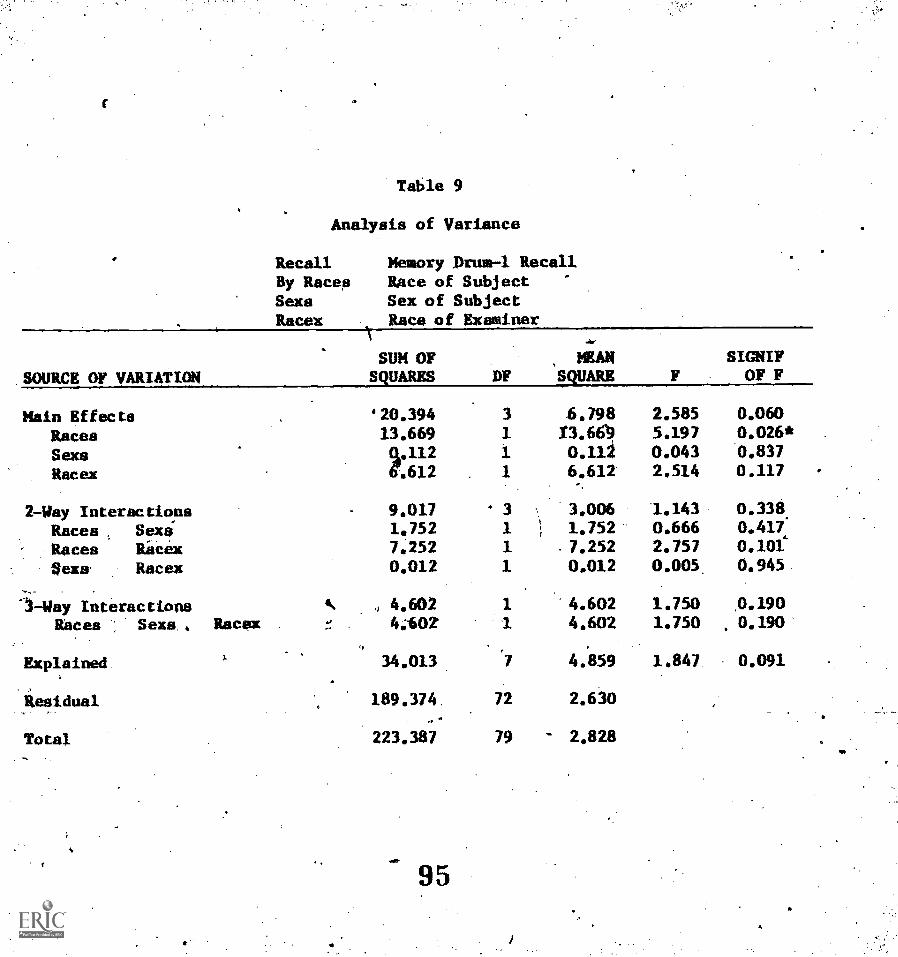
Table 9
Analysis of Variance
RecallBy RacesSemiRacer
.SOURCE OF VARIATION
Memory Drum-1 RecallRace of SubjectSex of SubjectRace of Examiner
SUM OFSQUARES
Main EffectsRacesSeraRaces
2-Way InteractionsRaces SemiRaces Rime.*
Use. Racer
1-Way InteractionsRaces Sexa, Race[
Explained.
Residual
Total
'20.39413.669
67112.612
9.0171.7527.2520.012
4.6024:602
34.013
189.374
223.387
95
AFMAN
SQ7ARE FSIGNIFOFF
31
1
4.79813.6690.111
2.5855.1970.043
0.0600.026*0.837
1 6.612 2.514 0.117
3 3.006 1.143 0.3381.752 0.666 0.417
1 .7.252 2.757 0.1011 0.012 0.005. 0.945.
1 4.602 1.750 S41904.602 1.750 0.19D'
7 4.859 1.847 0.091
72 2.630
79 2.828
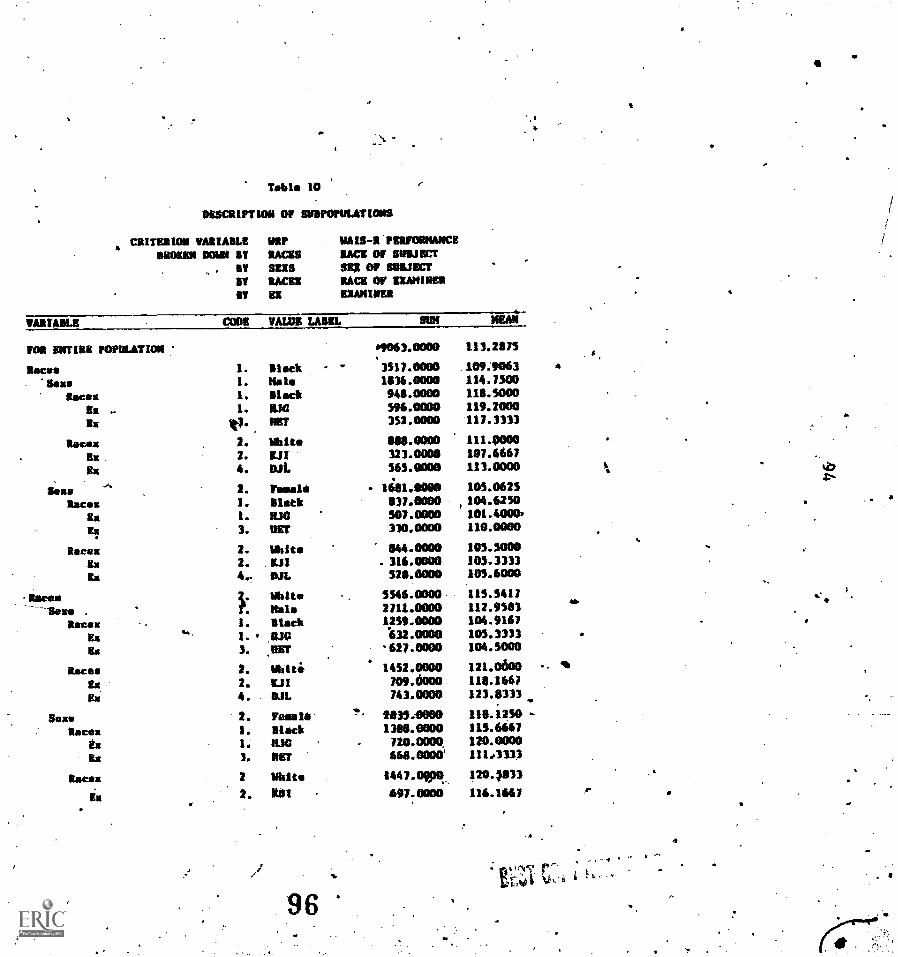
1.
Table 10
DESCRIPTION Of sumrormataus
CRITERION VARIABLE URP WINS -RIERFORNANCERUMEN DONN IT RACES RACE Of SUDJECT
AT SUS SEE OF SMELTST RACER RACE Of WHIMSIT ES EXAMINER
VARIABLE COOS VALUE LABEL SUN WEAR
TOR ENTIRE POPULATION 09063.0000 111.2075
Races 1. Slack ' 3517.0000 109.9063
'Sass 1. NMI. 1136.0000 114.7500
Races 1. Black 941.0000 111.5000
Ex . 1. RAO 596.0000 119.2000
Ex Al2. RET 312.0000 117.3333
Rees 2. Mita 111.0000 111.0000
Ex 2. gil 323.0000 107.6667
Ex 4. DAL 565.0000 113.0000
Saxe "" 2. fol* 141.00e0 105.0625
Rays* 1. Blatk 037.0000 104.6250
Ex 1. 0.10 507.0000 101.4000
F., 3. UST 310.0000 110.0000
Racal' 2. White 844.0000 105.5000
Ex 2. EJI 316.0000 105.3333
Ex 4.. DAL 528.0000 105.6000
Rama . Malta 5546.0000 115.5417 a
Dews .
. f. Nal* 2711.0000 112.9583
**cox 1. Black 1259.0000 104.9167
Ex44 1. WO sum= 105.3333
Eye 3. UNT .627.0000 104.5000
Ragan I. Nhlt.
1452.0000 121.0600
Ex 2. CAI 709.6000 118.1667
Ex 4. SAL 743.0000 123.8333
.Saxe 2. Pamela 1135.0000 111.1250
%ace* 1. Black 1311.0000 115.6667
Ex 1. TUC 720.0000 120.0000
Ex 3. BET 668.0000' 111.413)
Race* 2 Otto 1447.0100 120.1033
Ex 2. Ott 197.0000 116.1117
iw. r-
96
4
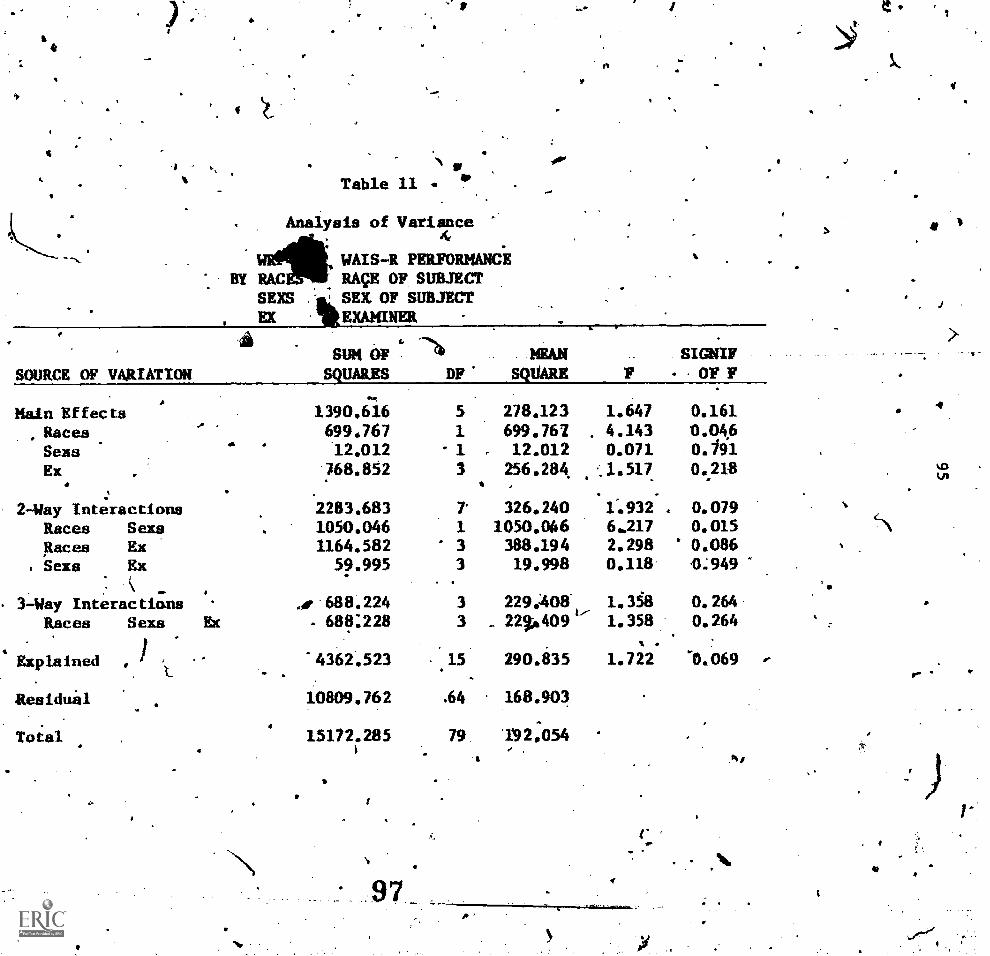
p.
SOURCE OF VARIATION
A
Main EffectsRacesSeasEx
a
2-Way InteractionsRaces SexsRaces ExSens Ex
3-Way InteractionsRaces Seim
Explained
Residual
Total
1 wTable 11 IR
Analysis of Variance
WAIS-R PERFORMANCEBY RAC RACE OF SUBJECT
SEXS AL SEX OF SUBJECTEX TR EXAMINER
sum OF .SQUARES DP
MEWSQUARE F
SIGNIFOF F
1390.616 5 278.123 1.647 0.161699.767 1 699.761 4.143 0.04612.012 1 , 12.012 0.071 0.91
768.852 3I
256.284,
.1.517 0.218
2283.683 7' 326.240 1,932 . 0.0791050.046 1 1050.066 6..217 0.0151164.582 3 388.194 2.298 0.086
59.995 3 19.998 0.118 L949
Ar 688.224 3 229.:408. 0.264Ex - 688:228 3 22%.409 1.358 0.264
4362.523 15 290.835 1.722. `0.069
10809.762 .64 168.903
15172.285 79 '1'92.054I
1
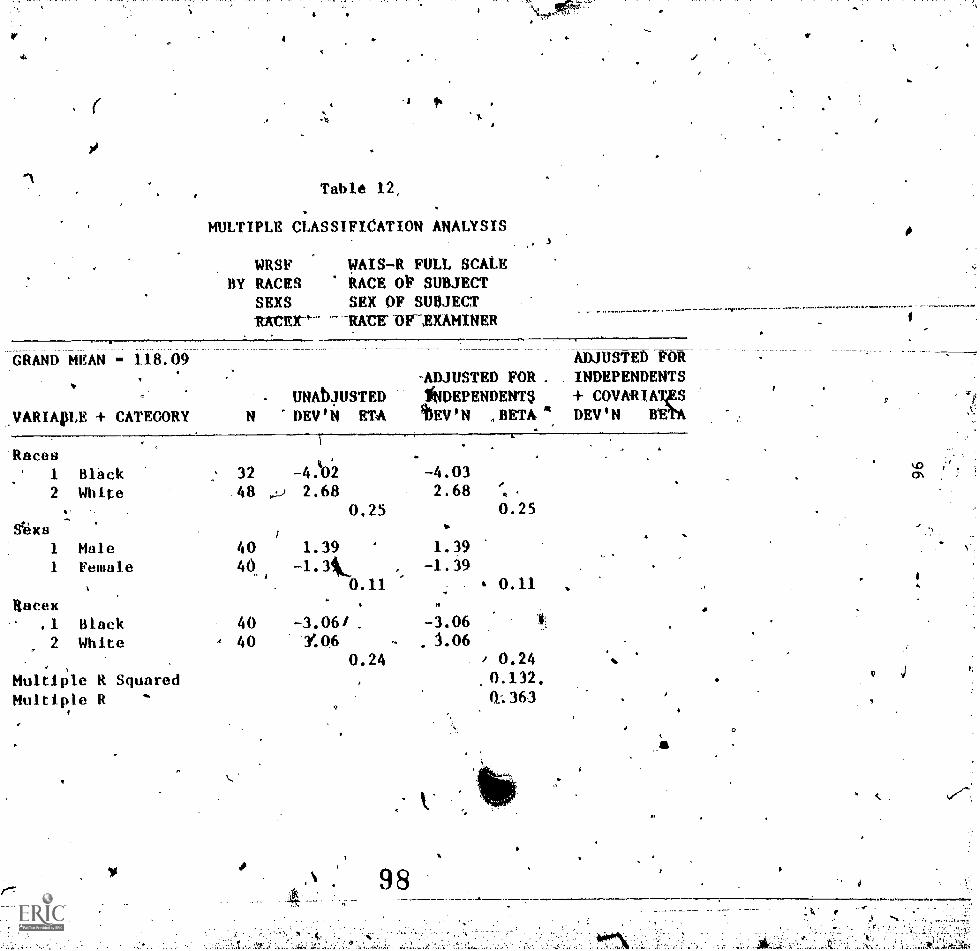
.1
Table 12,
IP%
MULTIPLE CLASSIFICATION ANALYSIS
WRSF WAIS-R FULL SCALEBY RACES RACE OP SUBJECT
SEXS SEX OF SUBJECTurn- RACE OF-,EXAMINER
GRAND MEAN - 118.09
VARIAVE CATEGORY N- UNADJUSTED'DEV'N ETA
-ADJUSTED1NDEPENDENT$bEV'N
ADJUSTED POEFOR . INDEPENDENTS
+ COVAEIAVS,BETA 4 DEV'N Btt*
'Races
1 Black 32 -4.402 -4.03
2 White .48 y 2.68 2.68 '.,
0,25 0.25
Saxe1
1 Male 40 1.39 1.39
1 Female 40 , -1.390.11 0.11
Racex 0
.1 Black 40 -3.06/ -3.062 White , 40 1:06 b J.06
0.24 0.24
Multiple R SquaredMultiple R
.0.132,
Q.363
it
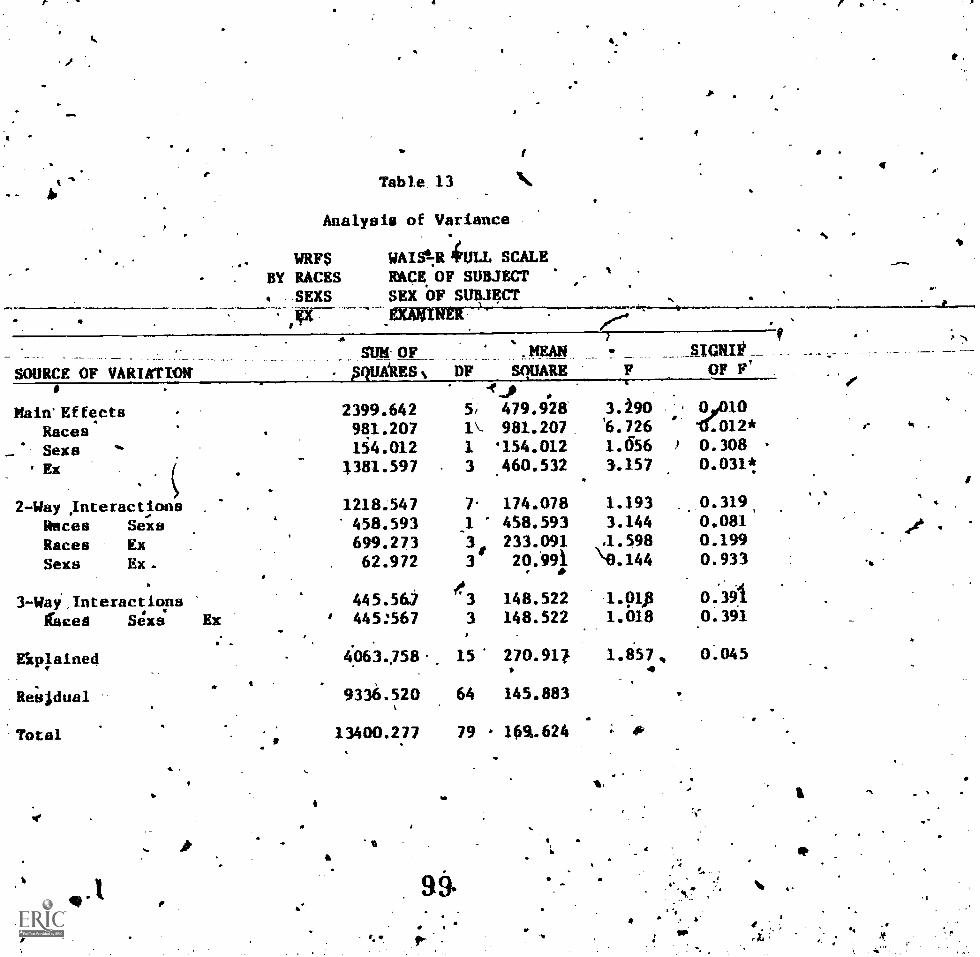
Table 13 *1/4
Analysis of Variance
a
WRF$ WAIStRit'ULL SCALE
BY RACES 'mpg OF SUBJECTSEXS SEX OF SUBJECT
. ,pr--
,SOURCE OF VARIATION
SIDI OFOF
MEANSTARE
___.
F___
OF F'
.
Main' Effects 2399.642 5' 479.928 3.190 ' 01.010
Races 981.207 1\- 981.207 '6.726 tr.012* 1'
_ Sexs 154.012 1 '154.012 1.656 0.308
Ex 1381.597 3 3.157 0.031*460.532
t
2-Way Interactionsbraces Sexs
1218.547458.593
71
174.078458.593
1.1933.144
0.319,0.081
Races Ex
Sexs Ex.
699.27362.972
3
3
233.09120.491 "0.144
0.1990.933
A
3-Wai,Interactions 445.50 '3 148.522 1.01p 0341Gees S4xs Ex 445:567 3 148.522 1.018 0.391
Elplained 063.,758 15 270.91 1.i57, 0.045
Residual 9336.520 64 145.883
Total 13400.277 79 169.624 .
Act ."
a
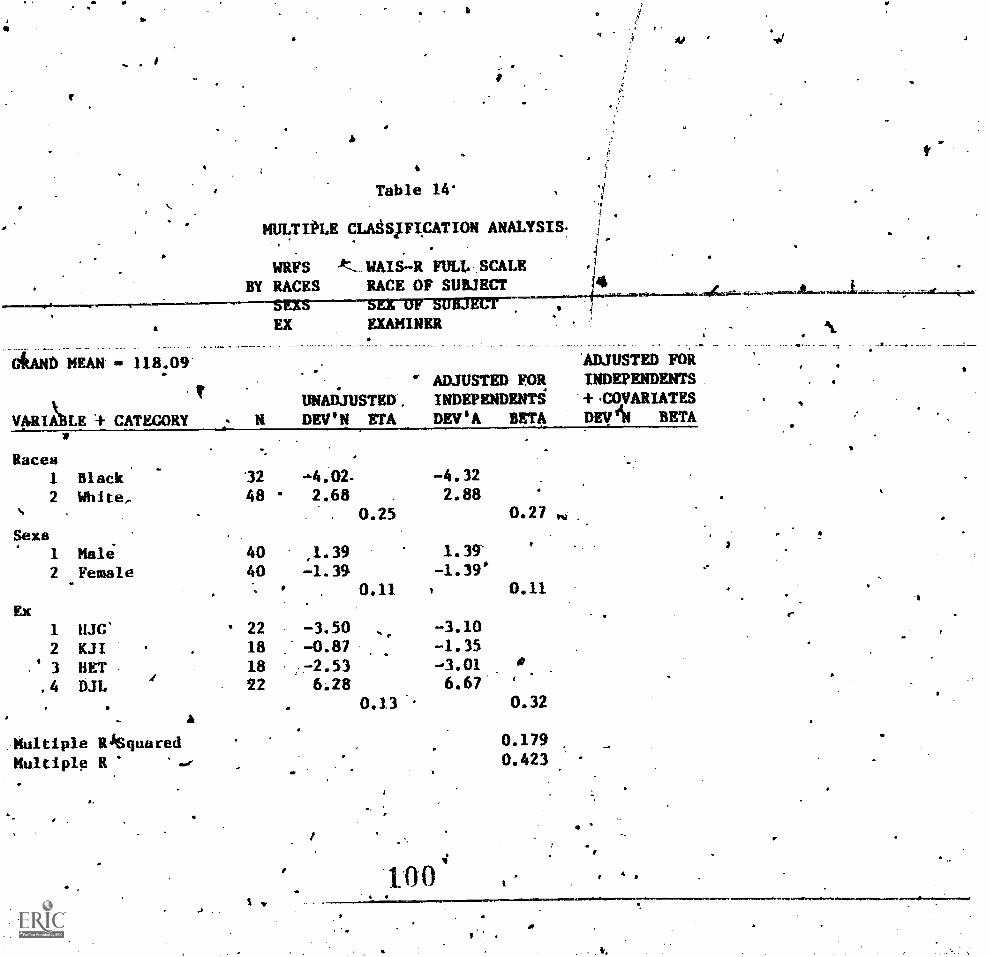
t
darn) MEAN ... 118.09
IP
A
4
Table 14
MULTIiLE CLASUFICATION ANALYSIS:
WRFS At-WAIS-R FULI,SCALEBY RACES RACE OF SUBJECT
EX EXAMINER
ADJUSTED FORADJUSTED FOR INDEPENDENTS
UNADJUSTED . INDEPENDENTS + COVARIATES
VARIBLE 4 CATEGORY DEV'N ETA DEV'A BETA Dreii BETA
Races1 Black 32 -4.02- -4.32
2 White, 48 a 2.68 . 2.880.25 0.27 .t
Seam1 Mal 40 ,1.39 1.39'
2 Female 40 -1.39 -1.39'
' . 0.11 0.11Ex 4"
1 M. 22 -3.50 -3.10
2 KJI 18 -0.87 -1.35
.4 3
,4
HETDIL
I18
22-2.536.28 6.67
Multiple RiSquaredMultiple R
a
awe
1.
0.13
100
0.32
0.1790.423
....pfa4
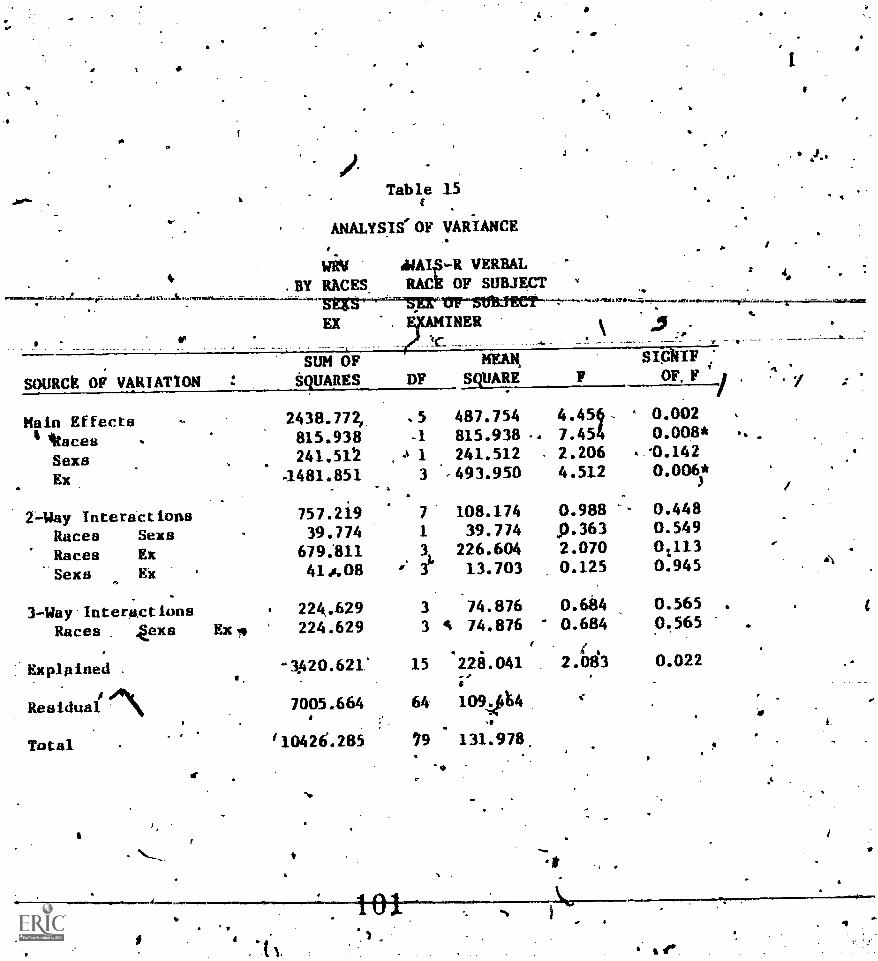
Dr
4
I
Table 15f
ANALYSIS'OF VARIANCE
WRY Autp-R VERBAL.BY RACES RACk OF SUBJECT
*se forkStralter,. . .k1 r aaSe s.1% resru I
EX EXAMINERP
SOURCE OF VARIATIONa
SUM OFSQUARES DP
MEANSQUARE F
SWIM?OF, F
Main Effects6 'times
2438.772,
815.938.5-1
487.754815.938 .
4.4527.45
0.0020.008*
Sexs 241.512 1 241.512 2.206 . 3.142
Ex .1481.851 3 ,493.950 4.512 0.006*
2-Way Interactions 757.219 7 108.174 0.988 0.448
Races Sexs 39.774 1 39.774 j3.363 0.549
Races Ex 679.'811 3 226.604 2.070 0;113
Sexs EX 41.1408 13.703 0.125 0.945
3-Way-Interactions 224.629 3 74.876 0.684 0.565
Races ;Sexs F.X 224.629 3 4 74.876 0.684 0.565
2211.04141 A
Explained -1420.621' 15 2.083 0.022
di^Residual 7005.664 64 109.is14
f.
410
Total 110426%285 79 131.978,
t
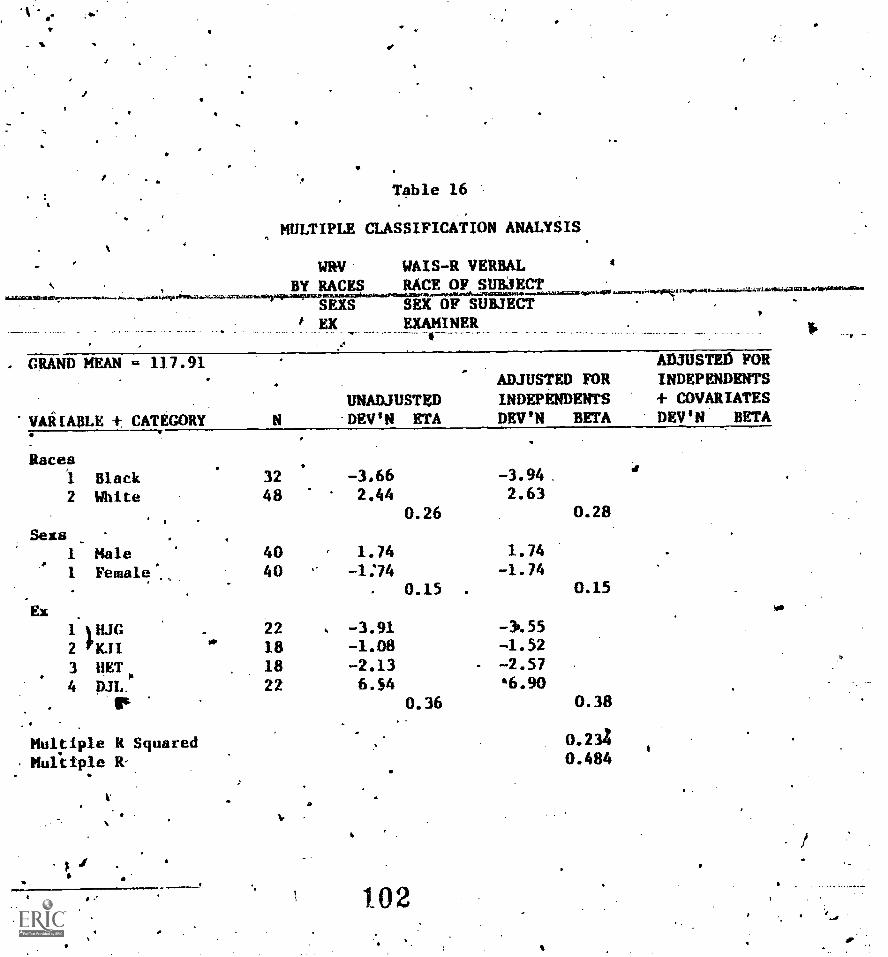
1'
I
Table 16
MULTIPLE CLASSIFICATION ANALYSIS
WRV. WAIS-R VERBAL 4
BY RACES RACE OF SUBJECTOF SaraE STX UBJECT
1 EX EXAMINER
. GRAND MEAN c. 117.91
'VAA1ABLE + CATEGORYUNADJUSTED-DEV'N ETA
ADJUSTEn FORADJUSTED FOR INDEPENDENTSINDEPENDENTS + COVARIATESDEV'N BETA DEV'N BETA
Races1 Black2 White
Sexs1 Male1 Female._
Ex1 1HJG2 'In3 NET,4 p.m.
Multiple R SquaredMultiple R.-
v
32
48-3.662.44
-3.94 .
2.630.26 0.28
40 1.74 1.74
40 -1:74 -1.740.15 . 0.15
to
22 . -3.91 -30.55
18 -1.08 -1.5218 -2.13 -2.57
22 6.54 6.900.36 0.38
0.23Z0.484
102
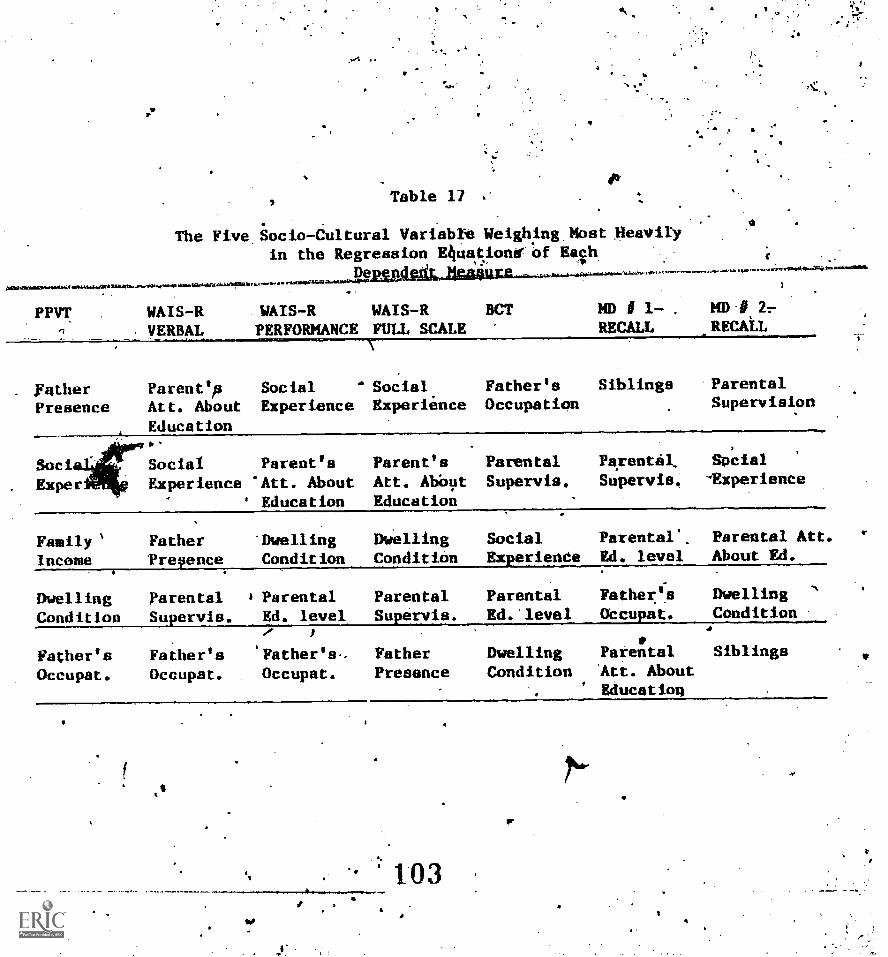
VW
41 fa
I v. . ,4 'N s
Table 17
The Five.Socio-Cultural Variable Weighing. Most Heavilyin the Regression E4uationeOf Each
VelraVkIliViaMtiittleVi.dfegiV014.Msafteit/iM 4.111010a1.11,64. 111 t,rao. v4tIMPV
PPVT
. FatherPresence
WAIS-RVERBAL
ParentAtt. AboutEducation
Soci
Exper
FamilyIncome
DuellingCondition
Father'sOccupat.
WAIS -R WAIS-R BCTPERFORMANCE FULL SCALE
MD # 1 -
RECALLMD #RECALL
Social Social Father's Siblings
Experience Experience OccupationParentalSupervision
Social Parent's Parent's Parental Parental, Social
Experience 'Att. About Att. About Supervis. Supervis. 'Experience
Education Education
Father 'Dwelling Dwelling Social Parental'. Parental Att.
Preqence Condition Condition Experience Ed. level About Ed.
Parental Parental Parental Parental Father's Dwelling
Supervis. Ed. level Supervia. Ed. level Occupat. Condition
Father'sOccupat.
Father's,Occupat.
FatherPresence
DwellingCondition
Parental'Att. About
Siblings
Education
f
a
- 103
4.
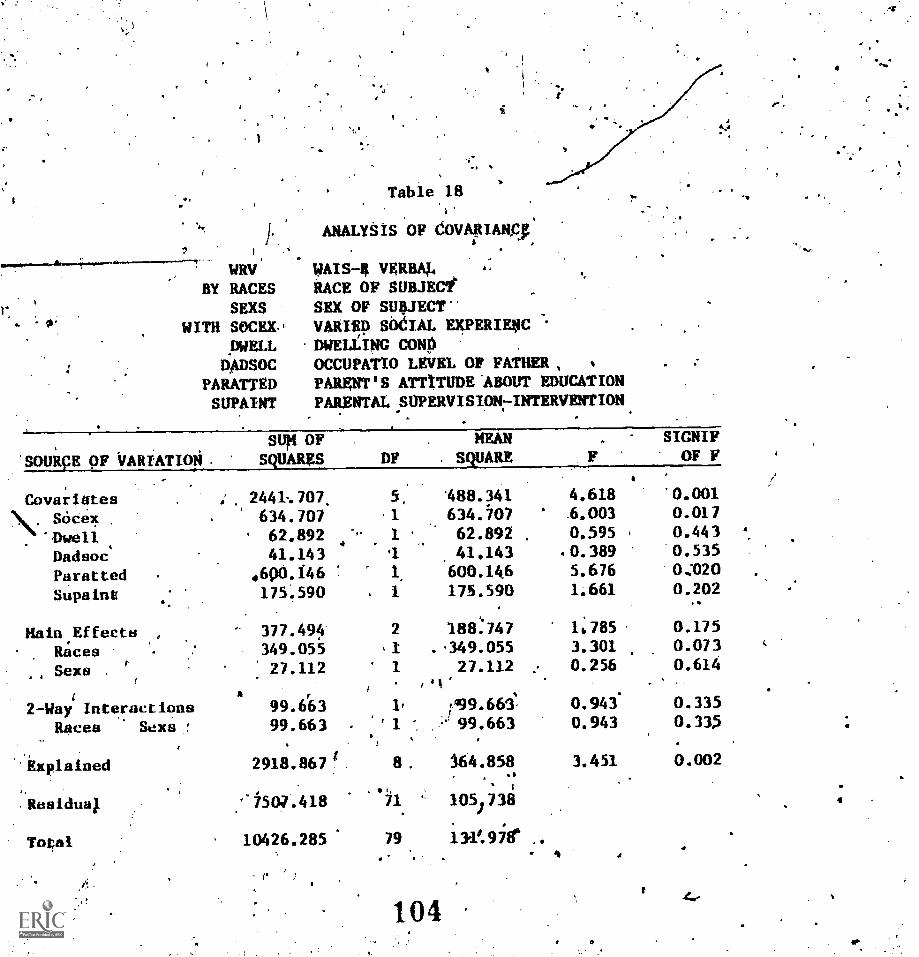
)
WRVBY RACES
SEXSWITH SOCE1C
DWELLDADSOC
PARATTEDSUPA/NT
"
Table 18
ANALYSIS OF dOVARIANg,
WAIS-# VERBALRACE OF SUBJECT'SEX OF SUBJECTVARIED SOdIAL EXPERIENCDWELLING CONpOCCUPATIO LEVEL OF FATHER,PARENT'S ATTITUDE 'ABOUT EDUCATION
PARENTALSOPERVISION7INTERVENTION
'SOURCE OF VARiATION
CovarittesSoCexDwellDadsoc'
ParattedSupaint
Hain .EffectsRacesSexs 't
2-Way InteractionsRaces Sexs
:Explained
Residual
Total
Stitt OF
SQUARES
. 2441-.707,
634.70762.89241.143
4600.146175.590
,
377.494'
349.05527.112
99.6'63
99.663
2918.867'
DFMEAN
squARE FSICNIFOF F
5, 488.341 4.618 '0.001
4."
11
634.70762.892
.6.003
0.595
0.0170.443 a
'1 41.143 .0.389 0.535
1, 600.146 5.676 0:020
1 175.590 1.661 0.202
2 188:747 1;785 0.175
I .449.055 3.301 0.073
1 27.112 0.256 0.614. ,ii
1, =.499.66i 0.943 0.335
'' 1 99.663 0.943 0.335
8. A64.858.
3.451 0.002
71 105 738
79 134:978
.7507.418
10426.285
p
104t
.
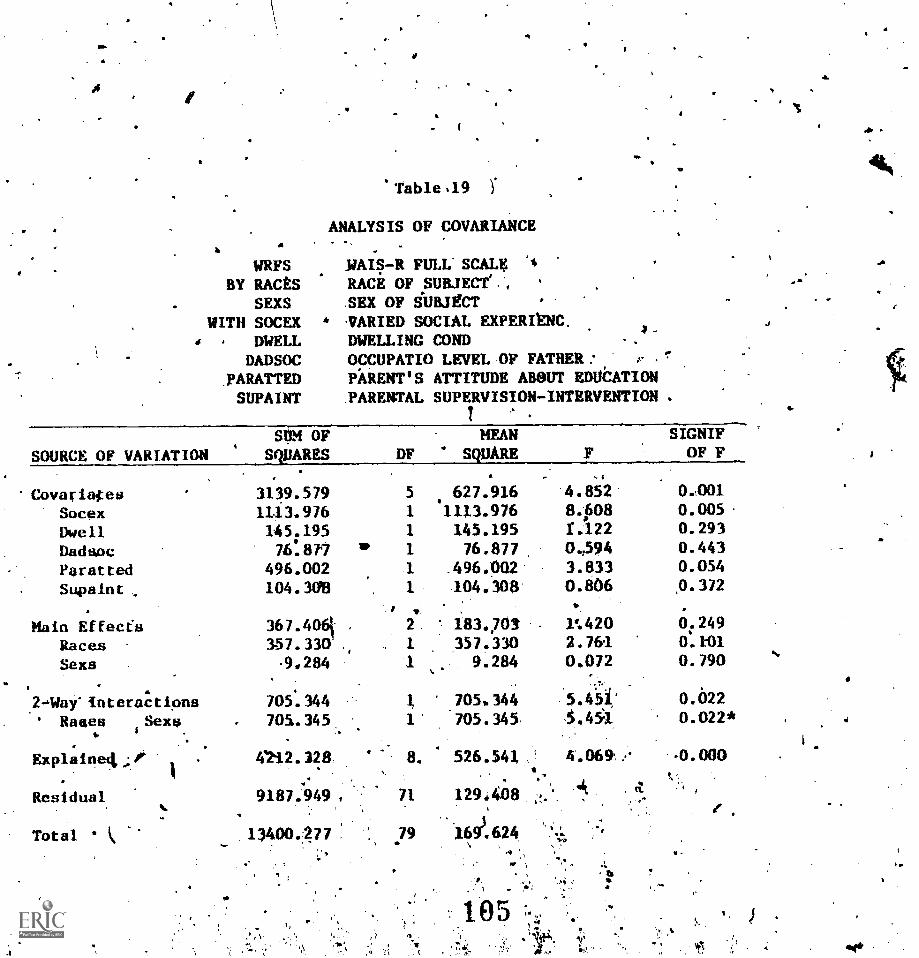
WRFSBY RACES
SEXSWITH SOCEX
DWELL
DADSOC
PARATTEDSUPAINT
SOURCE OF VARIATION
Covari4esSocexDwellDadaticParattedSuva Int
Main EffectsRacesSexs
42.-Way." Interactions' Rases Sexs
Explained P
Residual.
Total
f
Table .19 V
ANALYSIS OF COVARIANCE
i/AIR FULL scALg ti
RACE OF SUBJECT' .
.SEX OF SUBJeCTVARIED SOCIAL EXPERIY24C.DWELLING COND
4
OCCUPATIO LEVEL OF FATHERPARENT'S ATTITUDE ABOUT EDUCATION
.PARENTAL SUPERVISION-INTERVENTION .
Sice4 OFSNARLS DF
MEAN
SQUARE
SIGNIFOF F
3139.579 5 627.916 4.852 0.00111.13.976 1 111,3.976 8408 0.005145.195 1 145.195 1.122 0.293
7618T1 aro 1 76.877 0,594 0.443496.002 1 .496.00.2 3.833 0.054104.30'8 1 104.308 0.806 .0. 372
367.404 2 183.703 1;420 0.249357.330' 1 357.330 2.761 0. 1-01
9, 284 1 9.284 0.072 0. 790
705. 344 705.344 5.451.* 0.022705. 345 1 705. 345 0.022*
47`12.328, 8. 526 .541. 4.069'. . -O. 000
.-9187.949 , 71 129.408 Cr-
e'
134004.77 . .79 2693.624 ' e
4Ins
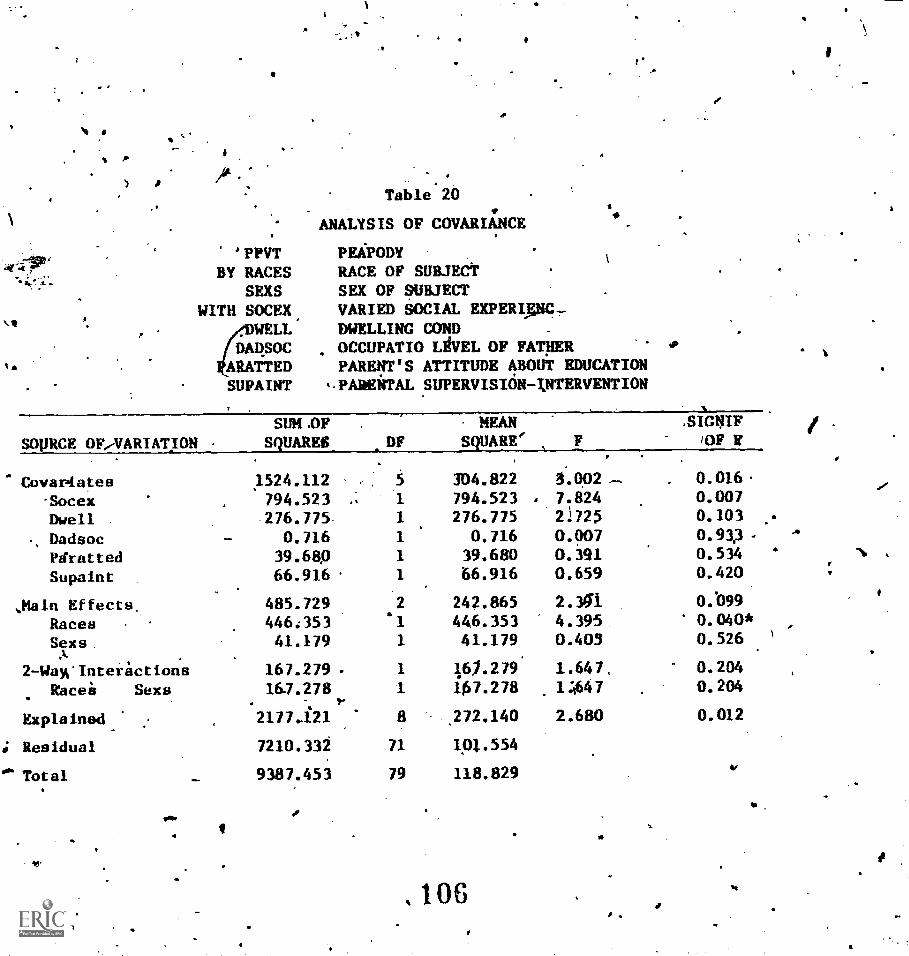
P
)
'PPVTBY RACES
SEXSWITH SOCEX,
(DADSOC
WELL
ARATTEDD
SUPAINT
Table 20
ANALYSIS OF COVARIANCE
PEAPODYRACE OF SUBJECTSEX OF SUBJECTVARIED SOCIAL EXPERI60,.DWELLING CONDOCCUPATIO LgVEL OF FATHERPARENT'S ATTITUDE ABOUT EDUCATION
.PARENTAL SUPERVISION-INTERVENTION
SOURCE OF, - VARIATION
SUM .OF
SQUARES_ DFMEAN
SQUARE'
.SIGNIF/OF
Covar4ates 1524.112 5 304.822 3.002 0.016-Socex 794.523 1 794.523 7.824 0.007
Dwell 276.775- 1 276.775 21725 0.103
Dadsoc _ 0.716 1 0.716 0.007 0.913 -
Pdratted 39.640 1 39.680 0.391 0.514
Supaint 66.916 1 66.916 0.659 0.420
,Main Effects. 485.729 2 242.865 2.341 0.099
Races 446.353 '1 446.353 0.040*
Sexs 41.179 41.179 0.403 0.526
2-Way,'Interiactions
Races Sexs167.27916.7.278
1
1
16/.279107.278
1.647,1:1047
0.2040.204
Explained 2177..121 8 272.140 2.680 0.012
; Residual 7210.332 71 1101.554
Total 9387.453 79 118.829
106
I.
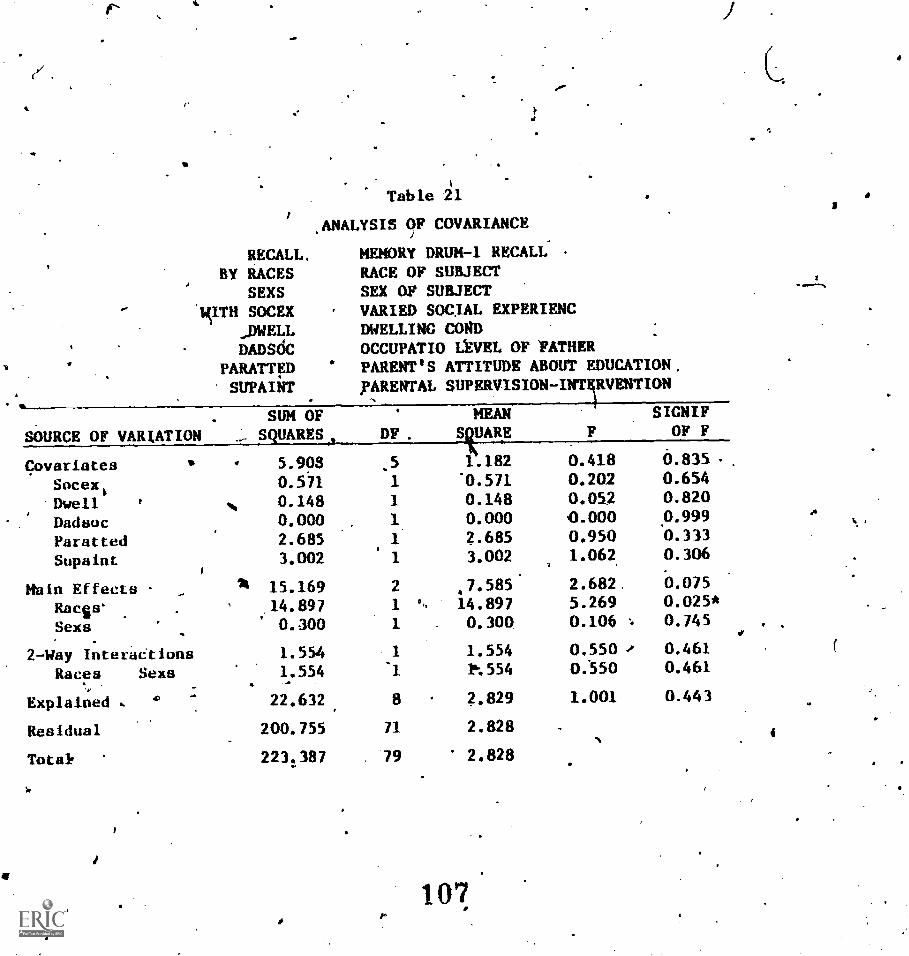
RECALL,BY RACES
SEXSSOCEX
;DWELLDADS&
PARATTRSUPAINT
so'
Table 21
ANALYSIS OF COVARIANCE
MEMORY DRUM-1 RECALLRACE OF SUBJECTSEX OF SUBJECTVARIED SOCIAL EXPERIENCDWELLING CORDOCCUPATIO LEVEL OF FATHERPARENT'S ATTITUDE ABOUT EDUCATION,PARENTAL SUPERVISION -INTD RVENTION
)
SOURCE OF VARIATIONSUM OFSQUARES, DF.
MEANSQUARE F
SIGNIFOF F
Govariates 5.908 .5 1.182 0.418 6.835
Socex, 0.571 1 '0.571 0.202 0.654
Dwell 0.148 1 0.148 0.052 0.820
Dadsoc 0.000 1 0.000 +0.000 0.999
Paratted 2.685 1 2.685 0.950 0.333
Supaint 3.002 1 3.002 1.062 0.306
Wain Effects 15.169 2 .7.585' 2.682 0.075
Races' 14.897 1 8, 14.897 5.269 0.025*
Sexs 0.300 1 0.300 0.106 0.745
2-Way InteraCtions 1.554 1 1.554 0.550 0.461
Races Sexs 1.554 1 t..554 0.550 0.461
Explained 22.632 8 2.829 1.001 0.443
Residual 200.755 71 2.828
Total! 223.387 79 2.828
1
1'
107,
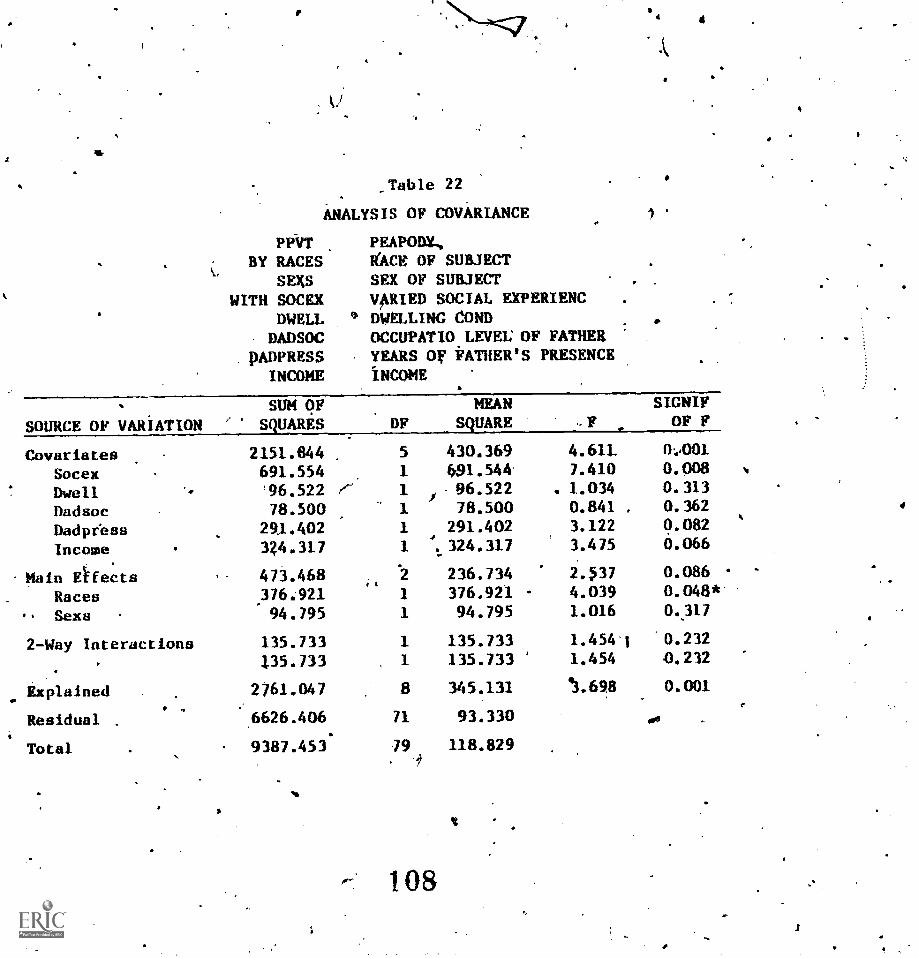
4
lir
*Table 22
ANALYSIS OF COVARIANCE
PPVT PEAPODX,BY RACES RACE OF SUBJECT
SEXS SEX OF SUBJECT
WITH SOCEX VARIED SOCIAL EXPERIENCDWELL e' DWELLING conDADSOC OCCUPATIO LEVEL OF FATHER
pADPRESS YEARS OV FATHER'S PRESENCE
INCOME INCOME
4
SUM OF MEAN SICKLY
JRCE"VARIAISMJARES........-.MW.- .
CovariatesSocexDwell -.
DadsocDadpressIncome
. .
Main Eifects .
Races.. Sexes
2-Way Interactions
Explained. .
Residual .
Total
2151.844691.554'96.52278.500
291.402344.317
473.468376:92194.795
135.733135.733
2761.047..
6626.406.
. 9387.453
ri-
5
1
1
1
1
1
2
1
1
1
1
8
71
79
430.369691.544.96.52278.500
291.402324.317
236.734376.92194.795
135.733135.733
345.131
93.330
118.829
-
4.611.
7.410. 1.0340.841 ,
3.1223.475
2.374.0391.016
1.45411.454
.3.698
0..0001
0.0080.3130.3620.0820.066
0.0860.048*'
0.317
.0.2320.232
0.001
0
N
'
.
i
108
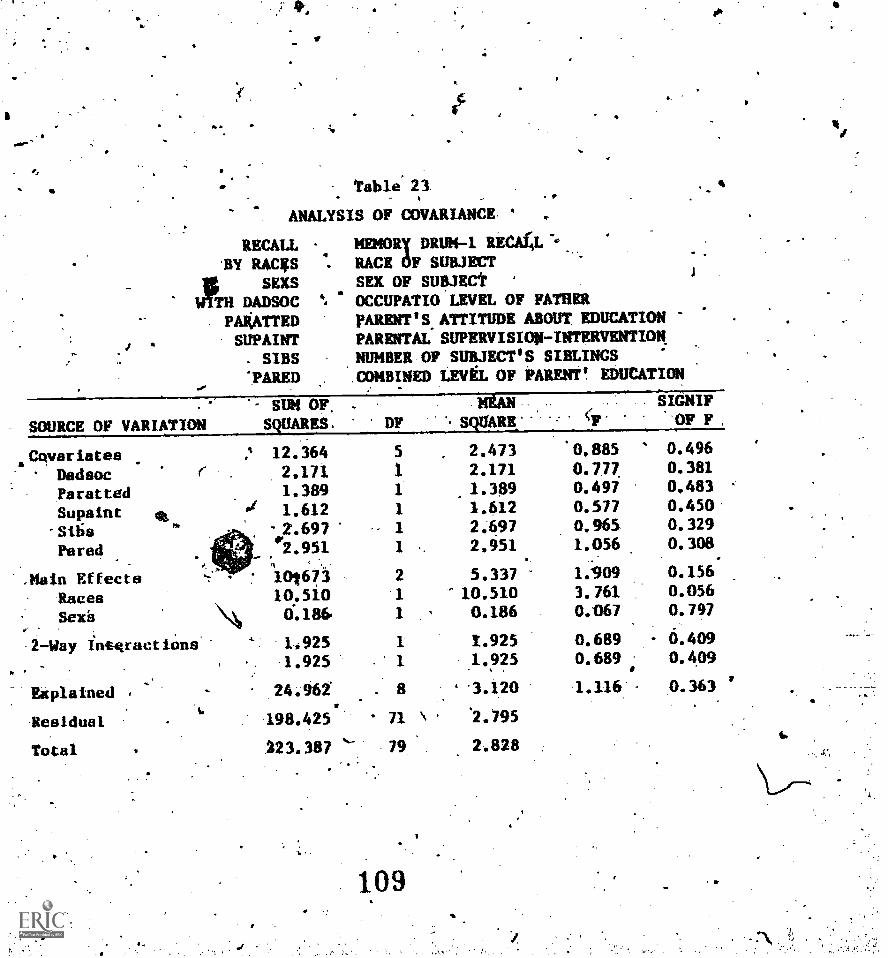
a
ft-a
Table. 23. 4
ANALYSIS OF COVARIANCE .
RECALLBY RACES
SEXSTH DADSOC
PAXATTEDSUPAINT
. SIBSPARED
re'
MEW3Ry DRUM-1 RECA4RACE OF SUBJECTSEX OF SUBJECTOCCUPATIO LEVEL OF FATHERPARENT'S ATTITUDE ABOUT EDUCATIONPARENTAL SUPERvisIM-INTERVENTION.NUMBER OF SUBJECT'S SIBLINGSCOMBINED LEVEL OF PARENT' EDUCATION
sum or.
= SOURCE OF VARIATION
CovariatesDadsocParattedSupa int
-S16sPored
,Hain EffectsRacesSexy
2-Way intgract ions
Explained
Residual
Total
squARss
12.3642.1711.389
1.6122.697
.2.95110167310.510
\\I 0.186.
1.925.1.925
24
198.425
123. 387
.
DF ' sqUARB:
5 2.4731 2.1711 1.3891 1.6121 2.6971 2.951
2 5.3371 10.5101 0.186
1 1.9251 1.925
.
8 .3.120
71 \ '2.795
`" 79 2.828
109
r.SICNIFOF F
0.885 0.4960.777. 0.3810.497 0.4830.577 0.4500.965 0.3291.056 0.308
1.909 0.1563.761 0.0560.067 0.797
0.689 6.4090.689 0.4091.116 0.363
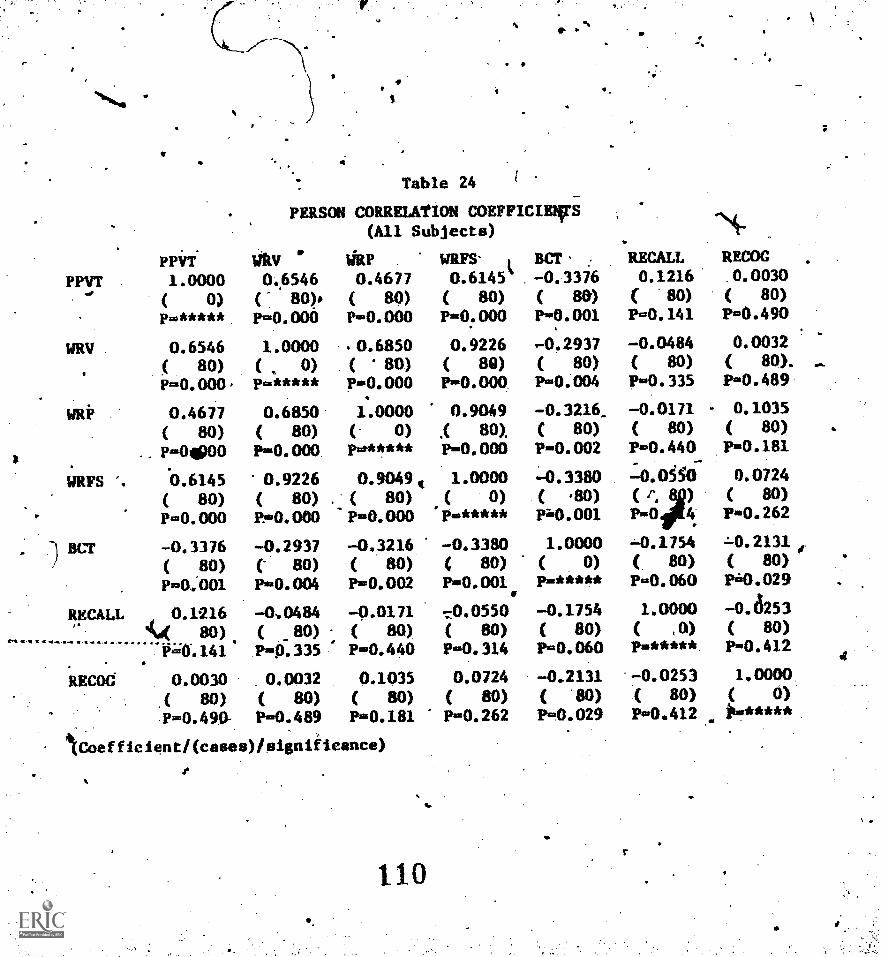
PPVTPPVT1.0000
( 0)p.*****.
WRV 0.6546( 80)P=0.000
WRi' 0.4677( 80)
.. P=04000
WRFS '. 0.6145( 80)P=0.000
BE.7 -0.3376( 80)
RECALL 0.1216e4k( 80)
i5=0..141
RECOG 0.0030,( 80)P=0.490.
4
Table 24 I
PERSON CORRELATION COEFFICIEIFS(All Subjects)
Ay0.6546
(- 80).p-o.two
1.0000( 0)pft*****
0.6850( 80)P=0.000
0.9226( 80)Ppo. 000
-0.2937(" 80)P=0.004
-0..0484( 80)P.9.335
0.0032( 80)P..0.489
HRP WRFS- BCT' RECALL RECOC
0.4677( 80)
0.6145%( 80)
-0.3376( 80)
0.121680)
.0.0030( 80)
P=0.000 P=0.000 P=0.001 P.00.141 P=0.490
0.6850 0.9226 -0.2937 -0.0484 0.0032( 80) ( 80) ( 80) ( 80) ( 80). ..P -0.000 P=0.004 P.0.335 P..0.489
1.0000 0.9049 - 0.3216. -0.0171 - 0,1035(- 0) ,( 80). ( 80) ( 80) ( 80)put*,*** P=0.000 P=0.002 P=0.440 P=0.181
0.9049 t 1.0000 -0.3380 -0.6SO 0.0724. ( 80) ( 0) ( '80)
(P=0.000 p.***** Pii0.001 L'd 2=0.r), 62
-0.3216 -0.3380 1.0000 -0.1754 2-0.2131( 80) ( 80) ( 0) ( 80) ( 80)P=0.002 P=0.001, p...sci*** P=0.060 P=.0.029
-0.0171 -z0.0550 -0.1754 1.0000 -0.13253( 80) ( 80) ( 80) ( .0) ( 80)P..0.440 P=0.314 P=0.060 1)..*****. P=0.412
0.1035 0.0724 -0.2131 -0.0253 1.0000,
( 80) ( 80) ( .80) ( 80) ( 0)P=0.181 P..0.262 P=0.029 P..0.412 tb.*****
/Coefficlent/(eases)/signlileance)
110
IN
r
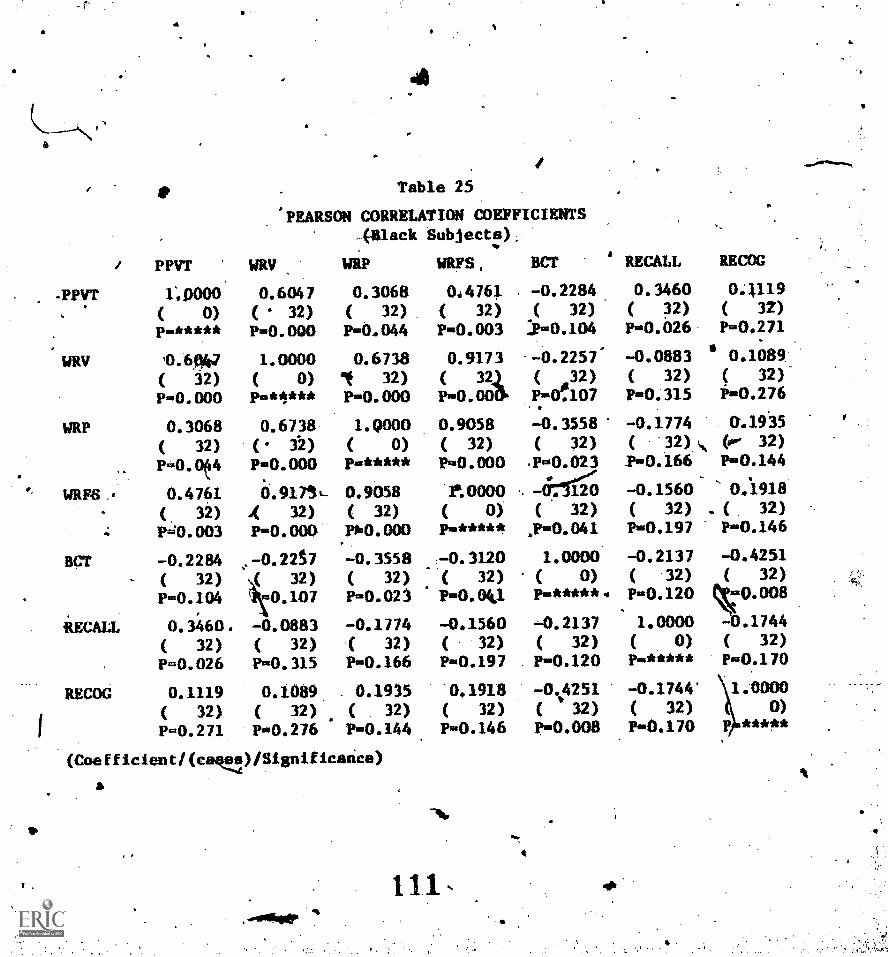
PPYT
-PPVT 1:0000( 0)p.m**
WRY 13.617( )2)
P=0.000
WRP 0.3068( 32)
P=0.004
WRFS 0.4761(. 32)
P=s0.003
BCT -0.2284( 32)
P=0.104
RECALL 0.3460.( 32)
P=0.026
RECOG 0.1119( 32)
P=0.271
4
Table 25
PEARSON CORRELATION COEFFICIENTS-481ack Subjects),.
WRY WRP WRFS,
0.6047 0.3068 044761
( 32) ( 32) ( 32)
P=0.000 P.0.044 P=0.003
1.0000 0.6738 0.9173( 0) lf 32) ( 32.1
P=***** P -0.000 P=0.000,
0.6738 1.Q000 0.9058
( 32) ( 0) ( 32)
P=0.000 P=***** P=0.000
6.917SL- 0.9058.( 32) ( 32)
P=0.000 P0.0.000
-0.2217 -0.3558
c32) ( 32)
0.107 P=0.023
-0.0883 -0.1774( 32) ( 32)
P=0.315 P=0.166
0.1089 0.1915( 32) ( 32)
P=0.276 P=0.144
(Coefficlent/(caqvp/SIgnalcace)
ltoopo( 0)pm*****
0.3120'( 32)
P=0.0kl
- 0.1560
( 32)
P=0.197
0.1918( 32)
P=0.146
1 11
BCT RECALL
-0.2284.
( 32)
:P=0.104
-0.2257'( 32)P=0.107
- 0.3558
( )2)
P=0.023
6750( 32)
P=0.041
1.0000( 0)P - *** **
.4).2137
( 32)
P=0.120
- 0.4251
( 32)P -0.008
0.3460( )2)
P=0.026
-0.0883( 32)
P=M15
RR=04119
( 32)
P=0,271
0.1089:
( 32)
P=0.276
-0.1774( '32)Y=0.166
-
. 049'35(- 32)
P=0.144
-0.1560 0.1918
( 32) . (. 32)
P -0.197 P -0.146
-0.2137 -0.4251( 32) ( 32)
P=0.120 0.0418
1.0000 .1744
( 0) ( 32)p.***** P -0.170
-0.1744' 1.8000( 32) 0)
P=0.170 P *****
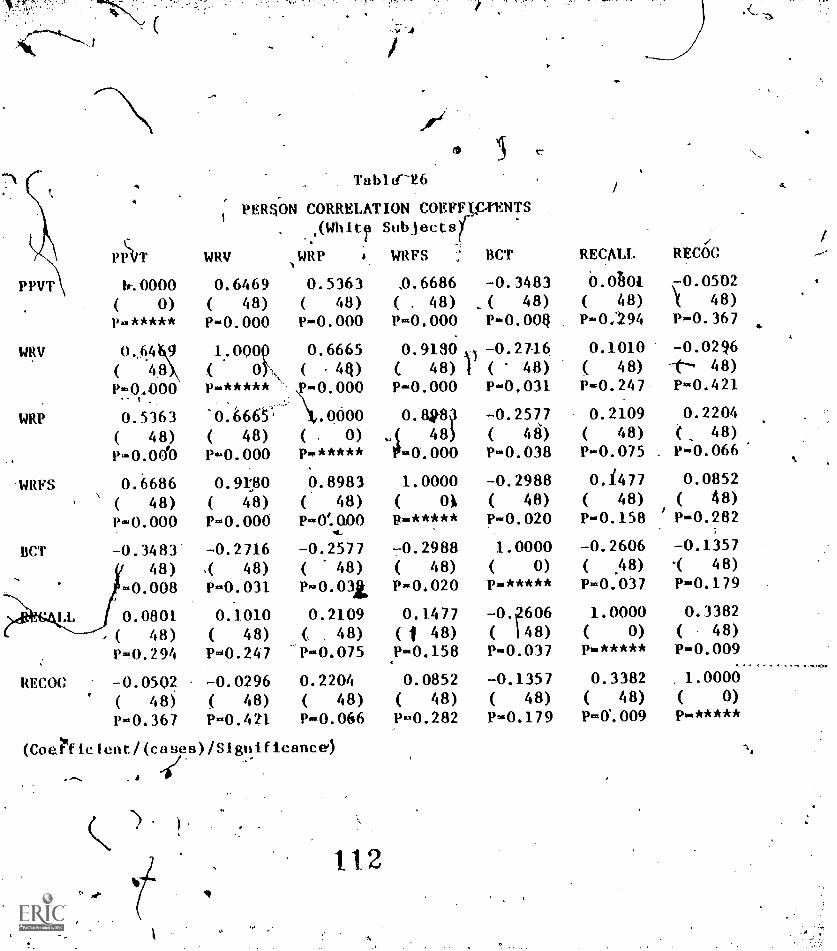
WRV
WRP
Tablet-26
PERWN CORRELATION COEFFIgtENTS. ,(Whitia Subjectsr
PAT WRV WRP WRFS
b-.0000 0.6469 0.5363( 0) ( 48) ( 48)
P-***** P -0.000 P-0.000
1.000p 0.6665
( 48 ( OY\ ( -4Q)P-04900 P..***** -4).000
0.5363 '0.6665 .0000
( 48) ( 48) (. 0)
P-0.001(0 P..0.000 13..*****
WRFS 0.6686( 48)P-0.000
Bcr -0.348348)
.-0.008
LL 0.0801,( 48) ( 48) ( 48)
P,..0.294 P00.247 'P-0.075
.0.6686
( 48)P..0.000
0.9180( 48)
P-0.000
o.am48
tt-o.000
0.91:80
( 48)
0.8983( 48)
1.0000(
r-o.000 11..0:000 P - * * * **
-0.2716 -0.2577 -0.2988
4 48) ( 48) ( 48)
P..0.031 P-0.031 P=0.020
0.1010 0.2109 0.1477
WOG 0.05Q2 -0.0296
( 48) ( 48)
P.-0.367 13,0.421
( 1 48)P-0.158
0.2204 0.0852
( 48) ( 48)P.0.066 P-0.282
(Cothiclent/(cases)/S1811ificance4
44
112
BCT RECALL RECOC
-0.3483 0.0ti01 c-0.0502
A 48) ( 48) k 48)
P-0.00Q Pi-0.367
0.27.16 0.1010 -0.0296
( 48) ( 48) 48)
P -0.031 P-0.247 P.-0.421
-0.2577 0.2109 0.2204
( 4d) ( 48) (, 48)
P-0.038 P-0.075 P -0.066
-0.2988 0.1477 0.0852
( 48) ( 48) ( 48)
P-0.020 P-.0.158 ' P-0.282
1.0000 -0.2606 -0.1357
( 0) ( A8) 48)p.***** P.03.037 P-0.179
-04606 1.0000 0.3382
( 148) ( 0) ( 48)
P-0.037 Pi-***** Pi-0.009
-0.1357 0.3382 1.0000
( 48) ( 48) ( 0)
13..0.179 13-0%009 1)*****
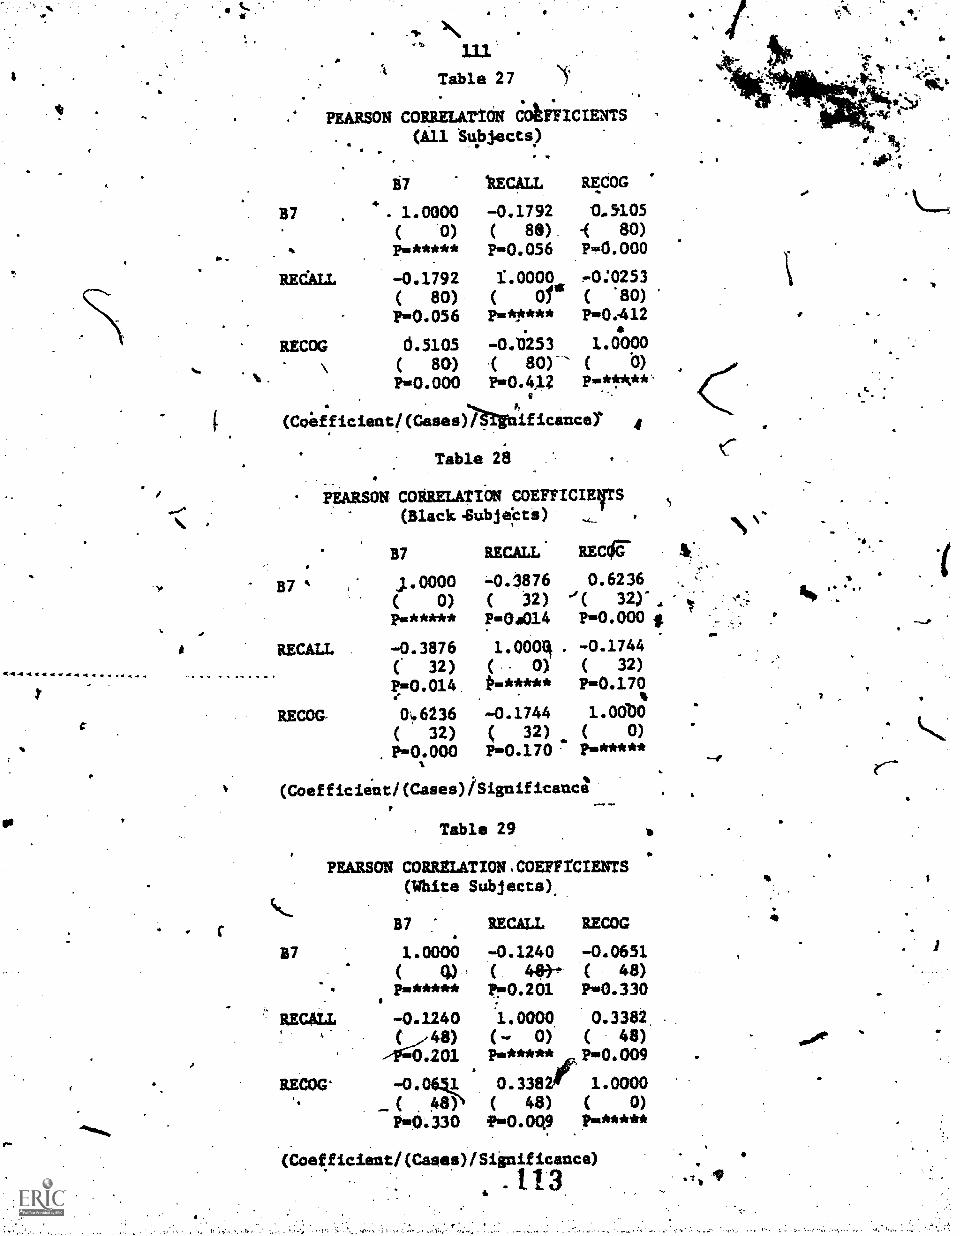
%-.
.
111'
Table 27
PEARSON CORRELATION COUFICIENTS(All Subjects)
37
RECALL
RECOG
-0.1792( 80)
P=0.056
0.5105( 80)
P=0.000
tECALL RECOG
-0.1792( 88)P=0.056
1.0000( of'
0.5105
80)P=0.000
,-0:0253
( .80)
P=Oe412
-0.-6253 1.0000( 80)-' ( b)
P=0.4,12g-
P=11,4c**
(Coidficieuq(Cases)/Sighificauce7 4
37
Table 28
PEARSON CORRELATION COEFFICIENTS(BlaciL.Subjets)
B7 RECALL- RECg
41.0000 -0.1876 0.6236
( 0) ( 32) '( 32r,P=***** P=0.11014 P=0.000 ft
RECALL -0.3876 1.0004 . -0.1744
( 32) ( 0) ( 32)
P=0.014. k=***** P=0.170
REC0G- 0.6236 -0.1744 1.001)0
( 32) ( 32) ( 0)
. P=0.000 P=0.170 7 P=*****
(Coefficient/(Cases)/Siguificauca
87
Table 29
PEARSON CORRELATION,COEFFIt/ENTS(White Subjects).
1
B7 : RECALL RECOG
1.0000 -0.1240 -0.0651
( ( 48+-e (.48)P=***** P=0.201 P=0.330
RECALL -0.1240(_.,48)
RECOG'
1.0000 0.3382,
(- 0) ( 48)P,. ***** P=0.009
0.3382A 1.0000(
P=0.330( 48) ( 0)
40.00 p.*****
( Coefficient /(Cases) /Significance)113
OF
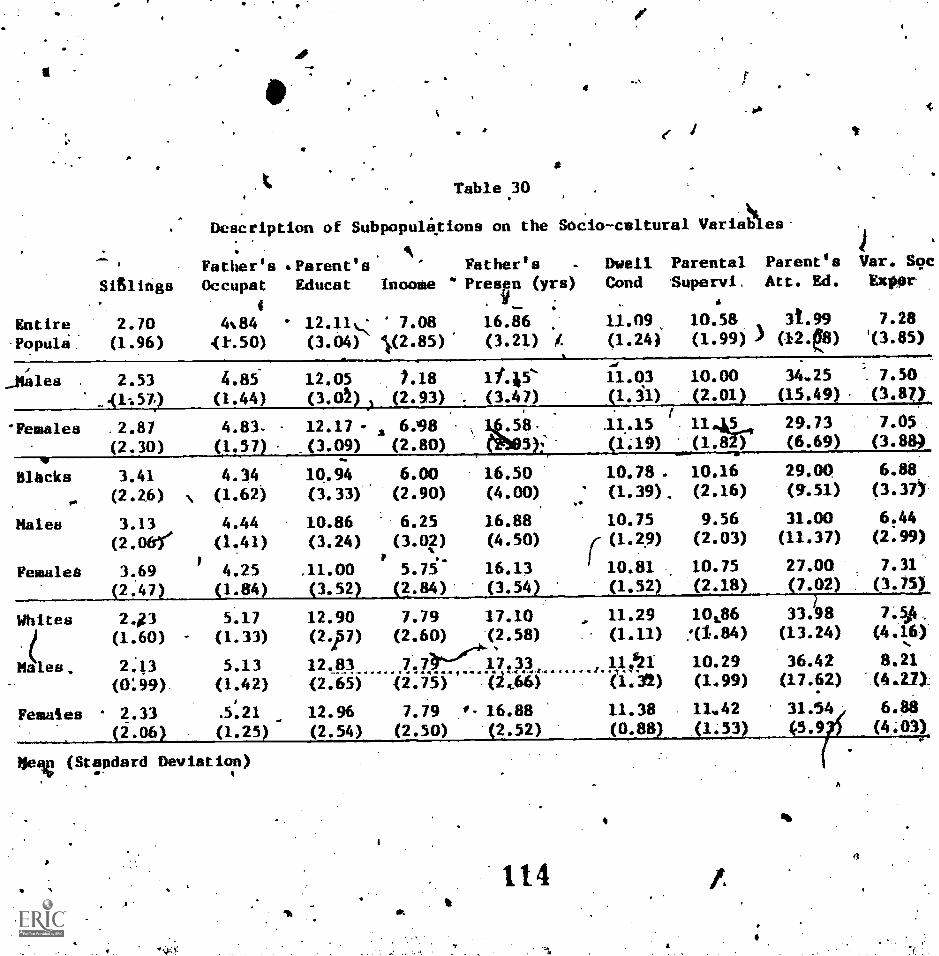
a
Siglings
.1%
-
Table 30
1
Description of Subpopulations on the Socio- caltural Varia&s.
AFather'sOccupat
.Parent'sEducat inoome
4
Entire 2.70 4.84 12.111/4;
Popula (1.96) 0-.50) (3.04)
files 2.53 4.85 12.05(1.44) (3.0/
'Females .2.87 4.83. 12.17
(2.30) (1.57) (3.09)
Blacks 3.41 4.34 10.94
(2.2.6) (1.62) (3.33)
Males 3.13 4.44 10.86
(2.06 (1.41) (3.24)
Femalea 3.69 4.252.47 1.84
Whites 243 5 . 17
(1.60) (1.33)
, 2.13 5.13Ma(0;99). (1.42)
Females. 2.33 .5.21
2.06 (1.25
Nele (Stlndard Deviation)4
7.08142.85)
Father's -
" PresV en (yrs)
16.86(3.21)
).182.93)
2 6:98(2.80)
6.00(2.90)
".6.25(3.02)
.11.00 5.753.52 2.84)
12.90(2."7)
12.83(2.65)
12.96(2.54)
(3.47)
00S05)
16.50(4.00)
16.88(4.50)
16.133.54
Dwell Parental Parent's
Cond Supervi, Att. Ed.
Var. SecExpor
A
11.09.(1.24)
10.58(1.99))
31.99
(12.8)7.28
'(3.85)
11.03 10.00 34.25 7.50
1.31) 2.01 (15.49) (3.8
11.15 1145,,., 29.73 7.05
1,1.19) (1.82) (6.69) (3.88)
10.78 . 10.16 29.00. 6.88 .
(1.39). (2.16) (9.51) (3.37.*
10.75 9.56 31.00 6.44
(1.29) (2.03) (11.37) (2.99)
10.81 10.751.52 (2.18
11.29 1006(1.11) 0.84)
10.29(1.31) (1.99)
11.38 11.42
7.79 17.10(2.60) (2.58)
7.7 17.33,(1,66)
0- 16.882.52)
(2.75)
7.79
(2.50)
27.007.02
33.98(13.24)
36.42(17.62)
31.54.(5.9(0.88 1.53
114Ij
7.31
(3.75
7.1A,(4./6).
8.21
6.88(4.03)


