Embed Size (px)
Citation preview
Communication ResearchXX(X) 1 –27
© The Author(s) 2009Reprints and permission: http://www. sagepub.com/journalsPermissions.nav
DOI: 10.1177/0093650209346805http://crx.sagepub.com
Don’t Expect Too Much! Learning From Late-Night Comedy and Knowledge Item Difficulty
Young Min Baek1 and Magdalena E. Wojcieszak2
Abstract
The debate on late night comedy has been inconclusive, with some scholars arguing that this genre increases political knowledge, and others seeing late night comedy as harmful to effective citizenry. We add to the debate and to the research on media effects more generally, by proposing a model that measures political knowledge. The model utilizes item response theory (IRT) to account for individual characteristics, knowledge item difficulty, and response format that influences the likelihood of providing a correct response. Drawing on the 2004 National Annenberg Election Study, we employ this model to test knowledge gain from late night comedy. Using a meta-analysis across 35 political knowledge items, we show that late night comedy increases knowledge, but primarily on easy political items that have fewer correct response options, and mainly among the inattentive citizens. We discuss theoretical implications and provide practical suggestions for scholarship on media effects.
Keywords
knowledge item difficulty, false positive, entertainment, late-night comedy, item response theory, meta-analysis, political learning
Traditional theories posit that the media’s contributions to political knowledge are limited. This is because, as the knowledge gap hypothesis predicts, those who are already endowed with civic skills or prior information learn more from news media. At the same time, as the uses and gratification perspective suggests, audiences use media for
10.1177/0093650209346805Communication ResearchBaek, Wojcieszak / Late-Night Comedy and Knowledge Items
1University of Pennsylvania2IE University, Segovia, Spain
Corresponding Author:Young Min Baek, PhD student, Annenberg School for Communication, 3620 Walnut Street, Philadelphia, PA 19104Email: [email protected]
Article
Communication Research OnlineFirst, published on October 9, 2009 as doi:10.1177/0093650209346805
2 Communication Research XX(X)
reinforcement—the informed seek yet more political content and the less interested citi-zens avoid political coverage (Blumer & Katz, 1974). Because the less interested citizens constitute a substantial subpopulation (Delli Carpini & Keeter, 1996), scholars who gener-ally tout the democratic benefits brought about by strictly political content have lamented that, rather than learn about arms reduction, some people immerse themselves in news about celebrity breakups and cats playing piano.
Late-night comedy, which combines entertainment and politics, may have the potential to bridge the divide. Not only have such entertainment-oriented news programs prolifer-ated (Riegert, 2007) but citizens also increasingly report turning to them for political infor-mation (Pew Research Center, 2000). This prevalence and popularity has instigated a debate on the contributions that late-night comedy might make to effective citizenry.
To some, late-night comedy has emerged as an important channel for news (Delli Carpini & Williams, 2000), a channel that could inform those citizens who otherwise do not tune in to hard news media (Baum, 2003a, 2003b; Young, 2006). To other scholars, the contributions that late-night comedy might make to democracy are questionable at best in that the learning effects are rare and confined to trivial topics that do not aid rational decision making (Patter-son, 1996; Sotirovic & McLeod, 2004). Inconsistent evaluations have led researchers to call for studies focused on specific programs or humor used by hosts (Young & Tisinger, 2006).
We do not seek to weigh in on whether there should be a greater research focus on programs or humor, nor do we aim to review the debate between those who see late-night comedy as merely junk food for the uninterested mind and those who tout their democratic benefits. Instead, we argue that refinement of a crucial methodological and substantive issue—measuring political knowledge—contributes to the debate and to research on media effects more generally. That is, some inconsistencies in the evaluations regarding learning from the media and late-night comedy might be due to insufficient differentiations between different types of audiences as well as the kinds of political knowledge they acquire. We therefore pro-pose a model for measuring political knowledge that accounts for item difficulty, response option format, and knowledge domain as well as for other pertinent factors.
Relying on the 2004 National Annenberg Election Study, we construct a model to test political knowledge gain from exposure to late-night comedy. Using a meta-analysis that tests the political knowledge items available in the NAES 2004 dataset, we demonstrate that late-night comedy increases knowledge, but this contribution is primarily confined to easy political items and politically inattentive citizens. Our findings thus indicate that before making a generalized argument about the Media Effect, different plural effects—among different items, knowledge domains, and subpopulations—need to be examined.
Media Effects and Political Knowledge IndexA knowledge item’s difficulty is generally defined as the proportion of correct responses to a given item (Delli Carpini & Keeter, 1993, 1996) and is therefore related to the information required in order to select the right answer. To measure knowledge, it is imperative to con-struct an index from diverse items ranging from relatively easy to relatively difficult (Delli Carpini & Keeter, 1993). If a knowledge index contains only difficult questions, then it will
Baek and Wojcieszak 3
only detect the information stored by highly knowledgeable citizens. Likewise, an index with an easy question-battery will not discriminate between highly knowledgeable and other citi-zens. If a study is concerned with one-dimensional knowledge, summing multiple items is recommended for simplicity. However, when studying the effects that the media generally and late-night comedy shows specifically have on political knowledge, constructing an addi-tive index might not be the best strategy. The reasons lie in two formative constraints, medium effects and format (genre) effects, that influence the extent to which people can learn from the media, and also who can acquire what information more successfully.
What Political Knowledge?First, different media require different abilities from the audience and may have differen-tial effects on political knowledge as a result (Gaziano, 1983; Shoemaker, Schooler, & Danielson, 1989). Newspapers demand familiarity with complex terminology, ability to extract abstract meanings from the text, and higher cognitive effort. In contrast, television, which provides more event-based news in a visually vivid style, requires less literacy or abstract thinking (Graber, 2001). It follows that there might be a disparity between political knowledge among those who consume different media, in that while both television and newspaper users correctly answer relatively easy items, it is newspaper readers who score higher on difficult and abstract questions (Sotirovic & McLeod, 2004).
More directly related to our focus, increases in political knowledge also depend on formats or genres. That is, some formats may be especially conducive to certain kinds of information and may demand different levels of cognitive effort from the audience (Kim & Vishak, 2008). The traditional distinction between the valued hard news and the frowned on entertainment best exemplifies the varying expectations regarding the information con-veyed by different formats (Berger, 1992; Prior, 2005). On the one hand, late-night comedy partly overcomes this distinction (Delli Carpini & Williams, 2001). Also, topics in tradi-tional news formats are now lighter (Project for Excellence in Journalism, 1998). More-over, The Daily Show conveys nuanced information that is comparable to that in hard news (Baym, 2005; Fox, Koloen, & Sahin, 2007; Young, 2006) and explores policy issues more often than do other late-night comedy programs (Young, 2004).
Although crucial differences between programs cannot be denied, traditional hard news formats may still cover complex topics to greater extent or in greater depth than late-night comedy (Prior, 2003). Some scholars argue that soft news downplays policy, military, politi-cal, and also partisan nuances and instead focuses on human interest and crime related themes (Baum, 2002; 2003a). Again setting aside the differences between shows, some scholars also find that jokes in late-night comedy target candidates’ traits rather than issues (Niven, Lichter, & Amundson, 2003; Young, 2004) and that issue content is generally lacking (Dye et al., 1992). When covering complex political topics, moreover, some soft news programs rely almost solely—and more so than traditional news—on episodic, rather than thematic, framing (Baum, 2003a). Furthermore, media types per se may produce different patterns in political information acquisition, with news media increasing knowledge and accuracy more than late-night comedy even after controlling for topical and thematic contents (Kim &
4 Communication Research XX(X)
Vishak, 2008). In sum, scholars who question whether late-night comedy contributes to informed citizenry argue that the information covered therein revolves around trivial topics rather than substantive issues critical to sound opinion formation and rational decision mak-ing (Prior, 2003). Even those who hope that this genre increases knowledge note that the increase might primarily emerge for easy and moderately difficult information (Baum, 2005).
Whose Political Knowledge?In addition to scrutinizing what political knowledge increases, it is important to analyze whose knowledge is influenced. Late-night comedy may foster attention primarily among people who are otherwise not acutely tuned into politics and who generally do not seek out hard news programs (Baum, 2003b, 2005). Armed with humor and wit and facilitating online information processing that relies on affective reactions (Kim & Vishak, 2008), late-night comedy may help the inattentive citizens absorb information, as a “free bonus, or incidental by-product” (Baum, 2002, p. 96, emphasis in original). Indeed, some research finds that soft news coverage mainly benefits the inattentive, less knowledgeable, and less formally educated individuals (Baum, 2002, 2003b, 2005; Young, 2006). Also, although the humor used by late-night comedians may increase the message’s persuasiveness by suspending argument scrutiny and thwarting counterarguing (Nabi, Moyer-Guse, & Byrne, 2007; Young, 2008), this effect may not be uniform. Humor works particularly well among people who do not consider a topic seriously (Kuipers, 2006), such as those who do not prioritize politics, while potentially failing to stimulate the cognitive effort among those who see politics as a serious affair.
Thus far, this discussion suggests that the effects that late-night comedy has on knowl-edge depend not only on item difficulty but also on individual characteristics. It follows that summing multiple political knowledge items in order to create a monolithic scale might not capture these effects. We thus now turn to methodological considerations under-lying knowledge scale constructions and propose a model that accounts for the relationship between item difficulty and political knowledge. We also add other pertinent factors that influence item difficulty and/or political knowledge.
Knowledge Item ComponentsClassical measurement theory might not be helpful in investigating the varying difficulties among political knowledge items. Its core assumption is that an observed score contains a respondent’s true score, such as genuine knowledge, and error. Multiple items are thus the way to control for the error by capturing an underlying latent concept, and hence reliability coef-ficients are widely used to quantify the overlapping variance among multiple items. Classical measurement approach works well when used to measure traits or attitudes but does not per-form well when differentiating between items’ difficulty and/or between test-takers’ learning capacities.
Item Response Theory (IRT), developed in social sciences and prevalent in education (Embretson & Reise, 2000; DeVellis, 2003), proves especially useful in addressing these
Baek and Wojcieszak 5
differentiations. This is because it accounts for both the item and the individual character-istics. Its simplest version, the Rasch Model (Rasch, 1960), is a logistic regression model for dichotomous variables, such as yes/no or right/wrong. In this model (see Formula 1), the odds ratio of being right to being wrong is modeled by the difference between person S’s capacities, θs, and the item’s genuine difficulty, β
i. If a person has the capacity to
provide the correct answer to an item (i.e., θs > βi), then the left part of the equation will be positive. However, a difficult item that exceeds a person’s ability (i.e., βi > θs) will yield a negative value on the formula.
ln½ Pis
ð1� PisÞ� ¼ ys � bi:
(1)
While providing the first step to distinguishing the more subtle effects that media and late-night comedy might have on political knowledge, this formula has one serious limita-tion. It implicitly presumes that there is no possibility for individuals to choose the right answer when they have no ability to do so. As response options decrease, however, such a false positive becomes more likely. For example, if there is one correct answer, and ques-tion A offers two response options and question B offers four, the 50% base probability to be right in question A drops to 25% in question B. In other words, a person’s chance to be right is twice larger when faced with question A, without the increase in a person’s knowl-edge or the decrease in a question’s difficulty.
Because political knowledge items in survey questionnaires have varying response options, both in number and type, scholars have been long concerned with this problem (Nunnally, 1978). Some questions are open-ended (e.g., What job is held by Dick Cheney?), some have one correct answer (e.g., one among 2-4 options), some have multiple answers (e.g., 2-3 among 10-11 options), and yet other questions have value ordered answers (i.e., partial credit). As a result, item difficulty is influenced by a false positive or the possibility that a person answers correctly without having the knowledge. In other words, to reliably estimate the relationship between media exposure and political knowledge, the model should not only control for item difficulty and individual characteristics, but also the response option factor. Hence we modify the original Formula 1 and incorporate another parameter (i.e., false positive, α
i):
bi ¼ b0i þ ai1i: (2)
Formula 2 indicates that false positive could increase (i.e., αi > 0) or decrease (i.e., α
i <
0) knowledge item difficulty by influencing a person’s capacity to answer correctly (βi),
without influencing the constant underlying difficulty level (β0i
). Our final formula is:
6 Communication Research XX(X)
ln½ Pis
ð1� PisÞ� ¼ ys � ðb0i þ aiÞ
Pis
ð1� PisÞ¼ e½ys�ðb0iþaiÞ�:
(3)
In sum, we model three components: (a) Individual characteristics parameter (i’s),
containing individual-level factors affecting political knowledge, such as sociodemograph-ics, political attitudes, news media use, and—central to our focus—exposure to late-night comedy; (b) item characteristics parameter (β
0i), which is the difficulty of a political
knowledge item defined as the proportion of correct response; and (c) a false positive parameter (α
i), which reflects the number of response options. In order to isolate knowl-
edge item difficulty level, our model also controls for political knowledge domain from which items are drawn, and for other theoretically important factors, which we later explain in detail.
Research HypothesesWe now bring the reviewed literatures together, aiming to clarify the relationship between knowledge gained from late-night comedy, item difficulty level, and false positives. First, response option format in a questionnaire influences the base probability that the answer to a given question will be correct, in that more choices minimize false positive, or being cor-rect without the underlying knowledge. We thus predict
Hypothesis 1 (H1): The fewer the response options to a political knowledge item, the less difficult the item.
The reviewed scholarship suggests that late-night comedy might provide information on already familiar or easily processed topics rather than on complex issues contained in difficult knowledge items. Therefore, we expect
Hypothesis 2 (H2): Exposure to late-night comedy shows will increase knowledge on relatively easy political knowledge items, controlling for other factors.
Finally, previous studies suggest that political learning from late-night comedy is not uniform across population, in that the effect might be especially pronounced among politically inattentive citizens. We thus predict that individual differences will moder-ate the learning effects:
Hypothesis 3 (H3): Exposure to late-night comedy will increase political knowledge among inattentive citizens to a greater extent than among attentive ones.
Baek and Wojcieszak 7
Method
Our analysis relies on the 2004 National Annenberg Election Survey (NAES, 2004), a public opinion survey from the Annenberg Public Policy Center at the University of Penn-sylvania. NAES tracked the campaign dynamics over the 2004 presidential campaign using a rolling cross-sectional (RCS) design. That is, on average 150 to 300 adult Ameri-cans were surveyed on a daily basis regarding topics related to the campaign and also to respondents’ political attitudes and behaviors. In total, the final NAES 2004 dataset contains information on 81,422 respondents, for the 25% response rate (for details, see Jamieson & Kenski, 2006).
MeasuresExposure to late-night comedy. This central predictor was assessed by standard ques-
tion format, asking respondents to report the number of days in the past week they watched such late-night comedy shows as Late Show with David Letterman, The Tonight Show with Jay Leno, or The Daily Show with Jon Stewart. Roughly, about a quarter of the sample reported watching late-night comedy.
Political attentiveness. To scrutinize whether late-night comedy’s effects depend on attentiveness, we use the question that asked respondents to report how closely they followed what is going on in government and public affairs. We categorized respon-dents into “Attentive,” who follow politics most of the time (40%), “Ordinary,” who do so some of the time (35%) and “Inattentive,” who only now and then or hardly at all follow politics (25%).
Item difficulty. Following past research (Delli Carpini & Keeter, 1993) and consis-tent with IRT, we define item difficulty as the proportion of correct responses to a political knowledge item. In other words, the higher the proportion of correct answer(s) to a given question, the less difficult the question. Among the 43 knowl-edge items in NAES 2004, this proportion ranges between .02 and .80 (median = .50, M = .46, SD = .22).
False positives. The probability that respondents select the right answer might be affected by response option format. Political knowledge items included in NAES 2004 contained varying formats: (a) one right answer among multiple choices, (b) plural answers among multiple choices, and (c) two open-ended questions. The first two formats are identified as recognition measures and the last one as recall. We operationalize the false positive measure as the ratio of correct answer choices to all alternatives offered, with the two open-ended questions replaced by the minimum value. The higher the ratio, the more vulnerable the item to a false positive (range .10-.50, M =.22, SD =.09).
Knowledge domain. Item difficulty, or the probability that respondents answer cor-rectly, could be influenced by the broader domain from which a political knowledge item is drawn. That is, questions about human interest issues may be processed more easily than questions from such domains as economics or international affairs, which
8 Communication Research XX(X)
may demand higher cognitive effort or greater prior information (Converse, 1964; Price & Zaller, 1993). To consider this influence and to isolate item difficulty, we fol-low NAES 2004 codebook (Annenberg Policy Center, 2006) and use six domains as controls in our model: (a) Economy, (b) Health/Human Issues, (c) Foreign Affairs, (d) Social/Other, (e) Candidate Knowledge, and (f) General Political Knowledge. Gener-ally, respondents were asked to identify—on a list of candidates’ names—the 2004 presidential candidate who favors or opposes various policies. For example, the ques-tions probed about who favors reducing estate tax and cutting federal budget (Econ-omy), workers’ social security and lower prescription drug prices (Health/Human), Patriot Act and reinstating military draft (Foreign Affairs), and also banning assault weapons and federally funded stem cell research (Social/Other). The questions from the Candidate issues domain focused on the candidates’ backgrounds, asking which candidate is a former general or a former trial lawyer, for example. Finally, the Gen-eral political knowledge domain contained five widely used questions, such as what job or political office is held by Dick Cheney or who determines if a law is constitu-tional or not (see Table 1; see also the appendix for question wording).
Individual characteristics. Finally, because the tested relationship might be con-founded by individual characteristics, we use 16 individual-level variables to statisti-cally isolate the main effects. We thus control for: sociodemographics, such as gender, race, age, and squared term of age, educational attainment and income level, partisan-ship and party affiliation, political participation, political attentiveness, and also com-municative behaviors, such as watching network news, reading newspapers, online news use, and interpersonal political discussion. For question wording see NAES 2004 codebook.
Statistical MethodsTo test our research hypotheses, we rely on item-level analysis and treat political knowl-edge items as independent observations. In order to capture campaign dynamics, political knowledge items were added to or removed from the NAES 2004 questionnaires through-out the sampling period (Jamieson & Kenski, 2006). As a result, the number of observa-tions to those items ranges from 1,352 to 28,095 (M = 12,946, SD = 9,369). Because it is easier to detect significant relationships with large samples (Schmidt, 1996), we account for the influence that sample size for each item might have on item-level properties, such as item difficulty, false positive, and learning effect from late-night comedy. Toward this end, we transform sample statistics (i.e., Likelihood ratio χ2) into effect-size statistics, widely used in meta-analyses to adjust for different sample size (Hunter & Schmidt, 2004).1
There are two rationales for using effect size statistics calculated via meta-analytic approach. First, in the context of IRT, the items’ properties need to be extracted. In order to test the hypotheses, item difficulty and false positives need to be defined as aggregate-level rather than individual level properties (for similar approach, see Romer, 2006; Stimson,
Baek and Wojcieszak 9
2004). Second, estimating the parameters for the NAES dataset based on different subsamples within a larger sample allows us to obtain reliable and stable estimates (Young et al., 2006).2 To test whether knowledge items come from homogeneous population, we depend on homogeneity statistic (e.g., Q statistic) frequently adopted in meta-analyses (Lipsey & Wilson, 2001). After examining all knowledge items via meta-analyses, conven-tional statistical methods (e.g., partial correlation and analysis of variance) are adopted to test research hypotheses.
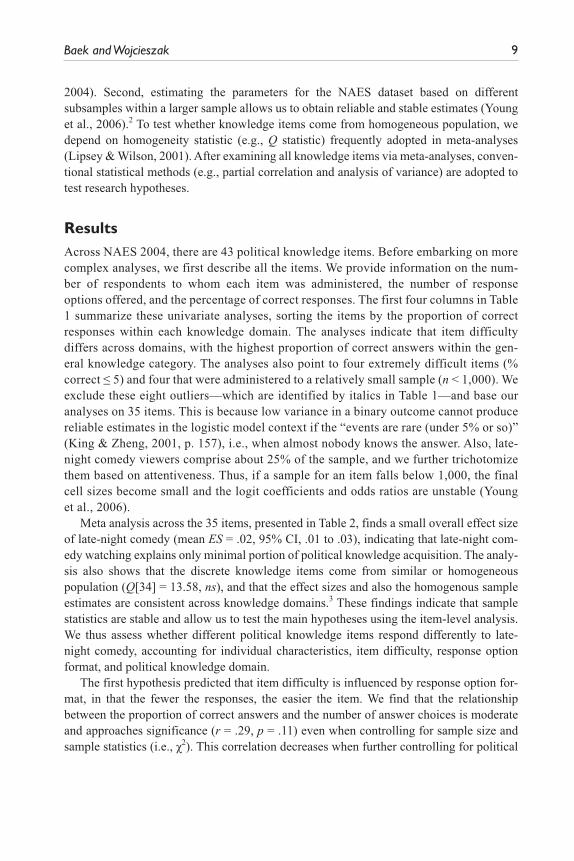
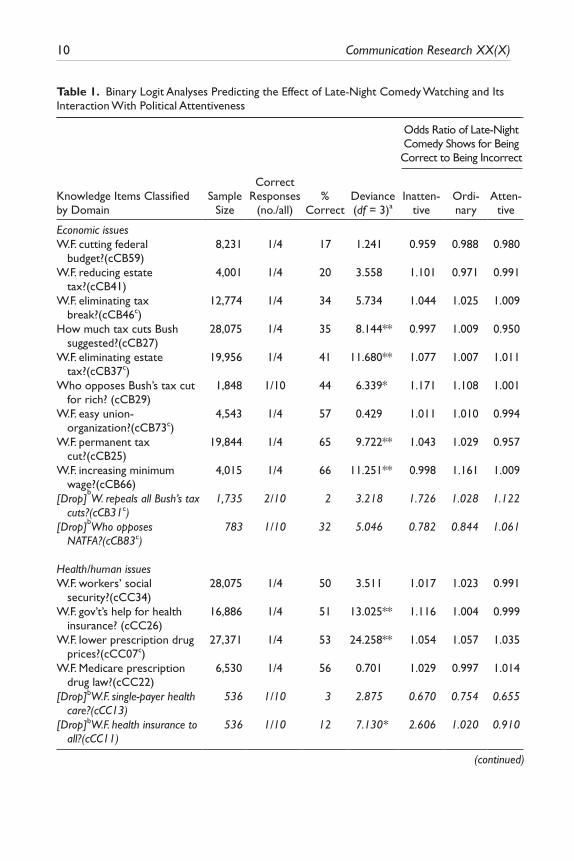
ResultsAcross NAES 2004, there are 43 political knowledge items. Before embarking on more complex analyses, we first describe all the items. We provide information on the num-ber of respondents to whom each item was administered, the number of response options offered, and the percentage of correct responses. The first four columns in Table 1 summarize these univariate analyses, sorting the items by the proportion of correct responses within each knowledge domain. The analyses indicate that item difficulty differs across domains, with the highest proportion of correct answers within the gen-eral knowledge category. The analyses also point to four extremely difficult items (% correct ≤ 5) and four that were administered to a relatively small sample (n < 1,000). We exclude these eight outliers—which are identified by italics in Table 1—and base our analyses on 35 items. This is because low variance in a binary outcome cannot produce reliable estimates in the logistic model context if the “events are rare (under 5% or so)” (King & Zheng, 2001, p. 157), i.e., when almost nobody knows the answer. Also, late-night comedy viewers comprise about 25% of the sample, and we further trichotomize them based on attentiveness. Thus, if a sample for an item falls below 1,000, the final cell sizes become small and the logit coefficients and odds ratios are unstable (Young et al., 2006).
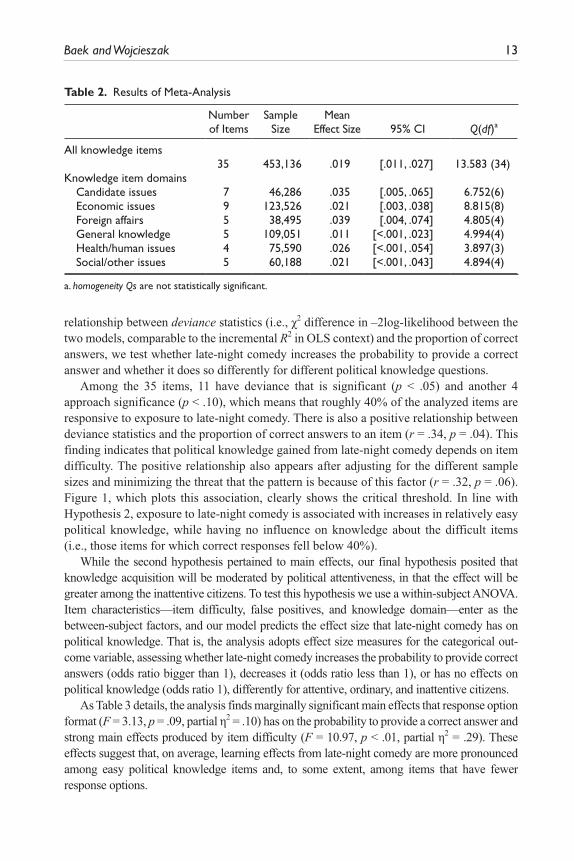
Meta analysis across the 35 items, presented in Table 2, finds a small overall effect size of late-night comedy (mean ES = .02, 95% CI, .01 to .03), indicating that late-night com-edy watching explains only minimal portion of political knowledge acquisition. The analy-sis also shows that the discrete knowledge items come from similar or homogeneous population (Q[34] = 13.58, ns), and that the effect sizes and also the homogenous sample estimates are consistent across knowledge domains.3 These findings indicate that sample statistics are stable and allow us to test the main hypotheses using the item-level analysis. We thus assess whether different political knowledge items respond differently to late-night comedy, accounting for individual characteristics, item difficulty, response option format, and political knowledge domain.
The first hypothesis predicted that item difficulty is influenced by response option for-mat, in that the fewer the responses, the easier the item. We find that the relationship between the proportion of correct answers and the number of answer choices is moderate and approaches significance (r = .29, p = .11) even when controlling for sample size and sample statistics (i.e., χ2). This correlation decreases when further controlling for political
10 Communication Research XX(X)
Table 1. Binary Logit Analyses Predicting the Effect of Late-Night Comedy Watching and Its Interaction With Political Attentiveness
Odds Ratio of Late-Night Comedy Shows for Being Correct to Being Incorrect
Knowledge Items Classified by Domain
Sample Size
Correct Responses
(no./all)%
CorrectDeviance (df = 3)a
Inatten-tive
Ordi-nary
Atten-tive
Economic issuesW.F. cutting federal
budget?(cCB59)8,231 1/4 17 1.241 0.959 0.988 0.980
W.F. reducing estate tax?(cCB41)
4,001 1/4 20 3.558 1.101 0.971 0.991
W.F. eliminating tax break?(cCB46c)
12,774 1/4 34 5.734 1.044 1.025 1.009
How much tax cuts Bush suggested?(cCB27)
28,075 1/4 35 8.144** 0.997 1.009 0.950
W.F. eliminating estate tax?(cCB37c)
19,956 1/4 41 11.680** 1.077 1.007 1.011
Who opposes Bush’s tax cut for rich? (cCB29)
1,848 1/10 44 6.339* 1.171 1.108 1.001
W.F. easy union-organization?(cCB73c)
4,543 1/4 57 0.429 1.011 1.010 0.994
W.F. permanent tax cut?(cCB25)
19,844 1/4 65 9.722** 1.043 1.029 0.957
W.F. increasing minimum wage?(cCB66)
4,015 1/4 66 11.251** 0.998 1.161 1.009
[Drop]bW. repeals all Bush’s tax
cuts?(cCB31c)1,735 2/10 2 3.218 1.726 1.028 1.122
[Drop]bWho opposes NATFA?(cCB83c)
783 1/10 32 5.046 0.782 0.844 1.061
Health/human issuesW.F. workers’ social
security?(cCC34)28,075 1/4 50 3.511 1.017 1.023 0.991
W.F. gov’t’s help for health insurance? (cCC26)
16,886 1/4 51 13.025** 1.116 1.004 0.999
W.F. lower prescription drug prices?(cCC07c)
27,371 1/4 53 24.258** 1.054 1.057 1.035
W.F. Medicare prescription drug law?(cCC22)
6,530 1/4 56 0.701 1.029 0.997 1.014
[Drop]bW.F. single-payer health care?(cCC13)
536 1/10 3 2.875 0.670 0.754 0.655
[Drop]bW.F. health insurance to all?(cCC11)
536 1/10 12 7.130* 2.606 1.020 0.910
(continued)
Baek and Wojcieszak 11
Odds Ratio of Late-Night Comedy Shows for Being Correct to Being Incorrect
Knowledge Items Classified by Domain
Sample Size
Correct Responses
(no./all)%
CorrectDeviance (df = 3)a
Inatten-tive
Ordi-nary
Atten-tive
Foreign affairsWho opposes Iraq war?
(cCD29)2,518 3/10 36 0.832 1.017 1.027 1.031
W.F. reduction of troops overseas?(cCD09)
8,524 1/4 48 1.848 0.981 0.972 1.017
W.F. reinstating military draft?(cCD12c)
10,204 1/4 53 6.607* 1.062 1.060 1.017
W.F. USA Patriot Act?(cCD68c) 13,577 1/4 63 9.582** 1.054 1.044 0.950W.F. spending US$87 billion
for last fall?(cCD27)8,231 1/4 71 3.610 1.082 0.998 0.997
Social/other issuesW.F. banning assault
weapons?(cCE35c)27,371 1/4 12 1.274 1.028 1.004 0.989
W.F. limiting punitive damages … in lawsuits?(cCG03) 10,931 1/4 46 1.950 1.050 1.010 0.998 for medical
malpractice?(cCG08)6,300 1/4 48 3.209 0.981 0.957 0.974
W.F. federally funded research on stem cells?(cCE10c) 10,499 1/4 62 11.237** 1.059 1.010 1.081 on stem cell
lines?(cCE15)5,039 1/4 77 4.760 1.015 1.102 1.003
[Drop]bSalary of Supreme Court Justice(cCH04)
396 1/5 4 4.999 1.134 1.713 0.999
[Drop]bSalary of the
President(cCH07) 396 1/5 5 13.567** <0.001 <0.001 0.503
Candidate issuesWhich candidate (or candidates) is (or are)… Son of a mill
worker?(cDA23)2,518 1/10 32 4.490 0.791 0.983 0.965
Former trial lawyer?(cDA29)
2,518 1/10 37 0.271 1.035 0.992 0.985
Former prosecutor?(cDA17)
21,798 1/4 48 20.008** 1.034 1.064 1.029
Governor of Vermont?(cDA27)
1,735 1/10 49 0.530 0.925 1.001 0.990
Former general?(cDA25) 1,352 1/10 59 1.175 1.114 1.017 0.959
Table 1. Continued
(continued)
12 Communication Research XX(X)
Odds Ratio of Late-Night Comedy Shows for Being Correct to Being Incorrect
Knowledge Items Classified by Domain
Sample Size
Correct Responses
(no./all)%
CorrectDeviance (df = 3)a
Inatten-tive
Ordi-nary
Atten-tive
Vietnam War Veteran?(Democrats, cDA02)
2,518 1/10 67 3.656 1.123 1.069 0.988
Vietnam War Veteran?(GOP,cDA04)
13,817 2/11 79 12.606** 1.071 1.057 1.084
[Drop]bWho was Leader at House?(cDA21)
196 1/10 52 1.696 1.729 0.835 0.965
[Drop]bWho was vice President in 2000?(cDA19)
536 1/10 63 5.440 0.980 0.996 0.771
General political knowledgeMajority to override presi-
dential veto(cMC05)24,465 n.a. 39 1.312 0.974 1.010 0.996
Who determines if law is constitutional(cMC03)
24,465 1/3 67 1.720 0.987 0.992 0.981
Majority in House of Representative(cMC09)
11,113 1/2 68 0.151 0.991 0.994 1.005
More conservative party(cMC07)
24,456 1/2 69 3.967 1.041 1.013 1.014
Job held by Dick Cheney(cMC01)
24,465 n.a. 80 40.743** 1.129 1.100 1.039
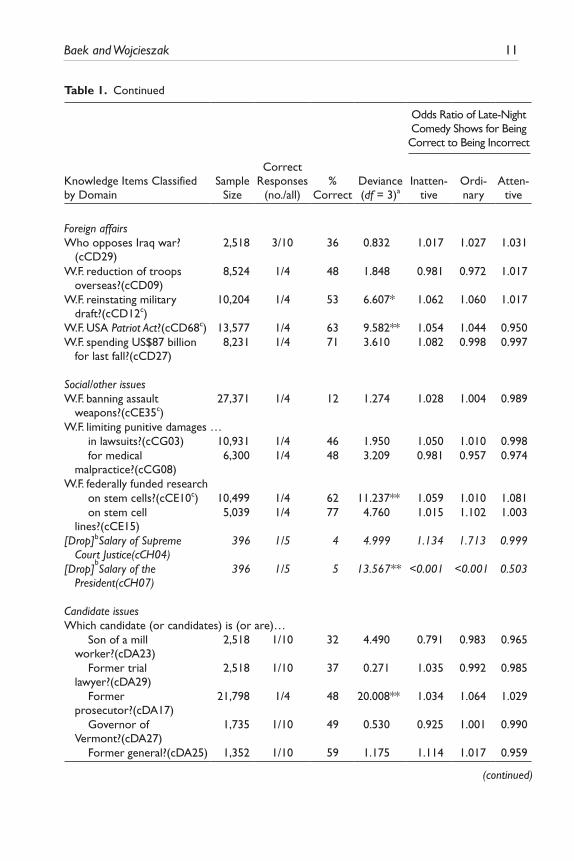
Note: Total N = 81,422. W.F. is the abbreviation for “Who favors..” n.a. under the column of “correct respons-es (no./all)” means the knowledge question was open-ended format (in the analysis, replaced by 1/10).a. Caculated difference of −2 Log-Likelihood between binary logit equations with control variables and the binary logit regressions with exposure to late-night comedy and its interaction terms with political atten-tiveness and inattentiveness.b. Items with [Drop] denotes the knowledge item is dropped in the analysis.c. Denotes the questionnaire items measured by two kinds of wording.*p < .10. **p < .05.
knowledge domain (r = .24, p = .21), suggesting that this relationship moderately varies across domains. These analyses offer a weak support for the first hypothesis and provide only some indication that the probability that respondents choose a correct answer, namely, item difficulty, may decrease with an increase in response options.4
What are the effects of exposure to late-night comedy? Does it increase political knowl-edge across the board or does it primarily augment the relatively easy knowledge? In order to test our second hypothesis, we construct a base binary logit model that enters all the con-trol variables and predicts the probability that respondents provide a correct answer to the 35 items separately. We then add exposure to late-night comedy and political attentiveness into the model and assess whether the model is significantly improved. By scrutinizing the
Table 1. Continued
Baek and Wojcieszak 13
relationship between deviance statistics (i.e., χ2 difference in –2log-likelihood between the two models, comparable to the incremental R2 in OLS context) and the proportion of correct answers, we test whether late-night comedy increases the probability to provide a correct answer and whether it does so differently for different political knowledge questions.
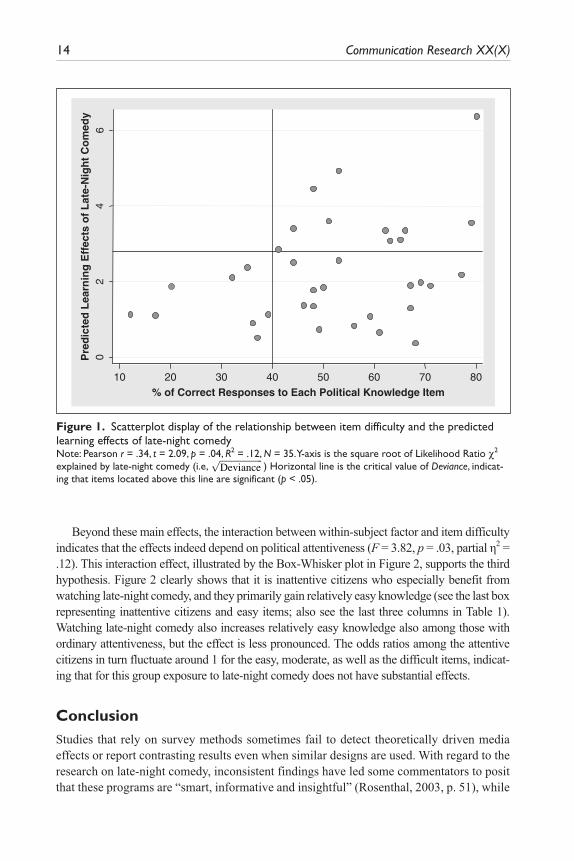
Among the 35 items, 11 have deviance that is significant (p < .05) and another 4 approach significance (p < .10), which means that roughly 40% of the analyzed items are responsive to exposure to late-night comedy. There is also a positive relationship between deviance statistics and the proportion of correct answers to an item (r = .34, p = .04). This finding indicates that political knowledge gained from late-night comedy depends on item difficulty. The positive relationship also appears after adjusting for the different sample sizes and minimizing the threat that the pattern is because of this factor (r = .32, p = .06). Figure 1, which plots this association, clearly shows the critical threshold. In line with Hypothesis 2, exposure to late-night comedy is associated with increases in relatively easy political knowledge, while having no influence on knowledge about the difficult items (i.e., those items for which correct responses fell below 40%).
While the second hypothesis pertained to main effects, our final hypothesis posited that knowledge acquisition will be moderated by political attentiveness, in that the effect will be greater among the inattentive citizens. To test this hypothesis we use a within-subject ANOVA. Item characteristics—item difficulty, false positives, and knowledge domain—enter as the between-subject factors, and our model predicts the effect size that late-night comedy has on political knowledge. That is, the analysis adopts effect size measures for the categorical out-come variable, assessing whether late-night comedy increases the probability to provide correct answers (odds ratio bigger than 1), decreases it (odds ratio less than 1), or has no effects on political knowledge (odds ratio 1), differently for attentive, ordinary, and inattentive citizens.
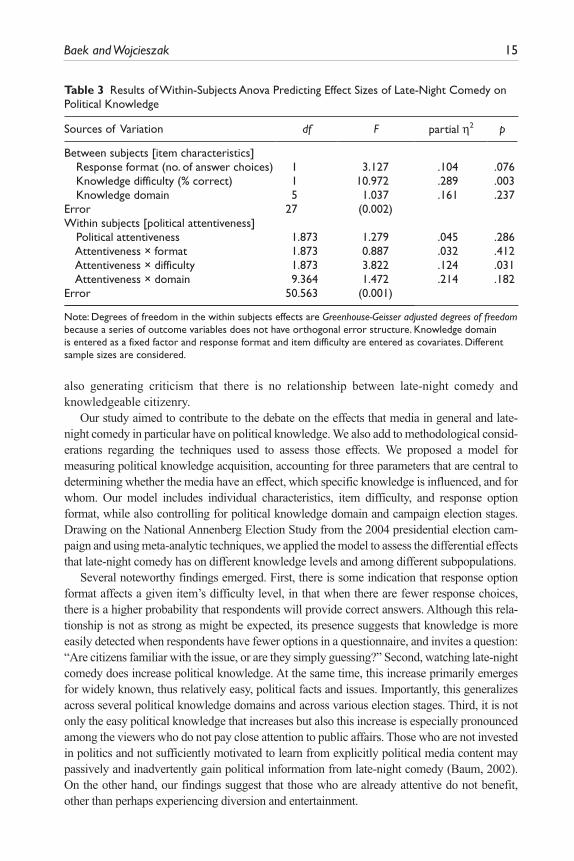
As Table 3 details, the analysis finds marginally significant main effects that response option format (F = 3.13, p = .09, partial η2 = .10) has on the probability to provide a correct answer and strong main effects produced by item difficulty (F = 10.97, p < .01, partial η2 = .29). These effects suggest that, on average, learning effects from late-night comedy are more pronounced among easy political knowledge items and, to some extent, among items that have fewer response options.
Table 2. Results of Meta-Analysis
Number of Items
Sample Size
Mean Effect Size 95% CI Q(df)a
All knowledge items35 453,136 .019 [.011, .027] 13.583 (34)
Knowledge item domains Candidate issues 7 46,286 .035 [.005, .065] 6.752(6) Economic issues 9 123,526 .021 [.003, .038] 8.815(8) Foreign affairs 5 38,495 .039 [.004, .074] 4.805(4) General knowledge 5 109,051 .011 [<.001, .023] 4.994(4) Health/human issues 4 75,590 .026 [<.001, .054] 3.897(3) Social/other issues 5 60,188 .021 [<.001, .043] 4.894(4)
a. homogeneity Qs are not statistically significant.
14 Communication Research XX(X)
02
46
Pre
dic
ted
Lea
rnin
g E
ffec
ts o
f L
ate-
Nig
ht
Co
med
y
10 20 30 40 50 60 70 80% of Correct Responses to Each Political Knowledge Item
Figure 1. Scatterplot display of the relationship between item difficulty and the predicted learning effects of late-night comedyNote: Pearson r = .34, t = 2.09, p = .04, R2 = .12, N = 35. Y-axis is the square root of Likelihood Ratio χ2 explained by late-night comedy (i.e, ) Horizontal line is the critical value of Deviance, indicat-ing that items located above this line are significant (p < .05).
ði:e:;ffiffiffiffiffiffiffiffiffiffiffiffiffiffiffiffiffiffiffiDeviance
pÞ
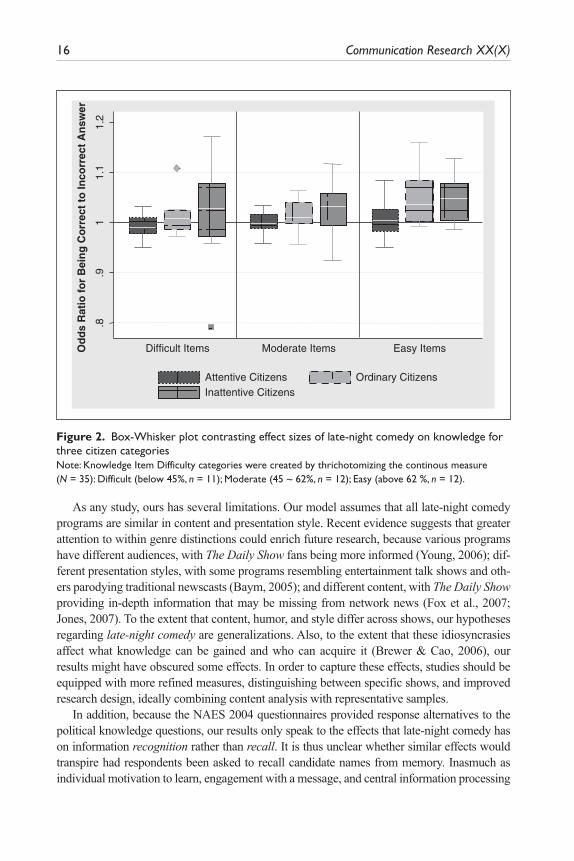
Beyond these main effects, the interaction between within-subject factor and item difficulty indicates that the effects indeed depend on political attentiveness (F = 3.82, p = .03, partial η2 = .12). This interaction effect, illustrated by the Box-Whisker plot in Figure 2, supports the third hypothesis. Figure 2 clearly shows that it is inattentive citizens who especially benefit from watching late-night comedy, and they primarily gain relatively easy knowledge (see the last box representing inattentive citizens and easy items; also see the last three columns in Table 1). Watching late-night comedy also increases relatively easy knowledge also among those with ordinary attentiveness, but the effect is less pronounced. The odds ratios among the attentive citizens in turn fluctuate around 1 for the easy, moderate, as well as the difficult items, indicat-ing that for this group exposure to late-night comedy does not have substantial effects.
ConclusionStudies that rely on survey methods sometimes fail to detect theoretically driven media effects or report contrasting results even when similar designs are used. With regard to the research on late-night comedy, inconsistent findings have led some commentators to posit that these programs are “smart, informative and insightful” (Rosenthal, 2003, p. 51), while
Baek and Wojcieszak 15
also generating criticism that there is no relationship between late-night comedy and knowledgeable citizenry.
Our study aimed to contribute to the debate on the effects that media in general and late-night comedy in particular have on political knowledge. We also add to methodological consid-erations regarding the techniques used to assess those effects. We proposed a model for measuring political knowledge acquisition, accounting for three parameters that are central to determining whether the media have an effect, which specific knowledge is influenced, and for whom. Our model includes individual characteristics, item difficulty, and response option format, while also controlling for political knowledge domain and campaign election stages. Drawing on the National Annenberg Election Study from the 2004 presidential election cam-paign and using meta-analytic techniques, we applied the model to assess the differential effects that late-night comedy has on different knowledge levels and among different subpopulations.
Several noteworthy findings emerged. First, there is some indication that response option format affects a given item’s difficulty level, in that when there are fewer response choices, there is a higher probability that respondents will provide correct answers. Although this rela-tionship is not as strong as might be expected, its presence suggests that knowledge is more easily detected when respondents have fewer options in a questionnaire, and invites a question: “Are citizens familiar with the issue, or are they simply guessing?” Second, watching late-night comedy does increase political knowledge. At the same time, this increase primarily emerges for widely known, thus relatively easy, political facts and issues. Importantly, this generalizes across several political knowledge domains and across various election stages. Third, it is not only the easy political knowledge that increases but also this increase is especially pronounced among the viewers who do not pay close attention to public affairs. Those who are not invested in politics and not sufficiently motivated to learn from explicitly political media content may passively and inadvertently gain political information from late-night comedy (Baum, 2002). On the other hand, our findings suggest that those who are already attentive do not benefit, other than perhaps experiencing diversion and entertainment.
Table 3 Results of Within-Subjects Anova Predicting Effect Sizes of Late-Night Comedy on Political Knowledge
Sources of Variation df F partial η2 p
Between subjects [item characteristics] Response format (no. of answer choices) 1 3.127 .104 .076 Knowledge difficulty (% correct) 1 10.972 .289 .003 Knowledge domain 5 1.037 .161 .237Error 27 (0.002)Within subjects [political attentiveness] Political attentiveness 1.873 1.279 .045 .286 Attentiveness × format 1.873 0.887 .032 .412 Attentiveness × difficulty 1.873 3.822 .124 .031 Attentiveness × domain 9.364 1.472 .214 .182Error 50.563 (0.001)
Note: Degrees of freedom in the within subjects effects are Greenhouse-Geisser adjusted degrees of freedom because a series of outcome variables does not have orthogonal error structure. Knowledge domain is entered as a fixed factor and response format and item difficulty are entered as covariates. Different sample sizes are considered.
16 Communication Research XX(X)
As any study, ours has several limitations. Our model assumes that all late-night comedy programs are similar in content and presentation style. Recent evidence suggests that greater attention to within genre distinctions could enrich future research, because various programs have different audiences, with The Daily Show fans being more informed (Young, 2006); dif-ferent presentation styles, with some programs resembling entertainment talk shows and oth-ers parodying traditional newscasts (Baym, 2005); and different content, with The Daily Show providing in-depth information that may be missing from network news (Fox et al., 2007; Jones, 2007). To the extent that content, humor, and style differ across shows, our hypotheses regarding late-night comedy are generalizations. Also, to the extent that these idiosyncrasies affect what knowledge can be gained and who can acquire it (Brewer & Cao, 2006), our results might have obscured some effects. In order to capture these effects, studies should be equipped with more refined measures, distinguishing between specific shows, and improved research design, ideally combining content analysis with representative samples.
In addition, because the NAES 2004 questionnaires provided response alternatives to the political knowledge questions, our results only speak to the effects that late-night comedy has on information recognition rather than recall. It is thus unclear whether similar effects would transpire had respondents been asked to recall candidate names from memory. Inasmuch as individual motivation to learn, engagement with a message, and central information processing
.8.9
11.
11.
2
Od
ds
Rat
io f
or
Bei
ng
Co
rrec
t to
Inco
rrec
t A
nsw
er
Difficult Items Moderate Items Easy Items
Attentive Citizens Ordinary CitizensInattentive Citizens
Figure 2. Box-Whisker plot contrasting effect sizes of late-night comedy on knowledge for three citizen categoriesNote: Knowledge Item Difficulty categories were created by thrichotomizing the continous measure (N = 35): Difficult (below 45%, n = 11); Moderate (45 ~ 62%, n = 12); Easy (above 62 %, n = 12).
Baek and Wojcieszak 17
lead to greater recall, whereas incidental exposure aids recognition (Hollander, 2005; Shoe-maker, et al., 1989), and inasmuch as the audience turns to late-night comedy for entertainment, is less interested in politics, and only incidentally exposed to political messages (Prior, 2003), our effects would likely be weaker. Accordingly, previous research finds that viewing late-night comedy is positively associated with information recognition and negatively with recall (Hollander, 2005). In sum, our study might overestimate the effects that late-night comedy has on political knowledge. At the same time, such overestimation would be uniform across various questions and domains and therefore the central patterns reported here would not change.
Alternatively, our analysis might actually underestimate the effects produced by late-night comedy. Because the National Annenberg Election Study focuses on campaign dynamics, all political knowledge questions—apart from those in the general knowledge category—pertain to presidential candidates and their issue stances. As a result, the dif-ferentiation between the generally lighter topics and the more substantive political issues is not as clear-cut as it is in other studies. Had the human interest or social issues category, for example, contained questions about more dramatic events or publicized facts, exposure to late-night comedy would perhaps produce stronger effects within some political knowl-edge domains and on some political knowledge items (Prior, 2003).
Also, our study captures political learning in a relatively narrow way and does not tap the subtle contributions made by late-night comedy in realms other than factual knowl-edge. In addition to factual knowledge about candidates, soft news impact candidate evalu-ations (Baumgartner & Morris, 2006) and also attitudes and perceptions (Baum, 2005; Moy et al., 2006; Pfau et al., 2001; Young; 2004). All these effects may facilitate learning by providing heuristic cues that “help people to make reasoned political judgments” (Baum 2003b, p. 174). Future studies that assess the links between factual knowledge gain and informational shortcuts, heuristic cues, or attitudinal effects would shed light on whether, and for whom, these subtle effects influence long-term retention.
Finally, the meta-analytic approach might not provide precise individual-level effects. While our analysis sketches the overall pattern, a panel design covering a large national sample and repeatedly measuring diverse items using different questionnaire formats within the same person, is needed to detect such effects. A multilevel model would also help to uncover the two-level effects: those produced by late-night comedy on individual level and those produced by knowledge item difficulty on measurement level (Raudenbush & Bryk, 2002). Although those two designs would be ideal, our dataset is advantageous in that the sample size is large. Because about only a quarter of a population watches late-night comedy, only large samples can detect the effects and provide reliable and stable statistics. Our findings suggest that the minimum sample size is 1,000, if nationally repre-sentative sample is gathered via popular random methods (e.g., Random Digit Dialing), and especially so when the outcome variable has a skewed distribution or is insensitive to variations in the predictor variable.
Despite these limitations, our findings emphasize important considerations for future research. First and foremost, political knowledge items need to be differentiated in order to find subtle effects that media exposure has on learning. That is, summing individual items, especially when knowledge gain from media exposure is an outcome variable, should be avoided. Although measurement simplicity is a virtue when constructing parsimonious
18 Communication Research XX(X)
theories, overlooking particularities and not distinguishing among diverse items may obscure important patterns. When a particular design requires summing, researchers ought to report appropriate intraclass correlations, reliability, or homogeneity coefficients for binary response items (e.g., KR-20, Kuder & Richardson, 1937; Loevinger’s H, Loevinger, 1948; see Hemker, Sijtsma, & Molenaar, 1995).
In a similar vein, studies on knowledge acquisition need to account for varying response option formats in survey questionnaires, as those formats could influence the results and produce certain effects. While we do not find substantial effects, there might be at least some possibility that findings are attributable to the form in which responses are presented rather than to genuine knowledge. Although our study cannot estimate the magnitude of the effects produced by response formats, research that accounts for answer choices in the design might be able to shed light on this issue. In addition, we provide some evidence that increasing the number of answer choices may heighten the predictive or discriminative power that media exposure has on political knowledge. Together these results suggest that future scholarship should attempt to implement standardized measurement methods, so that the results from one study are comparable to those detected using different datasets, thus allowing communication scholars to make broader claims regarding media effects (see also Delli Carpini & Keeter, 1993)
Finally, evaluating the contributions that late-night comedy makes to citizenry depends on the philosophical or theoretical approach that accompanies the evaluation. Learning effects do exist but are confined to the relatively easy or widely known political knowledge and to the politically inattentive citizens. To the elitists’ critics, these circumscribed effects might further confirm that the elites are justified to distrust the public, which is ignorant about the complex political world and easily mobilized by demagogues, and that democ-racy led by ordinary citizens is a highly imperfect system that cannot be remedied by the media (Lippmann, 1922). According to the information generalists, on the other hand, democracy is just fine with citizens who are knowledgeable about general issues (Delli Carpini & Keeter, 1996). The media’s role is not to educate omnipotent citizens but rather to create “citizens who are good enough” and alert when a political system is failing (Zaller, 2003). Late-night comedy is thus beneficial because it provides some information for some citizens and might increase their interest, self-efficacy, and participation (Baum, 2005; Young, 2006).
Yet another useful perspective when evaluating late-night comedy comes from the theo-rists who see the media as reinforcing social inequalities (Katz, 2001; Tichenor, Donohue, & Olien, 1970). The accessible blend of news and enjoyable entertainment might decrease the knowledge gap because it equips otherwise withdrawn citizens with some political awareness (Gaziano, 1983). Although late-night comedy could increase disparities for more high-profile information, it could also spur political curiosity among the inattentive citizens, offer the context necessary to understand more complex stories, and ultimately pull those citizens back into the democratic process. According to this hypothesis, late-night comedy programs would serve “as gateways to more traditional news use” and con-tribute to “an equalizing effect over time in which political engagement is no longer as strongly correlated with attentiveness to high-profile political stories” (Young & Tisinger,
Baek and Wojcieszak 19
2006, p. 116). Because we were concerned with questions that theoretically and method-ologically precede these effects, the relationship between gains in relatively easy knowl-edge and further information seeking or political participation is open to scrutiny.
All in all, showing that the contributions that late-night comedy makes to informed citi-zenry are quite limited in nature and highly circumscribed in scope does not support one theoretical perspective or resolve the ongoing debate. It does, however, confirm Sch-ramm’s (1961) notion that the media affect some people sometimes, and offers suggestions on how to measure which media or which formats affect which citizens in which specific knowledge areas.
Acknowledgments
The authors would like to thank Dr. Michael X. Delli Carpini, Dr. Joseph N. Cappella, Ashley Sanders-Jackson, Cabral Bigman, anonymous reviewers, and the editor for valuable comments and suggestions.
Declaration of Conflicting InterestsThe authors declared no potential conflicts of interest with respect to the authorship and/or
publication of this article.
Funding
The authors received no financial support for the research and/or authorship of this article.
Appendix
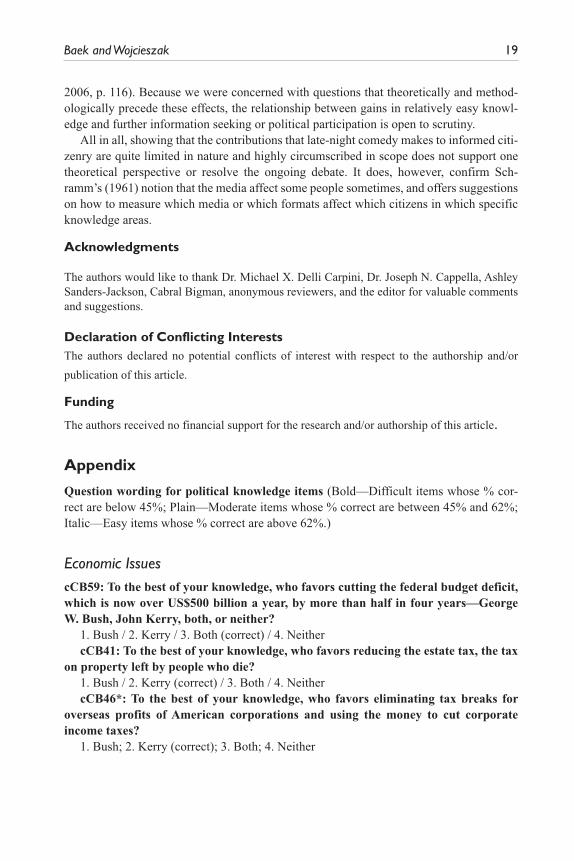
Question wording for political knowledge items (Bold—Difficult items whose % cor-rect are below 45%; Plain—Moderate items whose % correct are between 45% and 62%; Italic—Easy items whose % correct are above 62%.)
Economic IssuescCB59: To the best of your knowledge, who favors cutting the federal budget deficit, which is now over US$500 billion a year, by more than half in four years—George W. Bush, John Kerry, both, or neither?
1. Bush / 2. Kerry / 3. Both (correct) / 4. NeithercCB41: To the best of your knowledge, who favors reducing the estate tax, the tax
on property left by people who die?1. Bush / 2. Kerry (correct) / 3. Both / 4. NeithercCB46*: To the best of your knowledge, who favors eliminating tax breaks for
overseas profits of American corporations and using the money to cut corporate income taxes?
1. Bush; 2. Kerry (correct); 3. Both; 4. Neither
20 Communication Research XX(X)
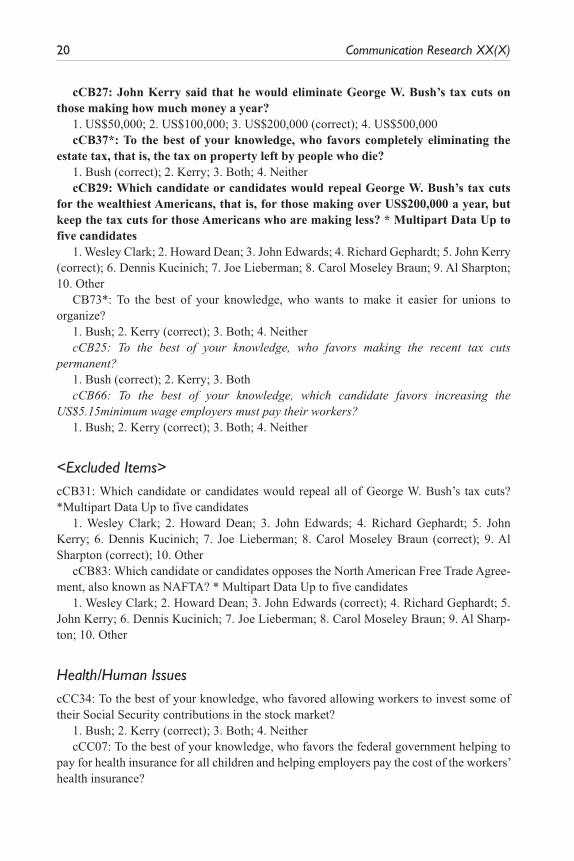
cCB27: John Kerry said that he would eliminate George W. Bush’s tax cuts on those making how much money a year?
1. US$50,000; 2. US$100,000; 3. US$200,000 (correct); 4. US$500,000cCB37*: To the best of your knowledge, who favors completely eliminating the
estate tax, that is, the tax on property left by people who die?1. Bush (correct); 2. Kerry; 3. Both; 4. NeithercCB29: Which candidate or candidates would repeal George W. Bush’s tax cuts
for the wealthiest Americans, that is, for those making over US$200,000 a year, but keep the tax cuts for those Americans who are making less? * Multipart Data Up to five candidates
1. Wesley Clark; 2. Howard Dean; 3. John Edwards; 4. Richard Gephardt; 5. John Kerry (correct); 6. Dennis Kucinich; 7. Joe Lieberman; 8. Carol Moseley Braun; 9. Al Sharpton; 10. Other
CB73*: To the best of your knowledge, who wants to make it easier for unions to organize?
1. Bush; 2. Kerry (correct); 3. Both; 4. NeithercCB25: To the best of your knowledge, who favors making the recent tax cuts
permanent?1. Bush (correct); 2. Kerry; 3. BothcCB66: To the best of your knowledge, which candidate favors increasing the
US$5.15minimum wage employers must pay their workers?1. Bush; 2. Kerry (correct); 3. Both; 4. Neither
<Excluded Items>cCB31: Which candidate or candidates would repeal all of George W. Bush’s tax cuts? *Multipart Data Up to five candidates
1. Wesley Clark; 2. Howard Dean; 3. John Edwards; 4. Richard Gephardt; 5. John Kerry; 6. Dennis Kucinich; 7. Joe Lieberman; 8. Carol Moseley Braun (correct); 9. Al Sharpton (correct); 10. Other
cCB83: Which candidate or candidates opposes the North American Free Trade Agree-ment, also known as NAFTA? * Multipart Data Up to five candidates
1. Wesley Clark; 2. Howard Dean; 3. John Edwards (correct); 4. Richard Gephardt; 5. John Kerry; 6. Dennis Kucinich; 7. Joe Lieberman; 8. Carol Moseley Braun; 9. Al Sharp-ton; 10. Other
Health/Human IssuescCC34: To the best of your knowledge, who favored allowing workers to invest some of their Social Security contributions in the stock market?
1. Bush; 2. Kerry (correct); 3. Both; 4. NeithercCC07: To the best of your knowledge, who favors the federal government helping to
pay for health insurance for all children and helping employers pay the cost of the workers’ health insurance?
Baek and Wojcieszak 21
1. Bush; 2. Kerry (correct); 3. Both; 4. NeithercCC26: To the best of your knowledge, which candidate favors allowing the federal
government to negotiate with drug companies for lower prescription drug prices for senior citizens?
1. Bush; 2. Kerry (correct); 3. Both; 4. NeithercCC22: To the best of your knowledge, who favors the Medicare prescription drug law
that was recently enacted?1. Bush (correct); 2. Kerry; 3. Both; 4. Neither
<Excluded Items>cCC13: Which candidate or candidates supports a single-payer health care plan? * Multi-part Data Up to five candidates
1. Wesley Clark; 2. Howard Dean; 3. John Edwards; 4. Richard Gephardt; 5. John Kerry; 6. Dennis Kucinich (correct); 7. Joe Lieberman; 8. Carol Moseley Braun; 9. Al Sharpton; 10. Other
cCC11: Which candidate or candidates has a plan that he says would provide health insurance to all Americans? * Multipart Data Up to five candidates
1. Wesley Clark; 2. Howard Dean; 3. John Edwards; 4. Richard Gephardt; 5. John Kerry; 6. Dennis Kucinich (correct); 7. Joe Lieberman; 8. Carol Moseley Braun; 9. Al Sharpton; 10. Other
Foreign AffairscCD29: Which candidate or candidates opposed the war in Iraq? * Multipart data up to five candidates.
1. Wesley Clark; 2. Howard Dean (correct); 3. John Edwards; 4. Richard Gephardt; 5. John Kerry; 6. Dennis Kucinich (correct); 7. Joe Lieberman; 8. Carol Moseley Braun; 9. Al Sharpton (correct)
cCD09: which candidate proposes moving 60,000 to 70,000 troops stationed in Europe and South Korea to other locations, including the United States, in the next decade?
1. Bush (correct); 2. Kerry; 3. Both; 4. NeithercCD12: To the best of your knowledge, who favors reinstating the military draft?1. Bush; 2. Kerry; 3. Both; 4. Neither (correct)cCD68: To the best of your knowledge, who wants to extend all provisions of the USA
Patriot Act in order to fight terrorism?1. Bush (correct); 2. Kerry; 3. Both; 4. NeithercCD27: To the best of your knowledge, who favored spending US$87 billion on Iraq
and Afghanistan last fall?1. Bush (correct); 2. Kerry; 3. Both; 4. Neither
Social/Other IssuescCE35: Who favors extending the federal law banning assault weapons?
22 Communication Research XX(X)
1. Bush; 2. Kerry; 3. Both (correct); 4. NeithercCG03: To the best of your knowledge, who wants to cut back punitive damages in
lawsuits?1. Bush (correct); 2. Kerry; 3. Both; 4. NeithercCG08: To the best of your knowledge, which candidate favors placing limits on how
much people can collect when a jury finds that a doctor has committed medical malpractice?
1. Bush (correct); 2. Kerry; 3. Both; 4. NeithercCE10: To the best of your knowledge, who favors federal funding of research on dis-
eases like Alzheimer’s using stem cells taken from human embryos?1. Bush; 2. Kerry (correct); 3. Both; 4. NeithercCE15: To the best of your knowledge, which candidate wants to make additional stem
cell lines from human embryos available for federally funded research on diseases like Parkinson’s?
1. Bush; 2. Kerry (correct); 3. Both; 4. Neither
<Excluded Items>cCH04: Just your best guess, can you tell me the yearly salary of a U.S. Supreme Court Justice?
1. US$193,000 (correct); 2. US$201,000; 3. US$193,000−US$201,000; 4. Less than US$193,000; 5. More than US$201,000
cCH07: Can you tell me the yearly salary of the President of the United States?1. US$400,000 (correct); 2. US$200,000; 3. US$200,000−US$400,000; 4. Less than
US$200,000; 5. More than US$400,000
Candidate IssuescDA23: Who is son of mill worker? Which candidate or candidates is the son of a
mill worker? * Multipart data up to five candidates1. Wesley Clark; 2. Howard Dean; 3. John Edwards (correct); 4. Richard Gephardt; 5. John
Kerry; 6. Dennis Kucinich; 7. Joe Lieberman; 8. Carol Moseley Braun; 9. Al Sharpton; 10. OthercDA29: Who was a trial lawyer? Which candidate or candidates was a trial
lawyer? * Multipart data up to five candidates1. Wesley Clark; 2. Howard Dean; 3. John Edwards (correct); 4. Richard Gephardt; 5.
John Kerry; 6. Dennis Kucinich; 7. Joe Lieberman; 8. Carol Moseley Braun; 9. Al Sharp-ton; 10. Other
cDA17: Who is a former prosecutor?1. Bush; 2. Kerry (correct); 3. Both; 4. NeithercDA27: Which candidate or candidates was governor of Vermont? * Multipart Data Up
to five candidates1. Wesley Clark; 2. Howard Dean (correct); 3. John Edwards; 4. Richard Gephardt; 5.
John Kerry; 6. Dennis Kucinich; 7. Joe Lieberman; 8. Carol Moseley Braun; 9. Al Sharpton; 10. Other
Baek and Wojcieszak 23
cDA25: Which candidate or candidates was a general? * Multipart Data Up to five candidates
1. Wesley Clark (correct); 2. Howard Dean; 3. John Edwards; 4. Richard Gephardt; 5. John Kerry; 6. Dennis Kucinich; 7. Joe Lieberman; 8. Carol Moseley Braun; 9. Al Sharp-ton; 10. Other
cDA02: Which candidate or candidates is a decorated Vietnam War veteran? *Multipart Data Up to five candidates
1. Wesley Clark (correct); 2. Howard Dean; 3. John Edwards; 4. Richard Gephardt; 5. John Kerry (correct); 6. Dennis Kucinich; 7. Joe Lieberman; 8. Carol Moseley Braun; 9. Al Sharpton; 10. Other
cDA04: Which of the candidates running for president is a decorated Vietnam veteran? * Multipart Data Up to five candidates
1. George W. Bush; 2. Wesley Clark (correct); 3. Howard Dean; 4. John Edwards; 5. Richard Gephardt; 6. John Kerry (correct); 7. Dennis Kucinich; 8. Joe Lieberman; 9. Carol Moseley Braun; 10. Al Sharpton; 11. Other
<Excluded Items>cDA21: Which candidate or candidates was majority leader in the U.S. House of Represen-tatives? * Multipart Data Up to five candidates
1. Wesley Clark; 2. Howard Dean; 3. John Edwards; 4. Richard Gephardt (correct); 5. John Kerry; 6. Dennis Kucinich; 7. Joe Lieberman; 8. Carol Moseley Braun; 9. Al Sharp-ton; 10. Other
cDA04: Which candidate or candidates ran for vice president in 2000 on the Demo-cratic ticket? * Multipart Data Up to five candidates
1. Wesley Clark; 2. Howard Dean; 3. John Edwards; 4. Richard Gephardt; 5. John Kerry; 6. Dennis Kucinich; 7. Joe Lieberman (correct); 8. Carol Moseley Braun; 9. Al Sharpton; 10. Other
General Political KnowledgecMC05: How much of a majority is required for the U.S. Senate and House to over-ride a presidential veto?
1. Two thirds (correct); 2. Other answer*cMC03: Who has the final responsibility to determine if a law is constitutional or not?1. President; 2. Congress; 3. Supreme Court (correct)cMC09: Do you happen to know which party has the most members in the United States
House of Representatives?1. Democratic; 2. Republican (correct)cMC07: Which one of the parties would you say is more conservative on the national level?1. Democratic; 2. Republican (correct)cMC01: Do you happen to know what job or political office is now held by Dick
Cheney?1. Vice president (correct); 2. Other answer*
24 Communication Research XX(X)
Notes
1. The following formula (see Lipsey & Wilson, 2001, p. 200) is used to calculated effect-size statistics,
ESði:e:;Effect SizeÞ ¼ 2 ·
ffiffiffiffiffiffiffiffiffiffiffiffiffiffiffiχ2
N � χ2
s
; (4)
where N denotes sample size, and χ2 is a sample statistic.
2. It should be noted that our approach slightly differs from conventional meta-analysis. While the χ2
statistic in conventional meta-analysis is bivariate (i.e., df = 1), our χ2 statistic comes from multivariate
analysis based on three degrees of freedom (i.e., main effect of late-night comedy and two interactions
between late night comedy and high and low attentiveness). Our strategy is similar to the meta-analytic
approach used in the context of multiple OLS regression (e.g., Greenwald, Hedges, & Laine, 1994) and
better suited for survey data and multivariate contexts. First, we are able to estimate improved model-
fits (i.e., likelihood ratio χ2) due to a set of additional three parameters using the same multivariate logit
equations across all knowledge items. Second, we estimate the logit transformed outcome for each item
using the same set of predictors across all models. While other multivariate meta-analyses are criticized
for unstable parameter estimates due to “the varying sets of independent variables” (Lipsey & Wilson,
2001, p. 67), our strategy is freed from this criticism.
3. This is suggested by homogeneity statistic, Q, which tests heterogeneity of different samples (Lipsey &
Wilson, 2001). Significant Q implies that samples in meta-analysis came from heterogeneous populations.
4. This modest association may be confounded by the fact that during the primaries, the average number of
response options in NAES 2004 was relatively high and the average proportion of correct responses was
relatively low, and was the opposite during the general election. Additional analyses tested this explana-
tion. We created four dichotomous variables representing campaign stages: Democratic Convention,
Republican Convention, Presidential Debate, and General Election, with the period after the Election
Day being a reference category. First, analyzing four general political knowledge items with varying dif-
ficulty levels but with the same number of response options found that the proportion of correct responses
was stable at different stages. This finding, however, may be limited to general political knowledge. Sec-
ond, the Pearson correlation between averaged response format (1/number of possible answer choices)
and averaged percentage of correct responses to all the available items was .26 (p < .001, n = 54,199),
and the significant correlation persists when controlling for election stages (r = .23, p < .001). These
analyses suggest that the detected patterns are not explained by the primary/general election effect.
References
Annenberg Policy Center. (2006). 2004 National Annenberg Election Study. Philadelphia: University of Pennsylvania.
Baum, M. (2002). Sex, lies, and war: How soft news brings foreign policy to the inattentive public. American Political Science Review, 96, 91-109.
Baum, M. A. (2003a). Soft news goes to war: Public opinion and American foreign policy in a new media age. Princeton, NJ: Princeton University Press.
Baum, M. (2003b). Soft news and political knowledge: Evidence of absence or absence of evidence? Political Communication, 20, 149-171.
Baek and Wojcieszak 25
Baum, M. (2005). Talking the vote: Why presidential candidates hit the talk show circuit. American Journal of Political Science, 49, 213-234.
Baumgartner, J., & Morris, J. S. (2006). The Daily Show effect: Candidate evaluations, efficacy, and the American youth. American Politics Research, 34, 341-267.
Baym, G. (2005). The Daily Show: Discursive integration and the reinvention of political journalism. Political Communication, 22, 259-276.
Berger, A. (1992). Popular culture genres: Theories and texts. Thousand Oaks, CA: Sage.Blumer, J., & Katz, E. (Eds.). (1974). The uses of mass communications: Current perspectives
on gratifications research. Beverly Hills, CA: Sage Press.Brewer, P., & Cao, X. (2006). Candidate appearances on soft news shows and public knowledge
about primary campaigns. Journal of Broadcasting & Electronic Media, 50, 18-35.Converse, P. E. (1964). The nature of belief systems in mass publics. In D. E. Apter (Ed.), Ideol-
ogy and discontent (pp. 206-261). New York, NY: Free Press.Delli Carpini, M. X., & Keeter, S. (1993). Measuring political knowledge: putting first things
first. American Journal of Political Science, 37, 1179-1206.Delli Carpini, M. X., & Keeter, S. (1996). What Americans know about politics and why it matters.
New Haven, CT: Yale University Press.Delli Carpini, M. X., & Williams, B. A. (2001). Let us infotain you: Politics in the new media
envrioment. In W. L. Bennet & R. M. Entman (Eds.), Mediated politics: Communication in the future of democracy (pp. 160-181). Cambridge, UK: Cambridge University Press.
DeVellis, R. F. (2003). Scale development: theory and applications (5th Ed). Newbury Park, CA: Sage
Dye, T. Zeigler, H., & Lichter, R. (1992). American politics in the media age. Pacific Grove, CA: Brooks/Cole.
Embretson, S. E., & Reise, S. P. (2000). Item response theory for psychologists (2nd ed.). Mahwah, NJ: Lawrence Erlbaum.
Fox, J., Koloen, G., & Sahin, V. (2007). No joke: A comparison of substance in The Daily Show with Jon Stewart and broadcast network television coverage of the 2004 presidential elec-tion campaign. Journal of Broadcasting and Electronic Media, 51, 213-227
Gaziano, C. (1983). The “knowledge gap”: An analytical review of media effects. Communication Research, 10, 447-486.
Graber, D. (2001). Processing politics: Learning from television in the Internet age. Chicago, IL and London: University Press of Chicago.
Greenwald, R., Hedges, L. V., & Laine, R. D. (1994). When reinventing the wheel is not necessary: A case study in the use of meta-analysis in education finance. Journal of Education Finance, 20, 1-20.
Hemker, B. T., Sijtsma, K., & Molenaar, I. W. (1995). Selection of unidimensional scales from a multidimensional item bank in the polytomous Mokken IRT model. Applied Psychological Measurement, 19, 337-352.
Hollander, B. A. (2005). Late-night learning: Do entertainment programs increase political campaign knowledge for young viewers? Journal of Broadcasting & Electronic Media, 49, 402-415.
Hunter, J. E., & Schmidt, F. L. (2004). Methods of meta-analysis: Correcting error and bias in research findings (2nd ed.). Thousand Oaks, CA: Sage.
Jamieson, K. H., & Kenski, K. (2006). Why the National Annenberg Election Survey? In D. Romer, K. Kenski, K. Winneg, C. Adasiewicz, & K. H. Jamieson (Eds.). Capturing campaign
26 Communication Research XX(X)
dynamics: The National Annenberg Election Survey 2000 and 2004 (pp. 1-13). Philadelphia: University of Pennsylvania Press
Jones, J. (2007). “Fake” news versus “real” news as sources of political information: The Daily Show and postmodern political reality. In K. Riegert (Ed.), Politicotainment: Television’s take on the real (pp. 129-149). New York: Peter Lang.
Katz, E. (2001). Media effects. International Encyclopedia of the Social and Behavioral Sci-ences (pp. 9472-9479). Oxford, UK: Elsevier Science.
Kim, Y. M., & Vishak, J. (2008). Just Laugh! You Don’t Need to Remember: The effects of entertainment media on political information acquisition and information processing in political judgment. Journal of Communication, 58, 338-360.
King, G., & Zheng, L. (2001). Logistic regression in rare events data. Political Analysis, 9, 137-161.Kuder, G. F., & Richardson, M. W. (1937). The theory of the estimation of test reliability,
Psychometrika, 2, 151-160.Kuipers, G. (2006). Good humor, bad taste. Berlin, Germany: Mouton de Gruyter.Lippman, W. (1922). Public opinion. New York: Harcourt, Brace.Lipsey, M., & Wilson, D. (2001). Practical meta-analysis. Thousand Oaks, CA: Sage.Loevinger, J. (1948). The technic of homogeneous tests compared with some aspects of “scale
analysis” and factor analysis. Psychological Bulletin, 45, 507-529.Moy, P., Xenos, M. A., & Hess, V. K. (2006). Priming effects of late-night comedy. International
Journal of Public Opinion Research, 18, 198-210.Nabi, R. L., Moyer-Gusé, E., & Byrne, S. (2007). All joking aside: A serious investigation into the
persuasive effect of funny social issue messages. Communication Monographs, 74(1), 29-54.Niven, D., Lichter, S. R., & Amundson, D. (2003). The political content of late-night comedy.
Press/Politics, 8, 118-133.Nunnally, J. C. (1978). Psychometric theory (2nd ed.). New York: McGraw-Hill.Patterson, T. E. (1996). Bad news, period. Political Science and Politics, 29(1), 17-20.Pew Center for the People and the Press. (2000). Sources for campaign news: The tough job
of communicating with voters. Retrieved August 14, 2009, from http://people-press.org/reports/print.php3?PageID=243
Pfau, M., Cho, J., & Chong, K. (2001). Communication forms in U.S. presidential campaigns: Influences on candidate perceptions and the democratic process. Press/Politics, 6, 88-105.
Price, V., & Zaller, J. (1993). Who gets the news? Alternative measures of news reception and their implications for research. Public Opinion Quarterly, 57, 133-164
Prior, M. (2003). Any good news in soft news? The impact of soft news preference on political knowledge. Political Communication, 20, 149-171.
Prior, M. (2005). News versus entertainment: How increasing media choice widens the gap in political knowledge and turnout. American Journal of Political Science, 49, 577-592.
Project for Excellence in Journalism. (1998). Changing definitions of the news: Retrieved August 29, 2009, from http://www.journalism.org/sites/journalism.org/files/Changing-DefinitionsofNews.pdf
Rasch, G. (1960). Probabilistic models for some intelligence and attainment tests. (Copenhagen, Danish Institute for Educational Research). Expanded edition (1980), with foreword and afterword by B. D. Wright. Chicago: The University of Chicago Press.
Raudenbush, S. W., & Bryk, A. S. (2002). Hierarchical linear models: Applications and data analysis methods. Thousand Oaks, CA: Sage.
Baek and Wojcieszak 27
Riegert, K., (Ed.). (2007). Introduction. In Politicotainment: Television’s take on the real (pp. 1-19). New York: Peter Lang.
Romer, D. (2006). Time series models. In D. Romer, K. Kenski, K. Winneg, C. Adasiewicz, & K. H. Jamieson (Eds.), Capturing campaign dynamics, 2000 & 2004 (pp. 165-242). Phila-delphia: University of Pennsylvania Press.
Rosenthal, P. (2003, April 25). The newsiest show at 10 isn’t your late local news. Chicago Sun-Times. Retrieved August 29, 2009, from LexisNexis database.
Schramm, W. (1961). How communication works. In W. Schramm (Ed.), The process and effects of mass communication (pp. 3-26). Urbana, IL: University of Illinois Press.
Schramm, W., & Roberts, D. F. (Eds.). (1971). The process and effects of mass communication (Rev. ed.). Urbana: University of Illinois Press.
Shoemaker, P. J., Schooler, C., & Danielson, W. A. (1989). Involvement with the media: Recall versus recognition of election information. Communication Research, 16, 78-103.
Sotirovic, M., & McLeod, J. M. (2004). Knowledge as understanding: The information process-ing approach to political learning. In L. L. Kaid (Ed.), Handbook of political communication research. Mahwah, NJ: Lawrence Erlbaum.
Stimson, J. A. (2004). Tides of consent: How public opinion shapes American politics. New York, NY: Cambridge University Press.
Tichenor, P. J., Donohue, G. A., & Olien, C. N. (1970). Mass media and the differential growth in knowledge. Public Opinion Quarterly, 34, 158-170.
Young, D. G. (2004). Late-night comedy in election 2000: Its influence on candidate trait rat-ings and the moderating effects of political knowledge and partisanship. Journal of Broad-casting & Electronic Media, 48, 1-22.
Young, D. G. (2006). Late-night comedy and the salience of the candidates’ caricatured traits in the 2000 election. Mass Communication and Society, 9, 339-366.
Young, D. G. (2008). The privileged role of the late-night joke: Exploring humor’s role in dis-rupting argument scrutiny. Media Psychology, 11, 119-142.
Young, D. G., & Tisinger, R. M. (2006). Dispelling late-night myths: News consumption among late-night comedy viewers and the predictors of exposure to various late-night shows. Harvard International Journal of Press/Politics, 11, 113-134.
Young, D. G., Tisinger, R., Kenski, K., & Romer, D. (2006). The power of numbers: Examining subpopulations with the NAES. In D. Romer, K. Kenski, K. Winneg, C. Adasiewicz, & K. H. Jamieson (Eds.), Capturing campaign dynamics, 2000 & 2004 (pp. 244-268). Philadelphia: University of Pennsylvania Press.
Zaller, J. (2003). A new standard of news quality: Burglar alarms for the monitorial citizen. Political Communication, 20, 109-130.
Bios
Young Min Baek (MS, journalism and mass communication, Iowa State University) is a doc-toral student at the Annenberg School for Communication at the University of Pennsylvania.
Magdalena E. Wojcieszak (MA sociology, University of Warsaw; PhD communications, Annenberg School for Communication, University of Pennsylvania) is an associate professor of political communication at the IE School of Communication, IE University, Segovia, Spain.


