Embed Size (px)
Citation preview


Published ByEPRA Publishing
CC License
Chief EditorDr. A. Singaraj, M.A., M.Phil., Ph.D.
Managing Editor Mrs.M.Josephin Immaculate Ruba
EDITORIAL ADVISORS1. Prof. Dr.Said I.Shalaby, MD,Ph.D. Professor & Vice President
Tropical Medicine,Hepatology & Gastroenterology, NRC,Academy of Scientific Research and Technology,Cairo, Egypt.
2. Dr. Mussie T. Tessema, Associate Professor,Department of Business Administration,Winona State University, MN, United States of America,
3. Dr. Mengsteab Tesfayohannes,Associate Professor,Department of Management,Sigmund Weis School of Business,Susquehanna University,Selinsgrove, PENN, United States of America,
4. Dr. Ahmed SebihiAssociate ProfessorIslamic Culture and Social Sciences (ICSS),Department of General Education (DGE), Gulf Medical University (GMU),UAE.
5. Dr. Anne Maduka,Assistant Professor, Department of Economics,Anambra State University,Igbariam Campus, Nigeria.
6. Dr. D.K. Awasthi, M.SC., Ph.D.Associate ProfessorDepartment of Chemistry,Sri J.N.P.G. College,Charbagh, Lucknow,Uttar Pradesh. India
7. Dr. Tirtharaj Bhoi, M.A, Ph.D, Assistant Professor,School of Social Science,University of Jammu,Jammu, Jammu & Kashmir, India.
8. Dr. Pradeep Kumar Choudhury, Assistant Professor,
Institute for Studies in Industrial Development, An ICSSR Research Institute,New Delhi- 110070, India.
9. Dr. Gyanendra Awasthi, M.Sc., Ph.D., NETAssociate Professor & HODDepartment of Biochemistry,Dolphin (PG) Institute of Biomedical & NaturalSciences,
Dehradun, Uttarakhand, India.10. Dr. C. Satapathy, Director, Amity Humanity Foundation, Amity Business School, Bhubaneswar, Orissa, India.
ISSN (Online): 2455-7838SJIF Impact Factor (2021):8.013
Research &Development
EPRA International Journal of
(IJRD)Monthly Peer Reviewed & Indexed
International Online Journal
ISI I.F. Value : 1.241
Indexed By:
DOI : 10.36713/epra2016
Volume: 6, Issue:8, August 2021

SJIF Impact Factor 2021: 8.013| ISI I.F.Value:1.241| Journal DOI: 10.36713/epra2016 ISSN: 2455-7838(Online) EPRA International Journal of Research and Development (IJRD)
Volume: 6 | Issue: 8 | August 2021 - Peer Reviewed Journal
CONTENTS
S.NO TITLE AUTHOR/S PAGES 1 TRAFFIC RULE MANAGEMENT SYSTEM
USING WIRELESS SENSOR NETWORK
Shivani Durge, Prof. Pragati Patil, Prof. Gajanan Patle
1-2
2 GRAB TAXI USING DISPAQ Abdhesh Kumar Sah*, Manish Kumar Jha*,
Ms. Suganya R
3-6
3 DENTAL HEALTH OF OLDER PEOPLE IN ANDIJAN REGION
IsayevaMuqaddashon Makhammadovna
7-9
4 LEADERSHIP STYLES AND REMUNERATION AS PREDICTORS TO TEACHERS’ JOB SATISFACTION IN SENIOR SECONDARY SCHOOLS IN BAUCHI STATE, NIGERIA
Prof ( Mrs ). C. E. Edemenang, Dr. Shuaibu Babawuro,
Dr. Abubakar Garba, Zalanga Dorothy Timothy
10-19
5 SOLAR ELECTRIC WHEELCHAIR WITH A FOLDABLE PANEL https://doi.org/10.36713/epra8021
Jainam J. Sanghvi, Maulik Y. Shah, Jay K. Fofaria
20-25
6 CHINESE BODY CLOCK: IN-DEPTH REVIEW BASED PERSPECTIVE
Dr. Jaya Bharti 26-29
7 ACCIDENT DETECTION AND REAL TIME INFORMATION USING IOT TO AUTOMOBILES
Nagesha K T, Ms. Sithara Chondamma
, Muhammed Shafeeq K R
30-34
8 EFFECTIVE COMMUNICATION SKILLS AMONG MARRIED COUPLES: AN OVERVIEW https://doi.org/10.36713/epra8135
Amuta Arumugam, Dr.Ganesan Shanmugavelu, PhD,
Dr.Balakrishnan Parasuraman,Phd, Dr.Khairi Ariffin, PhD
Dr.M.Nadarajan Manickam, Phd, Manimaran Vadivelu Kanaisan Kanapathy
35-45
9 A STUDY ON CONSUMER PREFERENCE AND SATISFACTION ABOUT SELECT BRANDED CLOTHING FOR MEN (WITH SPECIAL REGARD TO TIRUPUR CITY)
Dr.M.Kalimuthu, Mr.S.Deepak
46-49
10 ECOTOURISM DEVELOPMENT IN A REMOTE DISTRICT OF INDIA: A STUDY OF TAWANG, ARUNACHAL PRADESH
Ashi Lama 50-62
11 FOREIGN EXPERIENCES IN THE FORMATION OF NON-PROFESSIONAL TEACHERS' ENGLISH LEARNING MOTIVATION
Tursunnazarova Elvira Taxirovna 63-66
12 MADRASAH EDUCATION IN KHIVA KHANATE AND ITS PECULIARITIES
M.T.Jumaniyozova 67-71
13 THE ROLE OF IMAGINATIVE LITERATURE IN THE COMPREHENSIVE DEVELOPMENT OF PRESCHOOL CHILDREN
Daminova Shoxista Farkhodovna 72-74
14 FORMATION OF COMMUNICATIVE COMPETENCE OF FUTURE TEACHERS IN THE CONTEXT OF IDEAS OF A PERSONALLY-ORIENTED APPROACH
Egamnazarov Murod Yusupovich 75-77
15 ROLE OF PLANETS, STARS AND BHAVA’S IN MEDICAL ASTROLOGY
S Sharma, Sri Prathyangira Swamy
78-80
16 PETROGENETIC MODELING OF THE GRANITIC ROCKS IN AND AROUND LODHMA, DIST RANCHI, JHARKHAND, INDIA https://doi.org/10.36713/epra8177
Dr. Jayant Sinha 81-93
17 RURAL HAND BLOCK PRINT FABRICS IN INDIA: INTRODUCTORY REVIEW BASED STUDY
Dr. Hitaishi Singh 94-97
18 AWARENESS TOWARDS SOCIAL ENTREPRENEURSHIP: A QUALITATIVE STUDY IN DAKSHINA KANNADA DISTRICT, KARNATAKA
Vinyas .H, Dr. Uday Kumar M.A.
98-102
19 HEALTH INSECURITY: A STUDY OF MALARIA AS A HINDRANCE TO DEVELOPMENT
C.Lalengkima, Dr Thanminlian
103-107
20 CONCEPTUAL ADVERTISING LITERACY LEVEL OF CHILDREN IN INDIA https://doi.org/10.36713/epra8228
Dr. Kuldeep Chaudhary, Asha
108-114
21 A STUDY IN MEDICAL ASTROLOGY ON THE INFLUENCE OF LEO LAGNA ON DIABETES
S Sharma, Sri Prathyangira Swamy
115-118
22 A STUDY ON SOCIO-ECONOMIC STATUS OF FLORICULTURE FARMERS IN SHIRVA
Mr.Prashanth M D 119-122
23 EFFECTS OF DIABETES IN LIBRA LAGNA BASED ON MEDICAL ASTROLOGY
S Sharma, Sri Prathyangira Swamy
123-126
24 INHERITANCE OF MORPHOLOGICAL CHARACTERS IN F1, F2, F1В1 PLANTS OBTAINED FROM HYBRIDIZATION OF SOME POLYMORPHIC SPECIES CORRESPONDING TO THE SECTION MAGNIBRACTEOLATA
N.N. Nabieva, B.Kh. Amanov
127-132
25 AN ANALYSIS TO WOMEN AND CHILD WELFARE DEPARTMENT IN KOLHAPUR DISTRICT https://doi.org/10.36713/epra8170
Dr. Shashikant Subrao Sanghraj 133-136
26 IMPACTS ON SIVACHARYA YOGA’S IN GEMINI LAGNA
P Valsala, Sri Prathyangira Swamy
137-140
27 BANGLADESH'S COOPERATIVE LEADERSHIP: PATTERNS, ISSUES, AND PROSPECTS
Mrinmoy Mitra, SK Muhammad Yeasin
141-147
28 AYURVEDIC MANAGEMENT OF KITIBA KUSHTA W.S.R TO PSORIASIS – A CASE STUDY
Karbari Santosh, G K Prasad
148-152
29 OBSERVATIONAL ANALYSIS ON RESULT OF YSZ COATED PISTON CROWN ON THE BEHAVIOUR OF A PETROL ENGINE https://doi.org/10.36713/epra8270
Muhammad Asad Riaz 153-160
30 ADOLESCENTS ENGAGING IN SEXUAL Amuta Arumugam 161-168

ACTIVITY: AN OVERVIEW https://doi.org/10.36713/epra8265
Dr.Ganesan Shanmugavelu,PhD Dr.Sharmini Siva Vikaraman, Phd, Dr.M. Nadarajan Manickam,Phd
Jagdave Singh Avtar Singh, Manimaran Vadivelu Kanaisan Kanapathy
31 BOLOGNA PROCESS: CREDIT-MODULE SYSTEM
Khusainova Firuza Toxirovna 169-174
32 STRUCTURAL-SEMANTIC TYPES OF ADDRESSESIN VERSES BY A. AHMATOVA
Yevkocheva Z.M. 175-178
33 KHOREZM REGION'S INDUSTRIAL POLICY AND ITS ESSENCE
Avazov Ozod Rajabbayevich 179-181
34 THE ROLE OF DR. SHERALI TURDIEV BETWEEN UZBEK AND TATAR LITERARY RELATIONS https://doi.org/10.36713/epra8306
Turdieva Khulkar Komilovna 182-185
35 A STUDY OF SIVACHARYA’S YOGA P Valsala, Sri Prathyangira Swamy
186-188
36 POETIC EXPRESSIONS IN THE NOVEL “A THOUSAND ONE PERSON”
Ataboeva Gozal Farkhodovna 189-191
37 PRIORITY DIRECTIONS FOR SUSTAINABLE GROWTH IN THE PRODUCTION OF BUILDING MATERIALS IN THE REPUBLIC OF UZBEKISTAN
Kasimova Z.G. 192-194
38 ECOSYSTEM OF THE KARADARYA VALLEY
Sharobitdin J. Tojiboev, Sardorbek T. Mamasoliev
195-200
39 IMPACT OF PANDEMIC TOWARDS MIGRATION OF LABORER: THE EMERGENCE OF INVISIBLE INDIA
Arun Kumara Senapati, Prof. Subash Chandra Parida
201-205
40 THE NATURE AND FUNCTION OF CONTEMPORARY LITERARY THEORY: A STUDY IN OUTCOME-BASED LEARNING IN LITERATURE
Dr Valiur Rahaman 206-210
41 PREPARATION AND IN VITRO CHARACTERIZATION OF SUSTAINED RELEASE TABLETS OF VALSARTAN
N.Sagar Dr.Rama Krishna Mungi
Dr.K.Balaji
211-222
42 SOIL STABILIZATION OF THE SOIL BY USING DIFFERENT WASTE MATERIALS – A REVIEW https://doi.org/10.36713/epra8334
Tanna Manohar, Jyoti Prakash Giri
223-226
43 THE IMPACT OF CONCEPT MAPPING AS A TEACHING STRATEGY ON THE STUDENTS’ ACHIEVEMENT AND INTEREST IN ENGLISH https://doi.org/10.36713/epra8348
Mr. Rommel P. Manzon 227-232
44 INFLUENCES ON REACTION TIME AND AGILITY RESPONSE TO SHADOW TRAINING AMONG FOOTBALL PLAYERS
D. Chochalingam 233-236

SJIF Impact Factor 2021: 8.013| ISI I.F.Value:1.241| Journal DOI: 10.36713/epra2016 ISSN: 2455-7838(Online)
EPRA International Journal of Research and Development (IJRD)
Volume: 6 | Issue: 8 | August 2021 - Peer Reviewed Journal
2021 EPRA IJRD | Journal DOI: https://doi.org/10.36713/epra2016 | www.eprajournals.com |1 |
TRAFFIC RULE MANAGEMENT SYSTEM USING WIRELESS SENSOR NETWORK
Shivani Durge1, Prof. Pragati Patil2, Prof. Gajanan Patle3
1M.Tech Scholar, Department of Computer Science and Engineering,
Abha Gaikwad Patil College of Engineering, Nagpur
2,3Assistant Professor, Department of Computer Science and Engineering, Abha Gaikwad Patil College of Engineering, Nagpur
ABSTRACT From the time in memorial, Traffic Rule Management System has remained a primary concern and today the rules of
the roads. The rules apply to all road users such as drivers, pedestrians, motorcyclists, horse riders, cyclists. The rules
ask us to take personal responsibility for our use of the roads, and in doing so become better, safe and more socially
responsible road user. It is very important to follow to traffic rules so that we can save lives and prevent injury by
changing our behavior.
Now a days the world is diverting to digital technology whether its online money transaction or online filling
form. So why not challan send to the vehicle users through digital technology rather than sending hardcopy from currier
by scanning the number plate of that vehicle. Here we are using Wireless Sensor Network Technology which will helps
us to include GPS system by which head of the traffic police can track the location of traffic police of over the city. Also
In case, if any vehicle met with an accident than GPS system will help to reach to that particular location.
INDEX TERM- Wireless Sensor Network, Unauthorized Vehicles, GPS System, Vehicle Surveillance, Vehicle
Identification.
INTRODUCTION
Sensors link the physical with the digital world by capturing and revealing real-world phenomena these into a form that can be processed, stored, and acted upon. Integrated into numerous devices, machines, and environments, sensors provide a tremendous societal benefit. They can help to avoid catastrophic infrastructure failures, conserve precious natural resources, increase productivity, enhance security, and enable new applications such as context-aware systems and smart home technologies. The phenomenal advances in technologies such as very large scale integration (VLSI), micro electromechanical systems (MEMS), and wireless communications further contribute to the widespread use of distributed sensor systems.
For example, the impressive developments in semiconductor technologies continue to produce
microprocessors with increasing processing capacities, while at the same time shrinking in size. The miniaturization of computing and sensing technologies enables the development of tiny, low-power, and inexpensive sensors, actuators, and controllers. Further, embedded computing systems (i.e., systems that typically interact closely with the physical world and are designed to perform only a limited number of dedicated functions) continue to find application in an increasing number of areas. While defense and aerospace systems still dominate the market, there is an increasing focus on systems to monitor and protect civil infrastructure (such as bridges and tunnels), the national power grid, and pipeline infrastructure. Networks of hundreds of sensor nodes are already being used to monitor large geographic areas for modeling and forecasting concepts and techniques. As the field of wireless
sensor networks is based on numerous other domains,

SJIF Impact Factor 2021: 8.013| ISI I.F.Value:1.241| Journal DOI: 10.36713/epra2016 ISSN: 2455-7838(Online)
EPRA International Journal of Research and Development (IJRD)
Volume: 6 | Issue: 8 | August 2021 - Peer Reviewed Journal
2021 EPRA IJRD | Journal DOI: https://doi.org/10.36713/epra2016 | www.eprajournals.com |2 |
it is recommended that Sensing and Sensors Sensing is a technique used to gather information about a physical object or process, including the occurrence of events (i.e., changes in state such as a drop in temperature or pressure). An object performing such a sensing task is called a sensor. For example, the human body is equipped with sensors that are able to capture optical information from the environment (eyes), acoustic information such as sounds (ears), and smells (nose). These are examples of remote sensors, that is, they do not need to touch the monitored object to gather information. From a technical perspective, a sensor is a device that translates parameters or events in the physical world into signals that can be measured and Another commonly used term is transducer, which is often used to describe a device that converts energy From one form into another .A sensor, then, is a type of transducer that converts energy in the physical world into electrical energy that can be passed to a computing system or controller. An example of the steps performed in a sensing (or data acquisition) task .Phenomena in the physical world (often referred to as process, system) are observed by a sensor device.
CONCLUSION
The proposed system presents a digital technology and modern techniques Attribute Based on digital scheme that is much more efficient than the previous systems. It provides convenient and fast option for Traffic Police to send the fine digitally within 10 seconds . In order to reduce inconveniency and manage the traffic rules of the city, the system provides modified outsourced GPS scheme which supports the and number plate detection. Results show that our system is proficient as well as practical. ACKNOWLEDGMENT
The authors would like to thank Prof. Pragati Patil, Prof. Gajanan Patle for his instruction and encouragement to our work. REFERENCE 1. “Smart Vehicle Identification And Surveillance System
using OCR,” Akash Borse, Ganesh Gujar, Aliasgar Mandsaurwala, Prof. Samadhan SonavaneVol. 4,Issue June 2017.
2. “Traffic and Energy Aware P\Routing For Heterogeneous Wireless Sensor Network,” Deepak
Sharma, Member, IEEE, and Anmol P Bhondekar Member, IEEE, 2018, IEEE
3. “Component-based License Plate Detection Using Conditional Random Field Model ,”Bo Li, Bin Tian,
Ye Li, and Dieng Wen, Senior Member, IEEE 4. D.C.J.E.J.KHAC-HOAI Nam Bui” Real-tle, Traffic
Flow Management BASED ON Inter-Object Communication: A Case Study At Intersaction“7TH International Conference On Ambient Intelligence 2016.
5. T.E.A Osman “Intelligent Traffic Management System
For a Cross Section Of Road Using Computer Vision”
Computing And Communication Workshop And Conference (CCWC)2017 IEEE.
6. V.S.A.M.S.D.K.K. Swath “Traffic Density Control and
Accident Indicator Using WSN” International Journal
For Modern Trends In Science and Technology VOL.2 NO 4 PP,2016.
7. F.-Y. Wang, “Parallel control and management for
intelligent transportation systems: Concepts, architectures, and applications,” IEEE Trans. Intell.
Transp. Syst., vol. 11, no. 3, pp. 630–638, Sep. 2010.

SJIF Impact Factor 2021: 8.013| ISI I.F.Value:1.241| Journal DOI: 10.36713/epra2016 ISSN: 2455-7838(Online)
EPRA International Journal of Research and Development (IJRD) Volume: 6 | Issue: 8 | August 2021 - Peer Reviewed Journal
2021 EPRA IJRD | Journal DOI: https://doi.org/10.36713/epra2016 | www.eprajournals.com |3 |
GRAB TAXI USING DISPAQ
Abdhesh Kumar Sah*1, Manish Kumar Jha*2, Ms. Suganya R*3
*1 Student, Department of CSE, New Horizon College Of Engineering, Bangalore, Karnataka, India *2 Student, Department of CSE, New Horizon College Of Engineering, Bangalore, Karnataka, India *3 Senior Assistant Professor, Department of CSE, New Horizon College Of Engineering, Bangalore,
Karnataka, India
ABSTRACT
One of the indispensable issues for cabbies is to capably discover explorers to extend benefits. The quick progress and
inescapable passageway of (IoT) advancement snared on vehicle adventures enables us to give taxi drivers zones that
have more probable voyagers (more gainful zones) by examining and addressing taxi visit data. we recommend a
request taking care of structure, called (DISPAQ) which adequately recognizes gainful areas by abusing the Firebase
data base. DISPAQ firstly keeps the valuable zone request record (PQ-list) by eliminating district layouts and course
outlines from rough taxi trip data. It by then perceives contender helpful areas by means of glancing through the PQ-
record during request dealing with. By then, it mishandles a Z-Skyline figuring, which is the extension of the skyline
planning with a Z-demand interstellar filling twist, to the quickly refines the candidate useful zones. To propel the
display of scattered inquiry dealing with, we in like manner propose neighborhood Z-Skyline improvement, which is the
decreases the number of winning tests by passing on killer gainful areas to each pack canter point. Through expansive
evaluation with certifiable datasets, we show that our DSPAQ structure offers a flexible and gainful response for taking
care of valuable domain requests from monster proportions of enormous taxi trip data.
KEYWORDS: taxi trip data; profitable areas; distributed processing; PQ-index; z-skyline
I. INTRODUCTION Recently, all the countries around the world are
affected by the Covid-19. On March 2020, WHO declared Novel Coronavirus Disease (Covid-19) outbreak as a pandemic and reiterated the call for countries to take action immediately and scale up response to treat, detect and reduce transmission of communicable disease to save people’s lives. It has been about 1 year now since the announcement of covid-19 as a pandemic and people have to adapt their living in a different way. Since for living daily life, we have work and for working we have to travel a distance for reaching to respective office. Hence, the government has banned the public travels. So, by seeing this much problem around us. We have implemented our ideas and developed our application. It is just like online taxi but the problem is that all people can’t afford the online taxi. So, we work hard and implemented our own ideas for price prediction. It will show only relative price. We had created our own data through which it will cost less money. Web of Things development enables interconnections between tremendous volumes of circled and heterogeneous smart devices allowing them to talk about
impeccably with customers. Starting late, IoT contraptions, for instance, sensors, overall arranging systems (GPSs), and cameras have gotten commonly used in transportation adventures. For example, a couple of countries, for instance, the USA, Germany, Japan and Korea, assemble distinctive data from taxis outfitted with IoT devices. Data science consolidates the fruitful translation of data, disclosures and plans. Huge data assessment as a significant snippet of data science enables us not solely to offer clever sorts of help to customers, yet furthermore to improve work capability and advantage of cabbies by examining the accumulated data. Finding incredible taxi systems to improving organizations and the advantages is one Center projects in splendid transportation. The greater part of the current systems examine assembled GPS sensor data to isolate taxi strategies, e.g., extending traffic structure viability, assessing diagram based capability of cost organizations, understanding assistance techniques, for instance, searching for explorers, voyager movement, and organization domain tendency, notwithstanding finding incredible regions reliant on least cruising time, most extraordinary advantage, least cruising distance and
SJIF Impact Factor 2021: 8.013| ISI I.F.Value:1.241| Journal DOI: 10.36713/epra2016 ISSN: 2455-7838(Online)
EPRA International Journal of Research and Development (IJRD) Volume: 6 | Issue: 8 | August 2021 - Peer Reviewed Journal
2021 EPRA IJRD | Journal DOI: https://doi.org/10.36713/epra2016 | www.eprajournals.com |4 |
furthermore high voyager premium. Broadly, we acknowledge that these procedures are wanted to discover high- advantage regions for cabbies but different methodologies have been proposed. Taxi dispatch framework is a convoluted and testing task given the traffic elements of an advanced metropolitan region. An appropriately overseen dispatch framework decreases gridlock just as improving neighborhood economy. Subsequently the ongoing estimate of movement time for taxis is critical for existing electronic dispatch frameworks. II. OBJECTIVES
To with efficiency answer profitable-area queries.
To realize profitable areas by considering many factors at the same time.
To handle large volumes of taxi trip knowledge. Proposed associate optimized methodology for
distributed Z-skyline question process by causation killer areas to every n node, that maximizes the filtering of dominated areas.
Taxi passenger searching strategies: As one of the crucial goals of taxi as soon as possible, a variety of ways of finding highly profitable areas or recommending hot spots of taxi users have been suggested. Whenever any passenger books the taxis, it will be available within some minutes. This will happen automatically for i.e.; taxi will find it routes with less traffic using google map’s the nearest taxi will be reaching to the customer.
Getting Notification: This is one of most features present in the applications. These features work when, the customer book the taxi within a second one notification will be sent in user mobile number vehicles. This notification is a proof that the taxi is book from the admin sided. Firebase Database: The distributed storage stores all the data about the user email and password and driver user id and passport. If incase the user and driver forgot their password they easily can change through their email. 2A-way Authentication: The user is protected through 2A-way Authentication. As user can Login to the application, the admin will send an OTP to the user email address. If they put OTP in Authentication then only user can login to the app. Area Summary: As within the future through the IOT device and mistreatment IOT camera the admin will get the outline of space as those spaces is a smaller amount
traffic and that area is dense. If this may be expected then the corporate gets additional profit. They show that solely route that less traffic. Since associate extended route outline may be a combination of a region outline and a route outline, we have a tendency to shall give careful explanations for these summaries. we start with associate intuitive observation. Taxi drivers arrange their own routes when dropping off a traveler. they might wish to choose a region that guarantees high average fares and high traveler demand with a brief waiting time. Their choices for creating high profits depends on space and time. the driving force could apprehend some candidate areas from his/her previous expertise with the present location at a current time. Then, they could estimate taxi-passenger demand in candidate areas. Finally, they pick one space for prime profits consistent with past experiences. To tally a taxi driver’s call method, a PQ-index desires 2 items of outline info. area unipara neighborhood a district a regional locality a vicinity a partial section} outline maintains all candidate areas that are computed from raw taxi trip knowledge. For quickly distinguishing candidate profitable areas, we have a tendency to computed values with all combos of (area, time) pairs.
. III. METHODOLOGY Here we've developed all the employment case and therefore the needed system analysis in reference to the $64000 world downside. Our project targets the individuals from all ages cluster whose image ar uploaded within the UI layer, conjointly it covers each space wherever it will be enforced as a module with the minimum budget. The website allows the user with the subsequent features:
•Interact with the module with the only version of UI. •Upload the photographs from their native file resources. •View the end in the graphical user interface with easiest method of understanding. •Access to the regarding section wherever they'll perceive
the project and ascertain the developers of the project. SDK Tools in Android Each SDK Platform version includes the subsequent packages:
The mechanical man SDK Platform package. this is often needed to compile your app for that version. Several System Image packages. a minimum of one in every of these is needed to run that version on the mechanical man mortal.
Each platform version includes a system image for every supported kind issue (handsets, Android TV, and mechanical man Wear). every kind issue could provide

SJIF Impact Factor 2021: 8.013| ISI I.F.Value:1.241| Journal DOI: 10.36713/epra2016 ISSN: 2455-7838(Online)
EPRA International Journal of Research and Development (IJRD) Volume: 6 | Issue: 8 | August 2021 - Peer Reviewed Journal
2021 EPRA IJRD | Journal DOI: https://doi.org/10.36713/epra2016 | www.eprajournals.com |5 |
variations to match your computer's processor design (such as Intel x86 and ARM EABI). System pictures tagged Google arthropod genus embrace access to Google Play services and people tagged Google Play conjointly embrace Google Play Store.
The Sources for mechanical man package. This includes the supply files for the platform. mechanical man Studio could show lines of code from these files whereas you correct your app.
The revision numbers listed below are for the mechanical man SDK Platform package solely. The system pictures could receive separate updates, sometimes to resolve bugs with the mortal. There aren't any unleash notes for the system pictures, however you ought to continually keep them up to this point. Exception Handling
Exception handling in a java is one of the powerful mechanisms to handle the runtime errors so that normal flow of the application can be maintained. Exceptions is an event that disturbs the normal flow or the program. It is an object which is thrown at runtime. The types of Exception are:
Checked Exception The classes which directly inherit throwable class runtime Exception and Error are knowns as checked Exception. i.e. SQL Exception, IOException etc. Unchecked Exception The classes which inherit runtime Exception are known as unchecked Exceptions. i.e.:- Null Pointer, Arithmetic Exception etc. Error Error is irrecoverable. If there is any kind of error found in the program that can be recovered by error mechanism. i.e., outofMemoryError, Virtual Machine Error etc. Real Data Firebase In this section, we are storing user as well as driver information. where both user and driver see their
respective login id and rides details. Confusion Matrix
A much higher thanks to evaluate the performance of a classifier is to seem at the confusion matrix. the overall plan is to count the quantity of times instances category of sophistication}. An area unit classified as class B. for instance, to understand the quantity of times the classifier confused pictures of 5s with 3s, you'd look within the fifth row and third column of the confusion matrix. Training Data
In this section, we are created one csv file and put some random values of km, price, ride option like share and non- share option data. And that data is being trained by the by us using regression concept and TensorFlow. So, it will help the user and company as well as driver to find short route which consumes less time. IV. SUGGESTIONS The existing recommended application is only as similar to online service taxi. But in our project, we are implementing same things as previous application but using IoT Device. We install a camera in every taxi and IoT device. Which will measure the route distance and the traffic areas. Using this system, the benefits is that user get less time to reach in his/her destinations. Which helps the user to save time as well as money. It also makes the company and driver profits.
Another thing, the company regularly monitor to the taxi driver about how many rides they are cancelling and how many rides cancelled by user. Doing such things, the company can advise to her/his driver. They do train to their employees. These are some features and suggestions in our applications. V. CONCLUSION AND REMARKS
Hence, we are able to run our project. We also can predict our price through our own data. All the features are working well. Which will help the people to ride online taxi. The purpose of developing this application that everyone can ride online taxi, earlier online taxi charge more money from the customer. They don’t use their own data for price prediction. They also don’t study about the road route and traffic on the road. Simply they had some random price according to distance. But in this application, we had done everything related to it. So, it makes customer happy and comport ride. Using this application, the company doesn’t go in loss. Think all the concept while building these applications. The models inbuilt the study implements a distributable profitable space question system known as DISPAQ, by using real time base of operations

SJIF Impact Factor 2021: 8.013| ISI I.F.Value:1.241| Journal DOI: 10.36713/epra2016 ISSN: 2455-7838(Online)
EPRA International Journal of Research and Development (IJRD) Volume: 6 | Issue: 8 | August 2021 - Peer Reviewed Journal
2021 EPRA IJRD | Journal DOI: https://doi.org/10.36713/epra2016 | www.eprajournals.com |6 |
information. The models acquire candidate profitable space by querying our own knowledge. Hence, it offers the speed in keeping with the space. The user will book a ride in real time and choose destination. VI. REFERENCES 1. Vehicle safety Technology Report 2016. 2. Bischoff, J.; Michal Maciejewski, A.A.S. Analysis of
Berlin’s taxi services by exploring GPS traces. In Proceedings of the 2015 International Conference on Models and Technologies for Intelligent Transportation Systems, Budapest, Hungary, 3–5 June 2015.R. M. Gray, “Vector quantization,” IEEE ASSP Magazine, pp.
4–29, April 1984. 3. VIA and Japan Unveil Smart IoT Mobility
System.2016.Available online: http://www.viatech.com/en/2016/03/via-and-Japan-taxi-unveil-smart-iot-mobility-system/ (accessed on 19 September 2017).C.-C. Chang, T. S. Nguyen, and C.-C. Lin, “A reversible compression code hiding using SOC and SMVQ indices,” Information Sciences, vol. 300, pp. 85–99, 2015.
4. Zhan, X.; Qian, X.; Ukkusuri, S.V. A graph-based approach to measuring the efficiency of an urban taxi
service system. IEEE Trans. Intel. Transp. Syst. 2016.N. Farvardin, “A study of vector quantization
5. for noisy channels,” IEEE Transactions on Information Theory, vol. 36, no. 4, pp. 799–809, 1990.
6. Powell, J.W.; Huang, Y.; Bastani, F.; Ji, M. Towards reducing taxicab cruising time using spatio- temporal profitability maps. In Proceedings of the International
Symposium on Spatial and Temporal Databases, Minneapolis, MN, USA, 24–26 August 2011; Springer: Berlin, Germany.
7. Li, X.; Pan, G.; Wu, Z.; Qi, G.; Li, S.; Zhang, D.; Zhang, W.; Wang, Z. Prediction of urban human mobility using large-scale taxi traces and its applications. Front. Computer Science.
8. http://developer.Android.com/index.html 9. http://developer.android.com/index.html 10. http://developer.Android.com/index.html 11. http://developer.android.com/index.html

SJIF Impact Factor 2021: 8.013| ISI I.F.Value:1.241| Journal DOI: 10.36713/epra2016 ISSN: 2455-7838(Online)
EPRA International Journal of Research and Development (IJRD)
Volume: 6 | Issue: 8 | August 2021 - Peer Reviewed Journal
2021 EPRA IJRD | Journal DOI: https://doi.org/10.36713/epra2016 | www.eprajournals.com |7 |
DENTAL HEALTH OF OLDER PEOPLE IN ANDIJAN REGION
IsayevaMuqaddashon Makhammadovna
Assistant of the Department of Dentistry and Propaedeutics of Dental Diseases, Andijan State Medical Institute, Andijan City
RESUME
The article discusses the assessmentof dental health in centenarians of the Andijan region and provides
recommendations for its improvement. The dental status of 53 centenariansaged from 70 to 88 years was evaluated
according to archival records. An examination was performed for individual гигиену oral hygiene, the prevalence of
caries, a filled tooth, an extracted tooth, and periodontal inflammation.
KEY WORDS: dental health, people of older age groups, domestic healthcare.
RELEVANCE Numerous observations and studies of dentists
indicate that there is a certain relationship between the pathology of internal organs and body systems with damage to the oral cavity [1]. The high level of morbidity in the elderly and elderly population, characterized by the multiplicity and chronicity of pathology, as well as a high frequency of complications, exacerbates these processes [2]. Many experts believe that the aging of the population, which characterizes the beginning of a new stage in the development of demographic relations, causes serious demographic, economic, social, socio-psychological, cultural and medical consequences [3]. According to demographic changes, the proportion of elderly patients in dental clinics increases, filling the professional activity of doctors of many specialties, including dentists, with geriatric content [4]. The problem of providing dental care to older people is not discussed in sufficient detail in the scientific and popular medical press.
The current level of knowledge allows us to assess the dental health гериатрическогоof geriatric patients as unstable. Elderly and senile people, as well as physically disabled people, have an increased risk of developing diseases of the oral cavity. In world
practice, there is an increase in interest in the quality of hygienic oral care of this category of patients.
Dental and oral health has a huge impact on the quality of life – from the daily ability to eat, talk, and communicate, to the prevention of pain and discomfort.
According to studies, there is a link between oral health and various diseases, such as cardiovascular diseases, stroke, and diabetes[10].
Treatment and prevention of oral diseases in the elderly are also important for improving well-being and health. Good habits, a healthy diet, and regular visits to the doctor will help you maintain your oral health for life, including natural teeth, implants, and dentures. Typical dental problems in the elderly[8].
Poor oral hygiene – as a result of precarious health conditions and limited mobility or mental limitations, it may be difficult to perform activities necessary to comply with oral hygiene rules, such as brushing your teeth.
Gum diseases are infectious diseases of the tissues that support the teeth. These diseases can cause gum bleeding, bad breath, gum recession, and tooth mobility, even to the point of tooth loss. In addition, gum disease also affects other diseases, such as heart disease, stroke, and diabetes[7].
Caries-the risk of tooth decay increases in old age due to exposure of the dental roots due to gum recession, multiple restorations in the past, sometimes

SJIF Impact Factor 2021: 8.013| ISI I.F.Value:1.241| Journal DOI: 10.36713/epra2016 ISSN: 2455-7838(Online)
EPRA International Journal of Research and Development (IJRD)
Volume: 6 | Issue: 8 | August 2021 - Peer Reviewed Journal
2021 EPRA IJRD | Journal DOI: https://doi.org/10.36713/epra2016 | www.eprajournals.com |8 |
incorrect, and dry mouth as a result of medication or after chemotherapy and radiotherapy.
Fungal diseases-fungal diseases of the oral cavity can occur at any age, but especially in people who wear partial or complete dentures. Prolonged use of antibiotics or steroids, diabetes, immune system depression, dry mouth, and poor nutrition increase the risk of oral fungal infection[8].
Soft tissue injuries associated with dentures-people who wear full or partial dentures may suffer from the occurrence of wounds under the dentures. In most cases, we are talking about a traumatic wound formed due to the friction of an unstable prosthesis. Oral cancer-Older people (over 60 years of age) are at an increased risk of developing oral and lip cancer. This risk is higher for smokers, alcohol users, or people who spend a lot of time in the sun[4].
Elderly and senile patients have an increased risk of developing oral diseases compared to younger patients. гериатрическогоDental caries, periodontal diseases, and oral mucosal diseases are more common in geriatric patients with a pronounced need for external care than in patients of the same age category, but who are capable of independent hygienic care (or their need for external care is extremely low)[1]. Factors that increase the risk of developing dental diseases in elderly and senile patients include:: - decrease in saliva secretion associated with age-related atrophy of the salivary glands, and changes in the rheological properties of saliva (increase in its viscosity, change in the qualitative composition),due to theevolutionary changes in metabolic processes and regulation of the activity of the system of glands of exo-and endocrine secretion. Together, this determines the salivation causes of accelerated rates of plaque formation, soft plaque , supragingival and subgingival calculus deposits; - unsatisfactory hygienic care of the oral cavity, which leads to the formation of dense plaque from the tooth plaque (within just a few hours) and retention of food residues in the mouth, which, being transformed into putrefactive decomposition products, are an excellent habitat for a number of pathogenic microorganisms. Plaque microorganisms colonize the tooth surface and gingival furrow areas, contributing to the onset and progression of periodontal inflammation; the toxins released in this case (especially endotoxin) disrupt tissue nutrition, cell metabolism and contribute to cell necrosis, violating the integrity of the periodontal cell cover. Surrounding tissues become permeable to the degradable effects of endotoxin and its spread throughout the body. In addition to directly affecting the tissues, the microbial flora of the oral cavity causes
the formation of specific antibodies in the blood, which change the reactions of the body and periodontal tissues, in particular, increasing inflammation. Oral pathogenic microflora can cause allergic reactions in periodontal tissues and immunological disorders in the body. Elderly and senile patients who have well-established oral hygiene care, regardless of their need for outside help, have significantly fewer pathological conditions and diseases of the oral cavity compared to patients of the same age who receive oral hygiene care on an irregular basis, on a case-by-case basis. Quite often, elderly people with moderate needs for third-party care are able to independently conduct systematic hygienic care of their oral cavity, which indicates the justification and necessity of their training in the correct skills of adequate oral care[5,9]. In our opinion, this is due to socio-economic considerations. Given the high cost of modern methods of dental treatment, as well as the fact that most of these medical and preventive measures are not included in the list of those provided at the expense of budgetary funds. Currently, due to the aging of the world's population, the problem of medical adaptation and social rehabilitation of older people is very relevant. Of course, this necessitates an integrated approach to the elderly and the old man, so as a medical problem, you have to consider their psychosomatic status, and socioeconomic factors that affect their health, especially in older age groups is much higher, not only the incidence but also the number of diseases of the internal organs in each patient [2, 4]. The aim of the study was to assess the dental healthof centenarians of the Andijan region and make recommendations for its improvement. MATERIAL AND METHODS The dental status of 53centenarians aged from 70 to 88 years was evaluated. RESULTS AND THEIR DISCUSSION
Analysis of dental health showed that 18 (66.7%) men had teeth, and 14 (53.9%) women had teeth. Individual oral hygiene in centenarians who had natural teeth, regardless of gender, was unsatisfactory. Given that 33.3% of men and 46.2% of women obsledovanii of centenarians has suffered a complete loss of natural teeth, the prevalence of dental caries among made men, with 66.7% among women with 53.9 per cent, with the figure of the Communist party respectively and 19.3±1,6 (carious tooth (K) was 3.42; plombirovaniya tooth (P) – 2,94; deleted tooth (Y) – of 12.91), and 18.4±1,2 (carious teeth – 2,46; sealed teeth to 3.11; tooth extractions – 12,85) of the affected tooth.

SJIF Impact Factor 2021: 8.013| ISI I.F.Value:1.241| Journal DOI: 10.36713/epra2016 ISSN: 2455-7838(Online)
EPRA International Journal of Research and Development (IJRD)
Volume: 6 | Issue: 8 | August 2021 - Peer Reviewed Journal
2021 EPRA IJRD | Journal DOI: https://doi.org/10.36713/epra2016 | www.eprajournals.com |9 |
Non-carious lesions in the form of increased erasability of hard tooth tissues and wedge-shaped dental defects were detected in all centenarians in 100% of cases, regardless of gender (p≥0.05). Men were more often
diagnosed with a dystrophic form of periodontal tissue damage (periodontal disease) than women, respectively, in 14.8% and 7.7% of cases (p<0.01). Regardless of gender, long-livers often had inflammatory periodontal pathology in the form of chronic generalized periodontitis (CGP), which occurred in a moderate to severe degree of severity. Thus, CGP in men was detected in 51.9% of cases, in women-in 46.2% of cases. Diseases of the oral mucosa in the form of paresthesias, prosthetic stomatitis, and lichen planus were also detected more often in women than in men, respectively, in 46.2% and 33.3% of cases (p < 0.05). Diseases of the temporomandibular joint (TMJ) were detected in all centenarians (in 100% of cases).) in the form of temporomandibular osteoarthritis, pain dysfunction of the TMJ. Habitual dislocation and subluxation of the lower jaw, while parafunctions of the masticatory muscles (bruxism, clenching of teeth, tooth tapping, non-food chewing) were more common in men (63.0%) than in women (45.2%) of centenarians. Conclusion. Taking into account the obtained data, it seems to us that the assessment of health criteria for people of older age groups should be integral and take into account not only the degree of their physical mobility, social activity, visual acuity, hearing, but also dental health, including the indicator of preserved teeth and their functional value. The value of this indicator is difficult to overestimate, since the violation of the integrity of the chewing apparatus and its function leads to a decrease in the quality of life of centenarians, negatively affects the chewing of food, and, consequently, the work of the digestive system and metabolic processes in the body. The study of factors that determine the rehabilitation potential of centenarians suffering from comorbid pathology showed that prognostically significant in the planning of rehabilitation measures should be therapeutic and preventive dental measures. The presence of close relationships between medical and social, general somatic and dental indicators determines the need to consider systemic homeostasis in centenarians with comorbid pathology during their treatment, including dental, as well as medical and social rehabilitation. LIST OF LITERATURE
1. Actual issues of gerontostomatology in Russia at the present stage / V. V. Samsonov [et al.] / / Uspekhi gerontologii. 2013, vol. 26, No. 3, pp. 540-543.
2. Alimsky A.V.Gerontostomatology (epidemiological, social and organizational aspects)Alimskiy, Moscow, 2012.
3. Baluyeva E. C. Optimization of dental care for elderly and senile people:author's abstract . dis.. Candidate of Medical. Sciences ofAUK / E. C. Baluyeva. - Samara, 2013. - 24 p.
4. Improving the effectiveness of orthopedic treatment of patients with complete absence of teeth and complex anatomical conditions on the lower jaw by means of a modified prosthesis design: авторефabstract . dis.. Candidate of Medical. нSciences in auk / I. Y. Barkan. - Omsk, 2005. - 24 p.
5. Borovskii E. V., Pak A. N. Stomatologicheskii status lits pozhilogo i starcheskogo vozrasta v raznykh regionakh [Dental status of elderly and senile people in different regions].-1991. - No. 4. - pp. 78-80.
6. Willershausen-Tsenchen B. Changes in oral cavity tissues in the elderly.Willershausen-Zehnchen, S.Gleisner / / Clinical dentistry. 2000, No. 3, pp. 58-63.
7. Voznyi A. B. Scientific rationale for improvement of organization of dental and orthopedic care to the population: abstract. dis. Dr. med. nauk / A.V.Vozny, Moscow, 2008, 28 p. (in Russian)
8. Glushnik E. P. improving the efficiency of endodontic treatment of teeth of elderly and senile age: Avtoref. dis.cand. med. nauk / EPGlushnyuk, Moscow, 2010, 22 p. (in Russian)
9. Guk V. A. Features of the clinical course and treatment of mandibular fractures in elderly and senile patients: авторефabstract . dis. Candidate of Medical. нSciences of auk / V. A. Guk. - SPb., 2011. - 22 p.
10. Ivanova E. V. Improving the provision of therapeutic dental care to elderly and senile people in modern conditions: авторефauthor's abstract . dis. Candidate of Medical. нSciences of auk / E. V. Ivanova, Moscow, 2009, 24 p.

SJIF Impact Factor 2021: 8.013| ISI I.F.Value:1.241| Journal DOI: 10.36713/epra2016 ISSN: 2455-7838(Online)
EPRA International Journal of Research and Development (IJRD)
Volume: 6 | Issue: 8 | August 2021 - Peer Reviewed Journal
2021 EPRA IJRD | Journal DOI: https://doi.org/10.36713/epra2016 | www.eprajournals.com |10 |
LEADERSHIP STYLES AND REMUNERATION AS
PREDICTORS TO TEACHERS’ JOB SATISFACTION IN
SENIOR SECONDARY SCHOOLS IN BAUCHI STATE,
NIGERIA
Prof ( Mrs ). C. E. Edemenang1, Dr. Shuaibu Babawuro2, Dr. Abubakar Garba3, Zalanga Dorothy Timothy4
ABSTRACT This study was on Leadership Styles and Remuneration as Predictors to Teacher‟s Job satisfaction in Senior
Secondary Schools in Bauchi State, Nigeria. Two purposes of the study with two corresponding research questions
and hypotheses guided the study. Descriptive survey research design was adopted for this study. The population
comprised of 119 principals and 2900 teachers. The sample was randomly selected among the senior secondary
schools in those areas while the sampling technique used was proportionate stratified sampling. The instrument
used for data collection was “Teachers‟ Job Satisfaction Opinion Questionnaire (TJOQ)” and “Multifactor
Leadership Questionnaire (MLQ). The reliability of the instrument was .787 and .834. The values of .735 were
attained for teachers „job satisfaction, .787 for Leadership styles and .834 for remuneration, implying that the
content of the instruments (TJSOQ) and MLQ) were valid for assessing Leadership Styles and Remuneration as
predictors to teachers‟ job satisfaction. Among the findings of the study it was revealed that Teachers perceived
transformational leadership style is a predicting factor in their job satisfaction. Conclusions and recommendations
were made among which are The State Ministry of Education and other agencies involved should endeavour to
monitor the type of leadership style used in senior secondary schools. Good transformational leadership style will
lead to better satisfaction of teacher‟s job.
INTRODUCTION
Teaching is the process of attending to people‟s needs, experiences and feelings, and
intervening so that they learn particular things and go beyond the given. It is a mass occupation, which accounts for one-half to two-thirds of public sector employment in most developing countries (Bennell, 2004). While other professions (engineering, medicine and law) enjoy a high degree of self-regulation and are successful in maintaining high barriers to entry in terms of qualification requirements and registration, teachers on the other hand, tend to have weak, state-dominated professional organizations with several trade unions. Available evidence, however, reveals that the teaching force has expanded rapidly in only a relatively few countries (most notably Bangladesh, Malawi, Ethiopia, Eritrea, Mozambique, Uganda and Nigeria) furthermore, teaching has become an employment of the last resort among university
graduates, Nigeria Certificate in Education (NCE) and Diploma holders as well as Secondary School leavers ( Bennell 2004 ). Consequently, teachers often lack a strong, long term commitment to teaching as a vocation. Besides, the status and pay of Secondary School teachers compared to university lecturers is generally much lower in developing countries (Gonell, 2000). Thus, in the absence of alternative employment opportunities, becoming a university lecturer is the main avenue for social and economic advancement for the most able Secondary School teachers. This may have important implications for job satisfaction of Secondary School teachers.
The Federal Government of Nigeria (FGN) in the National policy on Education (2014), states that “ No education system can rise above the quality of its teachers ”. As a result, many institutions hire only talented teachers in order to reach the goals of teaching and learning. Teachers have been shown to

SJIF Impact Factor 2021: 8.013| ISI I.F.Value:1.241| Journal DOI: 10.36713/epra2016 ISSN: 2455-7838(Online)
EPRA International Journal of Research and Development (IJRD)
Volume: 6 | Issue: 8 | August 2021 - Peer Reviewed Journal
2021 EPRA IJRD | Journal DOI: https://doi.org/10.36713/epra2016 | www.eprajournals.com |11 |
influence students‟ academic performance and they
also play a crucial role in the educational attainment, because the teacher is ultimately responsible for translating policy into action and principles based on practice during interaction with students (Heyden, 2011). In order for teachers to cope with their demanding role, it is necessary for them to feel good about their job and draw satisfaction from it. It is argued that satisfied teachers are generally more productive and can influence students‟ academic
performance (Akinsola, 2012). Despite the leading role teachers play towards attaining educational objectives, several scholars (Adeyinka, Asabi and Adedotun, 2013), lamented that teachers job dissatisfaction has reached an intolerable low point in Nigeria, which is reflected in their deteriorating performance and poor students‟ academic
performance, especially in external examinations such as West African Examination Council (WAEC) and National Examination Council (NECO). Bennel (2004), indicates that so many teachers have left the teaching profession in search of greener pasture while those who are still in the profession are into part time jobs to make ends meet.
According to the world bank collection of development indicators, 50 % of highly qualified teachers have left the profession in droves within 5 years (2012-2017) claiming job dissatisfaction as one of the reasons (world Bank, 2017). Unfortunately, the shortage of teachers may cause some schools to lower their standards for teacher quality (Smith 2018) and thus, the achievement of students decreases (Zalanga, 2017). Research in other countries such as Tanzania, Greece and Kenya has found that teachers who have higher levels of job satisfaction have higher commitment to the profession and are less likely to leave the field of education to pursue other career choices (Abdu & Ndzilana, 2018). Job satisfaction is a positive or pleasant emotional state resulting from a persons‟
appreciation of his/her job experience. It is the extent to which people like or dislike their jobs. A positive favourable attitude and feelings relates to job satisfaction while a negative unfavourable attitude and feelings relates to job dissatisfaction. Job satisfaction and dissatisfaction is a result of employees‟ perception of how well their job
provides those things they view as important and necessary to working well and their enjoyment Luthans (2005).
The Equity theory holds that job satisfaction of individuals in an organisation is influenced by the extent to which they feel that they are being treated in a fair and equitable manner. While the Expectancy theory hypothesized that job satisfaction is determined by a person‟s perceptions or beliefs
regarding the relationship between his/her behaviour
and the outcomes or result of his behaviour. Job satisfaction has been perceived differently by different researchers, Bishey (2006), describe job satisfaction as an attitude developed by an individual towards the job and job conditions. Awodun (2016), view job satisfaction as the favourable or unfavourable subjective feelings with which employees view their work. Job satisfaction result when there is a relationship between job requirement, demand and expectations. It expresses the extent of a match between employees‟ expectations of the job
and the reward that the job provides. It is also considered a final state of agreement of a psychological process to work, along with its terms and conditions which are essential for a higher competitive level and organisational success (Alsamari and Bennel, 2005).
Teacher Job satisfaction relates to a teacher‟s perception of what he/she expects to get
from teaching and what he/she is actually getting from teaching (Lawler,1973). Job satisfaction is very essential in the lives of teachers because it forms the fundamental reason for working in life. While almost every teacher works in order to satisfy his/her needs in life, he/she constantly agitates for need satisfaction. Teachers‟ job satisfaction in this context
is the ability of the teaching job to meet the teachers‟
needs and improve their job performance. Due to its relevance to the physical and mental well-being of the teachers, as well as its implications for teachers‟
job-related behaviours such as lack of enthusiasm for the job, absenteeism, turnover and poor students performance, job satisfaction remains the most important topic today (Specter,1997). The level of Job satisfaction is affected by intrinsic and extrinsic motivating factors. According to Acha (2010), intrinsic motivational factors of teachers‟ job satisfaction has to do with the inner urge or self interest such as the Job itself, classroom activities, social relationship as well as recommendations from supervisors. While extrinsic factors associated with teachers job satisfaction comes from a source outside the individual such factors include Remuneration, Environment, career development, career advancement, leadership style among others. According to Kooi (2017), ignoring teachers‟ job
satisfaction places efficiency at stake and he goes further to assert that the teaching profession is in serious jeopardy if majority of its members are dissatisfied with their job and or do not regard matters pertaining to their work as being of central concern. In his opinion, when teachers are provided with tasks and conditions that fosters job satisfaction, their performance can be enhanced but when the job dimensions and work conditions necessary for job satisfaction are absent these teachers are likely to
SJIF Impact Factor 2021: 8.013| ISI I.F.Value:1.241| Journal DOI: 10.36713/epra2016 ISSN: 2455-7838(Online)
EPRA International Journal of Research and Development (IJRD)
Volume: 6 | Issue: 8 | August 2021 - Peer Reviewed Journal
2021 EPRA IJRD | Journal DOI: https://doi.org/10.36713/epra2016 | www.eprajournals.com |12 |
consider their commitment as being „‟a fair day‟s
work for a fair day‟s pay”. The significance of teachers‟ job satisfaction
has led to investigation of the factors that can contribute to its increase. Adeyinka (2013) observed that most teachers in Nigeria were not committed to their jobs, this may not be unrelated to the leadership styles of the principals. Effective schools researchers agree that the school learning environment is directly influenced by the leadership styles of the principals. (Abdu ,2018; Koutouzis, 2017). The leadership styles of the principal are largely responsible not only for the teaching and learning environment but also for the performance of the staff. Greece research has demonstrated that it is the style of leadership exercised by the principals which determines not only the tone of the entire school, but also the quality of education offered by the school. Koutozis, 2017). Leadership style is viewed by Hariri (2011), as the pattern of interactions between leaders and subordinates. It is a procedure to influence the people in order to achieve the desired result. Ezeuwa (2005) states that leadership is the key to the progress and survival of any organization whether it is an enterprise or institution. It is the act of influencing people so that they strive willingly and enthusiastically towards the accomplishment of goals. Kasinga (2010), says effective leadership is essential in all organizations. He further stated that, success of an organization largely depends on the quality of its leadership. It is an admitted fact that deficiency in dedicated leadership prevails all over the world. Hence different countries have different leadership styles on the basis of their cultural associations (Rad & Yar mohammadian, 2006).
Researchers in the field of education are now considering a shift from the old models of leadership styles namely; autocratic, democratic and laissez-faire leadership styles to a new perspective of leadership models which are transformational and transactional leadership styles, widely used in organisational settings such as accounting firms, banks and the military (schuarzt 2017). While the transactional leadership style motivates teachers by appealing to their self- interest and the use of coercion to acquire the subordinate‟s compliance
based on a give and take relationship and in which compliance of the teachers is exchanged for expected reward, the transformational leadership style is directed towards self-worth and self esteem of teachers, through couching and motivating teachers ( Bass & Avolio, 2000). On the other hand, laissez-faire leadership style is characterised as non leadership style or absence of leadership (Amin etal., 2013 ). In this type of leadership there is a limited interaction between the leader and his followers.
Different styles are needed for different situations and each leader needed to know when to exhibit a particular approach (Rad &Yarmohammadian, 2006). Lesomo (2013) advised that school Principals should not restrict themselves to one management style. No one leadership style is ideal for every situation, since a leader may have knowledge and skills to act effectively in one situation but may not emerge as effectively in a different situation. A major concern of all modern organizations is goal attainment. There is therefore informed growing interest to determine which of these styles is capable of ensuring organizational goal‟s attainment and employee job satisfaction.
Teaching effectiveness depends on the type of remuneration that is why Wayne (1998), notes that a reward in form of pay has a strong impact on the employees job satisfaction. The condition of satisfaction and dissatisfaction of employees depends on their salary because it is the organizational responsibility to provide suitable financial rewards like salary to their employees which may have strong influence on employee motivation and retention (Al-Samari & Bennel, 2004). All compensation factors are included in employee pay and people make effort to improve their performance because they want some rewards in term of money or promotion which was explained through expectancy theory (Akinsola, 2012). Mostly employees expect that their pay and promotion will be increased when they work well in the workplace then this will cause increase in their job satisfaction level. STATEMENT OF THE PROBLEM
Teacher remuneration has been a major concern to school managers and even the teachers themselves due to its perceived influence on teacher‟s effectiveness. The Government in Nigeria
and the Nigerian Union of Teachers (NUT) are in constant face off over issues relating to remuneration, working environment, and supervision of schools. The Government is bothered on the increasing incidence of teachers‟ truancy and other
negative behaviors, such as attending to personal businesses during office hours. The researcher observes that teachers in most schools in Bauchi State have agonizing plight arising from their irregular promotions, politicize study leave, and delayed salaries among others. These problems identified by both Government and teachers may affects the teachers‟ morale and this reduced
enthusiasm may translate to poor teacher‟s
performance in the long run. The researcher observed that some schools appear to be performing better than others, which may not be unconnected with the principals leadership styles, such as transformational, transactional and Laissez-faire. This study is
SJIF Impact Factor 2021: 8.013| ISI I.F.Value:1.241| Journal DOI: 10.36713/epra2016 ISSN: 2455-7838(Online)
EPRA International Journal of Research and Development (IJRD)
Volume: 6 | Issue: 8 | August 2021 - Peer Reviewed Journal
2021 EPRA IJRD | Journal DOI: https://doi.org/10.36713/epra2016 | www.eprajournals.com |13 |
therefore aimed at finding out the extent to which leadership styles and remuneration predict teachers‟
job satisfaction in Senior Secondary School in Bauchi State.
The Theoretical framework for this study was derived from Hertzberg‟s (1966) Two Factor
Theory and Bass & Avolio (2010) Full Range Leadership Theory (FRLT). Hertzberg‟s (1966) two
factor theory states that there are certain factors in the work place that cause job satisfaction while separate set of factors cause dissatisfaction. According to Herzberg, individuals are not content with the satisfaction of lower- order needs at work place; for example those needs associated with minimum salary levels or safe and pleasant working conditions which he called hygien factors, rather individuals look for the gratification of higher level psychological needs having to do with recognition, responsibility, advancement and the nature of the work. The two factor theory is based on the notion that the presence of hygien factors which are remuneration, work conditions and supervision will not motivate the teacher but its absence will bring dissatisfaction. According to Hertzberg, the motivating factors are the intrinsic which has to do with achievement, advancement and the work itself. The theory suggest that to improve job satisfaction administrators must provide intervening variables in the place of work and not assume that an increase in workers satisfaction will lead to decrease in dissatisfaction. The causes of dissatisfaction will not bring satisfaction nor will adding the factors of job satisfaction eliminates job dissatisfaction. If you have a hostile environment, giving someone promotion will not make him or her satisfied and if you increase the salary of the teacher without making instructional materials available it will not increase job satisfaction. This theory is applicable to this study due to the critical role played by the Principals‟
leadership styles in teachers‟ work. It will help
establish how Principals with different leadership styles satisfy teachers. According to Okumbe (1998), Herzberg‟s theory can lead to teachers‟ job
satisfaction through change in the nature of the job as well as through job enrichment and management allowing teachers maximum control over mechanisms of task performance.
The principal- teacher relationship has become more and more important with the increase in decision making at the school site. A study by Smith (2000) stated that “the principal is expected to
be an instructional leader who can support, inspire, and develop students and teachers, as well as communicate effectively with all publics within the educational environment”. Hallinger and Heck
(1998) found that a school leader‟s leadership style is
the main factor that greatly influences school
effectiveness and teacher job satisfaction. He believed that “a teachers‟ job satisfaction may serve to influence their morale, motivation and general willingness to maximize their teaching potential”.
Teachers who are not satisfied with their jobs may result in bad teaching or learning process, and school effectiveness will consequently be negatively impacted. As to the relationship between a school leader‟s leadership style and teacher job satisfaction,
the two basic factors influencing school effectiveness, Gitaka, (1991) recognized that the school leader‟s leadership style significantly influences teacher job satisfaction, consequently, it will be helpful, for reaching the goals of the school and increasing school effectiveness, to clearly comprehend the relationship between these two important factors.
School leadership plays a key role in improving school‟s outcomes by influencing the
motivation and capacities of teachers as well as the school climate and environment (Acha, 2010). The Principal must employ inclusive kind of leadership where they will involve other people as a team. This team gets a deliberate opportunity to contribute to the vision, culture and climate of the school and thus the Principal has a duty to create the opportunities to make this happen and teachers partly determine the leadership styles of the Principal (Mutula, 2006). As a leader, the principal has the power to influence job satisfaction among the teachers under them. It‟s
worthwhile to note that leadership has been one of the most popular research topics in organizational behaviour since the days of Greek philosophers (Alsamari & Bennel, 2004) The importance of leadership was first researched in the 1920s with studies using surveys reporting that favorable attitudes toward supervision helped to achieve employee job satisfaction (Bass, 1990). Several studies were conducted during the 1950s and 1960s to investigate how managers could use their leadership behaviours to increase employees‟ level of
job satisfaction (Northouse, 2004). These studies confirmed the significance of leadership in making differences in employees‟ job satisfaction (Bass,
1990). Furthermore, Schwartz,(2017) showed that leadership behaviour was positively related to job satisfaction and therefore managers needed to adopt appropriate leadership behavior in order to improve it.
Numerous literatures were published on Leadership and job satisfaction mostly in developed countries, a significant relationship have been found between the two variables. Bogler (2001), conducted a research which investigated leadership style in Israel on teacher job satisfaction in secondary schools. It also examines the effects of principals leadership styles, teachers occupation, teacher

SJIF Impact Factor 2021: 8.013| ISI I.F.Value:1.241| Journal DOI: 10.36713/epra2016 ISSN: 2455-7838(Online)
EPRA International Journal of Research and Development (IJRD)
Volume: 6 | Issue: 8 | August 2021 - Peer Reviewed Journal
2021 EPRA IJRD | Journal DOI: https://doi.org/10.36713/epra2016 | www.eprajournals.com |14 |
satisfaction from the job and principals decision –
making strategy. It also tries to find out how much of the variation in teachers job satisfaction can be attributed to their perception of their occupation, as compared to their perception about their principals‟
leadership style. It was conducted on a sample size of 745 teachers; the data collected was by quantitative questioners using likert-type scales. The study found that teachers‟ occupation perceptions strongly affect
their satisfaction both directly and indirectly through their perception, implications of the study are discussed in relation to supervisors and principals, as policy makers at government level. Model of the study demonstrated that the teachers perceptions of their principal and of their occupation contribute significantly to the explanation of variance in job satisfaction, however teachers perception are very subjective and affected by so many variables. Although this study Leadership Styles and Remuneration as Predictors to teachers‟ job
satisfaction is also looking at teachers perception of their principals leadership styles, but it is looking at it from the new model of transactional and transformational from the Nigerian context, Similarly, Hui, Jentabadi, Ismail and Radiz (2013), conducted the same study in china with less sample size of 539 teachers, and used structural equation modelling to prove the relationship between principals leadership style and teacher job satisfaction among primary and secondary schools. It also investigated the relationship among principals leadership style, principals decision making and teacher job satisfaction among primary secondary and high schools in Chinese educational system. The questioners used in the study were posted to teachers in 180 elementary schools, 172 secondary schools and 187 high schools situated within the province of Xingjiang china, the main contribution of this study is that the relationship between leadership style and teacher job satisfaction is triggered by the decision making style. Therefore the leadership style has to be accompanied with a style of decision making to be able to promote teacher job satisfaction in the school, whereas, in traditional management models, authors of those models mostly combine the styles of leadership and decision making into one style, thus ignoring the role of decision making as an independent process. The researcher is looking at Principals leadership styles and remuneration as predictors to teachers job satisfaction in Senior Secondary Schools in Bauchi State Nigeria. Sadeghi & Pihie (2013), conducted a study about the role of transformational leadership style in enhancing lecturers job satisfaction in Malaysia to identify the influence of transformational leadership style employed by departments heads on improving lecturer job satisfaction. In this study a quantitative
descriptive survey design was employed with a sample size of 305 lecturers consisting of professor, associate professors, lecturers etc in the university of Malaysia, the data indicated uncovered inspirational motivation and identified that the transformational leadership improves lecturers job satisfaction more than other leadership styles. This study demonstrates that department heads can be more effective in satisfying lecturers when they more frequently demonstrate transformational leadership behaviours. The findings of this study empirically contribute to existing body of knowledge regarding academic administrators‟ leadership style particularly in
developing countries by demonstrating the extent to which leadership styles influenced lecturer‟s job
satisfaction. In this study the researcher is working on both transformational transactional and laissez-faire leadership styles as predictors to teachers job satisfaction in secondary schools in Nigeria. PURPOSE OF THE STUDY
The main purpose of this study was to find out the extent to which principals‟ leadership styles and
remuneration predicts teachers‟ job satisfaction in
Senior Secondary Schools in Bauchi State. The specific objectives were to: -
1. Find out the factors that predict teachers‟ job
satisfaction in Senior Secondary School in Bauchi State.
2. Find out the extent to which Principals‟
Transformational leadership style predict teachers‟ job satisfaction in Senior Secondary
School in Bauchi state. RESEARCH QUESTIONS The following research questions guided the study:
1. What are the factors predicting teachers job satisfaction in Senior Secondary School in Bauchi State?
2. To what extent does principals‟ transformational leadership style predict teachers‟ job satisfaction?
RESEARCH HYPOTHESES The following hypotheses will guide the studies
1. H01: Principals‟ Transformational leadership
style, does not significantly predict teachers‟
job satisfaction. 2. H02: Principals‟ Transactional leadership
style, does not significantly predict teachers‟
job satisfaction. METHODOLOGY Research Design
This study used descriptive survey design. Descriptive survey design is a design that is used to allow the researcher to gather information about

SJIF Impact Factor 2021: 8.013| ISI I.F.Value:1.241| Journal DOI: 10.36713/epra2016 ISSN: 2455-7838(Online)
EPRA International Journal of Research and Development (IJRD)
Volume: 6 | Issue: 8 | August 2021 - Peer Reviewed Journal
2021 EPRA IJRD | Journal DOI: https://doi.org/10.36713/epra2016 | www.eprajournals.com |15 |
people‟s attitudes, opinions, habits or any other
characteristics of a particular individual or group and interpret the data collected for the purpose of clarification. (Orodho, 2009). Since this study seeks to find out the extent to which principals‟ leadership
styles and remuneration predicts teachers‟ job
satisfaction (attitude and behavior), this design is therefore considered appropriate. According to Osuala (2001) descriptive survey approach provides a snap shot of current state of affairs and relationship among variables for prediction of future events from the present knowledge. Area of the Study
The area of the study is Bauchi State which is located in the North Eastern Nigeria. It has 20 Local Government Areas which are divided into 3 Educational zones; Bauchi North, Bauchi South and Bauchi Central. The State is inhabited by a large number of ethnic groups including Fulani, Hausa, Sayawa, Jarawa and Denawa. It has an estimated population of four Million, six hundred and fifty three thousand, sixty six (4,653,066) people who are predominantly muslims (2006, Population census). It is bounded by the states of Jigawa and Kano on the northwest, Kaduna on the West; Plateau, Taraba and Gombe on the South and Yobe on the East. Population
The population of the study consisted of all Public Senior Secondary School Teachers in Bauchi State. Data from the ministry of Education Shows that Bauchi State, has one hundred and nineteen (119) secondary schools, one hundred and nineteen (l19) Principals and Two thousand nine hundred (2900) teachers in 2018-2019 Academic session. Sample and Sampling Technique
A sample of 346 teachers was used for the study based on Research Advisor Sample Size table for determining the sample size (Research Advisor,2006 ). The teachers were selected from 20 Public Senior Secondary Schools in Bauchi State. Proportionate stratified random sampling technique was used to select the number of teachers from each of the zones on the basis of the population. It was used to ensure that each subgroup of the population is adequately represented, proportionate to the relative number of each school, because the number of teachers in each of these schools varies. INSTRUMENT FOR DATA COLLECTION
Questionnaire was used as instrument for data collection. The Questionnaire will have four sections. Section A: was Demographic data of the teachers. Section B: was items that measure teachers on job satisfaction. The “General Index of Job
Satisfaction” instrument of Brayfield and Rothe
(1951) was adapted by the researcher. It was first developed in Taiwan for hospital staff, it has 18 items. The researcher adapted and titled it Teachers‟
Job Satisfaction Opinion Questionnaire (TJSOQ) and used only 10 items to determine each teacher‟s self-reported level of job satisfaction. Section C: will address items on teachers opinion about their principals Leadership styles. Leadership Style Questionnaire: Popularly known as the Multifactor Leadership Questionnaire (MLQ- 6s) developed by Bass (1985) in Greece was adapted by the researcher to elicit for information from the teachers about their opinion of their Principals‟ leadership styles. The
Multifactor Leadership Questionnaire was a 21 item questionnaire; But the researcher added some questions to make it 30. It measures individual leadership styles ranging from passive leaders to transactional leaders who give contingent rewards to followers and to transformational leaders who are able to transform their followers into becoming leaders themselves (Avolio & Bass, 1991). The purpose of the Multifactor Leadership Questionnaire is to reveal factors that differentiate between effective and ineffective leaders. The theoretical foundation of the questionnaire is based on the work of Bass (1985; 1998) on leadership styles of military commanders in Greece and is considered valid across a number of cultures and types of organizations (Antonakis, Avolio, &Sivasubramaniam, (2003). This instrument would be divided in to three sections with 10 questions in each of the sections; Transformational leadership style, Transactional leadership style and laissez-fair leadership style. The MLQ has been tested by Bass in a number of studies in Greece and has been found to have high validity and reliability (Bass, 1995; Bass, 1998; Bass, 1990; Bass & Riggio, 2006). Although the MLQ was used in military settings in Grece to test the leadership style of the military leaders or in business settings to examine the leadership behaviors of the management teams, the MLQ has also been successfully translated to other languages and used in educational settings world- wide (Ingram, 1997).
Section D: addressed items that measure teachers on remuneration. It has ten items which took care of the research questions raised and the hypotheses formulated for the study. Responses to items of both the TJOQ, MLQ as well as Remuneration was based on a four point likert- type scale from “Strongly Agreed (SA) to Strongly
Disagree (SD).” which was assigned numbers 4, 3, 2, and 1 respectively. Scaled item was used in this study, because it allows for fairly accurate assessment of opinions. The questions will be close ended.
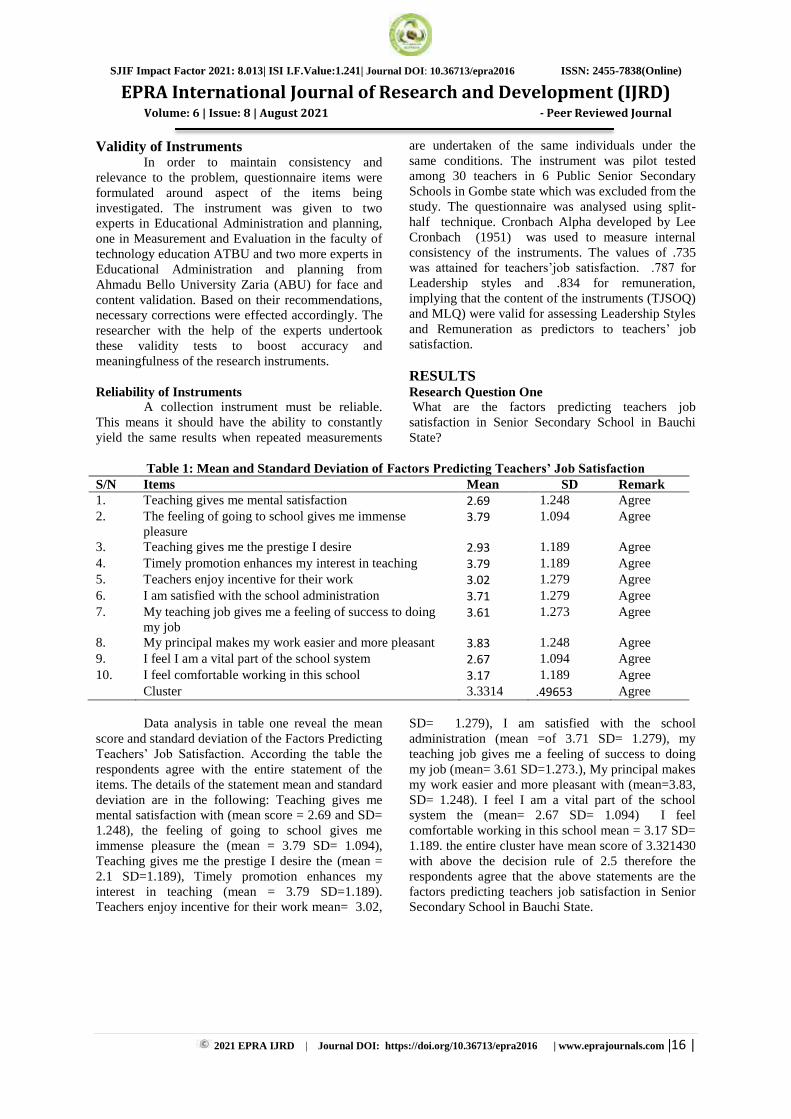
SJIF Impact Factor 2021: 8.013| ISI I.F.Value:1.241| Journal DOI: 10.36713/epra2016 ISSN: 2455-7838(Online)
EPRA International Journal of Research and Development (IJRD)
Volume: 6 | Issue: 8 | August 2021 - Peer Reviewed Journal
2021 EPRA IJRD | Journal DOI: https://doi.org/10.36713/epra2016 | www.eprajournals.com |16 |
Validity of Instruments In order to maintain consistency and
relevance to the problem, questionnaire items were formulated around aspect of the items being investigated. The instrument was given to two experts in Educational Administration and planning, one in Measurement and Evaluation in the faculty of technology education ATBU and two more experts in Educational Administration and planning from Ahmadu Bello University Zaria (ABU) for face and content validation. Based on their recommendations, necessary corrections were effected accordingly. The researcher with the help of the experts undertook these validity tests to boost accuracy and meaningfulness of the research instruments. Reliability of Instruments
A collection instrument must be reliable. This means it should have the ability to constantly yield the same results when repeated measurements
are undertaken of the same individuals under the same conditions. The instrument was pilot tested among 30 teachers in 6 Public Senior Secondary Schools in Gombe state which was excluded from the study. The questionnaire was analysed using split-half technique. Cronbach Alpha developed by Lee Cronbach (1951) was used to measure internal consistency of the instruments. The values of .735 was attained for teachers‟job satisfaction. .787 for
Leadership styles and .834 for remuneration, implying that the content of the instruments (TJSOQ) and MLQ) were valid for assessing Leadership Styles and Remuneration as predictors to teachers‟ job satisfaction. RESULTS Research Question One What are the factors predicting teachers job satisfaction in Senior Secondary School in Bauchi State?
Table 1: Mean and Standard Deviation of Factors Predicting Teachers’ Job Satisfaction
S/N Items Mean SD Remark 1. Teaching gives me mental satisfaction 2.69 1.248 Agree 2. The feeling of going to school gives me immense
pleasure 3.79 1.094 Agree
3. Teaching gives me the prestige I desire 2.93 1.189 Agree 4. Timely promotion enhances my interest in teaching 3.79 1.189 Agree 5. Teachers enjoy incentive for their work 3.02 1.279 Agree 6. I am satisfied with the school administration 3.71 1.279 Agree 7. My teaching job gives me a feeling of success to doing
my job 3.61 1.273 Agree
8. My principal makes my work easier and more pleasant 3.83 1.248 Agree 9. I feel I am a vital part of the school system 2.67 1.094 Agree 10. I feel comfortable working in this school 3.17 1.189 Agree Cluster 3.3314 .49653 Agree
Data analysis in table one reveal the mean
score and standard deviation of the Factors Predicting Teachers‟ Job Satisfaction. According the table the
respondents agree with the entire statement of the items. The details of the statement mean and standard deviation are in the following: Teaching gives me mental satisfaction with (mean score = 2.69 and SD= 1.248), the feeling of going to school gives me immense pleasure the (mean = 3.79 SD= 1.094), Teaching gives me the prestige I desire the (mean = 2.1 SD=1.189), Timely promotion enhances my interest in teaching (mean = 3.79 SD=1.189). Teachers enjoy incentive for their work mean= 3.02,
SD= 1.279), I am satisfied with the school administration (mean =of 3.71 SD= 1.279), my teaching job gives me a feeling of success to doing my job (mean= 3.61 SD=1.273.), My principal makes my work easier and more pleasant with (mean=3.83, SD= 1.248). I feel I am a vital part of the school system the (mean= 2.67 SD= 1.094) I feel comfortable working in this school mean = 3.17 SD= 1.189. the entire cluster have mean score of 3.321430 with above the decision rule of 2.5 therefore the respondents agree that the above statements are the factors predicting teachers job satisfaction in Senior Secondary School in Bauchi State.

SJIF Impact Factor 2021: 8.013| ISI I.F.Value:1.241| Journal DOI: 10.36713/epra2016 ISSN: 2455-7838(Online)
EPRA International Journal of Research and Development (IJRD)
Volume: 6 | Issue: 8 | August 2021 - Peer Reviewed Journal
2021 EPRA IJRD | Journal DOI: https://doi.org/10.36713/epra2016 | www.eprajournals.com |17 |
Research Question Two To what extent does transformational leadership style predict teachers‟ job satisfaction?
Table 2: Mean and Standard Deviation of Transformational Leadership Style S/N Statement
My Principal Mean SD Remark
1. makes teachers feel good around him/her and about themselves
2.78 .953 High Extent
2. has followers who are proud to be associated with him/her 3.81 1.286 High Extent
3. urges the group to beat its past 2.95 1.380 High Extent 4. considers the moral and ethical implications of each
decision 3. 35 1.037 High Extent
5. helps others develop their strength. 3. 98 1.369 High Extent 6. provides feedback to teachers on how they are doing 3.87 1.121 High Extent 7. allows teachers to think about old problems in new ways 3.72 1.219 High Extent 8. goes beyond self- interest for the good of the school 3.01 .899 High Extent
9. overcomes barriers to reach the goal 2.58 1.176 High Extent
10. expresses in few simple words what we could and should do
3.26 1.116 High Extent
3.0314 1.054
The result of the data analysis indicates that teachers perceived that Transformational Leadership Style is a predicting factor in job satisfaction with an average mean of 3.03. Details of the analysis revealed that teachers perceived that their Principal help others develop their strength with a mean score of 3.98. They also perceived that their Principal provide feedback to teachers on how they are doing with a mean score of 3.87. This is followed by My Principal has followers who are proud to be associated with him/her with a mean score of 3.81. The teachers perceived that their Principal allows teachers to think about old problems in new ways (3.72) and considers the moral and ethical implications of each decision (3.35). My Principal Expresses in few simple words what we could and should do (3.26) and goes beyond self- interest for the good of the school (3.01). Furthermore, they perceived that their Principal urges the group to beat its past (2.95), makes teachers feel good around him/her and about themselves (2.78) and overcomes barriers to reach the goal (2.58)
It can be concluded therefore, that to a high extent teachers perceived that Principals‟
Transformational Leadership Style is a predicting factor in teachers‟ job satisfaction in senior secondary schools in Bauchi state. DISCUSSION OF FINDINGS The p-value of 0.05 which indicates significance level of the prediction of principals‟ transformational
leadership style as a predictor of teachers‟ job
satisfaction was subjected to test of significance, the result in Table shows the P – value of .006. This
value is less than the 0.05 level of significant at which the researcher is prepared to accept or reject the null hypothesis. The null hypothesis which says Principals‟ Transformational leadership style, does
not significantly predict teachers‟ job satisfaction is
therefore rejected thus, the alternate hypothesis is retained, Principals‟ Transformational leadership style, predict teachers‟ job satisfaction. This means
that transformational leadership style is highly effective in enhancing teachers job satisfaction. This finding is In agreement with Judge & Piccolo (2004), who found that employees are more satisfied with transformational leadership than any other style. He also revealed that this type of leadership was not being exercised by most managers. The study concluded that transformational leadership leads to better satisfied employees. It is also in agreement with Lok & Crawford (2004) who looked at this scenario and affirmed that transformational leadership improves employees job satisfaction and commitment to work. The findings also showed that, as the Pearson Product Moment Correlation Coefficient r = .411 and the p value = .010 is less than 0. 05 level of significance, therefore, the hypothesis which says that there is no significant relationship between environment and teachers‟ job performance is
rejected. This shows that environment has a significant influence on teachers‟ job performance.
The finding is in line with Denga (1990) and Nwachuku (1992) who all shared the opinion that work environment has serious effects on job performance of teachers.

SJIF Impact Factor 2021: 8.013| ISI I.F.Value:1.241| Journal DOI: 10.36713/epra2016 ISSN: 2455-7838(Online)
EPRA International Journal of Research and Development (IJRD)
Volume: 6 | Issue: 8 | August 2021 - Peer Reviewed Journal
2021 EPRA IJRD | Journal DOI: https://doi.org/10.36713/epra2016 | www.eprajournals.com |18 |
The findings equally indicates that there is significant relationship between teacher‟s career development and their job performance with r = .468 the relationship is significant with p-value of .004 which is lower than 0.05 level of significance. The hypothesis which say there is no significant relationship between career development and teachers‟ job performance is therefore, rejected. This implies that when teachers are developed in their career it helps to increase their job performance. The finding of the study is in line with Alsamari & Bennel (2004) who studied the effect of teacher training on teacher value added. The result showed that training of the teacher was positively associated with productivity. There is a significant relationship between teachers‟ career advancement and their job
performance as the Pearson Product Moment Correlation Coefficient r = .400 and the p value = .005 therefore, the hypothesis which says there is no significant relationship between teachers career advancement and their job performance is rejected. This shows that promotion has a positive relationship with teachers‟ job performance. CONCLUSION
Based on the results that were found in the study, it was concluded that TJSOQ and MLQ consist of 18 and 21 item clusters. Each item has the minimum requirement for being acceptable for research assessment according to the research findings of this study. Therefore, the reliability and validity of the instrument is good, hence the instrument obtained 2.5 and 2.58 which signify good reliability. RECOMMENDATIONS From the aforementioned findings and conclusions, the study recommends that:
1. There is need to give room for in service training for teachers in the state secondary schools. When this is done it will lead to showing more positive attitude towards their jobs which in turn lead to increase in productivity.
2. Also, the state government should make sure that there is adequate provision of clean and conducive environment for teachers. When these provisions are made it will help to enhance teachers‟ performance.
3. The State Ministry of Education should organize regular inspection to schools to monitor the style of leadership used by principals that could enhance better job performance among teachers. This is necessary in order to achieve the objective
of secondary education as entrenched in the National Policy on Education.
4. The state ministry of Education and other agencies involved should endeavour to monitor the type of leadership style used in senior secondary schools. Good transformational leadership style will lead to better satisfaction of teacher‟s job.
REFERENCES
1. Abdu, N. & Nzilana, J.L. (2018). The influence of Teachers job satisfaction and commitment in teaching Public Primary Schools in Tanzania. Journal of Education and Practice. 9 (4), 3-5.
2. Acha, A. K. (2010). Motivation and the performance of primary school teachers in Uganda:A case study of kamanya-kyabuka.(master’s thesis) University of Makere,
Uganda. 3. Adeyinke, A. O. Asabi, M. & Adedotun A. O.
(2013). Teachers and student academic performance in Nigerian Secondary schools: implications for planning. Department of education management, university of Ilorin: University press
4. Akinsola, O. O. (2012). Teachers motivation on student performance in mathematics in Government secondary schools, Makurdi: International journal of humanities and social science invention ISSN (online):2319-7722.
5. Al-Samari, S,& Bennel, P. (2005). Where has all the Education gone on Africa Employment outcomes among secondary school and university leavers
6. Avolio, B., & Bass, B. (1991). The full-range of leadership development. Binghamton, NY: Center for Leadership Studies.
7. Bennel, P. S. (2004). Teacher motivation and incentives in sub-saharan Africa and Asia. Knowledge and skills for development: Brighton.
8. Bass, B. M., & Avolio, B. J. (1990). Developing transformational leadership: 1992 and beyond. Journal of European Industrial Training, 14(5).
9. Bogler, R. (2001). The influence of leadership style on teacher job satisfaction. Educational Administration Quarterly, 37(5), 662-683
10. Bishay, A. (2006). Teacher Motivation and Job Satisfaction among Secondary School Teachers in Makere District. Uganda: Fountain publishers
11. Awodun, A. (2016), Impact of teachers’
motivational indices on science students. Academic performance in Nigerian senior secondary schools. url:http:lldx.doi.org/1 0.5539 /ies.von2p49.
12. Gitaka, J. W. (2014). Influence of head teachers’
leadership styles on Teachers’ job satisfaction in
Public Primary Schools in Kajiado North District, Doctorate Dissertation, University of Nairobi Kenya.
13. Griffith, J. (2004). Relation of principal transformational leadership to school staff job satisfaction, staff turnover, and school

SJIF Impact Factor 2021: 8.013| ISI I.F.Value:1.241| Journal DOI: 10.36713/epra2016 ISSN: 2455-7838(Online)
EPRA International Journal of Research and Development (IJRD)
Volume: 6 | Issue: 8 | August 2021 - Peer Reviewed Journal
2021 EPRA IJRD | Journal DOI: https://doi.org/10.36713/epra2016 | www.eprajournals.com |19 |
performance. Journal of Educational Administration, 42(3), 333-356.
14. Hariri, H. (2011). Leadership styles, decision-making styles, and teacher job satisfaction: an Indonesian school context (Doctoral dissertation). James Cook University, Australia.
15. Herzberg, F. (1966). Work and the nature of man. New York, NY: World Publishing.
16. Heyden, S. S. (2011). Teachers motivation and students’ achievement in middle school students.
PPO quest. Dissertation and thesis(Unpublished).
17. Gosnell, S. (2000). Determinant of career satisfaction among federal employees. Paper presented at the seminar on public policy. Georgia Institute of Technology., Georgia, USA.
18. Hui, H., Jenatabadi, H. S., Ismail, N. A., & Mohammed Radzi, C. W. (2013). Principal’s
Leadership Styles and Teachers Job Satisfaction: A case Study in China. Interdisciplinary journal of contemporary research in business 5 (4).
19. Kooi, S.W. (2017). Factors Associated with Job Satisfaction and work centrally. Comparative Edu: 26(2/3): 259.
20. Koutouzis, M., & Malliara, K. (2017). Teachers Job Satisfaction: The effect of Principals Leadership and Decision- Making styles in. international Journal of Education. 9 ( 1) 4-5.
21. Lawler, (1973). Motivation in work Environment. Newyork; Brookscole
22. Luthans,F.(2005). Organisational behaviour. Newyork: MCGrow-Hill.
23. Rad, A. M. M., & Yarmohammadian, M. H. (2006). A study of relationship between managers' leadership style and employees' job satisfaction. Leadership in Health Services, 19(2), 11-28.
24. Sadeghi, A.,& Lope Pihie, Z. A. (2012). Transformational Leadership Styles in Enhansing Lecturers’ Jo Satisfaction. International Journal
of Business and Social Sciences. 3 (7). 25. Spector, P. E. (1997). Job Satisfaction,
Application, Assessment, Causes and consequences. California: Sage Publication.
26. Bass, B. M., & Avolio, B. J. (1990). Developing transformational leadership: 1992 and beyond. Journal of European Industrial Training, 14(5).
SJIF Impact Factor 2021: 8.013| ISI I.F.Value:1.241| Journal DOI: 10.36713/epra2016 ISSN: 2455-7838(Online) EPRA International Journal of Research and Development (IJRD)
Volume: 6 | Issue: 8 | August 2021 - Peer Reviewed Journal
2021 EPRA IJRD | Journal DOI: https://doi.org/10.36713/epra2016 | www.eprajournals.com |20 |
SOLAR ELECTRIC WHEELCHAIR WITH A FOLDABLE
PANEL
Jainam J. Sanghvi¹, Maulik Y. Shah², Jay K. Fofaria³
¹ Student, Department of Mechanical Engineering, A. D. Patel Institute of Technology, Gujarat, India.
² Student, Department of Mechanical Engineering, A. D. Patel Institute of Technology, Gujarat, India.
³ Student, Department of Mechanical Engineering, A. D. Patel Institute of Technology, Gujarat, India.
Article DOI: https://doi.org/10.36713/epra8021 DOI No: 10.36713/epra8021
ABSTRACT For physically challenged individuals the most basic expression of freedom would be the ability to be mobile. Modern
medical science being highly advanced designed a device of help for physically challenged individuals, called the
wheelchair. The market provides a vast assortment of options in a wheelchair to fulfill the desired need and
requirements of the consumer. To make the system energy efficient we have designed a solar wheelchair in which solar
power is used. This keen wheelchair is additionally fitted with a leg guard for the safety of the legs. In addition, we
have added a mechanism that allows our solar panel to fold and settle at a safe place, or in other terms, Solar
Wheelchair with a foldable panel. All our effort has been in the direction, to make this solar-induced wheelchair at an
affordable cost along with having an optimal utilization in the external as well as the internal environment.
KEYWORDS: Assistive device, Electric mode, Foldable solar panel, Solar Powered Wheelchair.
I. INTRODUCTION As we all are aware that with respect to
advancement in technology, wheelchairs have been modified such as voice modulation, automatic guidance, automatic joystick control, gesture controls, and a lot more. Our wheelchair is an Automatic Solar Wheelchair and as a part of innovation, we have added different features to it.
Many different kinds of wheelchairs have been previously designed; also, different solar wheelchairs have been designed. However, none thinking about the safety of one of the most important components, solar panels. We have designed a Solar Wheelchair by adding a foldable mechanism in the solar panel for its safety and a leg guard for the betterment of the driver. In addition, the wheelchair will be completely automatic and guided by a joystick.
II. WHEELCHAIR DESIGNING
The advancement & creativity in science, led to the development of ample solutions in response to the problem of mobility with a variety of wheelchairs that can mount through the stairs, advance rough roads, follow local commands, or maybe respond to human thoughts as well. Usually, people demand indoor or outdoor surfaces that provide a comfortable & smooth experience along with reducing the amount of human labor for the physically disabled ones. Things ease-out, for handicaps if the user can see where he/she is going & operate his/her joystick as well as control & maneuver his/her chair with a few buttons easily. The operational power of solar the wheelchair is gained from sunlight, which is then stored to be utilized in times of need.

SJIF Impact Factor 2021: 8.013| ISI I.F.Value:1.241| Journal DOI: 10.36713/epra2016 ISSN: 2455-7838(Online) EPRA International Journal of Research and Development (IJRD)
Volume: 6 | Issue: 8 | August 2021 - Peer Reviewed Journal
2021 EPRA IJRD | Journal DOI: https://doi.org/10.36713/epra2016 | www.eprajournals.com |21 |
III. SOLAR WHEELCHAIR
Energy acts as the source of power to conduct life activities, the sources of which are depleting exponentially, that enforced mankind to discover & increase the dependency upon inexhaustible resources, to curb the demands. Sunlight, amongst all the inexhaustible resources is plenty, eco-friendly and emission-free source. Therefore, it has been focused upon by the entire world to have its optimum usage for technical purposes. An electrically induced wheelchair is set in motion with the help of an electric motor rather than human effort. The difference between electrically & manually induced wheelchairs lie in the former being four-wheeled & non-foldable, whereas the latter is equipped with a system that provides auxiliary electrical power, which can be attached to the manually propelled wheels or integrated beneath the wheelchair. The electrical motors gain intensity through rechargeable batteries that are 4 or 5 amp deep cycled.
IV. EXPERIMENTAL SECTION
The different components of our Solar Wheelchair are:
Frame, seat, armrest, leg rest, wheels, caster wheels, solar panel, solar battery charger, joystick, steering mechanism, indicators, DC motors, batteries, and support stands.
A. Solar Panels
The photovoltaic solar panels are the bundle of solar cells that are interconnected to form an assembly. The installation of a photovoltaic panel involves a lineup of solar panels, an inverter, batteries, and an interconnected network of wires. The panel contains 36 cells, 65 x 39 in, and a basic circuit voltage of Voc = 22V. Somewhere between 12 & 14 volts of working voltage. The area of 2535 in² is covered by the panels in total. All the cells offer around 15% efficacy. Considering the conditions to be appropriate & ideal, the power generated all to the critical calculation shall be 100w. The solar wheelchair operates in 2 ways exposing & charging it through sunlight and storing the energy to be utilized when in need. In case the stored solar energy is deployed, the user can change it with the help of a wall outlet changer. SPECIFICATION OF SOLAR MODULE: Peak Power Output (P max, Watt) = 100 Current at P max (I max, Amp) = 5.5
Voltage at P max (V max, Volt) = 18.2 Short Circuit Current (I sc, Amp) = 5.92 Open Circuit Voltage (Voc, Volt) = 22 Dimensions (in inches) = 65 x 39
Fig I Voltage vs Current graph of solar panel
Fig II Voltage vs Power graph of solar panel
B. Frame
The frame acts as the selection of the solar wheelchair, which carries the complete weight of the user. The frame is the center where all the other parts are attached with the help of nut bolts or brackets. The frame is designed from iron, chrome, or steel square beams of diameter 35 mm. The beams of different lengths are placed and soldered as an arc that aids it makes it capable to beam the weight and decrease the vibrations when in motion. The peak is set as 105 cm, the width is 57 cm and the seating is 46 x 48 cm². The detailed planning & designing of the wheelchair is done in such a way that the assemblies are arranged on both sides of the wheelchair, one per armrest. The solar panel deployment is regulated through a pivoting bracket, which rotates with the help of actuators that makes the panels emerge from the rear to front.

SJIF Impact Factor 2021: 8.013| ISI I.F.Value:1.241| Journal DOI: 10.36713/epra2016 ISSN: 2455-7838(Online) EPRA International Journal of Research and Development (IJRD)
Volume: 6 | Issue: 8 | August 2021 - Peer Reviewed Journal
2021 EPRA IJRD | Journal DOI: https://doi.org/10.36713/epra2016 | www.eprajournals.com |22 |
C. Seat
Umpteen number of options are available in regards to the size & the luxury of the seat, but the one that maintains the weight of chair within a range of 25kg suits the best. The seat size is to be managed according to the frame dimensions. Hooking towards the comfort of the chair, the preferential choice would be the one with a good headrest and arm support.
D. Wheels
The wheel assembly consists of a wheel hub, DC motor, and bolt & nuts, which couples the wheels to the motor shaft. The electrical motor is attached to the wheel hub. Hub motor is equipped with electromagnetic pads that make the motor windings steady. The outer motor obeys those wheels that turn the attached wheel. The best part about this design is that there is no need for extra transmission, which expands the efficiency of the drive system. The wheels of about 50cm diameter and designed from aluminum or magnesium alloys have been used.
E. Caster
Caster is the small single, double, or compound wheels that are coupled at the bottom surface of a bigger object to help it maneuver. On this wheelchair, the caster is attached to the bottom surface of the seat that aides it to circulate around its axis which is horizontal, providing comfort to the user. Variations in caster are subjected to materials used for its manufacturing like rubber, aluminum, nylon, or chrome steel. These casters are commonly used in devices like carts available in malls and chairs available in offices. The diameter of the caster wheels used here is 15cm. Caster wheels can move freely over smooth & flat surfaces.
F. Battery Charger
The amount of energy received through sunlight is uneven. The output from a solar PV module mounted on a structure depends, among others, on the 0⁰ angle at which the irradiations reach the module surface. To make the optimal use of sunlight the solar charge controllers are designed to extract the most amount of power available from the solar array and deposit it within the battery. These charge controllers are important to safeguard the PV battery investment.
G. DC Motors
The wheels will be operated with the help of two DC motors with a power of 24V and restrained in a
way that provides safety with the max speed of 6-8 miles/hr. Batteries will operate the motors.
H. Battery
The power generated from the solar panel needs to be stored which will be used to run the DC motors. Energy generated from the solar panel is stored in a battery, which is controlled by a solar battery charger. Then this power is used to run the motor. The battery we have used is a lead-acid battery of 12 V, 100 AH.
I. Joystick
To move a wheelchair automatically joystick is required. With the proper setup of the steering mechanism and with joystick it will direct motors and move the wheelchair forward, backward, left, or right.
J. Steering mechanism
The innovation & designing of the solar-induced wheelchair is done in a way that it gains maximum power from an electric motor and not manually. At aids comfort to the patient of traditional as well as fatigued or cardiovascular impairments. Constant efforts in making the wheelchair more comfortable have presented the consumers with a variegated option such as, wheelchair with wheels & non-foldable or foldable and some that can temporarily dismantle for transit. Manual wheelchairs are equipped with a system that provides auxiliary electrical power with which it can take one of the above forms. Since it is equipped with hand-propelled wheels the application of force on such aims is enlarged by the drive system, which transmits the driving force to most wheels either through a friction drive system or through an auxiliary drive wheel.
K. Microcontroller
The microcontroller is known as the little computer. They are drafted with ingrained applications and utilized in devices that are automatically controlled like implantable medical devices, power tools, or remote systems.
When the operator sends a signal from the joystick to take a turn, the microcontroller receives a signal and sends it to H-bridge to control the movement of wheels.
PIC16F877A is the microcontroller utilized in wheelchair circuit. Which is an automatic cheaper reliable and expandable system.

SJIF Impact Factor 2021: 8.013| ISI I.F.Value:1.241| Journal DOI: 10.36713/epra2016 ISSN: 2455-7838(Online) EPRA International Journal of Research and Development (IJRD)
Volume: 6 | Issue: 8 | August 2021 - Peer Reviewed Journal
2021 EPRA IJRD | Journal DOI: https://doi.org/10.36713/epra2016 | www.eprajournals.com |23 |
PIC16F877A features an 8-bit PIC CPU, 256 bytes data EEPROM, with operating voltage of 2 to 5.5V.
L. H-Bridge
For the voltage that is supplied across the weight in all directions, H-bridge is necessary as a communicator mediating the programmed circuit & the physical work done. H-bridge gives binary commands that set high-power actuators in action. The prime function of the H-bridge is to manage the rotational direction of the DC motor, which means the movement of the wheelchair in our case.
Thus, the wheelchair circuit is equipped with an H-bridge made of four switches.
Table- I Direction control table
Fig I & II Proposed design
V. CALCULATIONS
A. Rpm
Taking Maximum speed of wheelchair V =8 km/hr. RPM of shaft wheel (let say N). V = *D*N/60 V = Speed of wheel chair = 8 km/hr Pi = 3.14 D = Diameter of wheel = 0.50 m N = Rpm of wheel
V= *D*N/60 8*1000/60x60 = (3.14x 0.50x N)/60 RPM =N =84.9 = 85(approx.)
B. Weight
If total weight (W) =120 kg (Assume). Person (P) = 80 kg, Weight of the system (S) = 40 kg.
Weight (on each wheel) = m x g m = Mass on one wheel g = Gravity (9.81)
Weight = m x g Weight = 60 x 9.81= 588.6 Newton
C. Torque
T= F*r T = Torque F = Force r = Radius
Torque = 588.6 x 0.05 (D= 10 cm, r = 5cm) Torque = 29.43 Nm
D. Power
Power = 2*pi*N*T/60 Power = 2 x 3.14xN x T/60 Power = 2 x 3.14x 85x 24.943/60
Joystick movement
DC motor (left) DC motor (right)
Displace backward
Displace forward
Displace forward
Displace backward
Displace forward
Displace forward
Displace backward
Displace backward

SJIF Impact Factor 2021: 8.013| ISI I.F.Value:1.241| Journal DOI: 10.36713/epra2016 ISSN: 2455-7838(Online)
EPRA International Journal of Research and Development (IJRD) Volume: 6 | Issue: 8 | August 2021 - Peer Reviewed Journal
2021 EPRA IJRD | Journal DOI: https://doi.org/10.36713/epra2016 | www.eprajournals.com |24 |
Power = 217.35 Watt
E. Solar Panel Calculation
Power of panel = V*I V = Voltage I = Current in ampere Total voltage of solar panel = 18.0 volts Ampere = 5.5 Amp. Power of panel = V*I = 18x 5.5 = 99 = 100 Watt
(approx.)
F. Traction Force
F (one wheel) = μt W F = Traction force (N) μt = Traction or coefficient of friction W = Weight or (N) m = Mass on the wheel (kg) ag = Acceleration of gravity (9.81 m/s2)
F (one wheel) = μt W F = (μt m ag) /4 F = (0.9x120x9.81)/4 F =1059.48/4 F =264.87 N F (both wheels) = 2(264.87) =529.74 N
VI. FOLDING MECHANISM As shown in the above pictures, we have added a
mechanism for the folding of solar panels. As we know, solar panels are very costly and harm to the panel cannot be afforded. However, while the panel is open or in its normal position, birds or other varying conditions can harm it. Keeping this idea in mind, we started research over it and developed a machine that can fold the panel and keep it in a safe place.
Support for panel after folding is added, which will be of sponge. It helps absorb shocks and keep the solar panel intact. The mechanism added is not much costly and can be adjusted in a small amount. The mechanism is easy and simple as shown in Figures I, II, III, IV. While manual driving or nighttime, the panel is inactive. At this time, the panel is not needed, and
not having it in its normal position is a better option. The panel can be easily cleaned after folding, thus increasing its efficiency and lifetime.
A. Working
It is having a very simple and easy mechanism and does not need any expertise. It is a long-lasting mechanism and needs normal and small maintenance like cleaning and oiling.
When a Solar panel is not in use, slowly unlock the panel from the support stand. By applying normal force fold the panel in the upward direction and slide it from grooves. After it sliding, rotate and fold the solar panel into its carrier ensuring the safety of the panel.
The support stand is also foldable. Push the topmost layer into the second carefully. Repeat the same for the third one and thus the stand will go inside.
Fig I, II, III and IV Folding Mechanism

SJIF Impact Factor 2021: 8.013| ISI I.F.Value:1.241| Journal DOI: 10.36713/epra2016 ISSN: 2455-7838(Online)
EPRA International Journal of Research and Development (IJRD) Volume: 6 | Issue: 8 | August 2021 - Peer Reviewed Journal
2021 EPRA IJRD | Journal DOI: https://doi.org/10.36713/epra2016 | www.eprajournals.com |25 |
VII. CONCLUSION The solar electric wheelchair with a foldable panel
provides freedom to physically challenged people. The solar panel allows users to store solar energy in the battery during the daytime and use it for their mobility. With the help of all the components like motor, steering mechanism, joystick, etc. allows sufficient mobility to the users. Separate motors are used to take a turn on a straight path. The proposed design is the extension of previously made Solar Wheelchairs with certain advancements and certain
points at which they were lagging like efficiency, economy, design, etc.
Our solar electric wheelchair has a foldable solar panel that allows it to fold and settle at a safe place providing safety to the solar panel. The foldable panel can easily be cleaned after folding it, thus increasing its efficiency and lifetime. This solar wheelchair is economical and efficient. The prime benefit of our solar wheelchair is that, it provides safety to solar panels, and is eco as well as user-friendly in nature
REFERENCE 1. Shamim Kaiser, Zamshed Iqbal Chowdhury,
Shamim Al Mamun, Amir Hussain, and Mufti Mahmud, “A Neuro-Fuzzy Control System Based on Feature Extraction of Surface Electromyogram Signal for Solar-Powered Wheelchair,” Cogn Comput, vol. 8, no. 5, pp. 946–954, Oct. 2016, doi: 10.1007/s12559-016-9398-4.
2. AKM Bahalul Haque, Shawan Shurid, Afsana Tasnim Juha, Md. Shadman Sadique, and Abu Sayem Mohammad Asaduzzaman, “A Novel
Design of Gesture and Voice Controlled Solar-Powered
3. Smart Wheel Chair with Obstacle Detection,” in
2020 IEEE International Conference on Informatics, IoT, and Enabling Technologies (ICIoT), Feb. 2020, pp. 23–28. doi: 10.1109/ICIoT48696.2020.9089652.
4. Syed Nazmus Sakib, Syeda Puspita Mouri, Zannatul Ferdous, and M. Shamim Kaiser, “A
study on low cost solar powered wheel chair for disabled people of Bangladesh,” in 2015 18th International Conference on Computer and Information Technology (ICCIT), Dhaka, Bangladesh, Dec. 2015, pp. 27–31. doi: 10.1109/ICCITechn.2015.7488037
5. Chi-Sheng Chien, Tung-Yung Huang, Tze-Yuan Liao, Tsung-Yuan Kuo, and Tzer-Min Lee, “Design and development of solar power-assisted manual/electric wheelchair,” J Rehabil Res Dev, vol. 51, no. 9, pp. 1411–1425, 2014, doi: 10.1682/JRRD.2013.11.0250.
6. Ali H A Alwaeli, “Electric-powered wheelchair with solar cell and single axis tracker,”
International Journal of Computation and Applied Sciences IJOCAAS, vol. 4, no. 2, p. 6, 2018.
7. Nida Riaz and Junaid Bin Aamir, “Electrical
wheel chair with retractable solar panels,” in
2014 International Conference on Energy Systems and Policies (ICESP), Islamabad,
Pakistan, Nov. 2014, pp. 1–6. doi: 10.1109/ICESP.2014.7346983.
8. V V Dighe, Sadaphal Avinash Bapusaheb, Shinde Ankita B., and Kurup Vidya V., “Self-Assisted Solar operated Wheelchair,” IJARIIE, vol. 3, no. 1, p. 6, 2017.
9. P. Kishore, Manikandan Ananth, Sethu Chidambaram, B. Vivekanandan, and N. Ammasai Gounden, “Solar Based Hybrid
Electric Powered Wheel Chair,” in 2013 Texas Instruments India Educators’ Conference, Bangalore, Apr. 2013, pp. 18–24. doi: 10.1109/TIIEC.2013.11.
10. Prof S.s.rashinkar, S. S. Lohar, A. L. Bhoi, P.V.GAVALI, and K. S. Ambekar, “SOLAR
POWERED ELECTRIC WHEEL CHAIR,”
JournalNX, pp. 35–37, 2017. 11. A.H Aswathy et al., “Solar powered intelligent
electric wheel chair with health monitoring system,” in 2017 International Conference on Technological Advancements in Power and Energy ( TAP Energy), Kollam, Dec. 2017, pp. 1–5. doi: 10.1109/TAPENERGY.2017.8397319.
12. Neela Madheswari, S. Latha, and M. Iswarya, “Solar powered wheel chair with voice controller
for physically challenged persons,” in 2017 2nd International Conference on Communication and Electronics Systems (ICCES), Coimbatore, Oct. 2017, pp. 987–991. doi: 10.1109/CESYS.2017.8321229.

SJIF Impact Factor 2021: 8.013| ISI I.F.Value:1.241| Journal DOI: 10.36713/epra2016 ISSN: 2455-7838(Online)
EPRA International Journal of Research and Development (IJRD) Volume: 6 | Issue: 8 | August 2021 - Peer Reviewed Journal
2021 EPRA IJRD | Journal DOI: https://doi.org/10.36713/epra2016 | www.eprajournals.com |26 |
CHINESE BODY CLOCK: IN-DEPTH REVIEW BASED PERSPECTIVE
Dr. Jaya Bharti Assistant Professor, Department of Psychology, A.N.D.N.N.M.M. (CSJM University) Kanpur
ABSTRACT Chinese medicine's 24-hour body clock is divided into 12 two-hour intervals of qi (vital force), which moves
through the organ system. Chinese medicine practitioners use The Organ Body Clock to help determine the organ
responsible for diseases. For example, if you find yourself waking between 3-5 a.m. every morning, you may have
an underlying sadness or sadness that is bothering you or you may have a condition in the lung area. If feelings of
anger or resentment do arise, you may feel them strongest during liver time which is 1-3 p.m. or perhaps if you
experience back pain at the end of your work day. Can suppress feelings of fear, or maybe even kidney problems.
INTRODUCTION All forms of therapy and healing are different languages—and the Chinese Body Clock is no different. It is part of the larger philosophy and practice of Traditional Chinese Medicine (TCM), which has existed for thousands of years. As scholars and physicians studied the body and disease, they sought a way to relate and explain the body's response to its environment. It provided great insight into physical or emotional conditions. They began to see patterns of life, death, disease and recovery. These medical concepts form the centerpiece of Chinese medical theory. The Body Clock encourages us to examine closely what we are doing during daylight hours, and to match our actions to the most appropriate energetic times. It's about adaptation, balance, rest and recovery.TCM scholars were able to determine whether our organs function at their specific strongest or weakest, or high or low. (Keep in mind that the concept of TCM organs may differ somewhat from Western definitions and is often more comprehensive with their roles.) The clock is based on a 24-hour time period, and each organ corresponds to a two-hour interval when it is most abundant and strongest. As mentioned, the opposite of the interval for each organ is the time when it is at its weakest energy point. This relative strength and weakness reflects one of the main underlying principles in TCM: balance. The most important aspect of the body clock is its ability to explain how the body functions at particular times of the day to maintain our health and fight disease. The TCM Body Clock tells us when it is best to eat, sleep and exercise and much more. Specific emotions in TCM are naturally associated with organs, which
are also linked to the time of day. For example, many people wake up between 3-5 a.m. at lung time. The feeling associated with the lungs is sadness or anxiety, so we hear many patients say that they worry, or feel sad, during the night. The first twelve hours are comprised of the TCM organs that contain actions that help us to have a healthy and productive day. For example: respiration; To distance; taking in, digesting and assimilating nutrients; blood formation; Strong mental-emotional health, etc. As the day progresses and our activity (should) decrease, the next twelve-hour period sees chi moving through the organs, including most of the body's ability to store, preserve, repair, and balance. has capacity. METHODOLOGY The current article is a in-depth review of the existing literature on Chinese Body Clock or Traditional Chinese medicine. In this short review, accordingly, the electronic databases, including PubMed, Medline, Google scholar, Scopus and net based article were reviewed for relevant studies conducted or written since 2016, using the search terms Chinese Body Clock, Body-Energy Clock, Traditional Chinese medicine, and Chinese medicine in various combinations. RESULT The Body-Energy Clock is built on the concept of cyclical fluctuations and flow of energy throughout the body. During the 24-hour period (see diagram below) qi moves through organ systems in two-hour intervals. During sleep, qi is drawn inward to restore the body. This phase is completed between 1 and 3 o'clock, when the liver cleanses the blood and

SJIF Impact Factor 2021: 8.013| ISI I.F.Value:1.241| Journal DOI: 10.36713/epra2016 ISSN: 2455-7838(Online)
EPRA International Journal of Research and Development (IJRD) Volume: 6 | Issue: 8 | August 2021 - Peer Reviewed Journal
2021 EPRA IJRD | Journal DOI: https://doi.org/10.36713/epra2016 | www.eprajournals.com |27 |
performs a myriad of functions that set the stage for the qi to move outwards again.
WORKING STYLE OF CHINESE BODY CLOCK In the 12-hour period following the peak functioning of the liver - from 3 a.m. - the energy cycles to the organs associated with daily activity, digestion and elimination: lungs, large intestine, stomach/pancreas, heart, small intestine. By mid-afternoon, the energy moves again to support the internal organs associated with restoring and maintaining the system to support the internal organs. The purpose is to transfer fluid and heat, as well as filter and purify - by the pericardium, triple burner (coordination of water functions and temperature), bladder/kidney and liver.
5 to 7 am is the time of the large intestine, which is a perfect time to have a bowel movement and remove toxins from the day before. This is also the ideal time to wash your body and comb your hair. It is believed that combing the hair removes energy from the mind. At this time, a sense of rescue or a
feeling of being trapped may arise.
7-9 a.m. is tummy time so it's important to have the biggest meal of the day here to improve digestion and absorption. Hot food which is rich in nutrition is best in the morning. Emotions that are likely to stir up at this time include disgust or despair.
9-11am is the time of the pancreas and spleen, where enzymes are released to help digest food and release energy for the day ahead. This is the ideal time to exercise and work out. Make the most of your day doing work at this time. Feelings like low self-esteem can be felt at this time.
11 a.m. to 1 p.m. is the heart time that will work to pump nutrients throughout the body to help provide you with energy and nutrition. It is also a good time for lunch and it is advisable to have a light, cooked meal. It is also recommended to take a one hour nap or a cup of tea during this time. Extreme joy or sadness can also be felt at this time.
TRADITIONAL CHINESE ORGAN BODY CLOCK

SJIF Impact Factor 2021: 8.013| ISI I.F.Value:1.241| Journal DOI: 10.36713/epra2016 ISSN: 2455-7838(Online)
EPRA International Journal of Research and Development (IJRD) Volume: 6 | Issue: 8 | August 2021 - Peer Reviewed Journal
2021 EPRA IJRD | Journal DOI: https://doi.org/10.36713/epra2016 | www.eprajournals.com |28 |
"What if you were able to unlock the secret of working out for yourself every day? What if you knew the best times to eat and sleep, exercise and rest, when to do your most demanding work, your The ideal time to book therapy sessions or work on personal development is when you have the possibility to come up with good ideas, and all the other things that make life more simple and equal. On the side? The wonderful news is that the design already has you all day."
- Jost Sawyer “For thousands of years, Traditional Chinese Medicine has explored not only how our organs work, but how each of them directly affects our emotions and spirit. If an organ is out of balance or not working properly, it will affect both your physical well-being and how you relate to yourself and others on an emotional level.”
- John S. O’Neill, Akhilesh B. Reddy. “The Chinese Organ Clock can be used as a guide to understand your energy cycle, and help you understand
how to best nurture yourself, do certain things, and avoid others that lead to this. Depends on what time it is.” - Zhang. T, Yan. L, Juan. S, 2016
1 to 3 p.m. is the time of the small intestine and is when the previously eaten food will be digested and assimilated. This is also a good time to go about daily tasks or exercise. Sometimes, weak thoughts or feelings of abandonment arise in my subconscious at the moment.
3 to 5 p.m. is bladder time when metabolic wastes move into the filtration system of the kidneys. This is the right time to study or complete a task that challenges the mind. Another cup of tea is recommended as is drinking plenty of water to aid the detoxification processes. Feeling irritated or timid may also occur at this time.
5-7 pm is the kidney time when the blood is filtered and the kidneys work to maintain the proper chemical balance. This is the perfect time to eat dinner and activate your circulation by taking a walk, massaging or stretching. Subconscious thoughts of fear or terror may also be active at this time.
7-9 hrs is the circulation time when nutrients are transported to the capillaries and into each cell. This is the right time to read. Avoid doing mental activities during this time. Difficulty expressing emotions may also be felt. However, this is the right time to have sex or conceive.
9-11 PM is the time of the triple heater or endocrine system where the body's homeostasis is adjusted and enzymes are
replenished. It is advisable to sleep at this time so that the body can conserve energy for the next day. A sense of paranoia or confusion may also be felt.
11am to 1pm is gall bladder time and to wake up the body should feel energized. In Chinese medicine, this is a period of time when the yin energy fades and the yang energy begins to rise. Yang energy helps you stay active during the day and is stored while you are sleeping. Subconscious feelings of resentment may appear during this time.
1-3am is liver time and a time when the body should be asleep. During this, toxins come out of the body and fresh new blood is formed. If you find yourself waking up during this time, you may have too much yang energy or problems with your liver or detoxification pathways. This is also a time of anger, frustration and anger.
Lung time at 3-5 o'clock and again, this is the time the body should be sleeping. If awake at this time, nerve soothing exercises are recommended such as breathing exercises. At this time also the body should be kept warm so that the lungs can be helped to fill the body with oxygen. Lungs are also associated with feelings of grief and sadness.
ORGANS CORRELATE TO THE 2-HOUR INTERVALS OF THE CHINESE BODY CLOCK 2-HOUR
INTERVAL ORGAN AND PEAK FUNCTIONALITY
3–5 a.m. Lung: This period is when the lungs are at their peak energy. It’s is believed to be an
ideal time to exercise, as opposed to later in the day.
5–7 a.m. Large intestine: This period is thought to be when you should give yourself enough time to honor the elimination function of the large intestine.
9–11 a.m. Spleen: The spleen is thought to be linked to the stomach, which is in charge of receiving food and drink before ultimately fermenting them. During this period, it’s
believed that qi is being propelled upward by the spleen.
11–1 p.m. Heart: Because the heart represents peacefulness, it’s essential to reduce stress during
this period, according to those who prescribe to the Chinese body clock. 1–3 p.m. Small intestine: Heavier meals are believed to be more tolerated during this period, as
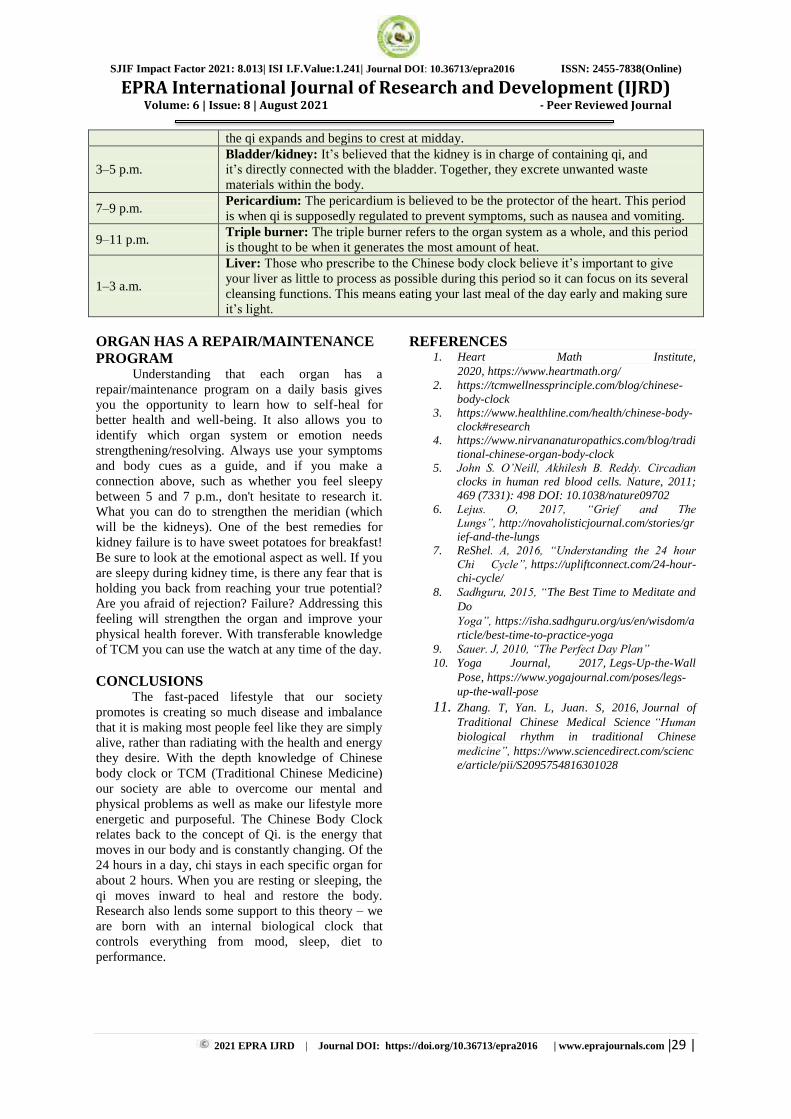
SJIF Impact Factor 2021: 8.013| ISI I.F.Value:1.241| Journal DOI: 10.36713/epra2016 ISSN: 2455-7838(Online)
EPRA International Journal of Research and Development (IJRD) Volume: 6 | Issue: 8 | August 2021 - Peer Reviewed Journal
2021 EPRA IJRD | Journal DOI: https://doi.org/10.36713/epra2016 | www.eprajournals.com |29 |
the qi expands and begins to crest at midday.
3–5 p.m. Bladder/kidney: It’s believed that the kidney is in charge of containing qi, and it’s directly connected with the bladder. Together, they excrete unwanted waste materials within the body.
7–9 p.m. Pericardium: The pericardium is believed to be the protector of the heart. This period is when qi is supposedly regulated to prevent symptoms, such as nausea and vomiting.
9–11 p.m. Triple burner: The triple burner refers to the organ system as a whole, and this period is thought to be when it generates the most amount of heat.
1–3 a.m.
Liver: Those who prescribe to the Chinese body clock believe it’s important to give
your liver as little to process as possible during this period so it can focus on its several cleansing functions. This means eating your last meal of the day early and making sure it’s light.
ORGAN HAS A REPAIR/MAINTENANCE PROGRAM Understanding that each organ has a repair/maintenance program on a daily basis gives you the opportunity to learn how to self-heal for better health and well-being. It also allows you to identify which organ system or emotion needs strengthening/resolving. Always use your symptoms and body cues as a guide, and if you make a connection above, such as whether you feel sleepy between 5 and 7 p.m., don't hesitate to research it. What you can do to strengthen the meridian (which will be the kidneys). One of the best remedies for kidney failure is to have sweet potatoes for breakfast! Be sure to look at the emotional aspect as well. If you are sleepy during kidney time, is there any fear that is holding you back from reaching your true potential? Are you afraid of rejection? Failure? Addressing this feeling will strengthen the organ and improve your physical health forever. With transferable knowledge of TCM you can use the watch at any time of the day. CONCLUSIONS The fast-paced lifestyle that our society promotes is creating so much disease and imbalance that it is making most people feel like they are simply alive, rather than radiating with the health and energy they desire. With the depth knowledge of Chinese body clock or TCM (Traditional Chinese Medicine) our society are able to overcome our mental and physical problems as well as make our lifestyle more energetic and purposeful. The Chinese Body Clock relates back to the concept of Qi. is the energy that moves in our body and is constantly changing. Of the 24 hours in a day, chi stays in each specific organ for about 2 hours. When you are resting or sleeping, the qi moves inward to heal and restore the body. Research also lends some support to this theory – we are born with an internal biological clock that controls everything from mood, sleep, diet to performance.
REFERENCES 1. Heart Math Institute,
2020, https://www.heartmath.org/ 2. https://tcmwellnessprinciple.com/blog/chinese-
body-clock 3. https://www.healthline.com/health/chinese-body-
clock#research 4. https://www.nirvananaturopathics.com/blog/tradi
tional-chinese-organ-body-clock 5. John S. O’Neill, Akhilesh B. Reddy. Circadian
clocks in human red blood cells. Nature, 2011; 469 (7331): 498 DOI: 10.1038/nature09702
6. Lejus. O, 2017, “Grief and The
Lungs”, http://novaholisticjournal.com/stories/grief-and-the-lungs
7. ReShel. A, 2016, “Understanding the 24 hour
Chi Cycle”, https://upliftconnect.com/24-hour-chi-cycle/
8. Sadhguru, 2015, “The Best Time to Meditate and Do Yoga”, https://isha.sadhguru.org/us/en/wisdom/article/best-time-to-practice-yoga
9. Sauer. J, 2010, “The Perfect Day Plan” 10. Yoga Journal, 2017, Legs-Up-the-Wall
Pose, https://www.yogajournal.com/poses/legs-up-the-wall-pose
11. Zhang. T, Yan. L, Juan. S, 2016, Journal of Traditional Chinese Medical Science “Human biological rhythm in traditional Chinese medicine”, https://www.sciencedirect.com/science/article/pii/S2095754816301028

SJIF Impact Factor 2021: 8.013| ISI I.F.Value:1.241| Journal DOI: 10.36713/epra2016 ISSN: 2455-7838(Online)
EPRA International Journal of Research and Development (IJRD) Volume: 6 | Issue: 8 | August 2021 - Peer Reviewed Journal
2021 EPRA IJRD | Journal DOI: https://doi.org/10.36713/epra2016 | www.eprajournals.com |30 |
ACCIDENT DETECTION AND REAL TIME INFORMATION
USING IOT TO AUTOMOBILES
Nagesha K T1, Ms. Sithara Chondamma2, Muhammed Shafeeq K R3
1Student, Dept of ECE, Coorg Institute of Technology, Ponnampet. 2Assistant Proffesor, Dept. of ECE, Coorg Institute of Technoology, Ponnampet.
3Student, Dept of ECE, Coorg Institute of Technology, Ponnampet.
ABSTRACT In automobiles, many advancements in technology could take place. Either interior or exterior, but cases of accident depend on
the driver and the other automobiles surrounding the driver. So, it takes a keen importance in emergency service providence in
automobiles in case of any accidents. In this project emergency service is activated as soon as there is any sight of accident.
Accident stimulus is taken from the sensors like vibration, tilt and flame sensors. This sensor module is connected to the
microcontroller which operates to perform the activity to send alert message in the system and also outside the system. If in case
there is no accident witnessed but still the sensor module has detected the emergency, driver can always switch the alert of from
the switch provided which is again connected to the microcontroller. Microcontroller sends signals to the Bluetooth module
connected to it in case of accident. Bluetooth module which is to be connected to the phone of the user or the driver will get access
to the android application.
In this android application the driver has to login and feed his personal details so that it helps in case of accident. He
will also be asked to feed his close contact to whom he wishes to send alert message in case of accident. This application send
message to the close contacts and also send message for the nearby hospital ambulance driver with location of accident. Since the
ambulance driver may or may not be near the accident area, application also get access to the ola or uber application to find the
nearby driver to pick up to the nearby hospital for emergency.
From this application time for surveillance to be provided is reduced so as to get immediate response to the emergency
victims.
KEYWORDS- Raspberry Pi, GPS, Vibration Sensor, L293D Motor Driver, Wi-Fi, Python. INTRODUCTION The high demand of automobiles has also increased the traffic hazards and the road accidents. In present days the rate of accidents can be increased rapidly. Due to employment the usage of vehicles like cars, bikes can be increased, because of this reason the accidents occur. People are going under risk because of their over speed, due to unavailability of advanced techniques, the rate of accidents can’t be decreased. To reduce the accident rate in the
country this paper introduces an optimum solution. Automatic alert system for vehicle accidents is introduced; the main objective is to control the accidents by sending a message to the registered mobile and nearby hospital, using wireless communications techniques. When an accident occurs at a city, the message is sent to the registered mobile and nearby hospital through GSM module in less time. When individual met with an accident which might be a very critical situation as their lives are on stake where no one can rely on passerby or the strangers for the needful help and cooperation. So, it is very important to get to the optimal solution that might be a life line for the individual.
This is because of the lack of best emergency facilities available in our country. An automatic alarm device for vehicle accidents is introduced in this paper. This design is a system which can detect accidents in significantly less time and sends the basic information to first aid center within a few seconds covering geographical coordinates, the time and angle in which a vehicle accident had occurred. This alert message is sent to the rescue team in a short time, which will help in saving the valuable lives. Thousands of people are dying because ambulances take too long to answer emergency calls. Human life is too precious to be lost in road accidents which are one of the major causes for fatalities in India. A switch is also provided in order to terminate the sending of a message in rare case where there LITERATURE SURVEY In this framework, we work on accident detection technics by referring following papers, in [1] author proposed solution to detect accident sound sensor, flame sensor using raspberry pi. Which is also used to keep track of the accelerometer readings. In [2] GPS and GSM framework used for accident detection with help of vibration sensor and

SJIF Impact Factor 2021: 8.013| ISI I.F.Value:1.241| Journal DOI: 10.36713/epra2016 ISSN: 2455-7838(Online)
EPRA International Journal of Research and Development (IJRD) Volume: 6 | Issue: 8 | August 2021 - Peer Reviewed Journal
2021 EPRA IJRD | Journal DOI: https://doi.org/10.36713/epra2016 | www.eprajournals.com |31 |
send quick message to the relatives. Another work of dispatching emergency services to appropriate location is done by using Analytic Hierarchy Process (AHP) in [3]. In paper [4] the author proposed all this system fully automated using different sensor on every stage to send message for relative and hospital. In [5] author designed a system which used alcohol sensor, vibration sensor. And GPS and GSM module were used forming an IoT network and cloud server to store all information. In [6] framework includes a microcontroller-based low-cost Accident Detection Unit (ADU) that contains GPS and GSM modem used for sending SMS and Alarm. In paper [7] author has talked about how to control traffic which help in accident reduction using intelligent traffic lights ITL. In paper [8], author proposed a project by how network problem can be overcome with the help of smart cities. In paper [9] VANETs is used to connect between different automobiles while travelling and make all the vehicle connected. In paper [10] mobile is used which access the help of wretch server to send emergency alert without any external aid. In this paper we study all above paper and basic idea to detect accident by system which available to every two-wheeler easily and reduce delay in providing emergency services to victim. So here we came up with new idea which implement fully automated system for all process.
Design and implementation
Fig 1: Block Diagram
WORKING In case of automobile accident, there must be
immediate access to the emergency services. The taken by the emergency responders will play a major rule in this kind of situation. So as to reduce this problem this project help in immediate service avail lance. The accident alert system and android app is interconnected with IOT. At first user have to install the app and have to register his details and have to enter his emergency contacts. If there is any occurrence of accident then the sensors in this device will detect the accident and then forward this information to the smart phone which is connected to it via Bluetooth. Now the remaining mechanism is done by app where app will automatically trigger an alarm upon receiving this information from the IOT. If the Driver fails to turn off this alarm within a specified time limit, the app sends a message to the contacts loaded by him which also contains the location of the accident to his emergency contacts and to the nearby hospital.
The android app developed will be having link to other application like Ola and Uber, since ambulance pick up time might be late to the location. This android app will send notification to the nearby Ola or Uber driver of emergency. It’s up to the driver intention to help the
accident-prone victims to help, company should give rewards for his act of humanity and gain respect and increase his commodity of service. Though ambulance driver intends to come as soon as possible to the accident area, driver from Ola/Uber whose work is to transport passenger can also help the emergency victims. To implement this service from the official app, if automobiles manufacturer looks forward to this surveillance which is a lifesaving project can change the death rates of accidents. Electronics parts Vibration Sensor
At present in the industry like research and development, the ability of monitoring, measuring as well as analyzing the vibration is very important. Unfortunately, the suitable techniques for making a measurement system for vibration with precise & repeatable are not always clear to researchers with the shades of test tools & analysis
Fig 2. vibration-sensor-module

SJIF Impact Factor 2021: 8.013| ISI I.F.Value:1.241| Journal DOI: 10.36713/epra2016 ISSN: 2455-7838(Online)
EPRA International Journal of Research and Development (IJRD) Volume: 6 | Issue: 8 | August 2021 - Peer Reviewed Journal
2021 EPRA IJRD | Journal DOI: https://doi.org/10.36713/epra2016 | www.eprajournals.com |32 |
measuring the vibration which includes a selection of suitable component, the configuration of the system, signal conditioning, analysis of waveform and setup. The vibration sensor is also called a piezoelectric sensor. These sensors are flexible devices which are used for measuring various processes. This sensor uses the piezoelectric effects while measuring the changes within acceleration, pressure, temperature, force otherwise strain by changing to an electrical charge. This sensor is also used for deciding fragrances within the air by immediately measuring capacitance as well as quality. The working principle of vibration sensor is a sensor which operates based on different optical otherwise mechanical principles for detecting observed system vibrations.
Fig 3. Flame-sensor
A sensor which is most sensitive to a normal light is
known as a flame sensor. That’s why this sensor module is used in flame alarms. This sensor detects flame otherwise wavelength within the range of 760 nm – 1100 nm from the light source. This sensor can be easily damaged to high temperature. So this sensor can be placed at a certain distance from the flame. The flame detection can be done from a 100cm distance and the detection angle will be 600. The output of this sensor is an analog signal or digital signal. These sensors are used in firefighting robots like as a flame alarm. A flame-sensor is one kind of detector which is mainly designed for detecting as well as responding to the occurrence of a fire or flame. The flame detection response can depend on its fitting. It includes an alarm system, a natural gas line, propane & a fire suppression system. This sensor is used in industrial boilers. The main function of this is to give authentication whether the boiler is properly working or not. The response of these sensors is faster as well as more accurate compare with a heat/smoke detector because of its mechanism while detecting the flame. This sensor/detector can be built with an electronic circuit using a receiver like electromagnetic radiation.
Fig.4. Arduino Uno Board Pin Configuration
The Arduino Uno is one kind of microcontroller board
based on ATmega328, and Uno is an Italian term which means one. Arduino Uno is named for marking the upcoming release of microcontroller board namely Arduino Uno Board 1.0. This board includes digital I/O pins-14, a power jack, analog I/ps-6, ceramic resonator-A16 MHz, a USB connection, an RST button, and an ICSP header. All these can support the microcontroller for further operation by connecting this board to the computer. The power supply of this board can be done with the help of an AC to DC adapter, a USB cable, otherwise a battery. The ATmega328 is one kind of single-chip microcontroller formed with Atmel within the meager family. The features of Arduino Uno ATmega328 includes the following. operating voltage is 5V The recommended input voltage will range from 7v to 12V The input voltage ranges from 6v to 20V Digital input/output pins are 14 Analog I/p pins are 6 DC Current for each input/output pin is 40 mA DC Current for 3.3V Pin is 50 mA Flash Memory is 32 KB SRAM is 2 KB

SJIF Impact Factor 2021: 8.013| ISI I.F.Value:1.241| Journal DOI: 10.36713/epra2016 ISSN: 2455-7838(Online)
EPRA International Journal of Research and Development (IJRD) Volume: 6 | Issue: 8 | August 2021 - Peer Reviewed Journal
2021 EPRA IJRD | Journal DOI: https://doi.org/10.36713/epra2016 | www.eprajournals.com |33 |
Fig.5.HC-05 Bluetooth Module
Bluetooth Module
It is used for many applications like wireless headset, game controllers, wireless mouse, wireless keyboard and many more consumer applications. It has range up to <100m which depends upon transmitter and receiver, atmosphere, geographic & urban conditions. It is IEEE 802.15.1 standardized protocol, through which one can build wireless Personal Area Network (PAN). It uses frequency-hopping spread spectrum (FHSS) radio technology to send data over air. It uses serial communication to communicate with devices. It communicates with microcontroller using serial port (USART). HC-05 is a Bluetooth module which is designed for wireless communication. This module can be used in a master or slave configuration. Android Application
An Android app is a software application running on the Android platform. Because the Android platform is built for mobile devices, a typical Android app is designed for a smartphone or a tablet PC running on the Android OS. Although an Android app can be made available by developers through their websites, most Android apps are uploaded and published on the Android Market, an online store dedicated to these applications. Android apps are written in the Java programming language and use Java core libraries. They are first compiled to Dalvik executables to run on the Dalvik virtual machine, which is a virtual machine specially designed for mobile devices. Developers may download the Android software development kit (SDK) from the Android website. The SDK includes tools, sample code and relevant documents for creating Android apps.
Novice developers who simply want to play around with Android programming can make use of the App Inventor. Using this online application, a user can construct an Android app as if putting together pieces of a puzzle. The Android application made here in this project is used to get information of the person driving the automobile. His basic information such as his name, address, contact number, family members contact information, his blood group are fed during the login of the application.
In case of accident the application in the phone gets initiated with data acquired from the Bluetooth via accident detection module. Accident detection module involve sensors and microcontroller, which is connected to Bluetooth module to send data to phone.
Application in the phone detects the location of the phone and search for the nearest hospital and send the location of the accident area to the hospital’s ambulance driver, since the driver and the hospital might be far away from the location of accident the application also sends notification of emergency to the nearest Ola/Uber driver. This way immediate surveillance to the emergency situation in case of an accident is achieved.
ADVANTAGES
Save time and increase notification efficiency Prepare notification templates in advance Multi-channel communication increases timeliness
of notification receipt Send to contacts’ preferred method of
communication Target specific contacts in geographic regions Have contacts confirm receipt of the notification Share results with other organizations View detailed reports after the emergency Optimize notifications for future emergencies Day-to-day use increases familiarity with the
process
DISADVANTAGES The main disadvantage of emergency surveillance is lack of network. Of course, network cannot be wide spread to all the regions FUTURE WORK
As a future work, a further analysis can be tried to improve the accuracy of detection phase and reduces the probability of false positive signs that are generated from being the user is inside or outside the car when the vehicle is travelling at a low speed. Therefore, it is suggested that the researchers investigate in the field of “Activity Recognition”
based on smartphone sensors, which is used to detect the current activity of the user whether he is driving, walking, running. Also, a voice recognition module can be constructed and added to the proposed system to differentiate between airbag deployment and benign noise. Achieving this enhancement would increase the proposed system reliability and decrease false positive signs. CONCLUSION
It has been realized that the smartphone-based car accident detection system is not an easy task to handle. It is really surrounded with many obstacles that prevent the researchers from achieving 100% accurate detection system. The proposed system minimizes the impact of this obstacle which is proved in the practical results conducted in this work.

SJIF Impact Factor 2021: 8.013| ISI I.F.Value:1.241| Journal DOI: 10.36713/epra2016 ISSN: 2455-7838(Online)
EPRA International Journal of Research and Development (IJRD) Volume: 6 | Issue: 8 | August 2021 - Peer Reviewed Journal
2021 EPRA IJRD | Journal DOI: https://doi.org/10.36713/epra2016 | www.eprajournals.com |34 |
Every smartphone-based accident detection and notification system is exposed to false positives. In the proposed system, helpful supporting features were added to the system to increase the accuracy of detection process and reduce the probability of false positives, which are briefly listed below:
CADANS presents a confirmation screen which gives the user the opportunity to confirm the accident, thus in case of false positive occurs the user can cancel the alarm and notification is aborted.
badans allows for uninjured peoples or bystanders to take images/videos and send them to emergency responders, for reporting the accident.
CADANS utilizes smartphone camera to record a video, showing what is happening at the instance of an accident immediately after the detection process indicates that there is an accident. This video is sent to the emergency responders for further inspection and analysis.
To notify the family or friends quickly about the accident, the proposed system sends SMS message which contains accident location coordinates to predefined emergency contacts. ACKNOWLEDGEMENT
We would like to thank all the authors of different research papers referred during writing this paper. It was very knowledge gaining and helpful for the further research to be done in future. REFERENCES
1. Aishwarya S.R, Ashish Rai, Charita, Prasanth M.A, and Savitha S.C “An IoT based vehicle accident prevention
and tracking system for night drivers” proc. IEEE, vol.3, no.4, pp.2320-9798 2015
2. Sadhana B Sharing, Bhagya Shree Jagadish Niphargid, Maitra M Poojary and T Pooja, “Smart helmet-intelligent safety for motorcyclist using raspberry pi and open CV”, proc. IEEE, vol.03, no.03 pp.2395-0056 2016
3. Jagdish A. Patel, Arin gale Shebang, Shweta Joshi, Aarti Pawar and Namrata Bari discussed on “Raspberry Pi
based smart home”, Proc. IEEE, vol.6, no.3, pp.2321-3361 2016
4. Dr. Pankaj Tomer and pretty Mehta focused on “An Efficient Management System based on Face Recognition using MATLAB and Raspberry Pi 2”, Proc-IEEE, vol.3, no.5, pp.239 2016
5. T. Anita and T. Upplight focused on “Android based
home automation using Raspberry pi”, Proc-IEEE, vol.04, no.01, pp-2351-8665 2016
6. Shailesh Bhatnagar and Prof. H.G.Sayyed discussed on”
Wireless System for Vehicle Accident Detection and Reporting using Accelerometer and GPS”, Proc .IEEE vol.6, no.8, pp-2229-5518 2015
7. Md.Shaad Mahmud, Honggang Wang, A.M.Esfar-E-Alam and Hua Fang has focused on “A Wireless Health
Monitoring System Using Mobile Phone Accessories”,
Proc-IEEE,vol.1, no.99, pp-2327-4662 2016 8. Sarika R. Gujar and Prof. A. R. Itkikar has focused on
“Advanced Embedded System of Vehicle Accident
Detection and Tracking System”, Proc-IEEE, vol.5, no.2, pp- 2277 128X 2015
9. Zaobo He, Zhipeng Cai, Jiguo Yu, Xiaoming Wang, Yunchuan Sun, and Yingshu Li, has discussed on “Cost-Efficient Strategies for Restraining Rumor Spreading in Mobile Social Networks”, Proc-IEEE,vol.66,no.3 2017
10. Hyung-Sin Kim, Hongchan Kim, jeongyeuo Paek and Saewoong Bahk has discussed on “Load Balancing
Under Heavy Traffic in RPL Routing Protocol for Low Power and Lossy Networks”, Proc-IEEE,vol.16, no.4, pp. 1536-1233 2017
SJIF Impact Factor 2021: 8.013| ISI I.F.Value:1.241| Journal DOI: 10.36713/epra2016 ISSN: 2455-7838(Online)
EPRA International Journal of Research and Development (IJRD) Volume: 6 | Issue: 8 | August 2021 - Peer Reviewed Journal
2021 EPRA IJRD | Journal DOI: https://doi.org/10.36713/epra2016 | www.eprajournals.com |35 |
EFFECTIVE COMMUNICATION SKILLS AMONG MARRIED COUPLES: AN OVERVIEW
Amuta Arumugam1, Dr.Ganesan Shanmugavelu, PhD2,
Dr.Balakrishnan Parasuraman,Phd3, Dr.Khairi Ariffin, PhD4
Dr.M.Nadarajan Manickam, Phd5, Manimaran Vadivelu6
Kanaisan Kanapathy7
1Certified Counselor, Ipoh,Perak,Malaysia
2Senior Lecturer, Institute of Teacher Education Ipoh Campus, Malaysia 3Professor, Universiti Malaysia Kelantan
4Associate Professor, Sultan Idris Education University, Malaysia 5Senior Lecturer, Institute of Teacher Education Keningau Campus,Malaysia
6Senior Lecturer, Institute of Teacher Education Ipoh Campus, Malaysia 7Lecturer, Institute of Teacher Education Ipoh Campus, Malaysia
Article DOI: https://doi.org/10.36713/epra8135
DOI No: 10.36713/epra8135
ABSTRACT This study aimed to analyse the effective communication skills among married couples for building and
maintaining strong couple relationships. The results of the study have an important implication for couple
communication includes theory and lays the foundation in their relationship toolbox. Most theoretical, explaining
the degree of ambiguity in the models governing couples' expectations for and self-disclosure performance
responsibilities affects the behaviour change. These factors appear to have dominated the development of theory to
facilitate efficient tasks, minimize bids for influence, enable partners to feel effective and respected. While the
process of adjustment and adaptation entail continued negotiation of responsibilities, repeated demands,
directives, and tension within the couple. Couple therapy reflects the outcome of reduced relationship distress and
communication skills that affect individual psychopathology, such as depression and the shortcomings of
psychological interventions for preventing marital distress. These efforts may lead to successful adjustment to
prevent marital distress that produces short-term changes in behaviour and relationship satisfaction, but little
evidence exists demonstrating a long-term prevention effect. The value of studying couple’s communication pattern
by using principles from psychology, concern about the negative impact of marital conflict and strengthened in
response to the demands imposed more comprehensive outcome measured. Therefore, conceptualizing and
measuring quality rooted an important theory and interventions that prioritize couple communication skills as the
key predictor of relationship satisfaction, while raising new questions about other factors that might predict
strengthen or moderate their association. As results, these findings shows a supporting understanding about what
interaction and transactional processes take place in couples that the interpersonal communications skills between
couples can predict satisfaction of their marital life.
KEYWORDS: Communication Skills, Couples, Relationships, Marital Therapy, Character

SJIF Impact Factor 2021: 8.013| ISI I.F.Value:1.241| Journal DOI: 10.36713/epra2016 ISSN: 2455-7838(Online)
EPRA International Journal of Research and Development (IJRD) Volume: 6 | Issue: 8 | August 2021 - Peer Reviewed Journal
2021 EPRA IJRD | Journal DOI: https://doi.org/10.36713/epra2016 | www.eprajournals.com |36 |
INTRODUCTION Having a good communication skill
relationship is the ability to talk, especially about the problems which considered by behaviours to be the most important feature of healthy relationships (Gottman, Markman, & Notarious, 1977; Jacobson, Waldron, & Moore, 1980). The dimensions and connectedness in couple‟s communication skill is an
aspect of intimate relationships that is shaped by a complex of general social values and qualities. Specification error in communication is one of the most important aspects of a satisfying marriage. The one element that consistently couples develop is bad habits and create destructive patterns when things aren‟t going well. The most abstract area of theoretical development that signify of communication the central role in concept of relationship deterioration, intimate bonds are believed to remain strong to the extent that partners respond with sensitivity to one another (Reis & Patrick, 1996). Good communication skill increases the rewards and pleasures of relating by leading to effectives stimulus control over behaviour. Clear communication enables couple to discriminate among, between behavioural events, enhances their ability to show understanding and to give support. Being important in a long-term relationship and effective communication skill is the way they reach level of comfort in relationship. The applicability and import of communication are at the heart of forming interpersonal relationship that reach the achievement of relation through everyday conversations that fabric the relationships. Thus, adapt to the dynamic nature of relational, given that relational partners do not enter each encounter or relationship with compatible expectations. However, communication is a clear and non-explainable concept because communicate in every second and in every way. One of its intelligence descriptions a good communication is wise message and expression of its own. Hence, evaluation determined that communication skills are the ability to symbolically and efficiently transfer the meanings and messages one has in mind. This perspective allows couple‟s communication developed successful quality to measure and test the factor of moderate, they can feel closer to each other, can share thoughts, can feel more intimate and by prevention of any possible misunderstanding which is at the bottom of couple‟s conflicts furthermore, couples can be more enjoy being together (Baghipour, 2010). However, communication skills lead to improvement of relationships, better handling of difficult situations, metal, physical health and better social performance (Lundblad & Hansson, 2006). The main conflicting influence communication skill behind is lack of infidelity, loss of intimacy, communication difficulties, coping with
stress challenges, financial pressure, boundary violations, difficulty balancing individual, couple expectations and breaking up. This concept distinguished about the challenge and flexibility important to note that all dyadic relationships will experience some kind of distress at some point. In this framework the critical successful relationships determined on how effective communication interact about issues such as time spent together or apart, money, health, gender differences, children, family, friends, commitment, trust and intimacy affect in their ability to develop and maintain lasting their marital relationships. The word “marriage” is interchangeable with
“relationship”. The most optimal common way for couples to pursue counselling when communication issues begin to dominate their relationship. An alternative approach that focuses on common pathways of communication within couple relationship such as the context of the situation, nonverbal physical expression (behaviour, facial expressions, gestures, spoken or written communication, touch and emotion. This studies also indicates that communication problems among couple are the major source of interpersonal difficulties, especially from misunderstanding, ineffective communication which results in frustrations and anger when implicit expectations also desires are fulfilled. Thus, major problem of those who seek therapy help is their inability to recognize and communicate their problems or another words clear objective about their concerns (Okun, 1991). Behaviourists, on the other hand, consistently emphasize the need to develop relationship skills and products of learning effective coping behaviour (Jacobson, 1981). Communication allows individual to test and be tested by relational partners through communication that respond when someone violates or fails to meet those expectations. These obtaining a significant effective communication strategy use a systematic process and behavioural theory to design communication activities that encourage sustainable social and behaviour change.
OBJECTIVES OF THE STUDY The major objective of this study is to determine the role of communication in couple‟s
strategic management of their relationship. Other specific objectives include: a) Evaluate the impact of communication in achieving the relationship strategic goals. b) Find out the most suitable pattern of communication adopted by the relationship. c) Bring to the forefront the barriers to effective communication skill.

SJIF Impact Factor 2021: 8.013| ISI I.F.Value:1.241| Journal DOI: 10.36713/epra2016 ISSN: 2455-7838(Online)
EPRA International Journal of Research and Development (IJRD) Volume: 6 | Issue: 8 | August 2021 - Peer Reviewed Journal
2021 EPRA IJRD | Journal DOI: https://doi.org/10.36713/epra2016 | www.eprajournals.com |37 |
SIGNIFICANCE OF STUDY As on-going situations, the solutions to the problems related to attribution regarding the problem should be obtained which will explain whether the major cause behind them is lack of communication or not. A satisfied couple‟s life should get developed among people, relationship satisfaction and communication skills, awareness regarding the role of communication. Thus, the influence of communication skill among married couples is important in order to enhance better marital communication skill. Since a successful couple‟s life can provide a safe environment for meeting physical, psychological needs and desires. However, it can help the couples live more happily and satisfyingly, also can help them resolve their communication conflicts. Perhaps, it may bring them a strong bond for the better family functioning and social well-being. The finding of this study will expose prospective married couple on how to achieve communication skill in their marriage lifestyles. IMPORTANT STRATEGIES IN COUPLE COMMUNICATION Communication is great importance to healthy families and couple well-functioning to speak and congruently. Whereby, in a good relationship, couples are able to speak openly and directly about conflicts also focus on the issues, keep in perspective and discuss specific behaviour that is of concern to them. Thus, they describe their own feelings and request for changes in the behaviour, criticizing and complaining. In addition to expressing their concerns as a request rather than attacks. Therefore, successful partners listen to the other‟s point of view and attempt to understand what is being said when problems arise or when circumstances change that couples need communication skills to change behaviour. Consider often characterised about the statement, "We don't know how to communicate effectively." If consider that the "effect" couples sometimes have on each other is clearly aligned with their desire to hurt or to push each other away, might argue that they communicate very effectively. This structural focus what couples really mean when they say this is, "We don't know how to connect effectively". A good communication is a tool, and good tools can make a task much easier to accomplish perhaps, the interpretation of good tools can‟t make up for the person using them. This may
sound sensational, until they understand how to defined communication skill, which was proficient in sending and receiving clear messages and the ability to accurately interpret the intent of each other‟s
message. Competence is only one element of positive communication, and it may not be the most important element. This study determined communication skill as cornerstone in any relationship, it is a foundation
of utmost importance and is something that often needs to be learned, polished and practiced over time. Despite being constrained intellectually by reasoning and there are basic strategies that can be used in any relationship to help improve connections and head of devastation before it starts. As broadly emerged the effective communication in relationships only help strengthen bonds between fathers and sons, mothers and daughters, life partners, spouses and friends. Overall, the married couples in this study were found to possess the same amount of communication skills as unhappily married couples. Overall, it encompasses the proficiency levels at effectively sending and accurately receiving clear messages. Further, communication often improves naturally when start, align own desires and attitudes with principles of commitment, honesty, personal accountability and loving actions. DESIGN OF HYPOTHESIS METHOD The significance of communication should be considered right from the courtship days as it sets the right foundation of the relationship. Meaning understand the importance of communication skill in couple life and why effective communication is important between couples, start reaching out to their partner as a habit. Hence, in contrast without genuine dialogue between husband and wife, a marriage will meet more obstacles. However, a healthy communication is the foundation for couple help the marriage sustain through time. The aim of such good communication is an important part of keeping a relationship vibrant and strong. Theoretical practice the important and productive in developing communication skills, shaping the values and mission able to reduce the divorce rate by ensuring couples had the tools for improving their communication skills. In this research couple‟s
communication evaluation was made using own quality questionnaire built by respecting all methodological requirements with targeted the following elements, considered as significant in defining communication specific to couple relationship.
i. Self-perception of communication level by partners.
ii. The interest/ disinterest shown by the partner to the communication situation (disturbing reactions as agitation, interruption of the idea, other preoccupations that distract the attention).
iii. Stress implications of the communication in couple relationship.
iv. Contradictions in communication and their conclusion.
v. The communicational attitude in front of the partner's problems.

SJIF Impact Factor 2021: 8.013| ISI I.F.Value:1.241| Journal DOI: 10.36713/epra2016 ISSN: 2455-7838(Online)
EPRA International Journal of Research and Development (IJRD) Volume: 6 | Issue: 8 | August 2021 - Peer Reviewed Journal
2021 EPRA IJRD | Journal DOI: https://doi.org/10.36713/epra2016 | www.eprajournals.com |38 |
vi. Compatibility in addressing the issues arising in the life of the couple.
vii. What things cause conflict between them? specifically not listening to each other?
viii. What things bring them happiness and feelings of connection?
ix. What things cause their disappointment and pain?
x. What things don‟t talk about and what stops
talking about them? xi. How would like their communication with
their partner to be different. xii. Avoid using the silent treatment.
xiii. Don‟t jump to conclusions. Acquire all the facts rather than guessing at motives.
xiv. Discuss what actually happened, don‟t
judge. xv. Learn to understand each other, not to defeat
each other. xvi. Talk using the future and present tense, not
the past tense. xvii. Concentrate on the major problem, and
don‟t get distracted by other minor problems.
xviii. Talk about the problems that hurt both side feelings, then move on to problems about differences in opinions.
xix. Use ‘I feel’ statements, not ‘You are’ statements.
xx. How some people (often men) tend to internalize stress and withdraw.
xxi. How some people (often women) tend to externalize stress and need to talk.
xxii. How this (predictable) creates a communication gap and emotional mis-match.
xxiii. How to stop the ensuing pursue / withdraw cycle and start connecting again.
xxiv. How couples can understand each other so they can be more compassionate with each other.
xxv. Exercises that couples can do to improve communication.
xxvi. How to get on the same page and create agreements and understanding.
xxvii. Ways of communicating with their partner in tense moments so that personal self can grow closer as a couple, instead of creating conflict.
CHARACTERISTICS OF GOOD COMMUNICATION In reality, couples relate to each other through various experiences, they begin to see each other as more predictable in response. The illustration process enhances set in their ways of interacting until they come to believe what has been labelled “survival myth,” and the illusion to maintain their existing
relationship could recognizable ways of relating in order to survive psychologically. There are five patterns of communication. The first placating is the denial of one's own right to an opinion. The second is blaming in which one is critical and domineering. The third pattern is super reasonable use of dispassionate, cool logic in discussion. Whereby the fourth is irrelevant in which one spouse ignores or tunes out the other. The last pattern is congruent in which words and feelings match the context in a realistic way. The focus of the communication here was on how couple ought to aspire democratise systems by sharing decision-making and independence for the purpose of increase communication productivity. These perspectives of communication skill in relationships are like a river when thoughts and feelings flow smoothly between marriage partners it's fun, feels good, and helps support everyone around. However, the profit motive built into communication flow is turbulent, it's potentially dangerous and destructive. Thus, when communication gets blocked, pressure builds up. These criticisms are valid when the words start flowing again, they tend to come out suddenly in a damaging raging flood. Whereby, many married couples struggle with healthy communication, especially about important issues, it‟s common for couples to avoid difficult conversations. An important point to share trickles of information back and forth about who‟s going where, when and who‟s going to pick up the kids, without
ever diving into the conversations that are actually most important to them. Over the time, this situation operates as a force, the lack of a full communication flow dries up the passion and love between them. Here, consider the structural and behavioural phenomenon emphasize to learn helpful skills such as using “I-statements,” paraphrasing each other‟s
feelings and thoughts. This encompassing concept of speaking one at a time, negotiating solutions together, avoiding blame and fault finding for better marriage communication improvement. To provide a specific other factor besides the knowledge and skills that affect not only the quality of a couple's communication, but the quality of their relationship in general, hence turn of events towards biological concepts includes commitment, willingness, intentions, desire, caring, and attitude. ANALYSE OF DATA INFORMATION The objective of communication leads to determine what reality the couple communication involves, they share and examine their perceptions, feelings, ideas and thoughts to come to an accurate understanding of what is happening. In addition, communication skills, to be an important theory about the effects to establish and preserve a loving, respectful relationship between people who love each

SJIF Impact Factor 2021: 8.013| ISI I.F.Value:1.241| Journal DOI: 10.36713/epra2016 ISSN: 2455-7838(Online)
EPRA International Journal of Research and Development (IJRD) Volume: 6 | Issue: 8 | August 2021 - Peer Reviewed Journal
2021 EPRA IJRD | Journal DOI: https://doi.org/10.36713/epra2016 | www.eprajournals.com |39 |
other. The key weightage communication in couple is the vehicle through which all other important parts considered right from the courtship days as it sets the right foundation of the relationship. Couple‟s
communication is the cornerstone of any, every long and loving couple atmosphere with a strong also caring marriage. This may manifest aspect in verbal communication, nonverbal communication and physical acts that can be placed under the umbrella of communication skill which will help understand the significant couple‟s marriage in a better way.
a) The Communication Triangle As a consequence, accountability and assessment in the hope of improving couple‟s
positive communication can be boiled down to three essential elements: attitude, desire and skill. Attitude refers to the sentiment toward partner and the emotionally laden perspectives that guide how act in the relationship communication. Attitude affects willingness to accommodate to each other and to take personal responsibility for part in relationship difficulties. The narrow concept defines desire as actions that are directly related to intentions, desires, and yearnings for personal growth, for spouse's well-being, happiness, and for positive change in the relationship. In spite of this, concerning skill which review to ability to communicate directly and clearly, repair relationship ruptures, manage differences, negotiate solutions, and solve problems together. Visualize the significance of these three elements arranged in a triangle, with attitude and desire forming the two points at the base of the triangle and skill forming the point at the top. The broad view includes arrangement emphasizes that attitude and desire are the foundation for positive communication. These might be considered to be aspects of helpful, positive attitudes and the desire can sometimes make up a limitation the communication skill level. These dimensions are further delineated a high skill level, however, cannot make up for negative attitudes or lack of desire. More specifically, some couples are so embittered and full of negative attitudes and intentions that their ill will and resentments are like stored-up gasoline. These focused the key ideas through raising and trying to solve difficult issues in the absence of positive sentiment and goodwill is like the match. The importance of a strong alignment is marriage counselling can end up becoming a battleground instead of a healing place. Particularly the influence explicit in the role of mission and vision building not to say communication skills are unimportant. This is a big „umbrella‟ that
encompasses several aspects, there are many useful strategies and principles to learn that can help couples manage conflict and handle disagreements more constructively. Nevertheless, if without a helpful concept, open attitude and the desire to
connect with a spouse, then "communication skills" can become like a hammer in the hands of someone with an objective score to settle or like a match set for gasoline. b) Attitude In this study, attitude and perception can affect communication skill in both positive and negative ways. Its combination of a pleasant, respectful, upbeat attitudes throughout an improve upward and downward communication, which increases morale, productivity and relationship. To begin with, emphasizes a clear communicate that may avoid misunderstandings such as hurt, anger, resentment or confusion. It takes two people to have a relationship and each person has a different objective in communication needs and styles. Also, an opportunity for couples to find a way of communicating that suits their relationship practice and hard work. More ever remain a clear communicating when staying with a partner, so that message can be received and understood easily. These methodologies included open and clear communication may help robust better relationship improvement include:
Building companionship such as sharing experiences, interests and concerns with life partner, showing affection and appreciation
Sharing intimacy is not only a sexual connection. Intimacy is created by having moments of feeling close and attached to a partner. It means being able to comfort and be comforted, to be open and honest.
Finding one or two key issues can agree on, such as how finances are distributed, goal, parenting styles and strategies.
c) Cultivating Positive Attitudes and Desires It is an understandable method for improving couple relationship, attitude and desire are matters of the heart. The methodological principles included the importance of forming communication in a couple‟s relationship in order to establish trust in
positive attitudes and desires to be encouraged, cultivated, nurtured and consciously chosen when facing a difficulty. The reflect upon own assumptions, values and consciously choose to focus on the positives in each other and spouse‟s positive
qualities including things that appreciate about the spouse. Think of what partner does that demonstrates his or her goodwill overall. Learn about each other's emotional needs things that allow the partner to feel loved and valued. Build a strong communication with each other by tuning in to each other‟s feelings and
needs, intentionally looking for ways to express caring, spending time with each other, and having fun together. Shared attitudes and values can strengthen interpersonal relations among couples by opening up

SJIF Impact Factor 2021: 8.013| ISI I.F.Value:1.241| Journal DOI: 10.36713/epra2016 ISSN: 2455-7838(Online)
EPRA International Journal of Research and Development (IJRD) Volume: 6 | Issue: 8 | August 2021 - Peer Reviewed Journal
2021 EPRA IJRD | Journal DOI: https://doi.org/10.36713/epra2016 | www.eprajournals.com |40 |
the lines of communication. For the most part, the changes have built upon communication is for the growth of relationships among people, regardless of whether they are colleagues. Those who have positive attitudes and are open to interpersonal communication with others will be more effective in developing positive interpersonal relationships. Potentially, people with a negative attitude can be harder to communicate because of their tendency to shut down or close themselves off from interacting with others. In short, demonstrate the communication is necessary for interpersonal relations also affected by the attitudes. d) Communication Breakdown The effective communication skill has been identified “the connector of the relationship”,
meaning that effective communication connects the individual and shared thoughts, feeling, dreams, experience and challenges the partner relationship through verbal and non-verbal intentions. Couples also have communication breakdown when hardly interacts and share information with each other and express their affection. Therefore, more recent most couples important learn to affirm their love, affection and gives them a sense of belonging. This study also identified some causes of communication breakdown in couple‟s life span outlined included:
i. Lack of sincere forgiveness by partner ii. Impatience, leading to over-reactions
iii. Constant nagging iv. Sexual denial v. The use of unkind words on your partner
vi. Different educational level (and understanding)
vii. Too busy with other things viii. Long absence of a partner causing loss of
intimacy ix. Lack of courage/boldness x. Bottled emotions / anger / bitterness /
frustration xi. Selfishness / Stubbornness / Arrogance
xii. Use of past mistakes/failures xiii. Taking marriage problems outside Communication in marriage as the process of sharing together thoughts, feelings, ideas, hurts, problems and issues freely between couples. In fact, communication permeates every sphere of the people and breakdown that could lead to other problems in the home. In addition to certain good communication is the foundation of a strong couple‟s marriage improved the way communication do break down. There are a number of reasons the communication process is constrained the couples are not willing to face up to the seriousness of things and seek help, for fear of losing face. The communication breakdown leading to ineffective communication patterns that
lead to unresolved problems, unfulfilled needs, misinterpretation of motives, and constant hostility. e) Detrimental Effects of Lack of Communication Lack of communication in couple marriages can make feel like have lost each other that continues over time then the intimacy eventually suffers. Sometimes there is nothing left to share or to talk about between two partners and signs of partner become strangers in their life, undesirable situation and really crave that connection in love. Due to lack of communication in relationships, this may tempt to cheat and feel like being married isn‟t reasonably
what it used to be anymore. Feeling a lack of validation or partner does not hear or care of their needs can be discouraging lack of respect and love can create insecurities which might cause one of spouse to seek someone outside of the marriage to fill what they feel their marriage is lacking. Hence sign of neglecting their relationship to stopped communicating, therefore can spell disaster for them to express sorrow, wants, needs and how to resolve a conflict so that their relationship satisfaction can bring closer together. For starter, relationship experts believe that most couple problems stem from a lack of proper communication, failing to participate in active communication can have many consequences. In fact, communication issues could manifest themselves in daily life till leave a huge impact on how to spend time together without constantly engage in arguments, experience wrong assumptions, failures to compromise and even verbal abuse. Poor communication also creates a negative and unproductive environment that can set a bad example for children also can harm self-esteem change outlook on themselves. f) Communication Issues in Intimate Relationships In line with the quality of collective focus on how context influences the patterns of interactions, communication challenges are often a factor in relationship troubles, couple may recognize when areas encompass in the relationship, but they may not attribute these difficulties poor communication. Some couples talk frequently about day-to-day issues, activities and consider themselves to be good communicators. In fact, be neglecting discussion of issues that have a significant impact on the relationship, hence, couples who impression communication issues into consideration and work to improve or build-up communication specific concepts that have come to define that this to be helpful in the purposefulness of conflict. The stem in enthusiastic and psychological issues of early childhood relationships, previous romantic relationships, or other areas of life may also affect

SJIF Impact Factor 2021: 8.013| ISI I.F.Value:1.241| Journal DOI: 10.36713/epra2016 ISSN: 2455-7838(Online)
EPRA International Journal of Research and Development (IJRD) Volume: 6 | Issue: 8 | August 2021 - Peer Reviewed Journal
2021 EPRA IJRD | Journal DOI: https://doi.org/10.36713/epra2016 | www.eprajournals.com |41 |
romantic, relationships, therefore, may cause emotional distress that challenging to communicate or discuss with a partner. Considered to be open systems because they have some degree of exchange between and among levels of existent communication between partners is typically considered a necessary characteristic healthy relationship, and when communication problems occur in relationships between family members, therapy can help address the issues and explore any underlying causes. g) Lack of Effective Communication Poor communication is a leading factor in relationship disharmony that affects the whole personality of the human being such as personal, professional and social life. In fact, very frequent reason people give is that their partner not communicate effectively, they are subjected to loneliness and isolation which might make them withdraw from social activities (Baxter and Montgomery 2010). This is probably because dissatisfied couples are mostly frustrated by their inability and lack of communication creates a chain of problems as one thing leads to another which results in another problem. i) Lack of communication may cause related to
lack of intimacy, meaning loss of romance whereby men and women think communicate differently when it comes to intimacy. Most people experience conflicts in their communications, especially sex and romance are topics that couples do not talk about openly, even today. Ultimately destroy the relationship due to this failure that cause of building walls and barriers between them. Hence, conflicts are also positively correlated with inappropriate psychological well-being conditions such as if a woman does not communicate her needs, likes, and/or dislikes, this situation will end up feeling disrespected. Whereby in man characteristic who does not convey his desires will be unsatisfied because he ends up feeling that his partner does not want to satisfy his needs.
ii) Couple conflicts can be explained according to different theoretical point of views specifically when romance flies out of a relationship, healthy intimacy will be missing too. This cause due to involved parties feels the strain, one or both of them may experience depression as a result of inability to talk to one another till to the level depression root cause of other problems and ailments.
iii) Dysfunctional communication leads to a loosened connection and lack of common concepts where there is almost no communication, when conversation goes
nowhere, when depression and lack of intimacy creeps in, partners feel disconnected from each other. In directly couples may go their own separate ways, even when living in the same house, meaning they no longer talk about the kids or what happened at the office. Even they live separate lives and have different set of friends that makes them feel even more isolated.
iv) They found different aspects of lack of effective communication results in arguments and unsettled issues which further leads to tension and harsh words even though they talk to one another but do not actually communicate. Specifically, if ego creeps into this situation, usually couple will end up communicating through blame and shame, then they engage in names calling, mood swinging and accusations, hence get worse in their arguments either remain unresolved or will.
v) An important role of a successful relationship is effective communication between both parties. Lack of communication in a relationship can result in hasty decisions that can lead to separation and failing relationship. Failing to communicate on a regular basis can cause people in a relationship to feel less connected to one another and creates a sense of dissatisfaction, confusion, restlessness and fear between partners. Basically, it showed that problem solving skills such as using the positive emotions and controlling the negative ones would have an important role in reducing the couple conflicts.
Positive Reframing Implication The main purpose of this study is to determine the impact of effective communication skills that affects communication breakdown in couple‟s life with a view to finding solutions. Specifically, began with the explicit assumption that couple‟s reality of both overall communication, relational behaviours that provides useful predictors of relationship satisfaction. The effective communication will demonstrate the success or failure of the couple‟s marriage because communication is the creation, exchange and interpretation of meaningful messages either be verbal or non-verbal. Thus, communication effectively will allow couples to negotiate problem areas, fulfil needs, avoid misunderstandings and develop intimacy. Reshape their emotional and conceptual approaches analyse couple conflicts as dysfunctional communication. A healthy communication is defined as the ability of people in explaining their needs, demands and preferences and

SJIF Impact Factor 2021: 8.013| ISI I.F.Value:1.241| Journal DOI: 10.36713/epra2016 ISSN: 2455-7838(Online)
EPRA International Journal of Research and Development (IJRD) Volume: 6 | Issue: 8 | August 2021 - Peer Reviewed Journal
2021 EPRA IJRD | Journal DOI: https://doi.org/10.36713/epra2016 | www.eprajournals.com |42 |
also the ability of attending to others for clarifying the issues. Perhaps, by imposing behaviour reframing will develop curiosity about how they could show up differently and how that would open up a creative space for their partner to do the same. Reframing encompasses an alternative possible explanation, interpretation or perception of an experience then facilitates positive change. The positive implication goes beyond reflective listening as it presents back to the couple what is said in a way which deepens understanding about the event or problem, and creates possibilities a new approach to the issues being deliberated. But why is reframing communication so important to relationship? Here are some of the reasons: i) Focus on misunderstandings that could lead to
alienation and resentment. ii) Repair the damages from negative or toxic
communication patterns (silent treatment, scolding/nagging, yelling, name-calling, blaming)
iii) Learn the new and more effective communication patterns.
iv) Model the healthy communication techniques for husband/wife, children (and others).
v) Strengthen the foundation for a satisfying lifelong commitment.
Communication is the way all information gets processed in a relationship and underlying issues in couple‟s life to feel secure and confident that they are in a safe place where they can speak their mind. It is vital for relationship starts to feel like they have to walk on eggshells if there is a problem. The best thing can do to improve communication in a relationship is to practice active listening and work specific times to catch up discuss things, and don‟t
neglect speaking what‟s on the mind. Be genuine and consistent to find a way of communicating that suits their relationship, however a healthy communication style requires practice and hard work. Be specific when communicating with partners, so that the message can be received and understood. But make good communication a priority in marriage lifecycle will stay connected and ensure that don‟t head down
the wrong path by losing each other. It is important to identify and rectify all the communications problems in couple before things fall apart between their relationships. Goal And Target Of Involvement This study also focused on the exploration of the theoretical connection and communication between couple relationships. To affirm this aspect of development, based on a theory that has a secure attachment style, the couple will engage in more constructive, intimacy-building communication, which has been linked to increased relationship satisfaction and longevity. The import target of
remaining engaged and avoiding gridlock when communicating also secure couples to initiate conversations about their relationship problems with express their feelings. It is important to understand each other‟s communication style and to accomplish
this, couples should realize that there are no secrets to communication, secure couples engage in direct, assertive conversation and self-disclosure. Thus, more than insecure couples, because they trust their partners to respond supportively and view the relationship as a safe with a secure base. The pattern of being more generous and thoughtful toward highest level of mutual constructive communication, able to express their feelings, needs clearly, assertively and trusted that their partners would not reject them for their self-disclosures. This study‟s
results suggest that it takes secure individuals to engage in positive, constructive communication. Open and clear communication help to improve communication with: i) Building companionship by sharing
experiences, interests and concerns with a partner, and showing affection and appreciation
ii) Sharing intimacy is not only a sexual connection, but it is created by having moments of feeling close and attached to a partner. In fact, able to comfort and be comforted, also to be honest.
iii) Finding one or two key issues agree on, such as how finances are distributed, a goal, or parenting styles or strategies.
Furthermore, the ways to communicate differently may results improve their communication, when aware of how communicate, this will be able to have more control over what happens. While it may not be easy at first, opening up new areas of communication can lead to a more fulfilling relationship include: i) Expectations that come with starting a new
relationship. ii) What makes a fulfilling couple relationship
target? iii) How to find out what relationship and life
needs are. iv) The sort of issues that need to be discussed in
intimate relationships. v) Making time to talk about how the
relationship is going. vi) How can encourage partner to communicate
more openly. vii) Making the effort. viii) The importance of good communication. ix) Ways to improve relationships. x) Recognising early warning signs of
relationship problems. The most important goal in communication, relationships is difficult situations or just aren‟t
aligned with the way each see something. Goal

SJIF Impact Factor 2021: 8.013| ISI I.F.Value:1.241| Journal DOI: 10.36713/epra2016 ISSN: 2455-7838(Online)
EPRA International Journal of Research and Development (IJRD) Volume: 6 | Issue: 8 | August 2021 - Peer Reviewed Journal
2021 EPRA IJRD | Journal DOI: https://doi.org/10.36713/epra2016 | www.eprajournals.com |43 |
communicating with a spouse is to express opinions and feelings in a way that they can understand. Thus, established how important communicating is in a relationship and several end goals of better communication, including the main goal of communicating with their spouse. Perhaps, the hardest goal to achieve and won‟t always be reached,
even when communicating better with spouse. This is a goal that will try to reach after communicating with someone strongly love, especially when it comes to discussing sensitive important issues like money, parenting, intimacy, and in-laws. Therapy Enhancement The communication process is constrained key successful because relationships are emotional and rely on interpersonal, verbal and nonverbal exchanges between the two people involved. Most couples start out with the idea of success not realizing the number cause of divorce due to bad communication. When there is a lack of communication in a couple‟s life, it can cause the relationship to become stagnant therefore, important for couples to learn to embrace change and to grow together learning about their partner. Hence, take opportunity learn to evolve together to develop a trusting, mature relationship where both clearly understand the other‟s wants and needs. Poor
communication can be fixed if both parties put in the effort to change their communication to improve their marriage life. Basically, the therapist can analyse the relationship from a different perspective, and they can give the right tools to help couples solve their issues in a smooth way. In fact, they can start with a lot of empathy, patience, trick to listen, understand and try not to be judgemental. This may improve further with good communication by avoiding hostility and passive-aggressive tactics. The key communication improvement is to understand the needs and respond in a way that supports connection with each other. However, when the couple understands the underlying emotional needs, it becomes much easier to tailor specific communication strategies that will work for both. Include how to start a conversation, how to talk about own experience rather than criticizing the other, how to make the other feel really understood, using empathic listening and problem-solving listening. This study also recommends that counsellors and the stress need for communication in marriage when counselling intending couples before and after marriage. Gradually, therapists help couples as a dyad to shape their behaviours both in conflict and non-conflict contexts, which will lead to a revision of the partners‟ models of self and others
toward attachment security. Therapist pointed to support-seeking, care giving, and communication as
intervention targets. Couples could learn how to ask each other for help instead of making extreme demands or denying the need for help. For caregiving behaviours, couples could learn to respond with empathy, validation, avoid minimization and blame. Couples‟ also can improve their communication by learning how to clearly communicate their feelings and their needs without blaming each other or becoming defensive. This may enhance partners reflect amplify their feelings, statements to demonstrate understanding and validation. Thus, partner‟s may empathy current maladaptive ways of seeking support and increased by encouraging a discussion about how those communications were adaptive within their family of origin relationship. Relationships are essential for growth, healing and recovery teach communication on how to express the needs including feelings. Healthy relationships foster trust, intimacy and true connection, as a result help feel wanted, valued, desire, become distant, stagnant and grow apart as struggle to understand why. The core concept and focus were therapeutic options that available for individuals experiencing communication issues may able to help individuals examine communication strategies to determine whether one‟s communication
style adequately conveys one‟s thoughts, needs and
goals. Hence, involves observation in therapy, individuals who find themselves often engaged in misunderstandings can explore what causes them to misinterpret the viewpoints of others or inaccurately convey their own ideas. In terms of demonstration understand the therapy may facilitate the improvement of interpersonal and intergroup skills by helping couples to improve the quality, nature and frequency of their communications. Relationship improvement therapy the designed to help couples develop the communication and listening skills needed to understand each other‟s needs. Each partner learns
empathy, validation, and emotional connection. Couples need to understand themselves, first. Knowing, loving and accepting about self is essential to connect with a partner. Including emotional therapy helps to deepen understanding of partner that able to safe to explore their feelings instead of having to react to them or defend themselves. Enhancing communications are the key to any positive, lasting relationship and couples therapy helps to create an atmosphere of honest, sage communication between each partner. This helps to build trust and intimacy helps to establish a better emotional connection. Healing old wounds, letting go of anger and pain because most couples have underlying core issues from their past, conflict can arise in new relationships. Basically, couples therapy helps to identify triggers, learn techniques to let go of anger, sadness or pain and build healthy coping

SJIF Impact Factor 2021: 8.013| ISI I.F.Value:1.241| Journal DOI: 10.36713/epra2016 ISSN: 2455-7838(Online)
EPRA International Journal of Research and Development (IJRD) Volume: 6 | Issue: 8 | August 2021 - Peer Reviewed Journal
2021 EPRA IJRD | Journal DOI: https://doi.org/10.36713/epra2016 | www.eprajournals.com |44 |
skills. Establishing healthy boundaries to respect each other and also keep the couple‟s space sacred
and not violated with life issues that drain the relationship. Knowing physical and emotional needs helps to establish healthy boundaries and self-care. As a result, partners should practice setting personal limits and expressing their needs and wants that boundaries create more time, energy for self-care and help to cope with life stress. Overall, being in a healthy couple in communication relationship will reveal lifetime spend understanding, relation developing, defining own personality and uniqueness. In contrast to this, becoming part of a healthy communication couple that connecting to an entire their personality, perspective, feelings to understand and compliment each other on their life journey. As a result, partners in the strong relationship can find themselves in need of relationship therapy. CONCLUSION This study revealed, the interpersonal communication skills are necessary for making the good relationship bond between the partners. There are significant points out the necessity of interpersonal communication skills for a strong couple marital relation, it is important to provide communication, counselling to the couple before they get married which can endorse the couple‟s marital satisfaction and life quality, and it is one of the main preventions in the initial levels. Realistically, effective couple communication is an essential tool for the marriage strategic spend much time when it is necessary in communicating verbally with their partner because it enhances proper understanding of the message. Moreover, simple and familiar words or language known to both the sender and the receiver should be used while communicating, this will certainly minimize the incident of barriers to communication in couple‟s lifecycle. For the purpose
of the same, respected authorities such a family counsellor, have to take necessary steps for enhancing the couple to make a strong bond for the better functioning and social well-being. Specifically, the nature of the relationships among the couple‟s therapy is an important quality tool for those who are dealing with communication problems, marital trouble, or who just want to discuss big topical issues in a therapeutic environment. Theory development includes identifying the logical connections that help couples talk openly about lingering feelings, bulldoze relationship roadblocks, strengthen intimacy, and grow as a unit. Finally, couples need consider to express themselves to their partners, take an opportunity to talk about the problems in their life, share their deepest fears and secrets with each other. The value best moments of life together, this is to say
that appropriate communication patterns agreeable by the couples be adopted. REFERENCES
1. Amato, P. R. and Previti, D. (2003). People’s
Reasons for Divorcing: Gender, Social Class, the Life Course, and Adjustment. Journal of Family Issues, Vol. 24 No. 5, July 2003 602-626.
2. Baghipour, Z. (2010): The Influence of Education of Communication Skills on Marital Adjustment among Married University, Master’s Thesis,
ShahidBahonar University of Kerman. 3. Baxter, L. A., and Montgomery, B. M..
Communication; Race and Family: Exploring communication in Black, White and Biracial families. Mahwah, NJ: Erlbaum. 2010.
4. Burgess, G., & Burgess, H. (2005). Conflict Management and Constructive Confrontation: A Guide to the Theory and Practice. Retrieved September 17, 2015.
5. Esere, M. O., Yusuf, J. and Omotosho, J. A. (2011). Influence of Spousal Communication on Marital Stability: Implication for Conducive Home Environment. Edo Journal of Counselling. Vol. 4, Nos. 1& 2, 2011.
6. Esere, M. O., Yusuf, J. and Omotosho, J. A. (2011). Influence of Spousal Communication on Marital Stability: Implication for Conducive Home Environment. Edo Journal of Counselling. Vol. 4, Nos. 1& 2, 2011.
7. Gottman, J., Markman, H., & Notarius, C. The topography of marital conflict: A sequential analysis of verbal and nonverbal behavior. Journal of Marriage and the Family, 1977, 39, 461-477
8. Gottman, J. M. (1999a). Repair and the core triad of balance. In J. M. Gottman, The marriage clinic:A scientifically-based marital therapy (pp. 31–86). New York:W.W. Norton & Company.
9. Gottman, J. M. (1999b). The sound marital house: A theory of marriage. In J. M. Gottman, The marriage clinic: A scientifically-based marital therapy (pp. 87–110). New York: W.W. Norton & Company.
10. Jacobson, N. S., Waldron, H., & Moore, D. Toward a behavioral profile of marital distress. Journal of Consulting and Clinical Psychology, 1980, 48, 696-703.
11. Jacobson, N. S., & Moore, D. Spouses as observers of the events in their relationship. Journal of Consulting and Clinical Psychology, 1981, 49, 269-277.
12. Johnson, S. M. (2003). Attachment theory: A guide for couple therapy. In S. M. Johnson and V. E. Whiffen (Eds.), Attachment processes in couple and family therapy (pp. 103–123). New York: Guilford Press.
13. Johnson, S. M. (2004b). EFFT: Emotionally-focused family therapy: Restructuring attachment. In S. M. Johnson, The practice of emotionally focused couple therapy: Creating connection, 2nd edn (pp. 243–265). New York: Brunner-Routledge.

SJIF Impact Factor 2021: 8.013| ISI I.F.Value:1.241| Journal DOI: 10.36713/epra2016 ISSN: 2455-7838(Online)
EPRA International Journal of Research and Development (IJRD) Volume: 6 | Issue: 8 | August 2021 - Peer Reviewed Journal
2021 EPRA IJRD | Journal DOI: https://doi.org/10.36713/epra2016 | www.eprajournals.com |45 |
14. Lundblad, A.M. & Hansson, K. (2006): Couples Therapy: Effectiveness of Treatment and long-term follow-up. Journal of Family Therapy, 28: 136-152.
15. Okun, B. F. (1991). Effective helping, interviewing, and counseling techniques (3rd ed.). Monterey, CA: Brooks/Cole.
16. Munroe, M. (2003). Understanding the woman’s
communication style: Promoting positive Muslim marital relations. A Journal of Sound Islamic Thoughts, 1(1), 46-51.
17. Mehrabian, A., & Ferris, S.R. (1967). Inference of attitudes from nonverbal communication in two channels. Journal of Consulting Psychology, 31(3) 48-258.
18. Mehrabian, A. & Wiener, M. (1967). Decoding of inconsistent communications. Journal of Personality and Social Psychology, 6, 109-114.
19. Reis, H. T., & Patrick, B. C. (1996). Attachment and intimacy: Component processes. In E. T. Higgins & A. W. Kruglanski (Eds.), Social psychology: Handbook of basic principles (pp. 523–563). New York: Guilford.

SJIF Impact Factor 2021: 8.013| ISI I.F.Value:1.241| Journal DOI: 10.36713/epra2016 ISSN: 2455-7838(Online)
EPRA International Journal of Research and Development (IJRD) Volume: 6 | Issue: 8 | August 2021 - Peer Reviewed Journal
2021 EPRA IJRD | Journal DOI: https://doi.org/10.36713/epra2016 | www.eprajournals.com |46 |
A STUDY ON CONSUMER PREFERENCE AND
SATISFACTION ABOUT SELECT BRANDED
CLOTHING FOR MEN (WITH SPECIAL REGARD TO TIRUPUR CITY)
Dr.M.Kalimuthu1, Mr.S.Deepak2 1Associate Professor, Department of Commerce with Professional Accounting
Dr.N.G.P. Arts and Science College, Coimbatore
2181PA113, Department of Commerce with Professional Accounting Dr.N.G.P. Arts and Science College, Coimbatore
ABSTRACT This study is particularly deals with consumer preference towards branded cloths and to work out the brands of
cloth most preferred by respondents in Tirupur city. The study also examines consumer's perception on branded
cloth showrooms in Tirupur city. The study could also be a descriptive study. Primary data was collected with
the help of structured questionnaire administered to 60 respondents in Coimbatore city and thus the type of
sampling was convenient sampling. Branding may communicate several meanings to the customer, which
include the attribute, benefit value, culture, personality, and usage. In addition, branding will indicate the
importance of loyalty, awareness, quality, association etc, From the analysis of this study, it had been shown
that there are six factors of brand name name loyalty that were appropriate within the environment which are,
the brand name, product quality, price, promotion, service quality and store environment. So marketers should
find it useful to understand how loyalty factors influence the customer buying behaviour within the marketplace,
which can help within the segmenting consumer and markets for his or her brand and marke ting communication
network.
KEYWORD: Consumer’s perception, Consumer preference, Market, Branding.
INTRODUCTION
Brand management holds the key in the modern markets, particularly in Indian markets because Indians are very traditional. India's traditional dress for men is Dhoti but gradually, people transmitted into tailor made dresses. Due to the globalization process, Indians are getting attracted to readymade dresses, particularly Multinational brands. The growth of readymade men's wear business in India was very slow till the early 1980's.
The main reason for this was that Indian was used to buying cloth and getting their outs tailored mainly through local tailoring shops from the unorganized segment. Consequently, there were no national level brands in this category for a long period. By the mid 1980's however customer mind-set seemed
to have started changing gradually, along with increasing urbanization, and changes in the social and economic status and life styles. As in many other industries in the nation, the move towards 'branding' soon took momentum in the market. In this study, an attempt was made to study the customer perception towards branded apparel and retail garment showrooms of India. Both listed and unlisted players cater to the branded apparel market.
There are a small number of listed players such as VK Fashions, Fashion Planet, Raymond Show Room, Bombay Dyeing, Peter England Show Room, Gokul Emporium, Santhosh Life Style, John player and Hi Fashions. Popular unlisted players include Indigo Nation, Basic and Sting. Brand management is the important aspect in the garment industries which holds

SJIF Impact Factor 2021: 8.013| ISI I.F.Value:1.241| Journal DOI: 10.36713/epra2016 ISSN: 2455-7838(Online)
EPRA International Journal of Research and Development (IJRD) Volume: 6 | Issue: 8 | August 2021 - Peer Reviewed Journal
2021 EPRA IJRD | Journal DOI: https://doi.org/10.36713/epra2016 | www.eprajournals.com |47 |
the key in the business analysis of the modern markets, particularly in Indian markets. Indian textile industry is one of the leading textile industries in the world.
Though this industries has number of brands in the current scenario started changing after the economic liberalization of Indian economy in 1991.The opening up of the brand gives the economy a much needed thrust to the Indian Textile industry, which has now successfully become one of the largest in the world .The customer preference of branded shirts are taken from the Show rooms like The Chennai silks, Siva Textiles, Tirupur silks and all the men’s Boutique
shops in Tirupur city. The branded shirts taken into account are Louis Philippe, Vanheusen, Peter England, Allen solely and Raymond. Many town has spinning industries, textiles and apparel industries which act as factory outlet and retail showrooms for branded and unbranded clothing. They are practicing with traditional looms such as pit looms, representing the culture. The success of textiles and apparel industries and retail forms depend on two elements that is tradition and innovation. Consumer require product worth of money they use for purchase. Consumer approach on clothing purchase based on AIO (activities interest and opinion) is to buy as their needs. Consumer buy clothes based on age, gender, income, occupation and location. Economic situation of consumer decides the clothing allowance of the family.
Clothing preferred by man for the whole family depends on the clothing budget. Decision making of consumer in purchase of clothes differs on the value of clothing, selling points used by sales people and mode of payment. Whether the effectiveness of clothing purchasing decision of consumer has been achieved is a big question, and so far little efforts have been undertaken to study the consumer’s preference in clothing selection.
The present study would throw light on the present scenario in perception of purchasing behavior of clothing among consumer in Tirpur district. Customer satisfaction is defined as the behaviour that customers display in searching that they expect will satisfy their needs. It is the systematic gathering, recording and analyzing of data about problems connected with the market place. Marketing research is the function which links the customer, consumer and public to the marketer through information used to identify and define marketing opportunities and problems, generate refine and evaluate actions, monitor marketing performance and improve understanding of marketing as a process.
Marketing research is concerned with all those factors which have a direct impact upon the marketing of products and services. It concentrates on the study of product planning and development, pricing, policies, effectiveness of personal selling, advertisement and sales promotion, competition and the entire area of buyer behaviour and attitudes in the market place. The study of customer satisfaction from various themes is the important once are discussed below.
Indian textile industry is one of the leading textile industries in the world. Though was predominantly unorganized industry even a few years back, but the scenario started changing after the economic liberalization of Indian economy in 1991.The opening up of the economy gave the much needed thrust to the Indian Textile industry, which has now successfully become one of the largest in the world. Indian textile industry largely depends upon the textile manufacturing and export. It plays a major role in the economy of the country. India earns about 27 percent of its total foreign exchange through textile exports. Further, the textile industry of India contributes nearly 14 percent of the total industrial production of the country. It contributes about 3 percent to the GDP of the country. Indian textile industry is the largest in the country in terms of employment generation. It not only generates jobs in its own industry, but opens up scopes for the other ancillary sectors. Indian textile industry currently generates employment to more than 35 million people. This research was made to know the Consumer preference and satisfaction about select branded clothing for men with special regard to Tirpur city. REVIEW OF LITERATURE
K. Nalini (2020)14 have revealed that the customer vary according to their likes, dislikes etc., The consumer behaviour is complex and multi-dimensional and based on assumptions on consumer behaviour the social and cultural factor influence in purchase decision and also their spending habits. The quality is associated with the product and also the price, store image etc., are dependent. The interest and situation are foundation for perception of product quality. Parul Mittal, Sandeep Aggarwal (2020)15 have said that the competition between products and services is becoming tough and so branding was introduced as it is psychological element helps in consumer buying behaviour and branding is a form of non-verbal communication. The brand differs for products to product. The study regards perception of branded products in the society. And thus conclude that

SJIF Impact Factor 2021: 8.013| ISI I.F.Value:1.241| Journal DOI: 10.36713/epra2016 ISSN: 2455-7838(Online)
EPRA International Journal of Research and Development (IJRD) Volume: 6 | Issue: 8 | August 2021 - Peer Reviewed Journal
2021 EPRA IJRD | Journal DOI: https://doi.org/10.36713/epra2016 | www.eprajournals.com |48 |
the brand enhance the people buying habit in Jaipur and brand is related to quality, style design and value for money and find that there is a relationship between income and purchase behaviour. P.S. Venkateswaran, N. Ananthi, U. Geetha, Binith Muthukrishnan. K (2020)16 analysis that the brand is a personality of a product or service. It is distinguished into two aspects as experimental and psychological. The study deals with the influence factor of brand loyalty towards branded apparel. The researcher says that it is difficult to maintain the brand loyalty as many forces are present like representing consumers as competition, advertising, sales promotions etc. So marketer should segment consumers and try to attract consumers and make them to identify the brand and remember the image of product. STATEMENT OF THE PROBLEM
There are various brands available to men for their clothing in the market. In this regard, there may various tastes and preferences among people. The choice of the consumers may vary in different ways like availability, advertisement, awareness, price, quality, etc. In this study, an attempt was made to study the consumer preference and satisfaction about select branded clothing for men Tirpur city. OBJECTIVES OF THE STUDY
To study the Economic and Demographic profile of the branded cloths users in Tirpur city.
To study the factor affects the purchase branded cloths in Tirpur city.
To study the buying behavior of regular buyers of the branded clothes.
To understand the reason for consumer preference towards branded clothes.
RESEARCH METHODOLOGY
Descriptive research has been undertaken in this research work to make research effective and the results of the research work successfully.
SAMPLING METHOD In this research work respondents will be selected from the total population at random by using convenience sampling method.
SAMPLE SIZE The study is restricted to 120 respondents.
SOURCE OF DATA Primary Data
This study is based on the primary data collected from 120 respondents using questionnaire.
Secondary Data
The secondary date used in the study is Newspapers, Journals, Magazines, Internet. TOOLS FOR THE RESEARCH
a) Simple Percentage Analyse. b) Ranking Analyse.
LIMIATIONS OF THE STUDY
The study has been restricted to 120 respondents due to the limited span of time.
The study being primary one, the accuracy and reliability of data depends upon the information provided by the respondents.
The study is limited to the Tirpur city only and therefore result cannot be generalized.
The responses given by the respondents may not be true or accurate.
FINDINGS SIMPLE PERCENTAGE ANALYSIS
Majority 48% of the respondents are belongs to age 35-40 years.
Majority100% of the respondents are male. Majority36% of the respondents belong to
professional. Majority79% of the respondents are married. Majority 40% of the respondents are from
upto School level as their educational qualification.
Majority22% of the respondents belong to Urban as their residential status.
Majority 38% of the respondent’s monthly
income is Rs. 20,000-40,000. Majority 34% of the respondents are agreeing
about the opinion of branded clothing are available at affordable prices.
Majority 32% of the respondents said that all of the time as their frequency of buying the branded clothes.
Majority 36% of the respondents are not very depending on the branded clothing.
Majority35% of the respondents feel completely available about the availability of branded clothes.
Majority 54% of the of the respondents feel completely satisfied about the satisfaction of branded clothing.
Majority38% of the respondents feel somewhat easy to use as the branded clothes are easy to use than T-shirt.

SJIF Impact Factor 2021: 8.013| ISI I.F.Value:1.241| Journal DOI: 10.36713/epra2016 ISSN: 2455-7838(Online)
EPRA International Journal of Research and Development (IJRD) Volume: 6 | Issue: 8 | August 2021 - Peer Reviewed Journal
2021 EPRA IJRD | Journal DOI: https://doi.org/10.36713/epra2016 | www.eprajournals.com |49 |
Majority 52% of the respondents felt probably will buy as their purchase interest in buying branded clothes.
Majority37% of the respondents feel very much aware about the awareness of branded clothing available in the city.
Majority28% of the respondents are known through advertisements in Television.
Majority 33% of the respondents prefer online. Majority 41% of the respondent’s spending
money Rs. 1,000 -2,000 for buying branded clothes.
Majority 62% of the respondents prefer formal wears the most.
RANK ANALYSIS From the table it is clear that among the
branded clothes according to preference ranks the top Louis Phillipe with an average of 5.40 followed by Wills Lifestyle with an average of 5.29 and Arrow Shirts with weighing an average of 4.86.
From the table it is clear that ranking based on best quality ranks the top Par X with an average of 5.65 followed by John Players with an average of 5.46 and Arrow Shirts with weighing an average of 5.36.
REFERENCES BOOKS
1. Donald R Cooper – Pamela S Schindler, “Business Research Method,” Tata Mc Graw – Hill Publishing Company Ltd., 8th edition, 2003.
2. Kotler Philip, Principles of Marketing, Sultan Chand and Company Ltd., New Delhi, 2002.
3. Kothari C.R., “Research Methodology”, New age
international Prakashan Publishers, Second edition, 2004.
4. Memoria. C.B. and Sathish Memoria (1985), “Marketing Management”, Ketab Mahal, New
Delhi. 5. Philip Kotler (2000), “Marketing Management”,
Prentice Hall of India, New Delhi. JOURNALS
1. K. Nalini (2020), ESatisfaction: Your secret weapon on the web. Harvard Business Review, Volume 78, Issue 4, pp 105-113.
2. Parul Mittal, Sandeep Aggarwal (2020). Customer Relationship management based on Increasing Customer Satisfaction. International Journal of Business and Social Science, Volume. 5, Issue. 5, pp. 256-263.
3. P.S. Venkateswaran, N. Ananthi, U. Geetha, Binith Muthukrishnan.K(2020), "Measurement and
Evaluation of Satisfaction Process in Retail Settings," Journal of Retailing, 57, pp 25-48.
WEBSITES
1. www.peterengland.com 2. www.textileindustry.com 3. www.researchgate.net 4. www.ukessay.com 5. www.zeucorp.com
SJIF Impact Factor 2021: 8.013| ISI I.F.Value:1.241| Journal DOI: 10.36713/epra2016 ISSN: 2455-7838(Online) EPRA International Journal of Research and Development (IJRD) Volume: 6 | Issue: 8 | August 2021 - Peer Reviewed Journal
2021 EPRA IJRD | Journal DOI: https://doi.org/10.36713/epra2016 | www.eprajournals.com |50 |
ECOTOURISM DEVELOPMENT IN A REMOTE DISTRICT OF INDIA: A STUDY OF TAWANG,
ARUNACHAL PRADESH
Ashi Lama
Associate Professor, Department of Economics, Rajiv Gandhi University, Doimukh-791112, Itanagar, Arunachal Pradesh, India
ABSTRACT
This paper explores the potentials and challenges of ecotourism development in Tawang, a remote district of
Arunachal Pradesh, India. It also examines the trend in tourist arrivals, travel choice and expenditure pattern of the
tourists based on secondary and field survey data collected from randomly selected 200 Indian tourists. The data were
analysed by using statistical tools such as percentage, compound annual growth rate, line graph and pie diagram. The
study revealed that Tawang has huge potentials for ecotourism development owing to its location in Eastern
Himalayan ranges. Its landscape is extremely fascinating with presence of numerous snow-capped peaks, passes and
lakes, historical sites and cultural heritage. However, the tourists inflow in Tawang has been fluctuating and its share
in total tourist arrivals in the State has declined over the years. The travel choice of tourists indicated that most of the
tourists visited this destination in a group of families mainly to enjoy natural beauty. The expenditure pattern
indicated that tourists spent greater proportion on accommodation, transportation and food and beverages. The main
challenges of ecotourism development were identified as inaccessibility, inadequate recreational facilities, entry
restrictions, climatic constraints and socio-political disturbances. Hence, the policy should focus on improving
connectivity, recreational facilities, quality of services and maintain clean and green environment.
KEYWORDS: Ecotourism, Tawang, Potentials, Challenges, Travel Choice, Expenditure Pattern
INTRODUCTION Ecotourism is a form of tourism that involves travelling to natural sites to enjoy and admire natural environment and culture connected with such environment. It is dependent on nature environments (both living and non-living) and any indigenous cultures closely connected to such environments (Tisdell, 2001). Ecotourism is defined is a variety of ways. However, the most widely accepted definition was given by Ceballos–Lascurain in 1987 who defined it as, “tourism
that involves traveling to relatively undisturbed or uncontaminated natural areas with the specific objective of studying, admiring and enjoying the scenery and its wild plants and animals as well as any existing cultural manifestations (both past and present) found in these areas” (Boo, 1990, p.20). The Ecotourism Society in 1991 defined ecotourism as, “purposeful travel to natural areas to understand the
culture and natural history of the environment, taking care not to alter the integrity of ecosystem while producing economic opportunities that make the conservation of natural resources beneficial to local people”. The society, later, shortened this definition of
ecotourism to “responsible travel to natural areas which
conserves the environment and improves the welfare of local people” (Western, 1993, p. 8).
These definitions imply that ecotourism is based on natural environment and local culture and it involves non-consumptive and mindful use of surrounding environments for recreation benefit of visitors and economic benefits of local people by generating income and employment opportunities. It is a nature-based tourism that must enhance or maintain natural systems. It involves recreational activities such as bird watching, wildlife watching, nature photography, botanical study, and wildlife treks or

SJIF Impact Factor 2021: 8.013| ISI I.F.Value:1.241| Journal DOI: 10.36713/epra2016 ISSN: 2455-7838(Online) EPRA International Journal of Research and Development (IJRD) Volume: 6 | Issue: 8 | August 2021 - Peer Reviewed Journal
2021 EPRA IJRD | Journal DOI: https://doi.org/10.36713/epra2016 | www.eprajournals.com |51 |
safaris (Whelan, 1991). Environmental education is an important aspect of ecotourism as it can educate both visitors and local people about the importance of environment and thus helps to reduce environmental damage. A distinguishing feature of ecotourism is that it benefits biodiversity conservation (Brandon and Margoluis, 1996). Ecotourism is gaining popularity worldwide because of its potential to combine conservation of environment and economic development. In fact, it is one of the fastest growing segments of the tourism industry (Whelan, 1991). The global spending on ecotourism is increasing by 20 per cent per year, about five times the average rate of growth in tourism industry as a whole (Vijayakumar, 2005). This is because people all over the world are turning to nature for peace, happiness and enjoyment. The participation of local community in resource management and in provisioning of services to the tourists is an important component of ecotourism. It, thus, provides economic benefits to local community and encourage their participation in the conservation efforts. Because of its potential to produce economic benefits to host community and ensure conservation of environment, ecotourism is considered as an effective strategy across the world to promote sustainable development.
Tawang district is a remote district of India. It is situated in the Eastern Himalayas in the north western corner of Arunachal Pradesh, India. Tawang, the headquarter of Tawang district, is situated an altitude of 10,000 ft (3,048 m) above mean sea level. This district is connected to the rest of the world only by the National Highway-13. It is located at a distance of 555 km from Guwahati and 320 km from Tezpur airport, Assam (the nearest airport) and about 300 km from Rangapara, Assam (the nearest railway station). It is strategically located and shares international border with Tibet (China) in the north and Bhutan in the south-west. It is spread over and area of 2172 sq. km. As per the population census 2011, the district has a population of 49,950 persons (54 per cent male and 46 per cent female) with population density of only 23 persons per Sq. km. The literacy rate in the district was 59 per cent as per 2011 census which is lower than the State average of 65.38 per cent and national average of 74.04 per cent. The district is inhabited by Monpa tribe who profess Buddhism and are known for hospitable and peace loving nature. The district is lagging behind in socio-economic development because of its inaccessibility, limited arable land owing to its mountainous topography and lack of industrial activities. Majority of the people live in rural area (77 per cent as per population census 2011) and are
engaged in agriculture and rearing of animals like yak and sheep for their livelihood. However, Tawang has tremendous potential for development of ecotourism because of its picturesque landscape, crystal fresh water lakes, cascading waterfalls, peaks and passes, snowfall, places of historical significance and rich local culture. Tawang‟s potential for tourism came to be known to
the rest of the world after the filming of a scene of the Bollywood movie Koyla featuring actress Madhuri Dixit at Sangetsar Lake in 1996. Since then, Tawang has been witnessing increasing number of tourist arrivals every year. However, there are numerous challenges to development of ecotourism in the destination.
In this background, this paper explores the potentials for ecotourism in Tawang, trend in tourist inflow and tourists‟ perception and challenges of
ecotourism development. DATA SOURCE AND METHODOLOGY The study is based on both primary and secondary data. The secondary data were collected from the Indian Tourism Statistics, Ministry of Tourism, Government of India and Tourism Statistics of Arunachal Pradesh, Directorate of Tourism, Government of Arunachal Pradesh. The primary data were collected by conducting field survey of visitors in the study area. The survey was conducted with the help of structured questionnaire during the peak tourist seasons. The questionnaire was designed to collect information on socio-economic variables (such as age, sex, educational qualification, occupation, income etc.), travel pattern and choice such as duration of tour, duration of stay, purpose of visit, sources of information, mode of transportation and other relevant information. Face-face interview method was used to collect information from the tourists. Tourists who had completed their tour were interviewed in the hotels for collection of necessary information. The random sampling technique was applied to select the samples of visitors. The sample size was 200 Indian tourists. Foreign tourists could not be included the sample, as the government had imposed restrictions on their entry owing to Covid-19 pandemic. In the sample, only adult visitors who have defined source of income were included because they are considered to be more realistic in making personal valuations.
The data were analysed by using various statistical tools. The Statistical analysis was done using software such as MS Excel and SPSS.

SJIF Impact Factor 2021: 8.013| ISI I.F.Value:1.241| Journal DOI: 10.36713/epra2016 ISSN: 2455-7838(Online) EPRA International Journal of Research and Development (IJRD) Volume: 6 | Issue: 8 | August 2021 - Peer Reviewed Journal
2021 EPRA IJRD | Journal DOI: https://doi.org/10.36713/epra2016 | www.eprajournals.com |52 |
ECOTOURISM POTENTIALS OF TAWANG Tawang has a high potential for ecotourism. It is an ideal destination for ecotourism as it has numerous natural and cultural attractions which lure tourists from different parts of the world as well and the country. Its landscape is quite fascinating owing to undulating topography consisting of snow-capped peaks, passes, waterfalls, lakes and river valleys. Unequivocally, it is one of the most beautiful place on the Earth. The presence of historical monuments, international borders and rich culture of the people are added attractions of Tawang. The ecotourism potentials of Tawang are presented as follows: Galden Namgyal Lhatse: It is popularly known as Tawang Monastery. It the largest monastery in India and second largest monastery in the world after the Potala Palace in Lhasa, Tibet. It was founded by Merak Lama Lodre Gyatso in 1680-1681 in accordance with the wishes of the 5th dalai Lama, ngawang Lobsang Gyatso (Singh, 2016). The main temple is known as Dukhang which means assembly building. It houses a large image of Lord Buddha of 18 feet height which is glided and decorated in a lotus position. Galden Namgyal Lhatse which means „celestial paradise is a
clear night‟ is the cultural and religious centre of the
people of Tawang. The main festivals held in the monastery are; Torgya, Losar, Ajilamu and Choskar. Torgya, an annual festival, is one of the most colourful and important festivals celebrated in Tawang Monastery. It is celebrated in the month of January to drive away evil spirits and to protect the people from natural disasters. The monastery has a library which houses valuable old scriptures. It also has a museum which contains statues of gods and goddesses and antique items. The monastery attracts a large number of Buddhist pilgrimage and tourists. Sela Pass and Sela Lake: Sela Pass is the second highest motorable Pass in the world after Leh-Manali. It is situated at and altitude of 13,701 ft (4,176 m) above mean sea level and connects Tawang with rest of the world. The landscape of the Pass is mesmerising and breath-taking with presence of snow cover and Sela Lake. Sela Lake, located just adjacent, to the Pass is a crystal fresh water lake. It is really a pristine and a beautiful high altitude lake. The local community considers it to be a sacred lake and believe that sacred ducks swim on the lake which is visible only to few fortune The fishing and boating activities are strictly prohibited. Tourists can walk around the lake and take photography.
Sangetsar lake: The Sangetsar lake (Tso) is popularly known as Madhuri lake. It is located at a distance of about 35 km north of Tawang town and 6.4 km west of Bumla Pass (Indo-China border) and is situated about 15,200 ft above sea level. The lake is situated at 27.720 N and 91.820 E and is one of the most pristine lakes in the State. It is considered as a sacred lake by the Buddhist community. It is quite attractive and fascinating as it is surrounded by snow covered mountains and alpine forests. It came to be known to rest of the world after the filming of a scene of Bollywood movie Koyla in 1997 featuring actress Madhuri Dixit. Since then it came to be popularly known as Madhuri lake. The tourists visit the lake for recreation and enjoy the beauty of the lake, local people visit it for religious purpose during important days as per Buddhist calendar. Fishing and other activities are strictly prohibited in the lake. There is strong a belief among the local community that any disturbances to the holy lake may bring calamities and disasters. Nuranang Waterfall: It is one of the most spectacular and beautiful waterfalls in Arunachal Pradesh. It is located near Jang in Tawang district. It is around 100 metre high waterfall. It is formed by Nuranag river which originates from the northern slopes of Sela Pass and it discharge its water in Tawang Chu (river). The fall came to the limelight after the filming of a song of the Koyla movie featuring actress Madhuri Dixit. Bum La Pass and Border: Bum La Pass is a border point between India and Tibet (China). It is situated at a distance of 37 km north from Tawang town (India). It is situated at an altitude of (15, 200 ft (4,600 m) above mean sea level. The Pass, which served as a trading point between Tawang and Tibet, was closed for trading after the Sino-India War of 1962. It was re-opened for local traders after 44 years in 2006. It has a historic significance as the People‟s Liberation Army
of China entered Tawang through Bum La (Pass) during the Sino-India War in 1962. One of the fierce battle of the 1962 Sino-India War took place at Bum La (Singh, 2016). The 14th Dalai lama also used this Pass to cross into Tawang (India) on 30th March, 1959. The Pass remains covered with snow for most part of the year. It is one of the most fascinating pass in the world because of its wonderful landscape and history associated with it. The Pass is, now, an important tourist attraction of and is visited by most of the tourists who travel to Tawang. Zemithang Valley: Zemithang valley is a beautiful place in Tawang district. It is located at distance of about 90 km away from Tawang town. The route to

SJIF Impact Factor 2021: 8.013| ISI I.F.Value:1.241| Journal DOI: 10.36713/epra2016 ISSN: 2455-7838(Online) EPRA International Journal of Research and Development (IJRD) Volume: 6 | Issue: 8 | August 2021 - Peer Reviewed Journal
2021 EPRA IJRD | Journal DOI: https://doi.org/10.36713/epra2016 | www.eprajournals.com |53 |
Zemitang is narrow but quite scenic. The road goes through the thick shadow of pine trees. Zemithang is known for Gorsam Chorten (Stupa) which is second largest stupa in Asia after the Baudha stupa of Kathmandu. Gorsam mela, which is held at the interval of every three years, attracts a large number of devotees. Zemithang is also known for Siberian black-necked Cranes which visit the valley during December to January as their winter habitat. The Cranes are considered to be sacred and are revered by the Monpas as the embodiment of the 6th Dalai Lama (Rina, 2019). Nyamjang Chu (river), which originates in Tibet (China), flows through the valley and adds to its natural attractions. Tourists can enjoy viewing migratory bird Siberian black-necked Cranes, visit Gorsam stupa, swim in the Nyamjang Chu, visit Pangchen valley community conserved forest for viewing some rare animals like Red Panda, mock deer, trapogan, monal
etc. Visit to tribal villages and agricultural fields of Zemithang to learn their culture and tradition can also be a satisfying experience for tourists. TREND IN TOURIST ARRIVALS IN TAWANG Tawang is one of the most attractive tourist spots of the State. A large number of visitors visit Tawang every year for recreation and other purposes. It comes under the Tezpur-Bhalukpong-Bomdila-Tawang tourist circuit which is one of the government identified tourist circuits of the State. In recent years, Tawang has come to emerge as one of the most favoured tourist destinations. It has become a popular destination for spending holidays by both domestic and foreign tourists. The trend in tourist inflow in Tawang has been observed to be fluctuating (Figure 1).
Figure 1 Trend in Tourist Arrivals in Tawang
Table 1: Tourist Arrivals in Tawang
Year Domestic Foreign Total
Growth of total (%)
2010 21325 273 21598 NA
2011 16433 277 16710 -22.63
2012 12686 271 12957 -22.46
2013 12874 235 13109 1.17
2014 13919 319 14238 8.61
2015 23776 305 24081 69.13
2016 22039 234 22273 -7.51 Source: Government of Arunachal Pradesh, 2019.
0
5000
10000
15000
20000
25000
30000
2010 2011 2012 2013 2014 2015 2016
Nu
mb
er
of
tou
rist
s
CAGR 3.36%

SJIF Impact Factor 2021: 8.013| ISI I.F.Value:1.241| Journal DOI: 10.36713/epra2016 ISSN: 2455-7838(Online) EPRA International Journal of Research and Development (IJRD) Volume: 6 | Issue: 8 | August 2021 - Peer Reviewed Journal
2021 EPRA IJRD | Journal DOI: https://doi.org/10.36713/epra2016 | www.eprajournals.com |54 |
The Table 1 shows that inflow of tourists in Tawang during the period 2010 to 2016. In 2010, total tourist inflow in the district was 21,598 which accounted for 9.34 per cent of the total tourist arrivals in the State. Tourist inflow to Tawang fell sharply by 22.63 per cent to 16,710 in 2011. It was mainly on account of fall in domestic tourist inflow. It further decline to 12,957 in 2012. The fall can be attributed to socio-political disturbance in the State owing to change in political leadership in the State.
Thereafter, the inflow of tourist in Tawang improved to 14,238 in 2014. It increased sharply to 24,081 in 2015. But in 2016 tourist inflow marginally fell to 22,273 which was 5.68 per cent of the total tourist arrivals in the State. The decline in share of Tawang in total tourist arrivals in the State indicates that it is losing its competitive position. The CAGR of tourist inflow in Tawang during the period 2010 to 2016 was 3.36 per cent. The fluctuations in tourist inflow in Tawang can be attributed to socio-political disturbance related to hydropower development. Hence, there is need to maintain conducive atmosphere to attract tourists. At the same time, roads and other infrastructure should be developed to harness its tourism potential and enhance benefits from tourism. TOURISTS’ SOCIO-ECONOMIC CHARACTERISTICS The travel decision and demand for tourism are influenced to a great extent by the socio-economic characteristics of tourists and visitors. The study of socio-economic characteristics and demand pattern of
the tourists is important for developing facilities in consonance with tourists‟ need and demand pattern. The socio-economic characteristics of the visitors include age, gender, education level, occupation, annual household income etc. The demand pattern includes purpose of visit, frequency of visit, duration of stay, type of tour, source of information, expenditure pattern of tourists in the study area and their responses to various facilities enjoyed by them. This information is important to understand in formulating appropriate policy in future for promoting tourism development.
An analysis of gender-wise distribution of the surveyed tourists (respondents) revealed among the surveyed domestic tourists 84.5 per cent were male and only 15.5 were female. It was found that most of the respondent tourists were travelling in a group of one or more families consisting of male, female and children. The average size of group was 6 persons among the surveyed tourists. Since female and children constitute a good proportion of tourists, there is a need to develop sanitary toilet facilities along the side of routes leading to tourist spots and at the spots. There is also a need to develop amusement park for children with all facilities for enhancing tourists‟ satisfaction and improve destination loyalty. The age profile of tourists showed that 31 per cent of were in the age group of 35-45 years, 29 per cent were in the age group of 45-60 years, and 21.5 per cent were in the age group of 25-35 years, 17 per cent were in the age group of 60 years and above. The mean age of the surveyed domestic tourists was 44.71 years. The details are given in Table 2.
Table 2: Distribution of Surveyed Tourists by Age group
Age Group Percentage of tourists
Below 25 1.0
25-35 21.5
35-45 31.00
45-60 29.50
60 and above 17.0
Total 100.00 Source: Field Survey 2020
Thus, it was observed that 53.5 per cent of the surveyed domestic tourists belonged to relatively young age group of below 45 years.
The household size is also one of the factors influencing visitation rate. The analysis showed that household size of most of the tourists was small. The details are given in the table 3.

SJIF Impact Factor 2021: 8.013| ISI I.F.Value:1.241| Journal DOI: 10.36713/epra2016 ISSN: 2455-7838(Online) EPRA International Journal of Research and Development (IJRD) Volume: 6 | Issue: 8 | August 2021 - Peer Reviewed Journal
2021 EPRA IJRD | Journal DOI: https://doi.org/10.36713/epra2016 | www.eprajournals.com |55 |
Table 3: Distribution of Surveyed Tourists by Household Size
Household Size Percentage of tourists
1 to 3 42.5
4 to 8 53.0
9 and above 4.50
Total 100.00 Source: Field Survey 2020
The analysis of household size of domestic tourists showed that 53 per cent of domestic tourists had household size of 4 to 8 members. However, a good number of domestic tourists (42.5 per cent) were having small household size and only 4.50 per cent were of them were having large household size. The analysis shows that the demand for recreation comes mainly from small and medium size households. This is expected as per capita income of small and medium sized household tend to relatively be higher than the others.
Demand for tourism is also influenced by the educational level of the people. It is argued that the demand for tourism varies directly with education. This is because the educated people understand the importance of recreational activities in improving both physical and mental health and so they tend to travel for recreation. The analysis of the education level of the surveyed tourists revealed that most of them were sufficiently educated. None of the tourist was found illiterate. The details are given in the Table 4.
Table 4: Distribution of Surveyed Tourists by Education level
Education level Percentage of tourists
Primary level 0.50
Secondary level 3.5
Higher Secondary 4.5
Graduate 56.5
Post Graduate and above 31.5
Any other 3.5
Total 100.00 Source: Field Survey 2020
It was found that majority of the surveyed tourists were graduates (56.5 per cent) followed by post graduates and above (31.50 per cent). Among the surveyed domestic tourists, 3.50 per cent were educated up to secondary level and 4.5 per cent up to higher secondary. Any other category accounted for 3.5 per cent of tourists which mainly consisted of diploma holders.
Occupation is also important determinants of demand for recreation. People with better occupation are more likely to travel frequently for recreation. The
government service holders in India enjoy the facility of leave travel concession (LTC) for all India travel. This facility has encouraged people to travel to different places for tourism and recreation. Hence, occupation can be an important factor determining the demand for tourism. The analysis of data showed that most of the surveyed tourists were salaried employees followed by professional/consultant and self-employed and business. Any other category included mostly social workers, members of NGOs, pensioners, writers, housewife etc. The details are given in the Table 5.
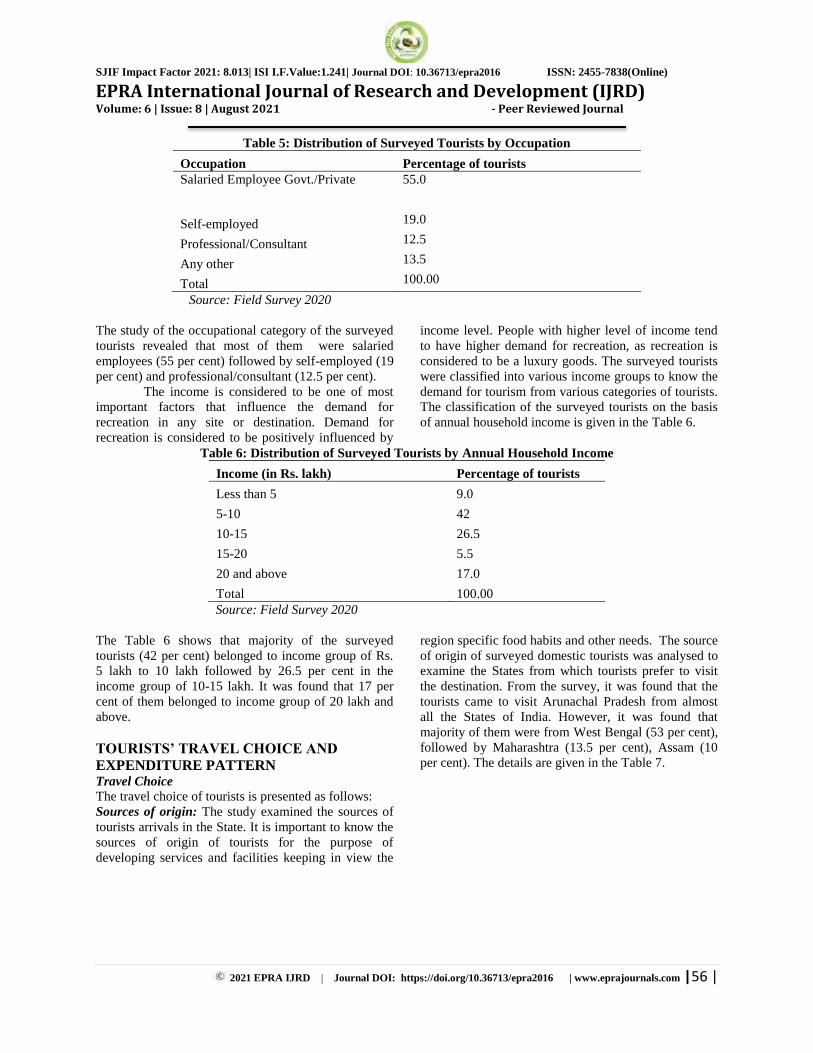
SJIF Impact Factor 2021: 8.013| ISI I.F.Value:1.241| Journal DOI: 10.36713/epra2016 ISSN: 2455-7838(Online) EPRA International Journal of Research and Development (IJRD) Volume: 6 | Issue: 8 | August 2021 - Peer Reviewed Journal
2021 EPRA IJRD | Journal DOI: https://doi.org/10.36713/epra2016 | www.eprajournals.com |56 |
Table 5: Distribution of Surveyed Tourists by Occupation
Occupation Percentage of tourists Salaried Employee Govt./Private 55.0
Self-employed 19.0
Professional/Consultant 12.5
Any other 13.5
Total 100.00
Source: Field Survey 2020 The study of the occupational category of the surveyed tourists revealed that most of them were salaried employees (55 per cent) followed by self-employed (19 per cent) and professional/consultant (12.5 per cent).
The income is considered to be one of most important factors that influence the demand for recreation in any site or destination. Demand for recreation is considered to be positively influenced by
income level. People with higher level of income tend to have higher demand for recreation, as recreation is considered to be a luxury goods. The surveyed tourists were classified into various income groups to know the demand for tourism from various categories of tourists. The classification of the surveyed tourists on the basis of annual household income is given in the Table 6.
Table 6: Distribution of Surveyed Tourists by Annual Household Income
Income (in Rs. lakh) Percentage of tourists
Less than 5 9.0
5-10 42
10-15 26.5
15-20 5.5
20 and above 17.0
Total 100.00 Source: Field Survey 2020 The Table 6 shows that majority of the surveyed tourists (42 per cent) belonged to income group of Rs. 5 lakh to 10 lakh followed by 26.5 per cent in the income group of 10-15 lakh. It was found that 17 per cent of them belonged to income group of 20 lakh and above. TOURISTS’ TRAVEL CHOICE AND
EXPENDITURE PATTERN Travel Choice The travel choice of tourists is presented as follows: Sources of origin: The study examined the sources of tourists arrivals in the State. It is important to know the sources of origin of tourists for the purpose of developing services and facilities keeping in view the
region specific food habits and other needs. The source of origin of surveyed domestic tourists was analysed to examine the States from which tourists prefer to visit the destination. From the survey, it was found that the tourists came to visit Arunachal Pradesh from almost all the States of India. However, it was found that majority of them were from West Bengal (53 per cent), followed by Maharashtra (13.5 per cent), Assam (10 per cent). The details are given in the Table 7.

SJIF Impact Factor 2021: 8.013| ISI I.F.Value:1.241| Journal DOI: 10.36713/epra2016 ISSN: 2455-7838(Online) EPRA International Journal of Research and Development (IJRD) Volume: 6 | Issue: 8 | August 2021 - Peer Reviewed Journal
2021 EPRA IJRD | Journal DOI: https://doi.org/10.36713/epra2016 | www.eprajournals.com |57 |
Table 7: Distribution of Domestic Tourists by State of Origin
State Percentage of tourist
West Bengal 53.0
Maharashtra 13.5
Assam 10.0
New Delhi 3.5
Rajasthan 3.5
Others 16.5 Source: Field Survey 2020 It was observed that most of the visitors were basically from plain States. They were visiting in large proportion mainly to enjoy natural beauty, pleasant climate in the hills, experience snowfall and to visit Indo-China border (Bumla border).
Purpose of visit: Tourists visit a destination with various purposes. The study of purpose of visit of the tourists can provide information about the purpose of visit of tourists and can help in formulating policies to develop facilities for enhancing their satisfaction level. The main purpose of visit of the surveyed tourists is presented in the Table 8.
Table 8: Distribution of Surveyed Tourists by main Purpose of Visit
Purpose of visit Percentage of tourists
Recreation/natural beauty 74.7
Know people and their culture 12.9
Adventure tourism 4.7
Educational value 2.9
Religious purpose 1.8
Any other purpose 2.9
Total 100.0 Source: Field Survey 2020 The Table 8 shows that most of the domestic tourists (74.5 per cent) were visiting the State for recreation/enjoy natural beauty. They were mainly interested in enjoying natural beauty and recreation. Only a small proportion of domestic tourists visited for any other purpose which includes mainly official and business visits.
Companion: Tourists, usually, travel to a destination in different types of companion or group. The classification of the surveyed tourists by the type of group in which they were travelling revealed that most of the surveyed tourists (were travelling with their own family members. The details are given in the Table 9.
Table 9: Distribution of Surveyed Tourists by Type of Group
Types of group Percentage of tourists
Single person
4.0
Couple
0.00
With own family members 51.5
In a group of more than one family 28.0
In a group of friends without family 13.0
Total 100.00 Source: Field Survey, 2020

SJIF Impact Factor 2021: 8.013| ISI I.F.Value:1.241| Journal DOI: 10.36713/epra2016 ISSN: 2455-7838(Online) EPRA International Journal of Research and Development (IJRD) Volume: 6 | Issue: 8 | August 2021 - Peer Reviewed Journal
2021 EPRA IJRD | Journal DOI: https://doi.org/10.36713/epra2016 | www.eprajournals.com |58 |
It was found that most of the domestic tourists (79.5 per cent) were travelling with family members. They were travelling with their own family members (51.5 per cent) or in a group of more than one family (28 per cent). Only a few surveyed domestic tourists (4 per cent) were travelling alone. The analysis shows that most of the tourists prefer to travel to the destination in a group of one of more family. The average size of group of domestic tourist was 6 persons. Hence, there is a need to develop facilities to meet the requirement of family oriented tourists.
Source of Information: Information about a destination is also an important factor which can
influence the potential tourists to visit the destination for recreation. Access to good and reliable information about the destination is very important as it can help the potential tourists to make proper travel plan. The lack of reliable information about the destination may discourage tourists to visit the destination. Hence, an attempt was also made to know the main sources of information about tourist spots in the State. This was considered important given the remote location of the tourist spot under the study and limited source of information. The responses of the surveyed tourists are presented in the Table 10.
Table 10: Distribution of Surveyed Tourists by Sources of Information
Source Percentage of tourists
Word of mouth 29.0
Internet 21.0
Magazine 16.0
Television 9.5
Newspaper 9.0
Previous visit 7.5
Books 6.0
Any other source 2.0
Total 100.00 Source: Field Survey 2020 The Table 10 shows that most of the surveyed tourists (29 per cent) came to know about the tourist spot from word of mouth followed by internet (21 per cent), magazine (16 per cent), television (9.5 per cent). Those who indicated any other source informed that they came to know about the study area through travel agent and official sources. The analysis showed that word mouth and internet were the most important sources of information for domestic tourists. Hence, there is a need to make the website more informative and attractive to provide
reliable and relevant information to the tourists. At the same time, tourists should be provided good hospitality and facilities to encourage them to advise their friends and relatives to visit tourist spots in the State.
Type of Tour: Tourists can perform their tour to any destination in two ways. They can either travel on a self-arranged tour or on package tour arranged by tour operators. The study of the type of tour performed by the tourists can indicate the demand for the services of tour operators. The details of type of tour performed by the surveyed tourists are given in the Table 11.
Table 11: Distribution of Surveyed Tourists by Type of Tour
Type of tour Percentage of tourists
Package 42.0
Self-arranged 58.0
Total 100.00 Source: Field Survey, 2020
The analysis of type of tour performed by surveyed tourists showed that majority of the them visited on a
self- arranged tour. Among the surveyed tourists 58 per cent visited on a self-arranged tour and rest were

SJIF Impact Factor 2021: 8.013| ISI I.F.Value:1.241| Journal DOI: 10.36713/epra2016 ISSN: 2455-7838(Online) EPRA International Journal of Research and Development (IJRD) Volume: 6 | Issue: 8 | August 2021 - Peer Reviewed Journal
2021 EPRA IJRD | Journal DOI: https://doi.org/10.36713/epra2016 | www.eprajournals.com |59 |
visiting on package tour. This indicated growing demand for the services of tour operators. Hence, there is a need to improve the efficiency of the tour operator services to increase their demand and enhance income and employment.
Frequency of visit: The frequency of visit of tourists shows that ability of a destination to attract the visitors. From the survey, it was found that most of the surveyed tourists were visiting for the first time in the tourist spot under the study. This is expected as the spot has a remote location. The details are given in the Table 12.
Table 12: Distribution of Surveyed Tourists by Frequency of Visit
Frequency Percentage of tourists
First 87.0
More than Once 13.0
Total 100.00 Source: Field Survey 2020 It was found that 87 per cent of the surveyed tourists were visiting for the first time. It found that 13 per cent of the surveyed tourists visited the spot more than once. This is due to that fact that the tourist spot is located in a remote district of the State.
Length of stay: The study also attempted to analyse the length of stay of the surveyed tourists. The length of stay of tourists in a destination can be taken as an
indicator of the demand for tourism. The longer length of stay generally leads to more spending of tourists and greater economic impact of local economy. However, length of stay depends on various factors such as income level, family size, purpose of visit, and availability of recreational facilities in the destination and so on. The length of stay of surveyed tourists in Tawang is given in the Table 13.
Table 13: Length of Stay of Surveyed Tourists
Length of stay (in days) Percentage of tourists
Less than 5 58.0
5-10 34.0
Above 10 7.5
Total 100.00 Source: Field Survey, 2020 It was found that most of the tourists stayed in the destination for less than 5 days. A high percentage of tourists (58 per cent) stayed in the destination for less than 5 days and 34 per cent of them stayed for 5 to 10 days. Only 7.5 per cent of the tourists stayed for more than 10 days. The average length of stays of the surveyed tourist 4.34
The above analysis and discussion shows that most of the surveyed tourists were visiting the destination for recreation and enjoy natural beauty. They were extremely mesmerised by scenic natural beauty of the Lake. This fact shows that there is a good potential market for ecotourism in the Lake and in Tawang. However, there is a need for formulating proper policies and guidelines so as to avert damages to
natural environment. The analysis showed that most of the domestic tourists were from West Bengal, Maharashtra and Assam. The domestic tourists were visiting for recreation and enjoy natural beauty and to know people and their rich culture. Hence, there is a need develop various facilities recreational activities and also for displaying local culture. Expenditure Pattern of Tourists The expenditure pattern of tourists shows their demand for various products and services. This information can be important for policy making purpose. Hence, the study examined the expenditure pattern of the surveyed tourists in the study area. The expenditure pattern of the surveyed tourists is shown in the Figure 2.

SJIF Impact Factor 2021: 8.013| ISI I.F.Value:1.241| Journal DOI: 10.36713/epra2016 ISSN: 2455-7838(Online) EPRA International Journal of Research and Development (IJRD) Volume: 6 | Issue: 8 | August 2021 - Peer Reviewed Journal
2021 EPRA IJRD | Journal DOI: https://doi.org/10.36713/epra2016 | www.eprajournals.com |60 |
Figure 2: Expenditure pattern of surveyed tourists (in percentage)
It was found that tourists incur expenditure on
various services and goods in Tawang. The analysis of the expenditure pattern of the tourists showed that the surveyed tourists incurred the highest expenditure on accommodation (Figure 2). The share of accommodation in total expenditure of tourists was 36 per cent followed by local transport (33 per cent) and food and beverages (27 per cent). It was found that the surveyed tourists spent 4 per cent of total expenditure on purchasing souvenirs (mainly handloom and handicraft products) which is a low share as compared to other hill stations where handicrafts/souvenirs accounts for more than 10 per cent of tourist expenditure. In Sikkim, shopping accounted for 22.7 per cent of tourist spending (GoI, 2012). In Guatemala, handicrafts /souvenirs accounted for 20 per cent of tourist expenditure (Foam and Franco (2008). The tourists‟ expenditure pattern indicates that accommodation, transport service providers and food and beverages establishment receive significant benefits from tourism in Tawang. Benefit to the accommodation providers is obvious as almost all tourists stay in hotels and lodges during their trip. The fairly high share of local transport can be attributed to the recent rules made by the local people of the area which require tourists to hire local taxis for sites seeing purpose. Tourists are not allowed to use their own vehicles or vehicles hired from outsides to go for site seeing. Relatively low share of food and beverage in total expenditure is mainly because of the fact that most of the Indian tourists travel in a group and they carry their own kitchen along in their vehicles. The low share of souvenirs in total tourist expenditure can be ascribed
to high price due to limited availability of such products. Hence, there is a need to focus on producing varied and attractive local handicraft products to enhance income and employment generation in local area. CHALLENGES OF ECOTOURISM IN TAWANG The challenges of ecotourism development in Tawang have been identified as follows: Transportation Problem: Tawang is a remote district of India and its tourist spots are inaccessibility due to poor road network. It is relatively backward in terms of infrastructural facilities. It is connected to rest of the world only by road (National Highway 13). The road communication remains affected during summer due to heavy monsoon rainfall and during winter heavy snowfall disrupts road network. There is no railway link. However, it is connected by helicopter service from a few selected towns/cities like Guwahati and Itanagar. But the frequency of the service is limited.
Inadequate Infrastructure: Inadequate infrastructure is one of the most important cause of underdevelopment of tourism (Bhatia, 1997). Tourism infrastructure includes, good accommodation facilities, better sanitary facilities and amenities for recreational activities, proper human resources. In Tawang, a good number of hotels and lodges have come up in response to growing tourists demand, but standard of services provided by the tourist lodges are also found to be below the satisfaction level of tourists and room rents are relatively high. Further, there are very few
Souvenirs 4 %
Accommodation 36 %
Food and Beverages
27 %
Local Transport
33 %

SJIF Impact Factor 2021: 8.013| ISI I.F.Value:1.241| Journal DOI: 10.36713/epra2016 ISSN: 2455-7838(Online) EPRA International Journal of Research and Development (IJRD) Volume: 6 | Issue: 8 | August 2021 - Peer Reviewed Journal
2021 EPRA IJRD | Journal DOI: https://doi.org/10.36713/epra2016 | www.eprajournals.com |61 |
amenities for recreational activities. There is only one cable car in Tawang which also often remains defunct.
Climatic Constraints: The climatic condition of Tawang is extremely cool during winter, particularly from December to February. During these months, temperature goes below zero degree. Heavy snowfall which occurs during December to February causes disruption in road network and acts as a natural barrier for tourists. During the rainy season, June to August, the entire area receives heavy monsoon rainfall which leads to landslides and road blockades. This serves as a disincentive for potential tourists to visit the spot during these months. Hence, the tourist inflow is confined only during September to November and March to May.
Institutional Constraints: Arunachal Pradesh, due to its strategic location, has been designated as a restricted area. The main institutional constraints are the provision of Inner Line Permit (ILP) and Protected Area Permit (PAP). Domestic tourists are required to obtain ILP and foreign tourists are to obtain PAP to enter the State. PAP is issued by Ministry of Home Affairs, Government of India. PAP is issued only to those foreign tourists who visit in a group of three or more persons for a maximum period of thirty days. Tourists opined that obtaining PAP is difficult and time consuming. This acts as a disincentive for the potential tourists intending to visit Arunachal Pradesh. Further, in Tawang, foreign tourists are not allowed to visit places of interest located near the border.
Socio-political Disturbances: Socio-political disturbances in the State as well as in the neighbouring State also affects tourism development in Tawang. Such disturbances act as a psychological barrier for potential tourists (Mitra and Lama, 2013). Tawang is a peaceful place but it is connected to rest of the world through Assam. The frequent strike (Bandh call) by different organizations in Assam restricts the movement of vehicles to the State. At the same time, number of bandh call within the State has increased in recent years. For instance, the strike called by some organizations against PRC issue in February, 2020 continued for many days and caused fear psychosis among the public with massive destruction of public properties in the State capital. These disturbances cause psychological impact on potential tourists and lead to diversion of tourists to other hill destinations like Shillong, Gangtok, Darjeeling etc.
CONCLUSION On the basis of above discussion and findings, it can be concluded that Tawang has huge potentials for development of ecotourism. Its landscape is quite fascinating with presence of numerous snow-capped mountain peaks, passes, lakes, rivers and alpine vegetations. It is also rich in cultural heritage and historical sites. Tawang came to the limelight after the filming of some scenes of Bollywood movie Koyla in 1996. Since, then this remote destination has been attracting a growing number of tourists from different parts of the country and the world. However, the inflow of tourists in Tawang has been fluctuating which can be attributed to emergence of other destinations as well as socio-political disturbances. The CAGR of tourist inflow in Tawang during the period 2010 to 2016 was only 3.36 per cent. Tawang‟s share in total tourist arrivals in the State has declined over the years from 9.34 per cent in 2010 to 5.68 per cent in 2016. This shows that Tawang is losing its competitive position. The study of socio-economic characteristics showed that most of the tourists male. The tourists were travelling in a group of one or more families consisting of male, female and children which implies that there is a need to develop way side sanitary facilities and develop amusement park with all facilities. It was observed that more than per cent of the tourists were below 45 years. Educational level of tourists showed that majority of the surveyed tourists were graduates followed by post graduates and above. The study of the occupational category of the surveyed tourists revealed that most of them were salaried employees, self-employed and professional/consultant.
The analysis of travel choice of the tourists revealed that majority of tourists were from West Bengal, Maharashtra and Assam and most of them were visiting to enjoy natural beauty. In case of source of information, it was found that most of the tourists came to know about the tourist spot from word of mouth, internet, magazine and television. The analysis of type of tour performed by surveyed tourists showed that majority of the them visited on a self- arranged tour. Frequency of visit showed that most of the tourists were visiting the destination for the first time which can be attributed to its remote location. The length of stay of tourists revealed that a high percentage of tourists stayed in the destination for less than 5 days. The expenditure pattern of the tourists showed that accommodation accounted for the highest share in total expenditure. It was observed that tourists spent only 4 per cent of total expenditure on purchasing souvenirs (mainly handloom and handicraft products).

SJIF Impact Factor 2021: 8.013| ISI I.F.Value:1.241| Journal DOI: 10.36713/epra2016 ISSN: 2455-7838(Online) EPRA International Journal of Research and Development (IJRD) Volume: 6 | Issue: 8 | August 2021 - Peer Reviewed Journal
2021 EPRA IJRD | Journal DOI: https://doi.org/10.36713/epra2016 | www.eprajournals.com |62 |
The following policy suggestions can be made for promoting ecotourism development in Tawang; The policy should focus on improving connectivity and recreational facilities at Tawang. There is a need to focus on producing varied and attractive local handicraft products to enhance income and employment generation in local area. The various stakeholders should be sensitized to improve the quality of services to maintain the competitiveness of the destination as word of mouth was the source of information for majority of the tourists. There is a need to invest more in maintaining clean and green environment as tourists were visiting mainly to enjoy natural beauty. Acknowledgement: This article is based on the minor research project funded by Indian Council of Social Science Research (ICSSR), New Delhi. The author would like to acknowledge the financial support of ICSSR, New Delhi. REFERENCES
1. Boo, E. (1990): Ecotourism: The Potential and Pitfalls, World Wildlife Fund.
2. Bhatia, A. K. (1997): International Tourism: Fundamentals and Problems, Sterling Publishers, New Delhi.
3. Brandon, K. and R. Margoluis (1996): ‘The
Ecotourism Equation: Measuring the Impacts’,
Bulletin 99, Yale School of Forestry and Environmental Studies.
4. Foam, L. and R. Franco (2008), Measuring the Local Economic Impact of Tourism, The SEEP Network, Washington DC, USA.
5. Government of Arunachal Pradesh (2011): Census of India 2011: Provisional Population Totals, Arunachal Pradesh, Directorate of Census Operations, Arunachal Pradesh.
6. Government of Arunachal Pradesh (2019): Tourism Statistics, Directorate of Tourism, Itanagar, Government of Arunachal Pradesh.
7. Government of India (2012): Tourism Survey for the State of Sikkim, Ministry of Tourism, Government of India.
8. Mitra, A. and M. lama (2013): Tourism Development in a Remote State: A Case Study of Arunachal Pradesh, India, in Tisdell, C. A. (ed.), Handbook of Tourism Economics: Analysis, New Applications and Case Studies, World Scientific Publications, Singapore.
9. Rina, T. (2019). Black-necked Crane Arrives in Nyamjang Chhu, The Arubachal Times, December 27, 2019.
10. Singh, S.(2016). Tourism in North East India, Vandana Publications, New Delhi.
11. Tisdell, C. A. (2001): Tourism, Economics, the Environment and Development: Analysis and Policy, Edward Elgar, Cheltenham, UK.
12. Vijayakumar, B. (2005): ‘Ecotourism: Concepts
and Issues’, in Sarngadharan, M. and G. Raju
(eds.), Tourism and Sustainable Economic Development: Indian and Global Perspectives, New Century Publications, New Delhi, pp. 69-82.
13. Western, D. (1993): ‘Defining Ecotourism’, in K.
Lindberg and D. E. Hawkins (Eds.), Ecotourism: A guide for Planners and Managers, North Bennington, VT: The Ecotourism Society, pp. 7-11.
14. Whelan, T. (1991): Nature Tourism – Managing for the Environment, Island Press, New York.

SJIF Impact Factor 2021: 8.013| ISI I.F.Value:1.241| Journal DOI: 10.36713/epra2016 ISSN: 2455-7838(Online)
EPRA International Journal of Research and Development (IJRD) Volume: 6 | Issue: 8 | August 2021 - Peer Reviewed Journal
2021 EPRA IJRD | Journal DOI: https://doi.org/10.36713/epra2016 | www.eprajournals.com |63 |
FOREIGN EXPERIENCES IN THE FORMATION OF NON-PROFESSIONAL TEACHERS' ENGLISH
LEARNING MOTIVATION
Tursunnazarova Elvira Taxirovna
Independent Researcher of Navoi State Pedagogical Institute
ABSTRACT
This article analyzes foreign experience (on the example of Germany, France, Canada, Australia, America,
South Korea) in shaping the motivation of non-specialist teachers to learn English.
KEYWORDS: mnemonics, era of globalization, educational technologies, motivation, teaching English to non-
specialist teachers.
It is clear that the foreign language teaching system formed in the twentieth century can no longer fully meet the requirements of modern life, as the need for alternative methods remains high, despite the fact that many educational institutions around the world are testing different pedagogical strategies and teaching technologies. It is no exaggeration to say that one of the main trends in education today is the expansion of high-quality language services focused on the needs of the world community.
In the course of our research, foreign experience in the formation of motivation of non-specialist teachers to learn English was also studied.
As a result of researching a new model of quality training of specialists by German teachers, efforts are being made to expand the scope of their knowledge, including the acquisition of a foreign language, understanding of job functions, communication skills, creative thinking, professional development. However, there is a lack of modern educational technologies and methods based on the knowledge that German educational institutions have the opportunity to design and adapt the process of teaching foreign languages to teachers, to improve the quality of education.
Traditionally, modern English language teaching in this country is given special attention. Our analysis shows that in countries such as Germany and France, public and private educational institutions are implementing modern methods and technologies in the educational process. First of all, this applies to teaching English. Among the most popular such innovative technologies in these countries are:
1) International curricula (programs of cooperation with foreign educational institutions);
2) Use of the Internet in the educational process (including distance learning);
3) block-module lessons; 4) Communication (mostly in the regional
aspect); 5) person-centered approach; 6) Interactive teaching methods; 7) Methods of using tests in the educational
process; 8) Linguistic socio-cultural methodology; 9) Design methodology; 10) Professional teaching of a foreign
language; 11) Standard programs of teaching English
(methods of extracurricular activities); 12) Use of elements of intensive methods of
teaching foreign languages. There is a wide range of international
programs for teaching English in foreign countries - Germany, France, Canada, including the field of foreign language teaching, which can be debated today as a "business card" of these countries.
A distinctive feature of many international English-language programs is the establishment of bilateral relations with a particular foreign university.
Collaboration takes many forms: access to information sources such as libraries, personal training, intensive courses that complement the local curriculum, active support for international student and teacher exchange programs between universities, and other forms. The College in Penang, Malaysia is evident in its collaboration with Antarabangsa

SJIF Impact Factor 2021: 8.013| ISI I.F.Value:1.241| Journal DOI: 10.36713/epra2016 ISSN: 2455-7838(Online)
EPRA International Journal of Research and Development (IJRD) Volume: 6 | Issue: 8 | August 2021 - Peer Reviewed Journal
2021 EPRA IJRD | Journal DOI: https://doi.org/10.36713/epra2016 | www.eprajournals.com |64 |
University, where the University of Sydney is the main academic partner.
These universities are developing a comprehensive international relations strategy for teaching English, which is updated annually.
In recent years, the block-modular education system in English language teaching has been introduced at the above-named universities, and interest in active forms and methods of teaching has also increased dramatically. There have been cases of mnemonic harmonization of these methods (didactic games, business games, “brainstorming” method,
etc.) and intensive forms of teaching (cybernetic, immersion, concentration learning, etc.). Research is also underway to put into practice other active alternative methods of teaching English.
Taking into account the level of special knowledge and skills through a system of entrance and exit tests on the basis of English language teaching technologies; preparation of an individual curriculum taking into account the level of professional competence established; flexible combination of forms of distance learning and careful teaching and methodological support of each module and training element; finally, it is embodied in the adaptation of training modules to the content of a particular profession or position.
Problem-based learning technology lies in the logically complete unity of the learning material, which is aimed at learning one or more basic concepts of teaching English through block-module.
The content of the teaching material for teaching English to non-specialist teachers is presented in a holistic structure; the methods, tools and forms of training are sufficiently selected and, in some cases, the opportunity to choose full, abbreviated or in-depth training options appropriate to their level of training.
Our research shows that when teaching English in Malaysian educational institutions, the teacher has to manage his / her own knowledge, i.e. implement a level of metabolism. Each non-specialist teacher independently achieves the objectives of the learning activity in the process of working on a module that combines the content of teaching and methods of learning activities to master this content. In teaching English, the module works as a modular learning tool because it includes: a targeted action plan, a data bank, a methodological guide for achieving didactic goals.
Problem-based modular teaching in English teaching can also be seen in the example of the University of Queensland. In this educational institution today, the block-modular methodology is very popular among foreign language teachers and students because it combines all the advanced things accumulated in pedagogical theory and practice.
During the study, a comparative analysis of the paradigm of teaching English in the educational system of our country and educational competencies in developed countries of the world was studied (Table 1).
Table 1 Comparative analysis of the education system of the Republic of Uzbekistan and the paradigm of
teaching English in educational competencies in developed countries of the world
Name of countries Number of basic competencies
Naming of basic competencies
Republic of Uzbekistan
6
1. Communicative competence 2. Competence in working with information 3. Competence for self-development as an individual 4. Socially active civic competence 5. General cultural competence 6. Competence to be aware of and use the achievements of mathematical literacy, science and technology
To the European Union
member states (50 countries: UK,
Germany, Finland, France, Spain, Italy,
Austria, Luxembourg,
Malta, the Netherlands, Russia,
etc.).
8
1. Communication in the mother tongue; 2. Communication in foreign languages; 3.Mathematical competence and basic competences in science and technology; 4. Digital competence; 5. Learning to learn; 6. Social and civic competences; 7. Sense of initiative and entrepreneurship; 8. Cultural awareness and expression;

SJIF Impact Factor 2021: 8.013| ISI I.F.Value:1.241| Journal DOI: 10.36713/epra2016 ISSN: 2455-7838(Online)
EPRA International Journal of Research and Development (IJRD) Volume: 6 | Issue: 8 | August 2021 - Peer Reviewed Journal
2021 EPRA IJRD | Journal DOI: https://doi.org/10.36713/epra2016 | www.eprajournals.com |65 |
U.S.A. 4
1. Ways of thinking (creative, innovative, critical thinking, ability to solve problems independently, decision-making, reading for learning, meta-knowledge). 2. Competences related to effective ways of working - ways o working. Ability to work in a team, to work collaboratively, to communicate effectively in the field. 3.To be able to use effective methods and tools of work - tools for working. Information literacy, ICT literacy. 4. To be able to live in the world, in society - living in the world. To have a civic position, to succeed in one's profession, to have social skills as an individual. (local and global citizenship, life and career, Personal and social responsibility).
South Korea 6
1. Competence inquiry skills. 2. Basic learning skills. 3. Problem-solving skills. 4. Creative thinking, creative skills. 5. Communicative competence. 6. Citizenship.
As can be seen from the table, today the
development of science, engineering and technology, the changing needs of society have changed the paradigm of learning English in the developed and developing countries of the world. This ensures that the learning process develops from the transfer of theoretical knowledge to the formation of motivations to apply the acquired knowledge in practice.
The approach to cybernetics in teaching English is transforming modular teaching into self-management, enriched by the idea of adaptive management of teachers' activities.
In the process of training and retraining of public educators in Uzbekistan, a competent approach to teaching English is strengthening, practical tasks in the field of lingodidactics, the main scientific tasks of modern linguistics, the functioning of language in communicative speech and cognitive mechanisms accompanying this process.
There are two interrelated steps that need to be taken into account in the organization of English language teaching, namely gnostic and practical. Given the creative nature of the professional self-development of a non-specialist teacher, as a subject of pedagogical work, it is required to organize a learning process that allows the listener to freely choose their own possibilities. At the same time, the requirements for the qualification description of a non-specialist teacher are taken into account. Such requirements are set out in the 2015 approved STC.
Mnemonic methods in the formation of the motivation of non-specialist teachers to learn English serve to expand the knowledge of the systematic structure of the language and the semantics of its lexical and grammatical units. At the same time, the level of linguistic competence expands the
individual's knowledge of the language through associations and the application of this knowledge in speech practice, because human competencies are formed and developed during the socialization of man.
The motivation of non-specialist teachers to learn English corresponds to the system of concepts related to the trinity of "language-speech-communication", and on this basis, language competence - speech competence - is expressed in communicative competencies.
Learning English in non-specialist teachers each includes specific subcompetitions. For example, linguistic competence embodies the sum of knowledge about the structural structure of language and combines knowledge about each of the levels of language, according to which lexical, grammatical, syntactic, textual and other competencies are distinguished. Linguistic competence can be defined as a high level of language competence, which is acquired by those who deal with language at a professional level, ie linguists.
The following aspects should be taken into account in shaping the motivation of non-specialist teachers to learn English:
1) Perception in the mind on the basis of speech-thinking mnemonic method. Divide the volume of the topic into smaller topics, defining their hierarchy, thereby achieving a clear structure and logical construction of the sentence; b) mastering the linguistic means of expressing the interrelationships between the elements of content;
2) The methodical embodiment of the studied English subject by means of associations.
Thus, the main qualities of a linguistic text related to mnemonics include fragmentation, coherence, knowledge of integrity, and the ability to

SJIF Impact Factor 2021: 8.013| ISI I.F.Value:1.241| Journal DOI: 10.36713/epra2016 ISSN: 2455-7838(Online)
EPRA International Journal of Research and Development (IJRD) Volume: 6 | Issue: 8 | August 2021 - Peer Reviewed Journal
2021 EPRA IJRD | Journal DOI: https://doi.org/10.36713/epra2016 | www.eprajournals.com |66 |
embody. On the other hand, these qualities, like the language tools themselves, acquire specificity in relation to the genre-methodological affiliation of the text.
In conclusion, the formation of motivation of non-specialist teachers through the study of English during the study of foreign experience depends in many respects on the content and equilibration (structure) of the use of mnemonic methods. Based on the study of foreign experience, the following approaches to the research topic were identified: the approach of national and universal values, ie the content of universal cultural competence, social, political, awareness, responsibility, information and communication classification, logistical competence in logistics competence. ; functional approach to the study of English organization, modeling of special tasks within the field of activity and within the field on the basis of the system of competencies; an individual-psychological approach aimed at developing the competence of agility and flexibility to the specific labor market conditions based on the study of the English language of the specialist. REFERENCES
1. Ядгарова О. И. ФОРМИРОВАНИЕ ЛИНГВОДИДАКТИЧЕСКИХ КОМПЕТЕНЦИЙ БУДУЩЕГО УЧИТЕЛЯ ИНОСТРАННОГО ЯЗЫКА //European research: innovation in science, education and techology. – 2020. – С. 106-108.
2. 2.Тоджибаева К. С. К. Мыслители Востока о
профессии педагога и педагогическом
мастерстве //Academy. – 2016. – №. 12 (15). 3. Babiyan O. Kh. MOTIVATION OF STUDENTS
OF NON-LANGUAGE UNIVERSITIES TO STUDY AND THE FOREIGN LANGUAGE (ON THE EXPERIENCE OF TEACHING THE ENGLISH LANGUAGE). - 2007.
4. Yadgarova O. I. FORMATION OF LINGUODIDACTIC COMPETENCIES OF THE FUTURE FOREIGN LANGUAGE TEACHER.
5. Тоджибаева К. С. К. Формирование
мотивационной сферы нравственных качеств
учащихся //Проблемы педагогики. – 2017. – №.
4 (27).

SJIF Impact Factor 2021: 8.013| ISI I.F.Value:1.241| Journal DOI: 10.36713/epra2016 ISSN: 2455-7838(Online)
EPRA International Journal of Research and Development (IJRD) Volume: 6 | Issue: 8 | August 2021 - Peer Reviewed Journal
2021 EPRA IJRD | Journal DOI: https://doi.org/10.36713/epra2016 | www.eprajournals.com |67 |
MADRASAH EDUCATION IN KHIVA KHANATE AND ITS PECULIARITIES
M.T.Jumaniyozova Associate professor of the Department of Pedagogy and Psychology of
Uzbek State World Languages University, candidate of Pedagogical Sciences
ANNOTATION The article discusses the construction of madrassas in the Khiva khanate, the educational process in madrassas
and its specificity, teaching methods, foundation property and the system of financing of madrassas, the role of
madrassas in the socio-cultural environment.
KEYWORDS: madrasah, foundation, education financing system
INTRODUCTION One of the oldest centers of world civilization, Khorezm is famous for its rich history, dating back thousands of years, high culture, science and advanced philosophical thinking. In this land where the first foundations of the Uzbek statehood were laid, irrigated agriculture and unique irrigation facilities were established, urban life, culture and scientific traditions flourished after the Arab conquest in earlier periods when the religion of Islam began to happen Muslim schools and madrassas appeared in the early days of the Arab state.
As cities such as Kat, Gurganj, Khiva, and Khazarasp were known as the largest economic and cultural centers of the East, historical sources show that madrasas first appeared in these cities in the late ninth and early tenth centuries
During the reign of Khorezmshah Ma'muniy, in the capital Gurganj, attention was paid to cultural and educational work, and there were many schools, madrasas and sanctuaries. During the reign of the Khorezmshahs of the Anushtegin dynasty (XI-XIII centuries) the construction of schools and madrasas expanded and scientific research was further developed. In particular, the Arab historian al-Muqaddasiy cites the Khorezmians as intelligent, knowledgeable, highly talented and good at the science of fikh. Historical sources show that Yaqut Hamawi admitted that he had never seen such a glorious, incredibly rich and beautiful city in the world as Gurganj, the capital of Khorezm.
According to written sources, during the Anushtegin period, there were more than 12,000 mosques in Khorezm, with as many schools and 4,440 madrasas. By the end of the 16th and 17th centuries, when the Mongol rule in Movarounnahr
and Khorezm had been abolished for a century and a half, there had been some revival in education and spiritual life, as in other spheres.
In the 1840s, in addition to the khan's palace, Ichan Castle had 17 mosques, 22 madrasas, a caravanserai and a large market. In the second half of the XIX century, during the reign of Muhammad Rahimkhan II Feruz, in the cultural life of the Khiva khanate there were specific processes of growth. It can be said that more than twenty madrasas, mosques, minarets and roads were built during this period. Tora Murad Tower (1888), Bikajon Bika Tower (1894), Polvon Qori Madrasah (1905), Qazi Kalon Madrasah (1905), Polvon Darvoza (1906), Islam Khoja Madrasah and Tower (1910-1911) and Arab Muhammad Khan (1616), Muhammad Amin Inaq (1765), Qutlimurod Inaq (1809), Shergozikhan (1719-1728), Allakulikhon (1831-1835), Muhammad Aminkhan (1852-1855), Muhammad Rahimkhan (1870), Islam Khoja (1910), Asfandiyarkhan and other madrasas.
Academician Ya. Gulomov points out that in the late XIX - early XX centuries in the city of Khiva were built 36 madrasas (Ya. Gulomov. 1941). At the beginning of the 20th century, there were 130 madrasas and 1,636 mosques in the khanate. Khiva is the second largest madrasah in Central Asia after Bukhara.
Currently, there are 65 madrassas in Khiva, of which 54 are located in the city and 11 in the suburbs. 10 of these madrassas were built by Khiva khans, more than 20 khan dynasties, rich people and clerics of religious courts.

SJIF Impact Factor 2021: 8.013| ISI I.F.Value:1.241| Journal DOI: 10.36713/epra2016 ISSN: 2455-7838(Online)
EPRA International Journal of Research and Development (IJRD) Volume: 6 | Issue: 8 | August 2021 - Peer Reviewed Journal
2021 EPRA IJRD | Journal DOI: https://doi.org/10.36713/epra2016 | www.eprajournals.com |68 |
ABOUT THE ARCHITECTURE OF MADRASAS
In the architecture of Khiva madrassas, the building has two floors on the roof and one floor on the courtyard (Shergozikhan, Islamkhoja, Muhammad Aminkhan, Muhammad Rahimkhan Sani and others).
L. Yu. Mankovskaya divides Khiva madrassas into three structural groups:
- Madrasas located along the traditional elongated composite axis;
- Madrasas located in a horizontal form; - Madrasas built freely on the basis of the
shape of the construction site; The following words of A. Vamber prove
this: depending on the number, decoration and appearance of schools (madrasas) in Central Asia, it is possible to form an idea about the living conditions and level of education of the population. Although the income is limited, the efforts and donations of not only by khans but also by ordinary artisans to build madrasas are commendable. We will mention some of them 1) Madamin (abbreviation of Muhammad Amin.) - Khan-madrasa, built in 1842. It is a high-level architectural monument built by Persian architects in the style of Persian caravanserais ”(Vamberi A. 2003).
The structure of madrassas is unique, and below is some information about madrassas.
Arab Muhammadkhan Madrasah. It is considered to be an architectural monument of Ichanqala ensemble (1616y). Arab Muhammad Khan ordered to build the madrasah in the form of a one-storey, simple, trapezoidal building. The lush terrace is kept in the Khiva Museum. The madrasa was built for 20 students. The madrasah was built as chubkori (in Khiva it is called nigirik). It was built of re-baked bricks during the reign of Allakulikhon. Muhammad Yusuf Haji-Doi taught at this madrasa. Now in this madrasa the fund of Ichankala reserve is located.
Shergozikhan Madrasah. According to legends, Shergozikhan built the madrasah after a successful march to Khorasan. The madrasa is located to the south of the mausoleum of Pahlavon Mahmud. The madrasa, which began being constructed in 1718-1719, was completed a year later. This madrasah, which is considered to be the richest in Khiva, annually harvests a lot of wheat, rice and oats from 1000 tanobs of land in the villages of Sherabad, Khayrabad,Pirnavkhost, Polvonbobo. Muhammad Rahimkhan Soniy Madrasah. It was built in 1871 by Muhammad Rahimkhan II in front of the Old Ark Gate and was commissioned in 1876. The madrasah has a summer and winter mosque, a classroom, a library and other rooms. The courtyard of the madrasah is surrounded by 76 one-story cells. The roof of the cells is bounded on the outside by a
barrier wall and connected to a two-story main facade. Dimensions of the madrasa: 62.4 x 49.7 m; courtyard 28.8 x 28.3 m; classroom 5.4 x 5.4 m; mosque 7.0 x 7.0 m.
Islamkhoja Madrasah. It was built in a unique architectural style during 1908-1910. The madrasa was built by master Khudoibergankhoji. Consisting of 42 rooms, the more complex buildings were rebuilt in the form of a dense labyrinth, over which a large dome and a tall tower were erected. The madrasah had 50 students, the front of which was built on two floors. As a foundation for the madrasah, Islam Khoja allocated 14,451 tanobs of land from his land.
Muhammad Pano Madrasah. It was built in 1905 in Ichanqala. The madrasa was built by Qalandar Quchum under the leadership of master Khudoibergankhoji. Local craftsmen were involved in the construction. The madrasah was built at the intersection of the main roads of Ichanqala. The madrasah is surrounded by several mosque and madrasas such as in the south of the madrasa is the 10th century monument, the Jome mosque, in the north is the Arabkhan madrasa, in the east is the Kutlugmurad Inoq madrasa, and in the west is the Feruz madrasa.
Matniyoz Devonbegi Madrasa. Muhammad Niyaz Devonbegi, the Khiva khan's finance minister, built a madrasah and a choir adjacent to a madrasah in the center of Khiva in 1871. The madrasa is located next to the Muhammad Aminkhan madrasa, with the main entrance facing west. The side facades of the madrasa are on the side of the road, the surrounding is open and is greened. The madrasa was

SJIF Impact Factor 2021: 8.013| ISI I.F.Value:1.241| Journal DOI: 10.36713/epra2016 ISSN: 2455-7838(Online)
EPRA International Journal of Research and Development (IJRD) Volume: 6 | Issue: 8 | August 2021 - Peer Reviewed Journal
2021 EPRA IJRD | Journal DOI: https://doi.org/10.36713/epra2016 | www.eprajournals.com |69 |
a one-story building with 21 rooms, a classroom and a library. There were 19 rooms on the first floor, and the other two rooms were built behind the roof above. ORGANIZATION OF THE EDUCATIONAL PROCESS IN MADRASSAS
In the Middle Ages, as in all Muslim countries, the education system in Khorezm consisted of three stages: primary education, general education and higher education. Primary education is provided in schools under mosques, which are intended for five years and students are accepted from 4-5 years of age. In primary schools, Arabic writing and reading, samples from the Quran and hadis, abjad arithmetic, poetry books, pandnoma (a didactic book), morality were taught.
The second and third stages of education are taught in madrassas. General education madrassas functioned in the cities, districts and villages of the khanate. Imams of mosques and clerks are trained in these madrassas.
Higher stage of education was called madrasai oliya or madrasat ul-ulum, which had the status of a modern university. Such madrassas operated in the central cities of Damascus, Baghdad, Basra, Isfahan, Merv, Bukhara, Samarkand, Kat, Gurganj and Khiva, where there were many scholars.
Madrasah scholars have trained talented and experienced scholars of Islamic sciences, scholars, sheikhs, jurists, mudarrises (a painter), and civil servants.
The period of study in madrassas is 8 years, in which students are divided into three groups - stages: first, lower stage-“adno”, second, middle stage-“avsat” and third, upper, higher stage-excellent group- “a‟lo”. A separate program has been developed for each stage, and the transition from one stage to the next is solved through final exams.
Issues related to the internal life of the madrasah were resolved by a board of trustees consisting of trustees “mutavalli” and teachers “mudarris”.
In Khorezm madrassas, as in other places, 4 days a week: Saturday, Sunday, Monday, Tuesday are considered official study days. Two days a week, Wednesdays and Thursdays, were independent reading days, and Friday was a day off.
An academic year in madrassas lasts 7 months. The academic year begins on the first day of the “mezon” month, September 21, and ends on March 21, the first day of the month of “hamal”. The remaining months were holidays, during which time the students were engaged in household chores.
General education classes in madrassas were conducted by experienced, knowledgeable, professional teachers. The practical classes were conducted by individual teachers: the hafiz taught recitation, the preacher-religious sermons, the imam
taught the Shari'a sunnahs, the rules of prayer. The lessons in the madrasa program are divided into two groups, namely, “ulumi naqliya”, the sciences of narration (Islamic) and “ulumi aqliya” the sciences of intellect (secular).
In Ulumi Naqliya the Qur'an, hadith, the science of fikh, and explanations of them were taught. Secular sciences such as astronomy, mathematics, astrology, algebra, chemistry, geometry, geography, history, philosophy, literature, logic, Arabic grammar, music, calligraphy, and moral sciences were taught in the scientific mind. The students of the madrasah not only were fluent in Turkish but also they spoke in Arabic and Persian.
In addition to the works of Arabic, Persian and Turkish scholars, in the madrasa the works of ancient Indian and Greek scholars such as Claudius Ptolomey, Socrates, Plato, Aristotle and others, as well aa explanations on them were taught as a textbook. Among the works of literary ones, the works of Abulqasim Firdavsi, Farobi, Saadi, Hafiz Sherozi, Jami, Navoi and Fuzuli are loved and studied.
Teaching in Khiva madrassas was mostly in Turkish, partly in Arabic and Persian. Since Islamic sciences are in Arabic, a lot of time is devoted to the study of Arabic language and grammar.
The duration of study in madrassas is not limited, some students studied in one course for 3-4 years, and some for 8-10 years. The study was conducted in three courses: "adno" - elementary, "avsat" - intermediate and "a‟lo”- “excellent" - final course. The elementary course taught Arabic grammar, logic, Shariat rules, religious customs, and literature in Arabic and Persian. During the remaining two courses, students diligently studied “tahsib” (logic), theology, law, and other subjects.
In madrassas, the method of conversation and discussion was used, and special attention was paid to the independent thinking of students.
Successful graduates of the madrasa have served as prominent Islamic scholars: sheikhs, sheikhs of Islam, jurists, mullahs, imams, teachers, schoolteachers, and government officials.
The management of each madrasah was structured as follows: the madrasa had an imam, a muezzin, teachers, a cleaner, a barber, and a meshkobchi. The duty of the trustee is to use his belongings and vaqf lands, and to pay the axun and teachers, who are not involved in the educational work.
Teachers were called „axuns‟ or „mudarris‟.
Teachers appointed from knowledgeable, educated people are considered to be the main persons responsible for the education of students.
The lessons are based on a very simple method. Each student was engaged in a special book reading. Several students would gather in the axis

SJIF Impact Factor 2021: 8.013| ISI I.F.Value:1.241| Journal DOI: 10.36713/epra2016 ISSN: 2455-7838(Online)
EPRA International Journal of Research and Development (IJRD) Volume: 6 | Issue: 8 | August 2021 - Peer Reviewed Journal
2021 EPRA IJRD | Journal DOI: https://doi.org/10.36713/epra2016 | www.eprajournals.com |70 |
room based on the book they were beginning to study, one of them would read the book, the others would follow, and the axon would explain the content.
Students who graduated from madrassas in Khiva passed the exam. For this purpose, a special jury was formed by the khan, which sometimes included the khan himself, often the valiahd, qazikalon (chief judge), qaziyorda (city judge), and a number of scribes. Students who successfully passed the exam were given the titles of mufti, alam, axun, mukarrir. The graduates were perfectly mastered the science of theology, while at the same time being aware of the secular sciences. The fact that poets, historians, calligraphers, scholars and nobles have graduated from Khiva madrassas is a proof of our opinion.
Mudarris (from Arabic-teacher) is a madrassa teacher. In addition to Khorezmian scholars, well-known scholars from different countries of the East also taught in the madrasas of Urgench and Khiva in the field of Islamic and secular sciences.
Muhammad ibn Ibrahim Abu Abdullah as-Sinai, Muhammad al-Gurganji, Muhammad ibn Arslan Zahriddin al-Khwarizmi, Abu Muayyad al-Khwarizmi, Abu Bakr Ahmad ibn Muhammad al-Khwarizmi and others were educated in Urgench and Khiva madrassas and also studied and got qualified in famous madrasas in Syria, Iraq, Hijaz, Bukhara and Samarkand, and many of them taught in potential and scientific madrassas in these countries, also taught several pupils of their own.
Furthermore, famous scholars of their time such as Muhammad Yusuf Axun, Salim Axun, Khudoibergan Axun, Muhammad Sharif Axun, Siddiq Axun, Muhammad Yaqubkhoja Axun, Muhammad Rizo Axun, Otaniyaz Axun and other famous scholars taught in Khiva madrasas. ABOUT THE SYSTEM OF FINANCING MADRASSAS
The financial expenses of the madrasas were covered by the income of the vaqf, and each madrasa had its own “vaqf”- (property allocated by the state or individuals in Muslim countries for religious needs or charitable activities) and vaqf document. The endowment clearly indicates the expenses of the madrasah, its staff: trustees, teachers, hafiz, seal, naqib, cleaner, cook, etc., as well as the number of students, their salaries and allowances.
The annual salaries of madrasa‟s staff, teachers, and students are divided by cash and food grains.
With the completion of the madrasas, the khan allocated them special vaqf lands, and all property was sealed and legalized by the sheikh.
Historian A. Vamberi writes: “This madrasa
has 130 rooms and can accommodate 260 students. They are spent 12,000 batmans of Khiva wheat and 5,000 gold coins every year. In order to give the student an idea of the network of madrasah, we present the distribution of income and expenses in this educational institution as well as the officials and clerks working there:
5 axons (professors) receive a salary of 3,000 batmans of wheat and 150 gold coins a year,
1 muezzin receives 200 batmans of wheat a year,
2 servants 200 batmans of wheat per year 1 barber also 200 batman, 2 mudarris- teacher receives a part of the
total income; The rest were distributed among students in
3 classes: One class was given 60 batman wheat 4
gold, the second class 30 batman wheat, 2tilla, the third class 15 batman wheat, l gold;
2) Allakuli-khan - consists of 120 cells, 50 batmans of annual income are given to the pupils, and 2 gold.
3) 50 batmans and 3 gold coins were given for each cell in Kutlugmurad Inaq Madrasa (Vamberi.2003). THE IMPACT OF MADRASSAS ON THE CULTURAL ENVIRONMENT
Madrasas were not only educational centers, but also the prestigious scientific and educational center of the khanate at that time. Well-known historians, poets and writers of Khiva, great scholars of Islamic sciences, lawyers, masters of music often gathered and discussed in the Arab madrasahs of Muhammad Muhammadkhan, Shergozikhan, Allakulikhan, Muhammad Aminkhan Muhammad Rahimkhan in Khiva. It has become a tradition to hold such evenings in madrassas as "Navoiykhanlik", "Sadiykhanlik", "Fuzulikhanlik", "Bedilkhanlik". Even Khiva khan Feruz personally took part in such debates, discussions and literary evenings. Bayani narrates: “Two days a week, on Friday and Monday
evenings, Hazrat Khan used to talk to the ulama and read. Andogkim, Yusuf Haji Axun and Ismail Hodja Axun and Khudaybergan Axun, and scholars and scholars were present and read to the mullahs of Mullah Muhammad Rasul and Faqiri Haqir Majlis twice a week (Bayani. 2004).
The enlightened khan Muhammad Rahimkhan II has a special contribution to this rise. He turned his palace into a unique scientific and cultural center. The Khan's palace brought together more than 40 famous artists, scientists, scholars, famous historians, writers, mature representatives of the musical arts. Among the great scholars who created in the Khan's palace are the names of dozens

SJIF Impact Factor 2021: 8.013| ISI I.F.Value:1.241| Journal DOI: 10.36713/epra2016 ISSN: 2455-7838(Online)
EPRA International Journal of Research and Development (IJRD) Volume: 6 | Issue: 8 | August 2021 - Peer Reviewed Journal
2021 EPRA IJRD | Journal DOI: https://doi.org/10.36713/epra2016 | www.eprajournals.com |71 |
of artists, such as Shermuhammad Munis, Ogahi, Khudoiberdi Kushmuhammad, Muhammad Yusuf Bayani, Kamil Khorezmi, Ahmadjon Tabibi.
In the XVIII-XIX centuries in the Khiva khanate a special attention was paid to the science of translation. At that time, a special school of translation consisting of famous historians and writers was formed in the khan's palace. Nowhere in Central Asia at that time was the art of translation as developed as in the Khiva khanate.
Dilovarkhoja, Khudoiberdi ibn Kushmuhammad, Ogahi, Bayani, Kamil Khorezmi, Tabibi, Muhammad Rasul Mirzaboshi and others were among the leading scholars of the Khiva school of translation. Zayniddin Vasifi's work "Badoe ul-vaqoe" was translated from Persian into Uzbek by a skilled translator and poet Dilovarkhoja on the instructions of Allakulikhon.
Munis and Agahi are especially famous in the science of translation. The first book and the first half of Mirkhand's Ravzat us-safo are translated from Persian into Uzbek by Munis. After Munis' death, Ogahi completes the translation of Mirkhand's work. Khudoiberdi ibn Kushmuhammad translated Sharafiddin Ali Yazdi's "Zafarnoma" into Uzbek. Acknowledgments We acknowledge the staff of the Social and Humanitarian Department of the Khorezm Mamun Academy for their assistance in preparing this article. We also express our gratitude to the Khorezm Regional Craftsmen's Association. We would like to thank Ozod Botirov, the head of the Khiva Ichonkala Museum Foundation, for his original materials, which helped to cover the article in a quality and objective manner.
I must acknowledge the great contribution of the staff of the Khiva Ethnographic Museum in the preparation of the article. I would like to emphasize that from the scientific works of our famous scientists, archeologist S.P Tolstov, art critic G.A Pugachenkova, ethnographer I.M Jabborov, who deeply studied the ethnography of Khorezm. I used for a deep bow to their memory. BIBLIOGRAPHY
1. Vamberi A. Putishestvie po Sredney Azii M.Vostochnaya literatura. 2003, p.155,193 p.,
2. M.Bayoniy. Shajarai Khorezmshahiy. T. Literature and Art Publishing, 1994, 102 p.
3. Mankovskaya L. Yu. An open-air museum. Treasure of painting of Uzbekistan. - T: Literature and Art, 1981.
4. Pugachenkova G. Termez, Shakhrisyabz, Khiva. M., 1976, p.205
5. Sadullaev A., Sotliqov A. Historical roots of Khorezm Mamun Academy. - Nukus-Urgench: Karakalpakstan, 2003.
6. Shamsutdinov R., Rasulov B. History of Turkestan schools and madrasas (late XIX and early XX centuries). - Andijon, 1995.
7. Ya.Gulomov. Pamyatniki city Xivy. M.1941, 209 p.
8. https://madrasa.uz/madrasa-darslik/480-xiva-madrasalarida-talim-tizimi.html
9. https://mobile.studbooks.net/2042072/pedagogika/razvitie_vospitaniya_obrazovaniya_buharskom_emirate_hivinskom_kokandskom_hanstvah.
10. https://uza.uz/uz/posts/barchaga-bir-khil-stipendiya-yekhud-khonliklar-davriban-tala-12-09-2019
SJIF Impact Factor 2021: 8.013| ISI I.F.Value:1.241| Journal DOI: 10.36713/epra2016 ISSN: 2455-7838(Online)
EPRA International Journal of Research and Development (IJRD) Volume: 6 | Issue: 8 | August 2021 - Peer Reviewed Journal
2021 EPRA IJRD | Journal DOI: https://doi.org/10.36713/epra2016 | www.eprajournals.com |72 |
THE ROLE OF IMAGINATIVE LITERATURE IN THE COMPREHENSIVE DEVELOPMENT OF PRESCHOOL
CHILDREN
Daminova Shoxista Farkhodovna
Independent Researcher,Institute for Training and Development of Directors and Specialists of Preschool Educational Organizations
ABSTRACT
The main purpose of the article is to acquaint preschool children with imaginative literature today, to prevent the
decline of interest in reading among children, to link the child to books, to help preschool education comply with
federal state educational standards.
KEY WORDS: preschool education, preschoolers, imaginative literature, mental, moral, and aesthetic knowledge of children’s.
Preschool education is the first link in the education system, the first foundation for the formation of a harmoniously developed personality. Raising children who are the owners of our future is a process of national importance, because it involves all members of society. So our country pays great attention to this process, in particular, to the pre-school education system. Because young people are our future, and the more knowledge and education we give them, the more prosperous our future will be and the more peaceful our country will be. Otherwise, it will be difficult to teach the student in the future, which will not only negatively affect the development of a particular child, but also the spiritual and moral potential of society as a whole. One of the main sources of knowledge and education for children is a book. The educator makes extensive use of the press and books, which are the main sources of education and upbringing of children. The book is recognized as a tool that has everything, a response to everything in the minds of the little ones. The purpose of children's books is to develop the emotions that nature has given them. The indirect effect of such books should be on the emotions of the children, not on their minds.
Imaginative literature serves as a powerful, effective tool for educating children mentally, morally, and aesthetically, and has a tremendous impact on the development and enrichment of children’s speech. Books play an important role in the formation of artistic taste. It is important that books differ not only in age, subject and content, but also in the way they are told and decorated. Books
for toddlers, especially young children, attention is paid more on the effect of pictures than words. The child reinforces the content of the book in his memory by repeatedly "reading" the pictures in the book to his friends, adults and puppets. The bright, beautiful pictures in the book nurture children’s
artistic taste. Imaginative literature is a powerful effective
means of children’s mental, moral, and aesthetic
knowledge that has a major impact on speech development and enrichment. It enriches the emotions, evokes imagination, gives wonderful examples of children’s wonderful language.
These patterns differ in their effect: in stories, children know the accuracy of the word; in poems, the rhythm of folk speech, the ease and expressive rhythm of language, the words of humor, living and figurative expressions are manifested in adolescents. Imaginative literature arouses interest in the inner world of man and the protagonist.
Imaginative literature has a great impact on a child’s mental and aesthetic development. Its role in developing the speech of the preschool educator is great.
A literary work preserves content in artistic form. Perception of a work of art is only complete if the child is prepared for it. And for this it is necessary to draw attention not only to the content, but also to the language of fairy tales, stories, poems and other works of imaginative literature.
Gradually, children's inventive attitude to literary works, artistic taste is formed.
SJIF Impact Factor 2021: 8.013| ISI I.F.Value:1.241| Journal DOI: 10.36713/epra2016 ISSN: 2455-7838(Online)
EPRA International Journal of Research and Development (IJRD) Volume: 6 | Issue: 8 | August 2021 - Peer Reviewed Journal
2021 EPRA IJRD | Journal DOI: https://doi.org/10.36713/epra2016 | www.eprajournals.com |73 |
Preschoolers are able to understand the idea, meaning, and expressive language of a language that is aware of the wonderful meaning of language and expressions. The problem of identifying literary works of different genres by preschool children is complex and multifaceted. In events based on complex forms of aesthetic perception, the child goes a long way beyond simple passion. Researchers have focused on the specifics of understanding the content and artistic forms of content and works of art.
It is, first and foremost, a concept, a little life experience, directly related to reality. Therefore, only at a certain level of development and only at the perception of purpose, the formation of aesthetic perception and on this basis the development of children's artistic creativity. Speech culture is a multi-speech phenomenon, the main outcome of which is speaking in accordance with the norms of literary language; This concept includes all the elements that determine the clear, distinct, and emotional transmission of thoughts and feelings in the communication process. Accuracy of speech and communicative technical purpose are the main stages of mastering literary language.
Imaginative literature in preschool children continues to get acquainted. The educator focuses on children's attention not only to the literary work, but also on some features of language. After reading the work, it is important to correct questions related to the actions, relationships, and movements of the main heroes. The right question makes the child think, come to the right conclusions and simultaneously feel the note and artistic form of the work.
Literary works are taught with explanation of literary works in preschool children to express content. Bigs of older children can understand some features of the artistic form that represents the content of literature. They can differentiate the genres of literary works and the specifics of each genre.
It is important to read books that are caring for loved ones with artistic images, courage, pride, and people's heroic and amazing people through moral content and people's heroic and amazement. Reading these books will be accompanied by a conversation. Children learn to assess the actions of the signs, their causes. The teacher helps children understand attitude towards heroes, trying to understand the main goal. With proper formation of problems, the child wants to imitate the moral behavior of heroes. The conversation should be in character actions not about the behavior of the group's children. An artistic look has any moral affected.
In preschool education organizations, it is attached to the acquaintance of children with artistic works, in which they are affected by the love of books. Based on the state requirements and on the 5 important initiatives on the side of the head of state,
work is underway and is carried out effectively. The fourth initiative is aimed at raising the spirituality of young people, the organization of systematic work on the widespread promotion of the readings between them. Waking a love for the book from the future generation, the formation of independent views and widespread worldvaes creates a solid foundation in the becoming a wise to life ways, plays a key role in the formation of a perfect human being.
In the State Requirements for the Development of Early and Preschool Children, it is the requirements for the development of reading skills of preschool children that the child is interested in books and reading, and the expected results are as follows:
3-4 year olds have an understanding of books; asks adults to read a book; reads books appropriate for his age; identifies the relationship between pictures and words in a book; recognizes familiar fairy tale characters from pictures.
4-5 year olds react to the story they are listening to and ask adults questions; can tell the main points of a work he / she has listened to based on pictures; can say the name of a work of art after listening to it; memorizes poems appropriate for his age; uses the book carefully.
5-6 year old know the first sound of a word; read the book independently; distinguish sounds; rhym words; use the dialogic form of speech, ask questions; memorize and expressively read poems; know the authors of favorite imaginative literature, fairy tales and stories and their names; correctly use the tone of expression; find words related to letters.
6-7 year olds tell other children the content of the book they remember; use simple and complex sentences in speech; compose words from syllables using syllable cards; have an understanding of words, sounds, syllables, sentences; read forewords, book titles, captions, etc .; know the name of the genre of children's literature (fairy tale, poem, story); know the names of famous writers and poets.
All conditions are created in educational institutions for children to acquire these knowledge, skills and abilities in preschool age. The responsibilities of the preschool organization and the parents are:
1. To open the world of word art to the child, to cultivate interest and love for the book, to listen and understand it, to react emotionally to imaginary events, to care for the heroes and a sense of "helping them", that is, to develop children artistically;
2. To develop the ability to listen to a story and read it with peers;
3. To teach children to perform play actions corresponding to the text of a number poem;

SJIF Impact Factor 2021: 8.013| ISI I.F.Value:1.241| Journal DOI: 10.36713/epra2016 ISSN: 2455-7838(Online)
EPRA International Journal of Research and Development (IJRD) Volume: 6 | Issue: 8 | August 2021 - Peer Reviewed Journal
2021 EPRA IJRD | Journal DOI: https://doi.org/10.36713/epra2016 | www.eprajournals.com |74 |
4. To educate children to express their emotional attitude to the melody and music of folk songs, poems, songs;
5. To help children identify their characters when literary works are read and told over and over again;
6. To encourage the child to repeat certain words and phrases from poems and fairy tales;
7. To teach them to look at illustrations, to recognize the heroes of literary works from them, and to answer simple questions about the content of the illustration (Who is this? What is he doing? Where is the mouse? Etc.).
8. To teach children to observe the development of actions in fairy tales, first on a visual basis (pictures, toys, actions), and then on short poems, fairy tales, presented without an exhibition;
9. To encourage the child to use independently published books (colorful, large picture, hardcover and washable) specifically for first-year children.
The implementation of these tasks is inextricably linked with the development of children's ability and aesthetic perception of literary works, the development of their artistic and speech activity.
Each child has unique characteristics, and only his/her parents know all about his or her behavior, abilities and capabilities. Therefore, the role of educators and parents in choosing the right book and using it is great. In addition, the recommended books should be adapted to the child's age, psyche, ability to understand. It should be noted that in the organization of expressive reading for preschool children, a large place should be given to examples of folklore - fairy tales, stories. Such works attract young readers with their mysterious aspects and have a strong positive effect on the educator. Because the unique creations of the people are fascinating with the attractiveness and high artistry of their deeply popular language. After all, they reflect the dreams and hopes of the people, their heroism, their love for the patriotic book. Young readers often believe in speaking shyly in front of 4 strangers, so at this age, parents can gain knowledge about children if they are involved.
When a child is asked a variety of questions that bother him or her when the conversation begins, the child is frightened, so the questions should be concise and interesting, allowing the child to talk more about himself or herself. Imaginative literature is an effective means of educating children in a comprehensive way, which contributes greatly to the development and enrichment of their speech. Imaginative literature helps the child to understand society, natural life, human feelings and relationships through poetic images, enriches emotions. Imaginative literature helps preschoolers develop
feelings of humanity — feelings of compassion, kindness, and caring for the little ones, parents, and older family members. Children get an aesthetic and moral imagination from works of art. A number of reforms being carried out in our country today are aimed at further developing the educational process for the development of the next generation of people who are well-rounded, physically and spiritually healthy, broad-minded and have high human qualities. The role of the media and the press is invaluable in the revival of our history, national traditions, values, the growing sense of self-knowledge in young people, the strong need for diversity of information, the rapid development of society.
REFERENCES
1. Mahmudov M. Perfect human personality and social experience. "Pedagogical skills", 2002, No. 4.
2. Fostering a culture of behavior in preschool children. S.V. Peterina.— M .: Education, 1986.
3. Internet information 4. Kadyrova F.R., Toshpolatova Sh.Q,
Kayumova N.M., Azamova M.N. “Preschool
pedagogy” Tashkent: “Sparks of literature”
- 2019. - P. 169 5. Тоджибаева К.С.К. Креативность и
творческое мышление как важные
составляющие профессиональных
компетенций будущих педагогов //
Вопросы науки и образования. 2018. № 8
(20). С. 124-126.

SJIF Impact Factor 2021: 8.013| ISI I.F.Value:1.241| Journal DOI: 10.36713/epra2016 ISSN: 2455-7838(Online)
EPRA International Journal of Research and Development (IJRD) Volume: 6 | Issue: 8 | August 2021 - Peer Reviewed Journal
2021 EPRA IJRD | Journal DOI: https://doi.org/10.36713/epra2016 | www.eprajournals.com |75 |
FORMATION OF COMMUNICATIVE COMPETENCE OF FUTURE TEACHERS IN THE CONTEXT OF IDEAS
OF A PERSONALLY-ORIENTED APPROACH
Egamnazarov Murod Yusupovich Independent Researcher of Jizzakh State Pedagogical Institute
ABSTRACT This article is devoted to the study of the problem of forming the communicative competence of future teachers. The
author considers a personality-oriented approach as a conceptual basis for the implementation of this process. The
article substantiates the main theoretical aspects of the process of forming the communicative competence of future
teachers in the context of the ideas of a personality-oriented approach.
KEYWORDS: competence, personality-oriented approach, the concept of personality-oriented learning, the
formation of communicative competence, future teachers, professional pedagogical education, the principles of
personality-oriented education.
INTRODUCTION Education is one of the important elements of the cultural system of society. Currently, our education system is undergoing major changes due to integration into the global community, which contributes to the modernization of the national education system. The rapid changes taking place in the socio-economic, political and cultural life necessitate the transformation of the model for the implementation of higher professional education, the purpose of which is to ensure a high quality of professional training of future specialists.
Research by N.V.Kuzmina, A.K.Markova, Yu.V.Vardanyan, A.A. Vorotnikova, E.V.Grigorieva, G.S.Smirnova, Z.A.Yagudina, T.V.Zamorskaya, N. A.Zimina et al [5]. The problems of the formation of communicative competence - a key professional characteristic of the teacher's personality - are becoming very relevant today [3]. The content structure of this competence includes the following skills: to form the goal and objectives of professional communication; organize a discussion; manage communication; use the means of etiquette to achieve a communicative goal; conduct conversation, discussion, dialogue, debate, negotiations; use various tactics to implement the chosen strategy; analyze conflicts, crisis situations and resolve them, etc [4].
Analysis of the nature of modern education reveals its focus on the individual. In this regard, one of the leading conceptual approaches to the implementation of higher professional education at the present stage is the person-oriented one. Focusing on the personality, this approach, as the main goal of the formation of communicative competence, determines the acquisition by a future specialist of a number of communicative qualities and competencies necessary for the implementation of full-fledged personal and professional life in modern society. STATEMENT AND PURPOSE OF THE ARTICLE The purpose of this article is to study the essence of the process of forming the communicative competence of future teachers in the context of the ideas of a personality-oriented approach. PRESENTATION OF THE MAIN MATERIAL OF THE ARTICLE In modern science, the personality-oriented approach is considered as a psychological and pedagogical principle in the training of future specialists. Its theorists in domestic science are V.I.Andreev, A.V. Drummers, I.A.Zimnyaya, I.S.Yakimanskaya and other scientists.

SJIF Impact Factor 2021: 8.013| ISI I.F.Value:1.241| Journal DOI: 10.36713/epra2016 ISSN: 2455-7838(Online)
EPRA International Journal of Research and Development (IJRD) Volume: 6 | Issue: 8 | August 2021 - Peer Reviewed Journal
2021 EPRA IJRD | Journal DOI: https://doi.org/10.36713/epra2016 | www.eprajournals.com |76 |
Despite the large number of publications devoted to various aspects of the implementation of the personality-oriented approach, they do not highlight the problem of the formation of communicative competence as one of the leading in the context of teacher education. So, the features and patterns of the implementation of a personality-oriented approach to the process of forming the communicative competence of future teachers need a special study and theoretical substantiation of its results.
Communicative competence is “the ability
to establish and maintain the necessary contacts with other people” [1, p. 19].
Within the framework of this study, we will consider the person-centered approach in the meaning of methodological orientation in pedagogical activity based on humanistic worldview and allowing on the basis of the system of interrelated concepts, ideas of humanistic pedagogy, humanistic ways of pedagogical actions to provide and support processes of self-cognition, self-actualization and self-realization of the future specialist and development of his individuality.
The personality-oriented approach in education is based on the formation of subject-subject relations in the pedagogical process based on the use of the subject experience of each student and respect for his personality. This approach focuses on the need to create favorable and safe conditions for the development and self-development of the individual, the realization of its natural potentials.
So, in the center of attention in the concept of student-centered learning is a unique, holistic personality, striving to maximize his capabilities, open to the perception of new experience, able to consciously and responsibly make a choice in various difficult situations [6].
The formation of the communicative competence of future teachers based on the ideas of a personality-oriented approach is based on three main positions:
1. The focus of the educational process in the professional education of the future specialist on the development of his personality. While attracting students to communicative activities, solving and communicative tasks, the teacher directs his efforts to the formation of the personal characteristics of the student's qualities (his perception, memory, thinking, speech, imagination, feelings, volitional qualities, abilities, analytical and critical attitude to life, etc.). ).
2. Recognition of the need to provide maximum assistance to the communicative development of the future teacher by ensuring productive communication in various situations, conditions and in the social environment.
3. Confirmation of the subjective role of the future specialist in the learning process.
In the context of the formation of the communicative competence of future teachers, the personality-oriented approach performs the following functions:
- Humanitarian, the essence of which is the recognition of the inherent value of the individual and the provision of ephysical and moral health (the mechanisms of this function are understanding, communication and cooperation);
- Cultural, the purpose of which is to preserve, recreate, develop and transmit a communicative culture through communicative activities (mechanisms: cultural identification, acceptance of social values, morality, etiquette, norms of behavior as their own and building their own life taking them into account);
- The function of socialization, which provides for the possibility of assimilation and reproduction by an individual of social experience necessary and sufficient for the person to enter society (mechanisms: reflection, preservation of individuality, creativity as a personal position and a means of self-determination).
Substantiation of the personality-oriented approach as a conceptual basis for the formation of the communicative competence of the future ideas of the teacher allows:
- To develop the individual abilities of each student for productive communication;
- Maximally identify, initiate, use the individual communicative experience of a person;
- help the student to know himself through communication with others;
- change communication settings in accordance with modern requirements;
- To promote self-determination and self-realization of each student as a subject of communicative activity;
- To form the communicative culture of the future teacher [2].
The process of forming the communicative competence of future teachers in the context of the ideas studied in this research approach provides for the creation of certain professional, pedagogical, psychological and methodological conditions.
The professional and pedagogical conditions include the following:
- Empathy of the teacher, who implements the formation of the communicative competence of future teachers;
- Organization by the teacher of communicative activities of future specialists in multivariate flexible forms in accordance with personal characteristics, the specifics of the social environment;
- setting clear and feasible tasks for students in a clear and friendly manner.

SJIF Impact Factor 2021: 8.013| ISI I.F.Value:1.241| Journal DOI: 10.36713/epra2016 ISSN: 2455-7838(Online)
EPRA International Journal of Research and Development (IJRD) Volume: 6 | Issue: 8 | August 2021 - Peer Reviewed Journal
2021 EPRA IJRD | Journal DOI: https://doi.org/10.36713/epra2016 | www.eprajournals.com |77 |
We define the following psychological conditions for the formation of communicative competence:
- The development of a future specialist of self-reflection as a subject of communicative activity;
- The possibility of students' free choice of the form of communication activities and ways to achieve goals
Methodological conditions provide for: - modeling the process of forming
communicative competence on the principles of human self-worth, respect for the personality of each student;
- Compliance of the aspirations and goals of future teachers with their capabilities and the requirements of society;
- Consideration of the process of formation of communicative competence as the implementation of pedagogical assistance to a student in his professional development.
- Timely identification and elimination of factors that negatively affect the process of achieving the set goal;
- modeling the process of forming communicative competence on the basis of the subject-subject nature of relations between the participants on the principles of their equal cooperation and mutual understanding;
- Development of dialogical forms of pedagogical interaction between teachers and students;
- ensuring the development and self-development of the student as a subject of communicative activity;
- providing the student with the right to self-determination and self-realization in personality-oriented or socially-oriented communicative activity through his mastery of various ways of verbal and non-verbal behavior;
- Motivation of students to develop their own models of communicative behavior and activities, search for methods of their implementation, interact with people in various activities;
- providing each student with the opportunity to individually perceive the communicative situation, to approach it creatively, to widely implement individual experience in the interpretation and assessment of facts, phenomena on the basis of personally significant values and internal attitudes;
- diagnostics and identification of the real level of formation of professionally significant communicative characteristics.
In the system of implementation of the process of formation of communicative competence, classical didactic principles do not allow to fully describe and regulate the personality-oriented
educational process. This justifies the need to take into account special principles. In this regard, it is expedient, in our opinion, to take into account the principles determined by A.V. Khutorsky, among which the principles:
- Personal goal-setting; - choosing an individual educational
trajectory; - metasubject foundations of the educational
process; - Productivity of training; - The primacy of educational products; - Situational learning; - Educational reflection [7].
CONCLUSIONS Summarizing the above, we conclude that the formation of the communicative competence of future teachers on the basis of the ideas of the personality-oriented approach is based on the positions of the orientation of the educational process on the development of the student's personality, the maximum contribution to his communicative development, the statement of the student's subjective role in the learning process.
The implementation of the formation of the communicative competence of future teachers in the context of a personality-oriented approach is possible by observing professional pedagogical, psychological and methodological conditions, as well as taking into account the principles of the conceptual approach analyzed in this study.
REFERENCE
1. Буртовая Н.Б. Изучение коммуникативной
компетентности педагогов-психологов // 8-я
Всеросс. конф. студ., аспирантов и молод.
ученых «Наука и образование». – Томск: Изд-во
ТГПУ, 2004. – Т. 2, ч. 2. – С. 19-21. 2. Zhukov Yu.P. Diagnostics and development of
competence in communication / Yu.P. Zhukov, L.A. Petrovskaya, P.V. Rastyannikov. - M .: Publishing house of Moscow State University, 1991 .-- 96 p.
3. Zimnyaya I.A. Key competencies as an effective-target basis of a competence-based approach in education. - M .: Research Center for the Problems of the Quality of Training of Specialists, 2004. - 40 p.
4. Selevko, G.K. Competencies and their classification // Public education. - 2004. - No. 4 (No. 1337). - P. 138-142.
5. Тоджибаева К. С. К. Профессиональная
педагогическая компетентность учителя:
феноменология понятия //Вопросы науки и
образования. – 2018. – №. 27 (39). 6. Khutorskoy A.V. Personality-oriented teaching
methodology: a guide for teachers / A.V. Khutorskoy. - M .: Vlados-Press, 2005 .-- 383 p.
7. Yakimanskaya I.S. Person-centered learning in a modern school. - M., 1996 .-- 96 p.
SJIF Impact Factor 2021: 8.013| ISI I.F.Value:1.241| Journal DOI: 10.36713/epra2016 ISSN: 2455-7838(Online) EPRA International Journal of Research and Development (IJRD) Volume: 6 | Issue: 8 | August 2021 - Peer Reviewed Journal
2021 EPRA IJRD | Journal DOI: https://doi.org/10.36713/epra2016 | www.eprajournals.com |78 |
ROLE OF PLANETS, STARS AND BHAVA’S IN
MEDICAL ASTROLOGY
S Sharma1, Sri Prathyangira Swamy2
1Research Scholar, Dept. of Astrology, Vels Int. of Science, Technology & Advanced Studies, Chennai, India
2Director & HoD, Dept. of Astrology, Vels Int. of Science, Technology & Advanced Studies, Chennai,
India
ABSTRACT
Astrology encompasses many divisions within oneself. The most notable of these is medical astrology. Medical
astrology has been given much importance since ancient times. Various measures have been taken for the
advancement of medical astrology in different times and in different countries. It is said that in the past, if a
person became ill, the doctor would hold his hand and feel that the disease would go away in a matter of days or so.
Medical astrology has been practiced as having the essential principles of knowledge of astrology, medical practice
and medical knowledge within itself.
KEYWORDS - Navagrahas, Lagna, Rahu, Ketu.
I. INTRODUCTION Like medicine, astrology has a long
tradition. Hippocrates, a Greek physician and philosopher born in 460 BC, proposed that human behavior is the result of the balance of the four elements of blood, black bile, yellow bile, and cooling. Astrology plays an important role in the maintenance of physical and mental health since one can use one's horoscope to predict when one will be afflicted by illness and even make the horoscope into a preconscious entity. An horoscope can indicate what organ is most susceptible to weakness. Nature has shown us in many ways that every living thing is unique. Although everyone in a family has been following the same diet for many generations, not everyone in the family gets the same disease. This does not mean that diet alone is the root cause of diabetes. Our focus is to establish and confirm the theories concerning diabetes, the impact of the six - eight - twelve houses that cause diabetes, as well as the effect of the planets Venus, Jupiter, Saturn, and the Moon, which are also believed to be factors causing diabetes. II. DIABETES AND ZODIAC
There is no single cure for diabetes. This disease affects all zodiac signs. Venus, Guru and Saturn are the causal planets for diabetes. The 6th, 8th, and 12th houses of this disease, and the causal
planets associated with water, are causal houses. In sinfulness 6th house signifies disease, 8th house signifies kidney damage, the long term effect of disease and its hardships and losses, 12th house signifies rest and eyes. The eyes reflect the expressions of the liver. When the liver is affected, so are the eyes. Thus houses 6th, 8th, 12th become the causative agent of diabetes. If Guru, Venus, Saturn and Moon are in 6th, 8th, 12th house or water zodiacs are in 6th, 8th, 12th house, then it is clear that everyone has diabetes.
III. DIABETES AND ITS PLANETARY SYSTEM
The planets Moon, Venus, Guru and Saturn in the 6th, 8th and 12th sins cause diabetes due to their contact. The incidence of diabetes is high. 6th, 8th, 12th sin If water zodiac sign has 6th lord in it then diabetes will come. The presence of Venus in the water zodiac and the presence of Venus in the 6th, 8th and 12th house of water are the main causes of diabetes. Guru, Venus conjunction being, Guru, Venus conjunction being in water zodiac. Guru, Saturn joined or seen. Guru, Venus, Saturn are two of the three together, seeing them one by one. If Guru, Venus and Saturn are associated with water in the zodiac, diabetes will definitely come. Venus and Guru are in 6th, 8th and 12th house and are in the water sign which is the cause of diabetes. The

SJIF Impact Factor 2021: 8.013| ISI I.F.Value:1.241| Journal DOI: 10.36713/epra2016 ISSN: 2455-7838(Online) EPRA International Journal of Research and Development (IJRD) Volume: 6 | Issue: 8 | August 2021 - Peer Reviewed Journal
2021 EPRA IJRD | Journal DOI: https://doi.org/10.36713/epra2016 | www.eprajournals.com |79 |
presence of Guru, Venus and Saturn in contact with one of the three Rahu, ketu is also a cause of diabetes. This spatial disease indicates that the organs are damaged or that the disease is very difficult. IV. ASTROLOGICAL HOUSES AND PHYSICAL HOUSES
In the celestial sphere, the literature is divided into twelve houses for the first twelve zodiac signs. Every zodiac sign or house is considered sinful. Lagna House - Head, brain, mind. Second House - Face, Right Eye, Nose, Tongue, Teeth, Ears, Fingers, Nails, Bones, Muscles. Third House - Neck, Throat, Neck Bones, Arms, Breathing, Ears, Body Development. Fourth House - Heart, Lungs, Chest, Blood. Fifth House - Upper abdomen, Mind, Esophagus, Gallbladder, Spleen, Intestines. Sixth House - Lower abdomen, Navel, Bones, Muscles, Psyche, Esophagus, Kidneys. Seventh House - Stomach, Thighs, Sphincter, Urethra, Mammary glands, Fallopian tubes, Broad ligament that connects bones. Eighth sin - Reproductive Organs, Urine, Blood, Small blisters that may grow in the future. Ninth House - Thighs, Arms and Legs, Blood vessels from the heart. Tenth House - Knees, Bones, Muscle. Eleventh House - The area between the knee and the ankle, Breathing, Usually the Legs, the Left ear. Twelfth House - Feet, Blood, Left Eye.
V. STARS AND BODY PARTS
Aswini star represents the head, brain, and skull. Barani star refers to the head, brain, skull, the organs in the head and the eyes. Kritikai Nakshatra 1st feet refers to the head, eyes, brain, vision and Krittikai Nakshatra 2nd, 3rd, 4th feet represent the organs of the face, neck, upper part of the vocal cords, tubules under the tonsils and jaw. The Rohini constellation refers to the two tubes under the face, mouth, tongue, and tongue, the upper part of the mouth, the neck, the cerebral cortex, which regulates thought-provoking movements, and the cartilage that supports the skull. The Mrigashiras star 1, 2 refers to the face, muzzle, cheeks, upper part of the larynx, the upper part of the larynx, the larynx leading to the heart, the blood vessel that carries blood to the heart, and the two tubes under the tongue. The Mrigashiras star 3,4 feet represents the throat, larynx, pujas, shoulders, ears, upper ribs, and gland at the base of the neck. Arudra star refers to the organs of the throat, pujas and shoulders. Punarvasu star 1st, 2nd and 3rd feet represent the ears, throat and shoulders. Punarvasu Star 4th Foot Refers to the lungs, respiratory tract, chest, abdomen, membrane between the liver and intestines, the epithelium, the thorax, and the pancreas. Pushyami star refers to the organs of the lungs, abdomen and ribs. Ashlesha Star refers to the organs of the lungs, stomach, esophagus, membrane between the liver and intestines, pancreas
and liver. Magha star refers to the heart, spine, spinal cord, spleen, spine, blood vessels and anterior part of the spine. Poorvaphalguni star represents the heart and spine. The UthraPhalguni 1st foot represents the spinal cord. The 2nd, 3rd, and 4th feet of the zodiac sign represent the intestines and the liver. Hastha Nastram refers to the organs of the intestines, the esophagus, the glands, the chemical that causes changes in the raw material. Chithra star represents 1st, 2nd feet indicates the abdomen, lower abdomen, and 4th feet represents the kidneys, halves, hernia, and lower part of the lumbar spine. Swati star refers to the skin, kidneys, bladder and urethra.The Visakha star 1st, 2nd and 3rd feet represent the lower abdomen, the organs near the bladder, the kidneys and the pancreas. The 4th feet of the Visakha star represents the rectum of the bladder and part of the descending colon the large gland.
Anusham Nastram refers to the organs of the bladder, genitals, rectum, bones near the genitals, and nasal bones. Jyeshta star refers to a part of the colon, the abdomen, the genitals, and the uterus. Moola star refers to the organs of the hips, thighs, and femur. Poorvashaada star refers to the organs of the thighs, hips, the triangular bone of the spinal cord, and the vessels that carry blood from the heart to the heart. Uthrashaada star 1st foot represents the thighs, femur, and blood vessels leading from the heart. The constellation 2nd, 3rd, and 4th feet represents the skin of the feet, the knees, and the rounded bones of the knees. Shravan star refers to the lymph nodes, knees and skin. Dhanishta Star 1st, 2nd feet represents the knee joints, the abdomen 3rd, 4th feet represent the ankles, the arms and legs the area between the knees and the ankles. Shathabhisha star refers to the area between the knee and the ankle, the limbs. Poorvabhadra star represents the 1st, 2nd, 3rd feet and the ankles. Poorvabhadra star 4th foot refers to the elements of the feet and nails. Uthrabhadra star refers to the organs of the feet. Revathi refers to the organs of the feet and nails.
VI. CONCLUSION
This study, entitled Medical Astrology, provides a comprehensive overview of patients being treated for diabetes in hospitals and the medications available to them. The purpose of this study is to find out how astrologers and planetary systems contribute to the horoscopes of diseased planets by obtaining their horoscopes and to learn about the effects of diabetes on others in the future and how to protect against it. VII. DISEASES CAUSED BY NAVAGRAHA’S
Sun - Abdominal pain, rash, rash, scabies, feverish diseases, Moon - Indigestion, diarrhea, diarrhea, blood-borne diseases, Mars - Vomiting,

SJIF Impact Factor 2021: 8.013| ISI I.F.Value:1.241| Journal DOI: 10.36713/epra2016 ISSN: 2455-7838(Online) EPRA International Journal of Research and Development (IJRD) Volume: 6 | Issue: 8 | August 2021 - Peer Reviewed Journal
2021 EPRA IJRD | Journal DOI: https://doi.org/10.36713/epra2016 | www.eprajournals.com |80 |
cramps, headache, cranial, Mercury - limb paralysis, rheumatism, sore throat, Guru - Mysticism, Depression, Venus - tumor, fissure, hemorrhoids, genital diseases, cholera, a cataract, Saturn - rheumatism, disease, cholera, osteoporosis, Rahu / Ketu - poison, dizziness.
REFERENCES
1. Sathasivam M S, Uthrakalamiritham Moolamum Uraiyum, Indhu Publications, Chennai, 2002.
2. Natesa Sasthrigal, Sathaga Palathipigai, Kadalangudi Publications, Kadalangudi, 1995.
3. Gopikrishnan k, Parivaartha Rathnagaram, Kumaran Publications, Chennai, 2005.
4. Kumarasami, Kalyanavarmar Saravali, Sri Anandha Nilaiyam, Chennai, 2003.
5. Boopathi Rajan, Navagraha Jothida Paripalanam, Abirami Publications, Chennai, 1982.
6. Hariharan k, Grahangal yethai kurikattukirathu, Krishnamoorthy Publications, Chennai. 1997.
7. Iyer P S, Jothida Ariviyal, Kerala Jothisha Publications, Madurai, 1993.

SJIF Impact Factor 2021: 8.013| ISI I.F.Value:1.241| Journal DOI: 10.36713/epra2016 ISSN: 2455-7838(Online)
EPRA International Journal of Research and Development (IJRD) Volume: 6 | Issue: 8 | August 2021 - Peer Reviewed Journal
2021 EPRA IJRD | Journal DOI: https://doi.org/10.36713/epra2016 | www.eprajournals.com |81 |
PETROGENETIC MODELING OF THE GRANITIC ROCKS IN AND AROUND LODHMA, DIST RANCHI,
JHARKHAND, INDIA
Dr. Jayant Sinha Associate Professor and Head, Department of Geology, St. Xavier’s College, Ranchi-834001
Article DOI: https://doi.org/10.36713/epra8177 DOI No: 10.36713/epra8177
ABSTRACT
The Lodhma area, in the Ranchi district, constitutes the central segment of Chotanagpur Granite Gneissic Complex (
CGGC) and falls in the northeastern segment of Survey of India toposheet number 73E/4.
The CGGC is mainly composed of variants of granitic rocks, amphibolites and metasedimentaries. The granitic
rocks find good exposure in the area. They comprise predominantly of granite gneisses, crystalline massive granites
and migmatites showing noticeable variations in mineralogy, texture, structure and associations. The regional strike of
the lithounits of the area show almost E-W trend. However ambient structural controls have brought about local
changes in the strike direction. The area has witnessed at least three phases of deformations which is reflected by three
generations of folds, which are generally isoclinals.
Petrogenetic characterization of granitic rocks and its variants in the area has been attempted using various
geochemical tools involving major/ trace element studies and Niggli values. S –type parentage of these Granites have
been established on the basis of distribution behavior of various chemical components present in it, thereby indicating
role of pelitic schists in the generation of anatectic melt, which ultimately crystallized into granites. S-type lineage of
these granites has also been further cemented with the help of several well established binary and ternary variation
diagrams.
The area under investigation lies in the Ranchi district of Jharkhand state. Lodhma is approximately 24 km from the Ranchi town and it lies to the south-west of Ranchi town. The Lodhma area falls in the northeastern segment of Survey of India topo sheet number 73E/4.
The Lodhma area constitutes the central segment of Chotanagpur Granite Gneissic Complex ( CGGC). The CGGC is mainly composed of variants of granitic rocks, amphibolites and metasedimentaries. The predominance of granite gneisses has imparted the name CGGC to this region. A comparison between the disposition of structural signatures and nature of lithounits between the CGGC and Singhbhum Craton indicate the collision of these two microplates leading to their suturing and triggering a sequence of deformational, magmatic and metamorphic activities.
The Lodhma area is a depository of almost all representative lithounits of this region. The nature of these rocks presents an insight regarding palaeo-source material responsible for their generation. The multiplicity of deformational episodes has led to lithological and structural complexities in the rocks of this area.
The present work is a holistic attempt to explore the petrogenetic characterization of granitic rocks and its variants present in the area.
GEOLOGY OF THE AREA
The Lodhma area is a geologically complex terrain embracing signatures of multiphase deformations, magmatism, metamorphism and subaerial transformations. Granitic rocks, amphibolites and the metasedimentaries dominate the present area, all belonging to Precambrian age. The granitic rocks
SJIF Impact Factor 2021: 8.013| ISI I.F.Value:1.241| Journal DOI: 10.36713/epra2016 ISSN: 2455-7838(Online)
EPRA International Journal of Research and Development (IJRD) Volume: 6 | Issue: 8 | August 2021 - Peer Reviewed Journal
2021 EPRA IJRD | Journal DOI: https://doi.org/10.36713/epra2016 | www.eprajournals.com |82 |
find good exposure in the area, showing variations not only in mineral composition but also in their fabric. The important variants are granite, granite gneisses and migmatites. Numerous inclusions of quartzo-felspathic veins have been encountered in the area. The pelitic, calcareous, psammitic metasedimentaries and amphibolites are the important metamorphic constituents in the area. Among the metasedimentaries the biotite schists, biotite-muscovite schists, quartz-garnet-sericite schists, calc-silicate rocks and diopside as well as hornblende quartzites are very prominent.
The regional strike of the lithounits of the area show almost E-W trend. However ambient structural controls have brought about local changes in the strike direction, as a result some of the lithounits have acquired a NW-SE strike. The metamorphites display strong planar structures, which is represented by the foliations and schistosity planes. The area has witnessed at least three phases of deformations which is reflected by three generations of folds, which are generally isoclinals.
Ghose(1983), Sarkar and Jha(1985), Banerji(1991), Tiwary et.al.(1992), Sinha(1998) and others have conducted geological investigation of different segments of CGGC. A detail study of the Lodhma area has revealed that pelitic, psammitic and calcareous sediments were the earliest lithounits deposited in the epicontinental basin. At present they are represented by their metamorphic equivalents. The regional metamorphism of the entire CGGC coincided with the culmination of third phase of deformation. The pelitic schists represent the first phase of sedimentation, which occur mainly as bands and enclaves of diverse shapes and sizes within the granitic rocks. Arenaceous sediments represent the next phase of sedimentation in the area, which are being represented by quartzites of diverse mineralogy. The cal-silicate rocks are the youngest sedimentary representatives in the area. They occur as small outcrops in the granitic country.
The amphibolites of diverse mineralogical composition as well as textural configuration occur in the area. They mainly occur as large circular or elliptical masses and in narrow strips intercalated with other metamorphites. They seem to have originated as a result of basic magmatism followed by amphibolisation (Sinha, 1998). Medium grained amphibolites occurring as inclusions within the granitic country is also found in the area.
The granitic rocks are the dominant lithounit in the area and are the representatives of the CGGC. The granitic rocks in the area comprise predominantly of granite gneisses, granites and migmatites showing noticeable variations in mineralogy, texture, structure
and associations. These granitic rocks crop out as huge rounded domes showing the effects of spheroidal weathering in them. Geologically these granitic rocks in particular and the CGGC in general is an extension of the Satpura range of central India judged from the continuation of the ENE-WSW strike ( Mahadevan, 2002). However, in the Lodhma area, due to local adjustments the granitic rocks exhibit a strike which varies from E-W to NW-SE. inclusions of various sizes and shapes of older metasedimentaries and amphibolites have been noticed within the granitic country.
PETROGRAPHY OF GRANITIC ROCKS The granitic rocks of Lodhma area display following petrographical characteristics:
The granitic rocks in general are coarse grained showing both massive as well as foliated habit.
The granite gneisses are characterized by typical gneissose structure showing alternate mafic and felsic bands.
The massive granites display typical holocystalline, hypidiomorphic and interlocking textute.
Quartz and Alkali felspar, in the form of orthoclase, microcline, albite and perthite form the essential minerals whereas biotite, muscovite, garnet, hornblende, apatite, sphene, opaques and epidote constitute the accessory minerals of the granitic rocks.
Plagioclase felspars are one of the dominant constituents in these rocks and it usually occurs as subhedral grains and often exhibits polysynthetic twinning with { 010} and {101} as the twin planes.
Myrmekites are quite common in them, the quartz occurs as blebs, drops and vermicules within the felspar plates.
Sericitisation of plagioclases and chloritization of biotite is very often observed.
One of the important variation in the mineralogy of the granites is in the nature and amount of the felspars present and also in the type of ferromagnesian constituent present in them.
Based on mineralogy, fabric and field associations, three broad types of granitic rocks have been identified in the area, viz. the granite gneisses, the massive granites and the migmatites.
Based on dominance of ferromagnesian minerals, the granite gneisses have been

SJIF Impact Factor 2021: 8.013| ISI I.F.Value:1.241| Journal DOI: 10.36713/epra2016 ISSN: 2455-7838(Online)
EPRA International Journal of Research and Development (IJRD) Volume: 6 | Issue: 8 | August 2021 - Peer Reviewed Journal
2021 EPRA IJRD | Journal DOI: https://doi.org/10.36713/epra2016 | www.eprajournals.com |83 |
categorized as biotite granite gneisses, hornblende granite gneisses and garnetiferous granite gneisses. However, on the basis of field observations and fabric studies following types of granite gneiises have been identified; the banded gneissse, the streaky gneisses, the augen gneisses and the porphyroblastic gneisses.
Massive granites have been identified as Gray granites, and migmatites as biotite and hornblende bearing migmatites.
GEOCHEMISTRY OF GRANITIC ROCKS The major element, trace element chemical analyses and Niggli values of the granitic rocks of Lodhma area has been shown in the Table 1, table 2 and Table 3 respectively. Sample numbers used in the chemical analyses Sample Nos BL1 ----BL5 = Massive Granites. BL6 ----BL10 = Foliated Granites. BL11 ----BL12 = Migmatites.
The silica content of the granites varies between 68.95% - 74.01%, thereby establishing their persilic nature. This also confirms their oversaturated character and is reflected in the occurrence of quartz as essential mineral. The Al2O3 percentage varies between 13.25% - 15.12%. Their Al2O3 / (Na2O + K2O+CaO) ratio is greater than 1.1, which classifies these granites into peraluminous category as well as suggests S type affinity to them. The average value of CaO is 1.66 wt%, which is another evidence in support of pelitic lineage for these granites. (Chappell and White,, 1974).
The Feo(t) and MgO content is almost uniform in all the samples. The interrelationship between the mafic and felsic components has been demonstrated in the (K2O + Na2O) – ( MgO + FeO(t)) variation diagram ( Fig. 1). The points show a weak negative correlation, a chemical behavior supporting the magmatic origin of granites. It also indicates that alkali silicates are far more common than the mafic silicates in them.
The Na2O / K2O ratio in general is less than 1. In the binary diagram Na2O vs K2O (Fig. 2) , the granitic rocks of the area are placed in the K2O field, an observation matching well with the major oxide analysis and dominance of K-felspars in them.
The higher percentage of Na2O may be due to the replacement of Ca++ by Na+. The Na2O / CaO ratio varies from 1.23 to 3.43, substantiating the fact that plagioclases are enriched in Na.
The MgO / CaO ratio is less than 1, which is manifested in the absence of camafic minerals in them.
The impoverishment of CaO and its manifestation in the mineral formation of silicate
affinity is illustrated in the CaO - Na2O - K2O ternary diagram ( Fig. 3). The granitic rocks of the area are placed far away from the CaO end. Abundance of Na2O / K2O in them is clear indication of preponderance of late differentiate minerals. There is progressive enrichment of alkalies, which is clearly reflected in the mineral composition. Presence of Na rich and Ca poor plagioclases also cements this conjecture.
The role of anatexis has been established in the generation of granitic melt and ultimately crystallizing into granite. Experimental studies have indicated that in presence of adequate water, partial melting of a variety of rocks can produce granitic melt which kinetically tends to move towards shallower level, i. e. , low pressure region. The movement of granitic melt, however may be arrested by loss of water and small granitic segregations can be formed ( Bose, 1997). Niggli c vs mg variation diagram ( Fig. 4 ) is very useful in identification of the primary source material, which underwent partial melting, followed by melt segregation and finally emplacement at shallower levels with distinct magmatic signatures. The compositional points are placed within the pelitic and semipelitic field, thus indications are that the metapelites of the area had their contributions, if not entirely, at least substantially, in the generation of granitic melt. Occasional presence of enclaves of biotite schist in the granitic country further establishes its lineage to metapelites.
One of the most popular classifications used in recent studies is the I- and S- type granitoid classification. These two contrasting granite types have been recognized by Chappell and White ( 1974) and White and Chappell (1977) in the plutonic rocks of southeastern Australia. They proposed a genetic subdivision of the granitic rocks into those derived from igneous source rocks as I – type and those extracted from sedimentary protoliths as S – type.
Chappell and White (1974) proposed several chemical parameters to distinguish S-type and I- type granites. I-type granites have Al2O3 / (Na2O+ K2O K2O+CaO) ratio less than 1.1 while S-type have more than 1.1. The granitic rocks of the present area are peraluminous; its average value has been found to be 1.42, an indication towards the S-type affinity for them. CaO percentage in S-type should be less than 3.7 wt%. the average value of CaO for these granites is 1.66, supporting the pelitic parentage for these granites.
The distribution behavior of certain trace elements has proved its efficacy in the distinction of I- / S- type granites. Cr, Co and Zr are present in higher amounts in S-type varieties. In such granites, their amount should be more than 45, 16 and 15 ppm

SJIF Impact Factor 2021: 8.013| ISI I.F.Value:1.241| Journal DOI: 10.36713/epra2016 ISSN: 2455-7838(Online)
EPRA International Journal of Research and Development (IJRD) Volume: 6 | Issue: 8 | August 2021 - Peer Reviewed Journal
2021 EPRA IJRD | Journal DOI: https://doi.org/10.36713/epra2016 | www.eprajournals.com |84 |
respectively. The average value of Cr, Co and Zr for the granites of study area has been found to be 371.95, 92.81 and 162.48 respectively. It gives the indication that these granites owe their origin the metapelites.
Chappell and White suggest that S-type granites are restricted in composition to high SiO2 types, while I-type granites have a wide composition from felsic to mafic. These characteristics are a consequence of S-type granites having been derived from a more SiO2 rich source. Therefore granitoids containing less than 65% SiO2 can assumed to be I-type. This is consistent with the work done by Hine et.al. (1978). The average value of SiO2 for granites of the study area is more than 70%, thus matching with the standards of S-type granites.
S-type affiliation of these granites is further cemented with the help of FeO – Fe2O3 (Fig. 5 8.31) and Na2O vs K2O ( Fig. 6 .32) variation diagrams. The compositional points religiously occupy the field assigned for S-type granites.
CONCLUSION
The granitic rocks are the most widely distributed lithounits in the area. The granites appear younger than the older metasedimentaries, as they are intrusive into them, a feature observed at many places. The granitic rocks of the study area consist of different variants and they differ in colour, texture, structure, mineral composition and field association. Broadly two types of granites have been identified, viz., the strongly to weakly foliated and lineated types and the massive, equigranular and crystalline varieties.
A careful scan of the various chemical components and their behavior has clearly indicated towards the contribution of pelitic schists in the generation of anatectic melt, which formed granites in the area. S-type parentage of these granites has also been established on the basis of distribution behavior of certain trace elements like Cr, Co and Zr. S-type
affiliation of the granites of the present area has been further cemented with the help of several well established binary and ternary variation diagrams.
An amalgamation of all these observations is a clear indication towards the contribution of pelitic schists in the generation of anatectic melt, which formed granites in the Lodhma area. REFERENCES
1. Bhattachrya V., 1980, The Gariadih Rapakivi Granite of the Bihar Mica Belt, Hazaribag Dist., Bihar, J. Geol. Soc. Ind., 21, pp. 21-29.
2. Bose M K.1997 Igneous Petrology. The world press pvt Ltd. Cal. 568 p.
3. Chapell B.W. and White A.J.R., 1983; Granitoid types and their distribution in the Lachlan fold belt, S.E. Australia, Mem. Geol. Soc. Amer., 159, 21p
4. Chatterjee S. C., 1974, Petrography of Igneous and Metamorphic Rocks. McMillian India.
5. Ghose N C. 1983, Geology, Tectonic and Evolution of Chotanagpur Granite Gneiss Complex ,Eastern India; Structure and Tectonic of Precambrian rocks of India; Hind publcorp, 10 pp,-211-247.
6. Le Bas M J and Streckeisen A L. 1991. The I UG S Systematics of Igneous rocks. ;jour .Geol.Soc.London. 148 pp. 825-833.
7. Mehnert K.R., 1968, Migmatites and the origin of Granitic rocks, Elsevier, Amsterdom, 392 p.
8. Sarkar A N and Jha B N. 1985. Structure, Metamorphism and Granitic Evolution of the Chotanagpur Gneiss Complex around Ranchi. Rec. Geol . Surv.ind. 113(III) pp.1-12.
9. Singh S.P., 1981, Petrochemistry of the Granitic and associated rocks of the region north of Latehar, Dist. Palamau, Bihar, Ph.D. Thesis, R.U. (unpub)

SJIF Impact Factor 2021: 8.013| ISI I.F.Value:1.241| Journal DOI: 10.36713/epra2016 ISSN: 2455-7838(Online)
EPRA International Journal of Research and Development (IJRD) Volume: 6 | Issue: 8 | August 2021 - Peer Reviewed Journal
2021 EPRA IJRD | Journal DOI: https://doi.org/10.36713/epra2016 | www.eprajournals.com |85 |

SJIF Impact Factor 2021: 8.013| ISI I.F.Value:1.241| Journal DOI: 10.36713/epra2016 ISSN: 2455-7838(Online)
EPRA International Journal of Research and Development (IJRD) Volume: 6 | Issue: 8 | August 2021 - Peer Reviewed Journal
2021 EPRA IJRD | Journal DOI: https://doi.org/10.36713/epra2016 | www.eprajournals.com |86 |

SJIF Impact Factor 2021: 8.013| ISI I.F.Value:1.241| Journal DOI: 10.36713/epra2016 ISSN: 2455-7838(Online)
EPRA International Journal of Research and Development (IJRD) Volume: 6 | Issue: 8 | August 2021 - Peer Reviewed Journal
2021 EPRA IJRD | Journal DOI: https://doi.org/10.36713/epra2016 | www.eprajournals.com |87 |

SJIF Impact Factor 2021: 8.013| ISI I.F.Value:1.241| Journal DOI: 10.36713/epra2016 ISSN: 2455-7838(Online)
EPRA International Journal of Research and Development (IJRD) Volume: 6 | Issue: 8 | August 2021 - Peer Reviewed Journal
2021 EPRA IJRD | Journal DOI: https://doi.org/10.36713/epra2016 | www.eprajournals.com |88 |

SJIF Impact Factor 2021: 8.013| ISI I.F.Value:1.241| Journal DOI: 10.36713/epra2016 ISSN: 2455-7838(Online)
EPRA International Journal of Research and Development (IJRD) Volume: 6 | Issue: 8 | August 2021 - Peer Reviewed Journal
2021 EPRA IJRD | Journal DOI: https://doi.org/10.36713/epra2016 | www.eprajournals.com |89 |

SJIF Impact Factor 2021: 8.013| ISI I.F.Value:1.241| Journal DOI: 10.36713/epra2016 ISSN: 2455-7838(Online)
EPRA International Journal of Research and Development (IJRD) Volume: 6 | Issue: 8 | August 2021 - Peer Reviewed Journal
2021 EPRA IJRD | Journal DOI: https://doi.org/10.36713/epra2016 | www.eprajournals.com |90 |
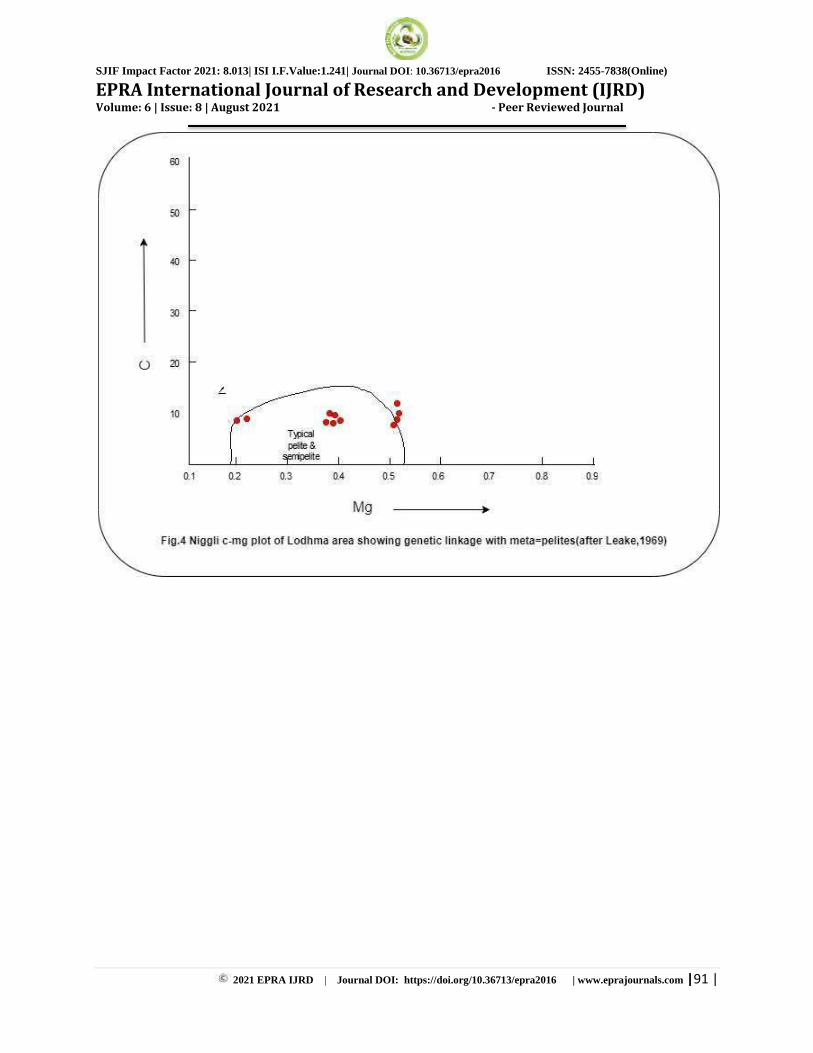
SJIF Impact Factor 2021: 8.013| ISI I.F.Value:1.241| Journal DOI: 10.36713/epra2016 ISSN: 2455-7838(Online)
EPRA International Journal of Research and Development (IJRD) Volume: 6 | Issue: 8 | August 2021 - Peer Reviewed Journal
2021 EPRA IJRD | Journal DOI: https://doi.org/10.36713/epra2016 | www.eprajournals.com |91 |
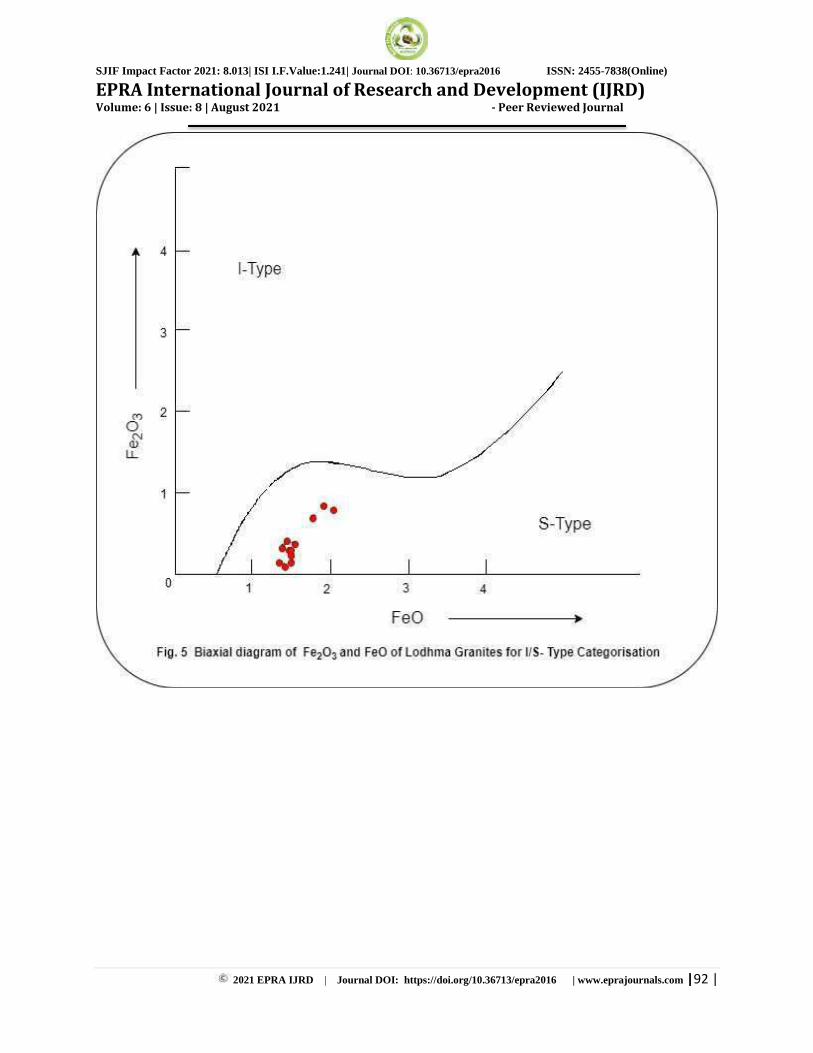
SJIF Impact Factor 2021: 8.013| ISI I.F.Value:1.241| Journal DOI: 10.36713/epra2016 ISSN: 2455-7838(Online)
EPRA International Journal of Research and Development (IJRD) Volume: 6 | Issue: 8 | August 2021 - Peer Reviewed Journal
2021 EPRA IJRD | Journal DOI: https://doi.org/10.36713/epra2016 | www.eprajournals.com |92 |

SJIF Impact Factor 2021: 8.013| ISI I.F.Value:1.241| Journal DOI: 10.36713/epra2016 ISSN: 2455-7838(Online)
EPRA International Journal of Research and Development (IJRD) Volume: 6 | Issue: 8 | August 2021 - Peer Reviewed Journal
2021 EPRA IJRD | Journal DOI: https://doi.org/10.36713/epra2016 | www.eprajournals.com |93 |

SJIF Impact Factor 2021: 8.013| ISI I.F.Value:1.241| Journal DOI: 10.36713/epra2016 ISSN: 2455-7838(Online)
EPRA International Journal of Research and Development (IJRD) Volume: 6 | Issue: 8 | August 2021 - Peer Reviewed Journal
2021 EPRA IJRD | Journal DOI: https://doi.org/10.36713/epra2016 | www.eprajournals.com |94 |
RURAL HAND BLOCK PRINT FABRICS IN INDIA: INTRODUCTORY REVIEW BASED STUDY
Dr. Hitaishi Singh
Associate Professor, Department of Home Science, A.N.D.N.N.M.M. Kanpur
ABSTRACT Real India lives in the rural areas. Indian civilization is considered as one of the oldest civilizations in the world
inherited with colorful diversity, rich culture and variety of handicraft prepared by rural artisans since ages
(Kumar &Kaptan, 2006). Handloom and handicraft sectors are the major source of income for rural people after
agriculture sector in India. Fabrics or clothes are one of the basic needs of civilized society. Rural India is rich in
producing handicrafts and handloom items in a traditional manner without use of any machinery. Hand block
printing is one of the important handicraft arts practiced in various parts of India.
INTRODUCTION In past, natural or vegetable colors were used in both dyeing and printing which are replaced by synthetic and artificial color dyes. The demand for hand block printed fabrics is because of its aesthetics, design pattern and use of vegetable colors in both printing and dying but today chemical color is also used to dye and print fabrics. In past yellow, red, blue and black colors were mainly used but today with the advent of chemical colors a large variety of colors are used in both printing and dyeing. History of hand block printing in India is 800 years old when it was practiced in various places in east, west, and southern parts. A few of the evidences show that it was in existence 4000 years ago as a trade link in between India and Babylon. Later on hand printed and hand woven fabrics traveled to Malaya, Indonesia and other eastern countries. During seventeenth century Surat became a major hand block printed fabrics exporting hub in India. Today at few of the places it is still alive and practiced by traditional artisans. In eastern part “Kalam” (Pen) is used to print the fabrics
and resist technique is used. A process of dyeing and printing with the use of wooden blocks developed in Gujarat and Rajasthan during medieval period mainly.
Hand block printing in India is in use since ancient times but during 12th century hand block printing prospered in India with the backing of royal families. Although in the beginning it flourished in the southern parts but gradually it spread all over India. In the early age Gujarat and Andhra Pradesh were two major centers for hand block printing work.
In the beginning of 18th century,Sanganer emerged as the major center in Rajasthan for hand block printing and another center Serampur emerged in West Bengal during 1940. Soon urban centers like Calcutta in West Bengal and Jaipur in Rajasthan also emerged as prominent centers. Today hand block printing is practiced mainly in rural and town areas of Rajasthan, Gujarat and Madhya Pradesh states of India. Presently Bagru and Sanganer in Rajasthan, Bagh in Madhya Pradesh and Kutch region in Gujarat have emerged as important centers for hand block printing in India.
REVIEW BASED RESULT There are various kinds of hand block printing techniques used to print fabrics across geographical areas in India. Mainly three different techniques are used for hand block printing are there: 1. Discharge Printing: In this technique fabric is dyed first with the chosen color. Once dyeing process is completed, we remove the dye from those areas which need to be printed with the chemical color. Printed portion is treated to re-color and discharge process is completed. 2. Direct Block Printing: Any cotton or silk fabric can be used in this process. First the fabric is bleached to create a white background then it is dyed with the chosen color. Border is printed first and then printing is done inside the border of the fabric. 3. Resist Printing: Under this technique the portion which does not need notto be dyed is covered with the mixture of clay, lime stone powder and resin. Then fabric is dyed in the chosen color which slightly

SJIF Impact Factor 2021: 8.013| ISI I.F.Value:1.241| Journal DOI: 10.36713/epra2016 ISSN: 2455-7838(Online)
EPRA International Journal of Research and Development (IJRD) Volume: 6 | Issue: 8 | August 2021 - Peer Reviewed Journal
2021 EPRA IJRD | Journal DOI: https://doi.org/10.36713/epra2016 | www.eprajournals.com |95 |
enters through the cracks and creates a curly effect of color on the fabric. Now at the final stage fabric block is printed with the desired design. INTRODUCTION TO RURAL INDIA
As per the latest census conducted in the year 2011, approximately 60-69% of the total population still lives in the rural areas in more than 6 lakh villages. It shows the importance of rural areas in India though urbanization of India is happening at a very fast growth rate still a large section of its population lives in rural areas.
This large rural population involved mainly in agriculture and traditional rural industries like handloom, handicrafts and others to earn their livelihood. Rural areas or villages are very important for the growth of Indian economy. On the importance of village once Mahatma Gandhi had said that “If the
village perishes, India will perish, too. It will be no more India. Her own mission in the world will get lost. The revival of the village is possible only when it is no more exploited”. Seeing rural as a potential market will ruin the economy in long run it must also be seen as a home of traditional rural industry for sustainability of the Indian economy. After agriculture; handloom and handicraft are the two most important rural non-farm industries in rural India. These two industries are providing maximum employment and source of income for rural population after agriculture.
“Rural” word is interchangeably used with the terms like rural society, village, countryside or folk society. The most common word used in sociology for “rural” is “village”. In defining rural areas the basic unit used by Indian administration is known as revenue village, which may contain some hamlets drawn by physical borders. There is no standard definition used to define the term „rural‟. There are
few government departments, agencies and private organizations which defined the term rural as per their understandings, experience and scope of work.
a) Rural Industries Indian economy is based on the primary sector i.e. agriculture which is considered to be a major rural economic activity. More than 70% rural population is dependent on the agriculture business but non-farm sector is also emerging in the rural India. There is a huge scope to promote rural industries for the overall development of villages and for the growth of Indian economy as a whole. Apart from agriculture rural industries like handloom, rural arts and crafts play a very important role in providing employment and as a source of their livelihood (Rao, 1978). Khadi and village industries contributed significantly in the growth of rural people by adding economic value in their life. In general terms rural industry can be defined as any industry established in the rural areas known as rural
industry. There are few government institutions dedicated to the development of rural enterprises defined rural industries in a proper way. Rao (1987) discussed that apart from agriculture rural arts and crafts provide the productive employment and opportunity to earn. Rural industry is also interchangeably used as cottage industry and village industry. KVIC defines rural industry as “any
industry located in rural areas which produces any goods or renders any service with or without the use of power and in which the fix capital investment per head of artisan or worker does not exceed Rs. 50000 or such other sum as may be specified by central government from time to time”.
b) Handicraft in India An Overview Handicraft and handloom is considered as one of the traditional product found generally in rural areas and represents culture of a specific area. It is also deeply rooted with traditions and there are many areas in the country where people are involved in the handloom and handicraft business since generations. The simple meaning of handicraft is any craft or art made with using bare hands or minimal tools without using any mechanical machine. International Labor Organization (ILO) recognized handicrafts as an important activity to earn livelihood through utilization of indigenous available resources, using traditional knowledge and technology, labor intensive and unorganized yet competitive market. In the year 1989 Development Commissioner (Handicrafts) of India gave a definition for handicrafts is “Items made by hand,
often with the use of simple tools, and generally artistic and/or traditional in nature. They include objects of utility and objects of decoration.” Export
of handicraft is one of the important sectors to earn foreign exchange needed for the growth of the country’s economy. With keeping in the mind potential of handicrafts to earn foreign exchange for India ministry of commerce & industry selected it in the export items and kept it under the first five year plan to promote its production. Since then Indian handmade sector is growing at a moderate speed. In the year 2000 estimated exports of handicraft goes up to US$ 2000 million and domestic market stands for US$ 4000.
c) Hand block printing in India India is very rich in both culture and handicrafts. Hand block printing is one of the most important sectors under handicraft industry. History of hand block printing is very old and due to unavailability of authentic documents it is not easy to reveal the exact time of its origin but few researches suggested that it is 4000 years old. Skidmore (2014) suggested that during 300 AD hand block prints of Rajasthan origin found in Palmyra town of Syria. Gillow (2010) mentioned in his book on hand block printing that some pieces of mordant dyed and printed cotton
SJIF Impact Factor 2021: 8.013| ISI I.F.Value:1.241| Journal DOI: 10.36713/epra2016 ISSN: 2455-7838(Online)
EPRA International Journal of Research and Development (IJRD) Volume: 6 | Issue: 8 | August 2021 - Peer Reviewed Journal
2021 EPRA IJRD | Journal DOI: https://doi.org/10.36713/epra2016 | www.eprajournals.com |96 |
found in Mohenjo-Daro of today‟s Pakistan which is
4000 years old. According to the documentation of AIACA (All Indian Artisan & Crafts Association) the art of hand block printing started during twelfth century in different parts of India. This art of hand block printing was supported well by Kings and royal family. At that time itspreadin various centers of western, south and eastern parts of the country. These centers were very famous for their quality printing techniques on the cotton. In southern part kalam (pen) or brush used to print the cotton clothes using resist dyeing technique. Wooden blocks commonly used in Gujarat for printing fabrics and in Rajasthan art of hand block printing and dyeing specially developed for cotton textiles.
d) Hand block printing v/s Screen printing Hand block printing is very old and traditional way of printing fabrics using hand blocks continuously followed by various generations of Chippa community in several parts of rural India. Chippas are still following the natural and traditional techniques to produce designed fabrics in Bagh village (Madhya Pradesh), Bagru and Barmer village (Rajasthan) and Kutch region of Gujarat. Hand block printing requires intensive labor work because it involves manual techniques in production. Screen printing came into practice after industrial revolution took place but in it started flourishing just after independence. Nandi & Chaudhary (2009) stated that screen printers in Sanganer flourished during 1960s using not only chemical colors, mechanized production processes, consuming more water than traditional hand block printers but also polluting river and ground water. As per the UNIDO (1997) report the uneven competition and rivalry among screen printing units and hand block printing units is increasing day by day is a matter of concern because both have their distinct qualities. While traditional hand block printers are using traditional designs and natural color dyes on the other hand screen printers are using chemical dyes and copying the designs of hand block printers is a matter of concern. Screen printed fabric is a low cost product as comparison to hand block printed fabrics. Screen printing is known for mass production and hand block printing is production by masses. CONCLUSION Dhar and Lydall defined “cottage industries are mainly traditional industries which produce traditional goods with the traditional techniques”.
Expert consultation in Rome in the year 1986, distinguished cottage activities, village enterprises and rural industries in terms of location, ownership, scale and organization of business mainly. In Indian perspective to extend the scope of rural industry government of India defined it as “Any industry
located in rural area, village or town with a
population of 20000 and below and an investment of Rs. 3 crore in plant and machinery is classified as village industry”. Considering all the definitions
above and with reference to present study, rural industries can be defined as any traditional or non-traditional business establishment in rural area with a population less than 25000 and below and provide scope for production by masses. Mainly rural economy is divided into two types of industries one is agriculture or farm industry and other is non-farm activities. According to government of India economic activities divided into three major sectors primary sector includes agriculture and allied activities like pisciculture, poultry, floriculture, sericulture and forestry. Secondary sector includes manufacturing and mining activities and tertiary sector includes financial, community, transport and other services. Rogerson (2000) discussed the importance of rural handicrafts for South Africa as a non-agriculture industry which not only provides employment but also provides livelihood to many people in the country. Soundarapandian (2010) discussed and emphasized on the textile, bakery, poultry, plastic conversion, handmade paper and village oil industry under the entrepreneurship and industries potential in rural areas. Joshi (2013) discussed the various types of rural industries and emphasized on the scope of rural industrialization in agro based, forest,mineral, animal dairy, renewable energy and traditional industries in rural areas. On the other side Handicraft sector is one of the most important sectors for Indian economy. It provides employment to maximum rural people after agriculture sector. More than 78% of the handicraft units and more than 76% of the artisans belongs to rural parts of India1 . It shows the importance of handicraft sector for rural economy. Out of total production of handicrafts in India 60% exported to different parts of the world and rest 40% sold in the domestic market. Statistics shows that handicraft artisan rises from 6.57 million in the year 2005-06 to 6.8 million in the year 2011-12. India is known for its handloom and handicrafts and it is one of the most important industries after agriculture sector providing maximum number of employment to rural population. Both handloom and handicraft sectors as a unit is the largest non-farm employment generation activity in the rural areas. Steering Committee on Handlooms and Handicrafts (2012) referred the handloom census conducted in the year 2009-10 there are 2.873 million handloom units cum households working in which 87% are situated in rural areas. These total handloom units are providing employment to more than 4.3 million weavers and allied workers. The same study shows that total artisansare 6.8 million in the year 2011-12 working in the handicraft sector.

SJIF Impact Factor 2021: 8.013| ISI I.F.Value:1.241| Journal DOI: 10.36713/epra2016 ISSN: 2455-7838(Online)
EPRA International Journal of Research and Development (IJRD) Volume: 6 | Issue: 8 | August 2021 - Peer Reviewed Journal
2021 EPRA IJRD | Journal DOI: https://doi.org/10.36713/epra2016 | www.eprajournals.com |97 |
REFERENCES
1. Gillow, J. (2010). Textiles of the Islamic World. London: Thames and Hudson.
2. Joshi, H., Srivastava, R.K. (2011). Capturing Rural Market with Customization of Marketing Mix.Asian Journal of Technology & Management Research, 1(2)
3. Joshi, P. (2014, February 15). Huge potential lies in domestic market. Money Mantra, 21-22.
4. Kumar R.C., Kaptan, S.S. (2006). Rural India Myth and Reality. New Delhi: Adhyayan Publishers & Distributors.
5. Nandi, R., Chaudhary, B. (2009). Rapid Assessment Study of the Impact of the Financial and Economic Slowdown on the Handicraft Industry in Sanganer, Rajasthan.Institute of Social Studies Trust: New Delhi
6. Rao, R.V. (1978). Rural Industrialization. New Delhi: Concept Publishing Company.
7. Rao, R.V. (1987). Rural Industrialisation in India. New Delhi: Concept Publishing House.
8. Report of the Steering Committee on Handlooms and Handicrafts Constituted for the Twelfth Five Year Plan (2012). Planning Commission. Retrieved from http://planningcommission.gov.in/aboutus/committee/strgrp12/str_handloom0305.pdf
9. Retrieved from http://www.indianartisansonline.com/artisan/subscribe
10. Retrieved from www.thehindubusinessline.com/life/2003/12/15/stories/2003121500020100.htm
11. Rogerson, C.M. (2000). Rural Handicraft Production in the Developing World: Policy Issues for South Africa. Agrekon: Agricultural Economics Research, Policy and Practice in Southern Africa. 39 (2), 193-217.
12. Rogerson, C.M. (2010). Rural Handicraft Production in The Developing World: Policy Issues with South Africa. Agrekon: Agricultural Economics Research, Policy and Practice in Southern Africa, 39 (2), 193-217.
13. Skidmore, S. (2014).Hand Blockopedia A Beginner’s Guide. Jaipur: AMHP Publications.
14. Soundarapandian, M. (Ed.).(2010). Rural Entrepreneurship Growth and Potentials. New Delhi: Kanishka Publishers.

SJIF Impact Factor 2021: 8.013| ISI I.F.Value:1.241| Journal DOI: 10.36713/epra2016 ISSN: 2455-7838(Online)
EPRA International Journal of Research and Development (IJRD) Volume: 6 | Issue: 8 | August 2021 - Peer Reviewed Journal
2021 EPRA IJRD | Journal DOI: https://doi.org/10.36713/epra2016 | www.eprajournals.com |98 |
AWARENESS TOWARDS SOCIAL ENTREPRENEURSHIP: A QUALITATIVE STUDY IN
DAKSHINA KANNADA DISTRICT, KARNATAKA
Vinyas .H1, Dr. Uday Kumar M.A.2
1Research Scholar, Department of Post Graduate Studies in Commerce and Research, Mangalore University, Mangalagangothri-574199
2Associate Professor, University College, Mangalore - 575001.
ABSTRACT
The aim of social entrepreneurship is business for a social cause. It is a combination of social service and
entrepreneurship. The concept of social entrepreneurship came in to force in the academic world of late 1990s in
united states. It has a mission of solving social problems. Social entrepreneurship is successful in terms of not the
large profits, but in the immeasurable social impacts. There are more benefits from social entrepreneurship for
removal of poverty, solution for unemployment, development of agriculture sector and positively impact on society.
It is one of the concepts of philanthropy, includes innovativeness in treating social problems and innovating
entrepreneurial practice are the main characteristics of social entrepreneurship. In this scenario social
entrepreneurship has been receiving greater recognition from the public (S.Bacq and F.Janseen 2011). Social
entrepreneurship focuses on long term capacity rather than short-term financial gains and has an explicit and
social mission, whereas commercial ventures has a mission of profit. This paper explains how the people perceives
the concept of social entrepreneurship.
KEY WORDS: Social- Entrepreneurship-Service-People
1. INTRODUCTION Social entrepreneurship is one such innovative idea of self-sustaining business model that aims to address the issue of revenue generation for survival and development in the long run. Social enterprises identify issues and build a business model to meet the unmet needs of the people. At this situation, social enterprises focus on innovations and building social arrangements that lead to solving social and economic problems. Social Entrepreneurship is commonly defined as an entrepreneurial activity based on certain social reasons. Some of the remarkable examples of social entrepreneurship have originated in developing countries and it is a vibrant concept in developing countries as well. It is best understood as a multidimensional and active constructed, moving across various inter section points between the private, public and social sectors. The innovative solutions to local problems confirmed by the social entrepreneurs in a local circumstance often have profound socio-economic implications and global significance. So social entrepreneurship is a process by which citizens build or transform institutions to advance solutions to social problems,
such as poverty, illness, illiteracy, environmental destruction, human rights abuses and corruption.
Many people use the terms social innovation and social entrepreneurship synonymously, but it has different connotations. Social innovation focuses more on what is being implemented, like a new technology or new process, to create impact. Social entrepreneurship focuses more on how it is being implemented, with a business approach or leveraging a unique business model to create, grow, and scale both in terms of impact and revenue. Today all social enterprises are giving service to the society. When they are going to give service to the society they need human and non- human resources, because the quality of services is dependent on these resources. Today many social enterprises accept financial, technical assistance and moral support from the state. At the same time social enterprise organizations put commercial strategies to maximize the human and environmental well-being. It means maximizing social impact and profit for external shareholders. Social enterprises might be established for a profit or non-profit but main intension of these institutions are providing service.

SJIF Impact Factor 2021: 8.013| ISI I.F.Value:1.241| Journal DOI: 10.36713/epra2016 ISSN: 2455-7838(Online)
EPRA International Journal of Research and Development (IJRD) Volume: 6 | Issue: 8 | August 2021 - Peer Reviewed Journal
2021 EPRA IJRD | Journal DOI: https://doi.org/10.36713/epra2016 | www.eprajournals.com |99 |
Social enterprises commonly attempt to solve the social, cultural and environmental problems in all over the world. After 2010 social entrepreneurship is made easy by the use of social media and social networks. These are helpful to social entrepreneurs to reach a large number of people all over the place. Social entrepreneurship in modern society offers a noble form of entrepreneurship that focuses on the benefits that society may obtain. Social entrepreneurs not only recognize immediate social problems but also seek to understand the broader context of an issue across disciplines, fields, and theories. Social enterprise can be characterized by an open membership and goals widely considered to be in the community or public interest. Today society allows social entrepreneurs to develop innovative solutions and mobilize available resources to affect the greater global society. So, social entrepreneurship is commonly defined as an entrepreneurial activity based on certain social reasons. Social entrepreneurship has the power to impact on economic system as it creates solution to social problems and leads the beneficiaries to a better standard of life. Social entrepreneurs have something in common with business entrepreneurs, but there are some significant differences between these two activities. Their goals, visions, missions and their methods are different. The social entrepreneurs measure their success primarily in terms of socially valued creations, rather than profits. Social enterprises will help in the betterment of society as well as nation. 2. REVIEW OF LITERATURE The review of literature gives a view of the existing information of the area. Social entrepreneurship is a reproduction that has been gaining energy and taking in recent years as an answer to social problems on a global level.
Covin and Slevin (1991) explain that, “Entrepreneurship as an aspect of organization strategy which is interpreted by dynamic behavior, risk taking, tendency for aggressive competition and dependence of an organization on the regular and widespread use of innovative product. Gregory Dees (1998) has observed that, social entrepreneur is widely appreciated and social entrepreneurs play the role of change agents in the social sector, by adopting a mission to create and uphold social values. R. Duane Ireland, Michael A.Hitt, S. Michael Camp and Donald L. Sexton (2001)observe that,
entrepreneurship and strategic management have to create wealth in a society. This is an important part of social enterprise activities. Naumes M, KammermeyerJ&Naumes W (2002) explain social entrepreneur is a person with a set of social goals and objectives who make operations of these objectives through entrepreneurial activities.
Jerr Boschee and Jim McClurg (2003) define, a social entrepreneur is any person who uses earned income strategies to pursue a social mission. This earned income strategy is directly linked to the mission and they employ people who are physically, mentally, socially or economically disabled. Jeff Skoll (2009) explains about the impact created by social entrepreneurs. He also highlighted the challenges which need increased attention, in spite of the efforts made by social entrepreneurs. He focused on responding quickly to events that threaten the world’s health and stability. Anne S. Fischer (2011) explains that entrepreneurship is a multi-disciplinary field drawing from the fields of entrepreneurship and social sector. Samiksha Jain (2016) clearly explains that, entrepreneur is an individual with innovative solutions to most of the society’s problems. She focused on the issue to tackle social problems by offering new ideas to bring about large-scale changes in the society.
So, there are a lot of advantages from social enterprises because entrepreneurial activities with a social concern establishes and manages the social development of the society. Above reviews show that social entrepreneurship is a novel, highly- motivated and vital thinking process. This is very supportive to solve the social problems. Development is a pattern of resources that aims to meet human needs while preserving the environment. Therefore, social entrepreneurship is working for meeting the needs of the society without compromise. 3. RESEARCH METHODOLOGY OF THE STUDY The study is based on the both primary and secondary data. This study is a qualitative research, based on a survey of people in Dakshina Kannada district, Karnataka and the secondary data has been collected through various sources. It includes journals and websites. The random sampling method is followed. A total of 300 people participated in this study, provided answers on social enterprises.
Table: 1 Gender Profile of Respondents
Gender Amount Men 154 (51.3%)
Women 146 (48.7%) Total 300 (100%)

SJIF Impact Factor 2021: 8.013| ISI I.F.Value:1.241| Journal DOI: 10.36713/epra2016 ISSN: 2455-7838(Online)
EPRA International Journal of Research and Development (IJRD) Volume: 6 | Issue: 8 | August 2021 - Peer Reviewed Journal
2021 EPRA IJRD | Journal DOI: https://doi.org/10.36713/epra2016 | www.eprajournals.com |100 |
The table presents that respondents are predominately 51.3% of men and 48.7% of women.
Table: 2. Age Profile of the Respondents Age Amount
less than 20 27 (9%) 20-40 261 (87%) 40-60 11 (3.7%)
more than 60 01 (.3%) Total 300 (100%)
The respondents are largely belongs to the age group of 20-40 years (87%) and followed by less than 20 years (9%) age group. Rest of respondents are from
the 40-60(3.7%) age group and only one person from more than 60-year-old.
Table: 3. Education Profile of the Respondents
Education Amount Illiterate 0 (0%)
Primary Education 9 (3%) Intermediate Education 24 (8%) Graduation and above 267 (89%)
Total 300 (100%) Above table shows that 89% of respondents have graduation and above qualifications, followed by the intermediate education holders 24%, primary
education holders 3% and no illiterate people participated in this survey.
Table: 4 Occupation Profile of the Respondents. Occupation Amount Wage earner 11 (3.7%) Agriculture 10 (3.3%)
Own business 10 (3.3%) Employee 146 (48.66%) Student 123 (41%) Total 300(100%)
The above table shows that 48.66% of respondents are employees, 41 % are students and 3.7% wage earners, were 3.3% agriculturists and 3.3% are have own business. 4. RESULTS This research paper clearly shows the understanding among Dakshina Kannada (South Canara) people
about social enterprise. The question “Are you aware
of the concept of social entrepreneurship?” the
empirical data provides that only 28.3% of people are aware of social entrepreneurship. Remaining 61.7% of people are partially aware of the concept of social entrepreneurship. While the rest 10% of people are not aware of the concept.
Table-5 Respondents Answer Answer Amount
Fully Aware 85 (28.3%) Partially Aware 185(61.7%)
Not Aware 30(10%) Total 300(100%)
5. LIMITATIONS OF THE STUDY 1. This study is limited to Dakshina Kannada only. 2. Only 300 people participated in this survey. 3. Limited period. 4. Lack of data and literature on the topic of study relevant to the region. 5. Defects in primary data collection.
6. FINDINGS Today improving the wellbeing of society is
ultimately leads to development of the economy, so social entrepreneurs are trying to provide benefits to society. For this purpose, social enterprises are undertaking some major activities under different names, qualities and doing socially beneficial programs. Social entrepreneurship has gained

SJIF Impact Factor 2021: 8.013| ISI I.F.Value:1.241| Journal DOI: 10.36713/epra2016 ISSN: 2455-7838(Online)
EPRA International Journal of Research and Development (IJRD) Volume: 6 | Issue: 8 | August 2021 - Peer Reviewed Journal
2021 EPRA IJRD | Journal DOI: https://doi.org/10.36713/epra2016 | www.eprajournals.com |101 |
significant momentum in recent years as more and more entrepreneurs look to make a positive difference and bring about meaningful change in the world while simultaneously generating profits to sustain their businesses. Apart from above benefits, as per the study of Thomas Reuters, reveals that India ranks 34th in public understanding what social entrepreneurs do. My study reveals that 61.7% of the people in Dakshina Kannada partially know about social enterprise, 28.3% of the people are fully aware and rest of the 10% people are unaware of the concept. One interesting factor is that educationally Dakshina Kannada district is the top most district in Karnataka state and literacy rate is 88.57 percentage as per the census of 2011.
This study finds that, most of the participants are graduates and post graduates, but still they are partially aware of the concept of social entrepreneurship. They have been hearing the term social entrepreneurship, but they don’t know exactly
what social entrepreneurship is. The lack of awareness on what social entrepreneurship is common among people. This lack of knowledge frequently causes social enterprises to be ignored when they are looking to raise capital through debt funding and investments from public.
Another thing is that, people are getting benefit from social entrepreneurship, but they are not trying to understand the concept because of the complex nature of business. Social enterprises are inherently complex and many in a government and financial system fail to adequately understand them.
Lack of success stories of Social entrepreneurship is the main reason for ignorance of the concept. The nature and philosophy of a social enterprise, it is practically difficult to understand.
Poor attraction for talent is additional reason for unconscious. Indian social entrepreneurs also find it difficult to attract qualified staff, who often view working for a social enterprise as riskier and less well-paying compared to old organizations. Most social entrepreneurs are high excellence talent themselves, but there are virtually no social enterprises hiring young professionals from campuses and thus many are not aware of the sector.
7. SUGGESTION
In a country like India, which is tackling issues like poverty, unemployment, lack of adequate health and sanitation facilities. So, a strong brand presence, affordable products, strong distribution network and cohesive efforts of different sectors of an economy are the biggest driving factors for businesses in a social entrepreneurship. In addition to providing solutions for unemployment and poverty, a social enterprise also creates value for society. However, to encourage more young
people to adopt this approach, there needs to be a proper structure in place. A social entrepreneur has an important role as the backbone of the national economy, especially those who had received education and training (Nilsson 2012). Social entrepreneurship is the powerful tool for the development of economy. Thus, it is very important to teach entrepreneurship at all educational level and government should conduct awareness programs about social entrepreneurship towards people. Educational institution as expected to explore the concept and create an awareness of social entrepreneurship.
So, it is very important to make a distinction between the nature of work and the objectives of a social enterprise and a commercial venture. A social enterprise does not begin by setting up computers in a room. It begins journey in the field around a social problem. It possesses a single attitude of creating sustained social impact while making profits. This often involves difficult yet innovative choices towards operating its business. As compared to a commercial venture, a social enterprise measures its performance on people, planet and profit.
We can’t do anything with folded hands and empty mind. So, it is essential to undertake serious program about the concept. Today most of the technologies are available in this global world, and we should use properly. In that social media is one of the most powerful tool, as a social entrepreneurs ought to use this tool for the creation of awareness among the people about the concept social entrepreneurship not only in Dakshina Kannada but also in whole world.
CONCLUSION Social entrepreneurship is a part of entrepreneurship which came into existence to make changes in society. It is very different from general entrepreneurship that focuses on creating new values and gaining profit. Social entrepreneurship not only recognizes immediate social problems but also seeks solution to those problems. General awareness about social entrepreneurship is very poor in India. Complex nature of business, lack of success stories and failure to poor attraction of talent are some of the main reasons for this. However, the conditions are favourable for social entrepreneurs to start and grow. The result of this survey reveals that only about 28.3% of people know about social entrepreneurship. So, it is very important to formally differentiate the concept of commercial and social entrepreneur, their objectives, impact and work done in the people mind.

SJIF Impact Factor 2021: 8.013| ISI I.F.Value:1.241| Journal DOI: 10.36713/epra2016 ISSN: 2455-7838(Online)
EPRA International Journal of Research and Development (IJRD) Volume: 6 | Issue: 8 | August 2021 - Peer Reviewed Journal
2021 EPRA IJRD | Journal DOI: https://doi.org/10.36713/epra2016 | www.eprajournals.com |102 |
REFERENCE 1. David Bornstein and Susan Davis:“Social
Entrepreneurship what everyone needs to know” 2. https://www.researchgate.net/publication/272561
624_Entrepreneurship_in_Organisations_Evidence_From_the_Popular_Music_Industry.
3. BURGELMAN, Robert A. (1983): "A Model of the Interaction of Strategic Behavior, Corporate Co.
4. Dennis R. Young (1986) “strategic planning in
national associations. 5. https://en.wikipedia.org/wiki/Sustainable
development. 6. Next, and the Concept of Strategy", Academy of
Management Review, 8, 1, 61- 71. 7. http://www.globalgoodfund.org/?gclid=cj0kcqjw
ub7nbrdjarisap7wlt8qatwqlol- fyaa4an0asf_jlxuaogrz1-mcccmwpobacp5wynbj00aahavealw_wcb
8. https://entrepreneurship.duke.edu/news-item/the-meaning-of-social-entrepreneurship.
9. Dees, J Gregory (2001) “The Meaning of Social Entrepreneurship.
10. http://epub.lib.aalto.fi/en/ethesis/pdf/14209/hse_ethesis_14209.pdf
11. https://www.esfcr.cz/documents/21802/752394/Evaluation+of+the+social+and+inclusive ntrepreneurship+support+in+OPHRE/eb33a2f8-df5e-4ed6-9bde7afff34333e
12. http://erepository.uonbi.ac.ke/bitstream/handle/11295/92927/Njuguna_Factors%20influencing%20sustainability%20of%20social%20entrepreneurship%20projects.pdf?sequence
13. file:///C:/Users/USER/Downloads/Thesis%20Anne%20Floor%20van%20Dalfsen.pdf.
14. https://www.slideshare.net/SyedMRaza/goal-setting-in-social-entrepreneurship.
15. https://www.researchgate.net/publication/328289155_rural_development_in_indiaa_way_forward.

SJIF Impact Factor 2021: 8.013| ISI I.F.Value:1.241| Journal DOI: 10.36713/epra2016 ISSN: 2455-7838(Online)
EPRA International Journal of Research and Development (IJRD) Volume: 6 | Issue: 8 | August 2021 - Peer Reviewed Journal
2021 EPRA IJRD | Journal DOI: https://doi.org/10.36713/epra2016 | www.eprajournals.com |103 |
HEALTH INSECURITY: A STUDY OF MALARIA AS A HINDRANCE TO DEVELOPMENT
C.Lalengkima1, Dr Thanminlian2 1Asst Professor, Department of Political Science, St Xavier’s College Lengpui, Aizawl
2Asst Professor , Department of History, Govt T Romana College, Aizawl
ABSTRACT The paper looks at how health condition of the people has a bearing on the developmental processes. World’s largest
organisation, the United Nations (UN) has clearly emphasised the inter-relationship between development and
health in its Millennium Development Goals (MDGs). The focus area of this paper is deduce to the diseases,
Malaria which is mention in goals number six of the MDGs. The paper examines how Malaria has undermined
the developmental process in India, and Mizoram in particular.
INTRODUCTION – THE MILLENNIUM DEVELOPMENT GOALS
In September 6-8, 2000, the United Nations (UN) had its Millennium Summit in New York to commemorate the new millennium. In this summit, the world leaders from different countries were present. They discussed the role of the UN at the turn of the 21st century. In this august meeting, they have adopted the UN Millennium Declaration. The Millennium Declaration had mentioned set of varied goals to deal the crisis that confronts the world. To achieve the Millennium Declaration in a better way, the UN had launched the Millennium Development Goals (MDGs). The MDGs are derived from this Declaration, and each has specific targets and objectives.i
The main purpose of the MDGs is to combat poverty, hunger, disease, illiteracy, environmental degradation, and discrimination against women and enhancing global partnership for a better world. The MDGs blueprint was agreed to by all countries of the world and all the world‘s leading development
institutions. These institutions have given great efforts to meet the needs of the world‘s poorest.
The millennium declaration and development goals have portrayed that the UN has clearly recognise that the development and health are co-join. The MDGs has pointed out three distinct features on health related issues. Goals number four deals to ‗reduce child mortality rates‘; goals number
five mentions ‗improve maternal health and number
six has seek to ‗combat HIV/AIDS, malaria, and
other diseases‘.
Besides the developmental concern in contemporary world, new area of security has emerged. Human security is one of the new imperative which we need to address. The security of human being, security of the people, community and individual cannot be ignore. This relationship between health and development must be given due importance.
Why Malaria?
The target set in the MDGs is quite extensive. Health related topic alone are extremely large to analyse in one go. One area of health issues that has tremendous impact on the Mizo society is in the case of Malaria. So, we decided to deduce our focus of study to goal number six of the UN MDGs i.e., to ‗combat HIV/AIDS, malaria, and other
diseases‘. And thus the paper only deals with the case
of Malaria and emphasis how the particular disease hinders the developmental process. Quoting from Mizoram Health Department sources, The Hindu revealed that, ―119 people including 40 women died
of malaria in Mizoram during 2009‖.ii This clearly
brings forward that malaria is still the one of the biggest threat to the process of development and health in Mizoram. Malaria – which the World Fights Against
Malaria had spread out in 106 countries. An estimated 3.3 billion persons were at risk of Malaria. And 86 percent of Malaria deaths occurred in children less than 5 years of age and the majority from Africa‘s Sub-Saharaiii. Incidence of Malaria had

SJIF Impact Factor 2021: 8.013| ISI I.F.Value:1.241| Journal DOI: 10.36713/epra2016 ISSN: 2455-7838(Online)
EPRA International Journal of Research and Development (IJRD) Volume: 6 | Issue: 8 | August 2021 - Peer Reviewed Journal
2021 EPRA IJRD | Journal DOI: https://doi.org/10.36713/epra2016 | www.eprajournals.com |104 |
decreased by 17 percent globally from 2000 to 2010. Malaria mortality rate had decreased by 26 percent following increases in prevention and treatment during the same period.iv The high plenary on the UN General Assembly had issued a document on the MDGs in 2010 to review its achievement. It mentions, ―Malaria kills a child in the world every 45
seconds. Close to 90 per cent of malaria deaths occur in Africa, where it accounts for a fifth of childhood mortalityv
.‖ The document further stated that half the
world‘s population is at risk to malaria. In 2002,
alone there were an estimated 243 million cases of malaria which caused 8, 63,000 deaths.
To combat this severe crisis, the UN has increases funding to control malaria. The global production of Mosquito nets rose from 30 million to 150 million annually between 2004 and 2009. Funding for malaria control has risen sharply in recent years, and reached $1.5 billion in 2009 — still far short of the estimated $6 billion needed in 2010 alone to meet the MDGs target. Insecticide-treated bed nets have been distributed. Close to 200 million nets were delivered to African countries during 2007-2009. To accelerate the UN works, the US President‘s Malaria Initiative, the Canadian Red Cross, WHO, UNICEF, etc. has taken commendable work for combating Malaria.
A Serious Case for India
Malaria can be said to be one of the most widespread diseases in India. It is claim all states except Himachal Pradesh and Jammu & Kashmir are Malaria prone area. The states of West Bengal, Odisha, Jharkhand, Chhattisgarh, Andhra Pradesh, Maharashtra, Gujarat and Karnataka, and the Northeast states are Malaria high prone area. The Times of India had revealed that more than twenty times of what the government had recorded had died of Malaria. According to official record, only 1,023 people died of malaria infection in 2010. However, Lancet study (2011) mentioned an estimated 46,800 Indians died of malaria in 2010. World Malaria Report, 2011 reported that over 70% of India's population face the risk of Malaria infection. Around 31 crore people face the "highest risk" of getting
infected. India has over 10 crore suspected Malaria cases but only 15.9 lakh could be confirmed in 2010. However, the Indian Medical Research Council (IMRC), former Director General, Dr Pradhan estimates that India records between 30,014 and 48,660 malaria deaths per yearvi. Thus is clear that India needs to flex its muscle in its fight against the dreaded Malaria.
The Case of Malaria in Mizoram
In Mizoram too, Malaria is one of the most fearsome disease which is a hazard to the health of the people. Since the year 2000 (starting year MDG), 1, 25,420 people were infected by Malaria. Most of the infected people were the case of Malaria PF (Plasmodium Falciparum). However, the Annual Parasite Incident (API) was always lower than the earlier year.
If we analyse the available data, we found that in every year (since 2000) 62.07 people die of Malaria. In every month, 5.17 people died due to Malaria. This suggests that in every fifth day, one person fall a victim to Malaria. According to the Mizoram Health Department records, out of every 1, 000 people 8.38 are infected by Malaria.
Even though the overall API is declining in Mizoram, the API is high in Lunglei, Mamit and Lawngtlai District. The API also is high among the Brus and Chakma community of the state. These communities are those who live in developmentally backward areas. This confirms the linkages between health and development. Malaria or any diseases, is a hindrance to the process of development. And the emphasis of MDGs or a welfare state is its eradication.
Data on Malaria during 2000- 2012
Year Number of Blood Test
Malaria Infested( PV)
Malaria Infested( PF)
Number of person died
2000 1,97,841 8,117 4,806 33
2001 2,04,492 10,929 5,955 43 2002 2,19,522 7,859 3,932 35 2003 2,03,188 7,290 4,167 48 2004 2,17,316 7,830 4,170 72 2005 2,02,155 8,458 6,079 84 2006 2,05,535 8,649 6,956 121

SJIF Impact Factor 2021: 8.013| ISI I.F.Value:1.241| Journal DOI: 10.36713/epra2016 ISSN: 2455-7838(Online)
EPRA International Journal of Research and Development (IJRD) Volume: 6 | Issue: 8 | August 2021 - Peer Reviewed Journal
2021 EPRA IJRD | Journal DOI: https://doi.org/10.36713/epra2016 | www.eprajournals.com |105 |
Data of Malaria during 2000 -2010. Estimate available from the data of the
Government of Mizoram recognised the declining API in the state. However, Malaria remains the biggest killer disease in Mizoram.vii
Health and Development – Malaria a Hindrance to Development Let look how malaria affects the process of development –
Economic Drainage: Malaria has drainage the government exchequer. Every now and then, he government need to paid more attention in its fight against Malaria. The public money has been drain to combat Malaria. This is through buying costly medicine, research funding, treatment of the infected people, etc. Insecticide treated mosquito net are being given to every two member of a family and to those who meet their subsistence by working in the forest. The National Vector Borne Disease Control Programme (NVBDCP) has allotted huge amount for combating Malaria. If we are healthier or free of Malaria, all of these sums could be use for other development projects. International funds for malaria control had risen to a peak of US$ 2000 million in 2011viii. If these amounts are slated to be use for global malaria programme, alot of purposeful work could be done if the world is free from Malaria.
Decreasing Workforce: Better health is dependent on the quality provided by the economy. The health condition has affected the workforce of the country. It is making a complication in the economic development of a nation. Unhealthy people have reduced the workforce population. And that fewer workforces can herald economic crisis. When people have a better health, it can increase the performance of the country by increasing production. It said that, ―Human capital is one of the chief
cornerstones of economic development, and any economy that is deficient in this vital component will suffer from the effects. A correlation between health and economic development can be seen in undeveloped countries with inadequate health care systems‖.
In agricultural or jhum-base economy like Mizoram, people need to stay in the forest or jungle for a week or a month. If these people are infected by Malaria or any diseases their production is considerably reduce. Thus there is a dire need to take
care of the health of the people in order to enhance our economy.
Worsen health condition: According to the USAID, more than 25 million African pregnant women are at risk of malaria annuallyix. The malaria infected pregnant women gave birth to a new born underweight baby that consequently affected their health condition. Children less than five years are at the risk of Malaria and many children died of Malaria too. The same problem of maternal and infant malaria is face by the northeastern states including Mizoram‖.
x Along with Jaundice and Tuberculosis, Malaria is the most common diseases in the northeastern states of India.
Treatment Problems: Like other diseases, Malaria infected people need a proper treatment. However, there are more complications in the treatment of Malaria. There are several instances that people infected by Malaria parasite are given wrong treatment. This stands true, especially in the case of Mizoram where medicare has not yet been satisfactory. Malaria is not incurable and researches are undergoing to find a way for more effective treatment. Combating and fighting Malaria need lots of monetary funds, energy and time. If this disease be reduce, if not eliminated attention could be diverted to other areas. CONCLUSION
It is a known fact that health is an important ingredient for growth and development. Amartya Sen rightly opine that, ―enhancement of health is a
constitutive part of development‖.xi He further
laments, ―good health is an integral part of good
development‖. Surmountable task in the path to
development is face by every state. The impediment of development may vary; however, if we achieve better health condition of living it can be assure that we are proceeding to a higher level of developmental process.
Meeting of Senior Officials and Ministers of Health organised by WHO in South Africa mention agreed that ―Health, in turn, contributes to economic,
social and environmental development through multiple pathways. Improved health feeds sustainable development, and sustainable development feeds improved health in a virtuous cycle, supported by effective health services‖
xii. So the linkage between health and development is further established. Both
2007 1,54,045 5,289 4,189 75 2008 1,65,441 7,361 6,172 91
2009 1,71,793 9,399 7,390 119 2010 3,29,771 15,495 14,321 31 2011 2,13,149 8,861 8,373 30 2012 1,63,421 9,883 9,437 25

SJIF Impact Factor 2021: 8.013| ISI I.F.Value:1.241| Journal DOI: 10.36713/epra2016 ISSN: 2455-7838(Online)
EPRA International Journal of Research and Development (IJRD) Volume: 6 | Issue: 8 | August 2021 - Peer Reviewed Journal
2021 EPRA IJRD | Journal DOI: https://doi.org/10.36713/epra2016 | www.eprajournals.com |106 |
have to go together for the attainment of effective development.
Rio Declaration on Environment and Development (1992) states: ―Human beings are at the
centre of concerns for sustainable development. They are entitled to a healthy and productive life in harmony with nature‖.
xiii Besides development, climate change also deeply affects the health condition of living beings. ―Climate change poses a
major, and largely unfamiliar, challenge to the efforts to manage human health‖
xiv. WHO estimates that Malaria alone slowed the ―economic growth in
Africa by up to 1.3% each year‖xv. So, the
deteriorated health condition could vehemently hinder the process of development. If those things could happen in Africa, it is implicit growth could also be hamper in India.
The present decade has witness drastic change in our lives. Technology has developed and knowledge has multiply. However, several diseases like Malaria have not been eradicated yet. To sustain and enhance the process of development, the health condition of the people has a great influence. The UN and other organisations, governments, civil societies and non-governmental organisations (NGOs) are deeply involve and continue to do so to improve the health condition of the masses. In this engagement, eradication of Malaria is among the priority.
The prevalence of Malaria in India is 3, 697 per 10, 0000 population. In Mizoram, this figure is 7, 359 per 10, 0000 populationxvi. This makes clear that the presence of the disease in Mizoram is much higher compare to the national average. Thus, here arise the compelling needs to heighten the steps taken by the state‘s in combating Malaria.
REFERENCES
1. Dash, A. P., et. al., (2008), Malaria in India: Challenges and Opportunities, Journal of Biosciences, Bangalore: Indian Academy of Science.
2. Sen, Amartya (1999), Health in Development, Keynote address by Professor Amartya Sen, Master of Trinity College, Cambridge, Nobel Laureate in Economics, to the Fifty-second World Health Assembly, Geneva.
3. United Nations (1992), Report of the United Nations Conference on Environment and Development Rio de Janeiro, 3-14 June 1992.
4. United Nations (2010), High Level Plenary Meeting of the General Assembly on 20-22 September 2010, New York.
5. Willis, Kate (2005), Theories and Practices of Development, New York: Routledge.
6. World Health Organisation (2002), Health and Sustainable Development, Meeting of Senior Officials and Ministers of Health Summary Report, Johannesburg, South Africa.
7. Daily New and Analysis (19 February 2010) “Malaria situation in Mizoram 'alarming', says control programme director”, Accessed on 15
April 2015. Available at http://www.dnaindia.com/india/1349925/report-malaria-situation-in-mizoram-alarming-says-control-programme-director .
8. The Hindu, (2 February 2010), “119 people died
of malaria in Mizoram in 2009”, Accessed on 15 April 2015. Available at http://www.thehindu.com/news/national/other-states/119-people-died-of-malaria-in-mizoram-in-2009/article99075.ece .
9. The Times of India (11 January 2013) “Malaria kills 20 times more than what govt says”,
Accessed on 15 April 2015. Available at http://articles.timesofindia.indiatimes.com/2013-01-11/india/36279079_1_malaria-mortality-malaria-deaths-world-malaria-report .
10. Zalen (April 14, 2013), “Kum 13 chhungin
Malaria in mi 807 suat”, Aizawl. 11. Health Problems in Mizoram, Accessed on 15
April 2015, Available at http://medind.nic.in/haa/t04/i1/haat04i1p85.pdf .
12. Fighting Malaria, Accessed on 15 April 2015, Available at http://www.theglobalfund.org/en/about/diseases/malaria/ .
13. Fighting Malaria, Accessed on 15 April 2015, Available at http://www.usaid.gov/what-we-do/global-health/malaria .
14. Millenium Development Goals, Accessed on 15 April 2015, Available at http://www.who.int/topics/millennium_development_goals/en/ .
15. Global Health Observatory, Accessed on 17 April 2015, Available at http://www.who.int/gho/malaria/en/index.html .
END NOTES i Millennium Development Goals, Accessed on 15 April 2015, Available at http://www.who.int/topics/millennium_development_goals/en/ . ii The Hindu, (2 February 2010), “119 people died of
malaria in Mizoram in 2009”, Accessed on 15 April 2015. Available at http://www.thehindu.com/news/national/other-states/119-people-died-of-malaria-in-mizoram-in-2009/article99075.ece . iii Global Health Observatory, Accessed on 17 April 2015, Available at http://www.who.int/gho/malaria/en/index.html iv ibid. v United Nations (2010), “High Level Plenary Meeting of
the General Assembly” on 20-22 September 2010, New York. vi The Times of India (11 January 2013) “Malaria kills 20 times more than what govt says”, Accessed on 15 April
2015. Available at http://articles.timesofindia.indiatimes.com/2013-01-11/india/36279079_1_malaria-mortality-malaria-deaths-world-malaria-report .

SJIF Impact Factor 2021: 8.013| ISI I.F.Value:1.241| Journal DOI: 10.36713/epra2016 ISSN: 2455-7838(Online)
EPRA International Journal of Research and Development (IJRD) Volume: 6 | Issue: 8 | August 2021 - Peer Reviewed Journal
2021 EPRA IJRD | Journal DOI: https://doi.org/10.36713/epra2016 | www.eprajournals.com |107 |
viiDaily New and Analysis (19 February 2010) “Malaria situation in Mizoram 'alarming', says control programme director”, Accessed on 15 April 2015. Available at http://www.dnaindia.com/india/1349925/report-malaria-situation-in-mizoram-alarming-says-control-programme-director . viiiFighting Malaria, Accessed on 15 April 2015, Available at http://www.theglobalfund.org/en/about/diseases/malaria/ . ix Fighting Malaria, Accessed on 15 April 2015, Available at http://www.usaid.gov/what-we-do/global-health/malaria x Health Problems in Mizoram, Accessed on 15 April 2015, Available at http://medind.nic.in/haa/t04/i1/haat04i1p85.pdf . xi Amartya Sen (1999), “Health in development” Keynote
address by Professor Amartya Sen, Master of Trinity College, Cambridge, Nobel Laureate in Economics, to the Fifty-second World Health Assembly Geneva. xii World Health Organisation (2002), Health and Sustainable Development, Meeting of Senior Officials and Ministers of Health Summary Report, Johannesburg, South Africa. xiii United Nations (1992), Report of the United Nations Conference on Environment and Development, (Rio de Janeiro, 3-14 June 1992. xivA P Dash et al (2008), “Malaria in India: Challenges
and opportunities”. Journal of Bioscienes, Bangalore: Indian Academy of Science. xvWorld Health Organisation (2002), op.cit. xvi Health Problems in Mizoram, op.cit.

SJIF Impact Factor 2021: 8.013| ISI I.F.Value:1.241| Journal DOI: 10.36713/epra2016 ISSN: 2455-7838(Online)
EPRA International Journal of Research and Development (IJRD) Volume: 6 | Issue: 8 | August 2021 - Peer Reviewed Journal
2021 EPRA IJRD | Journal DOI: https://doi.org/10.36713/epra2016 | www.eprajournals.com |108 |
CONCEPTUAL ADVERTISING LITERACY LEVEL OF CHILDREN IN INDIA
Dr. Kuldeep Chaudhary1, Asha2
1Associate Professor, Department of Management, Indira Gandhi University, Meerpur, Rewari, Haryana
2Research Scholar, Institute of Management Studies and Research,
Maharishi Dayanand University, Sector-6, Bahadurgarh, Rohtak, Haryana
Article DOI: https://doi.org/10.36713/epra8228
DOI No: 10.36713/epra8228
ABSTRACT Market for children consumption is growing worldwide and hence the marketing effort. Marketers are keen to
know the behavioural secrets to influence children’s consumptions. The promotional efforts are need to be more
fruitful and focused, therefore imperative to understand the conceptual advertising literacy level of the targeted
child consumers. In order to reveal the related facts, the study examines the conceptual advertising literacy level of
children in India. In a computer assisted survey of 392 children between the age brackets of 8-12 years, the
researchers examine their ability of advertising recognition, understanding of advertising selling intent and
understanding of advertising persuasive intent regarding brand promotion efforts. Results confirm that
advertising recognition and understanding selling intent is high in children but children do not acquire a clear
understanding of advertising persuasive intent until the age of 9-10 years. Furthermore, children's understanding
of advertising's selling intent emerges before their comprehension of its persuasive intent.
KEYWORDS: Children, Advertising Literacy, Persuasive Intent, Selling Intent
INTRODUCTION Marketers worldwide are now targeting
children as their products’ target market. Children
constitute a major audience for advertisers because, today, they have their own purchasing power and affect the buying decision of their parents (Ward etal., 1972; Atkin, 1978; Dr. T. N. Murty et al. 2013). Also, they're the adult consumers of the future. Marketers know that as soon as the children are caught into their nests, the more easily they can be developed in to potential loyal customer and brand loyalty at a young age thus helps in the unrelenting sales later (Šramová B. 2015). This is an economically cheaper way to create an early childhood customer base rather than to make strategies and plans for adults and senior customers. On the other hand in society, the rising influence of advertisers and changing trends for children in the TV entertainment has become a point of worry for
parents, academicians, policymakers, etc. (Kunkel et al., 2004; E. Rozendaal., 2011).
Marketers and advertisers are continuously trying understanding children psychology and consumption behaviour. The focal point is to know the age when children become capable to understand consciously and objectively regarding various advertisements. In response to this public discussion, academic study on children and advertising has typically focused on children advertising literacy’s
development (John, 1999; livingstone & Helsper, 2006; E. Rozendaal, 2011). Such competencies are often supposed to determine the susceptibility of children to advertising impacts (Oates & Blades, 2005; young, 1990). According to Rozendaal et. al (2011) children advertising literacy included three dimensions: (A) Conceptual Advertising Literacy -children having conceptual knowledge of advertising; (B) Attitudinal Advertising Literacy- to see

SJIF Impact Factor 2021: 8.013| ISI I.F.Value:1.241| Journal DOI: 10.36713/epra2016 ISSN: 2455-7838(Online)
EPRA International Journal of Research and Development (IJRD) Volume: 6 | Issue: 8 | August 2021 - Peer Reviewed Journal
2021 EPRA IJRD | Journal DOI: https://doi.org/10.36713/epra2016 | www.eprajournals.com |109 |
advertising in a critical way; (C) Advertising Literacy Performance -use of conceptual and attitudinal advertising literacy. Further, it has been proposed that conceptual advertising literacy may be effective in lessening children's susceptibility to advertising when they are prompted to use this literacy (Brucks et al., 1988; Roedder, 1981; E Rozendaal et Al., 2011). Therefore, it is relevant to measure the conceptual advertising literacy level of children. Most of the studies on conceptual advertising literacy were focused on the three determinants; (1) Advertising Recognition - Ability to make a fair difference between advertising and media content; (2) Understanding Selling Intent- ability to understand what advertiser is trying to sell out; (3) Understanding Persuasive Intent- ability to understand advertisers persuasive attempts to influence consumer by changing their state of mind, attitude and cognition about the brand.
There are much contested views on, at what age children can make a reasonable distinction in between an Advertisement and the T.V Programs; also, at what age they can understand the advertising. The foundation studies had revealed that this ability evolves around the age of 4 (Gains and Esserman, 1981), but, by the age of eight, nearly all children are able to distinguish between advertisements and TV Program (e.g. Bijmolt, Claassen, & Brus, 1998; Stutts et al., 1981; E.Rozendaal et al., 2011). On the question of children’s understanding about the advertisements, advertising selling and persuasive intent, some studies suggests that children may not understand advertising until they reach the age of seven or eight years (Chan, 2000), while other researchers states that their skill of comprehension does not develop until the child is 12 years (Edling, 1999). According to Livingstone and Helsper (2006, p 562), although children as young as 7 or 8 (Piaget's Concrete Operational Stage) understand that advertising is different from information, yet, it is not until they are about 12 years old (Piaget's Formal Operational Stage) that they can articulate a critical thought about the comprehension of advertising and advertiser’s intent.
Most of the studies pointed in the direction that children advertising literacy fully develop between the age of eight and twelve (Valkenburg & Cantor, 2001). However, majority of prior studies in the field of children advertising literacy is done by making comparison between adult and children, fewer, spoke about children as individually. Therefore, the present study aims to fill this identified gap and provide first-hand information and authentic grounds for understanding of children advertising literacy. The study is to investigate and compare advertising recognition and comprehension of advertising intent by children of 8 to 12 Years age. The children are also compared of their opinion on
the urbanisation level of their location and to see any relationship with advertising literacy level. The study includes the opinion of rural area children realising the facts that social and economic development in India has led to rapid increase in consumer incomes and reach to various media of promotion. Therefore, an effect on children purchasing and decision making is assumed to make a difference and likewise on their advertising literacy levels. Hence, the advertising literacy is also investigated in this regard to make further conclusions. THEORISING THE CONCEPTUAL ADVERTISING LITERACY
In a need of analysing research gaps and conceptual clarity, a thorough review of the existing literature was conducted and it is realised that literature doesn’t support any consensus on the
conceptual definition of the children advertising literacy. In spite of the fact that various theoretical models give insight into the advertising-related knowledge and abilities that children must possess (Friestad & Wright, 1994; John, 1999; Moses & Baldwin, 2005; Roberts, 1983; E. Rozendaal et al., 2011), they all basically emphasized on distinct prospective determinants of the children advertising literacy. However, it is generally assumed that advertising understanding develops from very simple to more complex and abstract competences. Furthermore, most models agree that the capacity to differentiate between advertising and programming, as well as the capacity to understand the intent of advertising, are the two most fundamental and first-developed advertising literacy skills. That is the reason why empirical research has mainly focused on these critical components (Ad recognition, understanding selling intent and understanding persuasive intent) of advertising literacy. Yet, research into the theory of children advertising literacy is primarily based on the developmental psychology paradigm like: Theory of cognitive development (Jean Piaget, 1929), Theory of information processing (Roedder, 1981) and Theory of mind (Moses & Baldwin, 2005). Advertising Recognition- Advertising recognition is commonly characterized as the ability to make a reasonable distinction between advertisement content and the other regular TV programming (Wackman, &Wartella, 1977; young, 1990; E. Rozendal et al., 2011). Some studies suggested that by the age of five, three quarter of children can recognise advertising based on perceptual features (Butter, Popovich, Stackhouse, & Garner, 1981; Levin, Petros, & Petrella, 1982) and up to 8 years of their age they master in this competency (Bijmolt et al. 1998). Various studies have investigated children ability of advertising recognition (Bijmolt et al.,

SJIF Impact Factor 2021: 8.013| ISI I.F.Value:1.241| Journal DOI: 10.36713/epra2016 ISSN: 2455-7838(Online)
EPRA International Journal of Research and Development (IJRD) Volume: 6 | Issue: 8 | August 2021 - Peer Reviewed Journal
2021 EPRA IJRD | Journal DOI: https://doi.org/10.36713/epra2016 | www.eprajournals.com |110 |
1998; Levin et al., 1982; Palmer & McDowell, 1979; Stephens &Stutts, 1982; Stutts et al., 1981; E. Rzendaal et al., 2011). And the common technique to measure the advertising recognition is Videotaped Method. The present study also used the videotaped method (Butter et al., 1981; Gains & Esserman, 1981). A video clip featuring three advertisements and three other programs was shown to the children. For all the three advertisement children were shown a video and asked whether is this a TV advertisement? And on every program were asked is this not a TV advertisement? The empirical evidences from the previous studies were reasonably consistent. They all suggested that the majority of 8-year-olds can appropriately differentiate between advertising and programming. To verify the information further, following research question needs to be answered with the help of first hand information: RQ1: What is the Ad recognition ability level of children in India residing National Capital Region? Understanding Selling Intent- Advertising selling intent is usually a direct effort by the advertiser to influence the actions of the consumers. Literature has inconsistent results regarding the age at which children understand the intent of advertising.But few studies proved that children as young as 8 years old begin to gain an awareness of selling intent (John 1999, Martine 1997, Kunkal et. al 2004). However, there are fewer details about the fully developed understanding regards advertising selling intent of children. Despite this, some studies proved that by the age of 12 a child fully developed the understanding about advertisers selling intent (Gunter et al., 2005; Valkenburg & Cantor, 2001). Reason for the same is that, children of this age are able to think about problems in a similar way like an adult and they also at this age learn from their experiences. Present study defines Understanding of selling intent as ability to recognise that an advertisement wants the audience to purchase a product. In the light of this we investigate the following questions; RQ2: What is the understanding of advertising selling intent among the children in India residing in National Capital Region? Understanding Persuasive Intent- Persuasive intent is an indirect attempt of advertisers to influence the mental state of consumers, for example; their interest and beliefs about the marketed product (Moses & Baldwin, 2005). The fundamental aspect of advertising literacy is to have an awareness of persuasive intent. Previous research has shown that children from the age of three can understand advertising is open to doubt (Donohue at al. 1980). But Caroline Oates (2001) found that, after the age of seven or eight years, children began to grasp the persuasive intent of advertiser. This is in line with
Moses and Baldwin’s (2005) assumption that it is easier for children to understand that advertisers try to change their behaviour (i.e., selling intent) than to understand that they try to change their mental states (i.e., persuasive intent). The present study investigated both type advertising understating and compare urban and rural children level of understating. To support the discussion, the study investigates the following question: RQ3: What is the understanding of advertising persuasive intent among children in India residing in National Capital Region? RESEARCH METHODS Participants and Procedure
Demographic profile of the respondents: A total 392 children in the group of 8 to 12 years old participated in the study. Children were selected from schools located in urban and rural schools situated in national capital region of India. The children interviewed in school as the surroundings of school instil a comfort in responding children and intervention of parents can be avoided (Banister and both, 2005). Also, it is assumed that a child from rural school location resides in the rural area. The sample consists 212 (54%) boys and 180 (46%) girls. Children were grouped into five age categories: 8 years (20.2%), 9 years (20.2%), 10 years (19.3%), 11 years (19.8%) and 12 years (17.3%). A bilingual (Hindi as well as English) schedule was used for the data collection. Prior to the survey's execution, institutional permission and informed permission from the children were acquired. Children were conveyed first that the questions are very simple and about television and advertising. To make them comfortable they were told that they could stop participating at any time they wished. Questionnaire was developed in such a way that advertising recognition can be measured by videotaped method and understanding regards selling and persuasive intent is measured by multiple choice questions. Measures
Recognition of Advertising: To measure the ability to recognize advertising children were presented with three television advertisement featuring children and famous animated character (a chocolate ad, a network ad and a soap ad). Children responded on a given five point scale from Strongly Disagree to Strongly Agree. To prevent the issue of reaction-bias, children were shown some unrelated video clips. Children were exposed to 3 short clips aired TV programs: a cartoon clip, a news anchoring and a famous kid’s dance show. Children were asked
Is this not a TV advertisement? And they need to respond on a given scale from Strongly Disagree to Strongly Agree. All the featured videos (Ad and non-

SJIF Impact Factor 2021: 8.013| ISI I.F.Value:1.241| Journal DOI: 10.36713/epra2016 ISSN: 2455-7838(Online)
EPRA International Journal of Research and Development (IJRD) Volume: 6 | Issue: 8 | August 2021 - Peer Reviewed Journal
2021 EPRA IJRD | Journal DOI: https://doi.org/10.36713/epra2016 | www.eprajournals.com |111 |
Ad) were of almost same duration of 20 to 30 seconds and were shown randomly.
Understanding Selling Intent: Some studies measuring advertising selling intent simply by asking them why commercials are shown on television (Butter et al., 1981; Donohue et al., 1978; Robertson & Rossiter, 1974). While, a number of studies have used a less cognitively demanding technique, for instance by using multiple-choice questions (Bijmolt et al., 1998; Donohue, Henke, & Donohue, 1980; Macklin, 1985, 1987). Present study investigates the understanding of selling intent with three inclusive statements were asked like: Are advertisements on television there to make you buy the advertised product? and Are Advertisements valuable source of information about the selling product? etc. on a scale ranging from (1) Strongly Disagree to (4) strongly agree
Understanding Persuasive Intent: In order to test the degree of awareness of the persuasive intent
of marketers, children were asked to score questions about positive feelings, make a desire to have the product, benefits of product that the advertiser conveyed to them via advertising. Also, the opinion about the statement that ‘advertisements were on
television to attract them’ was inquired. SURVEY RESULTS
The first aim of this study was to investigate the advertising recognition level of children. A cumulative mean score of advertising recognition is 3.77 with SD=.70. Results are almost at the degree of ‘Strongly Agree’ level indicated that, children are
capable of making a difference between an ad and other programs broadcasted on television. To make the results more meaningful, we have presented the mean scores as percentage of correct responses in table 1.
Table 1: Age wise Advertising Recognition Ability of Children in India
8 years
9 years
10 years
11 years
12 years Advertising Recognition
Ability
76.3%
86.7%
91%
95%
98% Our second aim was to examine the understanding of advertisers selling intent. A cumulative score of 3.6955 with high standard deviation of 0.72378 was
found. To make the results more meaningful, we have presented the mean scores as percentage of correct responses in table 2.
Table 2: Age wise Understanding of Advertising Selling Intent in Children in India
8 years
9 years
10 years
11 years
12 years
Understanding of Advertising Selling Intent
81.7%
87.8%
88.5%
91.2%
94%
Third aim of the present study was to examine the understanding of advertiser’s persuasive intent.
Further to analyse the results, statistical tools were applied and the mean value is the appropriate tool to measure the objective.The average score of 3.6071
and the standard deviation of .76535 for this aspect of advertising literacy suggested a confirmation of advertising literate children. The percentages of correct responses in the different age groups are shown in Table 3.
Table 3: Understanding of Advertising Persuasive Intent in Children in India
8 years
9 years
10 years
11 years
12 years
Understanding persuasive intent
69.5%
73%
80.8%
86.2%
88%
DISCUSSION OF SURVEY RESULTS
The first objective of the study was to investigate the advertising recognition level and children understanding of advertiser selling and persuasive intent. While achieving the objectives, the present research measures took into account the language and memory retrieval capacities of 8 to 12 years old children. It is widely assumed that this
ability generally develops around the age of 8 years. A cumulative mean score of 3.7700 which is almost at the degree of ‘Strongly Agree’ level indicates that, children are capable of making a difference between an advertisement and other programs broadcasted on television. While, measuring the ad recognition level of each age group it is found that the eight years old are still far behind than the 10, 11 or 12 years old
SJIF Impact Factor 2021: 8.013| ISI I.F.Value:1.241| Journal DOI: 10.36713/epra2016 ISSN: 2455-7838(Online)
EPRA International Journal of Research and Development (IJRD) Volume: 6 | Issue: 8 | August 2021 - Peer Reviewed Journal
2021 EPRA IJRD | Journal DOI: https://doi.org/10.36713/epra2016 | www.eprajournals.com |112 |
respondents in advertisement recognition. The ability to recognise increases as the child grows to 8 to 9, 9 to 10 and further. This result is in line with the E. Rozendaal et. Al., (2011) that the majority of the 8- to 9-year-old children could recognize advertising.
The second objective of the study was to investigate the understanding of selling intent by children. The results demonstrate that children know that advertisers tries to influence them by advertisements and that is why they ask their parents to purchase an advertised product. Respondents acknowledge that advertisements are the important source of information about the selling product and by this advertiser was attempting to alter their liking pattern. They simply understand that this influx of information makes influence to purchase the things they really not needed. Mean score result represented that, respondent’s understanding regards selling intent is High. Furthermore, while examining the understanding selling intent of each age group it was found that majority of eight years old children (81.7%) can understand the selling intent of advertiser and this understanding grows with the age.
Further, regarding the third objective, findings indicate that it is easier for a child to understand selling intent than to understand the persuasive intent. Even at the age of 12, a child cannot easily understand persuasive intent. One reason for that, children of 12 years may still lack some cognitive abilities and, as a consequence, their cognitive advertising competences have not yet fully developed (E.Rozendaal et. Al., 2011). As Moses and Baldwin (2005) suggested, children in this age group may be conceptually competent (in this case, able to recognize and understand advertising) and yet fail to apply these concepts in practice. In addition, children may have a lower level of cognitive advertising competences than adults because they are less experienced consumers (Friestad & Wright, 1994). However, results of this study are not in line with the pervious researches. As high means score of 3.6071, indicated that children’s poses higher understanding
regards the advertiser’s persuasive intent.
Furthermore, while examining the understanding persuasive intent of each age group it was found that 69.5% of eight years old children can understand the persuasive intent of advertiser and this understanding grows with the age. While, we compare this finding with understanding of selling intent component of advertising literacy (3.6955), a distinction has been made and can be said that it is easier for a child to understand selling intent than to understand the persuasive intent. This result is consistent with past research (Moses and Baldwin, 2005, Oates 2001), who theorized that understanding the persuasive intent required higher developmental level that grows with the age.
To sum up, it can be concluded that overall conceptual advertising literacy level of the respondents of the study is sufficiently high. Although children advertising literacy is growing at the age of 8 years and the ability improves with the age, comparatively. Children of 12 years age are quite literate to understand selling intent of advertisement and may start understand persuasive intent in later age. LIMITATIONS
This research provided significant insights into the developmental evolution of children's identification and comprehension of advertising by measuring their cognitive advertising skills. Yet, there are a number of limitations with regard to the study. The study focused on the children self-reported measure about their advertising literacy, and this may have overestimated their ability, skill and advertising related knowledge. Future research should include their parents, teachers, peers and can use adults to measure the level of their cognitive advertising skills.
This study only focuses on the conceptual advertising literacy of children because this competency is acknowledged fundamental cognitive advertising competency. However, Rozendaal et. al (2011), adding two more dimensions in their study, as named of, attitudinal advertising literacy and advertising literacy performanceas cognitive advertising competencies. More studies are required to determine if the trends found for advertisement recognition and comprehension also apply to other advertising competencies.
The method used in this study is a modified method according to the need of the study. Despite our efforts to improve current research measures, our findings may still be influenced by the measurement employed. Future study should be conducted in order to get an accurate picture of the development of children's cognitive advertising competencies by making use of a combination of various research techniques (Owen, Auty, Lewis, &Berridge, 2007; E. Rozendaal, 2011). FUTURE RESEARCH DIRECTIONS
Present study concentrated on television advertising since television watching is still the most popular leisure activity among children (Roberts & Foehr, 2008) and television advertising accounts for the majority of child-directed advertising expenditures (Calvert, 2008). However, marketers are quickly embracing new advertising techniques (e.g., branded websites, advergames, online marketing, social site marketing etc.) that are fundamentally different from conventional advertising and offer numerous new difficulties for young people's advertising processing. Children are likely to struggle

SJIF Impact Factor 2021: 8.013| ISI I.F.Value:1.241| Journal DOI: 10.36713/epra2016 ISSN: 2455-7838(Online)
EPRA International Journal of Research and Development (IJRD) Volume: 6 | Issue: 8 | August 2021 - Peer Reviewed Journal
2021 EPRA IJRD | Journal DOI: https://doi.org/10.36713/epra2016 | www.eprajournals.com |113 |
more with identifying and comprehending these new advertising tactics. Further this study can be extended to measure the adolescents and adults advertising literacy level and can be compared with the children advertising literacy level. REFERENCES
1. Atkin, C. K. (1978). Observation of parent- child interaction in supermarket decision- making. Journal of Marketing, 42, 41-45.
2. Banister, E. N. and Booth, G.J. (2005). Exploring innovative methodologies for child-centric consumer research. Qualitative Market Research: An International Journal, 8(2), 157-75.
3. Bijmolt, T. H. A., Claassen, W., & Brus, B. (1998). Children’s understanding of TV advertising: Effects of age, gender, and parental influence. Journal of Consumer Policy, 21, 171–
194. 4. Brucks, M., Armstrong, G. M., & Goldberg, M.
E. (1988). Children’s use of cognitive defences against television advertising: A cognitive response approach. Journal of Consumer Research, 14, 471–482.
5. Buckingham, D. (1993). Children Talking Television: The Making of Television Literacy. London: The Falmer Press.
6. Bums, A.C. and Bush, R.F. (2003). Marketing Research (4th ed.). Prentice Hog, New Jersey.
7. Butter, E. J., Popovich, P. M., Stackhouse, R. H., & Garner, R. K. (1981). Discrimination of television programs and commercials by preschool children. Journal of Advertising Research, 21, 53–56.
8. Calvert, S. L. (2008). Children as consumers: Advertising and marketing. The Future of Children. 18. 205–234.
9. Chan, K. (2000). Hong Kong children’s
understanding of television advertising. Journal of Marketing Communication, 6(1),37-52.
10. Chawla, D. and Sodhi, N. (2011). Research methodology: Concept and cases (1st ed.). Vikas publishing house, New Delhi, India.
11. Cohen, J. (1988). Statistical power analysis for the behavioural sciences (2nd ed.). Hillsdale, NJ: Lawrence Erlbaum Associates, Publishers.
12. Comstock, G., & Scharrer, E. (2007). Media and the American child. San Diego, CA: Academic Press.
13. Cook, G. (1992) The Discourse of Advertising. London: Routledge.
14. Donohue, T. R., Henke, L. L., & Donohue, W. A. (1980). Do kids know what TV commercials intend? Journal of Advertising Research, 20, 51–
57. 15. Donohue, T. R., Meyer, T. P., & Henke, L. L.
(1978). Black and white children: Perceptions of TV commercials. Journal of Marketing, 42, 34–
40.
16. Edling, A. (1999). Ethics and public policy’. paper presented to the TV advertising and children conference, London, UK, November.
17. Friestad, M., & Wright, P. (1994). The persuasion knowledge model: How people cope with persuasion attempts. Journal of Consumer Research, 21, 1–31.
18. Gaines, L., & Esserman, J. F. (1981). A quantitative study of young children’s
comprehension of TV programmes and commercials. In J. F. Esserman (Ed.), Television advertising and children (pp. 96–105). New York: Child Research Service.
19. Gunter, B., Oates, C., & Blades, M. (2005). Advertising to children on TV: Content, impact, and regulation. Mahwah, NJ: Lawrence Erlbaum Associates, Inc.
20. John, D. R. (1999). Consumer socialization of children: A retrospective look at twenty-five years of research. Journal of Consumer Research, 26, 183–213.
21. Kunkel, D., Wilcox, B. L., Cantor, J., Palmer, E., Linn, S., & Dowrick, P. (2004). Report of the APA Task Force on advertising and children. Washington, DC: American Psychological Association.
22. Levin, S. R., Petros, T. V., & Petrella, F. W. (1982). Preschoolers’ awareness of television
advertising. Child Development, 53, 933–937. 23. Livingstone, S., &Helsper, E. J. (2006). Does
advertising literacy mediate the effects of advertising on children? A critical examination of two linked research literatures in relation to obesity and food choice. Journal of Communication, 56, 560–584.
24. Macklin, M. C. (1985). Do young children understand the selling intent of commercials? Journal of Consumer Affairs, 19, 293–304.
25. Macklin, M. C. (1987). Preschoolers’
understanding of the informational function of television advertising. Journal of Consumer Research, 14, 229–239.
26. Martin, M. C. (1997). Children’s understanding
of the intent of advertising: A meta-analysis. Journal of Public Policy and Marketing, 16, 205–216.
27. Moses, L. J., & Baldwin, D. A. (2005). What can the study of cognitive development reveal about children’s ability to appreciate and cope with
advertising? Journal of Public Policy and Marketing, 24, 186–201.
28. Murthy, T.N., Chowdary, V.V.R.R., Rao, R.S. (2013). Impact of advertising on children with special reference to eating habits. International monthly referred journal of research in Management & Technology, 2, 39-45.
29. Owen, L., Auty, S., Lewis, C., & Berridge, D. (2007). Children’s understanding of advertising:
An investigation using verbal and pictorially cued methods. Infant and Child Development, 16, 617–628.
30. Palmer, E. L., & McDowell, C. N. (1979). Program/commercial separators in children’s

SJIF Impact Factor 2021: 8.013| ISI I.F.Value:1.241| Journal DOI: 10.36713/epra2016 ISSN: 2455-7838(Online)
EPRA International Journal of Research and Development (IJRD) Volume: 6 | Issue: 8 | August 2021 - Peer Reviewed Journal
2021 EPRA IJRD | Journal DOI: https://doi.org/10.36713/epra2016 | www.eprajournals.com |114 |
television programming. Journal of Communication, 29, 197–201.
31. Piaget, J. (1929). The child’s conception of the
world. London: Routledge & Kegan Paul. 32. Roberts, D. F. (1983). Children and
commercials: Issues, evidence, interventions. In J. Sprafkin,C. Swift, & R. Hess (Eds.), Rx Television: Enhancing the preventive impact of TV (pp. 19–36).New York: Haworth Press.
33. Roberts DF, Foehr UG. (2008). Trends in media use. Future Child. Spring, 18(1),11-37.
34. Robertson, T. S., & Rossiter, J. R. (1974). Children and commercial persuasion: An attribution theory analysis. Journal of Consumer Research, 1, 13–20.
35. Roedder, D. L. (1981). Age differences in children’s responses to television advertising: An information-processing approach. Journal of Consumer Research, 8, 144–153.
36. Rozendaal, E., Buijzen, M., Valkenburg, P. M. (2011). Comparing Children's and Adults' Cognitive Advertising Competences in the Netherlands. Journal of Children and Media, 4(1), 77-89.
37. Rozendaal, E., Lapierre, A.M., E. A. V Reijmersdal, V. A. E., & Buijzen, M. (2011). Reconsidering Advertising Literacy as a Defence Against Advertising Effects. Media Psychology. 14(4). 333-354.
38. Šramová, B. (2015). Marketing And Media
Communications Targeted to Children as Consumers. Procedia - Social and Behavioural Sciences, 191, 1522-1527.
39. Stephens, N., &Stutts, M. A. (1982). Preschoolers’ ability to distinguish between
television programming and commercials. Journal of Advertising, 11, 16–26.
40. Stutts, M. A., Vance, D., & Hundelson, S. (1981). Program-commercial separators in children’s television. Journal of Advertising, 10, 16–25.
41. Oates, C., Blades, M., & Gunter, B. (2002). Children and television advertising: When do they understand persuasive intent? Journal of Consumer Behaviour, 1, 238–245.
42. Valkenburg, P. M., & Cantor, J. (2001). The development of a child into a consumer. Journal of Applied Developmental Psychology, 22, 61–
72. 43. Ward, S. (1972). Children’s reactions to
commercials. Journal of Advertising Research, 12, 37–45.
44. Ward, S., Wackman, D. B., &Wartella, E. (1977). How Children Learn to Buy: The Development of Consumer Information Processing Skills. Sage Publications.
45. Wimalasiri, Jayantha. (2004). A cross-national study on children's purchasing behavior and parental response. Journal of Consumer Marketing, 21, 274-284.
46. Wright, P., Friestad, M., & Boush, D.M. (2005). The development of marketplace persuasion knowledge in children, adolescents, and young adults. Journal of Public Policy & Marketing, 24, 222-233.
47. Young, B. M. (1990). Television advertising and children. Oxford, UK: Clarendon Press.
48. Zarouali, B., Poels, K., Walrave, M. and Ponnet, K. (2018), “You talking to me?” the influence of
peer communication on adolescents’ persuasion
knowledge and attitude towards social advertisements”, Behaviour & Information
Technology, Vol. 37 No. 5, pp. 502-516. 49. Zarouali, B., Pauw, D, P., Ponnet, K., Walrave,
M., Poels, K., Cauberghe, V., & Hudders, L. (2019). Considering Children’s Advertising
Literacy from a Methodological Point of View: Past Practices and Future Recommendations. Journal of Current Issues & Research in Advertising, 40:2, 196-213.

SJIF Impact Factor 2021: 8.013| ISI I.F.Value:1.241| Journal DOI: 10.36713/epra2016 ISSN: 2455-7838(Online) EPRA International Journal of Research and Development (IJRD) Volume: 6 | Issue: 8 | August 2021 - Peer Reviewed Journal
2021 EPRA IJRD | Journal DOI: https://doi.org/10.36713/epra2016 | www.eprajournals.com |115 |
A STUDY IN MEDICAL ASTROLOGY ON THE INFLUENCE OF LEO LAGNA ON DIABETES
S Sharma1, Sri Prathyangira Swamy2
1Research Scholar, Dept. of Astrology, Vels Int. of Science, Technology & Advanced Studies, Chennai, India
2Director & HoD, Dept. of Astrology, Vels Int. of Science, Technology & Advanced Studies, Chennai,
India
ABSTRACT The role of a medical astrologer is very important in maintaining mental and physical health. Horoscopes can be
used to predict when and how one's health is going to suffer, and this can make the horoscope conscious.
Navagrahas are the same color that had an impact on the human body. It is believed that the disease can be
eradicated by knowing their impact and then seeking medical attention. It was common for astrologers to appear in
the royal courts. Physicians would also treat patients surgically, and astrologers, in this case, were the ones who
handled the medicine very well. Based on this, they predicted the harm to the country, knew the disease coming
through it and treated the medical system accordingly.
KEYWORDS - Navagrahas, Dasa, Buddhi, Andara Nathan, Lagna, Rahu, Ketu.
I. INTRODUCTION Navagrahas are also having various impacts
on humans living on Earth from space. Thus it is said that when an impact occurs on humans their organs do not escape from that impact. Navagrahas are able to know about one’s health depending on where they
are located in one’s horoscope and their strength. Our
focus is to establish and confirm the theories concerning diabetes, the impact of the six - eight - twelve houses that cause diabetes, as well as the effect of the planets Venus, Jupiter, Saturn, and the Moon, which are also believed to be factors causing diabetes. The common saying is, "Life without disease is life without wealth." On this basis, no matter how much wealth one has, it is a wealth that will last forever in one's life without disease. Nature has shown us in many ways that every living thing is unique. Although everyone in a family has been following the same diet for many generations, not everyone in the family gets the same disease. This does not mean that diet alone is the root cause of diabetes. II. NAVAGRAHAS IN SIXTH HOUSE AND DISEASE
If there are many planets in the 6th place, will lose his fingers. The sun is in the 6th house, it causes tuberculosis, bile, fever, skin diseases, eye
diseases and epilepsy. There is a moon in the 6th house, eye related diseases, diarrhea, tuberculosis, syphilis, hiccups, epilepsy and stomach can occur. Mars is in the 6th house, there will be ulcers, fever, leprosy, bleeding, hemorrhoids, frog rash, fire blight etc. There is a Mercury in the 6th house, rheumatic fever, anemia, stomach, bloating, nose diseases can occur. There is a Jupiter in the 6th house, pneumonia, tongue disease, toothache, kunmam, Gastric disease, peptic ulcer and ear disease occur. If Venus is in the 6th house, it is said to cause osteoporosis, eye diseases, hemorrhoids, urinary problems, anemia, diabetes and genital diseases. Saturn in the 6th house is said to cause rheumatism, neurological diseases, psoriasis, leprosy and poisoning. If Rahu was in the 6th house the head would be bigger. It can cause foot and mouth disease, leprosy, heart disease, and poisoning, although it is said to be non-lethal. Ketu in the 6th house is said to cause insanity, poisoning, epilepsy etc. III. DIABETES - PLANETARY CAUSES There is no single cure for diabetes. This disease affects all zodiac signs. The causal planets for diabetes are Venus, Guru and Saturn. The 6th, 8th, and 12th sins of this disease, and the causal planets associated with water, are causal houses. In sinfulness 6 signifies disease, 8 signifies kidney

SJIF Impact Factor 2021: 8.013| ISI I.F.Value:1.241| Journal DOI: 10.36713/epra2016 ISSN: 2455-7838(Online) EPRA International Journal of Research and Development (IJRD) Volume: 6 | Issue: 8 | August 2021 - Peer Reviewed Journal
2021 EPRA IJRD | Journal DOI: https://doi.org/10.36713/epra2016 | www.eprajournals.com |116 |
damage, and the long-term effect of the disease the corresponding hardship and loss, and the 12th sign of rest and eyes. The eyes reflect the expressions of the liver. When the liver is affected, so are the eyes. Thus house 6th, 8th, 12th become the causative agent of diabetes. The body does not get enough rest when it affects half of the twelfth. The liver is affected when rest is reduced. So that the eyes are also affected. Liver disease affects all eyes in diabetics and affects the eyes. Venus signifies early diabetes and Guru signifies mature diabetes. Guru, Venus fusion represents the most mature (glycogen) diabetes. Venus represents glucose. Glycogen is the stored multiple glucose. The Guru also refers to this. The combination of Venus and Guru indicates the multiplicity of sugar components. Saturn is the planet that signifies the consequences of diabetes and the affected organs. IV. ASPECTS IN DIABETES HOROSCOPES
1. The planet in the star of the sixth lord creates or develops the disease of the planet seen with the sixth lord.
2. The sixth house in Lagna brings planetary disease and the planet standing in a star, a planet belonging to, a planet seen or developing disease that develops diabetes.
3. The two hostile planets are in the same zodiac sign or look at the same zodiac sign, the zodiac sign is to be treated for disease or surgery or injury.
4. Dasa, Buddhi brings disease when traveling in the negative zodiac signs in the constellation of the planets standing in the star of Andara Nathan.
5. The most visible planet in a horoscope and the least visible planet can cause or develop disease in the horoscope.
6. Rahu, Ketu, which is close to a lagna, is capable of congenital disease.
7. The planets that saw the sixth lord will get the disease of signfulness or housefulness or the planets who saw the sixth lord will get the disease of signfulness and housefulness.
8. The disease occurs because the planets have a transitional relationship with each other and are associated with six-eighth house interactions.
IV. RULES IN DIABETES HOROSCOPE
1. Diabetes is caused by the presence of Venus, Guru, Saturn, Moon planets in the 6th, 8th, 12th house lord.
2. 6th, 8th, 12th house lord if water zodiac sign has 6th lord in it then diabetes will occur.
3. Venus, Guru is one of these 6th, 8th, 12th house lord is in water zodiac so diabetes will occur.
4. Guru, Venus, Saturn planets Two of the three together cause diabetes because another sees them.
5. Guru Venus planets combination Diabetes is caused by being in or seeing the water zodiac.
V. DIABETES HOROSCOPE TABLES
Example Horoscope : 01 Date of Birth : 10.07.1960 Time of Birth : 09.30 AM Place of Birth : Needamangalam Lagna : Leo Signs : Capricorn Star : Shraavan - 2 Dasa Bhukthi : Moon Dasa 07 Years 02 Month 00 Days
JUPITER
MOON
SUN
KETU
NAVAMSA
VENUS
LAGNA
MERCURY
RAGU SATURN
MARS
MARS
SUN
VENUS
KETU
RASI
MERCURY
MOON LAGNA
RAGU
SATURN
JUPITER

SJIF Impact Factor 2021: 8.013| ISI I.F.Value:1.241| Journal DOI: 10.36713/epra2016 ISSN: 2455-7838(Online) EPRA International Journal of Research and Development (IJRD) Volume: 6 | Issue: 8 | August 2021 - Peer Reviewed Journal
2021 EPRA IJRD | Journal DOI: https://doi.org/10.36713/epra2016 | www.eprajournals.com |117 |
Rules applied in horoscope table: Rule 4: Jupiter, Saturn planets together cause diabetes because another sees them.
Example Horoscope : 02
Date of Birth : 09.08.1995 Time of Birth : 06.45 AM
Place of Birth : Thiruvarur Lagna : Leo
Signs : Saggitarius Star : Uthrashaada - 1
Dasa Bhukthi : Sun Dasa 05 Years 01 Month 10 Days
Rules applied in horoscope table: Rule 2: 8th house lord if water zodiac sign has 6th lord Saturn in it then diabetes will occur.
Rule 3: Jupiter is the 8th, house lord is in water zodiac so diabetes will occur.
Example Horoscope : 03
Date of Birth : 18.09.2016 Time of Birth : 04.45 AM
Place of Birth : Kudavasal Lagna : Cancer
Signs : Pieces Star : Revathi - 1
Dasa Bhukthi : Mercury Dasa 15 Years 11 Month 04 Days
LAGNA
MERCUR
Y
KETU
MARS
NAVAMSA
SATURN
SUN
VENUS
MOON RAGU JUPITER
SATURN KETU
RASI
SUN
VENUS
LAGNA
MERCURY
MOON JUPITER RAGU MARS

SJIF Impact Factor 2021: 8.013| ISI I.F.Value:1.241| Journal DOI: 10.36713/epra2016 ISSN: 2455-7838(Online) EPRA International Journal of Research and Development (IJRD) Volume: 6 | Issue: 8 | August 2021 - Peer Reviewed Journal
2021 EPRA IJRD | Journal DOI: https://doi.org/10.36713/epra2016 | www.eprajournals.com |118 |
Rules applied in horoscope table:
Rule 1: Diabetes is caused by the presence of Moon planets in the 8th house lord. Rule 5: Jupiter, Venus planets combination Diabetes is caused by being in or seeing the water
zodiac. VI. CONCLUSION
This study, entitled Diabetes in Medical Astrology, provides a comprehensive overview of patients being treated for diabetes in hospitals and the medications available to them. The purpose of this study is to find out how astrologers and planetary systems contribute to the horoscopes of diseased planets by obtaining their horoscopes and to learn about the effects of diabetes on others in the future and how to protect against it.
REFERENCES 1. Sathasivam M S, Uthrakalamiritham Moolamum
Uraiyum, Indhu Publications, Chennai, 2002. 2. Natesa Sasthrigal, Sathaga Palathipigai,
Kadalangudi Publications, Kadalangudi, 1995. 3. Gopikrishnan k, Parivaartha Rathnagaram,
Kumaran Publications, Chennai, 2005. 4. Kumarasami, Kalyanavarmar Saravali, Sri
Anandha Nilaiyam, Chennai, 2003. 5. Boopathi Rajan, Navagraha Jothida
Paripalanam, Abirami Publications, Chennai, 1982.
6. Hariharan k, Grahangal yethai kurikattukirathu, Krishnamoorthy Publications, Chennai. 1997.
7. Iyer P S, Jothida Ariviyal, Kerala Jothisha Publications, Madurai, 1993.
KETU
VENUS SATURN
SUN
NAVAMSA
JUPITER
MERCURY
MARS
MOON
LAGNA
RAGU
MARS
JUPITER
MERCURY
KETU
SUN
VENUS
SATURN
RASI
LAGNA
MOON
RAGU

SJIF Impact Factor 2021: 8.013| ISI I.F.Value:1.241| Journal DOI: 10.36713/epra2016 ISSN: 2455-7838(Online)
EPRA International Journal of Research and Development (IJRD) Volume: 6 | Issue: 8 | August 2021 - Peer Reviewed Journal
2021 EPRA IJRD | Journal DOI: https://doi.org/10.36713/epra2016 | www.eprajournals.com |119 |
A STUDY ON SOCIO-ECONOMIC STATUS OF FLORICULTURE FARMERS IN SHIRVA
Mr.Prashanth M D Dean of Commerce, Alva’s Pre-University College,
Sundari Anand Alva Campus, Vidhyagiri, Moodbidri, Karnataka, India, 574227
ABSTRACT The present study aimed to find out socio-economic status of floriculture farmers in Shirva village of Udupi
district. Floriculture in Shirva consists on large-scale cultivation of a traditional flower, the jasmine flower.
Because of its favorable temperature and proximity to a market facility, this region is one of the major producers of
Jasmine flower in Karnataka State. Total 40 farmers were selected, randomly from mentioned region. Researcher
used standard Socio Economic Status Scale constructed by Rajbir Singh, Radhey Shyam and Sathish Kumar to
collect data. The data from farmers were collected by contacting them personally with the help of structured
interview schedule.
The outcome reveals that most of Floriculture farmers have middle socio-economic status. The respondents
were allocated according to their scores to different socio- economic status groups. They were analyzed by
calculating the percentage and then the attempt was presented in suitable tables and figures. The outcome reveals
that most of Floriculture farmers in Shirva have middle socio-economic status.
KEYWORDS: Floriculture, Shirva, Jasmine flower, Socio-economic status etc.
INTRODUCTION
Floriculture is becoming a significant commercial crop in India. Floriculture is an ancient occupation, but until the 1990s, it was limited to a few families. However, over the previous decade, the situation has shifted. A growing number of farmers are growing a variety of flowers for both local and export purposes. According to Katyayan (1989), the annual flower commerce in our country reaches 100 crores. Karnataka is the state with the largest flower production in the country. This state produces 34,200 tons of flowers every year on an area of 6,900 hectares, accounting for almost one-third of national production. Singh (1997) underlined that floriculture is a rapidly growing business in India, it has increased 12.5 times in area and 33 times in trade from 1962. This rise in area and trade is due to socioeconomic reasons such as changes in people's social values and the environment, as well as an increase in population and living standards.
According to the Department of Horticulture, the district has approximately 8,000 jasmine cultivators. In the district, Udupi Mallige is grown on 116 hectares. There are 68 hectares in Udupi taluk, 45 in Karkala taluk, and three in Kundapur taluk. Jasmine flower cultivation occupies a unique position in the life and economy of Udupi and
Dakshina Kannada in coastal Karnataka so much that it is not only a household work but also a source of income and occupation for quite a number of households. About Shirva
Shirva is a village located 15 kilometers from Udupi, which serves as both the district and sub-district headquarters for Shirva village. Shirva village is also a gram panchayat, according to 2009 statistics. The village has a total land area of 3216.13 hectares. Shirva is home to a total of 13,396 people (Census 2011 data). Udupi is the closest town to Shirva. Floriculture in Shirva consists on large-scale cultivation of a traditional flower, the jasmine flower. Because of its favorable temperature and proximity to a market facility, this region is one of the major producers of Jasmine flower in Karnataka State.

SJIF Impact Factor 2021: 8.013| ISI I.F.Value:1.241| Journal DOI: 10.36713/epra2016 ISSN: 2455-7838(Online)
EPRA International Journal of Research and Development (IJRD) Volume: 6 | Issue: 8 | August 2021 - Peer Reviewed Journal
2021 EPRA IJRD | Journal DOI: https://doi.org/10.36713/epra2016 | www.eprajournals.com |120 |
25.86 39.66
34.48
Lower SES Average SES Upper SES
METHODOLOGY
The study was restricted to Shirva village located in Udupi district in Karnataka state. The list of farmers growing traditional flowers in Shirva village is collected through horticulture department of Udupi. Total 40 farmers were selected, randomly from mentioned region. Researcher used standard Socio Economic Status Scale constructed by Rajbir Singh, Radhey Shyam and Sathish Kumar to collect data. The data from farmers were collected by contacting them personally with the help of structured interview schedule.
The respondents were allocated according to
their scores to different socio- economic status groups. They were analyzed by calculating the percentage and then the attempt was presented in suitable tables and figures. ANALYSIS AND DATA INTERPRETATION
The collected information is labeled and tabulated using percentage measurements. The data were analyzed and interpreted according to the objective of the study. This chapter includes tables and figures which follow.
Table 1.The below table described the socio-economic status of floriculture farmers in Shirva
Level Raw score Percentage Low SES 03 3.75
Middle SES 58 72.5 Higher SES 19 23.75
Table 1 showing the raw score distribution and percentage of floriculture farmers of Shirva village. The research founds 3.75 percent of low SES, 72.5 percent middle SES and
23.75 percent higher SES farmers. The outcome reveals that most of Floriculture farmers have middle socio-economic status.
Figure 1.The following figure reflects the middle level socio economic status of floriculture farmers in
Shirva
Figure 1 shows the proportion of the middle
level socioeconomic status of floriculture farmers in Shirva. 25.86 percent of farmers have lower SES, 34.48 percent of farmers have average SES, and 39.66 percent of farmers have upper SES. It shows that most floriculture farmers are in upper socioeconomic status among Middle SES. Almost 80 percent of the land

SJIF Impact Factor 2021: 8.013| ISI I.F.Value:1.241| Journal DOI: 10.36713/epra2016 ISSN: 2455-7838(Online)
EPRA International Journal of Research and Development (IJRD) Volume: 6 | Issue: 8 | August 2021 - Peer Reviewed Journal
2021 EPRA IJRD | Journal DOI: https://doi.org/10.36713/epra2016 | www.eprajournals.com |121 |
area has been converted to flower agriculture. The majority of this area is dedicated to Jasmine cultivation (Mangalore Mallige). The most prevalent considerations are market proximity, low cultivation costs, easy of maintenance, and profitability. SUMMERY, CONCLUSION AND RECOMMENDATIONS
According to the demographics of the sample households, nearly 65 percent of families rely heavily on floriculture. Among the sample growers, the Christian community is found in large numbers. Behari (1993) reported that flowers can be used for decoration, adornment, garland making, banquets, extracting perfumes, preparation of Ayurvedic medicines, gulkand, essence industry, cosmetic preparation and soap manufacturing. Dried flowers, floral craft items and floral arrangement are used during festivals and marriages.
According to the farmers the family's well-being is dependent on the income generated from jasmine cultivation. Their income from floricultural activity accounts about 60% of their entire income. The welfare of the family depends on the income that they receive from Jasmine cultivation. Out of their total income 60% of income they receive from floricultural activity. The trends in area and production in the Shirva have shown rapid increase. However, the increase in yield is not significant. Apart from this, the area under floriculture is mainly concentrated in few villages despite the soil conditions in other villages being conducive to the growth of flowers.
Farmers were expected to convert to modern floriculture over time since it is more profitable than traditional floriculture and also they reports various problems which were coming in the way of better performance. Among these, lack of proper transport, market information, cold storage facilities and menace of middlemen were cited as major problems. Recommendations
Efforts are needed to increase the yield by providing technical guidance and supply of improved plants and seeds to increase yields and avoid concentration of flower cultivation in few village by extending extensive services to other districts for undertaking floriculture. The allocations to the floriculture development in Shirva are inadequate. Considering its potential in generating more income and employment than other crops the outlays have to be increased in the coming plans. The farmers lack adequate and cheap mode of transport and proper roads for quick marketing of the flowers, which are highly perishable in nature. These have to be provided to the villagers, which not only help the flower growers, but also for the overall development of the villages. Several farmers have indicated that
there is lack of suitable technology, proper knowledge about the use of quality planting materials, inadequate or absence of guidance have resulted in low productivity. These have to be made available to the farmers so that the farmers can reap the benefits of technology and increase their productivity. REFERENCES
1. Acharyya, P. and Panda, P.K. (1996). Floriculture a Promising Foreign Exchange Earner. Yojana 40(12): 17-19.
2. Ambad, S.N. (1997). Flowers Arrangement: an Art and Beauty. Kid. Hort 41(4): 4-5.
3. Apte, S.S. and Bhargava, S.C. (1998). Indo-Dutch Cooperation in Floriculture. Ind. Hort. 43(2) : 7-13.
4. Balasudhahari, T. (1997). Post Harvest Management of Cut Flowers. Indian Farmer Times 14(12): 17-18.
5. Chauhan, R.S. (1997). Inside Haryana Marigold Cultivation is Now Popular. Indian Farmer Times 14(11): 19-2
6. Chhabra. V. (1996) Prospects of Floriculture Industry in India. Yojana 40(12): 8-10.
7. Das, T.K. and Mitra, A. (1994). Some dimensions of marigold (Targetes Erecta L) marketing in Nadia District of West Bengal - A case study. Ind. Jour. Agril. Mktg. 36(4): 24-26.
8. Goyal, S.K. (1999). Economics of Rose Cultivation and its Marketing in Sonepat District of Haryana State. Ind. Jour. Agril. Mktg. 13(3) : 44-46.
9. ICAR (2000). Agriculture Research Data Book. Indian Agricultural Statistical Research, ICAR, New Delhi. pp 121.
10. Kundu, K.K.; Singh, J.; Singh, V.K. and Suhag, K.S. (!997). India's floriculture export- growth, status, constraints and export strategies and analysis. Ind. Jour. Agril. Mktg. 11(1&2) : 14-20.
11. Latha, B. and Brindha, N. (1994). Participation of Women in Seed Industry. Indian Farmer Times 12(5): 17-26.
12. Maity, R.G. (1997). Flowers as a Commercial crop in East and North-east. Nana 41(9): 21-24.
13. Mehta, S. (1995). Communication fidelity of need based training for farm women. Ph.D. thesis CCS HAU Hisar.
14. N.H.B. (1995). Rastria bagwani board Id. suvidhae. Udhyan Lok. 7(1): 37-38.
15. Padmanabhan, B.S. (1991). Unlimited Export Potential. The Hindu Survey of Indian Agriculture (Section 5): 197-198.
16. Parameswaran, K. (2002). Flowers Therapy. Employment News (9-15 March):2.
17. Pilla, S. (1993) Flowers can make earning easy. Indian Farmer Times 11(5): 4.
18. Ramphal (1993). Scope of Cut-flower Exports from India. Agri. Mktg. 36(1): 25-30.
19. Sindhu, S. (1995). Floriculture-boom days ahead. Indian Farmer Times 13(3): 15-16.
20. Sen, D and Rani G.J.(1990) Women in Dairing: a Case Study, J of Rural Dev. 9(5): 809-831.
21. Sharma, M.R. (2002). In India : Role of NABARD in Promoting Floriculture. Industry with Credit

SJIF Impact Factor 2021: 8.013| ISI I.F.Value:1.241| Journal DOI: 10.36713/epra2016 ISSN: 2455-7838(Online)
EPRA International Journal of Research and Development (IJRD) Volume: 6 | Issue: 8 | August 2021 - Peer Reviewed Journal
2021 EPRA IJRD | Journal DOI: https://doi.org/10.36713/epra2016 | www.eprajournals.com |122 |
Support. Ind. Hort. 46(4): 60-63. 22. Sharma, S. (2003). Development and Effectiveness
of Media on Women Operated Farm Machinery for Cotton Cultivation. Ph.D. thesis CCS HAU Hisar.
23. Sindhu, S.S. (1995). Present Status of Floriculture-Challenges, Opportunities and Constraints. Farmers and Parliament 15(1): 21-22.
24. Singh, H.P. (2002). Floriculture Industry in India: its Perspective. Ind. Hort. 46(4): 51- 56.
25. Tomer, B.S. and Singh, K.K. (2001). Producing Seed of Marigold. Ind. Hort. 45(4): 36- 37.
26. Vasavada A.P. (1995) Commercialization on Flower Culture, Indian Farmers Times 12(11): 15-18
27. Sindhu, S. (1995). Floriculture-boom days ahead. Indian Farmer Times 13(3): 15-16.
28. Sen, D and Rani G.J.(1990) Women in Dairing: a Case Study, J of Rural Dev. 9(5): 809-831.

SJIF Impact Factor 2021: 8.013| ISI I.F.Value:1.241| Journal DOI: 10.36713/epra2016 ISSN: 2455-7838(Online) EPRA International Journal of Research and Development (IJRD) Volume: 6 | Issue: 8 | August 2021 - Peer Reviewed Journal
2021 EPRA IJRD | Journal DOI: https://doi.org/10.36713/epra2016 | www.eprajournals.com |123 |
EFFECTS OF DIABETES IN LIBRA LAGNA BASED ON MEDICAL ASTROLOGY
S Sharma1, Sri Prathyangira Swamy2
1Research Scholar, Dept. of Astrology, Vels Int. of Science, Technology & Advanced Studies, Chennai, India
2Director & HoD, Dept. of Astrology, Vels Int. of Science, Technology & Advanced Studies, Chennai,
India
ABSTRACT In astrology one can study a wide variety of categories within oneself. In ancient times, astrology was highly
valued for its health benefits. The most prominent of these is medical astrology. Medical astrology has developed in
different ways in different countries and influenced by many different factors. Thousands of years ago, astrology
was practiced as a means of divination. In astrology, the sun, moon, planets, and outer space stars are used to
predict future events. Astrologers were the ones who handled the medicine very well here, while physicians also
offered surgical treatment to patients. Based on this, they predicted the harm to the country, knew the disease
coming through it and treated the medical system accordingly.
KEYWORDS - Navagrahas, Dasa, Buddhi, Andara Nathan, Lagna, Rahu, Ketu.
I. INTRODUCTION Nature has shown us in many ways that
every living thing is unique. Although everyone in a family has been following the same diet for many generations, not everyone in the family gets the same disease. This does not mean that diet alone is the root cause of diabetes. Our focus is to establish and confirm the theories concerning diabetes, the impact of the six - eight - twelve houses that cause diabetes, as well as the effect of the planets Venus, Jupiter, Saturn, and the Moon, which are also believed to be factors causing diabetes. 'Diabetes in Medical Astrology' presents a comprehensive review of diabetic patients being treated and medications available in hospitals and using astrology and the structure of the planets, this study seeks to determine which planets cause diabetes by analyzing their horoscopes, as well as how to protect themselves from this disease using astrology. II. CONGENITAL IMMATURITY IN DIABETES
Every human body has some immaturity in their body anatomy. Such immature zones lead to various diseases. Lesser the immature zones better the health condition. Congenitally immature parts of the body become the principal factors of death in the long run. Congenital immaturity is such a natural phenomenon which can't be resisted by any means.
Hence the life is dependent on the planetary influence. The reasons for Congenital immaturity were attributed to the strength of the birth star i.e., natal moon position. Congenital disease is a disease or disorder that is inherited genetically from immediate parents or some grandparents in the family dynasty. This can be either paternal side or maternal side. These symptoms of disease may be controlled in a generation, by medicines / by any other curative methods. Still the recurrence of such symptoms cannot be ruled out in any of the next generations in the family.
III. ASTROLOGY AND GENETICS DNA is chemical material that governs inheritance in living beings. The structure of DNA in human body has a similarity to the spiraling pattern of planets in solar system. DNA contains the code of human life. Planets indicate the cosmic code of life. Planetary configurations at conception and at birth time influence the genes of the child. The natal chart gives information on genes and genetic engineering in a body. IV. ASPECTS IN DIABETES HOROSCOPES
1. The planet in the star of the sixth lord creates or develops the disease of the planet seen with the sixth lord.

SJIF Impact Factor 2021: 8.013| ISI I.F.Value:1.241| Journal DOI: 10.36713/epra2016 ISSN: 2455-7838(Online) EPRA International Journal of Research and Development (IJRD) Volume: 6 | Issue: 8 | August 2021 - Peer Reviewed Journal
2021 EPRA IJRD | Journal DOI: https://doi.org/10.36713/epra2016 | www.eprajournals.com |124 |
2. The sixth house in Lagna brings planetary disease and the planet standing in a star, a planet belonging to, a planet seen or developing disease that develops diabetes.
3. The two hostile planets are in the same zodiac sign or look at the same zodiac sign, the zodiac sign is to be treated for disease or surgery or injury.
4. Dasa, Buddhi brings disease when traveling in the negative zodiac signs in the constellation of the planets standing in the star of Andara Nathan.
5. The most visible planet in a horoscope and the least visible planet can cause or develop disease in the horoscope.
6. Rahu, Ketu, which is close to a lagna, is capable of congenital disease.
7. The planets that saw the sixth lord will get the disease of signfulness or housefulness or the planets who saw the sixth lord will get the disease of signfulness and housefulness.
8. The disease occurs because the planets have a transitional relationship with each other and are associated with six-eighth house interactions.
IV. RULES IN DIABETES HOROSCOPE
1. Diabetes is caused by the presence of Venus, Guru, Saturn, Moon planets in the 6th, 8th, 12th house lord.
2. 6th, 8th, 12th house lord if water zodiac sign has 6th lord in it then diabetes will occur.
3. Venus, Guru is one of these 6th, 8th, 12th house lord is in water zodiac so diabetes will occur.
4. Guru, Venus, Saturn planets Two of the three together cause diabetes because another sees them.
5. Guru Venus planets combination Diabetes is caused by being in or seeing the water zodiac.
V. DIABETES HOROSCOPE TABLES
Example Horoscope : 01
Date of Birth : 03.10.1990 Time of Birth : 07.30 AM
Place of Birth : Chennai Lagna : Libro
Signs : Aquarius Star : Poorvabhadra - 3
Dasa Bhukthi : Jupiter Dasa 07 Years 07 Month 08 Days
Rules applied in horoscope table: Rule 1: Diabetes is caused by the presence of Venus planet in the 12th house lord. Rule 3: Guru is 6th house lord is in water zodiac so diabetes will occur.
VENUS RAGU SUN MARS
MOON
NAVAMSA
MERCURY
LAGNA SATURN
JUPITER KETU
MARS
MOON
RASI
KETU
JUPITER
,
RAGU
SATURN LAGNA
SUN
MERCURY
VENUS

SJIF Impact Factor 2021: 8.013| ISI I.F.Value:1.241| Journal DOI: 10.36713/epra2016 ISSN: 2455-7838(Online) EPRA International Journal of Research and Development (IJRD) Volume: 6 | Issue: 8 | August 2021 - Peer Reviewed Journal
2021 EPRA IJRD | Journal DOI: https://doi.org/10.36713/epra2016 | www.eprajournals.com |125 |
Example Horoscope : 02
Date of Birth : 04.06.1963 Time of Birth : 04.05 PM
Place of Birth : Kumbakonam Lagna : Libra
Signs : Libra Star : Swathi - 1
Dasa Bhukthi : Rahu Dasa 03 Years 04 Month 10 Days
Rules applied in horoscope table: Rule 1: Diabetes is caused by the presence of Venus planet in the 12th house lord Rule 2: 6th house lord if water zodiac sign has 6th lord Jupiter in it then diabetes will occur.
Example Horoscope : 03
Date of Birth : 10.07.1975 Time of Birth : 02.00 PM Place of Birth : Thiruvarur Lagna : Libra Signs : Cancer Star : Pushyaami - 4 Dasa Bhukthi : Saturn Dasa 09 Years 07 Month 17 Days
MOON
MARS
SUN
RAGU
LAGNA
NAVAMSA
JUPITER
MERCURY
KETU
VENUS SATURN
JUPITER MERCURY
VENUS SUN RAGU
RASI
SATURN MARS
KETU LAGNA
MOON
JUPITER
MOON LAGNA
MARS
NAVAMSA
RAGU
SATURN
KETU SUN
VENUS MERCURY
SUN
VENUS
KETU
MOON
MARS
MERCURY
SATURN RASI
RAGU JUPITER LAGNA

SJIF Impact Factor 2021: 8.013| ISI I.F.Value:1.241| Journal DOI: 10.36713/epra2016 ISSN: 2455-7838(Online) EPRA International Journal of Research and Development (IJRD) Volume: 6 | Issue: 8 | August 2021 - Peer Reviewed Journal
2021 EPRA IJRD | Journal DOI: https://doi.org/10.36713/epra2016 | www.eprajournals.com |126 |
Rules applied in horoscope table: Rule 2: 6th house lord if water zodiac sign has 6th lord Jupiter in it then diabetes will occur.
Rule 3: Guru is 6th house lord is in water zodiac so diabetes will occur. VI. CONCLUSION
This study, entitled Diabetes in Medical Astrology, provides a comprehensive overview of patients being treated for diabetes in hospitals and the medications available to them. The purpose of this study is to find out how astrologers and planetary systems contribute to the horoscopes of diseased planets by obtaining their horoscopes and to learn about the effects of diabetes on others in the future and how to protect against it.
REFERENCES 1. Sathasivam M S, Uthrakalamiritham Moolamum
Uraiyum, Indhu Publications, Chennai, 2002. 2. Natesa Sasthrigal, Sathaga Palathipigai,
Kadalangudi Publications, Kadalangudi, 1995. 3. Gopikrishnan k, Parivaartha Rathnagaram,
Kumaran Publications, Chennai, 2005. 4. Kumarasami, Kalyanavarmar Saravali, Sri
Anandha Nilaiyam, Chennai, 2003. 5. Boopathi Rajan, Navagraha Jothida
Paripalanam, Abirami Publications, Chennai, 1982.
6. Hariharan k, Grahangal yethai kurikattukirathu, Krishnamoorthy Publications, Chennai. 1997.
7. Iyer P S, Jothida Ariviyal, Kerala Jothisha Publications, Madurai, 1993.

SJIF Impact Factor 2021: 8.013| ISI I.F.Value:1.241| Journal DOI: 10.36713/epra2016 ISSN: 2455-7838(Online) EPRA International Journal of Research and Development (IJRD) Volume: 6 | Issue: 8 | August 2021 - Peer Reviewed Journal
2021 EPRA IJRD | Journal DOI: https://doi.org/10.36713/epra2016 | www.eprajournals.com |127 |
INHERITANCE OF MORPHOLOGICAL CHARACTERS IN F1, F2, F1В1 PLANTS OBTAINED
FROM HYBRIDIZATION OF SOME POLYMORPHIC SPECIES CORRESPONDING TO THE SECTION
MAGNIBRACTEOLATA
N.N. Nabieva1, B.Kh. Amanov2
ABSTRACT
In this article the analyzed F1 plants of hybrid combinations studied on inheritance of fiber color, in interspecific
F1 subsp. раniculatum x subsp.ruderale f.parnat (tan fiber) combination, an intermediate, i.e light tan color
fiber was observed, while in F2-plants 1:2:1 ratio was noted by fiber color. In studied reciprocal F1, subsp.
раniculatum x subsp.ruderale f.parnat (tan fiber) hybrid plants, analogical results were noted. F2 plants, a
separation was observed in terms of day length requirement at a ratio of 15:1, the plants of the 15th part were
observed as long-day non-demanding plants, and in the 1st part the plants were long-day demaning. In hybrid
plants where such a separation rate was studied, it was also found that the polymer genes were inherited under the
non-cumulative effect.
KEYWORDS: cotton, fiber color, morphological traits, dominant, wild, semi-wild, subspecies, photoperiod,
demanding plants, not demanding plants.
It is known that the fiber color of the cotton can be white, tan, light tan, reddish brown, golden, green, light pink, bluish-green, dark brown. Several scientists have conducted research on this character [4; 7; 8]. While one group of scientists reported that the fiber color marker is inherited monogenically, others noted that it is inherited polygenically.
B.Kh Amanov [1] conducted research on the inheritance of morphological traits of cotton. G.barbadense L., selected as the primary source, was observed to be in tan color by semi-wild f.pisco mark, while cultural Karshi-8 variety was observed to be in white color. In F1 Karshi-8 x f.pisco reciprocal combinations from F1 plants, the color was intermediate, i.e in light tan color. Of the 214 plants of the analyzed F2 Karshi-8 x f.pisco combination, 104 were light tan colored fibers, 54 were tan, and 56 were white fibers. Inheritance by fiber color was 1:2:1 (х2= 0.71, 0.95> R> 0.80), with incomplete dominant, monogenic inheritance.
In the researches of H.A.Muminov [3] determined in his research that in terms of fiber color, this trait was intermediate, i.e in light tan color in F1f.sanguineum х var.
1 Andijan Institute of Agriculture and Agrotechnology, 2Тashkent Region Chirchik State Pedagogical Institute,

SJIF Impact Factor 2021: 8.013| ISI I.F.Value:1.241| Journal DOI: 10.36713/epra2016 ISSN: 2455-7838(Online) EPRA International Journal of Research and Development (IJRD) Volume: 6 | Issue: 8 | August 2021 - Peer Reviewed Journal
2021 EPRA IJRD | Journal DOI: https://doi.org/10.36713/epra2016 | www.eprajournals.com |128 |
Table-1 Inheritance of initial sources and interspecific F1, F2, F1В1-plants by their fiber color
№
Initial sources and and F1, F2, F1B1
combinations
Number of studied plants,
pcs
white
tan
light tan
ratio
Х
2 Р
Pcs % pcs % pcs %
Initial sources subsp. раniculatum 5 5 100,0 - - 0,0 subsp.ruderale f.parnat (brown fiber) 5 - - 5 100,0 0,0 «Kelajak» variety 5 5 100,0 - 0,0 0,0
F1-plants subsp. раniculatum x subsp.ruderale f.parnat (brown fiber) 10 - - - - 10 100,0 subsp.ruderale f.parnat x subsp. раniculatum 10 - - - - 10 100,0 «Kelajak» variety x subsp.ruderale f.parnat (brown fiber) 10 - - - - 10 100,0 subsp.ruderale f.parnat (brown fiber) x «Kelajak» variety 10 - - - - 10 100,0
F2-plants subsp. раniculatum x subsp.ruderale f.parnat (brown fiber) 200 48 24,0 46 23,0 106 53,0 1:2:1 0,76 0,80-0,50 subsp.ruderale f.parnat x subsp. раniculatum 195 46 23,6 60 30,8 89 45,6 1:2:1 6,26 0,05-0,01 «Kelajak» variety x subsp.ruderale f.parnat (brown fiber) 215 63 29,3 49 22,8 103 47,9 1:2:1 1,345 0,80-0,50 subsp.ruderale f. parnat x «Kelajak» variety 220 53 24,1 62 28,2 105 47,7 1:2:1 1,19 0,80-0,50
F1B1-plants (subsp.раniculatum x subsp.ruderale f.parnat (brown fiber) х
subsp. раniculatum 30 30 100,0 - - - - 1:0
(subsp. раniculatum x subsp.ruderale f.parnat (brown fiber)) х subsp.ruderale f.parnat (brown fiber)
30 - - 30 100,0 - - 1:0
(Kelajak x subsp.ruderale (brown fiber) х Kelajak 30 30 100,0 - - - - 1:0 (subsp.ruderale f.parnat (brown fiber) x Kelajak) х
subsp.ruderale f. f.parnat (brown fiber) 30 - - 30 100,0 - - 1:0

SJIF Impact Factor 2021: 8.013| ISI I.F.Value:1.241| Journal DOI: 10.36713/epra2016 ISSN: 2455-7838(Online) EPRA International Journal of Research and Development (IJRD) Volume: 6 | Issue: 8 | August 2021 - Peer Reviewed Journal
2021 EPRA IJRD | Journal DOI: https://doi.org/10.36713/epra2016 | www.eprajournals.com |129 |
nanking plants obtained on the basis of hybridization of tropical f.harga (white fiber) and wild subsp.nanking (tan fiber) intraspecific forms of G.аrboreum L. In F2 plants, the trait is inherited in a 1:2:1 ratio and divided into 3 phenological classes, i.e., some hybrid plants have tan fiber, some have light tan, and some plants have white fibers. The results of the study showed that this trait is inherited in an incompletely dominant monogenic type.
Intraspecific diversity of the primary sources G.hirsutum L. and G.barbadense L. on which research were conducted on the inheritance of morphological traits of cotton, i.e., fiber color trait of subsp.ruderale f.parnat (tan fiber) was found to be in tan color, while subsp. раniculatum subspecies and cultural “Kelajak” variety was in white color. In the interspecific F1 "Kelajak" variety x subsp.ruderale ƒ.parnat (tan fiber) reciprocal combinations from the analyzed F1 plants, the trait manifested an intermediate, i.e light tan color. Out of 215 plants of interspecific F2
"Kelajak" variety x subsp.ruderale f.paranat (tan fiber) combination, 103 had (48,9 %) light tan color, 49 had (22,8 %) tan color, 63 had (29,3 %) white color fiber. In plants of this combination, the ratio of fiber color inheritance was 1:2:1 (х2= 1,345, 0.80> R> 0.50), and in plants of the above hybrid combination, fiber color inheritance was incompletely dominant, monogenic inheritance was observed (Table 1).
From F1 plants of hybrid combinations studied on inheritance of fiber color, in interspecific F1 subsp. раniculatum x subsp.ruderale f.parnat (tan fiber) combination, an intermediate, i.e light tan color fiber was observed, while in F2-plants 1:2:1 ratio was noted by fiber color. In studied reciprocal F1, subsp. раniculatum x subsp.ruderale f.parnat (tan fiber) hybrid plants, analogical results were noted.
The results obtained in the analyzed F1В1 hybrid generations (Table 1) are further confirmed by the data presented in the literature. That is, according to B.Kh.Amanov [2019], N.G.Simongulyan, U.Kh.Mukhamedkhanov [1973], the fiber color trait is controlled by three pairs of genes, two of which are primary complementary genes and one is an additional gene that enhances their effects.
The evolution of photoperiodism in plants is inextricably linked with the moving of cotton to tropical regions for early ripening, to the northern regions with naturally long days (photoperiod). Due to the polymorphism of the initial day length requirement in cotton, various mutations and natural and artificial selections resulted in the formation of forms with low sensitivity to day length, precocious and almost neutral to day length [5]. In particular, the use of wild species, intraspecific diversities and forms of cotton in genetic and selection research has attracted the attention of local scientists in the analysis of the inheritance of traits such as typical morphobiological traits of species, i.e, their requirement for length of the day, their fiber color, anthocyanin spot on the petals, branching type, hair color, hairlessness, lack of fiber and chlorophyll, male infertility features, and there is little research in this area [2].
B.Kh. Amanov [2] analyzed the inheritance of photoperiodic reaction of intra- and interspecific F2 plants obtained on the basis of hybridization of wild G.barbadense L. species and wild G.darwinii Watt species. For example, when analyzing F2Аsh-8 х f.brasiliense reciprocal hybrid combinations, 196 out of 207 hybrids (hs = 4-15) were neutral for long-day, 11 (hs = 15-20 and above) required photoperiod, and photoperiodic reaction was observed to be inherited under the non-cumulative effect of polymer genes in a 15: 1 ratio.
In the research of F.U.Rafieva [4], G.mustelinum x “Beshqahramon” hybrid combinations obtained on the basis
of interspecific hybridization of tetraploid cotton species showed a wide range of variability in long-day conditions in F2 hybrids according to analysis of the inheritance of the trait of requirement for day length. The inheritance of 15:1 ratio of the studied trait determined that the polymer genes were controlled by the nocumulative effect.
Inheritance of the trait of requirement for day length in F2 plants obtained by hybridization of intraspecific G. hirsutum L. and G. barbadense L. diversities and wild G.darwinii species was analyzed. G.hirsutum L. subs.mexicanum var.nervosum, G.hirsutum L. subs.раniculatum, G.barbadense L. subs. ruderalе f.parnat forms and G.darwinii species which were selected as initial source were found to require day length, their first yielding branches appeared at the 15-28 nodes on the long day, while on short day at 3-9 nodes. G.hirsutum L. and G.barbadense L. intraspecific diversities and G.darwinii species demand the day length, the first fruiting branches locate at 23-30 nodes on the long day (13-15 hours), while in the artificial short day (10 hours) they locate at 9-10 nodes (Table 2).
Interspecific F1, F2f.parnat x Kelajak combination was analyzed. The studied F1 plants were able to easily form buds, flower, to form bolls and ripen on the long day, while the F2 generation plants were found to be widely variable on long day conditions. The variability of the first fruiting branch (hs) was determined at 4-5, at 25 and in the upper nodes. Of the 185 hybrids of F1 plants, 173 (hs = 4-15) were neutral for long-day and 12 (hs = 15-25 and above) were long-day-demanding plants.
The results of the genetic analysis performed showed that the results obtained in practice were determined close to the expected theoretical parameters. The inheritance of the trait of the requirement for long day at 15:1 ratio was found to be controlled by the non-cumulative effect of polymer genes, the demand of the semi-wild f.parnat form for the photoperiod was noted in the literature, [2; 7] neutral reaction for the long-day with 3 recessive genes ph1, ph2, ph3, shows that it is controlled by two dominant genes, Рh1, Рh2, and one recessive ph3 gene. In this case the results were between χ2=0,017, Р=0,80-0,50.
When F2 G.darwinii x Kelajak combination was analyzed, 189 out of 202 hybrid plants (hs = 4-15) were identified as not demanding a long day, 13 (hs = 15-25 and above) were identified as long day demanding-plant, and the demanding reaction to the length of the day was found to be

SJIF Impact Factor 2021: 8.013| ISI I.F.Value:1.241| Journal DOI: 10.36713/epra2016 ISSN: 2455-7838(Online) EPRA International Journal of Research and Development (IJRD) Volume: 6 | Issue: 8 | August 2021 - Peer Reviewed Journal
2021 EPRA IJRD | Journal DOI: https://doi.org/10.36713/epra2016 | www.eprajournals.com |130 |
inherited at 15:1 ratio under the cumulative effect of polymer genes.
Of 35 plants of F1В1 (f.рarnat х Kelajak) х f.рarnat backcross combination, 16 were found as long day demanding plants (45,7 %), 19 were (54,3 %) found as long day not demanding plants, the inheritance of this trait was noted at 1:1 (х
2=0,257, 0,95>Р>0,80) ratio.
In this hybrid combination, 1 group plants were found as long day demanding, 1 group as long day not demanding plants. In addition, out of 30 plants of F1В1 (Kelajak x G.darwinii) x Kelajak backcross combination, 30 (100%) long-day non-demanding plants were observed and the inheritance of the day length demanding trait was at 1:0 ratio.

SJIF Impact Factor 2021: 8.013| ISI I.F.Value:1.241| Journal DOI: 10.36713/epra2016 ISSN: 2455-7838(Online) EPRA International Journal of Research and Development (IJRD) Volume: 6 | Issue: 8 | August 2021 - Peer Reviewed Journal
2021 EPRA IJRD | Journal DOI: https://doi.org/10.36713/epra2016 | www.eprajournals.com |131 |
Table-2 The inheritance of interspecific F1, F2, F1 B1-plants according to photoperiod-demanding trait
№
Initial sources and
F1, F2, F1B1 hybrid combinations
Number of studied
plants, pcs
photoperiod
ratio
Х
2
Р
demanding plants, number
not demanding plants, number
pcs % pcs %
Initial sources 1 G.hirsutum L. subs.mexicanum var.nervosum 10 10 100,0 - - 2 G.hirsutum L. subs. pаniculatum 10 - - 10 100,0 3 G.hirsutum L. subs.euhirsutum “Kelajak” variety 10 - - 10 100,0 4 G.barbadense L. subs. ruderalе f.рarnat (brown fiber) 10 10 100,0 - - 5 G.barbadense L. subs. еubarbadense (Surkhan-9) 10 - - 10 100,0 6 G.darwinii Watt 10 10 - - -
F1-plants 1 f.parnat х “Kelajak” 10 - - 10 100,0 2 “Kelajak” х f.parnat 10 - - 10 100,0 3 G.darwinii х “Kelajak” 10 - - 10 100,0 4 Kelajak х G.darwinii 10 - - 10 100,0
F2-plants 1 f.parnat х “Kelajak” 185 12 6,5 173 93,5 1:15 0,017 0,80-0,50 2 “Kelajak” х f.рarnat 190 14 7,3 176 92,6 1:15 0,405 0,80-0,50 3 G.darwinii х “Kelajak” 202 13 6,5 189 93,5 1:15 0,95 0,50-0,20 4 “Kelajak” х G.darwinii 195 11 5,6 184 94,3 1:15 0,12 0,80-0,50
F1B1-plants 1 (f.рarnat х “Kelajak”) х f.рarnat 35 16 45,7 19 54,3 1:1 0,257 0,95-0,80 3 (“Kelajak” х f.parnat ) х “Kelajak” 16 - - 16 100,0 1:0 - - 4 (G.darwinii х “Kelajak”) х G.darwinii 30 14 46,7 16 53,3 1:1 0,133 0,95-0,80 5 (“Kelajak” х G.darwinii) х “Kelajak” 30 - - 30 100,0 1:0 - -

SJIF Impact Factor 2021: 8.013| ISI I.F.Value:1.241| Journal DOI: 10.36713/epra2016 ISSN: 2455-7838(Online) EPRA International Journal of Research and Development (IJRD) Volume: 6 | Issue: 8 | August 2021 - Peer Reviewed Journal
2021 EPRA IJRD | Journal DOI: https://doi.org/10.36713/epra2016 | www.eprajournals.com |132 |
The analysis of the initial studies showed that the complete dominance of long-day non-demanding plants in F1-plants was observed in the interspecific species f.parnat x Kelajak, G.darwinii x Kelajak combinations which were studied on the inheritance of the trait of demand for day length. Consequently, in the analyzed F2 plants, a separation was observed in terms of day length requirement at a ratio of 15:1, the plants of the15th part were observed as long-day non-demanding plants, and in the 1st part the plants were long-day demaning. In hybrid plants where such a separation rate was studied, it was also found that the polymer genes were inherited under the non-cumulative effect. REFERENCES
1. Amanov B.Kh. Genetic diversity of Perivian cotton species and inheritance of morphologic-economic traits// Cand.biol.sci.diss. Tashkent. 2010.-pp. 11-12. (in Uzbek).
2. Amanov B.Kh. Production of genetically enriched lines on the basis of intraspecific and interspecific hybridization of Peruvian cotton species.// Cand.biol.sci.diss. Tashkent. 2019.-pp. 25-26. (in Uzbek).
3. Muminov Kh.А. Intraspecific and interspecific phylogenic relations of G.herbaceum L. ва
G.arboreum L. cotton species diversities// Diss.on PhD. Tashkent. 2017.-pp. 11-12.(in Uzbek).
4. Rafieva F.U. Obtaining new donors on the basis of the study of phylogenetic origin of G.mustelinumMiers ex Watt. Species with other polyploidy species. Abst.diss (PhD). Tashkent. 2017.-pp. 12-15. (in Uzbek)
5. Rafieva F.U., Rizaeva S.М. Inheritance of morphological-biological traits of interspecific F2 hybrids for day length.// Materials from republican scientific-practical conference “Integration of
fundamental science and practice: problems and perspectives” - Tashkent. 2018. - pp. 40-41.(in Uzbek).
6. Sirojiddinov B.А. Phylogenetic relations of Australian and Indo-Chinese cotton species.// Diss.abs.Dsc. Tashkent. 2017.-pp. 10-13.(in Uzbek).
7. Simongulyan N.G., Mukhammedkhanov U. Inheritance of cotton color // Cotton growing. - Moscow, 1973. - №6. –p.53. (in Russian).
8. Saidaliev Kh., Khalikova М., Rahmonova R. Manifectation of some economic traits in naturally colored cotton specimens //Collection of works on cotton, alfalfa selection and seed-breeding. Tashkent, 2009. – pp. 42-45.(in Uzbek).

SJIF Impact Factor 2021: 8.013| ISI I.F.Value:1.241| Journal DOI: 10.36713/epra2016 ISSN: 2455-7838(Online)
EPRA International Journal of Research and Development (IJRD) Volume: 6 | Issue: 8 | August 2021 - Peer Reviewed Journal
2021 EPRA IJRD | Journal DOI: https://doi.org/10.36713/epra2016 | www.eprajournals.com |133 |
AN ANALYSIS TO WOMEN AND CHILD WELFARE DEPARTMENT IN KOLHAPUR DISTRICT
Dr. Shashikant Subrao Sanghraj
Associate Professor,Department of Political Science,Dr. Ghali College, Gadhinglaj, Dist. - Kolhapur. Maharashtra (India)
Article DOI: https://doi.org/10.36713/epra8170
DOI No: 10.36713/epra8170
INTRODUCTION
Women and Child Welfare Departments 1991 have been established. In 1993, our government set up an independent department for the development of women and children. The Women and Child Welfare Center in Maharashtra take care of the helpless, sheltherless, dependent, homeless, deaf and dumb and abandoned. Women and nuns (Devdasi) also get help in this project. Through special planning they provide education, training and protection services and rehabilitation facilities.
Such problems and solutions are considered in this research. In this research, Kolhapur District Women and Child Welfare Program and its adverse effects have been analyzed with the above objective chosen by the researcher. Among total population of India, half population is of women’s, nation’s
development is impossible without their development. Any country in the world can make progress by ignoring the power of women. We cannot make social, economic and political progress of the country without women. Today women have entered every field; they will be given the opportunity to go sour in their field. A number of projects have been launched for this purpose. Women empowerment is done through self-help groups. Before taking their progress in consideration, in the past how where their plight and how they achieve progress this is to be taken account. How these women enter in various fields? The journey of their struggle and plight to be pursuid and studied.
The Women's Welfare Department was established for the welfare and empowerment of
women. To make women self-reliant and independent, for the progress of women this project has to take assistance of government sectors, non-government organizations and other institutions. These departments work together in coordination, with the responsibility of maintaining and implementing various programs. In the case of women, justice has events and problems around the world. The status of women is interior to that of men. In today’s modern age every person is
enjoying happiness and joy through material progress. But women for their social status, concern with great hope at laws made for them. UNO is working to bring new vigour to their lives.
Women and Child Welfare Committees have been set up to run various schemes in Municipal Corporations, Municipal Councils / Nagar Panchayats in the State. This committee has given information about the programs to be run with reference letters and to the entire corporation, council as per the government decision.
However, according to variable situation there is necessary to improve or change in the scheme because of several schemes has been outdated. As well as may be in the Corporation Council / Municipality there is an improper execution of women schemes because of lack of adequate financial provision.
Definition of Women Empowerment
1. According to the Grifen the empowerment of women means the ability of women to take decision, to implement it, to organize women

SJIF Impact Factor 2021: 8.013| ISI I.F.Value:1.241| Journal DOI: 10.36713/epra2016 ISSN: 2455-7838(Online)
EPRA International Journal of Research and Development (IJRD) Volume: 6 | Issue: 8 | August 2021 - Peer Reviewed Journal
2021 EPRA IJRD | Journal DOI: https://doi.org/10.36713/epra2016 | www.eprajournals.com |134 |
to implement any activity such as public contact, financial transaction etc.
2. According to the Srilata Batliwala, “A well-known women activist has defined women’s
empowerment as, “the process by which
women gain greater control over the material and intellectual resources, and challenge the ideology of patriarchy and gender based discrimination against women in all institutions and structures of society.”
RESEARCH PROBLEM The current study is not intended to
understand general social welfare or the development of increased productivity. But the aim is to understand the real reach of the social welfare program to the target beneficiaries, including orphans childern, neglected and deprived women. It would attempt to understand the reach of different development schemes to the actual beneficiaries in Kolhapur district which include professional training to deprived women, annual aids for diets, facilities at institutions like orphanages and protection houses, facilities of loans. The researcher will study whether the benefits of these schemes reach the target beneficiaries. It is an open truth that the implementation of welfare programs like girl education, health, healthy diet and other development schemes is not carried out to the desired extent to alleviate social problems. Therefore, needy women and their children have to face different problems. OBJECTIVES OF STUDY
1. Analysis of allotted fund in women and children welfare of Kolhapur District.
2. Analysis of actual expenditure in women and children welfare of Kolhapur Municipal Corporation.
3. To suggest measures for improvement if necessary.
RESEARCH METHODOLOGY
Any research if necessary to methodology this research use only secondary data has been collected from Books, Journals, various years of socio-economic survey of Maharashtra, Annual Budgets, Annual Reports, and Official Records of the Kolhapur district for the period into consideration (2001 to 2018).
LIMITATIONS
The present research study has the following limitations
The study deals with only attempts of the Kolhapur district for women and children welfare.
The present study is limited to the period 2000-01 to 2017-18.
The present study considers only women and children welfare.
Data Analysis and Interpretation After consideration above all these things
government has been ordered to the entire Municipality, Council to develop women in all sectors.
1. Technical and Vocational Training for Women & Girls.
2. To run a Nursery / to provide tools / help to institutes which run nursery.
3. Arrange the Training Trip about work and Scheme for Representatives of Women in Kindergarten (K.g).
4. Encourage Grant to stop proportion of School Leakage of Backward Girls.
5. To honor students who have got maximum marks in std.10th to std. 12th exams, this honors those students who are in under municipal area.
6. Scheme for Physical Development and Self Defense Protection of Girls.
7. Training of Yoga for Women. 8. To Create Sports facilities in Girls School. 9. To create Gardens for the children and Sport
center for women. 10. Arrange competition for women and as well
as children to encourage their skills. 11. Hostels for Needy Women. 12. Establish Sales Center to Sale Products of
Women’s Saving Group. 13. Run Counseling Center for Women. 14. Arranging a health care camp to medical
check-up of girls and women. 15. To run a cleaning campaign in the region of
backward and in slum area. Women and Children welfare Committee has
all the rights to select or chose schemes from the above schemes.

SJIF Impact Factor 2021: 8.013| ISI I.F.Value:1.241| Journal DOI: 10.36713/epra2016 ISSN: 2455-7838(Online)
EPRA International Journal of Research and Development (IJRD) Volume: 6 | Issue: 8 | August 2021 - Peer Reviewed Journal
2021 EPRA IJRD | Journal DOI: https://doi.org/10.36713/epra2016 | www.eprajournals.com |135 |
Table no. 1
Expenditure on Women and Child Welfare department by Kolhapur District (Rs. In lakh)
Sr. No. Year Allotted Fund Actual Expenditure 1 2001-02 20.00 0.25 2 2002-03 21.75 0.90 3 2003-04 40.85 3.13 4 2004-05 38.22 0.25 5 2005-06 26.97 0.37 6 2006-07 27.10 2.99 7 2007-08 34.10 1.20 8 2008-09 40.00 7.91 9 2009-10 50.65 0.77 10 2010-11 70.00 29.48 11 2011-12 70.75 17.13 12 2012-13 40.00 23.57 13 2013-14 80.00 62.86 14 2014-15 200.00 71.82 15 2015-16 200.00 74.79 16 2016-17 143.00 61.03 17 2017-18 152.92 66.18
Average 73.90 24.98 SD 61.08 29.58 CV 82.65 118.44
CAGR 0.14 0.42 Maximum 200 74.79 Minimum 20 0.25
Source: Socio-Economic Survey of Kolhapur District. In this table no. 1 indicate that the
expenditure on women and child welfare department by Kolhapur district. The average Kolhapur district under allotted fund in women and child welfare department during the period 2001-02 to 2017-18 was 73.90 lakh respectively. The coefficient of variance allotted fund in women and child welfare department was 82.65 percent respectively. It means that allotted fund in women and child welfare department is fluctuating than Kolhapur district area. The compound annual growth rate of allotted fund in women and child welfare department was 0.14 percent respectively. The maximum allotted fund in women and child welfare department has been observed as 200 lakh in 2014-15 and 2015-16 in this year. Likewise the minimum allotted fund in women and child welfare department has been observed as 20 lakh respectively during the study period. This table concluding to that during the period 2001-02 to 2017-18 allotted funds in women and child welfare department is fluctuating.
The average Kolhapur district under actual expenditure in women and child welfare department the
period 2001-02 to 2017-18 was 24.98 lakh respectively. The coefficient of variance actual expenditure in women and child welfare department was 118.44 percent respectively. It means that actual expenditure in women and child welfare department is fluctuating than Kolhapur district area. The compound annual growth rate of actual expenditure in women and child welfare department was 0.42 percent respectively. The maximum actual expenditure in women and child welfare department has been observed as 74.79 lakh in 2015-16 this year. Likewise the minimum actual expenditure in women and child welfare department has been observed as 0.25 lakh respectively during the study period. This table concluding to that during the period 2001-02 to 2017-18 actual expenditure in women and child welfare department is fluctuating. CONCLUSIONS
1. The average Kolhapur district under allotted fund in women and child welfare department during the period 2001-02 to 2017-18 was 73.90 lakh respectively.

SJIF Impact Factor 2021: 8.013| ISI I.F.Value:1.241| Journal DOI: 10.36713/epra2016 ISSN: 2455-7838(Online)
EPRA International Journal of Research and Development (IJRD) Volume: 6 | Issue: 8 | August 2021 - Peer Reviewed Journal
2021 EPRA IJRD | Journal DOI: https://doi.org/10.36713/epra2016 | www.eprajournals.com |136 |
2. The coefficient of variance allotted fund in women and child welfare department was 82.65 percent respectively. It means that allotted fund in women and child welfare department is fluctuating than Kolhapur district area.
3. The compound annual growth rate of allotted fund in women and child welfare department was 0.14 percent respectively.
4. The maximum allotted fund in women and child welfare department has been observed as 200 lakh in 2014-15 and 2015-16 in this year. Likewise the minimum allotted fund in women and child welfare department has been observed as 20 lakh respectively during the study period. This table concluding to that during the period 2001-02 to 2017-18 allotted funds in women and child welfare department is fluctuating.
5. The average Kolhapur district under actual expenditure in women and child welfare department the period 2001-02 to 2017-18 was 24.98 lakh respectively.
6. The coefficient of variance actual expenditure in women and child welfare department was 118.44 percent respectively. It means that actual expenditure in women and child welfare department is fluctuating than Kolhapur district area.
7. The compound annual growth rate of actual expenditure in women and child welfare department was 0.42 percent respectively.
8. The maximum actual expenditure in women and child welfare department has been observed as 74.79 lakh in 2015-16 this year. Likewise the minimum actual expenditure in women and child welfare department has been observed as 0.25 lakh respectively during the study period. This table concluding to that during the period 2001-02 to 2017-18 actual expenditure in women and child welfare department is fluctuating.
SUGGESTION
1. Implementation of the government schemes is not transparent.
2. The government provides professional training to women. The government aid or scholarship given during the period of training is required to be increased.
3. Detail information of women and child welfare department schemes should be given at Grampanchayat.
REFERENCES
1. Mulani M.U. (2012), “Self Help Groups & Empowerment of Women”, Manas Publication
and Distributors, Jaipur, ISBN: 978-81-921743-5-8, pp.225.
2. Kamble P. S. (2001), “Finances of Kolhapur
Municipal Corporation”, (Ph.D. Thesis), Shivaji
University, Kolhapur. 3. More S. V. (2019), Women empowerment and
self-help group in Kolhapur Municipal Corporation and Sangli-Miraj-Kupwad Municipal Corporation, (Ph.D. Thesis), Shivaji University, Kolhapur.
4. Kawre K. D., (2014), Analytical study of the impact of Government welfare scheme of women and child welfare department in Akola District, (Ph. D. Thesis), Shri Jagdish Prasad Jhabarmal Tibrewala University Vidyanagari, Jhunjhun, Rajasthan.
5. Joshi A. (2017), women and child welfare schemes in India and how media can promote outreach, International Journal of Current Innovation Research, Vol. 3, Issue 12, pp. 947-954.
WEBSITES 1. www.kolhapurmunicipalcorporation.gov.in 2. www.shodhganga.ac.in

SJIF Impact Factor 2021: 8.013| ISI I.F.Value:1.241| Journal DOI: 10.36713/epra2016 ISSN: 2455-7838(Online) EPRA International Journal of Research and Development (IJRD)
Volume: 6 | Issue: 8 | August 2021 - Peer Reviewed Journal
2021 EPRA IJRD | Journal DOI: https://doi.org/10.36713/epra2016 | www.eprajournals.com |137 |
IMPACTS ON SIVACHARYA YOGA’S IN GEMINI LAGNA
P Valsala1, Sri Prathyangira Swamy2
1Research Scholar, Dept. of Astrology, Vels Int. of Science, Technology & Advanced Studies, Chennai, India
2Director & HoD, Dept. of Astrology, Vels Int. of Science, Technology & Advanced Studies, Chennai,
India
ABSTRACT In ancient times they predicted future events based on nature and the visible planets. The method of fortune-
telling, which then began on the basis of omens and fortune-telling, developed astrologically based on the planets by
the great development of astronomy over time. Astrology is an excellent mathematical method of calculating the
future of the country and the horoscope through the planets, zodiac signs and stars, to determine future events and
to predict future events.
KEYWORDS - Sivacharya, Ragu, Ketu
I. INTRODUCTION Astrology and spirituality are closely
related. There is no doubt that astrology helps us a great deal in protecting ourselves from the evils that befall us and in bringing us to the Lord. Lagna, Zodiac, Star, Yoga are predicted when one is born with the movements of the planets. Indian astrology is calculated based on the rotation of the moon. Indian astrology predicts 27 star clusters in our sky with the Moon passing by. The profession he does is predicted by putting the 10th house in one's favor. Predicting the 2nd house of Tanasthana, the 11th house of profit and the strength of the 10th, 2nd, 11th houses, it is said that the fortune-telling business is progressing and getting rich.
I. SIVACHARYAS - DESCRIPTION The Sivagams praise the Sivacharyas as
those who appeared directly from the five faces of Shiva. Sivacharyas who worship in Shiva temples are over sixteen years of age. Kamikamam says they must also be under the age of seventy. o qualify as „Sivachariyar‟, Kamikarakam, Yogajagam,
Sindhiyam, Kanagamam, Adam, Deeptha Aakamam, Kushmam. Sahasra Aakamam, Amsuman Aakamam, Rauvakamam, Magudagamam, Subrapetham, Vijayakamam, Kvasam, Swayambuvam, Analam, Veerikamam, Vimalakamam, Chandra Gnanam, Mukabimbakamam, Purothigitakamam, Lalitagamam, Siddhiyagamam, Santhanakamam.
Saivagama says that one should have mastered the twenty-eight types of Shastra tricks of Sarvoktamam, Parameswaram, Kiranagamam and Vadulagamam.
The Sivacharyas were Brahmins who studied the Vedas and the Agamas. Those who worship Lord Shiva according to the Sivagama mantras are also known as „Sivacharyas‟, with the
task of reciting the Vedas in general and Sivagama better. Sivacharya is also known as „Andanar‟ as he
possesses the Upanayana and the task of reading the scriptures. Since Sivacharya read Sivagama very well and stood in their way, he himself has the right to receive the priesthood and its way of teaching.
Saivars are divided into five types. Adi Saivar, Maha Saivar, Anusaivar, Avanthara Saivar, Prasavasivar. The Vedic Brahmin who worships Lord Shiva, who is the eternal Saiva, is said to be Adi Saiva, and the Vedic Brahmin who received Sivadeesa is said to be Maha Saiva, while others who have attained Sivadeesa are said to belong to other Saiva names.Adhisavars are also called Sivacharyas. These so-called „Sivacharyas‟ are the ones who
worship Lord Shiva in their homes in the form of Sivagams and in the Shiva temples.
II. ASPECTS IN SIVACHARYA HOROSCOPES
1. Position of Sun, Jupiter and Ketu planets in Sivacharya horoscopes.

SJIF Impact Factor 2021: 8.013| ISI I.F.Value:1.241| Journal DOI: 10.36713/epra2016 ISSN: 2455-7838(Online) EPRA International Journal of Research and Development (IJRD)
Volume: 6 | Issue: 8 | August 2021 - Peer Reviewed Journal
2021 EPRA IJRD | Journal DOI: https://doi.org/10.36713/epra2016 | www.eprajournals.com |138 |
2. Sun, Jupiter, Ketu contact in 1st, 9th, 10th houses.
3. Correlation between Sun, Guru, Ketu. 4. Rules for setting up Sivacharyar mission. 5. Relation of Sun, Jupiter, Ketu to the work
of Sivacharya. 6. The connection between the 9th house
and the work of Sivacharya.
III. RULES IN SIVACHARYA HOROSCOPE
Here mentioned the collected, compiled, analyzed and researched the horoscopes of Sivacharya‟s in horoscope table.
The following rules were taken from the study:
1. Sun, Jupiter and Ketu planets conjunction with 1st, 9th, 10th houses
2. Sun, Jupiter and Ketu planets aspecting with 9th house.
3. Sun, Jupiter and Ketu planets in 9th house. 4. Sun, Jupiter and Ketu in their padas. 5. Sun, Jupiter and Ketu planets aspects on
9th lord.
IV. SIVACHARYA’S HOROSCOPE TABLES
Example Horoscope : 01
Date of Birth : 21.07.1964 Time of Birth : 04.10 AM
Place of Birth : Namakkal Lagna : Gemini
Signs : Scorpio Star : Jheshta - 3
Dasa Bhukthi : Mercury Dasa 07 Years 08 Month 15 Days
Rules applied in horoscope table: Based on Rule 2: Ketu planet aspecting with 9th house. Based on Rule 3: Saturn planet in 9th house.
Example Horoscope : 02
Date of Birth : 27.11.1987 Time of Birth : 07.58 PM
Place of Birth : Erode Lagna : Gemini
Signs : Aquarius Star : Shravishta - 4
Dasa Bhukthi : Mars Dasa 00 Years 06 Month 20 Days
MERCURY
KETU
MOON
NAVAMSA
LAGNA
SATURN SUN
JUPITER
RAGU
MARS VENUS
JUPITER VENUS
LAGNA
RAGU
MARS
SATURN
RASI
SUN
MERCURY
KETU MOON

SJIF Impact Factor 2021: 8.013| ISI I.F.Value:1.241| Journal DOI: 10.36713/epra2016 ISSN: 2455-7838(Online) EPRA International Journal of Research and Development (IJRD)
Volume: 6 | Issue: 8 | August 2021 - Peer Reviewed Journal
2021 EPRA IJRD | Journal DOI: https://doi.org/10.36713/epra2016 | www.eprajournals.com |139 |
Rules applied in horoscope table: Based on Rule 4: Ketu and Sun Planets in their padas. Based on Rule 5: Ketu planet aspects on 9th lord of Saturn Planet.
Example Horoscope: 03
Date of Birth : 15.03.1998 Time of Birth : 11.58 AM
Place of Birth : Vellore Lagna : Gemini
Signs : Virgo Star : Hasta - 4
Dasa Bhukthi : Moon Dasa 00 Years 01 Month 17 Days
Rules applied in horoscope table: Based on Rule 1: Sun planet conjunction with 1sthouse Lord Mercury.
Based on Rule 3: Ketu and Jupiter planets in9th house. Based on Rule 4: Jupiter planet in the Ketu planet pada.
SATURN VENUS MERCURY
KETU
JUPITER NAVAMSA
LAGNA RAGU
MARS MOON SUN
JUPITER
RAGU LAGNA
MOON
RASI
VENUS SUN
SATURN
MERCURY
MARS KETU
VENUS
SATURN
KETU
JUPITER NAVAMSA
MOON
SUN
RAGU
MERCURY MARS
LAGNA
SUN
MERCURY
MARS
SATURN
LAGNA
JUPITER
KETU RASI
VENUS RAGU
MOON

SJIF Impact Factor 2021: 8.013| ISI I.F.Value:1.241| Journal DOI: 10.36713/epra2016 ISSN: 2455-7838(Online) EPRA International Journal of Research and Development (IJRD)
Volume: 6 | Issue: 8 | August 2021 - Peer Reviewed Journal
2021 EPRA IJRD | Journal DOI: https://doi.org/10.36713/epra2016 | www.eprajournals.com |140 |
V. CONCLUSION The study, entitled „The Impact of
the Sun, Jupiter and Ketu Planets in the “Sivacharya
Yoga‟s based on Taurus Lagna”, was done to know
more about the Sivacharya‟s who contribute to the
development of spirituality and devotion in the society and to help in further research. REFERENCES
1. Gopikrishnan k, Parivaartha Rathnagaram, Kumaran Publications, Chennai, 2005.
2. Sathasivam S M, Uththirakalaamirtham, Indhu Publications, Chennai, 2003.
3. Boopathi Rajan, Navagraha Jothida Paripalanam, Abirami Publications, Chennai, 1982.
4. Hariharan k, Grahangal yethai kurikattukirathu, Krishnamoorthy Publications, Chennai. 1997.
5. Iyer P S, Jothida Ariviyal, Kerala Jothisha Publications, Madurai, 1993.
SJIF Impact Factor 2021: 8.013| ISI I.F.Value:1.241| Journal DOI: 10.36713/epra2016 ISSN: 2455-7838(Online)
EPRA International Journal of Research and Development (IJRD) Volume: 6 | Issue: 8 | August 2021 - Peer Reviewed Journal
2021 EPRA IJRD | Journal DOI: https://doi.org/10.36713/epra2016 | www.eprajournals.com |141 |
BANGLADESH'S COOPERATIVE LEADERSHIP:
PATTERNS, ISSUES, AND PROSPECTS
Mrinmoy Mitra1, SK Muhammad Yeasin2
1Lecturer, Department of Business Administration, Shanto-Mariam University of Creative Technology 2Lecturer, Department of Business Administration, Shanto-Mariam University of Creative Technology
ABSTRACT Co-operative in Bangladesh has conceded its period on its system. In starting stage however it worked with
horticulture just, now it is working with financial circles. Considering its competency and successful utility in
post-free Bangladesh Co-operative Society is unavoidably perceived as of the most imperative divisions of the
economy. Genuinely Co-operative is built up as a social issue. The word cooperative, like the cooperative society, is
a collective noun. The term "cooperative," which refers to a collection of people working together, has been around
since the dawn of time. This might clearly distinguish between short-term/coincidental and long-term/permanent
cooperatives, as well as informal and formal traditional modern scientific, truly pure and psendo cooperatives, and
parochial cooperatives.
In this article, an effort has been made to understand the pattern of cooperative leadership by examining
their age, education, occupation, landholding, income, and other factors. The study will also highlight several
issues that co-operative groups face in Bangladesh, as well as potential solutions.
KEYWORDS: Cooperative societies, Economic contribution, Business Development, Leadership
BACKGROUND Co-operative Movement started its journey with the intent of helping the poor farmers and landless through providing agricultural and other credit to them. Later on, the scope and objectives of the movement were extended to weaver, fisherman, auto-rickshaw puller and so on. But the movement could not provide its services to its client’s up to the expectation. Researchers and practitioners found some factors responsible for this. The important factors were: lack of co-operative education and training, lack of effective and enlightened leadership, violation of established principles and practices and lack of commitment of both officials and co-operators. (Cooperative Movement, 2004)
Leadership is essentially an important factor of any organisations, especially co-operative organization. Leadership is a group of members who hold the high positions, enjoy high prestige and exert influence in a given society (A, 2001). In this study the members of the Managing Committee of the co-operative societies are considered as `Leaders'. Virtually leaders of the co-operative societies are the real `match-maker' who can cultivate, harvest and distribute the crops of the movement to the societies in a good manner. The co-operative leaders could
lead to do some good things in a good manner for the betterment of the societies (Abol Qasem, 2005)
Co-operative movement in this sub-continent has passed almost a century. During this period a lot of experiments were made on it. And as an outcome, it has taken different forms and shapes, types and dimensions. But the fact remains that cooperation as a way of emancipation for the poor achieved considerable failure instead of success. (Maruf, 2011)To many, this failure owed to a great extant, among other, to the dissatisfactory performance of the co-operative leaders. The leaders were wrongly selected, in most cases they really did not represent the client groups for which they were selected/elected, their commitment and dedication to the society were meagre and their quality and qualifications to run the society were almost absent. This is how it is important to know the socio-economic background of cooperative leaders. (Tofael, December 2009)
Some courses on Co-operative Management were held at Bangladesh Co-operative College (BCC), Comilla during 1992-93. Including 11 females forty cooperative leaders attended the courses. (Tofael, December 2009) The author took the opportunity to study their socio-economic back

SJIF Impact Factor 2021: 8.013| ISI I.F.Value:1.241| Journal DOI: 10.36713/epra2016 ISSN: 2455-7838(Online)
EPRA International Journal of Research and Development (IJRD) Volume: 6 | Issue: 8 | August 2021 - Peer Reviewed Journal
2021 EPRA IJRD | Journal DOI: https://doi.org/10.36713/epra2016 | www.eprajournals.com |142 |
ground. Thus an attempt has been made in this article to know the pattern of co-operative leadership analysing their age, education, occupation, landholding, income etc. The study will also highlight different problems as well as remedies of co-operative societies in Bangladesh.
2. OBJECTIVES
— To know the background of the co-operative leaders in terms of their age, occupation, education, landholding and other factors. — To study the role of cooperative leaders in performing different activities. — To know the problems of cooperative societies and probable solutions thereof.
3. SCOPE AND METHODOLOGY The study has been limited to analyse some selected issues of 40 co-operative leaders who attended the Co-operative Management courses conducted at BCC during 2021. Most of them belonged to the Savings and Credit co-operatives, Agricultural co-operatives, Women co-operatives, Fisherman co-operatives, Weaver's co-operative societies, etc. Out of 40 respondents under study 5 were
chairman, 14 managers and another 21 were the members of the Managing Committee. Information for the study was collected through a structured questionnaire.
4. LIMITATION There are approximately 11 lakh members of the Managing Committee of more than 1.26* lakh co-operative societies in Bangladesh. They are generally known as co-operative leaders.. (Directorate, 2020) For this study information were collected from only 40 leaders which may not representative
Still then, the effort may give a picture about the leadership pattern as well as problems and prospects of the co-operative societies in Bangladesh.
5. FINDINGS 5.1 Age:
Fifty percent of the leaders under study belonged to the age groups of 29-39 and 33% belonged to the age groups of 18-29. Thus it is obvious that younger have come to the cooperative leadership which constituted more than 82% of the total respondents (table-1).
Table-1 : Age of the. Co-operative Leaders
Age-groups No of respondents % 18 - 29 13* 32.5 29 - 39 20 50.0 39 - 49 4 10.0
49 and above 3 7.5 Total 40 100.0
* All are above 21 years. 5.2 Education Data shows that all of the leaders were literate. Their qualification ranged from class 1 to Masters degree. Remarkable feature is that about 33 % of the
respondents passed the SSC examination (table-2) It was also found that out of 11 female respondents 7 read up to class X
Table-2- : Educational Level of the Co-operative Leaders
Level of education No of respondents % I-V (Class) 2 5.0 VI - X 9 22.5 S.S.C 13 32.5 H.S.C 10 25.0 Bachelor Degree 5 12.5 Master Degree 1 2.5 Total 40 100.0 5.3 Occupation
The cooperative leaders are involved in as many as eleven occupations. It has been found that the highest number of respondents (33 %) have taken farming as their principal occupation. Less than 50 %
have subsidiary occupations (table-3). And again agriculture provides subsidiary sources of income to majority of them. Thus agriculture is dominant both as principal and subsidiary occupation.

SJIF Impact Factor 2021: 8.013| ISI I.F.Value:1.241| Journal DOI: 10.36713/epra2016 ISSN: 2455-7838(Online)
EPRA International Journal of Research and Development (IJRD) Volume: 6 | Issue: 8 | August 2021 - Peer Reviewed Journal
2021 EPRA IJRD | Journal DOI: https://doi.org/10.36713/epra2016 | www.eprajournals.com |143 |
Table-3: Occupations or the Co-operative Leaders
Occupations Subsidiary Main Farming
(%) Service
(%) Business
(%) House wife (%)
Tailoring (%)
Other (%)
No (%) Total (%)
Farming __ 3 (7.5)
1 (2.5)
__ __ 2 (5.0)
8 (20)
14 (35)
Service 3 (7.5)
__ __ __ __ __ 5 (12.5)
8 (20)
Business 2 (5.0)
__ __ __ __ 1 (2.5)
4 (10.0)
7 (17.5)
House wife __ __ __ __ 3 (7.5)
__ __ 3 (7.5)
Tailoring __ __ __ 1 (2.5)
__ __ __ 1 (2.5)
Medical Practice
1 (2.5)
__ __ __ __ __ __ 1 (2.5)
Poultry/ Raising
__ __ __ __ __ __ 1 (2.5)
1 (2.5)
Study __ __ __ __ __ __ 5 (12.5)
5 (12.5)
Total 6 (15.0)
3 (7.5)
1 (2.5)
1 (2.5)
3 (7.5)
3 (7.5)
23 (57.5)
40 (100)
No—have no subsidiary occupation Others— Lawyer, contractor and teacher. 5.4 Landholding It appears from the following table that more than 35 % of the leaders were small farmers and 27% were medium farmers having an average land of 1.5 and 4.9 acres respectively. 10% are big farmers with an average 27.30 acres of land and only 9 % are
landless having an average land of 0.35 acres (table-4) .This means that 70 % of leaders own only 41 % of land while only 10 % of leaders own 59 % of land. This shows a clear concentration of land in a few hands. However, most of the leaders came from small and medium farmer's group.
Table-4 : Land holding pattren of the Co-operative leaders.
Size of landholding (in acre) No. of
respondents % Average
holding 0.000 - 0.50 (Landless) 3 7.5 0.35 0.51 - 2.40 (Small farmers) 14 35.0 0.50 2.41 - 2.40 (Medium farmers) 11 27.5 4.90 7.41 and above (Big farmers) 4 10.0 27.30 Total. 32 80.0 -- *5 students and another 3 did not response. 5.5 Income : More than 22% i.e. about one-fourth of the respondents fell in the income group of taka 12001-24000/- However, the lowest and highest income of the leaders ranged from Tk, 2400/- to Tk, 1,20, 000/- per annum. Average income of the respondents was Tk, 36.532/ (table-5). Another sailent feature was that
12.5% leaders live along the subsistence level having an average income of Tk, 4680/-. Two women, two small farmers and one student (who is a private tutor) were in this group. Farming was the main source of income.

SJIF Impact Factor 2021: 8.013| ISI I.F.Value:1.241| Journal DOI: 10.36713/epra2016 ISSN: 2455-7838(Online)
EPRA International Journal of Research and Development (IJRD) Volume: 6 | Issue: 8 | August 2021 - Peer Reviewed Journal
2021 EPRA IJRD | Journal DOI: https://doi.org/10.36713/epra2016 | www.eprajournals.com |144 |
Table-5 : Annual Income of the Co-operative Leaders Income groups (in taka) No. of respondents % Average income
(in Tk.) Upto 6000 5 12.5 4680 6001 - 12000 5 12.5 9840 12001 - 24000 9 22.5 21200 24001 - 36000 6 15.0 33000 36001 - 48000 2 5.0 45000 48001 - 60000 4 10.0 60000 60001 - 95000 3 7.5 76000 95001 - and above 3 7.5 112000 Total 37* 95.5 36532 * Three did not response. 5.6 Positions of the Respondents in the Families
Data shows that more than 72 % of the respondents are the head of their family (table-6). Of them about 63 % belong to the age groups of 18-39. Thus it is clear that the co-operative leaders are not only the
leaders of the society, but also the leaders of their own families and most of them are young.
It should be mentioned here that 27.5 % did not reply. Some of them might be students and belonged to the joint families.
Table-6 : Position of the Co-operative Leaders in Their Families Type of respondents Head of the family
Nos. % Male of respondents 25 62.5 4 10.0 Total- 29 72.5 5.7 Past Involvement to the Managing Committee An attempt has also been made to know whether the cooperative leaders were involved with the Managing Committee in the past. It appears that about 37 % of the total respondents were previously
the members of the Managing Committee (table-7). That means they have been elected member of the Managing Committee for the second time. Their academic qualifications, honesty and sincerity played an important role to come to the power for second time.
Table-7 : Past Involvement of the Respondents to the managing Committee.
Age-groups No of respondents % Member of The Managing Committee in the past 15 37.5 Was not in the Managing Committee 18 45.0 Did not response 7 17.5 Total 40 100.0 5.8 Affiliation with other Institutions It was found that more than 53 % of the leaders have no affiliation to any political party. Only 27% have their affiliation to some major parties including the ruling ones. More than 32% leaders were related to some institutions like Union Parishad, Club etc. Most of them were holding the executive
posts (table-8). The average income of them was Tk, 52714/- per annum which is above than the average of total 40 leaders. It seems that they are considerably financially sound. Another 67% did not make any comment. So we can assume that they were not involved with such institutions.

SJIF Impact Factor 2021: 8.013| ISI I.F.Value:1.241| Journal DOI: 10.36713/epra2016 ISSN: 2455-7838(Online)
EPRA International Journal of Research and Development (IJRD) Volume: 6 | Issue: 8 | August 2021 - Peer Reviewed Journal
2021 EPRA IJRD | Journal DOI: https://doi.org/10.36713/epra2016 | www.eprajournals.com |145 |
Table-8: Involvement of the Co-operative Leaders with other Institutions Name of organization Designation Nos. %
Union Parishad Chairman/Member 5 12.5 Club General Secretary 4 10.0 Mukti Joddhah Sangsad Deputy Commander 2 5.0 Gram Sarker Chief 1 2.5 School Asstt. Teacher 1 2.5 Total 13 32.5 5.9 Kinship Relation Traditionally our kinship relation is very tight which may be considered as one of the indicators in measuring the nature and pattern of the leadership. (Barnes)The leaders were asked about the inclusion of their relatives in the Managing Committee. Only 32.5% told that they had own kin members, i.e. cousin, uncle, brother daughter, etc. in the Managing Committee of the societies. In response- to another query, 22.5% leaders replied the benefits of the society were not shared on equity basis. Rich and strong members were fully favoured over the weak/poor members in respect of facilities like loan, training, etc. Another 17% respondents reported that rich members were partially favoured. The rest did not make any comments. Thus it can be said that poor or weak
members of the societies are not given priority in getting loan and other facilities. 5.10 Settlement of Social Disputes To know the social status of the leaders, they were asked whether they were involved in settling down any social conflicts/disputes. (Beals, 1960) The information show that 20% of the total respondents played the role as 'Chief' and 30 % as 'Member' of the "Shalish Committee". Most of them are belonged to the age groups of 30-39. About 25% were present in the occasion as observers. And the rest 25% did not make any comments (table-9). The data reveals that the cooperative leaders are making contribution to the reconciliation of social disputes and other chaoes at the village level.
Table-9 : Role of Co-operative Leaders in Mitigating of Social Disputes
Role as Age groups Chief Member Observer Total
Nos. % Nos. % Nos. % Nos. % 18 - 29 3 705 3 7.5 3 7.5 9 22.5 30 - 39 4 10.0 7 17.5 5 12.5 16 40.0 40 & above 1 2.5 2 5.0 2 5.0 5 12.5 Total 8 20.0 12 30.0 10 25.0 30 75.0 5.11 Decision Making One of the important thrusts of the cooperative organizations is to involve the members in decision making. The cooperative leaders were asked about the participation of the members in decision making process. More than 82 % respondents were in favour of making decision in prior consultation with other members. On the
contrary, 17.5% were not in favour of discussing the members in-making decision. About the place of holding the meeting majority (55%) of the leaders reported that the meetings of the societies were held at the residence of the chairmen or manager. This may also influence the decision-making process to some extent.
6. PROBLEMS OF THE CO-OPERATIVE SOCIETIES IDENTIFIED BY THE RESPONDENTS
The co-operative leaders were asked to point out the basic problems they faced in the societies. They mentioned as many as five problems which are enumerated below (table-10).
Table- 10: Problems of the Societies Mentioned by the Respondents Problems No of respondents % — Lack of co-operative education and training 38 95.0 — Lack of capital 37 92.5 — Lack of society's office building 36 90.0 — Conflicts among leaders 25 62.5 — Financial indiscipline 23 57.5 Note : Some respondents have more than one opinion.

SJIF Impact Factor 2021: 8.013| ISI I.F.Value:1.241| Journal DOI: 10.36713/epra2016 ISSN: 2455-7838(Online)
EPRA International Journal of Research and Development (IJRD) Volume: 6 | Issue: 8 | August 2021 - Peer Reviewed Journal
2021 EPRA IJRD | Journal DOI: https://doi.org/10.36713/epra2016 | www.eprajournals.com |146 |
It seemed from the above table that the
extent and magnitude of the problems like lack of co-operative education, capital and society's office room were very acute.
7. SUGGESTIONS GIVEN BY THE RESPONDENTS The co-operative leaders gave some suggestions to overcome the problems mentioned above. They thought that if their suggestions would be taken care off, their societies might be benefited to a great extent. Suggestions given by them are furnished below (table-11).
Table-11: Suggestions Given by the Leaders for Future Development of the Co-operative Societies.
Suggestions No of respondents % — Loans should be given in time. 39 97.5 — Training on cooperatives should also be given to general co-operators
37 92.5
— Extension workers should make visit to the societies frequently
30 75.0
— Financial assistance is needed (for construction of the society's office room etc).
21 52.5
In addition, nine of the cooperative leaders mentioned that there should be provision for reward and punishment considering the level of performance. Again they (57%) thought that if adequate training on leadership and management could be arranged their contribution to the development of societies will certainly increase. 8. SUMMERY AND CONCLUSION 8.1 Summery 8.1.1 Comparatively young and middle-aged
people have been controlling the management of the co-operative societies.
8.1.2 All of the leaders interviewed are literate. It is a unique indication in the pattern of co-operative leadership which may play a positive role in developing the co-operative habit and culture among the co-operators as well as common people.
8.1.3 Majority of the co-operative leaders under study are the heads of their own families.
8.1.4 Most of the leaders are small and medium farmers having an average land of 1.50 and 4.90 acres respectively. And farming has taken as main occupation by the highest number of the leaders.
8.1.5 About 25 % have come from higher income groups while another 25% from lower income groups. More than 42% have come from a moderate lower and higher income groups. The average income is about Rk. 36,532/- per annum. Main source of their income is agriculture.
8.1.6 More than 32% leaders under query have their own kith and kin (cousin, aunt, uncle,
father, mother) in the Managing Committee of the societies.
8.1.7 Some leaders (20%) have been playing an important role as `chief' and some (30%) as 'member' of the Shalish Committee' in mitigating different social disputes at the village level.
8.1.8 More than 82 % co-operative leaders have opined in favour of discussion with the general co-operators in making any decision. Another 18% do not think so. They think that be-cause of illiteracy, the general co-operators cannot contribute to the decision making.
8.1.9 Some leaders (37%) have come to the Managing Committee for second time.
8.1.10 More than 32% have been involved in some institutions like gram sarker, union parishad, club etc. Besides, 27% have their affiliation to some major political parties.
8.1.11 Lack of co-operative education, lack of capital, conflicts among leaders etc. are the main problems of their societies as opined by almost all of the leaders. However they also made some suggestions such as disbursement of loan in time, training to the general co-operators, frequent visits to the societies by the officials etc. to these problems.
8.2 Conclusion In a developing country like Bangladesh where 80% of the total population live below poverty line, co-operative can play an important role in bringing the positive change in the socio-economic
SJIF Impact Factor 2021: 8.013| ISI I.F.Value:1.241| Journal DOI: 10.36713/epra2016 ISSN: 2455-7838(Online)
EPRA International Journal of Research and Development (IJRD) Volume: 6 | Issue: 8 | August 2021 - Peer Reviewed Journal
2021 EPRA IJRD | Journal DOI: https://doi.org/10.36713/epra2016 | www.eprajournals.com |147 |
conditions of the masses. Co-operative is a way of uniting people, encouraging them to save, investing savings for undertaking individual and joint ventures, making democratic decision and so on. However, the success of a co-operative society depends mainly on pattern and efficiency of co-operative leadership. (J, 2005) The co-operative leaders are the prime-mover of the co-operative societies. Once the age, the status and the wealth would determine the leadership in a society. But there occurred some changes in the pattern of co-operative leadership in course of time. Educated, sincere and younger people has started coming to the co-operative leadership. This is certainly a good indication to the success of co-operative movement contributing to increased leadership efficiency. The co-operative movement in Bangladesh could not achieve desired success mainly due to lack of (i) co-operative training and education, (ii) proper maintenance of books and accounts and (iii) unity among leaders. To run the co-operative societies in the right way the problems mentioned above need to be solved. First, both the co-operative leaders and the co-operators should be given intensive training on co-operative norms so that they will be aware of the duties and responsibilities. Second, necessary steps should be taken to maintain books and accounts properly. Persons concerned with accounts should also be provided training in this field. Again the leaders who are involved in accounts keeping should be made accountable to the general co-operators. Third, in many cases there observed conflicts among the co-operative leaders. Motivational training should be organised for them to develop the spirit of unity and cohesion. Finally, the frequent visits of co-operative officials to the societies can play an important role in smooth running of the co-operative societies. The problems of co-operative societies cannot be solved over night. However, these can be minimized if the co-operative leaders are active, dedicated, sincere, honest and committed.
BIBLIOGRAPHY 1. A, J. (2001). Potential application for Entrepreneur
Cooperatives in North . Entrepreneurship development and educational approach, 22.
2. Abol Qasem, S. (2005). The role of cooperatives in providing employment. Cooperative Development Axis of Third World countries, 43.
3. Barnes, J. A. (n.d.). Physical and Social Kinship. Chicago Press Journal, 28(03).
4. Beals, B. J. (1960). Conflict and Factionalist Dispute. JSTOR, 90, 110.
5. Directorate, C.-o. (2020). Statistics of the Department of Co-operatives. Dhaka: Co-operative Directorate.
6. J, H. P. (2005). THE DEVELOPMENT OF COOPERATIVES AND OTHER RURAL ORGANIZATIONS. WORLD BANK TECHNICAL PAPER, 56-89.
7. Maruf, R. (2011). Cooperative societies: a sustainable Development . IJSORT.
8. P, A. (2004). Cooperative Movement. New York: Encyclopedia Encarta.
9. Tofael, A. (DECEMBER 2009). THE DEVELOPMENT OF COOPERATIVE SECTOR OF BANGLADESH: SOME RECOMMENDATIONS, , . ANNUAL JOURNAL OF BARD.
SJIF Impact Factor 2021: 8.013| ISI I.F.Value:1.241| Journal DOI: 10.36713/epra2016 ISSN: 2455-7838(Online)
EPRA International Journal of Research and Development (IJRD) Volume: 6 | Issue: 8 | August 2021 - Peer Reviewed Journal
2021 EPRA IJRD | Journal DOI: https://doi.org/10.36713/epra2016 | www.eprajournals.com |148 |
AYURVEDIC MANAGEMENT OF KITIBA KUSHTA W.S.R TO PSORIASIS – A CASE STUDY
Karbari Santosh1, G K Prasad2 1PG Scholar, 2Professor, Department of Shalya Tantra, K V G Ayurveda Medical College and Hospital, Sullia
Corresponding Author: Karbari Santosh,PG Scholar, Department of Shalya Tantra, K V G Ayurveda medical college and hospital, sullia
ABSTRACT
Skin diseases are more prevalent in the present era due to the modernized lifestyle. In this era, people are more
concerned about their external beauty. In general Practice, 10-15% of the cases are skin diseases. Among all the
skin diseases psoriasis is the most prevalent and chronic one. The incidence of psoriasis has increased over the last
decades. This may be due to changes in human lifestyle, excess use of cosmetics, unhealthy and incompatible food
habits, unprotected pesticide usage, nutritional deficiency, mental stress, and lack of physical exercise are
commonly observed. WHO considers skin diseases as psycho cutaneous disease, which affects the body as well as
mind; it emphasizes the relation between skin and mind. In Ayurveda, all the skin diseases are explained under a
broad heading kushta (skin disease)and it is further classified as maha kushta (major skin disease) and kshudra
kushta (minor skin disease). Kitiba kushta (psoriasis) is one among the kshudra kushta(minor skin disease).
It affects tridosha (3 elements), rasa (body fluid), rakta (blood), and mamsa dhatu (muscular tissue), hence the
treatment of kitiba kushta (psoriasis) is a challenging task. This article explains the case of kitiba kushta
(psoriasis) with an ayurvedic approach towards the management.
KEYWORDS: Ayurveda, Kitiba kushta, Psoriasis, Shamana chikitsa, Shodana chikitsa
INTRODUCTION
The main aim of Ayurveda is to maintain the health of a healthy person and providing appropriate treatment to cure the disease. For which some codes of conduct are explained in classics. In modernized life, people are more attracted to the western lifestyle, food habits, and mental stress leading to many psychic and somatic disorders. Among those psoriasis is the one that is a more stressful disease for both patients and the physician. In Ayurveda, skin diseases are explained under a broad term called kushta (skin disease). They are further sub-divided into maha kushta (major skin disease) and kshudra kushta (minor skin disease).1 Excess intake of incompatible food habits, sedentary lifestyle, preservatives, and pesticide usage, mental stress, etc are considered as the main cause for the kushta (skin disease),2 which causes rasa (body fluid), rakta (blood), and mamsa (muscular tissue) dushti (vitiation) with tridosha dushti (vitiation of 3 elements)3. All types of kushta are considered tridoshaja (involvement of 3 elements). The specific dosha (element) involvement in the specific type of kushta (skin disease) is based on the particular dosha involvement in its samprapti (prognosis). Kitiba kushta (psoriasis) is one among the kshudra kushta (minor skin disease) having the Kapha (phlegm) – Vata (wind) predominancy.4 It has lakshanas (clinical features) like shyava vivarnata (blackish discoloration), khara sparsha (rough to touch), parusha (hardness to touch) which closely resembles psoriasis.5
Psoriasis is a chronic inflammatory skin disease that affects 2-3% of the world’s population6. It is
characterized by the presence of well-defined, erythematous, and scaly papules and plaques that occur especially over the scalp, ears, genitalia, and skin over bony prominences. The global prevalence of psoriasis varies from 0.12–8%, indicating that it is a common dermatosis. India has the prevalence of psoriasis varies from 0.5–1.5%.7

SJIF Impact Factor 2021: 8.013| ISI I.F.Value:1.241| Journal DOI: 10.36713/epra2016 ISSN: 2455-7838(Online)
EPRA International Journal of Research and Development (IJRD) Volume: 6 | Issue: 8 | August 2021 - Peer Reviewed Journal
2021 EPRA IJRD | Journal DOI: https://doi.org/10.36713/epra2016 | www.eprajournals.com |149 |
Case History A 22-year-old female patient came to OPD with chief complaints of whitish scaly patches present all
over the head associated with severe itching since 1 year. Brownish red patches with white scaly lesions over lower back and abdomen associated with itching since 1 year. Past History
No history of Diabetes mellitus, Hypertension, Thyroid dysfunction, or any metabolic disorder. No history of any major surgery. Family History No relevant family history as no one had a similar kind of illness in the family. History of Present Illness
The patient was apparently normal 1 year back. Gradually she developed reddish small lesions over - head, back, and abdomen, associated with itching. Over time the size of lesions got increased and they turned into brown patches covered with whitish scales. The itching was severe during the night and scaly discharge on itch. She consulted many general practitioners and dermatologists and took allopathic medications. She got symptomatic relief while taking these medications and got worse after the stoppage of the treatment. She was mentally disturbed about her illness. So she came to our OPD for taking Ayurvedic treatment. Personal History Appetite – reduced Bowel – hard stools, once in 2 days Micturition – normal frequency (6-7 times /day) and color Sleep – disturbed due to itching Diet – mixed Daily dietary routine 7:30 – Coffee/tea 9:30 – 10:30 – Breakfast – Lemon rice, roti with spicy chutney, upma, dosa, idli 2:00 – 3:00 – Lunch – Ragi mudde, rice, and sambar 5:00 – Coffee/ tea 9:30-10:00 - Dinner – Ragi mudde, rice, sambar, curd Non-veg – Chicken/mutton/fish – once a week Occupation – homemaker and works in the field Socioeconomic status – Lower middle class Treatment history – Took allopathic medications Habits – Coffee/tea - 3 times a day Examination Ashta sthana pareeksha: Nadi (pulse) – Kapha Vata Jihva (tongue) – Lipta (coated) Mala (bowel habit) – Vikruta (abnormal) – hard stools, once in 2 days Mutra (micturition) – Prakruta (normal) Shabda (sound) – Prakruta (normal) Sparsha (touch) – Khara sparsha (roughness of skin) Druk (vision) – Prakruta (normal) Akruti (built) – Madhyama (moderate built) General Examination Blood pressure – 130/80mmHg Pulse – 86 bpm Temperature – 98.6 F Respiratory rate – 20 cycles per minute Systemic Examination Skin and integumentary system : Shape – irregular
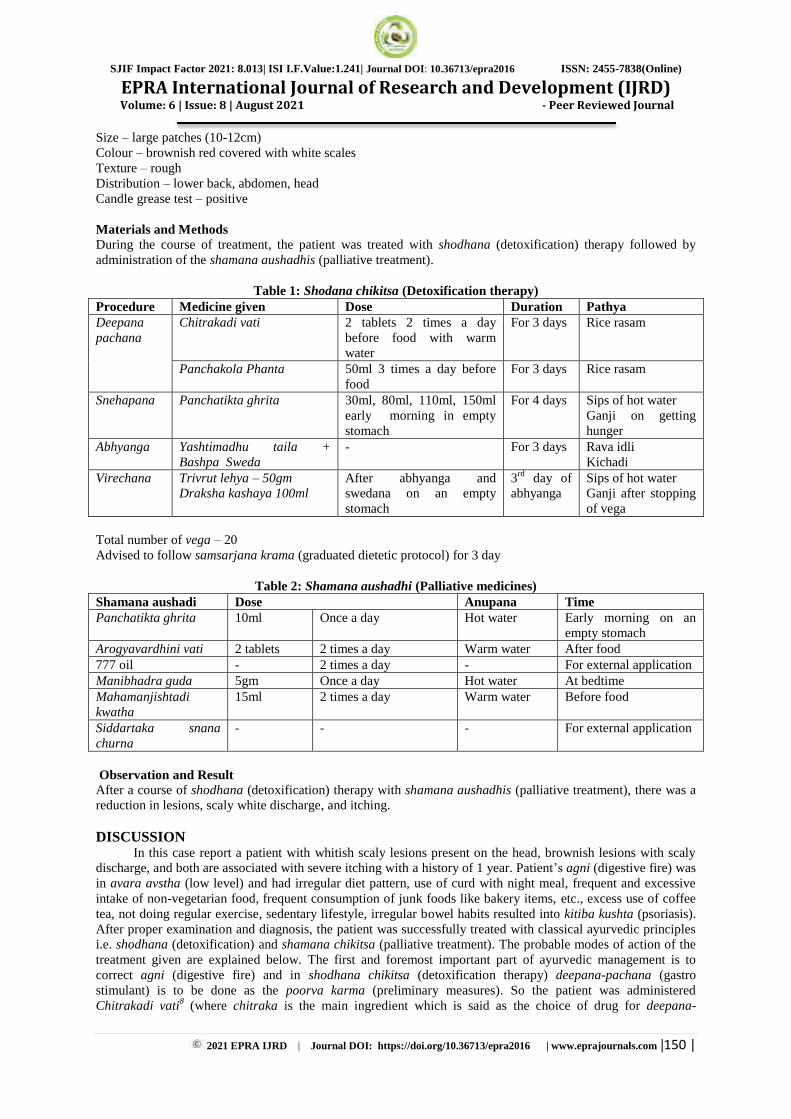
SJIF Impact Factor 2021: 8.013| ISI I.F.Value:1.241| Journal DOI: 10.36713/epra2016 ISSN: 2455-7838(Online)
EPRA International Journal of Research and Development (IJRD) Volume: 6 | Issue: 8 | August 2021 - Peer Reviewed Journal
2021 EPRA IJRD | Journal DOI: https://doi.org/10.36713/epra2016 | www.eprajournals.com |150 |
Size – large patches (10-12cm) Colour – brownish red covered with white scales Texture – rough Distribution – lower back, abdomen, head Candle grease test – positive Materials and Methods During the course of treatment, the patient was treated with shodhana (detoxification) therapy followed by administration of the shamana aushadhis (palliative treatment).
Table 1: Shodana chikitsa (Detoxification therapy) Procedure Medicine given Dose Duration Pathya Deepana pachana
Chitrakadi vati 2 tablets 2 times a day before food with warm water
For 3 days Rice rasam
Panchakola Phanta 50ml 3 times a day before food
For 3 days Rice rasam
Snehapana Panchatikta ghrita 30ml, 80ml, 110ml, 150ml early morning in empty stomach
For 4 days Sips of hot water Ganji on getting hunger
Abhyanga Yashtimadhu taila + Bashpa Sweda
- For 3 days Rava idli Kichadi
Virechana Trivrut lehya – 50gm Draksha kashaya 100ml
After abhyanga and swedana on an empty stomach
3rd day of abhyanga
Sips of hot water Ganji after stopping of vega
Total number of vega – 20 Advised to follow samsarjana krama (graduated dietetic protocol) for 3 day
Table 2: Shamana aushadhi (Palliative medicines)
Shamana aushadi Dose Anupana Time Panchatikta ghrita 10ml Once a day Hot water Early morning on an
empty stomach Arogyavardhini vati 2 tablets 2 times a day Warm water After food 777 oil - 2 times a day - For external application Manibhadra guda 5gm Once a day Hot water At bedtime Mahamanjishtadi kwatha
15ml 2 times a day Warm water Before food
Siddartaka snana churna
- - - For external application
Observation and Result After a course of shodhana (detoxification) therapy with shamana aushadhis (palliative treatment), there was a reduction in lesions, scaly white discharge, and itching.
DISCUSSION In this case report a patient with whitish scaly lesions present on the head, brownish lesions with scaly
discharge, and both are associated with severe itching with a history of 1 year. Patient’s agni (digestive fire) was in avara avstha (low level) and had irregular diet pattern, use of curd with night meal, frequent and excessive intake of non-vegetarian food, frequent consumption of junk foods like bakery items, etc., excess use of coffee tea, not doing regular exercise, sedentary lifestyle, irregular bowel habits resulted into kitiba kushta (psoriasis). After proper examination and diagnosis, the patient was successfully treated with classical ayurvedic principles i.e. shodhana (detoxification) and shamana chikitsa (palliative treatment). The probable modes of action of the treatment given are explained below. The first and foremost important part of ayurvedic management is to correct agni (digestive fire) and in shodhana chikitsa (detoxification therapy) deepana-pachana (gastro stimulant) is to be done as the poorva karma (preliminary measures). So the patient was administered Chitrakadi vati8 (where chitraka is the main ingredient which is said as the choice of drug for deepana-

SJIF Impact Factor 2021: 8.013| ISI I.F.Value:1.241| Journal DOI: 10.36713/epra2016 ISSN: 2455-7838(Online)
EPRA International Journal of Research and Development (IJRD) Volume: 6 | Issue: 8 | August 2021 - Peer Reviewed Journal
2021 EPRA IJRD | Journal DOI: https://doi.org/10.36713/epra2016 | www.eprajournals.com |151 |
pachana( gastro stimulant)) and Panchakola phanta9 to enhance digestive fire and to digest the ama. Later the patient was administered Panchatikta Ghrita10, a medicated ghee, for 4 days, with the dose of which was increased daily (Arohana snehapana) based on the time taken for digestion of the previous day dose. It contains 5 bitter herbs and it is mainly indicated in skin diseases, eczema, worm infestation, etc. Cow’s ghee is
considered an ideal base among the 4 lipid bases for the preparation of Ayurvedic formulations to target specific organs or tissues. The lipophilic action of ghee facilitates the transportation of active ingredients of herbal origin to the target tissue and their final delivery inside the cells11. Ghee is having anti-inflammatory activity due to its constituents like linoleic acid, which helps in reducing inflammation of the skin in psoriasis12. After the intake of medicated ghee for 4 days, the patient was given a whole-body massage with Marichadi Taila13, medicated oil, followed by a steam bath for 3 days. External application of emollients and other fatty substances has been proven to benefit the skin in psoriasis14. After this, Virechana (purgation therapy) was induced with Trivrut Lehya15, a herbal preparation causing purgation along with Draksha kashaya, which enhances the action of purgative medicine16. This whole process, called Shodhana in Ayurveda, helps for detoxification and purifies the body.
After this patient was administered with Panchatikta ghrita, Arogyavardhini vati, Mahamanjishtadi kashaya, Manibhadra guda daily along with 777 oil and Siddarthaka snana churna for external application. Panchatikta ghrita probably reduces the lesions of psoriasis due to its anti-inflammatory, anti-oxidant, and immunomodulation effects in psoriasis. Mahamanjishtadi kashaya, a polyherbal decoction, is usually recommended in Ayurveda for a variety of skin disorders. 777 oil is medicated oil where shwetha kutaja is the main ingredient that reduces dryness of skin associated with psoriasis and may help in reducing the hyperproliferation of keratinocytes. Siddarthaka snana churna is a polyherbal medicine mainly indicated in psoriasis to reduce the dryness and scaling of psoriasis. Manibhadra guda was administered as nitya virechana. Along with all the medications following proper pathya and avoiding apathy practice plays a very important role in any case of skin disorder. CONCLUSION
Psoriasis is a very common autoimmune disease and can be managed successfully by conventional medicine, poses challenges to a physician due to the long duration of the disease, social problems, tolerance, side effects, and complications over a long period. In Ayurveda, skin diseases are classified under the broad term Kushta and psoriasis can be considered as Kitiba kushta, which is a type of kushta. In the Ayurveda treatment principle of skin, disorder includes shodhana chikitsa (purification procedures) such as Vamana (emesis), virechana (purgation), and shamana chikitsa (palliative treatment) such as internal medicines and external applications. In the present case report, a case of scalp psoriasis and psoriasis over the abdomen and back was treated with virechana followed by internal administration of Mahamanjishtadi kashaya, Arogyavardhini vati, Manibhadra guda, Panchatikta ghrita along with the external application of 777 oil and Siddarthaka snana churna.
Hence it can be concluded that the ayurvedic principles are effective in the management of psoriasis. Following pathyapathya (do’s and don’ts) like Ahara (food), Vihara (lifestyle), Achara (regimen), and Vichara (thoughts) help to control the recurrence of disease and to maintain the health.
Figure 1: Before treatment Figure 2: After treatment

SJIF Impact Factor 2021: 8.013| ISI I.F.Value:1.241| Journal DOI: 10.36713/epra2016 ISSN: 2455-7838(Online)
EPRA International Journal of Research and Development (IJRD) Volume: 6 | Issue: 8 | August 2021 - Peer Reviewed Journal
2021 EPRA IJRD | Journal DOI: https://doi.org/10.36713/epra2016 | www.eprajournals.com |152 |
REFERENCE 1. Tripathi B,editor. Charaka samhita of Agnivesha volume 2, Chikitsa sthana;Kushta chikitsa:chapter 7,verse
13.Varanasi:Chaukhamba surbharati prakashan,2014;p 302 2. Tripathi B,editor. Charaka samhita of Agnivesha volume 1, Nidana sthana;kushta nidana;chapter 5,verse6.
Varanasi:Chaukhamba surbharati prakashan,2014;p 625 3. Tripathi B,editor. Charaka samhita of Agnivesha volume 1, Nidana sthana;kushta nidana;chapter 5,verse5.
Varanasi:Chaukhamba surbharati prakashan,2014;p 624 4. Tripathi B,editor. Charaka samhita of Agnivesha volume 2, Chikitsa sthana;Kushta chikitsa:chapter 7,verse 28-
29.Varanasi:Chaukhamba surbharati prakashan,2014;p 306 5. Tripathi B,editor. Charaka samhita of Agnivesha volume 2, Chikitsa sthana;Kushta chikitsa:chapter 7,verse
22.Varanasi:Chaukhamba surbharati prakashan,2014;p 305 6. Neena K, Kumar AS. World clinic series- Dermatology: Psoriasis. 1st edition. New Delhi: Jaypee publications;
2015:p 11-12 7. Neena K, Tejaswi TR. Step by step Psoriasis Management. 1st edition. New Delhi: Jaypee publications; 2011:p 1-
6 8. Tripathi B,editor. Charaka samhita of Agnivesha volume 2, Chikitsa sthana;Grahani chikitsa:chapter 15,verse 96-
97.Varanasi:Chaukhamba surbharati prakashan,2014;p 567 9. Acharya Sharangadhara. Sharangadhara samhitha with Dipika commentary of Kashirama. Edited by Pandit
Parashuram Shastri Vidyasagar. 2nd edition. Madhyama khanada; Churna kalpana: Chapter 6, verse 13-14: Varanasi: Nirnaya sagar press, 2013;p 180
10. Shastri RD,editor,14th ed. Bhaishajyaratnavali of Kaviraj ambikadatta shastri, Kushta rogadhikara:chapter 54,verse 257-260. Varanasi:Chaukhamba surbharati prakashan,2001;p 633-634
11. Mahakalkar A, Kashyap P, Bawankar R, Hatwar B. The versatility of cow ghee-an Ayurveda perspective. Am J Drug Deliv Ther 2014;1:p 28-34.
12. Ali H, Nawaz H, Saleem M, Nurjis F, Ahmed M. Qualitative analysis of desi ghee, edible oils, and spreads using Raman spectroscopy. J Raman Spectrosc 2016;47:706-1
13. Acharya Sharangadhara. Sharangadhara samhitha with Dipika commentary of Kashirama. Edited by Pandit Parashuram Shastri Vidyasagar. 2nd edition. Madhyama khanada; Sneha paribhasha: Chapter 9, verse 148-152: Varanasi: Nirnaya sagar press, 2013;p 227
14. Finlay A. Emollients as adjuvant therapy for psoriasis. J Dermatol Treat 1997;8:S25-7. 15. Sharma PV,editor,9th ed. Ashtanga hrudaya of Vagbhata,Kalpa sthana;virechana kalpadhyaya:chapter 2,verse 9.
Varanasi:Chaukhamba surbharati prakashan,2005;p 742 16. Tripathi B,editor. Charaka samhita of Agnivesha volume 1, Sutra sthana;Shadvirechana shatashritiya
adhyaya;chapter 4,verse13. Varanasi:Chaukhamba surbharati prakashan,2014;p 82

SJIF Impact Factor 2021: 8.013| ISI I.F.Value:1.241| Journal DOI: 10.36713/epra2016 ISSN: 2455-7838(Online)
EPRA International Journal of Research and Development (IJRD) Volume: 6 | Issue: 8 | August 2021 - Peer Reviewed Journal
2021 EPRA IJRD | Journal DOI: https://doi.org/10.36713/epra2016 | www.eprajournals.com |153 |
OBSERVATIONAL ANALYSIS ON RESULT OF YSZ COATED PISTON CROWN ON THE BEHAVIOUR OF A
PETROL ENGINE
Muhammad Asad Riaz Mechanical Engineer, Bahauddin Zakariya University, Multan, Punjab, Pakistan.
(Engineering Student, Department of Mechanical Engineering, Bahauddin Zakariya University, Multan, Punjab, Pakistan)
Article DOI: https://doi.org/10.36713/epra8270 DOI No: 10.36713/epra8270
ABSTRACT
An observational study of thermal barrier coating (TBC) on the working of 4-stroke single cylinder petrol engine was
studied. Yttria Stabilized Zirconia (YSZ) used as coating material. YSZ has less thermal conductivity,
sustainability under high temperature and pressure. Main aim of TBC is to decrease heat losses to the cooling jacket of
the engine. YSZ is coated on the piston crown by Plasma spray method. YSZ coating improves the performance of
petrol engine. Experimental study was carried out on 4-stroke single cylinder OHV petrol engine 25 °C inclined
cylinder horizontal shaft engine on performance of ceramic coated engine and compared with baseline engine under
different speed. Results show that ceramic coated engine is more effective than conventional engine as brake specific
fuel consumption (BSFC) is reduced 2-4% than normal piston engine, brake thermal efficiency (BTE) of modified
engine is expanded 4-8% than unmodified engine. Indicated thermal efficiency (ITE) of modified piston engine is
increased 5-10% than normal engine. Mechanical efficiency (ME) of the TBC engine is increased 4-10% than
standard engine. Volumetric efficiency (VE) of modified engine is decreased 3-9% when compared with standard
engine and exhaust gas temperature (EGT) of ceramic coated engine is increased 1-3% than unmodified engine.
KEYWORDS: Petrol Engine, Thermal barrier coating (TBC), Yttria Stabilized Zirconia (YSZ). Mechanical
Efficiency
I. INTRODUCTION AND BACKGROUND
In practice it is impossible to have a 100% adiabatic engine. At best the engine can reach 50-60% of adiabatic with advanced ceramics. In many cases the adiabatic engine is called the low heat rejection engine (LHRE), which more accurately describes the technology available today. As described earlier in an adiabatic engine there is no heat added or rejected. Theoretically one would like to make use of the exhaust that is released by the engine. The use of a turbocharger idealizes the no heat rejected concept by taking the high temperature exhaust and transferring work to the engine. In petrol engine EGT changes between 400-600°C for standard engine but in case of thermal barrier coated engine it changes between 700-900°C, while in turbo-charged engine it reached up to
1100°C. when temperature in thermal barrier coated engine reached such high temperature than the exhaust gasses such as carbon monoxide, Nitrogen oxide and many other hydrocarbons oxidize and exhaust gasses become less pollutant when compared with normal exhaust gasses. In figure 1.1 energy balance for conventional engine and ceramic coated engine is compared Büyükkaya. Ceramic material is light in weight and durable under high temperature and pressure which results improvement in results shows. Bryzik and Kamo reported that 35% reduction in engine dimensions and reduction in fuel consumption is 17% in TBC engine design in military tanks. In modern era, continues decrease in fossil fuels and increase in automobiles is directed towards invention to use fuels economically and increase

SJIF Impact Factor 2021: 8.013| ISI I.F.Value:1.241| Journal DOI: 10.36713/epra2016 ISSN: 2455-7838(Online)
EPRA International Journal of Research and Development (IJRD) Volume: 6 | Issue: 8 | August 2021 - Peer Reviewed Journal
2021 EPRA IJRD | Journal DOI: https://doi.org/10.36713/epra2016 | www.eprajournals.com |154 |
the performance of the engine. So, the engine always actuality undertakes on research, S. Jaichandar and P. Tamilporai [1]
Observational setup was conducted on ceramic material coating on the diesel engine performance of coating with 0.5mm, 1mm and baseline engine. Results shows that brake thermal efficiency (BTE) for 1mm ceramic coating is decreased 6% as the speed is increased but BTE for 0.5mm coating is increased up to 10% when compare with conventional engine. Exhaust gas temperature of 1mm ceramic coated engine is increased 10°C when compare with 0.5mm coated engine and baseline engine. VE decreases as the ceramic coating is increased Dennis Assanis et al [2]. Thermal barrier coated engine reduces the heat losses which increases the indicated thermal efficiency (ITE). In experimental setup, piston head was coated with Titanium dioxide on the diesel engine piston by atmospheric plasma spray method. In experimental setup, engine maintained at 1500 rev/mint for both modified and uncoated engine. Performance was examined at variable loads of 2,4,6 and 10 kg and constant speed of 1500 rev/mint. Brake specific fuel consumption (BSFC) decreased more in modified engine when compared with conventional engine. Coated engine increases brake thermal efficiency up to 3% than the standard engine. ITE is increased up to 3% from uncoated engine. Mechanical efficiency (ME) of the coated piston is increased up to 2% when compare with baseline engine Suresh Kumar Rupangudi et al [3]. Experiment was carried out with different load, velocity and injection timing for both coated and baseline engine. In experiment, it can conclude that piston head coating is more efficient than the cylinder crown coating in developing TE, brake power (BP), indicated power (IP) and decrease in the VE. Temperature of exhaust gas of thinly coated piston crown engine has high temperature than the cylinder head coating when compare with conventional engine coating of exhaust gas temperature. Peak cylinder pressure of the conventional engine is more than the cylinder head of coated engine and piston crown coated engine respectively. SFC of the piston head coated engine has less fuel consumption than the baseline engine E. M. Afify, D. E. Kleft [4]. Observational results are that ZrO2-Al2O3 coated piston BTE is increased when analyze with SiC modified piston and uncoated piston engine [5]. Observational examination on effect of TBC of spark ignition petrol engine was studied. Piston, liner, head, ports and valves were used in TBC engine Dennis N. Assanis and Tarun Mathur [6]. An analysis on working and exhaust emission of TBC engine with YSZ coating in combustion chamber was studied and compare with baseline engine. Results shows that it BSFC is decreased, TE is increased, in experiment various condition were studies that are fuel flow, exhaust temperature, exhaust emissions and fuel flow. Results indicates that
improvements in performance and emission [7]. BTE is increased 3% when compare with uncoated engine. ME is increased 2% more than conventional engine. Air-fuel ratio for modified engine is comparably more than conventional engine. Substantial expansion in exhaust gas temperature of coated engine compare to uncoated engine Suresh Kumar Rupangudi et al [8]. TBC is providing insulation which decrease heat losses. TBC engine working and emission results were comparing with conventional engine. BSFC of coated engine is decreased kg/KWh, BTE of coated engine is increased 5.99% when compare with conventional engine. HC emissions was decreased when compare with baseline engine Jayaram MUTHUSAMY et al [9]. In combustion engine the biggest quantity of energy transfers to environment in the form of thermal waste. A thin coating of ceramics material to the aluminum alloy piston reduced the thermal waste of energy which used as useful work. TBC of ceramics decrease the mass of fuel consumption 4.12%, BTE increases 12%, SFC decreases 2.65% and emissions reduced. [10].
- ° inclined cylinder horizontal shaft engine and aim of the coating is to protect the heat to move outside, somewhere it raise the TE and condensed the harmful gases against the exhaust as related to the conventional engine. Practical study about TBC on diesel engine performs at various loads. This coating acts as the insulation and increases the heat of the combustion chamber. Ceramic coated engine increases BTE as it depends on fuel consumption. Fuel consumption decreases in modified engine so BTE is increase, decreases VE, decrease in BSFC as it depends on the BP and as the BP is increased BSFC is decreases, increase the exhaust gas temperature (EGT) due to complete combustion when compared with standard engine. Coated piston increases BTE and decrease SFC at all loads. The thermal fatigue can be reduced, and the combustion and pressure have high heat release due to complete combustion.
Ceramic material becomes more important since the first invention of low heat rejection engine. Ceramic material has less thermal conduction coefficient and lower in weight when compare with the conventional engine material Gataowski. In modern time many types in quality is achieved. Now new material is named as advanced technology ceramics has been produced in late 20th century. Ceramic material consists of pure oxides such as Zirconia (ZrO2), Alumina (AlO2), Magnesia (MgO), Berillya (BeO) and other non-oxide also.
The most important material in ceramic materials is Zirconia due to its properties and application. The important property of Zirconia is its high temperature resistance when compare with other ceramic and conventional material used. When see on other properties of ceramic material than its melting point temperature and

SJIF Impact Factor 2021: 8.013| ISI I.F.Value:1.241| Journal DOI: 10.36713/epra2016 ISSN: 2455-7838(Online)
EPRA International Journal of Research and Development (IJRD) Volume: 6 | Issue: 8 | August 2021 - Peer Reviewed Journal
2021 EPRA IJRD | Journal DOI: https://doi.org/10.36713/epra2016 | www.eprajournals.com |155 |
durable under thermal shocks. Zirconia has high wear resistance and it is mostly used in diesel engine and other turbine blades to decrease heat transfer.
METHODOLOGY Coating Material
Zirconia can be found in three crystal structures. These are monolithic (m), tetragonal (t) and cubic (c)
structures. Monolithic structure is stable between room temperature and 1170 °C while it turns to tetragonal structure above 1170 °C. Tetragonal structure is stable up to 2379 °C and above this temperature, the structure turns to cubic structure. Usually cracks and fractures are observed during changing phases because of 8% volume difference while transitioning to tetragonal structure from monolithic structure.
Density (g/cm3) 4 Compressive Strength (MPa) 680 Micro Hardness 880 Boiling Point (°C) 2972 Modulus of Elasticity (GPa) 230 Toughness (MPa/m1/2) 3.20 P ’ R 0.27 Molar Mass (g/mol) 79.87 Thermal Conductivity (W/mk) 11.7 Melting Point (°C) 1870
Table 1.2 Zirconia Properties To avoid this and make zirconia stable in cubic
structure at room temperature, alkaline earth elements such as CaO (calcium oxide), MgO (magnesia), Y2O3 (yttria) and oxides of rare elements are added to zirconia. Zirconia based ceramic materials stabilized with yttria have better properties compared with Zirconia based ceramic materials which are stabilized by magnesia and m x Y ş , 1997; G ç , 1992). In practice, partially stabilized cubic zirconia (PSZ) which contains monolithic and tetragonal phases as sediments, is preferred
owing to its improved mechanical properties and importance of martensitic transition. Partially stabilized zirconia has been commercially categorized since the early 70s. Table contains partially stabilized zirconia types and their properties. Coating Process Technique used for coating is the plasma spray method. Information about the coating process is given in below table,
Coating Process Plasma spray Process Material Zirconia (ZrO3) Material coating 0.2 mm Binder NiCrAl Binder coating 0.1 mm
Table 1.3 Specification of Coating Process Plasma spray coating is method in which heated
materials are sprayed into the surface. There are two primary preferences primarily. First, it can be done at higher temperature in which melting of other known materials can be occur and second it can provide better heat transfer by others. In this method, materials which are in powder form and have some specific size can use easily. The main purpose of using plasma spray coating is to make a thin layer that has high protection values over a non-costly surface. Material places in the form of powder in this method then enters in plasma jet and it comes from plasma torch. Temperature in jet is 10,000 K which melts the material and run towards the substrate and at this place melted material deposited rapidly. There are two variants:
Spray and fuse, and spray fuse. In spray and fuse, the fusion is done after deposition using one of several techniques, such as flame or torch, induction, or vacuum, inert, or hydrogen furnaces. In spray-fuse, the deposition and fusion are done simultaneously.

SJIF Impact Factor 2021: 8.013| ISI I.F.Value:1.241| Journal DOI: 10.36713/epra2016 ISSN: 2455-7838(Online)
EPRA International Journal of Research and Development (IJRD) Volume: 6 | Issue: 8 | August 2021 - Peer Reviewed Journal
2021 EPRA IJRD | Journal DOI: https://doi.org/10.36713/epra2016 | www.eprajournals.com |156 |
Figure 3.2 Plasma Spray Coating System
Figure 3.4 Coated and Uncoated Piston Observational Step and Procedure
Single cylinder 4-stroke spark ignition engine is used in this experiment. Four stroke cycle engine s is working at completed four stroke of the piston or two revaluation of the crank shaft it is called as four stroke
engines. It has 68mm bore and 45mm stroke length. Power of the engine at study time is 3.5kW (4.8HP) and there is 3600 rpm. Engine showed in below figure.
Engine Type Four-stroke single cylinder OVH petrol engine Dry Weight 15.1 kg
Engine Oil Capacity 0.6 Liter Starter Recoil Net Power 3.6 kW (4.8 HP) / 3600 rpm Displacement 163 cm^3 Cylinder Sleeve Type Cast iron sleeve Bore x Stroke 68 x 45 mm Ignition System Transistorized Fuel Tank Capacity 3.1 Liter Dimension (L x W x H) 312 x 362 x 346 mm Max. net torque 10.3 Nm (1.05 kgfm) / 2500 rpm Cont. rated Power 2.5 kW (3.4 HP) / 3000 rpm
2.9 kW (3.9 HP) / 3600 rpm
Compression Ratio 9.0:1 Fuel cons. At cont. rated power 1.4 L/h - 3600 rpm
Table 1.4 Engine specification

SJIF Impact Factor 2021: 8.013| ISI I.F.Value:1.241| Journal DOI: 10.36713/epra2016 ISSN: 2455-7838(Online)
EPRA International Journal of Research and Development (IJRD) Volume: 6 | Issue: 8 | August 2021 - Peer Reviewed Journal
2021 EPRA IJRD | Journal DOI: https://doi.org/10.36713/epra2016 | www.eprajournals.com |157 |
With coated and non-coated piston, engine rpm set at 3600. Engine performance calculated with coated and non-coated engine at different speed and constant load. The experiments were conducted at four different speeds as 2000, 2500, 3000 and 3500 rpm. Other parameters calculated such as brake specific fuel consumption, brake
thermal and indicated thermal efficiencies, mechanical efficiency, brake specific energy consumption, air fuel ratio and exhaust gas temperature obtained. The variations of these parameters except exhaust gas temperature plotted with respect to Engine Speed and variation of exhaust gas temperature plotted with respect to Break Power.
Figure 3.5 Engine Test Bed Model. THO3
RESULTS AND DISCUSSION Brake Specific Fuel Consumption
The Brake specific fuel consumption (BSFC) is amount of fluid (fuel) needed to get one watt of power. It is measure from the amount of fuel consume to the power generated at output shaft. BSFC for conventional and
modified engine show in figure. Results presents that the BSFC of both conventional and modified engine decreases by increasing brake power. Fuel consumption (FC) of the modified engine is less due to the TBC of the Yttria-Stabilized Zirconia. Thus, for coated engine BSFC is also smaller than the conventional engine.
Figure 4.1 Comparison of Brake power with BSFC Brake thermal efficiency:

SJIF Impact Factor 2021: 8.013| ISI I.F.Value:1.241| Journal DOI: 10.36713/epra2016 ISSN: 2455-7838(Online)
EPRA International Journal of Research and Development (IJRD) Volume: 6 | Issue: 8 | August 2021 - Peer Reviewed Journal
2021 EPRA IJRD | Journal DOI: https://doi.org/10.36713/epra2016 | www.eprajournals.com |158 |
BTE of modified engine increases to 7.5% at 3000
rpm engine speed as compared to the typical engine due to the TBC of the Yttria Stabilized Zirconia on piston crown. This is because the zirconia coating of the piston head
reduces heat losses of coolant and higher heat is available in the chamber, which aids proper combustion and reduces fuel burn.
Figure 4.2 Comparison of Brake power with BTE
Indicated Thermal Efficiency
The ITE of the coated piston increases to 9.6% at 3000 rpm engine speed as compared to the typical engine. This is because the coated engine reduces heat loss and
provides better combustion efficiency correlated to the uncoated engine. In addition, fuel consumption in coated piston decreases due to better combustion.
Figure 4.3 Comparison of Brake power with ITE
Mechanical Efficiency Mechanical efficiency rises by increasing the brake
power of engine. ME of modified engine increases in
comparison to the conventional engine between 4 and 10% at different engine speed.

SJIF Impact Factor 2021: 8.013| ISI I.F.Value:1.241| Journal DOI: 10.36713/epra2016 ISSN: 2455-7838(Online)
EPRA International Journal of Research and Development (IJRD) Volume: 6 | Issue: 8 | August 2021 - Peer Reviewed Journal
2021 EPRA IJRD | Journal DOI: https://doi.org/10.36713/epra2016 | www.eprajournals.com |159 |
Figure 4.4 Comparison of Brake power with ME
Volumetric Efficiency The variety in VE of conventional and coated
engine is show in figure. It decreases with increasing
engine power, but the decrease in the coated engine is greater.VE of the modified engine decreases between 3 and 9% compared to the conventional engine.
Figure 4.5 Comparison of Brake power with VE
Exhaust Gas Temperature The exhaust gas temperature (EGT) of modified
engine is 1-3 ° C higher because more heat in chamber
increases the temperature of the exhaust gas. Turbocharger can be used to return this heat to the engine and improve engine efficiency.
Figure 4.6 Comparison of Brake power with EGT

SJIF Impact Factor 2021: 8.013| ISI I.F.Value:1.241| Journal DOI: 10.36713/epra2016 ISSN: 2455-7838(Online)
EPRA International Journal of Research and Development (IJRD) Volume: 6 | Issue: 8 | August 2021 - Peer Reviewed Journal
2021 EPRA IJRD | Journal DOI: https://doi.org/10.36713/epra2016 | www.eprajournals.com |160 |
CONCLUSION We Conclude that Performance analysis of the modified engine is better as compared to without coated engine. BSFC of coated engine is 2-4% lower as compared to uncoated engine. Thermal efficiency of modified engine increases by 4-8% compared to without coated engine. The indicated thermal efficiency of modified engine has an increase of 5 to 10% compared to with coated. The mechanical efficiency of modified engine increases 4-10% compared to without coated. The volumetric efficiency of modified engine reduced by 3-9% compared to the without coated. The exhaust gas temperature of the modified engine increases by 1-3 ° C compared to uncoated engine and by the turbocharger we can use heat energy of exhaust again. The heat energy released from the fuel in TBC engine is higher as compared to that of without coated engine with less emissions. REFERENCES
1. Jaichandar, S. and Tamilporai, P., The Status of Experimental Investigations on Low Heat Rejection Engines, SAE Technical Paper, No. 2004-01-1453, 2004
2. Assanis, D.N., et al., The Effects of Ceramic Coatings on Diesel Engine Performance and Exhaust Emissions, SAE Technical Paper, No. 910460, 1991
3. Rupangudi, S.K., et al., Study of Effect of Coating of Piston on the Performance of a Diesel Engine. SAE International Journal of Materials and Manufacturing, 7(3), pp.633-637, 2014
4. Afify, E.M. and Klett, D.E., The Effect of Selective Insulation on the Performance, Combustion, and NO Emissions of a DI Diesel Engine, SAE Technical Paper, No. 960505, 1996
5. Ramu, P. and Saravanan, C.G., Effect of ZrO2-Al2O3 and SiC Coating on Diesel Engine to Study the Combustion and Emission Characteristics, SAE Technical Paper, No. 2009-01-1435, 2009
6. Assanis, D.N. and Mathur, T., The Effect of Thin Ceramic Coatings on Spark-Ignition Engine Performance. SAE transactions, pp.981-990, 1990
7. Gosai, D.C. and Nagarsheth, H.J., Performance and Exhaust Emission Studies of an Adiabatic Engine with Optimum Cooling. Procedia Technology, pp.413-421, 2014
8. Rupangudi, S.K., et al., Study of Effect of Coating of Piston on the Performance of a Diesel Engine. SAE International Journal of Materials and Manufacturing, 7(3), pp.633-637, 2014
9. Muthusamy, J., et al., Experimental Investigation of Thermal Barrier (8YSZ-TiO 2-Al 2 O 3) Coated Piston Used in Direct Injection Compression Ignition Engine, Thermal Science, 20, 2016
10. Modi, R.S. and Modi, M.A., IC Engine Performance Using Ceramic Coated Piston, Journal of Mechanical
and Civil Engineering (IOSR-JMCE), Volume 14, Issue 2 Ver. IV, 2017

SJIF Impact Factor 2021: 8.013| ISI I.F.Value:1.241| Journal DOI: 10.36713/epra2016 ISSN: 2455-7838(Online)
EPRA International Journal of Research and Development (IJRD) Volume: 6 | Issue: 8 | August 2021 - Peer Reviewed Journal
2021 EPRA IJRD | Journal DOI: https://doi.org/10.36713/epra2016 | www.eprajournals.com |161 |
ADOLESCENTS ENGAGING IN SEXUAL ACTIVITY: AN OVERVIEW
Amuta Arumugam1 Dr.Ganesan Shanmugavelu,PhD2
Dr.Sharmini Siva Vikaraman, Phd3, Dr.M. Nadarajan Manickam,Phd4
Jagdave Singh Avtar Singh5, Manimaran Vadivelu6
Kanaisan Kanapathy7
1Certified Counsellor, Ipoh, Perak, Malaysia
2Senior Lecturer, Institute of Teacher Education Ipoh Campus, Malaysia 3Senior Lecturer, English Language Teaching Centre (ELTC), Malaysia
4Senior Lecturer, Institute of Teacher Education Keningau Campus, Malaysia 5Principal, Sierramas Secondary School, Selangor, Malaysia
6Senior Lecturer, Institute Of Teacher Education Ipoh Campus, Malaysia 7Lecturer, Institute of Teacher Education Ipoh Campus, Malaysia
Article DOI: https://doi.org/10.36713/epra8265 DOI No: 10.36713/epra8265
ABSTRACT
The purpose of this study is to determine the prevalence of risky sexual activities among adolescents within the
context of other behavioural factors that contribute to compromised health outcomes, for both sexes, those who
initiated sexual activity at an early age were more likely to engage in a variety of significant risks behaviours
factor. Possibility engaging in sexual activity is associated with age, low academic performance, substance abuse,
violence, depression, and suicidal tendencies. The more regular occurrence of these risk factors, the higher the
chances of engaging in sexual activity. The aim of various examining is to find efforts on how specific ways of
conceptualizing to reduce multiple risk factors and to determine how adolescents’ views on reproductive issues
influence may develop sexual initiation and patterns of behaviour in sexual activity over the time.
KEYWORD: Adolescent, Healthy, Sexual Activity, Therapy, Emotional, Multiple Risk
INTRODUCTION This study determined adolescents who have sex earlier in life are more likely to continue to be risky into young adulthood, including more sexual partners. The theoretical growth in terms of maturity and knowledge can be seen on a large scale of the adolescent population of today (Guha, 2013). Considerable adolescents had a developmental stage associated with increased risk behaviours that contribute to negative sexual health outcomes (Ramos et al. 2015). Within attitude towards sex, emphasizing the different elements of the construct change, with premarital sex, even high risk in sexual behaviour and adolescent pregnancy presents a
serious social and public health problem. Perhaps, in turn puts them at more risk of unwanted outcomes of sexual activity, including unintended pregnancy or sexually transmitted diseases. It is a multi-dimension concept and includes ethical, psychological, biological and cultural dimensions. The concept of sexuality highlights the necessity sexual behaviour within the context of global adolescent development, as they are intimately interconnected. Especially pubertal changes are accompanied by cognitive development whereby the primary task of which is developing a formal operational thought process. The abstract thinking and the ability to envision potential consequence of actions and the effect of this

SJIF Impact Factor 2021: 8.013| ISI I.F.Value:1.241| Journal DOI: 10.36713/epra2016 ISSN: 2455-7838(Online)
EPRA International Journal of Research and Development (IJRD) Volume: 6 | Issue: 8 | August 2021 - Peer Reviewed Journal
2021 EPRA IJRD | Journal DOI: https://doi.org/10.36713/epra2016 | www.eprajournals.com |162 |
action may have on others is one key aspect of this process and clearly indicate as an important development affecting the level of health risk associated with adolescent sexual behaviours. Cross study experiencing adolescents reflect deeper problems in emotional development, broadly that defined by distress and affect dysregulation sexual risk behaviour making early sexual intervention critical. The interventions with the best evidence of effectiveness are those which address multiple risk and protective factors, resilience, positive school environments and positive parent and family interactions. The changeover stage from childhood to adulthood is a critical period in which young adolescents have the opportunity to make decisions based on their own judgments away from parental influence. The maturity growth towards adulthood for teenagers poses a wide range of risks and harmful actions that constitute a threat to their well-being. These behaviours may impact their well-being in a negative way both physically and emotionally depending on what decisions they choose to make. Sexual activity may not itself be a risky behaviour, but to young adolescents engaging in this activity may present serious consequences to their health and well-being. However, they obtain in making decision to have sex as a young adolescent gratifies the desires of teenagers without having in mind the repercussions that could follow. Part of sexuality development is more complex than the biological forces that initiate the sexual maturation process and the development of adolescent sexuality includes not only physical development but also cognitive, emotional, social, and moral development. Moreover, it is emphasized throughout the particular problem with respect to adolescent sexuality because poor decisions, due to a lack of cognitive and/or emotional maturity. Essentially, caregivers to discuss all aspects of sexuality amongst adolescent, especially physical growth, emotional, social, physical and moral aspects of sexuality so that teens make wise thoughtful decisions. In a straight line they ensure parents understand the process of adolescent sexual development in a better position to assist their children, including knowledge to enable caregivers to know when to intervene. This study aims to describe the natural evolution of adolescent sexuality on their sexual thoughts and questions, their sexual feelings and concerns, their sexual behaviour and choices. This may emphasize parents be cautioned to remember that every youth is unique and their teens may reach these developmental milestones at ages and still be considered "normal." This study also observed that early sexual activity increases the likelihood to have more frequent sexual encounters (Kahn et al. 2002) and romantic partners (Sandfort et al. 2008) which
possibly will negatively impact on academic achievements since these activities are time consuming. The focus aspect in “refraining from
having sex as a teenager may impart important psychological and emotional benefits, in turn, lead to increased human capital accumulation” (Sabia and
Rees 2009). Sexual intercourse at a young age can distract adolescents to school achievements through unintended health consequences of becoming sexually active, such as the higher risk of unplanned pregnancies, abortion, and sexually transmitted diseases (Rector et al. 2003). Beside this there are other risk behaviours associated with early sexual intercourse are substance use and greater affiliation with deviant peers, which could lead to developing minor deviance (Bingham and Crockett 1996; Rees et al. 2001). However, studies evidenced, sex differences in depression during adolescence since females experienced a larger increase in depression and a greater decline in happiness than males in response to romantic involvement (Joyner and Udry 2000). Hallfors et al. (2005) discovered female adolescence who experienced sex with multiple partners were more likely to be depressed than their counterparts who remained sexually abstinent. However, boys engaged in sexual activity with multiple partners showed no significant increase of depression. In young ages who engage in sexual intercourse and have multiple partners might undergo negative social and health changes which, in turn, may lead to reduced interest in academic achievement. The aim of this research considered early adolescence is the most critical stage of development, a period of accelerated growth and change. The behaviour design associated with adopting in lifelong consequences, both positive and negative attitude that encounter in individual perception about sexuality. The significant effects in premarital sexual behaviour can cause various negative impacts on adolescents, either psychological, physical and social impact. The psychological effects influence and recognition such feelings of anger, fear, anxiety, depression, low self-esteem, guilt and physical effects can lead to unwanted pregnancies and abortions that lead to develop sexually transmitted diseases (STDs) among adolescents. In fact, sexually transmitted diseases can cause infertility and may increase the risk of contracting HIV / AIDS and will produce a quality generation (Sarwono, 2011), from the social point approach used in the current study. This may further allow to identify, the impacts that are being treated are ostracized, dropping out of school for pregnant female adolescents, and changing the role of mother or father, as well as the stigma of society who denounces and rejects the situation. The early adolescence opportunity, risk and a positive school environment, taking critical ways to ensuring this age

SJIF Impact Factor 2021: 8.013| ISI I.F.Value:1.241| Journal DOI: 10.36713/epra2016 ISSN: 2455-7838(Online)
EPRA International Journal of Research and Development (IJRD) Volume: 6 | Issue: 8 | August 2021 - Peer Reviewed Journal
2021 EPRA IJRD | Journal DOI: https://doi.org/10.36713/epra2016 | www.eprajournals.com |163 |
group‟s learning. Whereby, the social and physical needs that met along their support and guidance from parents as one of the most significant important factors which can mould the individual in the best positive way or the least positive way. The effective information clearly emphasizes the necessary for health professionals to prevent and intervene on not only unmarried young people‟s sexual behaviour, but also other negative consequence (Yip et al, 2013). Healthy Adolescent Sexual Development It‟s important that anyone who works with
young people has a good understanding of how adolescent develop sexually. This can help them recognise healthy sexual behaviours that are developmentally appropriate and identify if the adolescent is displaying behaviour that is inappropriate or potentially harmful. Adolescent‟s development and mental health are affected by various factors, including the environments they are raised in, the relationships build and the experiences they have. Their development refers to the physical, cognitive, emotional and social growth that occurs throughout a young person‟s life. Hence their mental health, cognitive, behavioural and social wellbeing is affected by this development, as well as a range of factors, including trauma and abuse. The journey begins much earlier in adolescent life about sexual development is part of sexuality. In fact, by the time they reach to adolescent stage, already have received many messages about sexuality (Strasburger, 2005). While some adolescents might receive accurate and comprehensive information from school, their parents, and elsewhere, others might receive less information. Many adolescents turn to other sources of information such as their peers, the internet, and the media due to absence of healthy, realistic messages about sexuality (Gruber & Grube, 2000). Potentially adolescent strengthen without an understanding of healthy relationships, consent, boundaries, and how to engage safely in sexual behaviours. The understanding of healthy sexuality may enable prevent sexual violence by addressing gender norms and inequality, promoting healthy relationships, encouraging an understanding of boundaries and helping young people feel empowered to ask questions that seek support when they need it. The Goals of Promoting the Knowledge and Key Skills to Healthy Sexuality. A wide variety of experience is normal and healthy, it can also be easy to view adolescence as a time of upheaval, rather than as a time of opportunity (McNeely & Blanchard, 2009). The objective of following information provides an understanding of adolescent sexual development that help better support on their path to becoming healthy adults. While the information provides a general guideline
for each development, it is important to remember that not all adolescents experience this in the same way.
i. Make decisions that are informed and turn to trusted adults for support and guidance when needed.
ii. Understand consent and how to respectfully interact with partners, friends, and peers.
iii. Help influence their peers in a positive manner by promoting positive social norms and engaging in bystander intervention.
iv. Recognize sexual violence and seek help and support when sexual violence occurs.
v. Provide support and information to peers and others who have experienced sexual violence.
vi. Ensuring the ability to access age-appropriate, comprehensive, education, achieving, protecting, respecting and fulfilling human rights related to sexual and reproductive health.
vii. Enabling women to avoid unintended pregnancies.
viii. Focused narrowly on specific behaviors leading to these health goals, gave clear messages about these behaviours, and addressed situations that might lead to them and how to avoid them.
ix. Addressed multiple sexual psychosocial risk and protective factors affecting sexual risk behaviours (e.g., knowledge, perceived risks, values, attitudes, perceived norms and self-efficacy).
Design of Hypothesis Method
Generally, the development pursues a variety of individual, clinician, system-level policies and strategies to ensure confidentiality, preventive and accessible sexual health care and education for adolescents. Thus, adolescents continue face numerous barriers to acquiring comprehensive and accurate sexual health information. The challenge that can ultimately inform best practice interventions that promoting positive developmental outcomes in listed hypothesis.
i. Are you now or have you ever had sex with males, females, or both?
ii. The last time you had sex? iii. How many sexual partners have you had? iv. How old were you when you first had sex? v. There are various forms of contraception:
did you use a condom and/or birth control with your last sexual encounter?
vi. Have you ever been worried that you were (got someone) pregnant?
vii. Have you ever had a sexually transmitted infection (STI)?

SJIF Impact Factor 2021: 8.013| ISI I.F.Value:1.241| Journal DOI: 10.36713/epra2016 ISSN: 2455-7838(Online)
EPRA International Journal of Research and Development (IJRD) Volume: 6 | Issue: 8 | August 2021 - Peer Reviewed Journal
2021 EPRA IJRD | Journal DOI: https://doi.org/10.36713/epra2016 | www.eprajournals.com |164 |
viii. Have you ever been tested for an STI and human immunodeficiency virus (HIV)?
ix. Have you ever traded money or drugs for sex?
x. Has anyone ever touched you in a way you did not want to be touched?
xi. Has anyone forced you to do something you did not want to do sexually?
xii. Have you focuses on the needs? xiii. How models, fosters caring and supportive
relationships to increase? xiv. How to manage self-confidence, awareness
and management of behaviour? xv. How to manage positive attitudes towards
assisting others? xvi. Clear guidelines to ensure appropriate
relationships with clear expectations Analyse and Interpret Data Information. Adolescent focused on learning about the emotional, social and physical aspects of growing up relationships, identity, reproduction, gender, human sexuality and sexual health. A primary goal of sexuality education is to equip adolescent with the knowledge, skills and values have safe, fulfilling, enjoyable relationships and to make responsible for safe choices that promote to protect their own health, safety and wellbeing. Being able to communicate, listen and negotiate with others to make informed decisions are useful life-skills that can be applied to all relationships, including intimate relationships. Effective sexuality education includes structured opportunities for adolescent to explore their attitudes and values, and to practise their decision-making, assertiveness and other life skills needed to make informed choices about their relationships and sexual lives. There are various competing messages about relationships, sex and sexuality in the world. Sexuality education provides opportunities for students to develop media literacy skills which are essential to help adolescent understand, interpret, evaluate media messages and imagery related to sexuality, relationships and gender. However, adolescent choose to be sexually active, thus sexuality education prioritises the acquisition and/or reinforcement of values such as reciprocity, equality, responsibility and respect, which are prerequisites for healthy, safer sexual and social relationships. These emphasize adolescent recognise these relationships long before they act on their sexuality and need the skills to understand their bodies, relationships and feelings from an early age. Effective sexuality education provides adolescent with age-appropriate, culturally relevant and scientifically accurate information. Beside this issue, parent knowledge of friends and time spent in activities problems did not affect the common problem behaviour factors, but
did have effects on specific behaviours. Adolescents who spent more time in organized activities had lower levels of marijuana use and academic failure. Academic failure was also less likely for individuals whose parents knew their friends. While these results make intuitive sense, it is not clear why the effects emerged towards sexual activities in specific behaviours reasons. Based on analysis and evaluation indicates that, where parents and carers have an understanding of their adult learning is improved. Whereby, therapy session should implement a consultative process to ensure parents and carers have the opportunity to participate in discussions on both curriculum content of teaching adults and learning materials need to be modified. Communication with parents and carers assists the community to better understand the content and aims of the establishing how parents will be and involved in decision making. Research on Sexual Education a) This study show that effective sexual
education can: i. Reduce misinformation
ii. Increase correct knowledge iii. Clarify and strengthen positive values
and attitudes iv. Increase skills to make informed
decisions and act upon them v. Improve perceptions about peer groups
and social norms vi. Increase communication with parents,
carers or other trusted adults. b) This research also shows that sharing the
above characteristics can help too: i. Abstain from or delay the debut of
sexual relations ii. Reduce the frequency of unprotected
sexual activity iii. Reduce the number of sexual partners iv. Increase the use of protection against
unintended pregnancy and sexually transmitted infections (STIs) during sexual intercourse.
c) This research also determined family members have been consistently identified adolescent as a significant source of information. This highlights the importance of communication skills, peer pressure, respectful relationships, consent and ethical behaviour in regards to sexual activity. However, communicating clearly enhance positive feelings about sexual activity and feeling confident to negotiate sexual activity and contraception are key indicators of healthy relationships.

SJIF Impact Factor 2021: 8.013| ISI I.F.Value:1.241| Journal DOI: 10.36713/epra2016 ISSN: 2455-7838(Online)
EPRA International Journal of Research and Development (IJRD) Volume: 6 | Issue: 8 | August 2021 - Peer Reviewed Journal
2021 EPRA IJRD | Journal DOI: https://doi.org/10.36713/epra2016 | www.eprajournals.com |165 |
d) Despite ongoing concerns of the sexual well-being in adolescent, the vast majority of confident in their decision-making around their sexual health. Dependent for those who are sexually active are, by and large, having sex that they enjoy and feel positive about. The ordinary population those who are not having intercourse are feeling comfortable and confident that this is what they want. This is clearly a strength of adolescent and one which should be recognised in a strength-based approach to sexuality education.
Goal and Target of Intervention a) What do adolescent’s learn about
relationships, sexuality and sexual health.
Sexuality and sexual health relationship taught in an age-appropriate way as part of key learning area. Crossroads extends adolescent learn about many aspects of relationships, sexuality and sexual health. Also embracing learning about body parts and puberty in primary school to rights and responsibilities in sexual relationships, planning and managing sexual health in high school. They learn about the qualities of caring and respectful relationships, recognising abuse and protective strategies. Generally, they also learn about appropriate sources of help and support, including parents, peers and sexual health services. Hence, they‟re taught to be critical consumers and develop skills in seeking accurate and reliable sources of information, including information from the Internet and media sources. With human sexuality and relationship at its core, formulation young people for the changeover to adulthood has always been one of humanity‟s great challenges, Today, in a world with
AIDS, the way exactly how we meet this confrontation is our most important opportunity in breaking the trajectory of the epidemic.”
b) How does best practice comply with, reflect and frameworks?
Counselling therapy are expected one of professional resources to develop adolescent to plan a knowledge and examined in terms of their potential for furthering the best interests focused practice includes:
i. Respect ii. Age/ developmentally appropriate responses
iii. Realistic expectations iv. Empathy v. Focusing on their needs
vi. Ensure they able to participate in decision making about his or her future
vii. Maintaining appropriate boundaries
viii. Promoting positive experiences and outcomes.
ix. Communicate with family, peers, and teachers about issues that affect health.
x. Make informed and thoughtful decisions about their health.
xi. Take responsibility for themselves and others to improve their health.
xii. Understand and question social norms and practices concerning sexuality, gender and relationships and contribute positively to society.
xiii. Be better equipped to face other challenges in life, especially during the transition period from childhood to adulthood.
xiv. Sexuality education has positive effects, including increasing young people‟s
knowledge and improving their attitudes related to sexual, reproductive health and behaviours.
xv. Sexuality education in or out of schools does not increase sexual activity, sexual risk-taking behaviour or STI/HIV infection rates.
xvi. „Gender-focused‟ programmes are
substantially more effective than „gender-blind‟ programmes at achieving health
outcomes such as reducing rates of unintended pregnancy or STIs.
xvii. Sexuality education has the most impact when school-based programmes are complemented with the involvement of parents, teachers, training institutes and youth-friendly services.
c) The Role of Parents Essentially, parents need resources to support their vital role in shaping the lives of adolescents, particularly help in learning effective ways of supporting their adolescent's psychosexual development. It is imperative that this research focus on target evaluations of declining adult‟s pregnancy
rates that can influence positive developmental outcomes. Thus, establish and maintain evaluation goals are deferred because of limited funding whereby research paradigms that can increase knowledge of effective interventions that can be potentially replicated. In this journey community effort to address teenage pregnancy, some parents may be apprehensive about other adults influencing regarding personal, sensitive issues. For parents who feel comfortable and equipped in addressing these issues with their children, including being aware of their own personal values and attitudes regarding sexuality and exactly what way they want their adolescent to be introduced to the sensitive topic of sexuality. Effective parent toward adult communication regarding love and intimacy, as well as family rules and standards about teenage dating,

SJIF Impact Factor 2021: 8.013| ISI I.F.Value:1.241| Journal DOI: 10.36713/epra2016 ISSN: 2455-7838(Online)
EPRA International Journal of Research and Development (IJRD) Volume: 6 | Issue: 8 | August 2021 - Peer Reviewed Journal
2021 EPRA IJRD | Journal DOI: https://doi.org/10.36713/epra2016 | www.eprajournals.com |166 |
can provide needed support for adolescents who are confronting the social and emotional challenges related to puberty. Parents are encouraged to introduce the topic of sexuality and sex education early in an adolescent‟s development. In what manner the early influenced occurs by the personal values and attitudes of the parents. Hence parent also able to determine as interpreters of the negative media images that foster inconsistent and controversial attitudes toward adolescent in early sexual activity and promiscuity. Parents are optimistic to become knowledgeable about their adolescent social contexts by monitoring their activities includes not only knowing where they are, but also who are the friends and peer associates of around them. It is also important to provide life options that provided with constructive, safe opportunities for personal growth. Beside other effective models of service include gender-specific interventions that assist adolescents in understanding positive manhood and womanhood development. Throughout the development of positive gender identity, adolescents can fully consider their role in relationships with family, peers, and community. There has been some debate regarding gender-specific versus mixed-gender to address the issue of teenage pregnancy. Giving confidence level to be intentional in their efforts to maximize opportunities for education and life-skills development, optional either in same-gender or mixed-gender environments. Thus, same-gender can provide safe learning environments in which groups can fully consider the challenges facing adolescents to engage in early sexual activity. Generally, for girls who may have been traumatized by males, it is critical that they have opportunities to voice their concerns and experiences without any perceived threat by male counterparts. On the other hand, in the absence of trauma-related experiences, adolescents may benefit from healthy, mixed-gender awareness that focus on the shared responsibility of both sexes in family planning. Therefore, comprehensive community strategies are needed to address the myriad of issues involved the diversity in social and community contexts. In wide ranging, sexuality education is a curriculum-based process of teaching and learning about the cognitive, emotional, physical and social aspects of sexuality. Perhaps the major discussion that target to equip young people with knowledge, skills, attitudes and values that will empower them to realize their health, dignity, develop respectful, social and sexual relationships. Consider how their choices affect their own well-being and that of others, hence understand to ensure the protection of their rights throughout their lives.
Enhancement Through Therapy Adolescent sexuality talks can be a difficult topic for many parents, and once parents have the “birds and the bees” talk, it can be tempting for them
to consider the job done. Nevertheless, mostly teens with mental health concerns, keeping an open dialogue is critical to addressing the developmental changes that are inherent in discussions about sexual behaviour. Therapy session can play a key role in encouraging parents to have a series of conversations about sex that can begin when a child is young and continue through their teens. While they may not be the focus of treatment, these conversations can often be a barometer for family communication that can be useful to the therapist. Perhaps therapist can help parents with these discussions by providing the rationale for their importance and giving tips to make these conversations easier for parents, such as the following: i. Parents should facilitate to recognize that sex
is a normal human behaviour and that people begin having sexual feelings at early ages. Coping those feelings, particularly in the absence of adults who will discuss them that can be challenging, create the discussions with parents more valuable. People are assaulted with restrained sexual messages all the time, which can prompt confusion.
ii. Parents should take accountability to identify their message if they are planning a conversation with their teen, help adolescent consider the main idea that they want to get across. The beginning of their journey to aware of their values, or to have information to make safe decisions, or to establish that they are someone their teen can talk to about difficult decisions. Knowing where they are headed with the conversation rather than they begin to making it go smoother.
iii. Practice some key phrases with parents to make sure they feel comfortable with them. Be a great exemplary that they willing to listen and hear that discussing about sex doesn‟t
have to feel embarrassed. Encouraging parents to practice run through when they‟re alone in
the car or in front of the mirror, listening for whether the way they phrased something sounds judgmental or doubting or just plain awkward that able to prepare them well. Hearing themselves say the words is great practice for feeling comfortable, and key phrases that helpful if they are feeling nervous. In fact, if parents are uncomfortable with the terms they might need to use (like “oral sex”),
encourage them to practice saying them out loud ahead of time to make it easier.
iv. Reassurance as parents to listen and consider that early teens talk about sex, even if they

SJIF Impact Factor 2021: 8.013| ISI I.F.Value:1.241| Journal DOI: 10.36713/epra2016 ISSN: 2455-7838(Online)
EPRA International Journal of Research and Development (IJRD) Volume: 6 | Issue: 8 | August 2021 - Peer Reviewed Journal
2021 EPRA IJRD | Journal DOI: https://doi.org/10.36713/epra2016 | www.eprajournals.com |167 |
aren‟t yet sexually active, probably getting “information” from their peers, who may or
may not be accurate. Meaning parents who talk about sexuality with their adolescent can correct misconceptions they learn from peers. Perhaps in case parents express that they don‟t
think their teen will come to them with questions or problems, uplift to suggest trust as a source of accurate information for their teen.
v. Inspire parents to communicate their values to teens often interested in what their parents think about things like sex, even if they don‟t
ask directly, and studies show that the more parents discuss their values with their teens the more values converge. Conveying values while recognizing that the point of view they have different life experiences, is important.
vi. Help parents identify naturally occurring moments to start discussions such as scenes in movies, lyrics in music, celebrity scandals reported on TV, or pictures in magazines are great conversation starters. Thus, an opportunity to ask teens an opinion as well as chances for parents to express some of their values.
vii. Remind parents to avoid judgment and coaching teens room to express their opinions that facilitate kind of two-way conversation that is desired. Parents can use facts about risk as a way to express concern rather than judging.
viii. As parents raise the spirits to start early even the best conversations can have limited impact if the timing is wrong. It is assuming most excellent time for parents to talk to teen is before their teen needs the information, not after.
ix. In fact, young people cannot improve sexual and reproductive health alone. They need the support of friends, families, service providers and the wider society. If they meet in groups, they can support each other in positive ways and take actions together to improve things. If they make strong partnerships with others, they can get support to make the community a safer place for everyone.
x. Parents and carers would often like to teach their children more about sexual and reproductive issues but they may need more information themselves, more confidence and approval from the society.
xi. Adults will also learn a lot from the topics and activities in this toolkit. If they learn alongside, it will bring many benefits to both generations in increased knowledge, helpful attitudes and life-skills. This will encourage good relationships and safer sexual behaviour.
xii. If parents learn to praise more and criticise less, to be good role-models to their children, to teach with love and to critically think about their changing cultural norms, then they can strengthen the socialisation that they already do.
CONCLUSION This research shows that, adolescent youth experience monumental changes in every single aspect of their lives as they make the transition from childhood into adulthood. This study also provides the purpose of the foundational ways for parents and other caregivers needed information to recognize and to appreciate the normal developmental progression of adolescents. Therefore, this article was primarily descriptive in nature. In spite of this process development can become quite challenging and sometimes overwhelming for both youth and their families. In most cases, adolescents explore their sexuality normative and has no negative consequences. Therefore, in this case the compulsive sexual behaviour is developed and needs to be treated or it will affect functioning and relationships in adolescent lifestyle. For this reason, their sexual behaviours have both short-term and long-term consequences, meaning the interventions that focus on multiple domains of risk may be the most effective in helping to promote broad reproductive health among adolescent. Despite the fact that decline in sexual activity is encouraging disheartening that declines among the lowest risk groups, effectively widening the gap of health. Thus, the realistic and factual balanced information about all forms of sexual activity and contraception to adolescents is abundantly clear. Ultimately, a unique position not only provide necessary services to adolescent in a confidential manner, but also to be educators and advocates within their communities about the education and health care needs. Understanding the sexual development of adolescent is utmost importance, unfortunately without this realization no educational intervention movement. The key factors influencing sexuality, understanding is self-indulgent of adolescent sexuality, that enhances help parents to recognize the difficulties of their adolescent lifestyle better and emphasize them to guide crossroads the younger generation. This study also provides parents and other caregiver‟s concrete advice and practical solutions to common problems that arise during adolescence. Armed with this information, parents will feel more confident and successful as they guide their teen‟s.

SJIF Impact Factor 2021: 8.013| ISI I.F.Value:1.241| Journal DOI: 10.36713/epra2016 ISSN: 2455-7838(Online)
EPRA International Journal of Research and Development (IJRD) Volume: 6 | Issue: 8 | August 2021 - Peer Reviewed Journal
2021 EPRA IJRD | Journal DOI: https://doi.org/10.36713/epra2016 | www.eprajournals.com |168 |
REFERENCES
1. Adelson S, Bell R, Graff A, et al. Toward a definition of ―hypersexuality‖ in children and adolescents. Psychodyn Psychiatry. 2012;40;481-503.
2. Bingham, C.R., & Crockett, L.J. (1996). Longitudinal adjustment patterns of boys and girls experiencing early, middle, and late sexual intercourse. Developmental Psychology, 32(4), 647.
3. Birchard T. CBT for Compulsive Sexual Behaviour: A Guide for Professionals. New York: Routledge; 2015.
4. Brown JD, L’Engle KL. X-rated: sexual attitudes and behaviors associated with US early adolescents’ exposure to sexually explicit media.
Comm Res. 2009;36;129-151. 5. CROCKETT, LISA, and CHOPAK, JOANNE S.
1993. "Pregnancy Prevention in Early Adolescence: A Developmental Perspective." In Early Adolescence: Perspectives on Research, Policy, and Intervention, ed. Richard Lerner. Hillsdale, NJ: Erlbaum.
6. Delmonico DL, Griffin EJ. Cybersex addiction and compulsivity. Internet Addiction: A Handbook and Guide to Evaluation and Treatment. New Jersey: John Wiley and Sons, Inc; 2011; 113-134.
7. DRYFOSS, JOY. 1990. Adolescents at Risk: Prevalence and Prevention. New York: Oxford University Press.
8. Efrati Y, Mikulincer M. Individual-based Compulsive Sexual Behavior scale: its development and importance in examining compulsive sexual behavior. J Sex Marit Ther. 2018;44;249- 259.
9. Efrati Y, Gola M. Adolescents’ compulsive sexual
behavior: the role of parental competence, parents’ psychopathology, and quality of parent-child communication about sex. J Behav Addic. 2019;8:420-431.
10. Guha S : Attitude, Knowledge and Behavior about Sexuality among Adolescents. IOSR Journal Of Humanities And Social Science 2013, 18(5): 05-19
11. Gruber, E., & Grube, J. W. (2000). Adolescent sexuality and the media: A review of current knowledge and implications. Western Journal of Medicine, 172, 210-214.
12. Hoffman , Saul D. 1998. "Teenage Childbearing Is Not So Bad After All … Or Is It? A Review of NewLiterature." FamilyPlanning Perspectives 30 (5):236–239, 243.
13. Hallfors, D.D., Waller, M.W., Bauer, D., Ford, C.A., Halpern, C.T. (2005). Which comes first in adolescence—sex and drugs or depression?. American Journal of Preventive Medicine, 29(3), 163–170.
14. Joyner, K, & Udry, J.R. (2000). You don’t bring
me anything but down: Adolescent romance and depression. Journal of Health and Social Behavior, 41(4), 369.
15. Kirby , Dougles. 2001. Emerging Answers: Research Findings on Programs to Reduce Teen Pregnancy. Washington, DC: National Campaign to Prevent Teen Pregnancy.
16. Koch, P. B. 1993. "Promoting Healthy Sexual Development During Early Adolescence" In Early Adolescence: Perspectives on Research, Policy, and Intervention, ed. Richard Lerner. Hillsdale, NJ: Erlbaum.
17. Kahn, J.A., Rosenthal, S.L., Succop, P.A., Ho, G.Y., Burk, R.D. (2002). Mediators of the association between age of first sexual intercourseand subsequent human papillomavirus infection. Pediatrics, 109(1), e5–
e5. 18. Kellett S, Simmonds-Buckley M, Totterdell P.
Testing the effectiveness of cognitive analytic therapy for hypersexuality disorder: an intensive time series evaluation. J Marit Sex Ther. 2016;6:1-16.
19. Mitchell KJ, Wells M. Problematic internet experiences: primary or secondary presenting problems in persons seeking mental health care. Soc Sci Med. 2007;65;1136-1141.
20. Rector, R.E., Johnson, K.A., Noyes, L.R., Martin, S. (2003). The harmful effects of early sexual activity and multiple sexual partners among women: a book of charts. Washington: The Heritage Foundation.
21. Ramos VG, Bouris A, Lee J, McCarthy K, Michael LS, Barnes PS, Dittus P: Paternal Influences on Adolescent Sexual Risk Behaviors: AStrustured Literature Review. PEDIATRICS 2012, 130(5): e1313-e1325
22. Reissing ED, Giulio GD. Practicing clinical psychologists’ provision of sexual health care services. Prof Psychol. 2010;41;57.
23. Reid RC, Bramen JE, Anderson A, Cohen MS. Mindfulness, emotional dysregulation, impulsivity, and stress proneness among hypersexual patients. J Clin Psychol. 2014;70;313- 321.
24. Strasburger VC. Adolescents, sex, and the media: oooo, baby, baby — a Q & A. Adolesc Med Clin 2005; 16: 269-288.
25. Sabia, J.J., & Rees, D.I. (2008). The effect of adolescent virginity status on psychological well-being. Journal of Health Economics, 27(5), 1368–1381.
26. Sandfort, T.G., Orr, M., Hirsch, J.S., Santelli, J. (2008). Long-term health correlates of timing of sexual debut: results from a national US study. American journal of public health, 98(1), 155–161.
27. Yip SFP, Zhang H, Lam TH, Lam KF, Lee AM, Chan J, Fan S: Sex Knowledge, attitudes, and high risk sexual behaviors among unmarried youth in Hongkong 2013, 13(691): 1-10

SJIF Impact Factor 2021: 8.013| ISI I.F.Value:1.241| Journal DOI: 10.36713/epra2016 ISSN: 2455-7838(Online)
EPRA International Journal of Research and Development (IJRD) Volume: 6 | Issue: 8 | August 2021 - Peer Reviewed Journal
2021 EPRA IJRD | Journal DOI: https://doi.org/10.36713/epra2016 | www.eprajournals.com |169 |
BOLOGNA PROCESS: CREDIT-MODULE SYSTEM
Khusainova Firuza Toxirovna Senior Teacher of the Department General Sciences and Culture of the Tashkent State University of Law
ANNOTATION The transition to a credit-module system requires new approaches to the organization of their own lessons, starting
with the creation of curricula in higher education. If the credit-module system is introduced correctly and
completely, it can bring great positive features to the higher education system of our country. In particular, the
introduction of a world-renowned unit of education in the higher education system of the country, the emergence of
balance and norms in the curriculum of higher education institutions, the transparent organization of the
educational process in higher education, the formation of curricula based on economics, labor market and student
needs. finally, it serves to ensure that each student, in a sense, has his or her own independent curriculum.
KEYWORDS: credit-module system, Bologna process, ECTS, module, training module, “modular education”.
БОЛОНЬЯ ЖАРАЁНИ: КРЕДИТ-МОДУЛ ТИЗИМИ Хусаинова Фируза Тохировна, Тошкент давлат юридик университети Умумтаълим
фанлар ва маданият кафедраси катта ўқитувчиси Аннотация: кредит-модул тизимига ўтиш ОТМлар ўқув дастурларини яратишдан бошлаб,
ўқитувчиларнинг ўз дарсларини ташкил қилиши бўйича янгича ѐндашувларни талаб қилади.
Агар кредит-модул тизими тўғри ва тўлиқлигича жорий этилса, у мамлакатимиз олий таълим
тизимига жуда катта ижобий хусусиятларни олиб кириши мумкин. Жумладан, у мамлакатимиз
олий таълим тизимига таълимнинг жаҳон тан олган мукаммал ўлчов бирлигининг олиб
кирилиши, ОТМлар ўқув дастурларида мувозанат ва меъѐр пайдо бўлиши, ОТМларда ўқиш
жараѐнининг шаффоф тарзда ташкил этилиши, ўқув дастурлари иқтисодиѐт, меҳнат бозори ва
талабалар эҳтиѐжлари асосида шаклланиши, дарсларнинг сифати яхшиланиши ва ниҳоят ҳар
бир талаба, маълум маънода ўзининг мустақил ўқув дастурига эга бўлишига хизмат қилади. Калит сўзлар: кредит-модул тизими, Болонья жараѐни, EСTS, модул, ўқув модули,
“модулли таълим”.
БОЛОНСКИЙ ПРОЦЕСС: КРЕДИТНО-МОДУЛЬНАЯ СИСТЕМА
Хусаинова Фируза Тохировна, старший преподаватель кафедры Общеобразовательные
дисциплины и культура Ташкентского государственного юридического университета
Аннотация: переход на кредитно-модульную систему требует новых подходов к
организации своих занятий преподавателями, начиная с создания учебных программ в
университетах. Если кредитно-модульная система внедрена правильно и полно, она может
принести огромные положительные черты системе высшего образования нашей страны. В
частности, внедрение всемирно известной единицы образования в систему высшего
образования страны, появление сбалансированности и норм в учебных программах высших
учебных заведений, прозрачная организация учебного процесса в высшей школе,

SJIF Impact Factor 2021: 8.013| ISI I.F.Value:1.241| Journal DOI: 10.36713/epra2016 ISSN: 2455-7838(Online)
EPRA International Journal of Research and Development (IJRD) Volume: 6 | Issue: 8 | August 2021 - Peer Reviewed Journal
2021 EPRA IJRD | Journal DOI: https://doi.org/10.36713/epra2016 | www.eprajournals.com |170 |
формирование учебные планы, основанные на экономике, рынке труда и потребностях
учащихся, и, наконец, они служат для обеспечения того, чтобы каждый учащийся в
определенном смысле имел свою собственную независимую учебную программу. Ключевые слова: кредитно-модульная система, Болонский процесс, ECTS, модуль,
учебный модуль, «модульное обучение».
The credit-module system is one of the latest
innovations aimed at creating a single competitive European educational space, which is widespread in the educational practice of European countries in the Bologna process.
The European style of education implies high activity of students in the learning process not only as an object of study, but also as a person who has a direct impact on the education system. To do this, on the one hand, the high level of self-awareness of students, on the other hand, the need to change the relationship between student and teacher. Unlike a traditional education system, where a student can be thought of as a conveyor belt moving from subject to subject along a predetermined trajectory (common curriculum, the same for all), the credit-module system allows students to combine different modules in addition to compulsory subjects. gives Thus, the student forms his own educational direction, focused on individual needs. During the study process, each student receives credits that measure the labor intensity of their activities. This system also includes the project form of training - the development and defense of individual or group projects on topical issues1.
Other advantages of the system are: the small number of subjects studied at the same time, the individuality of the pedagogical process, the practical direction, as well as the disclosure of students' creative abilities. In modern conditions, this system allows you to train more mobile, qualified and responsive professionals2.
The development of the "credit system" has a history of more than a century. The U.S. credit-module system was one of the first credit-module systems to contribute to the formation of credit-module systems in higher education institutions in the world, as well as in European countries. The credit-module system was first introduced in the United States in the second half of the 19th century. At that time, the country's higher education institutions operated on the basis of strictly defined
1 Bologna Treaty and ECTS (EUROPEAN CREDIT
TRANSFER SYSTEM) KF Tohirovna Archive of Conferences 14 (1), 25-31. 2
Methodological recommendations for the implementation of a system of credits (credits) at the university / State University of Management, Center for Quality; comp. O.V. Davydov, V.I. Zvonnikov, M.B. Chelyshkova. - M .: GUU, 2010.S. 13.
curricula. The curriculum consisted mainly of subjects related to the religious philosophy of the time. In almost all universities, Latin is taught as a separate subject. In fact, by this time, Latin had already become a dead language. That is, in practice there was almost no need for this language. The scope of subjects that have lost their relevance in such practice in university curricula has been considerable. As a result, universities were no longer institutions for the training of specialists, but at that time the darker strata of the population became educational institutions simply as a sign of prestige and prosperity. As a result, interest in universities among ordinary citizens began to decline. By 1869, Charles Elliot, one of the most progressive thinkers of the time, was elected president of Harvard University. Soon he will cancel the strictly defined curricula at the university. Now, at Harvard University, students have the opportunity to choose and study the subjects they want and are interested in from the subjects offered in the curriculum. That is, each student now had the opportunity to formulate his or her own university curriculum in a sense. This reform will revive interest in Harvard University among the country’s youth. As students choose the
subjects they are interested in, the subjects in the university curriculum also naturally begin to be selected. In order to attract students to their subjects, teachers are also trying to improve the quality of lessons. Otherwise, the subject they were teaching could be expelled from the curriculum. Student activity in classes also increases significantly. Because the students were mostly studying the subjects they wanted, were interested in and chose. After Harvard University abandoned strict curricula, a number of questions began to arise before the university: well, there are no longer strictly defined curricula at the university that are the same for all students. In this case, what are the criteria for students to move from course to course or graduate? That is, how can students ’progress in the curriculum be measured? How much knowledge do students need to be formed to become professionals? Harvard University finds a very simple solution to all of these questions. Each science is allocated symbolic units of measurement, i.e. credits, based on its reading load. That is, each subject is reflected in a certain amount of credits, and it is determined that the student must accumulate a certain amount of credits by the end of one academic year. Now, the university begins to determine the development of students in the

SJIF Impact Factor 2021: 8.013| ISI I.F.Value:1.241| Journal DOI: 10.36713/epra2016 ISSN: 2455-7838(Online)
EPRA International Journal of Research and Development (IJRD) Volume: 6 | Issue: 8 | August 2021 - Peer Reviewed Journal
2021 EPRA IJRD | Journal DOI: https://doi.org/10.36713/epra2016 | www.eprajournals.com |171 |
curriculum, its suitability for a particular level of education, depending on the number of credits it has accumulated. It was a convenient, easy-to-understand system for both the university and the students. Gradually, other universities will begin to adopt Harvard University internships as well. Whichever university applies this practice, the interest in these universities among young people will start to grow. The next stage in the wider dissemination of the principles of the credit system in U.S. higher education took place in the early 1900s. In 1906, the steel magnate in the United States, the great philanthropist Andrew Carnegie, founded the Education Development Fund to support teachers in higher education. He will contribute $ 10 million to the fund in the same period. Carnegie's main goal was to support the low-paid teachers of the time by adding a salary top-up and to contribute to attracting good staff to the profession. The task of the fund was to distribute the money fairly to university teachers. The Fund finds the most logical way to achieve this goal to be an existing credit system. That is, the fund decides to distribute Carnegie money to teachers based on the amount of science credits they teach. As a result, universities that have not yet adopted a credit system will also begin to introduce a credit system for their teachers in order to receive money from the fund. Thus, by the 1930s, almost all U.S. higher education institutions were operating in the credit system3.
The National Education Committee introduced credit not only in colleges but also in secondary schools, and began to determine the scope of the content of undergraduate, graduate and doctoral education on a credit basis. Since then, the "credit system" has been constantly improved4.
The credit-module system of organization of the educational process is a new form of organization of the training process. Implementing this direction is one of the first steps towards joining the single European space.
The credit-module system is a model of organizing the educational process based on the unit of modular learning technologies and ESTS credits as a unit of measurement of the student's workload.
In this case, the concept of "credit" is a quantitative feature that allows you to take into account the contribution of each subject to the content of education and training.
3
Voxid Urinov. ECTS Credit-Module System in Higher Education Institutions of the Republic of Uzbekistan: Basic Concepts and Rules. Guide. August 10, 2020. pp. 21-23. 4 Review of foreign credit systems (based on research materials carried out by Lomonosov Moscow State University within the framework of the 2005 FPRO project and the 2006 national project). P.18.
Initially, the modular system was used for individual teaching, but later it was widely used and seen as a new form. The concepts of "module" and "learning module" mean a functional unit of the learning process, a complete block of didactically adapted information. A learning module is an integrated functional unit that activates student and teacher development.
A modular system is a set of curricula designed for individual learning that provides learning achievements based on a certain level of preparation. Thus, according to modern notions, the term "modular education" means the technology of teaching students, the main means of which are the module and the module program. A module is a block of information that includes a logically completed learning material, a program of targeted action, and methodological guidelines that ensure the achievement of set goals5.
Let’s compare traditional and modular education. Traditional education consists of students studying a particular subject or section of disciplines and profile subjects being studied in the classroom. The modular training system consists of the study of training modules.
As an integral part of the working curriculum of the studied subject, the purpose of the module is to create conditions for the acquisition of knowledge, skills and abilities, as well as the formation of professional and personal qualities necessary for future work of students.
The essence of modular education is that the student can work independently with an individual curriculum, including a targeted action plan, an information bank and a methodological guide to achieve the set didactic goals.
What are the goals of a modular education system for students in higher education? This is to strengthen the control over the continuous study, mastering and quality of teaching materials during the semester, to intensify the work of the department and all teachers to update and improve the forms and methods of teaching, as well as to develop students' skills of systematic independent work and personal responsibility.
The practical and scientific significance of the module system is as follows:
- combines new and traditional approaches to teaching;
- combines a large part of pedagogical theory and practice, eliminates severe stress among students;
- The student bites the content of the studied material, which leads to a more conscious and deeper mastering of the material;
5
Credit-modular training system. A.A. Timofeev, N.A. Ushko, M.A. Yarifa. Modern dentistry. 1/2013. S. 134-135.

SJIF Impact Factor 2021: 8.013| ISI I.F.Value:1.241| Journal DOI: 10.36713/epra2016 ISSN: 2455-7838(Online)
EPRA International Journal of Research and Development (IJRD) Volume: 6 | Issue: 8 | August 2021 - Peer Reviewed Journal
2021 EPRA IJRD | Journal DOI: https://doi.org/10.36713/epra2016 | www.eprajournals.com |172 |
- creates conditions for personal development; - provides flexibility and adaptability to the
individual needs of the individual, the level of initial training and creates conditions for the development of thinking, memory and creative abilities in students.
The credit-module system also increases the requirements for university teachers. In the module system, the teacher performs not only information and control functions, but also consultant and coordinator functions. The leading role of the teacher in the pedagogical process is preserved. Using the credit-module system, the student has a work plan and database, as well as methodological recommendations for achieving the set learning objectives, and can independently master certain sections of the curriculum6.
Thus, during the transition to a credit-module system, there is an increase in the importance of independent work in the educational process, and this requires an increase in independence. In the credit-module system, students always have the opportunity to receive help and advice, if necessary, to evaluate their work by the teacher and other students. This will help you develop teamwork skills. This system not only helps to increase the activity of students (increasing their desire for knowledge), but also teachers, forcing them to improve their pedagogical skills7.
In the context of a credit-module system, each module must be a completed segment of the curriculum, as a result of which the student acquires a certain set of competencies. These competencies must be checked and evaluated. It is well known that competencies are formed over a long period of time (at least one semester and possibly several semesters). It is obvious that it is expedient to use the concepts of "section", "subdivision", "topic" rather than the concept of module of the period of study completed during the semester. The module can be understood as a separate part of the training course, a thematic block that combines several learning topics mastered in lectures and seminars.
The curriculum in European universities has a different structure: a single module combines subjects that are thematically close to each other, regardless of their general academic position. The basic principle of module construction is the transition from simple to complex, from
6 Urazgalieva R.I. Credit-modular system of training
organization as a factor in the formation of the student's self-educational skills. Abstract. Orenburg, 2010.S. 97. 7
Modern pedagogical methods in effective organization of lessons AS Narzulloevna, KF Tokhirovna, AZ Bakhramovna… - Journal of Critical Reviews, 2020.
methodological to practical sciences. Therefore, the module may include general professional sciences as well as natural sciences. An important feature of the module system is that it is focused on student practice, including research. The module combines conceptual knowledge and practical skills to enable the student to move quickly from one direction to another, from one level to another quickly and efficiently. Therefore, the modular organization of the educational process at the master's level should be associated with an individual master's program (the subject of his master's dissertation). In the European Higher Education Area, the module provides several courses (disciplines). The module creates a holistic view of a particular topic and should demonstrate the specific competencies that the student has acquired after mastering this module. The module is determined not by the topic but by the student’s
achievement of the learning outcome. The number of modules per semester is determined by what results the student should achieve in a semester.
The credit-module system of organization of the educational process is designed to positively address the following tasks:
- Divide the training material into modules, checking the mastery of each module;
- use a broader scale to assess knowledge; - increase the objectivity of knowledge
assessment; - Encourage regular independent work of
students during the semester; - Introduction of healthy competition in
education. The credit-module system has its advantages
and is considered as a means of increasing the mobility of students in the transition from one curriculum to another, including the next stage of education. The credit system allows to take into account not only the student's workload, but also his participation in research, conferences, science Olympiads and more8.
Specific features of the credit module system: - Introduction of a system of credits for the
assessment of labor costs of students and teachers for each subject of the curriculum;
- Freedom of choice of elective courses by students;
- Freedom of choice of teachers by students; - direct participation of the student in the
formation of his individual curriculum; - creation of special academic services -
institute of tutors;
8 Methodological recommendations for the implementation of a system of credits (credits) at the university / State University of Management, Center for Quality; comp. O.V. Davydov, V.I. Zvonnikov, M.B. Chelyshkova. - M .: GUU, 2010.S. 18.

SJIF Impact Factor 2021: 8.013| ISI I.F.Value:1.241| Journal DOI: 10.36713/epra2016 ISSN: 2455-7838(Online)
EPRA International Journal of Research and Development (IJRD) Volume: 6 | Issue: 8 | August 2021 - Peer Reviewed Journal
2021 EPRA IJRD | Journal DOI: https://doi.org/10.36713/epra2016 | www.eprajournals.com |173 |
- Extensive powers of the faculty in the organization of the educational process (identification and accounting of types of workload of professors and teachers);
- Educational-methodical and information-technical support of educational process9.
There is every reason to believe that the credit-module system will become a key link in Europe's single education system in the future, as it has established itself as a tool for transparency, comparability of student learning, and academic recognition of skills and competencies. Therefore, educational programs based on the credit-modular approach are being implemented outside the European Union.
The credit system is a sufficiently diverse and flexible educational tool to meet the needs of the market of educational services, working within the framework of a certain educational philosophy, aimed at the transition of educational institutions to individual forms of collective education. The credit system emerged precisely in the liberal education system, where it was initially shaped as a factor in the competitiveness of the higher education institution.
In terms of functionality, the credit system serves as a basis for:
- Individual organization of the educational process, which allows students to create individual curricula, freely determine the sequence of study of subjects and independently create an individual semester schedule of classes;
- systems for evaluating the results of educational activities of students and teachers;
- increase the level of academic freedom of all subjects of the educational process;
- Economic calculations of teaching costs and teachers' salaries, budgeting of the higher education institution and its subdivisions10.
As an integral attribute of the Bologna Declaration, the credit-module system is given two main functions:
1. Facilitate the mobility of students and teachers and simplify the transition from one university to another.
2. Clearly define the scope of work performed by the student, taking into account all types of
9 Credit-modular system of education at the university: the reverse side of the medal. V.G. Dunyaeva. TSU science vector. 2012. No. 4 (11). P. 91. 10 The introduction of a credit system in a Russian university: the first results in 60 experiments on the transition to the credit system of the Vladivostok State University of Economics and Service, 2004-2005 / Ed. OO Martynenko. - Vladivostok: Publishing house of VSUES, 2005. С.5.
educational and scientific activities. The amount of credits accumulated by a student in the study program determines the student’s ability.
Models of credit systems for the evaluation of educational programs:
- credit systems aimed at ensuring academic mobility;
- credit systems, mainly focused on the accumulation of loans.
According to the ESTS system, the academic year in European higher education institutions lasts an average of 40 weeks. The student’s annual
academic load was 60 credits. Based on this, a student should receive 30 credits per semester.
A European student can accumulate credits for a future diploma over a long period of time. Accumulation of credits allows a student to improve their skills throughout their life, for example, to obtain additional higher education. Thanks to the loans, the student will be able to take long breaks from study - the loans previously taken will not be lost. Even if a student is expelled from a higher education institution for any reason, the credits he or she receives can be used to continue his or her studies later, and they are taken into account again and again, which greatly helps the student to get a second higher education. Credits allow, under certain conditions, to take into account the student's work experience in the specialty as part of higher education11.
According to the rules of the Bologna process, it is customary to give loans to students for internships and internships, to prepare for exams. Indeed, it is a learning process that requires a certain amount of labor, it is important to evaluate its value as objectively as possible. Undoubtedly, in addition, credits should be given for essays and coursework written by a student that require the study of many sources and has high academic performance.
Credits are issued to a student only on the basis of the results of successful completion of the final form of control (examination, test, test or final control work, etc.) specified in the curriculum for a particular subject.
The modular-rating system of knowledge assessment implies a 100-point system, i.e. 100 points is the maximum score that a student can receive for academic success in the process of studying the module. In assessing the student's knowledge for the module, all types of classes conducted, scores obtained for current and final controls (e.g., for practical, laboratory classes, etc.) are taken into account.
The unity of the field of education does not mean its unification. On the contrary, all the basic
11
Bologna Treaty and ECTS (EUROPEAN CREDIT TRANSFER SYSTEM) KF Tohirovna - Archive of Conferences, 2021.

SJIF Impact Factor 2021: 8.013| ISI I.F.Value:1.241| Journal DOI: 10.36713/epra2016 ISSN: 2455-7838(Online)
EPRA International Journal of Research and Development (IJRD) Volume: 6 | Issue: 8 | August 2021 - Peer Reviewed Journal
2021 EPRA IJRD | Journal DOI: https://doi.org/10.36713/epra2016 | www.eprajournals.com |174 |
documents adopted after the signing of the Bologna Declaration state that every country and every educational institution has the right and even the obligation to preserve its traditions, achievements and priorities in the field of education. A single area means mutual understanding and mutual transparency of educational practices of different countries and higher education institutions.
REFERENCES
1. Bologna Treaty and ECTS (EUROPEAN CREDIT TRANSFER SYSTEM) KF Tohirovna Archive of Conferences 14 (1), 25-31.
2. Modern pedagogical methods in effective organization of lessons AS Narzulloevna, KF Tokhirovna, AZ Bakhramovna… - Journal of Critical Reviews, 2020.
3. Implementation of the credit system in a Russian university: the first results of 60 experiments on the transition to the credit system of the Vladivostok State University of Economics and Service, 2004-2005 / Ed. OO Martynenko. - Vladivostok: Publishing house of VSUES, 2005.
4. Vohid Hrinov. Uzbekistan Respubliki Oliy Talim Muassasalarida ECTS Credit-Module Tizimi: Assosiy Tushunchalar va Koidalar. Қўllanma.
August 10, 2020.21-23-b. 5. Credit-modular training system. A.A. Timofeev,
N.A. Ushko, M.A. Yarifa. Modern dentistry. 1/2013.
6. Credit-modular system of education at the university: the reverse side of the medal. V.G. Dunyaeva. TSU science vector. 2012. No. 4 (11).
7. Guidelines for the implementation of the system of credits (credits) at the university / State University of Management, Quality Center; comp. O.V. Davydov, V.I. Zvonnikov, M.B. Chelyshkova. - M .: GUU, 2010.
8. Review of foreign credit systems (based on research materials carried out by the Lomonosov Moscow State University in the framework of the 2005 FPRO project and the 2006 national project). P.18.
9. Urazgalieva R.I. Credit-modular system of training organization as a factor in the formation of the student's self-educational activity skills. Abstract. Orenburg, 2010.

SJIF Impact Factor 2021: 8.013| ISI I.F.Value:1.241| Journal DOI: 10.36713/epra2016 ISSN: 2455-7838(Online) EPRA International Journal of Research and Development (IJRD)
Volume: 6 | Issue: 8 | August 2021 - Peer Reviewed Journal
2021 EPRA IJRD | Journal DOI: https://doi.org/10.36713/epra2016 | www.eprajournals.com |175 |
STRUCTURAL-SEMANTIC TYPES OF ADDRESSESIN
VERSES BY A. AHMATOVA
Yevkocheva Z.M. PhD Student, UzSWLU
ANNOTATION Addresses as a separate intonational and grammatically independent component of the text attracted the interest
of scientists for a long time. Recently, the pragmatic and methodological aspects of address have been investigated.
As you know, in many works of art, adress is of great importance, since it serves to reveal the inner world of both
the characters and the author himself. This article discusses the structural-semantic types of addresses in the works
of Anna Akhmatova.
KEYWORDS: address, noun, adjective, syntax, function, role, repetition, construction.
СТРУКТУРНО-СЕМАНТИЧЕСКИЕ ВИДЫ ОБРАЩЕНИЙ В
СТИХОТВОРЕНИЯХ А. АХМАТОВОЙ
Ёвкочева З.М., Докторант УзГУМЯ
Аннотация. Обращения как обособленный интонационно и грамматически самостоятельный
компонент текста давно вызывает к себе интерес ученых. В последнее время исследуется
прагматический и методический аспекты обращений. Как известно, во многих художественных
произведениях обращение имеет большую значимость, поскольку служит раскрытию внутреннего мира
как персонажей, так и самого автора. В данной статье рассматриваются структурно-семантические виды
обращений в произведениях Анны Ахматовой. Ключевые слова: обращение, существительное, прилагательное, синтаксис, функция, роль, повтор,
осложненный, неосложненный, конструкция.
A. AXMATOVA SHERLARIDA MUROJAATNING TARKIBIY-SEMANTIK TURLARI
Yevkocheva Z.M., PhD student, UzSWLU
Izoh. Murojaat matnning alohida intonatsion va grammatik jihatdan mustaqil tarkibiy qismi sifatida uzoq vaqt olimlarning qiziqishini uyg'otdi. Yaqinda murojaatlarning pragmatik va metodologik jihatlari o'rganildi. Ma'lumki, ko'plab san'at asarlarida murojaat katta ahamiyatga ega, chunki u qahramonlarning ham, muallifning ham ichki dunyosini ochishga xizmat qiladi. Ushbu maqolada Anna Axmatova asarlarida murojaatning tarkibiy-semantik turlari ko'rib chiqiladi. Kalit so'zlar: murojaat, ot, sifat, sintaksis, funktsiya, rol, takrorlash, qurilma.

SJIF Impact Factor 2021: 8.013| ISI I.F.Value:1.241| Journal DOI: 10.36713/epra2016 ISSN: 2455-7838(Online) EPRA International Journal of Research and Development (IJRD)
Volume: 6 | Issue: 8 | August 2021 - Peer Reviewed Journal
2021 EPRA IJRD | Journal DOI: https://doi.org/10.36713/epra2016 | www.eprajournals.com |176 |
The syntactic category of address has long attracted the attention of Russian linguists, who note its property not to enter into grammatical connections with other words in a sentence and its special intonation design, which is reflected in punctuation marks in writing. Appeal is a separate intonational and grammatically independent component of a sentence or a complex syntactic whole, which serves to designate a person or object that is the addressee of speech. The call is usually not classified as a member of the sentence and is not included in the syntax tree of dependencies or constituents. Examples:
Приду, приду я вновь, мой милый домосед, С тобою вспоминать беседы прежних
лет (Пушкин) [8]. The term "conversion" is already known in
the ancient theories of language and style (Quintilian, Cicero, D. Halicarnassus) and is considered as a figure of speech used for greater persuasiveness and embellishment of speech [2, p. 3-6].
In the works of M.V. Lomonosov [5], A.Kh. Vostokov [4] describes the vocative case, which in the Old Russian language was a morphological means of expressing the syntactic function of the dominant word of that member of the sentence (“vocative, showing the name of the object to which
speech refers” [4, p. 21]. The vocative case in F. I. Buslaev received the name “conversion.” [3] It
should be noted that the term “conversion” appears
for the first time in the work of F.I. word ", then" word name ", then" inserted members of the sentence "[3].
In Russian linguistics, since the 19th century, address is traditionally considered in the syntax section as “a grammatically independent and
intonationally isolated component of a sentence or a more complex syntactic whole, denoting a person or object to which speech is addressed” [6, p. 340-341].
The attention of researchers is attracted by such problems as syntactic status and functions of address, its semantic and structural types, i.e. ways of expression, as well as the degree of semantic loading, types of intonation when addressing, the position of the address in the structure of the sentence, connections with the rest of the sentence.
The appeal has been studied sufficiently, however, due to the complexity and inconsistency of the linguistic nature of the object itself, many issues, including those related to the definition of constitutive signs of appeals, remain unresolved or are solved by scientists in different ways. In particular, N.Yu. Shvedova rightly notes that the appeal, being a syntactically independent component of the sentence, is connected with the rest of the sentence not only semantically ("materially"), but
also syntactically [7]. Appeals in pragmatic and stylistic aspects have not been studied sufficiently.
Let's consider the structural and semantic types of references in the works of A. Akhmatova.
A. Akhmatova is a poet-lyricist, since in all her works there is a pronounced lyrical flavor. A significant part of her work is a dialogue in which A. Akhmatova uses addresses in all the diversity of its structural and semantic types.
Among the appeals, A. Akhmatova most often uses the forms of uncommon appeals, expressed by nouns denoting concrete or abstract concepts.
In the works of A. Akhmatova, there are uncommon appeals expressed by adjectives, while they are put out by the author in a separate sentence with an exclamation, and, most often, with a repetition, which makes the addressee the object of the narrative, which is the center of the events. Such appeals not only name the addressee, which can be both a person and an object, but also contain a subjective modality, and also show the intonation with which the author addresses the addressee: Я ответила: «Милый, милый! И я тоже. Умру с тобой…» [1].
Common appeals are a type of appeals that contains more information, as opposed to uncommon ones, and it is also actively used in the lyrics of A. Akhmatova.
The following example uses a common adjective + abstract noun reference: Слава тебе, безысходная боль! Умер вчера сероглазый король. Вечер осенний был душен и ал, Муж мой, вернувшись, спокойно сказал: «Знаешь, с охоты его принесли, Тело у старого дуба нашли. Жаль королеву. Такой молодой!.. За ночь одну она стала седой…» [1].
The largest group of the total number of considered poems can be considered those works of A. Akhmatova, in which the widespread appeal, expressed by an adjective + noun, denotes a person directly: Меня покинул в новолунье Мой друг любимый. Ну так что ж! Шутил: «Канатная плясунья! Как ты до мая доживешь? [1].
Often A. Akhmatova uses appeals in which the author's subjective assessment is expressed: Высоко в небе облачко серело, Как беличья расстеленная шкурка. Он мне сказал: «Не жаль, что ваше тело Растает в марте, хрупкая Снегурка!» [1].
Attention should be paid to the frequency of addressing a friend, which is often found in the

SJIF Impact Factor 2021: 8.013| ISI I.F.Value:1.241| Journal DOI: 10.36713/epra2016 ISSN: 2455-7838(Online) EPRA International Journal of Research and Development (IJRD)
Volume: 6 | Issue: 8 | August 2021 - Peer Reviewed Journal
2021 EPRA IJRD | Journal DOI: https://doi.org/10.36713/epra2016 | www.eprajournals.com |177 |
poems of A. Akhmatova both in a complicated and uncomplicated form: И что память яростная мучит, Пытка сильных – огненный недуг! — И в ночи бездонной сердце учит Спрашивать: о, где ушедший друг? [1].
Quite a large part of the addresses of this group are nouns denoting a specific addressee: literary characters and characters invented by the author in the context of a poem, real personalities, gods: В ярком блеске Тюилери, Развеваются знамена. — «Ты страдал! Теперь цари! Здравствуй, сын Наполеона!» [1].
Present in the lyrics of A. Akhmatova's treatment of the particle o, both included in the sentence and included in a separate sentence.
The most productive in the Russian language is such a form of widespread appeal as "noun + adjective in the position of a single definition": poems with addresses of this type make up a fairly large layer of A. Akhmatova's lyrics, while frequent references to objects and phenomena, which shows that the addressee speech for the author or lyric hero of the poem is of particular importance and significance, the very image of the lyric addressee is pleasant and dear to him.
This characteristic is even more clearly expressed in the combination of a dear friend as an address of the type "noun + adjective in the position of an agreed definition", which gives the poems a friendly tonality, frankness, the character of a personal, but at the same time, open, confidential conversation with the addressee. The use of this combination should be noted as characteristic of A. Akhmatova's poetic speech.
The widespread appeals “noun + pronoun in
the position of a single definition” are used in the
analyzed lyric works of A. Akhmatova, which makes it possible to define this technique as a characteristic feature of her work. It is noteworthy that in all cases the poetess uses the possessive pronoun mine, which not only emphasizes the special attitude to the addressee named by the author, the state of closeness to the poet, but also the involvement of the lyric hero in the situation described in the poem.
It should be noted that A. Akhmatova, when addressing the addressee, often uses "noun + adjective in the position of a single definition + pronoun in the position of a single definition", thereby strengthening the feelings conveyed by the address to the addressee, its special significance, in some cases reinforcing the pathos of complex treatment with a particle O: И ты, мой юный, мой печальный, Уходишь прочь! По тебе томится вечер,
Черноокая моя! Я буду здесь. Мы все горим: Весь город мой, река, и я… Крести крещеньем огневым, О, милая моя! [1].
It should be noted that A. Akhmatova's use of addresses of the types under consideration in a homogeneous series makes it possible to more fully characterize the addressee, to show the level of her relationship with him, to characterize the connection existing between them.
In the process of analyzing the types of references used by A. Akhmatova in lyric works, a large number of examples of the use of large common constructions were revealed. So, there are examples of using a noun with a participle or a noun expressed with a participle as a reference. Unlike appeals with adjectives, such constructions have greater emotionality and expressiveness, speech acquires a different character, becoming in some cases higher, in other cases - more solemn, in others - more desperate. Such appeals, in comparison with appeals expressed by simpler common constructions, sound much brighter and are able to exaggerate the author's feelings towards the addressee: Косноязычно славивший меня Еще топтался на краю эстрады [1].
Thus, the use of non-widespread and widespread appeals of the type “substantivized
adjective + pronoun in the position of a single definition” should be considered productive in A.
Akhmatova's work, while exclusively the possessive pronoun mine is used. Summing up the analysis of A. Akhmatova's use of various structural and semantic types of references in her poetic works, it should be emphasized that most often and predominantly nouns and substantive adjectives are used in the constructions of common and non-widespread types. Often, nouns are spread by adjectives and the pronoun mine. REFERENCES
1. Akhmatova A. Collected works: In 6 volumes - M., 1998.
2. Bagna Ibrahim. Types and functions of the Russian address as the name of the addressee in different types of literature: Avtoref. diss. ... Candidate of Philosophy. - M., 2004.
3. Buslaev F.I. Historical grammar of the Russian language, 1875.
4. A.Kh. Vostokov Russian grammar, according to the outline of his own abridged grammar, is more fully stated. - M., 1835.
5. L.V. Lomonosov Complete Works, v. 7, Works on Philology. - 1739-1758.
6. I. I. Kruchinina Appeal // Linguistic Encyclopedic Dictionary / Ed. V.N. Yartsevoy - M., 1990.

SJIF Impact Factor 2021: 8.013| ISI I.F.Value:1.241| Journal DOI: 10.36713/epra2016 ISSN: 2455-7838(Online) EPRA International Journal of Research and Development (IJRD)
Volume: 6 | Issue: 8 | August 2021 - Peer Reviewed Journal
2021 EPRA IJRD | Journal DOI: https://doi.org/10.36713/epra2016 | www.eprajournals.com |178 |
7. Shvedova N.Yu. Propagation of a sentence by including an appeal // Russian grammar. T. 2. - M., 1980.
8. https://ru.wikipedia.org/wiki/%D0%9E%D0%B1%D1%80%D0%B0%D1%89%D0%B5%D0%BD%D0%B8%D0%B5_(%D0%BB%D0%B8%D0%BD%D0%B3%D0%B2%D0%B8%D1%81%D1%82%D0%B8%D0%BA%D0%B0)

SJIF Impact Factor 2021: 8.013| ISI I.F.Value:1.241| Journal DOI: 10.36713/epra2016 ISSN: 2455-7838(Online)
EPRA International Journal of Research and Development (IJRD) Volume: 6 | Issue: 8 | August 2021 - Peer Reviewed Journal
2021 EPRA IJRD | Journal DOI: https://doi.org/10.36713/epra2016 | www.eprajournals.com |179 |
KHOREZM REGION'S INDUSTRIAL POLICY AND ITS
ESSENCE
Avazov Ozod Rajabbayevich A Teacher of Urgench State University
ANNOTATION This article explains the issue and content of industrial reforms carried out in Khorezm in the early years of
independence.
KEYWORDS: Khorezm region, industry, industrial produce, industrial complex of territories, foreign
investments, joint ventures, small and medium business.
INTRODUCTION The administrative-command policy of the
Soviet period was dominated by administrative methods, which had a number of negative consequences. The first President of the Republic of Uzbekistan I.A. Karimov said the followings by evaluating the situation: “… during the former
regime the economy of our republic was unilaterally developed, but focused on the production of raw materials, and it caused only cotton-growing country with its negative features . With its backward production and social infrastructure, Uzbekistan was ranked the lowest in the former Soviet Union on per capita consumption. [1, p.5]” MATERIALS AND METHOS
After Uzbekistan gained its independence in 1991, it abandoned a tyrannical, administrative-command, planning and distribution system and "developed a model of development recognized as an „Uzbek model‟ all over the world [2, p.103]." Indeed, it became obvious that "…the creation of a socially-oriented market economy requires a completely new model that takes into account the peculiarities of the republic and fully reflects the past, present and future development of Uzbekistan [2, p.103]."
It is well known that each region has its own peculiarities in the comprehensive development of independent Uzbekistan. RESULTS AND DISCUSSION
Khorezm region is also a northern oasis in the Lower Amudarya part of the republic. 21.9 percent of the population live in urban areas, and 78.1 percent live in rural areas. The area occupies 1.4% of the territory of Uzbekistan [3, p.1]. The
center of the region is the city of Urgench. Its administrative-territorial structure consists of 10 districts, including 3 cities, 7 towns, 101 village gatherings, 612 settlement [4, p.103].
It is noted that the economy of Khorezm region is agrarian and industrial, and in the territorial division of the republic, Khorezm region specializes in light and food industry, and in agriculture for cotton and rice cultivation. Khorezm Ipagi textile factory with Chinese technology in Urgench, medical-cotton manufacturing factory in Baghdad according to UK technology, Khonka cotton-thread and cotton-fabric producing company in cooperation with Kamashin factory in Russia, „Gurlantextile‟
enterprise in cooperation with „Yazex‟ firm in
Turkey were built in here [5, p.160]. As well as there are the factories for cotton cleaning plant, oil-grease, brickwork, carpet weaving and other enterprises in Khiva were built [6, p. 151] .
During the Soviet era, it was established that even the smallest products could be imported from anywhere, even nails, nuts, that is, products that could be manufactured in each factory [7, p. 40]. . Although many of the products and equipment are available in Uzbekistan, the center al administrative power denied access to it because of the lack of funds as „an excuse‟ [7, pp.82,84] It was assumed that the development of industry was an important factor in ensuring sustainable economic growth in the newly independent Uzbekistan, at early stages of reforms the great attention was paid to mining, reproducing, gas, oil, gold and other natural minerals, and mechanical engineering. Effective progress has been made in the creation of large-scale industrial enterprises Khorezm by involving foreign investment to industry , in particular the creation of joint

SJIF Impact Factor 2021: 8.013| ISI I.F.Value:1.241| Journal DOI: 10.36713/epra2016 ISSN: 2455-7838(Online)
EPRA International Journal of Research and Development (IJRD) Volume: 6 | Issue: 8 | August 2021 - Peer Reviewed Journal
2021 EPRA IJRD | Journal DOI: https://doi.org/10.36713/epra2016 | www.eprajournals.com |180 |
ventures, small and medium-sized businesses enterprises.
However, in the early years, the disruptions between the economic relations of the previously established economic system have been reflected in other sectors of the economy, where it has previously had an impact on the manufacturing industries. As a result, the economy of Khorezm region experienced some crises in early 1992, which led to a falling in production by 48.0% in the region's industrial enterprises [8, p. 14]. However, in recent years, there has been a positive change with the efforts of the government, in the growth of industrial output in 2003 reaching 103.5 percent, and in 2001 - 100.3 percent [9].
During the years of independence, one of the main priorities of the economic policy of the Government was the formation of a highly efficient industrial and production system, taking into account the regional peculiarities of socio-economic development of Khorezm.
Within the framework of these measures, much attention was paid to increasing labor productivity in rural areas and industry, developing production and increasing employment.
In 2001, Khorezm region had a labor force of 677.4 people, or 49.4 percent of the total population. In the same year, 26,341 new jobs were created in Khorezm region, including 24,615 in medium and small businesses and 7,590 in small and medium enterprises [10, p. 6].
In 2001 in all 26 job fairs were organized in the region of which 3 in Urgench, 2 in Khonqa, 4 in Bagat, 2 in Gurlan,3 in Khazorasp, 4 in Shovot, and 2 in Urgench district, 1 in Yangiarik, 2 in Yangibazar, and 1 in Khiva and 1 in Koshkupir district. They offerred 5517 job vacancies from 670 employers and organizations. It was attended by 6,265 job seekers. Of these, 1,847 were employed, and 3,665 were provided with consultations on labor legislation and law [11, p. 3].
Given the importance of developing industry in sustaining Uzbekistan's economic growth in that context, the first step was to develop mining gas, oil, gold and other minerals that are of strategic importance to the development, progression, and machine-building industries. great attention has been given.
It should be noted that the Khorezm region was one of the last in the country in the early 1990s in terms of development of its industry. There was a need to take concrete measures to address this backwardness. During this period, industrial production declined and production volumes decreased. Many industrial enterprises in the region have slowed down.
As has been the case throughout the country, much has been done to develop industrial
production in the Lower Amudarya. In the transition to market relations, the region's economy, as well as its economic entities, as in other regions of the country, is characterized by inflation and slowdown in production, as well as gradual stabilization of the situation and growth. also experienced a period of seizure. Although economic disruptions in the pre-existing economic system have primarily affected the manufacturing industries, it has gradually been reflected in other sectors of the economy. As a result, the economy of Khorezm region experienced a severe crisis in early 1992, leading to a decline in production by 48%.
In Khorezm region in 1992-1995 there was a decline in industrial production. Due to lack of understanding of the essence of the new economic relations and lack of modern knowledge and thinking, 24 enterprises in the region closed their operations at the amount of 40 million 500 thousand sums of damage in 1994. Many industrial enterprises have significantly reduced production since 1993.
The industrial growth rate in the region was 85.3% in 1996, 100.6% in 1997, 106.2% in 1998, 102.4% in 1999, 103.5% in 2000, and in 2001 it was 100.3%. According to these indicators, the growth rate of industrial production in Khorezm region was lower than the national average.
During this period, as a result of a short-term program to develop the productive capacities in the Khorezm region, there was an increase in the share of industrial output in the gross regional product. In particular, in 1990 industrial output was 31.1% of GDP, in 1996 this figure was 35% and in 2001 it was 38.6% [12, pp. 29-30]. However, in some sectors, industrial output decreased in gross domestic product. In 1998, there was a downturn in the chemical and oil, building materials, woodworking and cellulose-paper industries.
According to the analysis, in 1990-1996 the volume of industrial production in Khorezm region increased by 2.4 times. During this period, the share of industrial production in the country at the national level increased from 3.6% in 1991 to 3.8% in 1996, and dropped to 2.5% in 2001. Analyzing specific industries, there was a decline in production across a number of industries for internal reasons. Examples include knitwear production reduced by almost 87%, footwear by 56%, carpets reduced by 30% and refined oils by 18%.
In general, during the 1990s, the Khorezm regional industry declined by 1.92 times, including the food industry by 1.65 times, light industry by 1.32 times, while the energy sector by 22%. , chemical and petrochemical industries decreased by 75.8%, and construction materials production by 26.1%.

SJIF Impact Factor 2021: 8.013| ISI I.F.Value:1.241| Journal DOI: 10.36713/epra2016 ISSN: 2455-7838(Online)
EPRA International Journal of Research and Development (IJRD) Volume: 6 | Issue: 8 | August 2021 - Peer Reviewed Journal
2021 EPRA IJRD | Journal DOI: https://doi.org/10.36713/epra2016 | www.eprajournals.com |181 |
As a result of structural changes, the GDP structure has also changed. The share of new enterprises established in the manufacturing sector has been growing. In particular, in 1995 the growth rate of industrial complex development was 100.1% in Khorezm region and 106.1% in the country. CONCLUSION
The priority of the Government of the Republic in improving the social life of the population of Khorezm region, strengthening its health is of great importance in the development of this region. Reforms and measures taken in various spheres of public life have had a positive impact on the welfare of the population. The focus is on the development of small business and private entrepreneurship, services and home-based work to create a labor market, employment and welfare. A strong regulatory framework for social protection has been created in the region, and a mechanism has been established to provide state guarantees and incentives for material and financial assistance. REFERENCE
1. Karimov I.A. The Concept of Intensification of Democratic Reforms and Formation of Civil Society in the Country: Report at the Joint Session of the Legislative Chamber and the Senate of the Oliy Majlis of the Republic of Uzbekistan. November 12, 2010. - Tashkent: Uzbekistan, 2010. - p.5.
2. Karimov I.A. High spirituality is an Invincible Power. - Tashkent: Manaviyat (Enlightenment), 2008. - p. 103.
3. Khorezm Regional Present archive Department of Statistics. The Passport of Khorezm Region.–Urgench, 2001, p.1.
4. Uzbek National Encyclopedia, State Science Publish House. – Т.9. – p. 471; Regions and Republic of Karakalpakistan in Uzbekistan. The Information Leaflet, Chief Editorship of Encyclopedia, 1995, – p.103
5. The Regions of Uzbekistan During the Years of Independence. – Тashkent: Sharq, 1996. – p.160.
6. Ahmedov E. The Cities of Uzbekistan During the Years of Independence – Tashkent: Abu -Ali -Ibn Sino, 2002. – p.151.
7. Central State Archive of the Republic of Uzbekistan. Р-682-fund, 1-list, 88- volume pp/ 82, 84.
8. Ruzmetov B. Regional economy: experience, problems, efficiency in complex development– Тashkent : Fan, 2002. – p.14
9. Current Archive of Khorezm Regional Department of Statistics, Statistic Data on Khorezm Region belonging to 1991-2001.
10. Khorezm: Investment Capacity. – Tashkent, 2002. – p.6.
11. Social Wefare Department of Khorezm Regional Department of Statistics. Yearly Report of 2001 –Urgench, 2002. –p.3.
12. Khorezm regional Government Administrative Report. Urgench, 2001. P.p. 29-30

SJIF Impact Factor 2021: 8.013| ISI I.F.Value:1.241| Journal DOI: 10.36713/epra2016 ISSN: 2455-7838(Online)
EPRA International Journal of Research and Development (IJRD) Volume: 6 | Issue: 8 | August 2021 - Peer Reviewed Journal
2021 EPRA IJRD | Journal DOI: https://doi.org/10.36713/epra2016 | www.eprajournals.com |182 |
THE ROLE OF DR. SHERALI TURDIEV BETWEEN UZBEK AND TATAR LITERARY RELATIONS
Turdieva Khulkar Komilovna ORCID: 0000-0002-0435-8689
Ph.D., Senior Lecturer of Alisher Navoi Tashkent State University of Uzbek Language and Literature, Tashkent, Uzbekistan
Article DOI: https://doi.org/10.36713/epra8306 DOI No: 10.36713/epra8306
ABSTRACT
Uzbek and Tatar nations have had strong literary relations since the beginning of XX century. In building such a
good friendly bonds, particular individuals play a significant role with their attempts. Dr. Sherali Turdiev did a
lot in the development of literary relations between Uzbek and Tatar nation. It can be proved by his written works
also exchanged letters. In this article, request, gratitude and invitation letters by Tatar scholars towards Dr.
Sherali Turdiev will be discussed.
KEY WORDS: literary relations, correspondences, publication, mutual literary supports
Literary relations are an important process in any nation‟s spiritual and cultural development of a
nation which can be shown by literary translations, literary impact to one another, lively dialogue, and correspondences exchanging letters, scientific and friendly collaborations (meetings, ceremonies, exhibitions, seminars, conferences, congresses and symposiums) as well as mentor-mentee traditions. Literary relations has long been a factor of cooperation and understanding between countries, people and great writers, poets, scholars. Both Uzbek and Tatar nations have had strong bonds in the various fields since long centuries ago. As both nation have the same family of their language, similar cultural principles and the same religion, they have many things in common in the sphere of literature as well. Tatar literature became widespread in Central Asia, Transcaucasia and East Turkestan before the revolution. Starting from 1910-1911 most of the literature and periodicals in Turkestan were published in Tatar language. Before the revolution, various Tatar newspapers and magazines entered Turkestan such as “So‟z” (World) from Moscow;
“Vaqt” (Time), “Sho‟ro” from Orenburg; “Turmush”
from Ufa; “Yulduz” (The star); “Quyosh” (The sun)
from Kazan had a significant impact on the development of Uzbek literature and periodicals. The works of progressive Tatar poets and writers such as
Gabdulla Tukay, Galimjon Ibragimov, F. Amirkhanov, H.Taktash and others were published regularly. Uzbek writers also participated actively in Tatar journals, publications with their prose and poetic as well as research works and studied at educational establishments named “Madrasai Oliya”,
“Madrasai Husayniya” and so forth. Besides that, poems and journalistic articles of Tatar and Uzbek writers were published on the pages of newspapers and magazines (“Uchqun”, “Sharq”, “Inqilob”,
“Chayan”, “Maorif va o‟qituvchi”, “Ishtirokiyun”) in
Samarkand and Tashkent (Hamza, S.Avloni, N.Turakulov, A.Qodiriy, A.Sharafutdinov, A.Saadi, S.Ayni and etc.)1
Dr. Sherali Turdiev also was keen on Tatar literature and history educations and he had dedicated a big part of his life in studying Tatar literature and contributed quite importantly with his research works, translations, exchanging materials as well as with his disinterested assistance to Tatar researchers.
1 Творческая связи узбекской литературы.
Ташкент: Фан, 1983. – С. 73.

SJIF Impact Factor 2021: 8.013| ISI I.F.Value:1.241| Journal DOI: 10.36713/epra2016 ISSN: 2455-7838(Online)
EPRA International Journal of Research and Development (IJRD) Volume: 6 | Issue: 8 | August 2021 - Peer Reviewed Journal
2021 EPRA IJRD | Journal DOI: https://doi.org/10.36713/epra2016 | www.eprajournals.com |183 |
DR. SHERALI TURDIEV’S WORKS RELATED TO TATAR LITERATURE:
Ahmad Zaki Validi. Bo‟linganni bo„ri yer. (The lone wolf finds trouble) – Book translated by Sherali Turdiev from tatar language into Uzbek.
Adabiy do‟stligimiz tongida. (In the beginning of our everlasting friendship) Book. Tashkent: Uzbekistan, 1974. – 34 p.
Hayotbaxsh ta‟sirlar: o„zbek va qardosh
xalqlar adabiy aloqalari tarixidan. (Vital influences: from the history of literary relations between the Uzbek and fraternal nations) Book. Tashkent: Adabiyot va san‟at
nashriyoti, 1977. –105 p. Adabiy hamkorliklar samarasi: o„zbek-tatar
adabiy aloqalari tarixidan. (The results of literary cooperation: from the history of Uzbek-Tatar literary relations) Book. Tashkent: Adabiyot va san‟at nashriyoti,
1984. –126 p. Гаспиринский и Средняя Азия. Голос
Крыма. – 2001. – 23 марта. (Gaspirinsky and Central Asia)
The activity of Turkestani Jadids as reflected in the records of the Tsarist secret police (1905-1917). Cental Asia on Display. Proceedings of the VII Conference of the European Society for Central Asian Studies, Volume 2, 2005. Vienna. P. 148-153.
Abdulla To„qay va o„zbek adabiyoti. (Abdulla Tukay and Uzbek literature) Journal “Jahon adabiyoti”, 2011, №4.
Teran tomirlar. On 100th birthday of Olimjon Ibrohimov (Deep roots). Journal Sharq yulduzi, 1987. N.5. P. 198-200.
Hamza va qardosh adabiyotlar. (Hamza and fraternal people’s Literature) Journal Sharq yulduzi, 1979. N.6. P. 191-194.
Ismail Gaspirinskiy ve Turkstan (Ismail Gaspirinskiy and Turkestan). Journal Yildiz, Tashkent, 1991. P.13-16.
Cho'lpon va tatar adabiyoti. (Chulpan and Tatar literature), Journal O'zbek tili va adabiyoti, 1997.N.4. P. 10-14.
Abdulla Qodiriy va tatar adabiyoti (Abdulla Kadiri and Tatar literature), Journal O'zbek tili va adabiyoti, 1994. N-4-5-6. P.32-38.
G'afur G'ulom va tatar adabiyoti (Gafur Gulyam and Tatar literature), Journal O'zbek tili va adabiyoti, 2003. N.2. P.32-38.
Professor Tohir Chig'atoy. Journal O'zbek tili va adabiyoti, 2001. N.1. P.45-48.
Sadriddin Ayniy va tatar madaniyati. (Sadriddin Ayniy and Tatar culture). Journal O'zbek tili va adabiyoti, 1985. N.4. P.6-11.
Интернациональные связи литератур
Средней Азии с литературами
зарубежного востока. (International links of literature in Central Asia with the literatures of the foreign East). Asian and African nations, N. 4. Moscow, 1978. P.128-133.
Исторические связи литератур народов
советского Востока в период 1905-1917. Moscow, 1977. N. 1. P. 90-97.
Abdulla To'qay O'zbekistonda. (Abdulla Tukay in Uzbekistan), Journal Sharq Yulduzi, 1986. N.4. P.187-191.
Ahmad Zaki Validi To'g'on. Xotiralar. (Memories). Translation of Sherali Turdiev. Journal Sharq yulduzi, 1993. N.5-6. P 125-189.
Tukay hem uzbek edabiyati. Kazan Utlari. 1985. N.5. P. 121-125.
G.Ibrahimov hem uzbek edabiyati. Kazan utlari, 1987. N.3. P.58-61.

SJIF Impact Factor 2021: 8.013| ISI I.F.Value:1.241| Journal DOI: 10.36713/epra2016 ISSN: 2455-7838(Online)
EPRA International Journal of Research and Development (IJRD) Volume: 6 | Issue: 8 | August 2021 - Peer Reviewed Journal
2021 EPRA IJRD | Journal DOI: https://doi.org/10.36713/epra2016 | www.eprajournals.com |184 |
O'zbek va qardosh xalqlar adabiy aloqalariga doir. Sharq yulduzi, 1963. N.6. P.133-140. (About literary relationships of Uzbek and fraternal nations)
Hamza Hakimzoda Niyoziy va tatar adabiy aloqalariga doir. (About Hamza Hakimzoda Niyoziy and Tatar literary relationships) Adabiy Meros, Toshkent. 2(36). 1986.
Ma‟rifatparvar va sayyoh. (Enlightener and traveler (About Abdurashid Ibrohimov)). Jahon adabiyoti, May, 2001. P. 137-140.
Тукай и литература Узбекистана. (Tukay and Literature of Uzbekistan) Zvezda Vostoka. 1986 (5). Tashkent, P.172-177.
Here some part of his works were mentioned. In all his works Sherali Turdiev highlighted the friendly scientific relationship between Uzbek and Tatar scholars.
As a grand-daughter of him, I have an access to read his letters exchanged with international researchers, scholars such as CIS countries (current), Japan, Germany, Austria, The USA, and Turkey.
In this article I am going to focus on the correspondences exchanged between Sherali Turdiev and Tatar researchers. The letters topics can be divided as following: requests, discussions, invitations to scientific events, gratitude and acknowledgements.
Some examples for requests:
Many researchers, scholars from Tatarstan wrote the letters asking for some assistance as following:
Books, sources from Uzbekistan State libraries and archives;
Books, sources from Sherali Turdiev‟s
private archive; Asking for advice and consultation in
writing Tatar Literature Antology; Asking for reviewing particular research
works and give his honorable comments and so forth.
Mostly the organizations such as publication offices, research journal editors, libraries, museums, several
educational establishments, scientific institutions were actively in contact with Dr. Sherali Turdiev.
Thanking Letters In his correspondences‟ archive there are big
bunches of thanking letters expressing gratefulness for his significant contribution such as delivering asked materials, photos, archive resources, photocopies original ones of Uzbek literature examples in making books on Tatar literature, organizing events dedicated to Tatar scholars, conducting researches and all were related to Tatar or Uzbek literature and literary relationships.

SJIF Impact Factor 2021: 8.013| ISI I.F.Value:1.241| Journal DOI: 10.36713/epra2016 ISSN: 2455-7838(Online)
EPRA International Journal of Research and Development (IJRD) Volume: 6 | Issue: 8 | August 2021 - Peer Reviewed Journal
2021 EPRA IJRD | Journal DOI: https://doi.org/10.36713/epra2016 | www.eprajournals.com |185 |
Invitations
CONCLUSION
To conclude, Sherali Turdiev can be considered as the scholar who was a bridge of knowledge, scientific and friendly cooperation among many nations. Nowadays, most researches focus on a single object as a research issue. However, Sherali Turdiev did a lot of detailed works on various scholars‟ works and lives who were from Asian and Western countries. If we collect all his results in one place, it would be a fantastic research for researchers in this sphere. LITERATURE AND SOURCES
1. Kazan Utlari. Journal arhives. Tatarstan, Kazan. ( between a period of 1960-2000)
2. Sharq yulduzi, Journal arhives. Tashkent, Uzbekistan. ( between a period of 1960-2011)
3. Jahon adabiyoti. Journal arhives. Tashkent, Uzbekistan. ( between a period of 1960-2011)
4. O'zbek tili va adabiyoti, Journal arhives. Tashkent, Uzbekistan. ( between a period of 1960-2011)
5. Exchanged avia mails of Sherali Turdiev and international scholars (1957-2011)

SJIF Impact Factor 2021: 8.013| ISI I.F.Value:1.241| Journal DOI: 10.36713/epra2016 ISSN: 2455-7838(Online) EPRA International Journal of Research and Development (IJRD)
Volume: 6 | Issue: 8 | August 2021 - Peer Reviewed Journal
2021 EPRA IJRD | Journal DOI: https://doi.org/10.36713/epra2016 | www.eprajournals.com |186 |
A STUDY OF SIVACHARYA’S YOGA
P Valsala1, Sri Prathyangira Swamy2
1Research Scholar, Dept. of Astrology, Vels Int. of Science, Technology & Advanced Studies, Chennai, India
2Director & HoD, Dept. of Astrology, Vels Int. of Science, Technology & Advanced Studies, Chennai,
India
ABSTRACT
Astrology is an excellent mathematical method of calculating the future of the country and the horoscope through
the planets, zodiac signs and stars, to determine future events and to predict future events. Astrology and
spirituality are closely related. There is no doubt that astrology helps us a great deal in protecting ourselves from
the evils that befall us and in bringing us to the Lord. Lagna, Zodiac, Star, Yoga are predicted when one is born
with the movements of the planets. Indian astrology is calculated based on the rotation of the moon. Indian
astrology predicts 27 star clusters in our sky with the Moon passing by. The profession he does is predicted by
putting the 10th house in one's favor. Predicting the 2nd house of Tanasthana, the 11th house of profit and the
strength of the 10th, 2nd, 11th housess, it is said that the fortune-telling business is progressing and getting rich.
KEYWORDS - Sivacharya, Ragu, Ketu
I. INTRODUCTION
The Sivacharyas have been serving the Lord with peace of mind since time immemorial, the work of „Sivacharyas‟ as their clan and optional profession.
They have been teaching the scriptures and Sivagama rituals to others from an early age and preparing them for the work of Sivacharya. It is necessary to mention here the throat of the Sivacharyas in the deities thus held. This is what the great Purana writer Sheikh Peruman has humbly said, the study of the influence of the Sun, Guru and Ketu planets in the horoscopes of the Sivacharyas has been studied in reference to the throat of such Sivacharyas. Religions such as Jainism, Vaiganism, Vaishnavism, and Buddhism appeared in ancient times. According to their religion, six daily pujas were performed for the Lord. These were promoted by the kings of the time in all sorts of forms of gold, material, and grants. We know that the lands were also given to the temple and grew spiritually. This was continued by the Sivacharyas through their lineage. Its ethics have been unwavering.
Gurus, also known as Sivacharyas, do a wonderful job of cultivating godliness in the minds of the priests by reciting the Vedic mantras they have learned to others. This is their deity. His advice and counsel can make a positive difference in the minds of the devotees who come to tell God their
grievances and help them to forget their sorrows and worries and bring peace of mind and happiness.
II. SIVACHARYAS The work of Sivacharya is greatly desired by
the AdiSaiva devotees. It is a great work that can give peace of mind and happiness. These Sivacharyas are the ones who follow the Vedic mantras and the Sivagama system regularly. The Sivacharyas are very diligent in their devotion to God and spirituality and are very important in guiding people to practice spirituality.
After a period of time the Vedic mantras and Sivagama worship are taught in a special way in the Vedic school and are developed into excellent Sivacharyas. In the early days, the teacher would listen to all the scriptures and Sivagama methods through Sivacharya and record them in his mind. Later he was taught the Vedic and Sivagama methods of writing with his fingers in the sand and with a stylus in the palm grove. Everyone from the king to the common citizen went in search of the teacher's place of work and gave him assignments and educated him by imprinting in his mind what he had taught.

SJIF Impact Factor 2021: 8.013| ISI I.F.Value:1.241| Journal DOI: 10.36713/epra2016 ISSN: 2455-7838(Online) EPRA International Journal of Research and Development (IJRD)
Volume: 6 | Issue: 8 | August 2021 - Peer Reviewed Journal
2021 EPRA IJRD | Journal DOI: https://doi.org/10.36713/epra2016 | www.eprajournals.com |187 |
II. SIVACHARYAS – DESCRIPTION The Sivagams praise the Sivacharyas as
those who appeared directly from the five faces of Shiva. Sivacharyas who worship in Shiva temples are over sixteen years of age. Kamikamam says they must also be under the age of seventy. o qualify as „Sivachariyar‟, Kamikarakam, Yogajagam,
Sindhiyam, Kanagamam, Adam, Deeptha Aakamam, Kushmam. Sahasra Aakamam, Amsuman Aakamam, Rauvakamam, Magudagamam, Subrapetham, Vijayakamam, Kvasam, Swayambuvam, Analam, Veerikamam, Vimalakamam, Chandra Gnanam, Mukabimbakamam, Purothigitakamam, Lalitagamam, Siddhiyagamam, Santhanakamam. Saivagama says that one should have mastered the twenty-eight types of Shastra tricks of Sarvoktamam, Parameswaram, Kiranagamam and Vadulagamam.
The Sivacharyas were Brahmins who studied the Vedas and the Agamas. Those who worship Lord Shiva according to the Sivagama mantras are also known as „Sivacharyas‟, with the
task of reciting the Vedas in general and Sivagama better. Sivacharya is also known as „Andanar‟ as he
possesses the Upanayana and the task of reading the scriptures. Since Sivacharya read Sivagama very well and stood in their way, he himself has the right to receive the priesthood and its way of teaching.
Saivars are divided into five types. Adi Saivar, Maha Saivar, Anusaivar, Avanthara Saivar, Prasavasivar. The Vedic Brahmin who worships Lord Shiva, who is the eternal Saiva, is said to be Adi Saiva, and the Vedic Brahmin who received Sivadeesa is said to be Maha Saiva, while others who have attained Sivadeesa are said to belong to other Saiva names. Adhisavars are also called Sivacharyas. These so-called „Sivacharyas‟ are the ones who
worship Lord Shiva in their homes in the form of Sivagams and in the Shiva temples.
Sivacharya is also referred to in the 10th century Udayargudi inscription as Sivavediyar Sivamarayor Chithramezhi Butter, Sivathuvijar by other names in inscriptions and literature. There are five tribes among them.
III. PURPOSE OF THE STUDY
Everyone who is born a human being is in a situation where he or she has to earn a living by pursuing a career to meet their needs. They are making various efforts on a daily basis to make themselves better and more knowledgeable in the industry. He thinks that he can achieve a good position in the society in which he lives by developing his economic status, influence and respect.
The horoscope's horoscopes determine the career of the target and the tenth lord of the profession. The purpose of this study is to show that the Sivacharyas should work in harmony with the
target sin, the tenth sin and the ninth sin in order to carry out their work.
IV. STUDY HYPOTHESIS
The aim of the study is to establish and confirm the guesswork rules for Sivacharyas' work, and to confirm that the influence of the Sun, Guru and Ketu on the horoscopes of the Sivacharyas, who are the ninth and tenth sins, and the planets for Sivacharyas to serve as Sivacharyas. This study is based on these.
The planets Sun, Guru and Ketu in the horoscopes determine the position to perform the divine mission of Sivacharya. Although there are various works in the field of charities, the work of the Sivacharyas working in the temples is to be examined in this study.
The sun gives the leadership position of Sivacharyar to do charity to the Lord and as the Guru is the intellectual, it gives yoga, knowledge and wisdom for the work of Sivacharya.
Scriptural education for Sivacharya's work imparts the knowledge of education, the virtue of Sivacharya's work after education, and the Guru's wisdom for Sivacharya's work. Similarly, the ninth sin of Bhakti, Dharma, also contributes to the practice of Sivacharya.
V. CAUSALITY OF PLANETS
The position of the Sun, Guru and Ketu planets in the horoscopes and the target, ninth and tenth sins are determined by the work of the Sivacharyas who understand Siva's throat. The activities of the caricatures and sins of the planets which play a major role in the work of the Sivacharyas have been collected and compiled.
VI. ASPECTS IN SIVACHARYA HOROSCOPES
1. Position of Sun, Jupiter and Ketu planets in Sivacharya horoscopes.
2. Sun, Jupiter, Ketu contact in 1st, 9th, 10th houses.
3. Correlation between Sun, Guru, Ketu. 4. Rules for setting up Sivacharyar mission. 5. Relation of Sun, Jupiter, Ketu to the work
of Sivacharya. 6. The connection between the 9th house
and the work of Sivacharya. VII. RULES IN SIVACHARYA HOROSCOPE
Here mentioned the collected, compiled, analyzed and researched the horoscopes of Sivacharya‟s in horoscope table.
The following rules were taken from the study:

SJIF Impact Factor 2021: 8.013| ISI I.F.Value:1.241| Journal DOI: 10.36713/epra2016 ISSN: 2455-7838(Online) EPRA International Journal of Research and Development (IJRD)
Volume: 6 | Issue: 8 | August 2021 - Peer Reviewed Journal
2021 EPRA IJRD | Journal DOI: https://doi.org/10.36713/epra2016 | www.eprajournals.com |188 |
1. Sun, Jupiter and Ketu planets conjunction with 1st, 9th, 10th houses
2. Sun, Jupiter and Ketu planets aspecting with 9th house.
3. Sun, Jupiter and Ketu planets in 9th house. 4. Sun, Jupiter and Ketu in their padas. 5. Sun, Jupiter and Ketu planets aspects on
9th lord. VIII. CONCLUSION
The study, entitled „The Impact of
the Sun, Jupiter and Ketu Planets in the “Sivacharya
Yoga‟s based on Taurus Lagna”, was done to know
more about the Sivacharya‟s who contribute to the
development of spirituality and devotion in the society and to help in further research. REFERENCES
1. Gopikrishnan k, Parivaartha Rathnagaram, Kumaran Publications, Chennai, 2005.
2. Sathasivam S M, Uththirakalaamirtham, Indhu Publications, Chennai, 2003.
3. Boopathi Rajan, Navagraha Jothida Paripalanam, Abirami Publications, Chennai, 1982.
4. Hariharan k, Grahangal yethai kurikattukirathu, Krishnamoorthy Publications, Chennai. 1997.
5. Iyer P S, Jothida Ariviyal, Kerala Jothisha Publications, Madurai, 1993.
6. Natesa Sasthrigal, Sathaga Palathipigai, Kadalangudi Publications, Kadalangudi, 1995.
7. Kumarasami, Kalyanavarmar Saravali, Sri Anandha Nilaiyam, Chennai, 2003.

SJIF Impact Factor 2021: 8.013| ISI I.F.Value:1.241| Journal DOI: 10.36713/epra2016 ISSN: 2455-7838(Online)
EPRA International Journal of Research and Development (IJRD) Volume: 6 | Issue: 8 | August 2021 - Peer Reviewed Journal
2021 EPRA IJRD | Journal DOI: https://doi.org/10.36713/epra2016 | www.eprajournals.com |189 |
POETIC EXPRESSIONS IN THE NOVEL “A THOUSAND ONE PERSON”
Ataboeva Gozal Farkhodovna
Tashkent State Pedagogical University named after Nizami lecturer of the department of Uzbek language and literature
ABSTRACT
Omon Mukhtor is one of the leading representatives of modern Uzbek novels. He made a great contribution to the
development of Uzbek romance with many of his novels. The study of a writer’s novels, the analysis of his views on
the universe, man, nature, society, is one of the most pressing issues in today’s literary criticism. This article
explores the style of the novels of the famous Uzbek writer Omon Mukhtor. In it, based on the general direction of
the author's talent and poetic skill, the style of the novel "A Thousand and One Person" is analyzed in terms of the
skill of expressive expression and skillful use of symbolism in folklore, and certain theoretical generalizations are
made.
KEYWORDS: novel, style, artistic skill, folk image, symbolism, individuality, poetic expression, conceptual
integrity, form and content.
INTRODUCTION
Omon Mukhtor (1941-2013) began his career as a novelist in the pre-independence period. He has published about thirty books as a poet, storyteller, storyteller, novelist. Omon Mukhtor's "A Thousand and One Person" (1994), "The Man in the Mirror" (1996), "The Ruins of the Hill" trilogy "Four Sides Qibla" (2000), "Ffu" (1996), "Women's Country and Kingdom" ”(1997),“ Plato ”(1998),“ Square ”
(1999),“ People of Love ”and“ The Great Cleaner
”dilogy“ Navoi and the artist Abulkhair ”(2006),“
People should laugh ”(2008) , Presented a series of novels to readers, such as The Woman King (2010). They are extremely important in terms of content, depth, richness of formal and methodological research, written in an attractive language.
Literary scholar D.Kuronov emphasizes that the author's attitude to the story, his worldview, and his current state of mind are important in the dialogue between the author and the reader. It is manifested in more style [4. 131]. Indeed, in every play the writer's identity is expressed: thoughts, feelings. There are methodological principles that reflect the nature of O. Mukhtor's unique talent, his creative image, on the basis of which the system of elements that make up a particular novel are interconnected. Consequently, a true artistic phenomenon is unique in nature.
MATERIAL AND METHOD
Literary critic H. Boltaboev writes: "The roots of this methodological phenomenon go back to the
richness of ancient lyricism in Eastern literature, examples of folk art reflected in the highly romantic interpretation, and others." [1. 15]. In addition to this idea, it should be noted that the influence of the experience of Western and world literature on the artistic taste of the Uzbek reader also plays a role.
Although the principles of the literary direction, based on Omon Mukhtor, allow to make generalizations specific to a particular stage (period) of his work, individual formal-methodological research: the style of the work taken separately and the skill of the writer can not be sufficiently developed. Indeed, individual style is discovered by penetrating deep into the inner layers of each work. Its brilliance is ensured by the experience of national literature, traditions of folk art and literature of the past, attention to the features of the national spirit, customs, language. The effectiveness of methodological research is determined by the nature of the talent of this or that writer, the way of emotional thinking and the way they are expressed.
Hence, methodological individuality is a set of features of a writer’s poetic thinking and
expression of life. It is manifested in all layers of the work of art (the structure of the literary text, rhetoric, the principles of creating artistic reality - poetics).
Consequently, only the derivation from the laws of art allows a correct understanding of the nature of style. The results of methodological research, in particular, the method of O. Mukhtor should be sought in the development of creative,

SJIF Impact Factor 2021: 8.013| ISI I.F.Value:1.241| Journal DOI: 10.36713/epra2016 ISSN: 2455-7838(Online)
EPRA International Journal of Research and Development (IJRD) Volume: 6 | Issue: 8 | August 2021 - Peer Reviewed Journal
2021 EPRA IJRD | Journal DOI: https://doi.org/10.36713/epra2016 | www.eprajournals.com |190 |
socio-psychological conditions and vibrations in the spiritual world of the writer, in harmony with the experience of world literature. In this sense, the Uzbek modernism, which shines in the works of the writer, acquires a peculiarity in terms of closeness to the moral and enlightenment values in the spirit of the nation.
RESULTS
The national style of Uzbek prose has gradually developed. Methodological research in today's Uzbek novels is born and formed on the basis of existing experience. It depends on many factors, such as the requirements of the time, the renewed thinking, the spiritual needs of the reader, the ability, potential, activity in research, the scope of interest of an individual writer. In particular, the author of such novels as "Balance", "Rebellion and Obedience", "Sabo and Samandar".In Hamdam's novels there is a tendency to learn from the methods of writing in the literature of the past and present, social content, journalistic interpretation. At the same time, the writer makes fruitful use of the method of philosophical interpretation of the bitter truth of the life of the time and period. Because the dynamics of the historical-literary process allows the expansion of the novel genre semantics.
The poetic structure of the modern novel has been improved. His ability to express reality is rich. Therefore, it can absorb the features of anecdotes, fairy tales, epics and other genres. This is especially the case in O. Mukhtor's novels. The style of the author's novel "A Thousand and One Person" stems from the general direction of the author's talent. The style chosen for the novel according to its artistic perception and style of expression forms a peculiar ring in the development of its universal style.
The novel includes folk anecdotes and fairy tales, generalizations of human emotions typical of the legendary individual hero of our epics, satirical allusions and universal themes, ways of expressing the ideal of the people, the rich use of symbolism and profound philosophy. allows you to illuminate the essence in a unique way. O. Mukhtor is able to connect his thoughts with the essence of the personality, spiritual world and aspirations of real heroes, using the content of fairy tales, populism in the logic of anecdotes.
O. Mukhtor's novel "A Thousand and One Person" provides conceptual integrity. The compositional parts of the work are arranged in the appropriate order. The writer makes lyrical digressions in place and encourages the reader to join his ideological and emotional assessments. In a sense, they communicate directly with the reader, sometimes openly and sometimes covertly, to the subject of the image.
The leitmotif of nationalism and universality, which is the main criterion of the novel "A Thousand and One Images", influences the rise of both art and emotionality. In the age-old struggle between good and evil, which is a peculiar tradition of our literature, one is glorified and the other is rejected.
Burhan Sharif, a simple man of faith with a light of compassion in his eyes, is committed to the protection of goodness. There is no arrogance in his nature, no bowing before his servant, no worship of him. Burhan Sharif considers the performance of human duty to be sacred, and strives to perform it without fail. In this national character, Nasir embodies the qualities of honesty, courage, pride, abstinence from filth, and conscientiousness. Therefore, the character clearly expresses his attitude to the behavior.
Abdullah Hakim, one of the protagonists of the novel "A Thousand and One Images", is a simple man, but a contented man, a talented poet. What he wrote about Mr. Nasriddin consists of poetic and prose observations. For this poet, Nasriddin is the Living Laughter of a people who live forever, not bowing to anyone, not caring about the world. The odmi jacket on his shoulder, the small turban on his head, and the shaggy donkey underneath are a symbol of his dervish life. Abdullah Hakim, who understood the bitter truth of the essence of his poison, worshiped the glory of the genius of the people as soon as everyone who had achieved freedom of heart and soul realized the ephemeral transience of human life. Nasriddin, who lives in his own heart and lives by the dictates of his conscience, considers it a blessing to live with laughter over the abominations of life. Only then will man become independent of the passions of the world and attain spiritual independence:
Who, heart free, free spirit - He will definitely find you. (Page
2.126). Each story in A Thousand and One Images
was made into a single novel by a different writer. However, my goal was to make a big statement in a concise way, as much as possible, ”the writer O.
Mukhtor wrote. In the novel, the prose writer, striving for brevity of volume, depth of subject and content, followed the path of determining the volume and ending of each work as the tone rose. In this regard, Abdullah Hakim's prose "Long Thoughts" in the novel "A Thousand and One Images" is especially characteristic.
In the interpretation of Omon Mukhtar, the figurative method of creating a figurative image in folk tales about a fox - a judge, a bear - a guard, a tortoise - a man, a snake - a minister, a lion - a king -
SJIF Impact Factor 2021: 8.013| ISI I.F.Value:1.241| Journal DOI: 10.36713/epra2016 ISSN: 2455-7838(Online)
EPRA International Journal of Research and Development (IJRD) Volume: 6 | Issue: 8 | August 2021 - Peer Reviewed Journal
2021 EPRA IJRD | Journal DOI: https://doi.org/10.36713/epra2016 | www.eprajournals.com |191 |
serves to increase the novel's impact. It can be said that this chapter of the novel is a unique mosaic based on metaphor. The strange legends and anecdotes embedded in the composition are reminiscent of Gulkhani's "Zarbulmasal". After all, not only special types of fairy tales, but also parables are based on figurative imagery. Nasir is able to successfully continue this tradition in a creative style within a new genre.
Nasriddin is a constant companion in the folk art of the donkey, which often serves the day of ordinary, poor people and serves man. In the novel, too, Hodja Badriddin, who lives in a strange village in the Second Province of Rahim II, is a world-famous, intelligent man. His youngest son is also an intelligent, wise, and at the same time extremely naive young man. Nasriddin, a child of a wealthy family, is fascinated by the myths and anecdotes of the hairdresser Mulla Ghulam because of his childhood passion. In this respect he is no different from ordinary villagers. In his dream of becoming famous, he sang "Millennial Song" in imitation of Mulla Ghulam, and weaved anecdotes about the justice of the king with an indescribable love. But he had not even received an assignment from a ruler who had never seen Rahim II, who had stolen his mind, in his life, and who could not fully imagine what it was like.
CONCLUSION
However, in some cases, the author also tells us details in the form of simple information . In such cases, where the principle of narration prevails, O. Mukhtor's feelings do not fully reach the heart of the reader. The narrative that emerges in the style of the image does not allow the details to come to life vividly. The writer is not completely “transformed”
into his protagonists, but is left to fend for himself and not be able to support his feelings.
As a result, there is a slight decrease in emotional impact. Thus, the style of today's Uzbek novel is a combination of national and literary traditions, as well as a certain synthesis of Western and Eastern literature. In this process, O. Mukhtor's tireless research on the application of new formal and methodological principles also plays an important role. REFERENCES
1. Boltaboev H. Nasrvauslub. –Tashkent: Fan, 1992. –15 p.
2. OmonMuxtor. Four-legged. –Tashkent: Sharq NMK, 2000. –418 p.
3. Yuldashev S. Ancient philosophy. –Tashkent, 1999. –126 p.
4. Quronov D. Poetics of Cholpon's prose. –
Tashkent: Sharq NMK, 2004. - 231 p. 5. Solijonov Y. Speech and style. –Tashkent:
Cholpon, 2002. –128 p.
6. Sultonov I. Literary theory. –Tashkent, 1980. –391 p.
7. Umurov H. Artistic psychologism and modern Uzbek novel. –Tashkent, 1983. - 380 p
8. Yakubov I. The evolution of the Uzbek novel. - T .: Science and technology, 2006. - 160 p.

SJIF Impact Factor 2021: 8.013| ISI I.F.Value:1.241| Journal DOI: 10.36713/epra2016 ISSN: 2455-7838(Online)
EPRA International Journal of Research and Development (IJRD) Volume: 6 | Issue: 8 | August 2021 - Peer Reviewed Journal
2021 EPRA IJRD | Journal DOI: https://doi.org/10.36713/epra2016 | www.eprajournals.com |192 |
PRIORITY DIRECTIONS FOR SUSTAINABLE
GROWTH IN THE PRODUCTION OF BUILDING
MATERIALS IN THE REPUBLIC OF UZBEKISTAN
Kasimova Z.G. The Republic of Uzbekistan, Fergana Polytechnic Institute
ANNOTATION The article analyzes the factors that ensure the effective development of the construction materials industry in the
context of diversification and increasing its investment attractiveness. The problems in the industry and the ways
of their solution are shown. Recommendations are given on attracting investments for modernization, technological
re-equipment of industry enterprises and increasing export potential.
KEY WORDS: building materials, efficiency, economy, production, industry, diversification, modernization,
localization, factor, development, innovation, investment, foreign capital.
The production of building materials is a priority area of the economy, and the strategy of managing the production of building materials plays an important role in this. Today the building materials industry is one of the most promising and fastest growing sectors of the national economy. It accounts for 65-75% of the total cost of construction work for the entire construction industry. In this connection, the building materials industry directly affects the results of structural changes in the economy and the rate of its growth.
An important factor in the development of the industry was the Decree of the President of the Republic of Uzbekistan dated May 23, 2019 PP-4335 "On additional measures for the accelerated development of the construction materials industry." resources and increasing the export of building materials. 1
As a result of the reforms, new enterprises and new jobs are being created in the Republic, foreign investments are attracted, outdated enterprises are being modernized and reconstructed. At the same time, improving the scientific and practical basis for managing the economic efficiency of enterprises, their competitiveness, meeting market
1Resolution of the President of the Republic of Uzbekistan dated May 23, 2019, PP-4335 "On additional measures for the accelerated development of the building materials industry."
demand while reducing the cost of production, is undoubtedly one of the important factors in increasing the efficiency of the building materials industry.
The role of the industry in improving the quality of macroeconomic indicators is determined by the importance of renewing fixed assets, modernizing industrial enterprises, building and reconstructing social facilities and housing, and increasing employment.
From year to year, Uzbekistan increases financing for the development of the economic and social sphere, investments in fixed assets are purposefully increasing in the Republic, which, accordingly, along with other positive trends, leads to an increase in the volume of construction work and the production of building materials.
Due to the growing volume of construction work, improved income and living conditions of the population, the demand for building materials in the country is growing. This is facilitated by the implementation of the state program for the large-scale construction of modern private housing according to standard projects.
Over the past four years, more than 140 thousand housing units have been built in the country within the framework of programs, which is 4-5 times higher than the average annual values of housing construction for the previous period. And in the past 2020, according to the state program, about 49.5 thousand houses were built, including more than 15 thousand in rural areas and about 15 thousand in

SJIF Impact Factor 2021: 8.013| ISI I.F.Value:1.241| Journal DOI: 10.36713/epra2016 ISSN: 2455-7838(Online)
EPRA International Journal of Research and Development (IJRD) Volume: 6 | Issue: 8 | August 2021 - Peer Reviewed Journal
2021 EPRA IJRD | Journal DOI: https://doi.org/10.36713/epra2016 | www.eprajournals.com |193 |
cities, for which 12 trillion 24 billion soums were spent. In the current year 2021, it is planned to provide housing for 54 thousand families, including building 45 thousand houses under the state mortgage program. 2
Due to the urbanization of cities and towns as a result of construction work on a turnkey basis in the construction of private houses and social facilities in the industry, there is an increase in demand for construction materials. So, in 2019, the production of baked bricks increased 2.8 times, fiberglass - 1.8 times, drywall - 2.1 times, decorative ceramic tiles - 4.3 times, wallpaper - 89 times. It can be seen that the increase in the production of building materials proportionally depends on the factor of the increase in the volume of construction of residential buildings and social facilities.
With the emergence of new types of building materials on the world market, the industry pays great attention to the development of production of new types of them using local raw materials and meeting the needs of the domestic market for modern building materials. This clearly leads to a decrease in the cost of products, mainly due to the factor of reducing transport and customs costs.
As a result of the modernization of existing industries and the production of modern competitive types of building materials through the opening of new enterprises, the exported building materials are increasing from year to year. And for this reason, there is a tendency towards a decrease in the import of building materials, and an increase in their export.
So, at the end of 2020, Uzbekistan exported construction materials worth $ 257.4 million, which is three times more than in 2019 ($ 85.3 million), and in 2018, products worth only 34.7 million US dollars were exported. According to the results of the 1st quarter of 2021, Uzbekistan exported construction materials for $ 62.3 million, which is 47% more than forecasted. By the end of the year, exports are expected to reach USD 270 million.3
Kazakhstan ($ 41 million), Kyrgyzstan ($ 30.9 million) and Tajikistan ($ 29 million) and Afghanistan ($ 11.1 million) are among the largest importing countries of Uzbek building materials. Construction products are also exported to Russia, Turkmenistan, Lithuania, China, Ukraine and Turkey.
The export assortment consists of such building materials as PVC profiles, pipes, fittings and
2Видеоселекторное совещание Президента
Республики Узбекистан, посвященное мерам по
развитию жилищного строительства и ипотечного
рынка, от 3 марта 2021 года, г. Ташкент. 3https://kursiv.uz/news/otraslevye-temy/2021-03/eksport-stroymaterialov-iz-uzbekistana-vyros-v-tri-raza.
plastic products, aluminum profiles and products from it, cement, plasterboard, lime, slate, ceramic products, dry building mixtures, sheet glass, wallpaper and others.
In the reporting period, Uzbek building materials were sent for the first time to Azerbaijan (ceramic tiles, wallpaper, fiberglass), Turkey (copper, PVC pipes and fittings) and Russia (thermal insulation materials). 4
In recent years, Uzbekistan has introduced and mastered new types of modern building and finishing materials that meet international ISO standards for energy efficiency and advanced technologies in construction, such as drywall, dry mixes, modern roofing materials, heat-resistant polymer pipes, ceramic tiles, sandwich panels, basalt fiber and reinforcement, heat-insulating materials and others.
Despite the positive shifts in the construction materials industry of the Republic, in recent years a number of problems have been identified that require urgent solutions, in particular:
- a high level of physical and moral obsolescence of fixed assets at many enterprises of the industry, the presence of energy-intensive technologies and a relatively low level of labor productivity;
- lack of production of energy-saving technologies for the building materials industry in the Republic;
- low investment and innovation activity of enterprises for the production of building materials, products and structures;
- inconsistency of the material and technical base of research and development organizations with modern requirements;
- the absence in most enterprises of an effective system for the use of modern management and marketing methods and human resources, taking into account the requirements of the market, etc.
Purposeful implementation of transformations in the construction industry aimed at the formation of modern management methods, increasing investment attractiveness in the implementation of projects and the introduction of innovations will undoubtedly result from the implementation of these measures.
For the successful and high-quality implementation of the planned tasks to increase the efficiency of production of competitive building materials and in order to further improve the construction industry, ensure the efficiency of the public administration system, progressive implementation in the field of digital technologies, on
4https://kursiv.uz/news/otraslevye-temy/2021-04/obem-eksporta-stroymaterialov-vyros-do-623-mln..

SJIF Impact Factor 2021: 8.013| ISI I.F.Value:1.241| Journal DOI: 10.36713/epra2016 ISSN: 2455-7838(Online)
EPRA International Journal of Research and Development (IJRD) Volume: 6 | Issue: 8 | August 2021 - Peer Reviewed Journal
2021 EPRA IJRD | Journal DOI: https://doi.org/10.36713/epra2016 | www.eprajournals.com |194 |
November 27, 2020, the President of the Republic of Uzbekistan issued a decree for No. UP-6119 "On approval of the strategy of modernization, accelerated and innovative development of the construction industry of the Republic of Uzbekistan for 2021-2025"5
This and other similar documents show that the state policy in the field of construction is aimed at increasing the potential of the industry through the formation of modern management methods, the effective use of innovations, investments, labor and material resources in ensuring the successful implementation of programs for the socio-economic development of the country, regions and industry in the whole.
Based on the above, the main factors of economic development and increasing the efficiency of the building materials industry include:
- Improvement of the scientific and practical base for the development of economic efficiency of enterprises in the construction materials industry;
- the impact of the development of the economic and social sphere on the efficiency of enterprises in the construction materials industry;
- Priority of the building materials industry in the national economy due to the need for the production of modern building materials and strengthening the export potential of the industry;
- Influence of the construction materials industry directly on the results of structural changes in the economy and the rate of economic growth of the national economy;
- Building materials - indicators of investment activity, locomotives of investment processes in the economy. The building materials industry determines the potential of the entire building industry;
- The need for modernization and reconstruction of outdated enterprises;
- Increase in the production of competitive building materials from local raw materials;
- Production of modern building materials and strengthening the export potential of the industry;
- Expansion and increase of the range of production of building materials, introduction and development of new modern technologies;
- Purchase of energy and resource-saving high-tech equipment, launch of modern production
5Decree of the President of the Republic of Uzbekistan dated November 27, 2020 No. UP-6119 "On approval of the strategy for modernization, accelerated and innovative development of the construction industry of the Republic of Uzbekistan for 2021-2025", Tashkent.
lines, construction of new factories for the production of building materials;
- Purposeful state policy in the field of construction and production of building materials, aimed at increasing the potential and efficiency of the industry, corresponding to the Resolution of the President of the Republic of Uzbekistan on the accelerated development of the construction industry;
- Introduction of new types of modern building materials that meet international ISO standards for energy efficiency and advanced technologies;
- Strengthening the material and technical base of the industry and launching production based on modern advanced technologies, by accelerating innovation;
- Providing the country's construction market with relatively cheap, high-quality modern building materials based on local raw materials, expanding their range, increasing the volume of import-substituting export-oriented competitive products;
- Localization of production and reduction of imports;
- The influence of the building materials industry on the results of structural changes in the economy and the rate of economic growth of the national economy.
Based on the above, we can conclude that the implementation of the planned measures in the industry and the corresponding structural changes are important factors in ensuring the effective development of the construction materials industry, deepening cooperation and integration activities between enterprises, diversifying products, increasing its competitiveness and, most importantly, effective use of economic and investment potential, provision of a decent environment for human life.
LIST OF USED LITERATURE 1. Resolution of the President of the Republic of
Uzbekistan dated May 23, 2019, PP-4335 "On additional measures for the accelerated development of the building materials industry."
2. Videoselector meeting of the President of the Republic of Uzbekistan on measures to develop housing construction and the mortgage market, March 3, 2021, Tashkent.
3. https://kursiv.uz/news/otraslevye-temy/2021-03/eksport-stroymaterialov-iz-uzbekistana-vyros-v-tri-raza.
4. https://kursiv.uz/news/otraslevye-temy/2021-04/obem-eksporta-stroymaterialov-vyros-do-623-mln.
5. Decree of the President of the Republic of Uzbekistan dated November 27, 2020 No. UP-6119 "On approval of the strategy for modernization, accelerated and innovative development of the construction industry of the Republic of Uzbekistan for 2021-2025", Tashkent.

SJIF Impact Factor 2021: 8.013| ISI I.F.Value:1.241| Journal DOI: 10.36713/epra2016 ISSN: 2455-7838(Online)
EPRA International Journal of Research and Development (IJRD) Volume: 6 | Issue: 8 | August 2021 - Peer Reviewed Journal
2021 EPRA IJRD | Journal DOI: https://doi.org/10.36713/epra2016 | www.eprajournals.com |195 |
ECOSYSTEM OF THE KARADARYA VALLEY
Sharobitdin J. Tojiboev1, Sardorbek T. Mamasoliev2 1Associate Professor of the Department of Biology, Namangan State University, Namangan,
Uzbekistan 2PhD of the Department of Ecology and Botany, Andijan State University, Andijan, Uzbekistan
\
ABSTRACT Based on data on the geographical structure of the Kara-Darya, one of the largest water basins in the Fergana
Valley, starting from the Fergana and Alay mountain ranges, information on the current ecological status of the
middle and lower reaches of the river valley, negative and positive aspects of anthropogenic impact, taxonomic
analysis of unique vegetation life forms adapted to the tugai environment and their importance in the economy is
provided.
KEY WORDS: Fergana Valley, Andijan region, Karadarya, taxonomic, anthropogenic, ecological, mountain, hill, soil, tugai, plant, life form.
INTRODUCTION The Fergana Valley attracts the people of the
world with its beautiful nature. The charming mountains, gardens, hills, fertile fields, diverse flora and fauna of the valley have aroused the interest of scientists.
Plants play a key role in the survival and life activities of humans and animals. Because they are sources of food, fodder, medicine, clothing, oxygen, which is important for living organisms, and many vital substances. The Karadarya basin has such a rich vegetation cover. It forms tugai forests on the river banks. The diversity of plants here has a special significance in the national economy, food, light industry, pharmaceuticals and medicine.
The current state of the plants of the Karadarya Valley, the preservation of existing species, the identification of medicinal plants, the specificity of the plants of the Karadarya and various other important aspects are extremely interesting. It is important to identify the problems associated with the extinction of wild plant species as a result of the development of natural areas of the Karadarya Valley as cultural lands by the population, as well as the preservation of existing species in this area.
MATERIAL AND METHODS
The vegetation cover of the study area is described on the basis of geobotanical maps created by R.S. Wernick and T. Rakhimova (1982) [6], [76].
The assessment of anthropogenic transformation of vegetation was carried out according to the method of V.L. Kotelnikov (1950). In determining the degree of degradation and transformation of vegetation cover in geobotanical studies, the following characteristics were taken into account:
a) the general condition of the plants in the grazing areas of livestock, ie the presence of vegetation by sheep and goats, the presence of trails formed by the constant movement of ungulates, etc.:
b) the composition and structure of plant populations, ie the decrease and status of forage species, the increase of ephemeral and xerophytes, the increase of non-livestock species, poisonous, adventitious plants:
c) the condition of trees, shrubs and bushes, living plants, increase in their number, growth and development:
d) natural and anthropogenic soil erosion and their nature;
e) the presence of endemic and rare plant species, their vegetative status.
RESULTS
Andijan region is richer in fresh water resources than other regions of our Republic. The rivers of the region receive water mainly from precipitation and perennial snow glaciers. The largest river is Karadarya [1],[196].

SJIF Impact Factor 2021: 8.013| ISI I.F.Value:1.241| Journal DOI: 10.36713/epra2016 ISSN: 2455-7838(Online)
EPRA International Journal of Research and Development (IJRD) Volume: 6 | Issue: 8 | August 2021 - Peer Reviewed Journal
2021 EPRA IJRD | Journal DOI: https://doi.org/10.36713/epra2016 | www.eprajournals.com |196 |
Karadarya is formed by the confluence of the Tor and Karagulcha rivers, starting from the Fergana and Alay ridges. After that, only two large tributaries, the Yassi on the right and the Kurshab on the left, flow into it. The subsequent tributaries of the Karadayo, the Kogart, the Karautur, the Maylisay on the right, and the Akbora on the left, also do not reach the Karadarya for a long time because the water of the Aravan River is used for irrigation. Only the excess water from irrigation is discharged into the Karadarya [2], [45].
The average annual water consumption of the Kara-Darya near the village of Balikchi is 123 m3 per second, of which corresponds to 46.4% in March-June, 14.4% in July-September and 39.2% in October-February.
It is known that humid air flows to Andijan region come mainly from the west. Mount Fergana, which is the catchment area of the Kara-Darya, is 500-700 mm, as it is located across these streams. Some years are even longer. Therefore, for every 1 km2 of the catchment area of the Karadarya corresponds to more than 10 meters of water per second. The onset of flooding in the Karadarya River
falls on averagely March 18, with the maximum flooding until June, and the end of flooding on September 18. [3], [365].
As a result of the irrigation of the Karadarya River through canals, after passing through the town of Kuyganyor, during the period when the crops are most irrigated, the water level decreases. However, at the confluence with the Naryn River, a large amount of water flows, and this water consists of groundwater and discharge water. Karadarya water temperature is -1 -7oC in winter and +15 +20oC in summer. The hottest months for water are July and August.
The average perennial turbidity of Karadarya water is 1.7 kg / m3, and in some years 4.2 kg / m3. Muddy water flows most often in April and August.
The characteristics of the Karadarya natural elements are not the same in all parts of it, the complexity of the relief, lithological structure and diversity of hydrological conditions, climate and vegetation have led to the formation of different soil types. [4].
Picture 1. Areas designated for research in the Karadarya Valley.
In the mountainous part of the Karadarya, the soil types formed three zones: the gray-soil hill region, the brown mountain-forest zone, and the light-colored brown meadow high mountain region. In the foothills of the Karadarya, on the high slopes of the river, in the foothills of the low mountains, light gray soil is widespread. The soil-forming rocks in these places are alluvial-proluvial deposits of lyoss and induction cones. Light gray soil is distinguished from clear gray soil by the fact that the top layer of grass is light gray, with a low amount of humus, close to the surface of the carbonate layer. [29],[38].
In the upper part of the river there is a gray soil zone. Here, too, as the amount of precipitation is
much higher, the plant species multiply and grow thicker. These in turn affect the process of soil formation and, consequently, the amount of humus in the soil. Hydromorphic soil types such as meadow-gray, swamp-meadow, gray, swamp-gray are also found in the gray hill region. Such gray soil types are located in the old upper reaches of the Kara-Darya, in the deltas, in the lower parts of the plains at the foot of the mountains. Meadow soils are also found in the lower reaches of the Karadarya, with humus content up to 2%. Today, this type of soil has been converted to irrigated grassland in many places [8].
In the mountainous part of the Karadarya, the air temperature is much lower, on the contrary,

SJIF Impact Factor 2021: 8.013| ISI I.F.Value:1.241| Journal DOI: 10.36713/epra2016 ISSN: 2455-7838(Online)
EPRA International Journal of Research and Development (IJRD) Volume: 6 | Issue: 8 | August 2021 - Peer Reviewed Journal
2021 EPRA IJRD | Journal DOI: https://doi.org/10.36713/epra2016 | www.eprajournals.com |197 |
the amount of precipitation increases, resulting in specific plants, various shrubs and trees forming forests [11], [36]. The plants that grow here are adapted to grow in the sernam (mesophyte) region of the river basin. [12],[19].
Many tugai forests have formed in the river valley, of which very few remain today. Even so, sparse plants gives hope for restoring the tugai forests.
When we say tugai and tugai forest plants, the local people understand the places near the river banks and the plants that grow there [9], [124]. In many places, tugai forests consist of trees, shrubs, semi-shrubs, and grasses growing together. Occasionally there are liana plants. Tugai forests are found along the rivers of Central Asia, including the desert region of Uzbekistan. But its main area is associated with the middle and lower reaches of rivers.
In the mountainous region, such areas form a thin self-network. On the banks of rivers flowing through mountain ranges and streams, a variety of plants grow in abundance, including trees, shrubs, and shrubs. From them grow willow, poplar, birch, mountain ash, hawthorn, spruce, and occasionally walnuts, apples, oleaster. In addition, shrubs such as dogwood, barberry are also common. In these places, annual and perennial plants such as agrostis, rhizome, sagebrush, dog-bane, sedge, mint, etc. form grass on the banks of rivers. [5], [18].
The tugai in the Adir region cover a much larger area. This is because sometimes when rivers overflow, they expand and flow to the shores. [7], [19] Later, the waters receded, and the rivers formed a narrow stream, and on its banks formed tugai forests. In the tugai in this region, shrubs and deciduous shrubs (juniper, populus diversifolia, willow, hippophae, tamarix gallica) grow more than perennials, such as jiida, white lily, Capparis spinosa. In addition, there are many plants from the family of alfalfa, licorice, various astragalus and wheat. [15], [16].
Rocky areas are also found in the upper regions of the tugai, consisting of gray and brown soils. Fertile soils are used for agriculture, to some extent as pastures for livestock.
Taxonomic analysis of the vegetation of the Karadarya basin shows that the flora here is very diverse, including tree, shrub, semi-shrub, perennial and annual grasses, several families. According to the taxonomic analysis of the identified species, there are 25 tribes, 27 families, 45 genera and 61 species. [10],[316].
The following tugai plants can be found on the river banks [22].
Elaeagnus angustifolia, Populus diversifoliya, Populus pruinosa, Salix songarica,
Salix Wilhelm jana, Fraxinus turkestanica, Hippophae rhamnoides, Clematis orientalis, Halimodendron halodendron, Lycium ruthenicum, Tamarix ramosissima, Tamarix hispida, Tamarix Laxa, Glycyrrhiza glabra, Capparis spinosa, Alhagi sparsifolia, Alhagi kirghisorum, Phragmites communis Trin., Typha laxmannii, Imperata cylindrica, Trifolium pratense, Equisetum arvense, Cennodom daktelon, Mentha aquatica, Plantago major L, Plantago lanceolata, Apocynum lancifolium, Karelinia caspia, Aeluropus litoralis, Artemisia ferganensis, Cichorium intybus, Zygophyllum fabago, Asparagus persicus, Lepidium latifolium, Dadortia orientales, Saccharum spontaneum, Urtica urens, Typha minima, Potamogeton natans, Potamogeton nodosus pour ex Lam, Erianthus ravennae, Hordeum bulbosum, Polygonum hydropiper, Leersia oryzoides, Juncos gerardii, Cyperus oryzoides and many other species are the main constituents of the river valley flora [19],[16].
The characteristics of the natural elements of the Karadarya valley are not the same in all its parts, the diversity of hydrological conditions, climate and diversity of plant species have led to the formation of specific soil types. [26],[34].
Although various ecological environments have been formed in the Karadarya Valley, mainly plants adapted to mesophytic conditions, we can sometimes find plants specific to the arid zone [13], [54]. These plants have formed unique life forms. In the upper reaches of the river there are more trees, shrubs, semi-shrubs, and a variety of annual, perennial plant species. In the middle and lower part, there are fewer trees and shrubs, and mainly a variety of plants are common [30], [346]. The plants found in the Karadarya basin have a variety of life forms, including the Ailanthus altissima mill., Salix songarica, Fraxinus turkestanica, Salix excelsa, Populus diversifolia, Populus pruinosa, Elaeagnus angustifolia, small trees such as Hippophae rhamnoides, Tamarix laxa, shrub plants such as Tamarix romosissime, Tamarix hispida, Чилвир
Salix wilhelm, Halimodendron halodendron, Lycium L.Ruthehicum, Clematis orientalis, Glucythiza glabra, Amorphaa fruticos Al, Rosa canina L., Small fruit namatakdog-rose - Roza biggeryana, large shrub-shaped Salix olgaergl) are the only species in the river valley vegetation [14],[8].
The fact that the most common form of life in the river valley is perennial grasses indicates that mesophytic conditions are high. [16],[123]. The most common species of such plants are Alhagi sparsifolia, Alhagi kirhizorm, Alhagi pseudo, Trifolium pratense, Trifolium repens, Capparis spinosa, Typha laxmannii, Typha minima, Calamagrostis biya, Imperata cylindrica, Cynodon
SJIF Impact Factor 2021: 8.013| ISI I.F.Value:1.241| Journal DOI: 10.36713/epra2016 ISSN: 2455-7838(Online)
EPRA International Journal of Research and Development (IJRD) Volume: 6 | Issue: 8 | August 2021 - Peer Reviewed Journal
2021 EPRA IJRD | Journal DOI: https://doi.org/10.36713/epra2016 | www.eprajournals.com |198 |
dactylon, Aeluropus littoralis, Saccharum pont, Erianthus ravennae, Hordeum bulbosum, Phragmites communis, Equisetum arvense, Euphorbia lamprocorpa, Mentha aquatica, Plantago major L, Plantago Lanceolata, Apocynum lancifolium, Karelinia caspia, Artemisia Ferganensis, Cichorium intybus, Zygophyllum fabago, Asparagus persicus, Lepidium latifolium, Urtica urens, Rumex drobovii, Bolboschoenus maritimus, Juncus Gerardii, annual plants such as Aeluropus littoralis, Dadartia avientalis L., Bidens tripartita, Carthamus turkish, Cannabis ruderalis L., Potamogeton natans, Polygonum hydropiper, Cyperus Oryzoides. SUGGESTIONS
The old riverbeds of the Karadarya, with the planting of assimilated crops, led to the deterioration of soil composition as a result of the mixing of various mineral fertilizers into the soil. Due to the use of various toxic chemicals to remove weeds from cultivated crops, tugai plants are disappearing. [18],[342].
High concentrations of water flowing into the river without washing away mineral salts from plows, various industrial wastes, pollute the river water and adversely affect the plants on the river banks.
Many wild species of plants that still grow naturally can be found in the Karadarya basin. If we study the importance of these wild species on the farm, we can see that some of them are at a higher level than the cultivated plants. Unfortunately, the number of some medicinal plant species has greatly decreased. For example, the plant types such as Hippophae rhamnoides, Rosa canina L, Glycyrrhiza glabra are now very scarce [20],[24].
The following is a discussion of the importance of some conservation-affected wild plant species in the Karadarya basin.
Elaeagnus angustifolia has sweet and sour fruit, and it is food. As the stem is thorny, it is dangerous as a fuel for the locals; it is used as a wall around the garden. It is a quality fuel in remote villages and neighborhoods. Populus diversifolia is used as a building material [21], [86].
Salix songarica, Salix wilhelm jana. Local people transplant them by the roots and use them as living walls and baskets.
Hippophae rhamnoides - the fruit of the plant is a very valuable medicinal plant. It is an effective remedy for various internal diseases, diseases of the esophagus, stomach and intestines. From its fruits can be prepared various jam varina. The leaves of the retail plant are used in the treatment of various skin diseases [23],[139].
Halimodendron halodendron – this thorny shrub grows in groups in the drier parts of the riverbed, on the gravelly hills. From them the locals make barns where cattle cannot pass. It is also used as a broom to sweep the hay under the cattle and to clean the scattered grain from the straw fields.
Tamarix ramosissima – this plant, since ancient times, has been made of whip stalks, sticks, because their stems are stiff. As firewood, fuel is prepared [24],[216].
Tamarix Laxa – the plant can be propagated as an ornamental plant because of its beauty.
Glycyrrhiza glabra – scientists have shown that the sweetness in the root of this plant is several times sweeter than sugar. Glycyrrhiza glabra is a valuable medicinal, fodder plant.
Capparis spinosa – in some places the fruit of Capparis spinosa is consumed as much as melons. Its buds and fruits and now sprouted twigs can be eaten as a spice. Oil can be extracted from the seeds. Indigenous people use Capparis spinosa fruit to treat various ailments, including gum and toothache [25],[92].
Alhagi sparsifolia – this plant has medicinal properties in addition to being a fodder, wood fuel. Very rich in honey and sugar..
Phragmites communis Trin. – The cane is a good food plant in the spring for cattle. During the summer, the animals eat only its leaves because the stem is woody. High quality silage can be obtained from these plants. The cane is dried and paved on the roof.
Typha Laxmannii – fodder, mats, rough rugs are made from this plant [26],[28].
Cennodom Daktelon – this plant is used as fodder for cattle and sheep. Cennodom Daktelon is used as a natural rug for playgrounds.
Mentha aquatica – this plant is an essential oil plant that belongs to the group of meadow plants. This plant is made from young grasses and eaten. Tincture is an effective remedy for nervous disease.
Plantago major L – it is a valuable medicinal plant. In the treatment of liver disease in humans, the juice of this plant "rliantaglutciline" is sold in pharmacies [27],[126].
Cichorium intybus – it is a medicinal plant. The roots and stems are rich in alkali. It is therefore registered as a medicinal plant. Scorpion grass or yeast (urtica urens) is a plant rich in vitamin C. Typha minima is a plant that is eaten by sheep. It is made into various baskets, buckets and boxes.
Bidens tripartita - this plant is a valuable medicinal plant. Children affected by heat, covered with rash are bathed, cooling the boiled water of Bidens tripartita.
Polygonum hydropiper – This plant is also medicinal [28],[16].

SJIF Impact Factor 2021: 8.013| ISI I.F.Value:1.241| Journal DOI: 10.36713/epra2016 ISSN: 2455-7838(Online)
EPRA International Journal of Research and Development (IJRD) Volume: 6 | Issue: 8 | August 2021 - Peer Reviewed Journal
2021 EPRA IJRD | Journal DOI: https://doi.org/10.36713/epra2016 | www.eprajournals.com |199 |
CONCLUSION
The Karadarya River, which flows through the Andijan region of the Fergana Valley, has different geographical structures, different natural zones, different soils across zones.
The soil of the tugai consists of gray and brown soils. Rocky areas are also found in the upper regions.
Specific plant species are spread in the Karadarya basin. In the upper part, tree shrubs are more common, while in the middle and lower parts, perennial grasses are more common.
According to the study of the vegetation of the Karadarya Valley, 3 species, 4 ancestors, 7 sub-ancestors, 25 tribes, 62 genera of 45 species were identified.
The current ecological condition of the Karadarya basin is in poor condition. Existing natural tugai and lakes are being destroyed and turned into cultural crops. The result is the application of various chemical mineral fertilizers to the soil; the use of toxic chemicals against wild plants is disrupting the natural ecosystem of various industrial wastes.
It is determined that the life forms of the existing plant species in the Karadarya basin include 9 types of trees, 10 types of shrubs, 34 types of perennial grasses, and 9 types of annual plants.
Karadarya plants are very important in the economy. Of the rare, medicinal plants, the importance of Hippophae rhamnoides, Capparis spinosa, Plantago major L, Mentha aquatica, Rosa canina L., Glucythiza glabra, Bidens tripartita and other plants should be emphasized.
Given the growing demand for wild plant species in natural areas, especially in the current conditions, in the treatment of various diseases, medical preventive measures among the population, in-depth study of river valley flora and fauna and strong conservation measures is a requirement of the time. REFERENCES
1. M.M. Arifkhanov. Vegetation of the Fergana Valley. - Tashkent: Fan, 1967 .-- 287 p.
2. M.M. Arifkhanov. Vegetation of the Fergana Valley: / author's abstract of the dissertation of Doctor of Biological Sciences - Tashkent: FAN, 1965. - 56 p.
3. P. Baratov. “Natural Geography of Uzbekistan”
Tashkent: “Ukituvchi” 1996. - 440 p. 4. P. Baratov. “Central Asian Rivers and Their
Economic Importance” Tashkent: FAN. 1967. 5. A.R. Gazybaev. Flora of the Isfara river basin (Its
rational use and protection): / abstract of the dissertation of the candidate of biological sciences - Tashkent, 1994. - 21 p.
1. 6.R.S. Vernik, T. Rakhimova Natural vegetation
and pastures of hills of the Namangan region - Tashkent: Fan, 1982. - 89 p.
6. G. Gaffarov. Flora and vegetation of the basin of the river Khodja-Bakirgan (Turkestan ridge): / abstract of the dissertation of the candidate of biological sciences - Tashkent, 1991. - 22 p.
7. P.L. Gorchakovsky. Trends in anthropogenic changes in the vegetation cover of the Earth // Botanical Journal, 1979, vol. 64, no. 12.
2. E.M. Demurin. Vegetation of the western part of the Turkestan ridge and its spurs. - Tashkent: Fan, 1975 .-- 189 p.
3. N.V. Dylis. Program and methodology of biogeocenological research Ed. Moscow: Nauka, 1974 .-- 401 p.
4. K.Z. Zakirov. Flora and vegetation of the Zeravshan river basin: (in 2 volumes). - Tashkent: Publishing house of the Academy of Sciences of the Uzbek SSR, 1961, 1962 .-- 205 p., - 446 p.
5. G.A. Ibrokhimova. The current state of endemic and rare species in the northern part of the Fergana Valley // Bulletin of the Khorezm Mamun Academy. - Khiva, 2019. - №2. - B. 19-22.
6. Ф.Д. Кабулова, Д.У. Расулов. О деградации
тугайного леса в Зарафшанском заповеднике
// Матер. республиканской научной
конференции «Ботаника соҳасидаги илмий-амалий ютуқлар ва долзарб муаммолар». – Самарканд, 2014. – С. 54-57.
7. V.A. Kamkin. Spatial structure of the vegetation of the Ertys river valley within the Pavlodar region: / abstract of the candidate of biological sciences. - Almaty, 2009 .-- S. 8-17.
8. R.V. Camelyn. Flora of Syrdarya Karatau. - L .: Nauka, 1990 .-- 146 p.
9. F.I. Karimov. Single-seeded geophytes of the Fergana Valley: - Tashkent. 2016. –155 p.
10. G.A. Lazkov. The family of cloves (Caryophyllaceae) in the flora of Kyrgyzstan. - M .: Partnership of scientific publications KMK, 2006. - 272 p.
11. V.I. Lipsky. Flora of Central Asia. Russian Turkestan khanate of Bukhara and Khiva. Part III Botanical collection from Central Asia. Petersburg, Gorold. 1905. -No. 3. - p 342-840.
12. Z.U. Muzafarova. Flora and vegetation of the Nauvalisay river basin: / abstract of the dissertation of the candidate of biological sciences. - Toshkent, 1993 .-- 23 p.
13. M.M. Nabiev. Vegetation of variegated strata of the Mailisay river basin (eastern part of the Fergana Valley) // Institute of Botany of the Academy of Sciences of the Uzbek SSR. Issue 5. - Tashkent, 1959 .-- S. 24-89 p.
14. T.V. Ovchinnikov. Transformation of the vegetation cover of the Kashkadary river basin: / dis. ... cond. biol. sciences. - Tashkent. 1995 .-- 133 p.
15. Keys to plants of Central Asia. A critical synopsis of flora. In I-XI. T. - Tashkent: Fan, 1968-2015.
16. W.P. Pratov. Haze in the Fergana Valley. -

SJIF Impact Factor 2021: 8.013| ISI I.F.Value:1.241| Journal DOI: 10.36713/epra2016 ISSN: 2455-7838(Online)
EPRA International Journal of Research and Development (IJRD) Volume: 6 | Issue: 8 | August 2021 - Peer Reviewed Journal
2021 EPRA IJRD | Journal DOI: https://doi.org/10.36713/epra2016 | www.eprajournals.com |200 |
Tashkent: Fan, 1970 .-- 167 p. 17. Vegetation cover of Uzbekistan and ways of its
rational use. In 4 volumes - Tashkent: FAN, 1971-1984. 11-356 p.
18. K.Sh. Tojibaev. Vegetation and meadows of Chodaksay basin: / dissertation, candidate of biological sciences. –Tashkent: 2002p. - p 134.
19. S.E. Treshkin. Degradation of Central Asian tugays and the possibility of their restoration: / abstract of the dissertation of Doctor of Biological Sciences. - Volgograd, 2011 .-- 44 p.
20. V.V. Sedov. Floodplain vegetation of the Zaravshan valley and the ways of its reconstruction. - Nukus Uz.GU Names of Alisher Navoi, 1959 .-- p. 165.
21. T. Khudaiberdiev. Flora and vegetation of the Aksakata river basin: / abstract of the dissertation of the candidate of biological sciences. - Tashkent, 1991 .-- 21 p.
22. T.Kh. Khudaiberdiev. Lipoids in the vegetation cover of the Fergana Valley: / abstract of the dissertation of the candidate of biological sciences. - Tashkent, 1997 .-- 44 p.
23. C. Raunkiаer. The life form of plants and statistical plant geography. – Oxford, 1934. 632 p.

SJIF Impact Factor 2021: 8.013| ISI I.F.Value:1.241| Journal DOI: 10.36713/epra2016 ISSN: 2455-7838(Online)
EPRA International Journal of Research and Development (IJRD) Volume: 6 | Issue: 8 | August 2021 - Peer Reviewed Journal
2021 EPRA IJRD | Journal DOI: https://doi.org/10.36713/epra2016 | www.eprajournals.com |201 |
IMPACT OF PANDEMIC TOWARDS MIGRATION OF LABORER: THE EMERGENCE OF INVISIBLE INDIA
Arun Kumara Senapati1, Prof. Subash Chandra Parida2
1Indira Memorial Degree College, Chandiput, Gajapati 2Retired Professor, Dept. of IRPM, Berhampur University
ABSTRACT International Organization for Migration (IOM), in a study in 2005 records that around 190 million people i.e., 3
per cent of the world’s population, lived in a place different from the one in which they were born. This figure throws
light on the colossal amount and complexity of the phenomenon called migration. It is local as well as international.
This had been there since time immemorial but given the recent developments i.e., Covid 19 Pandemic, it has reached
proportions never seen before. Of late heart rendering pictures of their plight have sent shivers down our spine. The very
group that had been contributing towards the development of our country by the sheer sweat of their brow, their labour,
are now struggling to get back home alive. Their voices are neither heard by the politicians in the villages they had left
behind for “greener pastures‟ nor by the ones in cities where they spend a large part of their working life. The present
paper tries sheds some light on their present state amid this pandemic. KEYWORDS: Covid-19; pandemic; migration.
INTRODUCTION International Organization for Migration (IOM),
in a study in 2005 records that around 190 million people i.e., 3 per cent of the world’s population, lived
in a place different from the one in which they were born. This figure throws light on the colossal amount and complexity of the phenomenon called migration. It is local as well as international. This had been there since time immemorial but given the recent developments i.e., Covid 19 Pandemic, it has reached proportions never seen before. Of late heart rendering pictures of their plight have sent shivers down our spine. The very group that had been contributing towards the development of our country by the sheer sweat of their brow, their labour, are now struggling to get back home alive. Their voices are neither heard by the politicians in the villages they had left behind for „greener pastures‟ nor by the ones in cities where they
spend a large part of their working life. The present
paper tries sheds some light on their present state amid this pandemic.
What situation was seen in most of European countries can be seen in ours too, with the principal actors being different. The crisis that hit most European counties sometime back was “Refugee crisis” and ours
at present is the “Migrant crisis”. With an uncertain future these “refugee‟ and “migrants‟ undertake a long
and tedious journey in search of a future and safety. The translocation here is not of international borders but the boundary of nation-state.
India is still a developing country with the majority of its population still finding it difficult to make ends meet. The World Bank had published a data on India’s poverty profile in 2016. Although the data
that was under study was of the year 2012, the number quoted as staggering. 270,000,000 (27 crores) Indians are poor which in other words comes down to the fact that 1 in 5 Indians is poor. The seven low-income states together comprise of the 62% of India’s poor and these
are home to 45% of India‟s total population.

SJIF Impact Factor 2021: 8.013| ISI I.F.Value:1.241| Journal DOI: 10.36713/epra2016 ISSN: 2455-7838(Online)
EPRA International Journal of Research and Development (IJRD) Volume: 6 | Issue: 8 | August 2021 - Peer Reviewed Journal
2021 EPRA IJRD | Journal DOI: https://doi.org/10.36713/epra2016 | www.eprajournals.com |202 |
State Number of poor (In millions) Uttar Pradesh 60 Bihar 36 Madhya Pradesh 24 Odisha 14 Jharkhand 13 Rajasthan 10 Chhattisgarh 10 Source: WB https://www.worldbank.org/en/news/infographic/2016/05/27/india-s- poverty-profile
The Indian economy is heavily dependent on migrant workers. It (migration) is a sort of a livelihood strategy for millions of people. As per 2011 Census there are around 194 million are permanent and semi-permanent migrant workers out of 482 million workers in India. Add to it another 15 million short-term migrant workers of temporary and circulatory nature. These migrant labourers are spread all across the country with their visibility more in high income states like Delhi, Goa, Maharashtra, Gujarat, Haryana, Punjab and Karnataka. These states are among the worst affected by Covid-19 as compared to the low-income
states like Uttar Pradesh, Jharkhand, Bihar, Odisha and Rajhasthan where there are higher rates of out migration. What one needs to be aware is the fact that the sudden rise of Covid cases in out migrating poorer states may also be the result from this migration. For example, there are migration corridors within the country – Bihar to Haryana and Punjab, Bihar to Delhi, Uttar Pradesh to Maharashtra and Delhi, Odisha to Gujarat and Andhra Pradesh and Rajasthan to Gujarat. Now with full lockdown being imposed, the positive cases are gradually on the rise in out migrating poorer states due to return migration.
Stock of Migrant Workers (in million), India, Census 2011
On 24th of March 2020, the Government of India went ahead with a full National lockdown sealing its

SJIF Impact Factor 2021: 8.013| ISI I.F.Value:1.241| Journal DOI: 10.36713/epra2016 ISSN: 2455-7838(Online)
EPRA International Journal of Research and Development (IJRD) Volume: 6 | Issue: 8 | August 2021 - Peer Reviewed Journal
2021 EPRA IJRD | Journal DOI: https://doi.org/10.36713/epra2016 | www.eprajournals.com |203 |
international borders and forcing a series of strict containment measures. With a barely four notice before the lockdown and no announcement on any kind of relief packages, this lockdown came as a thunderbolt to many. Millions of people, especially the informal sector workers and migrants were immediately left jobless with this announcement. With a little saving to feed themselves on for a week or two and with many of them with no ration cards, they were prompted for a mass exodus fleeing cities to go back to their villages on foot, travelling hundreds of kilometre with the heat hitting them hard with almost 40 degree centigrade. Many more were still trapped in cities with the inter-state buses and trains coming to a halt. The lockdown in India has led to a sudden job loss for more than 12 crore people, with the migrant workers being the worst hit. With more than 4 crore staring at an uncertain future, the state of politics in India is slowly taking a turn. A survey conducted by SWAN (Stranded Workers Action Network) throws light on some horrifying data. More than 78 per cent of them have not been paid salary since the day lockdown was imposed. Eighty-two per cent have not got any ration from the government after all the tall claims issued by the government. Lack of knowledge and Rights add to the misery of these migrant labourers too. About 30 percent of them work as casual labourers, being exposed to the vagaries of the labour market and lack social protection. Around 35 percent of migrant workers are employed as regular/salaried workers and the rest are self-employed (NSSO, 2010). Under these life threatening conditions they undertake a journey to a „home‟. The poor migrant is stranded between two varied notions of home. They walk back from a less secure
place to a one which at one point of time was their home but lacked any opportunity. It is therefore difficult to postulate that this homelessness will eventually create more radical forms of politics of which these migrant labours would be central players.
This “walking back” can be also viewed as a form of resistance. With all forms of livelihood being shut and no hope of any monetary help, things looked very grim for them. News of starvation, death and hunger started flooding the social media and mainstream news channels. The state and central agencies sprung into action and started heaping promises and welfare schemes of shelter and food, all from the state and central exchequer. Pradhan Mantri Garib Kalyan Yojna (PMGKY) was swiftly introduced to deal with the least fortunate among the poor but the successful execution of this package represents a major test as well as huge task for the governments (state and central). The MoF (Ministry of Finance) had stated on the official website that 42 crore poor people have received financial assistance of 65,454 crore under the Pradhan Mantri Garib Kalyan Yojna as on 20 June, 2020. Free food grains and monetary help to women and poor senior citizens and farmers were announced. And for the migrants, free food grains supply and chana for two months was quickly declared. Other schemes were too brought into effect such as MGNREGA, Jan Dhan etc. The Central Government directed the state governments to use Building and Construction Workers Welfare Fund to provide relief to Construction Workers through direct benefit transfer (DBT). Pradhan Mantri Garib Kalyan Package: Total Direct Benefit Transfer till 19/06/2020
Scheme Number of Beneficiaries Amount Support to PMJDY women account holders
1st Ins - 20.65 Cr (100%) 2ndIns –20.63 Cr 3rd Ins -20.62 (100%)
1stIns –10,325 Cr 2ndIns – 10,315 Cr 3rd Ins –
10,312 Cr Support to NSAP (Aged widows, Divyang, Senior citizen)
2.81 Cr (100%) 2814 Cr
Front-loaded payments to farmers under PM-KISAN
8.94 Cr 17891 Cr
Support to Building & Other Construction workers
2.3 Cr 17891 Cr
24% contribution to EPFO 66 Cr 996 Cr
Ujjwala 1st Ins – 7.48 2nd Ins – 4.48
8488 Cr
TOTAL 42.84 Cr 65,454 Cr
Source: Ministry of Finance,GOI, Press Release https://pib.gov.in/PressReleasePage.aspx?PRID=1632863

SJIF Impact Factor 2021: 8.013| ISI I.F.Value:1.241| Journal DOI: 10.36713/epra2016 ISSN: 2455-7838(Online)
EPRA International Journal of Research and Development (IJRD) Volume: 6 | Issue: 8 | August 2021 - Peer Reviewed Journal
2021 EPRA IJRD | Journal DOI: https://doi.org/10.36713/epra2016 | www.eprajournals.com |204 |
These welfare schemes and the effort behind them were commendable but the ground realities had a different story to narrate. Jan Sahas, an Indian non-profit organisation conducted a survey, “Voices of the
Invisible Citizens,” about the effect of lockdown on migrant workers. They had about 3,196 migrant construction workers from northern and central India for interview. The findings were astonishing: “62
percent of workers did not have any information about emergency welfare measures provided by the government and 37 percent did not know how to access the existing schemes.” The fear of loss of livelihood
and the looming danger of this new pandemic saw the mass exodus of millions of these migrant labourers. The only possible and safe option left for them was their “home”, their villages. This massive migration led to a chaotic situation on national highways, bus stops and railway stations resulting in misunderstandings between states. Strict orders were issued not to allow anyone to travel. Any kind of social gathering was to be dealt with strongly. With desperation soaring high and with rumours of train services starting once again, hundreds of workers gathered near Mumbai railway station defying rules of social distancing, putting themselves and others at risk. They demanded that authorities arrange transport to send them back to their hometowns and villages so they could be with their families. The police, instead, used sticks to disperse them. Around the same time it was also witnessed in the western state of Gujarat, where hundreds of textile workers had gathered and protested in Surat city, demanding passage home. A day later there were outage in the National capital, Delhi were news of several hundred migrants were discovered living under a bridge along the Yamuna river. The river here resembles a sewer and the bank is full with garbage. The people living there were unwashed and had not eaten anything in three days. These are but a few incidents that have managed to capture the lens of the national news channels, with many more such incidents of sufferings still being left unnoticed. What these incidents have done is that they have shone a spotlight on the plight of millions of poor Indians who migrate from villages to cities in search of livelihood - and how the lockdown has left them stranded far away from home, with no jobs or money. With no hope to get any support from the state and central agencies, the migrant labours now started walking hundreds of kilometres. This sudden mass movement took the authorities by surprise. Clearly, no policy maker had anticipated such a reaction, and no detailed contingency plans seemed to be in place.
“Reverse migration” a term apt for the present
scenario, it is the phenomenon of the migrants “walking back home” from urban and industrial centres. This has allowed them to script themselves back into the narrative of the nation and become politically relevant. This at the same time reminds us of the stark inequality that remain buried deep in our society. There were rescue missions being undertaken in India and abroad, missions like Vande Mataram, tourists being evacuated in Uttarakhand, pilgrims stranded in Varanasi being evacuated, middle-class students studying in Kota being evacuated, but when it came to migrant workers all became mute. This neglectful treatment is not something that should raise eyebrows in political corridors. Migrant workers had never seemed to be much of a consideration for politicians. These episodes are only some of many examples of this fact. These workers, despite their numbers, have no political clout. Many are registered to vote in their village. But when Election Day comes, they are usually in the city where they work and are unable to cast a ballot. Statistically speaking they are almost invisible. Because they consistently move between villages and cities, and among work sites, capturing their number is almost difficult. The government’s 2017 economic survey pointed out that if
the share of migrants in the workforce is estimated to be even 20 percent, the size of the migrant workforce can be estimated to be over 100 million. That is a huge number to ignore.
But with these times, where the migrants as a class have been hit, and hit severely hard, one can only imagine the where they would vent out their anger. They are all together in this suffering and pain. With Legislative Assembly elections to be held in the states of Bihar, Jammu and Kashmir and West Bengal soon, the political parties would now be at pains to woo them.
We see them everywhere. Yet, we never imagined migrant workers as a group big enough to be taken seriously. A lockdown, no matter how necessary, is always going to be unbearably difficult for those without a social and economic buffer. We have so far underestimated the role migrants played in the Indian economy. We have failed to recognize their contribution. We knew they existed but never acknowledged their quantum. The new coronavirus has given them a sudden visibility in the national discourse. But the acuteness of their plight today is a result of the fact that India had been ignoring them during normal times.

SJIF Impact Factor 2021: 8.013| ISI I.F.Value:1.241| Journal DOI: 10.36713/epra2016 ISSN: 2455-7838(Online)
EPRA International Journal of Research and Development (IJRD) Volume: 6 | Issue: 8 | August 2021 - Peer Reviewed Journal
2021 EPRA IJRD | Journal DOI: https://doi.org/10.36713/epra2016 | www.eprajournals.com |205 |
REFERENCES 1. BBC (2020) https://www.bbc.com/news/world-asia-
india-52086274 accessed on 6th April 2020. 2. Bhagat, R.B. (2012) „Summary Report and
Recommendations‟, Compendium on Workshop
Report on Internal Migration in India, Vol. 1, UNESCO and UNICEF, Delhi, 2012.
3. First Post (2020) Return migration and COVID-19: Data suggests Kerala, TN, Punjab, UP, Bihar may be future red zones for contagion risk, Apr 03, 2020, Available at : https://www.firstpost.com/health/coronavirus-outbreak-return-migration-andcovid-19
4. inindia-data-suggests-kerala-tamil-nadu-punjab-up-bihar-may-be-futurered-zones- forcontagion-risk-8221531.html.
5. International Labour Organization (2020) ILO Monitor 2nd edition: COVID-19 and the world of work, Available at: https://www.ilo.org/global/topics/coronavirus/impactsand- responses
6. International Organization for Migration (2019) World Migration Report 2020, IOM, Geneva.
7. Ministry of Housing and Poverty Alleviation (2017) Report of the Working Group on Migration, Govt of India, New Delhi.
8. NSSO (2010) Migration in India 2007-08, Ministry of Statistics and Programme Implementation, Govt. of India, New Delhi.
9. United Nations, Department of Economic and Social Affairs, Population Division (2019) International Migrant Stock 2019 (United Nations database, POP/DB/ MIG/stock/Rev2019)
10. https://indianexpress.com/article/coronavirus/coronavirus-deepens-struggles-formigrants- in-persian-gulf-6361636/
11. http://strandedworkers.in/mdocuments-library/# 12. https://www.worldbank.org/en/news/infographic/20
16/05/27/india-s-poverty-profile

SJIF Impact Factor 2021: 8.013| ISI I.F.Value:1.241| Journal DOI: 10.36713/epra2016 ISSN: 2455-7838(Online)
EPRA International Journal of Research and Development (IJRD) Volume: 6 | Issue: 8 | August 2021 - Peer Reviewed Journal
2021 EPRA IJRD | Journal DOI: https://doi.org/10.36713/epra2016 | www.eprajournals.com |206 |
THE NATURE AND FUNCTION OF CONTEMPORARY LITERARY THEORY: A STUDY IN OUTCOME-BASED
LEARNING IN LITERATURE
Dr Valiur Rahaman Assistant Professor of English, Department of Humanities, Madhav Institute of Technology and
Science Gwalior
ABSTRACT
The paper is undertaken to investigate the nature and function of Literary Theory. Since the phrase ‘Literary
Theory’ (LT) is not a new word, it has been explained and elucidated by many LT practitioners and professionals
before this paper is being conceived. All the LT professionals have opined their viewpoints on the nature and
function of the LT, yet its application as an approach to Literature, Culture Studies, Arts, Social Sciences and
their cognate sub-branches is yet to be diffused among young scholars and students. The paper demonstrates the
responses to the question why it happens at institute and organization level because from heretofore the scholars
continue their journey to the world of research. Hence, the paper is a well-organized structure of the knowledge
comprising with its sets that are ideas about what Literary theory is, how it emerges, where it can be used, and what
its outcome is.
KEYWORDS: Literary Criticism, Literary Theory, English Literature, Reading Skills, Critical Thinking,
Western Philosophy, Humanities, Social Science, Comparative Literature
INTRODUCTION Generally, every student of English literature
must study Literary theory (LT) and Literary Criticism (LC) while pursuing BA. and M.A. & MPhil. The LT & LC are prescribed as courses of Literature, Culture Studies, Political & Development sciences and Media Studies and their cognates in almost all the universities in India and abroad. The curriculum is designed becoming conscious of the coverage of 300 BC to 2000 CE: from Socrates (when we read Socrates, we must read about writers whom Socrates cites so it covers the extra timelines) to Jacques Derrida, Deleuze and Spivak. The students complete the course with affirmations that they did not understand or comprehend literary criticism and theory. This is only because the learners do not know about some basic things related to LT and LC such as the nature of LT and LC, difference between both the phrases, and differential study of both the concepts, and above all its outcome that means its utilization in personal and professional activities. The present review paper, therefore, presents research reviews of the nature and function of LT & LC and arguments for their applications and
utilities. Personal pronouns are used in this paper for directness of ideas following analytical qualitative (non-numerical) research methodology. WHY WRITING AND LITERARY THEORY?
Is writing itself a literary theory?(Eagleton 2008) Why writing?(Sartre 1988) Let‟s first find
answer to this question. I studied LT & LC to understand what critics and theorists establish and apply their perspectives to see the imaginative literature. For example, I read Literary theory of Deleuze and Guattari (D&G) once for comprehending what he writes, but now I see and witness the connectivity of Deleuze and Guattari‟s
works(Deleuze, Guattari, and Brinkley 1983) much more than I could do earlier. There is a big gap of the function of reading the G&D writing then and now. The present paper demonstrates that gap in terms of why a person writes. What factors do effect an author to become a social activist?(Eagleton 2008) Why does he write? And what factors are behind which compel him to write? For whom does he right? And

SJIF Impact Factor 2021: 8.013| ISI I.F.Value:1.241| Journal DOI: 10.36713/epra2016 ISSN: 2455-7838(Online)
EPRA International Journal of Research and Development (IJRD) Volume: 6 | Issue: 8 | August 2021 - Peer Reviewed Journal
2021 EPRA IJRD | Journal DOI: https://doi.org/10.36713/epra2016 | www.eprajournals.com |207 |
who are the authentic readers to read him? Does an author write for witnessing a change in society? These questions are very much related to the major question of the research paper that is why Deleuze and Guattari in Indian universities? Why should Deleuze and Guattari be read and explored by Indian academic scholars/readers? Why should literary theorists like them be considered in India? What is the need of seeing them? How should we read Deleuze - as an author, as a philosopher, as a critic, as a thinker, as an atheist, social reformer, NGO owner, and as a social technocrat? These questions are very pertinent questions of the paper and the entire paper answers to these questions. The questions would lead to understand why literary theory an integral part of the curriculum is. And unless we understand the utility of anything, we do not wish to consume it. Literary criticism (LC) is all about who to write about literature while literary theory is about how literature takes birth, how to write Literature, and create art. The LC writes about what is in the text while LT writes about what is in and around the text. DISCUSSION: LITERARY THEORY AND CRITICISM
In fact, In India the literary theory is used as adopted perspective to see literary arts whereas literary criticism studies the causative symptoms to call a writing an art. With these two functions, we end the act of reading. Let us understand with a few examples: During our reading, we look for Arnoldian seriousness and moral value; Eliotic sense of tradition; Aristotelian ethics of cathartic effect; Wordsworthian ideas of pantheistic criticism as the subjects for looking at a work of art, binaries of thoughts, contradictions, dictions, styles etc. in literary arts as readers. In doing so we forget that academic levonorgestrel implications of philosophical discourses (in any stream of knowledge) on man, life and death enforced literary persons to persuade reasons and roots of megalithic reality, belief, custom, experience, belonging, existence, agnostic and pragmatic assertions of great thinkers contained in discourse, text or a work of art. Criticism, thus, is no more rhetorical but epistemological entity of a creative mind. We can henceforth understand that literary theory is an epistemological enquiry of the text. Roland Barthes's Truth and Criticism (Barthes 1968; 2007)elucidates criticism as theory in the poststructuralist(Castle 2007) terms. Roland Barthes rightly said „Criticism is
not science. Science deals with meanings, criticism produces them ... it gives a language to the particular discourse [pure parole] which reads literature and gives one voice‟. It discovers in the work a certain
intelligibility, and in that, it deciphers and
participates in an interpretation. However, what it reveals cannot be signified ... criticism is not a translation but a paraphrase. (Barthes 2007, 81–87).
Theory does not talk of taste of rhetoric but of thinking. Kafka‟s The Castle, The Trial, Metamorphosis,(Deleuze, Guattari, and Brinkley 1983) Sartre‟s novels, Beckett‟s texts like The Waiting for Godot,(Graver 2004) Ionesco‟s plays like The Chair, Eliot‟s Four Quartets,(Eliot 1963) Pound‟s Canto(Pound 1975), Joyce‟s experimental
Ulysses(Hall and Waisbren 1980) , Artaud‟s The Cenci and so on are not only for evaluation, valuation, or textual analysis. For they tried to catch the abstract in soulful words. We can read the longest speech of Lucky in the Act One of Waiting for Godot (Graver 2004) which is spoken in one breath fruitlessly. He spoke around 800 words without any pause. Which school of literary criticism can elaborate it? Which philosophical school of theory can interpret its (un)spoken thought? Existential perspective, to be sure, will fail to interpret it. It does not demand analysis on/over its existence but supplement to it. The author fails to interpret the deep-seated thought, then and there a literary theorist assists to complete it by writing as supplement to it. For a theorist, good or bad does not matter but exploration of thinking and question so that it can produce a discourse. This is beautiful: beauty of literature and beauty of reading. Beautiful is resolution. But the fruitful, the productive, and hence the artistic principle is that which we call reserve.(Mann 1947) Auden‟s saying "Was he
happy? Was he free? / The question is absurd"(Auden 2020; Edward Mendelson 1979) is an example of “infinite” irony that accords Eliot‟s The Waste Land (Eliot 1963)but raises innumerable questions before readers‟ resolutions. Meaning cannot be explicit until
one does not answer to the questions like what is „happy‟. What is „free‟?(Auden 2020) What is „absurd‟?(Auden 2020) And above all, what „question‟ is. The word „question‟ is a matter of
irresolution in the modern literature. Of irresolutely condition of modern life, literature of the period became irresolutely literature of questions and answers too. After 1950, philosophy begun to guise itself in literature: literature of question. Consequently, literature could not remain for common readers who tried to seek pleasure as the source of entertainment. The works, I mentioned above, are beyond understanding of common reader or student of undergraduate level. But reading them one can produce a theory of reading. They insist to think over and again, else the text is in chaotic and complex to understand. Their thematic study will fail to tell their spectrality. Here we need to apply the theory of deconstruction. Deconstruction seeks and

SJIF Impact Factor 2021: 8.013| ISI I.F.Value:1.241| Journal DOI: 10.36713/epra2016 ISSN: 2455-7838(Online)
EPRA International Journal of Research and Development (IJRD) Volume: 6 | Issue: 8 | August 2021 - Peer Reviewed Journal
2021 EPRA IJRD | Journal DOI: https://doi.org/10.36713/epra2016 | www.eprajournals.com |208 |
finds the hidden meaning of a text because it teaches how to subvert the text. Outcomes of Learning Literary Theory and Art of Literary Research
Many people look at the literary pieces, now, with some philosopher‟s perspectives. The features of passionate, polemical, and judgmental and rhetorical arguments are repelled from contemporary field of criticism, and replaced by ambiguity, neutrality, and nuanced description of literary element perhaps this is the end of literary criticism because the root ethics of traditional criticism is no more. “Early twenty-first century art critics may or may not be university trained: in a way it does not matter, because virtually none are trained as art critics.” (Elkins 2003) It was overpowered by or say upgraded with Literary theory refurnishing the traditional judgmental practices for literary epistemology and went beyond inductive and deductive methods of logical enquiry. To this James Elkin criticises as ambiguous in negative terms, which is not so. This is a unique feature of human being which is celebrated as an attribution to the Poststructuralist literary theory. I appreciate James Elkins attack on Art materialism: “Art criticism
involves a fair amount of money by academic standards, because even modest exhibition brochures are printed in large numbers, on coated stock, with high- quality plates that are rare in academic publishing… a ghostly profession, catering for ghosts, but in a grand style.”(Elkins 2003) He explained how the word „criticism‟ is misused and
based on this idea only he devised the seven types of criticism: „catalogue essay‟, „academic treatise‟, „cultural criticism‟, „conservative harangue‟, „philosopher‟s essay‟, „descriptive art criticism‟, and „poetic art criticism‟ (Elkins 2003) I object to these futile exercises of the art historian and see the „criticism‟ only into two categories: 1.Technical Literary Criticism, and 2. Creative Literary Criticism. The functions and utility of both the categories are different. The first is mostly used for materialistic satisfaction, whereas the second is used for self-satisfaction. Elkins forgets that every art must be valued and learning of any art must have materialistic outcomes. If someone earns out of the knowledge of „criticism‟-be it historical, cultural, business, art, aesthetical design or whatever- based on the ethics of social engineering, there is no harm in doing so, rather it attributes to the outcome of learning about the history of writing or literature. I insist on knowing about the utility of learning about Literature and its valuable outcomes. If someone is M.A. in English Literature and join a company as a content writer, or a person of technical description of scientific objects / software or review writer of
aesthetical design, or owns the domain of film review, it is an outcome of his or her learning about how to write and read about things. Experts in the domains of Literary Criticism and Literary Theory must be appointed for such occupations, because they know what aesthetics is and what the value of words are. In India, there are many Engineers who are good poet and aestheticians. They write and compose and publish for their self-satisfaction. For example, Chandra Shekhar Malvi a Professor of Mechanical Engineering composed Baaten (Talks)1 I observe that the poem written in Hindi covers all human sentiments and depicts every aspect of human life. Durjoy Dutta turns his engineering career to novelist, screenwriter and entrepreneur his famous show is Sadda Haq – My Life, My Choice. Prof Alok Kumar Sharma2 is professionally an Engineer and architect but performed many roles as stage actor depicting philosophic and religious fervour of India. The New York Times reports, “the biggest selling English
language novelist in India‟s history” is Chetan
Bhagat who is an IIT alumni. Except their creative writings, they also perform shows and are known for writing social and cultural criticism. These facts justify that critical thinking and creative art have social materialistic outlook and help the Literature learners to decide and identify the outcomes of knowing about literary theory and criticism.
The Nature of Literary Theory 1. The LT is interdisciplinary, cross-disciplinary
and transdisciplinary branch of knowledge. The main reason is that LT teaches you how to interpret things, and how to see things. The knowledge of LT can be applied in the field of IT, IOT, Blockchain, and other developments in technologies. (Pandit and Rahaman 2019; Rahaman 2016; Rahaman, Singh, and Salunkhe 2021; Rahaman 2020b; 2020a). For example, Deconstruction is applied in the field of science and technology.(Devisch and Murray 2009; Shakespeare 2013; Hegzi and Abdel-Fatah 2018; Singh et al. 2019; O‟Halloran 2012)
2. The LT is intertextual(Childs and Fowler 2006) writing. Roland Barthes defines literary work of art as „text‟ (Barthes 1968) borrowing the idea from texture.
3. The LT is „philosophouros‟. Elkins criticizes the
cultural criticism saying it as anarchy. In fact, it is one of the characteristics of Literary theory: anarchy of interpretation – reciprocate text to text; literature to literature; literature to criticism;
1 Malvi CS Baaten. https://play.google.com/store/books/details/Baaten?id=o4SEDwAAQBAJ&hl=en_IN&gl=US 2 Director of IITTM Gwalior
SJIF Impact Factor 2021: 8.013| ISI I.F.Value:1.241| Journal DOI: 10.36713/epra2016 ISSN: 2455-7838(Online)
EPRA International Journal of Research and Development (IJRD) Volume: 6 | Issue: 8 | August 2021 - Peer Reviewed Journal
2021 EPRA IJRD | Journal DOI: https://doi.org/10.36713/epra2016 | www.eprajournals.com |209 |
literature to philosophy; philosophy to metaphysics; and vice versa. It is unlike literary criticism which focuses on a single work of art when one writes about it.
4. The idea remains that literature is no more rhetorical composition but a philosophy: a philosophy of decomposition, deconstruction of what we say, look and feel and what we neither say, look, nor feel too. Literature plays, not as an emotional game but a rational puzzle in its recess of silence. Roland Barthes can be eluded here in this respect: “Literature is like
philosopherous…it shines with its maximum
brilliance at the moment when it attempts to die.”(Young 1981, 34–45)
5. The LT is full of neologism and coinages. Creation of words is a compulsion of an author. Every coinage must be understood in terms of novelty. T.S. Eliot is rightly suggested: “the
novelty is better that repetition” (Eliot 1963; Castle 2007)
UNDERSTAND LITERARY THEORY BY UNDERSTANDING THE THEORIST
It is observed that after 1960 philosophers, media and communication scientists and linguists started taking more interest in interpreting literary texts than literary readers or critics. Most of the critics of human social sciences think that the Post-modernism is the result of constant acceleration of modernism, but we should not completely agree with them. We can also move ahead to see that Postmodernism has its own utility of peculiar ideas and way of thinking. The major cause of such change is the influence of phenomenology and existentialism. The mainstream of contemporary criticism came from both schools of thinkers. Derrida‟s concept of literature is not for a poet critic
but for a philosopher who keeps his aesthetic sense of receiving capacity. He must be a philosopher aesthetic who gets joyous ecstasy does not pleasure to reveal a new text during and after reading some others text. D&G‟s writing (Köhring 2015) needs more than this. Their writings need the power of connectivity that a reader does with society and thus reading becomes an activist approach to bring a change in society for human welfare. (Rahaman 2020 presented a paper on this research question in D&G Congress JMI Delhi in February 2020)
To reply to these questions, I had to go through the biography of the author and keenly observed how his creativity -better say his critical creativity- came into being. I could observe in what circumstances, an individual was born and how he maintained that soul, that spirit of writing throughout his life career where he fought for individual's freedom from a powerful desire to encroach an
individuality. He was born and brought up in the middle family, he spent his juvenile period at the time of Nazis attack and lost his brother in one of the Nazi‟s camps. It was a period of transition, it was a period of demand to change the social structure, the national political structures, structural or hierarchical thought processes through which the entire country had to pass. It was a period when freedom of an individual was locked with keys of frenzied power and desire to demolish humanitarian fraternity and global sense of humanitarian unity. At such time, at the very such time you can witness a situation when a sensitive individual turn into an author. So, an author sitting in a private chamber, or a closet write about the problems of global and international human and non-human societies. For example, Mahatma Gandhi, Rabindranath Tagore, Karl Marx, Sigmund Freud, Edward W. Said, Jacques Derrida and so on. When you name any of these authors you recall a wave of thinking, a particular way of thinking about shaping a society and giving a kind of system making it away say far away to an established system of the world. Conclusion
The discussion and analysis of the theorists and LC practitioners demonstrates that understanding the utility of literary theory and criticism in terms of professional career, one must understand the nature and function of literary theory and criticism. REFERENCES
1. Auden, W H. 2020. ―The Unknown Citizen.‖
Poet.Org. 2020. https://poets.org/poem/unknown-citizen.
2. Barthes, Roland. 1968. Writing Degree Zero. Translated by Annette Lavers and Colin Smith. USA: Beacon Press.
3. ———. 2007. Criticism and Truth. Edited and translated by Katrine Pilcher Keuneman. 1987. Impact. Continuum International Publishing Group.
4. Castle, Gregory. 2007. The Blackwell Guide to Literary Theory. Blackwell Publishing Ltd. Blackwell Publishing Ltd.
5. Childs, Peter, and Roger Fowler. 2006. The Routledge Dictionary of Literary Terms. NY. Routledge. https://doi.org/10.1292/jvms.57.911.
6. Deleuze, Gilles, Félix Guattari, and Robert Brinkley. 1983. ―What Is a Minor Literature?‖
Mississippi Review 11 (3): 13–33. 7. Devisch, Ignaas, and Stuart J Murray. 2009. ―‗
We Hold These Truths to Be Self-Evident ‘:
Deconstructing ‗ Evidence-Based ‘ Medical
Practice‖ 15: 950–54. https://doi.org/10.1111/j.1365-2753.2009.01232.x.
8. Eagleton, Terry. 2008. Literary Theory: An Introduction. The University of Minnesota USA. Anniversar. Minneapolis: The University of Minnesota. USA.

SJIF Impact Factor 2021: 8.013| ISI I.F.Value:1.241| Journal DOI: 10.36713/epra2016 ISSN: 2455-7838(Online)
EPRA International Journal of Research and Development (IJRD) Volume: 6 | Issue: 8 | August 2021 - Peer Reviewed Journal
2021 EPRA IJRD | Journal DOI: https://doi.org/10.36713/epra2016 | www.eprajournals.com |210 |
9. Edward Mendelson, ed. 1979. W H Auden: Selected Poems. New Editio. NY, USA: Vintage Book.
10. Eliot, TS. 1963. Collected Poems: 1909-1962. NY, USA: Harcourt, Brace & World, Inc.
11. Elkins, James. 2003. ―What Happened to Art
Criticism?,‖ 87. 12. Graver, Lawrence. 2004. Samuel Beckett:
Waiting for Godot. Cambridge UK, UK: Cambridge University Press.
13. Hall, Vernon, and Burton A. Waisbren. 1980. ―Syphilis as a Major Theme of James Joyce‘s
Ulysses.‖ Archives of Internal Medicine 140 (7): 963–65. https://doi.org/10.1001/archinte.1980.00040020963017.
14. Hegzi, Yasmine Sabry, and Noura Anwar Abdel-Fatah. 2018. ―Quantifying Students‘ Perception
for Deconstruction Architecture.‖ Ain Shams Engineering Journal 9 (4): 2745–54. https://doi.org/10.1016/j.asej.2017.09.006.
15. Köhring, Esther. 2015. Gilles Deleuze / Félix Guattari. Texte Zur Tiertheorie.
16. Mann, Thomas. 1947. Essays Of Three Decades. Translated by H.T. Lowe Porter. London: Secker & Warburg. https://ia801606.us.archive.org/27/items/in.ernet.dli.2015.46197/2015.46197.Essays-Of-Three-Decades.pdf.
17. O‘Halloran, Kieran. 2012. ―Electronic
Deconstruction: Revealing Tensions in the Cohesive Structure of Persuasion Texts.‖
International Journal of Corpus Linguistics 17 (1): 91–124. https://doi.org/10.1075/ijcl.17.1.04oha.
18. Pandit, R K, and Valiur Rahaman. 2019. ―Critical Pedagogy in Digital Era:
Understanding the Importance of Arts & Humanities for Sustainable IT Development.‖
SSRN Electronic Journal. https://doi.org/10.2139/ssrn.3387020.
19. Pound, Ezra. 1975. The Cantos of Ezra Pound. Soviet Studies in History. Revised. Vol. 26. London: Faber and Faber. https://doi.org/10.2753/rsh1061-1983260320.
20. Rahaman, Valiur. 2016. ―I Would like to Extend a Discussion for Patenting Investigations in Humanities (Esp. Research in Literature and Language). Can We Have Any Parameters to Assess the Concept of Patented Research? It Shall Revolutionize the Current Ways of Pursuing Research Esp. in Humanities and Languages.‖
https://doi.org/10.13140/RG.2.1.2810.2644. 21. ———. 2020a. ―Basic Modeling of ‗Cognitive
Sensors‘ Based on Literature Study of ‗Thick
Description‘ of Human Behavior.‖ In Advances in Modern Sensors, edited by GR Sinha, 1st ed., 2020. Institute of Physics Publishing. https://store.ioppublishing.org/page/detail/Advances-in-Modern-Sensors//?k=9780750327077.
22. ———. 2020b. ―Reading an Extremist Mind
through Literary Language.‖ In Cognitive
Informatics, Computer Modelling, and Cognitive Science. https://doi.org/10.1016/b978-0-12-819445-4.00010-2.
23. Rahaman, Valiur, Barkha Singh, and Manikrao Madhavrao Salunkhe. 2021. ―OBE Assessment
Tools for Mapping Learning Outcomes Identifying Slow Learners.‖ In .
https://doi.org/10.4018/978-1-7998-4784-7.ch005.
24. Sartre, Jean-Paul. 1988. ―What Is Literature‖
and and Other Essays. USA: Harvard University Press USA.
25. Shakespeare, Steven. 2013. ―The Word Became
Machine: Derrida‘s Technology of Incarnation.‖
Derrida Today 6 (1): 36–57. https://doi.org/10.3366/drt.2013.0051.
26. Singh, Rahul, Joseph P. Bennett, Mayank Gupta, Medha Sharma, Danish Eqbal, Anna M. Alessi, Adam A. Dowle, Simon J. McQueen-Mason, Neil C. Bruce, and Syed Shams Yazdani. 2019. ―Mining the Biomass Deconstructing
Capabilities of Rice Yellow Stem Borer Symbionts.‖ Biotechnology for Biofuels 12 (1): 1–19. https://doi.org/10.1186/s13068-019-1603-8.
27. Young, Robert, ed. 1981. Untying the Text: A Post-Structuralist Reader. First. Massachusetts, USA: Routledge &Kegan Paul Ltd. http://books.google.com/books?id=Kpg9AAAAIAAJ&printsec=frontcover&dq=intitle:Untying+the+text+A+post+structuralist+reader&hl=&cd=1&source=gbs_api.
SJIF Impact Factor 2021: 8.013| ISI I.F.Value:1.241| Journal DOI: 10.36713/epra2016 ISSN: 2455-7838(Online)
EPRA International Journal of Research and Development (IJRD) Volume: 6 | Issue: 8 | August 2021 - Peer Reviewed Journal
2021 EPRA IJRD | Journal DOI: https://doi.org/10.36713/epra2016 | www.eprajournals.com |211 |
PREPARATION AND IN VITRO CHARACTERIZATION OF SUSTAINED RELEASE TABLETS OF VALSARTAN
N.Sagar(18GN1S0311), Dr.Rama Krishna Mungi M.Pharm.Ph.D.*, Dr.K.Balaji M.Pharm.Ph.D.
*Asscoiate Professor, Department of Pharmaceutics, Avanthi Institute of Pharmaceutical
Sciences.Hyderabad.
**Principal and Professor, Avanthi Institute of Pharmaceutical Sciences, Hyderabad.
ABSTRACT The aim of present is to develop & evaluate extended release matrix tablet of Valsartan. Valsartan is an Hypotensive
agents. But owing to its shorter half life it needs frequent administration. In present study, an attempt has been made
to develop extended release matrix tablet of Valsartan there by reducing its frequency of administration & other dose
related side effects. Different types of Eudragit S 100, Sodium CMC and HPMC K4M were used as polymers. Total
12 formulations were prepared in trial batches. The formulation was evaluated for various pre compression & post
compression parameters. All the formulations showed compliance with the pharmacopoeial standards. On the basis of
evaluated parameters formulation V8 was considered to be the best one. Formulation V8 containing polymer Sodium
CMC showed 98.53 % invitro drug release profile. The release data for formulation V8 was fitted to various
mathematical models like zero order, first order, Krosmeyer Peppas & Higuchi model. It was observed that drug follows
Peppas release mechanism.
KEYWORDS: Valsartan, Extended release system.
INTRODUCTION
Valsartan is an angiotensin II receptor antagonist that is used for the treatment of hypertension. It treat the hypertension by blocking the vasoconstrictor and aldosterone secreting effect of angiotensin II selectively by blocking the binding of angiotensin II and angiotensin I receptor in many tissues. The most preferred route for this drug is oral delivery in form of tablets. Valsartan have poor water solubility, low bioavaibility (approximately 20-25%), and shorter half-life (nearly 6 h) (Abdelbary et al 2004). Oral drug delivery has been known for decades as the most widely utilized route of administration among all the routes that have been explored for the systemic delivery of drugs via various pharmaceutical products of different dosage forms. The reason that the oral route achieved such popularity may be in part attributed to its ease of administration as well as the traditional belief that by oral administration the drug is as well absorbed as the food stuffs that are ingested daily (Bandelin, 2008). The low bioavailability and short half-life of valsartan make the development of sustained-release forms desirable.
Sustained release system is a type of modified drug delivery system that can be used as an alternative to conventional drug delivery system (Armstrong and James, 1996). These systems sustain the release of drug and maintain the plasma drug concentration in therapeutic window except any fluctuation and increase the therapeutic efficacy of drug. They show their action by avoiding peak and trough in dosing and show constant plasma drug concentration in therapeutic window. Sustained release system have benefits like patient compliance and avoidance of multiple dosing, increased plasma drug concentration, avoidance of side effects and overcoming the problems associated with conventional system (Hingmire et al 2008). Among various approaches used for novel drug delivery

SJIF Impact Factor 2021: 8.013| ISI I.F.Value:1.241| Journal DOI: 10.36713/epra2016 ISSN: 2455-7838(Online)
EPRA International Journal of Research and Development (IJRD) Volume: 6 | Issue: 8 | August 2021 - Peer Reviewed Journal
2021 EPRA IJRD | Journal DOI: https://doi.org/10.36713/epra2016 | www.eprajournals.com |212 |
systems (Dahiya and Gupta, 2011; Tripathi et al 2011; Khan et al 2012; Mishra et al 2013; Verma et al 2014), matrix tablet is one of the most widely used and popular method. The goal of designing sustained or controlled release drug delivery systems of Valsartan matrix tablets is to reduce the frequency of dosing or to increase the effectiveness of the drug by localization at the site of action, reducing dose required, or providing controlled drug delivery.
EXPERIMENTAL Materials Valsartan (Val) was obtained as a gift sample from Torrent pharmaceuticals Private Limited,
Ahmedabad. HPMC K15M was purchased from S. Kant. Healthcare Limited, Vapi, Gujarat. Lactose was obtained from Qualigens Fine Chemicals, Mumbai. Magnesium stearate was procured from S. D.Fine Chemicals Limited, Mumbai andTalc was obtained from Nice ChemicalsPvt ChemicalsPvt. Limited, Cochin. Other chemicals used were of analytical reagent grade. Drug – Excipient compatibility studies Fourier Transform Infrared (FTIR) spectroscopy:
The compatibility between the pure drug and excipients was detected by FTIR spectra obtained on Bruker FTIR Germany(Alpha T).The solid powder sample directly place on yellow crystal which was made up of ZnSe. The spectra were recorded over the wave number of 4000 cm-1 to 400cm-1.
Methods Drug excipients interaction (Rowe et al 2006) Compatibility of the drug with excipients was determined by differential scanning calorimeter (Perkin Almer, USA). This study was carried out to detect any change on chemical constitution of the drug after combination with the excipients. The samples taken for DSC study were physical mixtures of Val : HPMC K15M (1 : 1). Analytical method development Determination of Wavelength 10mg of pure drug was dissolved in 10ml methanol (primary stock solution - 1000 µg/ml). From this primary stock solution 1 ml was pipette out into 10 ml volumetric flask and made it up to 10ml with the media (Secondary stock solution – 100µg/ml). From secondary stock solution again 1ml was taken it in to another volumetric flask and made it up to 10 ml with media (working solution - 10µg/ml). The working solution was taken for determining the wavelength. Determination of Calibration Curve 10mg of pure drug was dissolved in 10ml methanol (primary stock solution - 1000 µg/ml). From this primary stock solution 1 ml was pipette out into 10 ml volumetric flask and made it up to 10ml with the media (Secondary stock solution – 100µg/ml). From secondary stock solution required concentrations were prepared (shown in Table 8.1 and 8.2) and those concentrations absorbance were found out at required wavelength. Pre Formulation Parameters
The quality of tablet, once formulated by rule, is generally dictated by the quality of physicochemical properties of blends. There are many formulations and process variables involved in mixing and all these can affect the characteristics of blends produced. The various characteristics of blends tested as per Pharmacopoeia. Angle of Repose
The frictional force in a loose powder can be measured by the angle of repose. It is defined as, the maximum angle possible between the surface of the pile of the powder and the horizontal plane. If more powder is added to the pile, it slides down the sides of the pile until the mutual friction of the particles producing a surface angle, is in equilibrium with the gravitational force. The fixed funnel method was employed to measure the angle of repose. A funnel was secured with its tip at a given height (h), above a graph paper that is placed on a flat horizontal surface. The blend was carefully pored through the funnel until the apex of the conical pile just touches the tip of the funnel. The radius (r) of the base of the conical pile was measured. The angle of repose was calculated using the following formula:
Tan θ = h / r
Tan θ = Angle of repose h = Height of the cone ,

SJIF Impact Factor 2021: 8.013| ISI I.F.Value:1.241| Journal DOI: 10.36713/epra2016 ISSN: 2455-7838(Online)
EPRA International Journal of Research and Development (IJRD) Volume: 6 | Issue: 8 | August 2021 - Peer Reviewed Journal
2021 EPRA IJRD | Journal DOI: https://doi.org/10.36713/epra2016 | www.eprajournals.com |213 |
r = Radius of the cone base Bulk Density Density is defined as weight per unit volume. Bulk density, is defined as the mass of the powder divided by the bulk volume and is expressed as gm/cm3. The bulk density of a powder primarily depends on particle size distribution, particle shape and the tendency of particles to adhere together. Bulk density is very important in the size of containers needed for handling, shipping, and storage of raw material and blend. It is also important in size blending equipment. 10 gm powder blend was sieved and introduced into a dry 20 ml cylinder, without compacting. The powder was carefully leveled without compacting and the unsettled apparent volume, Vo, was read.
The bulk density was calculated using the formula: Bulk Density = M / Vo Where, M = weight of sample Vo = apparent volume of powder Tapped Density
After carrying out the procedure as given in the measurement of bulk density the cylinder containing the sample was tapped using a suitable mechanical tapped density tester that provides 100 drops per minute and this was repeated until difference between succeeding measurement is less than 2 % and then tapped volume, V measured, to the nearest graduated unit. The tapped density was calculated, in gm per L, using the formula:
Tap = M / V Where, Tap= Tapped Density M = Weight of sample V= Tapped volume of powder Measures of Powder Compressibility
The Compressibility Index (Carr’s Index) is a measure of the propensity of a powder to be compressed. It is determined from the bulk and tapped densities. In theory, the less compressible a material the more flowable it is. As such, it is measures of the relative importance of interparticulate interactions. In a free- flowing powder, such interactions are generally less significant, and the bulk and tapped densities will be closer in value.
For poorer flowing materials, there are frequently greater interparticle interactions, and a greater difference between the bulk and tapped densities will be observed. These differences are reflected in the Compressibility Index which is calculated using the following formulas:
Carr’s Index = [(tap - b) / tap] × 100 Where, b = Bulk Density Tap = Tapped D Formulation Development of Tablets
All the formulations were prepared by direct compression. The compositions of different formulations are given in Table 7.3.The tablets were prepared as per the procedure given below and aim is to prolong the release of Valsartan. Total weight of the tablet was considered as 200mg. Procedure
1) Valsartan and all other ingredients were individually passed through sieve no 60. 2) All the ingredients were mixed thoroughly by triturating up to 15 min. 3) The powder mixture was lubricated with talc. 4) The tablets were prepared by using direct compression method

SJIF Impact Factor 2021: 8.013| ISI I.F.Value:1.241| Journal DOI: 10.36713/epra2016 ISSN: 2455-7838(Online)
EPRA International Journal of Research and Development (IJRD) Volume: 6 | Issue: 8 | August 2021 - Peer Reviewed Journal
2021 EPRA IJRD | Journal DOI: https://doi.org/10.36713/epra2016 | www.eprajournals.com |214 |
Table 1 : Formulation composition for tablets INGREDIENTS
(MG) FORMULATIONS
V1 V2 V3 V4 V5 V6 V7 V8 V9 V10 V11 V12 Valsartan 40 40 40 40 40 40 40 40 40 40 40 40
Eudragit S 100 15 30 45 60 - - - - - - - - Sodium CMC - - - - 15 30 45 60 - - - - HPMC K4M - - - - - - - - 15 30 45 60
Aerosil 5 5 5 5 5 5 5 5 5 5 5 5 Magnesium Stearate 4 4 4 4 4 4 4 4 4 4 4 4
Lactose 136 121 106 91 136 121 106 91 136 121 106 91 Total Weight 200 200 200 200 200 200 200 200 200 200 200 200 All the quantities were in mg. Evaluation of Post Compression Parameters for Prepared Tablets
The designed formulation tablets were studied for their physicochemical properties like weight variation, hardness, thickness, friability and drug content. Weight Variation Test
To study the weight variation, twenty tablets were taken and their weight was determined individually and collectively on a digital weighing balance. The average weight of one tablet was determined from the collective weight. The weight variation test would be a satisfactory method of determining the drug content uniformity. Not more than two of the individual weights deviate from the average weight by more than the percentage shown in the following table and none deviate by more than twice the percentage. The mean and deviation were determined. The percent deviation was calculated using the following formula. % Deviation = (Individual weight – Average weight / Average weight ) × 100 Hardness
Hardness of tablet is defined as the force applied across the diameter of the tablet in order to break the tablet. The resistance of the tablet to chipping, abrasion or breakage under condition of storage transformation and handling before usage depends on its hardness. For each formulation, the hardness of three tablets was determined using Monsanto hardness tester and the average is calculated and presented with deviation. Thickness
Tablet thickness is an important characteristic in reproducing appearance. Tablet thickness is an important characteristic in reproducing appearance. Average thickness for core and coated tablets is calculated and presented with deviation. Friability It is measured of mechanical strength of tablets. Roche friabilator was used to determine the friability by following procedure. Pre weighed tablets were placed in the friabilator. The tablets were rotated at 25 rpm for 4 minutes (100 rotations). At the end of test, the tablets were re weighed, loss in the weight of tablet is the measure of friability and is expressed in percentage as
% Friability = [ ( W1-W2) / W] × 100 Where, W1 = Initial weight of three tablets W2 = Weight of the three tablets after testing Determination of Drug Content
Tablets were tested for their drug content. Ten tablets were finely powdered quantities of the powder equivalent to one tablet weight of drug were accurately weighed, transferred to a 100 ml volumetric flask containing 50 ml water and were allowed to stand to ensure complete solubility of the drug. The mixture was made up to volume with media. The solution was suitably diluted and the absorption was determined by UV –Visible spectrophotometer. The drug concentration was calculated from the calibration curve.
In vitro drug release studies Procedure

SJIF Impact Factor 2021: 8.013| ISI I.F.Value:1.241| Journal DOI: 10.36713/epra2016 ISSN: 2455-7838(Online)
EPRA International Journal of Research and Development (IJRD) Volume: 6 | Issue: 8 | August 2021 - Peer Reviewed Journal
2021 EPRA IJRD | Journal DOI: https://doi.org/10.36713/epra2016 | www.eprajournals.com |215 |
900ml 0f 0.1 HCl was placed in vessel and the USP apparatus –II (Paddle Method) was assembled. The medium was allowed to equilibrate to temp of 37°c + 0.5°c. Tablet was placed in the vessel and apparatus was operated for 2 hours and then the media 0.1 N HCl were removed and pH 6.8 phosphate buffer was added process was continued up to 12 hrs at 50 rpm. At definite time intervals withdrawn 5 ml of sample, filtered and again 5ml media was replaced. Suitable dilutions were done with media and analyzed by spectrophotometrically at required wavelength using UV-spectrophotometer. Application of Release Rate Kinetics to Dissolution Data:
Various models were tested for explaining the kinetics of drug release. To analyze the mechanism of the drug release rate kinetics of the dosage form, the obtained data were fitted into zero-order, first order, Higuchi, and Korsmeyer-Peppas release model. Zero Order Release Rate Kinetics
To study the zero–order release kinetics the release rate data ar e fitted to the following equation. F = Ko t
Where, ‘F’ is the drug release at time‘t’, and ‘Ko’ is the zero order release rate constant. The plot of % drug release versus time is linear. First order Release Rate Kinetics: The release rate data are fitted to the following equation Log (100-F) = kt A plot of log cumulative percent of drug remaining to be released vs. time is plotted then it gives first order release. Higuchi Release Model: To study the Higuchi release kinetics, the release rate data were fitted to the following equation.
F = k t1/2 Where, ‘k’ is the Higuchi constant. In higuchi model, a plot of % drug release versus square root of time is linear. Korsmeyer and Peppas Release Model
The mechanism of drug release was evaluated by plotting the log percentage of drug released versus log time according to Korsmeyer- Peppas equation. The exponent ‘n’ indicates the mechanism of drug release calculated through the slope of the straight Line.
Mt/ M∞ = K tn Where, Mt/ M∞ is fraction of drug released at time ‘t’, k represents a constant, and ‘n’ is the diffusional exponent, which characterizes the type of release mechanism during the dissolution process. For non-Fickian release, the value of n falls between 0.5 and 1.0; while in case of Fickian diffusion, n = 0.5; for zero-order release (case I I transport), n=1; and for supercase II transport, n > 1. In this model, a plot of log (Mt/ M∞) versus log (time) is linear. Hixson-Crowell Release Model
(100-Qt)1/3 = 1001/3
– KHC.t Where, k is the Hixson-Crowell rate constant.
Hixson-Crowell model describes the release of drugs from an insoluble matrix through mainly erosion. (Where there is a change in surface area and diameter of particles or tablets).

SJIF Impact Factor 2021: 8.013| ISI I.F.Value:1.241| Journal DOI: 10.36713/epra2016 ISSN: 2455-7838(Online)
EPRA International Journal of Research and Development (IJRD) Volume: 6 | Issue: 8 | August 2021 - Peer Reviewed Journal
2021 EPRA IJRD | Journal DOI: https://doi.org/10.36713/epra2016 | www.eprajournals.com |216 |
RESULTS & DISCUSSION The present study was aimed to developing sustained release tablets of Valsartan using various polymers.
All the formulations were evaluated for physicochemical properties and in vitro drug release studies. Pre Formulation Parameters of Powder Blend
Table 2 : Pre-formulation parameters of Core blend Formulation code Angle of repose
(Ө) Bulk density
(gm/cm3 Tapped
density(gm/cm3) Carr’s index (%) Hausner’s ratio
V1 26.06 0.721 0.910 20.77 1.22 V2 31.09 0.701 0.905 22.54 1.21 V3 30.07 0.694 0.852 18.54 1.05 V4 27.08 0.664 0.823 19.32 1.07 V5 32.15 0.652 0.807 19.21 0.98 V6 37.39 0.662 0.901 26.53 0.95 V7 31.47 0.667 0.907 26.46 0.99 V8 31.09 0.624 0.801 22.10 1.10 V9 28.12 0.648 0.862 24.82 0.91
V10 26.89 0.681 0.887 23.22 0.98 V11 25.9 0.651 0.817 20.32 1.13 V12 24.70 0.672 0.826 18.64 1.18
All the values represent n=3 Tablet powder blend was subjected to various pre-formulation parameters. The angle of repose values indicates that the powder blend has good flow properties. The bulk density of all the formulations was found to be in the range showing that the powder has good flow properties. The tapped density of all the formulations powders has good flow properties. The compressibility index of all the formulations was found to be below 26.53 which show that the powder has good flow properties. All the formulations has shown the hausner ratio below 1.22 indicating the powder has good flow properties. Quality Control Parameters For Tablets
Tablet quality control tests such as weight variation, hardness, and friability, thickness, and drug release studies in different media were performed on the compression tablet.
Table 3 : In vitro quality control parameters for tablets
V10 198.10 4.9 0.16 4.82 98.90 V11 198.40 5.0 0.52 4.47 97.19 V12 196.59 5.5 0.47 4.59 96.31
Formulation codes
Average Weight (mg)
Hardness(kg/cm2)
Friability (%loss)
Thickness (mm)
Drug content (%)
V1 198.56 4.1 0.48 4.25 98.65 V2 196.30 4.8 0.39 4.36 95.89 V3 198.32 4.9 0.50 4.12 96.33 V4 198.49 5.3 0.20 4.85 98.24 V5 197.69 4.0 0.42 4.20 96.39 V6 195.86 4.6 0.65 4.59 98.60 V7 200.05 5.4 0.51 4.75 97.41 V8 197.41 5.1 0.30 4.60 98.00 V9 196.74 4.2 0.24 4.39 97.15

SJIF Impact Factor 2021: 8.013| ISI I.F.Value:1.241| Journal DOI: 10.36713/epra2016 ISSN: 2455-7838(Online)
EPRA International Journal of Research and Development (IJRD) Volume: 6 | Issue: 8 | August 2021 - Peer Reviewed Journal
2021 EPRA IJRD | Journal DOI: https://doi.org/10.36713/epra2016 | www.eprajournals.com |217 |
Weight Variation Test Tablets of each batch were subjected to weight variation test, difference in weight and percent deviation
was calculated for each tablet. The average weight of the tablet is approximately in range of 195.86 to 200.05 mg, so the permissible limit is ±7.5% (>200 mg). The results of the test showed that, the tablet weights were within the pharmacopoeia limit. Hardness Test
Hardness of the three tablets of each batch was checked by using Pfizer hardness tester and the data’s were
shown in Table 8.4. The results showed that the hardness of the tablets is in range of 4.0 to 5.5 kg/cm2, which was within IP limits. Thickness
Thickness of three tablets of each batch was checked by using Micrometer and data shown in Table-8.4. The result showed that thickness of the tablet is raging from 4.12 to 4.85 mm. Friability Tablets of each batch were evaluated for percentage friability and the data were shown in the Table 8.4. The average friability of all the formulations was less than 1% as per official requirement of IP indicating a good mechanical resistance of tablets. Drug Content Drug content studies were performed for the prepared formulations. From the drug content studies it was concluded that all the formulations were showing the % drug content values within 95.89 - 98.90 %. All the parameters such as weight variation, friability, hardness, thickness and drug content were found to be within limits. In Vitro Drug release studies
Table 4: Dissolution data of Valsartan tablets
TIME (HRS)
% DRUG RELEASE
V1 V2 V3 V4 V5 V6 V7 V8 V9 V10 V11 V12 0 0 0 0 0 0 0 0 0 0 0 0 0
0.5 15.85 12.67 11.37 08.90 12.86 10.72 11.57 09.67 9.12 14.61 13.72 11.71 1 20.34 17.50 15.23 12.34 15.21 17.97 13.20 17.29 15.26 21.16 19.93 17.24 2 24.61 27.92 24.69 18.46 25.62 21.35 23.76 23.72 28.10 29.47 26.40 30.63 3 29.72 36.11 30.74 23.20 30.16 26.07 31.83 30.48 39.28 34.15 31.96 36.42 4 36.51 40.76 36.15 29.86 34.86 30.26 36.65 36.89 45.19 42.74 39.12 45.90 5 42.30 47.35 43.72 38.10 46.39 37.21 43.43 54.31 58.93 49.81 43.80 48.74 6 47.80 51.89 48.23 43.86 50.12 42.63 50.78 60.14 62.16 58.27 47.10 55.45 7 56.10 56.34 54.17 48.54 53.76 50.47 56.68 66.72 72.10 69.10 50.62 60.27 8 63.71 67.21 60.78 53.65 57.35 55.52 60.10 72.43 87.93 76.43 56.34 67.10 9 70.49 72.24 65.12 59.83 65.18 61.11 68.82 78.92 96.99 82.91 60.15 75.72 10 78.35 76.97 71.59 67.31 70.56 67.23 70.19 81.21 89.19 73.27 83.16 11 83.26 81.70 75.10 72.79 77.80 73.10 86.09 85.78 95.87 83.92 89.47 12 97.42 88.14 80.91 78.19 82.17 89.40 93.14 98.53 90.20 94.18
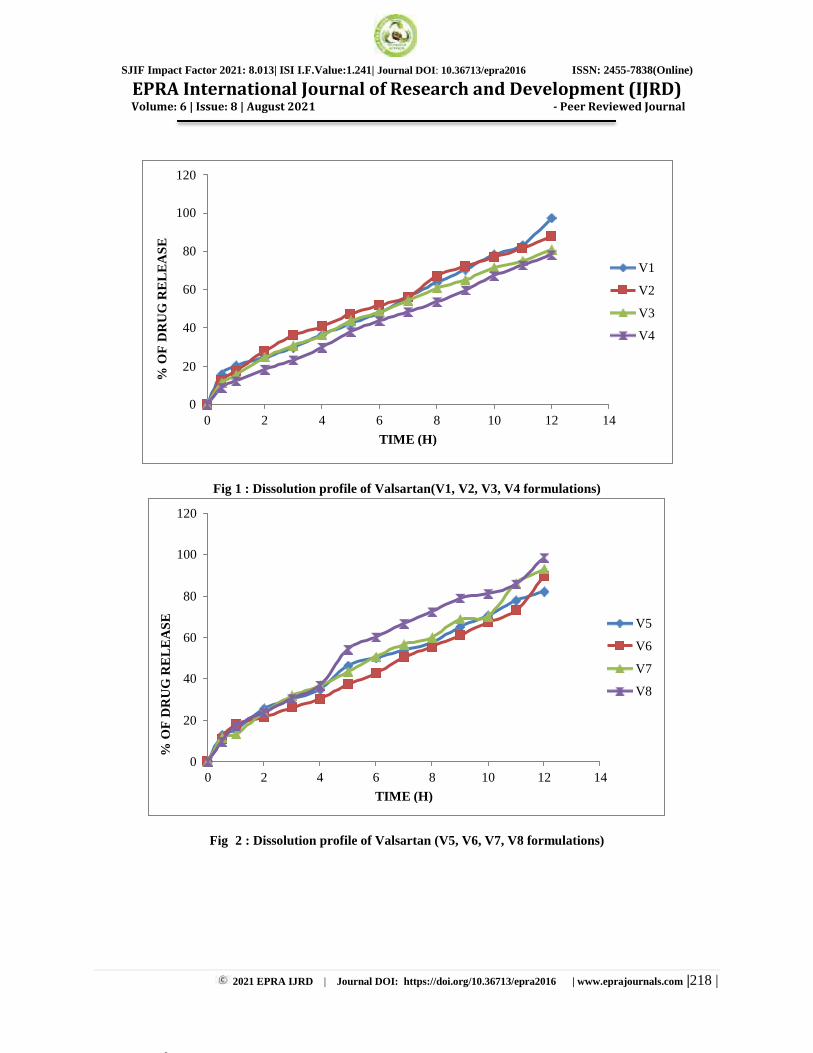
SJIF Impact Factor 2021: 8.013| ISI I.F.Value:1.241| Journal DOI: 10.36713/epra2016 ISSN: 2455-7838(Online)
EPRA International Journal of Research and Development (IJRD) Volume: 6 | Issue: 8 | August 2021 - Peer Reviewed Journal
2021 EPRA IJRD | Journal DOI: https://doi.org/10.36713/epra2016 | www.eprajournals.com |218 |
Fig 1 : Dissolution profile of Valsartan(V1, V2, V3, V4 formulations)
Fig 2 : Dissolution profile of Valsartan (V5, V6, V7, V8 formulations)
120
100
80
60
40
V1
V2
V3
V4
20
0
0 2 4 6 8 10 12 14
TIME (H)
% O
F D
RU
G R
EL
EA
SE
120
100
80
60
40
V5
V6
V7
V8
20
0 0 2 4 6 8 10 12 14
TIME (H)
% O
F D
RU
G R
EL
EA
SE
% O
F D
RU
G R
EL
EA
SE

SJIF Impact Factor 2021: 8.013| ISI I.F.Value:1.241| Journal DOI: 10.36713/epra2016 ISSN: 2455-7838(Online)
EPRA International Journal of Research and Development (IJRD) Volume: 6 | Issue: 8 | August 2021 - Peer Reviewed Journal
2021 EPRA IJRD | Journal DOI: https://doi.org/10.36713/epra2016 | www.eprajournals.com |219 |
Fig 3 : Dissolution profile of Valsartan(V9, V10, V11, V12 formulations) From the dissolution data it was evident that the formulations prepared with Eudragit S 100 as polymer were retard the good drug release up to desired time period i.e., 12 hours.
Formulations prepared with Sodium CMC retarded the drug release in the concentration of 60 mg (V8 Formulation) showed required release pattern i.e., retarded the drug release up to 12 hours and showed maximum of 98.53% in 12 hours with good retardation.
Formulations prepared with HPMC K4M retarded the drug release in the concentration of 60 mg (V12 Formulation) showed required release pattern i.e., retarded the drug release up to 12 hours and showed maximum of 94.18 % in 12 hours with good retardation. Finally Concluded that V8 formulation was considered as optimized formulation. It was evident that the formulation V8 was followed Peppas release mechanism.
120
100
80
60
40
V9
V10
V11
V12
20
0 0 2 4 6 8 10 12 14
TIME (H)

SJIF Impact Factor 2021: 8.013| ISI I.F.Value:1.241| Journal DOI: 10.36713/epra2016 ISSN: 2455-7838(Online)
EPRA International Journal of Research and Development (IJRD) Volume: 6 | Issue: 8 | August 2021 - Peer Reviewed Journal
2021 EPRA IJRD | Journal DOI: https://doi.org/10.36713/epra2016 | www.eprajournals.com |220 |
Table 5 : Release Kinetics
Cumulative (%)
Release Q
Time ( T )
Root (T)
Log( %) Release
Log ( T )
Log (%) Remain
Release Rate (Cumulative % Release /
T)
1/Cum% Release
Peppas
Log Q/100
% Drug Remaining
Q01/3
Qt1/3
Q01/3- Qt1/3
0 0 0 2.000 100 4.642 4.642 0.000
9.67 0.5 0.707
0.985
- 0.301
1.956
19.340
0.1034
-1.015
90.33
4.642
4.487
0.155
17.29 1 1.000 1.238 0.000 1.918 17.290 0.0578 -0.762 82.71 4.642 4.357 0.285
23.72 2 1.414 1.375 0.301 1.882 11.860 0.0422 -0.625 76.28 4.642 4.241 0.401
30.48 3 1.732 1.484 0.477 1.842 10.160 0.0328 -0.516 69.52 4.642 4.112 0.530
36.89 4 2.000 1.567 0.602 1.800 9.223 0.0271 -0.433 63.11 4.642 3.981 0.660
54.31 5 2.236 1.735 0.699 1.660 10.862 0.0184 -0.265 45.69 4.642 3.575 1.067
60.14 6 2.449 1.779 0.778 1.601 10.023 0.0166 -0.221 39.86 4.642 3.416 1.226
66.72 7 2.646 1.824 0.845 1.522 9.531 0.0150 -0.176 33.28 4.642 3.217 1.425
72.43 8 2.828 1.860 0.903 1.440 9.054 0.0138 -0.140 27.57 4.642 3.021 1.621
78.92 9 3.000 1.897 0.954 1.324 8.769 0.0127 -0.103 21.08 4.642 2.762 1.879
81.21 10 3.162 1.910 1.000 1.274 8.121 0.0123 -0.090 18.79 4.642 2.659 1.983
85.78 11 3.317 1.933 1.041 1.153 7.798 0.0117 -0.067 14.22 4.642 2.423 2.219
98.53 12 3.464 1.994 1.079 0.167 8.211 0.0101 -0.006 1.47 4.642 1.137 3.505
Drug – Excipient Compatability Studies
Figure 4 : FT-TR Spectrum of Valsartan pure drug.

SJIF Impact Factor 2021: 8.013| ISI I.F.Value:1.241| Journal DOI: 10.36713/epra2016 ISSN: 2455-7838(Online)
EPRA International Journal of Research and Development (IJRD) Volume: 6 | Issue: 8 | August 2021 - Peer Reviewed Journal
2021 EPRA IJRD | Journal DOI: https://doi.org/10.36713/epra2016 | www.eprajournals.com |221 |
Figure 4 : FT-IR Spectrum of Optimised Formulation
From the above studies it was found that there was no shifting in the major peaks which indicated that
there were no significant interactions occurred between the Valsartan and excipients used in the preparation of different Valsartan Sustained release formulations. Therefore the drug and excipients are compatible to form stable formulations under study. The FTIR spectra of Valsartan and physical mixture used for optimized formulation were obtained and these are depicted in above figures. From the FTIR data it was evident that the drug and excipients doses not have any interactions. Hence they were compatible. CONCLUSION Valsartan extended release matrix tablets were successfully prepared by using various polymers to retard the release and achieve the retard dissolution profile. Drug & polymer were found to be compatible as indicated by FTIR studies. From the observations it was concluded that polymers used in different concentrations differ in their ability to extend the drug release. Further it was concluded that polymer Sodium CMC showed better extended release property than Eudragit S 100 & HPMC K4M used in formulation of extended release matrix tablet. It was found that drug release from the matrix tablets was increased with increase in drug polymer ratio. It may be concluded from the present study that slow & controlled release of Valsartan over a period of 12hrs was obtained from formulation V8 using polymer Sodium CMC. The drug release kinetics revealed Peppas release model. Formulation & evaluation of extended release tablet of Valsartan was found to be satisfactory. On the basis of various evaluated parameters formulation V9 was considered to be the best one. REFERENCES
1. Hirani JJ, Rathod D, Vadalia K. Orally Disintegrating Tablets: A Review. Tropical Journal of Pharmaceutical Research. 2009;8(2):161-72.
2. Dobetti L. Fast-melting tablets: Developments and technologies. Pharmaceutical Technology Europe. 2000;12(9):32-42.
3. Chauhan V, Kumar. K, Teotia. D. Fast dissolving tablets: a promising approach for drug delivery Universal Journal of Pharmaceutical Research. 2017;2(4):51-7.

SJIF Impact Factor 2021: 8.013| ISI I.F.Value:1.241| Journal DOI: 10.36713/epra2016 ISSN: 2455-7838(Online)
EPRA International Journal of Research and Development (IJRD) Volume: 6 | Issue: 8 | August 2021 - Peer Reviewed Journal
2021 EPRA IJRD | Journal DOI: https://doi.org/10.36713/epra2016 | www.eprajournals.com |222 |
4. Rahane R, Rachh P. A review on fast dissolving tablet Journal of Drug Delivery & Therapeutics. 2018;8(5):50-5. 5. Mehnaz Ali, Fabiha Faizah Ali, Rita NA, Bhuiyan MA. Comparative in vitro evaluation of some commercial brands of
valsartan tablets marketed in Bangladesh. The Pharma Innovation Journal. 2018;7(4):1068-72. 6. Saydam M, Takka S. Bioavailability file: valsartan. Fabad Journal of Pharmaceutical Sciences. 2007;32(4):185-96. 7. Amidon G, Lennernäs H, Shah V, Crison J. A theoretical basis for a biopharmaceutic drug classification: the correlation
of in vitro drug product dissolution and in vivo bioavailability. Pharmaceutical research. 1995;12(3):413-20. 8. Wu C-Y, Benet L. Predicting drug disposition via application of BCS: transport/absorption/elimination interplay and
development of a biopharmaceutics drug disposition classification system. Pharmaceutical research. 2005;22(1):11-23.
9. Addanki Gopikrishna, B. Ramu, G. Srikanth, Dr. Bigala Rajkamal (2016). Formulation of isoniazide sustained release formulation by using carbopol 934 P P. Int J App Pharm Sci Res. 1(2):60- 69. Doi: 10.21477/ijapsr.v1i2.10177.
10. B. Ramu, Kaushal K. Chandrul, P. Shanmuga Pandiyan. Using 24 Factorial Designs optimization of Repaglinide Gastroretentive Drug Delivery System. Research J. Pharm. and Tech. 2021; 14(2):725-729. doi: 10.5958/0974-360X.2021.00126.8
11. B Ramu, N. Ramakrishna, Meruva Sathish, D. Anoosha (2015). Formulation of tellmisartan Hcl Fast Disintegrating Tablets by Sublimation Technique. International Journal of Pharm Tech Research. 8(3), 330-339.
12. Mbah C. Solubilization of valsartan by aqueous glycerol, polyethylene glycol and micellar solutions. Die Pharmazie-An International Journal of Pharmaceutical Sciences. 2006;61(4):322-4.
13. Ramu S, Kumar YA, Rao DS, Ramakrishna G. Formulation and Evaluation of Valsartan Oral Dispersible Tablets by Direct Compression Method. American Journal of Advanced Drug Delivery. 2014;2(6):719-33.
14. Corveleyn S, Remon J. Formulation and production of rapidly disintegrating tablets by lyophilisation using hydrochlorothiazide as a model drug. International Journal of Pharmaceutics. 1997;152(2):215-25.

SJIF Impact Factor 2021: 8.013| ISI I.F.Value:1.241| Journal DOI: 10.36713/epra2016 ISSN: 2455-7838(Online)
EPRA International Journal of Research and Development (IJRD) Volume: 6 | Issue: 8 | August 2021 - Peer Reviewed Journal
2021 EPRA IJRD | Journal DOI: https://doi.org/10.36713/epra2016 | www.eprajournals.com |223 |
SOIL STABILIZATION OF THE SOIL BY USING
DIFFERENT WASTE MATERIALS – A REVIEW
Tanna Manohar1, Jyoti Prakash Giri2 1PG Student, Department of Civil Engineering, GMR Institute of Technology, Rajam, AP, 532127.
2Assistant Professor, Department of Civil Engineering, GMR Institute of Technology, Rajam, AP, 532127.
Article DOI: https://doi.org/10.36713/epra8334 DOI No: 10.36713/epra8334
ABSTRACT
Soils that expand and contract unexpectedly are often described in terms of their permeability and poor load
transfer mechanism. As a result of these qualities, the rate of failure mechanisms such as excessive settlement and
subgrade failures attains at a very rapid pace, and the expansive soils are defined as more sensitive than other
types of soil. Constructions based on this sort of soil are therefore challenging for an Engineer to complete. Growing
population has led to an uncontrolled increase in plastic waste creation, and the disposal of the plastic waste has
become a significant issue for all countries. As a result, road construction industry has shown a great deal of
interest in utilising this waste and researchers have attempted to produce plastic wastes in soil stabilization as a
strengthening agent. The focus of this study is to identify ways to make use of plastic wastes in geotechnical
applications on a large scale.
KEYWORDS: Soil stabilization, Plastic waste, Unconfined compressive strength, Static tensile strength
INTRODUCTION The world has seen a huge growth in the population in the last few decades due to the population rising the needs of the people are increasing. These are the days where plastics have been became part in our day to day activities.to meet the demands of the people the plastic generation should be high.as the plastic is the nonbiodegradable material the disposal of waste plastic is problem. According to central pollution control board around 3.3 million metric tons of waste plastic produced in India in the year of 2018-2019.The disposal of enormous amount of plastic is difficult. So researches had been done to use the waste plastic in the fields of civil engineering. One of the civil engineering field that the plastic is used in is stabilization of soil. In India majority of the soil is not suitable for the construction. The majority of soil is expansive and cohesion less soil. These two types of soil exhibits low engineering properties. For construction of any building or the roads on these soils all the times it is not possible. So stabilization need to be done to improve the properties of these soils and make it utilize . Utilization of the waste plastic in the soil stabilization can be helpful in increasing the
engineering properties of soil. Various plastic materials that are used for the stabilizing the soil is
Polyethylene Terephthalate (PETE) High-Density Polyethylene (HDPE) Low density polyethylene (LDPE) Polyvinyl Chloride (PVC - U) Polypropylene (PP) Polystyrene or Styrofoam (PS) Poly acrylic.
The above materials are made into fibres with maintaining aspect ratio and they are added into the soil by maintaining an proportion. With the addition of the waste plastic to the soil the disposal problems can be reduced up to certain extent. In this study the utilization of various types of plastic materials in different types of soils had been studied. LITERATURE REVIEW (Choudhary, 2018, November.) stated that the addition of the LDPE increases the CBR value.CBR values for the unsoaked increases by increasing the strip content and reaches highest at a strip content of 1% and aspect ratio of 1 and after that it decreases by increasing strip content. Similar case is observed in the soaked CBR. In this the plastic is taken in three aspect ratios

SJIF Impact Factor 2021: 8.013| ISI I.F.Value:1.241| Journal DOI: 10.36713/epra2016 ISSN: 2455-7838(Online)
EPRA International Journal of Research and Development (IJRD) Volume: 6 | Issue: 8 | August 2021 - Peer Reviewed Journal
2021 EPRA IJRD | Journal DOI: https://doi.org/10.36713/epra2016 | www.eprajournals.com |224 |
maintaining width 10mm and varying the lengths 10mm,20mm,30mm and they were added in the percentages of 0.5,1,2%. It is observed that with the addition of waste LDPE of 1% with aspect ratio 1 the thickness of the layer decreases by 20.91%. (Panda, 2020) in this they examined the effect of using waste polyethylene terephthalate (PETE) strips in the expansive soil. In this the soil is collected from the Attabira, Bargarh District of Odisha. The soil was classified as CH (high plastic clay) as per Classification (IS:1498-1970) In this they performed tests of CBR for obtaining the efficient percentages of PETE strips at which maximum strength is obtained. In this investigation, the ideal estimations of CBR tests were gotten at the adding of 4% of PETE strips. By this study it was concluded that the soil stabilized with PETE strips has good CBR value. (Abukhettala, 2021) in this they examined the effect of using the LDPE, HDPE, PET and PP in the soil. The HDPE pellets and PET plastic used in this research are cylindrical in shape, with diameters across 3.65 mm and 4.45 mm and thicknesses across 2.70 mm and 1.65 mm respectively. The pellets had a round shape and are 3.3 mm in dia, while the flakes were triangular, between 7 mm x 8.8 mm in diameter and 0.7 mm in thickness. In this they conducted the tests of UCS, CBR, permeability and resilient modulus. The percentage of plastic added to the soil is 1%,2%,3%,4%,5% and 10%. They found that due to the addition of 2%,4% and 10% PP and HDPE pellets permeability of the soil increases. But due to the addition of the plastic the there is no significant change in the resilient modulus when mixed with plastic and the friction of the reinforced soil decreases when mixed plastic. (Shah, 2020) in this he investigated the use of waste plastic in the form of geocell and geo grid. The soil is classified as SM silty sand. By cutting the plastic containers of width 1.5cm the geo grids are made in the size of 1.5cm×3cm. The round neck of the plastic bottle is used for making geocell. These geogrids and geo cells are placed individually at a depth of 2.5cm ,5cm,7.5cm in the CBR mould and the CBR tests are done. It is observed that the CBR results for the virgin soil is 4% and for the soil reinforced with the geo rids at depth of 2.5cm 5cm 7.5cm are 4.5,10.5,4.5% and for the geo cell are 6.5,11,14% respectively. By the investigation it is observed that the waste geocell grid placed at a depth of 5 cm from the top of the CBR is effective. When the waste plastic geo cell is placed at a depth of 7.5 cm the load carrying capacity of the soil is more when compared with the geo grid. By the study it was concluded that the plastic made in the form of geo cell and geo grid can be used as the reinforcing material.
(Mishra, 2018) investigated the use of PET fibres in combination of fly ash. The soil is classified as CL according to the USCS classification. The PET added in the percentage of 0.4%,0.8%,1.2%,1.6% and fly ash added in combination percentage of 5%,10%,15%,20% .CBR, ITS and the shear tests are done to determine the strength parameters. The value of CBR at 1.2%PET fiber+15%fly ash is found effective. Here by increasing the PET fibre percent mixed with fly ash the shear strength of reinforced soil increases with the adding of 1.2% PET fibres and fly ash 15%. The shear strength of reinforced soil develop 1.45 times of shear strength of the un-reinforced soil. The cohesion and the angle of internal friction increases with an increment in PET fibre content in blend with fly ash. By the study it is found that PET along with the combination of fly ash can be used in the stabilization of the weak soils as well as in the development of the sub grade. (Yadav, 2019) had examined the use of polypropylene and polyethylene in the clayey soil. The soil is observed as CL according to USCS classification. The PP and PET fibres were added in the percentages of 1,2,3,4 individually to the soil with length 1cm,2cm. Various test are done to determine soil properties. The tests that performed are the standard compaction test, unconfined compressive strength test, California Bearing Ratio test, and resilient modulus increase. For the UCS soil mixed with PP and PE fibre of length 2cm and proportion 1% is effective. With the increase in the fibre content the resilient modulus increases. The CBR value increases gradually with the addition of the fibre content but it is optimum at 4% of fibre content and of length 2cm.Hence by the study it is observed that the PP and PE fibres can be utilise in the development of the weak sub grades. (Bekhiti, 2019) examined the effect of using the scrap tire with the cement in the expansive soil. The soil is classified as CH according to USCS. In this research, three different rubber fibre ratios 0,0.5,1,2% and four different cement ratios 0,5,7.5,10% by weight of soil, are used. The tests were conducted to know the shear strength. In this by the addition of the rubber content the shear strength of the soil increases and the ductility index of the soil increases and it is observed that 2% of the fibre content is effective.by the research it is found that the scrap tires can be effectively used in the soil stabilization. (Kumar, 2020) had investigated the usage of e-waste in the cohesion less soil. Here the plastic of e-waste is added in the percentage of 3%,6%,9%. The shear strength characteristics are determined by conducting direct shear test, UCS. By the addition of e-waste the unconfined compressive strength increases by 56% when compared with the soil mix without the e-waste.

SJIF Impact Factor 2021: 8.013| ISI I.F.Value:1.241| Journal DOI: 10.36713/epra2016 ISSN: 2455-7838(Online)
EPRA International Journal of Research and Development (IJRD) Volume: 6 | Issue: 8 | August 2021 - Peer Reviewed Journal
2021 EPRA IJRD | Journal DOI: https://doi.org/10.36713/epra2016 | www.eprajournals.com |225 |
In the direct shear test the value increase by 60% with the addition of the e-waste. (Fauzi, 2013) had examined the effect of using HDPE and glass content in the clayey soil. The HDPE added in the percentage of 4%,8%,12% to the weight of the soil. Atterberg limit tests were carried out to determine the properties of soil. With addition of HDPE and glass content the properties like plastic limit liquid limit and plastic limit increases. The CBR value rises with the increase in the content of HDPE and glass content. (Yadav, 2019) investigated the use of the rubber fibres and cement in the clayey soil. The rubber fibres and rubber granules are added in the percentages of 2.5%,5%,7.5%,10% and cement added in the percentage of 3%,6% and then the rubber (2.5,5,7.5,10) and cement (3,6) are combined and added to soil. The modified compaction, consolidation, UCS, STS tests are conducted to evaluate the various parameters of soil. wetting and drying tests are conducted to determine the durability of the soil mixed with the cement and the rubber fibre. It is observed that addition of the rubber fibre increases the compression index. The clay soil mixed with 6% of cement and carrying 0% and 2.5% rubber fibre full fills the rule of 20% weight loss in the durability tests. (Tiwari, 2020) studied the effect of using the polypropylene with the silica fume. The polypropylene fibre added in the proportion of 0%, 0.25%, 0.50%, 1% and silica fume added in the proportion of 2%, 4%, and 8% have been added to the dry weight of the soil. the SF and PP are added individually with the percentages mentioned above and after SF and PP are combinedly added to the soil. The soil is classified as high plastic clay (CH). (Kumar, 2020)The CBR value of the soil increases with addition of SF and PP but the maximum increase is observed at addition 8%SF+0.25%PP at this proportion the CBR values increase by 107.89%.the free swell index and liquid limit value decrease by adding of SF and PP. (Abdelsalam, 2019)investigated the usage of HDPE bits in the cohesion less soil. Direct shear test, one-dimensional consolidation test were conducted to determine the shear strength and consolidation characteristics of the soil. The HDPE bits are added in the percentage of 0%,5%,10% and 15%. The c and Ø values of the soil mixed with the HDPE bits increases from 26 kPa and 37° to 45 kPa and 46°, respectively as the HDPE content increased from 0 to15 percent. The compressibility and coefficient of permeability of soil increases by adding 5% of HDPE bits. (Peddaiah, 2018)This research covers the study of the influence of plastic bottle strips on silty sand, for
which a number of compaction, direct shear, and California bearing ratio tests have been performed on it.Experiments have been carried out with adding plastic in the percentages of 0.2,0.4,0.6 and 0.8 and plastic strips maintained length of (15mm ˣ15mm) (15mm ˣ25mm) (15mm ˣ35mm). With plastic reinforcement in soil, there is a substantial increase in maximum dry unit weight, Shear Strength Parameters, and CBR value, among other things. The CBR values for the soil increases from 3.3 to 7.1 for 0.2% plastic and 3.3 to 16.5 for 0.4% plastic The amount of improvement in soil characteristics that occurs is dependent on the kind of soil, the amount of plastic in the soil, and the size of the strip. Improvements in engineering characteristics of silty sand are found in the research when plastic content is 0.4 percent and strip size 15mm ˣ15mm.Hence by the study it is found that the waste plastic can be used in the pavement sub grades and the geo technical applications. CONCLUSIONS
By the literature study it is found that, due to inertness to chemical and physical reactions waste plastic such as LDPE, HDPE, PE, PP may be utilised in varied weather situations. They are readily available and inexpensive; therefore, they are an excellent choice for soil stabilisation. By the researches it is observed that, the addition of the plastic helps in improving the properties of the soil make the soil suitable for road construction. Addition to this maintaining the strip length and the proportions it is found the shear strength values and the California bearing ratio values increases in the performance point of view in long term implementation.
REFERENCES 1. Abdelsalam, Z. A. (2019). Reinforcing Some
Kuwaiti Soils with Shredded High-density Polyethylene (HDPE) Bits. . Environmental & Engineering Geoscience, 25(3),, pp.213-221.
2. Abukhettala, M. a. ( 2021). Geotechnical characterization of plastic waste materials in pavement subgrade applications. Transportation Geotechnics, 27, p.100472.
3. Bekhiti, M. T. (2019). 1. Influence of waste tire rubber fibers on swelling behavior, unconfined compressive strength and ductility of cement stabilized bentonite clay soil. Construction and Building Materials, 208,, pp.304-313.
4. Choudhary, A. D. (2018, November.). Improvement of Properties of Clay Subgrade Using Waste LDPE Strip Reinforcement. . In International Conference on Sustainable Waste Management through Design, (pp. pp. 103-115). Springer, Cham.
5. Fauzi, A. N. (2013). Experimental study on subgrade stabilization of kuantan clay soil using

SJIF Impact Factor 2021: 8.013| ISI I.F.Value:1.241| Journal DOI: 10.36713/epra2016 ISSN: 2455-7838(Online)
EPRA International Journal of Research and Development (IJRD) Volume: 6 | Issue: 8 | August 2021 - Peer Reviewed Journal
2021 EPRA IJRD | Journal DOI: https://doi.org/10.36713/epra2016 | www.eprajournals.com |226 |
HDPE mixed with lime. In Proceeding of the 14th REEEA Conference, . Kuala Lumpur, Malaysia.
6. Kumar, J. a. (2020). Experimental analysis of soil stabilization using e-waste. Materials Today: Proceedings, 22,, pp.456-459.
7. Mishra, B. a. (2018). 1. Use of randomly oriented polyethylene terephthalate (PET) fiber in combination with fly ash in subgrade of flexible pavement.,. Construction and Building Materials , 190, pp.95-107.
8. Panda, R. a. ( 2020). Improvement in Engineering Behaviour of Expansive Soil Reinforced with Randomly Distributed Waste Plastic Strips. Springer Singapore., pp. 239-248.
9. Peddaiah, S. B. (2018). Experimental study on effect of waste plastic bottle strips in soil
improvement. . Geotechnical and Geological Engineering, 36(5), pp.2907-2920.
10. Shah, A. a. (2020). Improving the Soil Subgrade with Plastic Waste Reinforcement—An Experimental Study. Springer, Singapore, pp. 153-161.
11. Tiwari, N. a. (2020). An experimental study on the behavior of lime and silica fume treated coir geotextile reinforced expansive soil subgrade. . Engineering Science and Technology, an International Journal, 23(5),, pp.1214-1222.
12. Yadav, J. H. (2019). Geotechnical properties of rubber reinforced cemented clayey soil. Transportation Infrastructure Geotechnology, 6(4),, pp.337-354.

SJIF Impact Factor 2021: 8.013| ISI I.F.Value:1.241| Journal DOI: 10.36713/epra2016 ISSN: 2455-7838(Online)
EPRA International Journal of Research and Development (IJRD) Volume: 6 | Issue: 8 | August 2021 - Peer Reviewed Journal
2021 EPRA IJRD | Journal DOI: https://doi.org/10.36713/epra2016 | www.eprajournals.com |227 |
THE IMPACT OF CONCEPT MAPPING AS A TEACHING STRATEGY ON THE STUDENTS’ ACHIEVEMENT AND
INTEREST IN ENGLISH
Mr. Rommel P. Manzon English Lecturer, International Maritime College of Oman (IMCO), Sohar, Oman
Article DOI: https://doi.org/10.36713/epra8348 DOI No: 10.36713/epra8348
ABSTRACT The purpose of this study is to determine the impact of concept mapping as a teaching strategy on the students’
achievement and interest in English. It is a quasi-experimental design of non- equivalent pre-test post-test control
group is used. Stratified random sampling technique is adapted in selecting the 250 students from the different schools
in the Philippines. Two research instruments is developed by the researchers and used for data collection are: Students’
English Achievement Test (STAT) and Students’ Interest Inventory (SII). Mean and Standard Deviation are used
to answer the three research questions, while three hypotheses are tested at 0.05 error margins using the t-test analysis.
The result of the findings showed that there is significant difference in the mean achievement scores and interest rating
of students are exposed to concept mapping strategy in English. There is a significant impact on the gender of the
respondents on achievement of students that are exposed to concept mapping strategy. The researchers recommended
among other things: the integration of concept mapping strategy in the curriculum, adequate training of English
teachers on the use of concept mapping strategy.
KEYWORDS: concept mapping; achievement; interest; gender; teaching strategy; and interest in English
INTRODUCTION
Today, English is the fundamental base in the task of nations’ capacity building in science and technology. Therefore, any short coming in this subject constitute draw back to the achievement of our nations’ science and technology objectives.
According to Adetola (2012) noted that science and technology have become dominant cultural factor, and any nation that is not alive to this fact is either dead or dying; hence, English is the cogwheel that moves these science and technology world over.
Tremendous efforts have been made by many English educators towards improving the teaching and learning of English. In spite of these efforts, Anyagh and Ok’wu (2010) revealed that English Education is
still in a deplorable state at all levels of the educational system. This low achievement in English has been attributed to non-utilization of appropriate instructional strategies.
In trying to find a solution to this ugly situation of low achievements, some researchers have identified teaching techniques employed by the teachers as some of the contributory factors (Anyagh and Ok’wu, 2010 in Yarima2014). This is because no matter how suitable the educational objectives and content seem to be, the curriculum process remained defective if viable instructional strategies are not employed in teaching and learning process.
English is an important aspect of education whose application cut across all branches of English Language. Unfortunately, most questions in English are poorly attempted by students especially in external examination (Nworgu, 2003).
In the words of Obodo (2004) defined interest as the state of curiosity and important factor in learning English. It is any activity that drives or motivates the individual for action. The researcher observed that interest is a very strong factor in the teaching and

SJIF Impact Factor 2021: 8.013| ISI I.F.Value:1.241| Journal DOI: 10.36713/epra2016 ISSN: 2455-7838(Online)
EPRA International Journal of Research and Development (IJRD) Volume: 6 | Issue: 8 | August 2021 - Peer Reviewed Journal
2021 EPRA IJRD | Journal DOI: https://doi.org/10.36713/epra2016 | www.eprajournals.com |228 |
learning of English. He further noted that degree and direction of attitude towards English are largely determined by the kind of interest developed by learners for English.
Furthermore, Novak (2008) defined concept mapping technique as a schematic device for representing a set of concept meanings embedded in a frame work of prepositions. Odili (2006) also defined concept mapping as an excellent device that visually represents the historical relationship among concepts within a subject. According to Imoko (2005), concept mapping could be perceived as a process that enables one or group layout ideas on a topic or discipline in picture or map-form. There is a parading shift from the conventional way of passive learning where the teacher dominates in the teaching and learning process to an approach that reduces the teacher to a mentor or guide.
Concept mapping strategy leverages on the abundant rich resources (objects and materials) found in our learning environment used as schematic device for representing a set of concept meanings (Butcher, 2011). The lesson could be planned into activity-based around the available learning resources which begins with a problem that engages learners into active thinking and discussion.
Effective teaching requires a thorough understanding of the learning process, characteristics of students at different stages of development, individual differences and factors that influence motivation, interest and retention which all translate to improved achievement.
It is in the light of the foregoing that the present study is set to explore the efficacy of concept mapping strategy in English in a typical students in a classroom setting. STATEMENT OF THE PROBLEM
The present day teaching and learning of mathematics is far from being satisfactory. This is evident in the persistent poor achievement of the students’ external and internal examinations.
It is in view of this that the problem of this study sought to determine the extent to which concept mapping influences achievement and interest of students in English, how does concept mapping solve the problem of gender differences in achievement in English? PURPOSE OF THE STUDY The purpose of this study is to investigate students taught English using concept mapping approach would achieve higher in what they learn. In specific terms, the
study shall: 1. Examine the extent to which concept mapping approach will influence achievement of students in English. 2. Find out the effect of concept mapping strategy on students ‘interest in English’ 3. Determine the difference in mean achievement scores between male and female students that are taught in English using concept mapping strategy. RESEARCH QUESTIONS The following research questions have been raised to guide the study: 1. What are the mean achievement scores of students taught in English using concept mapping strategy and those taught using conventional method? 2. What is the mean interest rating of students taught in English using concept mapping strategy and those taught English using conventional method? 3. What are the mean achievement scores of male and female students taught in English using concept mapping strategy? RESEARCH HYPOTHESES Three hypotheses were formulated and tested at 5% level of significance. 1. There is no significant difference in the mean achievement scores of students taught in English using concept mapping strategy and those taught using conventional method. 2. There is no significant difference in the mean interest rating of students taught in English using concept mapping strategy and those taught using conventional method. 3. There is no significant difference in the mean achievement scores of male and female students taught in English using concept mapping strategy. METHODOLOGY DESIGN
The design of the study was the quasi experimental design of non- randomized control group pre-test and post-test. Non-randomized design is adopted since it is not possible for the researchers to randomly sample and assign subjects.
The intact classes in the chosen schools are randomly assigned to experimental and control groups. The gender of the respondents also computed in this study.

SJIF Impact Factor 2021: 8.013| ISI I.F.Value:1.241| Journal DOI: 10.36713/epra2016 ISSN: 2455-7838(Online)
EPRA International Journal of Research and Development (IJRD) Volume: 6 | Issue: 8 | August 2021 - Peer Reviewed Journal
2021 EPRA IJRD | Journal DOI: https://doi.org/10.36713/epra2016 | www.eprajournals.com |229 |
POPULATION AND SAMPLE OF THE STUDY
The sample size of the study comprised of 250 randomly selected out of the population of 4,456 student in the study area. A stratified random sampling technique is adopted to draw the sample size from the population of the study. In this technique, the researchers grouped all the schools into two strata (single sex and co-education schools) and selection is done at random until co- education schools are chosen. Simple random sampling technique is finally used to draw the sample size. INSTRUMENT FOR DATA COLLECTION
The instruments used for data collection are students’ English achievement test (STAT) and students’ interest inventory (SII) constructed by the
researchers. The STAT and SII are divided into two categories each, category one is the pre-STAT and pre-SII which consisted of 20 test items each, while category two is the post-STAT and post-SII which also consisted of 20 test items each.
The instruments are validated by two experts,
one from measurement and evaluation and the other from English education, experts from state college of education in the Philippines. The instruments are also subjected to psychometric analysis using Richard Kuderson formula 21 and split half method. Reliability coefficients of 0.91 and 0.80 are obtained respectively. This indicated that the instruments are reliable and appropriate for the study.
Two teaching strategies are employed in line with the focus of the study. The subjects are exposed to concept mapping strategy and conventional method respectively. At the end of the four weeks of experiment, the students’ English achievements test
(STAT) and students’ interest inventory (SII) were administered. Analysis of t-test inferential statistic is used.
RESULTS Problem 1: What are the mean achievement scores of students taught in English using concept mapping strategy and those taught using conventional method?
Table 1: Mean achievement scores of students taught in English using concept mapping strategy and conventional method.
Teaching Approach No. of Students Mean Scores Pre-Post
SD Mean Gain
Concept Mapping 90 50.71 63.53
7.83 12.82
Conventional 90 46.16 57.49
10.85 11.33
Mean Difference 4.55 6.04 1.49 Total 180
Results in Table 1 shows that both the
experimental and control groups improved in their mean achievement scores after the treatment, however, students in the experimental group gained by mean achievement difference of 12.82,while those in control group gained by 11.33 which is lower compared to the experimental group. The difference in mean achievement of the two groups was 6.04 in favor of the
experimental group. Problem 2: What is the difference in the mean interest rating of student taught in English using concept mapping strategy and those taught using conventional method?

SJIF Impact Factor 2021: 8.013| ISI I.F.Value:1.241| Journal DOI: 10.36713/epra2016 ISSN: 2455-7838(Online)
EPRA International Journal of Research and Development (IJRD) Volume: 6 | Issue: 8 | August 2021 - Peer Reviewed Journal
2021 EPRA IJRD | Journal DOI: https://doi.org/10.36713/epra2016 | www.eprajournals.com |230 |
Table 2: Mean interest rating of students taught English using concept mapping strategy and those taught using conventional method.
Teaching Approach No. of Students Mean Scores Pre-Post
SD Mean Gain
Concept Mapping 90 43.63 52.29
8.24 8.66
Conventional 90 43.49 50.04
9.36 6.55
Mean Difference 0.14 2.25 2.11 Total 180
The results in table 2 showed that both the
experimental and control groups improved in their mean interest rating after the treatment, however , students in the experimental group gained by mean difference of 8.66 while those in control group gained by 6.55 which is lower compared to the experimental group. The overall mean gain in the mean interest rating of the two groups was
2.11 in favor of those taught using concept mapping strategy. Problem 3: What is the influence of gender on the achievement scores of students taught in English using concept mapping strategy?
Table 3: Mean achievement scores of male and female students taught in English using concept mapping strategy.
Teaching Approach No. of Students Mean Scores Pre-Post
SD Mean Gain
Concept Mapping 90 50.37 61.91
7.31 11.54
Conventional 90 51.07 65.23
7.81 14.16
Mean Difference 0.7 3.32 2.26 Total 180
Table 3 shows that both male and female
students improved in their achievement after the treatment, however, male students gained by mean achievement difference of 11.54 while that of female was 14.16 which are higher compared to the male group. The difference in mean achievement of the two groups was 3.32 in favour of the female group.
HYPOTHESES The three hypotheses formulated for this study were tested using t-test inferential statistic at 0.05 error margin. Hypothesis 1: There is no significant difference in the mean achievement scores of students taught in English using concept mapping strategy and those taught using conventional method.
Table 4: T-test results of students’ mean achievement scores taught in English using concept mapping strategy and conventional method.
Teaching Approach N X S.D. Significant
Df t-cal t-critical
CPMS 90 63.53 7.85 CVM 90 57.49 10.85 0.05 178 4.32 1.645

SJIF Impact Factor 2021: 8.013| ISI I.F.Value:1.241| Journal DOI: 10.36713/epra2016 ISSN: 2455-7838(Online)
EPRA International Journal of Research and Development (IJRD) Volume: 6 | Issue: 8 | August 2021 - Peer Reviewed Journal
2021 EPRA IJRD | Journal DOI: https://doi.org/10.36713/epra2016 | www.eprajournals.com |231 |
From table 4, the calculated t-value is 4.32 at 178 degree of freedom, while t-critical is 1.645. Since the calculated t-value of 4.32 exceeds the t-critical value of 1.645 at 5% level of significance, the hypothesis is rejected.
This means there is significant difference in the mean achievement scores of students taught in English using concept mapping strategy and those taught using
conventional method. Hypothesis 2: There is no significant difference in the mean interest rating of students taught in English using concept mapping strategy and those taught using conventional method.
Table 5: t-test result of students’
, mean interest rating of students taught trigonometry using concept mapping strategy and those taught using conventional method.
Teaching Approach
N X S.D. Significant Df t-cal t-critical
CPMS 90 52.29 8.24 CVM 90 50.04 9.36 0.05 178 1.71 1.645
From table 5, the calculated t-value is 1.71 at
178 degree of freedom, while t-critical is 1.654.It is observed from the table that t-calculated is greater than the t-critical at 5% level of significance.
Therefore, the hypothesis is rejected. This implies that a significant difference exist in the mean interest rating of students taught in English using
concept mapping and conventional method. Hypothesis 3: There is no significant difference in the mean achievement scores of male and female students taught in English using concept mapping strategy.
Table 6. T-test result of male and female students mean achievement scores taught in English using concept mapping strategy.
Teaching Approach
N X S.D. Significant Df t-cal t-critical
CPMS 90 61.91 7.31 CVM 90 65.23 7.81 0.05 88 2.08 1.658
From table 6, the calculated t-value is 2.08 at 88
degree of freedom, while t-critical is 1.658 which is less than the t-calculated at 5% level of significance.
Therefore, the hypothesis is rejected. This means there is significant difference in the mean achievement scores of male and female students taught in English using concept mapping. DISCUSSION OF FINDINGS
One of the major findings of this work is that students taught English using concept mapping strategy achieved higher than those who are taught using conventional method. These findings corroborate with that of Ezeudu (2005) who conducted a research to determine the use of concept mapping approach on students’ achievement, interest and retention in organic chemistry found that the use of concept mapping approach helps increase students’ achievement and developed high interest than the conventional method.
This finding also agrees with that of Esiobo and Soyibo (2005) who conducted a study to verify the efficiency of concept mapping in Ecology and genetics among eight grade students. The result showed that concept map used as advanced organizer resulted in a positive significant difference in achievement between the subjects taught using concept and Vee-mapping and those taught using the conventional approach in favour of those who used the concept and vee-mapping strategies. The similarity in this finding further strengthens the fact that the use of concept mapping strategy can enhance student’s achievement in trigonometry.
The study also found that there was significant difference in the mean interest rating of students taught using concept mapping strategy than those taught using conventional method. This study agreed with that of Imoko (2005) who found that students who are exposed to concept mapping technique exhibited greater interest

SJIF Impact Factor 2021: 8.013| ISI I.F.Value:1.241| Journal DOI: 10.36713/epra2016 ISSN: 2455-7838(Online)
EPRA International Journal of Research and Development (IJRD) Volume: 6 | Issue: 8 | August 2021 - Peer Reviewed Journal
2021 EPRA IJRD | Journal DOI: https://doi.org/10.36713/epra2016 | www.eprajournals.com |232 |
in English content than those who are not. It is also found that there is significant
difference in the mean achievement scores of male and female students taught using concept mapping strategy. This finding is slightly similar to that of Agwagah (2003) who conducted an experimental study to determine the effect of concept mapping strategy on male and female student’s achievement in Algebra in Philippines. The result reveals that male students performed significantly better than their female counterparts in Algebra achievement test (AAT) using concept mapping method.
While this study indicates that male students performed better than their female counterparts, the current study shows that the female students performed better than their male counterparts. This indicates that the approach could be gender sensitive in enhancing female’s achievement in mathematics which has always been the general outcry. However, this result is not in agreement with the findings of Imoko and Agwagah (2005) whose findings showed no sex difference among male and female students who are exposed to computer games learning approach. Also the study disagree with the findings of Achor, Imoko and Ajai (2010) who found that male and female learners taught using games and simulations did not differ significantly in their achievement. CONCLUSION
Based on these findings, the result provided empirical evidence that concept mapping strategy enhances and promote students’ achievement in English much better than the use of conventional method. The use of concept mapping strategy has shown that backwardness in English performance among the female folk could be reduced if appropriate method is used in mathematics class-room. RECOMMENDATION Based on the findings of the study, the following recommendations are proffered: 1. Concept mapping should be incorporated in the curriculum as a strategy used in teaching in English classroom. 2. Teacher training institutions should include the concept mapping strategy in English method course content. This will ensure that teachers are adequately trained on how to use the strategy. 3. Federal and state ministries of education, professional bodies, such as the English Teaching Association, should organized workshops/seminars on the use of concept mapping strategy so as to sensitize English teachers on the benefits derived from using
concept mapping strategy. REFERENCES
1. Achor, E.E; Imoko, B I. & Ajai J. T. (2010).Sex differentials in students’ achievement and interest in geometry using games and simulation techniques. Neealihey Faculty of education. Journal of science and mathematics, 4(1),1-10.
2. Adetula, L.O, (2002).A new teaching methodology by National Mathematical Centre, Abuja. Unpublished paper presented during an MIP workshop for mathematics teachers, Educational Research centre, Jos.
3. Agwagah, U.N.V. (2003).Instruction in mathematics reading as factor in students’
achievement in algebra. Journal of Nigeria education Association,15(1),148-159.
4. Butcher, N. (2011). A basic to open Educational Resources (OER).
5. Esiobo, G.O. & Sayibo,K. (202) .Impact of concept mapping and vee-mapping on the modes of class room interaction on students’ performance in genetics. Journal of educational research 33(2),113-120.
6. Ezeudu, F.O.(2005).The effect of concept mapping on students’ achievement, interest and retention in organic chemistry. Unpublished PhD thesis, University of Nigeria, Nsukka.
7. Imoko, B.I.(2005).Effect of concept mapping on students’ achievement in trigonometry: Implications for rural-urban Mathematics. Multidisciplinary Journal of research development, 3(1)47-55.
8. Novak,J.D.(2008).Meaningful learning:The essential factor for conceptual change in limited or appropriate propositional hierarchies (liphs) leading to empowerment of learners.Science education,86(4),548-571.
9. Nworgu,B.G.(2003).Educational measurement and evaluation:Theory and practice.Awka:Hallman publisher.
10. Obodo,G.C.(2004).Principle and practice 0f mathematics education in Nigeria.Enugu:Academic forum.
11. Odili,G.A.(2006) .Mathematics in Nigeria secondary schools:A teaching perspective.Port Harcourt and Lagos:Anachuna Educational Books.
12. Yarima,M.B.(2014).Effect of polya’s problem
solving strategy on secondary school student’s achievement and interest in trigonometry in Kaduna state.Unpublished master’s thesis,Benue state University,Makurdi.

SJIF Impact Factor 2021: 8.013| ISI I.F.Value:1.241| Journal DOI: 10.36713/epra2016 ISSN: 2455-7838(Online) EPRA International Journal of Research and Development (IJRD)
Volume: 6 | Issue: 8 | August 2021 - Peer Reviewed Journal
2021 EPRA IJRD | Journal DOI: https://doi.org/10.36713/epra2016 | www.eprajournals.com |233 |
INFLUENCES ON REACTION TIME AND AGILITY
RESPONSE TO SHADOW TRAINING AMONG FOOTBALL PLAYERS
D. Chochalingam
Teaching Fellow in Physical Education, University College of Engineering, Ramanathapuram, Tamilnadu, India.
ABSTRACT This study aimed to find out the influences on reaction time and agility response to shadow training among
football players. To achieve the purpose of the study thirty college level football players were selected from
University College of Engineering, Ramanathapuram. Their age ranged between 18-23 years. They were divided
into two equal groups consists of fifteen each. No attempt was made to equate the groups. Group I acted as
Experimental Group underwent Shadow training (ST) for the period of 8 weeks and Group II acted as control
group (CG), the subjects in control group was not engage in any training programme other than their regular
activity The agility was assessed by 4x10mts shuttle run test and Reaction Time was assessed by Penney Cup
Test. The data collected from the subjects was statistically analyzed with‘t’ ratio to find out significant
improvement if any at 0.05 level of confidence. The result of the agility and reaction time improved significantly
due to effect shadow training with the limitations of (diet, climate, life style ) status and previous training the
results of the current study coincide findings of the investigation done by completely different specialists within the
field of sports sciences. Shadow training significantly improved agility and reaction time of college level football
players.
KEYWORDS: Football, Agility and Reaction Time.
INTRODUCTION Football is the most pervasive games on the
planet. Football is portrayed as vivacious, high force, discontinuous, ball and physical games. The attributes of Football alongside the require practical exercises clearly puts extraordinary requests on the specialized and physical abilities of the individual players. The contemporary history of football traverses over 100 years. Everything started in 1863 in England, when rugby on their distinctive courses and the world's first football affiliation was established in England. The two types of football originated from a typical root and both have a long and complicatedly spread familial tree. Their initial history uncovers in any event about six unique amusements, fluctuating to various degrees and to which the chronicled improvement of football is connected and has really been followed back. Regardless of whether this can be legitimized in a few occasions is questionable. By and by, the reality remains that playing a ball with the feet has been continuing for a huge number of years and there is
positively no motivation to trust that it is a variation of the more "normal" type of playing a ball with the hands. In actuality, aside from the total need to utilize the legs and feet in with no laws for security, uncertainty perceived comfortable start that the specialty of controlling the ball with the feet is to a great degree troublesome and, thusly it is the most punctual type of the diversion for which there is logical proof was an activity of definitely this skilful method going back to the second and third hundreds of years B.C in China. A military manual dating from the time of the Han Dynasty incorporates among the physical training works out, the "Tsu' Chu". This comprised opening, measuring just 30- 40 cm in width, into a little net settled onto long bamboo sticks – an accomplishment which clearly requested awesome aptitude and brilliant procedure. A variety of this activity additionally existed, whereby the player is not allowed to go for his objective unrestricted, but rather needed to utilize his feet, chest, and back and bears while endeavouring to withstand the assaults of his adversaries. Utilization

SJIF Impact Factor 2021: 8.013| ISI I.F.Value:1.241| Journal DOI: 10.36713/epra2016 ISSN: 2455-7838(Online) EPRA International Journal of Research and Development (IJRD)
Volume: 6 | Issue: 8 | August 2021 - Peer Reviewed Journal
2021 EPRA IJRD | Journal DOI: https://doi.org/10.36713/epra2016 | www.eprajournals.com |234 |
of the hands is not allowed. The ball aestheticness of the present best players is in a way not exactly as new as a few people may expect. METHODS Experimental Approach to the Problem
To address the hypothesis presented herein, we selected thirty college level football players. Their age ranged between 18 and 23 years. The selected subjects were divided into two equal groups consisting of 15 each. No attempt was made to equate the groups. Experimental group I (n = 15) underwent shadow training for 6 weeks and group II (n = 15) acted as a control group (CG), the subjects in the control group were not engaged in any training programme other than their regular work.
Design The evaluated parameters were agility (4x10m
shuttle run) and reaction time (Penney Cup Test).The parameters were measured at baseline after 6 weeks of ST and the effects of the training were examined. Training Protocol
In each training session the training was imparted for a period 45 minutes. The Shadow practices, which included warming up and relaxation procedure after training programme for three days per week for a period of 8 weeks. Statistical Analysis The collected data were analyzed with application of‘t’ test to find out the individual effect from base line to post-test if any. 0.05 level of confidence was fixed to test the level of significance.
RESULTS Table-I
Relationship of Mean, SD and‘t’-Values of the Reaction Time between Pre & Post Test of the Shadow
Training and Control Groups of Football Players
*Significant at 0.05 level of confidence Table-I reveals that the mean values of per test
and post test of control group for reaction time were 5.79 and 5.77 respectively; the obtained t ratio was 1.52 respectively. The tabulated t value is 2.14 at 0.05 level of confidence for the degree of freedom 14. The calculated t ratio was lesser than the table value. It is found to be insignificant change in reaction time of the football players. The obtained mean and standard deviation values of pre test and
post test scores of shadow training group were 5.03 and 4.71 respectively; the obtained t ratio was 8.30. The required table value is 2.14 at 0.05 level of confidence for the degree of freedom 14. The obtained t ratio was greater than the table value. It is found to be significant changes in reaction time of the football players. The mean values on shadow training group and control group are graphically represented in figure-1.
Reaction Time
Groups Test Mean S.D ‘t’ Values
Control Group Pre Test 5.79 1.17
1.52 Post Test 5.77 1.20
Shadow Training Group
Pre Test 5.03 0.75 8.30*
Post Test 4.71 0.75

SJIF Impact Factor 2021: 8.013| ISI I.F.Value:1.241| Journal DOI: 10.36713/epra2016 ISSN: 2455-7838(Online) EPRA International Journal of Research and Development (IJRD)
Volume: 6 | Issue: 8 | August 2021 - Peer Reviewed Journal
2021 EPRA IJRD | Journal DOI: https://doi.org/10.36713/epra2016 | www.eprajournals.com |235 |
Figure-1: Bar Diagram Showing the Pre Test & Post Test On
Reaction Time of Control and Shadow Training Groups
Table-II
Relationship of Mean, SD and‘t’-Values of the Agility between Pre & Post Test of the Shadow Training and Control Groups of Football Players
*Significant at 0.05 level of confidence
Table-II reveals that the mean values of per test and post test of control group for agility were 12.08 and 12.07 respectively; the obtained t ratio was 0.11 respectively. The tabulated t value is 2.14 at 0.05 level of confidence for the degree of freedom 14. The calculated t ratio was lesser than the table value. It is found to be insignificant change in agility of the football players. The obtained mean and standard deviation values of pre test and post test
scores of shadow training group were 9.76 and 9.36 respectively; the obtained t ratio was 8.33. The required table value is 2.14 at 0.05 level of confidence for the degree of freedom 14. The obtained t ratio was greater than the table value. It is found to be significant changes in agility of the football players. The mean values on shadow training group and control group are graphically represented in figure-2.
Figure-2: Bar Diagram Showing the Pre Test & Post Test On
Agility of Control and Shadow Training Groups
0123456
Control Group Shadow TrainingGroup
5.79 5.3
5.77 4.71
Pre Test
Post Test
0
5
10
15
Control Group Shadow TrainingGroup
12.08 9.76
12.07 9.36
Pre Test
Post Test
Agility
Groups Test Mean S.D ‘t’ Values
Control Group Pre Test 12.08 1.14
0.11 Post Test 12.07 1.08
Shadow Training Group
Pre Test `9.76 0.71 8.33*
Post Test 9.36 0.67
SJIF Impact Factor 2021: 8.013| ISI I.F.Value:1.241| Journal DOI: 10.36713/epra2016 ISSN: 2455-7838(Online) EPRA International Journal of Research and Development (IJRD)
Volume: 6 | Issue: 8 | August 2021 - Peer Reviewed Journal
2021 EPRA IJRD | Journal DOI: https://doi.org/10.36713/epra2016 | www.eprajournals.com |236 |
DISCUSSION ON FINDING The shadow training is a incredible training
which has been found to be beneficial of the football players. To study the shadow training on reaction time and agility of college level football players, it was tested under to difference between shadow training group and control group. The shadow training includes on reaction time and agility. The shadow training is namely front run, backward run, side to side, cross run. It also improves the reaction time, agility and other than some physical fitness components are namely speed, speed endurance. The obtained result proved positively the shadow training group significantly improved. The result of the present study showed that the shadow training has significant improvement on reaction time and agility of football players. The results of the study are in line with the studies of J Nirendan et al., (2019), S Senthil Kumaran (2018) & Mehmet Fatih Yuksel, latif Aydos, (2017) the result of the study showed that the control group was not significantly improved on reaction time and agility of college level football players. CONCLUSIONS Based on the findings and within the limitation of the study it is noticed that practice of shadow training helped to improve reaction time and agility of football players at college level. It was also seen that there is progressive improvement in the selected criterion variables of shadow training group of football players after eight weeks of shadow training programme. Further, it also helps to improve reaction time and agility.
1. It was concluded that individualized impacts of shadow training group showed a statistically significant positive sign over the course of the treatment period on reaction time and agility of football players at college level.
2. It was concluded that individualized impacts of control group showed a statistically insignificant positive sign over the course of the period on reaction time and agility of football players at college level.
3. The results of comparative effects lead to conclude that shadow training group had better significant improvement on reaction time and agility of football players at college level as compared to their performance with control group.
REFERENCE
1. J Nirendan, Dr. K Murugavel. Effect of shadow training on motor fitness components of badminton players, International Journal of Physiology, Sports and Physical Education. 2019; 1(2): 04-06.
2. K Ooraniyan, S Senthil Kumar. Effect of game specific aerobic training on motor fitness components among handball players, International Journal of Yoga, Physiotherapy and Physical Education. 2018; 3(4): 68-70.
3. S Senthil Kumaran. Impacts of plyometric training on selected physical fitness variables among basketball players, International Journal of Yoga, Physiotherapy and Physical Education. 2018; 3(4): 52-54.
4. Mehmet Fatih Yüksel, latif Aydos. The Effect of Shadow Badminton Trainings on Some the Motor Features of Badminton Players, Journal of Athletic Performance and Nutrition. E-ISSN: 2148-7488. 2017; 4(2):11-28.
5. Luiz de França Bahia Loureiro, Mário Oliveira Costa Dias, Felipe Couto Cremasco, Maicon Guimarães da Silva, Paulo Barbosa de Freitas. Assessment of Specificity of the Badcamp Agility Test for Badminton Players Journal of Human Kinetics. 2017; 57:191-198 DOI: 10.1515.
6. Lim Joe Heang, Wee Eng Hoe, Chan Kai Quin, Ler Hui Yin. Effect of plyometric training on the agility of students enrolled in required college badminton programme, International Journal of Applied Sports Sciences. 2012; 24(1):18-24.
7. Dimitris Chatzopoulos, Christos Galazoulas, Dimitrios Patikas and Christos Kotzamanidis (2014), Acute Effects of Static and Dynamic Stretching on Balance, Agility, Reaction Time and Movement Time Journals of sports science and Medicine. 2012; 13(2):403-409.
8. Dorothy Beise, Virginia Peaseley. The Relation of Reaction Time, Speed, and Agility of Big Muscle Groups to Certain Sport Skills Research Quarterly. American Physical Education Association. 2013; 8(1):133-142.