Embed Size (px)
Citation preview
EDITORIAL POLICY
Papers must be submitted with the understanding that they have not been published elsewhere (except in the form of an abstract or as part of a published lecture, review, or thesis) and are not currently under consideration by another journal published or any other publisher. The submitting (Corresponding) author is responsible for ensuring that the article’s publication has been approved by all the other coauthors. It is also the authors’ responsibility to ensure that the articles coming from a particular institution are submitted with the approval of the necessary institution. Only an acknowledgment from the editorial office officially establishes the date of receipt. It is a condition for submission of a paper that the authors permit editing of the paper for readability. All enquiries concerning the publication of accepted papers should be addressed to [email protected].
PEER REVIEWERS Dr. Rakesh Ranjan, Educational Management and Administration, MAEERs Vishwashanti Gurukul School, Solapur. Dr. Rakesh Kumar, Manger Examinations, Texila Educational and Management Services. Dr. T. Selvankumar, Professor and Head, Mahendra Arts & Science College.

ABOUT PLAGIARISM
Plagiarism is the use or close imitation of the language and ideas of another author and representation of them as one’s own original work. Duplicate publication, sometimes called self-plagiarism, occurs when an author reuses substantial parts of his or her own published work without providing the appropriate references. This can range from getting an identical paper published in multiple journals, where authors add small amounts of new data to a previous paper.
Plagiarism can be said to have clearly occurred when large chunks of text have been cut and pasted. Such manuscripts would not be considered for publication in TIJN Journal. But minor plagiarism without dishonest intent is relatively frequent, for example when an author reuses parts of an introduction from an earlier paper. The editors will judge any case of which they become aware (either by their own knowledge of and reading about the literature, or when alerted by referees) on its own merits.
The paper containing the plagiarism will be obviously returned back to the author’s for review, but we earnestly request the authors to avoid submitting plagiarized.

DISCLAIMER
Texila International Journal of Academic Research (TIAR) make every effort to ensure the accuracy of all the information (the “Content”) contained in its publications. However, the TIAR and its agents make no representations or warranties whatsoever as to the accuracy, completeness or suitability for any purpose of the Content and disclaim all such representations and warranties whether express or implied to the maximum extent permitted by law. Any views expressed in this publication are the views of the authors and are not necessarily the views of the Editor’s or Texila International Journal of Academic Research.
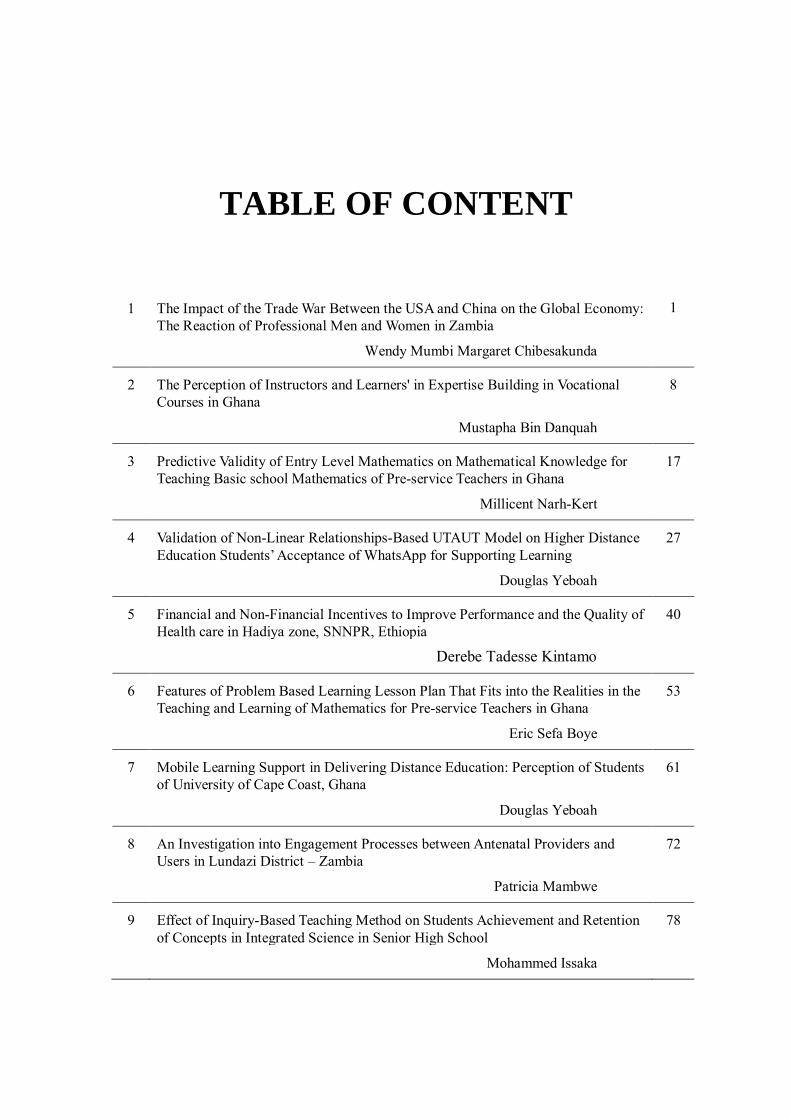
TABLE OF CONTENT
1 The Impact of the Trade War Between the USA and China on the Global Economy: The Reaction of Professional Men and Women in Zambia
1
Wendy Mumbi Margaret Chibesakunda
2 The Perception of Instructors and Learners' in Expertise Building in Vocational Courses in Ghana
8
Mustapha Bin Danquah
3 Predictive Validity of Entry Level Mathematics on Mathematical Knowledge for Teaching Basic school Mathematics of Pre-service Teachers in Ghana
17
Millicent Narh-Kert
4 Validation of Non-Linear Relationships-Based UTAUT Model on Higher Distance Education Students’ Acceptance of WhatsApp for Supporting Learning
27
Douglas Yeboah
5 Financial and Non-Financial Incentives to Improve Performance and the Quality of Health care in Hadiya zone, SNNPR, Ethiopia
40
Derebe Tadesse Kintamo
6 Features of Problem Based Learning Lesson Plan That Fits into the Realities in the Teaching and Learning of Mathematics for Pre-service Teachers in Ghana
53
Eric Sefa Boye
7 Mobile Learning Support in Delivering Distance Education: Perception of Students of University of Cape Coast, Ghana
61
Douglas Yeboah
8 An Investigation into Engagement Processes between Antenatal Providers and Users in Lundazi District – Zambia
72
Patricia Mambwe
9 Effect of Inquiry-Based Teaching Method on Students Achievement and Retention of Concepts in Integrated Science in Senior High School
78
Mohammed Issaka
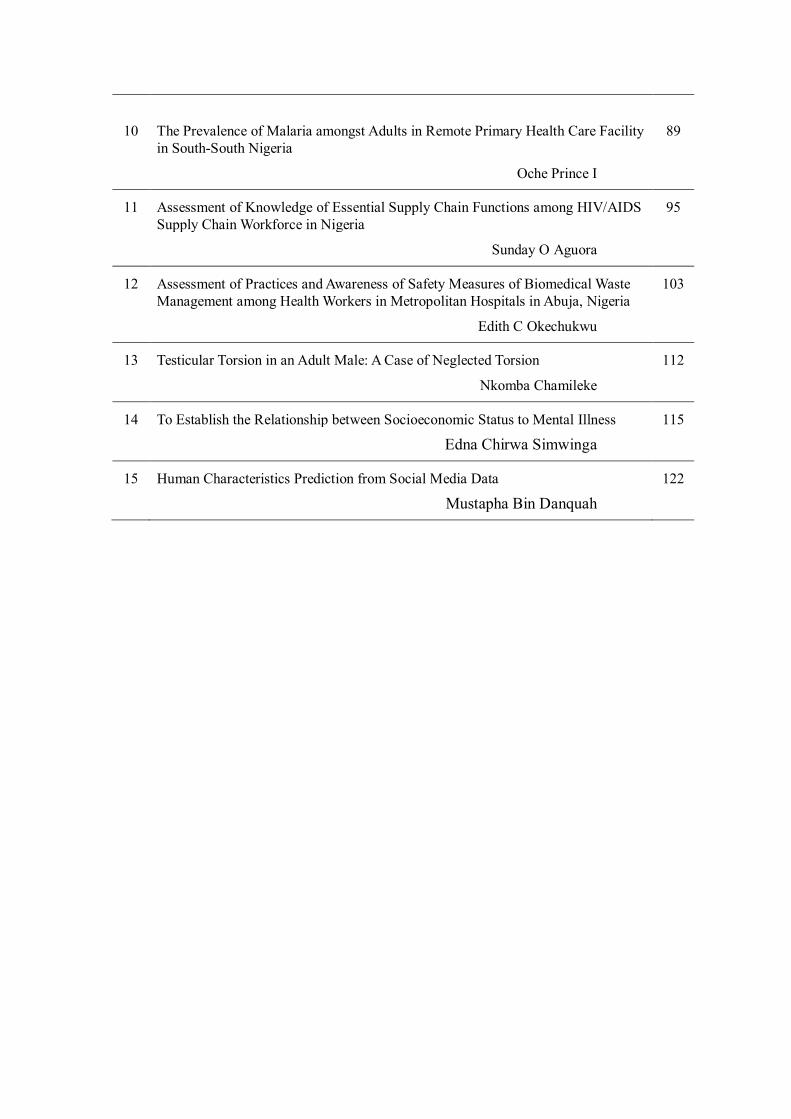
10 The Prevalence of Malaria amongst Adults in Remote Primary Health Care Facility in South-South Nigeria
89
Oche Prince I
11 Assessment of Knowledge of Essential Supply Chain Functions among HIV/AIDS Supply Chain Workforce in Nigeria
95
Sunday O Aguora
12 Assessment of Practices and Awareness of Safety Measures of Biomedical Waste Management among Health Workers in Metropolitan Hospitals in Abuja, Nigeria
103
Edith C Okechukwu
13 Testicular Torsion in an Adult Male: A Case of Neglected Torsion 112 Nkomba Chamileke
14 To Establish the Relationship between Socioeconomic Status to Mental Illness 115 Edna Chirwa Simwinga
15 Human Characteristics Prediction from Social Media Data 122 Mustapha Bin Danquah
Texila International Journal of Academic research ISSN: 2520-3088
DOI: 10.21522/TIJAR.2014.07.02.Art001
The Impact of the Trade War Between the USA and China on the Global Economy: The Reaction of Professional Men and Women in Zambia
Wendy Mumbi Margaret Chibesakunda MBA, International Business Methods Student of Texila American University
E-mail: [email protected]
Abstract
The purpose is to investigate if gender affects knowledge of the International Trade War. The results
will show that if both men and women had knowledge in full, of the devastating effects of an
International Trade War, before it's escalation, any trade war would be withheld. If women fully
understood and participated in war issues, then the negotiations and agreements would be richer,
stronger, subtler and firmly rooted especially in developing countries. The Author used the Chi Method
to understand how knowledgeable are the Professional Men and Women in Zambia on The
International Trade War and the data will show the knowledge imbalance. The Article confirms that
more needs to be done with the dissemination of information and participation of women because the
lack of knowledge and participation does not bring positive results according to the findings in research
which is briefly referred to in the Literature Review. Sadly, it appears that the gender gap will always
exist.
Keywords: International Trade War, Global economy, Gender, Tariffs.
Background The Trade War between China and the USA
started in July 2018 when President Donald Trump of the USA after months of threats, decided to impose tariffs on China for unfair trade practices. After the imposition of tariffs and failure to negotiate, the USA slapped China with US $550 Billion worth of Chinese products and China has set tariffs on US $185 Billion worth of USA products. China and the USA are currently in a Phase One Deal to adjust and cut the tariffs from the USA and increase China's purchase of products from the USA.
The specific objective of this study is to evaluate the level of awareness in the Professional field of both men and women in Zambia with regard to the International Trade War, which so far has had a devastating effect on the global economy. Presupposing that there was a gender balance in awareness, the study reveals that conflict resolution would be stable and deep rooted.
The Methodology used is primary through questionnaires and secondary, through available literature on the International Trade War. The data was subjected to multi variate analysis to
find if any relationship existed and the Chi Method was used.
This information is useful for the Professional Men and Women in Zambia because the global economy is not isolated from the Zambian situation in the sense that, the Professional women and men can disseminate information accurately and their participation can greatly improve Zambian lifestyles and coordination to the greater global economy.
Trade Wars protect national interests and provide advantages to domestic business and this greatly affects job creation and job security. The effect on men and women is always different and adjustments have to be made accordingly because the effects greatly affect, good production and consumption, education, health and general home management.
Introduction A trade war is an economic conflict from
extreme protectionism in which states raise or create tariffs or trade barriers against each other in response to the trade barriers created by the other party.
Trade is simply the exchange of goods and services between countries and that holds the global economy and whatever has an impact on
1
the global economy affects the price, demand and supply of both domestic and foreign goods/services and the policies across the globe.
As part of the Global Economy the Professional Men and Women in Zambia need to participate and try to show a greater interest in the trade war between China and the USA, disseminate the information and resolve issues before they become global disputes.
China has been in sub-Sahara Africa for decades and has been accused for the decline of industrial employment because of its ability to hold a powerful import and export policy that was launched in 1999 for global inclusion. China has had a great relationship with Africa in general and Zambia is no exception. The Trade War magnitude is not limited just to the USA, therefore, professional men and women in Zambia must take a great interest in the prevailing issues.
Literature review International Trade has many advantages like
comparative advantage, economies of scale, competition, transfer of technology and job creation.
Every economy wants to be globally connected to grow with technology and interconnectivity so that through various growth strategies they uphold competition on the foreign market, create jobs and meet demands for products and services at reasonable prices for the best quality recognised globally.
According to the War Street Journal, the escalating trade war between China and the USA has impacted the global economy very negatively, small businesses gave been badly affected in the USA and the industrial giants have not been spared in Asia and Europe in the export-oriented factories.
This has had dire consequences in Africa because most countries depend on aid and Foreign Direct Investment (FDI) from advanced nations and once aid and FDI reduce, this leads to an economic recession with fewer jobs and a loss in capital flow.
China has been described as the biggest partner of Africa and if China suffers, Africa suffers too and this conclusion is arrived at by the exports, imports and loans from China to Africa according to statistics. The South China Post reported in August 2019 that the African Economic Outlook of 2019 indicates that Africa
will be deeply hurt by the trade war through exports to China and Europe and there will be difficulties in the debt servicing of Africa and worst-case scenario China may dump its goods and services very cheaply on Africa.
According to the Press Reports of UNCTAD, UNCTAD warned both the USA and China that they both would be hurt and bilateral, unilateral and trilateral relations they have would decline because of higher prices and trade divisions. Both would lose out and the global economy would remain unstable.
If there is consensus, trade is beneficial to all, but imposing tariffs and threatening trade partners leads to loss of public support and all past achievements are rendered as nothing because everything is put at risk and in the end, there are no winners, but disruption of progress (Anahita Thoms 2019).
The more trade there is, the more an increase in the number of women contributions to the economy and the more benefits women reap in the global economy because their options increase with an adequate education. Cognitive Skills have also been identified as important investments in early childhood and throughout the school years to facilitate constant adjustments to new technology, change and employment and those that lack cognitive skills will always oppose (Worssman 2011).
The Significance of Knowledge of the Prevailing Trade War Between the USA and China
In the USA there are 7 times more women than men and in China for every 115 boys born, there are 100 girls, so men outnumber the women on a massive scale. In Zambia, there are 8 more women than men and for ease of comparison, the USA upholds the reality in Zambia. Women buy most products and services, raise their children and take care of other family members. The Trade War has affected most products and services (Cari Shane 2018). The UN Security Council Resolution 1325 adopted in 2000 protects women’s rights and women's integrity. Gender and women's rights go hand in hand. Knowledge of any war will categorize women as a homogenous social group to be either victim or perpetrators. Peace and Security designs categories to offer positive transformation. Men are always actors in negotiations, but the changed roles of women from conflict to peace, while
2
addressing gender perspectives for conflict resolution now call for the participation of women (Thea Waldron, Erin Baines 2019). For the purpose of peace building and peace-making, gender is a concept that embraces all for greater knowledge, participation and negotiations for richer, stronger, subtler and firmly rooted resolutions in societies Antonia Potter 2008).
As a result of the trade war, there is pressure on job creation and job security, wages, labour rights and the true assessment on the employment distribution, employment growth and the corresponding trade agreements whether bilateral, regional or multilateral. Special attention is paid to the labour market, employment policies and the result of trade liberalization. Income and Job Security are extremely important for the increase of standards, improvement of living conditions and they have a direct link on globalization, outsourcing and Job Creation. The gains have to be distributed well in developing countries like Zambia and thus, professional men and women have to be greatly interested. As an emerging economy, an interest has to be taken in competition and competition laws, especially with regard to the quality of the products made available on the market. China has already been accused by many, as holdings Africa as a dumping grounds for its cheaper and low-quality products. Although the negative perceptions are there, the growth effects of participation in a global economy have led to a lot of initiatives in the import and export of goods and services and any disruptions by a trade war has devastating effects. Political debates and analytical systems end up in a struggle because trade affects the quality and quantity of employment. The informal sector is also greatly affected because it has limited possibilities and if the formal sector has a great analytical system, then the informal sector cannot be greatly hampered by any trade war.
Objectives of the research The aim was to find out the level of awareness
in the Professional field and the extent of knowledge on the International Trade War between China and the USA and Zambia as a case study.
1. Evaluate the level of awareness and Knowledge of the trade war.
2. The application of the International Trade War to the Zambian situation.
3. To cite the main challenge.
The methodology used The Primary Data Collection was done
through questionnaires and the research questions that were asked were:
1. Do you know the genesis and content of the International Trade War?
2. Do you think joining the International Trade War is the best or worst option?
3. Would it be wise to pursue other regional agreements with other countries?
4. What is your view on Unilateral Liberalisation?
The Secondary Data Collection was done through Journals, Books and the Internet.
The study looked at both the primary data and secondary data that directly related to the International Trade War, other than that, a study was conducted on a population of Professional Men and Women in Zambia by limiting the sample to the ages between 35 to 65, not limited to any profession at all.
The individual reaction of countries towards the trade war
Join the war, this is considered as the worst options.
Do nothing, which is just as bad as joining it. Pursue regional trade agreements with
regions outside the warring countries and thus, divert trade.
Unilaterally liberalize on imports from the warring countries
The above findings are from the World Bank working papers on the usual responses to a trade war.
For the purpose of this paper, the final result sampling was done as follows:
Method: Simple Random Sampling.
Variable: Categorical.
Data: Contingency Table with an expected frequency count of about 4
Hypothesis
Null Hypothesis: Variable A does not help in predicting Variable B and the variables are independent, typically a comparison is between the p- value to the significant level.
Ho- Gender and Knowledge of the trade war are independent.
3
Alternative Hypothesis Ha- Gender and Knowledge of the trade war
are dependent. This is the Alternative Hypothesis which is
basically that, knowing the level of Variable A can help you predict the level of Variable B. The Variables must be related but the relationship not necessarily causal.
Testing our hypothesis To compare the findings of the Word Bank
which may look theoretical to some people on the general reaction to the trade war, 50 individual professionals in different fields were used as a sample analysis for comparing a variance to the ‘theoretical findings' of the World Bank. This will help us determine the different relationship of nominal data. This will help in determining how well the distribution fits to the determined data. The classifications will show whether data is dependent or independent.
The data was subjected to a series of multivariate analysis to find if any relationship existed and the Chi Method was used.
This helps us to test the goodness to fit, the significance of association and the homogeneity or the significance of the population variance.
This will greatly help us explain whether or not two attributes are associated 0 probability was due to chance.
The following conditions were fulfilled:
1. Observations recorded and used were collected at random.
2. All the views and reactions of the professionals were independent.
3. The number was/is acceptable It must be noted that the samples had no effect
on one another.
Analysis plan Chi square method was used for this discrete
input and discrete output of data which fluctuates over time and usually used when the null hypothesis is true and there is no category population or set of data and if there is a significant frequency in data. This is best for data analysis plans for quantitative data to be studied and appropriate to study or examine the relationship two nominal level variables. The r value is the number of rows and the c value is the number if columns.
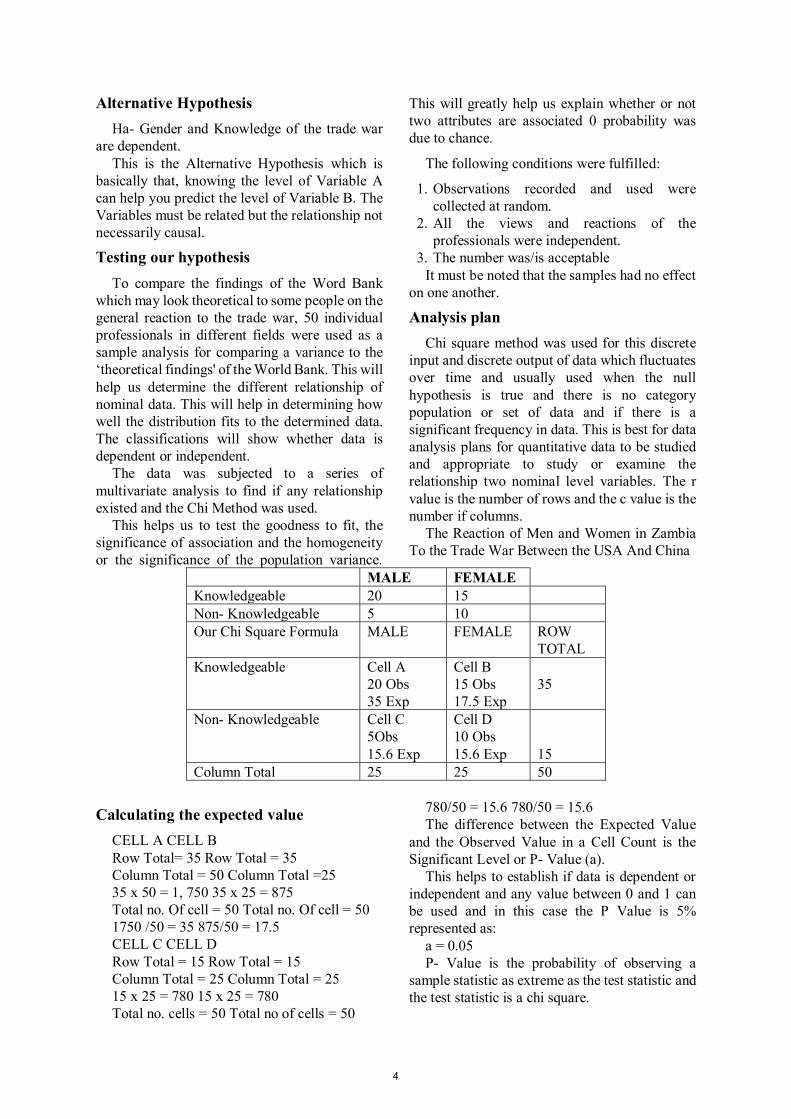
The Reaction of Men and Women in Zambia To the Trade War Between the USA And China
MALE FEMALE Knowledgeable 20 15 Non- Knowledgeable 5 10 Our Chi Square Formula MALE FEMALE ROW
TOTAL Knowledgeable Cell A
20 Obs 35 Exp
Cell B 15 Obs 17.5 Exp
35
Non- Knowledgeable Cell C 5Obs 15.6 Exp
Cell D 10 Obs 15.6 Exp
15
Column Total 25 25 50
Calculating the expected value CELL A CELL B Row Total= 35 Row Total = 35 Column Total = 50 Column Total =25 35 x 50 = 1, 750 35 x 25 = 875 Total no. Of cell = 50 Total no. Of cell = 50 1750 /50 = 35 875/50 = 17.5 CELL C CELL D Row Total = 15 Row Total = 15 Column Total = 25 Column Total = 25 15 x 25 = 780 15 x 25 = 780 Total no. cells = 50 Total no of cells = 50
780/50 = 15.6 780/50 = 15.6 The difference between the Expected Value
and the Observed Value in a Cell Count is the Significant Level or P- Value (a).
This helps to establish if data is dependent or independent and any value between 0 and 1 can be used and in this case the P Value is 5% represented as:
a = 0.05 P- Value is the probability of observing a
sample statistic as extreme as the test statistic and the test statistic is a chi square.
4

Analysing Sample Data with the Degree of Freedom
The degree of freedom is the freedom of links or joints in a sequence, expected frequency counts and chi square statistics are used to determine the P Value.
DF = (r-1) x (c-1) = (2-1) x (3-1) = 2 r = Number of category or data sets. c = Number of levels for other categorical
variables. Erc = (nr x nc) /n E 11= (35 x 25)/ 50 = 875/50 =17.5 E 12 = (35 x 25)/50 = 875/50 = 17.5 E 21= (15 x 25)/50 = 375/50 = 7.5 E 22 = (15 x 25)/50 =375/50 =7.5 X2 (20 -17.5)2/17.5 +( 15 -17.5)2 +(15-7.5)2/ 7.5 +(10 -7.5)2
=14 P Value is the probability that a chi square
statistic having 2 degrees of freedom is more extreme than 14
P (x 2 is greater than 14.2 Degree of Freedom = 2 Chi square critical value = 14 CV PX 2 less than 14 = 0.9991 PX 2 greater than 14 = 0.009
Result Interpretation Since the P Value is 0.009 which is less than
the Significant Level (0.05), we cannot accept the null hypothesis.
CONCLUSION: There is a relationship between gender and Knowledge of the trade war and the data herein cannot be of further use.
THE STRENGTHS OF THIS STUDY: The data was readily available. It was inexpensive. Holds absolutely no bias. Extremely confidential.
The weaknesses of this study The sample size was small, limited to 50
persons The literature review is limited to less than 4
authors. The scope is limited.
Hypothesis Conclusion To be significant, the observable value must be
equal or greater than the critical value and in this case it was significant.
The Null was rejected and this essentially means that nothing has changed and it cannot be proved as wrong.
The Alternative was accepted means that the education of women and improving their knowledge skills and participation is far greater or a better result than doing nothing.
The test as to goodness of fit is considered a good one because the sampling method was ransom and the variable studied was categorical and the Chi square goodness of fit test is greater than the table value and thus, the null hypothesis was rejected.
The test as to independence is also considered a good one.
There is a difference between the reaction of male and female to the trade war.
Observations as to the test of Independence
This is a test of frequency to show lack of bias. 20/25 of the males had full factual knowledge
of the genesis and content of the trade war. The affirmatives hold 40%.
15/25 of the females had full factual knowledge of the genesis and content of the trade war. The affirmatives hold 30%.
5/25 males had no idea or interest in the trade war, this accounts to 10%.
10/ 25 females had no idea or interest in the trade war, this accounts to 20%.
15/15 of the females regarded joining the trade war as the worst option which accounted to 30%, compared 15/25, of the males, that is, 30% who considered it the worst option.
Both genders upheld a 100% score that doing nothing about the trade war was just as bad as joining it.
15/25 of the females, that is, 30% upheld the view that the possibility of pursuing other regional agreements with regions outside the warring countries to divert trade was the best option, compared to 20/25 males who upheld the same view at 40%.
The view of Unilateral Liberalisation did not uphold any score with most ignoring it and seeking further information.
The findings of The World Bank to the reaction of countries to the trade war is inferred from the basic reactions of the broad spectrum of people and holds to be true.
Discussion There will always be disputes and these are
settled mostly in the Courts of Law or through Alternative Dispute Resolution (ADR)-mainly,
5
mediation and arbitration. When both men and women are involved in designing the resolutions to peace building and conflict management, the terrain that is greatly ignored by men is meticulously addressed by women such as care giving for the aged, addressing orphans, health care, education and food reserve. If women are for example, variable x and completely taken out from Dispute Resolution Methods, it would be a great injustice because in Zambia and the USA for instance, women are more than men and make great advocates of peace, the best observers and dispute resolvers. Women need all the support they can get, to address problems without impunity. China has been said to be more willing and better equipped to uphold the working conditions in Africa and have greatly diversified in the distribution of goods and services, this expansion of trade has led to changes in technology and that change means that both men and women must upgrade their knowledge and participation in information technology (Brauntigam D, 2010).
The relationship between gender and Knowledge of the trade war is very obvious that men have more information than women, women would rather not participate at all while men have more knowledge, do not hold long lasting solutions. These results are consistent with other works and the observations have been highlighted. The war applies greatly to the Zambian situation because the Zambian statistics show that women are more than men and head household and the women are more in the Professional field. With China, Zambia is part of sub- Sahara Africa and has had great dealings with China, the trade war has had an impact on Zambia. The domino effect is that export values and revenue generation may fall, but the greater impact is that trade between Zambia and China may vastly increase, while for the USA which favours its protectionism and is reluctant to venture in Africa will both be favourable at all.
Limitation
The Trade War magnitude is limited to the strength that each country wants to hold as a ransom to the other, which is greatly unfair and a huge disadvantage to the global economy. Knowledge and awareness are also highly subjective and limited to the knowledge, personal views and magnitude of the professional transactions concerning the international market.
Summary
The research is conducted on the topic
The Impact of the Trade War Between the USA and China on The Global Economy – The Reaction of Professional Men and Women in Zambia. Notably identified is the knowledge and awareness imbalance between men and women. The issues prevailing in the current International Trade War between China and the USA with Zambia as a case study. Lack of knowledge leads to lack of participation or agreement in the issues that affect the Global Economy. Zambia us part of the Global Economy and there has to be a proactive base that would allow it to disseminate information from the elementary to professional level to enable the utilization of information and allow it to take a positive stance and position to state in clear terms it's Sovereign view of issues affecting the Global Economy because each and every household buys goods and services.
The International Trade War affects every product and service provider, customer and consumer. The women have been identified in both the USA and Zambia as the major end users. Therefore, the dissemination of information and participation is very important. For information to be useful, it must be timely, complete, quality and relevant. The published information must enable the decision maker to make informed decisions that are accurate, valuable, important and most of all useful.
The challenges are a lack of surveillance and updated statistics to know the exact number or ratio from a reliable source to know the levels of knowledge, awareness and participation.
The other challenge is the general tendency for both genders, particularly, here in Zambia to think that The International Trade War is far and remote, this is cultural, but ignorance is not a defence. The dynamics of the Global Economy call for the participation, constant updates and strategies for the decision maker.
Labour reforms and trade reforms always need massive adjustments pre, during and post a trade war because of the loss of earnings, labour churns, redistributed income, massive layoffs and regional concentration. The loss of income and its effect is always devastating and effective strategies are needed to affiliate global compliance to concession and economic recovery. This is not an easy task, but provided there is adequate data, resources, commitment
6
and control, the effects become manageable and statistics are managed better.
Conclusion Every war has a devastating after math and
every great leader who is an authentic visionary for the greater good will build diplomatic relations and focus on internal operations to uphold trade policies for national and international development in bilateral and multilateral relations to build a better legacy. If the professional population in a country is unaware or uninterested in the trade war or any major global issue, it is worrying because it would mean they would have no global platform to address any global issue independently and frequently, statistics would also be difficult to compile. There is also need to address gender issues and perspectives for conflict resolution. Globalization calls for countries to shape their standards according to the current trends and dynamics in the global economy to escape from the weakness of the internal structures and standards, since women are more than men, they must be at the forefront of finding resolutions before the eruption of devastating wars.
Recommendation I greatly recommend that trade wars should
never be encouraged and The World Trade Organization must envision a benefit for each country and thus never encourage any trade war from the outset. The escalated Trade War although valid to the two countries, is a great inconvenience to all stakeholders. From our findings, it is clear that people will hold various views, but the devastating effects will only be felt after a long time due to a lack of agreement. There should also be greater dissemination of information and participation from schools to the Professional field because it is the women who suffer the most from the devastating effects of any war as burden bearers.
Zambia must have institutions that are distributed country wide to enable the allocation and the utilization of resources to adjust and adapt to improve self-sufficiency in times of global wars and loss especially. Workers are usually displaced and it's better to move to an area in need and sustain a good job with lesser benefits, than no job at all. The greatest recommendation is improving the infrastructure and its quality and providing education. The duty is with the
government more than civil society because government can intervene much quicker with no or less interference.
References [1] Agbajobi, S. 2010. The Role of Women in Conflict Resolution. University of Birmingham. [2] Anahita Thoms. 2019. In the Long-Term Trade Tensions Will Produce Losers. World Economic Forum Articles. Cologny, Geneva Switzerland. [3] Brauntigam D. 2010. The Dragon's Gift- the real story of China in Africa. Oxford university press. [4] Marion, J. Ralf Peters. Jose Marie Salazar- Xirinachs. 2011. Trade and Employment from myths to facts. ILO Publications, Geneva, Switzerland. [5] Potter Antonia.2008. Women Gender and Peace-making in Civil Wars 97802305845569 in Dorby J, Giuty R. M (ed) Contemporary Peace Making, Palmgrove Macmillan, London. [6] Rodriguez Clare.2010. Offshoring in a Ricardian World. American Economic Journal. Macroeconomics vol. 2 no. 2 2010. [7] Sanjay Bulaki Boradi. 2019.International Trade, Types, advantages and disadvantages. efinancemanagement.com. [8] Simon Ruth, Fujikawa Megumi, Hannon Paul. 2019. US Trade War on Global Impact Grows. The Wall Street Journal. Dow Jones and Company. New York. [9] Shane Cari. 2018. The Biggest Losers in Trump's Trade War? Women. www.ozy.com. [10] Waldron Thea, Erin Baines. 2019. Gender and Embodied War Knowledge. Journal on Human Rights Practice pp393- 405. Oxford Press. [11] Worssman, L. 2011. Education Policies to Make Globalization More Effective. ILO/WTO Publications, Geneva, Switzerland. [12] York Erica. 2019. New Report Finds Trade War is a lose -lose for US and China. Taxfoundation.org. [13] UN Security Council Resolution 1325 adopted in 2000. UNCTAD Press. PR. 2019. 03.
7
Texila International Journal of Academic research ISSN: 2520-3088
DOI: 10.21522/TIJAR.2014.07.02.Art002
The Perception of Instructors and Learners' in Expertise Building in Vocational Courses in Ghana
Mustapha Bin Danquah Department of Education, Texila American University, Saudi Arabia
E-mail: [email protected]
Abstract
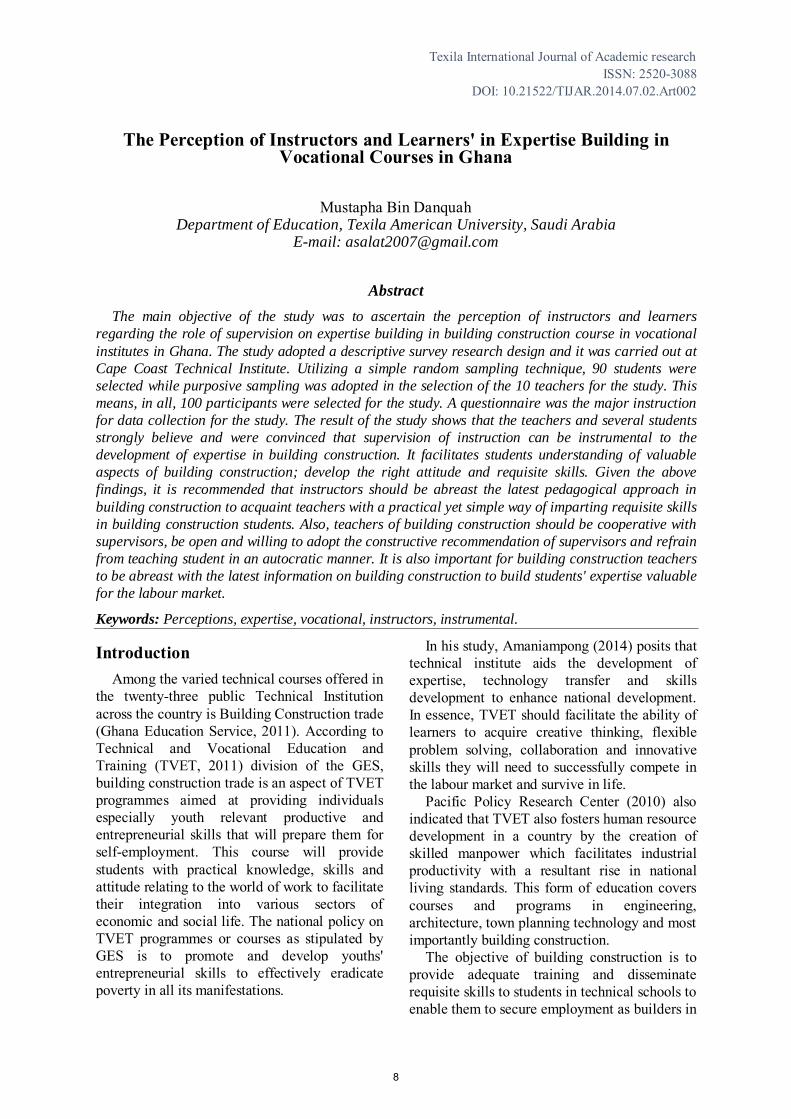
The main objective of the study was to ascertain the perception of instructors and learners
regarding the role of supervision on expertise building in building construction course in vocational
institutes in Ghana. The study adopted a descriptive survey research design and it was carried out at
Cape Coast Technical Institute. Utilizing a simple random sampling technique, 90 students were
selected while purposive sampling was adopted in the selection of the 10 teachers for the study. This
means, in all, 100 participants were selected for the study. A questionnaire was the major instruction
for data collection for the study. The result of the study shows that the teachers and several students
strongly believe and were convinced that supervision of instruction can be instrumental to the
development of expertise in building construction. It facilitates students understanding of valuable
aspects of building construction; develop the right attitude and requisite skills. Given the above
findings, it is recommended that instructors should be abreast the latest pedagogical approach in
building construction to acquaint teachers with a practical yet simple way of imparting requisite skills
in building construction students. Also, teachers of building construction should be cooperative with
supervisors, be open and willing to adopt the constructive recommendation of supervisors and refrain
from teaching student in an autocratic manner. It is also important for building construction teachers
to be abreast with the latest information on building construction to build students' expertise valuable
for the labour market.
Keywords: Perceptions, expertise, vocational, instructors, instrumental.
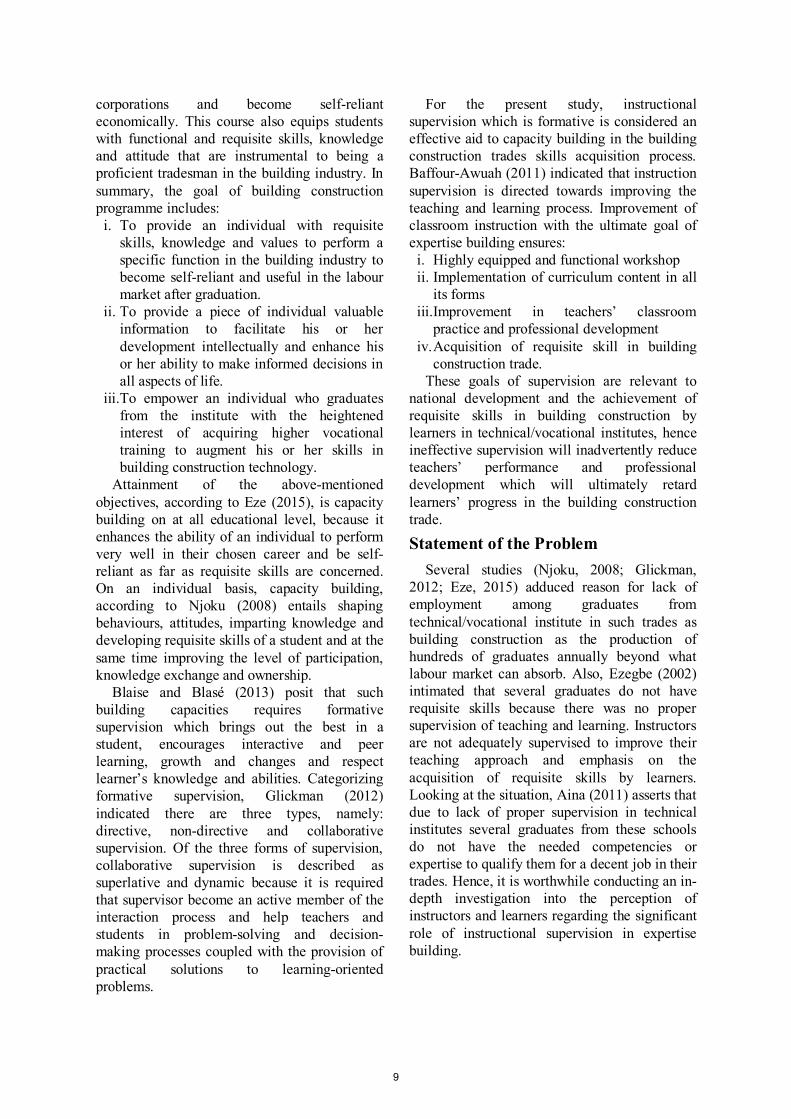
Introduction Among the varied technical courses offered in
the twenty-three public Technical Institution across the country is Building Construction trade (Ghana Education Service, 2011). According to Technical and Vocational Education and Training (TVET, 2011) division of the GES, building construction trade is an aspect of TVET programmes aimed at providing individuals especially youth relevant productive and entrepreneurial skills that will prepare them for self-employment. This course will provide students with practical knowledge, skills and attitude relating to the world of work to facilitate their integration into various sectors of economic and social life. The national policy on TVET programmes or courses as stipulated by GES is to promote and develop youths' entrepreneurial skills to effectively eradicate poverty in all its manifestations.
In his study, Amaniampong (2014) posits that technical institute aids the development of expertise, technology transfer and skills development to enhance national development. In essence, TVET should facilitate the ability of learners to acquire creative thinking, flexible problem solving, collaboration and innovative skills they will need to successfully compete in the labour market and survive in life.
Pacific Policy Research Center (2010) also indicated that TVET also fosters human resource development in a country by the creation of skilled manpower which facilitates industrial productivity with a resultant rise in national living standards. This form of education covers courses and programs in engineering, architecture, town planning technology and most importantly building construction.
The objective of building construction is to provide adequate training and disseminate requisite skills to students in technical schools to enable them to secure employment as builders in
8
corporations and become self-reliant economically. This course also equips students with functional and requisite skills, knowledge and attitude that are instrumental to being a proficient tradesman in the building industry. In summary, the goal of building construction programme includes:
i. To provide an individual with requisite skills, knowledge and values to perform a specific function in the building industry to become self-reliant and useful in the labour market after graduation.
ii. To provide a piece of individual valuable information to facilitate his or her development intellectually and enhance his or her ability to make informed decisions in all aspects of life.
iii. To empower an individual who graduates from the institute with the heightened interest of acquiring higher vocational training to augment his or her skills in building construction technology.
Attainment of the above-mentioned objectives, according to Eze (2015), is capacity building on at all educational level, because it enhances the ability of an individual to perform very well in their chosen career and be self-reliant as far as requisite skills are concerned. On an individual basis, capacity building, according to Njoku (2008) entails shaping behaviours, attitudes, imparting knowledge and developing requisite skills of a student and at the same time improving the level of participation, knowledge exchange and ownership.
Blaise and Blasé (2013) posit that such building capacities requires formative supervision which brings out the best in a student, encourages interactive and peer learning, growth and changes and respect learner’s knowledge and abilities. Categorizing formative supervision, Glickman (2012) indicated there are three types, namely: directive, non-directive and collaborative supervision. Of the three forms of supervision, collaborative supervision is described as superlative and dynamic because it is required that supervisor become an active member of the interaction process and help teachers and students in problem-solving and decision-making processes coupled with the provision of practical solutions to learning-oriented problems.
For the present study, instructional supervision which is formative is considered an effective aid to capacity building in the building construction trades skills acquisition process. Baffour-Awuah (2011) indicated that instruction supervision is directed towards improving the teaching and learning process. Improvement of classroom instruction with the ultimate goal of expertise building ensures:
i. Highly equipped and functional workshop ii. Implementation of curriculum content in all
its forms iii. Improvement in teachers’ classroom
practice and professional development iv. Acquisition of requisite skill in building
construction trade. These goals of supervision are relevant to
national development and the achievement of requisite skills in building construction by learners in technical/vocational institutes, hence ineffective supervision will inadvertently reduce teachers’ performance and professional development which will ultimately retard learners’ progress in the building construction trade.
Statement of the Problem Several studies (Njoku, 2008; Glickman,
2012; Eze, 2015) adduced reason for lack of employment among graduates from technical/vocational institute in such trades as building construction as the production of hundreds of graduates annually beyond what labour market can absorb. Also, Ezegbe (2002) intimated that several graduates do not have requisite skills because there was no proper supervision of teaching and learning. Instructors are not adequately supervised to improve their teaching approach and emphasis on the acquisition of requisite skills by learners. Looking at the situation, Aina (2011) asserts that due to lack of proper supervision in technical institutes several graduates from these schools do not have the needed competencies or expertise to qualify them for a decent job in their trades. Hence, it is worthwhile conducting an in-depth investigation into the perception of instructors and learners regarding the significant role of instructional supervision in expertise building.
9
Objectives of the study The main objective of the study is to ascertain
the perception of instructors and learners regarding the role of supervision on expertise building in building construction course in vocational institutes in Ghana. Specifically, the study will cover the following:
i. Decipher instructors and students’ perception of the contribution of instructional supervision to expertise building in vocational institutes
ii. Ascertain instructors and learners’ perception of the types of supervision for expertise building in building construction
Research Questions The study was guided by the following
research questions: 1. What are the instructors and learners’
perception of the contribution of instructional supervision to expertise building in vocational institutes?
2. How do instructors and learners perceive the types of supervision suitable for expertise building in building construction?
Significance of the Study The relevance of the present study cannot be
overemphasized with the alarming rate at which several students graduating from the technical institute with little or no employable skill in the world of work, hence findings of the study will provide relevant information on channeling instructional supervision towards building requisite skill in students upon completion of the building construction course.
Finding of the study will be relevant to supervisors, school administrators and other stakeholders of education involved in Technical and Vocational Education and Training because it will facilitate the rapid integration of practical approaches teachers can adopt during teaching and learning to aid students’ acquisition of requisite skill for the building industry and self-employment. Result of the study will also add to the literature on the development of expertise in building construction through effective supervision of instruction in TVET institutions in Ghana.
Review of related literature Concept of Vocational Courses
Technical/Vocational Institutes, according to Boakye (2012), are educational institution charged with the responsibility of providing practical training in scientific and technical subjects. In Ghana, educational reform policies stipulate the establishment of these institutes in all the ten regional capitals following as stipulated in Ghana constitution. The tenet of this law empowers vocational institute in the following ways:
i. To provide education through full-time courses in the field of electrical/electronic engineering, mechanical engineering, building construction, tourism and hospitality, business and such other areas as may be determined by TVET division of GES for the time being responsible for such education;
ii. To encourage study in technical subjects at the second cycle level; and
iii. To provide an opportunity for individual and national development in vocational issues.
In the '60s following the industrial development policy and rapid technological progress in a broad range of areas in Ghana, vocational education became a necessity for the country (Boakye, 2012). This need has not yet abated in Ghana, because in their study, Amedorme, Agbezudor and Sakyiama (2014) indicated that this form of education or technologically oriented education forms a sound footing for technological advancement of any nation, especially developing nation like Ghana. Essentially, vocational education was solely established with the objective of training graduates for skill acquisition and practical knowledge necessary for industrial and technological advancement. Anane (2012) indicated that graduates from the vocational institutes are expected to occupy middle-level manpower required by any country especially in the context of industrial development.
Vocational graduates are trained to use more hands than minds to solve problems that are confronting their nation. Literature (Boakye, 2012; Anane, 2012) revealed that practical training provided at technical/vocational institutes is indispensable to national growth and should not be compromised in any way because it involves Competency-Based Training which is
10
suitable for Technical and Vocational Education and Training (TVET) inherently associated with the development of requisite skills for the labour market. In other words, technical/vocational graduates receive practical training that Agodzo (2005) described as "do-it-yourself" learning, these graduates pass through training that emphasizes practical work that is demonstrated in the specific tasks he or she can do and is required to do. In effect, competency-based training at vocational institutes is all about gainfully engaging students in practically oriented tasks with the sole aim of developing expertise to survive the ever-increasing competition in the real world.
Okumephuna (2008) indicated that technical/vocational system of education is vastly different from the university and that a developing nation like Ghana needs more vocational graduates since vocational education is purely techno-scientific oriented. TVET system of education is meant to produce technocrats with the sole aim of improving the technological slant of the country for upward progression. Omega (2012) and Okumephuna (2008) posit that unlike predominantly theoretical university education, TVET education is 60 per cent practical and 40 per cent theoretical.
Hence, vocational education should not be negatively compared to the university because their mission, vision and objectives are vastly different from each other and with a developing nation, practical-oriented education will speed up the rate of technological advancement than purely theoretical learning which sometimes do not come to grips with reality (Salawu, 2005). Amedorme et al. (2014) indicated that some authors see TVET as a comprehensive institute offering professional, career-focused programs specializing in industrial, practical, or mechanical arts and applied sciences. This definition underscores the relevance of these institutes in Ghana because it encompasses student practical understanding of the real world, encourages career focus, program development, emphasizes collaborative research and learning with the ultimate goal of national techno-economic development (Ghana News Agency, 2006).
The relevance of Effective Supervision in TVET
To build expertise in building construction, it is paramount that both the government and stakeholders in education make concerted effort to improve the quality of schools and the achievements of students since learning outcomes depend on the mode of instruction and its effectiveness. In his study, Barro (2006) posits that national development and economic growth can only be achieved via higher quality of education and De Grauwe (2001) posits that such type of education depends largely on how teachers are trained and supervised because of their key position in pedagogy. Among other things, De Grauwe stated: “national authorities rely strongly on the school supervision system to monitor both the quality of schools and key measures of its success, such as student achievement (p. 39).
In their study, Sergiovanni and Strarratt (2002) posit that supervision and monitoring of instruction at schools cannot be overemphasized because it develops the expertise of teachers and enhances classroom practices which are crucial to students' academic achievement in any subject. Sergiovanni and Starratt further indicated that the nature of supervision and monitoring is very contributive to students’ academic achievement because it revolves around a collaborative effort between the supervisors and teachers through effective dialogue with the sole aim of improving classroom instruction and practice sessions.
Fisher (2002) further stated that employing effective supervision of instruction, supervisors can adequately influence and reinforce teaching practices with resultant improvement in student learning and the development of requisite skills. This often requires supervisors to carefully study performance and appropriate data regarding classroom instruction to provide meaningful feedback and direction to teachers coupled with appropriate inspection, control and evaluation of their activities (IIEP/UNESCO Module 2, 2007). With these processes in place, classroom instruction will undoubtedly exert immense influence on the teaching and learning process to the benefit of students ultimately.
11
Fisher (2002) further indicated that effective supervision and monitoring is critical to the objective of providing equal access to quality educational programs for all students irrespective of their background. It behoves supervisors or administrators to emphasize the importance of the appropriate and well-organized program to all teachers, clearly delineating how teachers can employ diverse teaching techniques to meet the ever-changing needs of the students and to provide them employable skills in their respective fields including building construction.
Tesema (2014) posits that supervisors should see to the enabling of individual teachers become an implementer of effective teaching. In all, Tesema intimated that supervisors should be concerned with the following:
i. Ensuring curriculum implementation ii. Providing direct technical support to
teachers iii. Providing on-the-job training to teachers iv. Conducting teacher performance evaluation v. Conducting formative education program
evaluation coupled with vi. Monitoring and coordination
Baffour-Awuah (2011) intimated that in Ghana, the Ministry of Education has the overall responsibility for education sector policy formulation, planning, monitoring and evaluation, while the Ghana Education Service (GES) is saddled with the responsibility of service delivery such as the deployment of teachers, allocation of textbooks, and supervision of schools and teachers. The collaborative efforts of the education sector of the Ministry of Education, Youth and Sports and the Ghana Education Service in the implementation TVET, established in 1992 by the Government of Ghana.
Effective supervision in TVET oriented institutions is anchored or lies within the jurisdiction of the Inspectorate Division at headquarters and Inspectorate Units at regional and district offices. At each level of education, supervisory structures and practices are kept in place to improve instruction; hence responsible
personnel involved in supervision in school are given ample training and equipment to augment their competencies and skills via in-service training courses and workshops at the national, regional and district levels. This means all personnel occupying supervisory positions must be abreast effective management techniques to horn their supervisory practices especially in supervising instruction on the building construction course.
Methodology The study adopted a descriptive survey
research design in eliciting relevant information regarding the study. The study was carried out at Cape Coast Technical Institute. Population for the study comprised 120 individuals with 110 being the SS3 learners/students and the remaining 10 being their instructors/teachers. Using simple random sampling technique, 90 students were selected while purposive sampling was adopted in the selection of the 10 teachers for the study. This means, in all, 100 participants were selected for the study. A questionnaire was the major instruction for data collection for the study. Since perception is related to emotion, the four-point Likert scale (Strongly Agree, Agree, Strongly Disagree, Disagree) was employed in preparing the question to identify the degree of intensity. Descriptive statistics through mean and standard deviation involving the use of tables and percentages were used for analysis.
Results and Discussion Research Question One: What are the
instructors and learners’ perception of the contribution of instructional supervision to expertise building in vocational institutes?
The focus of this question is to elicit relevant information regarding the perception of both teachers and students concerning the value of supervision of instruction in TVET classes to improving teachers’ pedagogical approach with the overall purpose of expertise building in students. Responses of the participants are presented in Table 1.
12
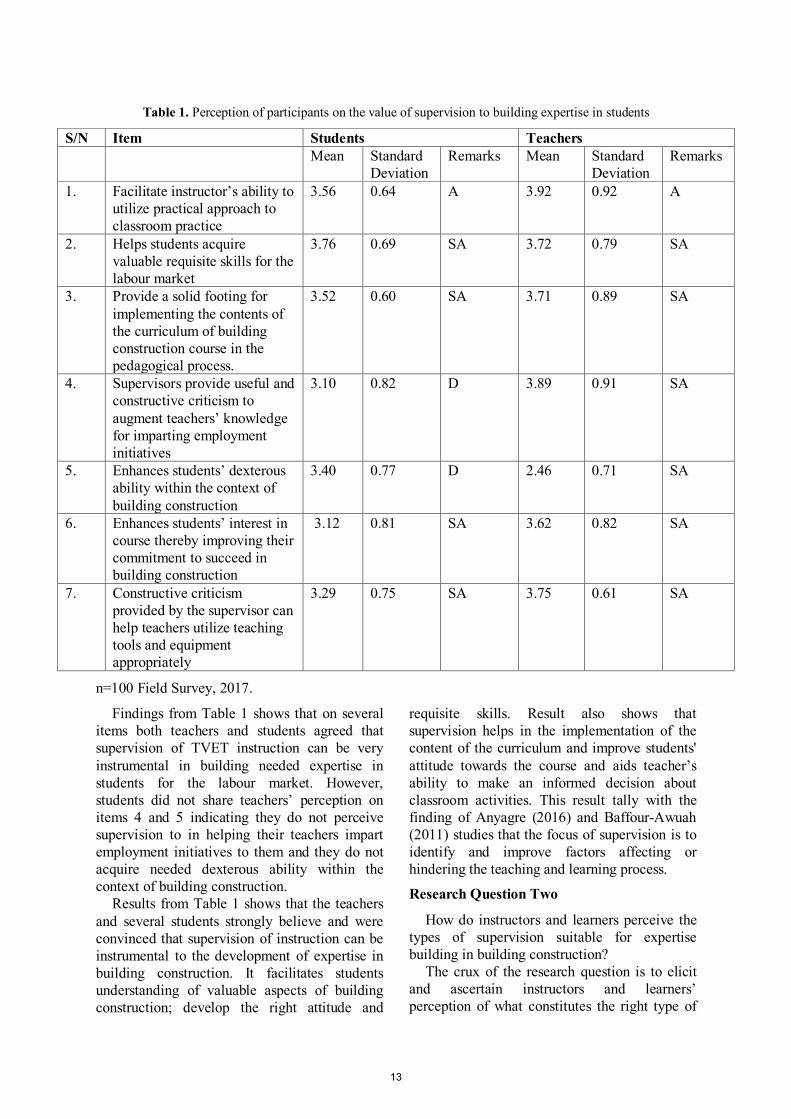
Table 1. Perception of participants on the value of supervision to building expertise in students
S/N Item Students Teachers Mean Standard
Deviation Remarks Mean Standard
Deviation Remarks
1. Facilitate instructor’s ability to utilize practical approach to classroom practice
3.56 0.64 A 3.92 0.92 A
2. Helps students acquire valuable requisite skills for the labour market
3.76 0.69 SA 3.72 0.79 SA
3. Provide a solid footing for implementing the contents of the curriculum of building construction course in the pedagogical process.
3.52 0.60 SA 3.71 0.89 SA
4. Supervisors provide useful and constructive criticism to augment teachers’ knowledge for imparting employment initiatives
3.10 0.82 D 3.89 0.91 SA
5. Enhances students’ dexterous ability within the context of building construction
3.40 0.77 D 2.46 0.71 SA
6. D Enhances students’ interest in course thereby improving their commitment to succeed in building construction
3.12 0.81 SA 3.62 0.82 SA
7. Constructive criticism provided by the supervisor can help teachers utilize teaching tools and equipment appropriately
3.29 0.75 SA 3.75 0.61 SA
n=100 Field Survey, 2017.
Findings from Table 1 shows that on several items both teachers and students agreed that supervision of TVET instruction can be very instrumental in building needed expertise in students for the labour market. However, students did not share teachers’ perception on items 4 and 5 indicating they do not perceive supervision to in helping their teachers impart employment initiatives to them and they do not acquire needed dexterous ability within the context of building construction.
Results from Table 1 shows that the teachers and several students strongly believe and were convinced that supervision of instruction can be instrumental to the development of expertise in building construction. It facilitates students understanding of valuable aspects of building construction; develop the right attitude and
requisite skills. Result also shows that supervision helps in the implementation of the content of the curriculum and improve students' attitude towards the course and aids teacher’s ability to make an informed decision about classroom activities. This result tally with the finding of Anyagre (2016) and Baffour-Awuah (2011) studies that the focus of supervision is to identify and improve factors affecting or hindering the teaching and learning process.
Research Question Two
How do instructors and learners perceive the types of supervision suitable for expertise building in building construction?
The crux of the research question is to elicit and ascertain instructors and learners’ perception of what constitutes the right type of
13
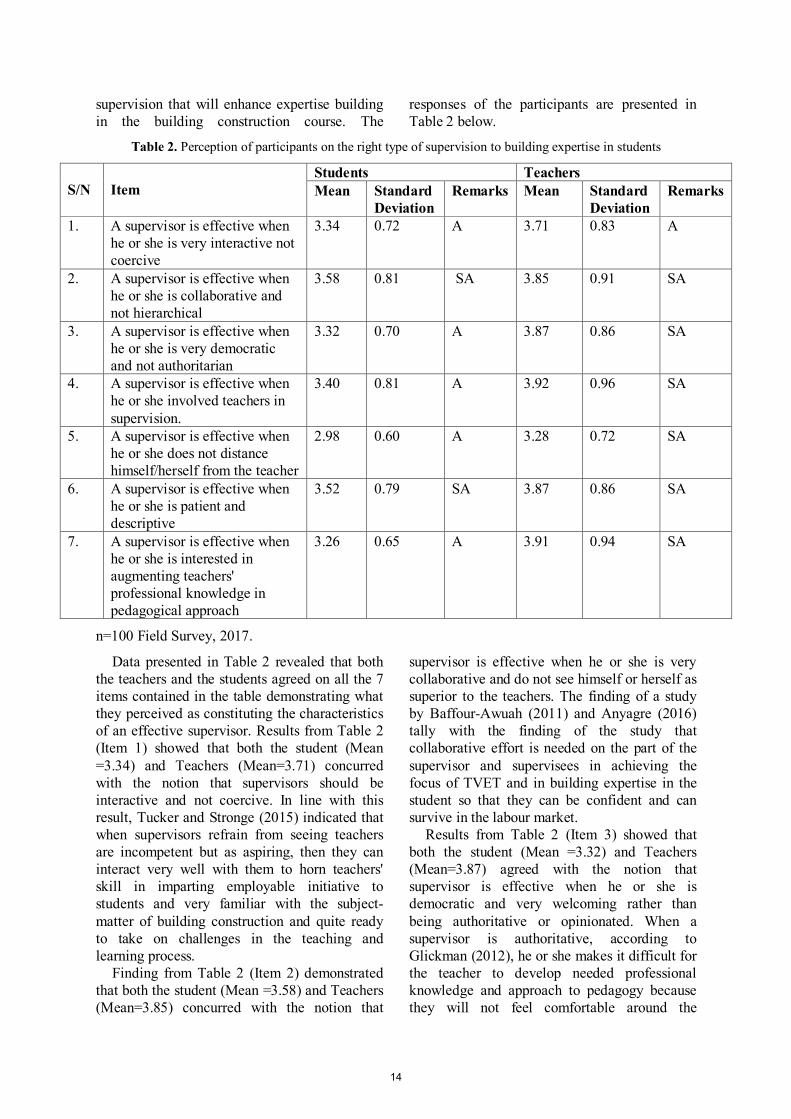
supervision that will enhance expertise building in the building construction course. The
responses of the participants are presented in Table 2 below.
Table 2. Perception of participants on the right type of supervision to building expertise in students
S/N
Item
Students Teachers Mean Standard
Deviation Remarks Mean Standard
Deviation Remarks
1. A supervisor is effective when he or she is very interactive not coercive
3.34 0.72 A 3.71 0.83 A
2. A supervisor is effective when he or she is collaborative and not hierarchical
3.58 0.81 SA 3.85 0.91 SA
3. A supervisor is effective when he or she is very democratic and not authoritarian
3.32 0.70 A 3.87 0.86 SA
4. A supervisor is effective when he or she involved teachers in supervision.
3.40 0.81 A 3.92 0.96 SA
5. A supervisor is effective when he or she does not distance himself/herself from the teacher
2.98 0.60 A 3.28 0.72 SA
6. D A supervisor is effective when he or she is patient and descriptive
3.52 0.79 SA 3.87 0.86 SA
7. A supervisor is effective when he or she is interested in augmenting teachers' professional knowledge in pedagogical approach
3.26 0.65 A 3.91 0.94 SA
n=100 Field Survey, 2017.
Data presented in Table 2 revealed that both the teachers and the students agreed on all the 7 items contained in the table demonstrating what they perceived as constituting the characteristics of an effective supervisor. Results from Table 2 (Item 1) showed that both the student (Mean =3.34) and Teachers (Mean=3.71) concurred with the notion that supervisors should be interactive and not coercive. In line with this result, Tucker and Stronge (2015) indicated that when supervisors refrain from seeing teachers are incompetent but as aspiring, then they can interact very well with them to horn teachers' skill in imparting employable initiative to students and very familiar with the subject-matter of building construction and quite ready to take on challenges in the teaching and learning process.
Finding from Table 2 (Item 2) demonstrated that both the student (Mean =3.58) and Teachers (Mean=3.85) concurred with the notion that
supervisor is effective when he or she is very collaborative and do not see himself or herself as superior to the teachers. The finding of a study by Baffour-Awuah (2011) and Anyagre (2016) tally with the finding of the study that collaborative effort is needed on the part of the supervisor and supervisees in achieving the focus of TVET and in building expertise in the student so that they can be confident and can survive in the labour market.
Results from Table 2 (Item 3) showed that both the student (Mean =3.32) and Teachers (Mean=3.87) agreed with the notion that supervisor is effective when he or she is democratic and very welcoming rather than being authoritative or opinionated. When a supervisor is authoritative, according to Glickman (2012), he or she makes it difficult for the teacher to develop needed professional knowledge and approach to pedagogy because they will not feel comfortable around the
14
supervisor who feels he or she can just be issuing commands without cognition of the condition of those he or she is supervising.
Results from Table 2 (Item 7) showed that both the student (Mean =3.26) and Teachers (Mean=3.91) agreed with the notion that Supervisor is effective when he or she is interested in augmenting teachers’ professional knowledge in pedagogical approach. Such a supervisor, according to Anyagre (2016) and Cobbold, Eshun, Bordoh and Kofie (2015), could go the extra mile to see that teachers get the import of his or her constructive criticism to facilitate its integration into the teaching and learning process in the classroom about building construction. To be noted is that such supervisor will stop at nothing to see that the teachers are abreast latest pedagogical approach to classroom practice and how students’ requisite knowledge can be built so that when they can be easily assimilated into the labour market due to possession of requisite skill and expertise in building construction.
Conclusion and Recommendations The study critically examined the relevance
of vocational courses in the two phases, individually and nationally. Ample explication was made with the important role and function of Technical and Vocational Education and Training within the Ghanaian context. This division of GES is primarily geared toward actualizing entrepreneurial learning of students upon admission into the tertiary institution and later into the world of work or labour market. TVET, according to the reviewed literature is highly important and instrumental to the production of graduates that are self-reliant and very pragmatic in activities requiring the manipulation of building construction tools in the accomplishment of construction projects. The result of the study shows that the teachers and several students strongly believe and were convinced that supervision of instruction can be instrumental to the development of expertise in building construction. It facilitates students understanding of valuable aspects of building construction; develop the right attitude and requisite skills. Result also shows that supervision helps in the implementation of the content of the curriculum and improve students' attitude towards the course and aids teacher’s ability to make an informed decision about
classroom activities. The study also showed that to facilitate the building of requisite skills and expertise in building construction, supervisors need to be interactive, democratic, result-oriented and keenly interested in improving teachers' professional knowledge which in turn will improve classroom instruction with the ultimate goal of providing students with employable skills in the highly competitive labour market.
Given the above findings, it is recommended that instructors should be abreast the latest pedagogical approach in building construction to acquaint teachers with a practical yet simple way of imparting requisite skills in building construction students. Also, teachers of building construction should be cooperative with supervisors, be open and willing to adopt the constructive recommendation of supervisors and refrain from teaching student in an autocratic manner. It is also important for building construction teachers to be abreast with the latest information on building construction to build students' expertise valuable for the labour market. References [1] Afework, T. H. & Asfew, M. B. (2014). The availability of school facilities and their effects on the quality of education in government primary schools of Harari regional state and east Hararghe Zone, Ethiopia. Middle Eastern & African Journal of
Educational Research, Issue 11, pp. 59-71. [2] Agodzo, S. K. (2005). Competency-Based Learning: The case of Wa Polytechnic of Ghana, CAPA Seminar, Erata Hotel, Accra. http://www.ijern.com/journal/May-2014/43.pdf. Acce [3] Aina, O. (2011). Business education, technology and national development. Business Education Journal, 5(2), 70-71. [4] Akhihiero, E. J. (2011). Effect of inadequate infrastructural facilities on academic performance of students of Oredo local government of Edo State. The Nigerian Academic Forum, Volume 20, No. 1. [5] Amaniampong, K. (2014). Importance of Polytechnic education and the challenges it faces. http://www.graphic.com.gh/news/education/importance-of-polytechnic-education-and-the-challenges-it-faces.html. Accessed June 27, 2016. [6] Amedorme, S. K., Agbezudor, K. & Sakyiama, F. K. (2014). Converting Polytechnics into technical universities in Ghana issues to address. International Journal of Education and Research, Vol. 2, No. 5.
15
[7] Anane, A.C. (2013). Competency-Based Training: Quality Delivery for Technical and Vocational Education and Training (TVET) Institutions in Ghana. Educational Research International Educational Research International, 2(2) 117-127 [8] Ankoma-Sey, V. R. & Maina, B. (2016). The role of effective supervision on the academic performance of senior high schools in Ghana. Journal of Arts & Humanities, Vol. 05, No. 04, pp. 73-83. [9] Anyagre, J. T. Z. (2016). Examining the views of teachers and headteachers on supervision and collective school management in contemporary Ghana. International Journal of Innovative Research & Development, Vol. 5, Issue 10, pp. 99-108. [10] Baffour-Awuah (2011) Supervision of Instruction in public primary schools in Ghana: Teachers and Headteachers' perspectives. https://core.ac.uk/download/ pdf/11238964.pdf. [11] Blasé, J. & Blasé J. (2013). Empowering teachers: what successful principals’ thousand oaks. USA: Corwin Press. [12] Boakye, A. E. (2012). Meeting NCTE and NABPTEX standards by Polytechnic in Ghana: Exploring the realities. A thesis submitted to the school of graduate studies Kwame Nkrumah University of Science and Technology, Kumasi. [13] Cobbold, C., Eshun, I., Bordoh, A. & Kofie, S. (2015). Perception of curriculum leaders and teachers on feedback and conditions essential for effective supervision in senior high schools. International Journal of Educational Research and Information Science, 2(2), pp. 21-26. [14] De Grauwe, A. (2001). Supervision in four African countries: Challenges and reforms Vol. I. Paris: IIEP/UNESCO. [15] Ezegbe, C.C. (2002). Towards effective supervision in Nigerian educational system: Educational, administration for colleges and universities. Owerri: Tony Ben Publishers.
[16] The Federal Republic of Nigeria. (2013). National policy on education (Revised). Lagos: NERDC Press, Yaba. [17] Glickman, D. C. (2012). Supervision of instruction: A developmental approach. Boston: Ellyn and Bacon. [18] Njoku, U.C. (2008). Business education and value orientation for national economic empowerment and development. Business Education Journal, 6(1), 102-108. [19] Ogbu, J. E. (2015). Influence of inadequate instructional material and facilities in teaching and learning of electrical/electronic technology education courses. International Journal of Vocational and Technical Education, Vol. 7 (3), pp. 20-27. [20] Okumephuna, C. (2008). The state of polytechnic education in Nigeria. Guardian Editorial. Accessed June 21, 2016. [21] Omega, E, M. M. (2010). Repositioning Polytechnic Education in Nigeria. [22] Pacific Policy Research Center (2010). 21st-century skills for students and teachers. http://webcache.googleusercontent.com/search?q=cache:k-apioOYL2AJ: www.ksbe.edu/_assets/spi/pdfs/21_century_skills_full.pdf+&cd=3&hl=en&ct=clnk&gl=gh. Accessed June 23, 2016. [23] Seidu, A. (2007). Modern Approaches to Research in Educational [24] Administration: Revised Edition. Kumasi: Payless Publication Limited. [25] Sergiovanni, T. J. & Starratt, R. (1993). Supervision: A redefinition. New York: McGraw-Hill. [26] Sergiovanni, T. J. & Starratt, R. (2002). Supervision: A redefinition (7th ed.). New York: MacGraw-Hill. [27] Sergiovanni, T. J. (2009). The principalship: A reflective practice perspective. Boston: Pearson Educational Inc.
16
Texila International Journal of Academic research ISSN: 2520-3088
DOI: 10.21522/TIJAR.2014.07.02.Art003
Predictive Validity of Entry Level Mathematics on Mathematical Knowledgefor Teaching Basic school Mathematics of Pre-service Teachers in Ghana
Millicent Narh-Kert
Accra College of Education, Ghana E-mail: [email protected]
Abstract
Introduction: Knowledge about teaching mathematics remains a contentious issue in the preparation
of pre-service teachers in Ghana. This study explored relationships among entry-level mathematical
knowledge (ELMK), mathematics content knowledge (MCK) and mathematics pedagogical content
knowledge (MPCK) scores of pre-service teachers in colleges of education (CoEs) in Ghana.
Methods: The cross-sectional survey design was adopted for this study. A total of 998 pre-service
teachers from ten (10) public colleges of education were sampled via multi-stage sampling technique.
Structured questionnaire and unstructured observation schedule were used for the survey. College
mathematics test results were used as secondary data. The data were analysed using descriptive
statistics (frequency count, percentage) and inferential statistics (Pearson’s correlation, paired-samples t-test and regression analysis) with the aid of Statistical Package for Social Sciences software
version 22.
Results: The majority of pre-service teachers in Ghanaian colleges of education had average but
relatively weak grades in ELMCK. ELMCK did not significantly predict pre-service teachers’ MCK
statistically (p ≥ 0.05) although a statistically significant positive correlation existed between the
variables. Although a negative correlation existed between ELMCK and PMCK, ELMCK significantly
predicted pre-service teachers’ PMCK statistically (p ≤ 0.05) but the effect size was statistically
negligible.
Conclusions: This study concluded that, CoEs in Ghana admit pre-service teachers with average but
weak grades in ELMK. Therefore, Ghanaian CoEs should structure and introduce PMCK alongside
MCK for pre-service teachers. Mathematics tutors in CoEs should organize remedial lessons for pre-
service teachers to scale-up their MCK and PMCK that adequately equip them with MKT.
Keywords: Entry-level mathematical knowledge (ELMK), mathematics content knowledge (MCK),
mathematics pedagogical content knowledge (MPCK), mathematical knowledge for teaching (MKT),
pre-service teachers.
Introduction Individuals who enroll into Colleges of
Education (CoE) in Ghana are known as pre-service teachers or teacher trainees. It is worth noting that one of the major requirements for selection into a CoE in Ghana is the entry level performance grade in the West Africa Senior Secondary Certificate Examination (WASSCE) [1], particularly credit passes or better in Core Mathematics, English Language and Integrated Science. This background attribute or entry level behaviour, with a particular reference to entry level mathematics knowledge (ELMK) shapes the thinking and practices of pre-service teachers’ mathematics content knowledge (MCK) and
mathematics pedagogical content knowledge (MPCK) while in college. Mathematics achievement entry grade is very critical in assessing pre-service teachers before entry into CoE as reported in Teacher Education (TE) and Development Study in Mathematics (TEDS-M) [2]. This is because it is assumed that entry behavior in mathematics is prognostic of future mathematics performance. Therefore, this study hypothesizes that entry-level mathematical knowledge (ELMK), predicts MCK and MPCK of pre-service teachers which eventually impact on their mathematical knowledge for teaching mathematics (MKT) after college.
The mathematical knowledge for teaching mathematics (MKT) has been of interest to
17
teacher educators of pre-service teacher education and training in Ghana. Mathematical knowledge for teaching is understanding of the mathematical horizon and it is evident when the teacher demonstrates a broad understanding of how mathematical ideas connect. A teacher who demonstrates knowledge of the mathematical horizon has peripheral vision, for example, they know the questions to prompt students’ understanding of mathematical proofs, know when to assist learning as well as when to be patient in allowing the student to work through the problem independently. Studies aimed at teachers’ mathematical knowledge mainly have focused on two topics: first, the teachers’ characteristics, for example, the number of mathematics courses they have completed, and second, the nature of teachers’ mathematical knowledge. It is believed excellent teachers of mathematics must know the mathematics appropriate to the grade level and primary mathematics subjects they teach [3, 4]. Also, researchers [5] summarised much of the then available research on teachers’ mathematical knowledge for teaching (MKT) and noted a lack of it can impede teachers’ abilities to notice and analyse students’ thinking as well as their ability to engage in productive professional conversations.
Having been established that one of the most important factors which influence students’ performance in mathematics are the mathematics teachers and the mathematics lessons they receive in school [6, 7]; it is significant that a comprehensive look is made into the college entry-level mathematical knowledge (ELMK), mathematics content knowledge (MCK) and mathematics pedagogical content knowledge (MPCK). The question therefore is, how do Ghanaian pre-service teachers become better at understanding mathematics content knowledge (MCK) and mathematics pedagogical content knowledge (MPCK) in ways that will give them flexibility and insight required for Mathematical Knowledge for Teaching (MKT) in the basic school?
In a study on ‘improving teaching and learning of basic mathematics and reading in Africa’ [8], it was found that even though initial teacher education programmes had impact on newly qualified teachers, they induced misplaced confidence leading to standardized teacher-led approaches that failed to engage learners. A
researcher [9] in a previous study pointed out that graduates of teacher training colleges are ill-prepared in facilitating learning in basic schools. Similarly, it has been observed that most beginning teachers are seen as woefully unprepared for the complex and demanding tasks of the classroom and pre-service teacher education has been regarded as pathetically weak, resulting in new teachers being found wanting and desperate in their initial experience. This observation has not changed because pre-service teachers are still exhibiting weak performances in their ‘End of Semester Examination’ [10, 11, 12] giving the impression that there has been little improvement in mathematics performance over the years. Several researchers [13, 14, 15, 16, 17] have found that pre-service teachers do not always possess the conceptual understanding of the mathematics content they will be expected to teach. Colleges have not yet been successful in helping students become confident and competent in their teaching of some topics in mathematics [8, 18, 19, 20]. A study which focused on mathematical achievement of pre-service teachers, found out that pre-service teachers had a limited understanding of mathematics [21]. This finding of a basic level of mathematic coursework supports another work which found that teachers only had a cursory understanding of mathematics and lacked the ability to elucidate important concepts [22].
The researcher as a mathematics tutor in a Ghanaian Colleges of Education (CoEs) had observed how pre-service teachers struggled to grasp concepts during lessons. Colleague tutors in other CoEs have also complained about the quality of pre-service teachers they were training. A study conducted by several researchers [23] on behalf of the Professional Board of the Institute of Education, University of Cape Coast, identified the weak qualifications of entrants to colleges of education as one of the major factors of the prospective teachers’ poor achievement in the end of training assessment as well as their overall preparedness to teach during their internship. They felt their performances were not up to expectation because of their background in mathematics. Also, there still remain significant number of students still trying to rewrite mathematics examination just for them to proceed to the next level in their academic journey [24]. Evidence abounds that many teachers enter the classroom without a comprehensive
18
understanding of mathematics [25, 26, 27, 28]. These concerns had been confirmed by the Diploma in Basic Education (DBE) Chief Examiner’s report which pointed out that the general performance of the majority of candidates in their method course (Teaching Primary and Junior High secondary mathematics) was not satisfactory, in that, only a limited number of the candidates exhibited good mastery in areas tested as observed by the Institute of Education of the University of Cape Coast [10, 11, 12]. This is to say that the performance of pre-service teachers at the CoEs is nothing different from the performance of students at the basic level. This challenge if not looked into and curbed will jeopardize mathematics education in Ghana. Just as the problem of poor performance in mathematics can possibly be traced to pre-service teachers’ lack of mathematical knowledge, the variables ((ELMK, MCK and ELMK) that contribute to the pre-service teachers’ mathematical knowledge for teaching (MKT) is less researched into. For this reason, this study analyzed the relationship between entry-level mathematical knowledge (ELMK) and mathematics content knowledge (MCK) cum mathematics pedagogical content knowledge (MPCK) scores of Ghanaian pre-service teachers in CoEs. Thus, it addressed the question, “What is the predictive validity of pre-service teachers’ college entry level mathematical content knowledge (ELMCK) on their mathematics content knowledge (MCK) and mathematics pedagogical content knowledge (MPCK)?”
Materials and Methods This is a quantitative research which adopted
the cross-sectional survey design. The rationale for using the design was that it relied on large-scale data from a representative sample of a population with the aim of describing the nature of existing conditions [29]. The target population was three thousand, three hundred and forty (3342) second-year or level 200 pre-service teachers in forty-six (46) public colleges of education in Ghana. Multi-stage sampling was used in sampling nine hundred and ninety-eight (n = 998, 30%) second year pre-service teachers from ten (10) conveniently selected public colleges of education for the study. These colleges were categorized into three geographical clusters of the Republic of Ghana, namely; the Southern, Central and Northern belts. Purposive sampling was used to pick level 200 students. The
second-year group was purposively chosen because, with the curriculum of colleges of education, methodology courses which are actually pedagogical knowledge of the various subject areas are taught in second year besides the content knowledge studied in level 100. A combination of stratified and simple random sampling techniques was used to sample 998 (30%) pre-service teachers of the target population. The stratified sampling technique was used to categories and select the respondents based on gender. The simple random sampling technique using the lottery approach was then used to select 645 (65%) males and 353 (35%) female students from the sampled colleges of education. The choice of 15% of the population is based on the assertion that a sample size of 5 to 30 percent of the accessible population is appropriate for a descriptive survey [30]. Again, the sample size was deemed representative of the target population based on the recommendation that a sample size of 10% to 20% of the target population is representative in descriptive research [31].
Structured questionnaire, mathematics test items and unstructured observation schedule developed by the researcher were used to collect data for the study. These instruments were used because of the explorative and descriptive nature of the study. The instruments were pilot tested on twenty (20) level 200 students from Ada College of Education which did not form part of the actual field study. Internal consistency was tested on the questionnaire by means of Cronbach alpha statistics by means of Cronbach alpha reliability analysis via the Statistical Package for Social Sciences (SPSS) software version 22, and this yielded a Cronbach’s alpha reliability coefficient (𝛼) of 0.895. Secondary data was also collected in the form of mathematics test results from Institute of Education at University of Cape Coast. The data were described using descriptive statistics (frequency count, percentage, standard deviation) as well as inferential statistics (Pearson’s correlation test, paired-samples t-test, regression analysis) which were computed at a significance level (p-value) of p ≤ 0.05 (2-tailed) at a confidence interval (C.I) of 95% with a margin of error of ± 5. The statistical analysis was done with the aid of SPSS software version 22. The variables or constructs of interest in this study are: ELMCK, MCK and PMCK. ELMCK measures achievement (grade) in core
19
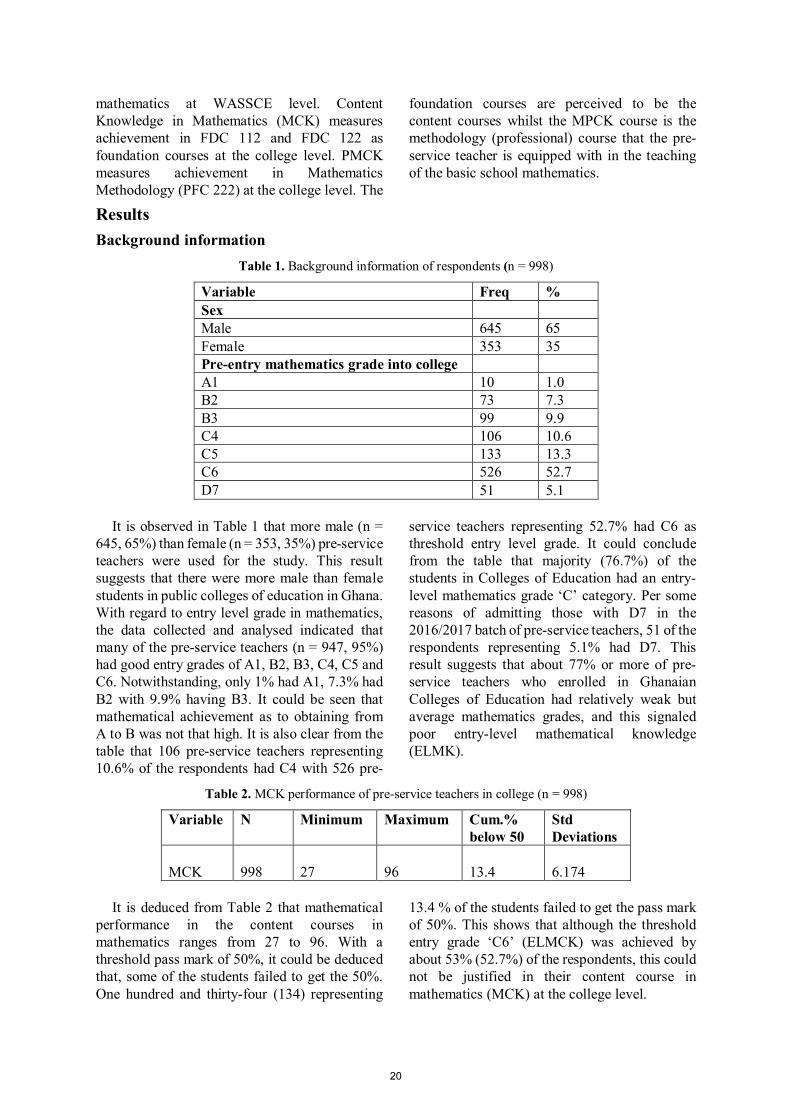
mathematics at WASSCE level. Content Knowledge in Mathematics (MCK) measures achievement in FDC 112 and FDC 122 as foundation courses at the college level. PMCK measures achievement in Mathematics Methodology (PFC 222) at the college level. The
foundation courses are perceived to be the content courses whilst the MPCK course is the methodology (professional) course that the pre-service teacher is equipped with in the teaching of the basic school mathematics.
Results Background information
Table 1. Background information of respondents (n = 998)
Variable Freq % Sex Male 645 65 Female 353 35 Pre-entry mathematics grade into college A1 10 1.0 B2 73 7.3 B3 99 9.9 C4 106 10.6 C5 133 13.3 C6 526 52.7 D7 51 5.1
It is observed in Table 1 that more male (n = 645, 65%) than female (n = 353, 35%) pre-service teachers were used for the study. This result suggests that there were more male than female students in public colleges of education in Ghana. With regard to entry level grade in mathematics, the data collected and analysed indicated that many of the pre-service teachers (n = 947, 95%) had good entry grades of A1, B2, B3, C4, C5 and C6. Notwithstanding, only 1% had A1, 7.3% had B2 with 9.9% having B3. It could be seen that mathematical achievement as to obtaining from A to B was not that high. It is also clear from the table that 106 pre-service teachers representing 10.6% of the respondents had C4 with 526 pre-
service teachers representing 52.7% had C6 as threshold entry level grade. It could conclude from the table that majority (76.7%) of the students in Colleges of Education had an entry-level mathematics grade ‘C’ category. Per some reasons of admitting those with D7 in the 2016/2017 batch of pre-service teachers, 51 of the respondents representing 5.1% had D7. This result suggests that about 77% or more of pre-service teachers who enrolled in Ghanaian Colleges of Education had relatively weak but average mathematics grades, and this signaled poor entry-level mathematical knowledge (ELMK).
Table 2. MCK performance of pre-service teachers in college (n = 998)
Variable N Minimum Maximum Cum.% below 50
Std Deviations
MCK
998
27
96
13.4
6.174
It is deduced from Table 2 that mathematical
performance in the content courses in mathematics ranges from 27 to 96. With a threshold pass mark of 50%, it could be deduced that, some of the students failed to get the 50%. One hundred and thirty-four (134) representing
13.4 % of the students failed to get the pass mark of 50%. This shows that although the threshold entry grade ‘C6’ (ELMCK) was achieved by about 53% (52.7%) of the respondents, this could not be justified in their content course in mathematics (MCK) at the college level.
20
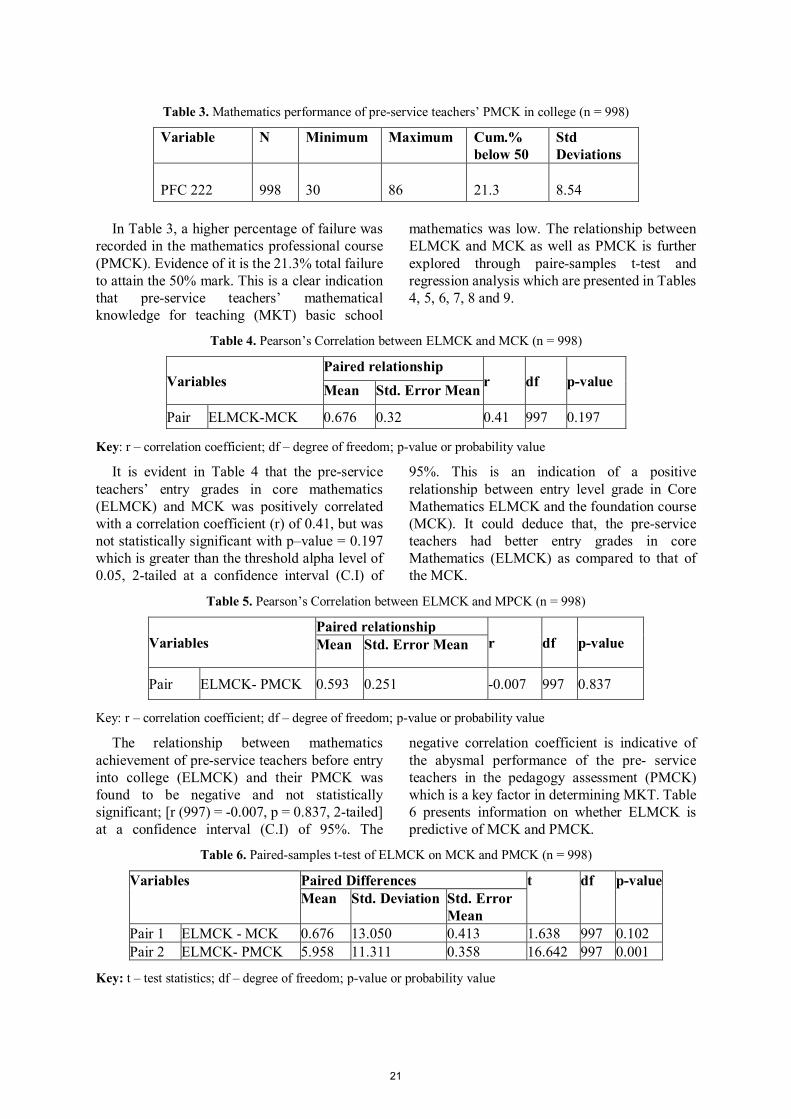
Table 3. Mathematics performance of pre-service teachers’ PMCK in college (n = 998)
Variable N Minimum Maximum Cum.% below 50
Std Deviations
PFC 222
998
30
86
21.3
8.54
In Table 3, a higher percentage of failure was
recorded in the mathematics professional course (PMCK). Evidence of it is the 21.3% total failure to attain the 50% mark. This is a clear indication that pre-service teachers’ mathematical knowledge for teaching (MKT) basic school
mathematics was low. The relationship between ELMCK and MCK as well as PMCK is further explored through paire-samples t-test and regression analysis which are presented in Tables 4, 5, 6, 7, 8 and 9.
Table 4. Pearson’s Correlation between ELMCK and MCK (n = 998)
Variables Paired relationship
r df p-value Mean Std. Error Mean
Pair ELMCK-MCK 0.676 0.32 0.41 997 0.197
Key: r – correlation coefficient; df – degree of freedom; p-value or probability value
It is evident in Table 4 that the pre-service teachers’ entry grades in core mathematics (ELMCK) and MCK was positively correlated with a correlation coefficient (r) of 0.41, but was not statistically significant with p–value = 0.197 which is greater than the threshold alpha level of 0.05, 2-tailed at a confidence interval (C.I) of
95%. This is an indication of a positive relationship between entry level grade in Core Mathematics ELMCK and the foundation course (MCK). It could deduce that, the pre-service teachers had better entry grades in core Mathematics (ELMCK) as compared to that of the MCK.
Table 5. Pearson’s Correlation between ELMCK and MPCK (n = 998)
Variables Paired relationship
r df p-value Mean Std. Error Mean
Pair ELMCK- PMCK 0.593 0.251 -0.007 997 0.837
Key: r – correlation coefficient; df – degree of freedom; p-value or probability value
The relationship between mathematics achievement of pre-service teachers before entry into college (ELMCK) and their PMCK was found to be negative and not statistically significant; [r (997) = -0.007, p = 0.837, 2-tailed] at a confidence interval (C.I) of 95%. The
negative correlation coefficient is indicative of the abysmal performance of the pre- service teachers in the pedagogy assessment (PMCK) which is a key factor in determining MKT. Table 6 presents information on whether ELMCK is predictive of MCK and PMCK.
Table 6. Paired-samples t-test of ELMCK on MCK and PMCK (n = 998)
Variables Paired Differences t df p-value Mean Std. Deviation Std. Error
Mean Pair 1 ELMCK - MCK 0.676 13.050 0.413 1.638 997 0.102 Pair 2 ELMCK- PMCK 5.958 11.311 0.358 16.642 997 0.001
Key: t – test statistics; df – degree of freedom; p-value or probability value
21
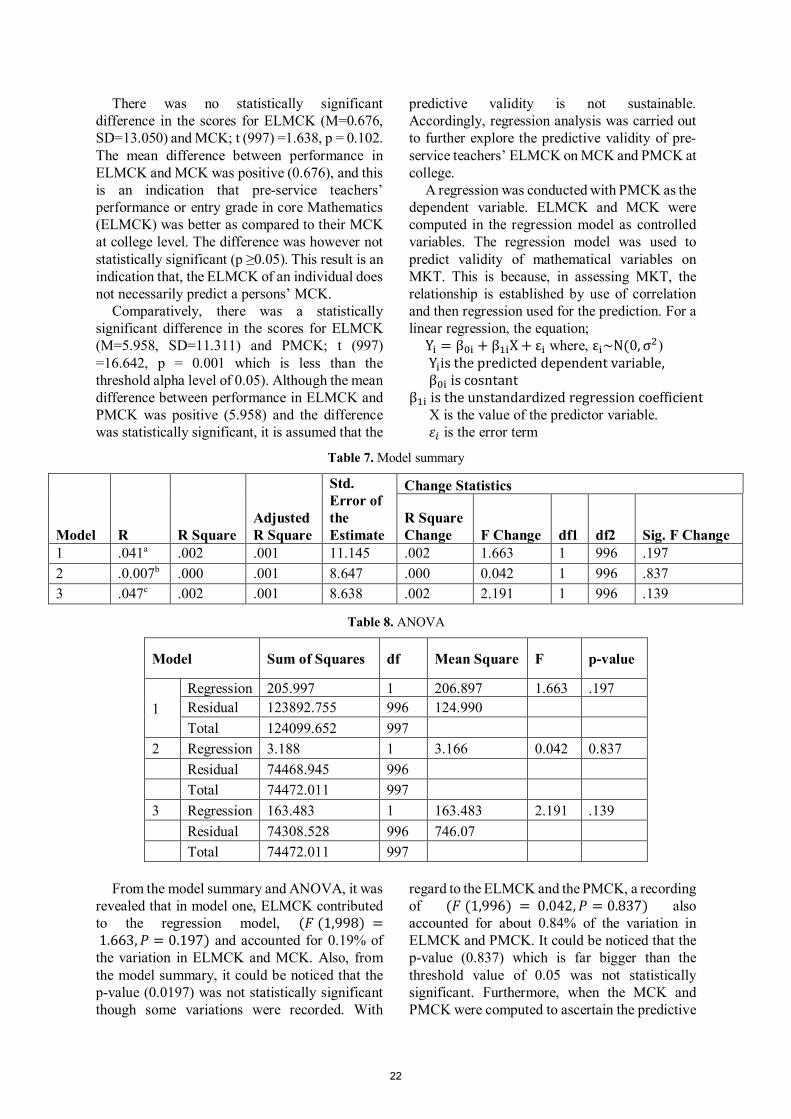
There was no statistically significant difference in the scores for ELMCK (M=0.676, SD=13.050) and MCK; t (997) =1.638, p = 0.102. The mean difference between performance in ELMCK and MCK was positive (0.676), and this is an indication that pre-service teachers’ performance or entry grade in core Mathematics (ELMCK) was better as compared to their MCK at college level. The difference was however not statistically significant (p ≥0.05). This result is an indication that, the ELMCK of an individual does not necessarily predict a persons’ MCK.
Comparatively, there was a statistically significant difference in the scores for ELMCK (M=5.958, SD=11.311) and PMCK; t (997) =16.642, p = 0.001 which is less than the threshold alpha level of 0.05). Although the mean difference between performance in ELMCK and PMCK was positive (5.958) and the difference was statistically significant, it is assumed that the
predictive validity is not sustainable. Accordingly, regression analysis was carried out to further explore the predictive validity of pre-service teachers’ ELMCK on MCK and PMCK at college.
A regression was conducted with PMCK as the dependent variable. ELMCK and MCK were computed in the regression model as controlled variables. The regression model was used to predict validity of mathematical variables on MKT. This is because, in assessing MKT, the relationship is established by use of correlation and then regression used for the prediction. For a linear regression, the equation;
Yi = β0i + β1iX + εi where, εi~N(0, σ2) Yiis the predicted dependent variable, β0i is cosntant
β1i is the unstandardized regression coefficient X is the value of the predictor variable. 𝜀𝑖 is the error term
Table 7. Model summary
Model R R Square Adjusted R Square
Std. Error of the Estimate
Change Statistics
R Square Change F Change df1 df2 Sig. F Change
1 .041a .002 .001 11.145 .002 1.663 1 996 .197 2 .0.007b .000 .001 8.647 .000 0.042 1 996 .837 3 .047c .002 .001 8.638 .002 2.191 1 996 .139
Table 8. ANOVA
Model Sum of Squares df Mean Square F p-value
1 Regression 205.997 1 206.897 1.663 .197 Residual 123892.755 996 124.990
Total 124099.652 997
2 Regression 3.188 1 3.166 0.042 0.837 Residual 74468.945 996 Total 74472.011 997
3 Regression 163.483 1 163.483 2.191 .139 Residual 74308.528 996 746.07 Total 74472.011 997
From the model summary and ANOVA, it was revealed that in model one, ELMCK contributed to the regression model, (𝐹 (1,998) = 1.663, 𝑃 = 0.197) and accounted for 0.19% of the variation in ELMCK and MCK. Also, from the model summary, it could be noticed that the p-value (0.0197) was not statistically significant though some variations were recorded. With
regard to the ELMCK and the PMCK, a recording of (𝐹 (1,996) = 0.042, 𝑃 = 0.837) also accounted for about 0.84% of the variation in ELMCK and PMCK. It could be noticed that the p-value (0.837) which is far bigger than the threshold value of 0.05 was not statistically significant. Furthermore, when the MCK and PMCK were computed to ascertain the predictive
22
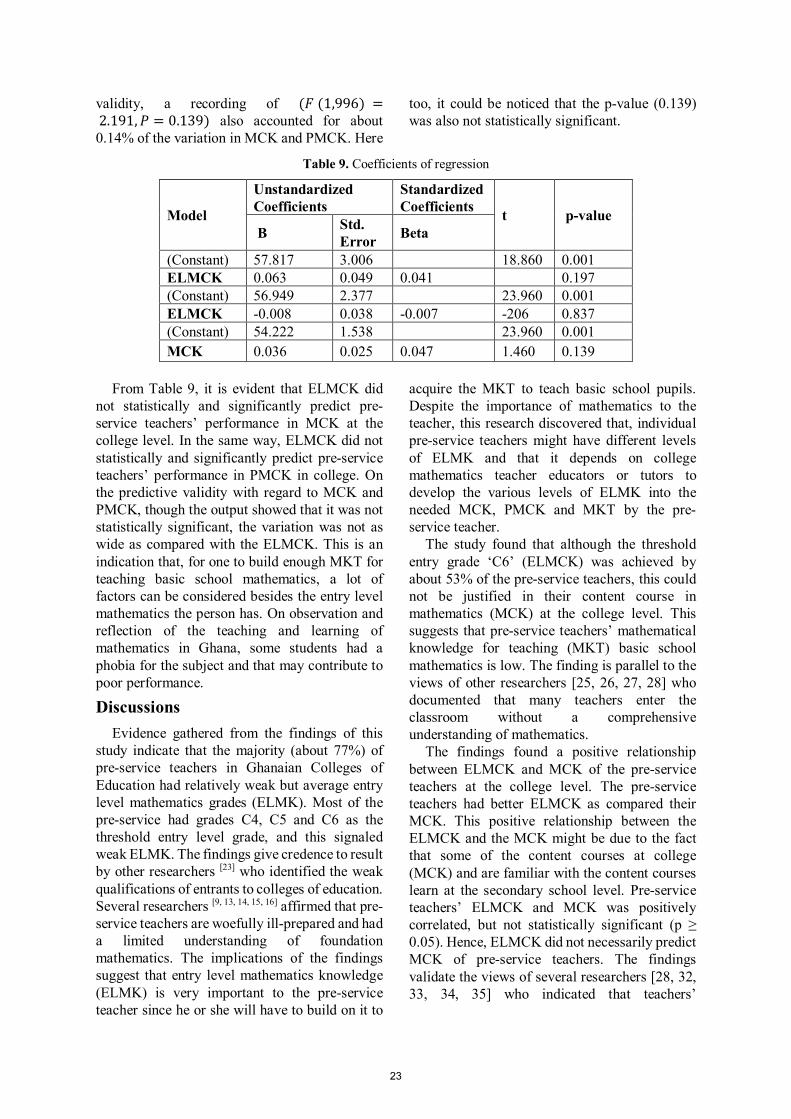
validity, a recording of (𝐹 (1,996) = 2.191, 𝑃 = 0.139) also accounted for about 0.14% of the variation in MCK and PMCK. Here
too, it could be noticed that the p-value (0.139) was also not statistically significant.
Table 9. Coefficients of regression
Model
Unstandardized Coefficients
Standardized Coefficients t p-value
B Std. Error Beta
(Constant) 57.817 3.006 18.860 0.001 ELMCK 0.063 0.049 0.041 0.197 (Constant) 56.949 2.377 23.960 0.001 ELMCK -0.008 0.038 -0.007 -206 0.837 (Constant) 54.222 1.538 23.960 0.001 MCK 0.036 0.025 0.047 1.460 0.139
From Table 9, it is evident that ELMCK did not statistically and significantly predict pre-service teachers’ performance in MCK at the college level. In the same way, ELMCK did not statistically and significantly predict pre-service teachers’ performance in PMCK in college. On the predictive validity with regard to MCK and PMCK, though the output showed that it was not statistically significant, the variation was not as wide as compared with the ELMCK. This is an indication that, for one to build enough MKT for teaching basic school mathematics, a lot of factors can be considered besides the entry level mathematics the person has. On observation and reflection of the teaching and learning of mathematics in Ghana, some students had a phobia for the subject and that may contribute to poor performance.
Discussions Evidence gathered from the findings of this
study indicate that the majority (about 77%) of pre-service teachers in Ghanaian Colleges of Education had relatively weak but average entry level mathematics grades (ELMK). Most of the pre-service had grades C4, C5 and C6 as the threshold entry level grade, and this signaled weak ELMK. The findings give credence to result by other researchers [23] who identified the weak qualifications of entrants to colleges of education. Several researchers [9, 13, 14, 15, 16] affirmed that pre-service teachers are woefully ill-prepared and had a limited understanding of foundation mathematics. The implications of the findings suggest that entry level mathematics knowledge (ELMK) is very important to the pre-service teacher since he or she will have to build on it to
acquire the MKT to teach basic school pupils. Despite the importance of mathematics to the teacher, this research discovered that, individual pre-service teachers might have different levels of ELMK and that it depends on college mathematics teacher educators or tutors to develop the various levels of ELMK into the needed MCK, PMCK and MKT by the pre-service teacher.
The study found that although the threshold entry grade ‘C6’ (ELMCK) was achieved by about 53% of the pre-service teachers, this could not be justified in their content course in mathematics (MCK) at the college level. This suggests that pre-service teachers’ mathematical knowledge for teaching (MKT) basic school mathematics is low. The finding is parallel to the views of other researchers [25, 26, 27, 28] who documented that many teachers enter the classroom without a comprehensive understanding of mathematics.
The findings found a positive relationship between ELMCK and MCK of the pre-service teachers at the college level. The pre-service teachers had better ELMCK as compared their MCK. This positive relationship between the ELMCK and the MCK might be due to the fact that some of the content courses at college (MCK) and are familiar with the content courses learn at the secondary school level. Pre-service teachers’ ELMCK and MCK was positively correlated, but not statistically significant (p ≥ 0.05). Hence, ELMCK did not necessarily predict MCK of pre-service teachers. The findings validate the views of several researchers [28, 32, 33, 34, 35] who indicated that teachers’
23
background subject knowledge directly influences students’ achievement.
The study established a negative correlation between ELMCK and PMCK of the pre-service teachers. This finding is indicative of the abysmal performance of the pre- service teachers in the pedagogy assessment (PMCK) which is a key factor in determining MKT. Notwithstanding, ELMCK significantly predicts PMCK of pre-service teachers (p ≤ 0.05) but the effect size was statistically negligible and not sustainable. Several researchers [28, 32, 33, 34, 35] made similar findings. The performance of pre-service teachers in the PMCK was abysmal because it is assumed that PMCK is a new area to the pre-service teachers. The researcher also shares same view that the PMCK course is new to the pre-service teachers and therefore they could not grasp it immediately. The findings suggest that for pre-service teachers to build adequate MKT for teaching basic school mathematics, a lot of factors need to be considered besides the entry level mathematics knowledge (ELMK) of the pre-service teacher. A casual observation and reflection by the researcher points to the issue of phobia for mathematics by some students during the teaching and learning of mathematics in Ghana; this might contribute to poor performance in MCK and PMCK. Should these pre-service teachers fail woefully in these courses (MCK and PMCK), and then what will be the guarantee that they will have the need MKT to teach it in the basic school? In this regard, PMCK must be taken serious in Ghanaian Colleges of Education and more time must be allocated to it by policy makers for strong MKT to be built.
Conclusions It could be concluded from the study that,
CoEs in Ghana admit pre-service teachers with average but weak background in mathematics (ELMK). Again, the performance of pre-service teachers in ELMCK and MPCK as well as MKT is partly dependent on ELMK of pre-service teachers and various factors such as mathematics phobia and pre-service teachers’ attitudes to mathematics. It is believed that many pre-service teachers, who are trained in CoEs in Ghana to teach mathematics in basic schools after college, are without firm grounding in MKT. For pre-service teachers in Ghana to take up the job of teaching mathematics to basic school pupils, there should be a level of combination of different
theories which should in turn be translated to practice. In this regard, pre-service should be given ample time for professional or pedagogical practice during internship or teaching practice (practicum) while in training. In view of the findings and conclusions drawn from the study, the following recommendations are put forward:
1. The Ghana Tertiary Education Commission (GTEC), which was hitherto known as the National Council for Tertiary Education (NCTE) and the National Accreditation Board (NAB) in liaison with the Principals of Colleges of Education in Ghana should peg the entry grade (ELMK) of C6, and D7 in mathematics for especially those who will not be specializing in mathematics.
2. Mathematics tutors in Ghanaian Colleges of Education should organize remedial lessons for pre-service teachers to scale-up their mathematics content knowledge (MCK), procedural and pedagogical knowledge or professional mathematics content knowledge (PMCK). This would step up their mathematical knowledge for teaching (MKT) mathematics in Ghanaian basic schools.
3. Mathematics tutors in Ghanaian Colleges of Education in collaboration with Principals of Colleges of Education should re-organize the internship programme of the colleges of education to make them more effective in training pre-service teachers who specialize in mathematics and other subject areas.
4. Mathematics tutors in Ghanaian Colleges of Education in collaboration with Principals of Colleges of Education and Ghana Tertiary Education Commission (GTEC) should structure and introduce the methodology course (PMCK) alongside the content course (MCK) for pre-service teachers since the separation of content and method courses often create disconnect for pre-service teachers and tutors as well as researchers. This is to ensure that more time is given to the pre-service teachers to explore MKT in a manner in which they are expected to teach.
5. It is also recommended that The National Council for Tertiary Education (NCTE) design and provide official textbooks and tutor’s handbooks for the CoEs to ensure that MCK and PMCK topics are treated in a more practical way.
6. A national committee of experts in mathematics should be put together by GTEC
24
and NCTE to collaborate with the Ghana Education Service (GES) to consider the drastic reduction in the mathematics syllabus at the basic school level with a view to have fewer topics to ensure in-depth treatment of the topics which should lead to better understanding of mathematical concepts and relevant applications to everyday living. This will help pre-service teachers have fewer topics to cover but with in-depth understanding and mastery to develop their MKT.
References [1] Narh-Kert, M., & Ampadu, E. (2020). Assessing factors influencing pre-service teachers’ mathematical knowledge for teaching (MKT) mathematics in Ghanaian basic schools. Texila International Journal
of Academic Research, 7(1), 46-60. [2] Tatto, M., Schwille, J., Senk, S., Ingvarason, L., Peck, R., & Rowley, G. (2008). Teacher education and development study in mathematics (TEDS-M): Policy, practice, and readiness to teach primary and secondary mathematics. Conceptual framework. East Lansing: Teacher Education and Development International Study Center, College of Education, Michigan University. [3] Shulman, L. S. (1986). Those who understand: Knowledge growth in teaching. Educational Researcher, 15(2), 4–14. [4] Finlayson, M. (2014). Addressing math anxiety in the classroom. Improving Schools, 17(1), 99-115. [5] Goldsmith, L., Doerr, H., & Lewis, C. (2014). Mathematics teachers’ learning: A conceptual framework and synthesis of research. Journal of Mathematics Teacher Education, 17, 5–36. [6] Rowan‐Kenyon, H. T., Swan, A. K., & Creager, M. F. (2012). Social cognitive factors, support, and engagement: Early adolescents’ math interests as precursors to choose of career. The Career Development Quarterly, 60(1), 2-15. [7] Tsanwani, A., Harding, A., Engelbrecht, J., & Maree, K. (2014). Perceptions of teachers and learners about factors that facilitate learners' performance in mathematics in South Africa. African Journal of Research in Mathematics, Science and Technology Education, 18(1), 40-51. [8] Akyeampong, K., Lussier, K., Pryor, J., & Westbrook, J. (2013). Improving teaching and learning of basic mathematics and reading in Africa: Does teacher preparation count? International Journal of Educational Development, 33(3), 272-282.
[9] Akyeampong A. K. (2003). Teacher training in Ghana: Does it count? MUSTER Report One. Sussex-
Centre for International Education, University of
Sussex. [10] Institute of Education, University of Cape Coast (2016). Diploma in Basic Education. Chief
Examiner’s Report.
[11] Institute of Education, University of Cape Coast (2017). Diploma in Basic Education. Chief Examiner’s Report. [12] Institute of Education, University of Cape Coast (2018). Diploma in Basic Education. Chief Examiner’s Report. [13] Carrillo, J. (2011). Building mathematical knowledge in teaching by means of theorised tools: Mathematical knowledge in teaching. Dordrecht: Springer. [14] Asante, J. N., & Mereku, D. K. (2012). The effect of Ghanaian pre-service teachers’ content knowledge on their mathematical knowledge for teaching basic school mathematics. African Journal of Educational Studies in Mathematics and Sciences, 10(1), 23-37. [15] Rowland, T. (2013). The knowledge quartet: The genesis and application of a framework for analysing mathematics teaching and deepening teachers’ mathematics knowledge. Sisyphus-Journal of Education, 1(3), 15-43. [16] Maboya, M. J. (2014). The relationship between teachers' mathematical knowledge and their classroom practices: A case study on the role of manipulatives in South African primary schools. University of the Free State. An unpublished doctoral dissertation. [17] Howell, H., Lai, Y., Phelps, G., & Croft, A. (2016). Assessing mathematical knowledge for teaching beyond conventional mathematical knowledge: Do elementary models extend. In annual meeting of the American educational research association, Washington, DC. [18] Agyei, D. D., & Voogt, J. (2011). ICT use in the teaching of mathematics: Implications for professional development of pre-service teachers in Ghana. Education and information technologies, 16(4), 423-439. [19] Agyei, D. D. (2012). Preparation of pre-service teachers in Ghana to integrate information and communication technology in teaching mathematics. University of Twente, Enschede. The Netherlands. An unpublished doctoral dissertation. [20] Instefjord, E., & Munthe, E. (2016). Preparing pre-service teachers to integrate technology: an analysis of the emphasis on digital competence in teacher education curricula. European Journal of Teacher Education, 39(1), 77-93.
25
[21] Rosas, C., & Campbell, L. (2010). Who’s teaching math to our most needy students? A descriptive study. Teacher Education and Special Education, 33(2), 102-113. [22] Floden, R., & Menikeetti, M. (2005). Research on the effects of coursework in the arts and sciences and in the foundations of education. In M. Cochran-Smith, & K. Zeichner (Eds.), Studying teacher education: The report of the AERA panel on research and teacher education (pp. 261-309). Mahwah, New Jersey: Lawrence Erlbaum Associates, Publishers. [23] Ossei-Anto, T. A., Fletcher, J. A., Annan-Noonoo, G., & Korankye, E. (2013a). Post situational report on colleges of education students’ poor performance in science and mathematics. A research report presented to the Professional Board, University of Cape Coast Institute of Education. [24] Mason, J. (2016). Rising above a cause-and-effect stance in mathematics education research. Journal of Mathematics Teacher Education, 19, 297–300. [25] Ball, D. L., & Bass, H. (2000). Interviewing content and pedagogy in teaching and learning to teach: Knowing and using mathematics. In J. Boaler (Ed.), Multiple perspectives on the teaching and learning of mathematics (pp. 83-104). Westport, CT: Ablex. [26] Ball, D. L. (1990). The mathematics understandings that prospective teachers bring to teacher Education. Elementary School Journal, 90(4), 449-466. [27] Hill, H. C., Rowan, B., & Ball, D. L. (2005). Effects of teachers’ mathematical knowledge for
teaching on student achievement. American Educational Research Journal, 42(2), 371-406. [28] Usiskin, Z. (2001). Teachers’ mathematics: A collection of content deserving to be a field. The Mathematics Educator, 6(1), 85-97. [29] Cohen, L., Manion, L., & Morrison, K. (2011). Research methods in education (7th ed.). USA and Canada: Routledge. [30] Saunders, M., Lewis, P., & Thornhill, A. (2007). Research methods for business students (4th ed.). England: Pearson Education Limited. [31] Gay, L. R., & Airasian, P. (2003). Educational research: Competencies for analysis and applications (7th ed.). Upper Saddle River, NJ: Pearson Education, Inc. [32] Barth, P. (2002). Add it up: Mathematics education in the U.S. does not compute. Thinking K 16, 6(1), Presented at the 12th Educational Trust National Conference, Washington, DC. [33] Darling-Hammond, L., & Bransford, J. (2005). Preparing teachers for a changing world: What teachers should learn and be able to do. San Francisco: Jossey Bass. [34] Heritage, M., & Vendlinski, T. (2006). Measuring teachers’ mathematical knowledge. CSE technical report 696. LA, the Regents of the University of California. [35] National Mathematics Advisory Panel (2008). Foundations for success: The final report of the national mathematics advisory panel, U.S. Washington, D.C: Department of Education.
26
Texila International Journal of Academic research ISSN: 2520-3088
DOI: 10.21522/TIJAR.2014.07.02.Art004
Validation of Non-Linear Relationships-Based UTAUT Model on Higher Distance Education Students’ Acceptance of WhatsApp for Supporting
Learning
Douglas Yeboah1*, Paul Nyagorme2
1Cape Coast study center, Institute for Distance and e-Learning (IDeL), University of Education, Winneba, Ghana
2Maths, Science and ICT Department, College of Distance Education, University of Cape Coast, Ghana
*Corresponding Author: [email protected]
Abstract This study examined relationships among the exogenous constructs of the Unified Theory of
Acceptance and Use of Technology (UTAUT) model to identify those that significantly predict others.
Questionnaires were used to collect data from 273 distance education students pursuing various
diploma, bachelor’s degree and post-graduate diploma programs at the Cape Coast study center of the
Institute for Distance and e-Learning (IDeL) of the University of Education, Winneba in Ghana.
Proportional stratified random sampling technique was employed to obtain the sample of students. The
data were analyzed using Partial Least Squares – Structural Equation Modeling (PLS-SEM). The
results indicated that in acceptance of WhatsApp for supporting higher distance learning, effort
expectancy and social influence predict performance expectancy; mobile self-efficacy and facilitating
conditions predict effort expectancy; and facilitating conditions predict social influence. Also, mobile
self-efficacy was found to significantly predict behavioral intention. We recommend that prior to
introduction of a new technology such as WhatsApp for supporting learning, necessary resources and
training should be provided by educational administrators and faculty to the students. This would make
the students perceive that they can use the technology effectively to bring about gains in their learning;
and subsequently accept the technology.
Keywords: technology acceptance, WhatsApp for learning, WhatsApp in distance education, structural
equation modeling, exogenous variables.
Introduction Teaching and learning in educational
institutions at all levels have undergone a changing trend from face-to-face modes of delivery to different degrees of blended and distance education modes. This trend of evolution in education is greatly influenced by emerging disruptive technologies. Educationists and researchers all over the world seek new ways of supporting students’ learning with emerging technologies. One ubiquitous technology that is accessible to higher distance education students in various parts of the world, especially in Ghana, is WhatsApp messenger mobile application. Some researchers such as [1], [2], [3], [4] and [5] have found educational benefits of using WhatsApp to support learning in higher education contexts.
As in the case of many new technologies, successful implementation of WhatsApp as a learning support tool requires acceptance from students who are the pivot of the teaching and learning processes. It is therefore pertinent for faculty and educational administrators to understand factors that could influence students to adopt WhatsApp as learning support tool before deciding on implementation. Several models and theories have been developed over the years which attempt to explain technology acceptance. One such models is Unified Theory of Acceptance and Use of Technology (UTAUT) [6]. This model explains that intention to adopt a new technology is determined by performance expectancy, effort expectancy and social influence. Also, actual use of a technology is determined by behavioral intention and facilitating conditions. The variables that predict
27
others are referred to as exogenous variables, whereas the predicted variables are endogenous variables.
The UTAUT model involved only relationships (referred to as linear relationships) between the exogenous variables and endogenous variables. However, [7] proposed non-linear relationships among some exogenous variables of the original UTAUT model. As a result, they proposed a modified linear and non-linear relationships-based UTAUT model that included non-linear relationships. Although before this current study, many studies had been conducted to validate the original UTUAT model proposed by [6], no other studies had been conducted to validate the linear and non-linear relationships-based UTAUT model that [7] proposed in different contexts.
The current study sought to validate the linear and non-linear relationships-based UTAUT model proposed by [7]. The findings of this study will hopefully contribute to the understanding of the linear and non-linear relationships among exogenous and endogenous constructs of the UTAUT model in the context of adoption of WhatsApp for supporting learning in higher distance education. The same knowledge will form a basis for understanding adoption of other technologies as well.
Research Objectives
1. To determine which of the exogenous constructs in the UTAUT model have significant non-linear relationships regarding Distance Education students’ behavioral intention to use WhatsApp for learning purposes.
2. To determine whether mobile self-efficacy predicts behavioral intention in the non-linear relationship-based UTAUT model with respect to acceptance of WhatsApp chat by distance education students for supporting learning.
Model Development and Hypotheses Formulation
The original formulators of the UTAUT model [6] proposed and validated existence of direct linear predictive relationships between the independent and dependent constructs. These relationships were further validated and confirmed by subsequent researches over the past years. A new development regarding the
predictive relationships among the UTAUT constructs is the possible existence of non-linear predictive relationships among the exogenous constructs of the UTAUT model. [7] proposed the existence of these non-linear relationships based on existing literature. The results of their study confirmed significance of some these non-linear relationships. This section reviews the bases for the proposition of existence of non-linear relationships among the UTAUT exogenous constructs.
Effort Expectancy and Performance Expectancy
The proposition of non-linear relationship between effort expectancy and performance expectancy is based on the Technology Acceptance Model developed by [8]. This model identifies two major belief constructs that are crucial in predicting the attitude of a potential user toward acceptance of a computer technology. These are perceived usefulness and perceived ease of use. Perceived usefulness refers to the extent to which a potential user of a given technology believes that using the technology would result in improvement in the performance of his or her job. Perceived ease of use also refers to how a potential user of a technology believes that he or she could use the technology without physical or mental effort.
The construct perceived ease of use is postulated to have a predictive effect on perceived usefulness. [8] hypothesized a significant direct effect of perceived ease of use on perceived usefulness. This hypothesis was based on the reason that if the use of a given technology is easier for the users, they are more likely to have improvement in their job accomplishments. Thus, as productivity increases with easy use of a technology, the technology is perceived to be more useful for the designated job.
The constructs perceived ease of use and perceived usefulness in technology acceptance model are the root constructs from which the constructs effort expectancy and performance expectancy of the UTAUT model respectively were derived [6]. By virtue of the derivative of the UTAUT constructs from the technology acceptance model constructs, it is logical to expect the predictive relationship between perceived ease of use and perceived usefulness to replicate between effort expectancy and
28
performance expectancy as well. This relationship was hypothesized and tested by [7]
and their result indicated that effort expectancy determined performance expectancy. Their finding was consistent with [8]. In view of existing literature, this study seeks to validate this relationship by testing the null hypothesis that:
H01: Effort Expectancy does not predict Performance Expectancy
Mobile Self-Efficacy and Effort Expectancy
Self-efficacy is a social psychology concept defined as “judgements of how well one can execute courses of action required to deal with prospective situations” [9]. Before attempting to perform any action such as use of a technology, every individual has an inner perception of his or her ability or otherwise to perform the action. According to Badura, measurement of self-efficacy of an individual should be fashioned to the domain of psychological functioning under consideration [9]. Thus, in the domain of computer technology usage, computer self-efficacy can be considered; whereas mobile self-efficacy can be considered in the domain of mobile or smart phone technology usage.
In technology acceptance model, [10] proposed that perceived ease of use of a technology is determined by control, intrinsic motivation and emotion. The anchoring construct referred to as control consists of two kinds of beliefs – internal control and external control. Venkatesh conceptualized internal control as computer self-efficacy and external control as facilitating conditions. Thus, he established that at early stages of a computer technology usage, perceived ease of use of the computer technology is determined by both computer self-efficacy and facilitating conditions among others.
In the context of this study, the technology used was WhatsApp messenger which is a mobile phone application. Thus, the construct computer self-efficacy hypothesized by [10] as a determinant of perceived ease of use of a computer technology could be likened to mobile self-efficacy in the context of this study. In order to validate the predictive relationship between mobile self-efficacy and effort expectancy (perceived ease of use), a null hypothesis is tested that:
H02: Mobile self-efficacy does not predict Effort Expectancy.
Social Influence and Performance Expectancy
The construct social influence in the UTAUT model is a derivative of subjective norm in Technology Acceptance Model 2 [6], [11]. These terms connote the idea that the acceptance of a new technology by an individual is influenced by how he or she believes others will view him or her as a result of using the technology. If the perceived view of important others is positive, a prospective user is more likely to adopt the new technology whereas vice versa is also likely.
Performance expectancy is also derived from other constructs such as perceived usefulness in technology acceptance model, among others [6],
[11]. It refers to the belief an individual has that using a technology would result in improvement in job accomplishments.
Attempts to identify predictive relationship between social influence and performance expectancy were arguably pioneered by [12]. They hypothesized a positive direct effect of subjective norm on perceived usefulness in the formulate of Technology Acceptance Model 2. Their results confirmed the hypothesis, significantly moderated by experience. The predictive relationship between social influence and performance expectancy was subsequently tested by [7] using the UTAUT model. Contrary to Venkatesh and Davis, the results obtained by [7] showed non-significant relationship between the constructs social influence and performance expectancy. This study sought to validate this relationship by testing the null hypothesis that:
H03: Social Influence does not predict Performance Expectancy.
Facilitating Conditions and Performance Expectancy
Facilitating conditions were hypothesized by [7] to be a direct determinant of performance expectancy. The basis of their assertion was that availability of resources and favorable conditions for utilization of a new technology would make prospective users develop favorable attitude towards adoption of the technology and its usefulness. Thus, when prospective users perceive that organizational or institutional provisions are available to support the use of a new technology, the user are more likely to also perceive the technology as one that would require little or no effort in its utilization, and
29
subsequently more likely to yield gains in job performance. However, the results obtained by [7] from testing the hypothesis was contrary to their assertion. The predictive relationship between facilitating conditions and performance expectancy was not significant at the acceptable significant level (p<.05). This study therefore sought to validate this relationship by testing the null hypothesis that:
H04: Facilitating Conditions do not predict Performance Expectancy
Facilitating Conditions and Effort Expectancy
The relationship between facilitating conditions and effort expectancy was hypothesized by [10]. According to the author, facilitating conditions (referred to as external control beliefs) in the technology acceptance model positively determines ease of use perception (effort expectancy in UTAUT) about a new technology. The hypothesized effect of facilitating conditions on perceived ease of use was said to be more paramount particularly at the early stages of user experience with a new technology. Venkatesh tested the hypothesis using data collected from three different organizations over three months period and the data supported the hypothesis. The predictive relationship between facilitating conditions and effort expectancy was later tested by [7] using the UTAUT model and reported that facilitating conditions had a direct positive effect on effort expectancy of distance education tutors on Learning Management System usage. In order to validate this relationship in the context of this study, a null hypothesis was tested that:
H05: Facilitating Conditions do not predict Effort Expectancy.
Facilitating Conditions and Social Influence
In technology adoption, the construct facilitating conditions is perceived to have a potential of influencing the impact of social influence on target users of a novel technology in an organization. This assertion was held by [7]. In their view, the availability of conducive environment for the utilization of a new technology serve as motivation for important referents to encourage potential users or adopters of the technology to accept same. Thus, facilitating conditions likely has the potential to enhance the effect of social influence. Based on this premise, [7] tested the hypothesis that
“facilitating conditions will predict social influence” on the adoption of Learning Management System by distance education tutors. Their results supported this assertion. This study further sought to validate the UTAUT model on this postulation by testing the null hypothesis that:
H06: Facilitating Conditions do not predict Social Influence.
Mobile Self-Efficacy and Behavioral Intention
Mobile self-efficacy refers to the belief an individual has in his or her own ability to use mobile communication technologies such as mobile phone, tablet pc, etc. to perform some task [13]. This construct originated from the social cognitive theory of [14]. Bandura introduced the concept of self-efficacy as one’s belief in his or her own ability to successfully carry out a certain task.
Self-efficacy is more significant at the initial stages of one’s attempt to perform a novel activity. In educational application of mobile technologies, it is logical to expect that people who strongly believe in themselves that they have the ability to use mobile devices and applications would readily accept to utilize the technology in their studies, all other things being equal.
Similar to mobile self-efficacy in the use of mobile technologies is computer self-efficacy in the use of computers and their related technologies. Computer self-efficacy was hypothesized by [6] to have none-significant influence on behavioral intention to accept computer technology. The findings of their study supported their hypothesis, hence self-efficacy was excluded from the original UTAUT model.
Mobile self-efficacy is not a construct in the original UTAUT model, neither has it been theorized in any extended version of the UTAUT model as a direct determinant of behavioral intention in existing literature. It is however postulated in this study that in the adoption of WhatsApp messaging application for distance learning, mobile self-efficacy could play a significant role in predicting behavioral intention of the students to adopt the technology. In order to validate the UTAUT model on the predictive relationship between mobile self-efficacy and behavioral intention, this study tested a null hypothesis that:
H07: Mobile Self-Efficacy does not predict Behavioral Intention.
30
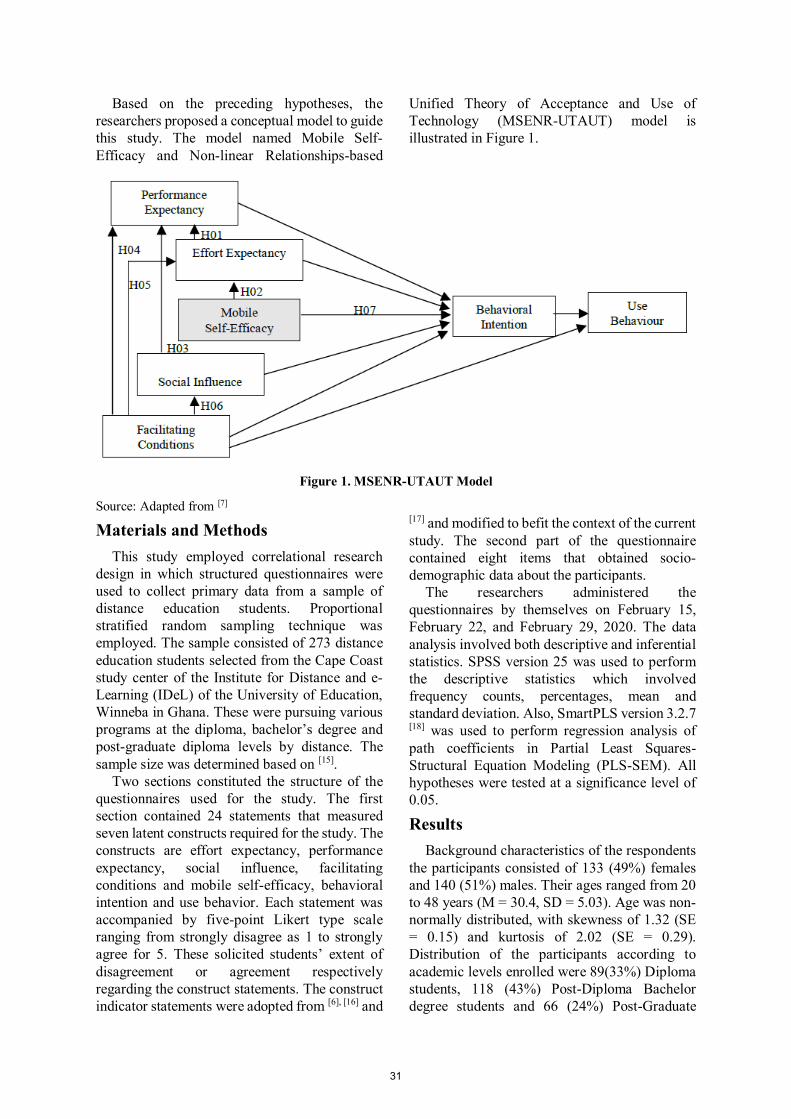
Based on the preceding hypotheses, the researchers proposed a conceptual model to guide this study. The model named Mobile Self-Efficacy and Non-linear Relationships-based
Unified Theory of Acceptance and Use of Technology (MSENR-UTAUT) model is illustrated in Figure 1.
Figure 1. MSENR-UTAUT Model
Source: Adapted from [7]
Materials and Methods This study employed correlational research
design in which structured questionnaires were used to collect primary data from a sample of distance education students. Proportional stratified random sampling technique was employed. The sample consisted of 273 distance education students selected from the Cape Coast study center of the Institute for Distance and e-Learning (IDeL) of the University of Education, Winneba in Ghana. These were pursuing various programs at the diploma, bachelor’s degree and post-graduate diploma levels by distance. The sample size was determined based on [15].
Two sections constituted the structure of the questionnaires used for the study. The first section contained 24 statements that measured seven latent constructs required for the study. The constructs are effort expectancy, performance expectancy, social influence, facilitating conditions and mobile self-efficacy, behavioral intention and use behavior. Each statement was accompanied by five-point Likert type scale ranging from strongly disagree as 1 to strongly agree for 5. These solicited students’ extent of disagreement or agreement respectively regarding the construct statements. The construct indicator statements were adopted from [6], [16] and
[17] and modified to befit the context of the current study. The second part of the questionnaire contained eight items that obtained socio-demographic data about the participants.
The researchers administered the questionnaires by themselves on February 15, February 22, and February 29, 2020. The data analysis involved both descriptive and inferential statistics. SPSS version 25 was used to perform the descriptive statistics which involved frequency counts, percentages, mean and standard deviation. Also, SmartPLS version 3.2.7 [18] was used to perform regression analysis of path coefficients in Partial Least Squares-Structural Equation Modeling (PLS-SEM). All hypotheses were tested at a significance level of 0.05.
Results Background characteristics of the respondents
the participants consisted of 133 (49%) females and 140 (51%) males. Their ages ranged from 20 to 48 years (M = 30.4, SD = 5.03). Age was non-normally distributed, with skewness of 1.32 (SE = 0.15) and kurtosis of 2.02 (SE = 0.29). Distribution of the participants according to academic levels enrolled were 89(33%) Diploma students, 118 (43%) Post-Diploma Bachelor degree students and 66 (24%) Post-Graduate
31
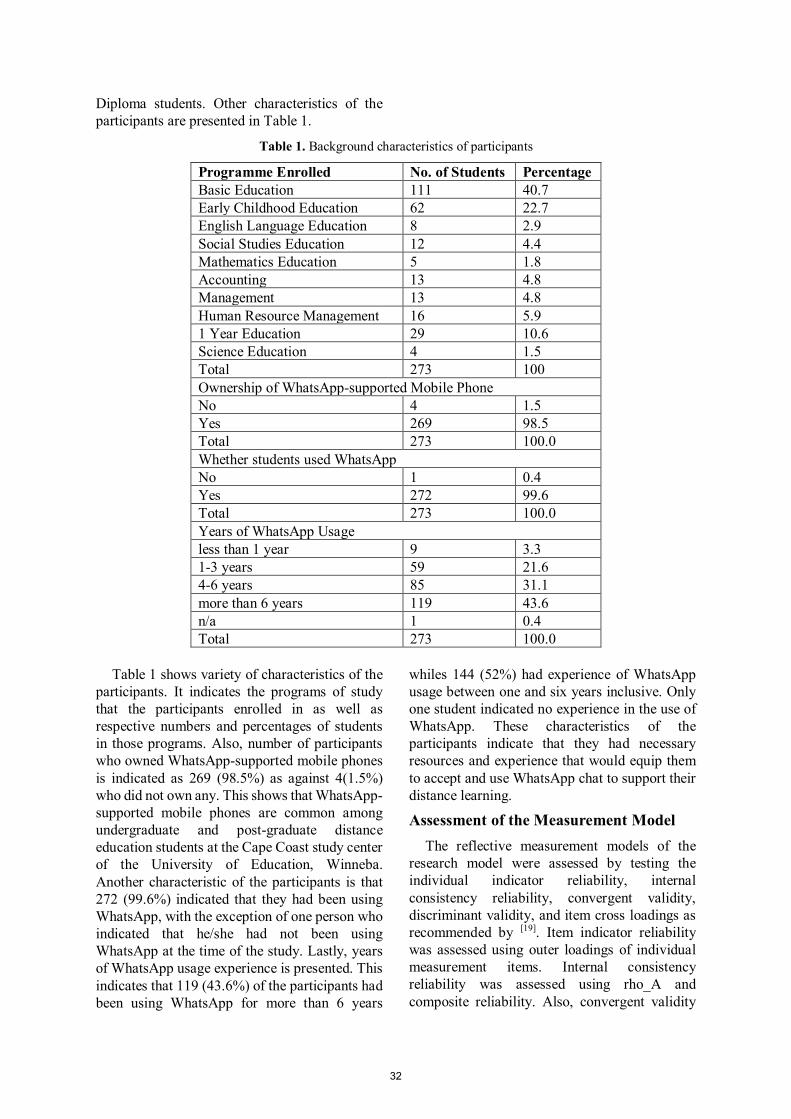
Diploma students. Other characteristics of the participants are presented in Table 1.
Table 1. Background characteristics of participants
Programme Enrolled No. of Students Percentage Basic Education 111 40.7 Early Childhood Education 62 22.7 English Language Education 8 2.9 Social Studies Education 12 4.4 Mathematics Education 5 1.8 Accounting 13 4.8 Management 13 4.8 Human Resource Management 16 5.9 1 Year Education 29 10.6 Science Education 4 1.5 Total 273 100 Ownership of WhatsApp-supported Mobile Phone No 4 1.5 Yes 269 98.5 Total 273 100.0 Whether students used WhatsApp No 1 0.4 Yes 272 99.6 Total 273 100.0 Years of WhatsApp Usage less than 1 year 9 3.3 1-3 years 59 21.6 4-6 years 85 31.1 more than 6 years 119 43.6 n/a 1 0.4 Total 273 100.0
Table 1 shows variety of characteristics of the participants. It indicates the programs of study that the participants enrolled in as well as respective numbers and percentages of students in those programs. Also, number of participants who owned WhatsApp-supported mobile phones is indicated as 269 (98.5%) as against 4(1.5%) who did not own any. This shows that WhatsApp-supported mobile phones are common among undergraduate and post-graduate distance education students at the Cape Coast study center of the University of Education, Winneba. Another characteristic of the participants is that 272 (99.6%) indicated that they had been using WhatsApp, with the exception of one person who indicated that he/she had not been using WhatsApp at the time of the study. Lastly, years of WhatsApp usage experience is presented. This indicates that 119 (43.6%) of the participants had been using WhatsApp for more than 6 years
whiles 144 (52%) had experience of WhatsApp usage between one and six years inclusive. Only one student indicated no experience in the use of WhatsApp. These characteristics of the participants indicate that they had necessary resources and experience that would equip them to accept and use WhatsApp chat to support their distance learning.
Assessment of the Measurement Model The reflective measurement models of the
research model were assessed by testing the individual indicator reliability, internal consistency reliability, convergent validity, discriminant validity, and item cross loadings as recommended by [19]. Item indicator reliability was assessed using outer loadings of individual measurement items. Internal consistency reliability was assessed using rho_A and composite reliability. Also, convergent validity
32
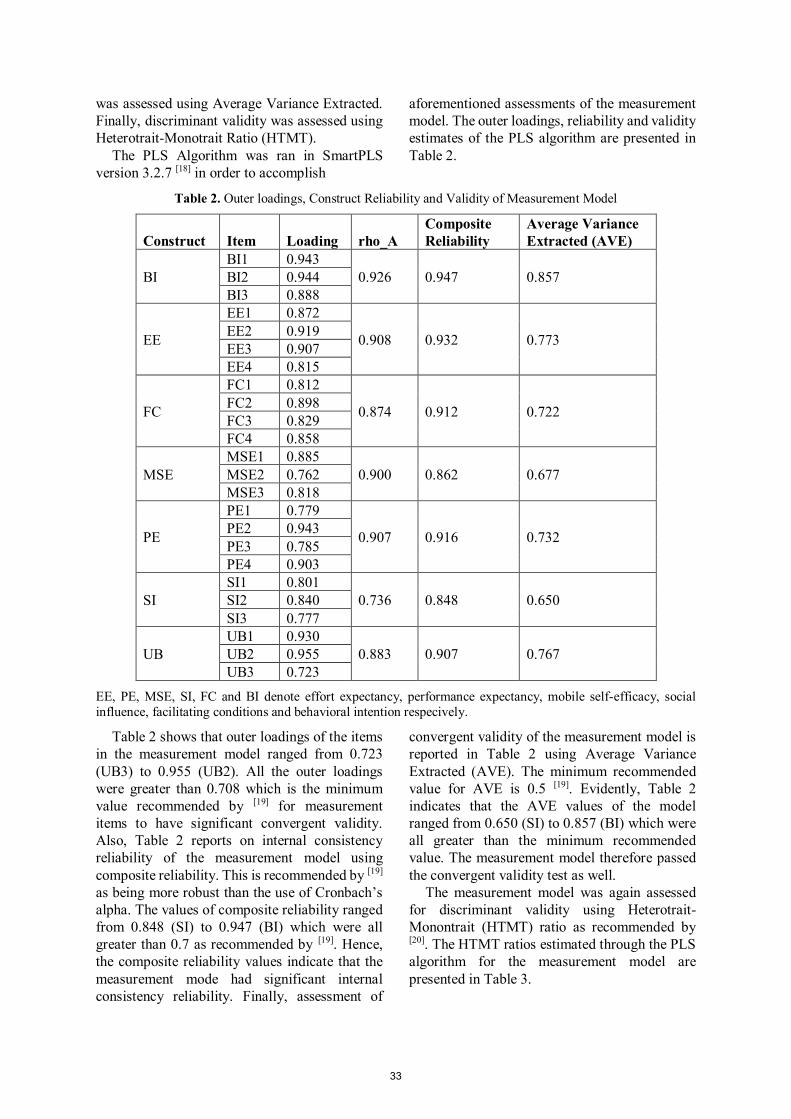
was assessed using Average Variance Extracted. Finally, discriminant validity was assessed using Heterotrait-Monotrait Ratio (HTMT).
The PLS Algorithm was ran in SmartPLS version 3.2.7 [18] in order to accomplish
aforementioned assessments of the measurement model. The outer loadings, reliability and validity estimates of the PLS algorithm are presented in Table 2.
Table 2. Outer loadings, Construct Reliability and Validity of Measurement Model
Construct Item Loading rho_A Composite Reliability
Average Variance Extracted (AVE)
BI BI1 0.943
0.926 0.947 0.857 BI2 0.944 BI3 0.888
EE
EE1 0.872
0.908 0.932 0.773 EE2 0.919 EE3 0.907 EE4 0.815
FC
FC1 0.812
0.874 0.912 0.722 FC2 0.898 FC3 0.829 FC4 0.858
MSE MSE1 0.885
0.900 0.862 0.677 MSE2 0.762 MSE3 0.818
PE
PE1 0.779
0.907 0.916 0.732 PE2 0.943 PE3 0.785 PE4 0.903
SI SI1 0.801
0.736 0.848 0.650 SI2 0.840 SI3 0.777
UB UB1 0.930
0.883 0.907 0.767 UB2 0.955 UB3 0.723
EE, PE, MSE, SI, FC and BI denote effort expectancy, performance expectancy, mobile self-efficacy, social influence, facilitating conditions and behavioral intention respecively.
Table 2 shows that outer loadings of the items in the measurement model ranged from 0.723 (UB3) to 0.955 (UB2). All the outer loadings were greater than 0.708 which is the minimum value recommended by [19] for measurement items to have significant convergent validity. Also, Table 2 reports on internal consistency reliability of the measurement model using composite reliability. This is recommended by [19] as being more robust than the use of Cronbach’s alpha. The values of composite reliability ranged from 0.848 (SI) to 0.947 (BI) which were all greater than 0.7 as recommended by [19]. Hence, the composite reliability values indicate that the measurement mode had significant internal consistency reliability. Finally, assessment of
convergent validity of the measurement model is reported in Table 2 using Average Variance Extracted (AVE). The minimum recommended value for AVE is 0.5 [19]. Evidently, Table 2 indicates that the AVE values of the model ranged from 0.650 (SI) to 0.857 (BI) which were all greater than the minimum recommended value. The measurement model therefore passed the convergent validity test as well.
The measurement model was again assessed for discriminant validity using Heterotrait-Monontrait (HTMT) ratio as recommended by [20]. The HTMT ratios estimated through the PLS algorithm for the measurement model are presented in Table 3.
33
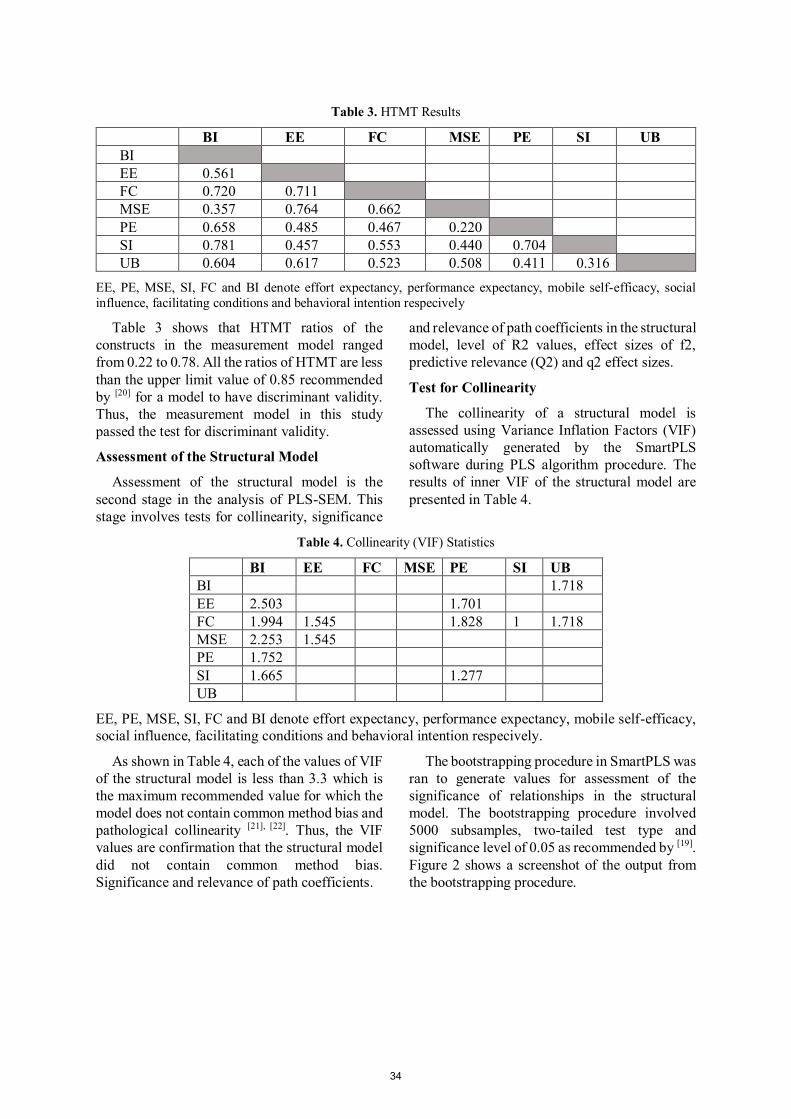
Table 3. HTMT Results
BI EE FC MSE PE SI UB BI EE 0.561 FC 0.720 0.711 MSE 0.357 0.764 0.662 PE 0.658 0.485 0.467 0.220 SI 0.781 0.457 0.553 0.440 0.704 UB 0.604 0.617 0.523 0.508 0.411 0.316
EE, PE, MSE, SI, FC and BI denote effort expectancy, performance expectancy, mobile self-efficacy, social influence, facilitating conditions and behavioral intention respecively
Table 3 shows that HTMT ratios of the constructs in the measurement model ranged from 0.22 to 0.78. All the ratios of HTMT are less than the upper limit value of 0.85 recommended by [20] for a model to have discriminant validity. Thus, the measurement model in this study passed the test for discriminant validity.
Assessment of the Structural Model
Assessment of the structural model is the second stage in the analysis of PLS-SEM. This stage involves tests for collinearity, significance
and relevance of path coefficients in the structural model, level of R2 values, effect sizes of f2, predictive relevance (Q2) and q2 effect sizes.
Test for Collinearity
The collinearity of a structural model is assessed using Variance Inflation Factors (VIF) automatically generated by the SmartPLS software during PLS algorithm procedure. The results of inner VIF of the structural model are presented in Table 4.
Table 4. Collinearity (VIF) Statistics
BI EE FC MSE PE SI UB BI 1.718 EE 2.503 1.701 FC 1.994 1.545 1.828 1 1.718 MSE 2.253 1.545 PE 1.752 SI 1.665 1.277 UB
EE, PE, MSE, SI, FC and BI denote effort expectancy, performance expectancy, mobile self-efficacy, social influence, facilitating conditions and behavioral intention respecively.
As shown in Table 4, each of the values of VIF of the structural model is less than 3.3 which is the maximum recommended value for which the model does not contain common method bias and pathological collinearity [21], [22]. Thus, the VIF values are confirmation that the structural model did not contain common method bias. Significance and relevance of path coefficients.
The bootstrapping procedure in SmartPLS was ran to generate values for assessment of the significance of relationships in the structural model. The bootstrapping procedure involved 5000 subsamples, two-tailed test type and significance level of 0.05 as recommended by [19]. Figure 2 shows a screenshot of the output from the bootstrapping procedure.
34
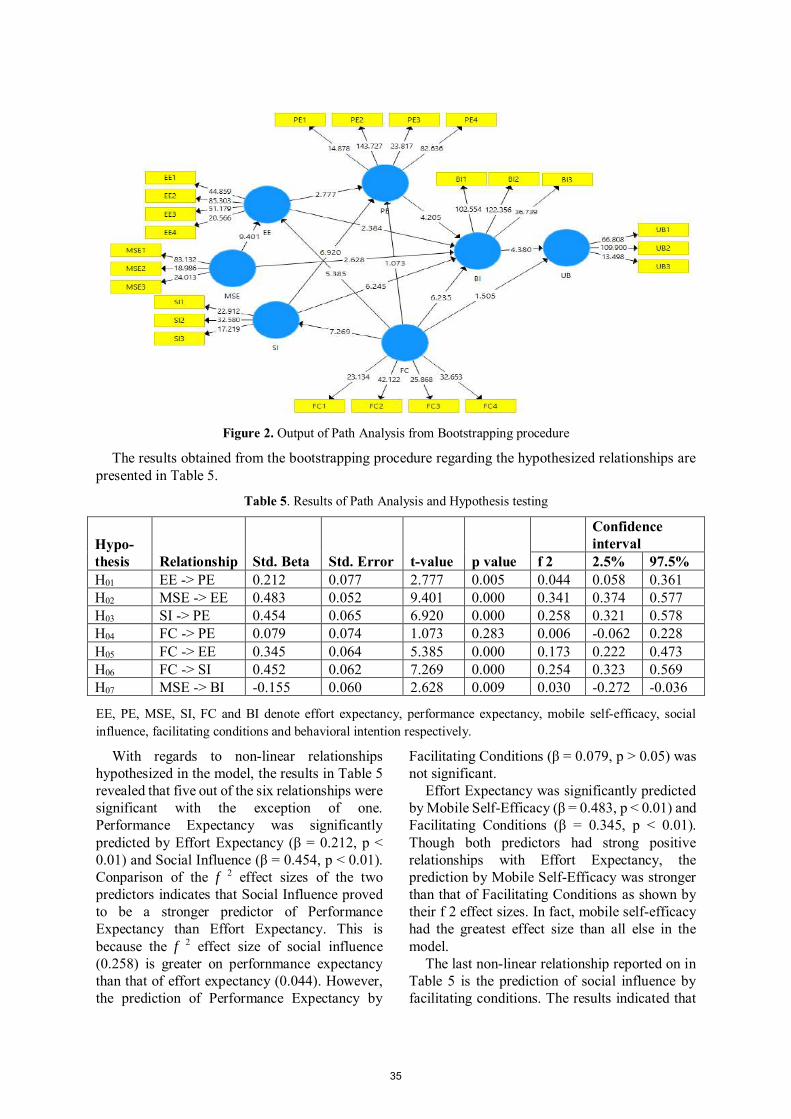
Figure 2. Output of Path Analysis from Bootstrapping procedure
The results obtained from the bootstrapping procedure regarding the hypothesized relationships are presented in Table 5.
Table 5. Results of Path Analysis and Hypothesis testing
Hypo-thesis Relationship Std. Beta Std. Error t-value p value
Confidence interval
f 2 2.5% 97.5% H01 EE -> PE 0.212 0.077 2.777 0.005 0.044 0.058 0.361 H02 MSE -> EE 0.483 0.052 9.401 0.000 0.341 0.374 0.577 H03 SI -> PE 0.454 0.065 6.920 0.000 0.258 0.321 0.578 H04 FC -> PE 0.079 0.074 1.073 0.283 0.006 -0.062 0.228 H05 FC -> EE 0.345 0.064 5.385 0.000 0.173 0.222 0.473 H06 FC -> SI 0.452 0.062 7.269 0.000 0.254 0.323 0.569 H07 MSE -> BI -0.155 0.060 2.628 0.009 0.030 -0.272 -0.036
EE, PE, MSE, SI, FC and BI denote effort expectancy, performance expectancy, mobile self-efficacy, social influence, facilitating conditions and behavioral intention respectively.
With regards to non-linear relationships hypothesized in the model, the results in Table 5 revealed that five out of the six relationships were significant with the exception of one. Performance Expectancy was significantly predicted by Effort Expectancy (β = 0.212, p < 0.01) and Social Influence (β = 0.454, p < 0.01). Conparison of the f 2 effect sizes of the two predictors indicates that Social Influence proved to be a stronger predictor of Performance Expectancy than Effort Expectancy. This is because the f 2 effect size of social influence (0.258) is greater on perfornmance expectancy than that of effort expectancy (0.044). However, the prediction of Performance Expectancy by
Facilitating Conditions (β = 0.079, p > 0.05) was not significant.
Effort Expectancy was significantly predicted by Mobile Self-Efficacy (β = 0.483, p < 0.01) and Facilitating Conditions (β = 0.345, p < 0.01). Though both predictors had strong positive relationships with Effort Expectancy, the prediction by Mobile Self-Efficacy was stronger than that of Facilitating Conditions as shown by their f 2 effect sizes. In fact, mobile self-efficacy had the greatest effect size than all else in the model.
The last non-linear relationship reported on in Table 5 is the prediction of social influence by facilitating conditions. The results indicated that
35
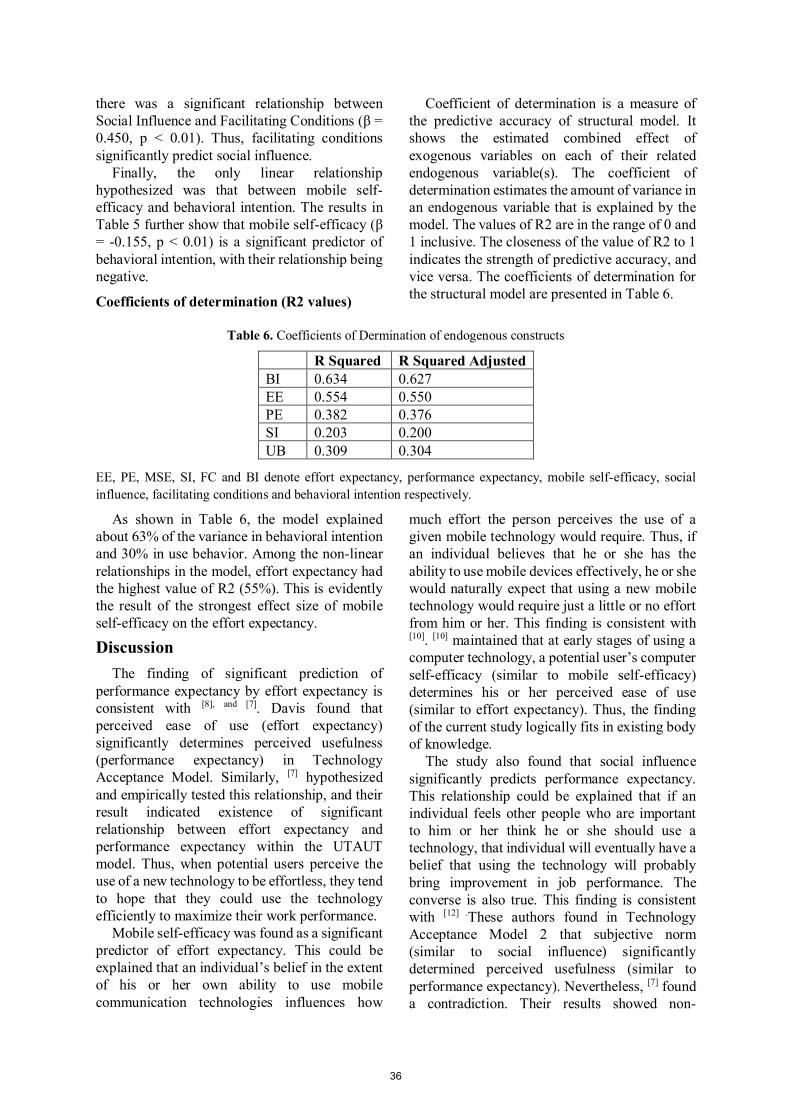
there was a significant relationship between Social Influence and Facilitating Conditions (β = 0.450, p < 0.01). Thus, facilitating conditions significantly predict social influence.
Finally, the only linear relationship hypothesized was that between mobile self-efficacy and behavioral intention. The results in Table 5 further show that mobile self-efficacy (β = -0.155, p < 0.01) is a significant predictor of behavioral intention, with their relationship being negative.
Coefficients of determination (R2 values)
Coefficient of determination is a measure of the predictive accuracy of structural model. It shows the estimated combined effect of exogenous variables on each of their related endogenous variable(s). The coefficient of determination estimates the amount of variance in an endogenous variable that is explained by the model. The values of R2 are in the range of 0 and 1 inclusive. The closeness of the value of R2 to 1 indicates the strength of predictive accuracy, and vice versa. The coefficients of determination for the structural model are presented in Table 6.
Table 6. Coefficients of Dermination of endogenous constructs
R Squared R Squared Adjusted BI 0.634 0.627 EE 0.554 0.550 PE 0.382 0.376 SI 0.203 0.200 UB 0.309 0.304
EE, PE, MSE, SI, FC and BI denote effort expectancy, performance expectancy, mobile self-efficacy, social influence, facilitating conditions and behavioral intention respectively.
As shown in Table 6, the model explained about 63% of the variance in behavioral intention and 30% in use behavior. Among the non-linear relationships in the model, effort expectancy had the highest value of R2 (55%). This is evidently the result of the strongest effect size of mobile self-efficacy on the effort expectancy.
Discussion The finding of significant prediction of
performance expectancy by effort expectancy is consistent with [8], and [7]. Davis found that perceived ease of use (effort expectancy) significantly determines perceived usefulness (performance expectancy) in Technology Acceptance Model. Similarly, [7] hypothesized and empirically tested this relationship, and their result indicated existence of significant relationship between effort expectancy and performance expectancy within the UTAUT model. Thus, when potential users perceive the use of a new technology to be effortless, they tend to hope that they could use the technology efficiently to maximize their work performance.
Mobile self-efficacy was found as a significant predictor of effort expectancy. This could be explained that an individual’s belief in the extent of his or her own ability to use mobile communication technologies influences how
much effort the person perceives the use of a given mobile technology would require. Thus, if an individual believes that he or she has the ability to use mobile devices effectively, he or she would naturally expect that using a new mobile technology would require just a little or no effort from him or her. This finding is consistent with [10]. [10] maintained that at early stages of using a computer technology, a potential user’s computer self-efficacy (similar to mobile self-efficacy) determines his or her perceived ease of use (similar to effort expectancy). Thus, the finding of the current study logically fits in existing body of knowledge.
The study also found that social influence significantly predicts performance expectancy. This relationship could be explained that if an individual feels other people who are important to him or her think he or she should use a technology, that individual will eventually have a belief that using the technology will probably bring improvement in job performance. The converse is also true. This finding is consistent with [12] .These authors found in Technology Acceptance Model 2 that subjective norm (similar to social influence) significantly determined perceived usefulness (similar to performance expectancy). Nevertheless, [7] found a contradiction. Their results showed non-
36
significant relationship between social influence and performance expectancy. The contradiction in the finding of this current study to that of [7] could be attributed to the fact that influence of important others is stronger on the participants of the current study because they are students; however, the participants of [7] were tutors and more independent. Hence, the tutors did not care much about the thoughts of important others.
The study found no significant relationship between facilitating conditions and performance expectancy. This finding is consistent with the result reported by [7]. Though their study focused on acceptance of Learning Management System by distance education tutors, they obtained a similar result. The explanation for this finding could be that at an early stage when a new technology is introduced to prospective users, availability of enabling conditions would not necessarily imply the users would perceive use of the technology to result in gains in job performance.
The study also revealed that facilitating conditions significantly determine effort expectancy. This finding is consistent with previous studies [10], [7]. Venkatesh tested the relationship between external control beliefs (similar to facilitating conditions) and perceived ease of use (similar to effort expectancy) using Technology Acceptance Model and found a significant and positive effect of external control beliefs on perceived ease of use. Likewise, [7] used the UTAUT model to test the non-linear relationship between facilitating conditions and effort expectancy, and they concluded that facilitating conditions significantly predict effort expectancy. The significant relationship between facilitating conditions and effort expectancy could be explained that when prospective users of a new technology perceive that the resources and conditions that will make the use of the technology are available, they tend to believe that using the technology will be effortless. Conversely, when a prospective user perceives that necessary resources and conditions for convenient use of a new technology are not available, the user will have the tendency to believe that using the technology will require more effort or even be difficult for him or her.
Again, facilitating conditions were found to significantly predict social influence in this current study. This finding is consistent with that of [7] in their study involving usage of Learning
Management System by distance education tutors of a Ghanaian university. This relationship could be explained that during introduction of a new technology to potential users, when conducive environment and resources are available to support utilization of the technology, people who are important to the potential users would have the tendency to encourage the latter to adopt the technology. Hence, the more important others perceive availability of resources and conducive environment to support use of a new technology, the more they encourage potential users to adopt the technology.
The negative significant prediction of behavioral intention by mobile self-efficacy is quite an interesting finding in this study. It is an indication that distance education students who have stronger belief in their own ability to use mobile devices (higher mobile self-efficacy) have lower intention (i.e. are less likely) to accept WhatsApp technology for use in supporting their learning aside from scheduled face-to-face lecture sessions. Conversely, distance education students who have weaker belief in their own ability to use mobile devices (lower mobile self-efficacy) have higher intention (are more likely) to accept WhatsApp technology for use in supporting their learning.
The finding in this study that mobile self-efficacy is a significant negative predictor of behavioral intention is consistent with the findings of some previous studies [10], [6]. In a study to establish determinants of perceived ease of use (effort expectancy) in TAM3, [10] maintained that computer self-efficacy was an indirect predictor of behavioral intention fully mediated by perceived ease of use. That view implies that in the absence of mediating effect of effort expectancy, self-efficacy would not determine behavioral intentions; thus, significance of mobile self-efficacy in predicting behavioral intention is as a result of mediating effect of effort expectancy. Similarly, [6] postulated and empirically confirmed in the UTAUT model that self-efficacy does not have direct significant effect on behavioral intentions. The current study has contributed to the existing knowledge that in the adoption of WhatsApp chat for supporting distance learning, mobile self-efficacy is a significant determinant of behavioral intention of distance education students.
37
Conclusion The main aim of the study was to validate non-
linear relationships among exogenous constructs of the UTAUT model regarding acceptance of WhatsApp for supporting learning by higher distance education students. Also, a new construct; mobile self-efficacy; was assessed for its significance in predicting behavioral intention. The partial least squares structural equation modeling was used to test hypotheses. The results showed that effort expectancy and social influence are significant predictors of performance expectancy, mobile self-efficacy and facilitating conditions are significant predictors of effort expectancy, and facilitating conditions determine social influence. Mobile self-efficacy was also found to significantly predict behavioral intention for use of WhatsApp as a learning support tool.
Implications for Theory
The findings of the study have theoretical implications. They affirm existence of non-linear relationships among exogenous constructs of the UTAUT model. These non-linear relationships affirmed can be applied to better understand studies involving acceptance of technologies in variety of domains. Furthermore, this study has discovered that in studies involving adoption of mobile technologies, mobile self-efficacy is a significant factor. Therefore, the researchers recommend that in studies involving adoption of mobile technologies, the UTAUT model should be extended to include mobile self-efficacy.
Implications for Practice
The findings of the study have practical implications for faculty and administrators of distance education institutions. The finding that effort expectancy and facilitating conditions predict performance expectancy could be used as the basis to provide necessary resources and training that would make the target learners perceive the use of a novel technology to be easier. This would influence the potential users to perceive that they will be able to use the technology efficiently to maximize their job performance and subsequently be willing to accept the technology.
Limitations of the Study
The study excluded the moderating variables of the original UTAUT model. This eliminated
understanding of how interactions between the exogenous and endogenous variables are influenced be the moderating variables.
Recommendations for future research The researchers recommend that future
researches on adoption of WhatsApp for supporting distance learning should include moderating variables such as gender, age and experience. This will hopefully help to understand how the moderators influence the relationships between the exogenous and endogenous variables, and hence extend existing knowledge on this subject.
References [1] Smith, R. (2015). The role of social media in
higher education marketing. Retrieved May 12, 2015 from http://www.bostoninteractive.com/blog/industries/socialmedia-higher-education-marketing. [2] Fattah, S. F. E. S. A. (2015). The effectiveness of using WhatsApp messenger as one of mobile learning techniques to develop students' writing skills. Journal of Education and Practice, 6(32), 115-127. [3] Vrocharidou, A., & Efthymiou, I. (2012). Computer mediated communication for social and academic purposes: Profiles of use and university students' gratifications. Computers & Education, 58(1), 609–616. [4] Ogara, S., Koh, C., & Prybutok, V. (2014). Investigating factors affecting social presence and user satisfaction with mobile instant messaging. Computers in Human Behavior, 36(2014), 453–459. [5] Cifuentes, O., & Lents, N. (2010). Increasing student-teacher interactions at an urban commuter campus through instant messaging and online office hours. Electronic Journal of Science Education, 14(1), 1–13. [6] Venkatesh V., Morris M., Davis G. & Davis F. (2003). User acceptance of information technology: Toward a unified view. MIS Quarterly. 27(3), 425-478. DOI: 10.2307/30036540. [7] Bervell, B. & Umar, I. N. (2017). Validation of UTAUT model: re-considering non-linear relationships of exogeneous variables in higher education technology acceptance research. EURASIA Journal of Mathematics Science and Technology Education, 13(10), 6472-6490. DOI: 10.12973/eurasia.2017.01078a. [8] Davis, F. D. (1986). Technology acceptance models for empirically testing new end-user
38
information systems: theory and results. Cambridge: MIT Sloan School of Management. [9] Bandura, A. (1982). Self-efficacy mechanism in human agency. American Psychologist, 37, 122-147. [10] Venkatesh, V. (2000). Determinants of perceived ease of use: integrating control, intrinsic motivation, and emotion into the technology acceptance model. Information Systems Research, 11(4), 342-365. [11] Davis, F. D., Bagozzi, R. P., & Warshaw, P. R. (1989). User Acceptance of Computer Technology: A Comparison of Two Theoretical Models. Management Science, 35(8), 982-1003. [12] Venkatesh, V. & Davis, F. D. (2000). A Theoretical Extension of the Technology Acceptance Model: Four Longitudinal Field Studies. Management Science, 46(2), 186-204. http://dx.doi.org/10.1287/mnsc.46.2.186.11926. [13] Nikou, S. A., and Economides, A. A. (2017). Mobile-based assessment: investigating the factors that influence behavioral intention to use. Comput. Educ.109, 56–73. DOI: 10.1016/j.compedu.2017.02.005. [14] Bandura, A. (1986). Social foundations of thought and action: a social cognitive theory: Prentice Hall, Englewood Cliffs, NJ. [15] Krejcie, R. V., & Morgan, D. W. (1970). Determining sample size for research activities. Educational and Psychological Measurement, 30, 607-610.
[16] Evans, N. D. (2013). Predicting user acceptance of electronic learning at the University of Zululand. Unpublished Thesis. Department of Information Studies, University of Zululand, South Africa. [17] Chao C-M (2019) Factors determining the behavioral intention to use mobile learning: an application and extension of the UTAUT model. Frontiers in Psychology, 10(1652), 1-14. DOI: 10.3389/fpsyg.2019.01652. [18] Ringle, C. M., Wende, S., and Becker, J.-M. (2015). "SmartPLS 3." Boenningstedt: SmartPLS GmbH, http://www.smartpls.com. [19] Hair, J. F., Hult, G. T. M., Ringle, C. M., & Sarstedt, M. (2014). A primer on partial least squares structural equation modeling. 1st Edition. Thousand Oaks: Sage. [20] Henseler, J., Ringle, C. M., & Sarstedt, M. (2015). A new criterion for assessing discriminant validity in variance-based structural equation modeling. J. of the Acad. Mark. Sci. 43, 115–135. DOI: 10.1007/s11747-014-0403-8. [21] Hair, J. F., Hult, G. T. M., Ringle, C. M., & Sarstedt, M. (2017). A primer on partial least squares structural equation modeling. 2nd Edition. Thousand Oaks: Sage. [22] Kock, N. (2015). Common method bias in PLS-SEM: A full collinearity assessment approach. International Journal of e-Collaboration, 11(4), 1-10.
39
Texila International Journal of Academic research ISSN: 2520-3088
DOI: 10.21522/TIJAR.2014.07.02.Art005
Financial and Non-Financial Incentives to Improve Performance and the Quality of Health care in Hadiya zone, SNNPR, Ethiopia
Derebe Tadesse Kintamo PhD in Management, Texila American University, Ethiopia
E-mail: [email protected]
Abstract
Human resources for health are key for delivery of health care services. According to WHO’s 2006 World Health Report, Ethiopia had 0.247 doctors, nurses and midwives combined per 1,000 population, and was one of the 57 countries with health workforce crisis. International Non-Governmental Organizations and International agencies utilizes financial and non-financial incentive to retain experienced health workers to deliver health services for targeted population. This study employed health facility based cross sectional survey. Quantitative and qualitative data collection techniques was used to gather primary information using tools. The study was conducted in the selected health facilities in Hadya zone, Southern Nations and Nationalities Region, Ethiopia. In Hadiya zone, there were 13 rural districts and 4 town administrations. The study targeted 4 rural districts selected randomly and all 4 town administrations. All health professionals who were working in the public health sector targeted for the study. The research aim was to examine the relationship between financial and non-financial incentives and health workers performance and quality of health care. This study found that 64.1% (Male 59.3%%; Female 66.7) respondents reported that both financial and non-financial incentives were equally important to improve health workers performance and motivation in provision of quality of health care services. This clearly indicated that the importance of non-financial incentives on the top of financial incentive to motivate Health Workers for better performance and quality of health care.
Keywords: Financial and non -financial Incentives, Health workers performance, Quality of health
Care, Satisfaction of workers on Fridge Benefits.
Introduction
According to WHO 2006 report, Ethiopia is one of the countries in the world with low health workforce density of 0.7/1000 population, which is far below the minimum threshold density of 2.3 health workers (MD, nurses & Midwives) per 1000 population for countries to achieve essential services (a targeted 80% coverage rate for skilled birth attendance). In the African region, the average threshold is 1.6 of doctors, nurses & Midwives per 1000 population. In the last two decades, an increasing number of developing countries have introduced incentive payments linked to results to widen access to care and to improve the quality and performance of health care services and systems. These incentive schemes, known collectively as Performance-based financing (PBF), play an important role in advancing progress toward universal health coverage, contributing to the achievement of the Sustainable Development Goals.
For over a decade, the World Bank’s strategies have emphasized the importance of paying for results approaches to expanding access to and
improving health care services. The World Development Report 2004; Making Services Work for Poor People lists weak incentives for health providers as one of the drivers of poor-quality service, leading to low demand for health services. To address such barriers to service delivery, the report recommended the creation of incentives for better quality service and strengthening accountability. A continued misalignment between health service providers' compensation and key system goals drives the failure to deliver efficient and effective services for populations despite many efforts in the last decade to improve quality and performance.
As many countries change governance principles of their health systems from rules and regulations toward devolved, results driven systems that emphasize strategic planning and decision making oriented towards performance, they have realized that success requires individuals and organizations in the system have an incentive to act on information and use their capacities to meet the health system goals. The term incentive means an inducement, which rouses or stimulates one to action in a desired direction. An incentive has a motivational power;
40
many incentives, the modern organizations use to motivate their employees may be broadly grouped into (i) financial incentives, and (ii) non-financial incentives.
Financial incentive -Money is an important motivator. Common uses of money as incentive are in the form of wages and salaries, bonus, retirement benefits, medical reimbursement, etc. Management needs to increase these financial incentives making wages and salaries competitive between various organizations to attract and hold work force. In any organization, the financial capability of employees is a very important factor as it determines the level or the extent to which he or she is motivated to expend his/her effort on the job performance. Non-financial incentives do not involve money payments. These are also important in motivating employees as they bring in psychological and emotional satisfaction to them. These include so many techniques. People do work for money-but they work even more for meaning in their lives. Some of the important non-financial incentives include recognition, Better job titles, empowerment, competition and job rotation etc.
Limitation of this research was it only focused on financial and non-financial incentives for improving performance and quality of care but other determinants for health care quality was not included in this study. The reason is that incentive alone can’t represent for quality of care improvement, there are other factors that may affect quality of care such as working environment, infrastructure, pharmaceuticals and other supplies availability. This study focused on 82 health facilities in Hadiya zone, South Nations, Nationalities and People Region (SNNPR), Ethiopia. This may limit generalizing the finding of the study.
Therefore, this study found out that to maintain required health work force in the health facilities, the management should focus both on financial and non-financial incentives strategically link in to their performance objectives.
Methodology This study was conducted in Hadiya zone,
South Nations Nationalities and peoples Region, Ethiopia. In this study, the researcher employed a cross-sectional survey design to quantitatively assess the relationship between the financial and non-financial incentives, employee performance and quality of health care improvement using a questionnaire. Key informant interview was conducted with facility and district managers to get detailed qualitative information on how and why of the financial and non-financial incentives contribution for improved performance and
quality of health care services. According to Creswell (2014) and Sekaran (2016) quantitative research is an approach for testing objective theories by examining the relationship among variables. According to him these variables in turn can be measured, typically on instruments, so that numbered data can be analyzed using statistical procedures.
According to the information obtained from the zonal health department, the total number of the target population (different cadre of health workers) in the study area were 2,533. This figure includes all kinds of health cadres (doctor, Nurses, Midwifes, Health officers, Pharmacist, laboratory technicians, Health Extension workers etc). To determine the sample size for this study, three key factors such as confidence interval (it is also called level of precision or sampling error), confidence level, and the population size were considered.
n= N 1+ N (e) ²
Where ‘n’ is the sample size, ’N’ is the population size, and ‘e’ is the level of precision/ Confidence interval.
The study considered a 95% confidence level and a 5% confidence interval. Using the above portrayed statistical formula, the sample
n = 2533 = 345 1+ 2533 (.05) ²
5% non-responders in case of absence at the work station during data collection is 17
Therefore, the sample size for targeted population of this study was 362 employees.
Data collection was conducted by the trained data collectors using closed ended questionnaires distributed to the randomly selected sample of individual employees of ministry of health of Ethiopia working in Hadiya zone and collected physically from respondents at their site by the researcher and trained data collectors. Qualitative data was collected using Key Informant Interview guide by the researcher and trained data collector. The qualitative information was collected from health facility and district/Woreda health department managers in view of getting detailed information on how and why of the financial and non -financial incentives for health workers and its impact on performance improvement and quality of care.
The quantitative data collected by the structured individual questionnaire was cleaned and edited and responses to open ended questions were coded. Then the data were entered into the computer using CSPro (Census and Survey Processing) software. Following the completion
41
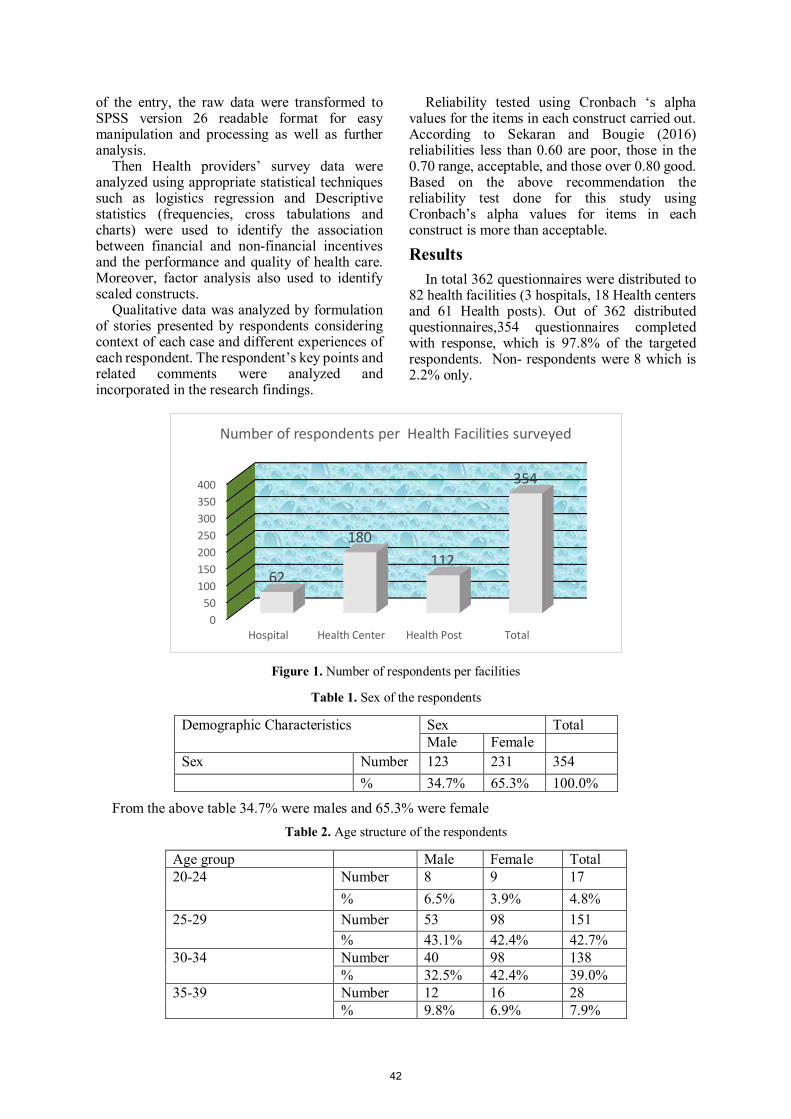
of the entry, the raw data were transformed to SPSS version 26 readable format for easy manipulation and processing as well as further analysis.
Then Health providers’ survey data were analyzed using appropriate statistical techniques such as logistics regression and Descriptive statistics (frequencies, cross tabulations and charts) were used to identify the association between financial and non-financial incentives and the performance and quality of health care. Moreover, factor analysis also used to identify scaled constructs.
Qualitative data was analyzed by formulation of stories presented by respondents considering context of each case and different experiences of each respondent. The respondent’s key points and related comments were analyzed and incorporated in the research findings.
Reliability tested using Cronbach ‘s alpha values for the items in each construct carried out. According to Sekaran and Bougie (2016) reliabilities less than 0.60 are poor, those in the 0.70 range, acceptable, and those over 0.80 good. Based on the above recommendation the reliability test done for this study using Cronbach’s alpha values for items in each construct is more than acceptable.
Results In total 362 questionnaires were distributed to
82 health facilities (3 hospitals, 18 Health centers and 61 Health posts). Out of 362 distributed questionnaires,354 questionnaires completed with response, which is 97.8% of the targeted respondents. Non- respondents were 8 which is 2.2% only.
Figure 1. Number of respondents per facilities
Table 1. Sex of the respondents
Demographic Characteristics Sex Total Male Female
Sex Number 123 231 354 % 34.7% 65.3% 100.0%
From the above table 34.7% were males and 65.3% were female Table 2. Age structure of the respondents
Age group Male Female Total 20-24 Number 8 9 17
% 6.5% 3.9% 4.8% 25-29 Number 53 98 151
% 43.1% 42.4% 42.7% 30-34 Number 40 98 138
% 32.5% 42.4% 39.0% 35-39 Number 12 16 28
% 9.8% 6.9% 7.9%
0
50
100
150
200
250
300
350
400
Hospital Health Center Health Post Total
62
180
112
354
Number of respondents per Health Facilities surveyed
42
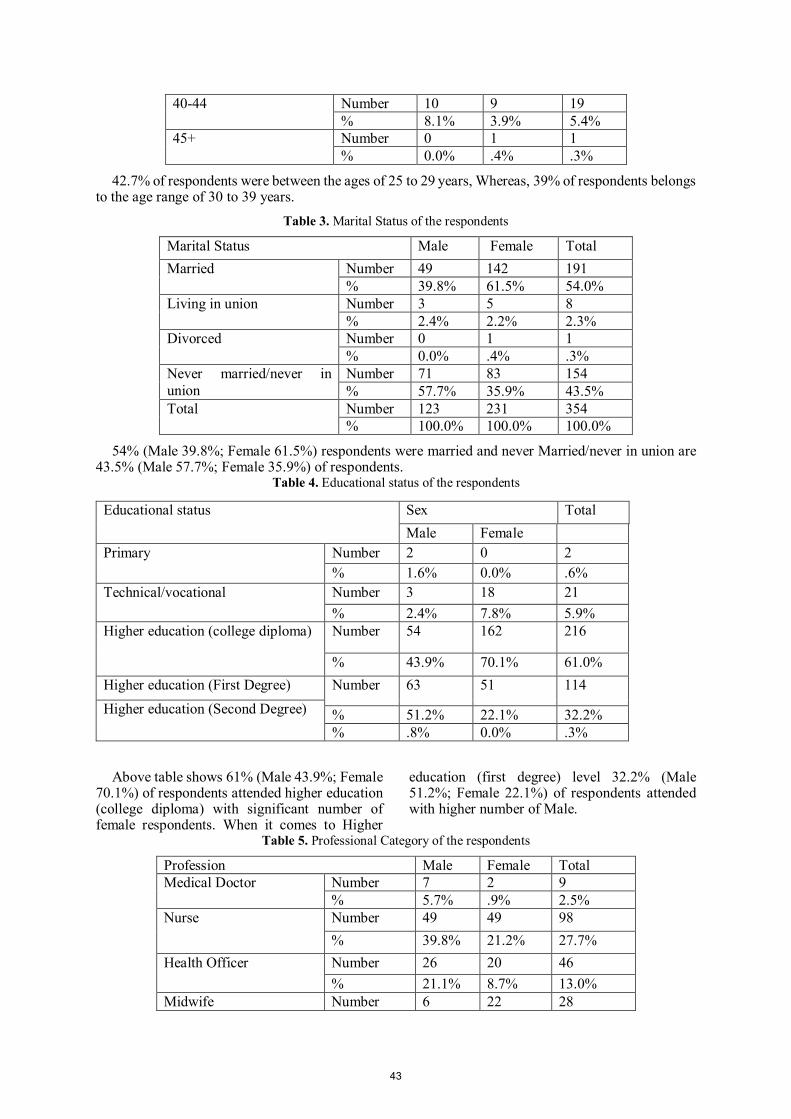
40-44 Number 10 9 19 % 8.1% 3.9% 5.4%
45+ Number 0 1 1 % 0.0% .4% .3%
42.7% of respondents were between the ages of 25 to 29 years, Whereas, 39% of respondents belongs to the age range of 30 to 39 years.
Table 3. Marital Status of the respondents
Marital Status Male Female Total Married Number 49 142 191
% 39.8% 61.5% 54.0% Living in union Number 3 5 8
% 2.4% 2.2% 2.3% Divorced Number 0 1 1
% 0.0% .4% .3% Never married/never in union
Number 71 83 154 % 57.7% 35.9% 43.5%
Total Number 123 231 354 % 100.0% 100.0% 100.0%
54% (Male 39.8%; Female 61.5%) respondents were married and never Married/never in union are 43.5% (Male 57.7%; Female 35.9%) of respondents.
Table 4. Educational status of the respondents
Educational status Sex Total Male Female
Primary Number 2 0 2 % 1.6% 0.0% .6%
Technical/vocational Number 3 18 21 % 2.4% 7.8% 5.9%
Higher education (college diploma) Number 54 162 216
% 43.9% 70.1% 61.0% Higher education (First Degree) Number 63 51 114 Higher education (Second Degree) % 51.2% 22.1% 32.2%
% .8% 0.0% .3%
Above table shows 61% (Male 43.9%; Female 70.1%) of respondents attended higher education (college diploma) with significant number of female respondents. When it comes to Higher
education (first degree) level 32.2% (Male 51.2%; Female 22.1%) of respondents attended with higher number of Male.
Table 5. Professional Category of the respondents
Profession Male Female Total Medical Doctor Number 7 2 9
% 5.7% .9% 2.5% Nurse Number 49 49 98
% 39.8% 21.2% 27.7% Health Officer Number 26 20 46
% 21.1% 8.7% 13.0% Midwife Number 6 22 28
43
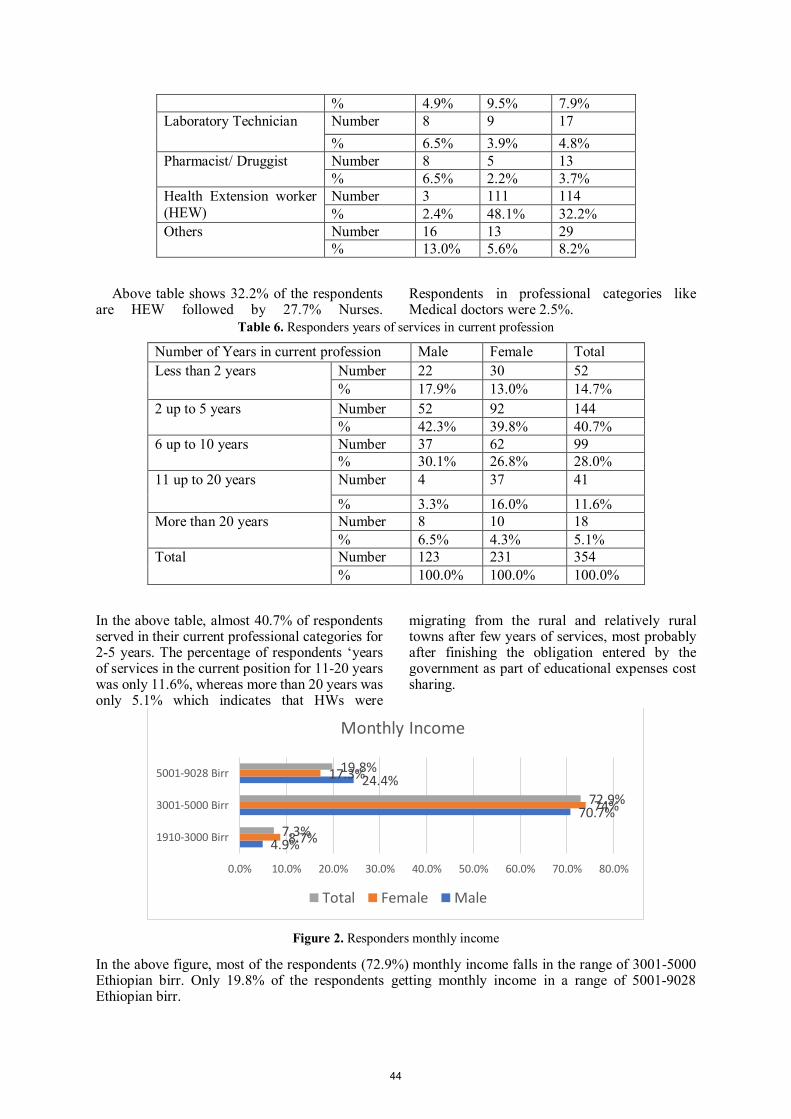
% 4.9% 9.5% 7.9% Laboratory Technician Number 8 9 17
% 6.5% 3.9% 4.8% Pharmacist/ Druggist Number 8 5 13
% 6.5% 2.2% 3.7% Health Extension worker (HEW)
Number 3 111 114 % 2.4% 48.1% 32.2%
Others Number 16 13 29 % 13.0% 5.6% 8.2%
Above table shows 32.2% of the respondents are HEW followed by 27.7% Nurses.
Respondents in professional categories like Medical doctors were 2.5%.
Table 6. Responders years of services in current profession
Number of Years in current profession Male Female Total Less than 2 years Number 22 30 52
% 17.9% 13.0% 14.7% 2 up to 5 years Number 52 92 144
% 42.3% 39.8% 40.7% 6 up to 10 years Number 37 62 99
% 30.1% 26.8% 28.0% 11 up to 20 years Number 4 37 41
% 3.3% 16.0% 11.6% More than 20 years Number 8 10 18
% 6.5% 4.3% 5.1% Total Number 123 231 354
% 100.0% 100.0% 100.0%
In the above table, almost 40.7% of respondents served in their current professional categories for 2-5 years. The percentage of respondents ‘years of services in the current position for 11-20 years was only 11.6%, whereas more than 20 years was only 5.1% which indicates that HWs were
migrating from the rural and relatively rural towns after few years of services, most probably after finishing the obligation entered by the government as part of educational expenses cost sharing.
Figure 2. Responders monthly income
In the above figure, most of the respondents (72.9%) monthly income falls in the range of 3001-5000 Ethiopian birr. Only 19.8% of the respondents getting monthly income in a range of 5001-9028 Ethiopian birr.
4.9%
70.7%
24.4%
8.7%
74%
17.3%
7.3%
72.9%
19.8%
0.0% 10.0% 20.0% 30.0% 40.0% 50.0% 60.0% 70.0% 80.0%
1910-3000 Birr
3001-5000 Birr
5001-9028 Birr
Monthly Income
Total Female Male
44
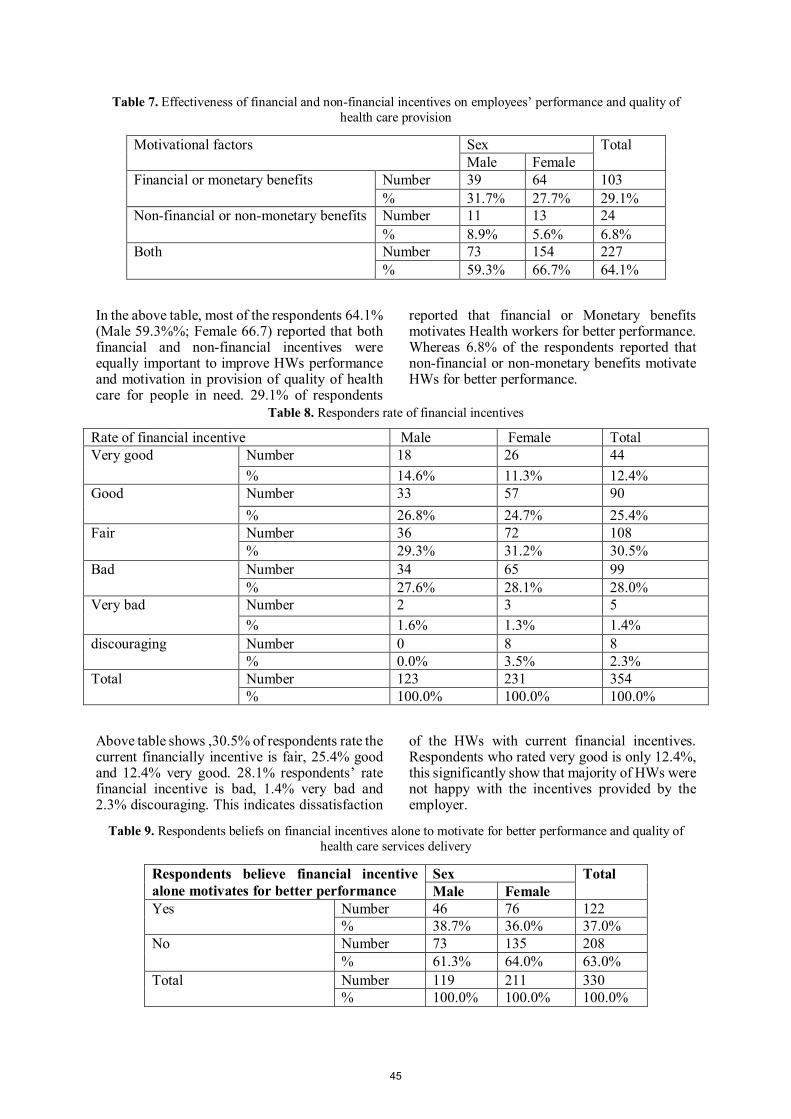
Table 7. Effectiveness of financial and non-financial incentives on employees’ performance and quality of health care provision
Motivational factors Sex Total Male Female
Financial or monetary benefits Number 39 64 103 % 31.7% 27.7% 29.1%
Non-financial or non-monetary benefits Number 11 13 24 % 8.9% 5.6% 6.8%
Both Number 73 154 227 % 59.3% 66.7% 64.1%
In the above table, most of the respondents 64.1% (Male 59.3%%; Female 66.7) reported that both financial and non-financial incentives were equally important to improve HWs performance and motivation in provision of quality of health care for people in need. 29.1% of respondents
reported that financial or Monetary benefits motivates Health workers for better performance. Whereas 6.8% of the respondents reported that non-financial or non-monetary benefits motivate HWs for better performance.
Table 8. Responders rate of financial incentives
Rate of financial incentive Male Female Total Very good Number 18 26 44
% 14.6% 11.3% 12.4% Good Number 33 57 90
% 26.8% 24.7% 25.4% Fair Number 36 72 108
% 29.3% 31.2% 30.5% Bad Number 34 65 99
% 27.6% 28.1% 28.0% Very bad Number 2 3 5
% 1.6% 1.3% 1.4% discouraging Number 0 8 8
% 0.0% 3.5% 2.3% Total Number 123 231 354
% 100.0% 100.0% 100.0%
Above table shows ,30.5% of respondents rate the current financially incentive is fair, 25.4% good and 12.4% very good. 28.1% respondents’ rate financial incentive is bad, 1.4% very bad and 2.3% discouraging. This indicates dissatisfaction
of the HWs with current financial incentives. Respondents who rated very good is only 12.4%, this significantly show that majority of HWs were not happy with the incentives provided by the employer.
Table 9. Respondents beliefs on financial incentives alone to motivate for better performance and quality of health care services delivery
Respondents believe financial incentive alone motivates for better performance
Sex Total Male Female
Yes Number 46 76 122 % 38.7% 36.0% 37.0%
No Number 73 135 208 % 61.3% 64.0% 63.0%
Total Number 119 211 330 % 100.0% 100.0% 100.0%
45
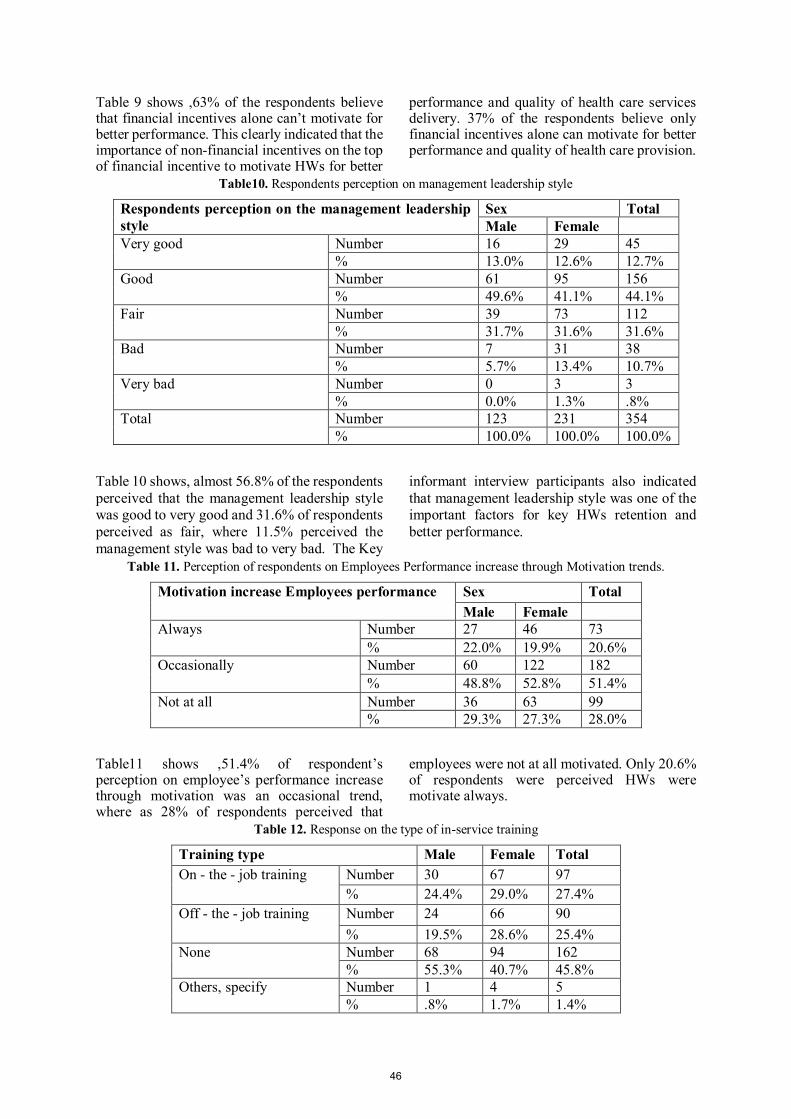
Table 9 shows ,63% of the respondents believe that financial incentives alone can’t motivate for better performance. This clearly indicated that the importance of non-financial incentives on the top of financial incentive to motivate HWs for better
performance and quality of health care services delivery. 37% of the respondents believe only financial incentives alone can motivate for better performance and quality of health care provision.
Table10. Respondents perception on management leadership style
Respondents perception on the management leadership style
Sex Total Male Female
Very good Number 16 29 45 % 13.0% 12.6% 12.7%
Good Number 61 95 156 % 49.6% 41.1% 44.1%
Fair Number 39 73 112 % 31.7% 31.6% 31.6%
Bad Number 7 31 38 % 5.7% 13.4% 10.7%
Very bad Number 0 3 3 % 0.0% 1.3% .8%
Total Number 123 231 354 % 100.0% 100.0% 100.0%
Table 10 shows, almost 56.8% of the respondents perceived that the management leadership style was good to very good and 31.6% of respondents perceived as fair, where 11.5% perceived the management style was bad to very bad. The Key
informant interview participants also indicated that management leadership style was one of the important factors for key HWs retention and better performance.
Table 11. Perception of respondents on Employees Performance increase through Motivation trends.
Motivation increase Employees performance Sex Total Male Female
Always Number 27 46 73 % 22.0% 19.9% 20.6%
Occasionally Number 60 122 182 % 48.8% 52.8% 51.4%
Not at all Number 36 63 99 % 29.3% 27.3% 28.0%
Table11 shows ,51.4% of respondent’s perception on employee’s performance increase through motivation was an occasional trend, where as 28% of respondents perceived that
employees were not at all motivated. Only 20.6% of respondents were perceived HWs were motivate always.
Table 12. Response on the type of in-service training
Training type Male Female Total On - the - job training Number 30 67 97
% 24.4% 29.0% 27.4% Off - the - job training Number 24 66 90
% 19.5% 28.6% 25.4% None Number 68 94 162
% 55.3% 40.7% 45.8% Others, specify Number 1 4 5
% .8% 1.7% 1.4%
46
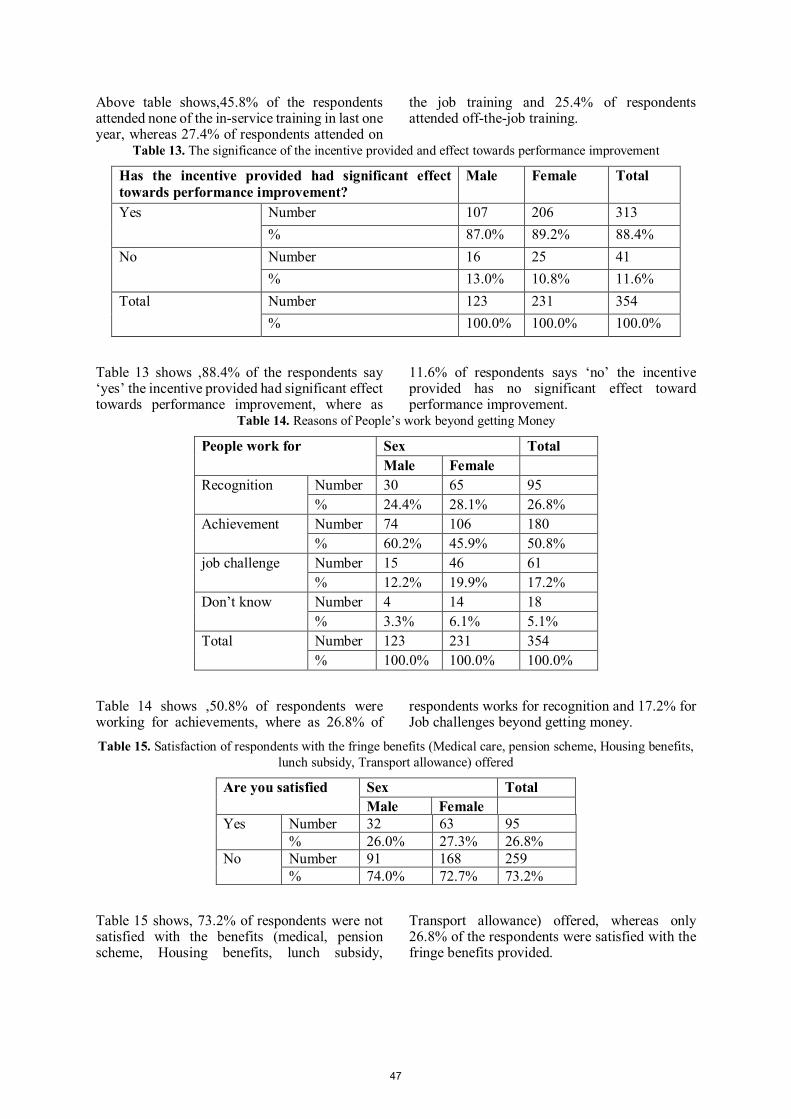
Above table shows,45.8% of the respondents attended none of the in-service training in last one year, whereas 27.4% of respondents attended on
the job training and 25.4% of respondents attended off-the-job training.
Table 13. The significance of the incentive provided and effect towards performance improvement
Has the incentive provided had significant effect towards performance improvement?
Male Female Total
Yes Number 107 206 313 % 87.0% 89.2% 88.4%
No Number 16 25 41 % 13.0% 10.8% 11.6%
Total Number 123 231 354 % 100.0% 100.0% 100.0%
Table 13 shows ,88.4% of the respondents say ‘yes’ the incentive provided had significant effect towards performance improvement, where as
11.6% of respondents says ‘no’ the incentive provided has no significant effect toward performance improvement.
Table 14. Reasons of People’s work beyond getting Money
People work for Sex Total Male Female
Recognition Number 30 65 95 % 24.4% 28.1% 26.8%
Achievement Number 74 106 180 % 60.2% 45.9% 50.8%
job challenge Number 15 46 61 % 12.2% 19.9% 17.2%
Don’t know Number 4 14 18 % 3.3% 6.1% 5.1%
Total Number 123 231 354 % 100.0% 100.0% 100.0%
Table 14 shows ,50.8% of respondents were working for achievements, where as 26.8% of
respondents works for recognition and 17.2% for Job challenges beyond getting money.
Table 15. Satisfaction of respondents with the fringe benefits (Medical care, pension scheme, Housing benefits, lunch subsidy, Transport allowance) offered
Are you satisfied Sex Total Male Female
Yes Number 32 63 95 % 26.0% 27.3% 26.8%
No Number 91 168 259 % 74.0% 72.7% 73.2%
Table 15 shows, 73.2% of respondents were not satisfied with the benefits (medical, pension scheme, Housing benefits, lunch subsidy,
Transport allowance) offered, whereas only 26.8% of the respondents were satisfied with the fringe benefits provided.
47
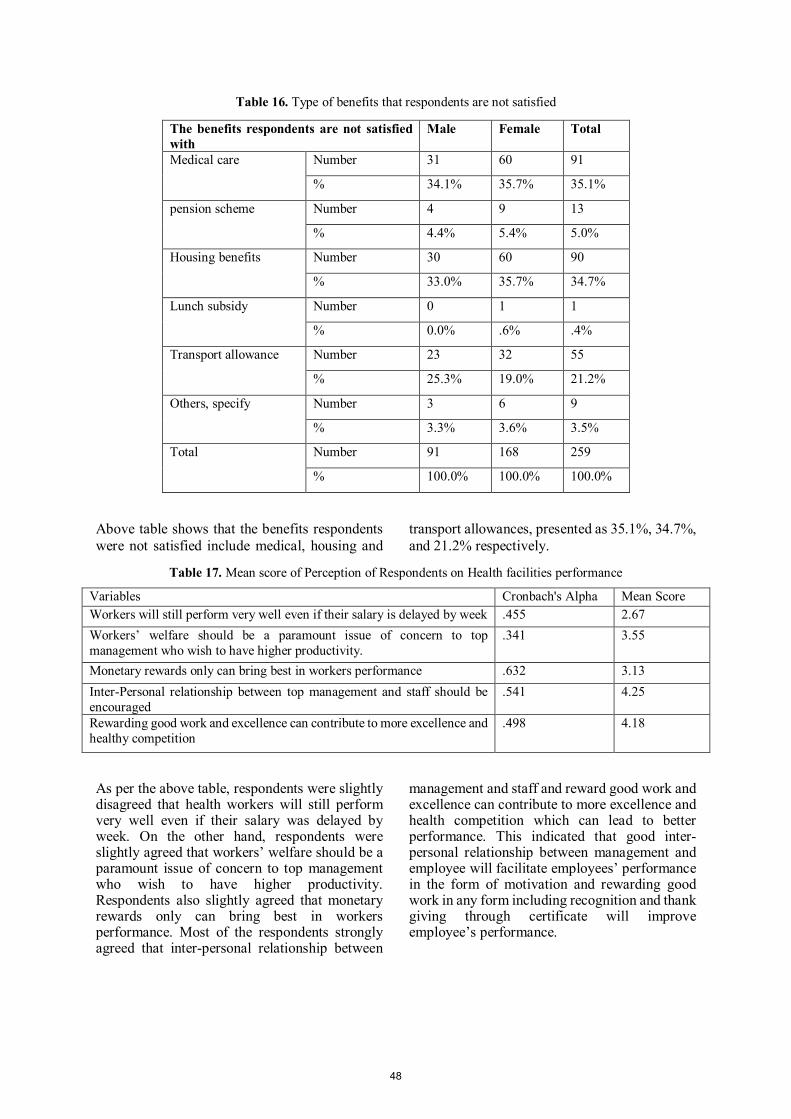
Table 16. Type of benefits that respondents are not satisfied
The benefits respondents are not satisfied with
Male Female Total
Medical care Number 31 60 91
% 34.1% 35.7% 35.1%
pension scheme Number 4 9 13
% 4.4% 5.4% 5.0%
Housing benefits Number 30 60 90
% 33.0% 35.7% 34.7%
Lunch subsidy Number 0 1 1
% 0.0% .6% .4%
Transport allowance Number 23 32 55
% 25.3% 19.0% 21.2%
Others, specify Number 3 6 9
% 3.3% 3.6% 3.5%
Total Number 91 168 259
% 100.0% 100.0% 100.0%
Above table shows that the benefits respondents were not satisfied include medical, housing and
transport allowances, presented as 35.1%, 34.7%, and 21.2% respectively.
Table 17. Mean score of Perception of Respondents on Health facilities performance
Variables Cronbach's Alpha Mean Score Workers will still perform very well even if their salary is delayed by week .455 2.67 Workers’ welfare should be a paramount issue of concern to top management who wish to have higher productivity.
.341 3.55
Monetary rewards only can bring best in workers performance .632 3.13 Inter-Personal relationship between top management and staff should be encouraged
.541 4.25
Rewarding good work and excellence can contribute to more excellence and healthy competition
.498 4.18
As per the above table, respondents were slightly disagreed that health workers will still perform very well even if their salary was delayed by week. On the other hand, respondents were slightly agreed that workers’ welfare should be a paramount issue of concern to top management who wish to have higher productivity. Respondents also slightly agreed that monetary rewards only can bring best in workers performance. Most of the respondents strongly agreed that inter-personal relationship between
management and staff and reward good work and excellence can contribute to more excellence and health competition which can lead to better performance. This indicated that good inter-personal relationship between management and employee will facilitate employees’ performance in the form of motivation and rewarding good work in any form including recognition and thank giving through certificate will improve employee’s performance.
48
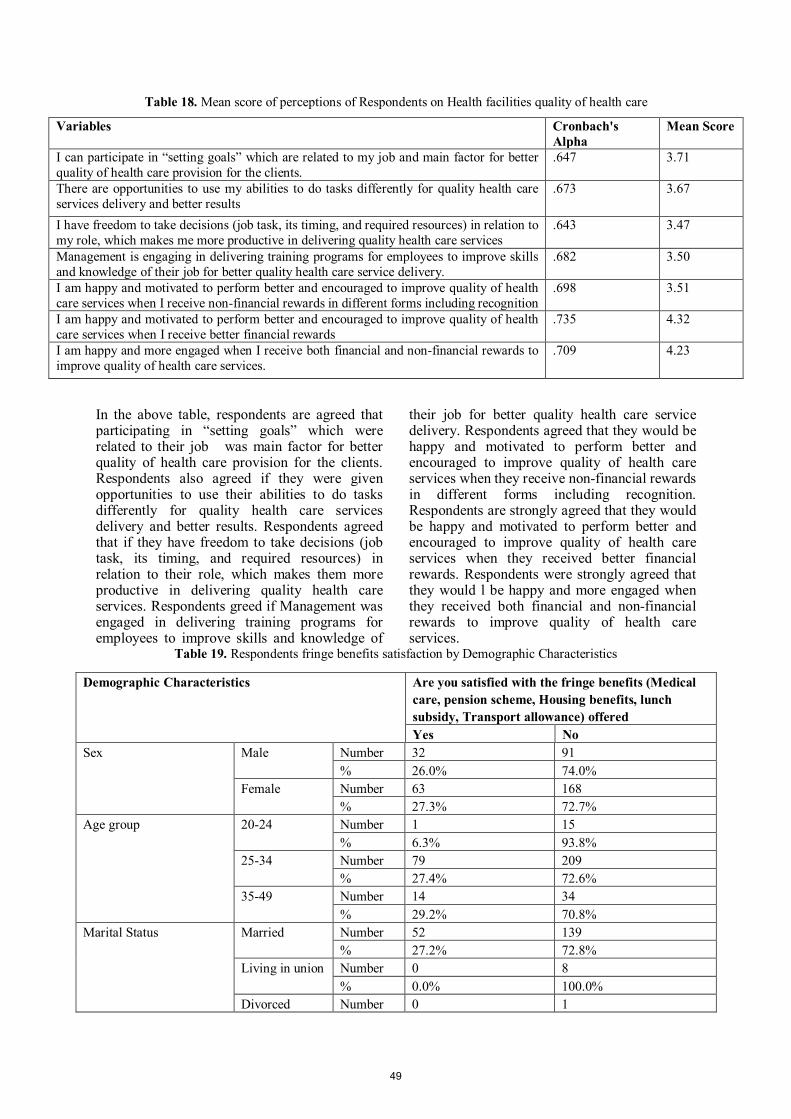
Table 18. Mean score of perceptions of Respondents on Health facilities quality of health care
Variables Cronbach's Alpha
Mean Score
I can participate in “setting goals” which are related to my job and main factor for better quality of health care provision for the clients.
.647 3.71
There are opportunities to use my abilities to do tasks differently for quality health care services delivery and better results
.673 3.67
I have freedom to take decisions (job task, its timing, and required resources) in relation to my role, which makes me more productive in delivering quality health care services
.643 3.47
Management is engaging in delivering training programs for employees to improve skills and knowledge of their job for better quality health care service delivery.
.682 3.50
I am happy and motivated to perform better and encouraged to improve quality of health care services when I receive non-financial rewards in different forms including recognition
.698 3.51
I am happy and motivated to perform better and encouraged to improve quality of health care services when I receive better financial rewards
.735 4.32
I am happy and more engaged when I receive both financial and non-financial rewards to improve quality of health care services.
.709 4.23
In the above table, respondents are agreed that participating in “setting goals” which were related to their job was main factor for better quality of health care provision for the clients. Respondents also agreed if they were given opportunities to use their abilities to do tasks differently for quality health care services delivery and better results. Respondents agreed that if they have freedom to take decisions (job task, its timing, and required resources) in relation to their role, which makes them more productive in delivering quality health care services. Respondents greed if Management was engaged in delivering training programs for employees to improve skills and knowledge of
their job for better quality health care service delivery. Respondents agreed that they would be happy and motivated to perform better and encouraged to improve quality of health care services when they receive non-financial rewards in different forms including recognition. Respondents are strongly agreed that they would be happy and motivated to perform better and encouraged to improve quality of health care services when they received better financial rewards. Respondents were strongly agreed that they would l be happy and more engaged when they received both financial and non-financial rewards to improve quality of health care services.
Table 19. Respondents fringe benefits satisfaction by Demographic Characteristics
Demographic Characteristics Are you satisfied with the fringe benefits (Medical care, pension scheme, Housing benefits, lunch subsidy, Transport allowance) offered Yes No
Sex Male Number 32 91 % 26.0% 74.0%
Female Number 63 168 % 27.3% 72.7%
Age group 20-24 Number 1 15 % 6.3% 93.8%
25-34 Number 79 209 % 27.4% 72.6%
35-49 Number 14 34 % 29.2% 70.8%
Marital Status Married Number 52 139 % 27.2% 72.8%
Living in union Number 0 8 % 0.0% 100.0%
Divorced Number 0 1
49
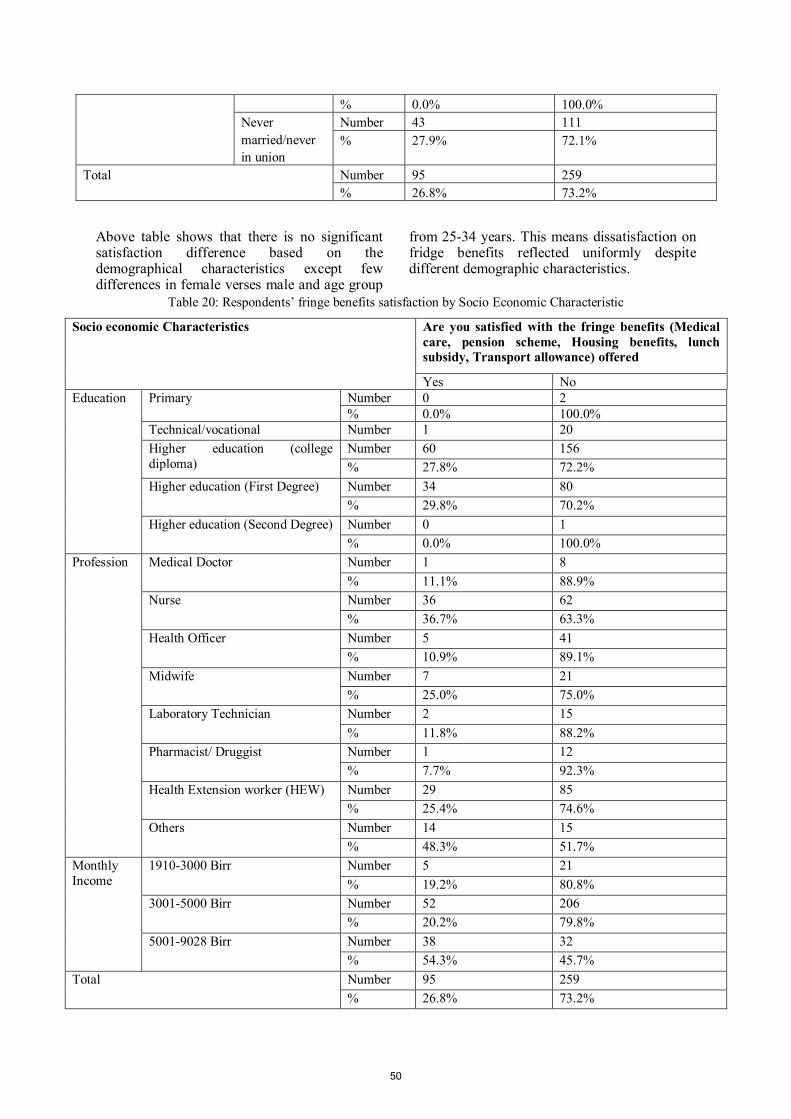
% 0.0% 100.0% Never married/never in union
Number 43 111 % 27.9% 72.1%
Total Number 95 259 % 26.8% 73.2%
Above table shows that there is no significant satisfaction difference based on the demographical characteristics except few differences in female verses male and age group
from 25-34 years. This means dissatisfaction on fridge benefits reflected uniformly despite different demographic characteristics.
Table 20: Respondents’ fringe benefits satisfaction by Socio Economic Characteristic
Socio economic Characteristics Are you satisfied with the fringe benefits (Medical care, pension scheme, Housing benefits, lunch subsidy, Transport allowance) offered
Yes No Education Primary Number 0 2
% 0.0% 100.0% Technical/vocational Number 1 20 Higher education (college diploma)
Number 60 156 % 27.8% 72.2%
Higher education (First Degree) Number 34 80 % 29.8% 70.2%
Higher education (Second Degree) Number 0 1 % 0.0% 100.0%
Profession Medical Doctor Number 1 8 % 11.1% 88.9%
Nurse Number 36 62 % 36.7% 63.3%
Health Officer Number 5 41 % 10.9% 89.1%
Midwife Number 7 21 % 25.0% 75.0%
Laboratory Technician Number 2 15 % 11.8% 88.2%
Pharmacist/ Druggist Number 1 12 % 7.7% 92.3%
Health Extension worker (HEW) Number 29 85 % 25.4% 74.6%
Others Number 14 15 % 48.3% 51.7%
Monthly Income
1910-3000 Birr Number 5 21 % 19.2% 80.8%
3001-5000 Birr Number 52 206 % 20.2% 79.8%
5001-9028 Birr Number 38 32 % 54.3% 45.7%
Total Number 95 259 % 26.8% 73.2%
50
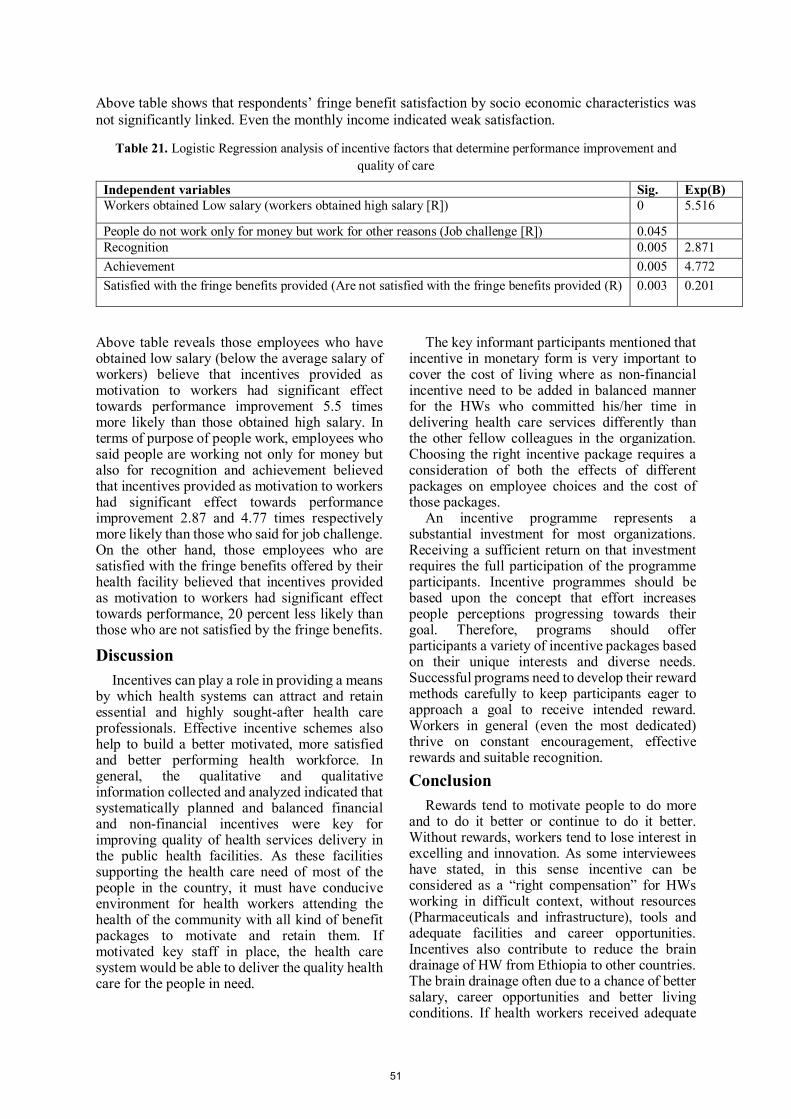
Above table shows that respondents’ fringe benefit satisfaction by socio economic characteristics was not significantly linked. Even the monthly income indicated weak satisfaction.
Table 21. Logistic Regression analysis of incentive factors that determine performance improvement and quality of care
Independent variables Sig. Exp(B) Workers obtained Low salary (workers obtained high salary [R]) 0 5.516
People do not work only for money but work for other reasons (Job challenge [R]) 0.045
Recognition 0.005 2.871 Achievement 0.005 4.772 Satisfied with the fringe benefits provided (Are not satisfied with the fringe benefits provided (R) 0.003 0.201
Above table reveals those employees who have obtained low salary (below the average salary of workers) believe that incentives provided as motivation to workers had significant effect towards performance improvement 5.5 times more likely than those obtained high salary. In terms of purpose of people work, employees who said people are working not only for money but also for recognition and achievement believed that incentives provided as motivation to workers had significant effect towards performance improvement 2.87 and 4.77 times respectively more likely than those who said for job challenge. On the other hand, those employees who are satisfied with the fringe benefits offered by their health facility believed that incentives provided as motivation to workers had significant effect towards performance, 20 percent less likely than those who are not satisfied by the fringe benefits.
Discussion Incentives can play a role in providing a means
by which health systems can attract and retain essential and highly sought-after health care professionals. Effective incentive schemes also help to build a better motivated, more satisfied and better performing health workforce. In general, the qualitative and qualitative information collected and analyzed indicated that systematically planned and balanced financial and non-financial incentives were key for improving quality of health services delivery in the public health facilities. As these facilities supporting the health care need of most of the people in the country, it must have conducive environment for health workers attending the health of the community with all kind of benefit packages to motivate and retain them. If motivated key staff in place, the health care system would be able to deliver the quality health care for the people in need.
The key informant participants mentioned that incentive in monetary form is very important to cover the cost of living where as non-financial incentive need to be added in balanced manner for the HWs who committed his/her time in delivering health care services differently than the other fellow colleagues in the organization. Choosing the right incentive package requires a consideration of both the effects of different packages on employee choices and the cost of those packages.
An incentive programme represents a substantial investment for most organizations. Receiving a sufficient return on that investment requires the full participation of the programme participants. Incentive programmes should be based upon the concept that effort increases people perceptions progressing towards their goal. Therefore, programs should offer participants a variety of incentive packages based on their unique interests and diverse needs. Successful programs need to develop their reward methods carefully to keep participants eager to approach a goal to receive intended reward. Workers in general (even the most dedicated) thrive on constant encouragement, effective rewards and suitable recognition. Conclusion
Rewards tend to motivate people to do more and to do it better or continue to do it better. Without rewards, workers tend to lose interest in excelling and innovation. As some interviewees have stated, in this sense incentive can be considered as a “right compensation” for HWs working in difficult context, without resources (Pharmaceuticals and infrastructure), tools and adequate facilities and career opportunities. Incentives also contribute to reduce the brain drainage of HW from Ethiopia to other countries. The brain drainage often due to a chance of better salary, career opportunities and better living conditions. If health workers received adequate
51
salary in their country they are less willing to leave their country.
During the discussion on incentive mechanisms some health managers mainly referred to the financial incentives. But HWs interviewed have underlined the important of non-financial incentives. The word recognition had a lot of importance among HWs, they asked recognition for their work and more when there were working in rural and remote areas of Ethiopia. This has been indicated in the WHO user guide for HRH in rural and remote areas. A good incentive mechanism includes both financial and non-financial incentives to be positive and useful to the empowerment of HWs in improving performance and quality of health care services. References [1] Kidane Mariam, W. & Moen, A. (1972). Government health services in Ethiopia and the role of medical graduates in it. Ethiopian-Medical Journal, PO, 117-13 [2] Health Extension Programme: An Innovative Solution to Public Health Challenges of Ethiopia. A Case Study, USAID. [3] Yayehyirad Kitaw, Yemane Ye-Ebiyo, Amir Said, Hailay Desta, and Awash Teklehaimanot, "Assessment of the Training of the First Intake of Health Extension Workers”, (2007). The Ethiopian Journal of Health Development, 21 (2007), pp. 232 – 239 [4] "Global distribution of health workers in WHO Member States" (2008). The World Health Report 2006. World Health Organization. [5] Macro International Inc. (2008). Ethiopia Atlas of Key Demographic and Health Indicators, 2005." (Calverton: Macro International. [6] Conacher, D.G. (1976). "Medical care in Ethiopia". Transactions of the Royal Society of Tropical Medicine and Hygiene. 70 (2): 141–144. doi:10.1016/0035-9203(76)90176-0. [7] The Ethiopia Sixth Health Accounts (2013/14): Statistical Report Health Insurance (CBHI, SHI), Publications; https://www.hfgproject.org/ethiopia-sixth-health-accounts-201314-statistical-report/ https://web.archive.org/web/20181220231759/ http://www.moh.gov.et/ [8] National Human resource for health strategic plan for Ethiopia 2016–2025 [9] Ministry of Health. (2010). Health sector development program IV 2010/11-2014/15. (). Addis Ababa, Ethiopia: Federal Democratic Republic of Ethiopia. [10] The Health Extension Programme in Ethiopia. The World Bank, Washington DC, January 2013;
[11] Transforming Health Care in Ethiopia: An Interview with Dr. Tedros Adhanom Ghebreyesu”. (2013). Boston Consulting Group. [12] EVALUATION OF HEP (2010). Implementation process and effect on health outcomes VOLUME IV: SUPPORT AND MANAGEMENT OF HEP, RURAL ETHIOPIA. [13] Institute of Medicine (2001). Crossing the quality chasm: A new healthcare system for the twenty-first century Washington, DC: National Academies Press. [14] Midwest Business Group on Health (2002). Reducing the costs of poor-quality health care through responsible purchasing leadership Chicago, IL: Mid- west Business Group on Health. [15] Pink GH, Brown AD, Stutter ML, Reiter KL, Leatt P (2006). Pay-for-Performance in publicly financed health care: some international experiences and considerations for Canada. Healthcare Papers, 6:8-26. [16] Bossert T (1998). Decentralization of health systems: decision space, innovation, and performance. Soc Sci Med, 10:1513-1127. [17] Saltman R, Bankauskaite V (2006). Conceptualizing decentralization in European health systems: a functional perspective. Health Economics, Policy and Law, 1:127-147. [18] Saltman R, Bankauskaite V (2006). Conceptualizing decentralization in European health systems: a functional perspective. Health Economics, Policy and Law, 1:127-147. [19] Herzberg, F., (1968). One more time: how do you motivate employees? Harvard Business Review, Vol 46, Issue 1 [20] Hotchkiss, D.R., Banteyerga, H. & Tharaney, M. (2015). Job satisfaction and motivation among public sector health workers: evidence from Ethiopia. Hum Resource Health 13, 83 (2015) doi: 10.1186/s12960-015-0083-6. [21] Vroom, V. H. (1964). Work and Motivation. New York: John Wiley. [22] Brewer, D. J., & Picus, L. O. (Eds.). (2014). Encyclopedia of Education Economics and Finance. SAGE Publications. [23] Herzberg, F., Mausner, B., Peterson, R., & Capwell, D. (1957). Job attitudes: Review of research and opinion. Pittsburg: Psychological Service of Pittsburg. [24] Herzberg, F. (1966). Work and the nature of man. Cleveland: World Publishing. [25] Herzberg, F. (1968). One more time: How do you motivate your employees? Harvard [26] Value Based Management.net. 2016. Retrieved from http://www.valuebased management.net/methods_herzberg_two_factor_theory.html.
52
Texila International Journal of Academic research ISSN: 2520-3088
DOI: 10.21522/TIJAR.2014.07.02.Art006
Features of Problem Based Learning Lesson Plan That Fits into the Realities in the Teaching and Learning of Mathematics for Pre-service
Teachers in Ghana
Eric Sefa Boye PhD, School of Education, Texila American University, Guyana
E-mail: [email protected]
Abstract
The traditional method of teaching Mathematics has been criticised by researchers as learner
passive paving the way for Problem Based Learning (PBL) strategy into the teacher education
curriculum in Ghana. This development has aroused concerns about the effectiveness of lesson plans
designed for teaching using the traditional method. Consequently, the introduction of a PBL lesson
plan that is learner-centred, interactive, and involves the cooperation of learners in small group
activities has become indispensable. The study seeks to determine the features of the PBL lesson plan
that fits into the realities in the teaching and learning of Mathematics for pre-service teachers at the
colleges of education in Ghana. The methodology employed in this study involved a literature review
of a traditional lesson plan for pre-service teachers in Ghana alongside a proposed PBL lesson plan
for pre-service teachers through a qualitative analysis before the enactment of the instructional
process. The result and discussions of the two lesson plans placed the PBL lesson plan as a more
constructive and a deeper reflection of the three domains of learning (cognitive, affective, and
psychomotor) which are crucial in stating instructional objectives and for teaching Mathematics. The
paper recommended that the PBL strategy should be integrated into the teacher education curriculum
in Ghana since its features better fit into the realities in Mathematics education in Ghana.
Keywords: Problem based learning, Traditional Teaching method, Lesson plan, Pre-service teachers,
and Mathematics education.
Introduction The teaching and learning of Mathematics are
a process and not an event. The process requires competent tutors with appreciable pedagogical skills to be able to deliver Mathematics contents effectively to shape the cognitive, affective and psychomotor skills of pre-service teachers. A tutor’s in-depth understanding of a subject matter is not singlehandedly a panacea for effective teaching. The ability of a tutor to deliver content to a group of learners requires a structured approach guided by a lesson plan artefact. This lesson plan has been widely acclaimed as a mandatory tool if one wants to trek the path of teaching and learning according to researchers.
Largely, it is accepted in the teaching and learning process that lesson plan helps the teaching and learning process to be valuable and meaningful. On the contrary, an ill-prepared lesson plan results in unfocused and
unproductive teaching and learning experiences. Many tutors generally believe that designing a lesson plan before an instructional process will lead to more effective teaching (Conkell and Imwold, 1992; Lederman and Niess, 2002). MacDonald and Phillips (2005) assert that planning a lesson allows the teacher to reflect on what to achieve and how best this can be done. A detailed lesson planning is important as it provides tutors the approach to better understand the content, student learning, and pedagogical content knowledge (Shen et al., 2007). Important to this is that lesson planning needs to focus on educational experiences that would stimulate learning than simply the delivery of content.
An instructional process in a formal classroom setting either takes the form of a teacher-centred or learner-centred approach. The teacher-centred approach describes a traditional method of teaching as against a learner-centred approach described as a problem-based learning
53
in the context of this paper. Research has revealed that these teachers use traditional methods in the teaching of Mathematics (Ampiah et al., 2004). Enu, J et al., (2015) conducted a study on the topic “factors influencing students’ Mathematics performance in some selected colleges of education in Ghana”. The study revealed that the expository approach of teaching Mathematics (just listening to teachers and copying notes from the board) was the major method of instruction by most tutors. The study revealed that 88% of Mathematics tutors use lecture method of instruction, 10% also use questioning and answering method of teaching whilst 2% use heuristic methods involving the use of small group discussion as the least methods of instruction (Enu et al., 2015).
Ghana Ministry of Education (2017) in a publication “The National Teacher Education Curriculum Framework” advocated for teachers to be competent in the use of different pedagogical strategies including project-based, enquiry based, and problem-based instructions and learning strategies, to meet the diverse needs and learning styles of learners. Irrespective of the kind of strategy to be employed and the level of content knowledge, the need for pre-service teachers to be exposed to how a typical lesson plan is prepared prior to an instructional process cannot be overlooked.
Problem based learning strategy reflects a social process in which students are engaged in dialogue and discussions (Hanley, 1994) and empowers teachers and students for critical thinking and creating changes in old teaching methods (Sawada, et al, 2002). Problem based learning (PBL) in Mathematics classrooms also fosters cooperation in small groups (Schmidt, et al, 2007). This effect could be achieved through a well-designed lesson plan that arranges and delivers content of a lesson coherently and confidently. The purpose of the paper is to examine the features of a typical PBL lesson plan relative to a typical lesson plan for a traditional Mathematics classroom at the colleges of education in Ghana. The paper briefly reviews literature on lesson plan and the domains of learning. It will then state the objective of the study, and the methodology employed in the study. Furthermore, it will compare a typical traditional lesson plan with a proposed PBL lesson plan. The paper also
discusses the outcome of the comparison and finally makes recommendations.
Literature Review This aspect of the paper will cover definitions
and features of a lesson plan, and the three domains of learning. According to Scrivener (2005), planning a lesson involves imagining the lesson before it is enacted and this includes prediction, anticipation, sequencing, organising and simplifying. This planning could be unit planning, weekly planning and/or daily planning (Anderson, 1989). Anderson emphasised that the lesson plan which is planned daily is very significant for teachers. Woodward (2009) states that constructing a lesson plan and planning a lesson must take into consideration the learners, the contents to deliver, materials, and activities that could go into the lesson.
Amin (2010) defines a lesson plan as a set of planned activities in the learning process to reach a certain goal. A lesson plan is also considered as a blueprint, a guide map for action or a comprehensive chart of classroom teaching and learning activities (Aggarwal 2002). Aggarwal describes it as elastic but a systematic approach to the teaching of the concepts, skills, and attitudes. From the foregoing, a lesson plan could be described as an artefact that sets the tone for effective teaching and learning by considering the content to teach and how to teach it with respect to the teacher, the learner, and the environment. This requires a systematic and coherent manner to shape the knowledge, attitude and skills of the learner. The lesson plan could vividly indicate the lesson objective, the activities to support the attainment of the objective, the teaching and learning materials, and the evaluation of the objectives within a stipulated time frame.
Most experts agree that a lesson plan should indicate the instructional objectives, the instructional materials, the procedure, the media, and an assessment technique. Brown (1975) indirectly enumerated the content of a lesson plan as:
a. What kind of things do you want the pupils to learn?
b. What are your precise instructional objectives?
c. What is the most appropriate sequence of the topic and the task?
d. What are the most appropriate methods?
54
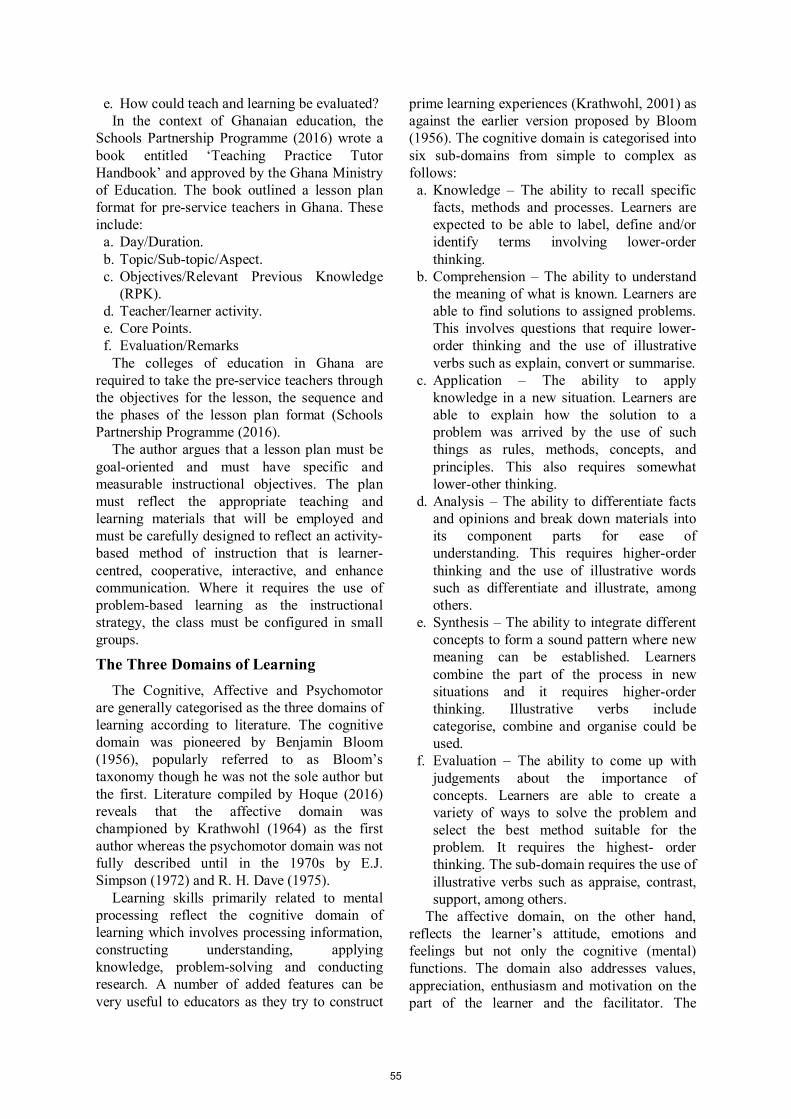
e. How could teach and learning be evaluated? In the context of Ghanaian education, the
Schools Partnership Programme (2016) wrote a book entitled ‘Teaching Practice Tutor Handbook’ and approved by the Ghana Ministry of Education. The book outlined a lesson plan format for pre-service teachers in Ghana. These include:
a. Day/Duration. b. Topic/Sub-topic/Aspect. c. Objectives/Relevant Previous Knowledge
(RPK). d. Teacher/learner activity. e. Core Points. f. Evaluation/Remarks
The colleges of education in Ghana are required to take the pre-service teachers through the objectives for the lesson, the sequence and the phases of the lesson plan format (Schools Partnership Programme (2016).
The author argues that a lesson plan must be goal-oriented and must have specific and measurable instructional objectives. The plan must reflect the appropriate teaching and learning materials that will be employed and must be carefully designed to reflect an activity-based method of instruction that is learner-centred, cooperative, interactive, and enhance communication. Where it requires the use of problem-based learning as the instructional strategy, the class must be configured in small groups.
The Three Domains of Learning The Cognitive, Affective and Psychomotor
are generally categorised as the three domains of learning according to literature. The cognitive domain was pioneered by Benjamin Bloom (1956), popularly referred to as Bloom’s taxonomy though he was not the sole author but the first. Literature compiled by Hoque (2016) reveals that the affective domain was championed by Krathwohl (1964) as the first author whereas the psychomotor domain was not fully described until in the 1970s by E.J. Simpson (1972) and R. H. Dave (1975).
Learning skills primarily related to mental processing reflect the cognitive domain of learning which involves processing information, constructing understanding, applying knowledge, problem-solving and conducting research. A number of added features can be very useful to educators as they try to construct
prime learning experiences (Krathwohl, 2001) as against the earlier version proposed by Bloom (1956). The cognitive domain is categorised into six sub-domains from simple to complex as follows:
a. Knowledge – The ability to recall specific facts, methods and processes. Learners are expected to be able to label, define and/or identify terms involving lower-order thinking.
b. Comprehension – The ability to understand the meaning of what is known. Learners are able to find solutions to assigned problems. This involves questions that require lower-order thinking and the use of illustrative verbs such as explain, convert or summarise.
c. Application – The ability to apply knowledge in a new situation. Learners are able to explain how the solution to a problem was arrived by the use of such things as rules, methods, concepts, and principles. This also requires somewhat lower-other thinking.
d. Analysis – The ability to differentiate facts and opinions and break down materials into its component parts for ease of understanding. This requires higher-order thinking and the use of illustrative words such as differentiate and illustrate, among others.
e. Synthesis – The ability to integrate different concepts to form a sound pattern where new meaning can be established. Learners combine the part of the process in new situations and it requires higher-order thinking. Illustrative verbs include categorise, combine and organise could be used.
f. Evaluation – The ability to come up with judgements about the importance of concepts. Learners are able to create a variety of ways to solve the problem and select the best method suitable for the problem. It requires the highest- order thinking. The sub-domain requires the use of illustrative verbs such as appraise, contrast, support, among others.
The affective domain, on the other hand, reflects the learner’s attitude, emotions and feelings but not only the cognitive (mental) functions. The domain also addresses values, appreciation, enthusiasm and motivation on the part of the learner and the facilitator. The
55

affective domain is categorised into 5 sub-domains, which are listed from the lowest level to highest level as (a) Receiving, (b) Responding, (c) Valuing, (d) Organisation and (e) Characterisation. These are briefly explained as follows:
a. Receiving - This requires paying attention to details to express the awareness of feelings and emotions. An example is listening attentively and closely to the classroom activities. Illustrative verbs that are used include ask, give, follow, among others.
b. Responding – Requires active participation of a learner in given activities. Learners participating in a group discussion may reflect a PBL classroom to complete an assigned task. Illustrative verbs that are used include answer, assist, comply, and practice among others.
c. Valuing – This is the ability of a learner to realise the worth of something and express it. Proposing a plan (e.g. a PBL lesson plan) to improve skills and a facilitator sharing know-how to achieve a learning outcome are examples. Illustrative verbs include describe, explain, complete, follow, initiate, and read.
d. Organisation – This is the ability to bring together different values, resolve conflicts and create a unique value system. An example is learners spend time in a PBL classroom and share ideas freely with their peers. This helps to identify strengths and weaknesses. The use of illustrating verbs such as: adhere, alter, arrange, combine, compare, among others are used.
e. Characterisation – The learner’s ability to internalise value and allow that to impact on behaviour. An example includes practicing cooperation in a small group activity and maintaining good study habits. Some illustrative verbs include act, discriminate, display, modify, practice and qualify.
The Psychomotor domain of learning as described by Simpson (1972) involves objectives that are specific to discrete physical functions, reflex actions and interpretative movements. The psychomotor domain comprises utilising motor skills and coordinating them. The domain has seven sub-domains which are mentioned from the lowest to the highest as follows:
a. Perception – The ability to apply sensory information to obtain a cue that guides motor activity. Example is relating to the sound of the drum to the type of dance move. This involves the use of illustrative verbs such as choose, describe, detect, among others.
b. Set – The readiness to act. This includes mental, physical and emotional set. An example is demonstrating how to state lesson objectives during an instructional period to achieve learning outcomes. Illustrative verbs include: begin, display, explain, and show.
c. Guided Response – The ability to imitate a displayed behaviour or to utilise trial and error. This involves the early stages of learning a complex skill. Example: a pre-service teacher emulates the teaching skills of a facilitator during teaching. Illustrative verbs include: assemble, build, and construct are used.
d. Mechanism – The ability to convert learnt responses into habitual actions with proficiency and confidence. A pre-service teacher is able to teach with a lesson plan after practicing how to prepare a lesson plan and rehearsing with it. Illustrative verbs include sketch, fix, assemble, and dissect.
e. Complex Overt Response – The ability to skilfully perform complex patterns of actions. Example: Teaching contents chronologically without looking at the lesson plan. Verbs such as organise, construct, assemble, etc. are used.
f. Adaptation – The ability to modify movement patterns from well-developed skills to meet special events. An example is modifying a lesson plan for the traditional teaching method to suit a PBL lesson plan. Illustrative verbs include adapt, alter, change, reorganise.
g. Origination – Creating a new movement pattern for a specific situation or a particular problem. An example is designing a typical problem-based learning lesson plan for the teaching of college of education Mathematics. The use of verbs such as create, design, and originate are examples.
The author asserts that a good lesson plan must recognise and integrate the six sub-domains of the cognitive domain of learning. The preparation, organisation, and sequencing of
56
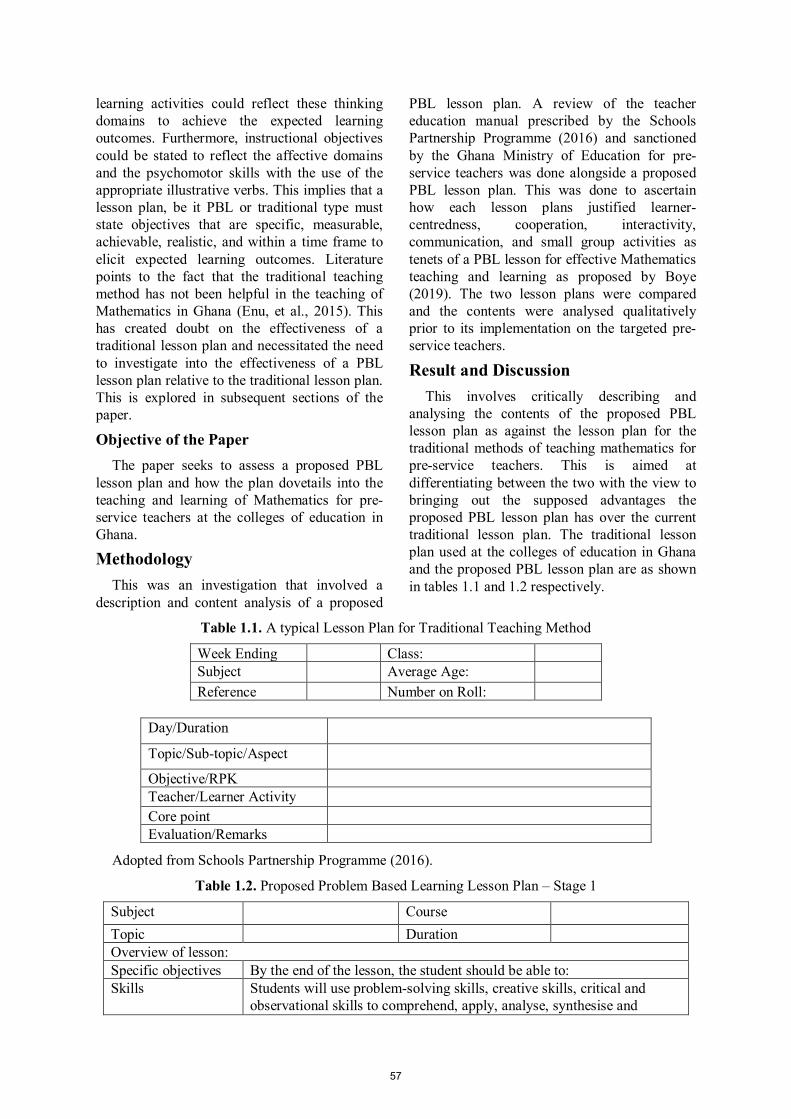
learning activities could reflect these thinking domains to achieve the expected learning outcomes. Furthermore, instructional objectives could be stated to reflect the affective domains and the psychomotor skills with the use of the appropriate illustrative verbs. This implies that a lesson plan, be it PBL or traditional type must state objectives that are specific, measurable, achievable, realistic, and within a time frame to elicit expected learning outcomes. Literature points to the fact that the traditional teaching method has not been helpful in the teaching of Mathematics in Ghana (Enu, et al., 2015). This has created doubt on the effectiveness of a traditional lesson plan and necessitated the need to investigate into the effectiveness of a PBL lesson plan relative to the traditional lesson plan. This is explored in subsequent sections of the paper.
Objective of the Paper The paper seeks to assess a proposed PBL
lesson plan and how the plan dovetails into the teaching and learning of Mathematics for pre-service teachers at the colleges of education in Ghana.
Methodology This was an investigation that involved a
description and content analysis of a proposed
PBL lesson plan. A review of the teacher education manual prescribed by the Schools Partnership Programme (2016) and sanctioned by the Ghana Ministry of Education for pre-service teachers was done alongside a proposed PBL lesson plan. This was done to ascertain how each lesson plans justified learner-centredness, cooperation, interactivity, communication, and small group activities as tenets of a PBL lesson for effective Mathematics teaching and learning as proposed by Boye (2019). The two lesson plans were compared and the contents were analysed qualitatively prior to its implementation on the targeted pre-service teachers.
Result and Discussion This involves critically describing and
analysing the contents of the proposed PBL lesson plan as against the lesson plan for the traditional methods of teaching mathematics for pre-service teachers. This is aimed at differentiating between the two with the view to bringing out the supposed advantages the proposed PBL lesson plan has over the current traditional lesson plan. The traditional lesson plan used at the colleges of education in Ghana and the proposed PBL lesson plan are as shown in tables 1.1 and 1.2 respectively.
Table 1.1. A typical Lesson Plan for Traditional Teaching Method
Week Ending Class: Subject Average Age: Reference Number on Roll:
Day/Duration
Topic/Sub-topic/Aspect
Objective/RPK Teacher/Learner Activity Core point Evaluation/Remarks
Adopted from Schools Partnership Programme (2016).
Table 1.2. Proposed Problem Based Learning Lesson Plan – Stage 1
Subject Course Topic Duration Overview of lesson: Specific objectives By the end of the lesson, the student should be able to: Skills Students will use problem-solving skills, creative skills, critical and
observational skills to comprehend, apply, analyse, synthesise and
57
evaluate.
Knowledge Students will learn: To distinguish between….
Attitude Problem solving, creativity, and critical thinking. Cooperation, Communicate skills, Learner-centred, Interactivity,
Small group activity. RPK Students are able to: Classroom configuration
Small groups (between 4-8 students) in a semi-circle or such that the groups face the marker board.
Resources/TLM
Stage 2
Phase Researcher Activity Student Activity
Introduction (duration)
Main Activity (duration)
Activity 1. Activity 2 Activity 3. Etc
Conclusion (Duration)
Activity sheet By comparing the two lesson plans, one could
notice that both provide preliminary information (class, subject, number on roll, duration, topic, etc) about the targeted group (pre-service teachers). This is important as it gives direction and informs the content of the lesson plans. The lesson objective, relevant previous knowledge (RPK), teacher and learner activity, and evaluation are headings that are featured in both traditional and PBL lesson plans.
Conversely, the PBL lesson plan has certain features that make the lesson plan artefact distinct and more promising in the attainment of the expected learning outcomes. For instance, the PBL lesson plan provides an overview of the lesson to be taught for a specific instructional period. The PBL lesson plan has other features such as skills, knowledge, attitude, classroom configuration, and teaching and learning materials/resources. Specifically, the teacher and learner activities under the PBL are intended to reflect the tenets of the PBL lesson (small group activity, learner-centredness, cooperation, interactivity, and communication) as proposed by Boye (2019). Undoubtedly, pieces of literature from experts in the field of Mathematics education continue to recommend a pedagogical approach that makes the learner more active than passive and this characterises
the PBL process. More importantly, the design of a PBL lesson to encompass the tenets and the subsequent implementation in the teaching of pre-service Mathematics could address the gaps created by the traditional lesson plan. This has called for a PBL lesson plan that puts the pre-service teacher at the centre of the teaching and learning process interspersed with problem-solving activities.
Generally, the lesson objectives, activities, and evaluation components of both lesson plans support the cognitive domain of learning as postulated by Bloom (1956) and highlighted in the literature above. In particular, however, the PBL lesson plan amply covers some aspects of the affective (attitude) and psychomotor domains (skills) pioneered by Krathwohl (1964) and Simpson (1972) respectively. More so, the PBL lesson plan is accompanied by an activity sheet that has homework or tasks that stimulate learners’ lower-order and higher-order thinking to reflect the three domains of learning: cognitive, affective and psychomotor skills of the learners. The PBL lesson plan sets the tone for the design and implementation of a more constructive and learner-centred method of teaching college of education Mathematics that will inure to the benefit of pre-service teachers.
58
Conclusion and Recommendations The successful outcome of an instructional
period requires detailed planning, organisation, and effective delivery of content based on a carefully designed lesson plan. Lesson plan has been discovered and widely accepted in the teaching and learning environment as a mandatory tool for teaching. A lesson plan is viewed as a set of planned activities in the learning process to reach a certain goal (Amin, 2010). The paper discussed two categories of lesson plan: a lesson plan used for traditional teaching method at the colleges of education in Ghana (Schools Partnership Programme (2016)) and a proposed PBL lesson plan for pre-service teachers in Ghana.
The components of a lesson plan as championed by Brown (1975) above could be summarised as topic, objectives, activities, method and evaluation. Similarly, the Schools Partnership Programme (2016) indicated that a lesson plan for pre-service teachers could have features such as duration of the lesson, topic/sub-topic, objective, relevance previous knowledge, and teacher-learner activity. Others are core points and evaluation. These were reflected in both lesson plans except that the class configuration was not captured in the Schools Partnership Programme (2016) for the traditional teaching method. The absence of the regrouping of the class into smaller units under the traditional setup impedes the constructiveness of effective teaching as championed by the PBL approach. Furthermore, the PBL lesson plan better reflects the affective and psychomotor domains (i.e. attitude and skills) of learning. Again, the practicality of the teacher-learner activity fits into the realities of pre-service teachers teaching and learning of Mathematics at the colleges of education.
Finally, the proposed PBL lesson plan sought to make the teaching and learning of Mathematics learner-centred, interactive, cooperative, and enhance communication. This could be achieved in small group activities that are learner dominated. This is expected to make the teaching of Mathematics interesting and promising as the approach could bring out the creative skills and problem-solving abilities in the pre-service teacher that will eventually make them good teachers in the future.
The following are recommended as part of measures to improve upon the teaching and learning of Mathematics by pre-service teachers using PBL lesson plan:
a. The Government of Ghana and stakeholders involved in the teacher education reforms should adopt PBL strategy in the teaching and learning of Mathematics.
b. The National Council for Tertiary Education (NCTE) in conjunction with the various universities in-charge of the colleges of education in Ghana should advocate for the use of PBL approach in teaching.
c. The Ministry of Education should identify and assemble PBL resource persons to design and implement a PBL refresher course for tutors at the colleges of education.
d. The Ghana Education Service should organise PBL workshops and seminars for in-service teachers as part of their professional development strategies.
References [1] Aggarwal, J. C., (2002). Principles, Methods & Techniques of Teaching (2nd ed). New Delhi: Vikas Publishing House Pvt. Ltd. [2] Amin, M (2010). Serba-Serbi Pengajaran Bahasa Buku 2, (Surabaya: Edufutura Press), 78- 81 [3] Ampiah, J., Akyeampong, A. K., and Leliveld, M. (2004). Science, mathematics and ICT (SMICT), secondary education in sub-Saharan Africa - country profile Ghana. Centre for International Cooperation (CIS), Vrije Universiteit Amsterdam. [4] Anderson L.W (1989): The Effective Teacher: McGraw Hill Book Company: Singapore. [5] Bloom, B.S. (Ed.). Engelhart, M.D., Furst, E.J., Hill, W.H., Krathwohl, D.R. (1956). Taxonomy of Educational Objectives,
Handbook I: The Cognitive Domain. New York: David McKay Co Inc. [6] Boye, E.S. (2019). Problem based learning in the teaching and learning of Mathematics in Ghana: A literature review. Texila International Journal of
Academic Research. ISSN: 2520-3088 DOI: 10.21522/TIJAR.2014.SE.19.02.Art008 [7] Brown, G (1975). Micro Teaching, London: Methuen and Co. Ltd. [8] Conkell, C. & Imwold, C. (1992). Planning practices and attitudes of physical education teachers. Physical Educator, 49(2), 1-5.
59
[9] Dave, R.H. (1975). Developing and writing
behavioral objective (R J Armstrong, ed.) Educational Innovators Press. [10] Enu, J, Agyman, O. K., and Nkum D. (2015). Factors influencing students’ mathematics performance in some selected colleges of education in Ghana. International Journal of Education
Learning and Development, 3(3), 68-74.
[11] Hanley, S. (1994). On Constructivism. Retrieved from http://www.inform.umd.edu/UMS%2BState/UMDProjects/MCTP/Essays/Constructivism.txt. [12] Hoque, M.E, (2016). Three Domains of Learning: Cognitive, Affective and Psychomotor. The journal of EFL Education and Research, Vol.2: ISSN-2520-5897. [13] Krathwohl, D.R., Bloom, B.S., and Masia, B.B. (1964). Taxonomy of educational objectives: The classification of educational goals. Handbook II: Affective domain. New York: David McKay Co. [14] Lederman, N.G. and Niess, M.L. (2000). If you fail to plan, are you planning to fail? School Science and Mathematics, 100(2), 57-61. [15] MacDonald, J .and Phillips, R.A.D. (2005). Developing teaching briefs and plan teaching sessions. Education for Primary Care, 16, 496-498. [16] Ministry of Education (2019). Presentation on the New Curriculum Reform for Basic Schools, Accra, Ghana: Ministry of Education.
[17] Sawada, D., Piburn, M. D., Judson, E., Turley, J., Falconer, K., Benford, R., and Bloom, I. (2002). Measuring reform practices in science and mathematics classrooms: The reformed teaching observation protocol. School Science and Mathematics, 102(6): 245-253. https://doi.org/10.1111/j.1949-8594.2002.tb17883.x. [18] Simpson E.J. (1972). The Classification of Educational Objectives in the Psychomotor Domain. Washington, DC: Gryphon House. [19] Schmidt, H. G., Loyens, S. M. M., Van Gog, T., and Paas, F. (2007). Problem-based learning is compatible with human cognitive architecture: Commentary on Kirschner, Sweller, and Clark (2006). Educational Psychologist, 42, 91–97. [20] Schools Partnership Programme (2016). Teaching Practice Tutor Handbook: Ghana Ministry of Education under Creative Commons Attribution-Share Alike 4.0 International. http://www.t-tel.org.Version 1.0 January 2016. [21] Scrivener, J (2005). Learning teaching (2nd ed), Oxford: Macmillan. [22] Shen, J, Poppink, S, Cui, Y. and Fan, G. (2007). Lesson planning: A practice of professional responsibility and development. Educational Horizons, 85(4), 248-258. [23] Woodward T (2009): Planning Lesson and Course: Cambridge University Press, Cambridge.
60
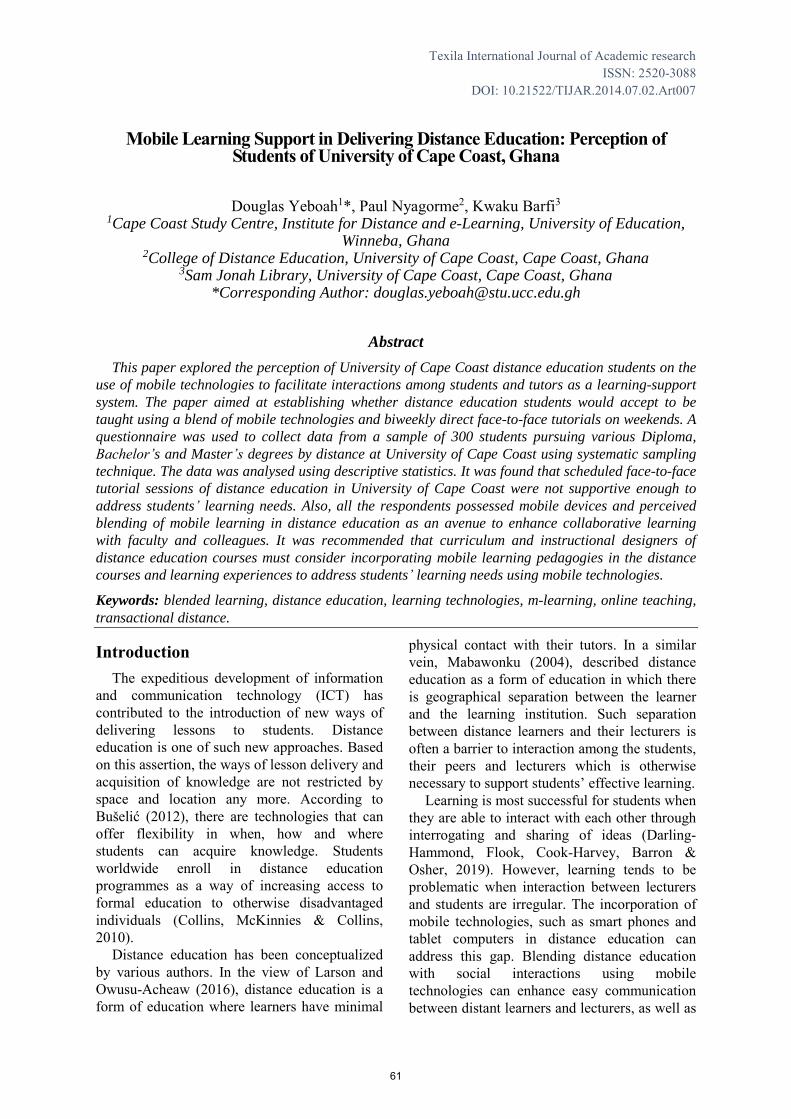
Texila International Journal of Academic research ISSN: 2520-3088
DOI: 10.21522/TIJAR.2014.07.02.Art007
Mobile Learning Support in Delivering Distance Education: Perception of Students of University of Cape Coast, Ghana
Douglas Yeboah1*, Paul Nyagorme2, Kwaku Barfi3 1Cape Coast Study Centre, Institute for Distance and e-Learning, University of Education,
Winneba, Ghana 2College of Distance Education, University of Cape Coast, Cape Coast, Ghana
3Sam Jonah Library, University of Cape Coast, Cape Coast, Ghana *Corresponding Author: [email protected]
Abstract
This paper explored the perception of University of Cape Coast distance education students on the
use of mobile technologies to facilitate interactions among students and tutors as a learning-support
system. The paper aimed at establishing whether distance education students would accept to be
taught using a blend of mobile technologies and biweekly direct face-to-face tutorials on weekends. A
questionnaire was used to collect data from a sample of 300 students pursuing various Diploma,
Bachelor’s and Master’s degrees by distance at University of Cape Coast using systematic sampling
technique. The data was analysed using descriptive statistics. It was found that scheduled face-to-face
tutorial sessions of distance education in University of Cape Coast were not supportive enough to
address students’ learning needs. Also, all the respondents possessed mobile devices and perceived
blending of mobile learning in distance education as an avenue to enhance collaborative learning
with faculty and colleagues. It was recommended that curriculum and instructional designers of
distance education courses must consider incorporating mobile learning pedagogies in the distance
courses and learning experiences to address students’ learning needs using mobile technologies.
Keywords: blended learning, distance education, learning technologies, m-learning, online teaching,
transactional distance.
Introduction The expeditious development of information
and communication technology (ICT) has contributed to the introduction of new ways of delivering lessons to students. Distance education is one of such new approaches. Based on this assertion, the ways of lesson delivery and acquisition of knowledge are not restricted by space and location any more. According to Bušelić (2012), there are technologies that can offer flexibility in when, how and where students can acquire knowledge. Students worldwide enroll in distance education programmes as a way of increasing access to formal education to otherwise disadvantaged individuals (Collins, McKinnies & Collins, 2010).
Distance education has been conceptualized by various authors. In the view of Larson and Owusu-Acheaw (2016), distance education is a form of education where learners have minimal
physical contact with their tutors. In a similar vein, Mabawonku (2004), described distance education as a form of education in which there is geographical separation between the learner and the learning institution. Such separation between distance learners and their lecturers is often a barrier to interaction among the students, their peers and lecturers which is otherwise necessary to support students’ effective learning.
Learning is most successful for students when they are able to interact with each other through interrogating and sharing of ideas (Darling-Hammond, Flook, Cook-Harvey, Barron & Osher, 2019). However, learning tends to be problematic when interaction between lecturers and students are irregular. The incorporation of mobile technologies, such as smart phones and tablet computers in distance education can address this gap. Blending distance education with social interactions using mobile technologies can enhance easy communication between distant learners and lecturers, as well as
61
between students and peers. According to Makoe (2013), the introduction of mobile technologies in blended learning holds considerable promise for distance education as a cognitive delivery tool to enhance collaborative learning.
Blended learning refers to a learning process that involves use of a combination of technology and direct face-to-face contacts (Singh, 2012). In the view of Kintu, Zhu and Kagambe (2017), adopting blended learning balances success between distance education using technology and traditional face-to-face learning approaches. Examples of blended learning include a combination of e-learning modules and time-tabled online tutorials using chat room facilities that are integrated into a learning management system (LMS).
In Ghana, the situation of inadequate interaction among distance education students and their tutors are not different. Some Universities in Ghana scheduled face-to-face weakened meetings between their distance students and tutors to deliver lessons.
Statement of the Problem
Tertiary institutions are embracing a number of innovations in pedagogies and some of these involve the use of technology in blended learning. The pedagogy of blended learning (combination of face-to-face and online teaching/learning) initiatives is part of these innovations. However, the efficiency of some of these innovations, especially among University of Cape Coast distance education students faces challenges.
From informal interactions the researchers had with some distance education students of the University of Cape Coast, it was revealed that some of the students have difficulty understanding the course content discussed at face-to-face biweekly tutorials sessions. Some of the distance education students complained that they were not afforded sufficient opportunities to clarify their misunderstandings at tutorial sessions because so much contents were hastily discussed by tutors in a limited time.
There is numerous literature that support the use of mobile devices to facilitate communication among students and tutors or lecturers to support collaborative learning in
distance education environments (Yousuf, 2006; Kukulska–Hulme & Traxler, 2005). The use of mobile devices is suitable especially in learning environments where time is a limited asset. However, there is literature gap on how distance education students in Ghana perceive the usefulness of mobile learning as a supportive pedagogy to enhance their interaction with peers and course tutors to facilitate their learning. This study sought to address this gap.
Purpose of the Study
The purpose of this study was to find out whether distance education students in Ghana accept the blend of weekend face-to-face tutorials at two weeks intervals with mobile learning support system outside the tutorial sessions.
Research Objectives
The objectives of the study were to: 1. determine the extent to which distance
education students desire for additional learning support systems besides their scheduled biweekly face-to-face tutorial sessions.
2. find out the proportion of distance education students who owned mobile devices.
3. determine the extent of distance education students’ willingness to use mobile devices as a complement to face-to-face learning activities.
4. determine how distance education students perceive the effectiveness of blending mobile learning pedagogy with face-to-face tutorial sessions.
Research Questions
1 To what extent do distance education students desire for additional learning support systems besides their scheduled biweekly face-to-face tutorial sessions?
2 What proportion of distance education students own mobile devices?
3 To what extent are distance education students willing to use mobile devices as a complement to face-to-face learning activities?
4 How do distance education students perceive the effectiveness of blending mobile learning pedagogy with face-to-face tutorial sessions?
62
Meaning of Mobile Learning
There have been a number of definitions of the concept of mobile learning by different authors. Among these, Quin (2001), Brown (2005) and Crescente and Lee (2011) are of the view that mobile learning is a subset or extension of e-learning through mobile computational devices. Others also perceive mobile-learning as the processes of acquiring knowledge “through conversations across multiple contexts among people and personal interactive technologies” (Sharples, Taylor & Vavoula, 2007:224). El-Hussein (2010) defined mobile learning as “any type of learning that takes place in learning environments and spaces that take account of the mobility of technology, mobility of the learner and mobility of learning” (p. 20). Keegan (2005) defines mobile learning as learning accomplished with the use of small, portable computing devices such as smartphones, personal digital assistants (PDAs) and similar handheld devices.
One of the paramount features of mobile learning emphasized in all definitions is that it involves the use of devices that are portable and convenient for learners to carry with them anywhere, anytime and enable learners to access sources of learning materials or information at any time anywhere as opposed to devices that are required to be fixed at a place like the desktop computer. Recent innovations in software applications and social media software using Web 2.0 technologies (e.g., blogs, wikis, Twitter, YouTube, WhatsApp) or social networking sites (such as Facebook and Myspace) have made mobile devices continuously changing and spreading. Also, mobile devices give assurance of more potential usage in education.
Blending Mobile Learning in Distance Education
The rate of penetration and ubiquitous nature of mobile devices present tremendous opportunities to educators, particularly those involved in distance education, to utilize these devices to provide support for enhancement of teaching and learning. Besides high rate of penetration, mobile devices present other advantages which make them suitable for use in supporting learning in distance education (Becking et al, 2008). These advantages include the use for independent and collaborative
learning experiences and affordability. Due to these and more advantages of mobile devices, they are thus used in distance education to address variety of student needs.
One of the challenges encountered by distance education students is a sense of isolation which comes as a result of the geographic distance separating students from their peers, and between students and their tutors (Galusha, 1997; Gibson & Graff, 1992). In addressing this challenge for distance learners, mobile devices are used to increase interaction among students and between students and faculty. Mobile devices are also used to support collaborative learning (Yousuf, 2006; Kukulska–Hulme & Traxler, 2005). Furthermore, mobile devices are used by faculty to provide immediate feedback to distance learners as part of improvement in their interactivity.
As reported by Foti and Mendez (2014), mobile learning affords both students and faculty the additional opportunity to conveniently access information instantaneously regardless of their location. By so doing, learning thus occurs anywhere at any time through the use of mobile devices.
The preceding discussion of literature establishes the foundation for variety of reasons and applications of mobile technologies in distance education to facilitate students’ learning. However, there is not much empirical evidence supporting the awareness of distance education students in Ghana regarding the benefits of blending mobile learning pedagogy in the teaching and learning processes of distance education.
Theoretical Framework
The study was underpinned by transactional distance theory which defines critical concepts of distance learning. Moore (1997) viewed transactional distance as a distance which is considered as not being a geographic separation but as a pedagogical concept. The theory allows for a programme in which the principal form of communication is through technology and where technology-mediated communication is ancillary to the classroom (Moore, 2007). According to Tatar, Roschelle, Vabey and Pennuel (2003) the latter programme is important for mobile learning because mobile devices are used in the school settings as an ancillary element but
63
mostly extend beyond the classroom to non-traditional, informal and non-institutional settings. This view is supported by Park (2011) who revealed that the nature of transactional theory and its applicability makes it useful for mobile learning.
Educational applications of mobile learning can be classified based on the transactional distance theory. Park (2011) modified the transactional distance theory and used it to classify mobile learning into four categories viz. high transactional distance socialized m-learning, high transactional distance individualized m-learning, low transactional distance socialized m-learning and low transactional distance individualized m-learning.
In high transactional distance socialized mobile learning activity, learners are said to have more psychological and communication space with their teacher (Park, 2011). The learners engage in group learning where they communicate and collaborate with one another. Also, the learning resources are provided from a predetermined programme through mobile devices. Communication mainly occur among learners, and the teacher has little involvement in facilitating the group activity.
In high transactional distance and Individualized mobile learning activity, the individual learners have more psychological and communication space with the instructor or instructional support (Park, 2011). According to her, the individual learners receive well organized content and resources through mobile devices. The individual learners receive the content and control their learning process in order to master it and the interactions are usually carried out between the individual learner and the content. This type of mobile device application learning demonstrates an expansion of the scope of e-learning which allows greater flexibility and portability.
A third type of mobile technology application in learning is the low transactional distance and socialized mobile learning activity in which individual learners communicate with the teacher and fellow learners through mobile devices (Park, 2011). According to Park (2011), the learners have less psychological and communication space with the instructor and the instruction is loosely structured. This type is said to demonstrate the most advanced form in terms
of the variety of mobile devices and learners’ social interactions.
This last type which is the low transactional distance and individualized mobile learning activity refers to less psychological and communication space between instructor and learner. On this basis, individual learners can interact directly with the instructor and the instructor leads and controls the learning in an effort to meet learners’ needs while maintaining their independence (Park, 2011). This type has the features of mobile learning that supports blended mode.
Materials and Methods Research Design
The research methodology employed in this study was descriptive quantitative methodology. The descriptive methodology has varied approaches such as observation studies, correlational research and survey research.
Among the various approaches to descriptive methodology, survey research design was used in this study because it was found to be most suitable. Survey research, as described by Leedy and Ormrod (2010, p.187), involves obtaining information about the characteristics, opinions, attitudes or previous experiences of one or more groups of people, perhaps by asking them questions and tabulating their answers. The ultimate goal of survey research design is to generalize findings to a larger population.
The choice of survey design for this study was due to its merit of gathering various responses from a wide range of people. Furthermore, descriptive survey helps to present the true state of affairs of a given situation after data have been collected from a number of people who respond to the same set of questions about a given situation (Gay, 1992). This approach is more suitable for this research because it was intended to acquire information about the attitude of distance learners concerning the possibility of blending mobile learning pedagogy in instructional activities.
Sampling Procedure
Systematic sampling technique was used to select the participants of the study. The sample included students pursuing various programmes at Master’s degree, Bachelor’s degree and
64
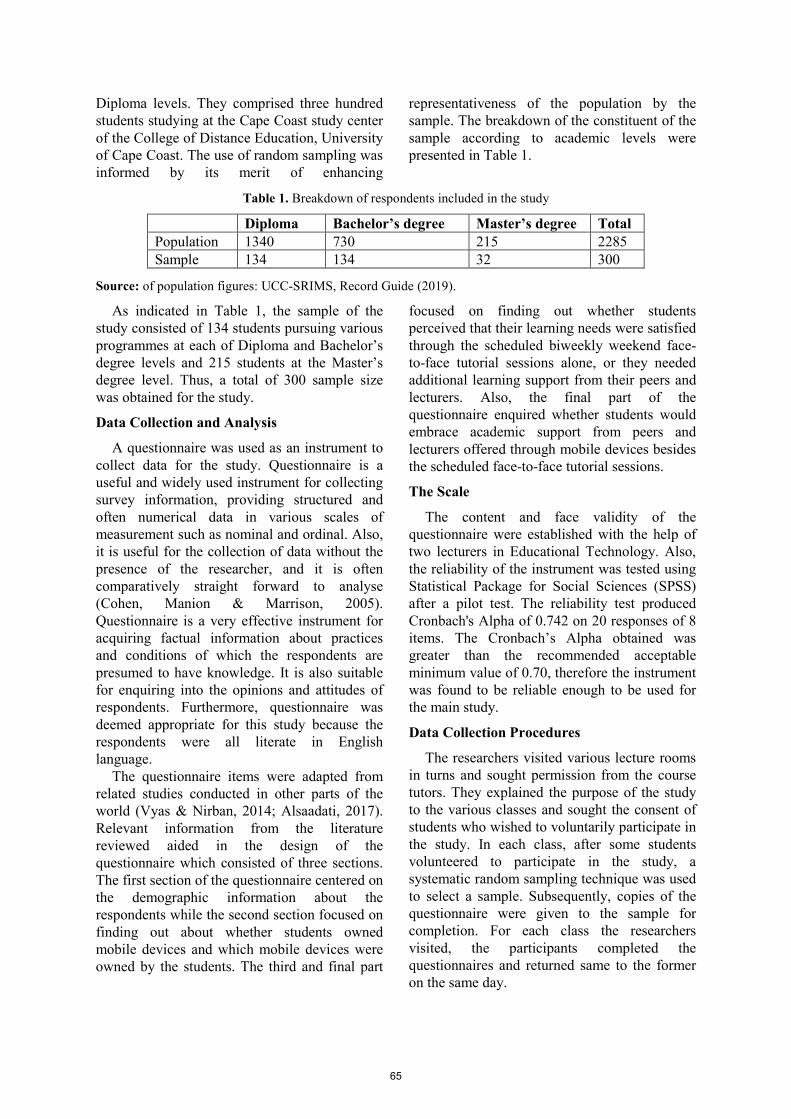
Diploma levels. They comprised three hundred students studying at the Cape Coast study center of the College of Distance Education, University of Cape Coast. The use of random sampling was informed by its merit of enhancing
representativeness of the population by the sample. The breakdown of the constituent of the sample according to academic levels were presented in Table 1.
Table 1. Breakdown of respondents included in the study
Diploma Bachelor’s degree Master’s degree Total Population 1340 730 215 2285 Sample 134 134 32 300
Source: of population figures: UCC-SRIMS, Record Guide (2019).
As indicated in Table 1, the sample of the study consisted of 134 students pursuing various programmes at each of Diploma and Bachelor’s degree levels and 215 students at the Master’s degree level. Thus, a total of 300 sample size was obtained for the study.
Data Collection and Analysis
A questionnaire was used as an instrument to collect data for the study. Questionnaire is a useful and widely used instrument for collecting survey information, providing structured and often numerical data in various scales of measurement such as nominal and ordinal. Also, it is useful for the collection of data without the presence of the researcher, and it is often comparatively straight forward to analyse (Cohen, Manion & Marrison, 2005). Questionnaire is a very effective instrument for acquiring factual information about practices and conditions of which the respondents are presumed to have knowledge. It is also suitable for enquiring into the opinions and attitudes of respondents. Furthermore, questionnaire was deemed appropriate for this study because the respondents were all literate in English language.
The questionnaire items were adapted from related studies conducted in other parts of the world (Vyas & Nirban, 2014; Alsaadati, 2017). Relevant information from the literature reviewed aided in the design of the questionnaire which consisted of three sections. The first section of the questionnaire centered on the demographic information about the respondents while the second section focused on finding out about whether students owned mobile devices and which mobile devices were owned by the students. The third and final part
focused on finding out whether students perceived that their learning needs were satisfied through the scheduled biweekly weekend face-to-face tutorial sessions alone, or they needed additional learning support from their peers and lecturers. Also, the final part of the questionnaire enquired whether students would embrace academic support from peers and lecturers offered through mobile devices besides the scheduled face-to-face tutorial sessions.
The Scale
The content and face validity of the questionnaire were established with the help of two lecturers in Educational Technology. Also, the reliability of the instrument was tested using Statistical Package for Social Sciences (SPSS) after a pilot test. The reliability test produced Cronbach's Alpha of 0.742 on 20 responses of 8 items. The Cronbach’s Alpha obtained was greater than the recommended acceptable minimum value of 0.70, therefore the instrument was found to be reliable enough to be used for the main study.
Data Collection Procedures
The researchers visited various lecture rooms in turns and sought permission from the course tutors. They explained the purpose of the study to the various classes and sought the consent of students who wished to voluntarily participate in the study. In each class, after some students volunteered to participate in the study, a systematic random sampling technique was used to select a sample. Subsequently, copies of the questionnaire were given to the sample for completion. For each class the researchers visited, the participants completed the questionnaires and returned same to the former on the same day.
65
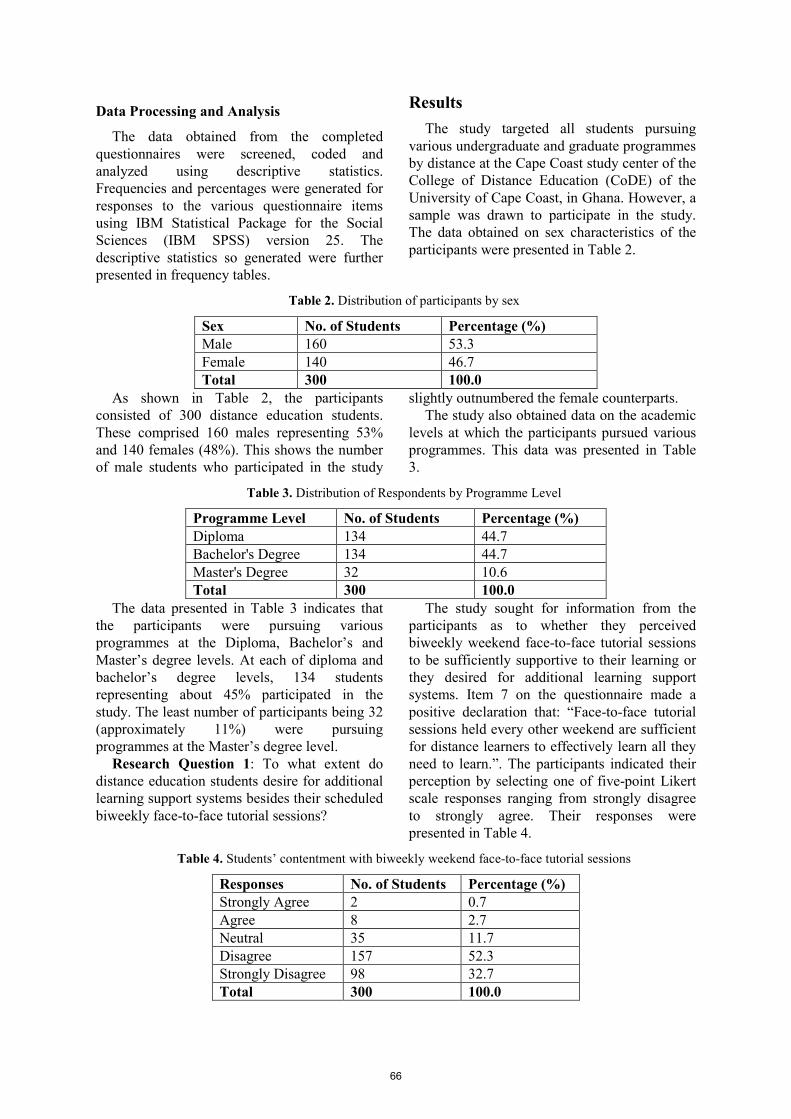
Data Processing and Analysis
The data obtained from the completed questionnaires were screened, coded and analyzed using descriptive statistics. Frequencies and percentages were generated for responses to the various questionnaire items using IBM Statistical Package for the Social Sciences (IBM SPSS) version 25. The descriptive statistics so generated were further presented in frequency tables.
Results The study targeted all students pursuing
various undergraduate and graduate programmes by distance at the Cape Coast study center of the College of Distance Education (CoDE) of the University of Cape Coast, in Ghana. However, a sample was drawn to participate in the study. The data obtained on sex characteristics of the participants were presented in Table 2.
Table 2. Distribution of participants by sex
Sex No. of Students Percentage (%) Male 160 53.3 Female 140 46.7 Total 300 100.0
As shown in Table 2, the participants consisted of 300 distance education students. These comprised 160 males representing 53% and 140 females (48%). This shows the number of male students who participated in the study
slightly outnumbered the female counterparts. The study also obtained data on the academic
levels at which the participants pursued various programmes. This data was presented in Table 3.
Table 3. Distribution of Respondents by Programme Level
Programme Level No. of Students Percentage (%) Diploma 134 44.7 Bachelor's Degree 134 44.7 Master's Degree 32 10.6 Total 300 100.0
The data presented in Table 3 indicates that the participants were pursuing various programmes at the Diploma, Bachelor’s and Master’s degree levels. At each of diploma and bachelor’s degree levels, 134 students representing about 45% participated in the study. The least number of participants being 32 (approximately 11%) were pursuing programmes at the Master’s degree level.
Research Question 1: To what extent do distance education students desire for additional learning support systems besides their scheduled biweekly face-to-face tutorial sessions?
The study sought for information from the participants as to whether they perceived biweekly weekend face-to-face tutorial sessions to be sufficiently supportive to their learning or they desired for additional learning support systems. Item 7 on the questionnaire made a positive declaration that: “Face-to-face tutorial sessions held every other weekend are sufficient for distance learners to effectively learn all they need to learn.”. The participants indicated their perception by selecting one of five-point Likert scale responses ranging from strongly disagree to strongly agree. Their responses were presented in Table 4.
Table 4. Students’ contentment with biweekly weekend face-to-face tutorial sessions
Responses No. of Students Percentage (%) Strongly Agree 2 0.7 Agree 8 2.7 Neutral 35 11.7 Disagree 157 52.3 Strongly Disagree 98 32.7 Total 300 100.0
66
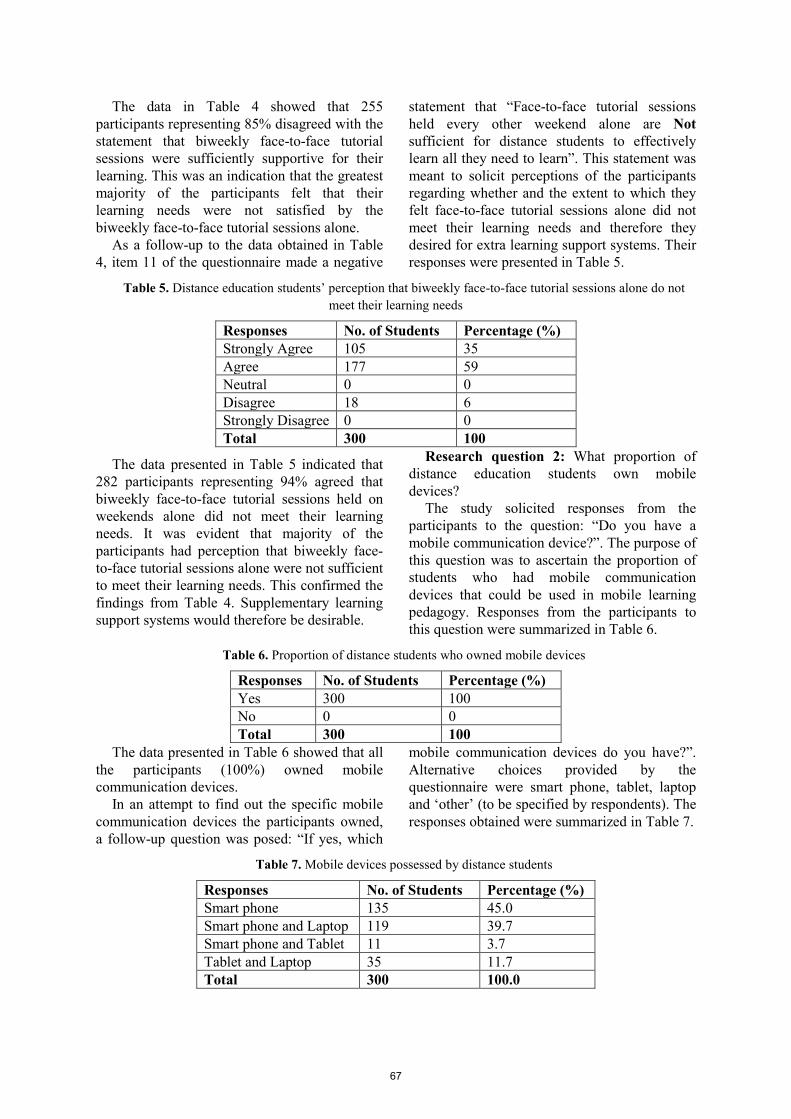
The data in Table 4 showed that 255 participants representing 85% disagreed with the statement that biweekly face-to-face tutorial sessions were sufficiently supportive for their learning. This was an indication that the greatest majority of the participants felt that their learning needs were not satisfied by the biweekly face-to-face tutorial sessions alone.
As a follow-up to the data obtained in Table 4, item 11 of the questionnaire made a negative
statement that “Face-to-face tutorial sessions held every other weekend alone are Not sufficient for distance students to effectively learn all they need to learn”. This statement was meant to solicit perceptions of the participants regarding whether and the extent to which they felt face-to-face tutorial sessions alone did not meet their learning needs and therefore they desired for extra learning support systems. Their responses were presented in Table 5.
Table 5. Distance education students’ perception that biweekly face-to-face tutorial sessions alone do not meet their learning needs
Responses No. of Students Percentage (%) Strongly Agree 105 35 Agree 177 59 Neutral 0 0 Disagree 18 6 Strongly Disagree 0 0 Total 300 100
The data presented in Table 5 indicated that 282 participants representing 94% agreed that biweekly face-to-face tutorial sessions held on weekends alone did not meet their learning needs. It was evident that majority of the participants had perception that biweekly face-to-face tutorial sessions alone were not sufficient to meet their learning needs. This confirmed the findings from Table 4. Supplementary learning support systems would therefore be desirable.
Research question 2: What proportion of distance education students own mobile devices?
The study solicited responses from the participants to the question: “Do you have a mobile communication device?”. The purpose of this question was to ascertain the proportion of students who had mobile communication devices that could be used in mobile learning pedagogy. Responses from the participants to this question were summarized in Table 6.
Table 6. Proportion of distance students who owned mobile devices
Responses No. of Students Percentage (%) Yes 300 100 No 0 0 Total 300 100
The data presented in Table 6 showed that all the participants (100%) owned mobile communication devices.
In an attempt to find out the specific mobile communication devices the participants owned, a follow-up question was posed: “If yes, which
mobile communication devices do you have?”. Alternative choices provided by the questionnaire were smart phone, tablet, laptop and ‘other’ (to be specified by respondents). The responses obtained were summarized in Table 7.
Table 7. Mobile devices possessed by distance students
Responses No. of Students Percentage (%) Smart phone 135 45.0 Smart phone and Laptop 119 39.7 Smart phone and Tablet 11 3.7 Tablet and Laptop 35 11.7 Total 300 100.0
67
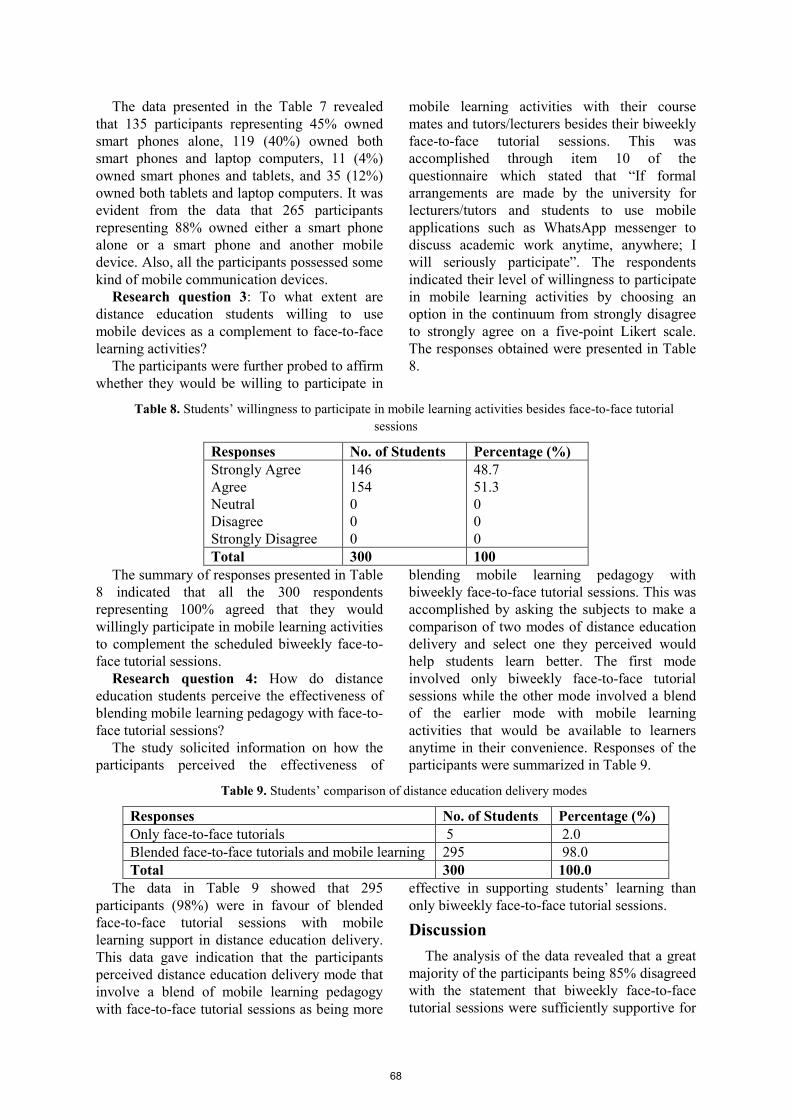
The data presented in the Table 7 revealed that 135 participants representing 45% owned smart phones alone, 119 (40%) owned both smart phones and laptop computers, 11 (4%) owned smart phones and tablets, and 35 (12%) owned both tablets and laptop computers. It was evident from the data that 265 participants representing 88% owned either a smart phone alone or a smart phone and another mobile device. Also, all the participants possessed some kind of mobile communication devices.
Research question 3: To what extent are distance education students willing to use mobile devices as a complement to face-to-face learning activities?
The participants were further probed to affirm whether they would be willing to participate in
mobile learning activities with their course mates and tutors/lecturers besides their biweekly face-to-face tutorial sessions. This was accomplished through item 10 of the questionnaire which stated that “If formal arrangements are made by the university for lecturers/tutors and students to use mobile applications such as WhatsApp messenger to discuss academic work anytime, anywhere; I will seriously participate”. The respondents indicated their level of willingness to participate in mobile learning activities by choosing an option in the continuum from strongly disagree to strongly agree on a five-point Likert scale. The responses obtained were presented in Table 8.
Table 8. Students’ willingness to participate in mobile learning activities besides face-to-face tutorial sessions
Responses No. of Students Percentage (%) Strongly Agree Agree Neutral Disagree Strongly Disagree
146 154 0 0 0
48.7 51.3 0 0 0
Total 300 100 The summary of responses presented in Table
8 indicated that all the 300 respondents representing 100% agreed that they would willingly participate in mobile learning activities to complement the scheduled biweekly face-to-face tutorial sessions.
Research question 4: How do distance education students perceive the effectiveness of blending mobile learning pedagogy with face-to-face tutorial sessions?
The study solicited information on how the participants perceived the effectiveness of
blending mobile learning pedagogy with biweekly face-to-face tutorial sessions. This was accomplished by asking the subjects to make a comparison of two modes of distance education delivery and select one they perceived would help students learn better. The first mode involved only biweekly face-to-face tutorial sessions while the other mode involved a blend of the earlier mode with mobile learning activities that would be available to learners anytime in their convenience. Responses of the participants were summarized in Table 9.
Table 9. Students’ comparison of distance education delivery modes
Responses No. of Students Percentage (%) Only face-to-face tutorials 5 2.0 Blended face-to-face tutorials and mobile learning 295 98.0 Total 300 100.0
The data in Table 9 showed that 295 participants (98%) were in favour of blended face-to-face tutorial sessions with mobile learning support in distance education delivery. This data gave indication that the participants perceived distance education delivery mode that involve a blend of mobile learning pedagogy with face-to-face tutorial sessions as being more
effective in supporting students’ learning than only biweekly face-to-face tutorial sessions.
Discussion The analysis of the data revealed that a great
majority of the participants being 85% disagreed with the statement that biweekly face-to-face tutorial sessions were sufficiently supportive for
68
their learning. Also, 94% of the participants agreed that biweekly face-to-face tutorial sessions held on weekends alone did not meet their learning needs. These two findings from the study revealed that distance education students of the University of Cape Coast deeply desired for additional learning support systems that would adequately address their learning needs. Consistent with the findings of this study, Hagel and Shaw (2006) also found in a study in which students compared face-to-face study mode to web-based mode that the students perceived the latter study mode to be more functional than the former.
It was also found that all the participants being 100% possessed smart phones. In addition to the smart phones, some owned tablet computers and or laptop computers. This finding is consistent with Huang (2016) and Hussin, Manap, Amir and Krish (2012). Huan observed that among Chinese undergraduate students, mobile phones were a major mobile technology that they possessed and 100% of the Chinese students who participated in his study owned mobile phones before starting college. Similarly, Hussin et al. found that all the students sampled in two Malaysian universities owned mobile phones. This makes mobile phones a feasible technology for pedagogical use in university education.
All the participants (100%) affirmed that they were willing to participate in mobile learning activities if implemented by the university for them to interact with fellow students and tutors/lecturers in connection with academic work anytime, anywhere, besides their scheduled biweekly weekend face-to-face tutorial sessions. This finding is consistent with Economides and Grousopoulou (2010) who observed that university students were most likely to use their mobile devices for obtaining information about lessons and exams, and arranging meetings with classmates. Also, the finding underscores that distance education in Ghana is characterized by high transactional distance and individualized learning (Park, 2011) which students perceive does not sufficiently meet their learning needs. As a result, the students desired for low transactional distance and socialized mobile learning activities in which individual learners communicate with the teachers and fellow learners through mobile devices.
Finally, 98% of the participants expressed their perception that distance education delivery involving a blend of fortnight face-to-face tutorial sessions with mobile learning activities that are always accessible to students would be more effective than only weekend face-to-face tutorial sessions held fortnightly. This finding is also consistent with Huang (2016). Huang found that Chinese undergraduate students were optimistic about the potential benefits of mobile phone integrated learning and that students were more likely to initiate mobile learning activities than their faculty.
Conclusion It could be concluded that distance education
students of the University of Cape Coast need additional learning support that would always be available from their course mates and faculty members by which their learning needs could be addressed anytime, and anywhere. This need could be met by incorporating mobile learning in distance education to close the transactional distance among learners and their lecturers. Also, because all the students possessed at least one mobile device and expressed willingness to participate in mobile learning activities, if mobile learning is incorporated into distance education in Ghana, it will possibly have massive acceptance by all the students.
References [1] Amedahe, F. K. (2002). Fundamentals of
educational research methods. Mimeograph, UCC, Cape Coast, Ghana. [2] Becking, D. (2008). How to match mobile learning resources with learners’ current needs: the didactic profiling, [online] Available at http://pi1.fernunihagen.de/publikationen/pub2005.html. [3] Brown, T. H. (2005). Towards a model for m-learning in Africa. International Journal of ELearning, vol. 4, no. 3, pp. 299-315, AACE, Norfolk, USA. [4] Bušelić, M. (2012). Distance learning–concepts and contributions. Oeconomica Jadertina, 23-31. [5] Cohen, L., Manion, L., & Marrison, K. (2005). Research method in education (5th ed.). New York. [6] Collins, S., McKinnies, R. C., & Collins, S. K. (2010). Distance learning and how access to Education Can Be Improved. Online Journal of Workforce Education and Development, vol. 4, no. 2, 1-12.
69
[7] Crescente, M. L., & Lee, D. (2011). Critical issues of m learning: design models, adoption processes, and future trends. Journal of the Chinese institute of industrial engineers, vol. 28, no. 2, pp. 111-123. DOI: 10.1080/10170669.2010.548856. [8] Darling-Hammond, L., Flook, L., Cook-Harvey, C., Barron, B., & Osher, D. (2019). Implications for educational practice of the science of learning and development. Applied Developmental Science, 23. [9] Economides, A. A. & Grousopoulou, A. (2010). Mobiles in education: students’ usage, preferences and desires. Int. J. Mobile Learning and Organisation, 4(3), 235-252. [10] El-Hussain, M. O., & Cronje, J. C. (2010). Defining mobile learning in higher education landscape. Educational Technology and Society, vol. 13, no. 3, pp. 12-21. [11] Foti, M. K., & Mendez, J. (2014). Mobile learning: how students use mobile devices to support learning. Journal of literacy and technology, vol. 15, no. 3. Available at http://www.literacyandtechnology.org/uploads/1/3/6/8/136889/jlt_v15_foti.pdf. [12] Galusha, J. M. (1997). Barriers to learning in distance education. Interpersonal Computing and Technology, vol. 5, no. 3, pp. 6-14. [online] Available at http://files.eric.ed.gov/fulltext/ED416377.pdf. [13] Garrison R. (2000). Theoretical challenges for distance education in the 21st century: A shift from structural to transactional issues. International Review of Research in Open and Distance Learning, vol. 7, no. 1. DOI: https://doi.org/10.19173/irrodl.v1i1.2. [14] Gay, L. R. (1992). Educational research: competencies for analysis and application. (4th ed.) New York: Merrill/Macmillan. [15] Gibson, C. C., & Graff, A. O. (1992). Impact of adults’ preferred learning styles and perception of barriers on completion of external baccalaureate degree programmes. International Journal of E-Learning & Distance Education, vol. 7, no. 1, pp. 39-51. [online] Available at http://www.ijede.ca/index.php/jde/article/view/413/303. [16] Hagel, P. & Shaw, R. N. (2006). Students’ perceptions of study modes. Distance Education, 27(3). 283-302. [17] Huang, G. (2016). Using mobile phones for teaching and learning in Chinese traditional undergraduate education (Doctoral dissertation). Nova Southeastern University. [online] Available at
NSU Works, College of Engineering and Computing. (983) https://nsuworks.nova.edu/gscis_etd/983. [18] Hussin, S., Manap, M. R., Amir, Z. and Krish, P. (2012). Mobile learning readiness among Malaysian students at higher learning institues. Asian Social Science, 8(12), 276-283. Available at http://dx.doi.org/10.5539/ass.v8n12p276. [19] Keegan, D. (2005). The incorporation of mobile learning into mainstream education and training. mLearn2005: 4th World conference on m-Learning. Cape Town: mLearn2005. [20] Kintu, M. J., Zhu, C., & Kagambe, E. (2017). Blended learning effectiveness: the relationship between student characteristics, design features and outcomes. International Journal of Educational Technology in Higher Education, vol. 14, No. 7. [21] Kukulska–Hulme, A., & Traxler, J. (2005). Mobile learning: A handbook for educators and trainers. London: Routledge. [22] Larson, A. G., & Owusu-Acheaw, M. (2016). Information needs of distance learners: A case of Winneba study center, University of Education, Winneba, Ghana. Turkish Online Journal of Distance Education, vol. 17, no. 3, 62-67. [23] Mabawonku, I. (2004). Library use in distance learning: a survey of undergraduates in three Nigerian universities. African Journal of Library, Archives and Information Science, vol. 14, no. 1, 151-166. [24] Makoe, M. (2013). The pedagogical suitability of using cell phones to support distance education students. Open Learning, 114-123. [25] Moore, M. G. (1997). Theroy of transactional distance. In D. Keegan (Ed.), Theoretical principles of distance education (pp. 22-38). NY: Routlege Studies in Distance Education. [26] Moore, M. G. (2007). The theory of transactional distance. In M. G. Moore (Ed.), Handbook of distance education (pp. 89-105). Mahwah, NJ: Lawrence Erlbaum Associates. [27] Park, Y. (2011). A pedagogical framework for mobile learning: Categorizing educational applications of mobile technologies into four types. International Review of Research in Open and Distance Learning, vol. 12, no. 2, pp. 78-102. DOI: https://doi.org/10.19173/irrodl.v12i2.791. [28] Quin, C. (2001). M-Learning: Mobile, wireless, in-your-pocket learning. Line Zine, Fall 2002. [online] Available at http://www.linezine.com/2.1/features/cqmmwiyp.html. [29] Sharples, M. (2002). Disruptive devices: mobile technology for conversational learning. International
70
Journal of Continuing Engineering Education and Lifelong Learning, vol. 12, no. 5/6, pp. 504-520. [online] Available at https://www.researchgate.net/profile/Mike_Sharples/publication/245528132_Disruptive_Devices_Mobile_Technology_for_Conversational_learning/links/00b4952cac64c72c7f000000.pdf. [30] Sharples, M., Taylor, J., & Vavoula, G. (2007). A theory of learning for the mobile age. In Andrews, R. & Haythornthwaite, C. (Eds.), The sage handbook of e-learning research, (pp. 221–247). London: Sage. [31] Singh, R. J. (2012). Current trends in higher education learning and teaching. South African Journal of Higher Education, 26(1), 5-9. [32] Tatar, D., Roschelle, J., Vabey, P., & Pennuel, W. R. (2003). Handhelds go to school: Lessons
learned. The IEEE Computer Society, vol. 36, pp. 30-37. DOI: 10.1109/MC.2003.1231192. [33] Thorpe, M. (2002) Rethinking learner support: the challenge of collaborative online learning, Open Learning: The Journal of Open, Distance and e-Learning, vol. 17, no. 2, pp. 105-119, DOI: 10.1080/02680510220146887a. [34] Vyas, N., & Nirban, V. S. (2014). Students’ perception on the effectiveness of mobile learning in an institutional context. ELT Research Journal, vol. 3, no. 1, 26- 36. [online] Available at http://dergipark.org.tr/eltrj/issue/5481/74444. [35] Yousuf, M. (2007). Effectiveness of mobile learning in distance education. Turkish Online Journal of Distance Education, vol. 8, no. 4, pp. 114-124. [online] Available at http://dergipark.org.tr/tojde/issue/16922/176609.
71
Texila International Journal of Academic research ISSN: 2520-3088
DOI: 10.21522/TIJAR.2014.07.02.Art008
An Investigation into Engagement Processes between Antenatal Providers and Users in Lundazi District – Zambia
Patricia Mambwe1*, Catherine. M. Ngoma2
1Department of Nursing, School of Health Sciences, Rusangu University, Monze, Zambia 2Department of Midwifery, School of Nursing, University of Zambia, Lusaka, Zambia
*Corresponding Author: [email protected]
Abstract
Background: Strategies to engage pregnant women in their prenatal care, educating them and
encourage hospital deliveries are important elements to consider in efforts aimed to improve quality
Antenatal Care (ANC).
Methods: A facility based cross-sectional study employing both qualitative and quantitative
methods was conducted in Lundazi District, Zambia. Engagement processes between ANC providers
and pregnant mothers during the provision of antenatal care were explored. Data was collected from
sixty pregnant women who attended ANC clinic in five public health facilities. It was also collected
from seventy-five ANC providers. Data were collected through focus group discussion with ANC
users, observation during consultation and self-administered questionnaire from ANC providers.
Results: This study observed that one to one individualized health education was not reinforced
despite the health and gestational age of clients. Only thirty-seven percent of ANC providers
explained their findings to the clients during physical examination. Clients were not counselled on
blurred vision, severe headache, convulsions, fever and difficulties in breathing. This study further
found that ANC providers could not explain the reason for referral submitting that Antenatal mothers
would still not understand even if staff took the entire year explaining. However, eighty percent of the
ANC users were encouraged to deliver from the health facility.
Conclusion: Lack of engagement with ANC users indicates missed opportunities for delivering
quality ANC Care. Reforcement of this component would improve the quality of care and improve
maternal and fetal wellbeing.
Key words: Antenatal care providers, Antenatal care Users, engagement processes.
Introduction Antenatal care (ANC) plays a central role in
the continuum of quality care, a critical framework for understanding the continuity between maternal, newborn and child health (Mc Nellan et al., (2019). ANC is an opportunity for skilled professionals to educate and engage with women about signs of danger signs in pregnancy, when to seek health care, nutrition in pregnancy, reasons for referral, procedures in ANC, importance of ANC visits and availability of modern family planning (AbouZahr and Wardlaw, 2004). Patient engagement is emerging as a significant component of efforts to improve health outcomes (Barello et al., 2012; Graffigna et al., 2014). Patient engagement includes involving patients and their families in their care by educating them about the risks and benefits of
treatments and empowering them to make informed decisions in partnership with their providers (AbouZahr and Wardlaw, 2004 Barello et al., 2012; Graffigna et al., 2014). The cardinal rationale for engaging patients has its roots in the ethical principles of respecting the patient’s autonomy and promoting self-determination (Mohamad et al., 2017). Studies have highlighted that pregnant women want to be involved in their care and more specifically in making decisions about their care (Vlemmix et al., 2013). This study aimed at investigating the engagement processes between antenatal providers and users in Lundazi district – Zambia.
Materials and Methods A facility based cross- sectional study
employing both qualitative and quantitative methods was conducted between October 2019
72
and June 2020 in Lundazi District, Zambia. Engagement processes and procedures between ANC providers and pregnant mothers during the provision of antenatal care were explored. Six (6) study sites were purposively selected (These were health facilities which had recorded high numbers of referred clients, who ended up dying during pregnancy, labour or delivery or who recorded a maternal death in the year “2019”).
75 individual study subjects who happen to be ANC providers at each health facility were selected using purposive sampling method (A provider who has been working in Antenatal clinic and gained experience for not less than six (6) months).
For Antenatal care observations made during ANC consultations, simple random sampling method was used to draw the sample of 60 ANC Users. Furthermore, 60 ANC users were selected using purposive sampling method to participate in the focus group discussion.
A self-administered questionnaire was used to collect data from the ANC providers, Maternal and new born Quality of Care Survey Antenatal Care Observation Checklist was used to collect data during the provision of ANC care and a focus group discussion guide.
Quantitative data was entered and analyzed with use of the statistical package for social sciences program software (SSPS Version 23). For qualitative data, identified themes and subthemes were reviewed by the Researcher and similar themes were grouped together. Qualitative data was then triangulated with quantitative data to give an in-depth understanding of the quality of antenatal care provided to pregnant women.
Results This study found that one to one
individualized health education was not reinforced despite the health and gestational age of clients. Only thirty-seven percent of ANC providers explained their findings to the clients during physical examination. Clients were not counselled on blurred vision, severe headache, convulsions, fever and difficulties in breathing. This study further found that ANC providers could not explain the reason for referral submitting that Antenatal mothers would still not understand even if staff took the entire year explaining.
Focus group participants shared their views concerning referrals to the hospital. Participant 3 from facility ‘B’ said,
If ANC providers find a problem when
palpating our abdomen, they tell us to go to the
hospital (Lundazi District Hospital). They don’t
tell t us why we are being referred. (Participant 3, 23years old).
Another participant from the same facility added saying,
Health workers tell us that even if they took a
full year explaining the reason for referral, we
would still not understand. They tell us to just go.
This study further found that clients were given the same day for review regardless of their gestational age. The study identified serious gaps from the physical environment where antenatal mothers were screened and counselled from. The facilities did not provide privacy and had no specific ANC consultation room. However, eighty percent of the ANC users were encouraged to deliver from the health facility.
Discussion This research work which is an extract from
the main study ‘assessing the quality of Antenatal care provided to pregnant women in Lundazi district health facilities, Zambia’ aimed at assessing the Engagement processes and procedures between ANC providers and pregnant mothers during the provision of antenatal care.
According to WHO (2018); Sheffel et al., (2019), effective communication between maternity care staff and women during Antenatal Care, labour and childbirth should include informing the client of findings, attending to clients in a timely manner, allocating sufficient time to each client, encouraging the woman to express her needs and preferences, regularly updating her and her family about what is happening, and asking if they have any questions.
This study revealed that only 37% of the ANC users were informed of the findings after being examined. ANC providers in all the five (5) health facilities reported that time limitation did not allow them to provide sufficient feedback to pregnant women during physical examination, because other clients were waiting outside. Some providers reported that they felt uncomfortable to take considerable amount of time with individual pregnant women in either counselling or individualized health education session for fear
73
that clients waiting outside would raise suscipicions that perhaps the health worker could be having carnal knowledge with a pregnant woman. So, it was entering, expose the abdomen, staff palpate and then leave quickly before the anxious community begins to gossip. As such clients were not asked if they had questions during consultations (table 1).
These findings tally with Phommachanh et al., (2019) who reported that Staff in ANC facilities did not share the physical examination findings with the clients. The same scholars reported that some providers did not ask the women about their needs, because they were afraid of not being able to fulfil the needs, which would be unacceptable for them. This study attributed this antiquated practice to lack of clinical drills and refresher courses in Antenatal care as it was reflected in the findings of this study where 60% of ANC providers from the five health facilities never had a chance of being trained or having any clinical drills on Obstetric emergencies (table 3) except for technical support.
It was also observed that the next ANC return visit date was communicated to the clients after consultation. However, antenatal mothers had the same appointment dates for subsequent visits regardless of the current gestational age or complaints. Health workers could not take consideration of grouping pregnant mothers according to gestational age for customized antenatal care. This study’s findings are similar to the study findings by Miltenburg et al., (2016) in Tanzania which revealed that return date was usually standardly documented to be next month, independent of number of visits and that sometimes clients could be given a return date after the estimated date of birth.
Provision of ANC requires many different actions and skills; next to routine services it requires provision of adequate decision making, risk identification, clinical reasoning and proper client counselling (WHO, 2016; Miltenburg et al., 2016). Coverage of routine services alone is insufficient if information is not used or acted upon (Miltenburg et al., 2016). In this study, pregnant women with abnormal findings, maternal problems/complications in all the health facilities reported that they would be referred to the first referral level hospital. However, through Focus Group Discussions participants reported that ANC providers could not explain the reason for referral submitting that antenatal mothers
would still not understand even if staff took the entire year explaining. This would make the clients either to take days before seeking care from the referred facility or not go at all. On the other hand, Miltenburg et al., (2016) in Tanzania argues that abnormal findings were rarely a reason for referral.
Prospects for a healthy outcome for both mother and baby improve when all women and families have adequate knowledge (Lincetto et al., 2016). Health education during antenatal is given to provide advice, education, reassurance and support (Mohammed and Amal, 2015). This implies that it should be given to ANC users from registration, during history taking, physical examination, investigations and dispersing of ANC medications). This study found that all the five health facilities pursued group health education of ANC clients with 12% of ANC providers using visual Aids during the sessions (table1).
In addition to group health education for antenatal mothers, it is important for health workers to provide individualized health education because ‘individual health behaviours are embedded in cultural pattern exchanges and are usually transmitted from generation to generation (Kaewsarn et al., 2003). Oshinyemi et al., (2018) affirms that teachings on different topics make individual clients aware of danger signs and when to seek medical care. This study found that ANC users were not counselled to seek immediate medical care when they experience; blurred vision, severe headache, convulsions, fever and difficulties in breathing (table 1). Furthermore, the study observed that one to one individualized health education was not reinforced despite the gestational age of clients.
These results are similar to the findings of Phommachanh et al., (2019); Miltenburg et al., (2017); Ritchie et al., (2016); Ajayi et al., (2013) who observed that health education was given to a group of women, culture limited the giving out of health education and that little information was communicated to individual ANC clients and their relatives.
This study further revealed that all, (100%), the five health facilities had no distinct antenatal room for ANC consultations (table 1). Provision of antenatal care services was done either from the labour room or an office. The facility where the services were provided in an office had no
74
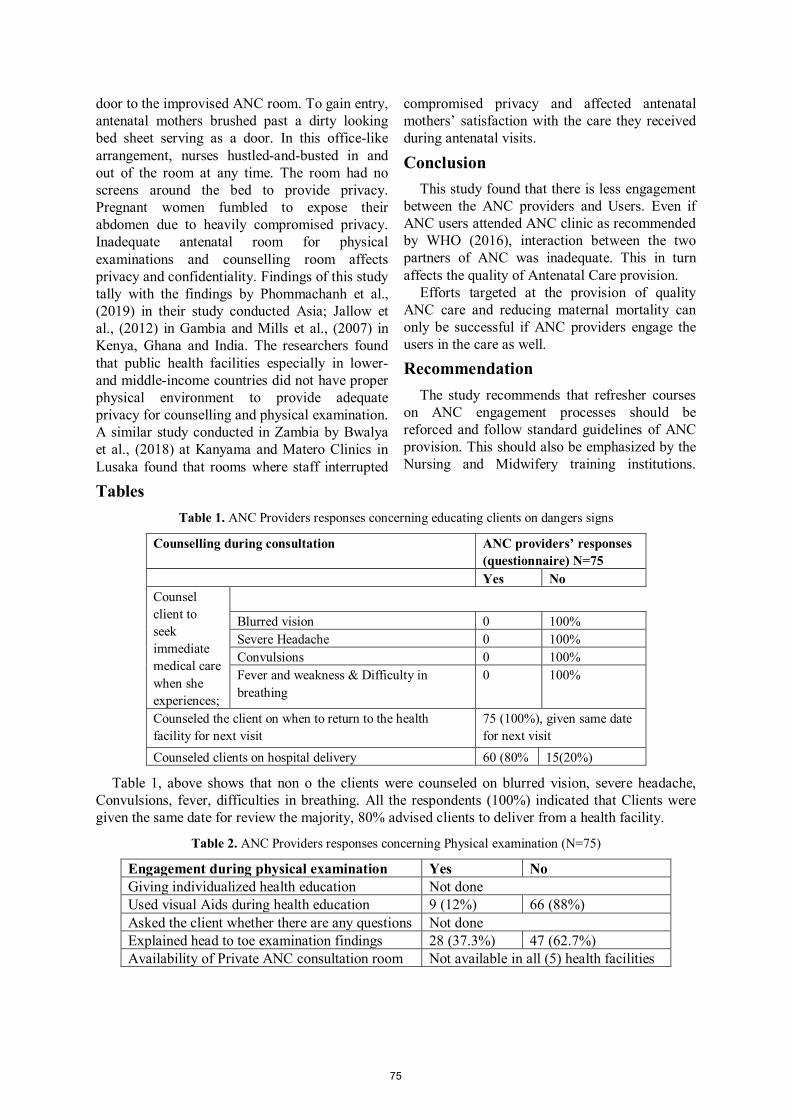
door to the improvised ANC room. To gain entry, antenatal mothers brushed past a dirty looking bed sheet serving as a door. In this office-like arrangement, nurses hustled-and-busted in and out of the room at any time. The room had no screens around the bed to provide privacy. Pregnant women fumbled to expose their abdomen due to heavily compromised privacy. Inadequate antenatal room for physical examinations and counselling room affects privacy and confidentiality. Findings of this study tally with the findings by Phommachanh et al., (2019) in their study conducted Asia; Jallow et al., (2012) in Gambia and Mills et al., (2007) in Kenya, Ghana and India. The researchers found that public health facilities especially in lower- and middle-income countries did not have proper physical environment to provide adequate privacy for counselling and physical examination. A similar study conducted in Zambia by Bwalya et al., (2018) at Kanyama and Matero Clinics in Lusaka found that rooms where staff interrupted
compromised privacy and affected antenatal mothers’ satisfaction with the care they received during antenatal visits.
Conclusion This study found that there is less engagement
between the ANC providers and Users. Even if ANC users attended ANC clinic as recommended by WHO (2016), interaction between the two partners of ANC was inadequate. This in turn affects the quality of Antenatal Care provision.
Efforts targeted at the provision of quality ANC care and reducing maternal mortality can only be successful if ANC providers engage the users in the care as well.
Recommendation The study recommends that refresher courses
on ANC engagement processes should be reforced and follow standard guidelines of ANC provision. This should also be emphasized by the Nursing and Midwifery training institutions.
Tables Table 1. ANC Providers responses concerning educating clients on dangers signs
Counselling during consultation ANC providers’ responses (questionnaire) N=75
Yes No Counsel client to seek immediate medical care when she experiences;
Blurred vision 0 100% Severe Headache 0 100% Convulsions 0 100% Fever and weakness & Difficulty in breathing
0 100%
Counseled the client on when to return to the health facility for next visit
75 (100%), given same date for next visit
Counseled clients on hospital delivery 60 (80% 15(20%)
Table 1, above shows that non o the clients were counseled on blurred vision, severe headache, Convulsions, fever, difficulties in breathing. All the respondents (100%) indicated that Clients were given the same date for review the majority, 80% advised clients to deliver from a health facility.
Table 2. ANC Providers responses concerning Physical examination (N=75)
Engagement during physical examination Yes No Giving individualized health education Not done Used visual Aids during health education 9 (12%) 66 (88%) Asked the client whether there are any questions Not done Explained head to toe examination findings 28 (37.3%) 47 (62.7%) Availability of Private ANC consultation room Not available in all (5) health facilities
75
Table 2, above shows that ANC clients were not given individualized health education. The lesser percentage, 37% of the ANC providers explained the physical examination findings during ANC consultation. All the five facilities did not have separate rooms for ANC consultation.
Concerning referrals to the next facility, focus group participants shared their views concerning referrals to the hospital. Participant 3 from facility ‘B’ said,
If ANC providers find a problem when
palpating our abdomen, they tell us to go to the
hospital (Lundazi District Hospital). They don’t
tell t us why we are being referred. (Participant 3, 23years old).
Another participant from the same facility added saying, Health workers tell us that even if
they took a full year explaining the reason for
referral, we would still not understand. They tell
us to just go.
Author’s Contribution PM was responsible for the study conception
and design, data collection and analysis, drafting the manuscript. CM supervised the research process.
Acknowledgements The authors are grateful to the Eastern
province and Lundazi District health office team for approving the request to undertake this study. Many thanks go to the participants for their willingness and time divorted to participate in this study.
This information was extracted from a PhD thesis by Patricia Mambwe.
References [1] Abou-Zahr CL and WardlawTM (2004). Strategies for reducing maternal complications in the
tropics. International journal of reproductive health, 8(20), 68-88 accessed from https://www.google.com/search?sa=X&nirf=1.%09 on 9/10/2019 @ 05:32 hours [2] Ajayi IO, Osakinle DC, Osakinle EO, Damilola C, Eunice O. Quality assessment of the practice of
focused antenatal care (FANC) in rural and urban
primary health centers in Ekiti state. Open journal of Obstetrics and Gynecology (2013) 3:319-26. Doi:10.4236/ojog.2013.33059 accessed from http://www.scirp.org/journal/ojog/ on 11/11/2019 @ 16:30 hours [3] Barello.S, Graffigna. G, Vegni. E (2012), Patient
Engagement as an Emerging Challenge for
Healthcare Services: Mapping the Literature retrieved from
https://www.ncbi.nlm.nih.gov/pmc/articles/PMC3504449/; doi:10.1155/2012/905934. [4] Bwalya. C, Sitali. D, Baboo. S. K and Zulu. J (2018), Experiences of Antenatal Care among
pregnant adolescents at kanyama and Matero clinics
in Lusaka, Zambia accessed from https://reproductive-health-journal.biomedcentral.com/articles/10.1186/s12978-018-0565-9#Sec3 on 13/7/2020 @ 15:11 hours. [5] Graffigna. G, Barello. S, Libreri. C and Bosio. C (2014), How to engage type-2 Diabetic Patients in
Their Own Health Management: Implications for
Clinical Practice retrieved from https://pubmed.ncbi.nlm.nih.gov/24966036/; Doi: 10.1186/1471-2458-14-648. [6] Jallow et al., (2012), women’s perception of
antenatal care services in public and private clinics in
Gambia, International journal for quality in Health Care, Vol 24, issue 6 , accessed from https://doi.org/10.1093/intqhc/mzs033 on 13/7/2020 @ 15:22 hours. [7] Kaewsarn, P., Mayle.W., Creedy. D., (2003), Traditional postpartum practices among Thai women. J Adv Nurs’ 41(4): 358-366 https://www.ncbi.nlm.nih.gov/pubmed/https://www.google/scholar. [8] Lincetto et al., (2016), Antenatal Care – World
Health Organisation accessed from https://www.who.int/pmnch/media/publications/aonsectionIII_2.pdf accessed on 14/7/2020 @ 01:01 AM. [9] Nellan etal., (2019) Antenatal care as a means to
increase participation in the continuum of maternal
and child healthcare: an analysis of the poorest
regions of four Mesoamérican countries accessed from https://bmcpregnancychildbirth.biomedcentral.com/articles/10.1186/s12884-019-2207-9 on 13/7/2020 @ 05:20 hours. [10] Mills. S, Bos. E, Lule. E, Ramana, G. N. V, and Bulatao.R (2007), “Obstetric care in poor settings in
Ghana, India, and Kenya,” HNP Discussion Paper Series, retrieved from [11] https://www.researchgate.net/publication/228872866_Obstetric_Care_in_Poor_Settings_in_Ghana_India_and_Kenya on 28/6/2020 at 10:27 hours. [12] Milltenburg. A. S, Van der Eem. L, Nyanza. E. C, Pelt.S, Ndaki.P e tal., (2017), Antenatal care and
opportunities for quality improvement of service
provision in resource limited settings: A mixed
methods study accessed on 16/11/19 at 06:57 hours
76
from https://journals.plos.org/plosone/article/file?type=printable&id=10.1371/journal.pone.0188279. [13] Mohamad et al., (2017), Patient experiences of
engagement with care plans and healthcare
professionals’ perceptions of that engagement accessed from https://bmchealthservres.biomedcentral.com/articles/10.1186/s12913-017-2806-y on 13/7/2020 @ 16:47 hours. [14] Mohammed. A and Amal. A (2015), Health
education during antenatal care: the need for more; International Journal of Women’s health accessed from https://www.ncbi.nlm.nih.gov/pmc/articles/PMC4340373/#b21-ijwh-7-239 on 21/6/2020 @ 05:24 hours. [15] Oshinyemi. E, Aluko. O and Oluwatosin.O (2018), Focused antenatal care: Re-appraisal of
current practices; International Journal of Nursing and Midwifery accessed from http://www.academicjournals.org/IJNM; DOI: 10.5897/IJNM2018.0312 retrieved on 13/7/2020 @ 15:42 hours. [16] Phommachanh e tal., (2019), Improvement of
Quality of Antenatal Care (ANC) Service Provision at
the Public Health Facilities in Lao PDR: Perspective
and Experiences of Supply and Demand Sides Accessed from https://www.ncbi.nlm.nih.gov/pmc/articles/PMC6647136/ on 13/6/2020 at 23:53 hours. [17] Sheffel et al., (2019), Understanding client and
provider perspectives of antenatal care service
quality: a qualitative multi-method study from Tanzania accessed from [18] https://www.ncbi.nlm.nih.gov/pmc/articles/PMC6596286/ on 21/6/2020 @ 06:23 hours. [19] Vlemmix et al., (2013), Decision aids to improve
informed decision‐making in pregnancy care: a
systematic review accessed from https://obgyn.onlinelibrary.wiley.com/doi/10.1111/1471-0528.12060 on 13/7/2020 @ 06:31 hours. [20] WHO (2018), Recommendations on effective
communication between maternity care providers and
women in labour accessed from
https://extranet.who.int/rhl/topics/preconception-
pregnancy-childbirth-and-postpartum-care/care-
during-childbirth/who-recommendation-effective-
communication-between-maternity-care-providers-
and-women-labour on 21/6/2020 @ 08:10 hours.
77
Texila International Journal of Academic research ISSN: 2520-3088
DOI: 10.21522/TIJAR.2014.07.02.Art009
Effect of Inquiry-Based Teaching Method on Students Achievement and Retention of Concepts in Integrated Science in Senior High School
Mohammed Issaka Texila American University
E-mail: [email protected]
Abstract
This study purposely investigated the impact of using inquiry-based teaching method on students’
academic achievement and retention of concept in integrated science against the traditional method
in some selected senior high schools in the Obuasi Municipality. The study also investigated the
difference in the mean achievement score between male and female students taught integrated science
using inquiry -based method.
The sample for the study was 292 students in SHS two from Christ the King Catholic Senior High
School and Obuasi Secondary Technical in the Obuasi Municipality. The sample were obtained
through random sample technique.
The experimental group received instructions in integrated science using inquiry-based method of
teaching whereas the control group were taught with the traditional method.
The data were collected through the use of pretest- posttest research design and were analyze
according to the research question for the study. The main research question for the study was: What
is the effect of inquiry-based method of teaching on students’ achievement and retention of concepts
in integrated science?
The results from the study indicates that the students in the experimental group performed better
than the students in the control group.
The findings also show that students who were instructed with inquiry-based method have higher
retention capacity than their counterpart students who were exposed to traditional method.
There was a slightly gender disparity in the achievement and retention capacity of both male and
female students taught integrated science with inquiry-based method in favour of the male. This
means that inquiry-based method is very rewarding to students in terms of achievement and retention
regardless of gender.
Keywords: inquiry-based method, integrated science, achievement, retention.
Introduction Globally, it is recognized that science is very
important subject in the development of every nation. The compulsory nature of integrated science in the curriculum of pre-tertiary education system in Ghana confirms its usefulness in the development of individuals in the country. The development of a country rest on science and technology in the world of work. (Shadreck & Mambanda, 2012; Anamuah-Mensah, August 2004). Integrated science competency is a key determiner of individual student’s post-secondary education and career options and much attention is given to it by stakeholders of education in the country. In Ghana for instance, students must obtain a pass
mark in integrated science before they can get admission to any tertiary institution.
Stressing on its importance Azure (2015) observed that Science education is needed in Ghana to produce the necessary human resource and skilled labour force to manage our local industries and educational institutions. The study of integrated science helps us to understand our natural world and also to approach challenges we face in life and our workplace in a more systematic and logical manner. Integrated Science education in Ghanaian educational system is the conscious effort to raise the level of scientific literacy of all students and equip them with relevant basic scientific knowledge needed for their own living and also contribute
78
to the country’s development. (Teaching syllabus for integrated science, 2010).
Despite its usefulness in determine students’ post-secondary education in Ghana, students don’t pay much attention to this subject. In the year 2018, the performance of students in integrated science drop from 52.89 percent in 2017 to 50.49 percent in 2018. In 2019, there was slight increase in their performance. This shows that there is more work to be done to improve students’ performance in integrated science. The chief examiner has over the years reported students woefully failing in some of these topics in integrated science. Topics such as Magnetism, Animal Production, rock, hydrocarbons, acid base and salt and hereditary and inheritance have been yearly reported. (Chief Examiners report 2016, 2017 and 2018).
Due to its usefulness the method of teaching the subject should be of great importance to science educators. O’Connor (2000) observed that the use of inappropriate teaching methods contributes to the low participation and performance of students in science.
The methods employed by teachers in teaching science have a great impact on the understanding and interest developed by students in the subject. Sree (2010) opined that the method of teaching each subject play a pivotal role in enhancing the efficiency of the practitioners. Teaching involve both methodology and pedagogy and the teacher is supposed to select appropriate method which will effectively engage the learners in the teaching and learning process.
Tytler’s (2003) was of the view that several studies have indicated that there is “a general problems with the teaching of science within secondary schools” (p.274), where much attention is focused on “the factual information, driven by textbook use and tests, lack of small group activity, negotiation of low level cognitive demand, and the concentration of conceptual activity in a minority of target students” (Tytler, 2003, p.274). Emphasizing on this Azure (2015) found out that students in senior high schools were not made to performed science practical activities in integrated science as suggested by the science curriculum. This has contributed to poor attitude shown by students towards science.
Wood and Gentile (2003) were of the view that educators are beginning to recognize that there are better ways to learn than the traditional
methods. The traditional method of teaching is passive rather than active. It does not enhance critical thinking and collaborative problem solving since students are made to act as spectators and passive recipient of information. Science educators have from to time emphasize the need to produce students who are skilled in solving basic problems within their immediate environment through analysis and experimentation and adopting a scientific way of life based on pragmatic observation and investigation of phenomena. They also stress the need to encouraging students to develop interest and high motivation towards science. To achieve this, students should be expose to skills in creating their own knowledge in order to understand scientific concept rather than providing them with set of rules and already prepared concepts without understanding them. Students should be exposed to several strategies of solving problems and also providing them a conducive learning environment where they can learn through inquiry and so doing student are placed at the centre of the learning process.
Educators came up with inquiry based instructional strategy which employs active participation of learners in the teaching and learning process and also placed the learners at the centre of the teaching and learning process where the student is made to interact with teaching and learning materials (TLMs) and also asks questions to discover scientific concepts, facts, or principles with or without any teacher support.
Objectives of the study The purpose of this study was to examine the
effects of inquiry-based method of teaching science on the academic achievement and retention of students in integrated science in Senior high schools in Obuasi Municipality. The study will specifically:
1. Find the difference in the mean achievement scores between students taught integrated science using inquiry-based method and those taught integrated science using traditional method.
2. Find the difference in the mean achievement score between male and female students taught integrated science using inquiry -based method.
3. Find the difference in the mean retention scores between students taught integrated
79
science using inquiry-based method and those taught integrated science using traditional method.
4. Find the difference in the mean retention score between male and female students taught integrated science using inquiry -based method.
Research Questions 1. What is the difference in the mean
achievement scores between students taught integrated science using inquiry-based method and those taught integrated science using traditional method?
2. What is the difference in the mean achievement score between male and female students taught integrated science using inquiry -based method?
3. What is the difference in the mean retention scores between students taught integrated science using inquiry-based method and those taught integrated science using traditional method?
4. What is the difference in the mean retention score between male and female students taught integrated science using inquiry -based method?
Significance of the Study The study will help improve students’
achievement in Integrated Science through showing high motivation and better attendance. This is because inquiry-based method ensures active involvement of students in the teaching and learning process and as students are made to practice what they learn, they develop interest and understanding in the lesson and be willing to attend class always.
It will also help Teachers see the need to use Inquiry Based Method in teaching Integrated Science. Most teachers still prefer the traditional method of teaching science to that of inquiry-based method despite its recommendations by several researchers.
It will be useful to the educational training institutions on the need to train teachers who will be able to use Inquiry-based method in teaching science. Teachers will be willing to use the inquiry-based method in teaching if it is incorporated into the teacher training program. Teachers will see it the need to use inquiry-based method in teacher integrated science.
Delimitations of the Study There are several concepts in Integrated
Science but this study only focusses on rocks, acid bases and salts, magnetism and inheritance and variations. These are the topics the chief examiner always reports students having difficulties in them in integrated science.
Limitations of the Study The main limitation to this study was that the
student initially resisted to the inquiry process and objected to their role as explorers. They were used to having the teacher as the main source of information and knowledge giver and they were to receive and read their textbook. They were not familiar with the teaching model in which the teacher asks questions and the students explore and search for the answers, supporting it with evidence and communicating their findings.
Also, there was the need to train teachers in extensive professional development in inquiry-based method of teaching and only two science teachers were willing to undergo such for the study.
Literature Review The theory underpinning this study is
constructivism. The constructivist maintain that learners construct their own knowledge and understanding of the world through experience by constantly asking questions or through inquiry. Basically, the concept of constructivism means encouraging learners to use active approach in experimentation and problem solving to generate more knowledge, discuss their findings and then reflect on the new ideas they have come across with their previous knowledge. Pr˚ucha, Walterov´a and Mareˇs, (2009) observed that the inquiry-based instruction is supported mainly by the cognitive constructivism that uses the didactic approaches based on the assumption that the constructive cognition is happening in the form of the cognized subject connecting the fragments of information from the outside to the meaningful structures, reconstructing the existing structures and performing the mental operations with them conditioned by a suitable level of the pupil’s cognitive development (Pr˚ucha, Walterov´a and Mareˇs, 2009, p. 131). There it is very important for the students to take active part in their
80
cognitive development. The teachers can motivate them by engaging them through the questions they posed to them or giving them the opportunity to part in the formulation of the questions.
The inquiry based- instructions is closely related with thinking and development and it starting points is the knowledge provided by cognitive science. According to Dost´al (2015) this cognitive science is based in the cognitive psychology which creates cognitive models for the problem solving.
Consequently, the constructivist school is the one where the child knows and comes to the schools in order to think about their own knowledge, to organize it, deepen it, enrich it and develop it — in the group where the teacher ensures that every pupil can achieve the highest possible level (cognitive, social, operational) during the participation and contribution of each one of them. (Tonucci, 1994).
The ultimate purpose of constructivism is the learning and the process of constructing it. These processes have to do with engaging the students through discussions, project activities, exercises group works, presentations and by given them tasks which reflect their real world. The students then become motivated with common purpose of reaching the goal. The teacher become the architect of the thinking process; he/she enables it. (Dost´al 2015). He/she creates and assign “good” problems that stimulate investigation, and creation of the group activities which model and enable the process of knowledge construction.
The teacher who now acts as a facilitator makes sure he/she understands the previous knowledge of their students and then prepare activities to help learners promote learning.
According to Khalid and Azeem (2012) the constructivism assumes the role of the teacher as a facilitator who guides learners to create knowledge and understanding instead of producing series of facts.
In a constructivist classroom, the teacher assists the learners through inquiry-based learning activities and problem solving with which the students investigate on a problem, discuss their ideas share their ideas to the group and then contemplate on their new ideas in a collaborative learning environment. The constructivist theory has several benefits to both the teacher and the learner and one of such
advantage is that it changes the learner from being a passive recipient of information to an active participant in the learning process. The teacher has the responsibility of guiding the learners to construct their own understanding and knowledge instead of becoming passive recipient of information from the teacher or the textbook. The teacher also has the responsibility of translating what is to be learned into a form relevant to the learner’s current state of understanding. (khalid & Azeem, 2012).
This theory capitalizes on learning through inquiry and problem solving through critical and creative thinking. Asselin, Branch and Oberg (2003) were of the view that students’ inquirers are encouraged to explore new ideas and understandings through personal discoveries and explorations as well as interactions with objects and with other people.
Olorundare (1992) was of the view that constructivism revolves around the tenets that individuals construct meanings in their attempt to make sense of the world around them. It is therefore very important for the classroom teacher to give access to the students to explore the classroom environment and also guides the students through problem solving and inquiry-based learning activities where students together investigation on a problem and come out with ideas to solve it. This environment must be full of educational materials that will compel the students to learn. The integrated science teacher must make available teaching and learning materials in the classroom environment.
A typical example of a structured inquiry-based learning approach is the learning Cycle Model from Piaget theory of cognitive learning (Bevevino, Denge, &Adams, 1999). Several versions of this learning cycle can be found in the science curricula with the phases ranging in number from 3E, 4E, 5E to 7E. The number of phases does not matter to this study every learning cycle has at its core the same purpose. This study will employ 5E learning by Bybee et al, (2006). It involves the instruction of five discrete elements:
i. Engagement: the prior knowledge of the students is review and also link them to the new concepts through the use of short activities that promote curiosity. The teacher makes connections between past and presents learning experiences. Students are
81
mentally engaging in the concept, process, or skills to be learned.
ii. Exploration: the teacher involves the students in the topic providing them the opportunity to build their own knowledge through investigating and researching and manipulating of the materials. Student build a set of common experience as they work in groups and this prompt sharing and communicating. At this stage, the teacher acts as a facilitator guiding the students focus and the students actively learn through inquiry-based learning process.
iii. Explanation: this face focus students’ attention on particular aspect of their engagement and exploration experiences and provides students opportunity to demonstrate their findings, their conceptual understanding through discussion and presentations. It also provides the teacher the opportunity to introduce the concept, terms and explanations.
iv. Elaboration: After the discussion and explanations about the main ideas and terms for their learning tasks, it is important to involve students in further experiences that extends the concepts and process or skills. Students are encouraged to apply the concept to new situations.
v. Evaluation: At this stage the students are given the opportunity to demonstrate their understanding of the concept. The teacher can administer assessments to determine each student understanding of the concept learned.
Llewellyn 2016 identifies the following roles of the teacher in the structured inquiry.
i. Provides step-by step sequential procedures to be followed
ii. Provides material and supplies as listed in activity sheet or lab.
iii. Assigns role to students on rotating basis iv. Acts as coach by ensuring all students are on
task and understand the procedure v. Encourage students to work as a group vi. Ask probing questions and answers
questions when appropriate vii. Provides follow up and going further
questions and inquires.
Inquiry- based science teaching methods
There are five inquiry-based teaching methods (Shamsudin and Abdullah, 2013). These are simulation, field study, demonstration, project, and experimentation.
i. Simulation
This inquiry-based science teaching consists of role play, model and games. During simulation, learners interact in a way where they become the test subject in the experiment. This strategy fits well with the principle of constructivism and effective way to assist students understands a concept. (Shamsudin and Abdullah, 2013).
According to Perry and et al (2009) simulation using model is a form of experimental learning and these instructional strategies enable the teacher to place the students in the world he/she created. Also, from the findings of Undo and Etiubons (2011) those students who were taught using computer-based science simulation attained better scores than those who were taught using traditional instructional method.
ii. Field study
This is an academic study which takes place in a natural setting other than in the classrooms or laboratory (Noel, 2007). Students normally study concepts through observation, discussions, picture taken as well as analysis of the data collected. These data collected can be in the form of specimen audio, video and pictures. This strategy does not allow active involvement of students but also help students develop an understanding and experience and the process of learning in a natural setting.
Harder (2010) opined that student and teachers found field study activity enjoyable because learning becomes more real and more challenging than those done inside the classroom and also help develop in the student the skills of gathering data through audio recording, picture taken, video recording and collection of specimens for science activities.
82
iii. Demonstration McFarland (2005) observed that
demonstration is very useful in promoting students learning through proving the truth of something through evidence.
It is true that it can be a tedious task for the teacher. For instance, the teacher has put in a lot of works design set up and think on the best way to carry out the demonstration, but the end results can be extremely positive. (Shamsudin and Abdullah, 2013).
Mc Farland (2005) also opined that through demonstration the classroom interaction tends to be less unidirectional as the students begin to get involved and ask several questions about science except using demonstration as a teaching method replaces the teacher as a source of knowledge and the teacher becomes more creative while students learn to respect the diverse of other students.
iv. Project Work
This inquiry-based science education focuses on the work given by the teacher for teacher students to carry out in groups. Hiang (2005) suggested that there should not be more than three students to a group and the group should invent a project for the discovery content purpose.
Project work has several benefits to the students it allows for more meaning understanding of science concepts among students and enhances academic performance. According to Kanter and Kontantopoulos (2009) project work enable teachers to develop their science content knowledge as well as their science pedagogical content knowledge as they prepare and facilitate students work.
v. Experimentation
Experimentation is core of doing investigation in science classroom. (Shamsudin and Abdullah, 2013). Experiment encourages students’ interest in learning science as they get the opportunities to manipulate objects test hypothesis and work together to solve or prove something exciting. Students are able to see or relate concepts better and contribute to sound science concepts.
According to Demeo (2005) experiments help produce more mature type of science education when students are allowed to manipulate things in the experiment. It also makes science become
practical for the students instead of always reading scientific theories and contents.
Integrated Science Education in Ghana
In Ghana science education is administered under the purview of Ministry of Education. The ministry is responsible for the formulation of national science education objectives. The ministry of education oversees all the activities of Ghana education service which is responsible for pre-tertiary education in Ghana.
The Ghanaian integrated science curriculum follows the “spiral approach” treating the same themes at different times and greater depths within each educational level. The integrated science curriculum is the replacement of what is used to be called ‘nature study’.
At both primary and junior high school level, pupils are made to study integrated science. They learn basic scientific ideas and concepts and how to develop the spirit of curiosity and open mindedness. The main teaching philosophy is inquiry-based which is aimed at providing the learner the opportunity to expand, change, enhance and modify the ways in which they view the world. (GES new science syllabus). It also enforces the teacher to use learner-centered approach in in teaching and learning process which the learner is physically and cognitively present in the knowledge acquiring process in a in a rich and rigorous inquiry-driven environment.
The Ghana science education philosophy at the basic level view science learning as ‘an active contextualized process of constructing knowledge based on learners’ experiences rather than acquiring it’. Learners are view as information constructors who operate as researchers and the teachers serve as facilitators by providing the enabling environment that promotes the construction of learners’ own knowledge based on their previous experiences.
At Senior high school level, the integrated science curriculum comprises the general science and the agricultural science and the environment. The content of the Senior high school integrated science covers basic sciences and these includes Health, Agriculture and industry and it is expected that every student passes this subject before gaining admission into any tertiary institution in Ghana.
The SHS integrated science syllabus covers a three-year period with each year work organized
83
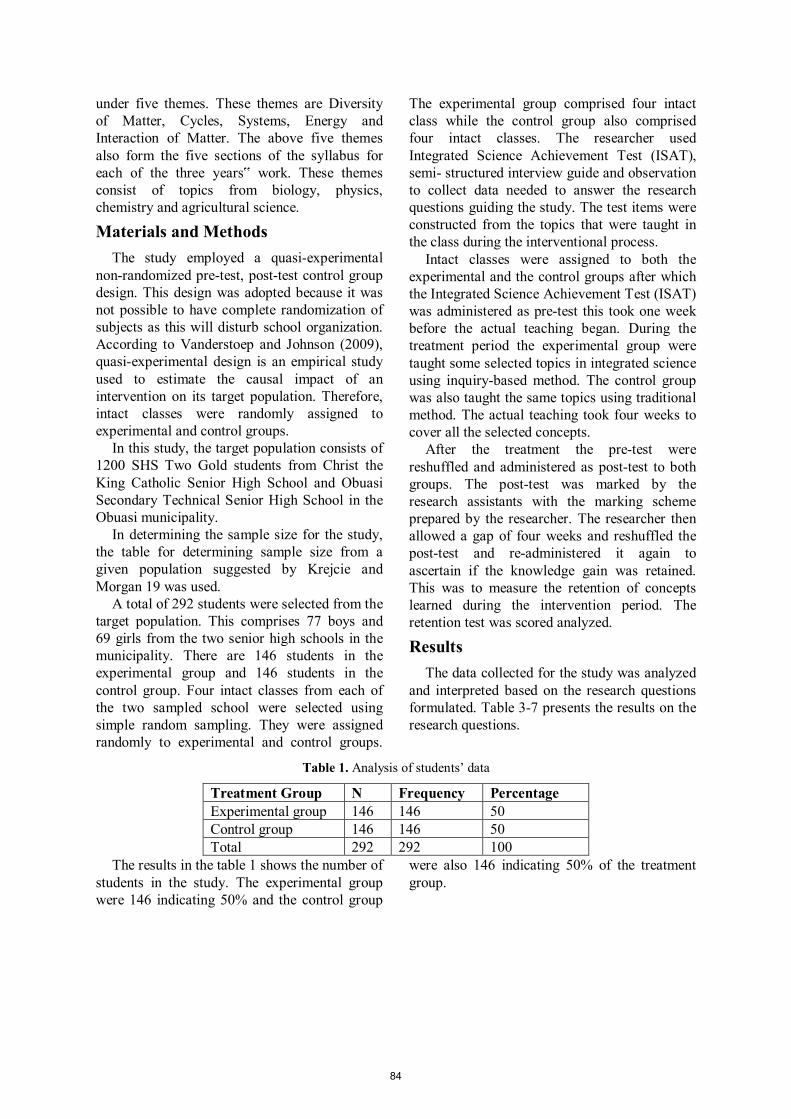
under five themes. These themes are Diversity of Matter, Cycles, Systems, Energy and Interaction of Matter. The above five themes also form the five sections of the syllabus for each of the three years‟ work. These themes consist of topics from biology, physics, chemistry and agricultural science.
Materials and Methods The study employed a quasi-experimental
non-randomized pre-test, post-test control group design. This design was adopted because it was not possible to have complete randomization of subjects as this will disturb school organization. According to Vanderstoep and Johnson (2009), quasi-experimental design is an empirical study used to estimate the causal impact of an intervention on its target population. Therefore, intact classes were randomly assigned to experimental and control groups.
In this study, the target population consists of 1200 SHS Two Gold students from Christ the King Catholic Senior High School and Obuasi Secondary Technical Senior High School in the Obuasi municipality.
In determining the sample size for the study, the table for determining sample size from a given population suggested by Krejcie and Morgan 19 was used.
A total of 292 students were selected from the target population. This comprises 77 boys and 69 girls from the two senior high schools in the municipality. There are 146 students in the experimental group and 146 students in the control group. Four intact classes from each of the two sampled school were selected using simple random sampling. They were assigned randomly to experimental and control groups.
The experimental group comprised four intact class while the control group also comprised four intact classes. The researcher used Integrated Science Achievement Test (ISAT), semi- structured interview guide and observation to collect data needed to answer the research questions guiding the study. The test items were constructed from the topics that were taught in the class during the interventional process.
Intact classes were assigned to both the experimental and the control groups after which the Integrated Science Achievement Test (ISAT) was administered as pre-test this took one week before the actual teaching began. During the treatment period the experimental group were taught some selected topics in integrated science using inquiry-based method. The control group was also taught the same topics using traditional method. The actual teaching took four weeks to cover all the selected concepts.
After the treatment the pre-test were reshuffled and administered as post-test to both groups. The post-test was marked by the research assistants with the marking scheme prepared by the researcher. The researcher then allowed a gap of four weeks and reshuffled the post-test and re-administered it again to ascertain if the knowledge gain was retained. This was to measure the retention of concepts learned during the intervention period. The retention test was scored analyzed.
Results
The data collected for the study was analyzed and interpreted based on the research questions formulated. Table 3-7 presents the results on the research questions.
Table 1. Analysis of students’ data
Treatment Group N Frequency Percentage Experimental group 146 146 50 Control group 146 146 50 Total 292 292 100
The results in the table 1 shows the number of students in the study. The experimental group were 146 indicating 50% and the control group
were also 146 indicating 50% of the treatment group.
84
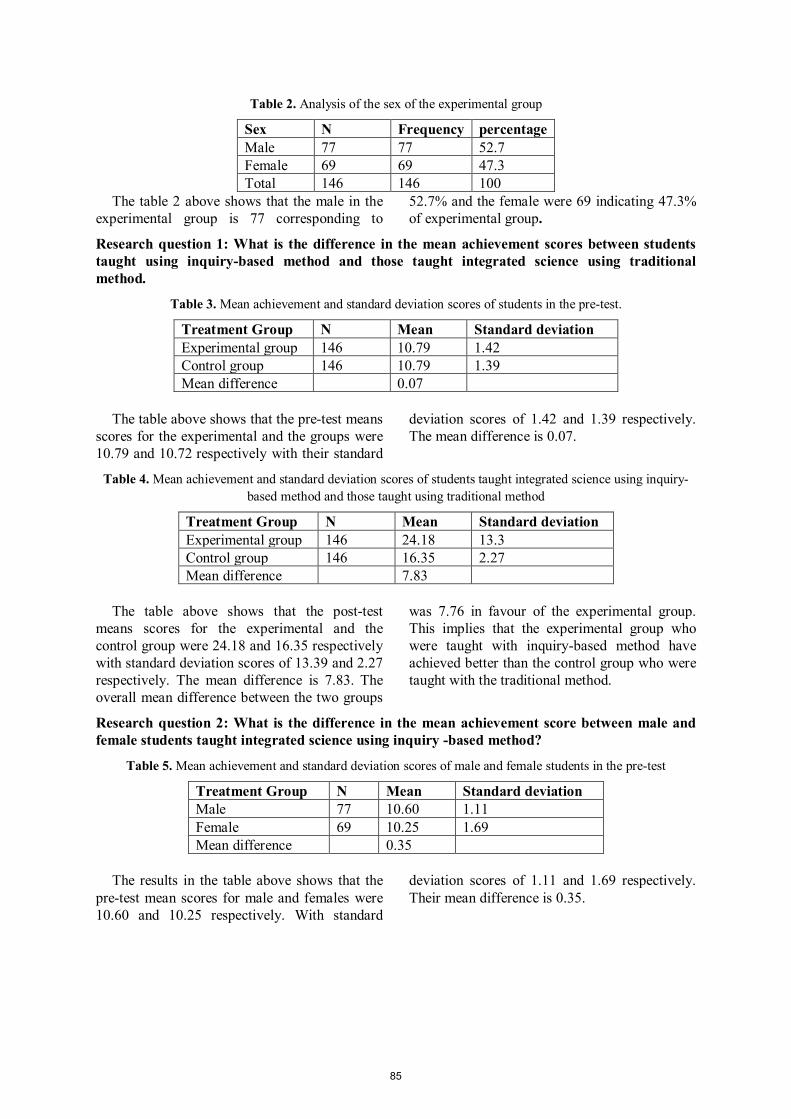
Table 2. Analysis of the sex of the experimental group
Sex N Frequency percentage Male 77 77 52.7 Female 69 69 47.3 Total 146 146 100
The table 2 above shows that the male in the experimental group is 77 corresponding to
52.7% and the female were 69 indicating 47.3% of experimental group.
Research question 1: What is the difference in the mean achievement scores between students taught using inquiry-based method and those taught integrated science using traditional method.
Table 3. Mean achievement and standard deviation scores of students in the pre-test.
Treatment Group N Mean Standard deviation Experimental group 146 10.79 1.42 Control group 146 10.79 1.39 Mean difference 0.07
The table above shows that the pre-test means scores for the experimental and the groups were 10.79 and 10.72 respectively with their standard
deviation scores of 1.42 and 1.39 respectively. The mean difference is 0.07.
Table 4. Mean achievement and standard deviation scores of students taught integrated science using inquiry-based method and those taught using traditional method
Treatment Group N Mean Standard deviation Experimental group 146 24.18 13.3 Control group 146 16.35 2.27 Mean difference 7.83
The table above shows that the post-test means scores for the experimental and the control group were 24.18 and 16.35 respectively with standard deviation scores of 13.39 and 2.27 respectively. The mean difference is 7.83. The overall mean difference between the two groups
was 7.76 in favour of the experimental group. This implies that the experimental group who were taught with inquiry-based method have achieved better than the control group who were taught with the traditional method.
Research question 2: What is the difference in the mean achievement score between male and female students taught integrated science using inquiry -based method?
Table 5. Mean achievement and standard deviation scores of male and female students in the pre-test
Treatment Group N Mean Standard deviation Male 77 10.60 1.11 Female 69 10.25 1.69 Mean difference 0.35
The results in the table above shows that the pre-test mean scores for male and females were 10.60 and 10.25 respectively. With standard
deviation scores of 1.11 and 1.69 respectively. Their mean difference is 0.35.
85
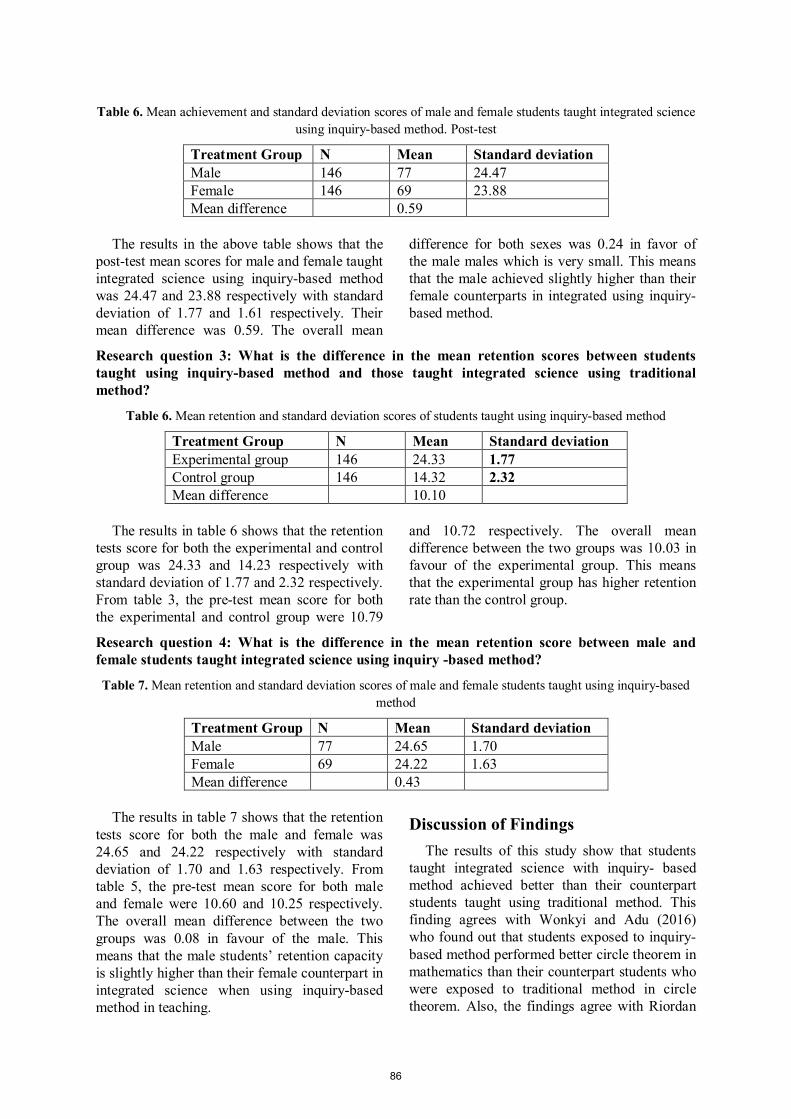
Table 6. Mean achievement and standard deviation scores of male and female students taught integrated science using inquiry-based method. Post-test
Treatment Group N Mean Standard deviation Male 146 77 24.47 Female 146 69 23.88 Mean difference 0.59
The results in the above table shows that the post-test mean scores for male and female taught integrated science using inquiry-based method was 24.47 and 23.88 respectively with standard deviation of 1.77 and 1.61 respectively. Their mean difference was 0.59. The overall mean
difference for both sexes was 0.24 in favor of the male males which is very small. This means that the male achieved slightly higher than their female counterparts in integrated using inquiry-based method.
Research question 3: What is the difference in the mean retention scores between students taught using inquiry-based method and those taught integrated science using traditional method?
Table 6. Mean retention and standard deviation scores of students taught using inquiry-based method
Treatment Group N Mean Standard deviation Experimental group 146 24.33 1.77 Control group 146 14.32 2.32 Mean difference 10.10
The results in table 6 shows that the retention tests score for both the experimental and control group was 24.33 and 14.23 respectively with standard deviation of 1.77 and 2.32 respectively. From table 3, the pre-test mean score for both the experimental and control group were 10.79
and 10.72 respectively. The overall mean difference between the two groups was 10.03 in favour of the experimental group. This means that the experimental group has higher retention rate than the control group.
Research question 4: What is the difference in the mean retention score between male and female students taught integrated science using inquiry -based method?
Table 7. Mean retention and standard deviation scores of male and female students taught using inquiry-based method
Treatment Group N Mean Standard deviation Male 77 24.65 1.70 Female 69 24.22 1.63 Mean difference 0.43
The results in table 7 shows that the retention
tests score for both the male and female was 24.65 and 24.22 respectively with standard deviation of 1.70 and 1.63 respectively. From table 5, the pre-test mean score for both male and female were 10.60 and 10.25 respectively. The overall mean difference between the two groups was 0.08 in favour of the male. This means that the male students’ retention capacity is slightly higher than their female counterpart in integrated science when using inquiry-based method in teaching.
Discussion of Findings The results of this study show that students
taught integrated science with inquiry- based method achieved better than their counterpart students taught using traditional method. This finding agrees with Wonkyi and Adu (2016) who found out that students exposed to inquiry-based method performed better circle theorem in mathematics than their counterpart students who were exposed to traditional method in circle theorem. Also, the findings agree with Riordan
86
and Noyce (2001) who found out that students taught using inquiry-based programs as their primary mathematics curriculum performed significantly better than students taught using traditional approach. The likely explanation for this outcome might be connected to the fact students taught with inquiry-based method had the opportunity to construct their own understanding of the concept taught in the class so deep learning occurred. According to Khalid and Azeem (2012) the constructivism assumes the role of the teacher as a facilitator who guides learners to create knowledge and understanding instead of producing series of facts.
It was also found out that students exposed to inquiry-based method have higher retention capacity than their counterpart students who were exposed to traditional method. This finding agrees with Ali (2012) who found that students have higher retention capacity when they are actively engaged in solving problems through hands-on activities than when they become passive learners as obtained in the use of traditional method. This outcome can be attributed to the fact students had the opportunity to understand and reflect on what was taught in the class therefore they were able to retain and reproduce what was taught in the class.
Again, the study revealed that the male students achieved slightly higher than their female counterparts using inquiry-based method. This difference is very small that it has no impact or significant. This finding agrees with the findings of Oluwatosin (2015) who found out that there was no significant statistical difference between male and female students taught chemistry with inquiry method. Also, Omokaadejo (2014) found that there is no significant difference between male and female SS2 students in their Chemistry academic performances implying that both gender benefit from the inquiry teaching method.
According to this finding it means achievement in integrated science does not depend on gender. Inquiry-based method can therefore be used to bridge the gap in
achievement between male and their female
counterpart.
Also, the findings of this study show that there
is no significant difference between gender and
retentions. This means that both male and
female students can retain what is taught in integrated science using inquiry-based method.
Conclusion The use of inquiry-based method enhanced
students’ achievement and retention in integrated science than traditional method. There was a slightly gender disparity in the achievement and retention capacity of both male and female students taught integrated science with inquiry-based method in favour of the male. This means that inquiry-based method is very rewarding to students in terms of achievement and retention regardless of gender. Also, there was no effect on interaction between the method and gender in students’ achievement and retention in integrated science. This therefore implies there is no need for separate method for both male and female since inquiry- based method could be successfully used for both.
Acknowledgements To Allah be the glory, Honour and praises. I
thank Almighty Allah for giving me knowledge and strength to undertake this study successfully. I would like to express my sincere gratitude to my mother, Madam Ayishetu Yusuf for her daily prayer and encouragement. Many thanks to my wife and brothers especially Nurudeen Abass for lovely support and caring. Finally, I would like thank all the workers of Texila American University for their wonderful support.
References [1] Akpan, O. E. (1992). Towards creative science teaching and learning in West African schools. Cape Coast: Catholic Mission Press. [2] Asselin, M., Branch, J. & Oberg, D. (Eds). 2003. Achieving information literacy standards for school library programs in Canada. O.N: Canadian School Library Association. (atas talian) http://ednet.edc.gov.ab.calk-12/curriculum/by [3] Azure, J.A. (2015). Senior High School Students’ views on the teaching and learning of integrated science in Ghana. Journal of Science Education and Research, 1(2), 49-61 [4] Bybee, R. W., Taylor, J.A., Gardner A., Scotter, P. V., Powell, J.C., Westbrook, A. & Landes, N. (2006). The BScs 5e instructional model: origins and effectiveness. Office of Science Education National Institutes of Health. 1-80.
87
[5] Cooper, J. M. (1990) (Ed.). Classroom teaching skills. Toronto: D. C. Heath and Company. [6] CRDD (2010) Integrated science Syllabus for
Senior High School. Curriculum Research and Development Division. [7] Demeo, S. (2005). Gazing A Hand: A Foulcaltion View of the Teaching of Manipulative Skills to [8] Introductory Chemistry students in the United States and the Potential for Transforming Laboratory Instruction. Retrieved April 5, 2012, from http://onlinelibrary.wiley.com/doi/10.1111/j.1467-873X.2005.00330.x/pdf [9] Hiang, P. S. (2005). Pedagogy of Science. Kuala Lumpur: Percetakan Sentosa (K. L) Sdn.Bhd [10] K.Adu-Gyamfi (2014) Using activity method to enhance students’ performance in energy transformation. [11] K.J. Sree (2010) Methods of Teaching Science Discovery Publishing House. [12] Khalid, A., & Azeem, M. (2012). Constructivist vs. traditional: Effective instructional approach in teacher education. International Journal of Humanities and Social Science, 2(5), 170–177. [13] Davar, M. (2012) Teaching of Science PHI Learning Limited [14] McFarland, E. (2005). Using Demonstration in Teaching Physics. La Physique Au Canada, 87-89 [15] Mensah, S. K. E. (1992). Source book for science tutors’ professional studies. [16] Shamsudin, M. N and Abdullah, N. “Strategies of Teaching Science Using an Inquiry based Science [17] Education (IBSE) by Novice Chemistry Teachers”, Procedia - Social and Behavioral Sciences, vol. 90, no.10, (2013), pp.583-592. [18] O’Oconnor, J. P. (2002). Teachers are the problem in SMT, not girls. Retrieved on January 9, 2009 from http://www.adea.org [19] Okoroafo, S. (2014). Gender difference in secondary school students’ academic achievement in Science. Australian Science Teachers Journal, 23(6), 23-25.
[20] Oluwatosin V. A. (2015). effect of hands-on activities on senior secondary chemistry students’ achievement in chemistry. Benue State. achievement in Basic Science. Unpublished M.Ed Dissertation, Tai Solarin University of Education, Ogun State, Nigeria. [21] Olorundare, A. S. (2014). Correlates of poor
academic performance of secondary school students
in the sciences in Nigeria. Paper presented at the International Institute for Capacity Building in Higher Education, Virginia State University, Virginia, USA. 20th – 31st June, 2014. [22] PR˚UCHA, Jan, Eliˇska WALTEROVA and Jiˇ ´ r´ı MARES. ˇ Pedagogick´y slovn´ık. Praha: Port´al, 2009. 395p. ISBN 978-80-7367-649. [23] Shadreck, M. & Mambanda, I. (2012). Science teacher quality and effectiveness: Gweru Urban junior secondary school students’ point of view. Asian social science, 8(8), 121-135. [24] Tytler, R. (2003). A Window for a Purpose: Developing a framework for describing effective science teaching and learning. Research in Science
Education, 33. pp. 273--‐298. Kluwer Academic Publishers [25] Perry, J. N. (2009). What is Simulation? Retrieved February 18, 2011, from Saskatoon: http://olc.spsd.sk.cs/DE/PD/INSTR/strats/simui/index.html [26] Udo, M. E. (2011). Computer-Based Science Simulations, Guided-Discovery and students’ Performance in Chemistry. [27] Wood, W.B & Gentile, J.M. (2003). Teaching in a Research Context. Science, 302:1510. [28] Yager, R.E. (1991). What research says to the
science teacher, volume seven. The science and
technology, society movement. Washington D.C. National Science Teachers Association [29] Yara, O, P., 2009. Students’ attitude towards mathematics and academic achievement in some selected secondary schools in South Western Nigeria. European Journal of Scientific Research, 36 (3): 336-341.
88
Texila International Journal of Academic research ISSN: 2520-3088
DOI: 10.21522/TIJAR.2014.07.02.Art010
The Prevalence of Malaria amongst Adults in Remote Primary Health Care Facility in South-South Nigeria
Oche Prince I1*, Ndukwu Geraldine U2
1Physician, medical services, International SOS, Port Harcourt, Nigeria 2Department of Family Medicine, University of Port Harcourt Teaching Hospital, Port
Harcourt, Nigeria *Corresponding Author: [email protected]
Abstract
Malaria is a serious public health burden with high morbidity and mortality in Nigeria accounting
for 60% outpatient visits, 30% childhood mortality, 25% infant mortality and 11% maternal
mortality, respectively, in the country. Malaria is endemic in Nigeria with consequent high economic
burden. Malaria is one of the leading causes of death in Nigeria. The prevalence of malaria is high in
Nigeria resulting from several climatic, bioenvironmental and socio-demographic factors. Malaria
prevalence is higher amongst dwellers with high poverty and illiteracy levels. The prevalence of
malaria was evaluated retrospectively in this study using clinical records over 12 months in a remote
primary healthcare facility in South-South Nigeria. The findings show varied malaria prevalence
rates amongst the months, with 3 months below 50% and the remaining 9 months above 50%. The
overall period prevalence was 56% (541/966). The high prevalence rate reported in this study reflects
the endemicity of malaria in Nigeria and is consistent with other reports that malaria prevalence is
higher in the south-south Nigeria than observed with other regions of the country. The study
prevalence 56% is twice higher than the average national period prevalence of 23%.
Keywords: malaria prevalence, malaria prevalence determinant factors.
Introduction
Malaria is a serious epidemiological burden in Nigeria and Africa characterized by high morbidity and mortality rates (Adu-Gyasi et al, 2018; Megnekou et al, 2018). Of the 228 million global malaria cases reported in 2018, Africa accounted for 93% and Nigeria 25%. The world malaria prevalence improved in 2018 by 23 billion cases compared to 251 million cases reported in 2010 (WHO, 2017 & 2019). The prevalence of malaria reflects frequent hospital visits and admission, with varied mortality rates among different population groups.
In Nigeria, malaria accounts for 60% outpatient visits, 30% childhood mortality, 25% infant mortality and 11% maternal mortality, respectively (NMEP). Malaria is not without economic burden as millions of naira ((Nigerian local currency) are involved with malaria management and control in Nigeria. According to the National Malaria Elimination Programme (NMEP), Nigeria loses 132 billion naira to malaria per year from prevention, control,
treatment and man-hours loss. Malaria is one of the leading causes of death in Nigeria (Khanam 2017). However, in 2018, Nigeria had the largest reduction in malaria deaths in the world from 153,000 deaths in 2010 to 95000 (WHO, 2019).
The prevalence of malaria in Nigeria has differed in various periods, amongst the geopolitical regions, age groups and rural/urban (Dawaki et al, 2016). In south-south region, period prevalence of malaria was reported at 72.7%, 46.6% and 43.1% at various periods in Rivers state (Amala & Nwibani, 2015; Nzeako, Nduka & Origie, 2013; Wogu & Nduka, 2018) and at 71.4% in Cross River state (Udoh, Ita & Odey, 2013). Though south east recorded 40.5% (Uneke, Ogbu & Nwojiji, 2006) at a time, Enugu state in the same region reported a much higher period prevalence of 85.7% (Ayogu et al, 2016). South-west region has shown much lower period prevalence of 14.7% (Lagos state) and 15% (Ogun state), respectively (Aina, Agomo, Olukosi, Okoh, Iwalokun, Egbuna et al, 2013; Okangba, Ejikwu, Shobowale, Shonekan & Nwadike, 2016). North-west Nigeria reported
89
60.6% (Dawaki et al, 2016; WHO, 2019) and 32.4% in Kano state and 46.6% in Zamfara state (Garba, Muhammed, Musa et al, 2016). The average national period prevalence of malaria is declining however. In 2010, Nigeria period prevalence of malaria was 42% which reduced tremendously to 27% in 2016 and 23% in 2018 (WHO, 2016, 2018 & 2019).
Several factors have been reported responsible for malaria prevalence in Nigeria ranging from bioenvironmental factors through educational status of the citizens to medical conditions and physiological states (Bassey & Izah, 2017; Garba, Ameh, Whong and Aminu-Mukhtarl, 2016; Seiyaboh et al, 2016; Ukaegbu et al, 2014). The common bioenvironmental factors are bushy and water-collecting environments that promote the breeding of the malaria parasite (Plasmodium) vector Anopheles
mosquitoes. Level of education has been correlated with malaria vector control protocols adherence, with those having advanced education known for better adherence rates. Medical conditions like diabetes mellitus, human immunodeficiency virus/acquired immunodeficiency syndrome (HIV/AIDs), cancers and other chronic conditions that reduce immunity are a risk to contracting malaria. Understanding the risk groups and factors for malaria prevalence is fundamental to the management of the disease.
Symptoms associated with malaria are not specific to the disease. Chief among the symptoms is fever with different patterns depending on the Plasmodium species; falciparum, ovale, vivax, malariae and knowlesi as the common five human-infesting species (Wongsrichanalai, Barcus, Muth, Sutamihardja & Wernsdorfer, 2007). Other non-specific malaria symptoms are weakness, malaise, headaches, joint pains, muscle pains, poor appetite, haematuria (blood in urine), vomiting, diarrhea, abdominal pain (Khanam, 2017). The burden of febrile disease in Nigeria and Africa is high, which necessitates diagnostic work ups of any febrile presentation at health facilities of any categories (Abdullah et al, 2017; Crump & Kirk, 2015). Parasitological testing is essential in malaria management.
Plasmodium falciparum remains the predominant species in Africa (including Nigeria) and it is the species that causes cerebral and fatal malaria in most cases (Griffin et al,
2010). P. falciparum accounts for most complicated and fatal cases of malaria in Nigeria as also reported across other African countries. Female Anopheles mosquito species (Anopheles
gambiae) is the vector that bears the malaria parasite Plasmodium spp., which promotes the transmission of malaria (Ayogu, Ukwe, & Nna, 2016). However, Plasmodium vivax is the most predominant species outside Africa.
Malaria can be catastrophic in certain vulnerable individuals because of reduced, poor or impaired immunity. Malaria has poor outcomes in neonates, infants, under five (U-5) children, pregnant women, and persons having haemoglobinopathies, chronic diseases and/or on chemotherapy (Ayogu et al, 2016; WHO, 2019).
Prompt and appropriate management of malaria following parasitological testing cannot be overemphasized, to avoid complications and resistance (Ayogu et al, 2016). Also, parasitological testing will help to determine the burden of malaria in the country and enable for planning and implementation of interventions to eradicate malaria from the country. Malaria is routinely diagnosed with microscopy and rapid diagnostic tests in health facilities. Microscopy is the gold standard and it requires expertise for reliable detection of malaria parasites (Plasmodium spp.).
Malaria elimination from the country is actually a daunting goal because of the unique and complex sociocultural composition of the population and poor political commitment of the country (Aribodor, Ugwuanyi & Aribodor, 2016). The prevailing poverty condition and poor literacy level in the country underline the difficulty in reducing malaria prevalence, if not eliminating the febrile illness/disease (World Bank, 2019).
Given the burden of malaria in Nigeria, the study aimed at evaluating the period prevalence of malaria in a remote Primary Health Care facility in South-South Nigeria, using microcopy. This will result in proper channeling of scarce resources at the peak period of transmission in order to eradicate or reduce drastically the transmission of malaria.
Materials and Methods This retrospective study evaluated positive
malaria cases as documented in the study clinic’s records over 12 months from September
90
2017 to August 2018. The study site is a ‘remote Primary Health Care (PHC) facility’ in South-South Nigeria (a rainforest zone with high malaria transmission), using Giemsa-stained microscopy as the malaria diagnostic test method. The clinic sees adult population with a handful of females, males being the predominant gender in the study site.
The clinic laboratory is operated in good conditions with constant power supply and by two professional scientists who read microscopic slides according to international standard practice and the local protocol.
Every case of suspected malaria in the clinic is investigated using either Giemsa-stained microscopy or rapid diagnostic test, but the study considered cases tested with microcopy. The population studied was 966 cases tested for malaria by Giemsa-stained microscopy as extracted from the clinic’s records over the 12-month period.
For statistical analysis, the author used the formula below to calculate the ‘period prevalence’ of malaria over a 12-month period.
Positive Malaria cases Prevalence = --------------------------- X 10n Total population at risk over the 12-month
period, where 10n = 100 The numerator is the positive cases of malaria
and the denominator is the total population tested or studied for malaria in the specified period.
Results The results displayed in the respective table 1
and figure 1 show the respective monthly malaria prevalence rates per 100% from September 2017 to August 2018 (12-month period).
From both table 1 and figure 1, three months in 2018 (February, July and August) had below 50% malaria prevalence rates. The remaining 9 months recorded prevalence rates of malaria above 50%. The lowest malaria prevalence rate was 45% (August, 2018) and the highest was 71% (June, 2018).
However, the overall ‘period malaria prevalence’ with respect to the total microscopy positive cases and the total number tested is 56%.
Discussion This study has shown different monthly
prevalence rates of malaria. Three months have respective malaria prevalence rates below 50% and the rest 9 months have above 50%. But the study overall period prevalence of malaria is 56% (i.e. the no of positive cases over total cases times 100). This implies that for every 100 Nigerians 56 persons have malaria in the study area which depends on several factors as discussed in the introduction (Bassey et al, 2017). This study finding at 56% is twice higher than the national average malaria prevalence (23%) reported in 2018 (WHO, 2019). Malaria prevalence is not stable neither consistent all year round, across regions and among age groups. The study results imply that malaria prevalence is dynamic as it varies in different periods (Nigeria Malaria Fact Sheet, 2011). The understanding of the determinant factors of malaria prevalence is helpful in instituting malaria elimination programmes and control protocols.
Several studies have reported varied malaria prevalence rates in different geopolitical regions and socio-demographic strata (Dawaki et al, 2016). The study overall period prevalence of malaria at 56% is much higher than 14.7% in Lagos state (Okangba et al, 2016) and 15% in Ogun state in south-west Nigeria (Aina et al, 2013). Also, the index prevalence is higher than 32.4% in Kano state in north-west Nigeria (WHO, 2019), 40.5% in south-east Nigeria (Uneke et al, 2006), 40.8% and 43.1% in Rivers state in south-south Nigeria (Amala et al, 2015; Wogu et al, 2018) and 46.6% in Zamfara state in north-west Nigeria (Garba et al, 2016). However, the study prevalence (56%) is lower than 60.6% in Kano state in north-west Nigeria (Dawaki et al, 2016), 71.4% Cross River state in south-south Nigeria where the index study was conducted (Udoh et al, 2013), 72.7% in Rivers state in south-south Nigeria (Nzeako et al, 2013) and 85.7% in Enugu state in south-east Nigeria (Ayogu et al, 2016). The authors’ finding shows that the prevalence of malaria is more in the south-south and south east than in the north and west.
Garba et al (2016) reported different malaria prevalence in different seasons among blood donors. Malaria prevalence amongst the group was 9.2% in wet (rainy, April to October) and 4.9% dry (November to March) seasons,
91
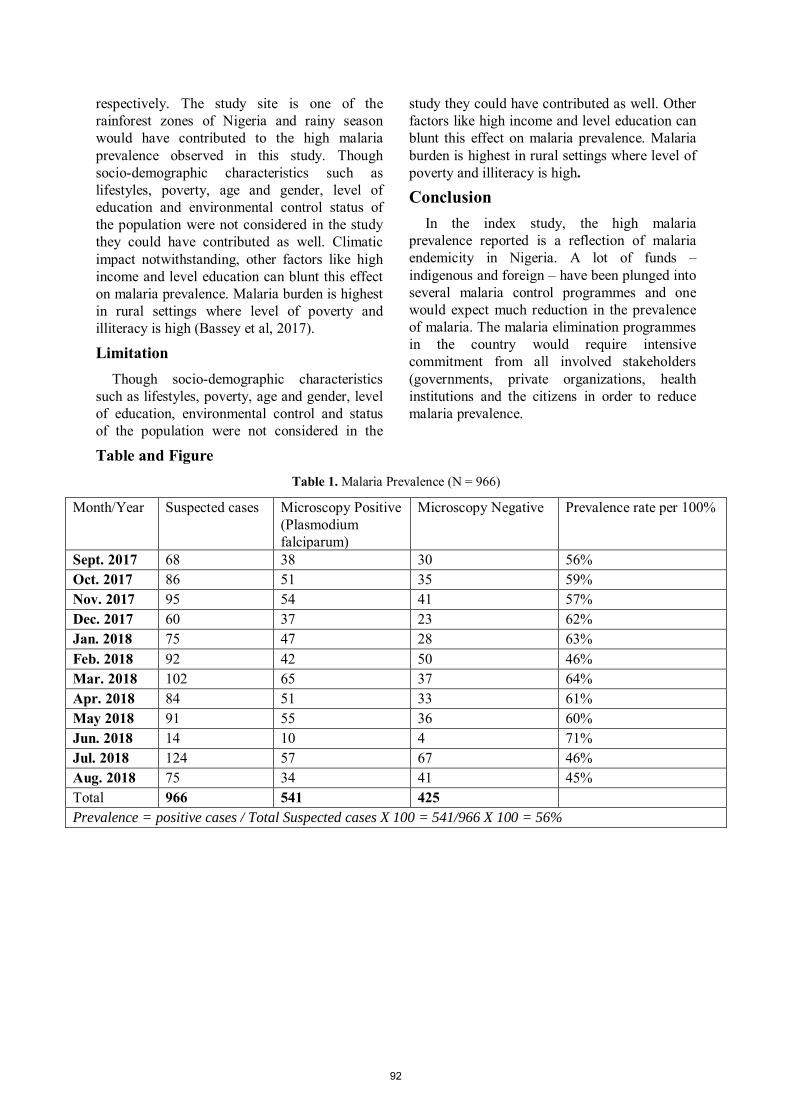
respectively. The study site is one of the rainforest zones of Nigeria and rainy season would have contributed to the high malaria prevalence observed in this study. Though socio-demographic characteristics such as lifestyles, poverty, age and gender, level of education and environmental control status of the population were not considered in the study they could have contributed as well. Climatic impact notwithstanding, other factors like high income and level education can blunt this effect on malaria prevalence. Malaria burden is highest in rural settings where level of poverty and illiteracy is high (Bassey et al, 2017).
Limitation Though socio-demographic characteristics
such as lifestyles, poverty, age and gender, level of education, environmental control and status of the population were not considered in the
study they could have contributed as well. Other factors like high income and level education can blunt this effect on malaria prevalence. Malaria burden is highest in rural settings where level of poverty and illiteracy is high.
Conclusion In the index study, the high malaria
prevalence reported is a reflection of malaria endemicity in Nigeria. A lot of funds – indigenous and foreign – have been plunged into several malaria control programmes and one would expect much reduction in the prevalence of malaria. The malaria elimination programmes in the country would require intensive commitment from all involved stakeholders (governments, private organizations, health institutions and the citizens in order to reduce malaria prevalence.
Table and Figure Table 1. Malaria Prevalence (N = 966)
Month/Year Suspected cases Microscopy Positive (Plasmodium falciparum)
Microscopy Negative Prevalence rate per 100%
Sept. 2017 68 38 30 56% Oct. 2017 86 51 35 59% Nov. 2017 95 54 41 57% Dec. 2017 60 37 23 62% Jan. 2018 75 47 28 63% Feb. 2018 92 42 50 46% Mar. 2018 102 65 37 64% Apr. 2018 84 51 33 61% May 2018 91 55 36 60% Jun. 2018 14 10 4 71% Jul. 2018 124 57 67 46% Aug. 2018 75 34 41 45% Total 966 541 425 Prevalence = positive cases / Total Suspected cases X 100 = 541/966 X 100 = 56%
92
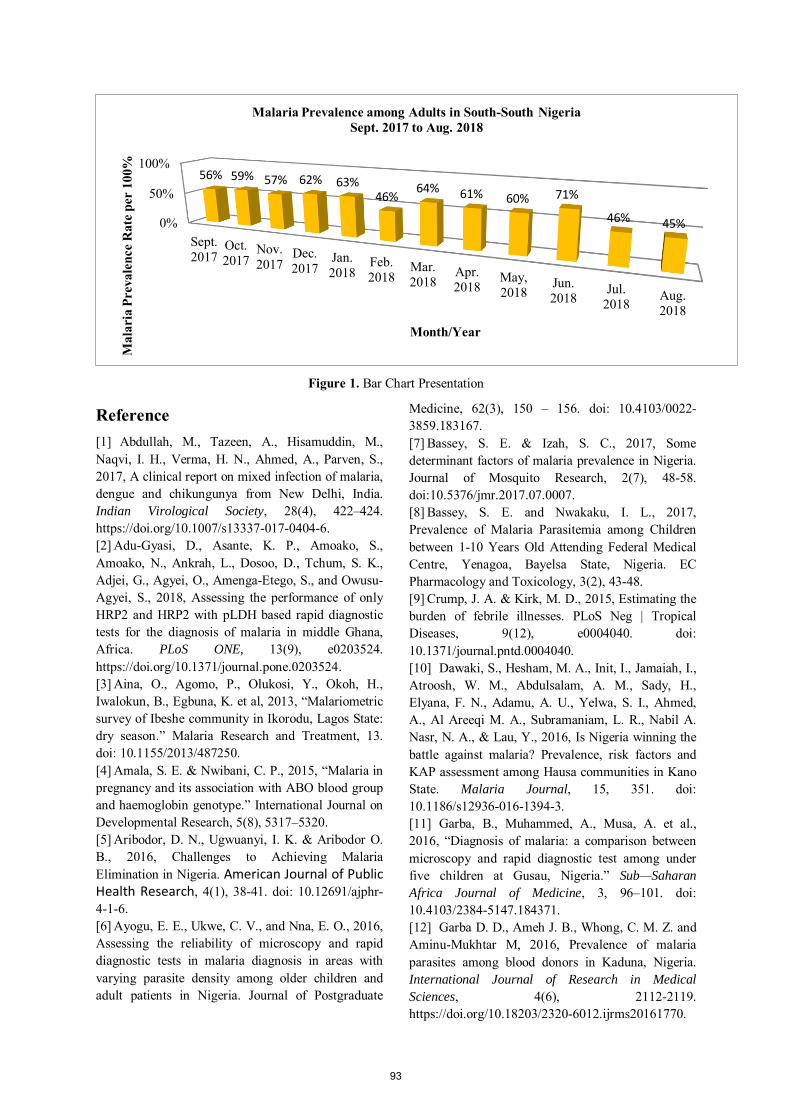
Figure 1. Bar Chart Presentation
Reference [1] Abdullah, M., Tazeen, A., Hisamuddin, M., Naqvi, I. H., Verma, H. N., Ahmed, A., Parven, S., 2017, A clinical report on mixed infection of malaria, dengue and chikungunya from New Delhi, India. Indian Virological Society, 28(4), 422–424. https://doi.org/10.1007/s13337-017-0404-6. [2] Adu-Gyasi, D., Asante, K. P., Amoako, S., Amoako, N., Ankrah, L., Dosoo, D., Tchum, S. K., Adjei, G., Agyei, O., Amenga-Etego, S., and Owusu-Agyei, S., 2018, Assessing the performance of only HRP2 and HRP2 with pLDH based rapid diagnostic tests for the diagnosis of malaria in middle Ghana, Africa. PLoS ONE, 13(9), e0203524. https://doi.org/10.1371/journal.pone.0203524. [3] Aina, O., Agomo, P., Olukosi, Y., Okoh, H., Iwalokun, B., Egbuna, K. et al, 2013, “Malariometric survey of Ibeshe community in Ikorodu, Lagos State: dry season.” Malaria Research and Treatment, 13. doi: 10.1155/2013/487250. [4] Amala, S. E. & Nwibani, C. P., 2015, “Malaria in pregnancy and its association with ABO blood group and haemoglobin genotype.” International Journal on Developmental Research, 5(8), 5317–5320. [5] Aribodor, D. N., Ugwuanyi, I. K. & Aribodor O. B., 2016, Challenges to Achieving Malaria Elimination in Nigeria. American Journal of Public Health Research, 4(1), 38-41. doi: 10.12691/ajphr-4-1-6. [6] Ayogu, E. E., Ukwe, C. V., and Nna, E. O., 2016, Assessing the reliability of microscopy and rapid diagnostic tests in malaria diagnosis in areas with varying parasite density among older children and adult patients in Nigeria. Journal of Postgraduate
Medicine, 62(3), 150 – 156. doi: 10.4103/0022-3859.183167. [7] Bassey, S. E. & Izah, S. C., 2017, Some determinant factors of malaria prevalence in Nigeria. Journal of Mosquito Research, 2(7), 48-58. doi:10.5376/jmr.2017.07.0007. [8] Bassey, S. E. and Nwakaku, I. L., 2017, Prevalence of Malaria Parasitemia among Children between 1-10 Years Old Attending Federal Medical Centre, Yenagoa, Bayelsa State, Nigeria. EC Pharmacology and Toxicology, 3(2), 43-48. [9] Crump, J. A. & Kirk, M. D., 2015, Estimating the burden of febrile illnesses. PLoS Neg | Tropical Diseases, 9(12), e0004040. doi: 10.1371/journal.pntd.0004040. [10] Dawaki, S., Hesham, M. A., Init, I., Jamaiah, I., Atroosh, W. M., Abdulsalam, A. M., Sady, H., Elyana, F. N., Adamu, A. U., Yelwa, S. I., Ahmed, A., Al Areeqi M. A., Subramaniam, L. R., Nabil A. Nasr, N. A., & Lau, Y., 2016, Is Nigeria winning the battle against malaria? Prevalence, risk factors and KAP assessment among Hausa communities in Kano State. Malaria Journal, 15, 351. doi: 10.1186/s12936-016-1394-3. [11] Garba, B., Muhammed, A., Musa, A. et al., 2016, “Diagnosis of malaria: a comparison between microscopy and rapid diagnostic test among under five children at Gusau, Nigeria.” Sub—Saharan
Africa Journal of Medicine, 3, 96–101. doi: 10.4103/2384-5147.184371. [12] Garba D. D., Ameh J. B., Whong, C. M. Z. and Aminu-Mukhtar M, 2016, Prevalence of malaria parasites among blood donors in Kaduna, Nigeria. International Journal of Research in Medical
Sciences, 4(6), 2112-2119. https://doi.org/10.18203/2320-6012.ijrms20161770.
0%
50%
100%
Sept.2017
Oct.2017
Nov.2017
Dec.2017
Jan.2018
Feb.2018
Mar.2018
Apr.2018
May,2018
Jun.2018
Jul.2018 Aug.
2018
56% 59% 57% 62% 63%46%
64% 61% 60% 71%
46% 45%
Mal
aria
Pre
vale
nce
Rat
e pe
r 10
0%
Month/Year
Malaria Prevalence among Adults in South-South NigeriaSept. 2017 to Aug. 2018
93
[13] Griffin, J. T., Hollingsworth, T. D., Okell, L. C., Churcher, T. S., White, M., Hinsley, W., Bousema, T., Drakeley, C. J., Ferguson, N. M., Basáñez, M., Ghani, A. C., 2010, Reducing Plasmodium falciparum malaria transmission in Africa: a model-based evaluation of intervention strategies. PLoS Medicine, 7(8). Retrieved from: https://doi.org/10.1371/journal.pmed.1000324. [14] Khanam, S., 2017, Prevalence and Epidemiology of Malaria in Nigeria: A Review. International Journal of Research in Pharmacy and
Biosciences, 4(8), 10-12. ISSN 2394-5885 (Print) & ISSN 2394-5893 (Online). Retrieved from: http://www.ijrpb.org/papers/v4-i8/2.pdf. [15] Megnekou, R., Djontu, J. C., Nana, B. C., Bigoga, J. D., Fotso, M., Fogang, B., and Leke, R. F. G., 2018, Accuracy of One Step malaria rapid diagnostic test (RDT) in detecting Plasmodium falciparum placental malaria infection in women living in Younde, Cameroon. Malaria Journal, 17, 450. https://doi.org/10.1186/s12936-018-2595-8. [16] National Malaria Elimination Programme. https://nmcp.gov.ng/about-national-malaria-elimination-programme/. Accessed September 05, 2020. [17] Nigeria Malaria Fact Sheet, 2011. https://photos.state.gov/libraries/nigeria/231771/Public/December-MalariaFactSheet2.pdf. Accessed, September 15, 2020. [18] Nzeako, S. O., Nduka, F. O. and Origie, O. A., 2013, “Prevalence of malaria in pregnant women attending antenatal care at University of Port Harcourt Primary Healthcare Centre Aluu, Port Harcourt, Rivers State, Nigeria.” International
Journal of Scientific Research in Environmental
Sciences, 1(10), 268–272. http://dx.doi.org/10.12983/ijsres-2013-p268-272. Available online at http://www.ijsrpub.com/ijsres. [19] Okangba, C, Elikwu, C., Shobowale, E., Shonekan, O. and Nwadike, V., 2016, “Histidine rich protein 2 performance in determining the prevalence of malaria among patients presenting with clinical symptoms of malaria.” Scientific Journal of Pure and
Applied Sciences, 5(1), 339–350. [20] Seiyaboh, E. I., Inyang, I. R. and Izah, S. C., 2016, Seasonal Variation of Physico-Chemical Quality of Sediment from Ikoli Creek, Niger Delta. International Journal of Innovative Environmental
Studies Research, 4(4), 29-34. [21] Udoh, E., Ita, A., Odey, F et al., 2013, “Malariometric indices among Nigerian children in a rural setting,” Malaria Research and Treatment, 4. http://dx.doi.org/10.1155/2013/716805.
[22] Uneke, C. J., Ogbu, O. and Nwojiji, V., 2006, “Potential risk of induced malaria by blood transfusion in South-eastern Nigeria.” McGill
Journal of Medicine, 9(1), 8–13. PMCID: PMC2687905; PMID: 19529802. Retreived from: https://www.ncbi.nlm.nih.gov/pmc/articles/PMC2687905/pdf/mjm9_1p8.pdf. [23] Ugah, U. I., Alo, M. N., Owolabi, J. O., Okata-Nwali, O. D., Ekejindu, I. M., Ibeh, N., Elom, M. O., 2017, Evaluation of the utility value of three diagnostic methods in the detection of malaria parasites in endemic area. Malaria Journal, 16, 189, Retrieved from: https://doi.org/10.1186/s12936-017-1838-4. [24] World Bank, 2019, The World Bank in Nigeria: Overview. https://www.worldbank.org/en/country/nigeria/overview. [25] World Health Organization, 2016, Nigeria launches the 2015 National Malaria Indicator Survey. https://www.afro.who.int/news/nigeria-launches-2015-national-malaria-indicator-survey. [26] World Health Organization Malaria Report, 2017, Global response to malaria at crossroads. http://www.who.int/mediacentre/news/releases/2017/malaria-report-response/en/. [27] World Health Organization, 2018, World Malaria Day 2018; Ready to Beat Malaria. https://www.afro.who.int/news/world-malaria-day-2018-ready-beat-malaria. [28] World Health Organization, 2019, “The World Malaria Report 2019” at a glance. https://www.who.int/news-room/feature-stories/detail/world-malaria-report-2019. [29] World Health Organization, 2019, Malaria control: Households receive over eight million nets in Kano. https://www.afro.who.int/news/malaria-control-households-receive-over-eight-million-nets-kano. [30] Wogu, N. & Nduka, F. O., 2017, Evaluating Malaria Prevalence Using Clinical Diagnosis Compared with Microscopy and Rapid Diagnostic Tests in a Tertiary Healthcare Facility in Rivers State, Nigeria. Journal of Tropical Medicine, 2018. https://doi.org/10.1155/2018/3954717. [31] Wongsrichanalai, C., Barcus, M. J., Muth, S., Sutamihardja, A., Wernsdorfer, W. H., 2007, A review of malaria diagnostic tools: microscopy and rapid diagnostic test (RDT). American Journal of Tropical Medicine and Hygiene, 77(6), 119–127. https://www.ncbi.nlm.nih.gov/pubmed/18165483.
94
Texila International Journal of Academic research
ISSN: 2520-3088
DOI: 10.21522/TIJAR.2014.07.02.Art011
Assessment of Knowledge of Essential Supply Chain Functions among HIV/AIDS Supply Chain Workforce in Nigeria
Sunday O Aguora1*, Azuka C Oparah2, Edith C Okechukwu3
1, 3School of Public Health, Texila American University, Georgetown, Guyana, South America
2Department of Pharmacy and Pharmacy Practice, Faculty of Pharmacy, University of Benin, Benin City, Nigeria
*Corresponding Author: [email protected]
Abstract
This study on assessment of knowledge of essential supply chain functions among HIV/AIDS supply
chain workforce in Nigeria comprised of research objectives, questions and hypothesis. A pre-tested
self-completed structured questionnaire (422) was administered to respondents, 396 were completed
and returned, with a response rate of (93.8%). The respondents had received previous trainings and
knowledge distribution of essential supply chain functions showed good knowledge in serving customers
(84.8%), procurement (82.6%), logistics management information system (78.8%), monitoring and
evaluation (77.5%) and product selection (71.0%)) and capacity gaps in inventory strategy (48.7%),
warehouse and distribution (48.0%), quantification (44.2%) and risk management (33.3%). The study
revealed knowledge gaps in essential supply chain functions such as inventory strategy, warehouse and
distribution, quantification and risk management among HIV/AIDS supply chain workforce. A
reliability analysis was carried out on knowledge level of essential supply chain functions, Cronbach’s
alpha showed the questionnaire to reach acceptable reliability, α = 0.925. Chi-square statistic revealed
that knowledge of essential supply chain functions is a significant factor of HIV/AIDS supply chain
workforce capacity (p<0.05). There is need to strengthen HIV/AIDS workforce capacity in the areas
they are deficient to ensure effective provision of service and improved health outcomes.
Keywords: HIV/AIDS, supply chain workforce, knowledge, supply chain functions.
Introduction
Human resources have been noted as the most
important part of a functional health system
(WHO, 2000), and development of skilled
workforce contributes to health systems
strengthening (Schneider et al., 2011). Health
systems strengthening (HSS) is vital to achieving
health-related Sustainable Development Goals
(SDGs) and improved health outcomes
(Leatherman et al., 2010; Frenk, 2010; Fowkes et
al., 2016). There is a growing concern that
without urgent improvements in the performance
of health systems, the health-related Sustainable
Development Goals will not be achieved because
of lack of skilled human resources for health. It
follows therefore that health systems that
function well usually are staffed with adequate
human resources possessing the right skills and
motivation. Thus, the need for a well-trained and
competent workforce, knowledgeable on
essential supply chain functions to be engaged in
HIV/AIDS supply chain management. Human
resources are recognized as a key performance
driver within supply chains (Brown and
Sankaranarayanan, 2014). Therefore, skilled
workforce is essential for sustained progress in
HIV/AIDS supply chain management in Nigeria.
It is important to ensure existing workforce are
well trained and given adequate mix of skills. The
supply chain workforces are true lifesavers and
improving the quality of HIV/AIDS supply chain
workforce is vital. To ensure sustainable supply
chain, a network of supply chain professionals
with broad and vastly specialized expertise needs
to be developed (Brown and Sankaranarayanan,
2014). Every cadre of supply chain workforce at
every step till the last mile of the supply chain
should be adequately trained such that only
experts would deliver their task in a professional
manner (UNICEF, 2014). Workforce knowledge
is key for sustained progress in health supply
chains and sustainable development (Brown and
Sankaranarayanan, 2014).
95
Therefore, the present study seeks to assess
knowledge of essential supply chain functions
among HIV/AIDS supply chain workforce in
Nigeria.
Materials and Methods
Selection of the area
The study was carried out in Abuja, the
administrative and political centre of Nigeria.
Abuja is the centre for policy development,
coordination and monitoring of implementation
of HIV/AIDS supply chain activities. It has
boundary with four states; Kaduna state (north),
Niger state (west), Nassarawa state (east) and
Kogi state (south) (Ebele et al., 2014). Abuja also
serves as headquarter of many of the HIV/AIDS
organizations from where they carry out their
HIV/AIDS supply chain functions around the
country.
Sample size determination
Cochran’s formula (n0= z2pq/e2) for
calculating representative sample size for infinite
population was used (Cochran, 1977).
n0 = sample size
z = 1.96 (selected critical value of desired
confidence level)
p = 0.5 (assuming the maximum variability,
which is equal to 50%)
q = 1- p
e = 0.05 (±5% desired level of precision at
95% confidence level)
n0 = (1.96)2(0.5) (0.5)/ (0.05)2
n0 = 384.16
To ensure minimum response rate, 10%
overage was added to the calculated sample size
to accommodate possible drop out, non-response,
incomplete response and late response.
Sampling technique
Respondents (422) from public sector, private
sector, non-governmental organization, faith-
based organization and donor agency involved in
HIV/AIDS supply chain management without
gender discrimination were selected using
random sampling technique. The study excluded
those who had not spent up to two years in their
respective organizations and obtained at least
bachelor’s degree qualification.
Data collection
Primary and secondary sources of data were
used for the study. We used the secondary data
for literature review and design of the
questionnaire. The secondary data was collected
from textbooks, journals and newspapers. The
primary sources of data were those collected from
the field through a structured self-completed
questionnaire. The purpose of the study and
questionnaire were explained to the participants
and the consent of each participant was obtained
before joining the study. Participants were free to
withdraw at any point from the study without
consequences. The identity of participants was
kept anonymous and confidential by excluding
their names and organizations in the
questionnaire. The questionnaire had twenty-
three (23) questions with which relevant
information in the area of socio-demographic
characteristics, areas of training and knowledge
distribution on supply chain functions were
obtained. The questionnaire required about 20
minutes to complete. We ensured construct
validity by fashioning the questionnaire based on
relevant literatures and empirical studies. To
ensure content validity, the questionnaire was
reviewed by the supervisor and pre-tested and
modifications made based on the results of the
review and pre-test. The survey was conducted
between September and December 2019.
Data analysis
Returned questionnaires were checked for
accuracy, completeness and consistency. Usable
questionnaires were numbered serially and
coded. Each questionnaire was captured on the
excel template while ensuring the serial number
on the hard copy of the questionnaire ties with the
serial number on the excel template. The entries
in the excel template were rechecked for accuracy
before data analysis. Analysis of data was carried
out with Statistical Package for Social Sciences
(SPSS Version 20.0) and Chi-square statistic to
determine the level of association at 5% level of
significance (p ≤ 0.05).
Results and Discussion
We administered 422 questionnaires, only 396
questionnaires were returned giving a response
rate of 93.8%. Table (1) captured socio-
demographic characteristics with age of most
(96.0%) of the respondents between 30 and 59
years. Most of the respondents (69.4%) were
male, with years of experience in HIV/AIDS
supply chain between 4 and 15 years and more
than half of the respondents had master’s degree
96
as their highest educational qualification. Most of
the respondents work at the national and state
levels in the NGO and public sector with majority
(74.2%) in the rank of manager, supervisor,
specialist, advisor and officer. Table (2) captured
the areas of previous trainings in supply chain
functions, table (3) percentage frequency of
knowledge level of supply chain functions, table
(4) perception towards supply chain workforce
capacity, table (5) Cronbach’s alpha test scores
and table (6) Chi square test.
The socio-demographic characteristics of the
respondents (Table 1) showed that the
respondents were drawn from all levels of the
health sector with predominant respondents from
national and state levels that drive supply chain
policy development and implementation. It also
entails stakeholders that have played key roles at
the different levels and acknowledged supply
chain as a key driver for successful HIV/AIDS
program implementation. This is essential for
development of competent and knowledgeable
workforce needed for health supply chain
success. The various stakeholders denote diverse
perspectives, expertise and capacity to enable
consensus, promoting national and local
ownership for a sustainable strategy to improve
HIV/AIDS supply chain performance. The
respondents have substantial experience with
good understanding of the supply chain
management needs of the HIV/AIDS program,
and can be trusted for reliable and valid results,
thus guaranteeing credence and quality of the
research outcomes. With more than half of the
respondents with master’s degree as their highest
educational qualification it shows that the
respondents have attained some level of skill
which can be enhanced to promote effective and
efficient supply chain functions. They have
workable knowledge of good supply chain
management. In the present study, the
respondents had received training in the key
supply chain functions (Table 2). This means that
the respondents used in this study have basic
background and knowledge required for their
position.
The study revealed good knowledge in some
supply chain functions (serving customers,
product selection, procurement, logistics
management information system and monitoring
and evaluation) and capacity gaps in risk
management, quantification, inventory strategy
and warehousing and distribution (Table 3) and
use of quantification results to inform
procurement of HIV/AIDS products within
government system at the national and state
levels (Table 4). This finding supports existing
body of knowledge; Matowe et al. (2008)
reported limited skills on quantification,
inventory strategy, ordering, receiving, storing
and distribution, and TGF (2017) reported that
supply chain management remains a significant
challenge and interventions by donors (The
Global Fund, PEPFAR, USAID, United Nations
Agencies etc.) only resulted to improvement in
procurement and getting the products into the
country but do not address the challenges of
quantification and getting the products to the
intended beneficiaries. Itiola and Agu (2018)
reported that requisite supply chain management
skills and competencies are inadequate in the
Nigeria public sector, whereas Matowe et al.
(2008) observed that the weakness of health
supply chains has remained a consistent barrier
across a range of low- and middle- income
countries. Therefore, effective supply chains are
vital to deliver essential health commodities
(Cometto et al., 2014) and weakness of supply
chain functions increases the potential for the
entry of counterfeit and substandard products
(WHO Bulletin, 2010). On the other hand,
Dowling (2011) reported that stock outs of
essential commodities are common in many low-
and middle-income countries, with a mean
availability of core medicines in the public sector
estimated between 38.2% in sub-Saharan Africa
and 57.7 % in Latin America and the Caribbean.
As a result of inadequate forecasting and
information flow among stakeholder’s stock outs
of ARV drugs are common among health
facilities in west and central Africa (UNICEF et
al., 2008). A similar situation has been noted in
east and southern Africa, where stock outs of
ARVs and other life-saving drugs have also been
a problem (Thom and Langa, 2010).
Notwithstanding past huge investment over
the past decades, national supply chains are often
unable to respond effectively to existing
demands, putting health outcomes at risk (Brown
et al., 2014). In a previous study, Waako et al.
(2009) reported inadequate human resources
capacity to select, quantify and distribute ARVs
and related commodities as some of the problems
in East African countries. Despite PEPFAR
efforts to improve the capacity of partner country
governments to quantify, forecast, procure,
97
warehouse, distribute, and track commodities,
challenges to assuring consistent and reliable
supply chain functioning remain in many
countries (IOM, 2013). Reliable supply chain is
critical for sustainable and cost-efficient
HIV/AIDS responses as well as to avoid
disruptions to the care and treatment of people
living with HIV/AIDS (IOM, 2013).
Furthermore, this study (Table 4) revealed that
skilled workforce is an important part of
functional HIV/AIDS system, contributes to
health systems strengthening and vital for
improving health outcomes and achieving health-
related Sustainable Development Goals. The
result of this study is consistent with reports of
previous studies (WHO, 2000; Leatherman et al.,
2010; Frenk, 2010; Schneider et al., 2011). It
follows that supply chain workforce capacity
should be developed to ensure availability of
skills to provide quality health services (Matovu
et al., 2013). Furthermore, for supply chains to
run effectively, it requires dynamic workforce
(which is the most important resource) at all
levels who are motivated and possess the
competencies required to fulfill essential supply
chain functions.
Similarly, the study showed that there is
shortage of manpower at the sub-national level
and the country’s current poor economic situation
may not allow for personnel recruitment in the
immediate future (Table 4). Supply chain
workforce capacity gaps have been reported in
low- and middle-income countries with some
having vacancy rates of about 71% for public
sector posts that would require accredited
pharmaceutical training (WHO, 2011), often due
to a combination of insufficient training as well
as 100-150% higher wages in the private sector
as compared to the public sector (Cometto et al.,
2014). There is a rising need to address human
resources capacity requirements for supply chain
systems (Cometto et al., 2014) and investments
in the health supply chain personnel will be
worthwhile and effective strategy to improve the
overall efficiency of health systems (Soucat and
Scheffler, 2013). More so, workforce crisis due to
brain drain poses enormous challenge in meeting
the manpower capacity needs in the healthcare
sector (Ike, 2007) and may hinder progress
towards country ownership and sustainability.
While there may be adequate capacity in the
private sector, available human resource in the
Nigerian public sector is inadequate and do not
have requisite supply chain skills and
competencies (Itiola and Agu, 2018). It is well-
known that the global problem of insufficient and
adequately trained human resources for health is
most critical in sub-Saharan Africa with alarming
health workforce crisis (Anywangwe and
Mtonga, 2007). In a previous work, Frenk (2010)
reported workforce shortage as the most complex
challenges of health systems strengthening.
Matovu et al. (2011) recognized workforce
shortage as significant constraint in achieving the
SDGs. Inadequate human resource for health is
an important global problem in Sub-Saharan
Africa (Anywangwe and Mtonga, 2007). In
another study, Adekola and Adelanwa (2014)
reported human resource crisis in all areas of the
health system and cadres including the
HIV/AIDS supply chain workforce in Nigeria.
A number of reasons have been provided for
the human resource shortage; chronic
underinvestment in human resources (IOM,
2011), frozen recruitment and salaries (IOM,
2011), restricted public budgets (IOM, 2011),
higher turnover of health workforce (IOM, 2011),
insufficient compensation (Oleribe et al., 2016),
harsh working conditions (Oleribe et al., 2016),
high burden of HIV and AIDS (Mazibuko et al.,
2014), increased numbers of patients needing
antiretroviral (ARV) services (Mazibuko et al.,
2014), migration to developed countries in search
of greener pastures (Waako et al., 2009; Itiola and
Agu, 2018), higher salaries within externally
funded projects, sometimes more than twice as
obtained in the public sector (Windisch et al.,
2011), motivation (Akinyemi and Atilola, 2013)
and uneven distribution of health workers
(Bangdiwala et al., 2010; Adeloye et al., 2017).
The problem of human resources skills
weakness in supply chain management in Nigeria
needs to be addressed to ensure country’s
progress towards sustainability. This is even
more imperative now with the declining donor
funding. PEPFAR’s contribution to health
workforces in partner countries has been directed
to more pre-service production. However, partner
countries continue to have huge need for health
workforce development and retention (IOM,
2013). Therefore, adherence by partner countries
to the Global Code of Practice on the
International Recruitment of Health Personnel
and follow through on commitments to the Abuja
Declaration could support both sustainability of
98
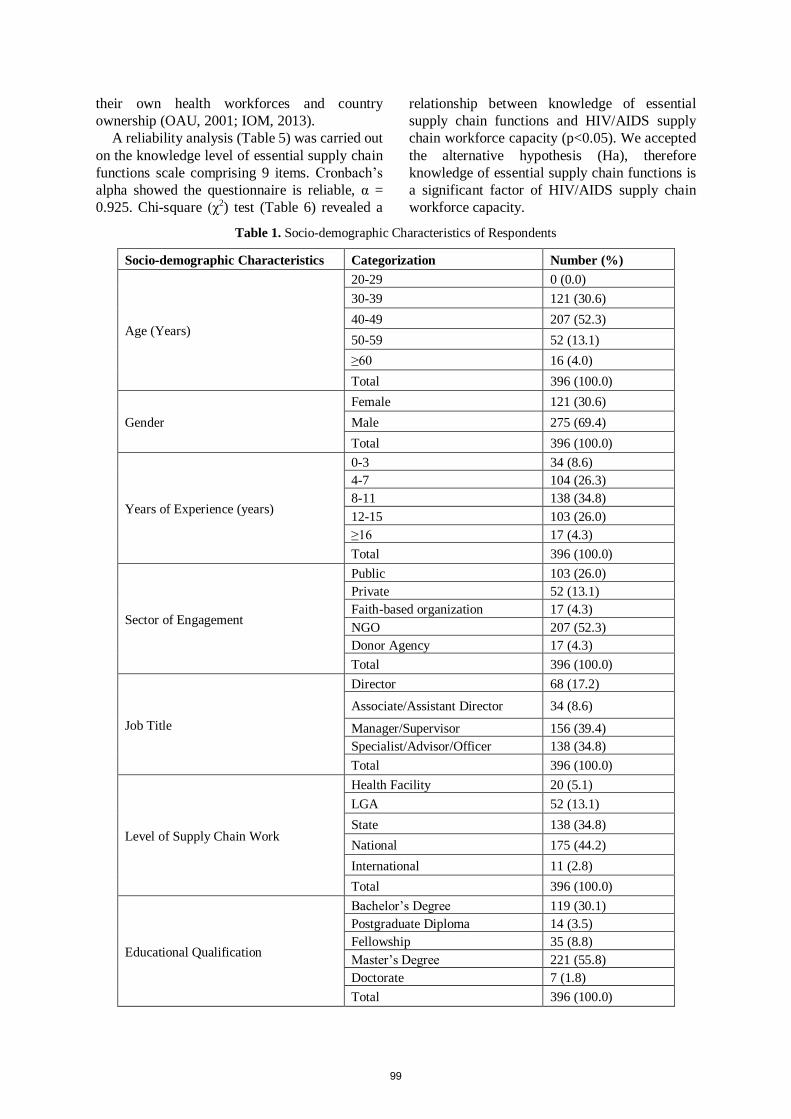
their own health workforces and country
ownership (OAU, 2001; IOM, 2013).
A reliability analysis (Table 5) was carried out
on the knowledge level of essential supply chain
functions scale comprising 9 items. Cronbach’s
alpha showed the questionnaire is reliable, α =
0.925. Chi-square (χ2) test (Table 6) revealed a
relationship between knowledge of essential
supply chain functions and HIV/AIDS supply
chain workforce capacity (p<0.05). We accepted
the alternative hypothesis (Ha), therefore
knowledge of essential supply chain functions is
a significant factor of HIV/AIDS supply chain
workforce capacity.
Table 1. Socio-demographic Characteristics of Respondents
Socio-demographic Characteristics Categorization Number (%)
Age (Years)
20-29 0 (0.0)
30-39 121 (30.6)
40-49 207 (52.3)
50-59 52 (13.1)
≥60 16 (4.0)
Total 396 (100.0)
Gender
Female 121 (30.6)
Male 275 (69.4)
Total 396 (100.0)
Years of Experience (years)
0-3 34 (8.6)
4-7 104 (26.3)
8-11 138 (34.8)
12-15 103 (26.0)
≥16 17 (4.3)
Total 396 (100.0)
Sector of Engagement
Public 103 (26.0)
Private 52 (13.1)
Faith-based organization 17 (4.3)
NGO 207 (52.3)
Donor Agency 17 (4.3)
Total 396 (100.0)
Job Title
Director 68 (17.2)
Associate/Assistant Director 34 (8.6)
Manager/Supervisor 156 (39.4)
Specialist/Advisor/Officer 138 (34.8)
Total 396 (100.0)
Level of Supply Chain Work
Health Facility 20 (5.1)
LGA 52 (13.1)
State 138 (34.8)
National 175 (44.2)
International 11 (2.8)
Total 396 (100.0)
Educational Qualification
Bachelor’s Degree 119 (30.1)
Postgraduate Diploma 14 (3.5)
Fellowship 35 (8.8)
Master’s Degree 221 (55.8)
Doctorate 7 (1.8)
Total 396 (100.0)
99
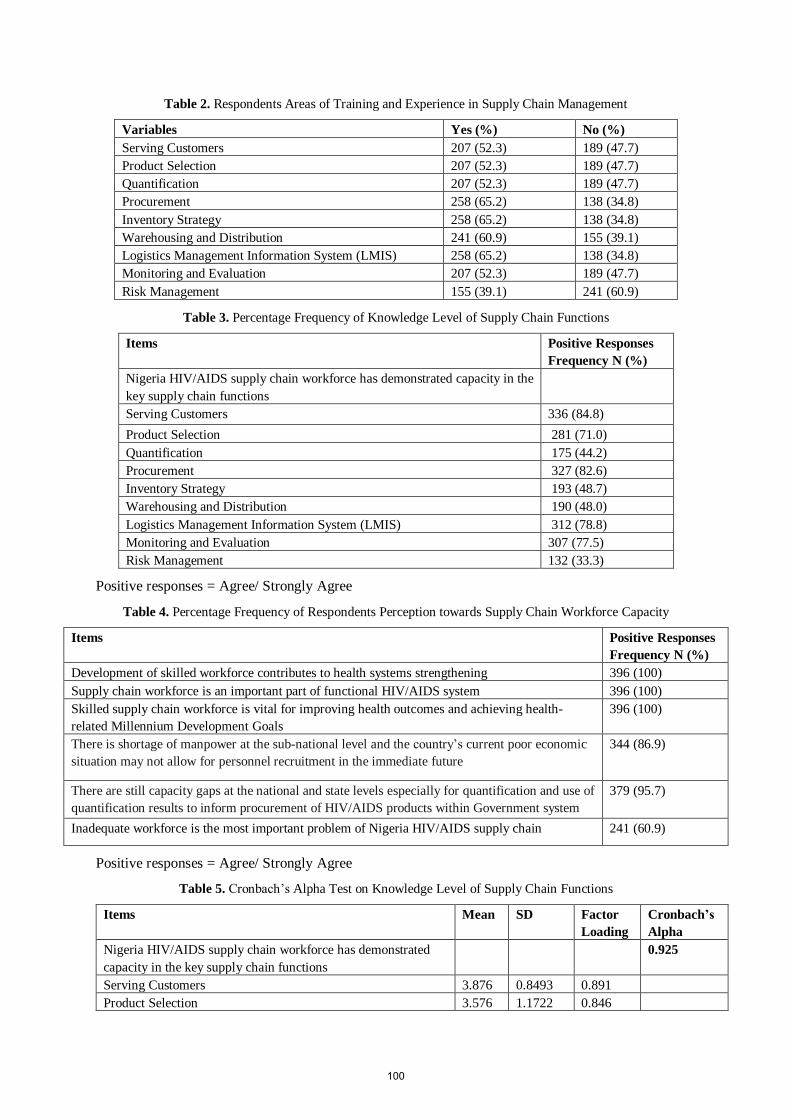
Table 2. Respondents Areas of Training and Experience in Supply Chain Management
Variables Yes (%) No (%)
Serving Customers 207 (52.3) 189 (47.7)
Product Selection 207 (52.3) 189 (47.7)
Quantification 207 (52.3) 189 (47.7)
Procurement 258 (65.2) 138 (34.8)
Inventory Strategy 258 (65.2) 138 (34.8)
Warehousing and Distribution 241 (60.9) 155 (39.1)
Logistics Management Information System (LMIS) 258 (65.2) 138 (34.8)
Monitoring and Evaluation 207 (52.3) 189 (47.7)
Risk Management 155 (39.1) 241 (60.9)
Table 3. Percentage Frequency of Knowledge Level of Supply Chain Functions
Items Positive Responses
Frequency N (%)
Nigeria HIV/AIDS supply chain workforce has demonstrated capacity in the
key supply chain functions
Serving Customers 336 (84.8)
Product Selection 281 (71.0)
Quantification 175 (44.2)
Procurement 327 (82.6)
Inventory Strategy 193 (48.7)
Warehousing and Distribution 190 (48.0)
Logistics Management Information System (LMIS) 312 (78.8)
Monitoring and Evaluation 307 (77.5)
Risk Management 132 (33.3)
Positive responses = Agree/ Strongly Agree
Table 4. Percentage Frequency of Respondents Perception towards Supply Chain Workforce Capacity
Items Positive Responses
Frequency N (%)
Development of skilled workforce contributes to health systems strengthening 396 (100)
Supply chain workforce is an important part of functional HIV/AIDS system 396 (100)
Skilled supply chain workforce is vital for improving health outcomes and achieving health-
related Millennium Development Goals
396 (100)
There is shortage of manpower at the sub-national level and the country’s current poor economic
situation may not allow for personnel recruitment in the immediate future
344 (86.9)
There are still capacity gaps at the national and state levels especially for quantification and use of
quantification results to inform procurement of HIV/AIDS products within Government system
379 (95.7)
Inadequate workforce is the most important problem of Nigeria HIV/AIDS supply chain 241 (60.9)
Positive responses = Agree/ Strongly Agree
Table 5. Cronbach’s Alpha Test on Knowledge Level of Supply Chain Functions
Items Mean SD Factor
Loading
Cronbach’s
Alpha
Nigeria HIV/AIDS supply chain workforce has demonstrated
capacity in the key supply chain functions
0.925
Serving Customers 3.876 0.8493 0.891
Product Selection 3.576 1.1722 0.846
100
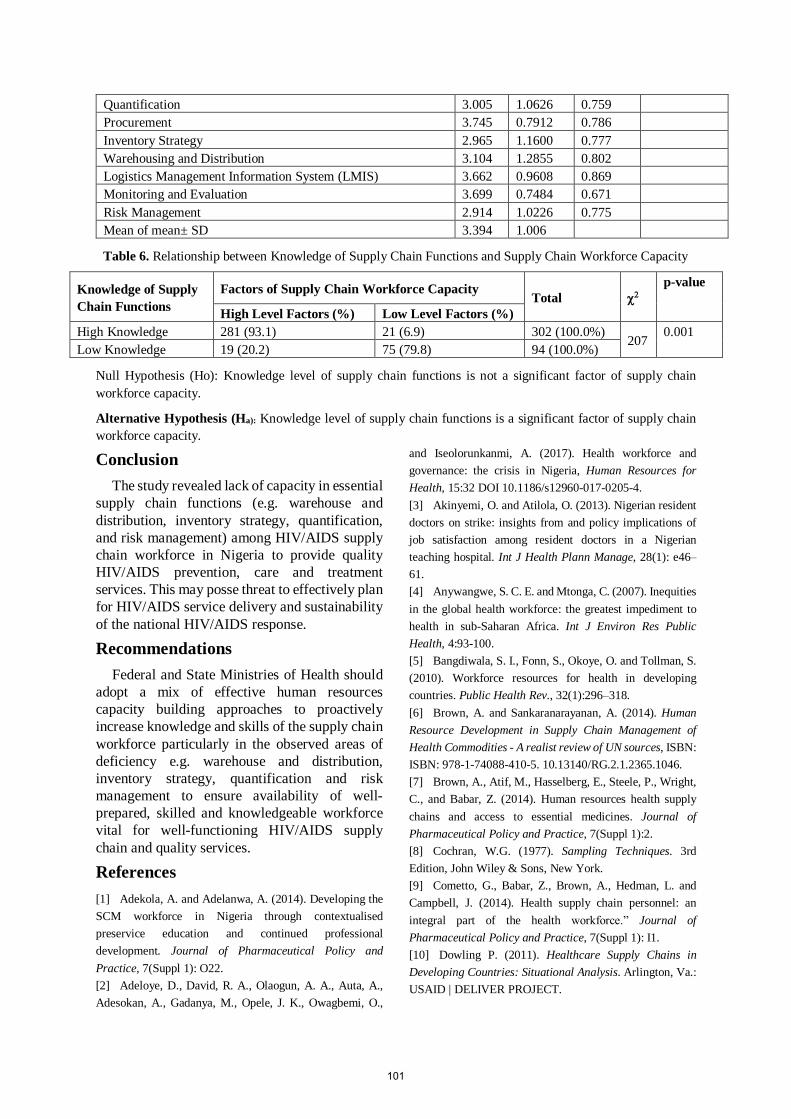
Quantification 3.005 1.0626 0.759
Procurement 3.745 0.7912 0.786
Inventory Strategy 2.965 1.1600 0.777
Warehousing and Distribution 3.104 1.2855 0.802
Logistics Management Information System (LMIS) 3.662 0.9608 0.869
Monitoring and Evaluation 3.699 0.7484 0.671
Risk Management 2.914 1.0226 0.775
Mean of mean± SD 3.394 1.006
Table 6. Relationship between Knowledge of Supply Chain Functions and Supply Chain Workforce Capacity
Knowledge of Supply
Chain Functions
Factors of Supply Chain Workforce Capacity Total
p-value
High Level Factors (%) Low Level Factors (%)
High Knowledge 281 (93.1) 21 (6.9) 302 (100.0%) 207
0.001
Low Knowledge 19 (20.2) 75 (79.8) 94 (100.0%)
Null Hypothesis (Ho): Knowledge level of supply chain functions is not a significant factor of supply chain
workforce capacity.
Alternative Hypothesis (Ha): Knowledge level of supply chain functions is a significant factor of supply chain
workforce capacity.
Conclusion
The study revealed lack of capacity in essential
supply chain functions (e.g. warehouse and
distribution, inventory strategy, quantification,
and risk management) among HIV/AIDS supply
chain workforce in Nigeria to provide quality
HIV/AIDS prevention, care and treatment
services. This may posse threat to effectively plan
for HIV/AIDS service delivery and sustainability
of the national HIV/AIDS response.
Recommendations
Federal and State Ministries of Health should
adopt a mix of effective human resources
capacity building approaches to proactively
increase knowledge and skills of the supply chain
workforce particularly in the observed areas of
deficiency e.g. warehouse and distribution,
inventory strategy, quantification and risk
management to ensure availability of well-
prepared, skilled and knowledgeable workforce
vital for well-functioning HIV/AIDS supply
chain and quality services.
References
[1] Adekola, A. and Adelanwa, A. (2014). Developing the
SCM workforce in Nigeria through contextualised
preservice education and continued professional
development. Journal of Pharmaceutical Policy and
Practice, 7(Suppl 1): O22.
[2] Adeloye, D., David, R. A., Olaogun, A. A., Auta, A.,
Adesokan, A., Gadanya, M., Opele, J. K., Owagbemi, O.,
and Iseolorunkanmi, A. (2017). Health workforce and
governance: the crisis in Nigeria, Human Resources for
Health, 15:32 DOI 10.1186/s12960-017-0205-4.
[3] Akinyemi, O. and Atilola, O. (2013). Nigerian resident
doctors on strike: insights from and policy implications of
job satisfaction among resident doctors in a Nigerian
teaching hospital. Int J Health Plann Manage, 28(1): e46–
61.
[4] Anywangwe, S. C. E. and Mtonga, C. (2007). Inequities
in the global health workforce: the greatest impediment to
health in sub-Saharan Africa. Int J Environ Res Public
Health, 4:93-100.
[5] Bangdiwala, S. I., Fonn, S., Okoye, O. and Tollman, S.
(2010). Workforce resources for health in developing
countries. Public Health Rev., 32(1):296–318.
[6] Brown, A. and Sankaranarayanan, A. (2014). Human
Resource Development in Supply Chain Management of
Health Commodities - A realist review of UN sources, ISBN:
ISBN: 978-1-74088-410-5. 10.13140/RG.2.1.2365.1046.
[7] Brown, A., Atif, M., Hasselberg, E., Steele, P., Wright,
C., and Babar, Z. (2014). Human resources health supply
chains and access to essential medicines. Journal of
Pharmaceutical Policy and Practice, 7(Suppl 1):2.
[8] Cochran, W.G. (1977). Sampling Techniques. 3rd
Edition, John Wiley & Sons, New York.
[9] Cometto, G., Babar, Z., Brown, A., Hedman, L. and
Campbell, J. (2014). Health supply chain personnel: an
integral part of the health workforce.” Journal of
Pharmaceutical Policy and Practice, 7(Suppl 1): I1.
[10] Dowling P. (2011). Healthcare Supply Chains in
Developing Countries: Situational Analysis. Arlington, Va.:
USAID | DELIVER PROJECT.
101
[11] Ebele, F.U., Aregbosola, B.G., Hasstrup, D.T. and
Adams, E. (2014). The Effect of Climate Change on
Agricultural Production among Farmers in Kwali Area
Council of Federal Capital Territory of Nigeria. Advances in
Social Sciences Research Journal, 1(2):13-26.
[12] Fowkes, F. J. I., Draper, B. I., Hellard, M. and Stoové,
M. (2016). Achieving development goals for HIV,
tuberculosis and malaria in sub-Saharan Africa through
integrated antenatal care: barriers and challenges, BMC
Medicine, 14:202 DOI 10.1186/s12916-016-0753-9.
[13] Frenk, J. (2010). The Global Health System:
Strengthening National Health Systems as the Next Step for
Global Progress. PLoS Med, 7(1): e1000089. doi:
10.1371/journal.pmed.1000089.
[14] Ike, S. O. (2007). The health workforce crisis: the
brain drain scourge. Niger J Med., 16:204–211.
[15] IOM (Institute of Medicine). (2011). Preparing for the
Future of HIV/ AIDS in Africa: A Shared Responsibility.
Washington, DC: The National Academies Press.
[16] IOM (Institute of Medicine). (2013). Evaluation of
PEPFAR. Washington, DC: The National Academies Press.
[17] Itiola, A. J., and Agu, K. A. (2018). Country
ownership and sustainability of Nigeria’s HIV/AIDS Supply
Chain System: qualitative perceptions of progress,
challenges and prospects. Journal of Pharmaceutical Policy
and Practice, 11:21 https://doi.org/10.1186/s40545-018-
0148-8.
[18] Leatherman, S., Ferris, T. G., Berwick, D., Omaswa,
F. and Crisp, N. (2010). The role of quality improvement in
strengthening health systems in developing countries. Int J
Qual Health Care, 22(4): 237–243
[19] Matovu, J. K. B., Rhoda, K., Wanyenze, Susan
Mawemuko, Gakenia Wamuyu-Maina, William Bazeyo,
Olico-Okui and David Serwadda. (2011). Building capacity
for HIV/AIDS program leadership and management in
Uganda through mentored Fellowships. Glob Health Action,
4:5815. doi:10.3402/gha.v4i0.5815.
[20] Matovu, J. K. B., Rhoda, K., Wanyenze, Susan
Mawemuko, Olico Okui, William Bazeyo and David
Serwadda (2013). Strengthening health workforce capacity
through work-based training; BMC International Health and
Human Rights, 13:8.
[21] Matowe, L., Waako, P., Odoi-adome, R., Kibwage, I.,
Minzi, O. and Bienvenu, E. (2008). A strategy to improve
skills in pharmaceutical supply management in East Africa:
the regional technical resource collaboration for
pharmaceutical management. Human Resources for Health,
6:30. doi:10.1186/1478-4491-6-30.
[22] Mazibuko, G. N., Sagwa, E., Kagoya, H. R., Kibuule,
D., Rennie, T., Mavere, T., Ghoneim, R., Mabirizi, D.,
Naikaku, E., Niaz, Q. and Lates, J. (2014). Incorporating
pharmaceutical supply management modules in the
preservice curriculum of the BPharm program, of the
University of Namibia, School of Pharmacy, Journal of
Pharmaceutical Policy and Practice, 7(Suppl 1): P12.
[23] OAU (Organization of African Unity). (2001). Abuja
Declaration on HIV/AIDS, tuberculosis and other related
infectious diseases. Presented at African Summit on
HIV/AIDS, Tuberculosis and Other Related Infectious
Diseases, Abuja, Nigeria.
[24] Oleribe, O. O., Ezieme, I. P., Oladipo, O., Akinola, E.
P., Udofia, D., Taylor-Robinson, S. D. (2016). Industrial
action by healthcare workers in Nigeria in 2013-2015: an
inquiry into causes, consequences and control-a cross-
sectional descriptive study. Hum Resour Health, 14(1):46.
doi: 10.1186/s12960-016-0142-7.
[25] Schneider, D., Evering-Watley, M., Walke, H.,
Bloland, P. B. (2011). Training the Global Public Health
Workforce through Applied Epidemiology Training
Programs: CDC’s Experience, 1951–2011. Public Health
Rev, 33:190–203.
[26] Soucat A, and Scheffler R. (2013). The Labor Market
for Health Workers in Africa: New Look at the Crisis.
Washington, DC: World Bank.
[27] TGF (The Global Fund). (2017). Audit Report: The
Global Fund’s In-country Supply Chain Processes, GF-
OIG-17-008 Geneva, Switzerland.
[28] Thom, A., and Langa, L. (2010). South Africa:
Provinces face drug stock outs due to overspending. The
Pharma Letter, Putney London SW151SP.
http://allafrica.com/stories/201004090010.html (accessed
October 29, 2019).
[29] UNICEF, WHO, and ESTHER. (2008). Evaluation of
ARV procurement and supply management systems in west
and central Africa region. Dakar, Senegal.
[30] UNICEF. (2014). Supply Annual Report 2013.
UNICEF Supply Division, Copenhagen, Denmark.
[31] Waako, P., Odoi, R.., Obua, C., Owino, E.,
Tumwikirize, W., Ogwal-Okeng, J., Anokbonggo, W.,
Matowe, L., and Aupont, O. (2009). Existing capacity to
manage pharmaceuticals and related commodities in East
Africa: An assessment with specific reference to
antiretroviral therapy, Human Resources for Health 7(1):21
DOI: 10.1186/1478-4491-7-21.
[32] WHO. (2000). World Health Report 2000 Health
systems: improving performance. Geneva, Switzerland.
[33] WHO. (2010). Growing threat from counterfeit
medicines. Bulletin, 88(4):241-320.
[34] WHO. (2011). Tackling the crisis of workforce
shortages in the pharmaceutical sector. Geneva,
Switzerland.
[35] Windisch, R., Waiswa, P., Neuhann, F., Scheibe, F.
and Savigny, D. (2011). Scaling up antiretroviral therapy in
Uganda: using supply chain management to appraise health
systems strengthening. Globalization and Health, 7:25.
102
Texila International Journal of Academic research
ISSN: 2520-3088
DOI: 10.21522/TIJAR.2014.07.02.Art012
Assessment of Practices and Awareness of Safety Measures of Biomedical Wastes Management among Health Workers in Metropolitan Hospitals in Abuja,
Nigeria
Edith C Okechukwu1*, Azuka C Oparah2, Sunday O Aguora3
1, 3School of Public Health, Texila American University, Georgetown, Guyana, South America
2Department of Pharmacy and Pharmacy Practice, Faculty of Pharmacy, University of Benin, Benin City, Nigeria
*Corresponding Author: [email protected]
Abstract
Effective and efficient biomedical wastes management is vital in the health care delivery system. Safe
environment and public health could possibly be achieved through the standard practices of biomedical
wastes procedures with safety measures in place. The aim of this study is to evaluate the practices and
awareness of safety measures among health workers towards biomedical wastes management in
selected hospitals in Abuja, Nigeria. Data were collected by structured questionnaire and on- the-spot
observation. Three private and three public hospitals that provides health care services in Abuja were
surveyed. Descriptive and inferential statistical analysis were used in the analysis of the data. Chi-
square (χ2) test was used to determine the level of significance set at p ≤ 0.05. The male health workers
were 220 (55.00%) and the female were 180 (45.00%) in the survey. The Nurses were the highest
respondents in the study with percentage frequency of 117(28.75%) followed by the Laboratory
Scientists 96 (24.00%), Pharmacists 71 (17.75%), Doctors 64(16.00%) and other health care workers
54 (13.50%). The practices of handling biomedical waste among health workers is a significant factor
of biomedical wastes management (p<0.05). Also, the awareness on safety measures among health
workers is a significant factor of biomedical wastes management (p<0.05). The study revealed that
there are gaps in the standard practices of handling biomedical wastes such as transportation from
point of generation, treatment, temporal storage and disposal, whereas awareness of safety measures
and practices is appreciable. Training of health workers on standard practices of handling biomedical
wastes is crucial in achieving efficient biomedical wastes management in the hospitals. Government
should be involved in the policy making and ensure the enforcement of strict compliance in accordance
with WHO stipulations.
Keywords: Safety measures, environment, public health, biomedical wastes, health workers.
Introduction
The proliferation of hospitals mostly in the
urbanized locations in Nigeria, population surge
and use of hospitals (Chima et al., 2011; Chima
et al., 2014; Useh et al., 2018), largely
contributes to the total wastes stream of various
categories that could become a daunting task for
handling, storage, treatment and disposal of
biomedical wastes.
In developing nations, poor management of
biomedical wastes is usually encountered which
are attributable to lack of awareness on the public
health implication, non-participation of
government and ineffective legislation (Derres et
al., 2018). This suggests improper handling of
waste during generation, collection,
inappropriate storage methods, treatment,
transport, lack of personal protective equipment,
untrained personnel and unsafe disposal options
(Chima et al., 2014).
Effective and efficient biomedical wastes
management should be paramount in any
functional health care delivery system. The
World Health Organization have designed a
biomedical waste management guideline to
ensure safe management of these wastes
generated from health care activities (Derres et
al., 2018). Vital steps are involved in the
appropriate biomedical wastes management
process which are listed as follows: segregation,
transportation, treatment, storage, disposal
103
including minimization and reuse (Rao et al.,
2004). The process can involve a number of
intermediary stages (Ola-Adiza et al., 2015).
The belief that it is the sole responsibility of
the government to manage biomedical and
general wastes has made waste generators (health
workers) to neglect their primary duty of proper
handling of biomedical wastes and barely think of
the adverse effects of improper biomedical
wastes management. The international policy
states that the generator of waste is responsible
for the proper handling, treatment and disposal of
wastes and has only been theoretical (Ngwuluka
et al., 2009). Obviously, there exist a missing link
among the policymakers, regulators and health
care establishments on establishing laws,
enforcement and implementation of effective and
efficient biochemical wastes management in the
health care institutions. Comparative information
on the practices of handling and awareness of
safety measures of biomedical wastes
management are scanty especially in hospitals
located in the urban areas in Nigeria. Hence, the
aim of the study is to assess the practices of
handling and awareness on safety measures of
biomedical wastes management among health
workers in public and private hospitals in Abuja.
Materials and Methods
Selection of the area
The study was carried out in Abuja the Federal
Capital Territory of Nigeria. Abuja is divided into
six Area Councils of which Abuja Municipal
Area Council, a densely populated area because
of the administrative seat of government and
commercial activities. According to United
Nation Fund for Population Activities, UNFPA
(2015), Federal Capital Territory is estimated to
have a population of 3,324,000 people. The
municipal has many private and public (district)
hospitals to serve the increasing population.
Sample size determination
The researcher used Cochran’s formula
(n0=z2pq/e2) for calculating sample size when the
population is infinite (Glenn, 1992).
Where:
n0 = sample size
z = selected critical value of desired
confidence level
p = estimated proportion of an attribute that is
present in the population
q = 1- p
e = desired level of precision taking 95%
confidence level with ±5% precision, the
calculation for required sample size was
calculated as follows:
p = 0.5; hence q =1-0.5 = 0.5; e = 0.05; z =1.96
n0 = z2pq/e2
n0 = (1.96)2(0.5) (0.5)/ (0.05)2
n0 = 384.16
Therefore; n0 = 384 (minimum sample size for
this study)
An overage of (12%) of 384 was added to the
sample size to offset for the reasons of non-
response, incomplete response and late response
in order to have the acceptable minimum
response size for the study.
Sampling technique
Six (6) hospitals were selected for the study,
using random sampling method. The hospitals
were stratified into two groups; private and public
based on the ownership and management of the
hospitals and were lettered alphabetically to
ensure anonymity and confidentiality.
Data collection
Structured self-administered and self-
completed questionnaires were used to collect the
data. Consent forms were filled by the
participants to obtain their consent to participate
in the study. Participation was voluntary and
participants were free to withdraw at any time.
Confidentiality was assured by excluding all the
names of the hospital surveyed and respondents.
Data analysis
Statistical Package for Social Sciences (SPSS
version 20.0) was used for the analysis of the
data. Chi-Square statistical test of significance
was used to determine the level of significance of
association. Level of significance difference was
set at p ≤ 0.05.
Results and Discussion
Table 1 shows the socio-demographic factors
of the health workers across the six metropolitan
hospitals in Abuja. The male health workers were
220 (55.00%) and the female were 180 (45.00%).
The Nurses were the highest respondents with
percentage frequency of 117 (28.75%) followed
by the Laboratory Scientists 96 (24.00%),
Pharmacists 71 (17.75%), Doctors 64 (16.00%)
and other health care workers 54 (13.50%). The
result of the study is similar to the reports of
104
Deress et al. (2018) in Ethiopia, Imam et al.
(2019) in Kano, Nigeria though confined to
surgical theatres as the male respondents and
nurses were predominant. The Nurses are one of
the indispensable health professionals in the
health care institutions and are basically involved
in most of the generation and segregation of
health care wastes. Contrastingly, Awodele et al.
(2016) in Lagos reported that the majority were
domestic workers followed by Nurses and female
respondents. The variation in the health
professionals could be attributed to method of
sampling techniques, location of the health
facility and availability of the health
professionals during the study.
The practices of handling biomedical wastes as
shown in Table 2, the result showed that all the
respondents agreed that proper biomedical wastes
treatment leads to a reduction in volume of
infectious wastes and reduces the risk of
transmission of diseases, that treatment of
biomedical wastes enhances the safe
transportation of biomedical wastes to the
disposal site and minimizes transmission of
diseases. Almost all the respondents agreed that
the practices of segregation of infectious wastes
at the source of generation is prime indicator to
achieving a sound biomedical wastes
management. Over half of the total respondents
agreed that intensive training and retraining of
health workers on the effective waste
management activities are performed. Previous
studies showed an increased awareness and
knowledge of segregation (Chima et al., 2014;
Awodele et al., 2016; Uchechukwu et al., 2017).
The finding in the study is consistent with the
study conducted in selected health care
establishments at Lagos and Abuja that revealed
majority of health workers especially in Lagos
have received training, segregation is practiced in
both locations but treatment of biomedical wastes
is still lacking in both locations (Dunloye et al.,
2018). On the other hand, the findings in the
study differs from Ola- Adisa et al. (2015) that
reported in a study carried out in 30 health care
establishments in Jos North, Plateau state showed
that the practice of segregation was poor among
the health workers, majority of the health workers
were barely trained and disposal of biomedical
wastes were unprotected and obsolete methods
such as burial and incineration were practised.
Another study conducted in hospitals in India,
revealed unsatisfactory segregation practices,
health workers lacked the awareness, training and
poor treatment of biomedical wastes in hospitals
(Rhada et al., 2009). Lack of biomedical wastes
management policies in hospital and
unpreparedness to tackle the issues could be
attributable to the lack of awareness on proper
practices of biomedical wastes management.
The Standard Operating Procedure designed
for biomedical wastes management process is
shown in Table 3. Over three quarter of the
respondents agreed to practicing standard
operating procedure (SOP) designed for
segregation in the hospital. Over half of the
respondents agreed to practicing standard
operating procedure (SOP) designed for storage
in the hospital. The finding in the study revealed
that the respondents had the understanding of
identification and separation of the different types
of biomedical wastes which reflected in the
practices of segregation. All the hospitals
surveyed practiced segregation of sharps, as the
sharps were mostly segregated into sharp boxes
and most especially the public hospitals made
efforts to use colour coded bins, containers or
liners. This is in conformity with the findings of
Awodele et al. (2016) in Lagos, where majority
of the respondents’ practised segregation using
colour-code. This shows that the health workers
have realized the importance of segregation in the
management of biomedical wastes. The
awareness and availability of SOP guidelines and
posters at the various service areas in the
hospitals such as diagnostic laboratories, in-
patients’ wards, operating theatres and pharmacy
could attribute to the high level of compliance to
the segregation practices in the hospitals as
observed.
Segregation is carried out at the point of
generation but later mixed with general wastes
during collection for final disposal (Debere et
al.,2013; Yelebe et al., 2015) in (Ethiopia and
Nigeria) respectively. Udofia et al. (2015)
reported that about (53.00%) of studies revealed
that segregation was practised, only (18.00%) of
the studies showed compliance to the use of
colour coded bins. Although in some instances
black nylon bags were used to collect and store
medical wastes, which could cause blind mix up
of infectious and non-infectious wastes.
The result showed that over three-quarter of
the health workers practised the standard
operating procedure of segregation, disposal,
labelling and treatment. The result of the study
105
revealed that in most of the hospitals biomedical
wastes were mostly carried manually by the
cleaners and hospital attendants to the temporary
storage sites as trolleys were occasionally used.
This is consistent with the reports of Abah and
Ohimain (2011), Muluken et al. (2013) where
medical wastes receptacles were manually lifted
by hospital cleaners, wastes handlers and
auxiliary staff.
Though over half of the total respondents
showed the practice of standard storage
procedure but the observation further revealed
that the temporary storage/disposal sites were in
an open space not secured and unprotected areas
from neither the sun nor rain. This is in
conformity with the report of (Ndiaye et al.,
2012).
The wastes are found tied in bags dumped in
the metal bins and most times the bins are filled
to the brim such that the wastes drop and litter
around the disposal site. This indicates that the
wastes are not promptly lifted away for final
disposal. The delay of the disposal from the
hospital premises could pose environmental risk
such as air pollution and presence of disease
transmitting rodents. The distance of the
temporary storage site is less than 10m from the
busy side of the hospital which could portend
health risks to humans. This finding is
comparable with the study carried out in Owerri,
where temporary disposal site was not more than
10m from the hospital facilities (Chima et al.,
2014).
Table 4, shows the methods of biomedical
waste treatment to ensure safe disposal. The
result of the study showed that all the respondents
were aware and practised disinfection, well over
half of the respondents agreed to the practice of
autoclaving as a biomedical wastes treatment
before disposal. About three-quarter of the
respondents did not practise microwaving and
shredding. The result shows that the majority of
the respondents practised chemical disinfection
of some categories of infectious wastes generated
from diagnostic laboratories and operating
theatres. Over half of the total respondents
practised autoclaving especially of medical
wastes generated from the diagnostic laboratories
prior to the temporary disposal. The treated
medical wastes by these methods could ensure
safe transportation of medical wastes from point
of generation to the disposal sites. Majority of the
respondents do not have adequate knowledge nor
practise the method of microwaving and
shredding. Abah and Ohimain (2011) reported
that autoclaving was practised in the hospitals
surveyed. Chima et al. (2015) reported that about
half of the respondents practised chemical
disinfection. Contrastingly, commonly used
methods of treatment for medical wastes in
developed countries are steam sterilization,
autoclaving and incineration with air pollution
control equipment (APC) (Patwary et al., 2011).
The disposal procedures of biomedical wastes
in hospitals is shown in Table 5. The result of the
study showed that over three-quarter of the total
respondents agreed to burning pit and
incineration practices and less than a quarter of
the total respondents agreed to landfill and
recycling disposal method. Furthermore, the
results showed that most biomedical wastes are
transported occasionally in closed compaction
vehicles to designated burning pits. The
incineration method employed in hospitals were
dysfunctional without air pollution control (APC)
equipment (Udofia et al., 2015). The finding in
the study is similar to the reports of Chima et al.
(2015) where over three-quarter of the
respondents were aware of the methods of
burning pits. The finding in the study is consistent
with the reports by Abah and Ohimain (2011),
Uchechukwu et al. (2017) and Denloye et al.
(2018) where most health care facilities in
Nigeria practise open dumpsite and periodical
burning of biomedical wastes. The disposal
procedures were further ranked to know the
commonly practiced disposal method of
biomedical wastes in the hospitals. Burning pit
ranked first of the disposal methods while
incineration ranked second of the disposal
method practiced in the hospitals.
Table 6, shows the awareness of safety
measures by health workers where all the
respondents were aware of the need to comply
with safety measures. The result showed
adequate knowledge of the need for safety
measures in handling biomedical wastes that will
lead to proper attitude and practice in order to
achieve safe environment for health workers,
hospitals visitors and the general public.
Protective devices for handling biomedical
wastes is shown in Table 7.
All of the 400 (100.00%) respondents agreed
to the use of gloves, face masks, apron and safety
boots. Also, most of the respondents agreed to the
use of google.
106
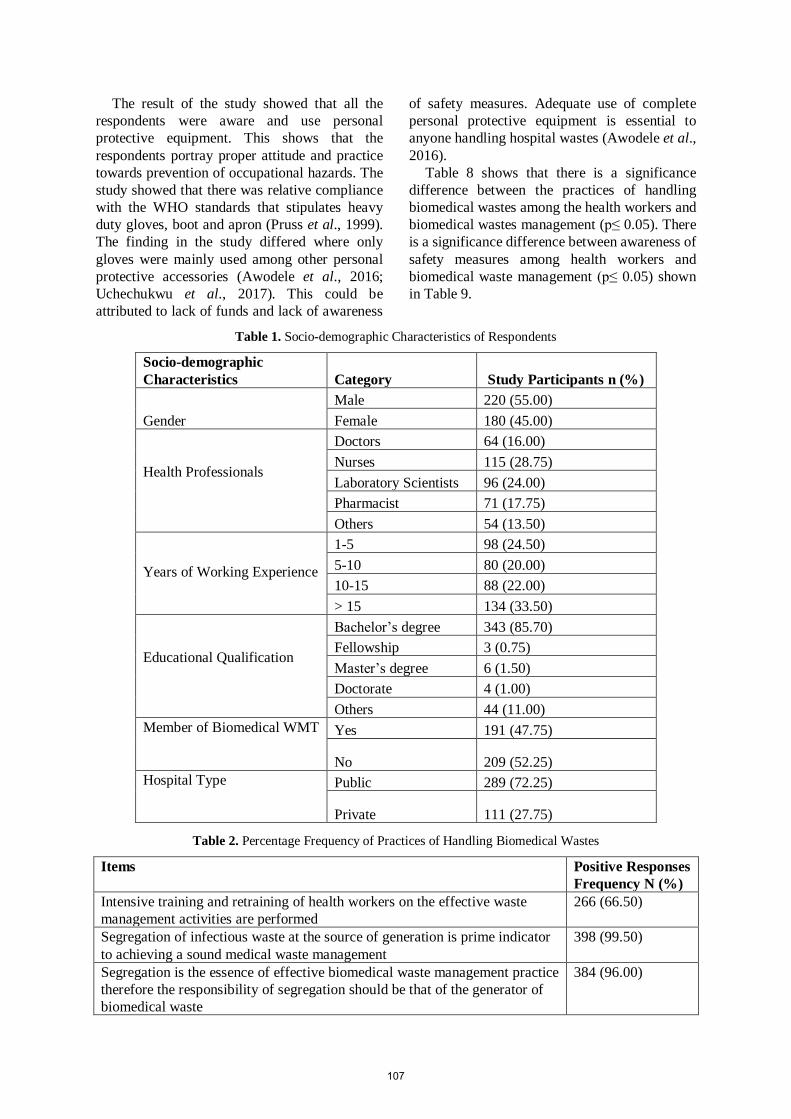
The result of the study showed that all the
respondents were aware and use personal
protective equipment. This shows that the
respondents portray proper attitude and practice
towards prevention of occupational hazards. The
study showed that there was relative compliance
with the WHO standards that stipulates heavy
duty gloves, boot and apron (Pruss et al., 1999).
The finding in the study differed where only
gloves were mainly used among other personal
protective accessories (Awodele et al., 2016;
Uchechukwu et al., 2017). This could be
attributed to lack of funds and lack of awareness
of safety measures. Adequate use of complete
personal protective equipment is essential to
anyone handling hospital wastes (Awodele et al.,
2016).
Table 8 shows that there is a significance
difference between the practices of handling
biomedical wastes among the health workers and
biomedical wastes management (p≤ 0.05). There
is a significance difference between awareness of
safety measures among health workers and
biomedical waste management (p≤ 0.05) shown
in Table 9.
Table 1. Socio-demographic Characteristics of Respondents
Socio-demographic
Characteristics Category Study Participants n (%)
Gender
Male 220 (55.00)
Female 180 (45.00)
Health Professionals
Doctors 64 (16.00)
Nurses 115 (28.75)
Laboratory Scientists 96 (24.00)
Pharmacist 71 (17.75)
Others 54 (13.50)
Years of Working Experience
1-5 98 (24.50)
5-10 80 (20.00)
10-15 88 (22.00)
> 15 134 (33.50)
Educational Qualification
Bachelor’s degree 343 (85.70)
Fellowship 3 (0.75)
Master’s degree 6 (1.50)
Doctorate 4 (1.00)
Others 44 (11.00)
Member of Biomedical WMT
Yes 191 (47.75)
No 209 (52.25)
Hospital Type
Public 289 (72.25)
Private 111 (27.75)
Table 2. Percentage Frequency of Practices of Handling Biomedical Wastes
Items Positive Responses
Frequency N (%)
Intensive training and retraining of health workers on the effective waste
management activities are performed
266 (66.50)
Segregation of infectious waste at the source of generation is prime indicator
to achieving a sound medical waste management
398 (99.50)
Segregation is the essence of effective biomedical waste management practice
therefore the responsibility of segregation should be that of the generator of
biomedical waste
384 (96.00)
107
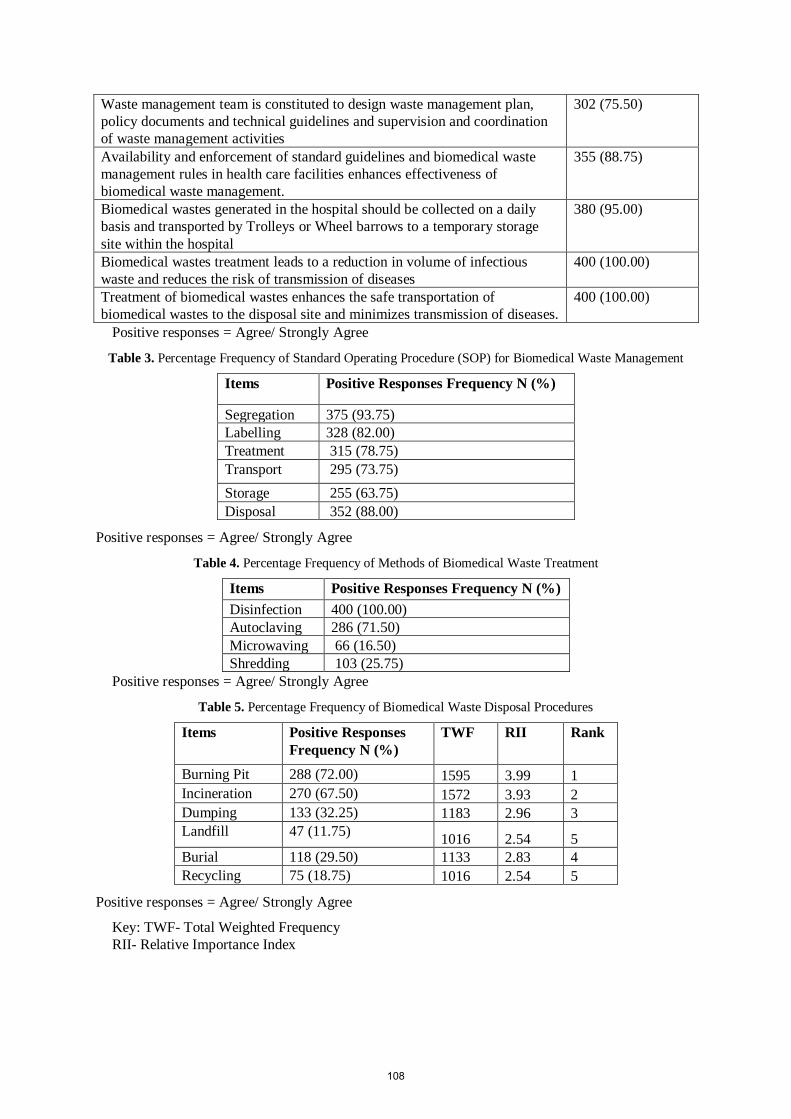
Waste management team is constituted to design waste management plan,
policy documents and technical guidelines and supervision and coordination
of waste management activities
302 (75.50)
Availability and enforcement of standard guidelines and biomedical waste
management rules in health care facilities enhances effectiveness of
biomedical waste management.
355 (88.75)
Biomedical wastes generated in the hospital should be collected on a daily
basis and transported by Trolleys or Wheel barrows to a temporary storage
site within the hospital
380 (95.00)
Biomedical wastes treatment leads to a reduction in volume of infectious
waste and reduces the risk of transmission of diseases
400 (100.00)
Treatment of biomedical wastes enhances the safe transportation of
biomedical wastes to the disposal site and minimizes transmission of diseases.
400 (100.00)
Positive responses = Agree/ Strongly Agree
Table 3. Percentage Frequency of Standard Operating Procedure (SOP) for Biomedical Waste Management
Items Positive Responses Frequency N (%)
Segregation 375 (93.75)
Labelling 328 (82.00)
Treatment 315 (78.75)
Transport 295 (73.75)
Storage 255 (63.75)
Disposal 352 (88.00)
Positive responses = Agree/ Strongly Agree
Table 4. Percentage Frequency of Methods of Biomedical Waste Treatment
Items Positive Responses Frequency N (%)
Disinfection 400 (100.00)
Autoclaving 286 (71.50)
Microwaving 66 (16.50)
Shredding 103 (25.75)
Positive responses = Agree/ Strongly Agree
Table 5. Percentage Frequency of Biomedical Waste Disposal Procedures
Items Positive Responses
Frequency N (%)
TWF RII Rank
Burning Pit 288 (72.00) 1595 3.99 1
Incineration 270 (67.50) 1572 3.93 2
Dumping 133 (32.25) 1183 2.96 3
Landfill 47 (11.75) 1016 2.54 5
Burial 118 (29.50) 1133 2.83 4
Recycling 75 (18.75) 1016 2.54 5
Positive responses = Agree/ Strongly Agree
Key: TWF- Total Weighted Frequency
RII- Relative Importance Index
108

Table 6. Percentage Frequency of Awareness of Safety Measures among Health Workers
Items Positive Responses
Frequency N (%)
There is need for compliance with standard biomedical waste rules and
regulations for improved waste management in the hospital
Regular monitoring and evaluation of hospital waste management practices and
the performance of the systems periodically enhances safe handling and disposal
400 (100.00)
400 (100.00)
There is need to educate and equip especially the on-site biomedical waste
workers on the use of complete personal protective to prevent accidental injury
by sharps
400 (100.00)
Protective accessories are important to minimize the risk of exposure to
nosocomial infection among health workers
395 (98.75)
Trainings will improve safe handling and disposal of biomedical waste 400 (100.00)
Positive responses = Agree/ Strongly Agree
Table 7. Percentage Frequency of Protective Devices for Handling Biomedical Waste to minimize Occupational
Hazards
Items Positive Responses
Frequency N (%)
Gloves
Face Masks
400 (100.00)
400 (100.00)
Apron 400 (100.00)
Safety booth 400 (100.00)
Googles 390 (97.50)
Positive responses = Agree/ Strongly Agree
Table 8. Relationship between Practices of Handling Biomedical Waste and Biomedical Waste Management
Practices of Handling
Biomedical Waste
Biomedical Waste
Management
Good
Practice
(%)
Poor Practice
(%) Total χ
2 p-value
Good waste management 302 (83.6) 59 (16.4) 361 (100.0) 213.2894 0.000
Poor waste management 11 (28.2) 28 (71.8) 39 (100.0)
The chi-square (χ2) test revealed that there is relationship between practices of handling biomedical
wastes and biomedical waste management since the p-value is (<0.05) therefore the alternative
hypotheses is accepted, the practices of handling biomedical waste among health workers is a
significant factor of biomedical waste management.
Table 9. Relationship between Level of Awareness on Safety Measures among Health Workers and Biomedical
Waste Management
Biomedical Waste
Management
Level of Awareness on Safety Measures
Total χ2
p-value High Awareness (%)
Low Awareness
(%)
Good Waste Management 395 (100.0%) 0 (0.0%) 395 (100.0%) 296.1934 0.000
Poor Waste Management 0 (0.0%) 5 (100.0%) 5 (100.0%)
109
The chi-square (χ2) test revealed that there is a
relationship between the awareness on safety
measures among health workers and biomedical
waste management since the p-value is (< 0.05).
The alternative hypothesis is accepted, and that
the awareness on safety measures among health
workers is a significant factor of biomedical
waste management.
Conclusion
This study showed that there are gaps in the
implementation of standard practices of handling
biomedical wastes in the hospitals such as in the
areas of transportation from point of generation,
treatment, temporal storage and disposal.
Awareness of safety measures and practices are
appreciable however should be improved upon.
Moreover, this study has shown that the practices
of handling biomedical wastes and awareness of
safety measures are related to biomedical waste
management (p≤ 0.05).
Recommendations
Regular training, workshops and seminars on
standard practices of handling biomedical wastes
and safety measures among health workers to
secure the health of the populace and the
environment. The hospital management should
regularly monitor and enforce the execution of
proper handling procedures of biomedical wastes.
Also, strict compliance to the use of personal
protective equipment among health workers is
critical in the prevention of occupational hazards.
Involvement of government and related agencies
to establish laws and policies for functional and
sustainable system towards achieving an efficient
biomedical wastes management.
References
[1] Awodele, O., Adewoye, A. A and Oparah, A. C.
(2016) Assessment of medical waste management in
seven hospitals in Lagos, Nigeria. Bio Medical Central
Public Health 16-269.
[2] Chima, G.N., Abanobi O. C., Abaraogu, U.J.
Uwalaka C, H. Asonye, I.C., Nwakpa, P. (2014)
Hospital Waste generation and Management Practices
in Owerri, Nigeria. African Journal of Environmental
Science and Technology 8(11) pp 623-632.
[3] Chima, G.N., Ezekwe, I.C., Digha, N.O. (2011)
‘An assessment of medical waste management in
health institutions in Yenagoa, South-South, Nigeria’.
World Review of Science, Technology and Sustainable
Development 8 (2/3/4) pp.224–233.
[4] Debere M. K., Gelaye K. A., Alamdo A. G., and
Trifa Z. M., (2013). Assessment of the health care
waste generation rates and its management system in
hospitals of Addis Ababa, Ethiopia, 2011. BMC Public
Health, 13: 28-37.
[5] Denloye, A.A., Ojuromi, O.T., Ochei, K. and
Ade-Serrano, E.A. (2018) Bio safety Knowledge,
Waste Disposal Practices and Identification of
Parasites in Biomedical Wastes from Healthcare
Establishments in Lagos and Abuja, Nigeria.
Biomedical journal of scientific and Technical
Research 5(4) pp 4759-64.
[6] Deress, T. Hassen, F. Adane, K. and Tsegaye, A.
(2017) Assessment of Knowledge, Attitude, and
Practice about Biomedical Waste Management and
Associated Factors among the Healthcare
Professionals at Debre Markos Town Healthcare
Facilities, Northwest Ethiopia. Journal of
Environmental and Public Health pp1-10.
[7] Glenn, I. D. (1992) Sampling the Evidence of
Extension Program Impact. Program Evaluation and
Organizational Development, IFAS, University of
Florida. PEOD-5. October pp1-5.
[8] Muluken, A. Haimot, G., Mesafint, M. (2013).
Healthcare waste management practices among health
care workers in health care facilities of Gondar town.
North West Ethiopia. Health Science Journal 7(3) pp
315-326.
[9] Ndiaye, M., EI Metghari, L., Soumah, M.M. and
Sow, M.L. (2012). Biomedical waste management in
five hospitals in Dkar, Senegal. Bulletin Sociology
Pathology Exot 105(4) pp 296-304.
[10] Ngwuluka, N., Ochekpe, N., Odumosu, P. John,
S. A. (2009) Waste management in healthcare
establishments within Jos Metropolis, Nigeria. African
Journal of Environmental Science and Technology vol
(3)12 pp 459-465.
[11] Ola-Adisa, E. O. Mangden, Y.E. Sati, Y.C. and
Adisa, J. O. (2015) “Knowledge, attitudes/beliefs and
practices in medical waste management-an appraisal
of Jos North LGA, Plateau State, Nigeria,”
International Journal of Resaerch in Humanities and
Social Studies 2 (12) pp. 43–56.
[12] Patwary M.A., O’Hare, W. T. and Saker, M.H.
(2011). Assessment of occupational and
environmental safety associated with medical waste
disposal in developing countries. A quantitative
approach. Safari Science 49 (8-9) pp1200-1207.
[13] Rahda K.V., Kalaivani K. and Lavanya R. (2009).
A Case Study of Biomedical Waste Management in
Hospitals. Global Journal of Health Sciences 1(1)
pp82-88.
110

[14] Rao, S.K.M., Ranyal, R.K., Bhatia, S.S., Sharma,
V.R. (2004). Biomedical waste management: An
infrastructural survey of Hospitals. Medical Journal of
Armed Forces India, 60(4): 379-382.
[15] Uchechukwu, E.E., Babatunde, I. O. and Ndu A.
C. (2017) Investigating Knowledge, Attitude and
Health Care Waste Management by Health Workers in
a Nigerian Tertiary Health Institution. Global Journal
of Health Science 9 (4) pp 222-232.
[16] Udofia E. A., Fobil, J. N. and Gulis, G. (2015).
Solid medical waste management in Africa. African
Journal of Environmental Science and Technology
9(3) pp 244-254.
United Nations Fund for Population Activities (2015)
UNFPA in FCT, Abuja. WHO (2011). Health-care
waste management: Health-care waste needs sound
management, including alternatives to incineration.
[17] Useh, U, J, Lawal, H.M., Useh, M. U., Akpan, E.
G. and Ibrahim, K. (2018). Assessment of Medical
Waste Generation at a Medical Center in Keffi
Metropolis. American Journal of Biological and
Environmental Statistics 4(1) pp 31-41.
[18] Yelebe, Z.R., Revelation J. S and Blessing Z.
Yelebe, B. Z. (2015) Biomedical Waste Treatment: A
Case Study of some Selected Hospitals in Bayelsa
State, South-South, Nigeria. American Journal
Engineering Research 4 (6) pp-160-164.
111
Texila International Journal of Academic research ISSN: 2520-3088
DOI: 10.21522/TIJAR.2014.07.02.Art013
Testicular Torsion in an Adult Male: A Case of Neglected Torsion
Mukambo Chinayi1, Nkomba Chamileke2*, Bassem Wayed3 1University of Zambia, School of Medicine
2, 3University Teaching Hospital *Corresponding Author: [email protected]
Abstract
Testicular torsion is a true surgical emergency caused by twisting of the testicle on the spermatic
cord leading to disruption of the vascular supply and time sensitive ischemia with or without necrosis
of testicular tissue. The annual incidence is 1 in 4000 males under the age of 25 years globally, with
peak presentation in adolescents between 12 to 16 years as well in the neonatal period. However, there
are rare cases in which adult males present with testicular torsion and this case study explores one
such instance looking at it's unique features and at the same time underscoring an important point that
torsion can occur outside the bimodal peak. The case report illustrates that age distribution maybe
clinically misleading and should not be relied upon for a diagnosis.
Keywords testicular torsion, epididymitis, surgical emergency, ischemia.
Introduction Testicular torsion refers to a condition in
which there is twisting of the spermatic cord leading to decreased blood flow to the testicle resulting in ischemia/infarction and tissue necrosis [1]. The annual incidence is 1 in 4000 males under the age of 25 years globally [2] with peak presentation in adolescents between 12 to 16 years and the neonatal period [3]. Testicular torsion is a common urological problem affecting 1 in 4000 males below the age of 25 [4]. It is a urological emergency hence the need for every medical practitioner to be able to diagnose the condition or consider it as a differential in patients presenting with acute scrotal pain. This however is easier said than done because not all patients with testicular torsion fit the classical clinical vignette which is that testicular torsion is mostly a condition which has a bimodal peak affecting neonates and adolescents between the ages of 12 to 16 years [5] and this case report looks at a unique case where an adult male presented with testicular torsion.
Case report NM, Male 27 years, presented to the
emergency department of the University Teaching hospital (UTH) with a 4day history of right sided testicular pain. NM was referred from one of the local clinics. The pain was of sudden
onset and it started while the patient was cleaning around the house. The pain was mostly felt in the right scrotal area, it was sharp, severe and was associated with localised swelling. On the same day he visited the local clinic where he was given painkillers (diclofenac) which alleviated the pain. He was also started on antibiotics (doxycycline and then ciprofloxacin for 3 days). However, he had no hx of dysuria, genital discharge or fever, there was also no hx of nausea and vomiting. The patient`s swelling persisted despite analgesia and antibiotics and 4 days later he was referred to UTH. He is not hypertensive or diabetic, he is HIV negative and has no hx of a similar presentation. There is a hx of alcohol intake and smoking.
On examination, he was afebrile to touch and vitals were in the normal range. Respiratory, cardiovascular and gastrointestinal systems were clinically clear. Local exam: inspection of the perineum showed normal hair distribution and normal genitalia, right hemi scrotal swelling. On palpation the right testicle was tender, elevated compared to contralateral testis and horizontal lie. Prehn's sign was negative. Left testicle was normal. Doppler ultrasound done 4 days after onset of symptoms revealed no vascularity on the right testis and hypoechoic texture while the left testis was normal. Patient was taken to theatre on day 7 (one week after onset of symptoms). Scrotal exploration was carried out and the
112
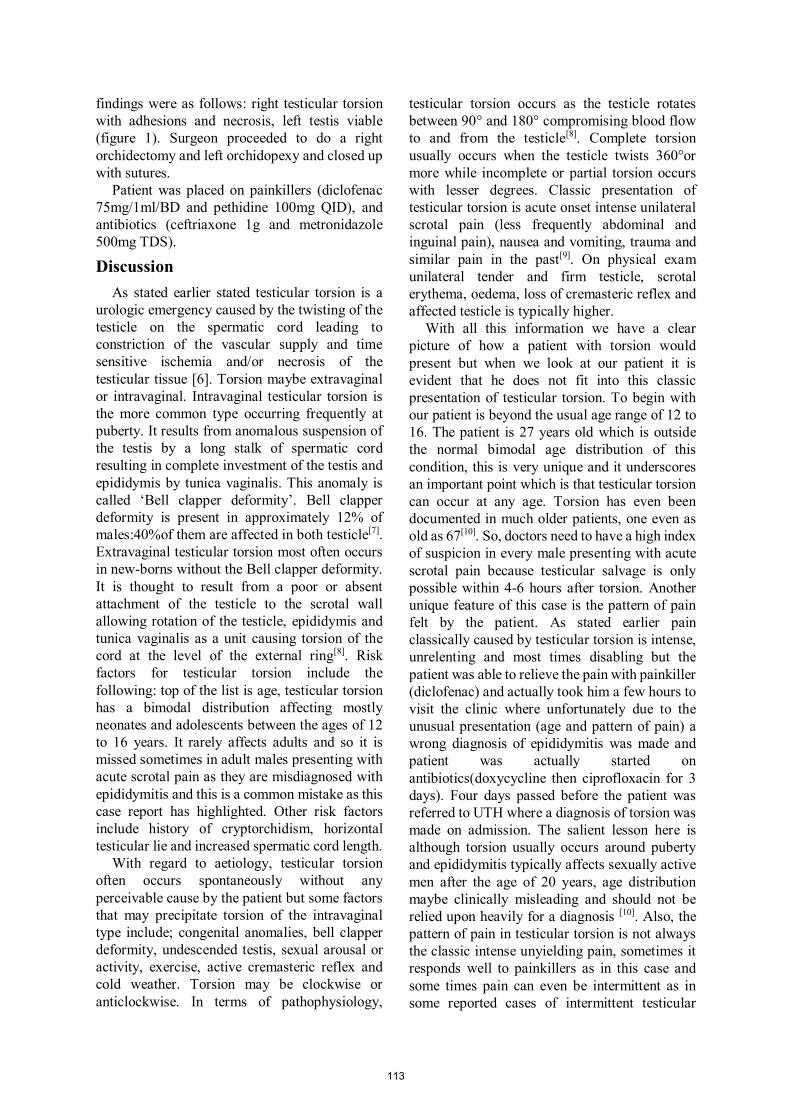
findings were as follows: right testicular torsion with adhesions and necrosis, left testis viable (figure 1). Surgeon proceeded to do a right orchidectomy and left orchidopexy and closed up with sutures.
Patient was placed on painkillers (diclofenac 75mg/1ml/BD and pethidine 100mg QID), and antibiotics (ceftriaxone 1g and metronidazole 500mg TDS).
Discussion As stated earlier stated testicular torsion is a
urologic emergency caused by the twisting of the testicle on the spermatic cord leading to constriction of the vascular supply and time sensitive ischemia and/or necrosis of the testicular tissue [6]. Torsion maybe extravaginal or intravaginal. Intravaginal testicular torsion is the more common type occurring frequently at puberty. It results from anomalous suspension of the testis by a long stalk of spermatic cord resulting in complete investment of the testis and epididymis by tunica vaginalis. This anomaly is called ‘Bell clapper deformity’. Bell clapper deformity is present in approximately 12% of males:40%of them are affected in both testicle[7]. Extravaginal testicular torsion most often occurs in new-borns without the Bell clapper deformity. It is thought to result from a poor or absent attachment of the testicle to the scrotal wall allowing rotation of the testicle, epididymis and tunica vaginalis as a unit causing torsion of the cord at the level of the external ring[8]. Risk factors for testicular torsion include the following: top of the list is age, testicular torsion has a bimodal distribution affecting mostly neonates and adolescents between the ages of 12 to 16 years. It rarely affects adults and so it is missed sometimes in adult males presenting with acute scrotal pain as they are misdiagnosed with epididymitis and this is a common mistake as this case report has highlighted. Other risk factors include history of cryptorchidism, horizontal testicular lie and increased spermatic cord length.
With regard to aetiology, testicular torsion often occurs spontaneously without any perceivable cause by the patient but some factors that may precipitate torsion of the intravaginal type include; congenital anomalies, bell clapper deformity, undescended testis, sexual arousal or activity, exercise, active cremasteric reflex and cold weather. Torsion may be clockwise or anticlockwise. In terms of pathophysiology,
testicular torsion occurs as the testicle rotates between 90° and 180° compromising blood flow to and from the testicle[8]. Complete torsion usually occurs when the testicle twists 360°or more while incomplete or partial torsion occurs with lesser degrees. Classic presentation of testicular torsion is acute onset intense unilateral scrotal pain (less frequently abdominal and inguinal pain), nausea and vomiting, trauma and similar pain in the past[9]. On physical exam unilateral tender and firm testicle, scrotal erythema, oedema, loss of cremasteric reflex and affected testicle is typically higher.
With all this information we have a clear picture of how a patient with torsion would present but when we look at our patient it is evident that he does not fit into this classic presentation of testicular torsion. To begin with our patient is beyond the usual age range of 12 to 16. The patient is 27 years old which is outside the normal bimodal age distribution of this condition, this is very unique and it underscores an important point which is that testicular torsion can occur at any age. Torsion has even been documented in much older patients, one even as old as 67[10]. So, doctors need to have a high index of suspicion in every male presenting with acute scrotal pain because testicular salvage is only possible within 4-6 hours after torsion. Another unique feature of this case is the pattern of pain felt by the patient. As stated earlier pain classically caused by testicular torsion is intense, unrelenting and most times disabling but the patient was able to relieve the pain with painkiller (diclofenac) and actually took him a few hours to visit the clinic where unfortunately due to the unusual presentation (age and pattern of pain) a wrong diagnosis of epididymitis was made and patient was actually started on antibiotics(doxycycline then ciprofloxacin for 3 days). Four days passed before the patient was referred to UTH where a diagnosis of torsion was made on admission. The salient lesson here is although torsion usually occurs around puberty and epididymitis typically affects sexually active men after the age of 20 years, age distribution maybe clinically misleading and should not be relied upon heavily for a diagnosis [10]. Also, the pattern of pain in testicular torsion is not always the classic intense unyielding pain, sometimes it responds well to painkillers as in this case and some times pain can even be intermittent as in some reported cases of intermittent testicular
113
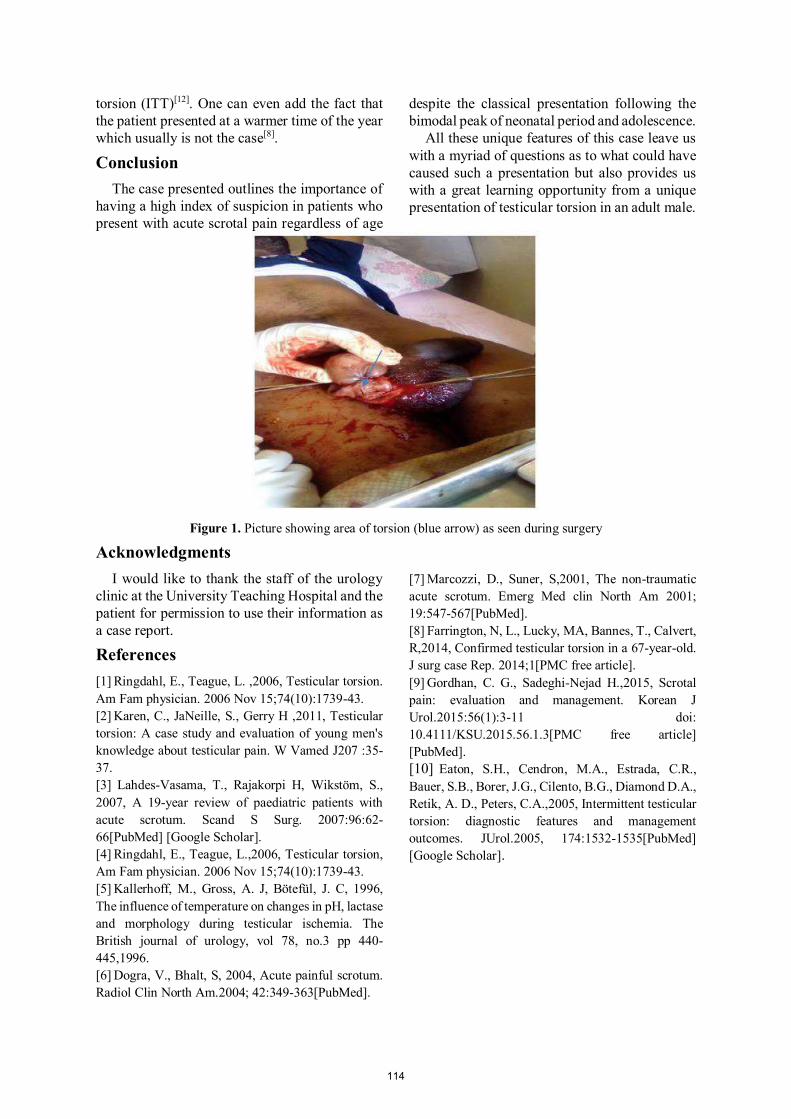
torsion (ITT)[12]. One can even add the fact that the patient presented at a warmer time of the year which usually is not the case[8].
Conclusion The case presented outlines the importance of
having a high index of suspicion in patients who present with acute scrotal pain regardless of age
despite the classical presentation following the bimodal peak of neonatal period and adolescence.
All these unique features of this case leave us with a myriad of questions as to what could have caused such a presentation but also provides us with a great learning opportunity from a unique presentation of testicular torsion in an adult male.
Figure 1. Picture showing area of torsion (blue arrow) as seen during surgery
Acknowledgments I would like to thank the staff of the urology
clinic at the University Teaching Hospital and the patient for permission to use their information as a case report.
References [1] Ringdahl, E., Teague, L. ,2006, Testicular torsion. Am Fam physician. 2006 Nov 15;74(10):1739-43. [2] Karen, C., JaNeille, S., Gerry H ,2011, Testicular torsion: A case study and evaluation of young men's knowledge about testicular pain. W Vamed J207 :35-37. [3] Lahdes-Vasama, T., Rajakorpi H, Wikstöm, S., 2007, A 19-year review of paediatric patients with acute scrotum. Scand S Surg. 2007:96:62-66[PubMed] [Google Scholar]. [4] Ringdahl, E., Teague, L.,2006, Testicular torsion, Am Fam physician. 2006 Nov 15;74(10):1739-43. [5] Kallerhoff, M., Gross, A. J, Bötefül, J. C, 1996, The influence of temperature on changes in pH, lactase and morphology during testicular ischemia. The British journal of urology, vol 78, no.3 pp 440-445,1996. [6] Dogra, V., Bhalt, S, 2004, Acute painful scrotum. Radiol Clin North Am.2004; 42:349-363[PubMed].
[7] Marcozzi, D., Suner, S,2001, The non-traumatic acute scrotum. Emerg Med clin North Am 2001; 19:547-567[PubMed]. [8] Farrington, N, L., Lucky, MA, Bannes, T., Calvert, R,2014, Confirmed testicular torsion in a 67-year-old. J surg case Rep. 2014;1[PMC free article]. [9] Gordhan, C. G., Sadeghi-Nejad H.,2015, Scrotal pain: evaluation and management. Korean J Urol.2015:56(1):3-11 doi: 10.4111/KSU.2015.56.1.3[PMC free article] [PubMed]. [10] Eaton, S.H., Cendron, M.A., Estrada, C.R., Bauer, S.B., Borer, J.G., Cilento, B.G., Diamond D.A., Retik, A. D., Peters, C.A.,2005, Intermittent testicular torsion: diagnostic features and management outcomes. JUrol.2005, 174:1532-1535[PubMed] [Google Scholar].
114
Texila International Journal of Academic research ISSN: 2520-3088
DOI: 10.21522/TIJAR.2014.07.02.Art014
To Establish the Relationship between Socioeconomic Status to Mental Illness
Edna Chirwa Simwinga Texila American University – Zambia
E-mail: [email protected]
Abstract
It is cardinal to note that several studies have revealed that there is a robust relationship between
socioeconomic status (SES) and general physical health. These findings that can be generalized to
Zambia. Zambia which is one of the most urbanized countries in sub-Saharan Africa, there are
assumptions that it is possible that social, and economic factors may contribute to the mental health of
the people. The purpose of this study is to establish the relationship between socioeconomic status,
home environment, and mental illness in Zambia. In order to guide the paper, the aim was to establish
the relationship between socioeconomic statuses to mental illness. A quantitative methodology was used
whereby data was collected using questionnaires from the respondents.
The results established that low school accessibility is associated with higher risk of mental illness
among younger men (20–31) and women (20–45), while it is a slightly protective factor for elderly
individuals of both sexes. The association between social inequalities and the manifestation of
psychological instability symptoms has been observed in relation to unemployment, lower education,
low income and some material deprivation and most severely affects women of low SES, children,
adolescents and the elderly. In the data, a low level of education and inactivity shows the strongest
effect on the incidence of mental disorders, particularly among unemployed men.
Keywords: Social economic status, Mental illness, Physical health.
Introduction Socioeconomic status (SES) can be looked at
as a theoretical construct encompassing individual, household, and/or community access to resources (Adler et al., 2000). However, it is usually conceptualized as a combination of economic, social, and work status, measured by income or wealth, education, and occupation, respectively (Pollack at al., 2007). In this vein, SES has been linked to a wide range of health-related exposures and outcomes, including undernutrition, chronic disease, infection and mental health disorders. For instance, evidence has shown that the poorer one's socioeconomic conditions are, the higher one's risk is for mental disability and psychiatric hospitalization (Pickett et al, 2006). In light of the above, it is critical to make mention that mental illness tends to be on the increase in Zambia both in the rural and in the urban areas. Like many other developing countries, Zambia experiences a number of challenges around mental health including shortages of mental health facilities and professionals especially in the developing countries, stigma associated with the illness, lack
of adequate policies, inadequate resources, among others (Siwo, 2018).
Although there are psychiatric units within seven general hospitals across the country, and the mental health policy in the country has made a commitment to integration, mental health services in Zambia are largely delivered at Chainama Hospital in Lusaka, the only mental health hospital in the country (Siwo, 2018). In addition, there is a dearth of research on mental health generally in Zambia (Kapungwe et al., 2010) with currently no research having been conducted on issues around integration of mental health with primary health care and thus the importance of this study. The major aim of this paper was to establish the link between Socioeconomic Status and mental illness. The study further wanted to establish the relationship between home environmental and mental illness in Lusaka, Zambia.
Most studies that have been carried out to investigate factors influencing mental illness have concentrated on sex, age, and ethnicity rather than SES (American Psychology Association, 2011). Therefore, there is needed to
115
get a comprehensive understanding of how SES influences mental illness. Thus, conducting this study in a developing country like Zambia would contribute to a more comprehensive understanding of how SES influences mental illness. This could further policy and provision of mental health services in Zambia. Therefore, there it is essential to better understand of this relationship for the purposes of planning preventive activities and health care provision.
Literature review Suffice to note that mental illnesses worldwide
are accompanied by another pandemic, that of stigma and discrimination (Kapungwe et al., 2010). In many instance, mental illness tends to strike with a double-edged sword, with those affected having to deal with the symptoms and disabilities of their illness on the one side, and widespread stigma and discrimination on the other. There have been a great number of studies that have been done on mental health in the western worlds (Crisp et al., 2000; Jacob et al., 2007). However, there has been very few studies conducted in Africa have suggested that the experience of stigma by people with mental illness may in fact be common.
For example, in their study investigating knowledge and attitudes of the general South African public towards mental illness, Hugo and colleagues found that knowledge was low and stigma was high. Such stigma appeared to be associated with the fact that mental illnesses were understood as a lack of willpower, and stress-related, rather than medical illnesses (Hugo et al., 2007).
Another example can be seen in Nigeria, where the first large-scale, community representative study of popular attitudes towards mentally ill, found stigma to be widespread, with most people indicating that they would not tolerate even basic social interactions with someone with a mental illness (Gureje et al., 2005). These preliminary findings thus confirm Corrigan and Watson’s assertion that the lack of empirical data in African countries may explain the speculation that stigmatisation and discrimination towards mental illness is less common in these societies. More studies on the continent are needed in order to avoid ill-informed assumptions, and to prevent uncritical transposition of findings from western contexts to
Africa, given cultural and structural regional differences.
Relationship between Socioeconomic Status and Mental Health
Results from previous studies show strong associations between mental health for instance, social relations, income, working conditions and critical life events.
Korkeila et al. (2003) conducted a study in order to present background work for developing a number indicator of mental health indicators to be included in part of an all-inclusive health monitoring system in Europe. A functional model of mental health was used to delineate variables essential for mental health indicators. The study ended up with a number of mental health indicators that could heighten the visibility of mental health problems in the European setting. This review included different studies that employed various methodologies rendering it difficult to compare the results. Furthermore, the socio-economical setting is very different from the Zambian setting.
Previous studies have followed two main research approaches to decide the temporal order between mental illnesses and SES. The first depends on old self-reports of study participants. For instance, a study by Kessler (2005), to determine the temporal order between mental disorders and school dropout by trusting on the study participants’ ability to remember their mental state prior to major educational moves, such as high school completion and college entry. On average, the study participants were asked to recollect their mental state fifteen years before the study time. Such studies relying on retrospective self-reports find evidence for the selection perspective to the extent that study participants who were unsuccessful in making major educational transitions recounted an overrepresentation of anxiety disorders, mood disorders and conduct disorder that pre-existed their school dropout.
It is important to note, conversely, that findings based on such analyses utilization in this research design are based on the assumption that retrospective self-reports of the incidence and timing of childhood and adolescent mental illnesses are valid and reliable. This is very debatable. To avoid such a pitfall, participants should only be asked to recollect and retell their very recent and current episodes respectively.
116
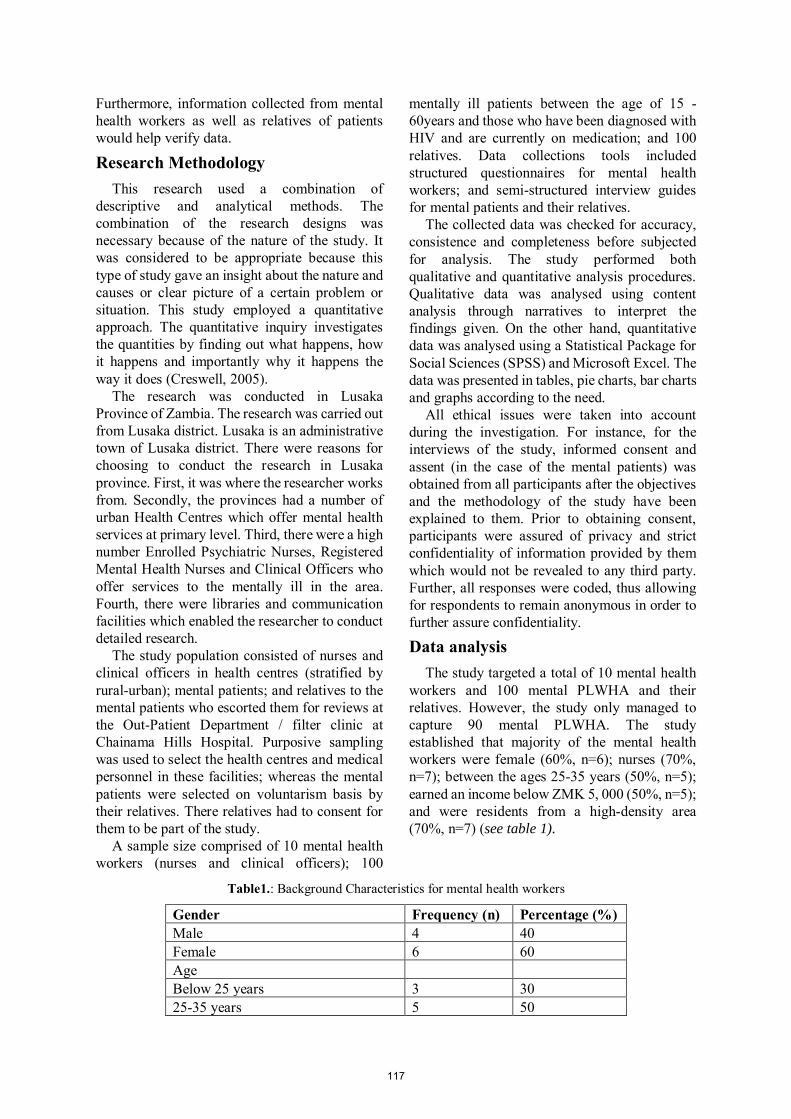
Furthermore, information collected from mental health workers as well as relatives of patients would help verify data.
Research Methodology This research used a combination of
descriptive and analytical methods. The combination of the research designs was necessary because of the nature of the study. It was considered to be appropriate because this type of study gave an insight about the nature and causes or clear picture of a certain problem or situation. This study employed a quantitative approach. The quantitative inquiry investigates the quantities by finding out what happens, how it happens and importantly why it happens the way it does (Creswell, 2005).
The research was conducted in Lusaka Province of Zambia. The research was carried out from Lusaka district. Lusaka is an administrative town of Lusaka district. There were reasons for choosing to conduct the research in Lusaka province. First, it was where the researcher works from. Secondly, the provinces had a number of urban Health Centres which offer mental health services at primary level. Third, there were a high number Enrolled Psychiatric Nurses, Registered Mental Health Nurses and Clinical Officers who offer services to the mentally ill in the area. Fourth, there were libraries and communication facilities which enabled the researcher to conduct detailed research.
The study population consisted of nurses and clinical officers in health centres (stratified by rural-urban); mental patients; and relatives to the mental patients who escorted them for reviews at the Out-Patient Department / filter clinic at Chainama Hills Hospital. Purposive sampling was used to select the health centres and medical personnel in these facilities; whereas the mental patients were selected on voluntarism basis by their relatives. There relatives had to consent for them to be part of the study.
A sample size comprised of 10 mental health workers (nurses and clinical officers); 100
mentally ill patients between the age of 15 - 60years and those who have been diagnosed with HIV and are currently on medication; and 100 relatives. Data collections tools included structured questionnaires for mental health workers; and semi-structured interview guides for mental patients and their relatives.
The collected data was checked for accuracy, consistence and completeness before subjected for analysis. The study performed both qualitative and quantitative analysis procedures. Qualitative data was analysed using content analysis through narratives to interpret the findings given. On the other hand, quantitative data was analysed using a Statistical Package for Social Sciences (SPSS) and Microsoft Excel. The data was presented in tables, pie charts, bar charts and graphs according to the need.
All ethical issues were taken into account during the investigation. For instance, for the interviews of the study, informed consent and assent (in the case of the mental patients) was obtained from all participants after the objectives and the methodology of the study have been explained to them. Prior to obtaining consent, participants were assured of privacy and strict confidentiality of information provided by them which would not be revealed to any third party. Further, all responses were coded, thus allowing for respondents to remain anonymous in order to further assure confidentiality.
Data analysis The study targeted a total of 10 mental health
workers and 100 mental PLWHA and their relatives. However, the study only managed to capture 90 mental PLWHA. The study established that majority of the mental health workers were female (60%, n=6); nurses (70%, n=7); between the ages 25-35 years (50%, n=5); earned an income below ZMK 5, 000 (50%, n=5); and were residents from a high-density area (70%, n=7) (see table 1).
Table1.: Background Characteristics for mental health workers
Gender Frequency (n) Percentage (%) Male 4 40 Female 6 60 Age Below 25 years 3 30 25-35 years 5 50
117
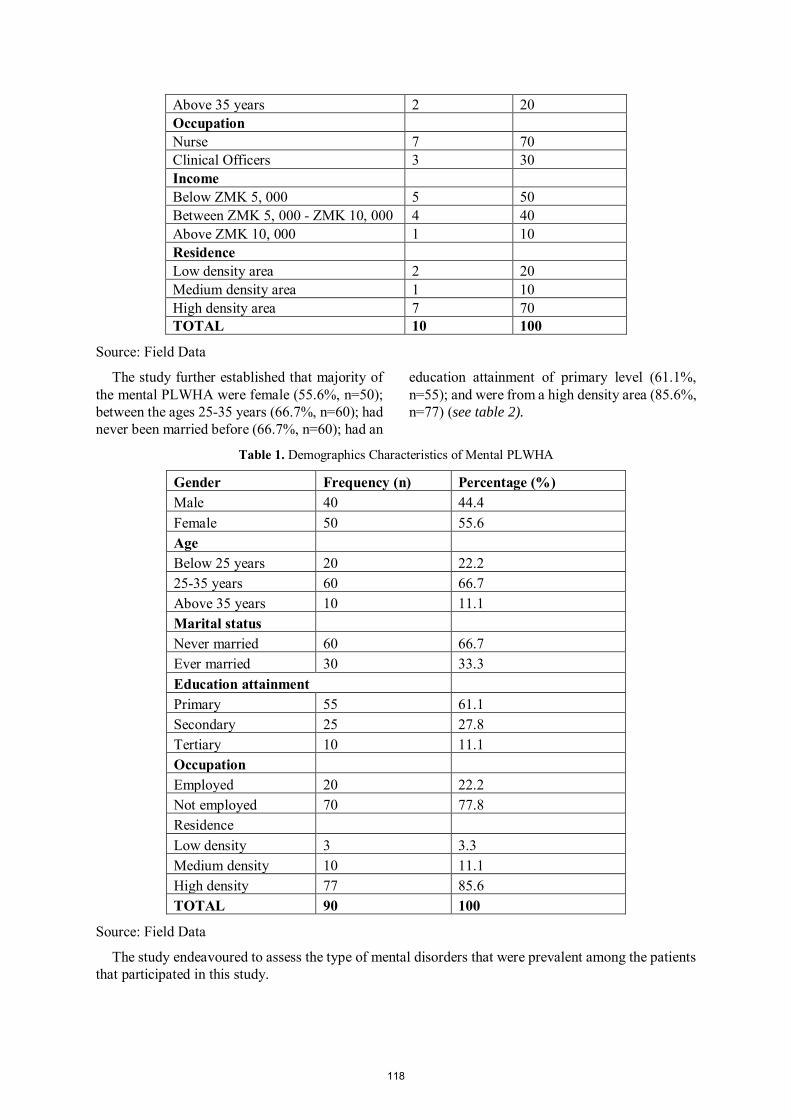
Above 35 years 2 20 Occupation Nurse 7 70 Clinical Officers 3 30 Income Below ZMK 5, 000 5 50 Between ZMK 5, 000 - ZMK 10, 000 4 40 Above ZMK 10, 000 1 10 Residence Low density area 2 20 Medium density area 1 10 High density area 7 70 TOTAL 10 100
Source: Field Data
The study further established that majority of the mental PLWHA were female (55.6%, n=50); between the ages 25-35 years (66.7%, n=60); had never been married before (66.7%, n=60); had an
education attainment of primary level (61.1%, n=55); and were from a high density area (85.6%, n=77) (see table 2).
Table 1. Demographics Characteristics of Mental PLWHA
Gender Frequency (n) Percentage (%) Male 40 44.4 Female 50 55.6 Age Below 25 years 20 22.2 25-35 years 60 66.7 Above 35 years 10 11.1 Marital status Never married 60 66.7 Ever married 30 33.3 Education attainment Primary 55 61.1 Secondary 25 27.8 Tertiary 10 11.1 Occupation Employed 20 22.2 Not employed 70 77.8 Residence Low density 3 3.3 Medium density 10 11.1 High density 77 85.6 TOTAL 90 100
Source: Field Data
The study endeavoured to assess the type of mental disorders that were prevalent among the patients that participated in this study.
118
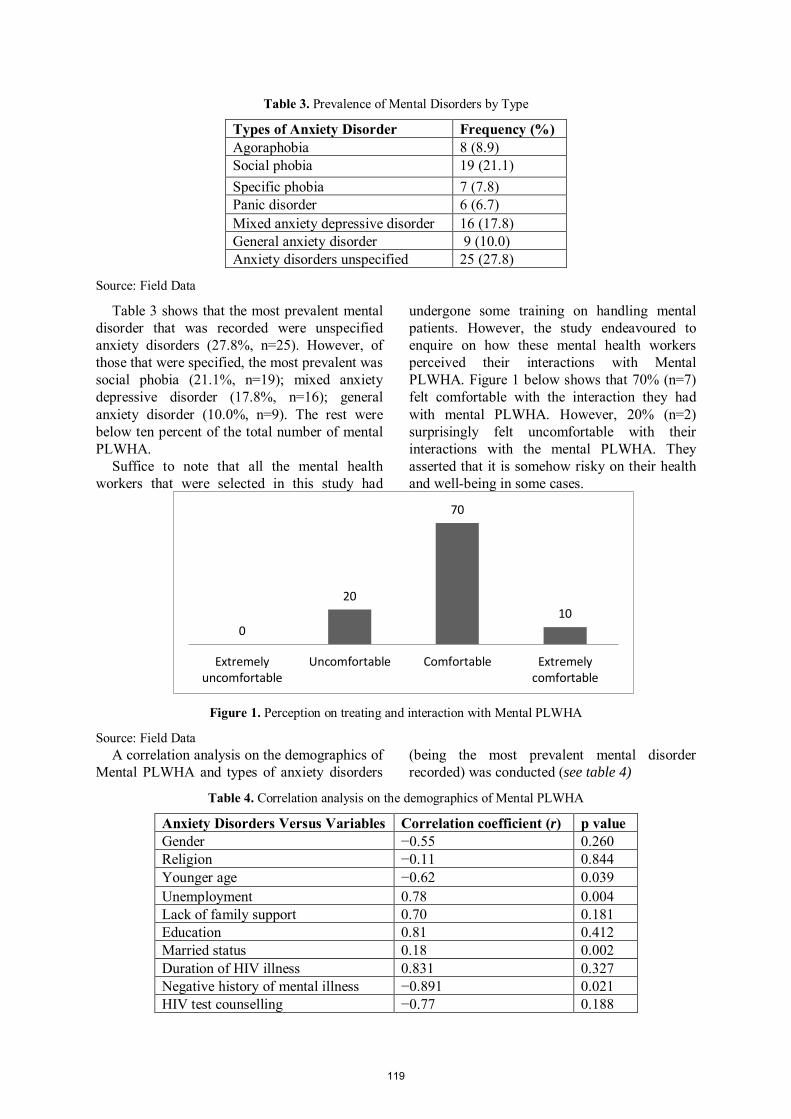
Table 3. Prevalence of Mental Disorders by Type
Types of Anxiety Disorder Frequency (%) Agoraphobia 8 (8.9) Social phobia 19 (21.1) Specific phobia 7 (7.8) Panic disorder 6 (6.7) Mixed anxiety depressive disorder 16 (17.8) General anxiety disorder 9 (10.0) Anxiety disorders unspecified 25 (27.8)
Source: Field Data
Table 3 shows that the most prevalent mental disorder that was recorded were unspecified anxiety disorders (27.8%, n=25). However, of those that were specified, the most prevalent was social phobia (21.1%, n=19); mixed anxiety depressive disorder (17.8%, n=16); general anxiety disorder (10.0%, n=9). The rest were below ten percent of the total number of mental PLWHA.
Suffice to note that all the mental health workers that were selected in this study had
undergone some training on handling mental patients. However, the study endeavoured to enquire on how these mental health workers perceived their interactions with Mental PLWHA. Figure 1 below shows that 70% (n=7) felt comfortable with the interaction they had with mental PLWHA. However, 20% (n=2) surprisingly felt uncomfortable with their interactions with the mental PLWHA. They asserted that it is somehow risky on their health and well-being in some cases.
Figure 1. Perception on treating and interaction with Mental PLWHA
Source: Field Data A correlation analysis on the demographics of
Mental PLWHA and types of anxiety disorders (being the most prevalent mental disorder recorded) was conducted (see table 4)
Table 4. Correlation analysis on the demographics of Mental PLWHA
Anxiety Disorders Versus Variables Correlation coefficient (r) p value Gender −0.55 0.260 Religion −0.11 0.844 Younger age −0.62 0.039 Unemployment 0.78 0.004 Lack of family support 0.70 0.181 Education 0.81 0.412 Married status 0.18 0.002 Duration of HIV illness 0.831 0.327 Negative history of mental illness −0.891 0.021 HIV test counselling −0.77 0.188
0
20
70
10
Extremelyuncomfortable
Uncomfortable Comfortable Extremelycomfortable
119
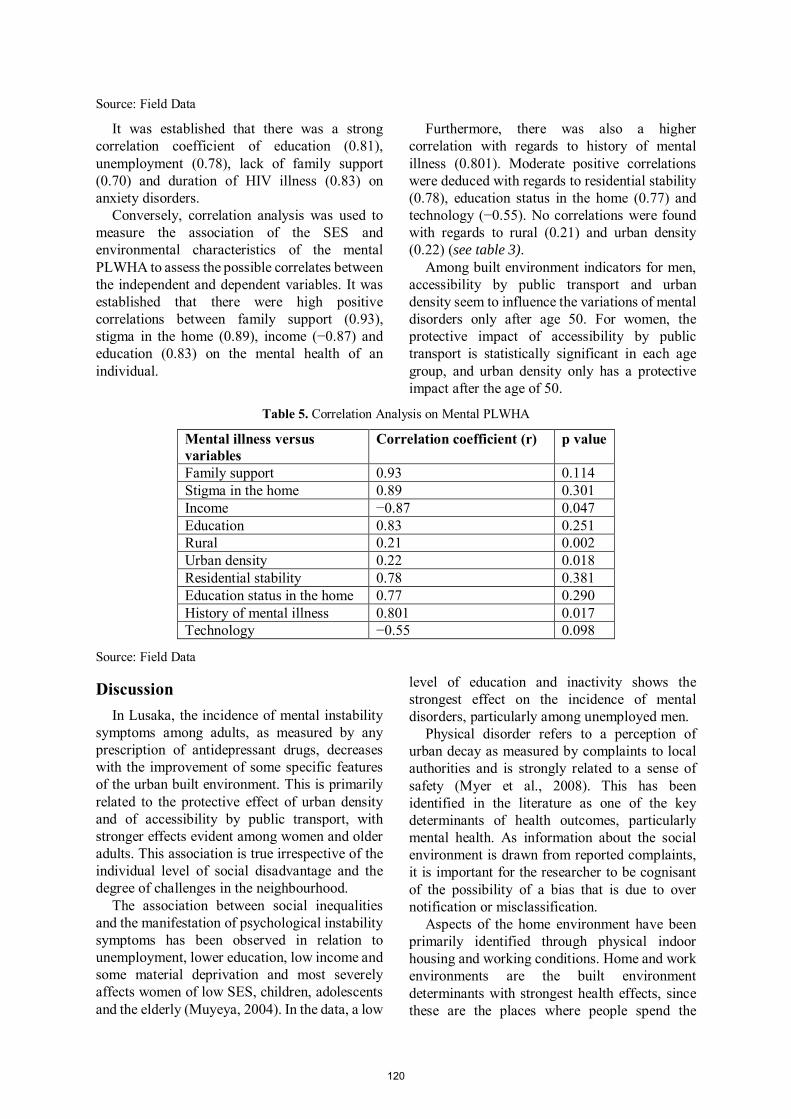
Source: Field Data
It was established that there was a strong correlation coefficient of education (0.81), unemployment (0.78), lack of family support (0.70) and duration of HIV illness (0.83) on anxiety disorders.
Conversely, correlation analysis was used to measure the association of the SES and environmental characteristics of the mental PLWHA to assess the possible correlates between the independent and dependent variables. It was established that there were high positive correlations between family support (0.93), stigma in the home (0.89), income (−0.87) and education (0.83) on the mental health of an individual.
Furthermore, there was also a higher correlation with regards to history of mental illness (0.801). Moderate positive correlations were deduced with regards to residential stability (0.78), education status in the home (0.77) and technology (−0.55). No correlations were found with regards to rural (0.21) and urban density (0.22) (see table 3).
Among built environment indicators for men, accessibility by public transport and urban density seem to influence the variations of mental disorders only after age 50. For women, the protective impact of accessibility by public transport is statistically significant in each age group, and urban density only has a protective impact after the age of 50.
Table 5. Correlation Analysis on Mental PLWHA
Mental illness versus variables
Correlation coefficient (r) p value
Family support 0.93 0.114 Stigma in the home 0.89 0.301 Income −0.87 0.047 Education 0.83 0.251 Rural 0.21 0.002 Urban density 0.22 0.018 Residential stability 0.78 0.381 Education status in the home 0.77 0.290 History of mental illness 0.801 0.017 Technology −0.55 0.098
Source: Field Data
Discussion In Lusaka, the incidence of mental instability
symptoms among adults, as measured by any prescription of antidepressant drugs, decreases with the improvement of some specific features of the urban built environment. This is primarily related to the protective effect of urban density and of accessibility by public transport, with stronger effects evident among women and older adults. This association is true irrespective of the individual level of social disadvantage and the degree of challenges in the neighbourhood.
The association between social inequalities and the manifestation of psychological instability symptoms has been observed in relation to unemployment, lower education, low income and some material deprivation and most severely affects women of low SES, children, adolescents and the elderly (Muyeya, 2004). In the data, a low
level of education and inactivity shows the strongest effect on the incidence of mental disorders, particularly among unemployed men.
Physical disorder refers to a perception of urban decay as measured by complaints to local authorities and is strongly related to a sense of safety (Myer et al., 2008). This has been identified in the literature as one of the key determinants of health outcomes, particularly mental health. As information about the social environment is drawn from reported complaints, it is important for the researcher to be cognisant of the possibility of a bias that is due to over notification or misclassification.
Aspects of the home environment have been primarily identified through physical indoor housing and working conditions. Home and work environments are the built environment determinants with strongest health effects, since these are the places where people spend the
120
majority of their time. Some of the direct effects on health due to the outdoor urban environment are more difficult to isolate and are recognized to be of minor intensity. In addition, the urban built environment can have an important impact on mental health through indirect pathways.
Recommendations Home and work environments have to be
stress free spaces since most people spend the majority of their time there.
People must make time to talk to someone at work or at home so that they can share and vent of their stress.
Awareness campaigns so that the younger generations desist from dropping out from school and the use of drugs.
Government must equip the young generation with entrepreneurial skills that improve their livelihoods so that they will not be affected by the stress of making ends meet.
Conclusion In conclusion, there is indeed some positive
relationship between socioeconomic status and mental illness. Lack of education and physical disorders are some of the socioeconomic factors leading to mental illness. The state must stand as watchdogs so ensure the wellbeing of every citizen thus dealing with the scourge of mental illness.
References [1] Adler, N. E., Epel, E. S., Castellazzo, G., & Ickovics, J. R. (2000). Relationship of Subjective and Objective Social Status with Psychological and Physiological Functioning: Preliminary Data in Healthy White Women. Health Psychology, 19, 586 –592. [2] American Psychological association. (2011). Children, Youth, Families and Socioeconomic Status. APA. Retrieved from Children, Youth, Families and Socioeconomic Status on 2017 January, 25. [3] Creswell, J. (2005). Educational Research: Planning, Conducting and Evaluating Quantitative and Qualitative Research (Second Edition). New Jersey: Pearson. [4] Högberg, T. and Magnusson, A. (2005). "To be a nurse or a neighbour? A moral concern for psychiatric nurses living next door to individuals with a mental illness." Nursing Ethics, 12(5), 468-478.
[5] Jacob KS, Sharan P, Mirza I, Garrido-Cumbrera M, Seedat S, Mari JJ (2007): Mental health systems in countries: Where are we now?. Lancet. 2007, 370: 1061-1077. 10.1016/S0140-6736(07)61241-0. [6] Kapungwe A, Cooper S, Mwanza J, Mwape L, Sikwese A, Kakuma R, Lund C, Flisher A J, MHaPP Research Programme Consortium (2010): Mental Illness--Stigma and Discrimination in Zambia. Afr J Psychiatry (Johannesbg). 2010 Jul;13(3):192-203. [7] Kessler, R. C., Demler, O., Frank, R. G., Olfson, M., Pincus, H. A., Walters, E. E., Zaslavsky, A. M. (2005). Prevalence and treatment of mental disorders, 1990 to 2003. New England Journal of Medicine, 352, 2515–2523. [8] Knapp M, Funk M, Curran C, Prince M, Grigg M, McDaid D (2006): Economic barriers to better mental health practice and policy. Health Policy Plan. 2006, 21: 157-170. 10.1093/heapol/czl003. [9] Korkeila J, Lehtinen V, Bijl R, Dalgard AS, Kovess V, Morgan A, Salize HJ. (2003). Establishing a set of mental health indicators for Europe. Scandinavian Journal of Public Health, 31, 451-9. [10] Mayeya, J. (2004). “Zambia Mental Health Profile,” International Review of Psychiatry. 16 (1-2) 63-72. Accessed from http://www.ncbi.nlm.nih.gov/pubmed/15276939; June 27, 2011. [11] Myer, L., Stein, D.J., Grimsrud, A., Seedat, S. and Williams, D.R., (2008). Social Determinants of Psychological Distress in a Nationally-Representative Sample of South African adults. Social Science & Medicine, 66(8), pp.1828-1840. [12] Palitza, K. (2009). “Mental Illness in HIV-Positive Patients Largely Ignored”, accessed at http://ipsnews.net/news.asp?idnews=47138; on June, 10, 2011. [13] Pickett KE, Wilkinson RG. (2006). Child wellbeing and income inequality in rich societies: ecological cross-sectional study. BMJ 335:1080–87. [14] Pollack CE, Chideya S, Cubbin C, Williams B, Dekker M, Braveman P (2007): Should Health Studies Measure Wealth? A Systematic Review. Am J Prev Med. 2007 Sep;33(3):250-64. doi: 10.1016/j.amepre.2007.04.033. [15] Siwo C. (2018). Young People and Mental Health in a Changing World. Health Press Zambia Bull.
121
Texila International Journal of Academic research ISSN: 2520-3088
DOI: 10.21522/TIJAR.2014.07.02.Art015
Human Characteristics Prediction from Social Media Data
Mustapha Bin Danquah Department of Education, Texila American University, Saudi Arabia
E-mail: [email protected]
Abstract
With 2.19 billion users, Facebook is one of the most famous and prosperous social network
services (SNS). Because of its pervasiveness and especially concerning the recent issue on the
collection of personal data of both users and non-users, some experts and psychologists believe that
users are influenced to behave in certain ways vastly different from their usual behaviour. The present
study provided insight into why students adopt a characteristic or identity in this online setting via a
thorough examination of the student's level of participation on Facebook. The descriptive research
design was employed for the study. The sample size used was 240 drawn from the first and third-year
undergraduate students of the University of Ghana (UG). Purposive sampling technique was adopted
for sample selection. The main research instrument for the study was a questionnaire. The study
revealed that most of the students were digitally inclined and is very active on Facebook. It was also
seen that due to the visual possibilities of Facebook, students tailored their characteristics or identity
towards wanting their audience to like them, to be desired by their girlfriend and sought after by
popular users. It was also discovered that unlike anonymous media such as chat room, users can be
held accountable for deviant behaviour on the Facebook environment because pertinent information
about them are kept and shared with third parties.
Keyword: Developmental psychology, Social Network Service, identity management, construction of
identity, the performance of identity.
Introduction In recent times, the construction of identity
online has drawn much attention from psychologists in the social network field. Experts in developmental psychology such as Zacarias- Gonzalez, Iborra, Tomas, and Serra (2009) posited that identity construction has proven to be a major concern faced by young adults. Experts described identity as a coherent conception of oneself that includes the targets, values, and beliefs to which we make a firm commitment, it is psycho-social and is often influenced by self-concept, interpersonal relations and individual surroundings (Trimble, Root, & Helms, 2003; Perez-Torres, Pastor-Ruiz, & Ben-Boubaker, 2018). Studies on the prediction of human characteristics utilizing social network service, according to Perez-Torres et al. (2018), is focused on understanding how people construct their identity in a virtual or unreal world void of physical contact.
Herring and Kapidzic (2015) and Lin, Fang, and Jin (2017) conducted extensive investigation
and research on the anonymous online environment such as chat forums and their findings revealed that users are predisposed to hiding their true identity and take on a different identity that may closely resemble their innermost desire and aspirations especially in connection with things they cannot do in the real-world or offline. Users resorted to this type of identity construction due to the anonymous nature of the online environment of which users are less culpable. These findings fanned the interest of several researchers on social network service, including Ellison et al. (2006), Waheed, Anjum, Rehman, and Khawaja (2017) and Perez-Torres et al. (2018) to investigate how users construct identities in anonymous (i.e opposite of anonymous) online environment, especially on sites that identity is extremely important, such as internet dating sites.
Results of their study revealed that people constructed their identity differently on these sites (internet dating), their behaviour or actions revealed a sense of awareness of the anonymous online environment, of which their actions or
122
behaviour may be consequential. The result of Ellison et al, Waheed et al. and Perez-Torres et al. underpin the objectives of this study, because it vividly revealed that online environment was not constitutive of a single unit, it has shades of variation suggesting that how individuals constructed identity or presented themselves varied significantly from one online setting to another. Given this variation, the present study will carry out an extensive investigation into how users on Facebook, anonymous and social networking site, construct identity or perform self-presentation. The focus of the study is on university students because this social networking site – Facebook has become very popular with university students in Ghana.
Objectives of the study To fully understand the various ways
students' identity can be understood on social media (Facebook), the present study has as its objectives the following:
i. To investigate how often students, visit Facebook
ii. To ascertain how often students, update their profiles on Facebook
iii. To establish how students, perform and construct their identities on Facebook.
Research questions i. How often do users visit Facebook? ii. How often do users update their profiles on
Facebook? iii. How do users construct and perform their
identity on Facebook?
Significance of the Study The significance of this study cannot be
overemphasized at a time when using Facebook, with 2.19 billion monthly active users, is considered a laudable achievement and 'keeping up with the Joneses' (Kearney, 2018). This study is also timely because of the mounting pressure on Facebook executives to review their privacy policies with less monitoring of messenger messages, to make the service less anonymous (Roettgers, 2018, p. 1). It is envisaged that result of the study will provide insight into the privacy issue and its impact on the construction of identity on Facebook. Moreover, the study would serve as an impetus in understanding the several forms of identity student are prone to create while on Facebook and add to the
literature on prediction of human characteristics on social networking sites.
Facebook Interested in putting his computer science
skill to good use, coupled with his sophomoric sense of humour to create a type of "hot or not" game for Harvard students, Mark Zuckerberg, along with classmates Eduardo Saverin, Dustin Moskovitz, and Chris Hughes invented a social networking website called Facebook. This social networking website was initially made to assist Harvard University student to interact socially and get to know each other (Bellis, 2013). Initially, membership to the website was at first restricted to Harvard University students. However, other universities and colleges were later incorporated into this popular social networking site with the help of Zuckerberg’s colleagues. For example, Severin improved the business section of the website, Moskovitz worked as a programmer, and McCollum as a graphic artist. In a short while, Facebook opened up for all audiences and has been growing in leaps and bounds ever since.
Facebook differs from other social networking sites because only users or friends who are part of the same network could view each other’s profiles and posts. Unlike Twitter, users do not have access to all the messages on the site. Another unique feature of Facebook is that it allows applications of third parties to have access to certain user information via quiz or game. The website is structured to collect useful information when participants use a tool and give permission to the application to use their personal information.
Additionally, unlike Hyves, Twitter, Blackplanet and Flickr, Facebook was initially designed to host a specific audience, but due to its evolving nature as indicated by Boyd and Ellison (2007), it has embraced other users and has gained worldwide acclaim as a powerful social networking site. However, Facebook also has a marked limitation in that it grants users limited freedom of expression to construct identity or make self-presentation, users cannot choose their background and colours of their page, they have to stick to default settings.
Due to its curtailment of users’ ability to feign the ideal personality, Facebook informs an ideal condition for examining identity construction in online environments where most
123
of the users are friends and can readily meet each other when not online. It is expected that people would engage in identity construction on Facebook and adopt various ways of presenting themselves in a bid to deal with the less anonymous environment. In essence, the way Facebook is structured underpins the present study because it facilitates prediction of user’s characteristics that they would like to present their hoped-for-possible selves rather than their “true” or “hidden selves”.
It is predicted that users may characteristically emphasize or even exaggerate their identity with much emphasis on part of them that are socially desirable but not readily discernible in a brief encounter with other users, such as inner qualities including one’s character and intelligence. At the same time, they could seek to downplay part of their identities that they feel are socially undesirable, such as for overweight, shyness, or stuttering.
Though it is possible for people to emphasize or deemphasize their identity to present the better side of themselves in offline conditions, Facebook offers a unique opportunity of constructing selective identities. This makes Facebook vastly different from internet dating because those on internet dating sites create a romantic relationship with people unknown to them, while those on Facebook concretizes friendships and romantic relationships among people known and unknown to them. Hence, Facebook is an ideal social media to predict how people will present themselves in terms of strength and weaknesses, what want others to feel about them to the end of leaving a lasting impression on the minds of other users.
Recently there has been much pressure on Facebook executives to review the privacy policy and make Facebook less anonymous. This is as a result of Facebook leaking users' data to Cambridge Analytical for influencing voters in several countries including Nigeria and the United States. At present, Facebook is in the process of revising its policies on privacy.
However, Roettgers (2018) and Oremus (2018), citing Egan (Facebook Chief Privacy Officer) and Beringer (Deputy General Counsel for Facebook), indicated that Facebook will not fundamentally change its stance on user’s data rather they will render the policies in a language easier to read, spelling out the data they collect and how they use such data within their platform
and with third parties. The two executives indicated that the revision is not yet finalized. Notwithstanding, it thus underscores the fact that the user's information is more anonymous than was previously thought. As a result, it is worth examining how users construct identities given the prevailing issues surrounding personal data on Facebook.
Literature Review The advent of the internet has revolutionized
the traditional conditions of predicting human characteristics or mode of constructing identities. With the inability of users to experience physical contact during the online encounter, it becomes possible for student A in Accra to interact with student B in Kumasi on the Facebook thinking he is communicating with a lady whereas offline (the real world) a young man is posing as a lady. Because of such tendencies, starting from the 1990's researchers have been conducting investigations into various possibilities and implication the internet would hold for the social conception of identity. Turkle (1995) for example investigated the potential for fragmented, multiple postmodern selves and arrived at the following submission: “computer-mediated communication can serve as a place for the construction of identity” (p. 14).
In his study, Hawisher (2004) examined feminist concepts such as affinity politics and oppositional consciousness through the idea of the Cyborg (a being with both organic and cybernetic parts) and sought to reject boundaries such as those between man and machine. In their studies, Zhao, Grasmuck, and Martin, 2008 indicated that due to the link between disembodiment and anonymity, social media creates a technologically mediated environment that paved way for the emergent new mode of identity production. Social media platform such as Facebook has unique features that allow people to “play-act at being someone else or to put on different online personae that differ from their ‘‘real life” identities” (Zhao et al., 2008, p. 1818).
Since online users are aware of the fact that there is no physical contact between them and the other individual, they tend to hide their undesired physical characteristics and re-create their biography and personality. The user could pretend to be of another gender (a man may present himself as a woman), pretend to be an
124
extrovert while in the real world is an introvert. Research has shown that social media cannot reveal the inner qualities such as stuttering, shyness, or vindictiveness hence makes it possible for users with these traits or characteristics bypass the usual obstacles that prevent them from constructing desired identities in face-to-face settings (McKenna, Green, & Gleason, 2002). Findings of Suler (2002) and Rosenmann and Safir (2006) studies revealed that social networking sites are an ideal location for predicting human characteristics since it enhances users' ability to construct any type of identity that interests them and impresses their audience.
However, Zhao et al. (2008) indicated that the online world is not entirely anonymous. Family members, neighbours, colleagues, and other offline acquaintances also communicate with each other on the Internet. More importantly, most social networking sites, according to Roettgers (2018) and Oremus (2018) often have records of a person’s legal name, residential location, and institutional affiliations and shares this information with third parties. This means users are fully aware that the social media sites are anonymous, hence they construct identities to heighten positive traits and downplay negative ones.
In their book: Handbook of self-determination
research, Deci & Ryan (2017), sees self-determination theory as a macro theory of human motivation and personality, concerning people’s inherent growth tendencies and their innate psychological needs. Essentially, self-determination theory addresses three universal needs: competence, autonomy and psychological relatedness. According to Deci & Ryan (p. 227), needs "specify the necessary conditions for psychological growth, integrity, and well-being." Relatedness, on the other hand, is about being connected to others by caring or being cared for (Wang et al., 2008). Competence is described as the effecting-focused ability to produce valued outcomes and experience mastery which in turn implies the desire for information-based learning, while autonomy refers to a person's volition – the desire to self-organize experience and to engage in activities that are in harmony with one’s sense of the self (Deci & Ryan, 2012).
These three aspects of personality are invaluable to understanding what and why
certain goals are pursued by actors in a social context. Motivation, according to Deci and Ryan, is very important because it lies at the bottom of the three characteristics mentioned earlier and it serves as the driving force for the three qualities, hence, there might be variation in what individuals need for competence, autonomy and relatedness.
As a result, it could be inferred that individuals are not simply passive and act only when they have to replenish perceived deficiencies of need fulfilment, but they also proactively and self-determinedly engage in activities that interest them and develop or actualize their potential. This is only possible as long as they are "in a context that allows needing satisfaction" (p. 230). This means that most activities people are interested in challenges their curiosity, openness and assimilation, culminating in positive resonance not necessarily because a need must be fulfilled but due to the mental exercise involved in such activities and the actualizing of their fantasies and innermost desires.
Deci & Ryan' study underpins the present study and sets the background for research domain: an empirical assessment of how quantitative data, or their change between two observation, may be perceived as effective reflective cues, about personal development in terms of satisfying intrinsic and higher-level needs, such as the need for relatedness, competence and autonomy which are often reflective in identity construction or self-representation on social networking sites such as Facebook. As a result, the present study shall unveil and discuss new dimensions in the performance and construction of identity by university students on the less anonymous online website – Facebook.
Methodology The study is rooted in survey research
paradigm. The choice of this research design was informed by its appropriateness and suitability. Mizner (2008) posited that survey research provides a high level of general capability in representing a large population. Due to the usual huge number of people who answers the survey, the data being gathered possess a better description of the relative characteristics of the general population involved in the study. As compared to other
125
methods of data gathering, surveys can extract data that are near to the exact attributes of the larger population. Moreover, Zhao et al (2008) and Ginger (2008) employed it in recent research similar to the present research with appreciable results.
Population and Sample The population was made up of the all the
first and third-year undergraduate students of the University of Ghana, Legon. The first-year students were selected by the researcher because they have less academic workload and under their level, the third-year students are not under much pressure academically like the second and final year students. The stated academic context of the first and third-year students allows them ample time to visit Facebook frequently. Using purposive sampling, a total of 240 undergraduate students was selected. The researcher employed purposive sampling because, the selection is by choice; the sample chosen is thought to be typical of the universe concerning the characteristics under investigation (Etikan, Musa, Alkassim, 2016).
The research site for the present study was the University of Ghana (UG). As Ghana's premier university, it was founded in 1948 as the University College of the Gold Coast-based on the recommendation of the Asquith Commission, on Higher education in the then British Colonies (Ofosu-Ampong, 2016; Ranking Web of Universities, 2018). The research site was selected due to its location and proximity. Located in Accra, the heart of Information Communication Technology in Ghana, social networking sites are popular among UG students (Kolan & Dzandza, 2018). Also, being a resident of Accra and within walking distance to the institution, data collection was relatively easy. Both factors (location and proximity) enriched the findings of the study.
Instrumentation The major research instrument used was the
questionnaire. Open-ended and closed-ended questions were used. Section C of the questionnaire contained structured questions based on a four Likert Scale where Always was 4, Sometimes 3, Rarely 2, and Never 1. The questionnaire was made up of three major
sections. Section (a) consisted of items dealing with the frequency of users to Facebook, section (b) contained items designed to measure respondents’ effort in updating their profiles on Facebook while section (c) looked into how people construct and perform identity on Facebook.
Data Collection Procedure The researcher was assisted by some course
representatives during the administration of the questionnaire, the main instrument for data collection. This was to promote participation and a high return rate of the questionnaires from respondents.
Results The analysis was done concerning the stated
research questions. First, to answer research questions 1 and 2, simple frequencies were run for section A and B of the questionnaire using percentages and tables. Second, an adequate answer was provided regarding question 3 by calculating the average-mean of responses about section C of the questionnaire. The aggregate conjecture of the data aided confirmation of predicted characteristics of Facebook users in the research site.
Analysis and Discussion Identification of student’s activity on
Facebook is primarily important to deciphering how the type of trait or self-presentation they would construct on Facebook; this matter is treated in researcher question one (1).
Research Question One (1): How often do users visit Facebook? This question is meant to reveal how frequently and intensively Facebook users visit their profiles and make necessary contacts, conversation, and announcements. Table 1 provided an answer to the first research question.
Table 1 shows that the majority (48.3%) were visiting at least once to two times a day. This means that many students are digitally oriented and desired to make and retain friends on popular Facebook. Many though, (21.7%) visit the site three to four times daily, while only 6.7% visited the site three times a week and 3.3% less than once a week. These statistics suggest that participants log on
126
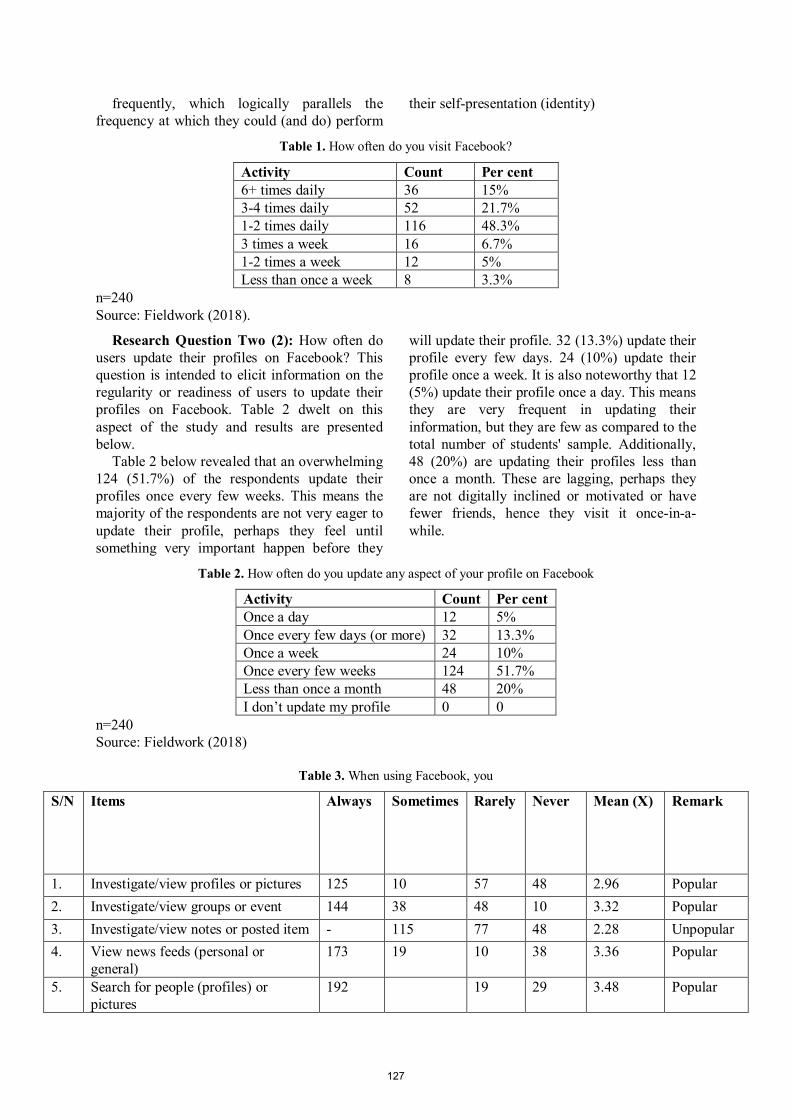
frequently, which logically parallels the frequency at which they could (and do) perform
their self-presentation (identity)
Table 1. How often do you visit Facebook?
Activity Count Per cent 6+ times daily 36 15% 3-4 times daily 52 21.7% 1-2 times daily 116 48.3% 3 times a week 16 6.7% 1-2 times a week 12 5% Less than once a week 8 3.3%
n=240 Source: Fieldwork (2018).
Research Question Two (2): How often do users update their profiles on Facebook? This question is intended to elicit information on the regularity or readiness of users to update their profiles on Facebook. Table 2 dwelt on this aspect of the study and results are presented below.
Table 2 below revealed that an overwhelming 124 (51.7%) of the respondents update their profiles once every few weeks. This means the majority of the respondents are not very eager to update their profile, perhaps they feel until something very important happen before they
will update their profile. 32 (13.3%) update their profile every few days. 24 (10%) update their profile once a week. It is also noteworthy that 12 (5%) update their profile once a day. This means they are very frequent in updating their information, but they are few as compared to the total number of students' sample. Additionally, 48 (20%) are updating their profiles less than once a month. These are lagging, perhaps they are not digitally inclined or motivated or have fewer friends, hence they visit it once-in-a-while.
Table 2. How often do you update any aspect of your profile on Facebook
Activity Count Per cent Once a day 12 5% Once every few days (or more) 32 13.3% Once a week 24 10% Once every few weeks 124 51.7% Less than once a month 48 20% I don’t update my profile 0 0
n=240 Source: Fieldwork (2018)
Table 3. When using Facebook, you
S/N Items Always Sometimes Rarely Never Mean (X) Remark
1. Investigate/view profiles or pictures 125 10 57 48 2.96 Popular 2. Investigate/view groups or event 144 38 48 10 3.32 Popular 3. Investigate/view notes or posted item - 115 77 48 2.28 Unpopular 4. View news feeds (personal or
general) 173 19 10 38 3.36 Popular
5. Search for people (profiles) or pictures
192 19 29 3.48 Popular
127
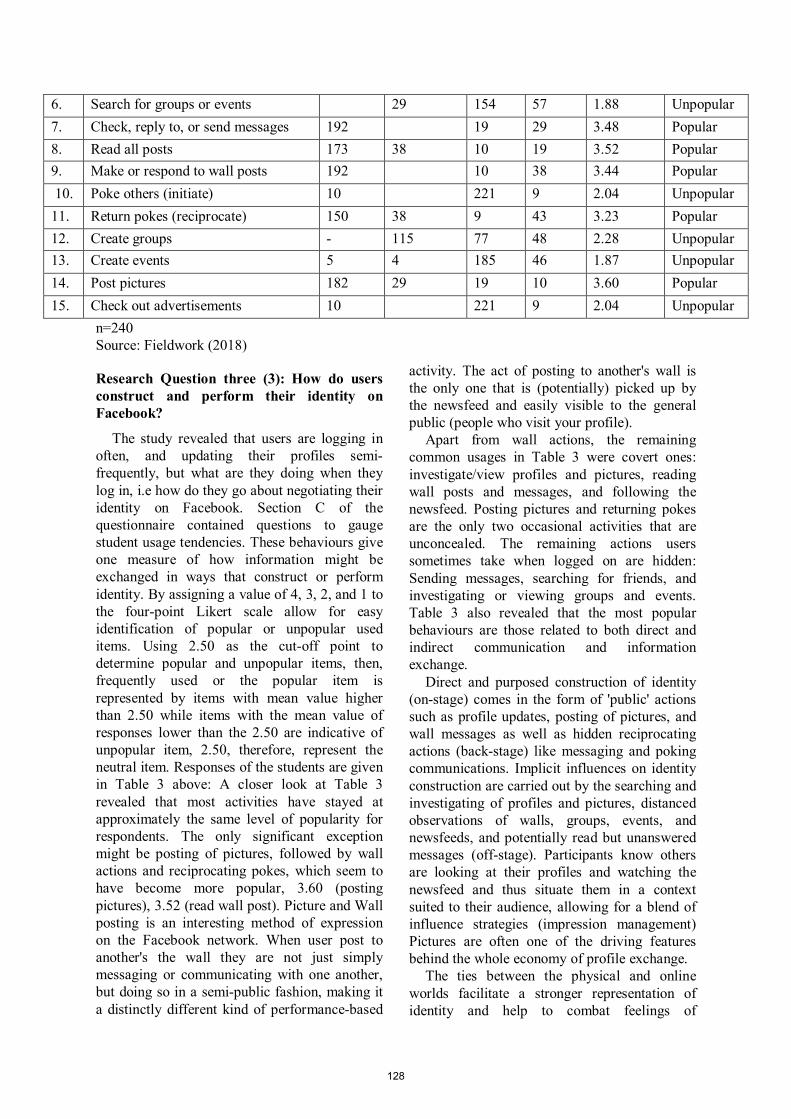
6. Search for groups or events 29 154 57 1.88 Unpopular 7. Check, reply to, or send messages 192 19 29 3.48 Popular 8. Read all posts 173 38 10 19 3.52 Popular 9. Make or respond to wall posts 192 10 38 3.44 Popular 10. Poke others (initiate) 10 221 9 2.04 Unpopular 11. Return pokes (reciprocate) 150 38 9 43 3.23 Popular 12. Create groups - 115 77 48 2.28 Unpopular 13. Create events 5 4 185 46 1.87 Unpopular 14. Post pictures 182 29 19 10 3.60 Popular 15. Check out advertisements 10 221 9 2.04 Unpopular
n=240 Source: Fieldwork (2018)
Research Question three (3): How do users construct and perform their identity on Facebook?
The study revealed that users are logging in often, and updating their profiles semi-frequently, but what are they doing when they log in, i.e how do they go about negotiating their identity on Facebook. Section C of the questionnaire contained questions to gauge student usage tendencies. These behaviours give one measure of how information might be exchanged in ways that construct or perform identity. By assigning a value of 4, 3, 2, and 1 to the four-point Likert scale allow for easy identification of popular or unpopular used items. Using 2.50 as the cut-off point to determine popular and unpopular items, then, frequently used or the popular item is represented by items with mean value higher than 2.50 while items with the mean value of responses lower than the 2.50 are indicative of unpopular item, 2.50, therefore, represent the neutral item. Responses of the students are given in Table 3 above: A closer look at Table 3 revealed that most activities have stayed at approximately the same level of popularity for respondents. The only significant exception might be posting of pictures, followed by wall actions and reciprocating pokes, which seem to have become more popular, 3.60 (posting pictures), 3.52 (read wall post). Picture and Wall posting is an interesting method of expression on the Facebook network. When user post to another's the wall they are not just simply messaging or communicating with one another, but doing so in a semi-public fashion, making it a distinctly different kind of performance-based
activity. The act of posting to another's wall is the only one that is (potentially) picked up by the newsfeed and easily visible to the general public (people who visit your profile).
Apart from wall actions, the remaining common usages in Table 3 were covert ones: investigate/view profiles and pictures, reading wall posts and messages, and following the newsfeed. Posting pictures and returning pokes are the only two occasional activities that are unconcealed. The remaining actions users sometimes take when logged on are hidden: Sending messages, searching for friends, and investigating or viewing groups and events. Table 3 also revealed that the most popular behaviours are those related to both direct and indirect communication and information exchange.
Direct and purposed construction of identity (on-stage) comes in the form of 'public' actions such as profile updates, posting of pictures, and wall messages as well as hidden reciprocating actions (back-stage) like messaging and poking communications. Implicit influences on identity construction are carried out by the searching and investigating of profiles and pictures, distanced observations of walls, groups, events, and newsfeeds, and potentially read but unanswered messages (off-stage). Participants know others are looking at their profiles and watching the newsfeed and thus situate them in a context suited to their audience, allowing for a blend of influence strategies (impression management) Pictures are often one of the driving features behind the whole economy of profile exchange.
The ties between the physical and online worlds facilitate a stronger representation of identity and help to combat feelings of
128
disembodiment. Sharing through pictures may be less assertive. However, as viewing a picture does not notify the owner of the picture that someone is looking at it, users seem to browse (investigate) more than they actively and intentionally search for specific people, groups, and events in the system. The newsfeed, however, offers an interesting mixture of potentially passive observation and indications of assertive characteristic or behaviour. Some items, like the breakup of a romantic relationship, group and application involvement, and status changes are also tagged by the newsfeed but were not included above in the collection of widespread routines.
Significantly, Table 3 indicates that the newsfeed 3.36 (popular) has become viable, or at least, accepted way of sharing one's activities, constructing identity information, and otherwise communicating indirectly (and potentially unintentionally) with the mass. While some users may not purposely act to perform for the newsfeed, they at least know that it’s observing them. The fact that far fewer people initiate pokes 2.04 (unpopular) than return them probably indicates fewer poke starters than people willing to engage in poke-exchanges.
The most assertive activities, such as creating events, groups, and poking others as well as the ones least directly connected to people, such as viewing groups, events, the pulse, and posted items, were the ones of lowest occurrence. Advertisements 2.04 (unpopular) were one of the least often engaged items on Table 3, which is perhaps not surprising, but unfortunate news for marketing agents who feel Facebook is the best place to get their product to take off.
Ginger (2008) and Compete.com (cited by Freiert, 2007) also conducted similar studies to determine what Facebook visitors were doing most on the website. Their findings are consistent with those explained here though they sourced data via a different method. For example, Compete.com tracked only behaviour, wall posting was not examined. Their study was not user-reported or empirical data but instead collected data by analysis of system statistics. Unlike this study, Compete's results ranked browsing of profiles as the most frequent activity, followed by browsing pictures and interacting with applications. Ginger, on the other hand, studied the differences between users based on the number of friends on other
networks and also analyzed the demographics of participants.
Findings The major findings emanating from the
research include the following: i. It was discovered that Facebook subscribers
have many opportunities to perform their identity on Facebook, hence several students investigated are frequently (Table 1, item 3 (48.3%) visiting the site once or two times a day for connections, making and retaining friends and the likes.
ii. The investigative study also revealed on Table 2, item 4 that majority (124 (51.7%)) of the respondents are updating their profiles once every few weeks, this means they are semi-frequent in updating their profiles. This may also suggest that are very actively involved or passive about such matters but are rather interested in checking postings or events on the site.
iii. The study also revealed that majority of the respondents is highly interested in posting pictures (3.60) followed by wall posting (3.52) as depicted in Table 3, item 8 and 14. These are veritable means of constructing and performing individual identities on Facebook.
Conclusions Given the findings emanating from this study,
the following conclusions were drawn: a. In line with the analysis presented above,
the majority of the students showcased themselves indirectly through photo and wall posting on Facebook. In this way, it was shown that most of the respondents display mediated interaction due to being online and expected their audience to respond alike. Respondent tailored their characteristics or identity towards wanting their audience like them, to be desired by their girlfriend and sought after by popular users.
b. The study also showed that the virtual (online) world is not a dreamland for deviant behaviour. As it is expected of an individual to behave according to established norms; conformity to norms will be rewarded and deviations from them will be punished. On the Facebook environment, individuals can be held accountable for deviant behaviours,
129
hence users maintained adorable personality or identity, in harmony with normative expectations.
c. It was also seen that several users downplay unfavourable characteristics while highlighting positive ones.
Recommendations Based on the findings and the conclusions
enumerated above regarding the construction and performance of identity on Facebook, the researcher made the following recommendations:
1. All users of the Facebook network should be wary in their approach to matters on the website because Facebook allows subscribers to partition their Facebook pages into many “back” and “Front” regions in this case staging different identity shows for different audiences. One should not be deceived into believing what may later hurt him physically and otherwise.
2. Also, because of the recent development regarding a privacy issue, it is recommended that Facebook should refrain from technical approach to seeking the consent of users, of which, on several occasions, they are not aware of how their personal information is being used. Facebook executives should be transparent and revise their privacy policy to facilitate users’ informed decision.
References [1] Banks, A. (2006). Race, Rhetoric, and
Technology: Searching for Higher Ground. Mahwah, CT: Lawrence Erlbaum Associates. [2] Bargh, J. A., McKenna, K. Y. A., & Fitzsimons, G. M. (2002). Can you see the real me? [3] Activation and expression of the ‘‘true self” on the Internet. Journal of Social Issues, 58(1), 33–48.
[4] Boyd, D. M. and N.B. Ellison (2007) ‘Social Network Sites: Definition, History and Scholarship’, Journal of Computer-Mediated Communication
13(1). [5] Brennan, G., & Pettit, P. (2004). Esteem, identifiability and the Internet. Analyse & Kritik, 26,
139–157.
[6] Cassidy, J. (2006). Me media. The New Yorker (May 15), 50–59. [7] Clark, L. S. (1998). Dating on the Net: Teens and the rise of ''pure relationships". In S. G. Jones (Ed.), Cyberspace 2.0: Revisiting computer-mediated
communication and community (pp. 159–183). Thousand Oaks, CA: Sage. [8] Douglas, K. M., & McGarty, C. (2001). Identifiability and self-presentation: Computer-mediated communication and intergroup interaction. British Journal of Social Psychology, 40, 399–416.
[9] Ellison, N., Heino, R., & Gibbs, J. (2006). Managing impressions online: Self-presentation processes in the online dating environment. Journal
of Computer-Mediated Communication, 11(2)
(article 2).
[10] Ellison, N.B., C. Steinfield and C. Lampe (2007) ‘The Benefits of Facebook ‘Friends:’ Social Capital and College Students’ Use of Online Social Network Sites’, Journal of Computer-Mediated
Communication 12(4). [11] Etikan, I., Musa, S. A., Alkassim, R. S. (2018). Comparison of Convenience Sampling and Purposive Sampling. American Journal of Theoretical and Applied Statistics. Vol. 5, No. 1, 2016, pp. 1-4. doi: 10.11648/j.ajtas.20160501.11 [12] Freiert, M. (2007). “Facebook now ranked 3rd in Page Views; MySpace down nearly 20%.” Compete.com. September 11. [13] Gibbs, J. L., Ellison, N. B., & Heino, R. D. (2006). Self-presentation in online personals: The role of anticipated future interaction, self-disclosure, and perceived success in Internet dating. Communication Research, 33(2), 152–177. [14] Ginger, J. (2008) (2nd Ed.) Performance and Construction of digital identity. The FacebookProject.com. (http://www.thefacebookproject.com/research/jeff/pu
blications/genderroles.html)
[15] Girard, R. (1961). Deceit, desire, and the novel:
Self and other in literary structure. Baltimore: John Hopkins Press. [16] Goffman, E. (1959). The presentation of self in
everyday life. New York: Doubleday. [17] Goffman, E. (1963). Behaviour in public places. New York: The Free Press. [18] Hawisher, G. E., Cynthia L. S., Brittney Moraski, and Pearson, M. 2004. “Becoming Literate in the Information Age: Cultural Ecologies and the Literacies of Technology.” College Composition and
Communication 55:642-92.
[19] Higgins, E. T. (1987). Self-discrepancy theory. Psychological Review, 94, 1120–1134. [20] Kolan, B. J., & Dzandza, P. E. (2018). Effect of social media on the academic performance of students in Ghanaian universities: a case of the University of Ghana, Legon. Library Philosophy and Practice (e-journal). 1637, pp. 1-24.
130
[21] Markus, H., & Nurius, P. (1986). Possible selves. American Psychologist, 41(9), 954–969. [22] Marx, G. T. (1999). What’s in a name? Some reflections on the sociology of anonymity. The
Information Society, 15, 99–112.
[23] McKenna, K. Y. A., Green, A. S., and Gleason, M. E. J. (2002). Relationship formation on the Internet: What’s the big attraction? Journal of Social Issues, 58(1), 9–31. [24] Ofosu-Ampong, K. (2016). The uptake of the institutional repository: the case of the University of Ghana. Unpublished thesis submitted to the University of Ghana. [25] Oremus, W. (2018). Facebook is passing the Buck. https://slate.com/technology/2018/03/Facebook-responds-to-Cambridge-Analytica-scandal-says-its-outraged-that-we-were-deceived.html . Retrieved June 4, 2018. [26] Porter, C. E. & Donthu, N. (2006). “Using the technology acceptance model to explain how attitudes determine Internet usage: The role of perceived barriers and demographics.” Journal of Business Research 59:999-1007 [27] Perez-Torres, V., Pastor-Ruiz, Y., & Ben-Boubaker, A. (2018). You Tubers videos and the construction of adolescent identity. Communicator, Vol. 26, No. 55, pp. 61-70. [28] Ranking Web of Universities (2018). Retrieved June 3, 2018, from http://www.webometrics.info/en/Africa/ghana [29] Roettgers, J. (2018). Facebook admits to scanning private messages, releases privacy policy updates. https://variety.com/2018/digital/news/facebook-policy-updates-1202743819/. Retrieved June 4, 2018. [30] Rosenberg, M. (1986). Conceiving the self-Malabar, FL: Robert E. Krieger. Rosenmann, A., and Safir, M. P. (2006). Forced online: Push factors of Internet sexuality: A preliminary study of online paraphilic empowerment. Journal of Homosexuality,
51(3), 71–92. [31] Stone, G. (1981). Appearance and the self: A slightly revised version. In G. Stone and H. A. Farberman (Eds), Social psychology through
symbolic interaction (2nd ed., pp. 187– 202). New York: Wiley.
[32] Stone, A. A. (1996). The war of desire and
technology at the close of the mechanical age.
Cambridge, MA: MIT Press. [33] Stutzman, F. (2008). Data Portability. " Unit
Structures. July 2. [34] Suler, J. R. (2002). Identity management in cyberspace. Journal of Applied Psychoanalytic
Studies, 4(4), 455–459.
[35] Surratt, C. G. (1998). Netlife: Internet citizens and their communities. New York: Nova Science. [36] Turkle, S. (1995). Life on the screen: Identity in
the age of the Internet. New York: Simon and Schuster. [37] Twumasi, P. A. (1986) Social Research in Rural
Communities: the problems of fieldwork in Ghana. Accra, Ghana Universities Press*Pp. 109. [38] Walker, K. (2000). ‘‘It’s difficult to hide it”: The presentation of self on Internet home pages. Qualitative Sociology, 23(1), 99–120.
[39] Yurchisin, J., Watchravesringkan, K., & McCabe, D. B. (2005). An exploration of identity re-creation in the context of Internet dating. Social
Behavior and Personality, 33(8), 735–750.
[40] Zacarés G. J., Iborra, C. A., Tomás, M. J., & Serra, D. E. (2009). Identity development in the adolescence and emergent adulthood: a comparison of global identity versus identity in specific domains. Anales De PsicologíA / Annals of Psychology, 25(2), 316-329. Retrieved from http://revistas.um.es/analesps/article/view/87931/84641 [41] Zhao, S. (2006). Cyber-gathering places and online-embedded relationships. In Paper presented at
the annual meetings of the eastern sociological
society in Boston.
[42] Zhao, S., Grasmuch, S., and Martin J. (2008) Identity construction on Facebook: Digital empowerment in anchored relationships. Computers
in Human Behaviour, pp. 1816 – 1836.
131