Embed Size (px)
Citation preview
qfq.cF'2];I
arra d q]-Jruil{ ('zi ilG-ar q{ sf',ta srr{fr-q q-q-dTft-fr g{erur {rsfi-q qF-dqt n-deT"T (!-arrga-fl)
*" ood qk * !6 aTrrl * sq' d E-dT* zo )s d qa zoro il' dl-{rd f}-qr rr+l-r Fs s{eJot d gTR-d dq)-qrTru trd a-d-d-qq * Efuq vrg$ tr{ q ,rn $fr qrR-dTR-m- Fqrsqt $ €-q-d g'o zuFaara Bfqlsd-dTtcf$- 5ar, trlzr, qrrd-Hr-fl;q a-E dm-trfi tq'Tqil 6f Ff,{. q}eTFm rr€er3i d qf,flra sqRrF, qrcrr--, , ,(- lE, .- , fAv^----qqqrq+- qTQIqrq. $-cqtft qr {rs-frq qq r.'r Fdftq qilaT €-qtrd fir rT-$r ls ffi8 fr F-Fqrt 3flR *--\r-- : . r\ . --Y-qr{r61 tl,rrFcr nrq'=} w:+tcl|Fd, gTt-{d fi Fr'Et4-$ trE a-rR} h Fm fir {t-d4R rrq fisfll ft F.4F t€-FeFwd3r{'fl1-fl uq rs$ €F,irq REq Bf:'ta-461"1 mt u+ja fu-qr qeT ill
ood dk * b-;frq qF"-qqt 3ri6-si + HTIIrr q{ (rd(rsu{T3il A erra di d-rTrTR r'q fta-qn zooe-to il ryru wilao qa zolr fr artt Fo('t .rsh.rror* a-da-s(r€ S'ood ak * s{eror 3lingt S'sirrnw ta,ry{ uq trf,4ru h frEq qegEtr q-{ +tto fu-cqa foiit aft 6-{A fir qt.r-dT d-fl-S rT$ tr snr ffiR$e arft ft ar g-6r Hr ad-ara Rmf 'ffirr * aFr-d-rrli w a-rRt d toryl azi trwTr{ fir RqF'gff+}u|t fr 3il"6fr r'q 3rF=fr Rttl)-t tt orfqa ir'r fifl frf-f;a Fq) qefl- Hl-rrcq E;+q. cf,ara srcalFo sa*t$re"ga-{T) ('E ild-fla tF-o r-Or (fiSrc'.,r) 6I s-d-aril m.€ gq anqr urfl tt E;rlrut;rl zool firEon M t il sa;n$=e FrFIa-rRt d (3{c ''rq fr-fl fr q'fie-q) ffit wassfl a"t frfuqa qr s-+r$3r|q6 (3{rcF.R 4ulr I) t a-q a-rRt fi d Er;q rilorri fi Ra s+r ?Teil so,ooo t sw q-a ('"F' frR-q-fl d o-o(rrrorq,aM z) 3fk ffiilft s-d-€-cqr So,ooi, d ma (3ilznrq M:l t, q-atfi fi R!.€rlsn'e-arfr 4Srg-s Rg]"8 d fr"d 3{t,{r-q \rE qR qftf,a'rs-c t r 5s ftd-3 fr Rr' au rg'ara} d €-iqFla ryu Fl-os- ioff i --S- -; ' ---i{L-qtq dt;I 4 u-c-Ea fra-} zrn t | 3rTsqr-q ',R di r€FrrEt;Tr t 3ik 3i{Lqrq q} fr F€ ndt d frf$-;a a-q}q-r Foq lrc' $ferq d qgcF-d sq-Fq"il3,il r'r qP{e{r-Er3i ft fu€Ea ila-firft fr "r$ tI 3{fu'f, srTTtrqF'- _,__-___+v FFrd-qa lrnuil rfrfl q{ T6 R:qtl rnqnfta i, R:qi8 *'srlr qftfa}N-c'6'fr uuEa fr aT-$ tr qFqat
sf$m-,-q uq qr+o-f,fl qfu.qr or fu-*-qa Etrrq sftfQls-d'q'd ft-qr qer tt sftfQls-c'ur'fr 3rr{fr3ilt6T-q1E-q rrf 1 and'zoog r'q t enf, zors;r't fr ffi qelfud d;rflEqT t r a-aqfr zoro fir a-+euqr o)qTaznfud fu.qr "rrqr t r qRfqlsd 's', qlr ji 1s-dm rdq-fr 6r rt-{t€ {r rTt t r
r.al'sa-{T3r} * gfqrq rrfso-cq q-q rgutna qslrq (a-f,&3{R*) i wfelur orffi uq Rltt h--. \_ a_=_ _aqrsrl 6lclcF-fg ot ffir Fft efrr (raa-s(rur+fr b'ef{ Tifrr$ qelrlr (\'tr3rtfr) * et{ znr$ WT fu-qT s-qfu
t\ a'-.------sqfr T.Itrrrfa uq qTwfr-{a m-I 6T-S u ltgt'g:lt €-d-+- hcrr+a qe{rll (fiS-&) 6Rr frrqT rrcrrllaq's(.{T3il h' lrm;qq qq q-dilqg qerr4 (rttffi1 i s{eil t s#qf,qd fuf,$;a ffif 6T Hfl;qqFqrfl t
r'+r'sqsgfi fir q-6 mtf,qlqr {fr t 1 F' s!-i wdqil fi RNtt ('?i qftqrff, siirgT-q-qtfldT3n fir-.--;^.-^t --\ --3il?FTHr3lT m.I qll zn-{i * fr(r sflq q{ F r,rori Gr {s s{qTur b qcu qftuTra u+ a+r$ eal $Het{ 6I-4 h WT fi-} * \16 at' b efr-d-{ ,rft 6-{ ftd ?rn e} r +5 v-+awr.w:i} * frfSE qeTrai fi
h drcr fuf,s;a +rffii (r4 ]ildftfl F-d-sd 3ik Arqrcf, b- o-nq aa.tT ua('{T('s3il filr6lq6. gfunrfui * qrffii fi o-fu-n rt6+fl fr srrq dr wmr tr d !aa-€!.run * ooti dk *dr-d-<-d s{F a-E {rsfiq nrffiq 3rd-rT (r, rus$I) m} sdeilrT il fufuq ran} qt l+h rp-+ra Ei?kaffr+- ( - \ , , - - . - - oF : ,6 rfi(r:rentT (t fr sa frqlvri an efr 3TTenJI ( A Rml oi gtn-ri'fi fr!.3rrfr e-flq.,-?T ftrqFrqY-S, rl ,( l 6 t
fr snqn 6-{aI ( fu qO Rd-8 *s rrm-rq}. frF F"rlFT3n 3ik qrtcrardt3{i fi Rq sq-ffi Ftl?r rS-€-h fr\'-q qFq !-{ sariqla h gury fi. fr,' Tflr-q elr6frq Ft-nr
f1r't '4': '(fuTq g-aN)
a-Otfrlqrfr aET ry3q o-rffi 3rffi{Ts-^Eq qR-{qf sderq- o.rqtdq
;rS fu-.frR-aacrr zor:
l f l { l ' :1,". .1( ' l i .
An all-llriiia quinqrtesilriu.i sltrrtf i"rtr ctrrlllt]I'tilstit otnl uttcrlrpkrl.rrrt'nt in lndiii **' c$rriL:rl lrr[iiurlrtg lhu grs1i161 Juil ltltlt) tr Junc l{il{} ar a lr;rrt ui'tilu fr{r'$ rirrrn,ri t,ri'thc Natir.tn;ll Tnnrplr 5rr*'*1tNSSI. ln thir {urts}'. it"rtirrnr:ltir}n r!n \;ttir}lrq I rr,:sli tf'etnplt5nlrn{ i}nd ru}*fllp[t]]llrent ir] lricli;r ari*J:l-tllf rndil'idr"ml rharactcrii,ti*s assr.rri*tt:d rtrllr li,,ru*efti:ld trterttlrgr-r.,uch J-\ u!:*. *:ri" lcvul lrl'gq:nur*i;lrrd lucltnicral cduuatictri uttairriC. rrlrrcrri.rllrrr.lrurc{ in crluratinriui in:rtituti*}rs. lol;tti*n;li trulnr*1:rEcciv*i. err . w*:r* r,:*lleutetJ "ill {hf ni}l{}n;l} iln(i !t*tf levEl, *lts*rj iin ti}{ rlatlr crJ}ette,J ilurirrg tllecrltire prril:d" fsfi$lates pcltaining tt"'rr:rpilr),rIrcr:rl * iul{t$pl,-'r,rtrenl situ;rtiertr,-ri pcupir irr citicr urklIutttls rn Indin nti*g lrith r.*riurrs charscturi.it'ur;nslt:i;ttEd r+ith th*rn hilvc hc$n Frercntrii rn tlricfffxlrt.
flasrtl ,.ur thu i:errlritl xil*tp$r: r.lstu rrl'\Sl r*fi': 'rtx'rt.lil. thu \liS{} rrlu:rr*rf th* Ar:,r /rld.{ir:{Jtr)r'1 r},,{tJ l Ip i ' . i - i . r t t * | t t ( I t | { { i } t l : l r ; l ' l l r i . t .4 r t l r f | } } / t l r i i r ; l . . | { t | ' , , . / l i i1 ' ' ; ,n ' . - ] i | | i .A1tn. r t i i : *nnt l r is .v ig | r t r | r tx i Ief { p1 i } r l i i u *p ian r t *< i t < r [ . ' q re | c t l : ' e c | * l : l a l i nus ' | r fX I t 5u | ' c t n ; r l r n1 t l l e r l l i t l t t | u r }L1 f t | p } { } \ l f 1c I I t l } $$ { l l } [ :NSS trfr* ntrutttl r.Lttlr. Sur't:ir suuh rrrA"rrls li.rr'c ;tlruxll' h*:n rulr.:irsr:rl.
'l*hc pr*$cnt r*pclt'l {Jt}
lmg l i11 .1 . '111 .1r t l l J l# |h* 'o l t t , r : I t }1 - t t | * : t l / . t r . |1 . r l , f lq4 | f t l t t t i l ' ,d , lE ! t i
vtlies !\'tlrki'urr-e itas been lneil*urt:tl {^{l'rrtg tlrrrtt rliifrrurl *pprttaltrcr \i/"- r{rrrrii,\'r{/frr,y. r'trr.,:l}!,lt,i.*,tl 't..rfrrrurir{.I*,1Lar:tIc"lrl.r,ExlJur&..}it:lr,.tf('/.),\,l-{'rrh|uhttr.ctgllsrv{l l cin*s I ci l i r .L { l istr:r i in { 'h*ptcr t t r t i th p, 'pulxt i*n * l ' r t t t{ nt i l l ion i l r f fr i }re (sir.* cl t is l} ns nwP*pttlai iein Ccnsirs ltitl I and also lir:' lnti *tiiet 5rre cl;r$$rls ol" [ri*'tts vir. tlrrrsE rvith pcrplilatir:ri 5{t,00{Jto less fhan +nr,'nrillit 'n (srze clfl$s J! lrtrJ thcsr' lr'r{i'r prrpillntion lsss thzur 1CI,Qil{} t*ize cla*x i). I'trcr{f{}rt urxntitirill thrcr"'uhaplcr-r $lxl lilrr lrppurxlr.cs"'l'h.: nt;lin lilrtlinS;x relnting t* thr *i,tirltir!c\ gircriili thlr rc:flilrt ire Fr*$i.flted in {'h;rplcr'liu'ee, t lwpter {-}ne gil't:s tlte frrrrur/r*.'fiqrlr'lntl {'hirpfrl Irrcir'iestrihg ttt tJet*il !ilf {
'l,r'.-'trI,r ct /}rrJillri '1r.. rtscd tl: t"h* 5rr!'\je \' il ' i cr.ritrte{lictt rr iih l'iu'r*r.rs ilettts
{rr\{rr i t t i rr l i t is rf t}r lr t . l 'hc t tr j tJi lerJ; i l l - lnrhn r,r i :Jrs (rt- ' \ t l l icb t l tc ruprir- i i r trx"r*tt sf{ pfrJrr; 'nturl i rr, \ppent l i r . ; \ i l }e l ; l l l r l i Jdc ie : r iF t l r ' , . l f { r | "s i I i } lF l t t |T ' , ! i * i tn i le${ I { } l ; i t i< . lnpr1t ] { { :d t t r * lsg i r 'enr : rApper l i ' x [ }t'iru Pru,[cflei,l ]ii4ruhltir.rcr tui r]ttr l" Jnrruary lttiL't dcril'crj frutu t]re l]ruiurcrr;d Pupulelir.]tr;rs i]rr
'!''
\d:rnr:lr ltXl$ imrl lot lr..larcir l{t lO ruppliu*l \ R( il {}tter: hsr hcrn prc*cn{er$ irr Ap1*-,nilix t:. AppentlixD gir,es l lacstrni le *f '1h* sr:hs. i tul* *t 'encuir l c,r i ! i t rsdi, l i t t t lw t iskl
lits Surrr:y L)*.rigri ilrld ltrssilrcli l)ivi:r,r{t {$DI{I}} eij'lhr'\SS{:} undr:rtr*rk tlrc drr*ir.iFlri*ni* l"the snr\,c\ tncl l trqluhr{} as wi: l i *: r lntf} inir , l" l l tu rcFrwl.
' l l rs l lelrJ lu'r t1i r+' ;rs c;rn' icrr l rr t l l h.r t l t t l
Fit l r- l ( . ip*rnf ir \ l ' ls [ ] iv isir-rrr {F'{)nl i .1f NIS{-} ' . ,hi le thrr. luta pr*cessi irgt intd t i lbu!f l t iof l *tLrk n"t,htttdleiJ [t; L]ala Prtrurs*illg l]irisir'rtr tlJlrl)] r,: 1..S5(]. llte l}r-cltlinilti*n xnrl l]uhli**tiorr IJirixrlrri(- Ittll ll-fiSli{} rrxirtlin*tcil vnrious s{:livitics pr'r1;tinittg t* th* tlrrrp*$}
N>*${,} has frern efid*a\"b-uring r* hnng utri its $Ltn'r,\i retuh$ a*rt rcgxnlr us r:nd;' ;lr ;xrsrihluirr ttrtetittg thr' grtirrirrg nefldlli tf dirta [s{ri. llrc kc,r reliults uf'thc Furve\ grul unit Islcl dat* u'*rer*l**sffl lr,irltin d{}c ytt}l qrf tllE tr:rnfrh:li*n uf tlt* llcld it.rrL. ltis trccarrru Sxrs*ihlc twurilse ,,f' theclJurk mndr ny lhr ui ircinls *t i l i f tcrcnt I) ivi*, ,ns r. ] l ' \SS(' , n'1' nret i t :uh:rrs pla*nrr lg i lnd exer$tr i l r ' ) *{r ' i l r iq ' rus ; rc t i t ' i t i cs invr" r l r * tJandfh( l in rdu ' , r rhd l r r tbv thc*egtpcn ing* i f ic iu is$nds ls f ' l " r r i 'N l .St l Ina it iUnkt* l I f , fhe \a t i * ** i l i t * t is t iCa l t -n l l r r r i r r r i , , , (Nt ( . ' l dnr l \ \ i l rk r ru ( i r t r r rp , r l ' \$$ { i ( r th . r r i t i * .1 f i . r rl l tsir vul l* lhlc g' .uirtuncu ir l vgriuus l tn$cr nl ' lhc ' .rrr\c\. I i lm airtr tha*ktrr l t , .r t l re [-rp*ns ictt pt"r"- iel ir l rvclrrlthlr filrnrnent\ lrr inlpm:t'e the repr:rr.
I h*pe. thi.i repcrt u'ill tx nselili lo the irlnnnsrf;- lxrlicy rnfkr'ni itrd rr:$uarcl cr* Srrgtgcrtittrrrf*r: irt:pr<rve,llcll irl" its erxrltrll t]fld Crr\.er$gu will hu higtrll itFprcuiirtuil.
n*vrv LlelhiSepenrb*r :{iil
$ ti*--t \ri.;it1' Itunr;lt )
$! rcctcur Cen$r irl & dh icl' l: rcr:r:t i,-c { }ii r curXutiunrrJ Slttnph littrr'sl' (,)Uic*

NSS Report No.553: Employment and Unemployment situation in cities and towns in Indiai
Highlights
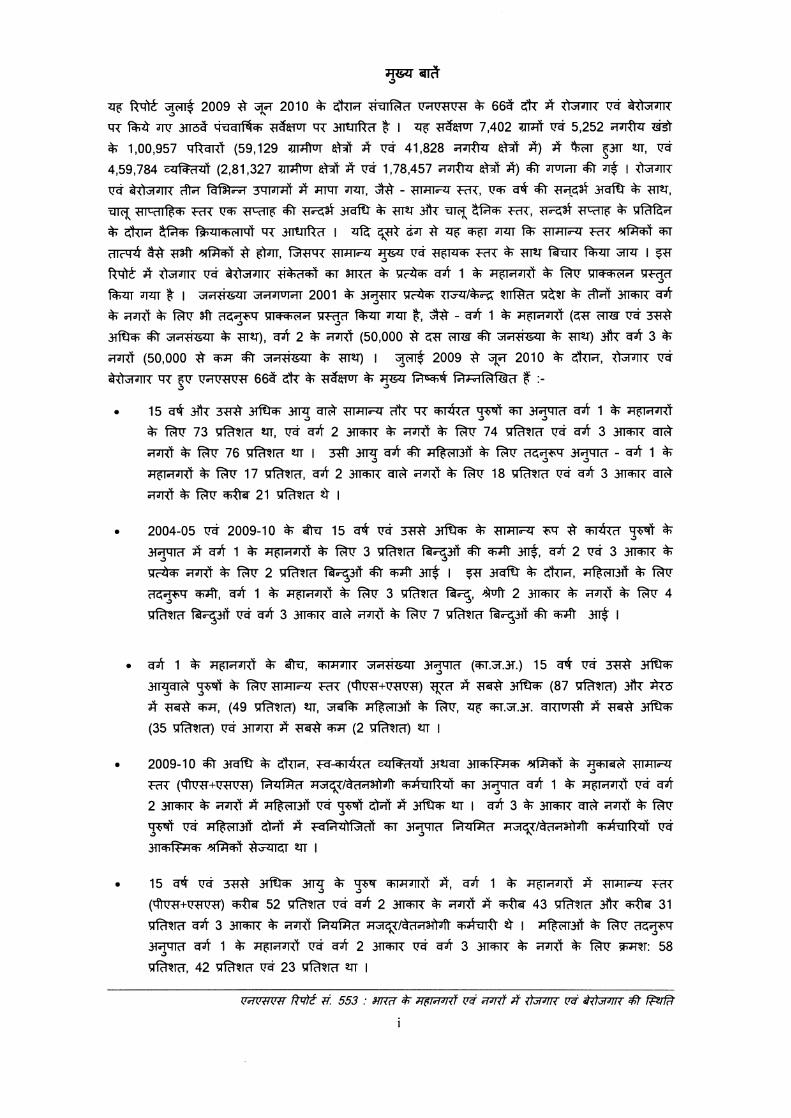
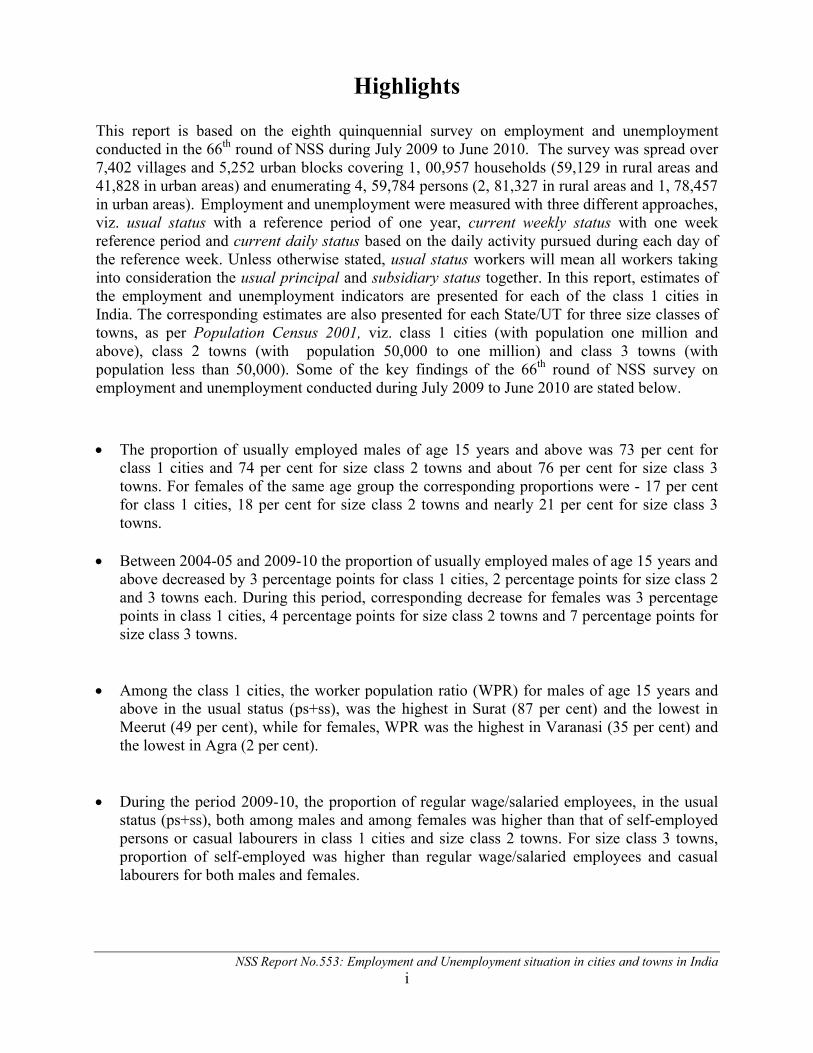
This report is based on the eighth quinquennial survey on employment and unemployment conducted in the 66th round of NSS during July 2009 to June 2010. The survey was spread over 7,402 villages and 5,252 urban blocks covering 1, 00,957 households (59,129 in rural areas and 41,828 in urban areas) and enumerating 4, 59,784 persons (2, 81,327 in rural areas and 1, 78,457in urban areas). Employment and unemployment were measured with three different approaches, viz. usual status with a reference period of one year, current weekly status with one week reference period and current daily status based on the daily activity pursued during each day of the reference week. Unless otherwise stated, usual status workers will mean all workers taking into consideration the usual principal and subsidiary status together. In this report, estimates of the employment and unemployment indicators are presented for each of the class 1 cities in India. The corresponding estimates are also presented for each State/UT for three size classes of towns, as per Population Census 2001, viz. class 1 cities (with population one million and above), class 2 towns (with population 50,000 to one million) and class 3 towns (with population less than 50,000). Some of the key findings of the 66th round of NSS survey on employment and unemployment conducted during July 2009 to June 2010 are stated below.
The proportion of usually employed males of age 15 years and above was 73 per cent forclass 1 cities and 74 per cent for size class 2 towns and about 76 per cent for size class 3 towns. For females of the same age group the corresponding proportions were - 17 per cent for class 1 cities, 18 per cent for size class 2 towns and nearly 21 per cent for size class 3 towns.
Between 2004-05 and 2009-10 the proportion of usually employed males of age 15 years and above decreased by 3 percentage points for class 1 cities, 2 percentage points for size class 2 and 3 towns each. During this period, corresponding decrease for females was 3 percentage points in class 1 cities, 4 percentage points for size class 2 towns and 7 percentage points for size class 3 towns.
Among the class 1 cities, the worker population ratio (WPR) for males of age 15 years and above in the usual status (ps+ss), was the highest in Surat (87 per cent) and the lowest in Meerut (49 per cent), while for females, WPR was the highest in Varanasi (35 per cent) and the lowest in Agra (2 per cent).
During the period 2009-10, the proportion of regular wage/salaried employees, in the usual status (ps+ss), both among males and among females was higher than that of self-employed persons or casual labourers in class 1 cities and size class 2 towns. For size class 3 towns, proportion of self-employed was higher than regular wage/salaried employees and casual labourers for both males and females.
NSS Report No.553: Employment and Unemployment situation in cities and towns in Indiaii
Among male workers of age 15 years and above in the usual status (ps+ss), about 52 per cent in class 1 cities, about 43 per cent in size class 2 towns and about 31 per cent in size class 3towns were regular wage/salaried employees. Corresponding proportions for females were 58 per cent, 42 per cent and 23 per cent for class 1 cities, size class 2 towns and size class 3towns, respectively.
Among male workers of age 15 years and above in the usual status (ps+ss), about 39 per cent in class 1 cities, about 40 per cent in size class 2 towns and about 45 per cent in size class 3towns were self-employed. Corresponding proportions for females were 33 per cent, 41 per cent and 47 per cent for class 1 cities, size class 2 towns and size class 3 towns, respectively.
For males of age 15 years and above, the unemployment rate in the usual status (ps+ss)remained at the same level between 2004-05 and 2009-10 in class 1 cities and it decreased by 1 percentage point for size class 2 towns and by 2 percentage points for size class 3 towns. For females, between 2004-05 and 2009-10, the unemployment rate in the usual statusincreased by 1 percentage point in class 1 cities and decreased for both size class 2 and size class 3 towns by nearly 2 percentage points each.
Among the workers in the usual status (ps+ss), the tertiary sector had the highest share of workers in 2009-10 compared to other two sectors in all size class of towns. Among male workers of age 15 years and above in urban India, about 59 per cent were engaged in tertiary sector, about 35 per cent in secondary sector and about 6 per cent in primary sector.Corresponding proportions for females were about 53 per cent, 33 per cent and 14 per cent,respectively.
Among male workers of age 15 years and above according to the usual status (ps+ss) in all class I cities, about 64 per cent were engaged in tertiary sector, about 35 per cent in secondary sector and about 1 per cent in primary sector. Corresponding proportions for females were about 67 per cent, 31 per cent and 2 per cent, respectively.
Among male workers of age 15 years and above according to the usual status (ps+ss) in size class 2 towns, about 60 per cent were engaged in tertiary sector, about 36 per cent insecondary sector and about 4 per cent in primary sector. Corresponding proportions for females were about 57 per cent, 34 per cent and 9 per cent, respectively.
Among male workers of age 15 years and above according to the usual status (ps+ss) in size class 3 towns, about 54 per cent were engaged in tertiary sector, about 33 per cent in secondary sector and about 13 per cent in primary sector. Corresponding proportions for females were about 36 per cent, 34 per cent and 30 per cent, respectively.
Among male workers of age 15 years and above, according to usual status (ps+ss), the secondary sector registered nearly 3 percentage points decrease in the share of total workers during 2009-10 compared to 2004-05 for class 1 cities but increased for size class 2, size class 3 towns by 2 and 1 percentage points respectively.
NSS Report No. 553: Employment and Unemployment situation in cities and towns in India
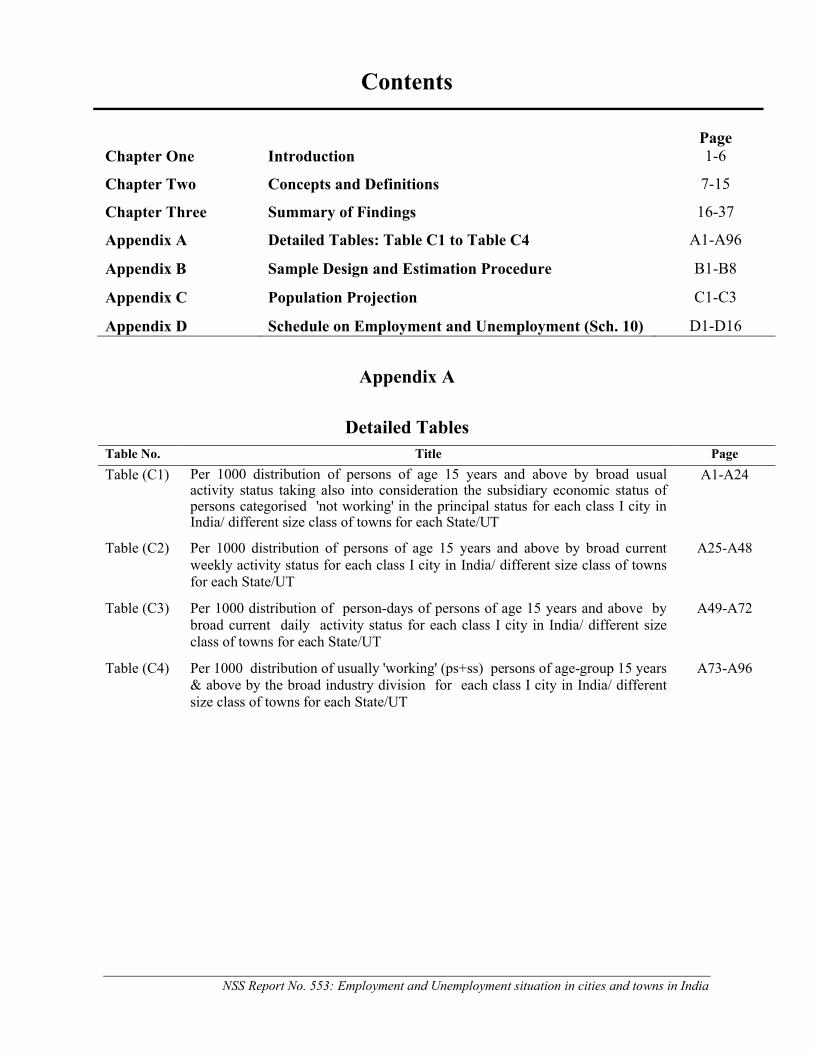
Contents
PageChapter One Introduction 1-6
Chapter Two Concepts and Definitions 7-15
Chapter Three Summary of Findings 16-37
Appendix A Detailed Tables: Table C1 to Table C4 A1-A96
Appendix B Sample Design and Estimation Procedure B1-B8
Appendix C Population Projection C1-C3
Appendix D Schedule on Employment and Unemployment (Sch. 10) D1-D16
Appendix A
Detailed TablesTable No. Title Page
Table (C1) Per 1000 distribution of persons of age 15 years and above by broad usual activity status taking also into consideration the subsidiary economic status of persons categorised 'not working' in the principal status for each class I city in India/ different size class of towns for each State/UT
A1-A24
Table (C2) Per 1000 distribution of persons of age 15 years and above by broad current weekly activity status for each class I city in India/ different size class of towns for each State/UT
A25-A48
Table (C3) Per 1000 distribution of person-days of persons of age 15 years and above by broad current daily activity status for each class I city in India/ different size class of towns for each State/UT
A49-A72
Table (C4) Per 1000 distribution of usually 'working' (ps+ss) persons of age-group 15 years & above by the broad industry division for each class I city in India/ different size class of towns for each State/UT
A73-A96
NSS Report No. 553: Employment and Unemployment situation in cities and towns in India
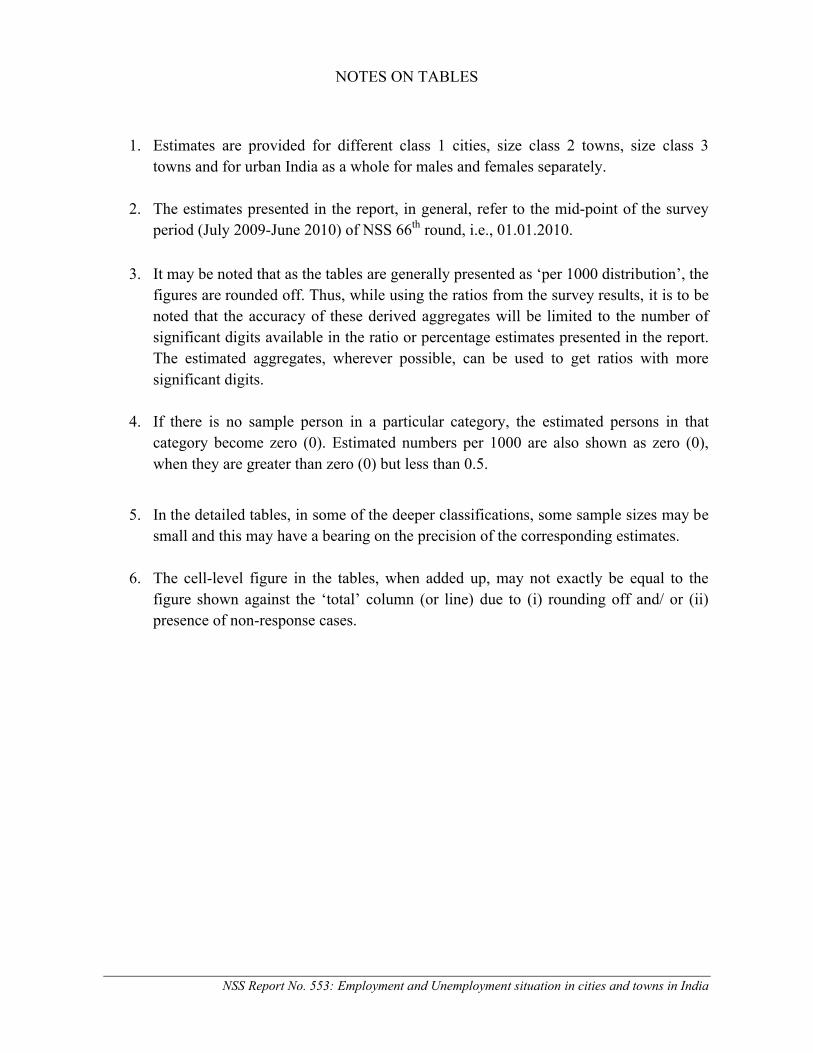
NOTES ON TABLES
1. Estimates are provided for different class 1 cities, size class 2 towns, size class 3 towns and for urban India as a whole for males and females separately.
2. The estimates presented in the report, in general, refer to the mid-point of the survey period (July 2009-June 2010) of NSS 66th round, i.e., 01.01.2010.
3. It may be noted that as the tables are generally presented as ‘per 1000 distribution’, the figures are rounded off. Thus, while using the ratios from the survey results, it is to be noted that the accuracy of these derived aggregates will be limited to the number of significant digits available in the ratio or percentage estimates presented in the report. The estimated aggregates, wherever possible, can be used to get ratios with more significant digits.
4. If there is no sample person in a particular category, the estimated persons in that category become zero (0). Estimated numbers per 1000 are also shown as zero (0), when they are greater than zero (0) but less than 0.5.
5. In the detailed tables, in some of the deeper classifications, some sample sizes may be small and this may have a bearing on the precision of the corresponding estimates.
6. The cell-level figure in the tables, when added up, may not exactly be equal to the figure shown against the ‘total’ column (or line) due to (i) rounding off and/ or (ii) presence of non-response cases.
Chapter OneIntroduction
NSS Report No. 553: Employment and Unemployment situation in cities and towns in India1
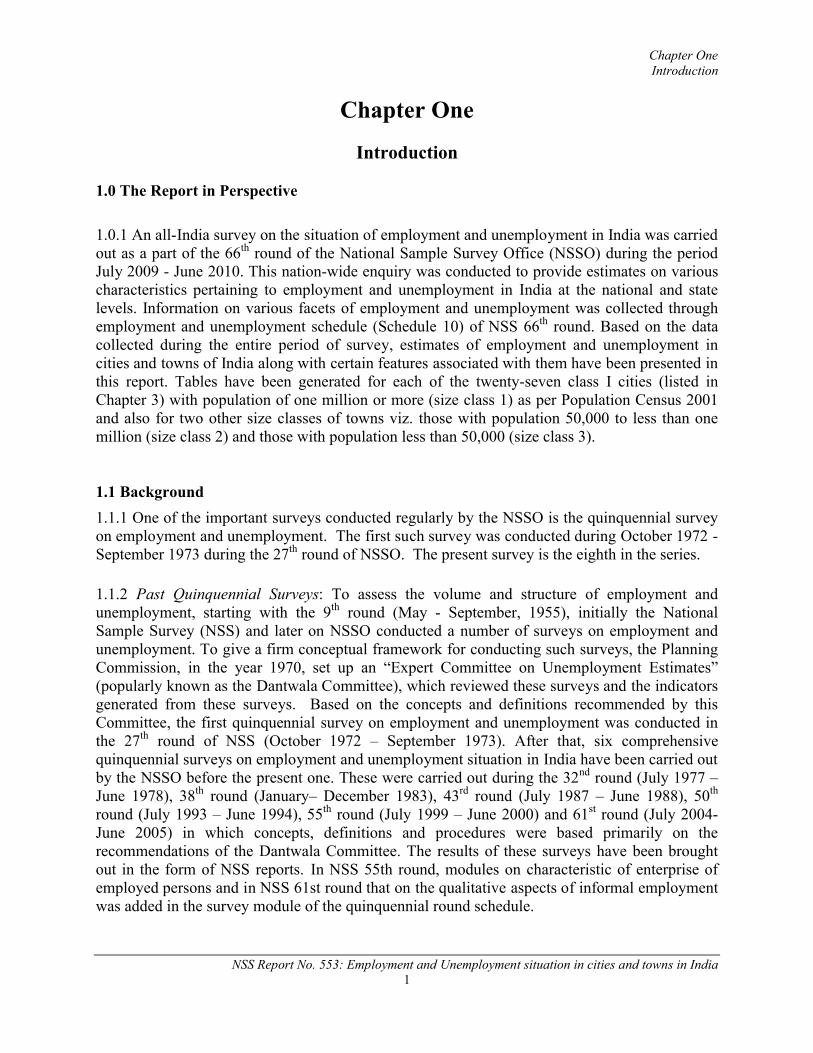
Chapter One
Introduction
1.0 The Report in Perspective
1.0.1 An all-India survey on the situation of employment and unemployment in India was carried out as a part of the 66th round of the National Sample Survey Office (NSSO) during the period July 2009 - June 2010. This nation-wide enquiry was conducted to provide estimates on various characteristics pertaining to employment and unemployment in India at the national and state levels. Information on various facets of employment and unemployment was collected through employment and unemployment schedule (Schedule 10) of NSS 66th round. Based on the data collected during the entire period of survey, estimates of employment and unemployment in cities and towns of India along with certain features associated with them have been presented in this report. Tables have been generated for each of the twenty-seven class I cities (listed in Chapter 3) with population of one million or more (size class 1) as per Population Census 2001 and also for two other size classes of towns viz. those with population 50,000 to less than one million (size class 2) and those with population less than 50,000 (size class 3).
1.1 Background
1.1.1 One of the important surveys conducted regularly by the NSSO is the quinquennial survey on employment and unemployment. The first such survey was conducted during October 1972 -September 1973 during the 27th round of NSSO. The present survey is the eighth in the series.
1.1.2 Past Quinquennial Surveys: To assess the volume and structure of employment and unemployment, starting with the 9th round (May - September, 1955), initially the National Sample Survey (NSS) and later on NSSO conducted a number of surveys on employment and unemployment. To give a firm conceptual framework for conducting such surveys, the Planning Commission, in the year 1970, set up an “Expert Committee on Unemployment Estimates” (popularly known as the Dantwala Committee), which reviewed these surveys and the indicators generated from these surveys. Based on the concepts and definitions recommended by this Committee, the first quinquennial survey on employment and unemployment was conducted in the 27th round of NSS (October 1972 – September 1973). After that, six comprehensive quinquennial surveys on employment and unemployment situation in India have been carried out by the NSSO before the present one. These were carried out during the 32nd round (July 1977 –June 1978), 38th round (January– December 1983), 43rd round (July 1987 – June 1988), 50th
round (July 1993 – June 1994), 55th round (July 1999 – June 2000) and 61st round (July 2004-June 2005) in which concepts, definitions and procedures were based primarily on the recommendations of the Dantwala Committee. The results of these surveys have been brought out in the form of NSS reports. In NSS 55th round, modules on characteristic of enterprise of employed persons and in NSS 61st round that on the qualitative aspects of informal employment was added in the survey module of the quinquennial round schedule.
Chapter OneIntroduction
NSS Report No. 553: Employment and Unemployment situation in cities and towns in India2
1.1.3 Other surveys on employment and unemployment: Apart from these quinquennial surveys on employment and unemployment, NSSO had also been collecting information on certain key items on employment and unemployment, as a part of annual series, from a smaller sample of households in each round since its 45th round (July 1989 - June 1990) through the schedule on Household Consumer Expenditure (Schedule 1.0). The objective of data collected in the annual series was to measure employment and unemployment indicators in terms of the usual and current weekly statuses only and study of these indicators in respect of category of employment, industrial distribution of the usually employed, etc. These procedures continued till the 59th
round (January-December 2003) of NSS. In these annual rounds, only activity status and industry of work according to usual principal status, subsidiary status and current weekly status approach were collected through a few columns of the demographic block of the Consumer Expenditure Schedule (Schedule 1.0). Particulars of employment and unemployment according to the usual principal status and usual subsidiary status were collected in these annual rounds by following a similar approach as in the quinquennial rounds. In the quinquennial rounds, particulars of current daily status of the household members are collected and current weekly status is derived from them, whereas in these annual rounds, current weekly status was obtained through a direct query. In the 60th round (January-June 2004), a separate schedule on employment and unemployment was canvassed for the first time in an annual round and particulars on employment and unemployment was collected in the same manner as that of the quinquennial rounds. In NSS 62nd round (July 2005 - June 2006) and in NSS 64th round (July 2007- June 2008) also a separate schedule on employment and unemployment, similar to the one canvassed during NSS 60th round, was canvassed and particulars on labour force were collected in the manner similar to the quinquennial rounds.
1.2 Present Survey
1.2.1 The critical issues in the context of labour force enquiries pertain to defining the labour force and measuring participation of labour force in different economic activities. The activity participation of the people is not only dynamic but also multidimensional; it varies over regions, age, education, gender, industry and occupational categories. In NSS surveys, persons are classified into various activity categories on the basis of activities pursued by them during certain specified reference periods. Three reference periods are used in NSS surveys, viz. (i) one year, (ii) one week and (iii) each day of the reference week. Based on these three periods, three different measures of activity status are arrived at. The activity status determined on the basis of the reference period of one year is known as the usual activity status (US) of a person, that determined on the basis of a reference period of one week is known as the current weekly status (CWS) of the person and the activity status determined on the basis of the activities pursued by a person on each day during the reference week is known as the current daily status (CDS) of the person. As in the past, in the present survey too, NSSO collected data on some employment unemployment characteristics based on which estimates of employment and unemployment, measured in terms of three basic approaches, viz., usual status, current weekly status and current daily status can be obtained.
Chapter OneIntroduction
NSS Report No. 553: Employment and Unemployment situation in cities and towns in India3
1.2.2 In NSS 66th round Employment & Unemployment schedule, the major features of data collected in NSS 61st round were retained. In addition, some information on ‘Home based workers’ was collected. The present quinquennial round is the first one, since the major public intervention in the rural labour market made with the enactment of the Mahatma Gandhi National Rural Employment Guarantee Act 2005. The survey instruments of NSS 66th round appropriately collected data on some aspects relating to MGNREGA.
1.2.3 In NSS 66th round, data on employment and unemployment characteristics were collected through Schedule 10. The schedule captured a range of information on the following aspects:
i) Household characteristics, like household size, religion, social group, land possessed, land cultivated, etc. For the rural households information was collected, on whether the household had Mahatma Gandhi National Rural Employment Guarantee (MGNREG) job card, whether got work in MGNREG works during the last 365 days, number of days got work in MGNREG works and mode of payment of the wages earned in MGNREG works. To study the employment and unemployment characteristics with the level of living of the population, information on monthly consumer expenditure of the household was also collected through a separate block of this schedule consisting of 36 different components of household consumer expenditure.
ii) Demographic particulars, like age, sex, educational level, status of current attendance and vocational training.
iii) Usual principal activity status and subsidiary economic activity status of the all persons.
iv) Particulars of the enterprise for all the usual status workers (excluding those engaged in growing of crops and growing of crops combined with farming of animals) viz., location of work place, type of enterprises, number of workers in the enterprise etc. and some particulars on the conditions of employment for the employees, like type of job contract, eligibility for paid leave, availability of social security benefits, etc. For self-employed persons in the usual status, some particulars were collected for identification of home-based workers.
v) Extent of underutilization of the labour time and on the qualitative aspects of employment, like changes in activity status, occupation /industry, existence of trade unions/associations, nature of employment (permanent/temporary), etc.
vi) Participation in specified activities by the household members who were classified as engaged in domestic duties in the usual principal activity status.
1.3 The Survey Outline
1.3.1 Geographical coverage: The survey covered the whole of the Indian Union except (i) interior villages of Nagaland situated beyond five kilometres of the bus route and (ii) villages in Andaman and Nicobar Islands which remained inaccessible throughout the year. However, all the sample first stage units of both rural and urban areas of Leh, Kargil and Poonch districts of Jammu & Kashmir became casualty and therefore these districts were outside the survey coverage.
Chapter OneIntroduction
NSS Report No. 553: Employment and Unemployment situation in cities and towns in India4
1.3.2 Sub-round: The fieldwork of the 66th round of NSSO started from 1st July, 2009 and continued till 30th June, 2010. As usual, the survey period of this round was divided into four sub-rounds, each with a duration of three months, the 1st sub-round period ranging from July to September 2009, the 2nd sub-round period from October to December 2009 and so on. An equal number of sample villages/blocks (FSUs) was allotted for survey in each of these four sub-rounds. The survey used the interview method of data collection from a sample of randomly selected households.
1.4 Sample Design
1.4.1 A stratified multi-stage design was adopted for the 66th round survey. The first stage units (FSU) were the 2001 census villages (Panchayat wards in case of Kerala) in the rural sector and Urban Frame Survey (UFS) blocks in the urban sector. In addition, two non-UFS towns of Leh and Kargil of Jammu & Kashmir were also treated as FSUs in the urban sector. The ultimate stage units (USU) were households in both the sectors. Hamlet-groups/sub-blocks constituted the intermediate stage whenever these were formed in the sample FSUs. For the rural sector, the list of 2001 census villages (Panchayat wards in case of Kerala) constituted the sampling frame. For the urban sector, latest list of UFS blocks constituted the sampling frame. For non-UFS towns, frame consisted of the individual towns (only two towns, viz., Leh & Kargil constituted this frame). Within each district of a State/UT, two basic strata were formed as follows: rural stratum comprising all rural areas of the district and urban stratum comprising all the urban areas of the district. However, within the urban areas of a district, if there were one or more towns with population 10 lakhs or more as per population census 2001 in a district, each of them formed a separate basic stratum and the remaining urban areas of the district were considered as another basic stratum. There was no sub-stratification in the urban sector. However, to net adequate number of child workers, for all rural strata, each stratum was divided into 2 sub-strata. These were, sub-stratum 1: all villages with proportion of child workers (p) >2P (where P is the average proportion of child workers for the State/UT as per Census 2001) and sub-stratum 2: remaining villages.
1.4.2 At the all-India level, a total number of 12784 FSUs were allocated for survey in the central sample. This sample size was at par with the sample size of NSS 61st round. In addition, 24 State sample FSUs (16 for rural sector and 8 for urban sector) of Leh and Kargil districts of J & K were included in the central sample. The total number of sample FSUs was allocated to the States and UTs in proportion to population as per census 2001 subject to the availability of investigators and ensuring minimum sample allocation to each State/UT. The State/UT level sample size was allocated between two sectors in proportion to population as per census 2001with double weightage to urban sector subject to the restriction that urban sample size for bigger states like Maharashtra, Tamil Nadu, etc. did not exceed the rural sample size. A minimum of 16 FSUs (to the extent possible) was allocated to each State/UT separately for rural and urban areas. Further the State level allocations for both rural and urban areas were adjusted marginally in a few cases to ensure that each stratum/ sub-stratum got a minimum allocation of 4 FSUs. Within each sector of a State/UT, the respective sample size was allocated to the different strata/ sub-strata in proportion to the population as per census 2001. Allocations at stratum/ sub-stratum level were adjusted to multiples of 4 with a minimum sample size of 4 and equal number of samples was allocated among the four sub rounds.
Chapter OneIntroduction
NSS Report No. 553: Employment and Unemployment situation in cities and towns in India5
1.4.3 For the rural sector, from each stratum/ sub-stratum, required number of sample villages was selected by probability proportional to size with replacement (PPSWR), size being the population of the village as per Census 2001. For urban sector, from each stratum FSUs were selected by using Simple Random Sampling Without Replacement (SRSWOR). Both rural and urban samples were drawn in the form of two independent sub-samples. All households listed in the selected village/block/ hamlet-groups/sub-blocks were stratified into three second stage strata (SSS). A total of 8 households were selected from each sample village/block for canvassing the employment and un-employment schedule. The sample households from each of the second stage strata were selected by SRSWOR.
1.4.4 Out of the total number of 12,808 FSUs (7,524 villages and 5,284 urban blocks) allotted for the central sample1 (including 24 state sample FSUs of Leh and Kargil districts of J & K: 16 for rural sector and 8 for urban sector), 12,654 FSUs (7,402 villages and 5,252 urban blocks) could be surveyed at the all-India level for canvassing Schedule 10. The number of households surveyed was 1, 00,957 (59,129 in rural areas and 41,828 in urban areas) and number of persons surveyed was 4, 59,784 (2, 81,327 in rural areas and 1, 78,457 in urban areas). The sample design and estimation procedure used for the survey is given in Appendix B of this report.
1.4.5 The domains of rural and urban sector in the survey are co-terminus with the criterion adopted in census. The urban frame used in the survey is the latest updated UFS that takes into account the newly declared towns after the last census 2001. Accordingly the rural sector is the one that is not urban.
1.5 Contents of the Report
1.5.1 This report contains three chapters, including the present introductory chapter, and fourappendices. Chapter Two describes the concepts and definitions of the terms used in the survey in connection with the various items covered in this report. The main findings relating to the estimates given in this report are presented and discussed in Chapter Three. The detailed tables forming the basis of this report are presented in Appendix A. Appendix B gives a detailed description of the sample design and estimation procedure used for the survey. In Appendix C, the Projected Population as on 1st March 2009 and 1st March 2010 supplied by RGI Office have been presented along with those projected for 1st January 2010 using compound rate of growth. The projections have been given for, males and females, separately, for rural and urban areas ofeach State/UT. Appendix D gives a facsimile of the schedule canvassed in the survey.
1.5.2 All the estimates presented in this report are based on the Central sample data only. The cell-level figures in any of the detailed tables, when added up, may not exactly equal the figure shown against the ‘total’ column (or line) due to rounding off.
1 The sample selected for NSS 66th round which was surveyed by NSSO is termed “Central sample”. As is usual in the regular NSS rounds, most States and Union Territories participated in the survey: the sample surveyed by State Government officials is termed as “State sample”.
Chapter OneIntroduction
NSS Report No. 553: Employment and Unemployment situation in cities and towns in India6
1.5.3 In Appendix A, the results are presented in the detailed tables for each of the 27 class 1 cities and for the three size classes of towns, viz., class 1, class 2 and class 3 of each State/UT. The tables also give the number of sample blocks for each of 27 class 1 cities and for the three size classes of towns for each State/UT. The sample blocks for each of the 27 class 1 cities exclude those blocks which were uninhabited or were treated as ‘zero cases’. Some examples of such zero cases are: blocks comprising wholly the barracks of military and paramilitary forces (like CRPF, BSF etc.); rural areas declared as urban areas and now forming a part of UFS frame used for urban sampling; blocks wholly submerged under water in a dam or blocks with thewhole population evicted because of acquisition of land to construct a new factory or other project work etc. with no chance of habitation in future. As against this, the blocks the entire population of which had shifted elsewhere due to some natural calamities like fire, cyclone etc, but was likely to return in future, were considered as uninhabited. The estimates are, however, based on all the surveyed blocks, which includes the uninhabited and zero cases also. Moreover, the sample blocks shown against each of the size classes of towns in the State/UT include ‘zero cases’ and uninhibited blocks, i.e., all the surveyed blocks.
1.6 Plan for Release of Results
1.6.1 It was planned to bring out a series of eight reports on the basis of the employment and unemployment survey results of NSS 66th round. The present report – entitled ‘Employment and Unemployment situation in cities and towns in India’- eighth in the series - deals with various estimates relating to employment and unemployment in cities and towns as obtained from data on relevant items collected for the entire round. The seven reports which have already been released are:
(i) Report No. 537(Employment and Unemployment Situation in India, 2009-10),
(ii) Report No. 539 (Informal Sector and Conditions of Employment in India),
(iii) Report No. 543 (Employment and Unemployment situation among Social Groups in India),
(iv) Report No. 548 (Home-based Workers in India),
(v) Report No. 550 (Participation of Women in Specified Activities along with Domestic Duties),
(vi) Report No. 551 (Status of Education and Vocational Training in India),
(vii) Report No. 552 (Employment and Unemployment situation among Major Religious Groups in India).
Chapter 2Concepts and Definitions
NSS Report No. 553: Employment and Unemployment situation in cities and towns in India 7
Chapter Two
Concepts and Definitions
2.0 The concepts and definitions of some important terms used in the survey and relevant to this report are explained in the following paragraphs.
2.1 Household: A group of persons who normally lived together and took food from a common kitchen constituted a household. The adverb “normally” means that temporary visitors and guests (whose total period of stay in the household was expected to be less than 6 months) were excluded but temporary stay aways (whose total period of absence from the household was expected to be less than 6 months) were included. Thus, a son/daughter residing in a hostel for studies was excluded from the household of his/her parents, but a resident domestic servant or paying guest (but not just a tenant in the house) was included in the employer’s/host’s household. “Living together” was given more importance than “sharing food from a common kitchen” in drawing the boundaries of a household, in case the two criteria were in conflict. However, in the special case of a person taking food with his family but sleeping elsewhere (say, in a shop or a different house) due to shortage of space, the household formed by such a person’s family members was taken to include that person also. Each inmate of a hotel, mess, boarding-lodging house, hostel, etc., was considered to be a single-member household except that a family living in a hotel (say) was considered one household only. The same principle was applicable for the residential staff of such establishments. The size of a household is the total number of persons in the household.
2.2 Economic activity: The entire spectrum of human activity falls into two categories –economic activities and non-economic activities. Any activity resulting in production of goods and services that add value to national product was considered as an economic activity for the employment and unemployment survey. Such activities included production of all goods and services for market (i.e. for pay or profit) including those of government services, and, the production of primary commodities for own consumption and own account production of fixed assets.
2.2.1 The full spectrum of economic activities as defined in the UN system of National Accounts was not covered in the definition adopted for the NSS 66th round survey of Employment and Unemployment. Production of any good for own consumption is considered as economic activity by UN System of National Accounts but production of only primary goods for own consumption was considered as economic activity by NSSO. While the former considers activities like own account processing of primary products as economic activities, in the NSS surveys, processing of primary products for own consumption was not considered as economic activity.
2.2.2 The term 'economic activity' as defined in the employment and unemployment survey of NSS 66th round, therefore, included:
Chapter 2Concepts and Definitions
NSS Report No. 553: Employment and Unemployment situation in cities and towns in India 8
(i) all the market activities performed for pay or profit which result in production of goods and services for exchange. (ii) of the non-market activities, (a) all the activities relating to ‘agriculture’ and ‘mining & quarrying’ (i.e. industry Divisions 01 to 14 of NIC-2004) which result in production (including free collection of uncultivated crops, forestry, firewood, hunting, fishing, mining, quarrying, etc.) of primary goods for own consumption and
(b) activities relating to the own-account production of fixed assets, which include production of fixed assets including construction of own houses, roads, wells, etc., and of machinery, tools, etc., for household enterprise and also construction of any private or community facilities free of charge. A person may be engaged in own account construction in the capacity of either a labourer or a supervisor.
As per the practice followed in earlier rounds, certain activities like prostitution, begging, etc., which though fetched earnings, were not considered as economic activities. Activity status of a person was judged irrespective of the situation whether such activity was carried out illegally in the form of smuggling or not.
2.3 Activity status: It is the activity situation in which a person was found participated in economic and non-economic activities during the reference period. According to this, a person could be in one or a combination of the following three broad activity statuses during a reference period:
(i) working or being engaged in economic activity (work) as defined above,
(ii) being not engaged in economic activity (work) but either making tangible efforts to seek 'work' or being available for 'work' if the 'work' is available and
(iii) being not engaged in any economic activity (work) and also not seeking/available for 'work'.
Broad activity statuses mentioned in (i) and (ii) above are associated with 'being in labour force' and the last with 'not being in the labour force'. Within the labour force, broad activity status (i) and (ii) were associated with 'employment' and ‘unemployment’, respectively.
2.3.1 Identification of each individual into a unique activity status could pose a problem when more than one of the three broad activity statuses listed above were concurrently obtained for a person. In such an eventuality, the identification uniquely under any one of the three broad activity statuses was done by adopting either the major time or priority criterion. The former was used for classification of persons according to the 'usual activity status' approach and the latter for classification of persons according to the ‘current activity status’ approach. Each of the three broad activity statuses, in both usual status approach and current activity status approach was further sub-divided into several detailed activity categories by considering major time criterion.
Chapter 2Concepts and Definitions
NSS Report No. 553: Employment and Unemployment situation in cities and towns in India 9
If a person categorised as engaged in economic activity by adopting one of the two criteria mentioned above was found to be pursuing more than one economic activity during the reference period, the appropriate detailed activity status code related to that activity in which relatively more time had been spent. A similar procedure was adopted for assigning detailed activity status code for persons categorised as engaged in non-economic activity and pursuing more than one non-economic activity.
2.3.2 The detailed activity statuses under each of the three broad activity statuses (viz. employed, unemployed and not in labour force) and the corresponding codes used in the survey are given below:
code description
working (or employed)
self-employed11 worked (self-employed) in household enterprises as own-account worker12 worked (self-employed) in household enterprises as an employer21 worked (self-employed) in household enterprises as helper
regular wage/ salaried employee31 worked as regular wage/ salaried employee
casual labour41 worked as casual wage labour in public works42 worked as casual wage labour in MGNREG works51 worked as casual wage labour in other types of works61 did not work owing to sickness though there was work in household enterprise 62 did not work owing to other reasons though there was work in household enterprise71 did not work owing to sickness but had regular wage/ salaried employment72 did not work owing to other reasons but had regular wage/ salaried employment
not working but seeking/available for work (or unemployed)
81 sought work or did not seek but was available for work (for usual status approach)81 sought work (for current weekly status approach)82 did not seek but was available for work (for current weekly status approach)
neither working nor available for work (or not in labour force)
91 attended educational institutions92 attended to domestic duties only 93 attended to domestic duties and was also engaged in free collection of goods (vegetables,
roots, firewood, cattle feed, etc.), sewing, tailoring, weaving, etc. for household use94 rentiers, pensioners, remittance recipients, etc.95 not able to work owing to disability97 others (including beggars, prostitutes, etc.) 98 did not work owing to sickness (for casual workers only)99 children of age 0-4 years
Chapter 2Concepts and Definitions
NSS Report No. 553: Employment and Unemployment situation in cities and towns in India 10
It may be noted that codes 61, 62, 71, 72, 82 and 98 were applicable for current weekly status and current daily status approaches only.
2.4 Workers (or employed): Persons who were engaged in any economic activity or who, despite their attachment to economic activity, abstained themselves from work for reason of illness, injury or other physical disability, bad weather, festivals, social or religious functions or other contingencies necessitating temporary absence from work, constituted workers. Unpaid helpers who assisted in the operation of an economic activity in the household farm or non-farm activities were also considered as workers. In the usual status relevant activity status codes 11 to 51 were assigned for workers. Workers were further categorized as self-employed (relevant activity status codes: 11, 12, 21), regular salaried/wage employee (relevant activity status codes: 31), and casual wage labour (relevant activity status codes: 41 and 51).
2.5 Seeking or available for work (or unemployed): Persons who, owing to lack of work, had not worked but either sought work through employment exchanges, intermediaries, friends or relatives or by making applications to prospective employers or expressed their willingness or availability for work under the prevailing conditions of work and remuneration, were considered as those ‘seeking or available for work’ (or unemployed). In the usual status, activity status codes 81 were assigned for unemployed.
2.6 Labour force: Persons who were either 'working' (or employed) or 'seeking or available for work' (or unemployed) constituted the labour force. In the usual status, persons with activity status codes 11 – 81 constituted the labour force.
2.7 Not in labour force: Persons who were neither 'working' nor 'seeking or available for work' for various reasons during the reference period were considered as 'not in labour force'. Persons in this category include students, those engaged in domestic duties, rentiers, pensioners, recipients of remittances, those living on alms, infirm or disabled persons, too young persons, prostitutes, etc. and casual labourers not working due to sickness. Activity status codes 91-95, 97 and 98 were assigned for persons belonging to category 'not in labour force'. For the purpose of this report, status code 99 was assigned to children of age 0-4 years.
2.8 Self-employed: Persons who operated their own farm or non-farm enterprises or were engaged independently in a profession or trade on own-account or with one or a few partners were treated as self-employed in household enterprises. The essential feature of the self-employed is that they have autonomy (decide how, where and when to produce) and economic independence (in respect of choice of market, scale of operation and finance) for carrying out their operation. The remuneration of the self-employed consists of a non-separable combination of two parts: a reward for their labour and profit of their enterprise. The combined remuneration is wholly determined by the revenue from sales after netting out value of purchased inputs used in production.
Chapter 2Concepts and Definitions
NSS Report No. 553: Employment and Unemployment situation in cities and towns in India 11
2.8.1 Categories of self-employed persons: Self-employed persons were categorised as follows:
(i) own-account workers: those self-employed persons who operated their enterprises on their own account or with one or a few partners and who, during the reference period, by and large, ran their enterprise without hiring any labour. They could, however, have had unpaid helpers to assist them in the activity of the enterprise;
(ii) employers: those self-employed persons who worked on their own account or with one or a few partners and, who, by and large, ran their enterprise by hiring labour; and
(iii) helpers in household enterprise: those self-employed persons (mostly family members) who were engaged in their household enterprises, working full or part time and did not receive any regular salary or wages in return for the work performed. They did not run the household enterprise on their own but assisted the related person living in the same household in running the household enterprise.
2.9 Regular wage/ salaried employee: These were persons who worked in others’ farm or non-farm enterprises (both household and non-household) and, in return, received salary or wages on a regular basis (i.e. not on the basis of daily or periodic renewal of work contract). This category included not only persons getting time wage but also persons receiving piece wage or salary and paid apprentices, both full time and part-time.
2.10 Casual wage labour: A person who was casually engaged in others’ farm or non-farm enterprises (both household and non-household) and, in return, received wages according to the terms of the daily or periodic renewal of work contract, was a casual wage labour.
2.11 Public works: ‘Public works’ were those activities which were sponsored by Government or Local Bodies, and which covered local area development works like construction of roads, dams, bunds, digging of ponds, etc., as relief measures, or as an outcome of employment generation schemes under the poverty alleviation programme such as Mahatma Gandhi National Rural Employment Guarantee (MGNREG) public works, Sampoorna Grameen Rozgar Yojana (SGRY), National Food for Work Programme (NFFWP), etc. The coverage of schemes under ‘public works’ was restricted to those schemes through which the Government generated wage employment under poverty alleviation programme, or relief measures. The types of works that were generally undertaken through these schemes, were watershed development, drought proofing, land levelling, flood control, laying pipes or cables, sanitation, water harvesting, irrigation canal, development of orchard, road construction, building construction / repair, running crèche, etc. To distinguish between ‘public works’ and works not classifiable as ‘public works’, some broad characteristics of ‘public work’ were identified, viz. the primary objective is generation of wage employment and poverty alleviation, and creation of community asset as an outcome in achieving those main objectives.
Chapter 2Concepts and Definitions
NSS Report No. 553: Employment and Unemployment situation in cities and towns in India 12
2.12 Different approaches followed to determine activity status: The persons surveyed were classified into various activity categories on the basis of the activities pursued by them during certain specified reference periods. There were three reference periods for this survey. These are: (i) one year (ii) one week and (iii) each day of the reference week. Based on these three periods, three different measures of activity status are arrived at. These are termed respectively as usual status, current weekly status and current daily status. The procedure adopted to arrive at these three measures is given below.
2.12.1 Usual principal activity status: The usual activity status relates to the activity status of a person during the reference period of 365 days preceding the date of survey. The activity status on which a person spent relatively long time (i.e., major time criterion) during the 365 days preceding the date of survey is considered as the usual principal activity status of the person. To decide the usual principal activity of a person, first a two stage dichotomous classification was followed for determining the broad usual principal activity status (either employed or unemployed or not in labour force) of the person. At the first stage, persons were first categorised as those in the labour force (either employed or unemployed) and those not in the labour force depending on the major time spent during the 365 days preceding the date of survey. Persons thus adjudged as not belonging to the labour force were assigned the broad activity status 'neither working nor available for work' (not in the labour force). At the second stage, for persons belonging to the labour force, the broad activity status of either 'working' (employed) or ‘not working but seeking and/or available for work’ (unemployed) was ascertained based on the same criterion, viz., relatively longer time spent in accordance with either of the two broad statuses within the labour force during the 365 days preceding the date of survey. Within the broad activity status so determined, the detailed activity status of a person pursuing more than one such activity was determined once again on the basis of the relatively longer time spent on such activities. In terms of activity status codes, codes 11-51 were assigned to persons classified as workers and codes 91-97 to those not in the labour force. In the usual status approach, a single code 81 was assigned to persons seeking or available for work (unemployed persons) while two separate codes 81(sought work) and 82 (did not seek but was available for work) were assigned to unemployed persons according to current weekly status and current daily status approach.
2.12.2 Usual subsidiary economic activity status: A person whose usual principal status was determined on the basis of the major time criterion could have pursued some economic activity for a shorter time throughout the reference year of 365 days preceding the date of survey or for a minor period, which is not less than 30 days, during the reference year. The status in which such economic activity was pursued was the subsidiary economic activity status of that person. Activity status codes 11-51 only were used for the subsidiary economic activity performed by a person. It may be noted that engagement in work in subsidiary capacity may arise out of the two following situations:
Chapter 2Concepts and Definitions
NSS Report No. 553: Employment and Unemployment situation in cities and towns in India 13
(i) a person may be engaged in a relatively longer period during the 365 days in economic (non-economic activity) and for a relatively minor period, which is not less than 30 days (not necessarily for a continuous period), in another economic activity (any economic activity). The economic activity, which was pursued for a relatively minor period, was considered as his/her subsidiary economic activity.
(ii) a person may be pursuing an economic activity (non-economic activity) almost throughout the year in the principal status and also simultaneously pursuing another economic activity (any economic activity) for a relatively shorter time in a subsidiary capacity. The economic activity, which was pursued for a relatively shorter time, was considered as his/her subsidiary economic activity.
2.12.3 Usual activity status considering principal and subsidiary status taken together: The usual status, determined on the basis of the usual principal activity and usual subsidiary economic activity of a person taken together, is considered as the usual activity status of the person and is written as usual status (ps+ss). According to the usual status (ps+ss), workers are those who perform some work activity either in the principal status or in the subsidiary status. Thus, a person who is not a worker in the usual principal status is considered as worker according to the usual status (ps+ss), if the person pursues some subsidiary economic activity for 30 days or more during 365 days preceding the date of survey.
2.12.4 Current weekly activity status: The current weekly activity status of a person is the activity status obtaining for a person during a reference period of 7 days preceding the date of survey. It is decided on the basis of a certain priority-cum-major time criterion.
2.12.4.1 According to the priority criterion, the status ‘working’ gets priority over the status ‘not working but seeking or available for work’ that, in turn, gets priority over the status ‘neither working nor available for work’. A person was considered working (or employed) if he/she, while pursuing any economic activity, had worked for at least one hour on at least one day during the 7 days preceding the date of survey. A person was considered ‘seeking or available for work (or unemployed)’ if, during the reference week, no economic activity was pursued by the person but he/she made efforts to get work or had been available for work any time during the reference week though not actively seeking work in the belief that no work was available. A person who had neither worked nor was available for work any time during the reference week was considered as engaged in non-economic activities (or not in labour force).
2.12.4.2 After deciding the broad current weekly activity status of a person on the basis of 'priority' criterion, the detailed current activity status was then decided on the basis of 'major time' criterion if that person pursued multiple economic activities. The current weekly activity status of a person could be any of the valid codes within 11 to 98. Of these codes, 11 to 72 pertained to workers, 81 to 82 for unemployed and 91 to 98 for persons not in the labour force.
Chapter 2Concepts and Definitions
NSS Report No. 553: Employment and Unemployment situation in cities and towns in India 14
2.12.5 Current daily activity status: The activity pattern of the population, particularly in the informal sector, is such that during a week, and sometimes, even during a day, a person could pursue more than one activity. Moreover, many people could even undertake both economic and non-economic activities on the same day of a reference week. The current daily activity status for a person was determined on the basis of his/her activity status on each day of the reference week using a priority-cum-major time criterion (day to day labour time disposition). Time disposition was recorded for every member of the sample households. This involved recording of different activities pursued by the members along with the time intensity in quantitative terms for each day of the reference week. The different activities were identified and recorded in terms of 'activity status' and 'industry' codes for persons in urban areas and 'activity status', 'industry' and 'operation' codes for persons in rural areas. The description (and codes used) of current dailyactivity statuses is the same as those of current weekly activity status. Industry and occupations of individuals are collected according to NIC 2004 and NCO 2004 respectively. The term ‘operation’ is explained later. The following points were considered for assigning the time intensity and determining the current daily status of a person:
i) Each day of the reference week was looked upon as comprising either two ‘half days’ or a ‘full day’ for assigning the activity status. For recording time disposition for activities pursued by a person in a day, an intensity of 1.0 was given against an activity that was done for ‘full day’ and an intensity of 0.5 against the activity which was done for ‘half day’.
ii) A person was considered ‘working’ (employed) for the full day if he/she had worked for 4 hours or more during the day.
iii) If a person was engaged in more than one of the economic activities for 4 hours or more on a day, he/she was assigned two out of the various economic activities on which he/she devoted relatively long time on the reference day. In such cases, an intensity of 0.5 was given for each of these two economic activities.
iv) If the person had worked for 1 hour or more but less than 4 hours, he/she was considered ‘working’ (employed) for half-day and ‘seeking or available for work’ (unemployed) or ‘neither seeking nor available for work’ (not in labour force) for the other half of the day depending on whether he was seeking/available for work or not.
v) If a person was not engaged in any ‘work’ even for 1 hour on a day but was seeking/available for work for 4 hours or more, he was considered ‘unemployed’ for the entire day. But if he was ‘seeking/available for work’ for more than 1 hour and less than 4hours only, he was considered ‘unemployed’ for half day and ‘not in labour force’ for the other half of the day.
vi) A person who neither had any ‘work’ to do nor was available for ‘work’ even for half a day was considered ‘not in labour force’ for the entire day and was assigned one or two of the detailed non-economic activity statuses depending upon the activities pursued during the reference day.
Chapter 2Concepts and Definitions
NSS Report No. 553: Employment and Unemployment situation in cities and towns in India 15
2.12.6 In the quinquennial surveys, the current weekly status of a person is derived from the intensities assigned for the daily activities performed by a person during the 7 days of the reference week by using priority-cum-major time criterion.
2.13 Operation: It is the type of work performed by a person during a reference period such as manual, non-manual, agricultural, non-agricultural, etc. Operation has been combined with activity status and industry corresponding to the work performed. Information regarding the type of operation is collected only for rural areas and relating to current status only. The different types of operations are - ploughing, sowing, transplanting, weeding, harvesting, others (manual) and others (non-manual). In the last two cases, the sector in which the work is performed is indicated by the industry. It may be noted, that for 'regular wage/ salaried employees' on leave or on holiday, the 'operation' relates to their respective function in the work or job from which he/ she is temporarily off. Similarly, for persons categorised as 'self-employed' but not working on a particular day in spite of having work on that day, the operation will relate to the work that he/ she would have done if he/ she had not enjoyed leisure on that day.
Chapter 3Summary of Findings
NSS Report No. 553: Employment and Unemployment situation in cities and towns in India16
Chapter 3
Summary of Findings
3.0 Introduction
3.0.1 In order to get a comprehensive picture of the different dimensions of the situation of employment and unemployment in the country, NSSO generates three different estimates of ‘employed’ persons (workers) from the data collected through its quinquennial employment and unemployment surveys. They relate to:
i) The number of persons usually employed in the principal status (ps) only and a wider set of ‘all’ workers taking into consideration the subsidiary economic status (ss) of persons categorized 'not working' in the principal status (ps) termed as work force according to the usual status (ps+ss) which includes (a) the persons who worked for a relatively long part of the 365 days preceding the date of survey and (b) those persons from among the remaining population who had worked at least for 30 days during the reference period of 365 days preceding the date of survey.
ii) The workforce measured in terms of current weekly status (CWS) gives number of persons employed on an average in a week of 7 days during the survey period. The estimate of workforce, according to CWS provides the number of persons worked for at least 1 hour on any day during the 7 days preceding the date of survey.
iii) The workforce measured in terms of current daily status (CDS) gives the average picture of the person-days where a person was found employed on an average on a day during the survey period. For each person, 7 person-days were assigned for the 7 days preceding the date of survey and the estimate of the number of person-days worked in the reference week was obtained on the basis of the person-days worked according to the CDS approach. The number of person-days worked on a day during the survey period was obtained by dividing the person-days worked in a week by 7.
Chapter 3Summary of Findings
NSS Report No.553: Employment and Unemployment situation in cities and towns in India17
3.0.2 In the Statements of this chapter, the figures are presented for the class 1 cities (i.e., those with a population of one million or more) along with those for size class 2 towns (with a population of 50,000 to less than one million) and size class 3 towns (with population less than 50,000) and urban India as a whole for NSS 55th, 61st and 66th rounds. It may be noted that for 66th and 61st rounds, the size classes were formed as per population of Population Census 2001 while those for 55th round were formed as per population of Population Census 1991 (1981 Census population for J & K).
3.0.3 As per population census 2001, the following twenty-seven cities were classified as class 1 cities: Agra, Ahmedabad, Bangalore, Bhopal, Chennai, Delhi M.C.(Urban), Faridabad, Greater Mumbai, Howrah, Hyderabad, Indore, Jaipur, Kalyan-Dombivili, Kanpur, Kolkata, Lucknow, Ludhiana, Meerut, Nagpur, Nasik, Patna, Pimprichinchwad, Pune, Surat, Thane, Vadodara and Varanasi. Statements and tables for this report present results of 66th round for these twenty-seven class 1 cities. Besides these twenty-seven class 1 cities, the statements include estimates for two more cities viz. Madurai and Visakhapatnam, which were class 1 cities during NSS 55th
round but were not classified as class 1 cities in Population Census 2001 and were therefore not included as class 1 cities in NSS 61st and 66th rounds.
3.0.4 The discussion in this chapter is mainly restricted to the findings of each of the class 1 cities and for all-India in different size classes of towns. However, the results for each State/UTby three size class of towns have been presented in the Appendix tables. The results for small States/UTs presented in the Appendix tables, should be interpreted with caution because of inadequate sample size for some of the categories in these States/ UTs.
Chapter 3Summary of Findings
NSS Report No.553: Employment and Unemployment situation in cities and towns in India18
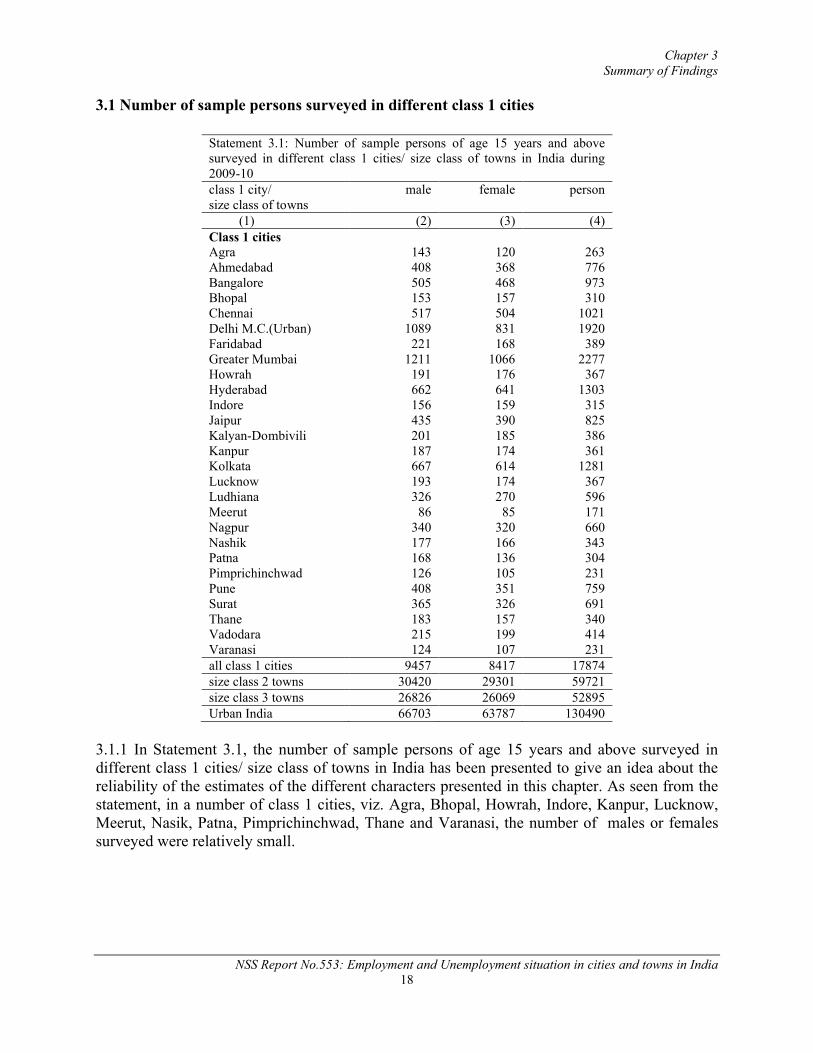
3.1 Number of sample persons surveyed in different class 1 cities
3.1.1 In Statement 3.1, the number of sample persons of age 15 years and above surveyed in different class 1 cities/ size class of towns in India has been presented to give an idea about the reliability of the estimates of the different characters presented in this chapter. As seen from the statement, in a number of class 1 cities, viz. Agra, Bhopal, Howrah, Indore, Kanpur, Lucknow, Meerut, Nasik, Patna, Pimprichinchwad, Thane and Varanasi, the number of males or females surveyed were relatively small.
Statement 3.1: Number of sample persons of age 15 years and above surveyed in different class 1 cities/ size class of towns in India during 2009-10class 1 city/ size class of towns
male female person
(1) (2) (3) (4)Class 1 citiesAgra 143 120 263Ahmedabad 408 368 776Bangalore 505 468 973Bhopal 153 157 310Chennai 517 504 1021Delhi M.C.(Urban) 1089 831 1920Faridabad 221 168 389Greater Mumbai 1211 1066 2277Howrah 191 176 367Hyderabad 662 641 1303Indore 156 159 315Jaipur 435 390 825Kalyan-Dombivili 201 185 386Kanpur 187 174 361Kolkata 667 614 1281Lucknow 193 174 367Ludhiana 326 270 596Meerut 86 85 171Nagpur 340 320 660Nashik 177 166 343Patna 168 136 304Pimprichinchwad 126 105 231Pune 408 351 759Surat 365 326 691Thane 183 157 340Vadodara 215 199 414Varanasi 124 107 231all class 1 cities 9457 8417 17874size class 2 towns 30420 29301 59721size class 3 towns 26826 26069 52895Urban India 66703 63787 130490
Chapter 3Summary of Findings
NSS Report No.553: Employment and Unemployment situation in cities and towns in India19
3.2 Usually employed
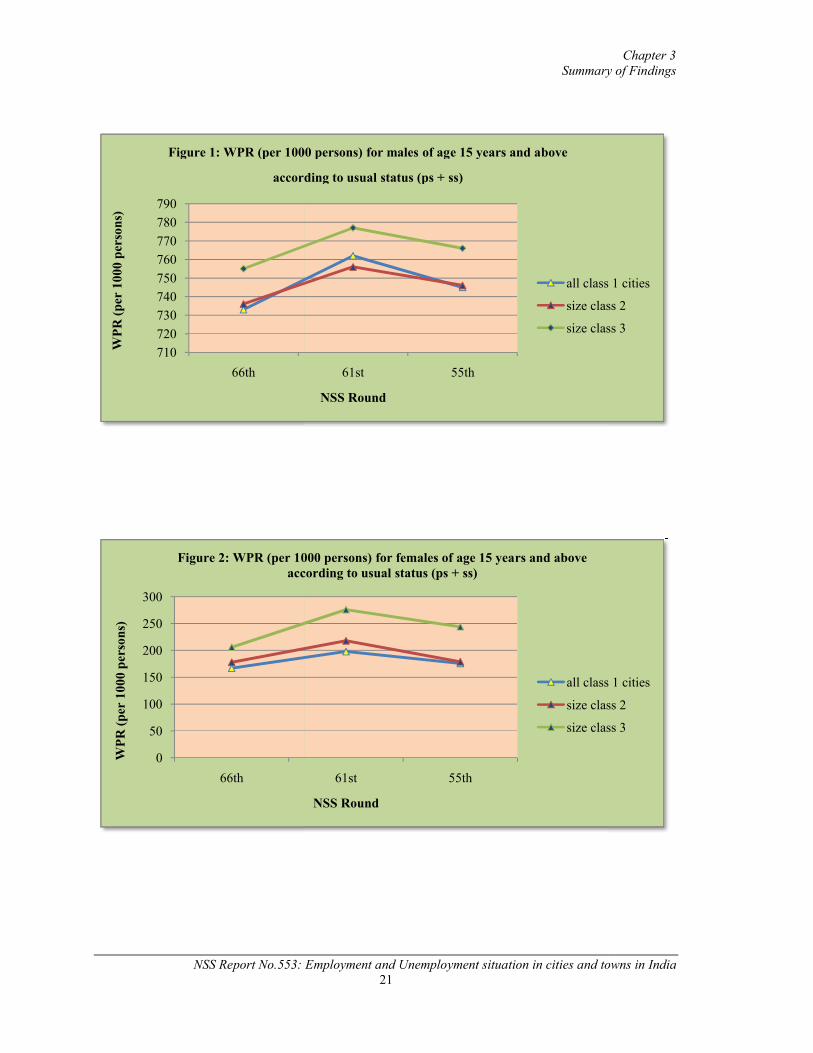
3.2.1 Statement 3.2 presents worker population ratio (WPR) for persons of age 15 years and above according to usual status (ps+ss) for each class 1 cities and size class of towns. Statement 3.2, therefore, gives number of persons usually employed per 1000 persons of age 15 years and above considering usual principal and subsidiary activity together. In Figures 1 and 2, WPR (per 1000 of persons) for persons of age 15 years and above according to usual status (ps+ss) are given for males and females, respectively.
3.2.2 Worker population ratios (WPR) during 2009-10: Statement 3.2 shows that during 2009-10, the proportion of persons of age 15 years and above employed according to usual status (ps+ss) was 74 per cent among males and 18 per cent among females in urban India. Theseproportions were higher for the size class 3 towns – about 76 per cent among males and about 21 per cent among females in comparison with class 1 cities and size class 2 towns. For class 1 cities, nearly 73 per cent of males and 17 per cent of females were usually employed during 2009-10. Among the class 1 cities, Surat had the highest proportion (87 per cent) of employed males followed by Ludhiana and Pimprichinchwad (about 82 per cent each). Meerut reported the lowest proportion (nearly 49 per cent) of employed males. For females, Varanasi reported the highest proportion of employed (35 per cent) followed by Thane (nearly 31 per cent), while Agra reported the lowest proportion of employed (about 2 per cent) among females.
3.2.3 Changes in WPR between 1999-2000 and 2009-10 for different size class of towns: In urban India as a whole, for both males and females, the proportion of usually employed (ps+ss) during 2009-10 showed a decrease of about 1 percentage point over that in the year 1999-2000. Over the period 1999-2000 and 2009-10, the WPR for males of age 15 years and above decreased by about 1 percentage point for each of size class 3 towns, size class 2 towns and class 1 cities. In comparison with 2004-2005 figures, a decrease in WPR for males of age 15 years and above is also observed in 2009-10 for all the three size class of towns. The decrease was about 2 percentage points each for size class 3 and size class 2 towns and about 3 percentage points for class1 cities. Over the period 1999-2000 and 2009-10, the WPR for females of age 15 years and above decreased by nearly 4 percentage points for size class 3 towns and by 1 percentage point for size class1 towns. In comparison with 2004-2005 figures, a decrease in WPR for females of age 15 years and above is also observed in 2009-10 for all the three size class of towns. The decrease was nearly 7 percentage points for size class 3 towns, 4 percentage points for class 2 towns and 3 percentage points for class1 cities.
Chapter 3Summary of Findings
NSS Report No.553: Employment and Unemployment situation in cities and towns in India20
3.2.4 Changes in WPR between 1999-2000 and 2009-10 for class 1 cities: In between 1999-2000and 2009-10, for class 1 cities, highest increase in WPR for males of age 15 years and above was observed for Surat (nearly 11 percentage points), followed by Kalyan-Dombivili1 (7 percentage points,) whereas Lucknow (11 percentage points) followed by Agra (10 percentage points) showed the sharpest decline in the WPR. In comparison with 2004-05 figures, highest increase in WPR in 2009-10 for males of age 15 years and above was observed for Patna (6 percentage points) followed by Kalyan-Dombivili2 and Pimprichinchwad (about 5 percentage points each) whereas Meerut (nearly 30 percentage points) followed by Agra (13 percentage points) showedthe sharpest decline in the WPR for males of age 15 years and above during this period. Over the period 1999-2000 and 2009-10, for females of age 15 years and above, highest increase in WPR was observed for Varanasi (nearly 15 percentage points), followed by Surat (11 percentage points) whereas Chennai (15 percentage points) followed by Agra (9 percentage points) showed the sharpest decline in the WPR. In comparison with 2004-05 figures, for females of age 15 years and above highest increase in WPR in 2009-10 was observed for Thane (8 percentage points) followed by Bhopal (6 percentage points) and the sharpest decline in the WPR in 2009-10 was observed for Jaipur (25 percentage points) followed by Indore (16 percentage points).
1 In NSS 55th Round, the name used was Thane (Kalyan)2In NSS 55th Round, the name used was Thane (Kalyan)
NSS Report No.553: Employment and U
710
720
730
740
750
760
770
780
790
66th
WP
R (
per
100
0 p
erso
ns)
Figure 1: WPR (per 1000 persons) for males of age 15 years and above
according to usual status (ps + ss)
0
50
100
150
200
250
300
66th
WP
R (
per
100
0 p
erso
ns)
Figure 2: WPR (per 1000 persons) for females of age 15 years and above according to usual status (ps + ss)
Summary of Findings
NSS Report No.553: Employment and Unemployment situation in cities and towns in India21
61st 55th
NSS Round
Figure 1: WPR (per 1000 persons) for males of age 15 years and above
according to usual status (ps + ss)
all class 1 cities
size class 2
size class 3
61st 55th
NSS Round
Figure 2: WPR (per 1000 persons) for females of age 15 years and above according to usual status (ps + ss)
all class 1 cities
size class 2
size class 3
Chapter 3Summary of Findings
towns in India
all class 1 cities
size class 2
size class 3
all class 1 cities
size class 2
size class 3
Chapter 3Summary of Findings
NSS Report No.553: Employment and Unemployment situation in cities and towns in India22
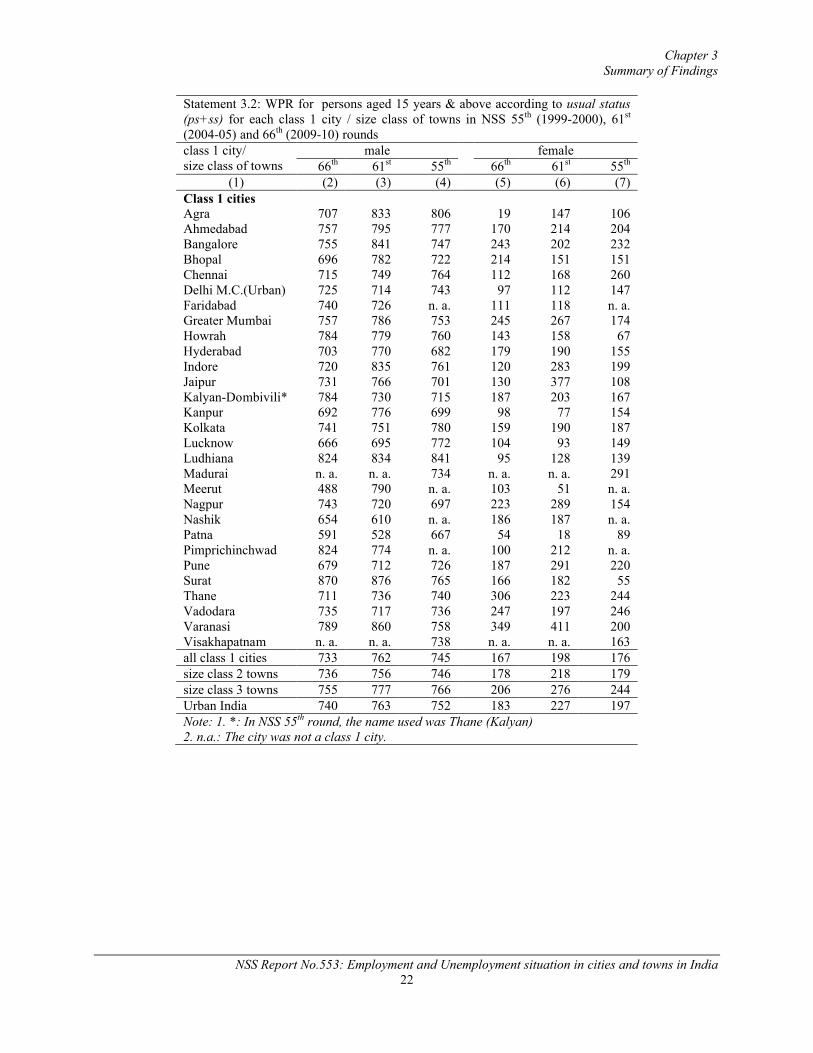
Statement 3.2: WPR for persons aged 15 years & above according to usual status (ps+ss) for each class 1 city / size class of towns in NSS 55th (1999-2000), 61st
(2004-05) and 66th (2009-10) roundsclass 1 city/size class of towns
male female66th 61st 55th 66th 61st 55th
(1) (2) (3) (4) (5) (6) (7)Class 1 citiesAgra 707 833 806 19 147 106Ahmedabad 757 795 777 170 214 204Bangalore 755 841 747 243 202 232Bhopal 696 782 722 214 151 151Chennai 715 749 764 112 168 260Delhi M.C.(Urban) 725 714 743 97 112 147Faridabad 740 726 n. a. 111 118 n. a.Greater Mumbai 757 786 753 245 267 174Howrah 784 779 760 143 158 67Hyderabad 703 770 682 179 190 155Indore 720 835 761 120 283 199Jaipur 731 766 701 130 377 108Kalyan-Dombivili* 784 730 715 187 203 167Kanpur 692 776 699 98 77 154Kolkata 741 751 780 159 190 187Lucknow 666 695 772 104 93 149Ludhiana 824 834 841 95 128 139Madurai n. a. n. a. 734 n. a. n. a. 291Meerut 488 790 n. a. 103 51 n. a.Nagpur 743 720 697 223 289 154Nashik 654 610 n. a. 186 187 n. a.Patna 591 528 667 54 18 89Pimprichinchwad 824 774 n. a. 100 212 n. a.Pune 679 712 726 187 291 220Surat 870 876 765 166 182 55Thane 711 736 740 306 223 244Vadodara 735 717 736 247 197 246Varanasi 789 860 758 349 411 200Visakhapatnam n. a. n. a. 738 n. a. n. a. 163all class 1 cities 733 762 745 167 198 176size class 2 towns 736 756 746 178 218 179size class 3 towns 755 777 766 206 276 244Urban India 740 763 752 183 227 197Note: 1. *: In NSS 55th round, the name used was Thane (Kalyan)2. n.a.: The city was not a class 1 city.
Chapter 3Summary of Findings
NSS Report No.553: Employment and Unemployment situation in cities and towns in India23
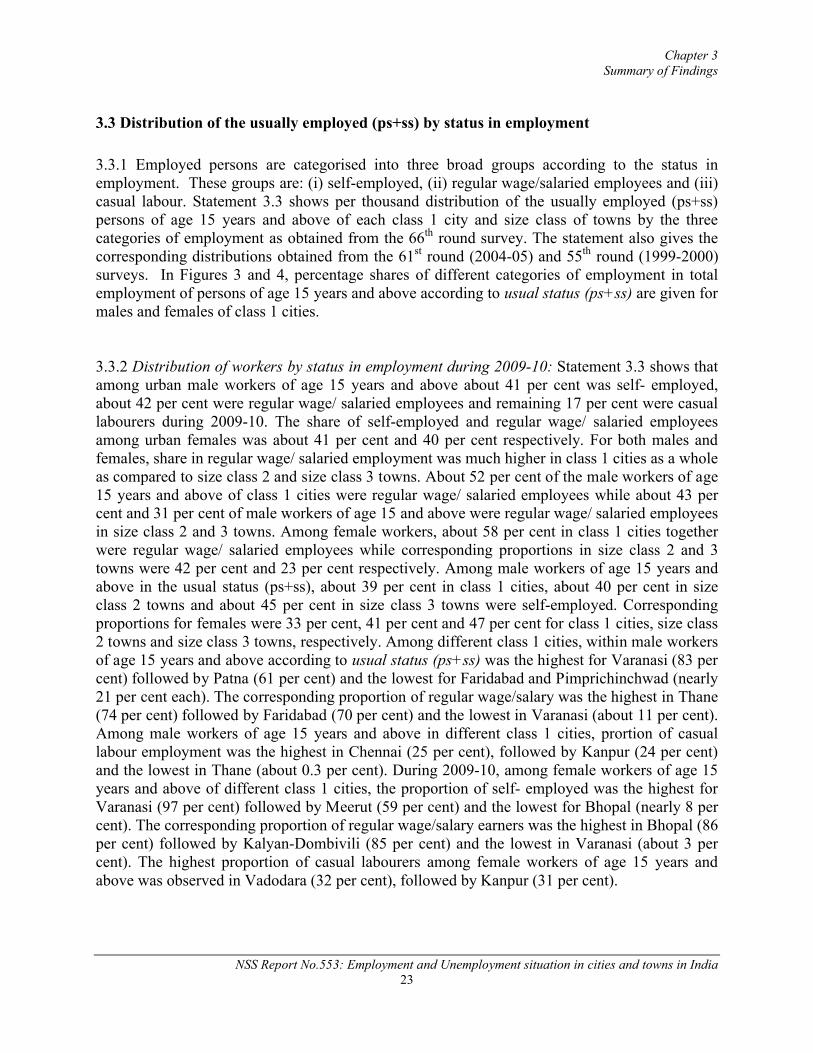
3.3 Distribution of the usually employed (ps+ss) by status in employment
3.3.1 Employed persons are categorised into three broad groups according to the status inemployment. These groups are: (i) self-employed, (ii) regular wage/salaried employees and (iii) casual labour. Statement 3.3 shows per thousand distribution of the usually employed (ps+ss) persons of age 15 years and above of each class 1 city and size class of towns by the three categories of employment as obtained from the 66th round survey. The statement also gives the corresponding distributions obtained from the 61st round (2004-05) and 55th round (1999-2000) surveys. In Figures 3 and 4, percentage shares of different categories of employment in total employment of persons of age 15 years and above according to usual status (ps+ss) are given for males and females of class 1 cities.
3.3.2 Distribution of workers by status in employment during 2009-10: Statement 3.3 shows that among urban male workers of age 15 years and above about 41 per cent was self- employed, about 42 per cent were regular wage/ salaried employees and remaining 17 per cent were casual labourers during 2009-10. The share of self-employed and regular wage/ salaried employees among urban females was about 41 per cent and 40 per cent respectively. For both males and females, share in regular wage/ salaried employment was much higher in class 1 cities as a whole as compared to size class 2 and size class 3 towns. About 52 per cent of the male workers of age 15 years and above of class 1 cities were regular wage/ salaried employees while about 43 per cent and 31 per cent of male workers of age 15 and above were regular wage/ salaried employees in size class 2 and 3 towns. Among female workers, about 58 per cent in class 1 cities togetherwere regular wage/ salaried employees while corresponding proportions in size class 2 and 3 towns were 42 per cent and 23 per cent respectively. Among male workers of age 15 years and above in the usual status (ps+ss), about 39 per cent in class 1 cities, about 40 per cent in size class 2 towns and about 45 per cent in size class 3 towns were self-employed. Corresponding proportions for females were 33 per cent, 41 per cent and 47 per cent for class 1 cities, size class 2 towns and size class 3 towns, respectively. Among different class 1 cities, within male workers of age 15 years and above according to usual status (ps+ss) was the highest for Varanasi (83 per cent) followed by Patna (61 per cent) and the lowest for Faridabad and Pimprichinchwad (nearly 21 per cent each). The corresponding proportion of regular wage/salary was the highest in Thane (74 per cent) followed by Faridabad (70 per cent) and the lowest in Varanasi (about 11 per cent).Among male workers of age 15 years and above in different class 1 cities, prortion of casual labour employment was the highest in Chennai (25 per cent), followed by Kanpur (24 per cent)and the lowest in Thane (about 0.3 per cent). During 2009-10, among female workers of age 15 years and above of different class 1 cities, the proportion of self- employed was the highest for Varanasi (97 per cent) followed by Meerut (59 per cent) and the lowest for Bhopal (nearly 8 per cent). The corresponding proportion of regular wage/salary earners was the highest in Bhopal (86 per cent) followed by Kalyan-Dombivili (85 per cent) and the lowest in Varanasi (about 3 per cent). The highest proportion of casual labourers among female workers of age 15 years and above was observed in Vadodara (32 per cent), followed by Kanpur (31 per cent).
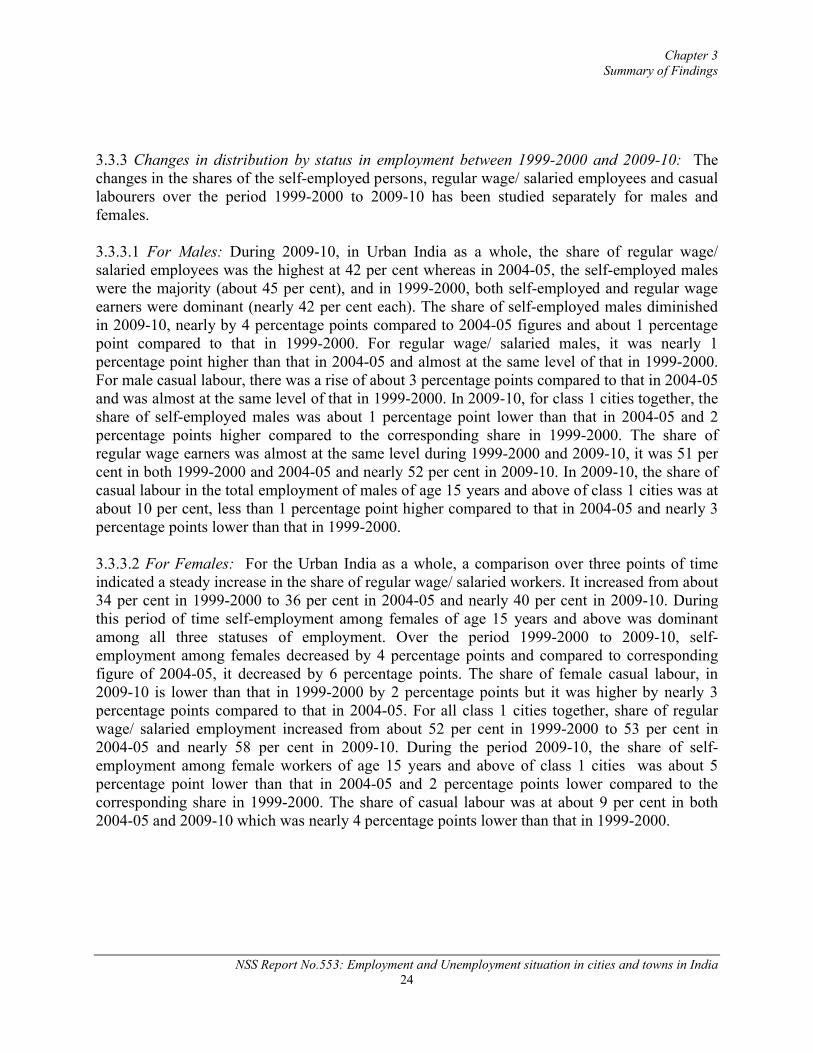
Chapter 3Summary of Findings
NSS Report No.553: Employment and Unemployment situation in cities and towns in India24
3.3.3 Changes in distribution by status in employment between 1999-2000 and 2009-10: The changes in the shares of the self-employed persons, regular wage/ salaried employees and casual labourers over the period 1999-2000 to 2009-10 has been studied separately for males and females.
3.3.3.1 For Males: During 2009-10, in Urban India as a whole, the share of regular wage/ salaried employees was the highest at 42 per cent whereas in 2004-05, the self-employed males were the majority (about 45 per cent), and in 1999-2000, both self-employed and regular wage earners were dominant (nearly 42 per cent each). The share of self-employed males diminished in 2009-10, nearly by 4 percentage points compared to 2004-05 figures and about 1 percentage point compared to that in 1999-2000. For regular wage/ salaried males, it was nearly 1 percentage point higher than that in 2004-05 and almost at the same level of that in 1999-2000. For male casual labour, there was a rise of about 3 percentage points compared to that in 2004-05 and was almost at the same level of that in 1999-2000. In 2009-10, for class 1 cities together, the share of self-employed males was about 1 percentage point lower than that in 2004-05 and 2 percentage points higher compared to the corresponding share in 1999-2000. The share of regular wage earners was almost at the same level during 1999-2000 and 2009-10, it was 51 per cent in both 1999-2000 and 2004-05 and nearly 52 per cent in 2009-10. In 2009-10, the share of casual labour in the total employment of males of age 15 years and above of class 1 cities was at about 10 per cent, less than 1 percentage point higher compared to that in 2004-05 and nearly 3percentage points lower than that in 1999-2000.
3.3.3.2 For Females: For the Urban India as a whole, a comparison over three points of time indicated a steady increase in the share of regular wage/ salaried workers. It increased from about 34 per cent in 1999-2000 to 36 per cent in 2004-05 and nearly 40 per cent in 2009-10. During this period of time self-employment among females of age 15 years and above was dominant among all three statuses of employment. Over the period 1999-2000 to 2009-10, self-employment among females decreased by 4 percentage points and compared to corresponding figure of 2004-05, it decreased by 6 percentage points. The share of female casual labour, in 2009-10 is lower than that in 1999-2000 by 2 percentage points but it was higher by nearly 3 percentage points compared to that in 2004-05. For all class 1 cities together, share of regular wage/ salaried employment increased from about 52 per cent in 1999-2000 to 53 per cent in 2004-05 and nearly 58 per cent in 2009-10. During the period 2009-10, the share of self-employment among female workers of age 15 years and above of class 1 cities was about 5percentage point lower than that in 2004-05 and 2 percentage points lower compared to the corresponding share in 1999-2000. The share of casual labour was at about 9 per cent in both 2004-05 and 2009-10 which was nearly 4 percentage points lower than that in 1999-2000.
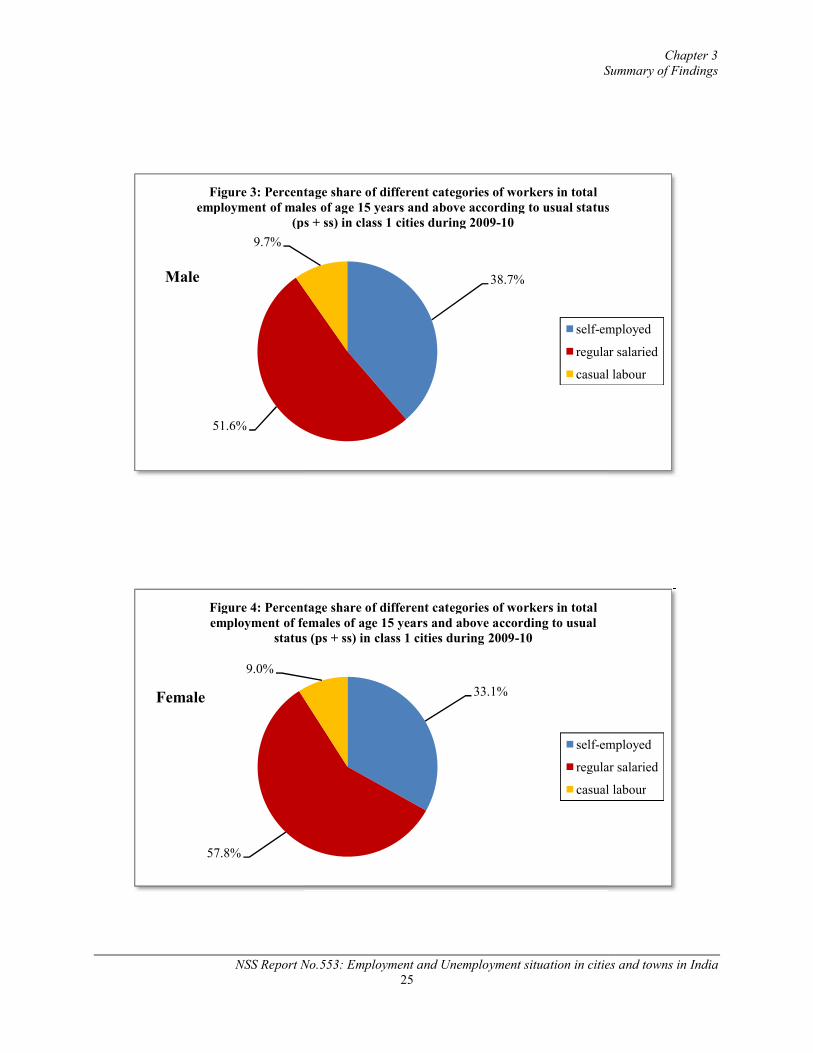
NSS Report No.553: Employment and U
51.6%
9.7%
Figure 3: Percentage share of different categories of workers in total employment of males of age 15 years and above according to usual status
(ps + ss) in class 1 cities during 2009
Male
57.8%
9.0%
Figure 4: Percentage share of different categories of workers in total employment of females of age 15 years and above according to usual
status (ps + ss) in class 1 cities during 2009
Female
Summary of Findings
NSS Report No.553: Employment and Unemployment situation in cities and25
38.7%
Figure 3: Percentage share of different categories of workers in total employment of males of age 15 years and above according to usual status
(ps + ss) in class 1 cities during 2009-10
self-employed
regular salaried
casual labour
33.1%
Figure 4: Percentage share of different categories of workers in total employment of females of age 15 years and above according to usual
status (ps + ss) in class 1 cities during 2009-10
self-employed
regular salaried
casual labour
Chapter 3Summary of Findings
nemployment situation in cities and towns in India
employment of males of age 15 years and above according to usual status
employed
regular salaried
casual labour
employed
regular salaried
casual labour
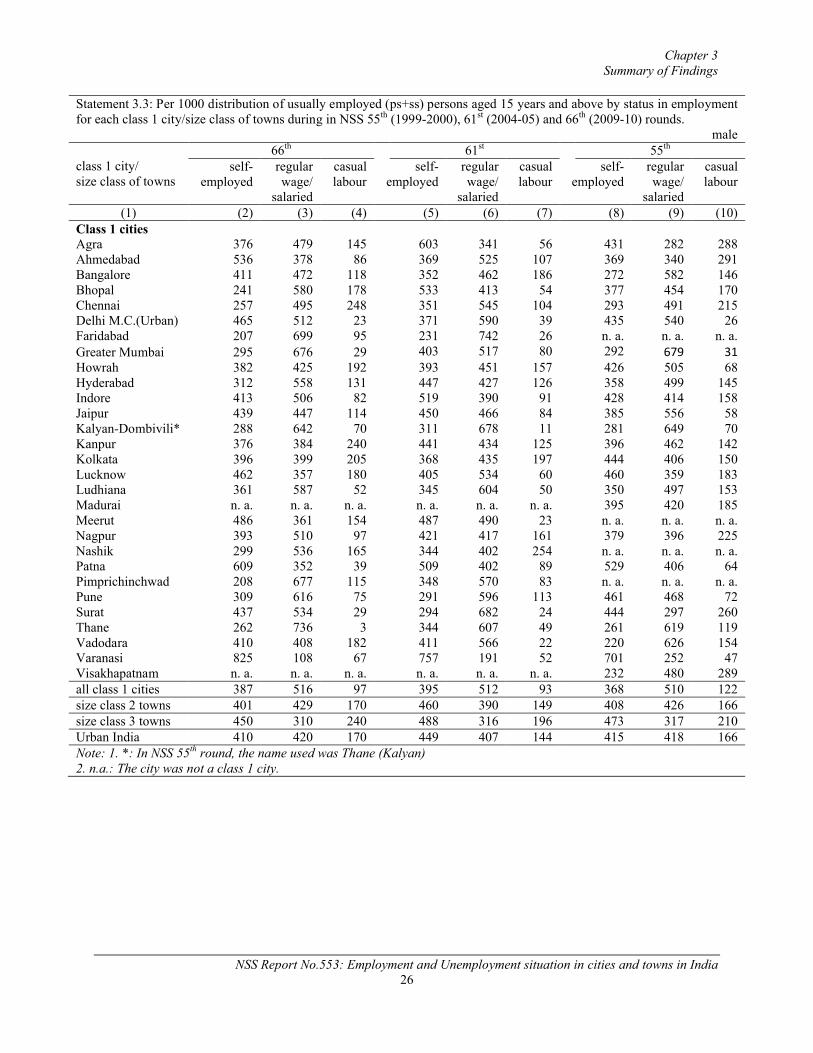
Chapter 3Summary of Findings
NSS Report No.553: Employment and Unemployment situation in cities and towns in India26
Statement 3.3: Per 1000 distribution of usually employed (ps+ss) persons aged 15 years and above by status in employment for each class 1 city/size class of towns during in NSS 55th (1999-2000), 61st (2004-05) and 66th (2009-10) rounds.
male
class 1 city/size class of towns
66th 61st 55th
self-employed
regular wage/
salaried
casual labour
self-employed
regular wage/
salaried
casual labour
self-employed
regular wage/
salaried
casual labour
(1) (2) (3) (4) (5) (6) (7) (8) (9) (10)Class 1 citiesAgra 376 479 145 603 341 56 431 282 288Ahmedabad 536 378 86 369 525 107 369 340 291Bangalore 411 472 118 352 462 186 272 582 146Bhopal 241 580 178 533 413 54 377 454 170Chennai 257 495 248 351 545 104 293 491 215Delhi M.C.(Urban) 465 512 23 371 590 39 435 540 26Faridabad 207 699 95 231 742 26 n. a. n. a. n. a.Greater Mumbai 295 676 29 403 517 80 292 679 31Howrah 382 425 192 393 451 157 426 505 68Hyderabad 312 558 131 447 427 126 358 499 145Indore 413 506 82 519 390 91 428 414 158Jaipur 439 447 114 450 466 84 385 556 58Kalyan-Dombivili* 288 642 70 311 678 11 281 649 70Kanpur 376 384 240 441 434 125 396 462 142Kolkata 396 399 205 368 435 197 444 406 150Lucknow 462 357 180 405 534 60 460 359 183Ludhiana 361 587 52 345 604 50 350 497 153Madurai n. a. n. a. n. a. n. a. n. a. n. a. 395 420 185Meerut 486 361 154 487 490 23 n. a. n. a. n. a.Nagpur 393 510 97 421 417 161 379 396 225Nashik 299 536 165 344 402 254 n. a. n. a. n. a.Patna 609 352 39 509 402 89 529 406 64Pimprichinchwad 208 677 115 348 570 83 n. a. n. a. n. a.Pune 309 616 75 291 596 113 461 468 72Surat 437 534 29 294 682 24 444 297 260Thane 262 736 3 344 607 49 261 619 119Vadodara 410 408 182 411 566 22 220 626 154Varanasi 825 108 67 757 191 52 701 252 47Visakhapatnam n. a. n. a. n. a. n. a. n. a. n. a. 232 480 289all class 1 cities 387 516 97 395 512 93 368 510 122size class 2 towns 401 429 170 460 390 149 408 426 166size class 3 towns 450 310 240 488 316 196 473 317 210Urban India 410 420 170 449 407 144 415 418 166Note: 1. *: In NSS 55th round, the name used was Thane (Kalyan)2. n.a.: The city was not a class 1 city.
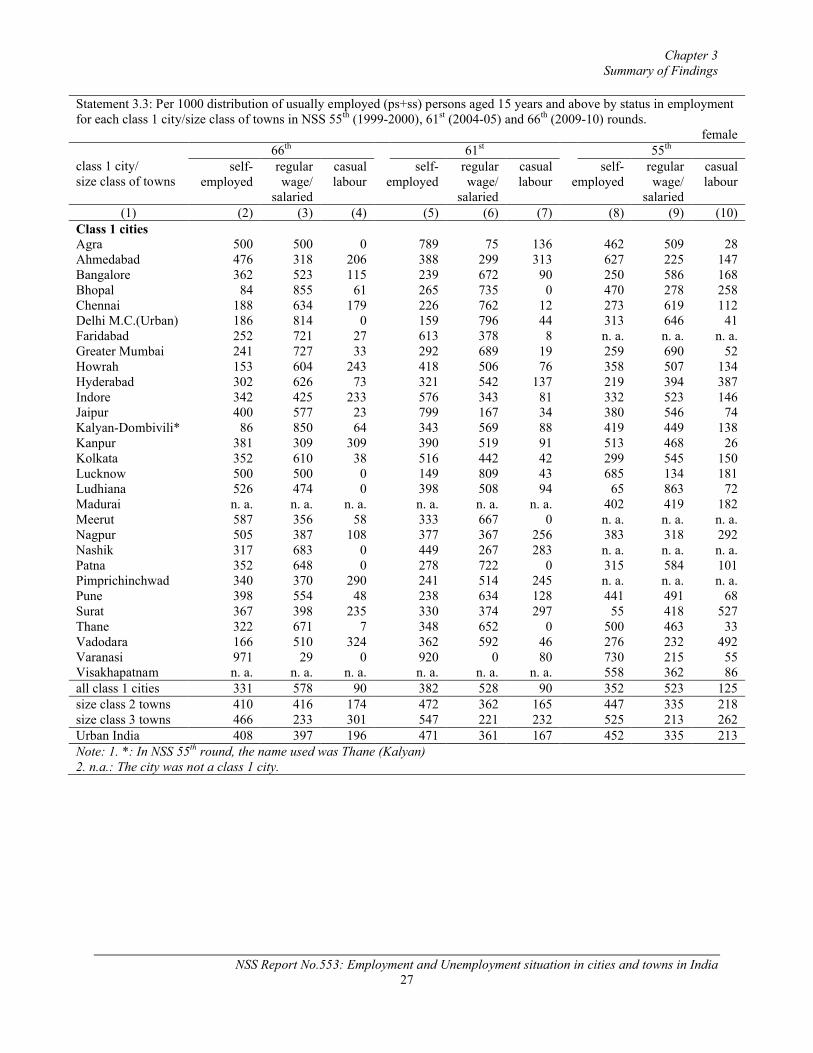
Chapter 3Summary of Findings
NSS Report No.553: Employment and Unemployment situation in cities and towns in India27
Statement 3.3: Per 1000 distribution of usually employed (ps+ss) persons aged 15 years and above by status in employment for each class 1 city/size class of towns in NSS 55th (1999-2000), 61st (2004-05) and 66th (2009-10) rounds.
female
class 1 city/size class of towns
66th 61st 55th
self-employed
regular wage/
salaried
casual labour
self-employed
regular wage/
salaried
casual labour
self-employed
regular wage/
salaried
casual labour
(1) (2) (3) (4) (5) (6) (7) (8) (9) (10)Class 1 citiesAgra 500 500 0 789 75 136 462 509 28Ahmedabad 476 318 206 388 299 313 627 225 147Bangalore 362 523 115 239 672 90 250 586 168Bhopal 84 855 61 265 735 0 470 278 258Chennai 188 634 179 226 762 12 273 619 112Delhi M.C.(Urban) 186 814 0 159 796 44 313 646 41Faridabad 252 721 27 613 378 8 n. a. n. a. n. a.Greater Mumbai 241 727 33 292 689 19 259 690 52Howrah 153 604 243 418 506 76 358 507 134Hyderabad 302 626 73 321 542 137 219 394 387Indore 342 425 233 576 343 81 332 523 146Jaipur 400 577 23 799 167 34 380 546 74Kalyan-Dombivili* 86 850 64 343 569 88 419 449 138Kanpur 381 309 309 390 519 91 513 468 26Kolkata 352 610 38 516 442 42 299 545 150Lucknow 500 500 0 149 809 43 685 134 181Ludhiana 526 474 0 398 508 94 65 863 72Madurai n. a. n. a. n. a. n. a. n. a. n. a. 402 419 182Meerut 587 356 58 333 667 0 n. a. n. a. n. a.Nagpur 505 387 108 377 367 256 383 318 292Nashik 317 683 0 449 267 283 n. a. n. a. n. a.Patna 352 648 0 278 722 0 315 584 101Pimprichinchwad 340 370 290 241 514 245 n. a. n. a. n. a.Pune 398 554 48 238 634 128 441 491 68Surat 367 398 235 330 374 297 55 418 527Thane 322 671 7 348 652 0 500 463 33Vadodara 166 510 324 362 592 46 276 232 492Varanasi 971 29 0 920 0 80 730 215 55Visakhapatnam n. a. n. a. n. a. n. a. n. a. n. a. 558 362 86all class 1 cities 331 578 90 382 528 90 352 523 125size class 2 towns 410 416 174 472 362 165 447 335 218size class 3 towns 466 233 301 547 221 232 525 213 262Urban India 408 397 196 471 361 167 452 335 213Note: 1. *: In NSS 55th round, the name used was Thane (Kalyan)2. n.a.: The city was not a class 1 city.
Chapter 3Summary of Findings
NSS Report No.553: Employment and Unemployment situation in cities and towns in India28
3.4 Estimates of employed according to current status
3.4.1 The ‘usual status’ approach adopted for classification of the population, obviously, does not take into consideration the changes in the activity pattern caused by seasonal fluctuations. But the estimates obtained by adopting the current weekly status (CWS) and current daily status(CDS) approaches are expected to reflect the overall effect of intermittent changes in the activity pattern during the year as they take into account the changes which take place even during a week or day. The estimates of the employed based on current weekly status give the average weekly picture and those based on current daily status give the average daily picture of employment. Since some persons classified as working during a week might not have had work for the entire week, the difference in work participation rate (WPR) in CWS (i.e. number of persons employed per 1000 persons) and work participation rate (WPR) in CDS (i.e. number of person-days employed per 1000 person-days), broadly indicates the underemployment of those who had some employment in the week. The lower the ‘daily status’ rate of employment in relation to the ‘weekly status’ rate, the higher, in general, is the rate of underemployment. This interpretation requires caution in the case of female workers who often have to attend to pressing domestic duties by opting out of workforce. Statement 3.4 gives the relevant estimates of employed persons per 1000 persons of age 15 years and above according to current weekly statusand number of person-days employed per 1000 person-days according to current daily status for each city/size class of towns separately for males and females. The relevant results based on 61st
round and 55th round surveys are also presented in the Statement.
3.4.2 During 2009-10, in case of males, underemployment was highest in Vadodara (4 per cent)followed by Chennai (3 per cent). In case of females, it was the highest for Ahmedabad (4 per cent) followed by Surat (3 per cent).
3.4.3 Changes between 1999-2000 and 2009-10: The prevalence of underemployment among males of age 15 years and above decreased during 2009-10 compared to that in 2004-05 and 1999-2000 for class I cities and for size class 2 and 3 towns as well as for urban India as a whole. For males, differences in WPRs according to CWS and CDS for class 1 cities, size class 2 and size class 3 towns and urban India were 1 percentage point, 2 percentage points, 3 percentage points and 2 percentage points respectively during 2009-10 while corresponding differences were 2 percentage points, 3 percentage points, 4 percentage points and 3 percentage points respectively during 1999-2000. For females, difference in WPRs according to CWS and CDS for class 1 cities, size class 2 and size class 3 towns and urban India were 1 percentage point, 1 percentage point, 3 percentage points and 2 percentage points respectively during 2009-10 while corresponding differences were 2 percentage points, 2 percentage points, 3 percentage points and 2 percentage points respectively during 1999-2000.
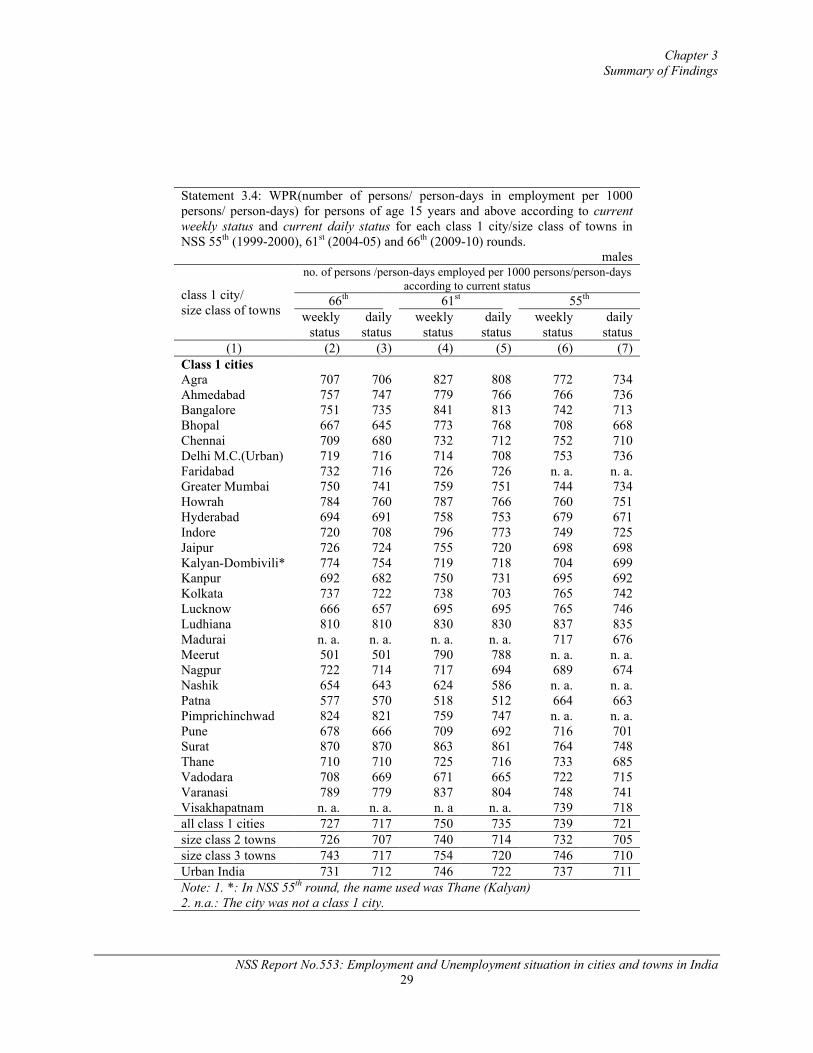
Chapter 3Summary of Findings
NSS Report No.553: Employment and Unemployment situation in cities and towns in India29
Statement 3.4: WPR(number of persons/ person-days in employment per 1000 persons/ person-days) for persons of age 15 years and above according to current weekly status and current daily status for each class 1 city/size class of towns in NSS 55th (1999-2000), 61st (2004-05) and 66th (2009-10) rounds.
males
class 1 city/size class of towns
no. of persons /person-days employed per 1000 persons/person-days according to current status
66th 61st 55th
weekly status
daily status
weekly status
daily status
weekly status
daily status
(1) (2) (3) (4) (5) (6) (7)Class 1 citiesAgra 707 706 827 808 772 734Ahmedabad 757 747 779 766 766 736Bangalore 751 735 841 813 742 713Bhopal 667 645 773 768 708 668Chennai 709 680 732 712 752 710Delhi M.C.(Urban) 719 716 714 708 753 736Faridabad 732 716 726 726 n. a. n. a.Greater Mumbai 750 741 759 751 744 734Howrah 784 760 787 766 760 751Hyderabad 694 691 758 753 679 671Indore 720 708 796 773 749 725Jaipur 726 724 755 720 698 698Kalyan-Dombivili* 774 754 719 718 704 699Kanpur 692 682 750 731 695 692Kolkata 737 722 738 703 765 742Lucknow 666 657 695 695 765 746Ludhiana 810 810 830 830 837 835Madurai n. a. n. a. n. a. n. a. 717 676Meerut 501 501 790 788 n. a. n. a.Nagpur 722 714 717 694 689 674Nashik 654 643 624 586 n. a. n. a.Patna 577 570 518 512 664 663Pimprichinchwad 824 821 759 747 n. a. n. a.Pune 678 666 709 692 716 701Surat 870 870 863 861 764 748Thane 710 710 725 716 733 685Vadodara 708 669 671 665 722 715Varanasi 789 779 837 804 748 741Visakhapatnam n. a. n. a. n. a n. a. 739 718all class 1 cities 727 717 750 735 739 721size class 2 towns 726 707 740 714 732 705size class 3 towns 743 717 754 720 746 710Urban India 731 712 746 722 737 711Note: 1. *: In NSS 55th round, the name used was Thane (Kalyan)2. n.a.: The city was not a class 1 city.
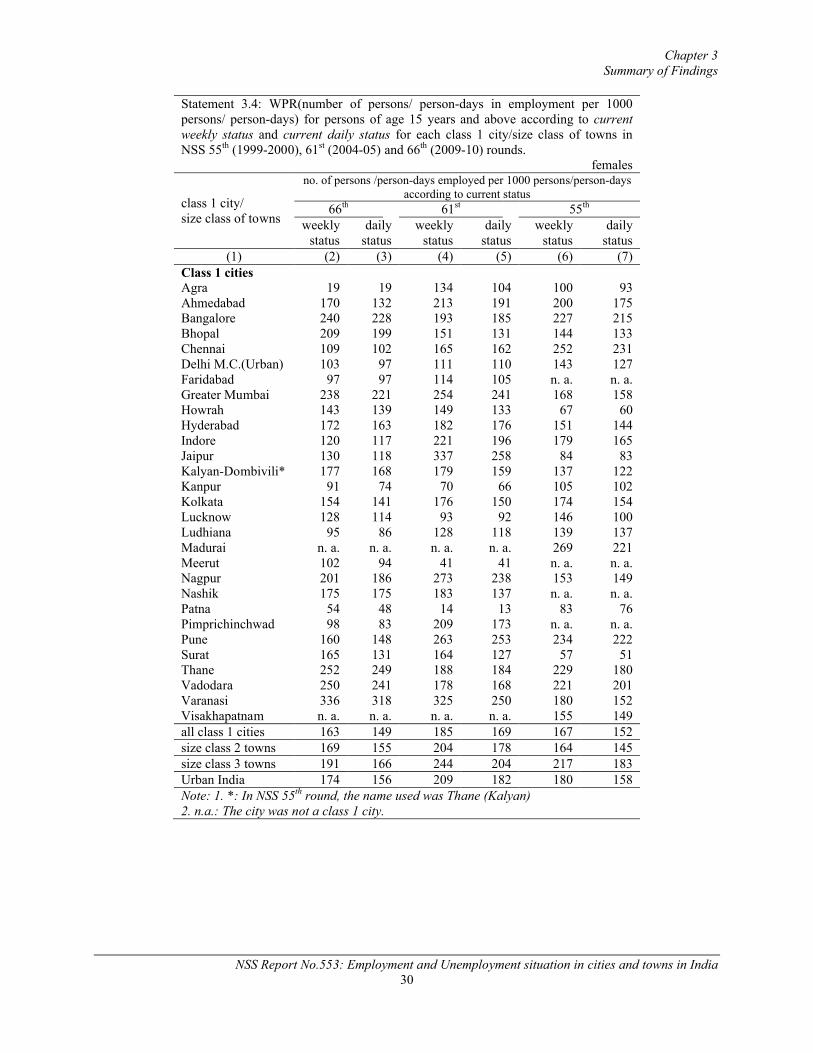
Chapter 3Summary of Findings
NSS Report No.553: Employment and Unemployment situation in cities and towns in India30
Statement 3.4: WPR(number of persons/ person-days in employment per 1000 persons/ person-days) for persons of age 15 years and above according to current weekly status and current daily status for each class 1 city/size class of towns in NSS 55th (1999-2000), 61st (2004-05) and 66th (2009-10) rounds.
females
class 1 city/size class of towns
no. of persons /person-days employed per 1000 persons/person-days according to current status
66th 61st 55th
weekly status
daily status
weekly status
daily status
weekly status
daily status
(1) (2) (3) (4) (5) (6) (7)Class 1 citiesAgra 19 19 134 104 100 93Ahmedabad 170 132 213 191 200 175Bangalore 240 228 193 185 227 215Bhopal 209 199 151 131 144 133Chennai 109 102 165 162 252 231Delhi M.C.(Urban) 103 97 111 110 143 127Faridabad 97 97 114 105 n. a. n. a.Greater Mumbai 238 221 254 241 168 158Howrah 143 139 149 133 67 60Hyderabad 172 163 182 176 151 144Indore 120 117 221 196 179 165Jaipur 130 118 337 258 84 83Kalyan-Dombivili* 177 168 179 159 137 122Kanpur 91 74 70 66 105 102Kolkata 154 141 176 150 174 154Lucknow 128 114 93 92 146 100Ludhiana 95 86 128 118 139 137Madurai n. a. n. a. n. a. n. a. 269 221Meerut 102 94 41 41 n. a. n. a.Nagpur 201 186 273 238 153 149Nashik 175 175 183 137 n. a. n. a.Patna 54 48 14 13 83 76Pimprichinchwad 98 83 209 173 n. a. n. a.Pune 160 148 263 253 234 222Surat 165 131 164 127 57 51Thane 252 249 188 184 229 180Vadodara 250 241 178 168 221 201Varanasi 336 318 325 250 180 152Visakhapatnam n. a. n. a. n. a. n. a. 155 149all class 1 cities 163 149 185 169 167 152size class 2 towns 169 155 204 178 164 145size class 3 towns 191 166 244 204 217 183Urban India 174 156 209 182 180 158Note: 1. *: In NSS 55th round, the name used was Thane (Kalyan)2. n.a.: The city was not a class 1 city.
Chapter 3Summary of Findings
NSS Report No.553: Employment and Unemployment situation in cities and towns in India31
3.5 Unemployment
3.5.1 As in the case of employed, three sets of estimates of unemployment are also obtained by the three different approaches used for classification of the activity statuses of persons. The different estimates of unemployment are:
i) number of persons usually unemployed based on ‘usual status’ approach,
ii) number of persons unemployed on an average in a week, based on the current weekly status(CWS) approach, and
iii) number of person-days unemployed on an average during the reference period of seven days preceding the date of survey, based on the current daily status (CDS) approach.
3.5.1.1 Of these three, the first estimate indicates the numerical magnitude of the persons unemployed for a relatively long period during a reference period of 365 days, and approximates an indicator of chronically unemployed. The estimate of unemployed based on usual principal status is called unemployed according to usual status (ps). However, some of the unemployed on the basis of this criterion might be working in a subsidiary capacity. One can, therefore, get alternative estimate of the usually unemployed excluding those employed in a subsidiary capacity during the reference period. The estimate of unemployed excluding those employed in subsidiary status is called unemployed in usual status (adjusted), which would conceptually be lower than the former.
3.5.1.2 The second estimate is based on the current weekly status and gives the average weekly picture of unemployment during the survey year. It includes both chronic unemployment and also seasonal unemployment of those categorised as usually employed caused by seasonal fluctuations in labour market.
3.5.1.3 The third estimate, based on the current daily status concept, gives the average volume of unemployment on a day during the survey year. It is the most inclusive rate of ‘unemployment’ as it captures the unemployed days of the chronically unemployed, the unemployed days of the usually employed who become intermittently unemployed during the reference week and the unemployed days of those classified as employed according to the priority criterion of current weekly status.
Chapter 3Summary of Findings
NSS Report No.553: Employment and Unemployment situation in cities and towns in India32
3.5.2 Unemployment rates
3.5.2.1 Unemployment Rate (UR) is the ratio of number of unemployed persons/person-days to the number of persons/person-days in labour force. Employed and unemployed taken togetherconstitute labour force (LF). UR gives the unutilized portion of the labour force. Statement 3.5 shows the unemployment rates of persons aged 15 years and above according to usual status (adjusted), current weekly status and current daily status for each class 1 city/size-class of townsseparately for males and females. The corresponding results based on the 61st round and 55th
round survey are also presented in the Statement.
3.5.2.2 Unemployment Rate for Males of age 15 years and above: During 2009-10, among the class 1 cities, chronic unemployment rate for males was the highest for Patna (13 per cent), followed by Kanpur (8 per cent). Over the period 2004-05 and 2009-10, Bhopal witnessed the highest decreased in the chronic unemployment rate (6 percentage points), followed by Howrah (4 percentage points) whereas both Agra and Ludhiana had the highest increase in the chronic unemployment rate (5 percentage points each). Over the period 1999-2000 to 2009-10, there was a steady decrease in both chronic unemployment rates as well as unemployment rates as per current weekly status for males for class 1 cities, size class 2 and 3 towns and for urban India as a whole. The chronic unemployment rates during this period were lowered by about 1 percentage point for class 1 cities, 2 percentage points for size class 2 towns, 1 percentage point for size class 3 towns and 2 percentage points for urban India as a whole. The unemployment rates as per current weekly status over the period 1999-2000 to 2009-10 decreased by about 1 percentage point for class 1 cities, 2 percentage points for size class 2 towns, 2 percentage point for size class 3 towns and 2 percentage points for urban India as a whole. The unemployment rates as per current daily status decreased in 2009-10 in comparison to both 1999-2000 and 2004-05.Between 1999-2000 and 2009-10, the unemployment rates according to CDS decreased by about 2 percentage points for class 1 cities, size class 2 towns, size class 3 towns and for urban India as a whole.
3.5.2.3 Unemployment rate for Females of age 15 years and above: During 2009-10, among the class 1 cities, chronic unemployment rate for females was the highest for Patna (24 per cent), followed by Chennai and Pimprichinchwad (19 per cent each). Over the period 2004-05 and 2009-10, Bangalore witnessed the highest decrease in the chronic unemployment rate (10 percentage points), followed by Vadodara and Howrah (5 percentage point each) whereas Chennai (17 percentage points) had the highest increase in the chronic unemployment rate followed by Ludhiana (14 percentage points). Between 1999-2000 and 2009-10, for urban India as a whole, the chronic unemployment rate and that as per current daily status remained almost at the same level and unemployment rate by current weekly status decreased by less than 1 percentage point. For class 1 cities, between 1999-2000 and 2009-10, the chronic unemployment rate and unemployment rate by current daily status decreased by nearly 1 percentage point and that by current weekly status remained almost at the same level. For size class 2 towns, during1999-2000 and 2009-10, the chronic unemployment rate remained almost at the same level and unemployment rate as per current weekly and current daily status decreased by nearly 1 percentage point. For size class 3 towns, during 1999-2000 and 2009-10, the chronic unemployment rate and that by CWS and CDS remained more or less at the same level.
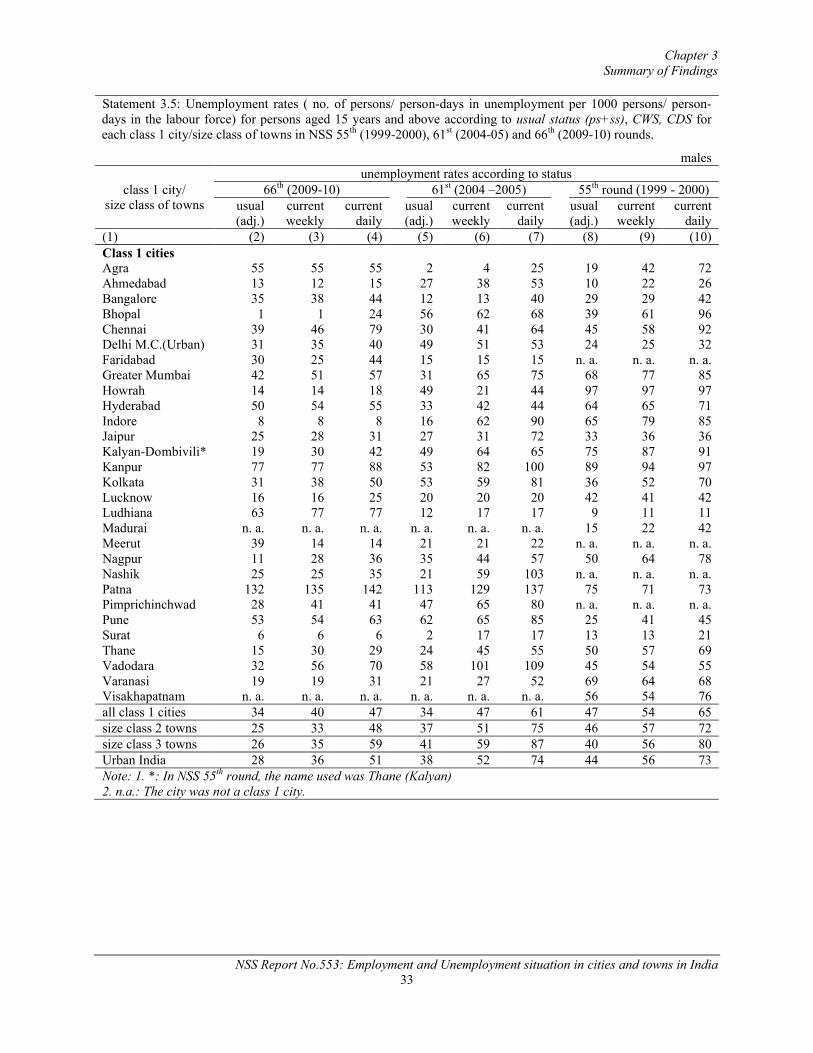
Chapter 3Summary of Findings
NSS Report No.553: Employment and Unemployment situation in cities and towns in India33
Statement 3.5: Unemployment rates ( no. of persons/ person-days in unemployment per 1000 persons/ person-days in the labour force) for persons aged 15 years and above according to usual status (ps+ss), CWS, CDS for each class 1 city/size class of towns in NSS 55th (1999-2000), 61st (2004-05) and 66th (2009-10) rounds.
males
class 1 city/size class of towns
unemployment rates according to status66th (2009-10) 61st (2004 –2005) 55th round (1999 - 2000)
usual(adj.)
current weekly
current daily
usual(adj.)
current weekly
current daily
usual(adj.)
current weekly
current daily
(1) (2) (3) (4) (5) (6) (7) (8) (9) (10)Class 1 citiesAgra 55 55 55 2 4 25 19 42 72Ahmedabad 13 12 15 27 38 53 10 22 26Bangalore 35 38 44 12 13 40 29 29 42Bhopal 1 1 24 56 62 68 39 61 96Chennai 39 46 79 30 41 64 45 58 92Delhi M.C.(Urban) 31 35 40 49 51 53 24 25 32Faridabad 30 25 44 15 15 15 n. a. n. a. n. a.Greater Mumbai 42 51 57 31 65 75 68 77 85Howrah 14 14 18 49 21 44 97 97 97Hyderabad 50 54 55 33 42 44 64 65 71Indore 8 8 8 16 62 90 65 79 85Jaipur 25 28 31 27 31 72 33 36 36Kalyan-Dombivili* 19 30 42 49 64 65 75 87 91Kanpur 77 77 88 53 82 100 89 94 97Kolkata 31 38 50 53 59 81 36 52 70Lucknow 16 16 25 20 20 20 42 41 42Ludhiana 63 77 77 12 17 17 9 11 11Madurai n. a. n. a. n. a. n. a. n. a. n. a. 15 22 42Meerut 39 14 14 21 21 22 n. a. n. a. n. a.Nagpur 11 28 36 35 44 57 50 64 78Nashik 25 25 35 21 59 103 n. a. n. a. n. a.Patna 132 135 142 113 129 137 75 71 73Pimprichinchwad 28 41 41 47 65 80 n. a. n. a. n. a.Pune 53 54 63 62 65 85 25 41 45Surat 6 6 6 2 17 17 13 13 21Thane 15 30 29 24 45 55 50 57 69Vadodara 32 56 70 58 101 109 45 54 55Varanasi 19 19 31 21 27 52 69 64 68Visakhapatnam n. a. n. a. n. a. n. a. n. a. n. a. 56 54 76all class 1 cities 34 40 47 34 47 61 47 54 65size class 2 towns 25 33 48 37 51 75 46 57 72size class 3 towns 26 35 59 41 59 87 40 56 80Urban India 28 36 51 38 52 74 44 56 73Note: 1. *: In NSS 55th round, the name used was Thane (Kalyan)2. n.a.: The city was not a class 1 city.

Chapter 3Summary of Findings
NSS Report No.553: Employment and Unemployment situation in cities and towns in India34
Statement 3.5: Unemployment rates ( no. of persons/ person-days in unemployment per 1000 persons/ person-days in the labour force) for persons aged 15 years and above according to usual status (ps+ss), CWS, CDS for each class 1 city/size class of towns in NSS 55th (1999-2000), 61st (2004-05) and 66th (2009-10) rounds.
females
class 1 city/size class of towns
unemployment rates according to status66th (2009-10) 61st (2004 –2005) 55th round (1999 - 2000)
usual(adj.)
current weekly
current daily
usual(adj.)
current weekly
current daily
usual(adj.)
current weekly
current daily
(1) (2) (3) (4) (5) (6) (7) (8) (9) (10)Class 1 citiesAgra 0 0 0 0 0 28 0 0 11Ahmedabad 12 12 15 27 36 73 10 10 11Bangalore 36 51 54 137 172 185 80 81 85Bhopal 9 9 25 0 0 0 44 77 83Chennai 188 193 221 23 41 41 41 31 45Delhi M.C.(Urban) 20 28 30 59 90 91 33 40 45Faridabad 75 171 126 0 0 0 n. a. n. a. n. a.Greater Mumbai 68 105 102 53 66 69 117 124 136Howrah 0 0 0 54 108 119 143 143 145Hyderabad 109 140 151 59 67 69 38 44 65Indore 124 124 127 0 9 93 0 6 6Jaipur 65 65 71 10 20 30 18 23 24Kalyan-Dombivili* 26 27 29 33 48 70 87 105 129Kanpur 0 0 0 49 54 57 6 9 10Kolkata 86 94 102 104 111 133 70 89 110Lucknow 28 23 26 0 0 0 80 82 115Ludhiana 136 136 149 0 38 41 14 14 14Madurai n. a. n. a. n. a. n. a. n. a. n. a. 107 103 116Meerut 0 0 0 0 0 0 n. a. n. a. n. a.Nagpur 47 74 75 17 45 63 25 25 39Nashik 0 0 0 51 52 87 n. a. n. a. n. a.Patna 239 333 360 182 222 235 174 270 290Pimprichinchwad 187 190 217 70 83 99 n. a. n. a. n. a.Pune 0 0 0 10 37 56 31 29 30Surat 40 35 44 11 41 52 0 17 19Thane 0 12 12 4 87 89 144 112 139Vadodara 31 31 40 84 180 188 47 75 95Varanasi 0 37 15 37 69 91 15 16 19Visakhapatnam n. a. n. a. n. a. n. a. n. a. n. a. 150 197 209all class 1 cities 56 74 80 43 66 77 64 72 85size class 2 towns 63 82 94 84 101 127 63 89 105size class 3 towns 51 59 93 68 96 132 47 61 90Urban India 57 75 93 70 91 117 57 72 92Note: 1. *: In NSS 55th round, the name used was Thane (Kalyan)2. n.a.: The city was not a class 1 city.
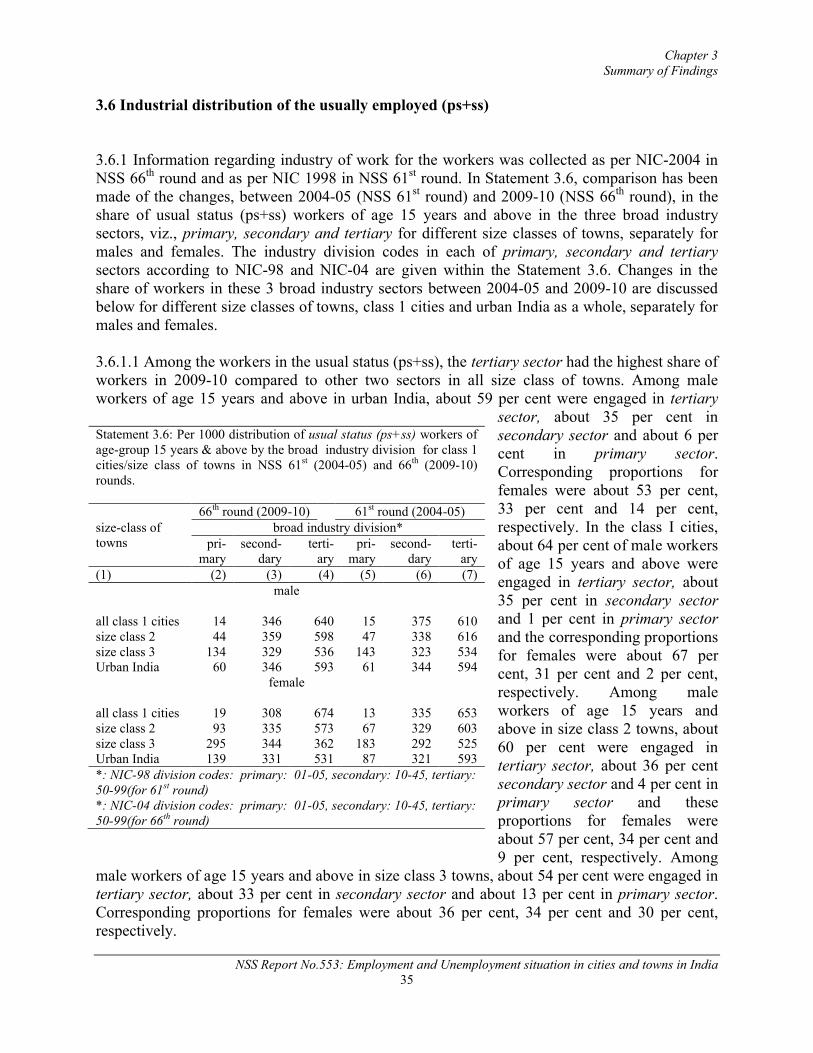
Chapter 3Summary of Findings
NSS Report No.553: Employment and Unemployment situation in cities and towns in India35
3.6 Industrial distribution of the usually employed (ps+ss)
3.6.1 Information regarding industry of work for the workers was collected as per NIC-2004 in NSS 66th round and as per NIC 1998 in NSS 61st round. In Statement 3.6, comparison has been made of the changes, between 2004-05 (NSS 61st round) and 2009-10 (NSS 66th round), in the share of usual status (ps+ss) workers of age 15 years and above in the three broad industry sectors, viz., primary, secondary and tertiary for different size classes of towns, separately for males and females. The industry division codes in each of primary, secondary and tertiarysectors according to NIC-98 and NIC-04 are given within the Statement 3.6. Changes in the share of workers in these 3 broad industry sectors between 2004-05 and 2009-10 are discussed below for different size classes of towns, class 1 cities and urban India as a whole, separately for males and females.
3.6.1.1 Among the workers in the usual status (ps+ss), the tertiary sector had the highest share of workers in 2009-10 compared to other two sectors in all size class of towns. Among male workers of age 15 years and above in urban India, about 59 per cent were engaged in tertiary
sector, about 35 per cent in secondary sector and about 6 per cent in primary sector.Corresponding proportions for females were about 53 per cent,33 per cent and 14 per cent,respectively. In the class I cities, about 64 per cent of male workers of age 15 years and above were engaged in tertiary sector, about 35 per cent in secondary sectorand 1 per cent in primary sectorand the corresponding proportionsfor females were about 67 per cent, 31 per cent and 2 per cent,respectively. Among male workers of age 15 years and above in size class 2 towns, about 60 per cent were engaged in tertiary sector, about 36 per cent secondary sector and 4 per cent in primary sector and theseproportions for females were about 57 per cent, 34 per cent and 9 per cent, respectively. Among
male workers of age 15 years and above in size class 3 towns, about 54 per cent were engaged in tertiary sector, about 33 per cent in secondary sector and about 13 per cent in primary sector.Corresponding proportions for females were about 36 per cent, 34 per cent and 30 per cent,respectively.
Statement 3.6: Per 1000 distribution of usual status (ps+ss) workers of age-group 15 years & above by the broad industry division for class 1 cities/size class of towns in NSS 61st (2004-05) and 66th (2009-10) rounds.
size-class of towns
66th round (2009-10) 61st round (2004-05)broad industry division*
pri-mary
second-dary
terti-ary
pri-mary
second-dary
terti-ary
(1) (2) (3) (4) (5) (6) (7)male
all class 1 cities 14 346 640 15 375 610size class 2 44 359 598 47 338 616size class 3 134 329 536 143 323 534Urban India 60 346 593 61 344 594
female
all class 1 cities 19 308 674 13 335 653size class 2 93 335 573 67 329 603size class 3 295 344 362 183 292 525Urban India 139 331 531 87 321 593*: NIC-98 division codes: primary: 01-05, secondary: 10-45, tertiary: 50-99(for 61st round)*: NIC-04 division codes: primary: 01-05, secondary: 10-45, tertiary: 50-99(for 66th round)
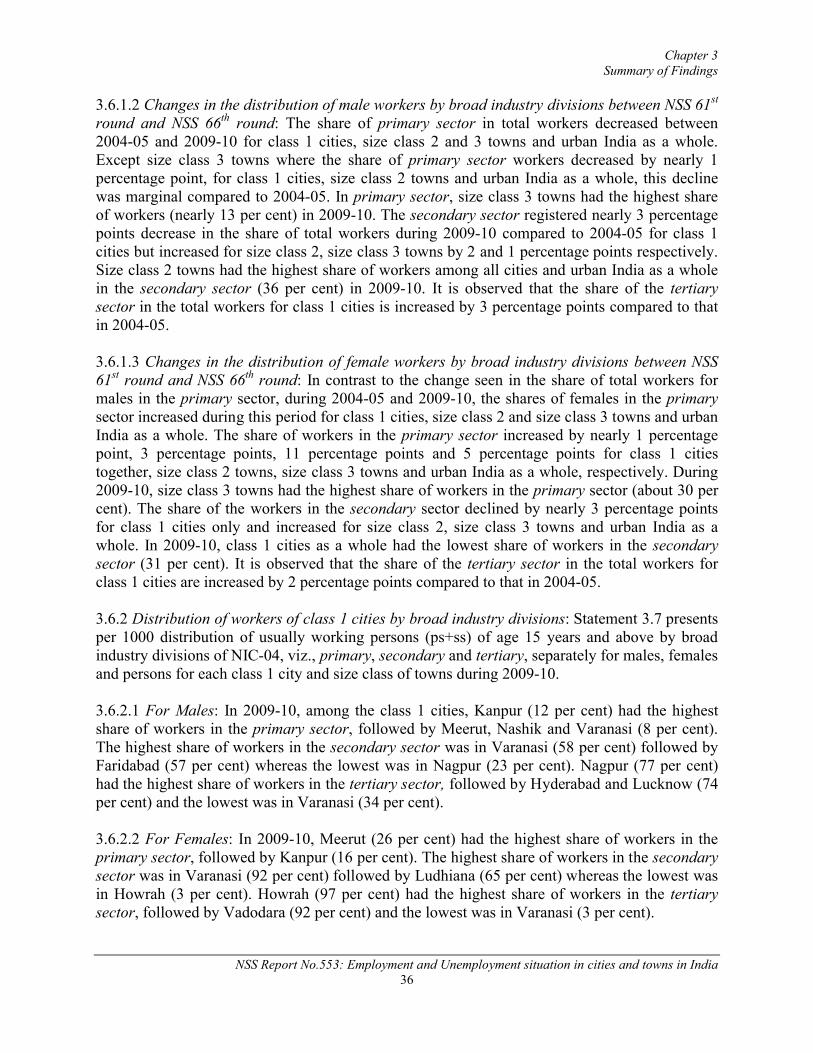
Chapter 3Summary of Findings
NSS Report No.553: Employment and Unemployment situation in cities and towns in India36
3.6.1.2 Changes in the distribution of male workers by broad industry divisions between NSS 61st
round and NSS 66th round: The share of primary sector in total workers decreased between 2004-05 and 2009-10 for class 1 cities, size class 2 and 3 towns and urban India as a whole. Except size class 3 towns where the share of primary sector workers decreased by nearly 1 percentage point, for class 1 cities, size class 2 towns and urban India as a whole, this decline was marginal compared to 2004-05. In primary sector, size class 3 towns had the highest share of workers (nearly 13 per cent) in 2009-10. The secondary sector registered nearly 3 percentage points decrease in the share of total workers during 2009-10 compared to 2004-05 for class 1 cities but increased for size class 2, size class 3 towns by 2 and 1 percentage points respectively. Size class 2 towns had the highest share of workers among all cities and urban India as a whole in the secondary sector (36 per cent) in 2009-10. It is observed that the share of the tertiarysector in the total workers for class 1 cities is increased by 3 percentage points compared to that in 2004-05.
3.6.1.3 Changes in the distribution of female workers by broad industry divisions between NSS 61st round and NSS 66th round: In contrast to the change seen in the share of total workers for males in the primary sector, during 2004-05 and 2009-10, the shares of females in the primarysector increased during this period for class 1 cities, size class 2 and size class 3 towns and urban India as a whole. The share of workers in the primary sector increased by nearly 1 percentage point, 3 percentage points, 11 percentage points and 5 percentage points for class 1 citiestogether, size class 2 towns, size class 3 towns and urban India as a whole, respectively. During 2009-10, size class 3 towns had the highest share of workers in the primary sector (about 30 per cent). The share of the workers in the secondary sector declined by nearly 3 percentage pointsfor class 1 cities only and increased for size class 2, size class 3 towns and urban India as a whole. In 2009-10, class 1 cities as a whole had the lowest share of workers in the secondarysector (31 per cent). It is observed that the share of the tertiary sector in the total workers for class 1 cities are increased by 2 percentage points compared to that in 2004-05.
3.6.2 Distribution of workers of class 1 cities by broad industry divisions: Statement 3.7 presents per 1000 distribution of usually working persons (ps+ss) of age 15 years and above by broad industry divisions of NIC-04, viz., primary, secondary and tertiary, separately for males, females and persons for each class 1 city and size class of towns during 2009-10.
3.6.2.1 For Males: In 2009-10, among the class 1 cities, Kanpur (12 per cent) had the highest share of workers in the primary sector, followed by Meerut, Nashik and Varanasi (8 per cent). The highest share of workers in the secondary sector was in Varanasi (58 per cent) followed by Faridabad (57 per cent) whereas the lowest was in Nagpur (23 per cent). Nagpur (77 per cent)had the highest share of workers in the tertiary sector, followed by Hyderabad and Lucknow (74 per cent) and the lowest was in Varanasi (34 per cent).
3.6.2.2 For Females: In 2009-10, Meerut (26 per cent) had the highest share of workers in the primary sector, followed by Kanpur (16 per cent). The highest share of workers in the secondarysector was in Varanasi (92 per cent) followed by Ludhiana (65 per cent) whereas the lowest was in Howrah (3 per cent). Howrah (97 per cent) had the highest share of workers in the tertiary sector, followed by Vadodara (92 per cent) and the lowest was in Varanasi (3 per cent).
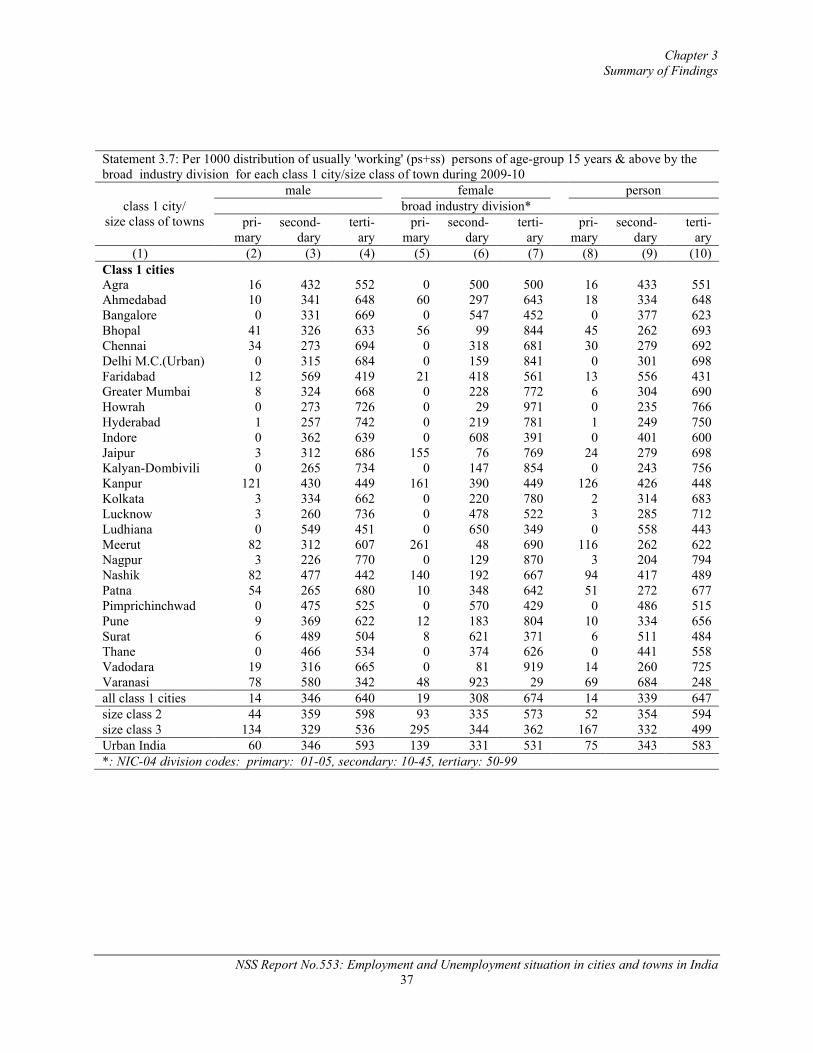
Chapter 3Summary of Findings
NSS Report No.553: Employment and Unemployment situation in cities and towns in India37
Statement 3.7: Per 1000 distribution of usually 'working' (ps+ss) persons of age-group 15 years & above by the broad industry division for each class 1 city/size class of town during 2009-10
class 1 city/size class of towns
male female personbroad industry division*
pri-mary
second-dary
terti-ary
pri-mary
second-dary
terti-ary
pri-mary
second-dary
terti-ary
(1) (2) (3) (4) (5) (6) (7) (8) (9) (10)Class 1 citiesAgra 16 432 552 0 500 500 16 433 551Ahmedabad 10 341 648 60 297 643 18 334 648Bangalore 0 331 669 0 547 452 0 377 623Bhopal 41 326 633 56 99 844 45 262 693Chennai 34 273 694 0 318 681 30 279 692Delhi M.C.(Urban) 0 315 684 0 159 841 0 301 698Faridabad 12 569 419 21 418 561 13 556 431Greater Mumbai 8 324 668 0 228 772 6 304 690Howrah 0 273 726 0 29 971 0 235 766Hyderabad 1 257 742 0 219 781 1 249 750Indore 0 362 639 0 608 391 0 401 600Jaipur 3 312 686 155 76 769 24 279 698Kalyan-Dombivili 0 265 734 0 147 854 0 243 756Kanpur 121 430 449 161 390 449 126 426 448Kolkata 3 334 662 0 220 780 2 314 683Lucknow 3 260 736 0 478 522 3 285 712Ludhiana 0 549 451 0 650 349 0 558 443Meerut 82 312 607 261 48 690 116 262 622Nagpur 3 226 770 0 129 870 3 204 794Nashik 82 477 442 140 192 667 94 417 489Patna 54 265 680 10 348 642 51 272 677Pimprichinchwad 0 475 525 0 570 429 0 486 515Pune 9 369 622 12 183 804 10 334 656Surat 6 489 504 8 621 371 6 511 484Thane 0 466 534 0 374 626 0 441 558Vadodara 19 316 665 0 81 919 14 260 725Varanasi 78 580 342 48 923 29 69 684 248all class 1 cities 14 346 640 19 308 674 14 339 647size class 2 44 359 598 93 335 573 52 354 594size class 3 134 329 536 295 344 362 167 332 499Urban India 60 346 593 139 331 531 75 343 583*: NIC-04 division codes: primary: 01-05, secondary: 10-45, tertiary: 50-99
Appendix A
Detailed Tables
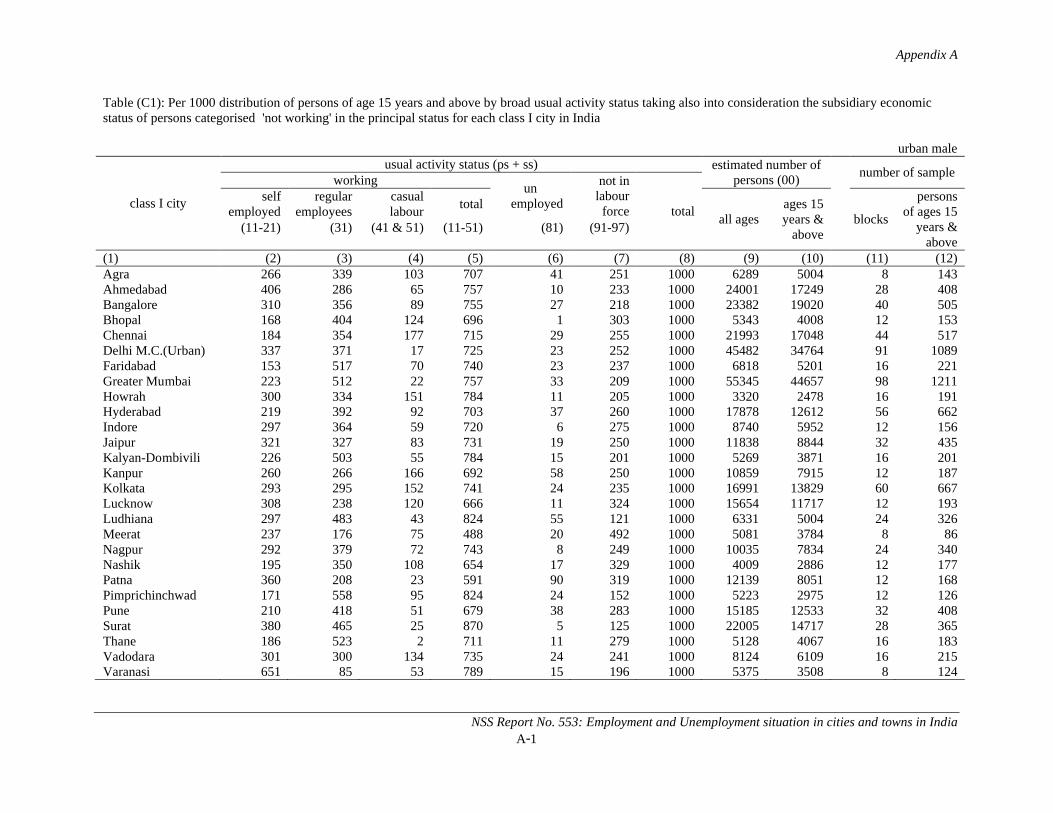
Appendix A
NSS Report No. 553: Employment and Unemployment situation in cities and towns in IndiaA-1
Table (C1): Per 1000 distribution of persons of age 15 years and above by broad usual activity status taking also into consideration the subsidiary economic status of persons categorised 'not working' in the principal status for each class I city in India
urban male
class I city
usual activity status (ps + ss) estimated number of persons (00)
number of sampleworking
unemployed
not in labour
force totalself
employedregular
employeescasual labour
totalall ages
ages 15 years &
aboveblocks
persons of ages 15
years & above
(11-21) (31) (41 & 51) (11-51) (81) (91-97)
(1) (2) (3) (4) (5) (6) (7) (8) (9) (10) (11) (12)Agra 266 339 103 707 41 251 1000 6289 5004 8 143Ahmedabad 406 286 65 757 10 233 1000 24001 17249 28 408Bangalore 310 356 89 755 27 218 1000 23382 19020 40 505Bhopal 168 404 124 696 1 303 1000 5343 4008 12 153Chennai 184 354 177 715 29 255 1000 21993 17048 44 517Delhi M.C.(Urban) 337 371 17 725 23 252 1000 45482 34764 91 1089Faridabad 153 517 70 740 23 237 1000 6818 5201 16 221Greater Mumbai 223 512 22 757 33 209 1000 55345 44657 98 1211Howrah 300 334 151 784 11 205 1000 3320 2478 16 191Hyderabad 219 392 92 703 37 260 1000 17878 12612 56 662Indore 297 364 59 720 6 275 1000 8740 5952 12 156Jaipur 321 327 83 731 19 250 1000 11838 8844 32 435Kalyan-Dombivili 226 503 55 784 15 201 1000 5269 3871 16 201Kanpur 260 266 166 692 58 250 1000 10859 7915 12 187Kolkata 293 295 152 741 24 235 1000 16991 13829 60 667Lucknow 308 238 120 666 11 324 1000 15654 11717 12 193Ludhiana 297 483 43 824 55 121 1000 6331 5004 24 326Meerat 237 176 75 488 20 492 1000 5081 3784 8 86Nagpur 292 379 72 743 8 249 1000 10035 7834 24 340Nashik 195 350 108 654 17 329 1000 4009 2886 12 177Patna 360 208 23 591 90 319 1000 12139 8051 12 168Pimprichinchwad 171 558 95 824 24 152 1000 5223 2975 12 126Pune 210 418 51 679 38 283 1000 15185 12533 32 408Surat 380 465 25 870 5 125 1000 22005 14717 28 365Thane 186 523 2 711 11 279 1000 5128 4067 16 183Vadodara 301 300 134 735 24 241 1000 8124 6109 16 215Varanasi 651 85 53 789 15 196 1000 5375 3508 8 124
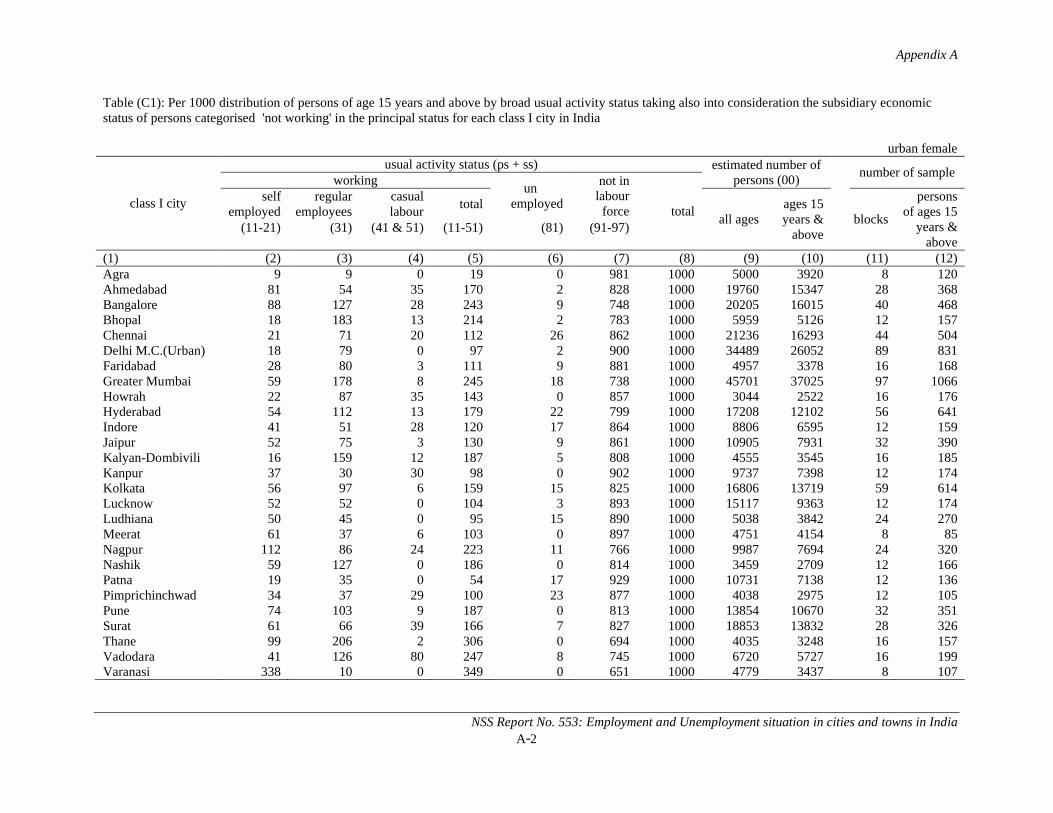
Appendix A
NSS Report No. 553: Employment and Unemployment situation in cities and towns in IndiaA-2
Table (C1): Per 1000 distribution of persons of age 15 years and above by broad usual activity status taking also into consideration the subsidiary economic status of persons categorised 'not working' in the principal status for each class I city in India
urban female
class I city
usual activity status (ps + ss) estimated number of persons (00)
number of sampleworking
unemployed
not in labour
force totalself
employedregular
employeescasual labour
totalall ages
ages 15 years &
aboveblocks
persons of ages 15
years & above
(11-21) (31) (41 & 51) (11-51) (81) (91-97)
(1) (2) (3) (4) (5) (6) (7) (8) (9) (10) (11) (12)Agra 9 9 0 19 0 981 1000 5000 3920 8 120Ahmedabad 81 54 35 170 2 828 1000 19760 15347 28 368Bangalore 88 127 28 243 9 748 1000 20205 16015 40 468Bhopal 18 183 13 214 2 783 1000 5959 5126 12 157Chennai 21 71 20 112 26 862 1000 21236 16293 44 504Delhi M.C.(Urban) 18 79 0 97 2 900 1000 34489 26052 89 831Faridabad 28 80 3 111 9 881 1000 4957 3378 16 168Greater Mumbai 59 178 8 245 18 738 1000 45701 37025 97 1066Howrah 22 87 35 143 0 857 1000 3044 2522 16 176Hyderabad 54 112 13 179 22 799 1000 17208 12102 56 641Indore 41 51 28 120 17 864 1000 8806 6595 12 159Jaipur 52 75 3 130 9 861 1000 10905 7931 32 390Kalyan-Dombivili 16 159 12 187 5 808 1000 4555 3545 16 185Kanpur 37 30 30 98 0 902 1000 9737 7398 12 174Kolkata 56 97 6 159 15 825 1000 16806 13719 59 614Lucknow 52 52 0 104 3 893 1000 15117 9363 12 174Ludhiana 50 45 0 95 15 890 1000 5038 3842 24 270Meerat 61 37 6 103 0 897 1000 4751 4154 8 85Nagpur 112 86 24 223 11 766 1000 9987 7694 24 320Nashik 59 127 0 186 0 814 1000 3459 2709 12 166Patna 19 35 0 54 17 929 1000 10731 7138 12 136Pimprichinchwad 34 37 29 100 23 877 1000 4038 2975 12 105Pune 74 103 9 187 0 813 1000 13854 10670 32 351Surat 61 66 39 166 7 827 1000 18853 13832 28 326Thane 99 206 2 306 0 694 1000 4035 3248 16 157Vadodara 41 126 80 247 8 745 1000 6720 5727 16 199Varanasi 338 10 0 349 0 651 1000 4779 3437 8 107
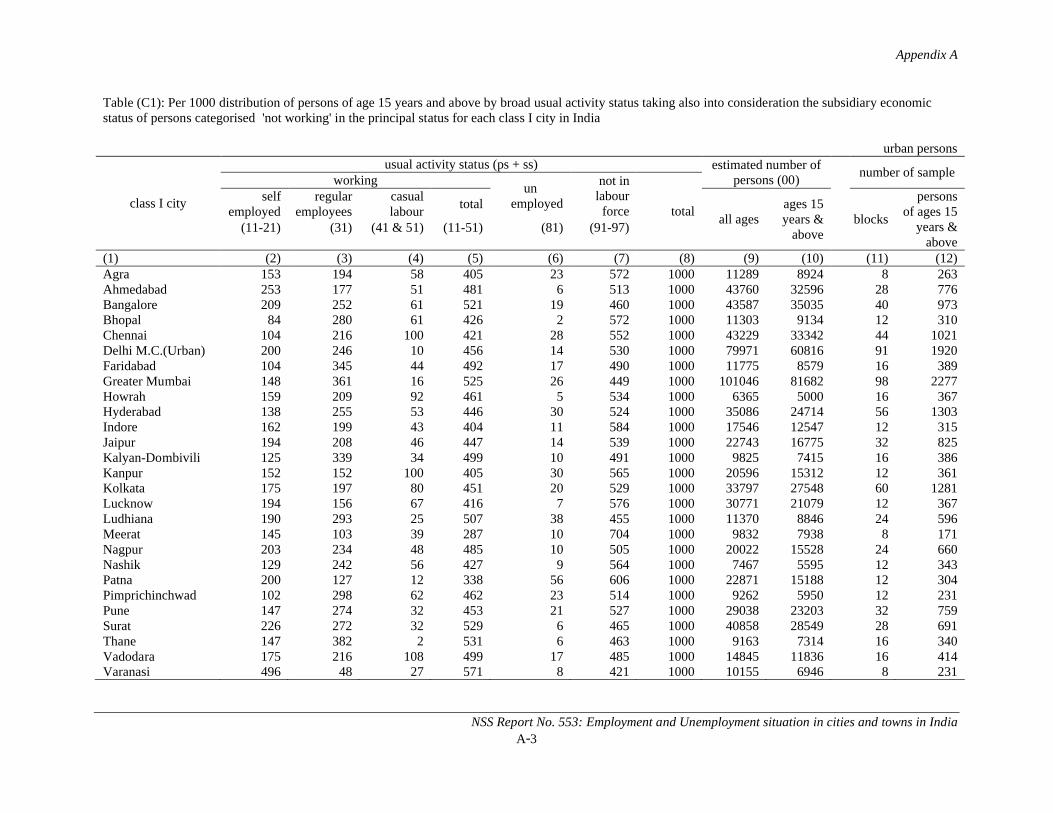
Appendix A
NSS Report No. 553: Employment and Unemployment situation in cities and towns in IndiaA-3
Table (C1): Per 1000 distribution of persons of age 15 years and above by broad usual activity status taking also into consideration the subsidiary economic status of persons categorised 'not working' in the principal status for each class I city in India
urban persons
class I city
usual activity status (ps + ss) estimated number of persons (00)
number of sampleworking
unemployed
not in labour
force totalself
employedregular
employeescasual labour
totalall ages
ages 15 years &
aboveblocks
persons of ages 15
years & above
(11-21) (31) (41 & 51) (11-51) (81) (91-97)
(1) (2) (3) (4) (5) (6) (7) (8) (9) (10) (11) (12)Agra 153 194 58 405 23 572 1000 11289 8924 8 263Ahmedabad 253 177 51 481 6 513 1000 43760 32596 28 776Bangalore 209 252 61 521 19 460 1000 43587 35035 40 973Bhopal 84 280 61 426 2 572 1000 11303 9134 12 310Chennai 104 216 100 421 28 552 1000 43229 33342 44 1021Delhi M.C.(Urban) 200 246 10 456 14 530 1000 79971 60816 91 1920Faridabad 104 345 44 492 17 490 1000 11775 8579 16 389Greater Mumbai 148 361 16 525 26 449 1000 101046 81682 98 2277Howrah 159 209 92 461 5 534 1000 6365 5000 16 367Hyderabad 138 255 53 446 30 524 1000 35086 24714 56 1303Indore 162 199 43 404 11 584 1000 17546 12547 12 315Jaipur 194 208 46 447 14 539 1000 22743 16775 32 825Kalyan-Dombivili 125 339 34 499 10 491 1000 9825 7415 16 386Kanpur 152 152 100 405 30 565 1000 20596 15312 12 361Kolkata 175 197 80 451 20 529 1000 33797 27548 60 1281Lucknow 194 156 67 416 7 576 1000 30771 21079 12 367Ludhiana 190 293 25 507 38 455 1000 11370 8846 24 596Meerat 145 103 39 287 10 704 1000 9832 7938 8 171Nagpur 203 234 48 485 10 505 1000 20022 15528 24 660Nashik 129 242 56 427 9 564 1000 7467 5595 12 343Patna 200 127 12 338 56 606 1000 22871 15188 12 304Pimprichinchwad 102 298 62 462 23 514 1000 9262 5950 12 231Pune 147 274 32 453 21 527 1000 29038 23203 32 759Surat 226 272 32 529 6 465 1000 40858 28549 28 691Thane 147 382 2 531 6 463 1000 9163 7314 16 340Vadodara 175 216 108 499 17 485 1000 14845 11836 16 414Varanasi 496 48 27 571 8 421 1000 10155 6946 8 231
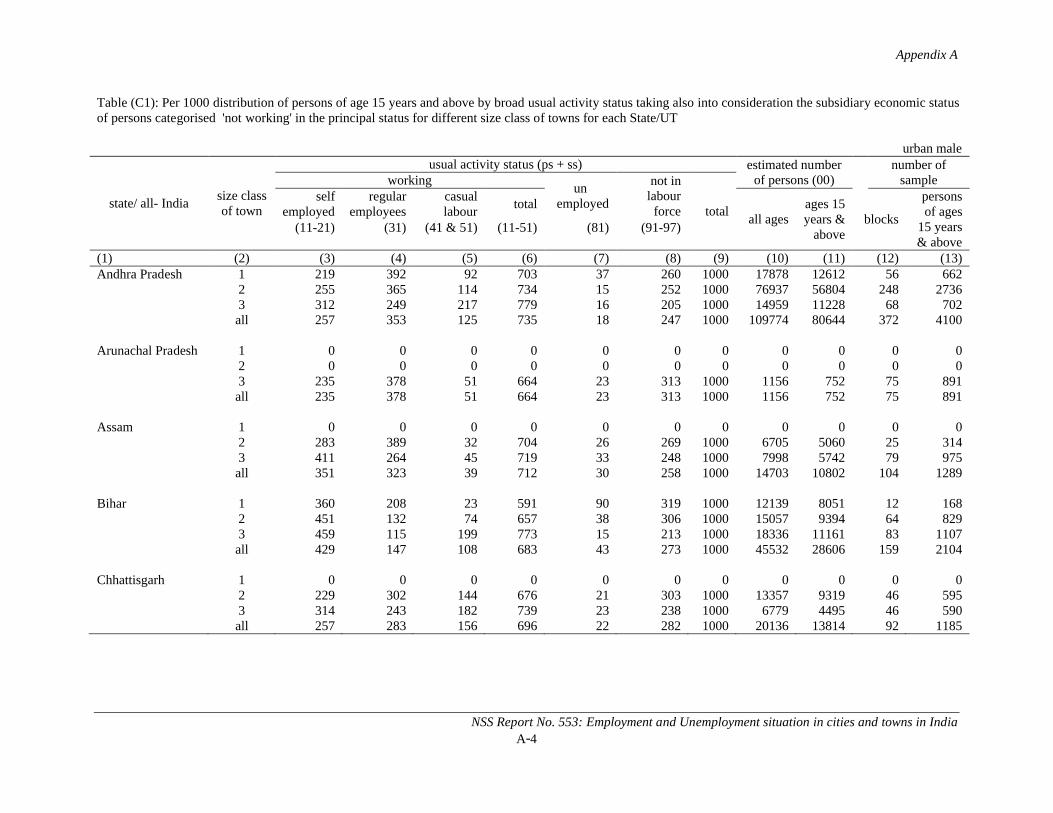
Appendix A
NSS Report No. 553: Employment and Unemployment situation in cities and towns in IndiaA-4
Table (C1): Per 1000 distribution of persons of age 15 years and above by broad usual activity status taking also into consideration the subsidiary economic status of persons categorised 'not working' in the principal status for different size class of towns for each State/UT
urban male
state/ all- Indiasize class of town
usual activity status (ps + ss) estimated number of persons (00)
number of sampleworking
unemployed
not in labour
force totalself
employedregular
employeescasual labour
totalall ages
ages 15 years &
aboveblocks
persons of ages
15 years & above
(11-21) (31) (41 & 51) (11-51) (81) (91-97)
(1) (2) (3) (4) (5) (6) (7) (8) (9) (10) (11) (12) (13)Andhra Pradesh 1 219 392 92 703 37 260 1000 17878 12612 56 662
2 255 365 114 734 15 252 1000 76937 56804 248 27363 312 249 217 779 16 205 1000 14959 11228 68 702all 257 353 125 735 18 247 1000 109774 80644 372 4100
Arunachal Pradesh 1 0 0 0 0 0 0 0 0 0 0 02 0 0 0 0 0 0 0 0 0 0 03 235 378 51 664 23 313 1000 1156 752 75 891all 235 378 51 664 23 313 1000 1156 752 75 891
Assam 1 0 0 0 0 0 0 0 0 0 0 02 283 389 32 704 26 269 1000 6705 5060 25 3143 411 264 45 719 33 248 1000 7998 5742 79 975all 351 323 39 712 30 258 1000 14703 10802 104 1289
Bihar 1 360 208 23 591 90 319 1000 12139 8051 12 1682 451 132 74 657 38 306 1000 15057 9394 64 8293 459 115 199 773 15 213 1000 18336 11161 83 1107all 429 147 108 683 43 273 1000 45532 28606 159 2104
Chhattisgarh 1 0 0 0 0 0 0 0 0 0 0 02 229 302 144 676 21 303 1000 13357 9319 46 5953 314 243 182 739 23 238 1000 6779 4495 46 590all 257 283 156 696 22 282 1000 20136 13814 92 1185
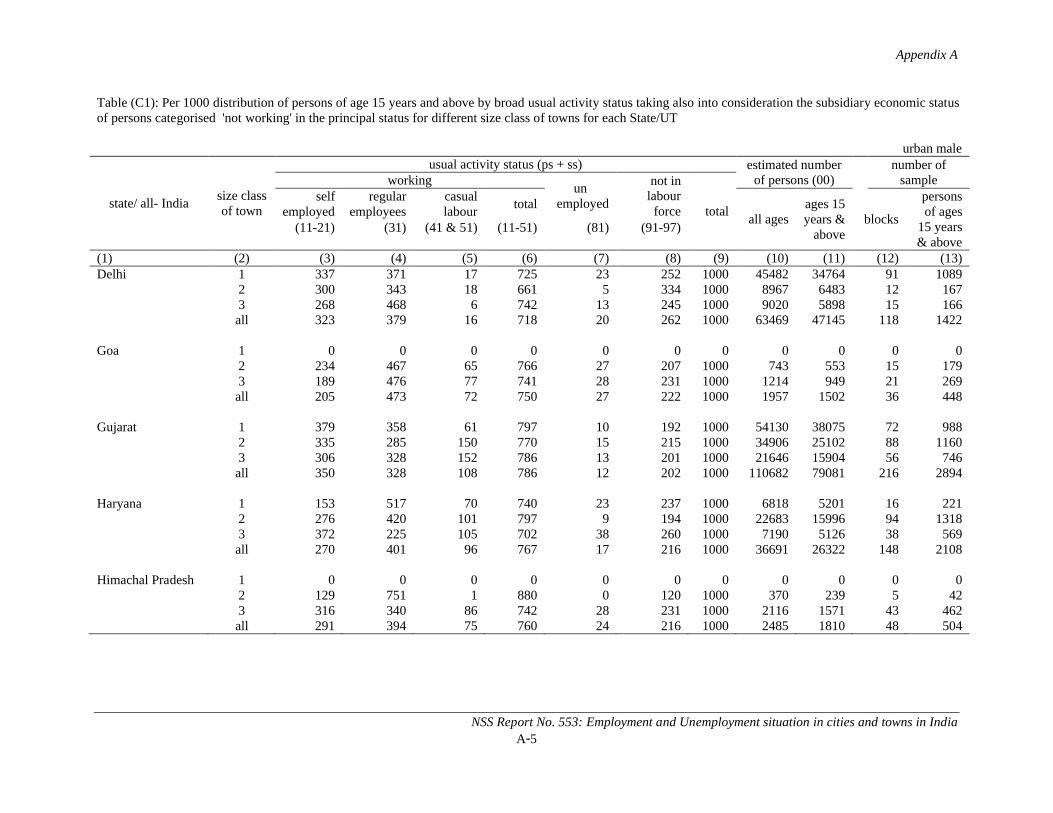
Appendix A
NSS Report No. 553: Employment and Unemployment situation in cities and towns in IndiaA-5
Table (C1): Per 1000 distribution of persons of age 15 years and above by broad usual activity status taking also into consideration the subsidiary economic status of persons categorised 'not working' in the principal status for different size class of towns for each State/UT
urban male
state/ all- Indiasize class of town
usual activity status (ps + ss) estimated number of persons (00)
number of sampleworking
unemployed
not in labour
force totalself
employedregular
employeescasual labour
totalall ages
ages 15 years &
aboveblocks
persons of ages
15 years & above
(11-21) (31) (41 & 51) (11-51) (81) (91-97)
(1) (2) (3) (4) (5) (6) (7) (8) (9) (10) (11) (12) (13)Delhi 1 337 371 17 725 23 252 1000 45482 34764 91 1089
2 300 343 18 661 5 334 1000 8967 6483 12 1673 268 468 6 742 13 245 1000 9020 5898 15 166all 323 379 16 718 20 262 1000 63469 47145 118 1422
Goa 1 0 0 0 0 0 0 0 0 0 0 02 234 467 65 766 27 207 1000 743 553 15 1793 189 476 77 741 28 231 1000 1214 949 21 269all 205 473 72 750 27 222 1000 1957 1502 36 448
Gujarat 1 379 358 61 797 10 192 1000 54130 38075 72 9882 335 285 150 770 15 215 1000 34906 25102 88 11603 306 328 152 786 13 201 1000 21646 15904 56 746all 350 328 108 786 12 202 1000 110682 79081 216 2894
Haryana 1 153 517 70 740 23 237 1000 6818 5201 16 2212 276 420 101 797 9 194 1000 22683 15996 94 13183 372 225 105 702 38 260 1000 7190 5126 38 569all 270 401 96 767 17 216 1000 36691 26322 148 2108
Himachal Pradesh 1 0 0 0 0 0 0 0 0 0 0 02 129 751 1 880 0 120 1000 370 239 5 423 316 340 86 742 28 231 1000 2116 1571 43 462all 291 394 75 760 24 216 1000 2485 1810 48 504
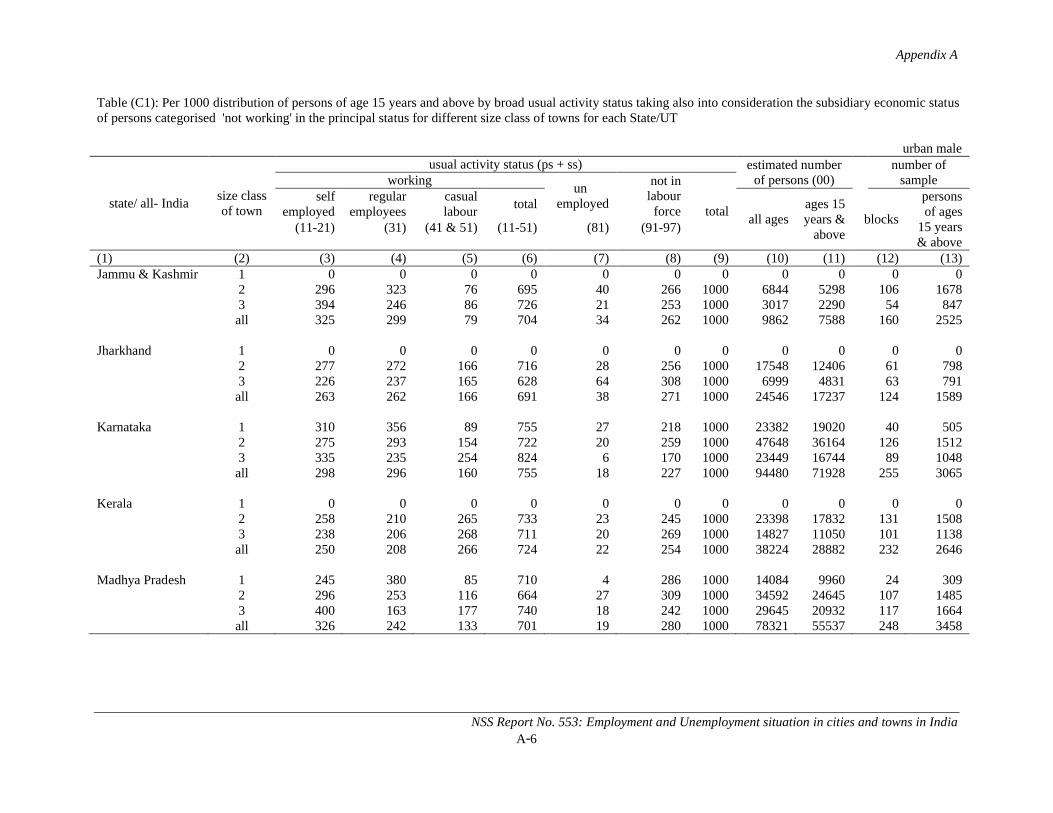
Appendix A
NSS Report No. 553: Employment and Unemployment situation in cities and towns in IndiaA-6
Table (C1): Per 1000 distribution of persons of age 15 years and above by broad usual activity status taking also into consideration the subsidiary economic status of persons categorised 'not working' in the principal status for different size class of towns for each State/UT
urban male
state/ all- Indiasize class of town
usual activity status (ps + ss) estimated number of persons (00)
number of sampleworking
unemployed
not in labour
force totalself
employedregular
employeescasual labour
totalall ages
ages 15 years &
aboveblocks
persons of ages
15 years & above
(11-21) (31) (41 & 51) (11-51) (81) (91-97)
(1) (2) (3) (4) (5) (6) (7) (8) (9) (10) (11) (12) (13)Jammu & Kashmir 1 0 0 0 0 0 0 0 0 0 0 0
2 296 323 76 695 40 266 1000 6844 5298 106 16783 394 246 86 726 21 253 1000 3017 2290 54 847all 325 299 79 704 34 262 1000 9862 7588 160 2525
Jharkhand 1 0 0 0 0 0 0 0 0 0 0 02 277 272 166 716 28 256 1000 17548 12406 61 7983 226 237 165 628 64 308 1000 6999 4831 63 791all 263 262 166 691 38 271 1000 24546 17237 124 1589
Karnataka 1 310 356 89 755 27 218 1000 23382 19020 40 5052 275 293 154 722 20 259 1000 47648 36164 126 15123 335 235 254 824 6 170 1000 23449 16744 89 1048all 298 296 160 755 18 227 1000 94480 71928 255 3065
Kerala 1 0 0 0 0 0 0 0 0 0 0 02 258 210 265 733 23 245 1000 23398 17832 131 15083 238 206 268 711 20 269 1000 14827 11050 101 1138all 250 208 266 724 22 254 1000 38224 28882 232 2646
Madhya Pradesh 1 245 380 85 710 4 286 1000 14084 9960 24 3092 296 253 116 664 27 309 1000 34592 24645 107 14853 400 163 177 740 18 242 1000 29645 20932 117 1664all 326 242 133 701 19 280 1000 78321 55537 248 3458

Appendix A
NSS Report No. 553: Employment and Unemployment situation in cities and towns in IndiaA-7
Table (C1): Per 1000 distribution of persons of age 15 years and above by broad usual activity status taking also into consideration the subsidiary economic status of persons categorised 'not working' in the principal status for different size class of towns for each State/UT
urban male
state/ all- Indiasize class of town
usual activity status (ps + ss) estimated number of persons (00)
number of sampleworking
unemployed
not in labour
force totalself
employedregular
employeescasual labour
totalall ages
ages 15 years &
aboveblocks
persons of ages
15 years & above
(11-21) (31) (41 & 51) (11-51) (81) (91-97)
(1) (2) (3) (4) (5) (6) (7) (8) (9) (10) (11) (12) (13)Maharashtra 1 223 480 38 741 29 230 1000 100193 78822 210 2646
2 259 389 123 771 14 215 1000 78670 58455 186 26013 298 271 175 745 15 240 1000 31814 23279 106 1413all 247 417 89 752 21 226 1000 210677 160557 502 6660
Manipur 1 0 0 0 0 0 0 0 0 0 0 02 425 234 44 704 46 251 1000 988 680 59 7763 518 195 22 735 33 232 1000 1754 1110 89 1135all 483 210 30 723 38 239 1000 2742 1790 148 1911
Meghalaya 1 0 0 0 0 0 0 0 0 0 0 02 113 446 144 704 19 278 1000 613 433 17 1933 193 348 125 666 23 312 1000 1378 914 34 451all 167 380 131 678 21 301 1000 1991 1347 51 644
Mizoram 1 0 0 0 0 0 0 0 0 0 0 02 228 358 121 707 30 263 1000 813 568 55 6783 480 223 78 782 9 209 1000 839 585 57 709all 356 290 99 745 19 236 1000 1652 1152 112 1387
Nagaland 1 0 0 0 0 0 0 0 0 0 0 02 221 351 15 588 35 377 1000 685 501 13 1843 305 336 13 655 47 298 1000 761 503 27 350all 263 344 14 621 41 338 1000 1446 1005 40 534
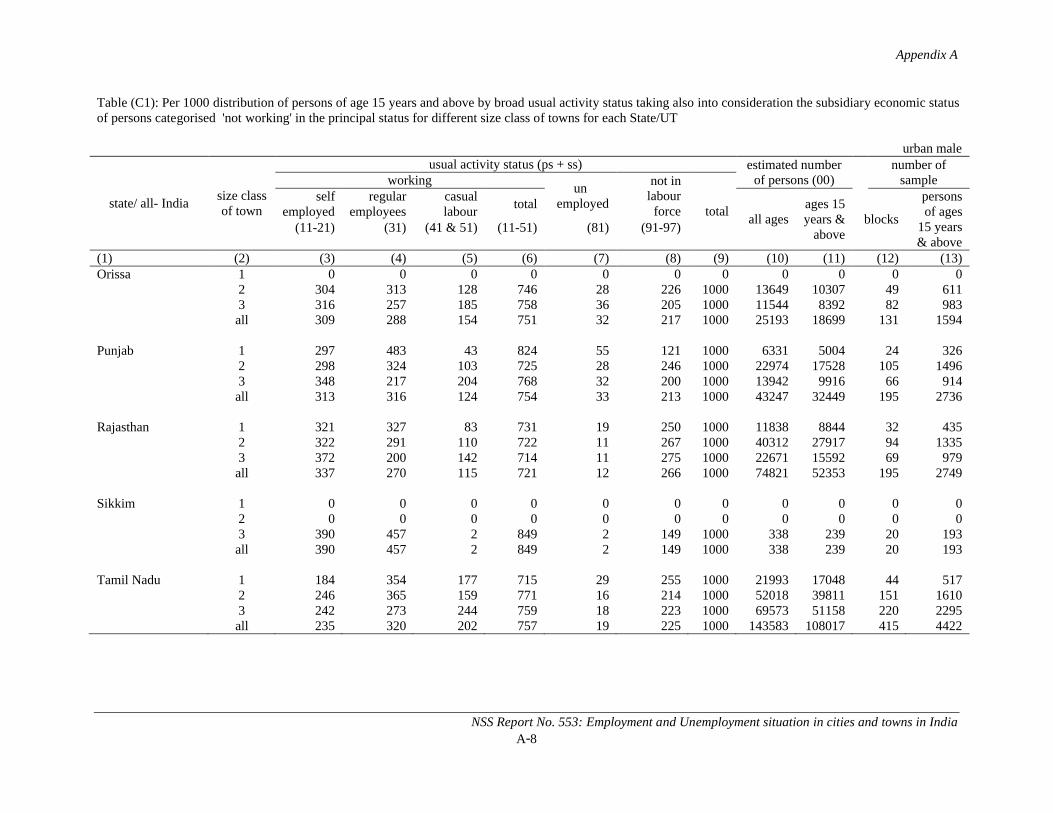
Appendix A
NSS Report No. 553: Employment and Unemployment situation in cities and towns in IndiaA-8
Table (C1): Per 1000 distribution of persons of age 15 years and above by broad usual activity status taking also into consideration the subsidiary economic status of persons categorised 'not working' in the principal status for different size class of towns for each State/UT
urban male
state/ all- Indiasize class of town
usual activity status (ps + ss) estimated number of persons (00)
number of sampleworking
unemployed
not in labour
force totalself
employedregular
employeescasual labour
totalall ages
ages 15 years &
aboveblocks
persons of ages
15 years & above
(11-21) (31) (41 & 51) (11-51) (81) (91-97)
(1) (2) (3) (4) (5) (6) (7) (8) (9) (10) (11) (12) (13)Orissa 1 0 0 0 0 0 0 0 0 0 0 0
2 304 313 128 746 28 226 1000 13649 10307 49 6113 316 257 185 758 36 205 1000 11544 8392 82 983all 309 288 154 751 32 217 1000 25193 18699 131 1594
Punjab 1 297 483 43 824 55 121 1000 6331 5004 24 3262 298 324 103 725 28 246 1000 22974 17528 105 14963 348 217 204 768 32 200 1000 13942 9916 66 914all 313 316 124 754 33 213 1000 43247 32449 195 2736
Rajasthan 1 321 327 83 731 19 250 1000 11838 8844 32 4352 322 291 110 722 11 267 1000 40312 27917 94 13353 372 200 142 714 11 275 1000 22671 15592 69 979all 337 270 115 721 12 266 1000 74821 52353 195 2749
Sikkim 1 0 0 0 0 0 0 0 0 0 0 02 0 0 0 0 0 0 0 0 0 0 03 390 457 2 849 2 149 1000 338 239 20 193all 390 457 2 849 2 149 1000 338 239 20 193
Tamil Nadu 1 184 354 177 715 29 255 1000 21993 17048 44 5172 246 365 159 771 16 214 1000 52018 39811 151 16103 242 273 244 759 18 223 1000 69573 51158 220 2295all 235 320 202 757 19 225 1000 143583 108017 415 4422
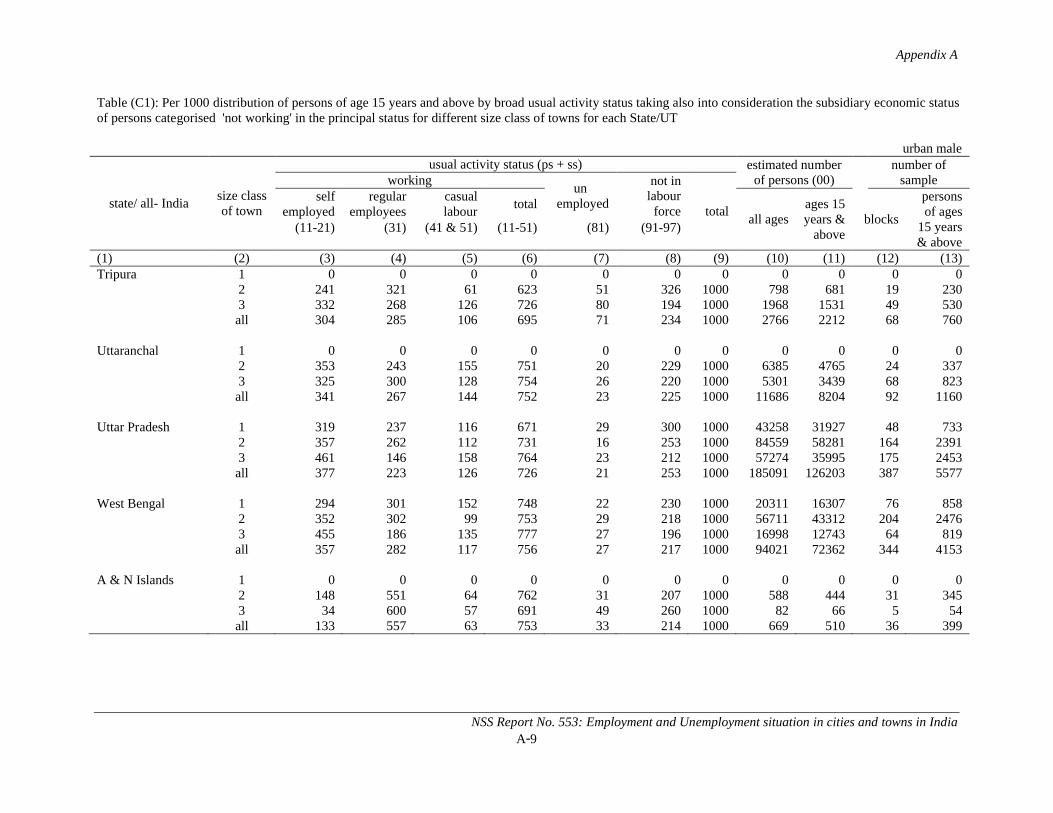
Appendix A
NSS Report No. 553: Employment and Unemployment situation in cities and towns in IndiaA-9
Table (C1): Per 1000 distribution of persons of age 15 years and above by broad usual activity status taking also into consideration the subsidiary economic status of persons categorised 'not working' in the principal status for different size class of towns for each State/UT
urban male
state/ all- Indiasize class of town
usual activity status (ps + ss) estimated number of persons (00)
number of sampleworking
unemployed
not in labour
force totalself
employedregular
employeescasual labour
totalall ages
ages 15 years &
aboveblocks
persons of ages
15 years & above
(11-21) (31) (41 & 51) (11-51) (81) (91-97)
(1) (2) (3) (4) (5) (6) (7) (8) (9) (10) (11) (12) (13)Tripura 1 0 0 0 0 0 0 0 0 0 0 0
2 241 321 61 623 51 326 1000 798 681 19 2303 332 268 126 726 80 194 1000 1968 1531 49 530all 304 285 106 695 71 234 1000 2766 2212 68 760
Uttaranchal 1 0 0 0 0 0 0 0 0 0 0 02 353 243 155 751 20 229 1000 6385 4765 24 3373 325 300 128 754 26 220 1000 5301 3439 68 823all 341 267 144 752 23 225 1000 11686 8204 92 1160
Uttar Pradesh 1 319 237 116 671 29 300 1000 43258 31927 48 7332 357 262 112 731 16 253 1000 84559 58281 164 23913 461 146 158 764 23 212 1000 57274 35995 175 2453all 377 223 126 726 21 253 1000 185091 126203 387 5577
West Bengal 1 294 301 152 748 22 230 1000 20311 16307 76 8582 352 302 99 753 29 218 1000 56711 43312 204 24763 455 186 135 777 27 196 1000 16998 12743 64 819all 357 282 117 756 27 217 1000 94021 72362 344 4153
A & N Islands 1 0 0 0 0 0 0 0 0 0 0 02 148 551 64 762 31 207 1000 588 444 31 3453 34 600 57 691 49 260 1000 82 66 5 54all 133 557 63 753 33 214 1000 669 510 36 399

Appendix A
NSS Report No. 553: Employment and Unemployment situation in cities and towns in IndiaA-10
Table (C1): Per 1000 distribution of persons of age 15 years and above by broad usual activity status taking also into consideration the subsidiary economic status of persons categorised 'not working' in the principal status for different size class of towns for each State/UT
urban male
state/ all- India
size class
of town
usual activity status (ps + ss) estimated number of persons (00)
number of sampleworking
unemployed
not in labour
force totalself
employedregular
employeescasual labour
totalall ages
ages 15 years &
aboveblocks
persons of ages
15 years & above
(11-21) (31) (41 & 51)
(11-51) (81) (91-97)
(1) (2) (3) (4) (5) (6) (7) (8) (9) (10) (11) (12) (13)Chandigarh 1 0 0 0 0 0 0 0 0 0 0 0
2 239 425 60 723 22 254 1000 3779 2883 35 4243 0 0 0 0 0 0 0 0 0 0 0all 239 425 60 723 22 254 1000 3779 2883 35 424
Dadra & Nagar Haveli 1 0 0 0 0 0 0 0 0 0 0 02 0 0 0 0 0 0 0 0 0 0 03 210 598 13 821 37 142 1000 401 278 12 178all 210 598 13 821 37 142 1000 401 278 12 178
Daman & Diu 1 0 0 0 0 0 0 0 0 0 0 02 0 0 0 0 0 0 0 0 0 0 03 301 292 201 795 23 182 1000 455 314 8 105all 301 292 201 795 23 182 1000 455 314 8 105
Lakshadweep 1 0 0 0 0 0 0 0 0 0 0 02 0 0 0 0 0 0 0 0 0 0 03 258 269 122 649 59 293 1000 131 98 16 269all 258 269 122 649 59 293 1000 131 98 16 269
Pondicherry 1 0 0 0 0 0 0 0 0 0 0 02 174 373 169 716 12 271 1000 2477 1954 38 4123 205 458 140 803 22 175 1000 883 623 18 208all 182 393 162 737 15 248 1000 3359 2577 56 620
all- India 1 283 378 71 733 26 241 1000 377837 285637 745 94572 295 316 125 736 19 245 1000 675771 493813 2372 304203 340 234 181 755 20 225 1000 406458 285450 2133 26826all 304 311 126 740 21 238 1000 1460066 1064900 5250 66703
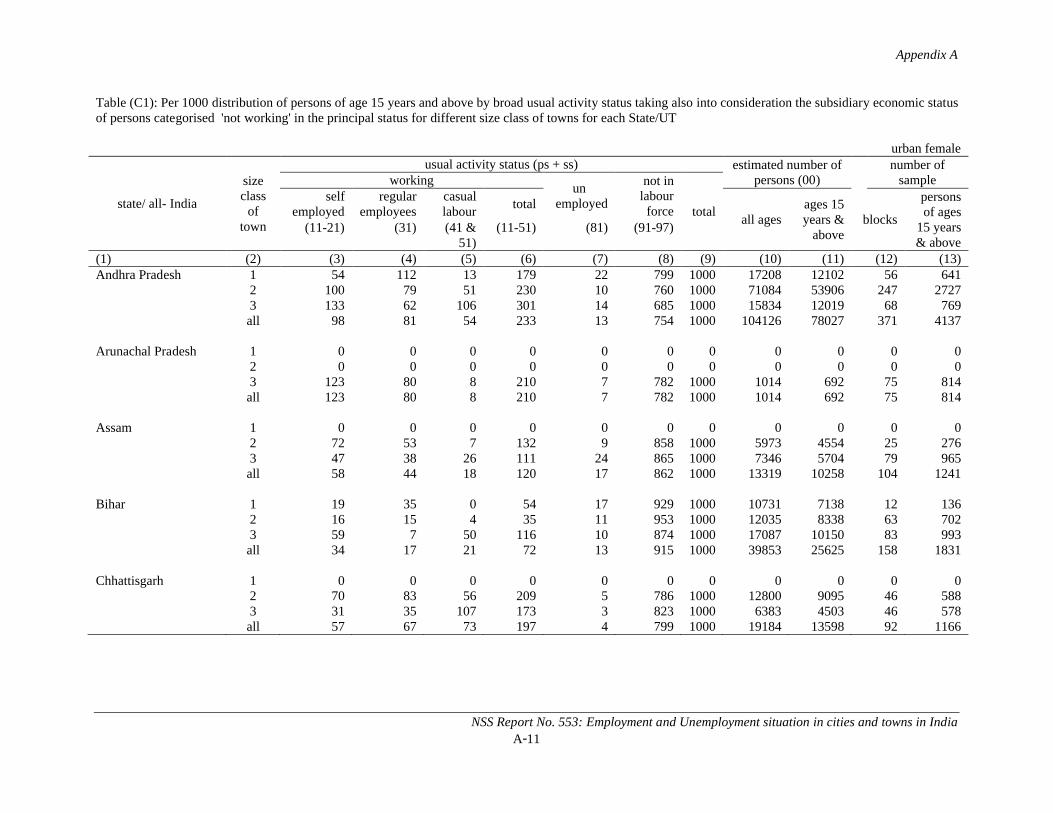
Appendix A
NSS Report No. 553: Employment and Unemployment situation in cities and towns in IndiaA-11
Table (C1): Per 1000 distribution of persons of age 15 years and above by broad usual activity status taking also into consideration the subsidiary economic status of persons categorised 'not working' in the principal status for different size class of towns for each State/UT
urban female
state/ all- India
size class
of town
usual activity status (ps + ss) estimated number of persons (00)
number of sampleworking
unemployed
not in labour
force totalself
employedregular
employeescasual labour
totalall ages
ages 15 years &
aboveblocks
persons of ages
15 years & above
(11-21) (31) (41 & 51)
(11-51) (81) (91-97)
(1) (2) (3) (4) (5) (6) (7) (8) (9) (10) (11) (12) (13)Andhra Pradesh 1 54 112 13 179 22 799 1000 17208 12102 56 641
2 100 79 51 230 10 760 1000 71084 53906 247 27273 133 62 106 301 14 685 1000 15834 12019 68 769all 98 81 54 233 13 754 1000 104126 78027 371 4137
Arunachal Pradesh 1 0 0 0 0 0 0 0 0 0 0 02 0 0 0 0 0 0 0 0 0 0 03 123 80 8 210 7 782 1000 1014 692 75 814all 123 80 8 210 7 782 1000 1014 692 75 814
Assam 1 0 0 0 0 0 0 0 0 0 0 02 72 53 7 132 9 858 1000 5973 4554 25 2763 47 38 26 111 24 865 1000 7346 5704 79 965all 58 44 18 120 17 862 1000 13319 10258 104 1241
Bihar 1 19 35 0 54 17 929 1000 10731 7138 12 1362 16 15 4 35 11 953 1000 12035 8338 63 7023 59 7 50 116 10 874 1000 17087 10150 83 993all 34 17 21 72 13 915 1000 39853 25625 158 1831
Chhattisgarh 1 0 0 0 0 0 0 0 0 0 0 02 70 83 56 209 5 786 1000 12800 9095 46 5883 31 35 107 173 3 823 1000 6383 4503 46 578all 57 67 73 197 4 799 1000 19184 13598 92 1166

Appendix A
NSS Report No. 553: Employment and Unemployment situation in cities and towns in IndiaA-12
Table (C1): Per 1000 distribution of persons of age 15 years and above by broad usual activity status taking also into consideration the subsidiary economic status of persons categorised 'not working' in the principal status for different size class of towns for each State/UT
urban female
state/ all- India
size class
of town
usual activity status (ps + ss) estimated number of persons (00)
number of sampleworking
unemployed
not in labour
force totalself
employedregular
employeescasual labour
totalall ages
ages 15 years &
aboveblocks
persons of ages
15 years & above
(11-21) (31) (41 & 51)
(11-51) (81) (91-97)
(1) (2) (3) (4) (5) (6) (7) (8) (9) (10) (11) (12) (13)Delhi 1 18 79 0 97 2 900 1000 34489 26052 89 831
2 7 12 0 20 0 980 1000 5811 4364 12 1213 17 7 0 24 0 976 1000 6519 4658 15 119all 16 61 0 78 2 920 1000 46819 35074 116 1071
Goa 1 0 0 0 0 0 0 0 0 0 0 02 8 102 0 111 1 889 1000 725 575 15 1863 5 120 11 136 15 849 1000 1340 1054 21 291all 6 114 7 127 10 863 1000 2065 1628 36 477
Gujarat 1 66 71 44 181 5 814 1000 45333 34906 72 8932 55 85 37 177 6 816 1000 29571 23454 88 11173 66 56 78 200 8 792 1000 19238 14411 56 693all 63 73 48 184 6 810 1000 94142 72771 216 2703
Haryana 1 28 80 3 111 9 881 1000 4957 3378 16 1682 77 107 25 209 6 785 1000 20107 13727 94 12103 95 49 30 174 7 818 1000 5997 4366 38 502all 73 91 23 187 6 807 1000 31061 21471 148 1880
Himachal Pradesh 1 0 0 0 0 0 0 0 0 0 0 02 48 125 1 174 0 826 1000 324 241 5 473 98 78 44 221 29 751 1000 2158 1602 43 454all 92 84 39 214 25 761 1000 2482 1843 48 501
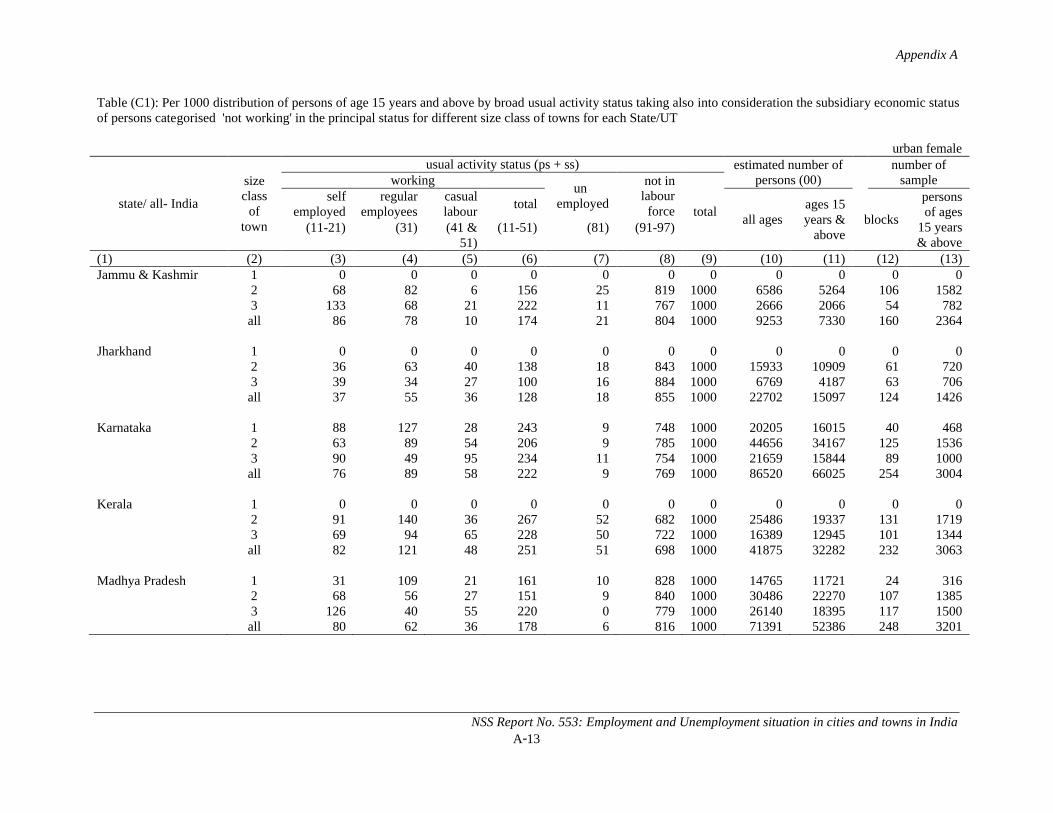
Appendix A
NSS Report No. 553: Employment and Unemployment situation in cities and towns in IndiaA-13
Table (C1): Per 1000 distribution of persons of age 15 years and above by broad usual activity status taking also into consideration the subsidiary economic status of persons categorised 'not working' in the principal status for different size class of towns for each State/UT
urban female
state/ all- India
size class
of town
usual activity status (ps + ss) estimated number of persons (00)
number of sampleworking
unemployed
not in labour
force totalself
employedregular
employeescasual labour
totalall ages
ages 15 years &
aboveblocks
persons of ages
15 years & above
(11-21) (31) (41 & 51)
(11-51) (81) (91-97)
(1) (2) (3) (4) (5) (6) (7) (8) (9) (10) (11) (12) (13)Jammu & Kashmir 1 0 0 0 0 0 0 0 0 0 0 0
2 68 82 6 156 25 819 1000 6586 5264 106 15823 133 68 21 222 11 767 1000 2666 2066 54 782all 86 78 10 174 21 804 1000 9253 7330 160 2364
Jharkhand 1 0 0 0 0 0 0 0 0 0 0 02 36 63 40 138 18 843 1000 15933 10909 61 7203 39 34 27 100 16 884 1000 6769 4187 63 706all 37 55 36 128 18 855 1000 22702 15097 124 1426
Karnataka 1 88 127 28 243 9 748 1000 20205 16015 40 4682 63 89 54 206 9 785 1000 44656 34167 125 15363 90 49 95 234 11 754 1000 21659 15844 89 1000all 76 89 58 222 9 769 1000 86520 66025 254 3004
Kerala 1 0 0 0 0 0 0 0 0 0 0 02 91 140 36 267 52 682 1000 25486 19337 131 17193 69 94 65 228 50 722 1000 16389 12945 101 1344all 82 121 48 251 51 698 1000 41875 32282 232 3063
Madhya Pradesh 1 31 109 21 161 10 828 1000 14765 11721 24 3162 68 56 27 151 9 840 1000 30486 22270 107 13853 126 40 55 220 0 779 1000 26140 18395 117 1500all 80 62 36 178 6 816 1000 71391 52386 248 3201

Appendix A
NSS Report No. 553: Employment and Unemployment situation in cities and towns in IndiaA-14
Table (C1): Per 1000 distribution of persons of age 15 years and above by broad usual activity status taking also into consideration the subsidiary economic status of persons categorised 'not working' in the principal status for different size class of towns for each State/UT
urban female
state/ all- India
size class
of town
usual activity status (ps + ss) estimated number of persons (00)
number of sampleworking
unemployed
not in labour
force totalself
employedregular
employeescasual labour
totalall ages
ages 15 years &
aboveblocks
persons of ages
15 years & above
(11-21) (31) (41 & 51)
(11-51) (81) (91-97)
(1) (2) (3) (4) (5) (6) (7) (8) (9) (10) (11) (12) (13)Maharashtra 1 66 148 11 224 12 763 1000 85630 67865 209 2350
2 74 75 32 181 10 809 1000 71872 53864 186 24493 95 52 63 209 8 783 1000 28644 21356 106 1344all 73 106 27 206 11 783 1000 186146 143085 501 6143
Manipur 1 0 0 0 0 0 0 0 0 0 0 02 157 60 0 217 10 773 1000 948 677 59 7583 168 35 5 207 9 784 1000 1601 1082 89 1101all 164 44 3 211 9 780 1000 2549 1759 148 1859
Meghalaya 1 0 0 0 0 0 0 0 0 0 0 02 73 204 35 312 30 658 1000 868 602 17 2463 113 143 52 308 31 661 1000 1407 967 34 447all 98 166 45 310 31 660 1000 2275 1569 51 693
Mizoram 1 0 0 0 0 0 0 0 0 0 0 02 232 116 13 361 24 616 1000 862 610 55 7203 397 43 18 457 4 539 1000 826 580 57 708all 313 80 15 408 14 578 1000 1688 1191 112 1428
Nagaland 1 0 0 0 0 0 0 0 0 0 0 02 68 27 4 99 39 862 1000 595 454 13 1723 205 42 0 247 45 708 1000 692 502 27 346all 140 35 2 177 42 781 1000 1288 955 40 518
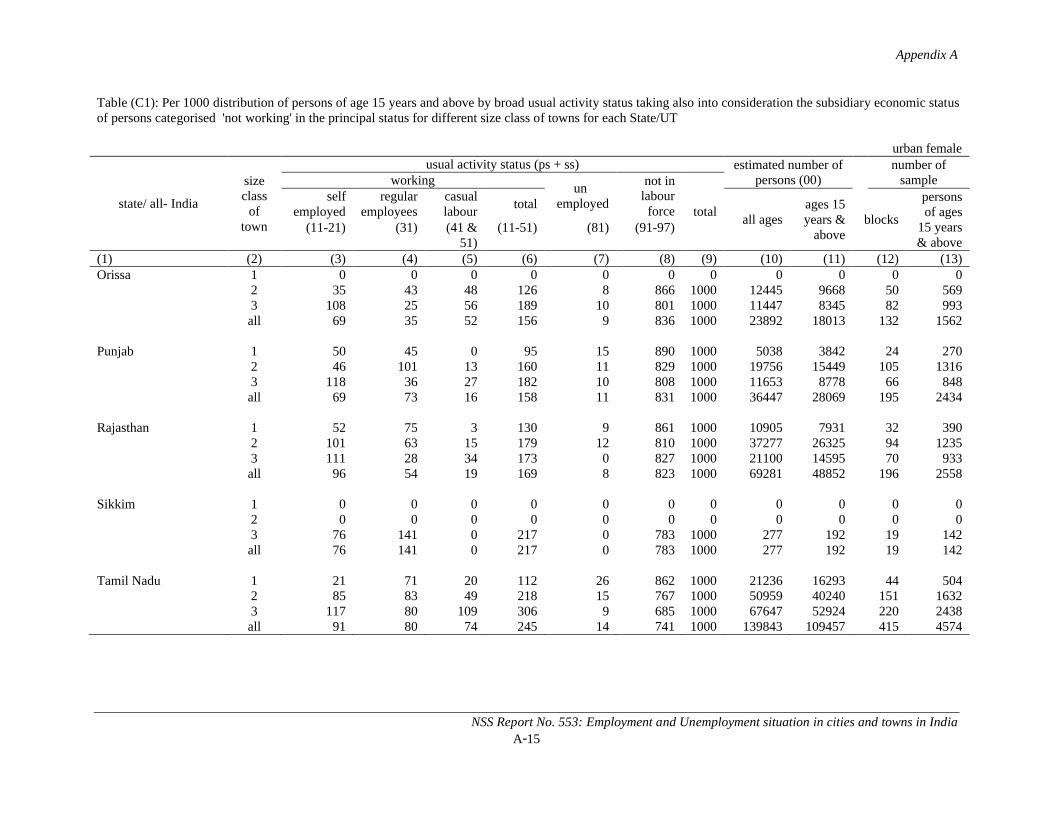
Appendix A
NSS Report No. 553: Employment and Unemployment situation in cities and towns in IndiaA-15
Table (C1): Per 1000 distribution of persons of age 15 years and above by broad usual activity status taking also into consideration the subsidiary economic status of persons categorised 'not working' in the principal status for different size class of towns for each State/UT
urban female
state/ all- India
size class
of town
usual activity status (ps + ss) estimated number of persons (00)
number of sampleworking
unemployed
not in labour
force totalself
employedregular
employeescasual labour
totalall ages
ages 15 years &
aboveblocks
persons of ages
15 years & above
(11-21) (31) (41 & 51)
(11-51) (81) (91-97)
(1) (2) (3) (4) (5) (6) (7) (8) (9) (10) (11) (12) (13)Orissa 1 0 0 0 0 0 0 0 0 0 0 0
2 35 43 48 126 8 866 1000 12445 9668 50 5693 108 25 56 189 10 801 1000 11447 8345 82 993all 69 35 52 156 9 836 1000 23892 18013 132 1562
Punjab 1 50 45 0 95 15 890 1000 5038 3842 24 2702 46 101 13 160 11 829 1000 19756 15449 105 13163 118 36 27 182 10 808 1000 11653 8778 66 848all 69 73 16 158 11 831 1000 36447 28069 195 2434
Rajasthan 1 52 75 3 130 9 861 1000 10905 7931 32 3902 101 63 15 179 12 810 1000 37277 26325 94 12353 111 28 34 173 0 827 1000 21100 14595 70 933all 96 54 19 169 8 823 1000 69281 48852 196 2558
Sikkim 1 0 0 0 0 0 0 0 0 0 0 02 0 0 0 0 0 0 0 0 0 0 03 76 141 0 217 0 783 1000 277 192 19 142all 76 141 0 217 0 783 1000 277 192 19 142
Tamil Nadu 1 21 71 20 112 26 862 1000 21236 16293 44 5042 85 83 49 218 15 767 1000 50959 40240 151 16323 117 80 109 306 9 685 1000 67647 52924 220 2438all 91 80 74 245 14 741 1000 139843 109457 415 4574
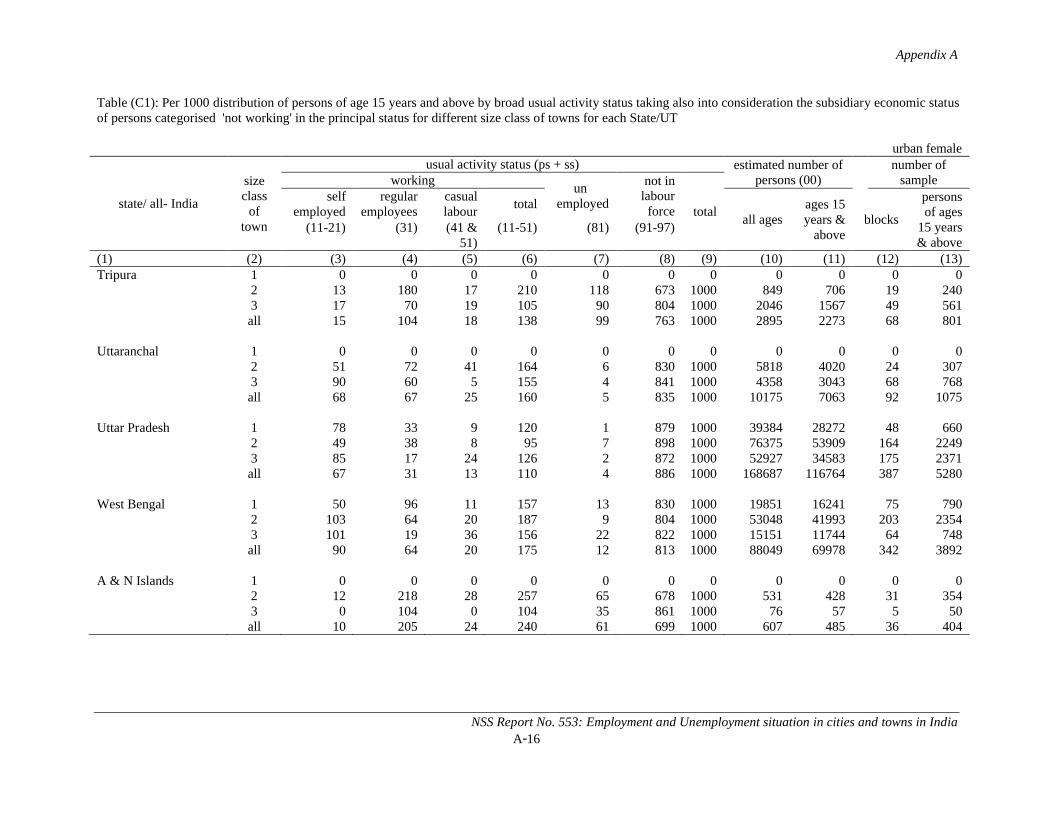
Appendix A
NSS Report No. 553: Employment and Unemployment situation in cities and towns in IndiaA-16
Table (C1): Per 1000 distribution of persons of age 15 years and above by broad usual activity status taking also into consideration the subsidiary economic status of persons categorised 'not working' in the principal status for different size class of towns for each State/UT
urban female
state/ all- India
size class
of town
usual activity status (ps + ss) estimated number of persons (00)
number of sampleworking
unemployed
not in labour
force totalself
employedregular
employeescasual labour
totalall ages
ages 15 years &
aboveblocks
persons of ages
15 years & above
(11-21) (31) (41 & 51)
(11-51) (81) (91-97)
(1) (2) (3) (4) (5) (6) (7) (8) (9) (10) (11) (12) (13)Tripura 1 0 0 0 0 0 0 0 0 0 0 0
2 13 180 17 210 118 673 1000 849 706 19 2403 17 70 19 105 90 804 1000 2046 1567 49 561all 15 104 18 138 99 763 1000 2895 2273 68 801
Uttaranchal 1 0 0 0 0 0 0 0 0 0 0 02 51 72 41 164 6 830 1000 5818 4020 24 3073 90 60 5 155 4 841 1000 4358 3043 68 768all 68 67 25 160 5 835 1000 10175 7063 92 1075
Uttar Pradesh 1 78 33 9 120 1 879 1000 39384 28272 48 6602 49 38 8 95 7 898 1000 76375 53909 164 22493 85 17 24 126 2 872 1000 52927 34583 175 2371all 67 31 13 110 4 886 1000 168687 116764 387 5280
West Bengal 1 50 96 11 157 13 830 1000 19851 16241 75 7902 103 64 20 187 9 804 1000 53048 41993 203 23543 101 19 36 156 22 822 1000 15151 11744 64 748all 90 64 20 175 12 813 1000 88049 69978 342 3892
A & N Islands 1 0 0 0 0 0 0 0 0 0 0 02 12 218 28 257 65 678 1000 531 428 31 3543 0 104 0 104 35 861 1000 76 57 5 50all 10 205 24 240 61 699 1000 607 485 36 404
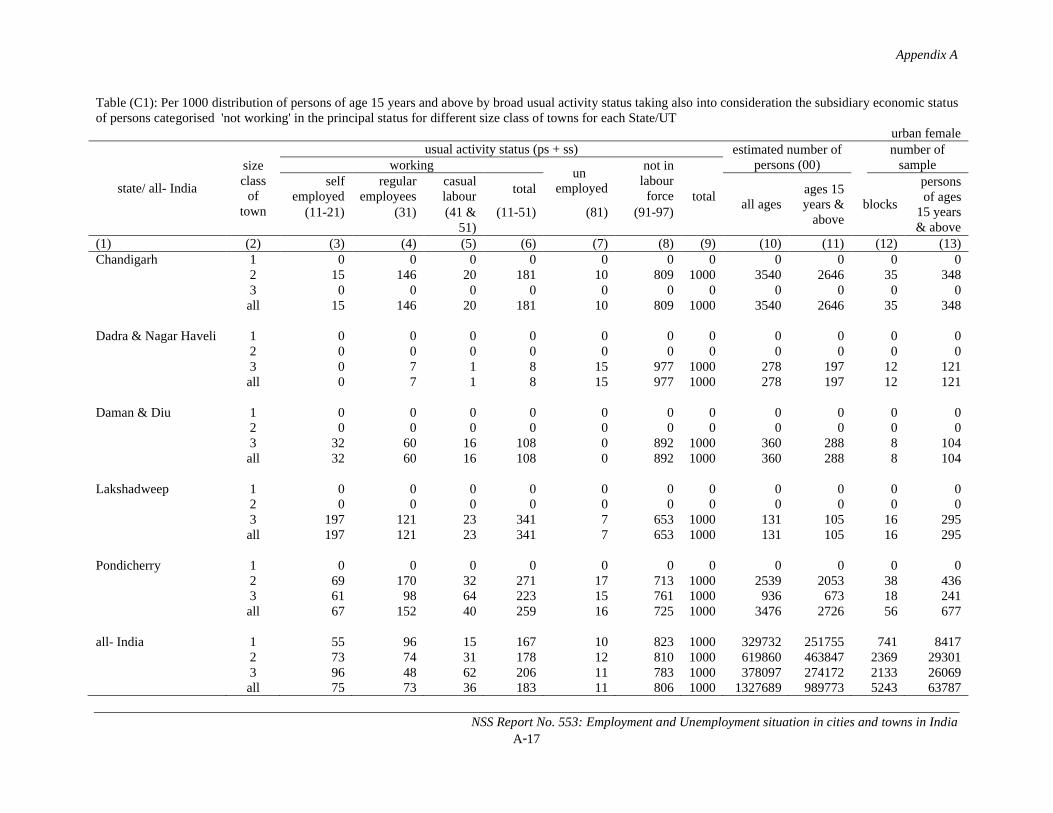
Appendix A
NSS Report No. 553: Employment and Unemployment situation in cities and towns in IndiaA-17
Table (C1): Per 1000 distribution of persons of age 15 years and above by broad usual activity status taking also into consideration the subsidiary economic status of persons categorised 'not working' in the principal status for different size class of towns for each State/UT
urban female
state/ all- India
size class
of town
usual activity status (ps + ss) estimated number of persons (00)
number of sampleworking
unemployed
not in labour
force totalself
employedregular
employeescasual labour
totalall ages
ages 15 years &
aboveblocks
persons of ages
15 years & above
(11-21) (31) (41 & 51)
(11-51) (81) (91-97)
(1) (2) (3) (4) (5) (6) (7) (8) (9) (10) (11) (12) (13)Chandigarh 1 0 0 0 0 0 0 0 0 0 0 0
2 15 146 20 181 10 809 1000 3540 2646 35 3483 0 0 0 0 0 0 0 0 0 0 0all 15 146 20 181 10 809 1000 3540 2646 35 348
Dadra & Nagar Haveli 1 0 0 0 0 0 0 0 0 0 0 02 0 0 0 0 0 0 0 0 0 0 03 0 7 1 8 15 977 1000 278 197 12 121all 0 7 1 8 15 977 1000 278 197 12 121
Daman & Diu 1 0 0 0 0 0 0 0 0 0 0 02 0 0 0 0 0 0 0 0 0 0 03 32 60 16 108 0 892 1000 360 288 8 104all 32 60 16 108 0 892 1000 360 288 8 104
Lakshadweep 1 0 0 0 0 0 0 0 0 0 0 02 0 0 0 0 0 0 0 0 0 0 03 197 121 23 341 7 653 1000 131 105 16 295all 197 121 23 341 7 653 1000 131 105 16 295
Pondicherry 1 0 0 0 0 0 0 0 0 0 0 02 69 170 32 271 17 713 1000 2539 2053 38 4363 61 98 64 223 15 761 1000 936 673 18 241all 67 152 40 259 16 725 1000 3476 2726 56 677
all- India 1 55 96 15 167 10 823 1000 329732 251755 741 84172 73 74 31 178 12 810 1000 619860 463847 2369 293013 96 48 62 206 11 783 1000 378097 274172 2133 26069all 75 73 36 183 11 806 1000 1327689 989773 5243 63787
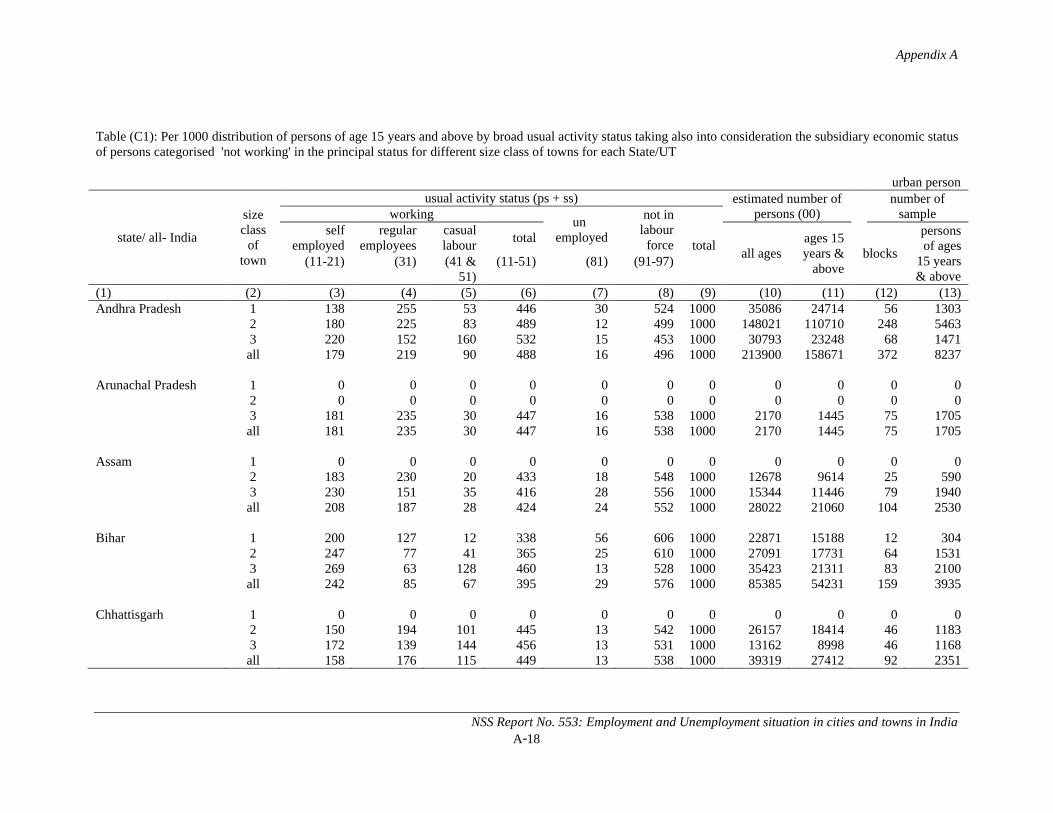
Appendix A
NSS Report No. 553: Employment and Unemployment situation in cities and towns in IndiaA-18
Table (C1): Per 1000 distribution of persons of age 15 years and above by broad usual activity status taking also into consideration the subsidiary economic status of persons categorised 'not working' in the principal status for different size class of towns for each State/UT
urban person
state/ all- India
size class
of town
usual activity status (ps + ss) estimated number of persons (00)
number of sampleworking
unemployed
not in labour
force totalself
employedregular
employeescasual labour
totalall ages
ages 15 years &
aboveblocks
persons of ages
15 years & above
(11-21) (31) (41 & 51)
(11-51) (81) (91-97)
(1) (2) (3) (4) (5) (6) (7) (8) (9) (10) (11) (12) (13)Andhra Pradesh 1 138 255 53 446 30 524 1000 35086 24714 56 1303
2 180 225 83 489 12 499 1000 148021 110710 248 54633 220 152 160 532 15 453 1000 30793 23248 68 1471all 179 219 90 488 16 496 1000 213900 158671 372 8237
Arunachal Pradesh 1 0 0 0 0 0 0 0 0 0 0 02 0 0 0 0 0 0 0 0 0 0 03 181 235 30 447 16 538 1000 2170 1445 75 1705all 181 235 30 447 16 538 1000 2170 1445 75 1705
Assam 1 0 0 0 0 0 0 0 0 0 0 02 183 230 20 433 18 548 1000 12678 9614 25 5903 230 151 35 416 28 556 1000 15344 11446 79 1940all 208 187 28 424 24 552 1000 28022 21060 104 2530
Bihar 1 200 127 12 338 56 606 1000 22871 15188 12 3042 247 77 41 365 25 610 1000 27091 17731 64 15313 269 63 128 460 13 528 1000 35423 21311 83 2100all 242 85 67 395 29 576 1000 85385 54231 159 3935
Chhattisgarh 1 0 0 0 0 0 0 0 0 0 0 02 150 194 101 445 13 542 1000 26157 18414 46 11833 172 139 144 456 13 531 1000 13162 8998 46 1168all 158 176 115 449 13 538 1000 39319 27412 92 2351

Appendix A
NSS Report No. 553: Employment and Unemployment situation in cities and towns in IndiaA-19
Table (C1): Per 1000 distribution of persons of age 15 years and above by broad usual activity status taking also into consideration the subsidiary economic status of persons categorised 'not working' in the principal status for different size class of towns for each State/UT
urban person
state/ all- India
size class
of town
usual activity status (ps + ss) estimated number of persons (00)
number of sampleworking
unemployed
not in labour
force totalself
employedregular
employeescasual labour
totalall ages
ages 15 years &
aboveblocks
persons of ages
15 years & above
(11-21) (31) (41 & 51)
(11-51) (81) (91-97)
(1) (2) (3) (4) (5) (6) (7) (8) (9) (10) (11) (12) (13)Delhi 1 200 246 10 456 14 530 1000 79971 60816 91 1920
2 182 210 11 403 3 594 1000 14777 10847 12 2883 157 264 3 425 8 568 1000 15539 10556 15 285all 192 244 9 445 12 543 1000 110288 82219 118 2493
Goa 1 0 0 0 0 0 0 0 0 0 0 02 119 281 32 432 14 554 1000 1468 1128 15 3653 92 289 42 423 21 556 1000 2554 2003 21 560all 102 286 38 426 18 555 1000 4022 3131 36 925
Gujarat 1 230 220 53 503 8 490 1000 99463 72981 72 18812 200 188 95 484 11 506 1000 64477 48556 88 22773 192 198 117 507 10 482 1000 40884 30315 56 1439all 213 206 79 498 9 493 1000 204824 151852 216 5597
Haryana 1 104 345 44 492 17 490 1000 11775 8579 16 3892 184 276 66 525 7 467 1000 42790 29723 94 25283 245 144 71 460 24 517 1000 13187 9492 38 1071all 181 262 63 506 12 481 1000 67752 47793 148 3988
Himachal Pradesh 1 0 0 0 0 0 0 0 0 0 0 02 88 436 1 525 0 475 1000 693 480 5 893 206 208 65 479 28 493 1000 4274 3173 43 916all 190 238 57 485 25 491 1000 4967 3653 48 1005
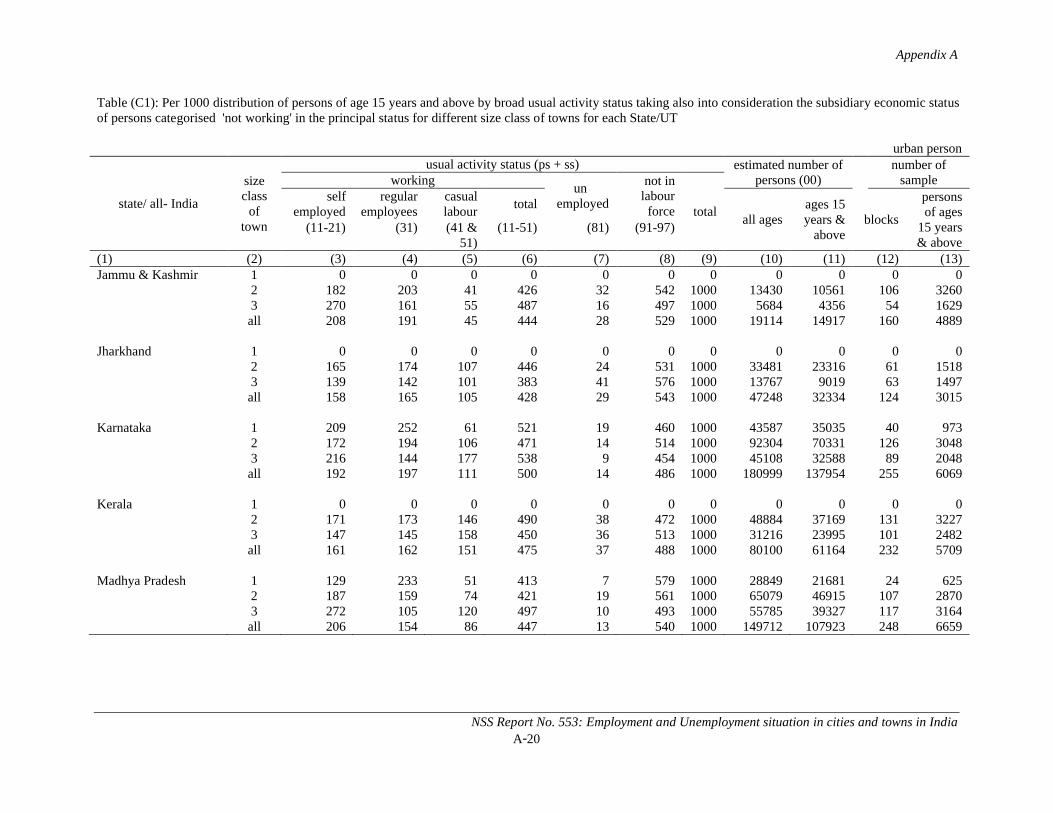
Appendix A
NSS Report No. 553: Employment and Unemployment situation in cities and towns in IndiaA-20
Table (C1): Per 1000 distribution of persons of age 15 years and above by broad usual activity status taking also into consideration the subsidiary economic status of persons categorised 'not working' in the principal status for different size class of towns for each State/UT
urban person
state/ all- India
size class
of town
usual activity status (ps + ss) estimated number of persons (00)
number of sampleworking
unemployed
not in labour
force totalself
employedregular
employeescasual labour
totalall ages
ages 15 years &
aboveblocks
persons of ages
15 years & above
(11-21) (31) (41 & 51)
(11-51) (81) (91-97)
(1) (2) (3) (4) (5) (6) (7) (8) (9) (10) (11) (12) (13)Jammu & Kashmir 1 0 0 0 0 0 0 0 0 0 0 0
2 182 203 41 426 32 542 1000 13430 10561 106 32603 270 161 55 487 16 497 1000 5684 4356 54 1629all 208 191 45 444 28 529 1000 19114 14917 160 4889
Jharkhand 1 0 0 0 0 0 0 0 0 0 0 02 165 174 107 446 24 531 1000 33481 23316 61 15183 139 142 101 383 41 576 1000 13767 9019 63 1497all 158 165 105 428 29 543 1000 47248 32334 124 3015
Karnataka 1 209 252 61 521 19 460 1000 43587 35035 40 9732 172 194 106 471 14 514 1000 92304 70331 126 30483 216 144 177 538 9 454 1000 45108 32588 89 2048all 192 197 111 500 14 486 1000 180999 137954 255 6069
Kerala 1 0 0 0 0 0 0 0 0 0 0 02 171 173 146 490 38 472 1000 48884 37169 131 32273 147 145 158 450 36 513 1000 31216 23995 101 2482all 161 162 151 475 37 488 1000 80100 61164 232 5709
Madhya Pradesh 1 129 233 51 413 7 579 1000 28849 21681 24 6252 187 159 74 421 19 561 1000 65079 46915 107 28703 272 105 120 497 10 493 1000 55785 39327 117 3164all 206 154 86 447 13 540 1000 149712 107923 248 6659
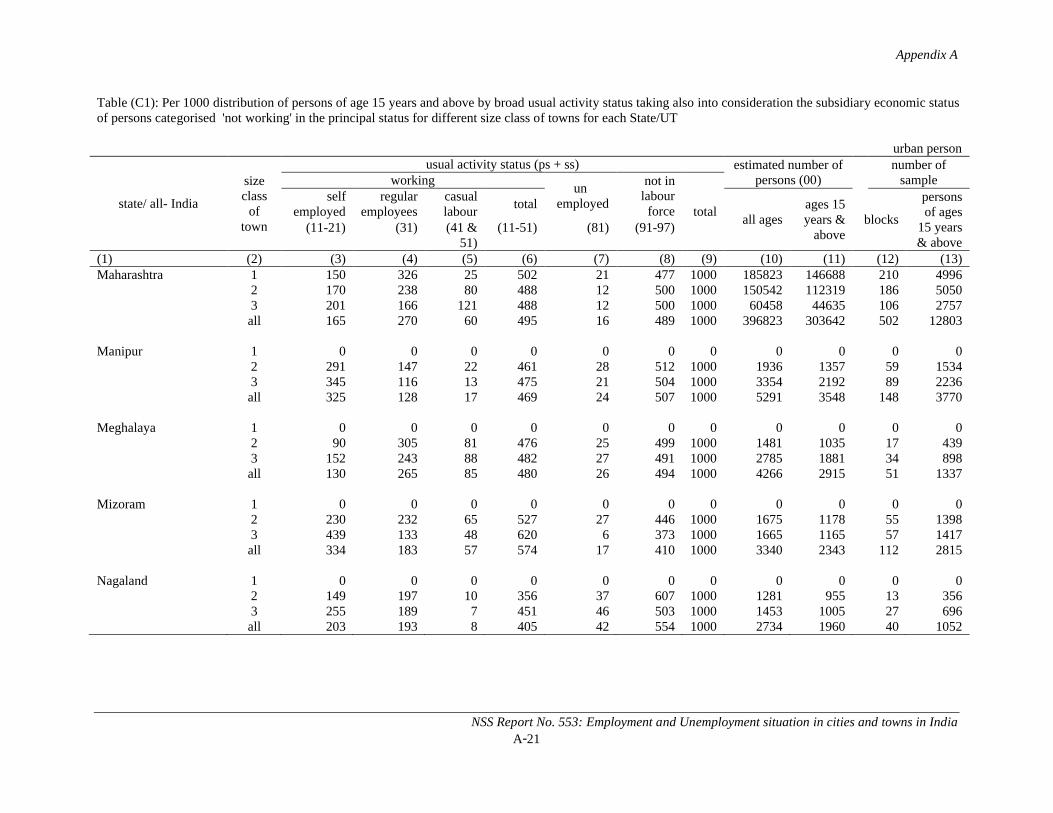
Appendix A
NSS Report No. 553: Employment and Unemployment situation in cities and towns in IndiaA-21
Table (C1): Per 1000 distribution of persons of age 15 years and above by broad usual activity status taking also into consideration the subsidiary economic status of persons categorised 'not working' in the principal status for different size class of towns for each State/UT
urban person
state/ all- India
size class
of town
usual activity status (ps + ss) estimated number of persons (00)
number of sampleworking
unemployed
not in labour
force totalself
employedregular
employeescasual labour
totalall ages
ages 15 years &
aboveblocks
persons of ages
15 years & above
(11-21) (31) (41 & 51)
(11-51) (81) (91-97)
(1) (2) (3) (4) (5) (6) (7) (8) (9) (10) (11) (12) (13)Maharashtra 1 150 326 25 502 21 477 1000 185823 146688 210 4996
2 170 238 80 488 12 500 1000 150542 112319 186 50503 201 166 121 488 12 500 1000 60458 44635 106 2757all 165 270 60 495 16 489 1000 396823 303642 502 12803
Manipur 1 0 0 0 0 0 0 0 0 0 0 02 291 147 22 461 28 512 1000 1936 1357 59 15343 345 116 13 475 21 504 1000 3354 2192 89 2236all 325 128 17 469 24 507 1000 5291 3548 148 3770
Meghalaya 1 0 0 0 0 0 0 0 0 0 0 02 90 305 81 476 25 499 1000 1481 1035 17 4393 152 243 88 482 27 491 1000 2785 1881 34 898all 130 265 85 480 26 494 1000 4266 2915 51 1337
Mizoram 1 0 0 0 0 0 0 0 0 0 0 02 230 232 65 527 27 446 1000 1675 1178 55 13983 439 133 48 620 6 373 1000 1665 1165 57 1417all 334 183 57 574 17 410 1000 3340 2343 112 2815
Nagaland 1 0 0 0 0 0 0 0 0 0 0 02 149 197 10 356 37 607 1000 1281 955 13 3563 255 189 7 451 46 503 1000 1453 1005 27 696all 203 193 8 405 42 554 1000 2734 1960 40 1052
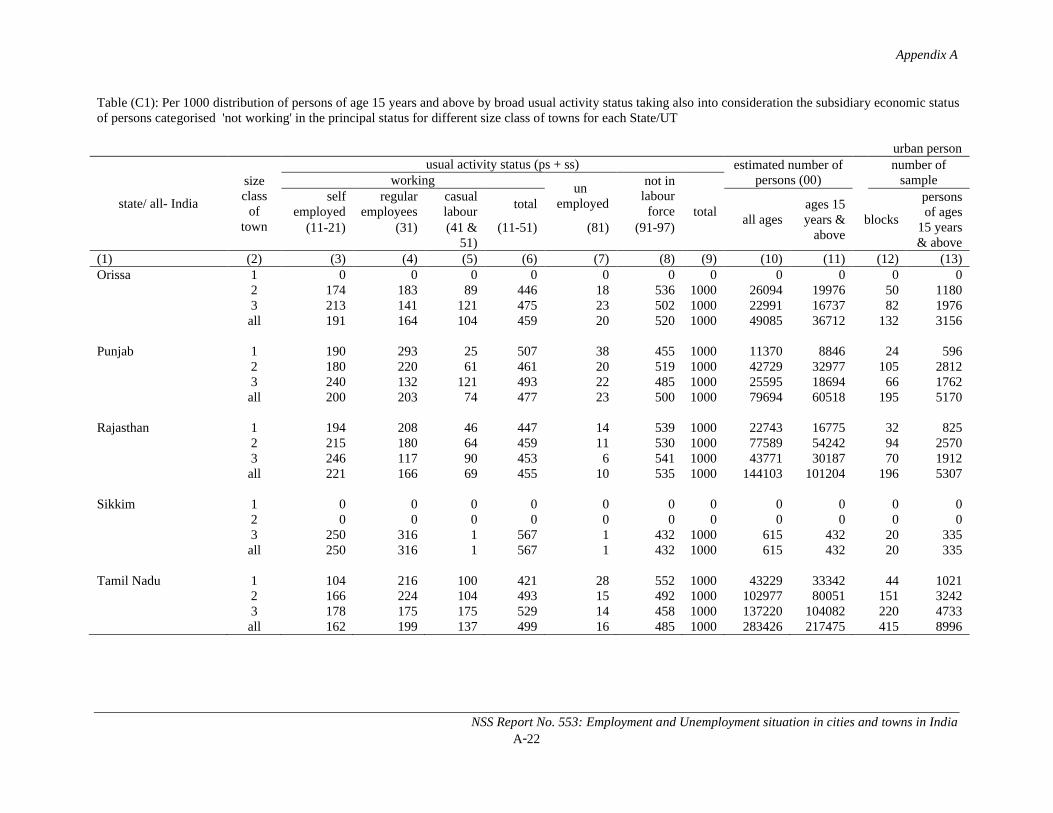
Appendix A
NSS Report No. 553: Employment and Unemployment situation in cities and towns in IndiaA-22
Table (C1): Per 1000 distribution of persons of age 15 years and above by broad usual activity status taking also into consideration the subsidiary economic status of persons categorised 'not working' in the principal status for different size class of towns for each State/UT
urban person
state/ all- India
size class
of town
usual activity status (ps + ss) estimated number of persons (00)
number of sampleworking
unemployed
not in labour
force totalself
employedregular
employeescasual labour
totalall ages
ages 15 years &
aboveblocks
persons of ages
15 years & above
(11-21) (31) (41 & 51)
(11-51) (81) (91-97)
(1) (2) (3) (4) (5) (6) (7) (8) (9) (10) (11) (12) (13)Orissa 1 0 0 0 0 0 0 0 0 0 0 0
2 174 183 89 446 18 536 1000 26094 19976 50 11803 213 141 121 475 23 502 1000 22991 16737 82 1976all 191 164 104 459 20 520 1000 49085 36712 132 3156
Punjab 1 190 293 25 507 38 455 1000 11370 8846 24 5962 180 220 61 461 20 519 1000 42729 32977 105 28123 240 132 121 493 22 485 1000 25595 18694 66 1762all 200 203 74 477 23 500 1000 79694 60518 195 5170
Rajasthan 1 194 208 46 447 14 539 1000 22743 16775 32 8252 215 180 64 459 11 530 1000 77589 54242 94 25703 246 117 90 453 6 541 1000 43771 30187 70 1912all 221 166 69 455 10 535 1000 144103 101204 196 5307
Sikkim 1 0 0 0 0 0 0 0 0 0 0 02 0 0 0 0 0 0 0 0 0 0 03 250 316 1 567 1 432 1000 615 432 20 335all 250 316 1 567 1 432 1000 615 432 20 335
Tamil Nadu 1 104 216 100 421 28 552 1000 43229 33342 44 10212 166 224 104 493 15 492 1000 102977 80051 151 32423 178 175 175 529 14 458 1000 137220 104082 220 4733all 162 199 137 499 16 485 1000 283426 217475 415 8996
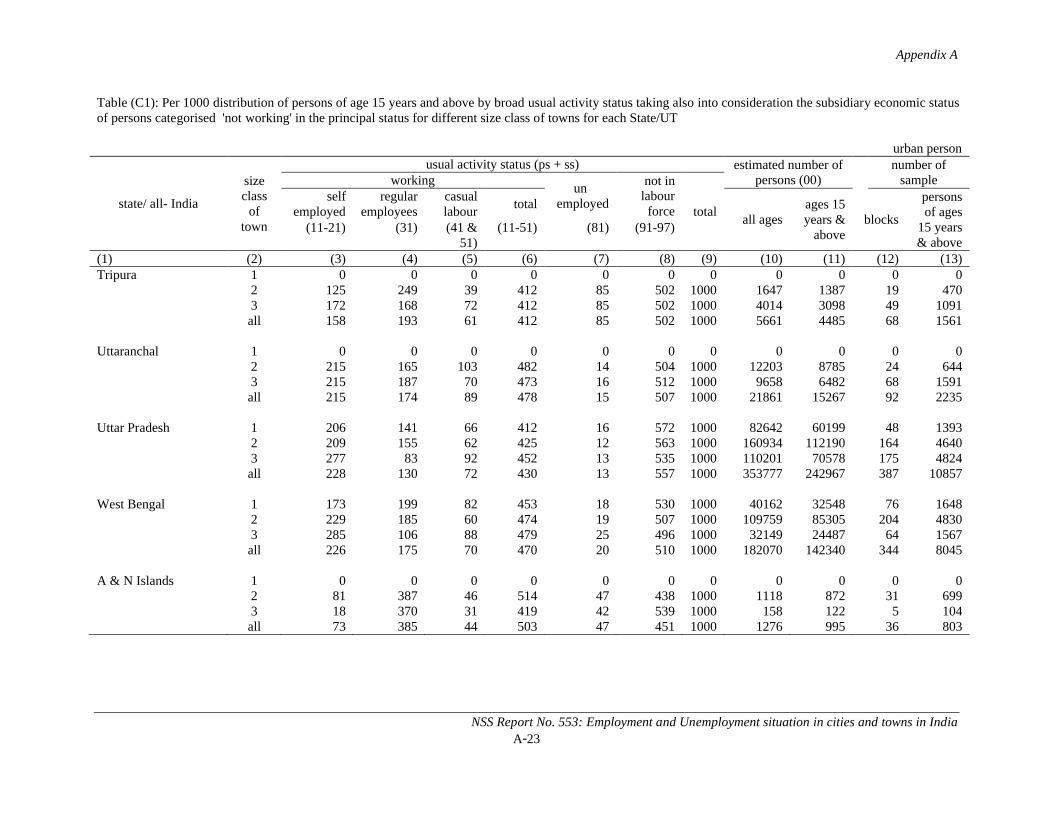
Appendix A
NSS Report No. 553: Employment and Unemployment situation in cities and towns in IndiaA-23
Table (C1): Per 1000 distribution of persons of age 15 years and above by broad usual activity status taking also into consideration the subsidiary economic status of persons categorised 'not working' in the principal status for different size class of towns for each State/UT
urban person
state/ all- India
size class
of town
usual activity status (ps + ss) estimated number of persons (00)
number of sampleworking
unemployed
not in labour
force totalself
employedregular
employeescasual labour
totalall ages
ages 15 years &
aboveblocks
persons of ages
15 years & above
(11-21) (31) (41 & 51)
(11-51) (81) (91-97)
(1) (2) (3) (4) (5) (6) (7) (8) (9) (10) (11) (12) (13)Tripura 1 0 0 0 0 0 0 0 0 0 0 0
2 125 249 39 412 85 502 1000 1647 1387 19 4703 172 168 72 412 85 502 1000 4014 3098 49 1091all 158 193 61 412 85 502 1000 5661 4485 68 1561
Uttaranchal 1 0 0 0 0 0 0 0 0 0 0 02 215 165 103 482 14 504 1000 12203 8785 24 6443 215 187 70 473 16 512 1000 9658 6482 68 1591all 215 174 89 478 15 507 1000 21861 15267 92 2235
Uttar Pradesh 1 206 141 66 412 16 572 1000 82642 60199 48 13932 209 155 62 425 12 563 1000 160934 112190 164 46403 277 83 92 452 13 535 1000 110201 70578 175 4824all 228 130 72 430 13 557 1000 353777 242967 387 10857
West Bengal 1 173 199 82 453 18 530 1000 40162 32548 76 16482 229 185 60 474 19 507 1000 109759 85305 204 48303 285 106 88 479 25 496 1000 32149 24487 64 1567all 226 175 70 470 20 510 1000 182070 142340 344 8045
A & N Islands 1 0 0 0 0 0 0 0 0 0 0 02 81 387 46 514 47 438 1000 1118 872 31 6993 18 370 31 419 42 539 1000 158 122 5 104all 73 385 44 503 47 451 1000 1276 995 36 803
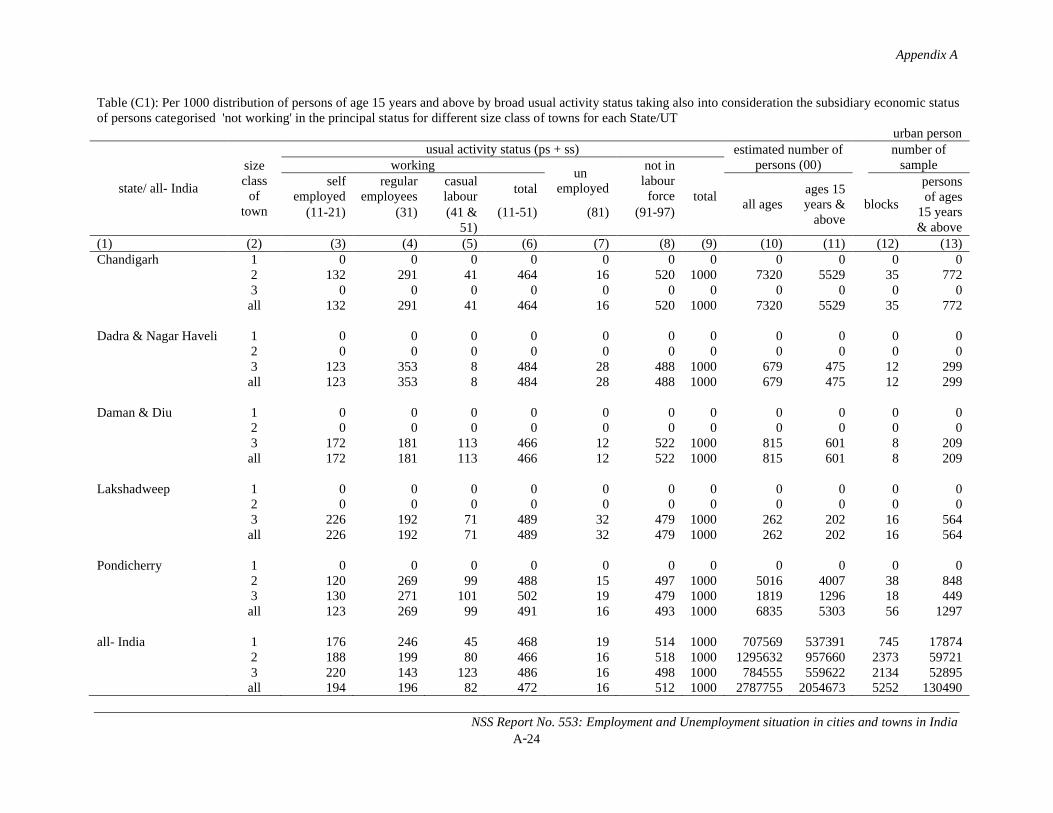
Appendix A
NSS Report No. 553: Employment and Unemployment situation in cities and towns in IndiaA-24
Table (C1): Per 1000 distribution of persons of age 15 years and above by broad usual activity status taking also into consideration the subsidiary economic status of persons categorised 'not working' in the principal status for different size class of towns for each State/UT
urban person
state/ all- India
size class
of town
usual activity status (ps + ss) estimated number of persons (00)
number of sampleworking
unemployed
not in labour
force totalself
employedregular
employeescasual labour
totalall ages
ages 15 years &
aboveblocks
persons of ages
15 years & above
(11-21) (31) (41 & 51)
(11-51) (81) (91-97)
(1) (2) (3) (4) (5) (6) (7) (8) (9) (10) (11) (12) (13)Chandigarh 1 0 0 0 0 0 0 0 0 0 0 0
2 132 291 41 464 16 520 1000 7320 5529 35 7723 0 0 0 0 0 0 0 0 0 0 0all 132 291 41 464 16 520 1000 7320 5529 35 772
Dadra & Nagar Haveli 1 0 0 0 0 0 0 0 0 0 0 02 0 0 0 0 0 0 0 0 0 0 03 123 353 8 484 28 488 1000 679 475 12 299all 123 353 8 484 28 488 1000 679 475 12 299
Daman & Diu 1 0 0 0 0 0 0 0 0 0 0 02 0 0 0 0 0 0 0 0 0 0 03 172 181 113 466 12 522 1000 815 601 8 209all 172 181 113 466 12 522 1000 815 601 8 209
Lakshadweep 1 0 0 0 0 0 0 0 0 0 0 02 0 0 0 0 0 0 0 0 0 0 03 226 192 71 489 32 479 1000 262 202 16 564all 226 192 71 489 32 479 1000 262 202 16 564
Pondicherry 1 0 0 0 0 0 0 0 0 0 0 02 120 269 99 488 15 497 1000 5016 4007 38 8483 130 271 101 502 19 479 1000 1819 1296 18 449all 123 269 99 491 16 493 1000 6835 5303 56 1297
all- India 1 176 246 45 468 19 514 1000 707569 537391 745 178742 188 199 80 466 16 518 1000 1295632 957660 2373 597213 220 143 123 486 16 498 1000 784555 559622 2134 52895all 194 196 82 472 16 512 1000 2787755 2054673 5252 130490
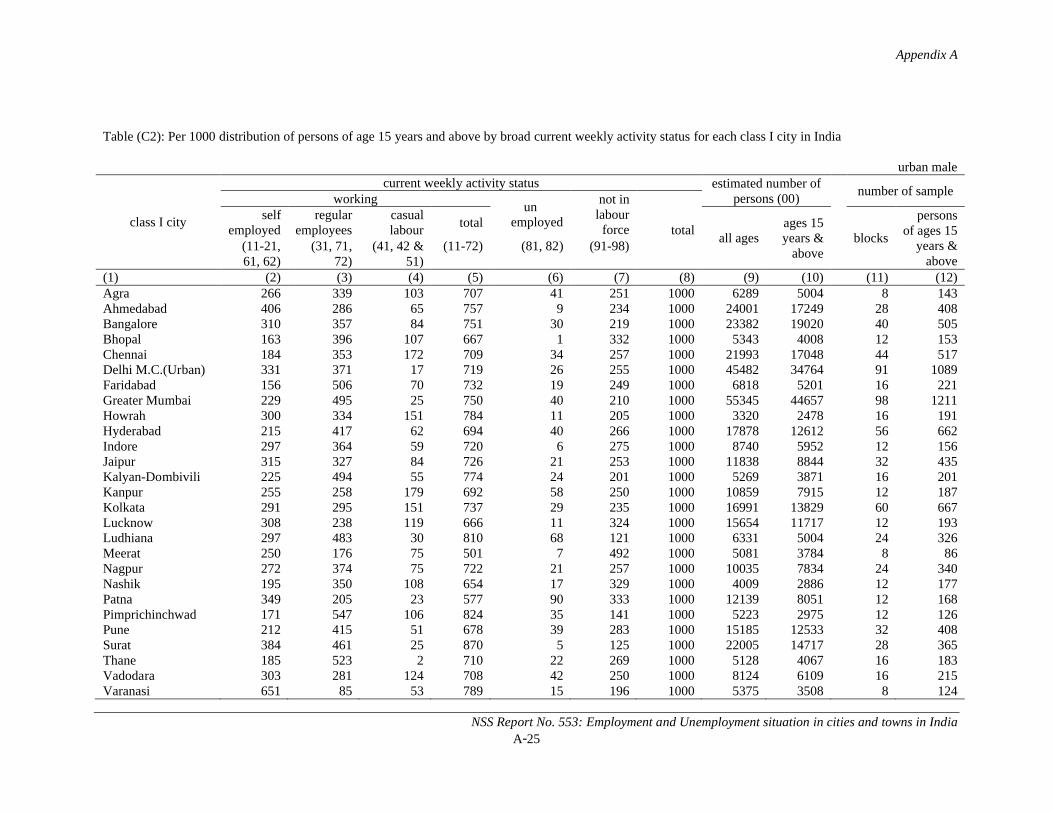
Appendix A
NSS Report No. 553: Employment and Unemployment situation in cities and towns in IndiaA-25
Table (C2): Per 1000 distribution of persons of age 15 years and above by broad current weekly activity status for each class I city in India
urban male
class I city
current weekly activity status estimated number of persons (00)
number of sampleworking
unemployed
not in labour
force totalself
employedregular
employeescasual labour
totalall ages
ages 15 years &
aboveblocks
persons of ages 15
years & above
(11-21, 61, 62)
(31, 71, 72)
(41, 42 &51)
(11-72) (81, 82) (91-98)
(1) (2) (3) (4) (5) (6) (7) (8) (9) (10) (11) (12)Agra 266 339 103 707 41 251 1000 6289 5004 8 143Ahmedabad 406 286 65 757 9 234 1000 24001 17249 28 408Bangalore 310 357 84 751 30 219 1000 23382 19020 40 505Bhopal 163 396 107 667 1 332 1000 5343 4008 12 153Chennai 184 353 172 709 34 257 1000 21993 17048 44 517Delhi M.C.(Urban) 331 371 17 719 26 255 1000 45482 34764 91 1089Faridabad 156 506 70 732 19 249 1000 6818 5201 16 221Greater Mumbai 229 495 25 750 40 210 1000 55345 44657 98 1211Howrah 300 334 151 784 11 205 1000 3320 2478 16 191Hyderabad 215 417 62 694 40 266 1000 17878 12612 56 662Indore 297 364 59 720 6 275 1000 8740 5952 12 156Jaipur 315 327 84 726 21 253 1000 11838 8844 32 435Kalyan-Dombivili 225 494 55 774 24 201 1000 5269 3871 16 201Kanpur 255 258 179 692 58 250 1000 10859 7915 12 187Kolkata 291 295 151 737 29 235 1000 16991 13829 60 667Lucknow 308 238 119 666 11 324 1000 15654 11717 12 193Ludhiana 297 483 30 810 68 121 1000 6331 5004 24 326Meerat 250 176 75 501 7 492 1000 5081 3784 8 86Nagpur 272 374 75 722 21 257 1000 10035 7834 24 340Nashik 195 350 108 654 17 329 1000 4009 2886 12 177Patna 349 205 23 577 90 333 1000 12139 8051 12 168Pimprichinchwad 171 547 106 824 35 141 1000 5223 2975 12 126Pune 212 415 51 678 39 283 1000 15185 12533 32 408Surat 384 461 25 870 5 125 1000 22005 14717 28 365Thane 185 523 2 710 22 269 1000 5128 4067 16 183Vadodara 303 281 124 708 42 250 1000 8124 6109 16 215Varanasi 651 85 53 789 15 196 1000 5375 3508 8 124
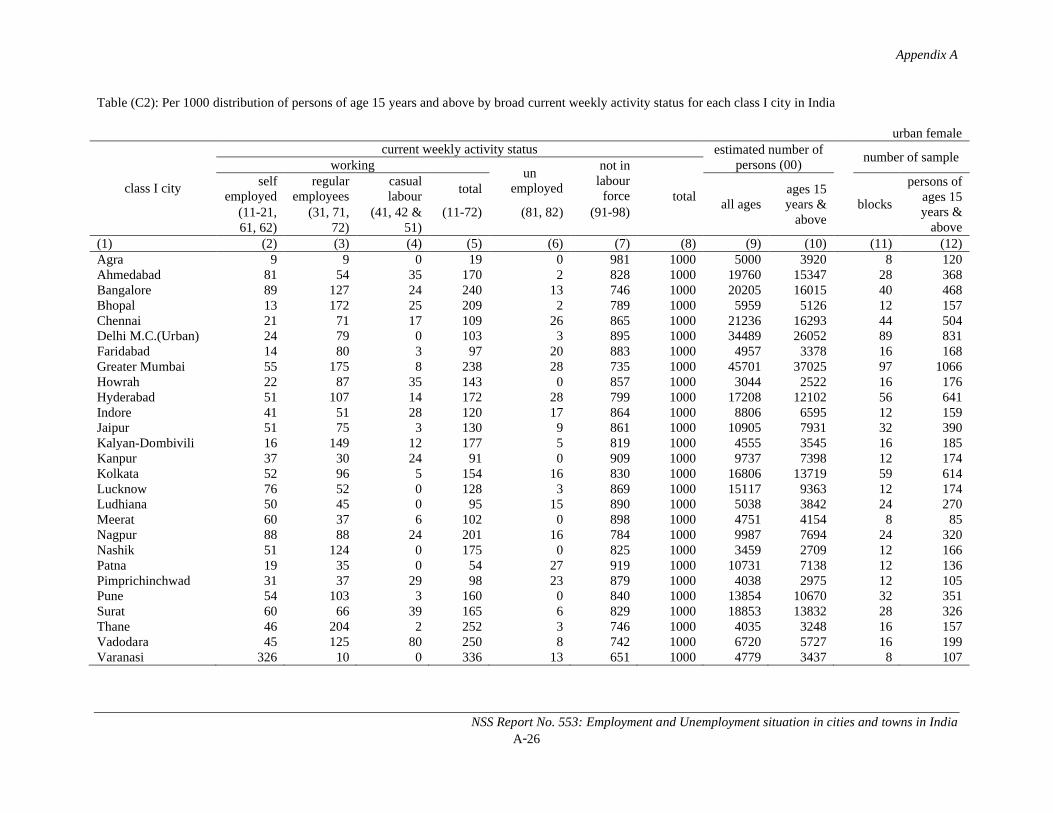
Appendix A
NSS Report No. 553: Employment and Unemployment situation in cities and towns in IndiaA-26
Table (C2): Per 1000 distribution of persons of age 15 years and above by broad current weekly activity status for each class I city in India
urban female
class I city
current weekly activity status estimated number of persons (00)
number of sampleworking
unemployed
not in labour
force totalself
employedregular
employeescasual labour
totalall ages
ages 15 years &
aboveblocks
persons of ages 15 years &
above(11-21, 61, 62)
(31, 71, 72)
(41, 42 & 51)
(11-72) (81, 82) (91-98)
(1) (2) (3) (4) (5) (6) (7) (8) (9) (10) (11) (12)Agra 9 9 0 19 0 981 1000 5000 3920 8 120Ahmedabad 81 54 35 170 2 828 1000 19760 15347 28 368Bangalore 89 127 24 240 13 746 1000 20205 16015 40 468Bhopal 13 172 25 209 2 789 1000 5959 5126 12 157Chennai 21 71 17 109 26 865 1000 21236 16293 44 504Delhi M.C.(Urban) 24 79 0 103 3 895 1000 34489 26052 89 831Faridabad 14 80 3 97 20 883 1000 4957 3378 16 168Greater Mumbai 55 175 8 238 28 735 1000 45701 37025 97 1066Howrah 22 87 35 143 0 857 1000 3044 2522 16 176Hyderabad 51 107 14 172 28 799 1000 17208 12102 56 641Indore 41 51 28 120 17 864 1000 8806 6595 12 159Jaipur 51 75 3 130 9 861 1000 10905 7931 32 390Kalyan-Dombivili 16 149 12 177 5 819 1000 4555 3545 16 185Kanpur 37 30 24 91 0 909 1000 9737 7398 12 174Kolkata 52 96 5 154 16 830 1000 16806 13719 59 614Lucknow 76 52 0 128 3 869 1000 15117 9363 12 174Ludhiana 50 45 0 95 15 890 1000 5038 3842 24 270Meerat 60 37 6 102 0 898 1000 4751 4154 8 85Nagpur 88 88 24 201 16 784 1000 9987 7694 24 320Nashik 51 124 0 175 0 825 1000 3459 2709 12 166Patna 19 35 0 54 27 919 1000 10731 7138 12 136Pimprichinchwad 31 37 29 98 23 879 1000 4038 2975 12 105Pune 54 103 3 160 0 840 1000 13854 10670 32 351Surat 60 66 39 165 6 829 1000 18853 13832 28 326Thane 46 204 2 252 3 746 1000 4035 3248 16 157Vadodara 45 125 80 250 8 742 1000 6720 5727 16 199Varanasi 326 10 0 336 13 651 1000 4779 3437 8 107
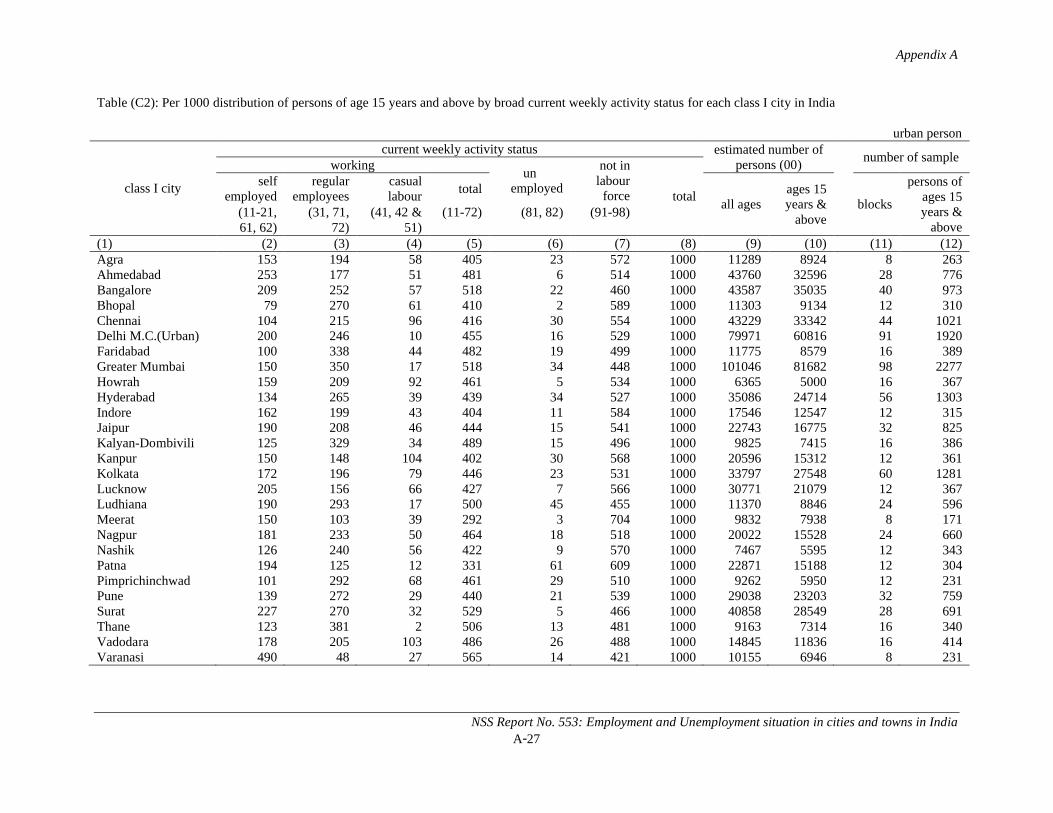
Appendix A
NSS Report No. 553: Employment and Unemployment situation in cities and towns in IndiaA-27
Table (C2): Per 1000 distribution of persons of age 15 years and above by broad current weekly activity status for each class I city in India
urban person
class I city
current weekly activity status estimated number of persons (00)
number of sampleworking
unemployed
not in labour
force totalself
employedregular
employeescasual labour
totalall ages
ages 15 years &
aboveblocks
persons of ages 15 years &
above(11-21, 61, 62)
(31, 71, 72)
(41, 42 & 51)
(11-72) (81, 82) (91-98)
(1) (2) (3) (4) (5) (6) (7) (8) (9) (10) (11) (12)Agra 153 194 58 405 23 572 1000 11289 8924 8 263Ahmedabad 253 177 51 481 6 514 1000 43760 32596 28 776Bangalore 209 252 57 518 22 460 1000 43587 35035 40 973Bhopal 79 270 61 410 2 589 1000 11303 9134 12 310Chennai 104 215 96 416 30 554 1000 43229 33342 44 1021Delhi M.C.(Urban) 200 246 10 455 16 529 1000 79971 60816 91 1920Faridabad 100 338 44 482 19 499 1000 11775 8579 16 389Greater Mumbai 150 350 17 518 34 448 1000 101046 81682 98 2277Howrah 159 209 92 461 5 534 1000 6365 5000 16 367Hyderabad 134 265 39 439 34 527 1000 35086 24714 56 1303Indore 162 199 43 404 11 584 1000 17546 12547 12 315Jaipur 190 208 46 444 15 541 1000 22743 16775 32 825Kalyan-Dombivili 125 329 34 489 15 496 1000 9825 7415 16 386Kanpur 150 148 104 402 30 568 1000 20596 15312 12 361Kolkata 172 196 79 446 23 531 1000 33797 27548 60 1281Lucknow 205 156 66 427 7 566 1000 30771 21079 12 367Ludhiana 190 293 17 500 45 455 1000 11370 8846 24 596Meerat 150 103 39 292 3 704 1000 9832 7938 8 171Nagpur 181 233 50 464 18 518 1000 20022 15528 24 660Nashik 126 240 56 422 9 570 1000 7467 5595 12 343Patna 194 125 12 331 61 609 1000 22871 15188 12 304Pimprichinchwad 101 292 68 461 29 510 1000 9262 5950 12 231Pune 139 272 29 440 21 539 1000 29038 23203 32 759Surat 227 270 32 529 5 466 1000 40858 28549 28 691Thane 123 381 2 506 13 481 1000 9163 7314 16 340Vadodara 178 205 103 486 26 488 1000 14845 11836 16 414Varanasi 490 48 27 565 14 421 1000 10155 6946 8 231
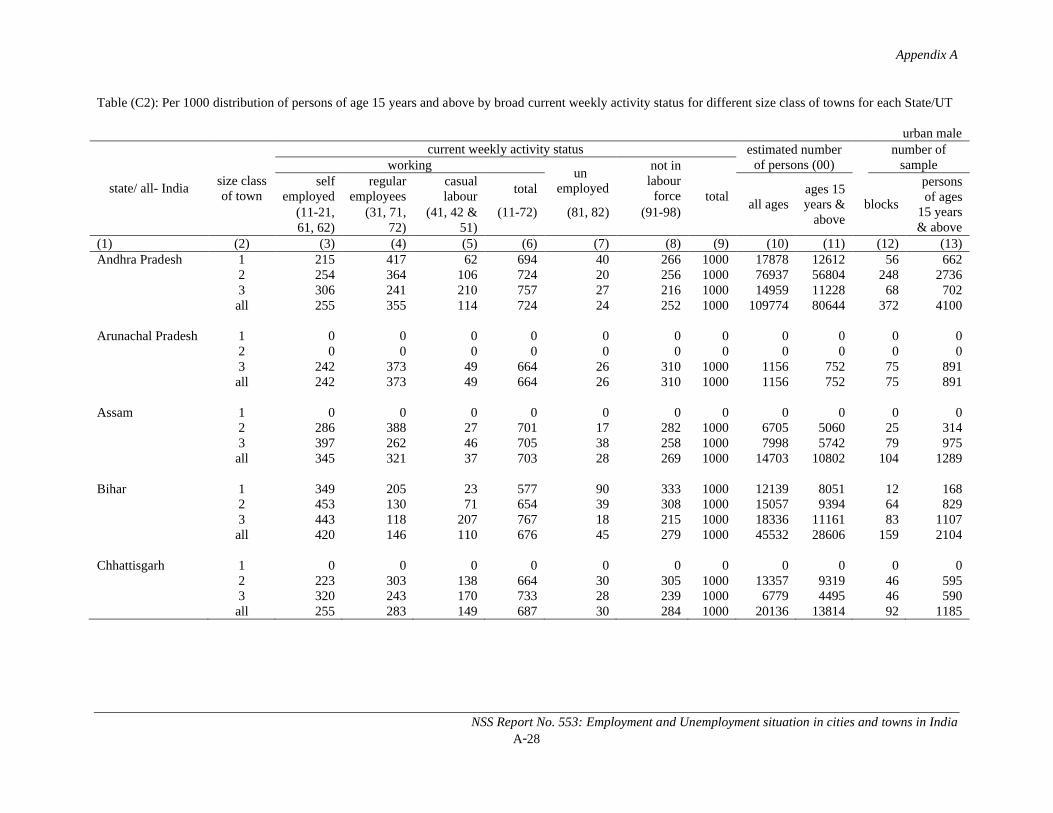
Appendix A
NSS Report No. 553: Employment and Unemployment situation in cities and towns in IndiaA-28
Table (C2): Per 1000 distribution of persons of age 15 years and above by broad current weekly activity status for different size class of towns for each State/UT
urban male
state/ all- Indiasize class of town
current weekly activity status estimated number of persons (00)
number of sampleworking
unemployed
not in labour
force totalself
employedregular
employeescasual labour
totalall ages
ages 15 years &
aboveblocks
persons of ages
15 years & above
(11-21, 61, 62)
(31, 71, 72)
(41, 42 & 51)
(11-72) (81, 82) (91-98)
(1) (2) (3) (4) (5) (6) (7) (8) (9) (10) (11) (12) (13)Andhra Pradesh 1 215 417 62 694 40 266 1000 17878 12612 56 662
2 254 364 106 724 20 256 1000 76937 56804 248 27363 306 241 210 757 27 216 1000 14959 11228 68 702all 255 355 114 724 24 252 1000 109774 80644 372 4100
Arunachal Pradesh 1 0 0 0 0 0 0 0 0 0 0 02 0 0 0 0 0 0 0 0 0 0 03 242 373 49 664 26 310 1000 1156 752 75 891all 242 373 49 664 26 310 1000 1156 752 75 891
Assam 1 0 0 0 0 0 0 0 0 0 0 02 286 388 27 701 17 282 1000 6705 5060 25 3143 397 262 46 705 38 258 1000 7998 5742 79 975all 345 321 37 703 28 269 1000 14703 10802 104 1289
Bihar 1 349 205 23 577 90 333 1000 12139 8051 12 1682 453 130 71 654 39 308 1000 15057 9394 64 8293 443 118 207 767 18 215 1000 18336 11161 83 1107all 420 146 110 676 45 279 1000 45532 28606 159 2104
Chhattisgarh 1 0 0 0 0 0 0 0 0 0 0 02 223 303 138 664 30 305 1000 13357 9319 46 5953 320 243 170 733 28 239 1000 6779 4495 46 590all 255 283 149 687 30 284 1000 20136 13814 92 1185
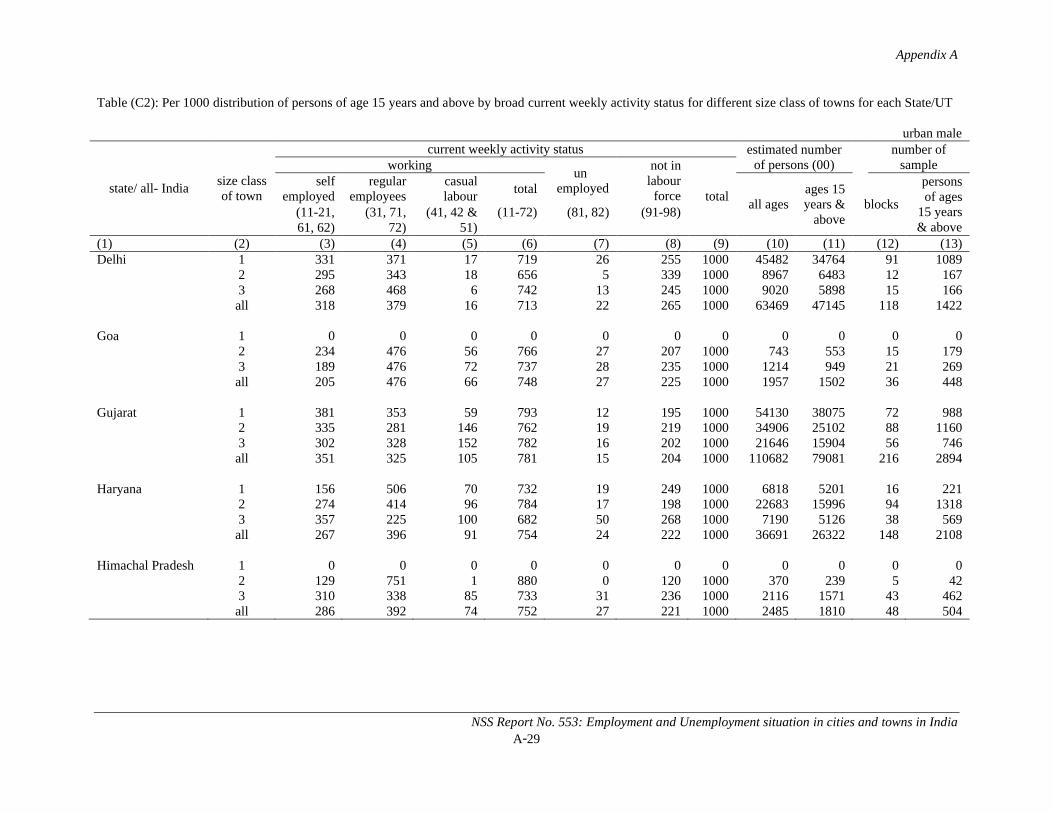
Appendix A
NSS Report No. 553: Employment and Unemployment situation in cities and towns in IndiaA-29
Table (C2): Per 1000 distribution of persons of age 15 years and above by broad current weekly activity status for different size class of towns for each State/UT
urban male
state/ all- Indiasize class of town
current weekly activity status estimated number of persons (00)
number of sampleworking
unemployed
not in labour
force totalself
employedregular
employeescasual labour
totalall ages
ages 15 years &
aboveblocks
persons of ages
15 years & above
(11-21, 61, 62)
(31, 71, 72)
(41, 42 & 51)
(11-72) (81, 82) (91-98)
(1) (2) (3) (4) (5) (6) (7) (8) (9) (10) (11) (12) (13)Delhi 1 331 371 17 719 26 255 1000 45482 34764 91 1089
2 295 343 18 656 5 339 1000 8967 6483 12 1673 268 468 6 742 13 245 1000 9020 5898 15 166all 318 379 16 713 22 265 1000 63469 47145 118 1422
Goa 1 0 0 0 0 0 0 0 0 0 0 02 234 476 56 766 27 207 1000 743 553 15 1793 189 476 72 737 28 235 1000 1214 949 21 269all 205 476 66 748 27 225 1000 1957 1502 36 448
Gujarat 1 381 353 59 793 12 195 1000 54130 38075 72 9882 335 281 146 762 19 219 1000 34906 25102 88 11603 302 328 152 782 16 202 1000 21646 15904 56 746all 351 325 105 781 15 204 1000 110682 79081 216 2894
Haryana 1 156 506 70 732 19 249 1000 6818 5201 16 2212 274 414 96 784 17 198 1000 22683 15996 94 13183 357 225 100 682 50 268 1000 7190 5126 38 569all 267 396 91 754 24 222 1000 36691 26322 148 2108
Himachal Pradesh 1 0 0 0 0 0 0 0 0 0 0 02 129 751 1 880 0 120 1000 370 239 5 423 310 338 85 733 31 236 1000 2116 1571 43 462all 286 392 74 752 27 221 1000 2485 1810 48 504

Appendix A
NSS Report No. 553: Employment and Unemployment situation in cities and towns in IndiaA-30
Table (C2): Per 1000 distribution of persons of age 15 years and above by broad current weekly activity status for different size class of towns for each State/UT
urban male
state/ all- Indiasize class of town
current weekly activity status estimated number of persons (00)
number of sampleworking
unemployed
not in labour
force totalself
employedregular
employeescasual labour
totalall ages
ages 15 years &
aboveblocks
persons of ages
15 years & above
(11-21, 61, 62)
(31, 71, 72)
(41, 42 & 51)
(11-72) (81, 82) (91-98)
(1) (2) (3) (4) (5) (6) (7) (8) (9) (10) (11) (12) (13)Jammu & Kashmir 1 0 0 0 0 0 0 0 0 0 0 0
2 295 322 74 692 40 268 1000 6844 5298 106 16783 380 245 82 708 30 263 1000 3017 2290 54 847all 320 299 77 696 37 266 1000 9862 7588 160 2525
Jharkhand 1 0 0 0 0 0 0 0 0 0 0 02 278 271 160 709 35 256 1000 17548 12406 61 7983 224 234 160 618 72 309 1000 6999 4831 63 791all 263 261 160 684 46 271 1000 24546 17237 124 1589
Karnataka 1 310 357 84 751 30 219 1000 23382 19020 40 5052 274 291 149 714 24 261 1000 47648 36164 126 15123 339 230 237 806 13 181 1000 23449 16744 89 1048all 299 294 152 745 23 231 1000 94480 71928 255 3065
Kerala 1 0 0 0 0 0 0 0 0 0 0 02 249 210 241 700 41 260 1000 23398 17832 131 15083 238 206 246 690 34 276 1000 14827 11050 101 1138all 245 208 243 696 38 266 1000 38224 28882 232 2646
Madhya Pradesh 1 243 377 78 698 4 298 1000 14084 9960 24 3092 289 254 111 654 31 314 1000 34592 24645 107 14853 402 155 169 726 31 243 1000 29645 20932 117 1664all 323 239 127 689 26 285 1000 78321 55537 248 3458
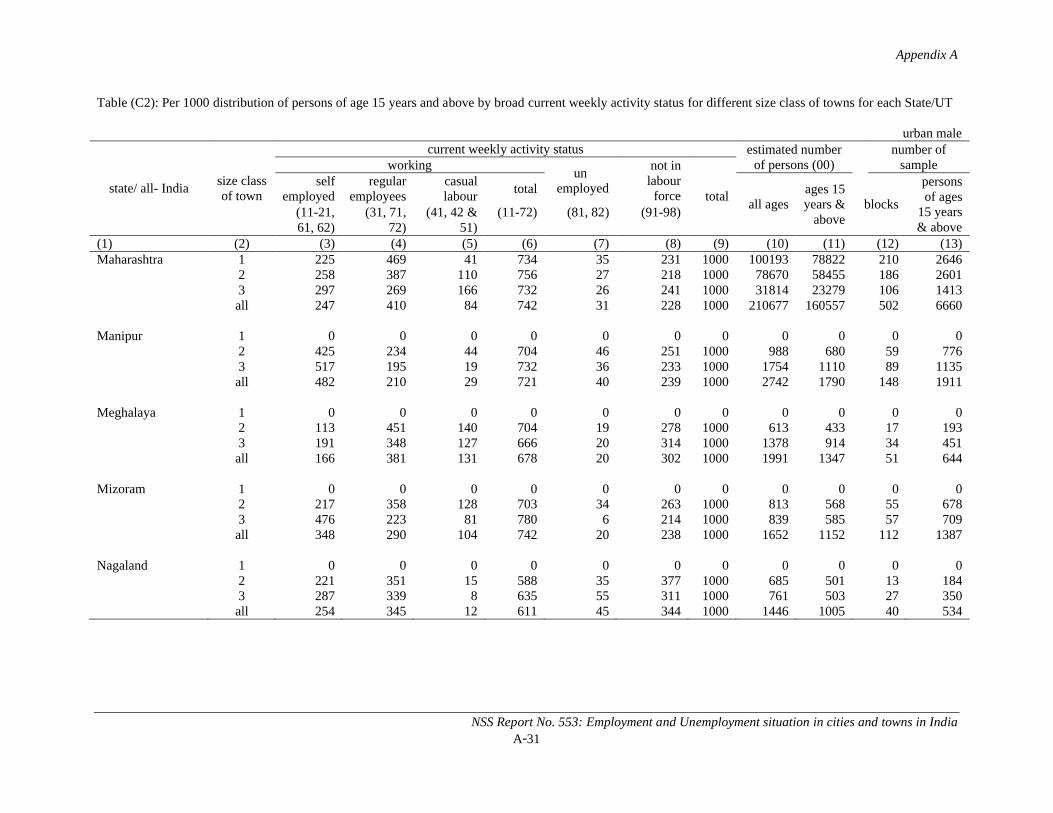
Appendix A
NSS Report No. 553: Employment and Unemployment situation in cities and towns in IndiaA-31
Table (C2): Per 1000 distribution of persons of age 15 years and above by broad current weekly activity status for different size class of towns for each State/UT
urban male
state/ all- Indiasize class of town
current weekly activity status estimated number of persons (00)
number of sampleworking
unemployed
not in labour
force totalself
employedregular
employeescasual labour
totalall ages
ages 15 years &
aboveblocks
persons of ages
15 years & above
(11-21, 61, 62)
(31, 71, 72)
(41, 42 & 51)
(11-72) (81, 82) (91-98)
(1) (2) (3) (4) (5) (6) (7) (8) (9) (10) (11) (12) (13)Maharashtra 1 225 469 41 734 35 231 1000 100193 78822 210 2646
2 258 387 110 756 27 218 1000 78670 58455 186 26013 297 269 166 732 26 241 1000 31814 23279 106 1413all 247 410 84 742 31 228 1000 210677 160557 502 6660
Manipur 1 0 0 0 0 0 0 0 0 0 0 02 425 234 44 704 46 251 1000 988 680 59 7763 517 195 19 732 36 233 1000 1754 1110 89 1135all 482 210 29 721 40 239 1000 2742 1790 148 1911
Meghalaya 1 0 0 0 0 0 0 0 0 0 0 02 113 451 140 704 19 278 1000 613 433 17 1933 191 348 127 666 20 314 1000 1378 914 34 451all 166 381 131 678 20 302 1000 1991 1347 51 644
Mizoram 1 0 0 0 0 0 0 0 0 0 0 02 217 358 128 703 34 263 1000 813 568 55 6783 476 223 81 780 6 214 1000 839 585 57 709all 348 290 104 742 20 238 1000 1652 1152 112 1387
Nagaland 1 0 0 0 0 0 0 0 0 0 0 02 221 351 15 588 35 377 1000 685 501 13 1843 287 339 8 635 55 311 1000 761 503 27 350all 254 345 12 611 45 344 1000 1446 1005 40 534

Appendix A
NSS Report No. 553: Employment and Unemployment situation in cities and towns in IndiaA-32
Table (C2): Per 1000 distribution of persons of age 15 years and above by broad current weekly activity status for different size class of towns for each State/UT
urban male
state/ all- Indiasize class of town
current weekly activity status estimated number of persons (00)
number of sampleworking
unemployed
not in labour
force totalself
employedregular
employeescasual labour
totalall ages
ages 15 years &
aboveblocks
persons of ages
15 years & above
(11-21, 61, 62)
(31, 71, 72)
(41, 42 & 51)
(11-72) (81, 82) (91-98)
(1) (2) (3) (4) (5) (6) (7) (8) (9) (10) (11) (12) (13)Orissa 1 0 0 0 0 0 0 0 0 0 0 0
2 302 314 124 739 28 233 1000 13649 10307 49 6113 324 256 170 749 44 206 1000 11544 8392 82 983all 312 288 145 744 35 221 1000 25193 18699 131 1594
Punjab 1 297 483 30 810 68 121 1000 6331 5004 24 3262 290 325 104 719 33 248 1000 22974 17528 105 14963 348 215 189 753 46 201 1000 13942 9916 66 914all 309 316 119 743 42 214 1000 43247 32449 195 2736
Rajasthan 1 315 327 84 726 21 253 1000 11838 8844 32 4352 318 289 95 702 19 279 1000 40312 27917 94 13353 370 196 133 699 19 282 1000 22671 15592 69 979all 333 268 104 705 19 275 1000 74821 52353 195 2749
Sikkim 1 0 0 0 0 0 0 0 0 0 0 02 0 0 0 0 0 0 0 0 0 0 03 390 457 2 849 2 149 1000 338 239 20 193all 390 457 2 849 2 149 1000 338 239 20 193
Tamil Nadu 1 184 353 172 709 34 257 1000 21993 17048 44 5172 246 364 157 767 16 217 1000 52018 39811 151 16103 243 272 239 754 20 225 1000 69573 51158 220 2295all 235 319 198 752 21 227 1000 143583 108017 415 4422
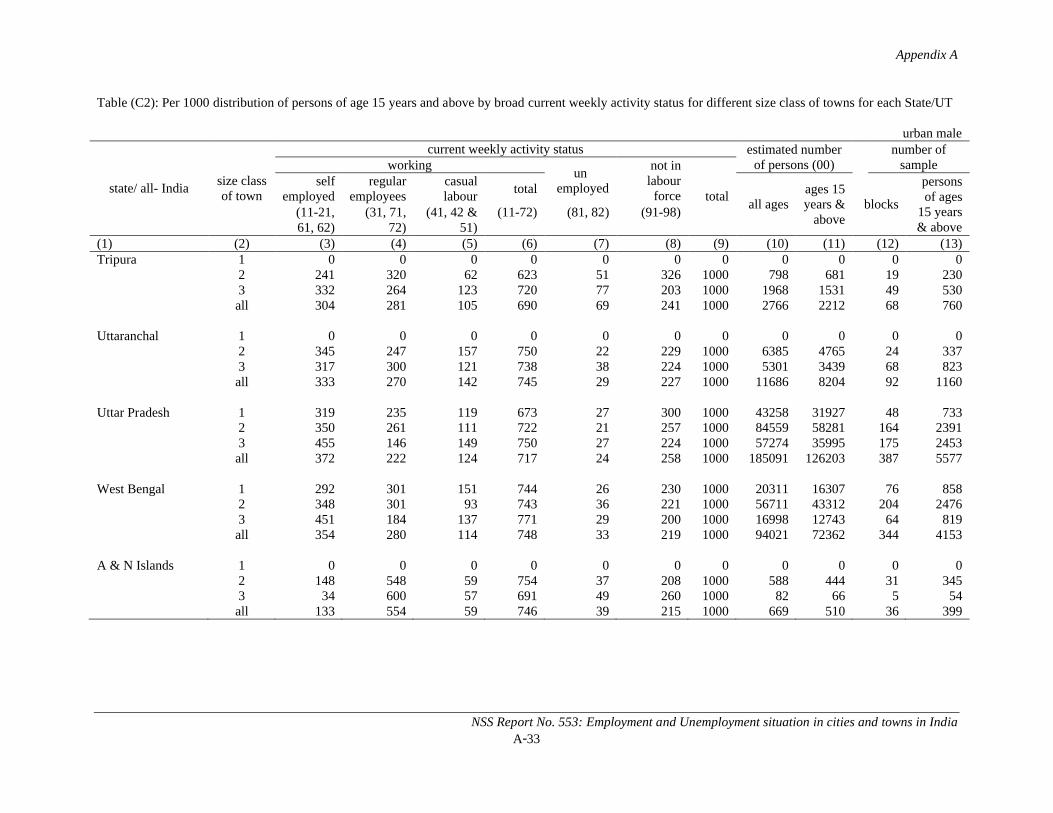
Appendix A
NSS Report No. 553: Employment and Unemployment situation in cities and towns in IndiaA-33
Table (C2): Per 1000 distribution of persons of age 15 years and above by broad current weekly activity status for different size class of towns for each State/UT
urban male
state/ all- Indiasize class of town
current weekly activity status estimated number of persons (00)
number of sampleworking
unemployed
not in labour
force totalself
employedregular
employeescasual labour
totalall ages
ages 15 years &
aboveblocks
persons of ages
15 years & above
(11-21, 61, 62)
(31, 71, 72)
(41, 42 & 51)
(11-72) (81, 82) (91-98)
(1) (2) (3) (4) (5) (6) (7) (8) (9) (10) (11) (12) (13)Tripura 1 0 0 0 0 0 0 0 0 0 0 0
2 241 320 62 623 51 326 1000 798 681 19 2303 332 264 123 720 77 203 1000 1968 1531 49 530all 304 281 105 690 69 241 1000 2766 2212 68 760
Uttaranchal 1 0 0 0 0 0 0 0 0 0 0 02 345 247 157 750 22 229 1000 6385 4765 24 3373 317 300 121 738 38 224 1000 5301 3439 68 823all 333 270 142 745 29 227 1000 11686 8204 92 1160
Uttar Pradesh 1 319 235 119 673 27 300 1000 43258 31927 48 7332 350 261 111 722 21 257 1000 84559 58281 164 23913 455 146 149 750 27 224 1000 57274 35995 175 2453all 372 222 124 717 24 258 1000 185091 126203 387 5577
West Bengal 1 292 301 151 744 26 230 1000 20311 16307 76 8582 348 301 93 743 36 221 1000 56711 43312 204 24763 451 184 137 771 29 200 1000 16998 12743 64 819all 354 280 114 748 33 219 1000 94021 72362 344 4153
A & N Islands 1 0 0 0 0 0 0 0 0 0 0 02 148 548 59 754 37 208 1000 588 444 31 3453 34 600 57 691 49 260 1000 82 66 5 54all 133 554 59 746 39 215 1000 669 510 36 399

Appendix A
NSS Report No. 553: Employment and Unemployment situation in cities and towns in IndiaA-34
Table (C2): Per 1000 distribution of persons of age 15 years and above by broad current weekly activity status for different size class of towns for each State/UT
urban male
state/ all- Indiasize class of town
current weekly activity status estimated number of persons (00)
number of sampleworking
unemployed
not in labour
force totalself
employedregular
employeescasual labour
totalall ages
ages 15 years &
aboveblocks
persons of ages
15 years & above
(11-21, 61, 62)
(31, 71, 72)
(41, 42 & 51)
(11-72) (81, 82) (91-98)
(1) (2) (3) (4) (5) (6) (7) (8) (9) (10) (11) (12) (13)Chandigarh 1 0 0 0 0 0 0 0 0 0 0 0
2 239 425 60 723 22 254 1000 3779 2883 35 4243 0 0 0 0 0 0 0 0 0 0 0all 239 425 60 723 22 254 1000 3779 2883 35 424
Dadra & Nagar Haveli 1 0 0 0 0 0 0 0 0 0 0 02 0 0 0 0 0 0 0 0 0 0 03 210 598 13 821 37 142 1000 401 278 12 178all 210 598 13 821 37 142 1000 401 278 12 178
Daman & Diu 1 0 0 0 0 0 0 0 0 0 0 02 0 0 0 0 0 0 0 0 0 0 03 301 297 196 795 23 182 1000 455 314 8 105all 301 297 196 795 23 182 1000 455 314 8 105
Lakshadweep 1 0 0 0 0 0 0 0 0 0 0 02 0 0 0 0 0 0 0 0 0 0 03 254 269 105 628 75 297 1000 131 98 16 269all 254 269 105 628 75 297 1000 131 98 16 269
Pondicherry 1 0 0 0 0 0 0 0 0 0 0 02 174 373 166 713 16 271 1000 2477 1954 38 4123 189 442 158 788 36 176 1000 883 623 18 208all 178 389 164 731 21 248 1000 3359 2577 56 620
all- India 1 283 375 69 727 30 243 1000 377837 285637 745 94572 293 315 119 726 25 249 1000 675771 493813 2372 304203 338 232 174 743 27 230 1000 406458 285450 2133 26826all 302 309 120 731 27 242 1000 1460066 1064900 5250 66703

Appendix A
NSS Report No. 553: Employment and Unemployment situation in cities and towns in IndiaA-35
Table (C2): Per 1000 distribution of persons of age 15 years and above by broad current weekly activity status for different size class of towns for each State/UT
urban female
state/ all- Indiasize class of town
current weekly activity status estimated number of persons (00)
number of sampleworking
unemployed
not in labour
force totalself
employedregular
employeescasual labour
totalall ages
ages 15 years &
aboveblocks
persons of ages
15 years & above
(11-21, 61, 62)
(31, 71, 72)
(41, 42 & 51)
(11-72) (81, 82) (91-98)
(1) (2) (3) (4) (5) (6) (7) (8) (9) (10) (11) (12) (13)Andhra Pradesh 1 51 107 14 172 28 799 1000 17208 12102 56 641
2 98 78 43 219 16 766 1000 71084 53906 247 27273 133 61 91 285 16 699 1000 15834 12019 68 769all 96 80 46 222 18 761 1000 104126 78027 371 4137
Arunachal Pradesh 1 0 0 0 0 0 0 0 0 0 0 02 0 0 0 0 0 0 0 0 0 0 03 120 80 8 208 15 777 1000 1014 692 75 814all 120 80 8 208 15 777 1000 1014 692 75 814
Assam 1 0 0 0 0 0 0 0 0 0 0 02 74 40 7 121 0 879 1000 5973 4554 25 2763 35 38 26 99 23 878 1000 7346 5704 79 965all 52 39 18 108 13 879 1000 13319 10258 104 1241
Bihar 1 19 35 0 54 27 919 1000 10731 7138 12 1362 19 15 0 34 22 944 1000 12035 8338 63 7023 40 7 23 70 11 919 1000 17087 10150 83 993all 27 17 9 54 19 927 1000 39853 25625 158 1831
Chhattisgarh 1 0 0 0 0 0 0 0 0 0 0 02 70 82 55 207 3 790 1000 12800 9095 46 5883 34 38 98 170 3 827 1000 6383 4503 46 578all 58 68 69 195 3 802 1000 19184 13598 92 1166
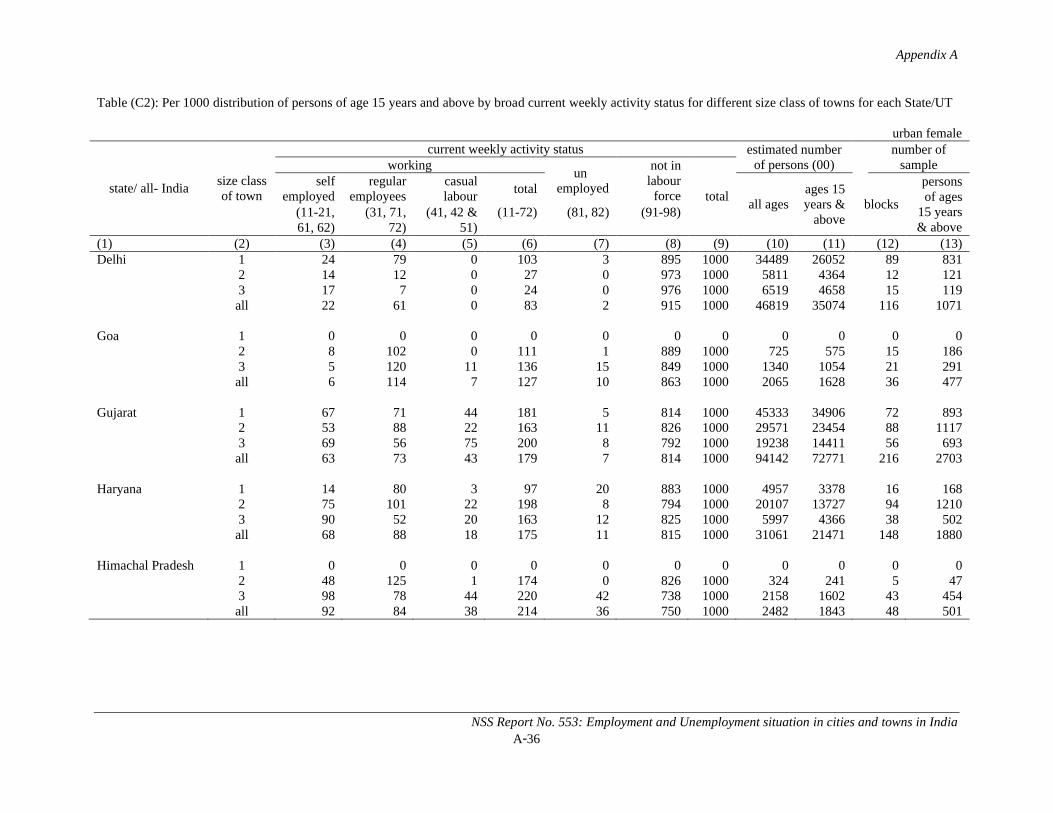
Appendix A
NSS Report No. 553: Employment and Unemployment situation in cities and towns in IndiaA-36
Table (C2): Per 1000 distribution of persons of age 15 years and above by broad current weekly activity status for different size class of towns for each State/UT
urban female
state/ all- Indiasize class of town
current weekly activity status estimated number of persons (00)
number of sampleworking
unemployed
not in labour
force totalself
employedregular
employeescasual labour
totalall ages
ages 15 years &
aboveblocks
persons of ages
15 years & above
(11-21, 61, 62)
(31, 71, 72)
(41, 42 & 51)
(11-72) (81, 82) (91-98)
(1) (2) (3) (4) (5) (6) (7) (8) (9) (10) (11) (12) (13)Delhi 1 24 79 0 103 3 895 1000 34489 26052 89 831
2 14 12 0 27 0 973 1000 5811 4364 12 1213 17 7 0 24 0 976 1000 6519 4658 15 119all 22 61 0 83 2 915 1000 46819 35074 116 1071
Goa 1 0 0 0 0 0 0 0 0 0 0 02 8 102 0 111 1 889 1000 725 575 15 1863 5 120 11 136 15 849 1000 1340 1054 21 291all 6 114 7 127 10 863 1000 2065 1628 36 477
Gujarat 1 67 71 44 181 5 814 1000 45333 34906 72 8932 53 88 22 163 11 826 1000 29571 23454 88 11173 69 56 75 200 8 792 1000 19238 14411 56 693all 63 73 43 179 7 814 1000 94142 72771 216 2703
Haryana 1 14 80 3 97 20 883 1000 4957 3378 16 1682 75 101 22 198 8 794 1000 20107 13727 94 12103 90 52 20 163 12 825 1000 5997 4366 38 502all 68 88 18 175 11 815 1000 31061 21471 148 1880
Himachal Pradesh 1 0 0 0 0 0 0 0 0 0 0 02 48 125 1 174 0 826 1000 324 241 5 473 98 78 44 220 42 738 1000 2158 1602 43 454all 92 84 38 214 36 750 1000 2482 1843 48 501
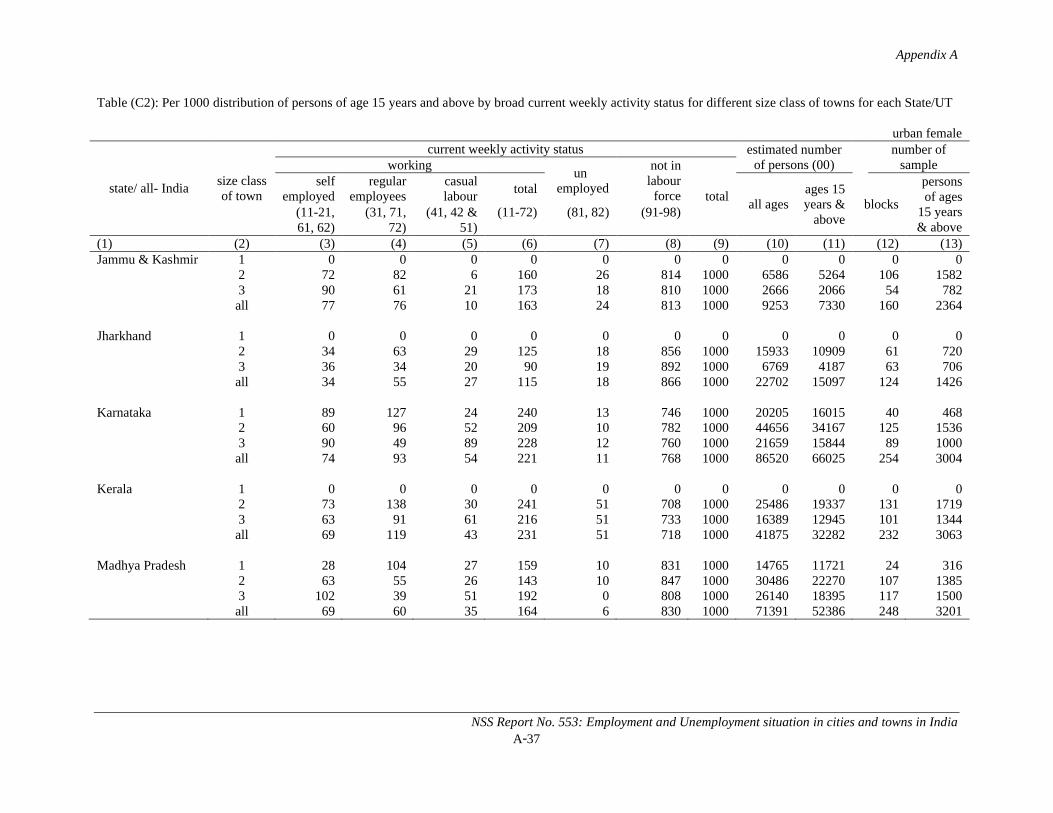
Appendix A
NSS Report No. 553: Employment and Unemployment situation in cities and towns in IndiaA-37
Table (C2): Per 1000 distribution of persons of age 15 years and above by broad current weekly activity status for different size class of towns for each State/UT
urban female
state/ all- Indiasize class of town
current weekly activity status estimated number of persons (00)
number of sampleworking
unemployed
not in labour
force totalself
employedregular
employeescasual labour
totalall ages
ages 15 years &
aboveblocks
persons of ages
15 years & above
(11-21, 61, 62)
(31, 71, 72)
(41, 42 & 51)
(11-72) (81, 82) (91-98)
(1) (2) (3) (4) (5) (6) (7) (8) (9) (10) (11) (12) (13)Jammu & Kashmir 1 0 0 0 0 0 0 0 0 0 0 0
2 72 82 6 160 26 814 1000 6586 5264 106 15823 90 61 21 173 18 810 1000 2666 2066 54 782all 77 76 10 163 24 813 1000 9253 7330 160 2364
Jharkhand 1 0 0 0 0 0 0 0 0 0 0 02 34 63 29 125 18 856 1000 15933 10909 61 7203 36 34 20 90 19 892 1000 6769 4187 63 706all 34 55 27 115 18 866 1000 22702 15097 124 1426
Karnataka 1 89 127 24 240 13 746 1000 20205 16015 40 4682 60 96 52 209 10 782 1000 44656 34167 125 15363 90 49 89 228 12 760 1000 21659 15844 89 1000all 74 93 54 221 11 768 1000 86520 66025 254 3004
Kerala 1 0 0 0 0 0 0 0 0 0 0 02 73 138 30 241 51 708 1000 25486 19337 131 17193 63 91 61 216 51 733 1000 16389 12945 101 1344all 69 119 43 231 51 718 1000 41875 32282 232 3063
Madhya Pradesh 1 28 104 27 159 10 831 1000 14765 11721 24 3162 63 55 26 143 10 847 1000 30486 22270 107 13853 102 39 51 192 0 808 1000 26140 18395 117 1500all 69 60 35 164 6 830 1000 71391 52386 248 3201
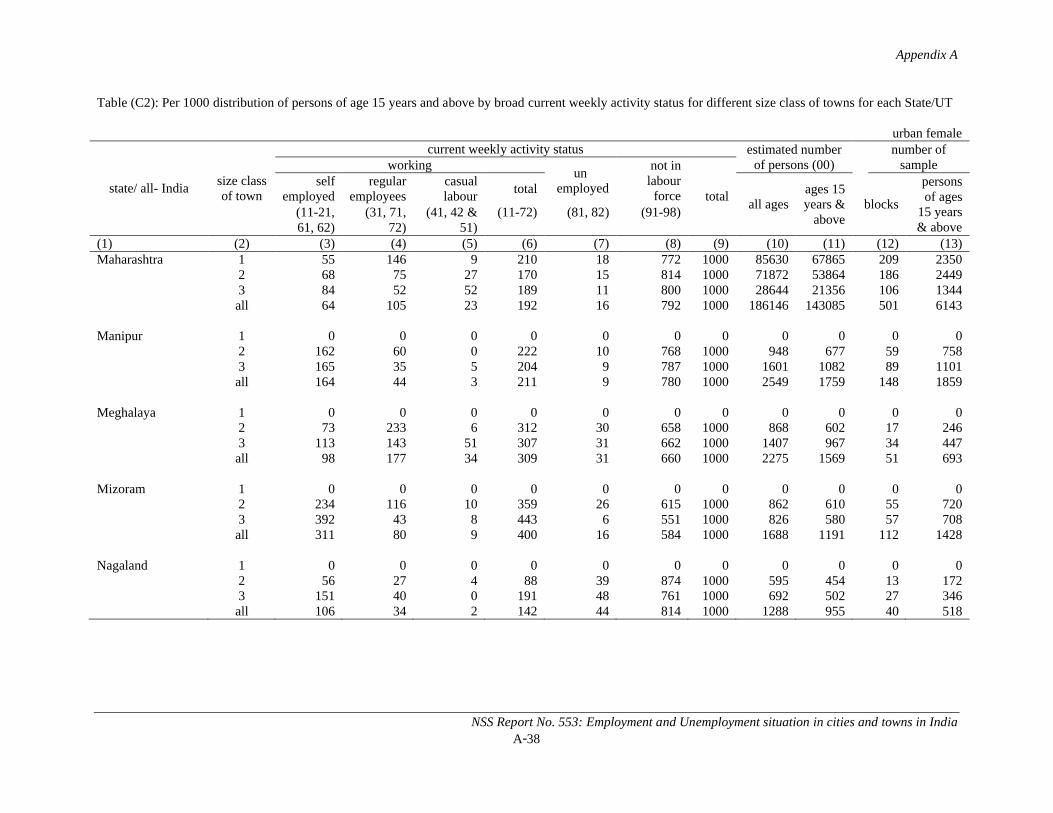
Appendix A
NSS Report No. 553: Employment and Unemployment situation in cities and towns in IndiaA-38
Table (C2): Per 1000 distribution of persons of age 15 years and above by broad current weekly activity status for different size class of towns for each State/UT
urban female
state/ all- Indiasize class of town
current weekly activity status estimated number of persons (00)
number of sampleworking
unemployed
not in labour
force totalself
employedregular
employeescasual labour
totalall ages
ages 15 years &
aboveblocks
persons of ages
15 years & above
(11-21, 61, 62)
(31, 71, 72)
(41, 42 & 51)
(11-72) (81, 82) (91-98)
(1) (2) (3) (4) (5) (6) (7) (8) (9) (10) (11) (12) (13)Maharashtra 1 55 146 9 210 18 772 1000 85630 67865 209 2350
2 68 75 27 170 15 814 1000 71872 53864 186 24493 84 52 52 189 11 800 1000 28644 21356 106 1344all 64 105 23 192 16 792 1000 186146 143085 501 6143
Manipur 1 0 0 0 0 0 0 0 0 0 0 02 162 60 0 222 10 768 1000 948 677 59 7583 165 35 5 204 9 787 1000 1601 1082 89 1101all 164 44 3 211 9 780 1000 2549 1759 148 1859
Meghalaya 1 0 0 0 0 0 0 0 0 0 0 02 73 233 6 312 30 658 1000 868 602 17 2463 113 143 51 307 31 662 1000 1407 967 34 447all 98 177 34 309 31 660 1000 2275 1569 51 693
Mizoram 1 0 0 0 0 0 0 0 0 0 0 02 234 116 10 359 26 615 1000 862 610 55 7203 392 43 8 443 6 551 1000 826 580 57 708all 311 80 9 400 16 584 1000 1688 1191 112 1428
Nagaland 1 0 0 0 0 0 0 0 0 0 0 02 56 27 4 88 39 874 1000 595 454 13 1723 151 40 0 191 48 761 1000 692 502 27 346all 106 34 2 142 44 814 1000 1288 955 40 518
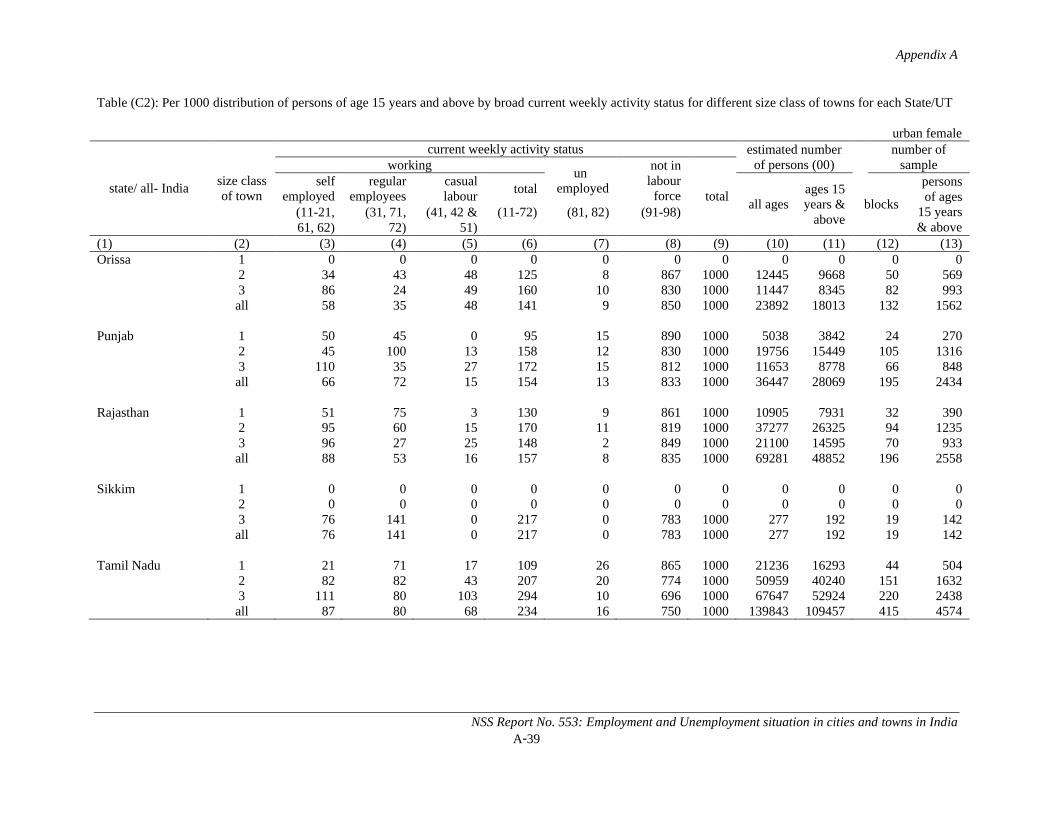
Appendix A
NSS Report No. 553: Employment and Unemployment situation in cities and towns in IndiaA-39
Table (C2): Per 1000 distribution of persons of age 15 years and above by broad current weekly activity status for different size class of towns for each State/UT
urban female
state/ all- Indiasize class of town
current weekly activity status estimated number of persons (00)
number of sampleworking
unemployed
not in labour
force totalself
employedregular
employeescasual labour
totalall ages
ages 15 years &
aboveblocks
persons of ages
15 years & above
(11-21, 61, 62)
(31, 71, 72)
(41, 42 & 51)
(11-72) (81, 82) (91-98)
(1) (2) (3) (4) (5) (6) (7) (8) (9) (10) (11) (12) (13)Orissa 1 0 0 0 0 0 0 0 0 0 0 0
2 34 43 48 125 8 867 1000 12445 9668 50 5693 86 24 49 160 10 830 1000 11447 8345 82 993all 58 35 48 141 9 850 1000 23892 18013 132 1562
Punjab 1 50 45 0 95 15 890 1000 5038 3842 24 2702 45 100 13 158 12 830 1000 19756 15449 105 13163 110 35 27 172 15 812 1000 11653 8778 66 848all 66 72 15 154 13 833 1000 36447 28069 195 2434
Rajasthan 1 51 75 3 130 9 861 1000 10905 7931 32 3902 95 60 15 170 11 819 1000 37277 26325 94 12353 96 27 25 148 2 849 1000 21100 14595 70 933all 88 53 16 157 8 835 1000 69281 48852 196 2558
Sikkim 1 0 0 0 0 0 0 0 0 0 0 02 0 0 0 0 0 0 0 0 0 0 03 76 141 0 217 0 783 1000 277 192 19 142all 76 141 0 217 0 783 1000 277 192 19 142
Tamil Nadu 1 21 71 17 109 26 865 1000 21236 16293 44 5042 82 82 43 207 20 774 1000 50959 40240 151 16323 111 80 103 294 10 696 1000 67647 52924 220 2438all 87 80 68 234 16 750 1000 139843 109457 415 4574

Appendix A
NSS Report No. 553: Employment and Unemployment situation in cities and towns in IndiaA-40
Table (C2): Per 1000 distribution of persons of age 15 years and above by broad current weekly activity status for different size class of towns for each State/UT
urban female
state/ all- Indiasize class of town
current weekly activity status estimated number of persons (00)
number of sampleworking
unemployed
not in labour
force totalself
employedregular
employeescasual labour
totalall ages
ages 15 years &
aboveblocks
persons of ages
15 years & above
(11-21, 61, 62)
(31, 71, 72)
(41, 42 & 51)
(11-72) (81, 82) (91-98)
(1) (2) (3) (4) (5) (6) (7) (8) (9) (10) (11) (12) (13)Tripura 1 0 0 0 0 0 0 0 0 0 0 0
2 13 180 17 210 118 673 1000 849 706 19 2403 17 70 14 101 94 806 1000 2046 1567 49 561all 16 104 15 134 101 764 1000 2895 2273 68 801
Uttaranchal 1 0 0 0 0 0 0 0 0 0 0 02 51 72 39 162 6 831 1000 5818 4020 24 3073 76 60 5 141 4 855 1000 4358 3043 68 768all 62 67 24 153 5 842 1000 10175 7063 92 1075
Uttar Pradesh 1 85 33 7 125 3 873 1000 39384 28272 48 6602 43 38 7 88 9 903 1000 76375 53909 164 22493 73 17 22 113 2 885 1000 52927 34583 175 2371all 62 31 11 104 5 891 1000 168687 116764 387 5280
West Bengal 1 47 95 10 152 14 834 1000 19851 16241 75 7902 94 65 13 172 18 810 1000 53048 41993 203 23543 96 18 30 144 21 835 1000 15151 11744 64 748all 84 64 15 163 17 820 1000 88049 69978 342 3892
A & N Islands 1 0 0 0 0 0 0 0 0 0 0 02 17 218 17 252 75 674 1000 531 428 31 3543 0 104 0 104 35 861 1000 76 57 5 50all 15 205 15 235 70 695 1000 607 485 36 404
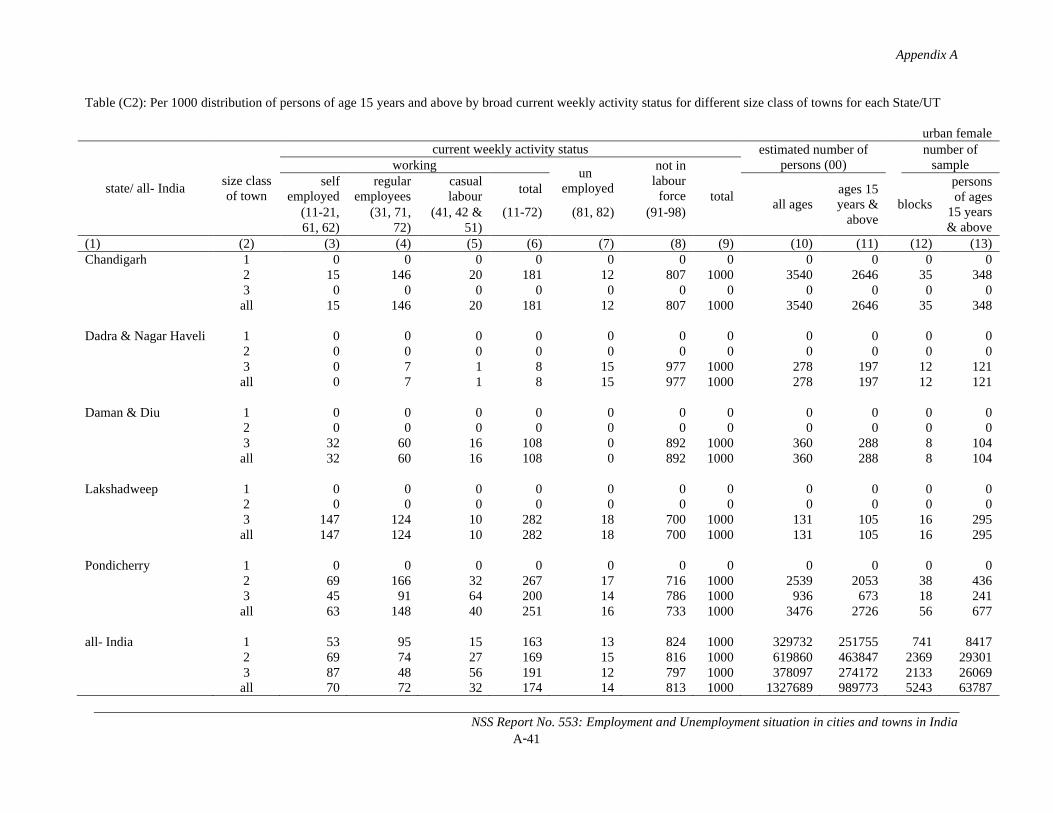
Appendix A
NSS Report No. 553: Employment and Unemployment situation in cities and towns in IndiaA-41
Table (C2): Per 1000 distribution of persons of age 15 years and above by broad current weekly activity status for different size class of towns for each State/UT
urban female
state/ all- Indiasize class of town
current weekly activity status estimated number of persons (00)
number of sampleworking
unemployed
not in labour
force totalself
employedregular
employeescasual labour
totalall ages
ages 15 years &
aboveblocks
persons of ages
15 years & above
(11-21, 61, 62)
(31, 71, 72)
(41, 42 & 51)
(11-72) (81, 82) (91-98)
(1) (2) (3) (4) (5) (6) (7) (8) (9) (10) (11) (12) (13)Chandigarh 1 0 0 0 0 0 0 0 0 0 0 0
2 15 146 20 181 12 807 1000 3540 2646 35 3483 0 0 0 0 0 0 0 0 0 0 0all 15 146 20 181 12 807 1000 3540 2646 35 348
Dadra & Nagar Haveli 1 0 0 0 0 0 0 0 0 0 0 02 0 0 0 0 0 0 0 0 0 0 03 0 7 1 8 15 977 1000 278 197 12 121all 0 7 1 8 15 977 1000 278 197 12 121
Daman & Diu 1 0 0 0 0 0 0 0 0 0 0 02 0 0 0 0 0 0 0 0 0 0 03 32 60 16 108 0 892 1000 360 288 8 104all 32 60 16 108 0 892 1000 360 288 8 104
Lakshadweep 1 0 0 0 0 0 0 0 0 0 0 02 0 0 0 0 0 0 0 0 0 0 03 147 124 10 282 18 700 1000 131 105 16 295all 147 124 10 282 18 700 1000 131 105 16 295
Pondicherry 1 0 0 0 0 0 0 0 0 0 0 02 69 166 32 267 17 716 1000 2539 2053 38 4363 45 91 64 200 14 786 1000 936 673 18 241all 63 148 40 251 16 733 1000 3476 2726 56 677
all- India 1 53 95 15 163 13 824 1000 329732 251755 741 84172 69 74 27 169 15 816 1000 619860 463847 2369 293013 87 48 56 191 12 797 1000 378097 274172 2133 26069all 70 72 32 174 14 813 1000 1327689 989773 5243 63787
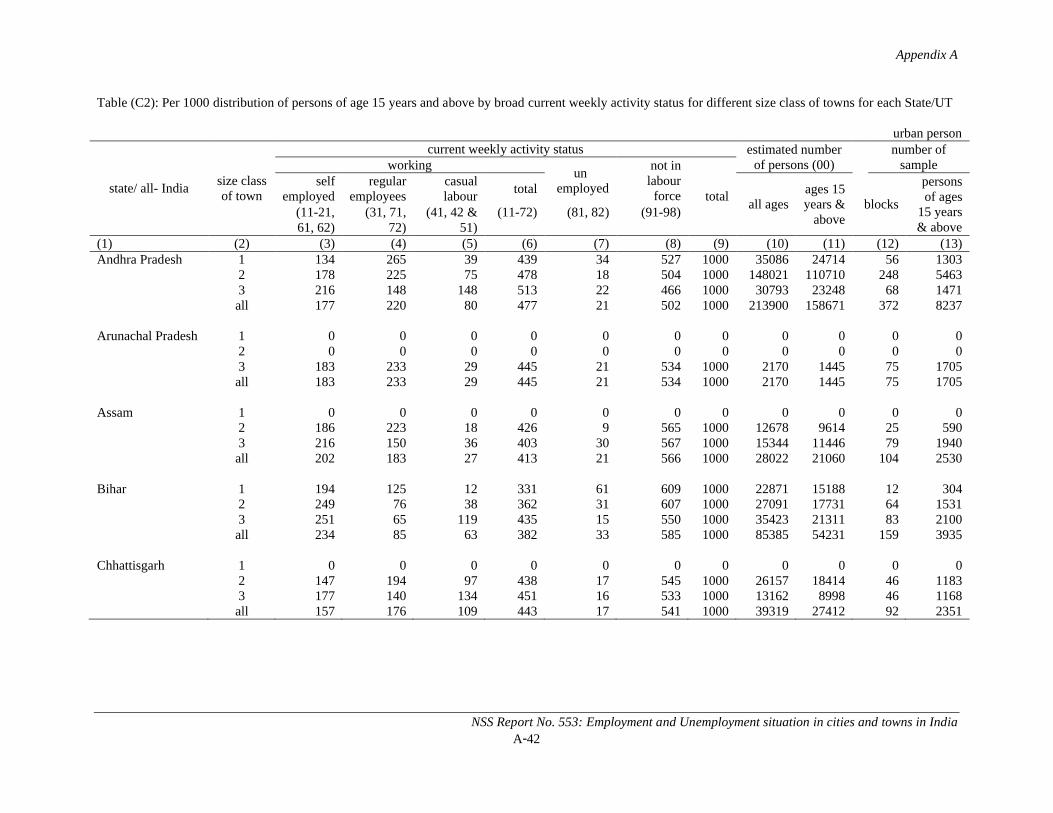
Appendix A
NSS Report No. 553: Employment and Unemployment situation in cities and towns in IndiaA-42
Table (C2): Per 1000 distribution of persons of age 15 years and above by broad current weekly activity status for different size class of towns for each State/UT
urban person
state/ all- Indiasize class of town
current weekly activity status estimated number of persons (00)
number of sampleworking
unemployed
not in labour
force totalself
employedregular
employeescasual labour
totalall ages
ages 15 years &
aboveblocks
persons of ages
15 years & above
(11-21, 61, 62)
(31, 71, 72)
(41, 42 & 51)
(11-72) (81, 82) (91-98)
(1) (2) (3) (4) (5) (6) (7) (8) (9) (10) (11) (12) (13)Andhra Pradesh 1 134 265 39 439 34 527 1000 35086 24714 56 1303
2 178 225 75 478 18 504 1000 148021 110710 248 54633 216 148 148 513 22 466 1000 30793 23248 68 1471all 177 220 80 477 21 502 1000 213900 158671 372 8237
Arunachal Pradesh 1 0 0 0 0 0 0 0 0 0 0 02 0 0 0 0 0 0 0 0 0 0 03 183 233 29 445 21 534 1000 2170 1445 75 1705all 183 233 29 445 21 534 1000 2170 1445 75 1705
Assam 1 0 0 0 0 0 0 0 0 0 0 02 186 223 18 426 9 565 1000 12678 9614 25 5903 216 150 36 403 30 567 1000 15344 11446 79 1940all 202 183 27 413 21 566 1000 28022 21060 104 2530
Bihar 1 194 125 12 331 61 609 1000 22871 15188 12 3042 249 76 38 362 31 607 1000 27091 17731 64 15313 251 65 119 435 15 550 1000 35423 21311 83 2100all 234 85 63 382 33 585 1000 85385 54231 159 3935
Chhattisgarh 1 0 0 0 0 0 0 0 0 0 0 02 147 194 97 438 17 545 1000 26157 18414 46 11833 177 140 134 451 16 533 1000 13162 8998 46 1168all 157 176 109 443 17 541 1000 39319 27412 92 2351
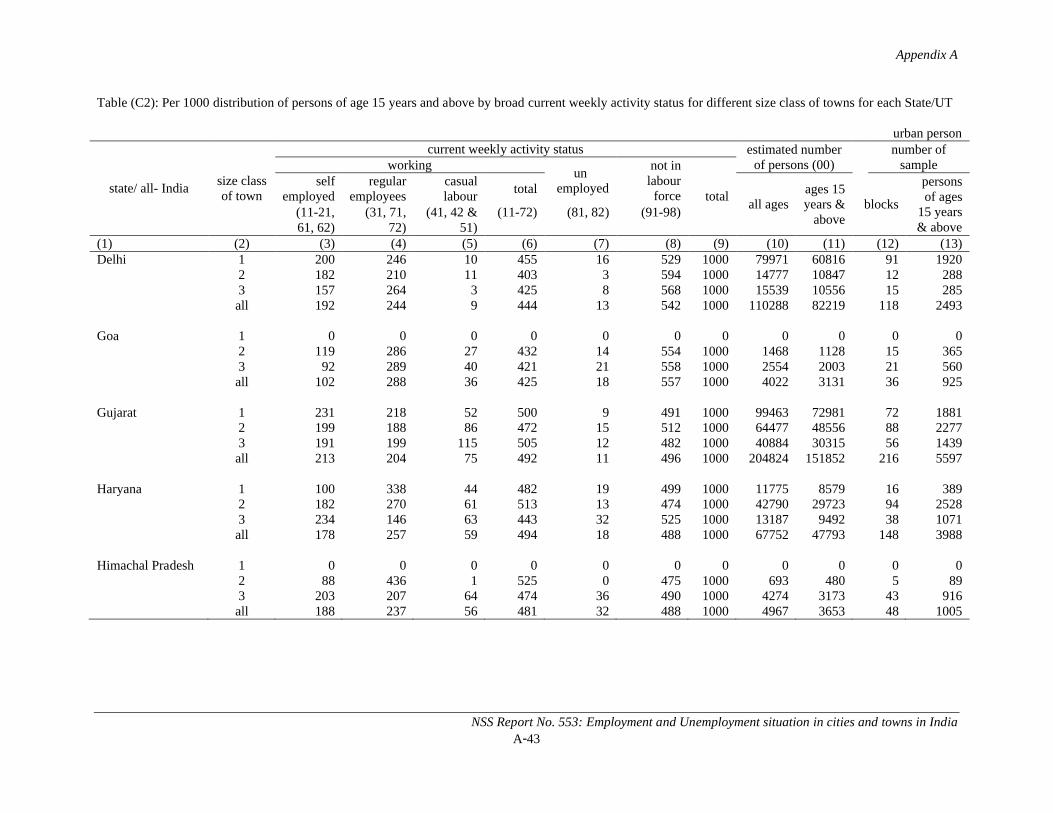
Appendix A
NSS Report No. 553: Employment and Unemployment situation in cities and towns in IndiaA-43
Table (C2): Per 1000 distribution of persons of age 15 years and above by broad current weekly activity status for different size class of towns for each State/UT
urban person
state/ all- Indiasize class of town
current weekly activity status estimated number of persons (00)
number of sampleworking
unemployed
not in labour
force totalself
employedregular
employeescasual labour
totalall ages
ages 15 years &
aboveblocks
persons of ages
15 years & above
(11-21, 61, 62)
(31, 71, 72)
(41, 42 & 51)
(11-72) (81, 82) (91-98)
(1) (2) (3) (4) (5) (6) (7) (8) (9) (10) (11) (12) (13)Delhi 1 200 246 10 455 16 529 1000 79971 60816 91 1920
2 182 210 11 403 3 594 1000 14777 10847 12 2883 157 264 3 425 8 568 1000 15539 10556 15 285all 192 244 9 444 13 542 1000 110288 82219 118 2493
Goa 1 0 0 0 0 0 0 0 0 0 0 02 119 286 27 432 14 554 1000 1468 1128 15 3653 92 289 40 421 21 558 1000 2554 2003 21 560all 102 288 36 425 18 557 1000 4022 3131 36 925
Gujarat 1 231 218 52 500 9 491 1000 99463 72981 72 18812 199 188 86 472 15 512 1000 64477 48556 88 22773 191 199 115 505 12 482 1000 40884 30315 56 1439all 213 204 75 492 11 496 1000 204824 151852 216 5597
Haryana 1 100 338 44 482 19 499 1000 11775 8579 16 3892 182 270 61 513 13 474 1000 42790 29723 94 25283 234 146 63 443 32 525 1000 13187 9492 38 1071all 178 257 59 494 18 488 1000 67752 47793 148 3988
Himachal Pradesh 1 0 0 0 0 0 0 0 0 0 0 02 88 436 1 525 0 475 1000 693 480 5 893 203 207 64 474 36 490 1000 4274 3173 43 916all 188 237 56 481 32 488 1000 4967 3653 48 1005

Appendix A
NSS Report No. 553: Employment and Unemployment situation in cities and towns in IndiaA-44
Table (C2): Per 1000 distribution of persons of age 15 years and above by broad current weekly activity status for different size class of towns for each State/UT
urban person
state/ all- Indiasize class of town
current weekly activity status estimated number of persons (00)
number of sampleworking
unemployed
not in labour
force totalself
employedregular
employeescasual labour
totalall ages
ages 15 years &
aboveblocks
persons of ages
15 years & above
(11-21, 61, 62)
(31, 71, 72)
(41, 42 & 51)
(11-72) (81, 82) (91-98)
(1) (2) (3) (4) (5) (6) (7) (8) (9) (10) (11) (12) (13)Jammu & Kashmir 1 0 0 0 0 0 0 0 0 0 0 0
2 184 203 40 426 33 540 1000 13430 10561 106 32603 242 158 53 454 24 522 1000 5684 4356 54 1629all 201 190 44 434 31 535 1000 19114 14917 160 4889
Jharkhand 1 0 0 0 0 0 0 0 0 0 0 02 164 174 99 436 27 537 1000 33481 23316 61 15183 136 141 95 373 47 580 1000 13767 9019 63 1497all 156 165 98 418 33 549 1000 47248 32334 124 3015
Karnataka 1 209 252 57 518 22 460 1000 43587 35035 40 9732 170 197 102 469 17 514 1000 92304 70331 126 30483 218 142 165 525 13 462 1000 45108 32588 89 2048all 191 198 105 494 17 488 1000 180999 137954 255 6069
Kerala 1 0 0 0 0 0 0 0 0 0 0 02 157 172 131 461 46 493 1000 48884 37169 131 32273 144 144 147 434 43 523 1000 31216 23995 101 2482all 152 161 137 451 45 504 1000 80100 61164 232 5709
Madhya Pradesh 1 127 229 50 407 7 586 1000 28849 21681 24 6252 181 160 71 412 21 567 1000 65079 46915 107 28703 262 101 114 476 17 507 1000 55785 39327 117 3164all 200 152 82 434 17 549 1000 149712 107923 248 6659
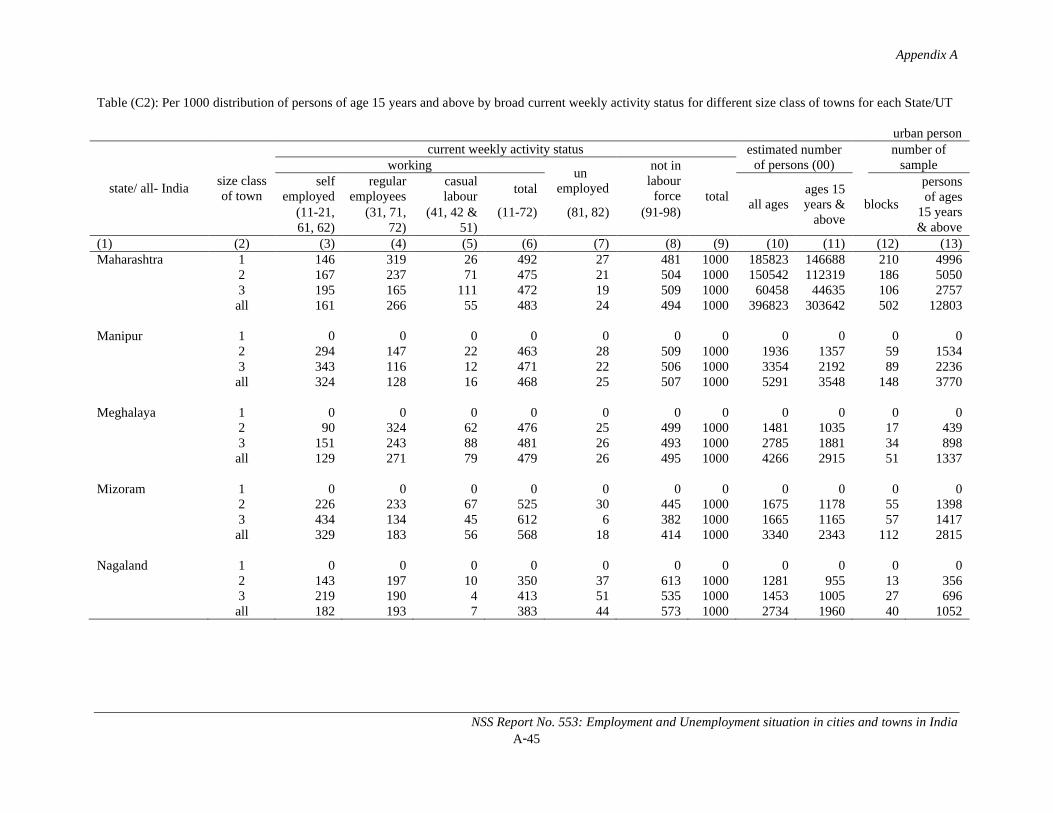
Appendix A
NSS Report No. 553: Employment and Unemployment situation in cities and towns in IndiaA-45
Table (C2): Per 1000 distribution of persons of age 15 years and above by broad current weekly activity status for different size class of towns for each State/UT
urban person
state/ all- Indiasize class of town
current weekly activity status estimated number of persons (00)
number of sampleworking
unemployed
not in labour
force totalself
employedregular
employeescasual labour
totalall ages
ages 15 years &
aboveblocks
persons of ages
15 years & above
(11-21, 61, 62)
(31, 71, 72)
(41, 42 & 51)
(11-72) (81, 82) (91-98)
(1) (2) (3) (4) (5) (6) (7) (8) (9) (10) (11) (12) (13)Maharashtra 1 146 319 26 492 27 481 1000 185823 146688 210 4996
2 167 237 71 475 21 504 1000 150542 112319 186 50503 195 165 111 472 19 509 1000 60458 44635 106 2757all 161 266 55 483 24 494 1000 396823 303642 502 12803
Manipur 1 0 0 0 0 0 0 0 0 0 0 02 294 147 22 463 28 509 1000 1936 1357 59 15343 343 116 12 471 22 506 1000 3354 2192 89 2236all 324 128 16 468 25 507 1000 5291 3548 148 3770
Meghalaya 1 0 0 0 0 0 0 0 0 0 0 02 90 324 62 476 25 499 1000 1481 1035 17 4393 151 243 88 481 26 493 1000 2785 1881 34 898all 129 271 79 479 26 495 1000 4266 2915 51 1337
Mizoram 1 0 0 0 0 0 0 0 0 0 0 02 226 233 67 525 30 445 1000 1675 1178 55 13983 434 134 45 612 6 382 1000 1665 1165 57 1417all 329 183 56 568 18 414 1000 3340 2343 112 2815
Nagaland 1 0 0 0 0 0 0 0 0 0 0 02 143 197 10 350 37 613 1000 1281 955 13 3563 219 190 4 413 51 535 1000 1453 1005 27 696all 182 193 7 383 44 573 1000 2734 1960 40 1052
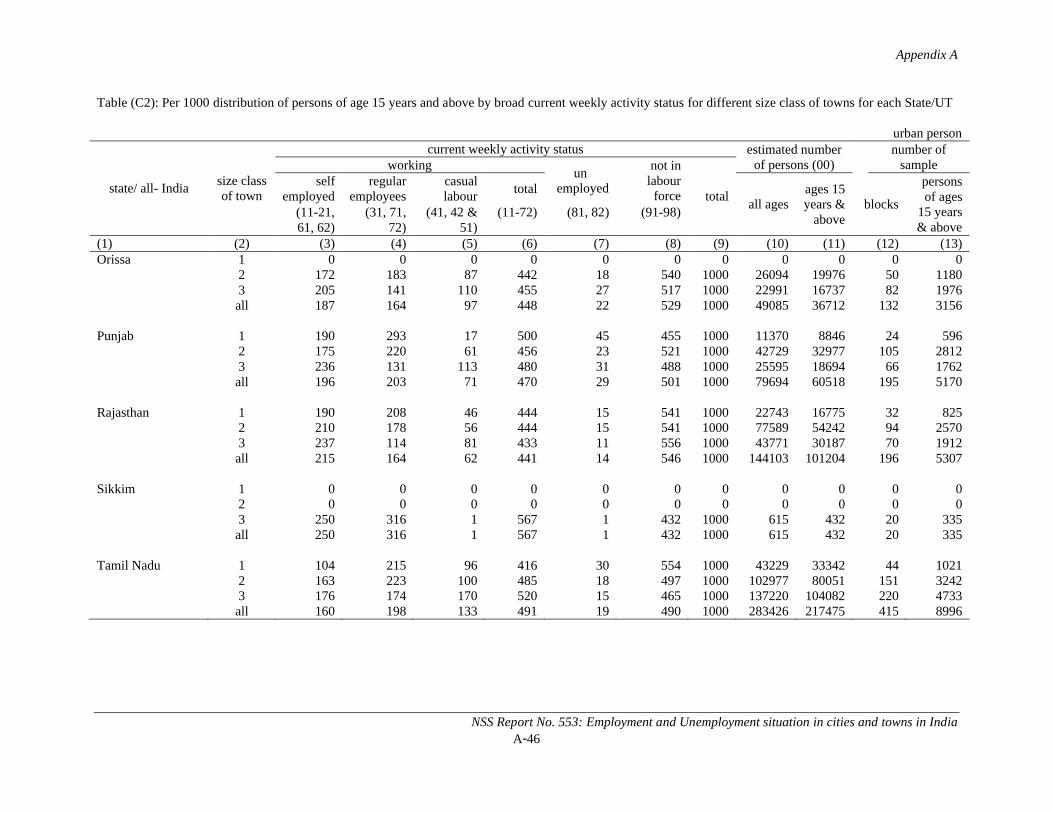
Appendix A
NSS Report No. 553: Employment and Unemployment situation in cities and towns in IndiaA-46
Table (C2): Per 1000 distribution of persons of age 15 years and above by broad current weekly activity status for different size class of towns for each State/UT
urban person
state/ all- Indiasize class of town
current weekly activity status estimated number of persons (00)
number of sampleworking
unemployed
not in labour
force totalself
employedregular
employeescasual labour
totalall ages
ages 15 years &
aboveblocks
persons of ages
15 years & above
(11-21, 61, 62)
(31, 71, 72)
(41, 42 & 51)
(11-72) (81, 82) (91-98)
(1) (2) (3) (4) (5) (6) (7) (8) (9) (10) (11) (12) (13)Orissa 1 0 0 0 0 0 0 0 0 0 0 0
2 172 183 87 442 18 540 1000 26094 19976 50 11803 205 141 110 455 27 517 1000 22991 16737 82 1976all 187 164 97 448 22 529 1000 49085 36712 132 3156
Punjab 1 190 293 17 500 45 455 1000 11370 8846 24 5962 175 220 61 456 23 521 1000 42729 32977 105 28123 236 131 113 480 31 488 1000 25595 18694 66 1762all 196 203 71 470 29 501 1000 79694 60518 195 5170
Rajasthan 1 190 208 46 444 15 541 1000 22743 16775 32 8252 210 178 56 444 15 541 1000 77589 54242 94 25703 237 114 81 433 11 556 1000 43771 30187 70 1912all 215 164 62 441 14 546 1000 144103 101204 196 5307
Sikkim 1 0 0 0 0 0 0 0 0 0 0 02 0 0 0 0 0 0 0 0 0 0 03 250 316 1 567 1 432 1000 615 432 20 335all 250 316 1 567 1 432 1000 615 432 20 335
Tamil Nadu 1 104 215 96 416 30 554 1000 43229 33342 44 10212 163 223 100 485 18 497 1000 102977 80051 151 32423 176 174 170 520 15 465 1000 137220 104082 220 4733all 160 198 133 491 19 490 1000 283426 217475 415 8996

Appendix A
NSS Report No. 553: Employment and Unemployment situation in cities and towns in IndiaA-47
Table (C2): Per 1000 distribution of persons of age 15 years and above by broad current weekly activity status for different size class of towns for each State/UT
urban person
state/ all- Indiasize class of town
current weekly activity status estimated number of persons (00)
number of sampleworking
unemployed
not in labour
force totalself
employedregular
employeescasual labour
totalall ages
ages 15 years &
aboveblocks
persons of ages
15 years & above
(11-21, 61, 62)
(31, 71, 72)
(41, 42 & 51)
(11-72) (81, 82) (91-98)
(1) (2) (3) (4) (5) (6) (7) (8) (9) (10) (11) (12) (13)Tripura 1 0 0 0 0 0 0 0 0 0 0 0
2 125 249 39 412 85 502 1000 1647 1387 19 4703 173 166 68 407 86 508 1000 4014 3098 49 1091all 158 191 59 408 85 506 1000 5661 4485 68 1561
Uttaranchal 1 0 0 0 0 0 0 0 0 0 0 02 211 167 103 481 15 504 1000 12203 8785 24 6443 204 188 67 458 22 520 1000 9658 6482 68 1591all 208 176 88 471 18 511 1000 21861 15267 92 2235
Uttar Pradesh 1 209 140 66 415 16 569 1000 82642 60199 48 13932 202 154 61 417 15 568 1000 160934 112190 164 46403 268 83 87 438 15 548 1000 110201 70578 175 4824all 223 130 70 423 15 562 1000 353777 242967 387 10857
West Bengal 1 170 198 81 449 20 532 1000 40162 32548 76 16482 223 185 54 462 27 511 1000 109759 85305 204 48303 281 104 86 470 25 505 1000 32149 24487 64 1567all 221 174 65 460 25 515 1000 182070 142340 344 8045
A & N Islands 1 0 0 0 0 0 0 0 0 0 0 02 83 386 38 508 56 437 1000 1118 872 31 6993 18 370 31 419 42 539 1000 158 122 5 104all 75 384 37 497 54 449 1000 1276 995 36 803
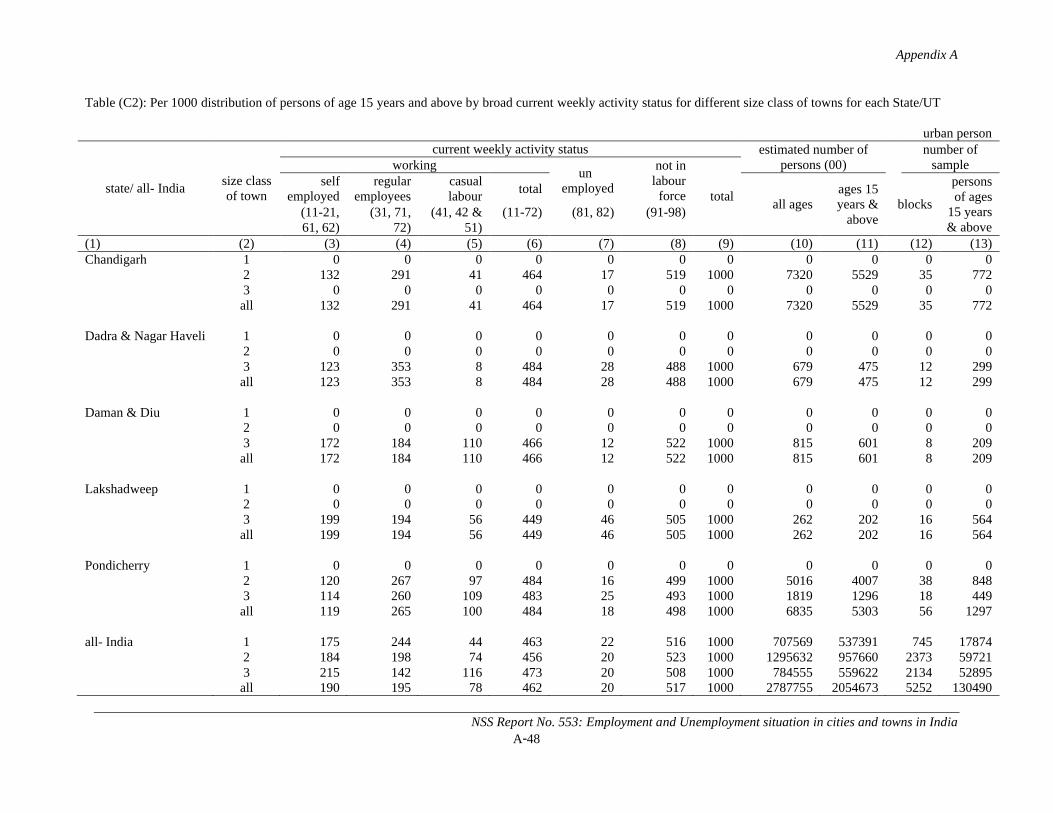
Appendix A
NSS Report No. 553: Employment and Unemployment situation in cities and towns in IndiaA-48
Table (C2): Per 1000 distribution of persons of age 15 years and above by broad current weekly activity status for different size class of towns for each State/UT
urban person
state/ all- Indiasize class of town
current weekly activity status estimated number of persons (00)
number of sampleworking
unemployed
not in labour
force totalself
employedregular
employeescasual labour
totalall ages
ages 15 years &
aboveblocks
persons of ages
15 years & above
(11-21, 61, 62)
(31, 71, 72)
(41, 42 & 51)
(11-72) (81, 82) (91-98)
(1) (2) (3) (4) (5) (6) (7) (8) (9) (10) (11) (12) (13)Chandigarh 1 0 0 0 0 0 0 0 0 0 0 0
2 132 291 41 464 17 519 1000 7320 5529 35 7723 0 0 0 0 0 0 0 0 0 0 0all 132 291 41 464 17 519 1000 7320 5529 35 772
Dadra & Nagar Haveli 1 0 0 0 0 0 0 0 0 0 0 02 0 0 0 0 0 0 0 0 0 0 03 123 353 8 484 28 488 1000 679 475 12 299all 123 353 8 484 28 488 1000 679 475 12 299
Daman & Diu 1 0 0 0 0 0 0 0 0 0 0 02 0 0 0 0 0 0 0 0 0 0 03 172 184 110 466 12 522 1000 815 601 8 209all 172 184 110 466 12 522 1000 815 601 8 209
Lakshadweep 1 0 0 0 0 0 0 0 0 0 0 02 0 0 0 0 0 0 0 0 0 0 03 199 194 56 449 46 505 1000 262 202 16 564all 199 194 56 449 46 505 1000 262 202 16 564
Pondicherry 1 0 0 0 0 0 0 0 0 0 0 02 120 267 97 484 16 499 1000 5016 4007 38 8483 114 260 109 483 25 493 1000 1819 1296 18 449all 119 265 100 484 18 498 1000 6835 5303 56 1297
all- India 1 175 244 44 463 22 516 1000 707569 537391 745 178742 184 198 74 456 20 523 1000 1295632 957660 2373 597213 215 142 116 473 20 508 1000 784555 559622 2134 52895all 190 195 78 462 20 517 1000 2787755 2054673 5252 130490
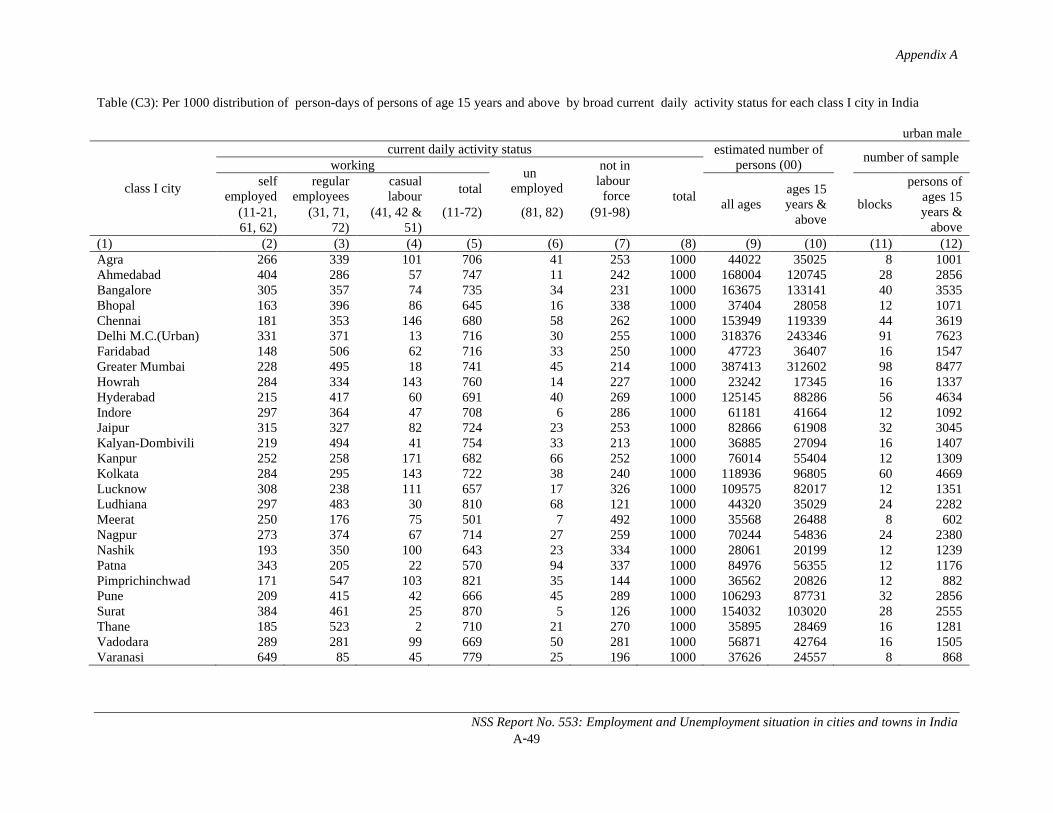
Appendix A
NSS Report No. 553: Employment and Unemployment situation in cities and towns in IndiaA-49
Table (C3): Per 1000 distribution of person-days of persons of age 15 years and above by broad current daily activity status for each class I city in India
urban male
class I city
current daily activity status estimated number of persons (00)
number of sampleworking
unemployed
not in labour
force totalself
employedregular
employeescasual labour
totalall ages
ages 15 years &
aboveblocks
persons of ages 15 years &
above(11-21, 61, 62)
(31, 71, 72)
(41, 42 & 51)
(11-72) (81, 82) (91-98)
(1) (2) (3) (4) (5) (6) (7) (8) (9) (10) (11) (12)Agra 266 339 101 706 41 253 1000 44022 35025 8 1001Ahmedabad 404 286 57 747 11 242 1000 168004 120745 28 2856Bangalore 305 357 74 735 34 231 1000 163675 133141 40 3535Bhopal 163 396 86 645 16 338 1000 37404 28058 12 1071Chennai 181 353 146 680 58 262 1000 153949 119339 44 3619Delhi M.C.(Urban) 331 371 13 716 30 255 1000 318376 243346 91 7623Faridabad 148 506 62 716 33 250 1000 47723 36407 16 1547Greater Mumbai 228 495 18 741 45 214 1000 387413 312602 98 8477Howrah 284 334 143 760 14 227 1000 23242 17345 16 1337Hyderabad 215 417 60 691 40 269 1000 125145 88286 56 4634Indore 297 364 47 708 6 286 1000 61181 41664 12 1092Jaipur 315 327 82 724 23 253 1000 82866 61908 32 3045Kalyan-Dombivili 219 494 41 754 33 213 1000 36885 27094 16 1407Kanpur 252 258 171 682 66 252 1000 76014 55404 12 1309Kolkata 284 295 143 722 38 240 1000 118936 96805 60 4669Lucknow 308 238 111 657 17 326 1000 109575 82017 12 1351Ludhiana 297 483 30 810 68 121 1000 44320 35029 24 2282Meerat 250 176 75 501 7 492 1000 35568 26488 8 602Nagpur 273 374 67 714 27 259 1000 70244 54836 24 2380Nashik 193 350 100 643 23 334 1000 28061 20199 12 1239Patna 343 205 22 570 94 337 1000 84976 56355 12 1176Pimprichinchwad 171 547 103 821 35 144 1000 36562 20826 12 882Pune 209 415 42 666 45 289 1000 106293 87731 32 2856Surat 384 461 25 870 5 126 1000 154032 103020 28 2555Thane 185 523 2 710 21 270 1000 35895 28469 16 1281Vadodara 289 281 99 669 50 281 1000 56871 42764 16 1505Varanasi 649 85 45 779 25 196 1000 37626 24557 8 868
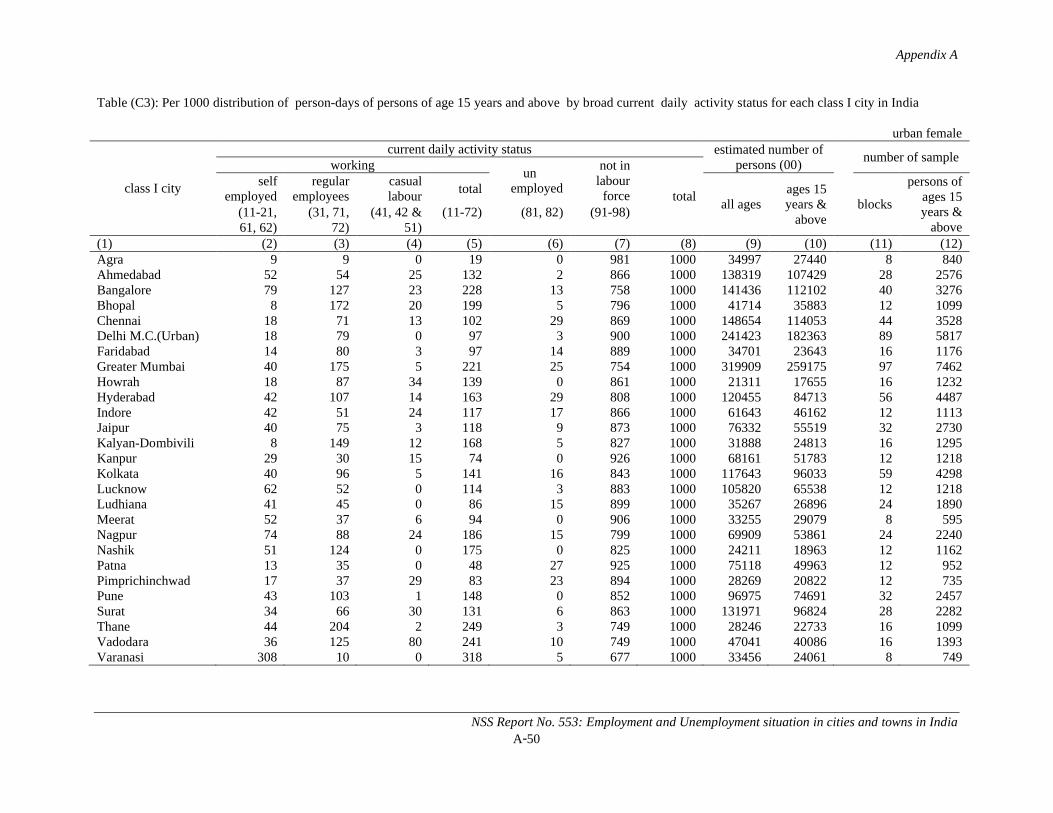
Appendix A
NSS Report No. 553: Employment and Unemployment situation in cities and towns in IndiaA-50
Table (C3): Per 1000 distribution of person-days of persons of age 15 years and above by broad current daily activity status for each class I city in India
urban female
class I city
current daily activity status estimated number of persons (00)
number of sampleworking
unemployed
not in labour
force totalself
employedregular
employeescasual labour
totalall ages
ages 15 years &
aboveblocks
persons of ages 15 years &
above(11-21, 61, 62)
(31, 71, 72)
(41, 42 & 51)
(11-72) (81, 82) (91-98)
(1) (2) (3) (4) (5) (6) (7) (8) (9) (10) (11) (12)Agra 9 9 0 19 0 981 1000 34997 27440 8 840Ahmedabad 52 54 25 132 2 866 1000 138319 107429 28 2576Bangalore 79 127 23 228 13 758 1000 141436 112102 40 3276Bhopal 8 172 20 199 5 796 1000 41714 35883 12 1099Chennai 18 71 13 102 29 869 1000 148654 114053 44 3528Delhi M.C.(Urban) 18 79 0 97 3 900 1000 241423 182363 89 5817Faridabad 14 80 3 97 14 889 1000 34701 23643 16 1176Greater Mumbai 40 175 5 221 25 754 1000 319909 259175 97 7462Howrah 18 87 34 139 0 861 1000 21311 17655 16 1232Hyderabad 42 107 14 163 29 808 1000 120455 84713 56 4487Indore 42 51 24 117 17 866 1000 61643 46162 12 1113Jaipur 40 75 3 118 9 873 1000 76332 55519 32 2730Kalyan-Dombivili 8 149 12 168 5 827 1000 31888 24813 16 1295Kanpur 29 30 15 74 0 926 1000 68161 51783 12 1218Kolkata 40 96 5 141 16 843 1000 117643 96033 59 4298Lucknow 62 52 0 114 3 883 1000 105820 65538 12 1218Ludhiana 41 45 0 86 15 899 1000 35267 26896 24 1890Meerat 52 37 6 94 0 906 1000 33255 29079 8 595Nagpur 74 88 24 186 15 799 1000 69909 53861 24 2240Nashik 51 124 0 175 0 825 1000 24211 18963 12 1162Patna 13 35 0 48 27 925 1000 75118 49963 12 952Pimprichinchwad 17 37 29 83 23 894 1000 28269 20822 12 735Pune 43 103 1 148 0 852 1000 96975 74691 32 2457Surat 34 66 30 131 6 863 1000 131971 96824 28 2282Thane 44 204 2 249 3 749 1000 28246 22733 16 1099Vadodara 36 125 80 241 10 749 1000 47041 40086 16 1393Varanasi 308 10 0 318 5 677 1000 33456 24061 8 749
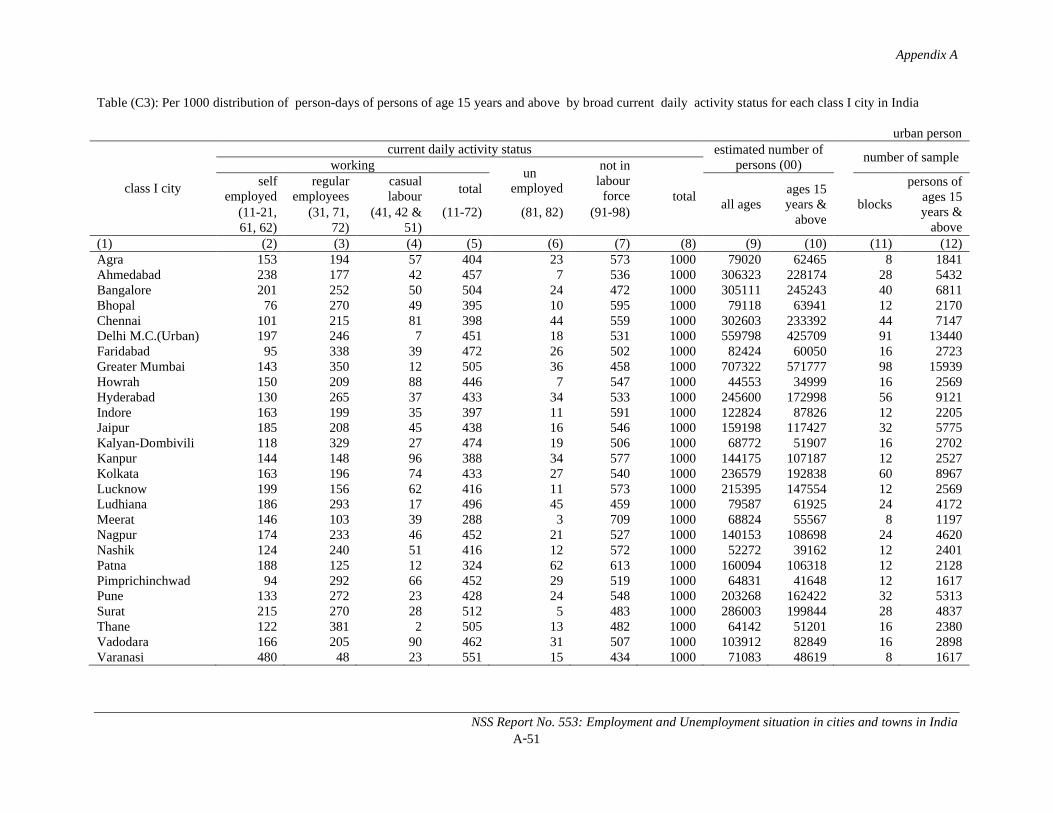
Appendix A
NSS Report No. 553: Employment and Unemployment situation in cities and towns in IndiaA-51
Table (C3): Per 1000 distribution of person-days of persons of age 15 years and above by broad current daily activity status for each class I city in India
urban person
class I city
current daily activity status estimated number of persons (00)
number of sampleworking
unemployed
not in labour
force totalself
employedregular
employeescasual labour
totalall ages
ages 15 years &
aboveblocks
persons of ages 15 years &
above(11-21, 61, 62)
(31, 71, 72)
(41, 42 & 51)
(11-72) (81, 82) (91-98)
(1) (2) (3) (4) (5) (6) (7) (8) (9) (10) (11) (12)Agra 153 194 57 404 23 573 1000 79020 62465 8 1841Ahmedabad 238 177 42 457 7 536 1000 306323 228174 28 5432Bangalore 201 252 50 504 24 472 1000 305111 245243 40 6811Bhopal 76 270 49 395 10 595 1000 79118 63941 12 2170Chennai 101 215 81 398 44 559 1000 302603 233392 44 7147Delhi M.C.(Urban) 197 246 7 451 18 531 1000 559798 425709 91 13440Faridabad 95 338 39 472 26 502 1000 82424 60050 16 2723Greater Mumbai 143 350 12 505 36 458 1000 707322 571777 98 15939Howrah 150 209 88 446 7 547 1000 44553 34999 16 2569Hyderabad 130 265 37 433 34 533 1000 245600 172998 56 9121Indore 163 199 35 397 11 591 1000 122824 87826 12 2205Jaipur 185 208 45 438 16 546 1000 159198 117427 32 5775Kalyan-Dombivili 118 329 27 474 19 506 1000 68772 51907 16 2702Kanpur 144 148 96 388 34 577 1000 144175 107187 12 2527Kolkata 163 196 74 433 27 540 1000 236579 192838 60 8967Lucknow 199 156 62 416 11 573 1000 215395 147554 12 2569Ludhiana 186 293 17 496 45 459 1000 79587 61925 24 4172Meerat 146 103 39 288 3 709 1000 68824 55567 8 1197Nagpur 174 233 46 452 21 527 1000 140153 108698 24 4620Nashik 124 240 51 416 12 572 1000 52272 39162 12 2401Patna 188 125 12 324 62 613 1000 160094 106318 12 2128Pimprichinchwad 94 292 66 452 29 519 1000 64831 41648 12 1617Pune 133 272 23 428 24 548 1000 203268 162422 32 5313Surat 215 270 28 512 5 483 1000 286003 199844 28 4837Thane 122 381 2 505 13 482 1000 64142 51201 16 2380Vadodara 166 205 90 462 31 507 1000 103912 82849 16 2898Varanasi 480 48 23 551 15 434 1000 71083 48619 8 1617

Appendix A
NSS Report No. 553: Employment and Unemployment situation in cities and towns in IndiaA-52
Table (C3): Per 1000 distribution of person-days of persons of age 15 years and above by broad current daily activity status for different size class of towns for each State/UT
urban male
state/ all- Indiasize class of town
current daily activity status estimated number of persons (00)
number of sampleworking
unemployed
not in labour
force totalself
employedregular
employeescasual labour
totalall ages
ages 15 years &
aboveblocks
persons of ages
15 years & above
(11-21, 61, 62)
(31, 71, 72)
(41, 42 & 51)
(11-72) (81, 82) (91-98)
(1) (2) (3) (4) (5) (6) (7) (8) (9) (10) (11) (12) (13)Andhra Pradesh 1 215 417 60 691 40 269 1000 125145 88286 56 4634
2 251 364 92 707 29 264 1000 538556 397626 248 191523 308 241 180 728 40 231 1000 104715 78597 68 4914all 253 355 99 708 32 260 1000 768416 564509 372 28700
Arunachal Pradesh 1 0 0 0 0 0 0 0 0 0 0 02 0 0 0 0 0 0 0 0 0 0 03 241 373 49 663 26 311 1000 8094 5266 75 6237all 241 373 49 663 26 311 1000 8094 5266 75 6237
Assam 1 0 0 0 0 0 0 0 0 0 0 02 274 388 23 685 20 294 1000 46935 35419 25 21983 389 262 44 695 43 262 1000 55987 40195 79 6825all 335 321 34 690 32 277 1000 102922 75614 104 9023
Bihar 1 343 205 22 570 94 337 1000 84976 56355 12 11762 442 130 67 638 46 317 1000 105397 65757 64 58033 445 118 194 757 23 220 1000 128351 78130 83 7749all 415 146 104 665 50 284 1000 318724 200242 159 14728
Chhattisgarh 1 0 0 0 0 0 0 0 0 0 0 02 221 303 132 655 36 308 1000 93496 65230 46 41653 318 243 161 722 32 246 1000 47453 31468 46 4130all 253 283 141 677 35 288 1000 140949 96698 92 8295
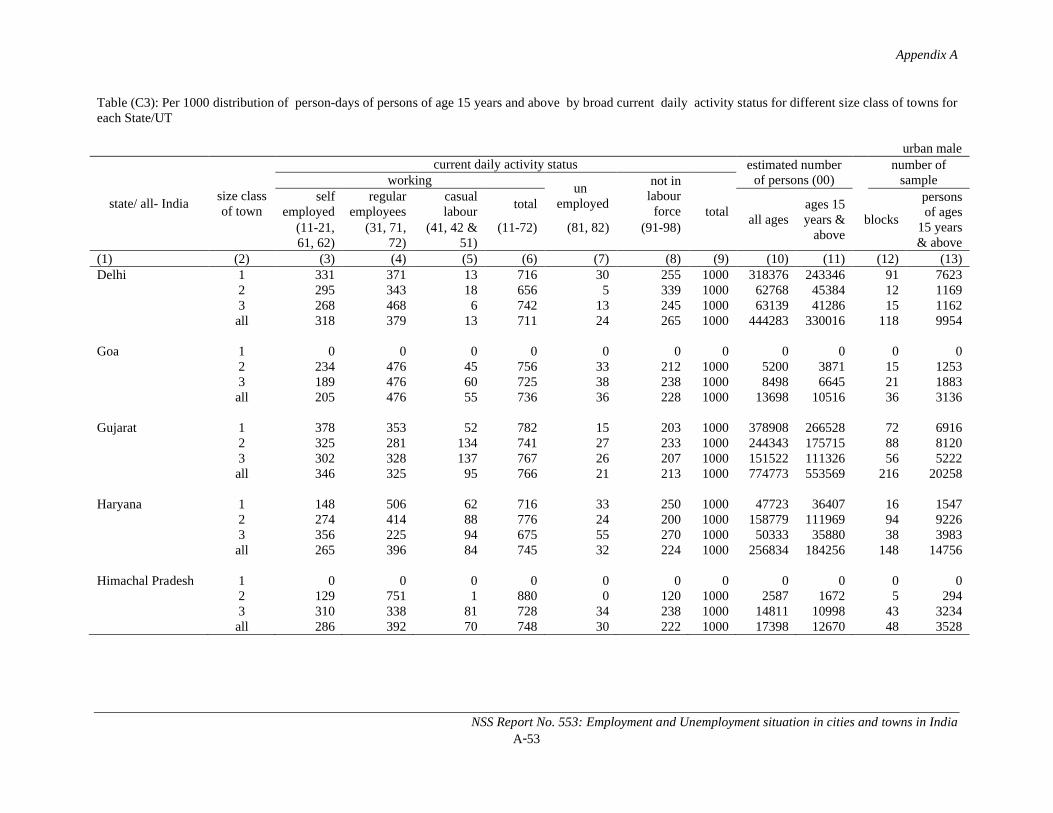
Appendix A
NSS Report No. 553: Employment and Unemployment situation in cities and towns in IndiaA-53
Table (C3): Per 1000 distribution of person-days of persons of age 15 years and above by broad current daily activity status for different size class of towns for each State/UT
urban male
state/ all- Indiasize class of town
current daily activity status estimated number of persons (00)
number of sampleworking
unemployed
not in labour
force totalself
employedregular
employeescasual labour
totalall ages
ages 15 years &
aboveblocks
persons of ages
15 years & above
(11-21, 61, 62)
(31, 71, 72)
(41, 42 & 51)
(11-72) (81, 82) (91-98)
(1) (2) (3) (4) (5) (6) (7) (8) (9) (10) (11) (12) (13)Delhi 1 331 371 13 716 30 255 1000 318376 243346 91 7623
2 295 343 18 656 5 339 1000 62768 45384 12 11693 268 468 6 742 13 245 1000 63139 41286 15 1162all 318 379 13 711 24 265 1000 444283 330016 118 9954
Goa 1 0 0 0 0 0 0 0 0 0 0 02 234 476 45 756 33 212 1000 5200 3871 15 12533 189 476 60 725 38 238 1000 8498 6645 21 1883all 205 476 55 736 36 228 1000 13698 10516 36 3136
Gujarat 1 378 353 52 782 15 203 1000 378908 266528 72 69162 325 281 134 741 27 233 1000 244343 175715 88 81203 302 328 137 767 26 207 1000 151522 111326 56 5222all 346 325 95 766 21 213 1000 774773 553569 216 20258
Haryana 1 148 506 62 716 33 250 1000 47723 36407 16 15472 274 414 88 776 24 200 1000 158779 111969 94 92263 356 225 94 675 55 270 1000 50333 35880 38 3983all 265 396 84 745 32 224 1000 256834 184256 148 14756
Himachal Pradesh 1 0 0 0 0 0 0 0 0 0 0 02 129 751 1 880 0 120 1000 2587 1672 5 2943 310 338 81 728 34 238 1000 14811 10998 43 3234all 286 392 70 748 30 222 1000 17398 12670 48 3528
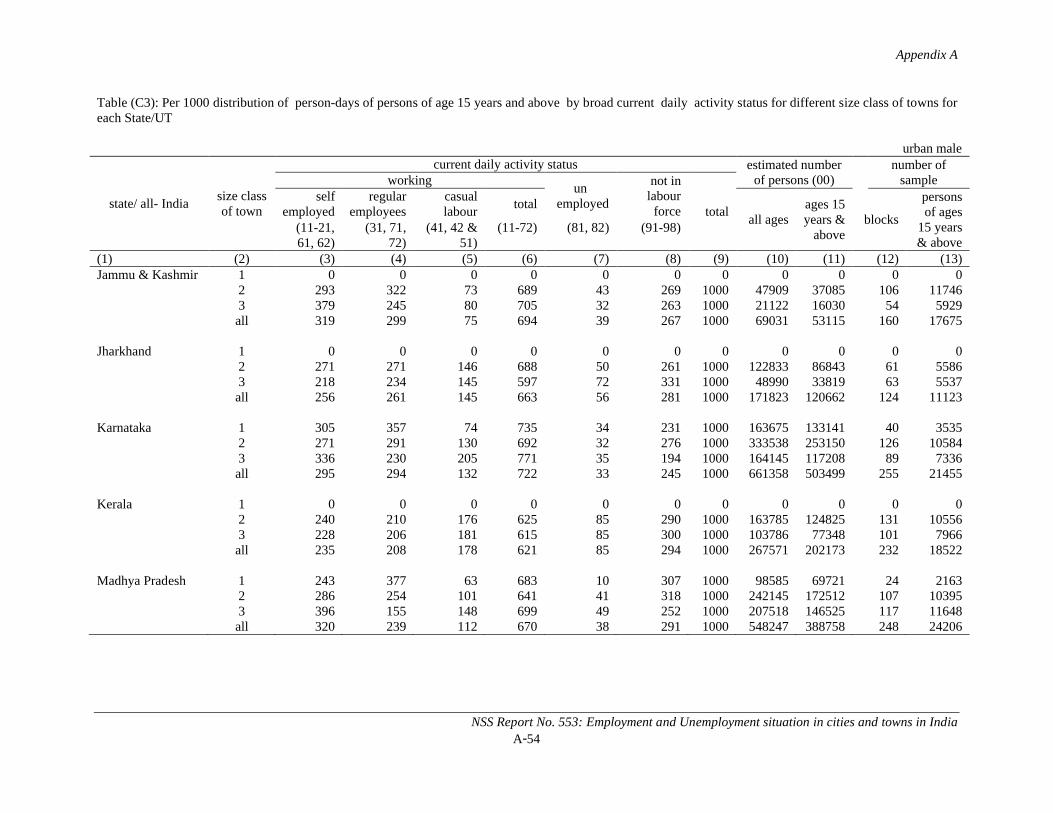
Appendix A
NSS Report No. 553: Employment and Unemployment situation in cities and towns in IndiaA-54
Table (C3): Per 1000 distribution of person-days of persons of age 15 years and above by broad current daily activity status for different size class of towns for each State/UT
urban male
state/ all- Indiasize class of town
current daily activity status estimated number of persons (00)
number of sampleworking
unemployed
not in labour
force totalself
employedregular
employeescasual labour
totalall ages
ages 15 years &
aboveblocks
persons of ages
15 years & above
(11-21, 61, 62)
(31, 71, 72)
(41, 42 & 51)
(11-72) (81, 82) (91-98)
(1) (2) (3) (4) (5) (6) (7) (8) (9) (10) (11) (12) (13)Jammu & Kashmir 1 0 0 0 0 0 0 0 0 0 0 0
2 293 322 73 689 43 269 1000 47909 37085 106 117463 379 245 80 705 32 263 1000 21122 16030 54 5929all 319 299 75 694 39 267 1000 69031 53115 160 17675
Jharkhand 1 0 0 0 0 0 0 0 0 0 0 02 271 271 146 688 50 261 1000 122833 86843 61 55863 218 234 145 597 72 331 1000 48990 33819 63 5537all 256 261 145 663 56 281 1000 171823 120662 124 11123
Karnataka 1 305 357 74 735 34 231 1000 163675 133141 40 35352 271 291 130 692 32 276 1000 333538 253150 126 105843 336 230 205 771 35 194 1000 164145 117208 89 7336all 295 294 132 722 33 245 1000 661358 503499 255 21455
Kerala 1 0 0 0 0 0 0 0 0 0 0 02 240 210 176 625 85 290 1000 163785 124825 131 105563 228 206 181 615 85 300 1000 103786 77348 101 7966all 235 208 178 621 85 294 1000 267571 202173 232 18522
Madhya Pradesh 1 243 377 63 683 10 307 1000 98585 69721 24 21632 286 254 101 641 41 318 1000 242145 172512 107 103953 396 155 148 699 49 252 1000 207518 146525 117 11648all 320 239 112 670 38 291 1000 548247 388758 248 24206
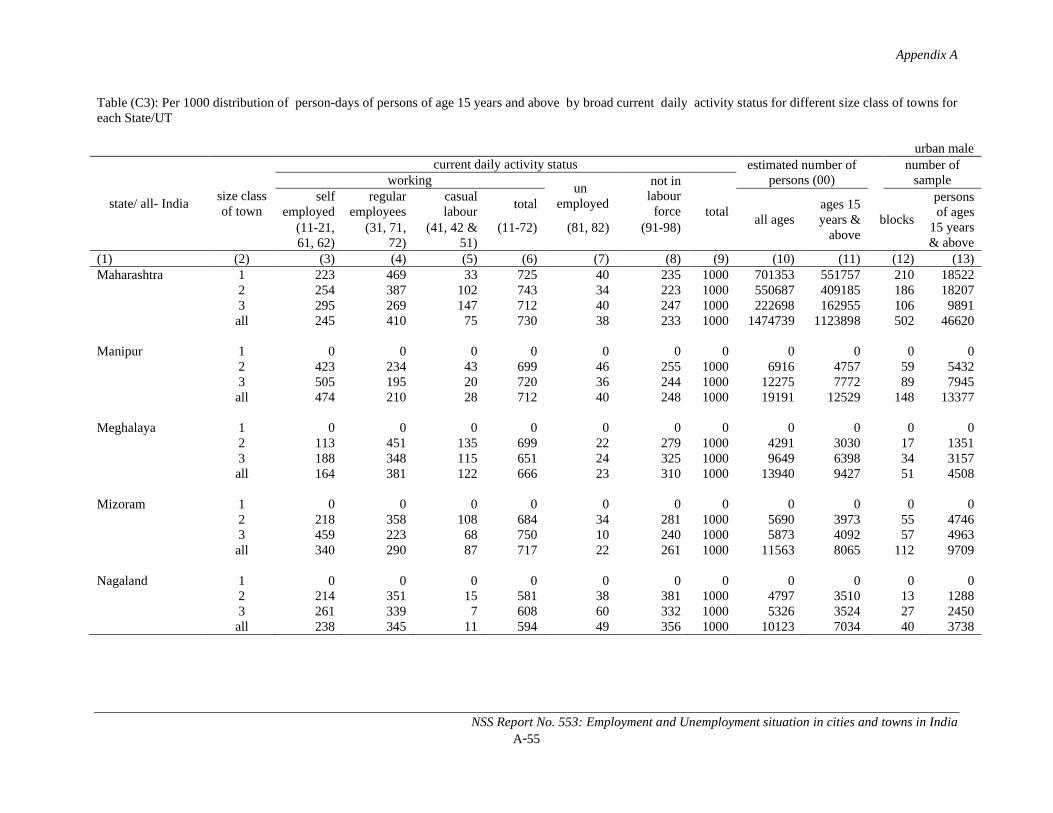
Appendix A
NSS Report No. 553: Employment and Unemployment situation in cities and towns in IndiaA-55
Table (C3): Per 1000 distribution of person-days of persons of age 15 years and above by broad current daily activity status for different size class of towns for each State/UT
urban male
state/ all- Indiasize class of town
current daily activity status estimated number of persons (00)
number of sampleworking
unemployed
not in labour
force totalself
employedregular
employeescasual labour
totalall ages
ages 15 years &
aboveblocks
persons of ages
15 years & above
(11-21, 61, 62)
(31, 71, 72)
(41, 42 & 51)
(11-72) (81, 82) (91-98)
(1) (2) (3) (4) (5) (6) (7) (8) (9) (10) (11) (12) (13)Maharashtra 1 223 469 33 725 40 235 1000 701353 551757 210 18522
2 254 387 102 743 34 223 1000 550687 409185 186 182073 295 269 147 712 40 247 1000 222698 162955 106 9891all 245 410 75 730 38 233 1000 1474739 1123898 502 46620
Manipur 1 0 0 0 0 0 0 0 0 0 0 02 423 234 43 699 46 255 1000 6916 4757 59 54323 505 195 20 720 36 244 1000 12275 7772 89 7945all 474 210 28 712 40 248 1000 19191 12529 148 13377
Meghalaya 1 0 0 0 0 0 0 0 0 0 0 02 113 451 135 699 22 279 1000 4291 3030 17 13513 188 348 115 651 24 325 1000 9649 6398 34 3157all 164 381 122 666 23 310 1000 13940 9427 51 4508
Mizoram 1 0 0 0 0 0 0 0 0 0 0 02 218 358 108 684 34 281 1000 5690 3973 55 47463 459 223 68 750 10 240 1000 5873 4092 57 4963all 340 290 87 717 22 261 1000 11563 8065 112 9709
Nagaland 1 0 0 0 0 0 0 0 0 0 0 02 214 351 15 581 38 381 1000 4797 3510 13 12883 261 339 7 608 60 332 1000 5326 3524 27 2450all 238 345 11 594 49 356 1000 10123 7034 40 3738

Appendix A
NSS Report No. 553: Employment and Unemployment situation in cities and towns in IndiaA-56
Table (C3): Per 1000 distribution of person-days of persons of age 15 years and above by broad current daily activity status for different size class of towns for each State/UT
urban male
state/ all- Indiasize class of town
current daily activity status estimated number of persons (00)
number of sampleworking
unemployed
not in labour
force totalself
employedregular
employeescasual labour
totalall ages
ages 15 years &
aboveblocks
persons of ages
15 years & above
(11-21, 61, 62)
(31, 71, 72)
(41, 42 & 51)
(11-72) (81, 82) (91-98)
(1) (2) (3) (4) (5) (6) (7) (8) (9) (10) (11) (12) (13)Orissa 1 0 0 0 0 0 0 0 0 0 0 0
2 299 314 114 727 36 237 1000 95543 72152 49 42773 318 256 162 736 55 208 1000 80808 58743 82 6881all 308 288 136 731 45 224 1000 176351 130895 131 11158
Punjab 1 297 483 30 810 68 121 1000 44320 35029 24 22822 291 325 98 714 37 250 1000 160816 122697 105 104723 342 215 168 725 70 204 1000 97595 69415 66 6398all 308 316 109 732 52 216 1000 302732 227141 195 19152
Rajasthan 1 315 327 82 724 23 253 1000 82866 61908 32 30452 315 289 87 691 29 280 1000 282184 195416 94 93453 370 196 130 695 22 282 1000 158699 109145 69 6853all 331 268 99 698 26 276 1000 523749 366469 195 19243
Sikkim 1 0 0 0 0 0 0 0 0 0 0 02 0 0 0 0 0 0 0 0 0 0 03 390 457 2 849 2 149 1000 2369 1676 20 1351all 390 457 2 849 2 149 1000 2369 1676 20 1351
Tamil Nadu 1 181 353 146 680 58 262 1000 153949 119339 44 36192 245 364 123 732 41 227 1000 364126 278680 151 112703 243 272 188 704 62 235 1000 487008 358103 220 16065all 234 319 157 710 54 236 1000 1005083 756121 415 30954
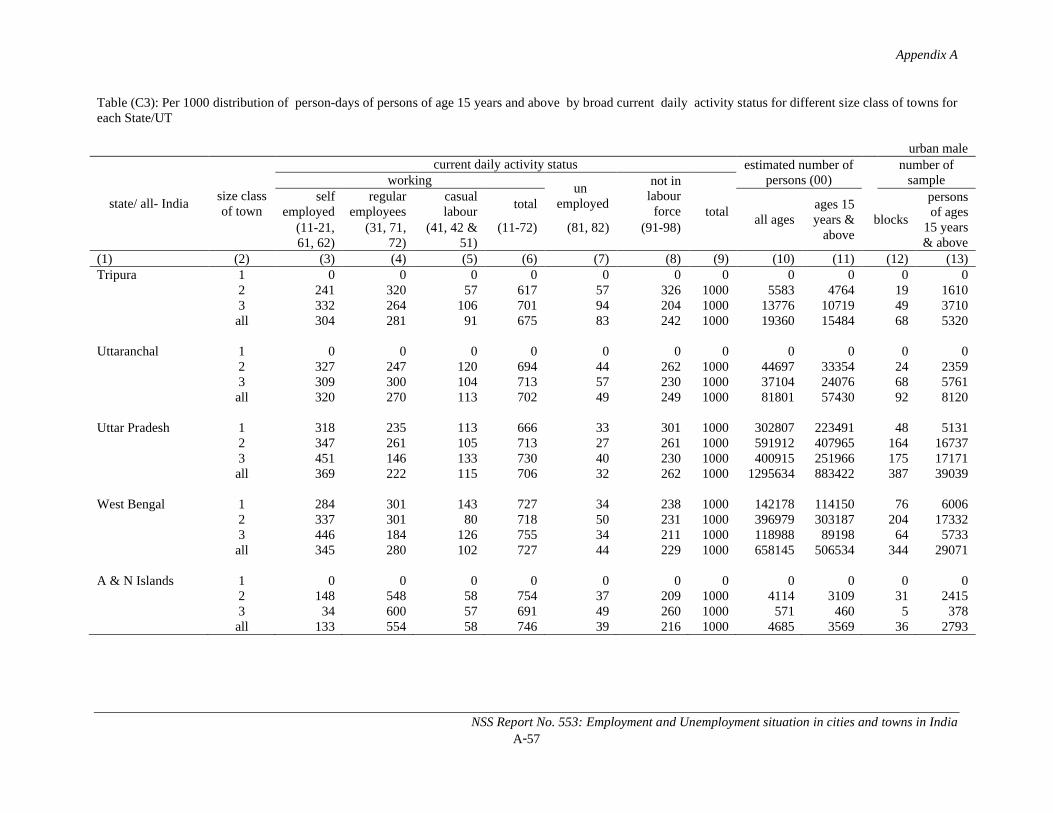
Appendix A
NSS Report No. 553: Employment and Unemployment situation in cities and towns in IndiaA-57
Table (C3): Per 1000 distribution of person-days of persons of age 15 years and above by broad current daily activity status for different size class of towns for each State/UT
urban male
state/ all- Indiasize class of town
current daily activity status estimated number of persons (00)
number of sampleworking
unemployed
not in labour
force totalself
employedregular
employeescasual labour
totalall ages
ages 15 years &
aboveblocks
persons of ages
15 years & above
(11-21, 61, 62)
(31, 71, 72)
(41, 42 & 51)
(11-72) (81, 82) (91-98)
(1) (2) (3) (4) (5) (6) (7) (8) (9) (10) (11) (12) (13)Tripura 1 0 0 0 0 0 0 0 0 0 0 0
2 241 320 57 617 57 326 1000 5583 4764 19 16103 332 264 106 701 94 204 1000 13776 10719 49 3710all 304 281 91 675 83 242 1000 19360 15484 68 5320
Uttaranchal 1 0 0 0 0 0 0 0 0 0 0 02 327 247 120 694 44 262 1000 44697 33354 24 23593 309 300 104 713 57 230 1000 37104 24076 68 5761all 320 270 113 702 49 249 1000 81801 57430 92 8120
Uttar Pradesh 1 318 235 113 666 33 301 1000 302807 223491 48 51312 347 261 105 713 27 261 1000 591912 407965 164 167373 451 146 133 730 40 230 1000 400915 251966 175 17171all 369 222 115 706 32 262 1000 1295634 883422 387 39039
West Bengal 1 284 301 143 727 34 238 1000 142178 114150 76 60062 337 301 80 718 50 231 1000 396979 303187 204 173323 446 184 126 755 34 211 1000 118988 89198 64 5733all 345 280 102 727 44 229 1000 658145 506534 344 29071
A & N Islands 1 0 0 0 0 0 0 0 0 0 0 02 148 548 58 754 37 209 1000 4114 3109 31 24153 34 600 57 691 49 260 1000 571 460 5 378all 133 554 58 746 39 216 1000 4685 3569 36 2793
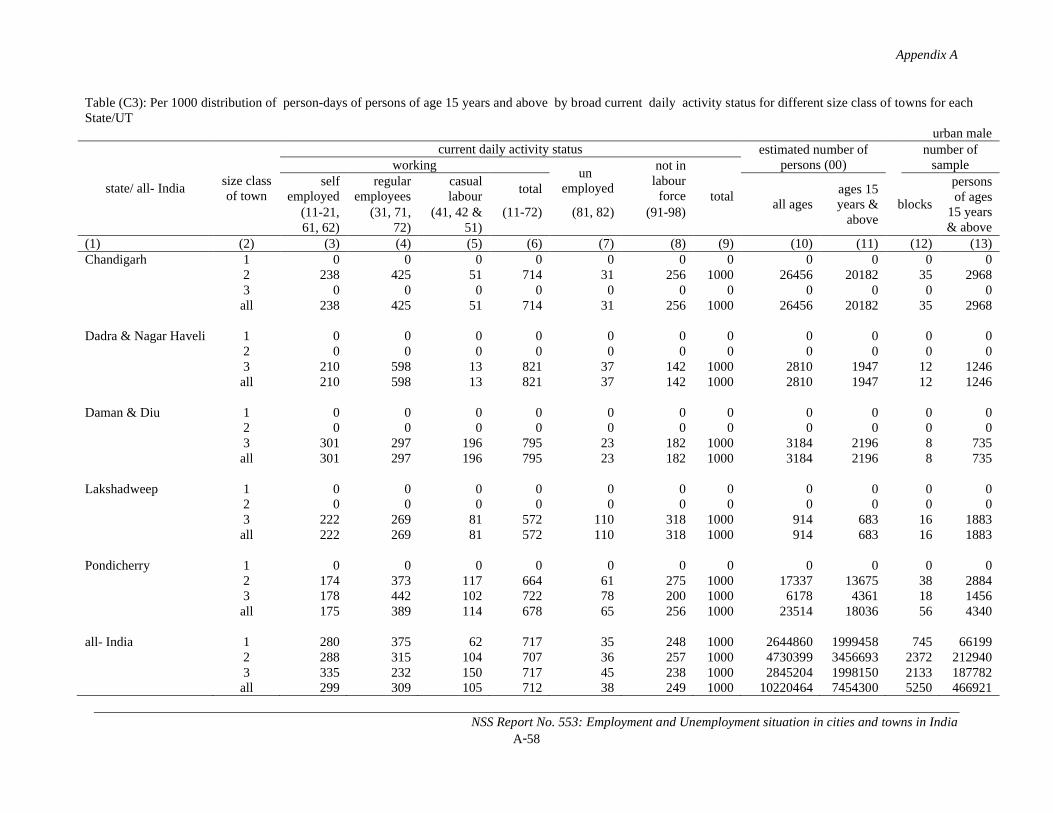
Appendix A
NSS Report No. 553: Employment and Unemployment situation in cities and towns in IndiaA-58
Table (C3): Per 1000 distribution of person-days of persons of age 15 years and above by broad current daily activity status for different size class of towns for each State/UT
urban male
state/ all- Indiasize class of town
current daily activity status estimated number of persons (00)
number of sampleworking
unemployed
not in labour
force totalself
employedregular
employeescasual labour
totalall ages
ages 15 years &
aboveblocks
persons of ages
15 years & above
(11-21, 61, 62)
(31, 71, 72)
(41, 42 & 51)
(11-72) (81, 82) (91-98)
(1) (2) (3) (4) (5) (6) (7) (8) (9) (10) (11) (12) (13)Chandigarh 1 0 0 0 0 0 0 0 0 0 0 0
2 238 425 51 714 31 256 1000 26456 20182 35 29683 0 0 0 0 0 0 0 0 0 0 0all 238 425 51 714 31 256 1000 26456 20182 35 2968
Dadra & Nagar Haveli 1 0 0 0 0 0 0 0 0 0 0 02 0 0 0 0 0 0 0 0 0 0 03 210 598 13 821 37 142 1000 2810 1947 12 1246all 210 598 13 821 37 142 1000 2810 1947 12 1246
Daman & Diu 1 0 0 0 0 0 0 0 0 0 0 02 0 0 0 0 0 0 0 0 0 0 03 301 297 196 795 23 182 1000 3184 2196 8 735all 301 297 196 795 23 182 1000 3184 2196 8 735
Lakshadweep 1 0 0 0 0 0 0 0 0 0 0 02 0 0 0 0 0 0 0 0 0 0 03 222 269 81 572 110 318 1000 914 683 16 1883all 222 269 81 572 110 318 1000 914 683 16 1883
Pondicherry 1 0 0 0 0 0 0 0 0 0 0 02 174 373 117 664 61 275 1000 17337 13675 38 28843 178 442 102 722 78 200 1000 6178 4361 18 1456all 175 389 114 678 65 256 1000 23514 18036 56 4340
all- India 1 280 375 62 717 35 248 1000 2644860 1999458 745 661992 288 315 104 707 36 257 1000 4730399 3456693 2372 2129403 335 232 150 717 45 238 1000 2845204 1998150 2133 187782all 299 309 105 712 38 249 1000 10220464 7454300 5250 466921
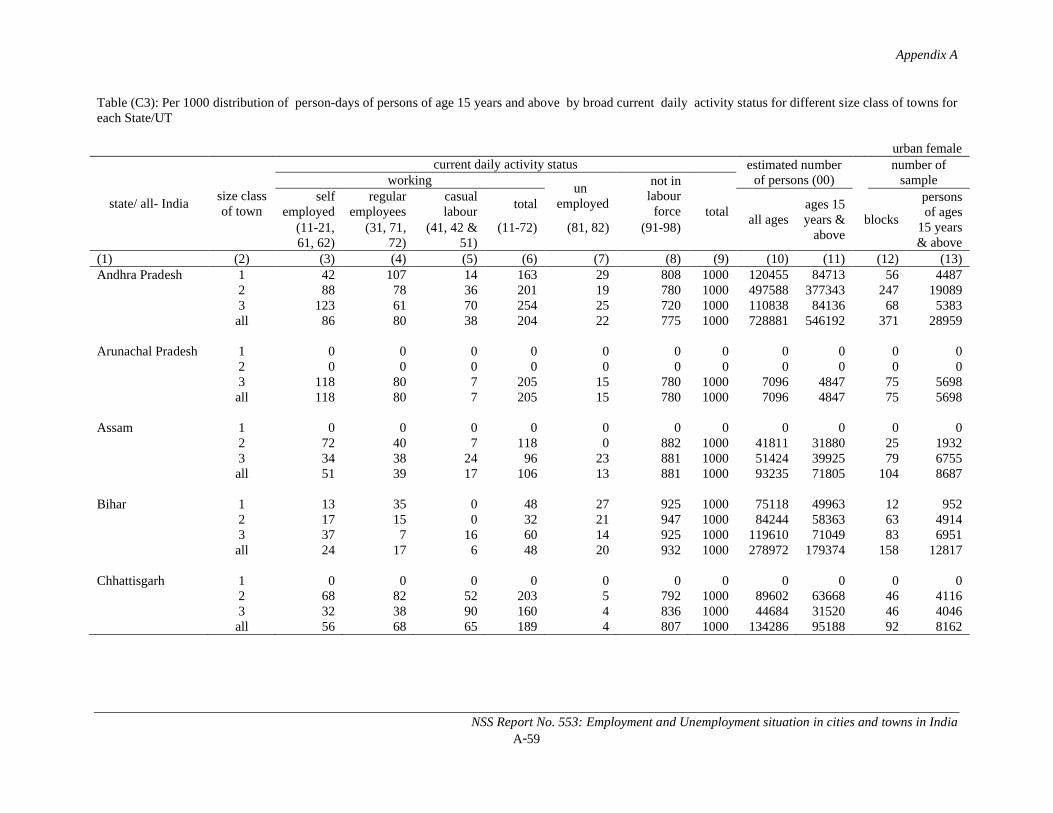
Appendix A
NSS Report No. 553: Employment and Unemployment situation in cities and towns in IndiaA-59
Table (C3): Per 1000 distribution of person-days of persons of age 15 years and above by broad current daily activity status for different size class of towns for each State/UT
urban female
state/ all- Indiasize class of town
current daily activity status estimated number of persons (00)
number of sampleworking
unemployed
not in labour
force totalself
employedregular
employeescasual labour
totalall ages
ages 15 years &
aboveblocks
persons of ages
15 years & above
(11-21, 61, 62)
(31, 71, 72)
(41, 42 & 51)
(11-72) (81, 82) (91-98)
(1) (2) (3) (4) (5) (6) (7) (8) (9) (10) (11) (12) (13)Andhra Pradesh 1 42 107 14 163 29 808 1000 120455 84713 56 4487
2 88 78 36 201 19 780 1000 497588 377343 247 190893 123 61 70 254 25 720 1000 110838 84136 68 5383all 86 80 38 204 22 775 1000 728881 546192 371 28959
Arunachal Pradesh 1 0 0 0 0 0 0 0 0 0 0 02 0 0 0 0 0 0 0 0 0 0 03 118 80 7 205 15 780 1000 7096 4847 75 5698all 118 80 7 205 15 780 1000 7096 4847 75 5698
Assam 1 0 0 0 0 0 0 0 0 0 0 02 72 40 7 118 0 882 1000 41811 31880 25 19323 34 38 24 96 23 881 1000 51424 39925 79 6755all 51 39 17 106 13 881 1000 93235 71805 104 8687
Bihar 1 13 35 0 48 27 925 1000 75118 49963 12 9522 17 15 0 32 21 947 1000 84244 58363 63 49143 37 7 16 60 14 925 1000 119610 71049 83 6951all 24 17 6 48 20 932 1000 278972 179374 158 12817
Chhattisgarh 1 0 0 0 0 0 0 0 0 0 0 02 68 82 52 203 5 792 1000 89602 63668 46 41163 32 38 90 160 4 836 1000 44684 31520 46 4046all 56 68 65 189 4 807 1000 134286 95188 92 8162
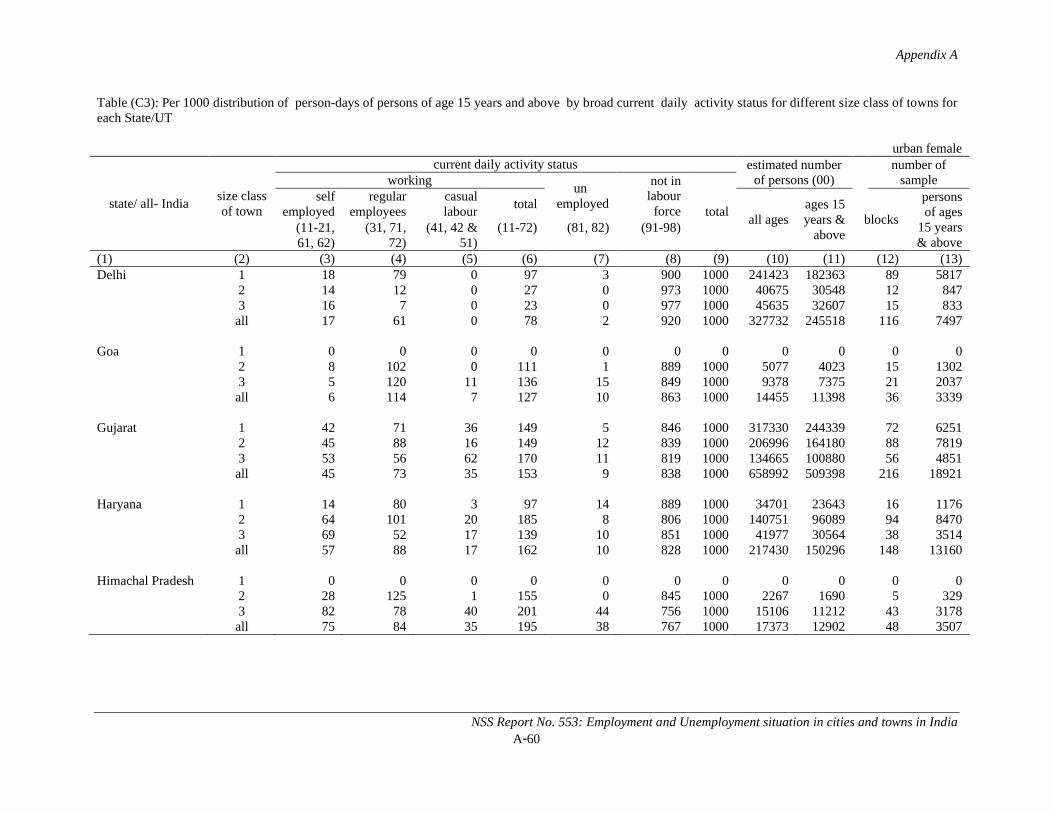
Appendix A
NSS Report No. 553: Employment and Unemployment situation in cities and towns in IndiaA-60
Table (C3): Per 1000 distribution of person-days of persons of age 15 years and above by broad current daily activity status for different size class of towns for each State/UT
urban female
state/ all- Indiasize class of town
current daily activity status estimated number of persons (00)
number of sampleworking
unemployed
not in labour
force totalself
employedregular
employeescasual labour
totalall ages
ages 15 years &
aboveblocks
persons of ages
15 years & above
(11-21, 61, 62)
(31, 71, 72)
(41, 42 & 51)
(11-72) (81, 82) (91-98)
(1) (2) (3) (4) (5) (6) (7) (8) (9) (10) (11) (12) (13)Delhi 1 18 79 0 97 3 900 1000 241423 182363 89 5817
2 14 12 0 27 0 973 1000 40675 30548 12 8473 16 7 0 23 0 977 1000 45635 32607 15 833all 17 61 0 78 2 920 1000 327732 245518 116 7497
Goa 1 0 0 0 0 0 0 0 0 0 0 02 8 102 0 111 1 889 1000 5077 4023 15 13023 5 120 11 136 15 849 1000 9378 7375 21 2037all 6 114 7 127 10 863 1000 14455 11398 36 3339
Gujarat 1 42 71 36 149 5 846 1000 317330 244339 72 62512 45 88 16 149 12 839 1000 206996 164180 88 78193 53 56 62 170 11 819 1000 134665 100880 56 4851all 45 73 35 153 9 838 1000 658992 509398 216 18921
Haryana 1 14 80 3 97 14 889 1000 34701 23643 16 11762 64 101 20 185 8 806 1000 140751 96089 94 84703 69 52 17 139 10 851 1000 41977 30564 38 3514all 57 88 17 162 10 828 1000 217430 150296 148 13160
Himachal Pradesh 1 0 0 0 0 0 0 0 0 0 0 02 28 125 1 155 0 845 1000 2267 1690 5 3293 82 78 40 201 44 756 1000 15106 11212 43 3178all 75 84 35 195 38 767 1000 17373 12902 48 3507

Appendix A
NSS Report No. 553: Employment and Unemployment situation in cities and towns in IndiaA-61
Table (C3): Per 1000 distribution of person-days of persons of age 15 years and above by broad current daily activity status for different size class of towns for each State/UT
urban female
state/ all- Indiasize class of town
current daily activity status estimated number of persons (00)
number of sampleworking
unemployed
not in labour
force totalself
employedregular
employeescasual labour
totalall ages
ages 15 years &
aboveblocks
persons of ages
15 years & above
(11-21, 61, 62)
(31, 71, 72)
(41, 42 & 51)
(11-72) (81, 82) (91-98)
(1) (2) (3) (4) (5) (6) (7) (8) (9) (10) (11) (12) (13)Jammu & Kashmir 1 0 0 0 0 0 0 0 0 0 0 0
2 59 82 6 146 26 827 1000 46103 36845 106 110743 62 61 18 142 21 838 1000 18665 14462 54 5474all 60 76 9 145 25 830 1000 64769 51307 160 16548
Jharkhand 1 0 0 0 0 0 0 0 0 0 0 02 27 63 26 116 20 864 1000 111532 76365 61 50403 26 34 15 75 24 902 1000 47380 29311 63 4942all 27 55 23 105 21 874 1000 158913 105677 124 9982
Karnataka 1 79 127 23 228 13 758 1000 141436 112102 40 32762 50 96 47 193 11 796 1000 312589 239169 125 107523 82 49 78 209 18 773 1000 151612 110907 89 7000all 65 93 48 206 13 781 1000 605637 462178 254 21028
Kerala 1 0 0 0 0 0 0 0 0 0 0 02 58 138 24 220 56 724 1000 178402 135357 131 120333 47 91 44 183 55 762 1000 114724 90618 101 9408all 54 119 32 205 56 740 1000 293126 225975 232 21441
Madhya Pradesh 1 27 104 22 153 11 836 1000 103357 82046 24 22122 59 55 18 133 13 854 1000 213405 155891 107 96953 91 39 42 172 4 824 1000 182977 128763 117 10500all 63 60 27 151 9 839 1000 499740 366700 248 22407
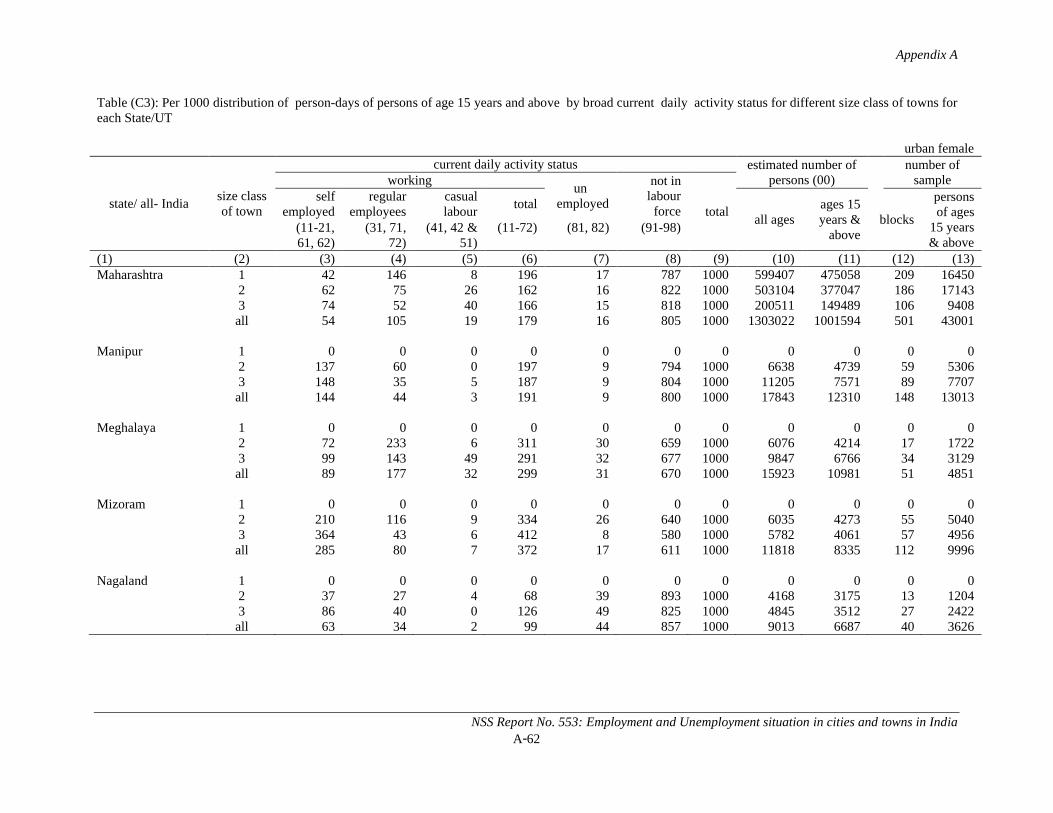
Appendix A
NSS Report No. 553: Employment and Unemployment situation in cities and towns in IndiaA-62
Table (C3): Per 1000 distribution of person-days of persons of age 15 years and above by broad current daily activity status for different size class of towns for each State/UT
urban female
state/ all- Indiasize class of town
current daily activity status estimated number of persons (00)
number of sampleworking
unemployed
not in labour
force totalself
employedregular
employeescasual labour
totalall ages
ages 15 years &
aboveblocks
persons of ages
15 years & above
(11-21, 61, 62)
(31, 71, 72)
(41, 42 & 51)
(11-72) (81, 82) (91-98)
(1) (2) (3) (4) (5) (6) (7) (8) (9) (10) (11) (12) (13)Maharashtra 1 42 146 8 196 17 787 1000 599407 475058 209 16450
2 62 75 26 162 16 822 1000 503104 377047 186 171433 74 52 40 166 15 818 1000 200511 149489 106 9408all 54 105 19 179 16 805 1000 1303022 1001594 501 43001
Manipur 1 0 0 0 0 0 0 0 0 0 0 02 137 60 0 197 9 794 1000 6638 4739 59 53063 148 35 5 187 9 804 1000 11205 7571 89 7707all 144 44 3 191 9 800 1000 17843 12310 148 13013
Meghalaya 1 0 0 0 0 0 0 0 0 0 0 02 72 233 6 311 30 659 1000 6076 4214 17 17223 99 143 49 291 32 677 1000 9847 6766 34 3129all 89 177 32 299 31 670 1000 15923 10981 51 4851
Mizoram 1 0 0 0 0 0 0 0 0 0 0 02 210 116 9 334 26 640 1000 6035 4273 55 50403 364 43 6 412 8 580 1000 5782 4061 57 4956all 285 80 7 372 17 611 1000 11818 8335 112 9996
Nagaland 1 0 0 0 0 0 0 0 0 0 0 02 37 27 4 68 39 893 1000 4168 3175 13 12043 86 40 0 126 49 825 1000 4845 3512 27 2422all 63 34 2 99 44 857 1000 9013 6687 40 3626
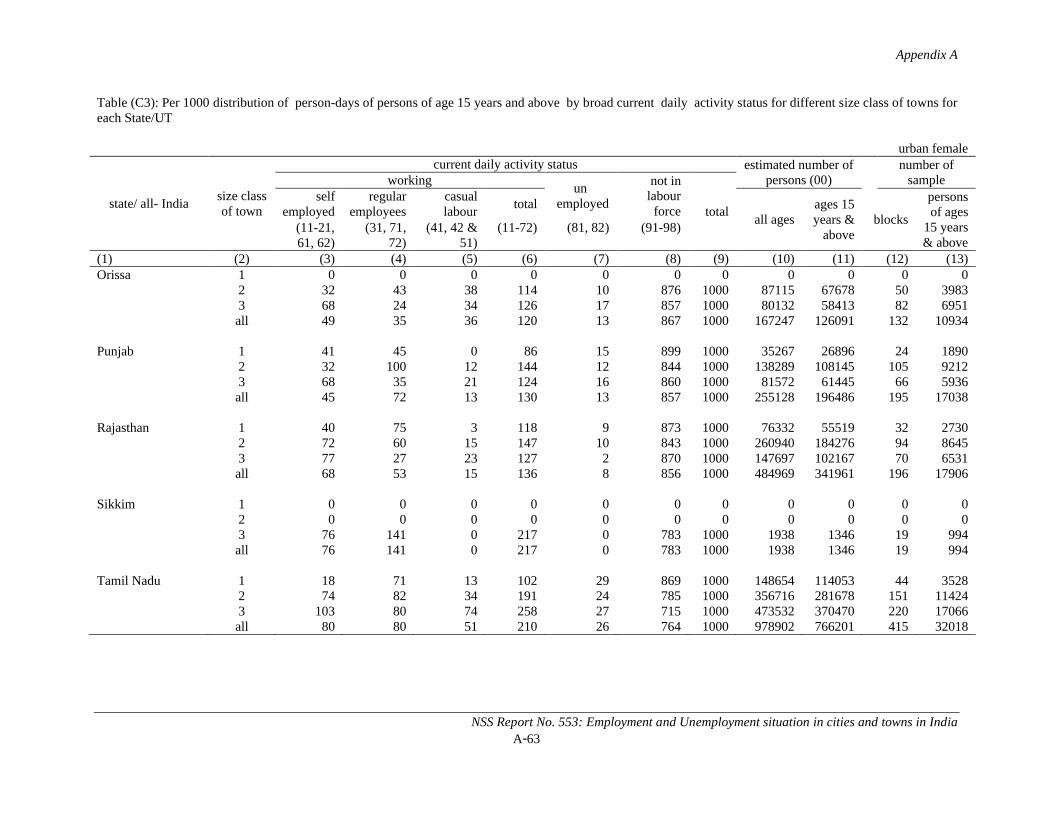
Appendix A
NSS Report No. 553: Employment and Unemployment situation in cities and towns in IndiaA-63
Table (C3): Per 1000 distribution of person-days of persons of age 15 years and above by broad current daily activity status for different size class of towns for each State/UT
urban female
state/ all- Indiasize class of town
current daily activity status estimated number of persons (00)
number of sampleworking
unemployed
not in labour
force totalself
employedregular
employeescasual labour
totalall ages
ages 15 years &
aboveblocks
persons of ages
15 years & above
(11-21, 61, 62)
(31, 71, 72)
(41, 42 & 51)
(11-72) (81, 82) (91-98)
(1) (2) (3) (4) (5) (6) (7) (8) (9) (10) (11) (12) (13)Orissa 1 0 0 0 0 0 0 0 0 0 0 0
2 32 43 38 114 10 876 1000 87115 67678 50 39833 68 24 34 126 17 857 1000 80132 58413 82 6951all 49 35 36 120 13 867 1000 167247 126091 132 10934
Punjab 1 41 45 0 86 15 899 1000 35267 26896 24 18902 32 100 12 144 12 844 1000 138289 108145 105 92123 68 35 21 124 16 860 1000 81572 61445 66 5936all 45 72 13 130 13 857 1000 255128 196486 195 17038
Rajasthan 1 40 75 3 118 9 873 1000 76332 55519 32 27302 72 60 15 147 10 843 1000 260940 184276 94 86453 77 27 23 127 2 870 1000 147697 102167 70 6531all 68 53 15 136 8 856 1000 484969 341961 196 17906
Sikkim 1 0 0 0 0 0 0 0 0 0 0 02 0 0 0 0 0 0 0 0 0 0 03 76 141 0 217 0 783 1000 1938 1346 19 994all 76 141 0 217 0 783 1000 1938 1346 19 994
Tamil Nadu 1 18 71 13 102 29 869 1000 148654 114053 44 35282 74 82 34 191 24 785 1000 356716 281678 151 114243 103 80 74 258 27 715 1000 473532 370470 220 17066all 80 80 51 210 26 764 1000 978902 766201 415 32018
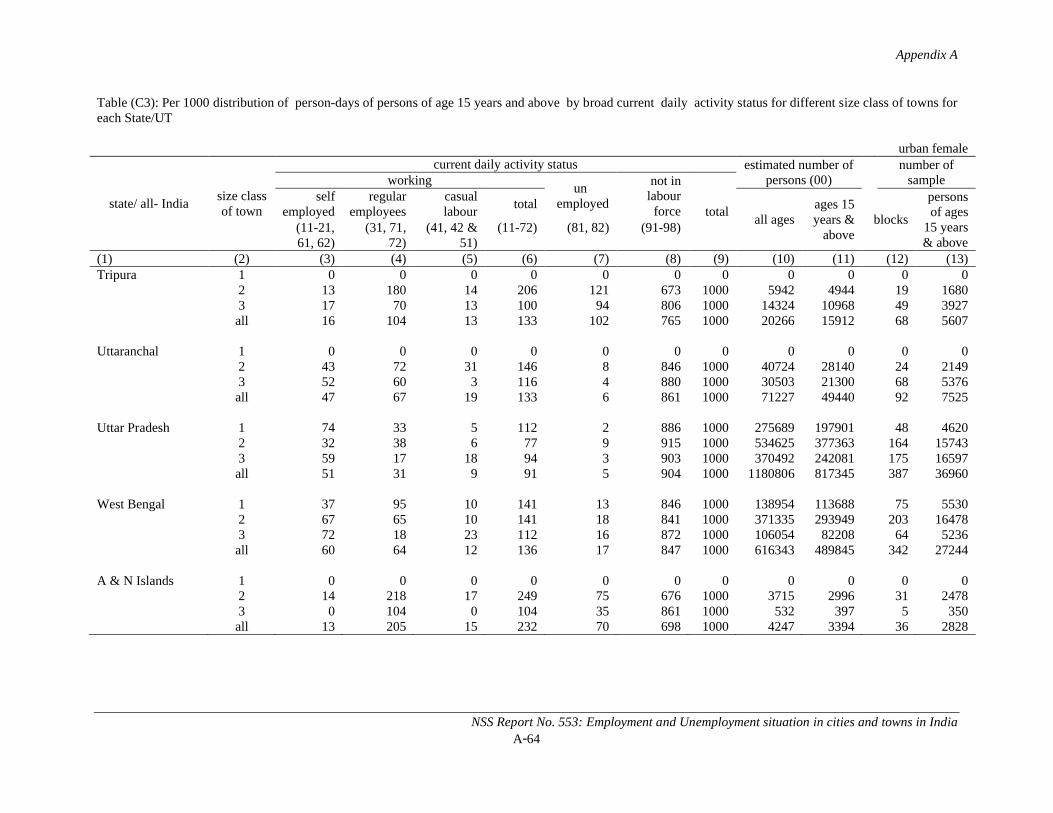
Appendix A
NSS Report No. 553: Employment and Unemployment situation in cities and towns in IndiaA-64
Table (C3): Per 1000 distribution of person-days of persons of age 15 years and above by broad current daily activity status for different size class of towns for each State/UT
urban female
state/ all- Indiasize class of town
current daily activity status estimated number of persons (00)
number of sampleworking
unemployed
not in labour
force totalself
employedregular
employeescasual labour
totalall ages
ages 15 years &
aboveblocks
persons of ages
15 years & above
(11-21, 61, 62)
(31, 71, 72)
(41, 42 & 51)
(11-72) (81, 82) (91-98)
(1) (2) (3) (4) (5) (6) (7) (8) (9) (10) (11) (12) (13)Tripura 1 0 0 0 0 0 0 0 0 0 0 0
2 13 180 14 206 121 673 1000 5942 4944 19 16803 17 70 13 100 94 806 1000 14324 10968 49 3927all 16 104 13 133 102 765 1000 20266 15912 68 5607
Uttaranchal 1 0 0 0 0 0 0 0 0 0 0 02 43 72 31 146 8 846 1000 40724 28140 24 21493 52 60 3 116 4 880 1000 30503 21300 68 5376all 47 67 19 133 6 861 1000 71227 49440 92 7525
Uttar Pradesh 1 74 33 5 112 2 886 1000 275689 197901 48 46202 32 38 6 77 9 915 1000 534625 377363 164 157433 59 17 18 94 3 903 1000 370492 242081 175 16597all 51 31 9 91 5 904 1000 1180806 817345 387 36960
West Bengal 1 37 95 10 141 13 846 1000 138954 113688 75 55302 67 65 10 141 18 841 1000 371335 293949 203 164783 72 18 23 112 16 872 1000 106054 82208 64 5236all 60 64 12 136 17 847 1000 616343 489845 342 27244
A & N Islands 1 0 0 0 0 0 0 0 0 0 0 02 14 218 17 249 75 676 1000 3715 2996 31 24783 0 104 0 104 35 861 1000 532 397 5 350all 13 205 15 232 70 698 1000 4247 3394 36 2828
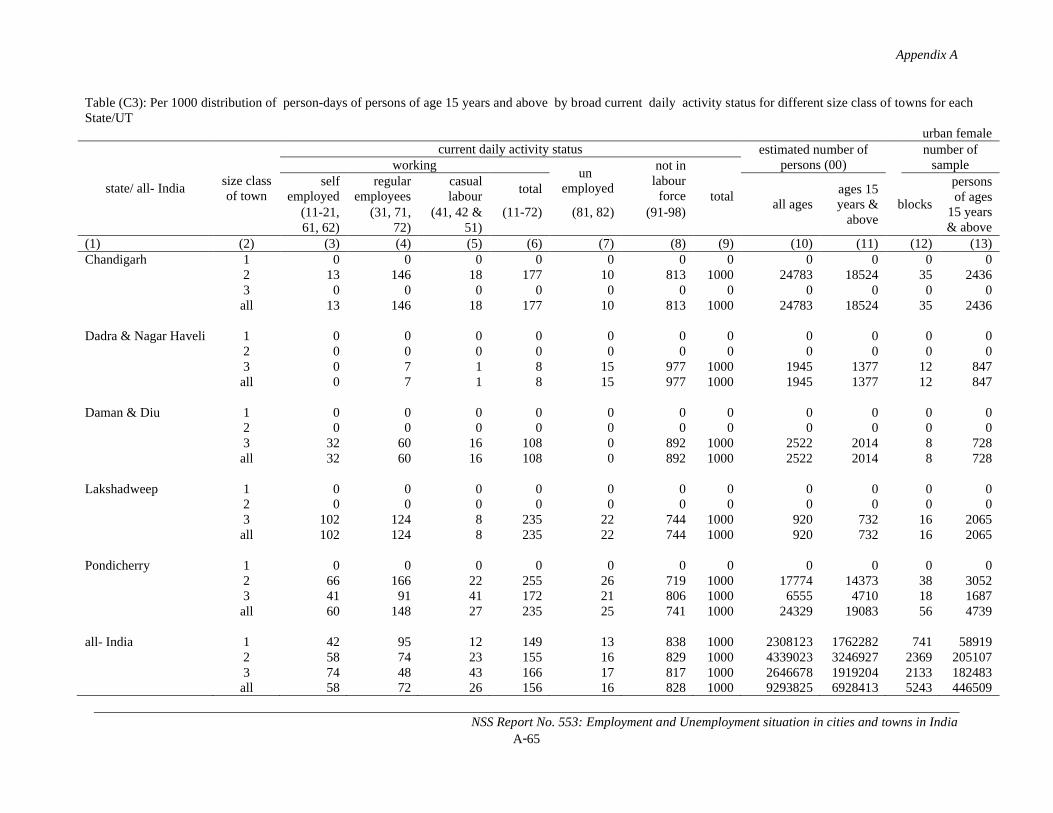
Appendix A
NSS Report No. 553: Employment and Unemployment situation in cities and towns in IndiaA-65
Table (C3): Per 1000 distribution of person-days of persons of age 15 years and above by broad current daily activity status for different size class of towns for each State/UT
urban female
state/ all- Indiasize class of town
current daily activity status estimated number of persons (00)
number of sampleworking
unemployed
not in labour
force totalself
employedregular
employeescasual labour
totalall ages
ages 15 years &
aboveblocks
persons of ages
15 years & above
(11-21, 61, 62)
(31, 71, 72)
(41, 42 & 51)
(11-72) (81, 82) (91-98)
(1) (2) (3) (4) (5) (6) (7) (8) (9) (10) (11) (12) (13)Chandigarh 1 0 0 0 0 0 0 0 0 0 0 0
2 13 146 18 177 10 813 1000 24783 18524 35 24363 0 0 0 0 0 0 0 0 0 0 0all 13 146 18 177 10 813 1000 24783 18524 35 2436
Dadra & Nagar Haveli 1 0 0 0 0 0 0 0 0 0 0 02 0 0 0 0 0 0 0 0 0 0 03 0 7 1 8 15 977 1000 1945 1377 12 847all 0 7 1 8 15 977 1000 1945 1377 12 847
Daman & Diu 1 0 0 0 0 0 0 0 0 0 0 02 0 0 0 0 0 0 0 0 0 0 03 32 60 16 108 0 892 1000 2522 2014 8 728all 32 60 16 108 0 892 1000 2522 2014 8 728
Lakshadweep 1 0 0 0 0 0 0 0 0 0 0 02 0 0 0 0 0 0 0 0 0 0 03 102 124 8 235 22 744 1000 920 732 16 2065all 102 124 8 235 22 744 1000 920 732 16 2065
Pondicherry 1 0 0 0 0 0 0 0 0 0 0 02 66 166 22 255 26 719 1000 17774 14373 38 30523 41 91 41 172 21 806 1000 6555 4710 18 1687all 60 148 27 235 25 741 1000 24329 19083 56 4739
all- India 1 42 95 12 149 13 838 1000 2308123 1762282 741 589192 58 74 23 155 16 829 1000 4339023 3246927 2369 2051073 74 48 43 166 17 817 1000 2646678 1919204 2133 182483all 58 72 26 156 16 828 1000 9293825 6928413 5243 446509
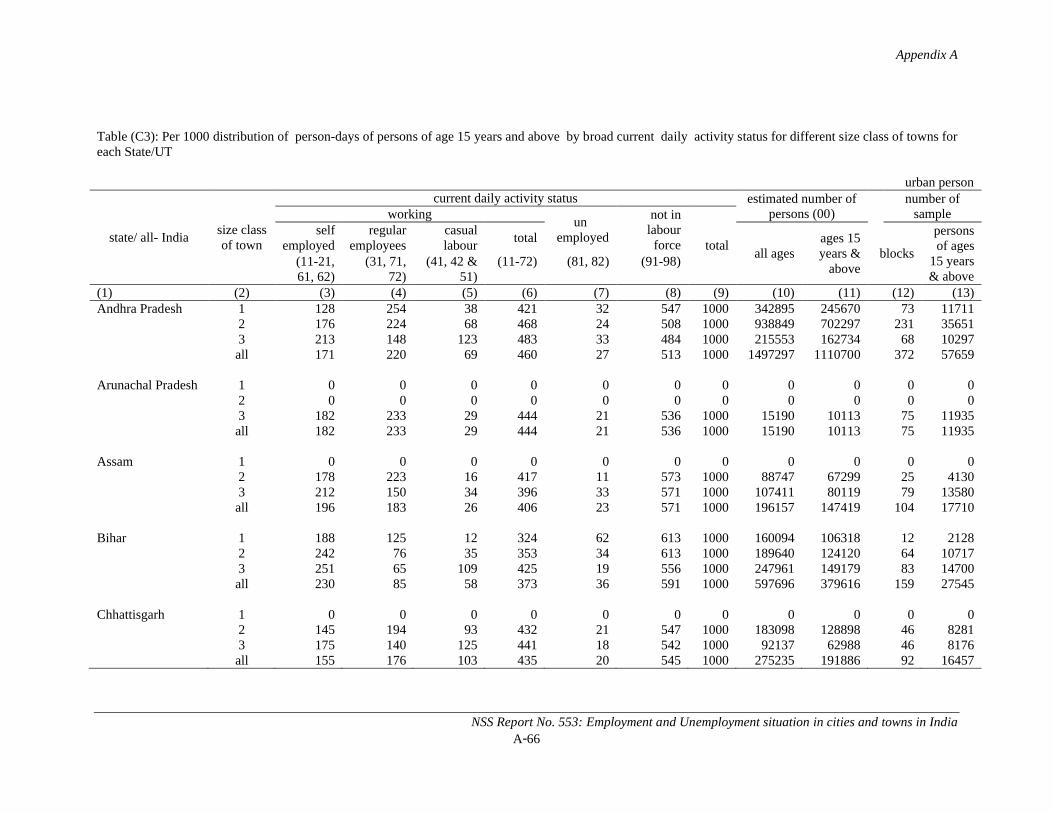
Appendix A
NSS Report No. 553: Employment and Unemployment situation in cities and towns in IndiaA-66
Table (C3): Per 1000 distribution of person-days of persons of age 15 years and above by broad current daily activity status for different size class of towns for each State/UT
urban person
state/ all- Indiasize class of town
current daily activity status estimated number of persons (00)
number of sampleworking
unemployed
not in labour
force totalself
employedregular
employeescasual labour
totalall ages
ages 15 years &
aboveblocks
persons of ages
15 years & above
(11-21, 61, 62)
(31, 71, 72)
(41, 42 & 51)
(11-72) (81, 82) (91-98)
(1) (2) (3) (4) (5) (6) (7) (8) (9) (10) (11) (12) (13)Andhra Pradesh 1 128 254 38 421 32 547 1000 342895 245670 73 11711
2 176 224 68 468 24 508 1000 938849 702297 231 356513 213 148 123 483 33 484 1000 215553 162734 68 10297all 171 220 69 460 27 513 1000 1497297 1110700 372 57659
Arunachal Pradesh 1 0 0 0 0 0 0 0 0 0 0 02 0 0 0 0 0 0 0 0 0 0 03 182 233 29 444 21 536 1000 15190 10113 75 11935all 182 233 29 444 21 536 1000 15190 10113 75 11935
Assam 1 0 0 0 0 0 0 0 0 0 0 02 178 223 16 417 11 573 1000 88747 67299 25 41303 212 150 34 396 33 571 1000 107411 80119 79 13580all 196 183 26 406 23 571 1000 196157 147419 104 17710
Bihar 1 188 125 12 324 62 613 1000 160094 106318 12 21282 242 76 35 353 34 613 1000 189640 124120 64 107173 251 65 109 425 19 556 1000 247961 149179 83 14700all 230 85 58 373 36 591 1000 597696 379616 159 27545
Chhattisgarh 1 0 0 0 0 0 0 0 0 0 0 02 145 194 93 432 21 547 1000 183098 128898 46 82813 175 140 125 441 18 542 1000 92137 62988 46 8176all 155 176 103 435 20 545 1000 275235 191886 92 16457
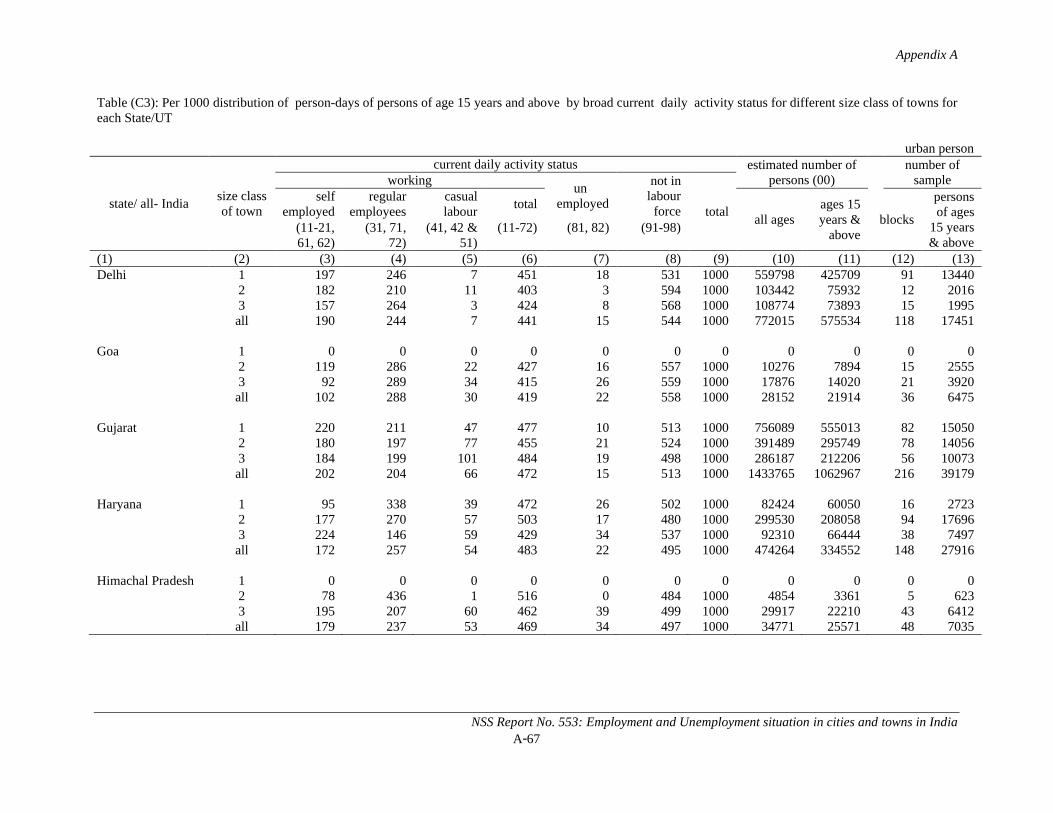
Appendix A
NSS Report No. 553: Employment and Unemployment situation in cities and towns in IndiaA-67
Table (C3): Per 1000 distribution of person-days of persons of age 15 years and above by broad current daily activity status for different size class of towns for each State/UT
urban person
state/ all- Indiasize class of town
current daily activity status estimated number of persons (00)
number of sampleworking
unemployed
not in labour
force totalself
employedregular
employeescasual labour
totalall ages
ages 15 years &
aboveblocks
persons of ages
15 years & above
(11-21, 61, 62)
(31, 71, 72)
(41, 42 & 51)
(11-72) (81, 82) (91-98)
(1) (2) (3) (4) (5) (6) (7) (8) (9) (10) (11) (12) (13)Delhi 1 197 246 7 451 18 531 1000 559798 425709 91 13440
2 182 210 11 403 3 594 1000 103442 75932 12 20163 157 264 3 424 8 568 1000 108774 73893 15 1995all 190 244 7 441 15 544 1000 772015 575534 118 17451
Goa 1 0 0 0 0 0 0 0 0 0 0 02 119 286 22 427 16 557 1000 10276 7894 15 25553 92 289 34 415 26 559 1000 17876 14020 21 3920all 102 288 30 419 22 558 1000 28152 21914 36 6475
Gujarat 1 220 211 47 477 10 513 1000 756089 555013 82 150502 180 197 77 455 21 524 1000 391489 295749 78 140563 184 199 101 484 19 498 1000 286187 212206 56 10073all 202 204 66 472 15 513 1000 1433765 1062967 216 39179
Haryana 1 95 338 39 472 26 502 1000 82424 60050 16 27232 177 270 57 503 17 480 1000 299530 208058 94 176963 224 146 59 429 34 537 1000 92310 66444 38 7497all 172 257 54 483 22 495 1000 474264 334552 148 27916
Himachal Pradesh 1 0 0 0 0 0 0 0 0 0 0 02 78 436 1 516 0 484 1000 4854 3361 5 6233 195 207 60 462 39 499 1000 29917 22210 43 6412all 179 237 53 469 34 497 1000 34771 25571 48 7035

Appendix A
NSS Report No. 553: Employment and Unemployment situation in cities and towns in IndiaA-68
Table (C3): Per 1000 distribution of person-days of persons of age 15 years and above by broad current daily activity status for different size class of towns for each State/UT
urban person
state/ all- Indiasize class of town
current daily activity status estimated number of persons (00)
number of sampleworking
unemployed
not in labour
force totalself
employedregular
employeescasual labour
totalall ages
ages 15 years &
aboveblocks
persons of ages
15 years & above
(11-21, 61, 62)
(31, 71, 72)
(41, 42 & 51)
(11-72) (81, 82) (91-98)
(1) (2) (3) (4) (5) (6) (7) (8) (9) (10) (11) (12) (13)Jammu & Kashmir 1 0 0 0 0 0 0 0 0 0 0 0
2 176 203 40 418 34 547 1000 94012 73929 106 228203 229 158 51 438 27 536 1000 39787 30493 54 11403all 192 190 43 424 32 544 1000 133800 104422 160 34223
Jharkhand 1 0 0 0 0 0 0 0 0 0 0 02 157 174 90 421 36 543 1000 234365 163209 61 106263 129 141 85 355 49 596 1000 96370 63130 63 10479all 149 165 88 402 40 558 1000 330735 226339 124 21105
Karnataka 1 201 252 50 504 24 472 1000 305111 245243 40 68112 164 197 89 450 21 529 1000 646127 492319 126 213363 212 142 143 498 27 475 1000 315757 228116 89 14336all 185 198 92 475 24 502 1000 1266995 965678 255 42483
Kerala 1 0 0 0 0 0 0 0 0 0 0 02 145 172 97 414 70 516 1000 342188 260182 131 225893 131 144 107 382 69 549 1000 218510 167966 101 17374all 139 161 101 401 70 529 1000 560698 428148 232 39963
Madhya Pradesh 1 126 229 41 396 11 593 1000 201942 151767 24 43752 178 160 62 400 28 573 1000 455550 328403 107 200903 253 101 99 453 28 519 1000 390495 275287 117 22148all 195 152 71 418 24 557 1000 1047987 755458 248 46613
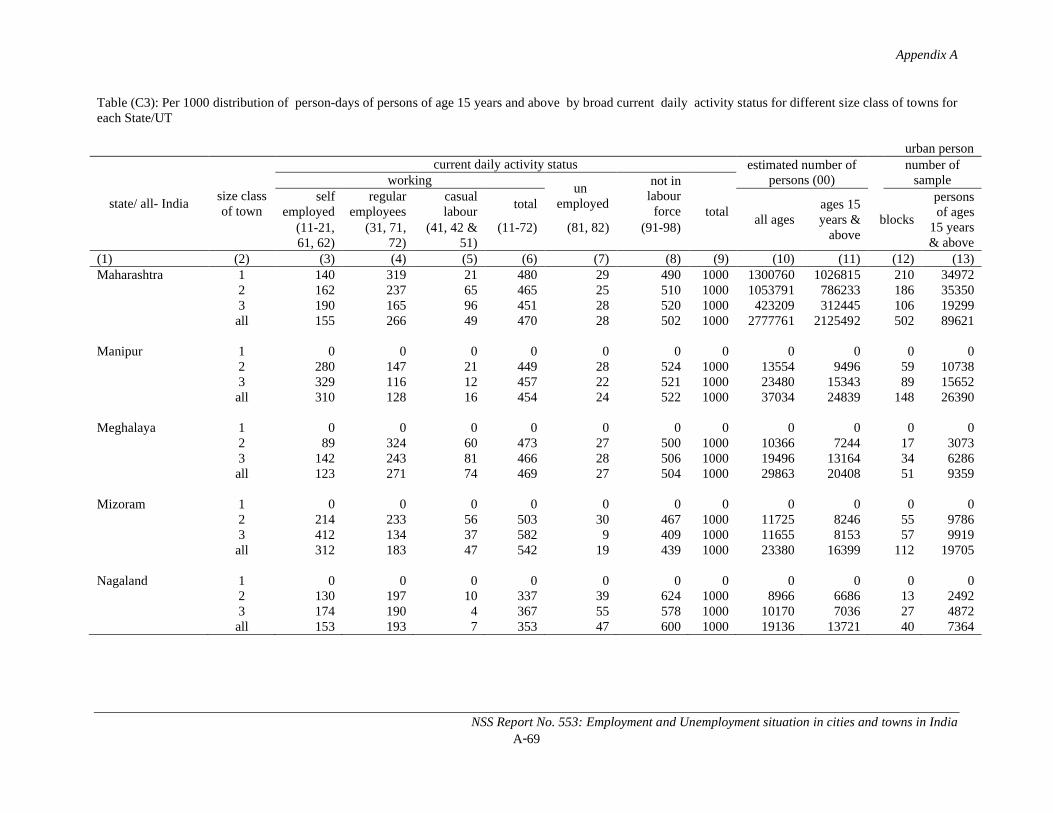
Appendix A
NSS Report No. 553: Employment and Unemployment situation in cities and towns in IndiaA-69
Table (C3): Per 1000 distribution of person-days of persons of age 15 years and above by broad current daily activity status for different size class of towns for each State/UT
urban person
state/ all- Indiasize class of town
current daily activity status estimated number of persons (00)
number of sampleworking
unemployed
not in labour
force totalself
employedregular
employeescasual labour
totalall ages
ages 15 years &
aboveblocks
persons of ages
15 years & above
(11-21, 61, 62)
(31, 71, 72)
(41, 42 & 51)
(11-72) (81, 82) (91-98)
(1) (2) (3) (4) (5) (6) (7) (8) (9) (10) (11) (12) (13)Maharashtra 1 140 319 21 480 29 490 1000 1300760 1026815 210 34972
2 162 237 65 465 25 510 1000 1053791 786233 186 353503 190 165 96 451 28 520 1000 423209 312445 106 19299all 155 266 49 470 28 502 1000 2777761 2125492 502 89621
Manipur 1 0 0 0 0 0 0 0 0 0 0 02 280 147 21 449 28 524 1000 13554 9496 59 107383 329 116 12 457 22 521 1000 23480 15343 89 15652all 310 128 16 454 24 522 1000 37034 24839 148 26390
Meghalaya 1 0 0 0 0 0 0 0 0 0 0 02 89 324 60 473 27 500 1000 10366 7244 17 30733 142 243 81 466 28 506 1000 19496 13164 34 6286all 123 271 74 469 27 504 1000 29863 20408 51 9359
Mizoram 1 0 0 0 0 0 0 0 0 0 0 02 214 233 56 503 30 467 1000 11725 8246 55 97863 412 134 37 582 9 409 1000 11655 8153 57 9919all 312 183 47 542 19 439 1000 23380 16399 112 19705
Nagaland 1 0 0 0 0 0 0 0 0 0 0 02 130 197 10 337 39 624 1000 8966 6686 13 24923 174 190 4 367 55 578 1000 10170 7036 27 4872all 153 193 7 353 47 600 1000 19136 13721 40 7364
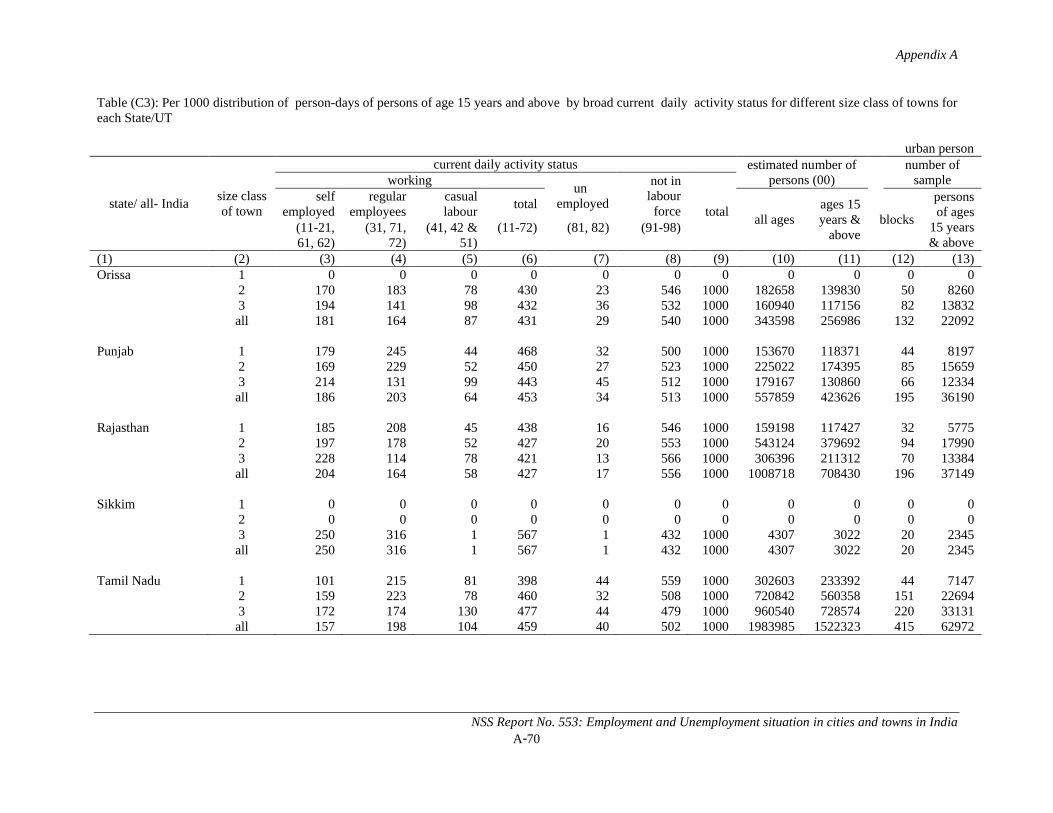
Appendix A
NSS Report No. 553: Employment and Unemployment situation in cities and towns in IndiaA-70
Table (C3): Per 1000 distribution of person-days of persons of age 15 years and above by broad current daily activity status for different size class of towns for each State/UT
urban person
state/ all- Indiasize class of town
current daily activity status estimated number of persons (00)
number of sampleworking
unemployed
not in labour
force totalself
employedregular
employeescasual labour
totalall ages
ages 15 years &
aboveblocks
persons of ages
15 years & above
(11-21, 61, 62)
(31, 71, 72)
(41, 42 & 51)
(11-72) (81, 82) (91-98)
(1) (2) (3) (4) (5) (6) (7) (8) (9) (10) (11) (12) (13)Orissa 1 0 0 0 0 0 0 0 0 0 0 0
2 170 183 78 430 23 546 1000 182658 139830 50 82603 194 141 98 432 36 532 1000 160940 117156 82 13832all 181 164 87 431 29 540 1000 343598 256986 132 22092
Punjab 1 179 245 44 468 32 500 1000 153670 118371 44 81972 169 229 52 450 27 523 1000 225022 174395 85 156593 214 131 99 443 45 512 1000 179167 130860 66 12334all 186 203 64 453 34 513 1000 557859 423626 195 36190
Rajasthan 1 185 208 45 438 16 546 1000 159198 117427 32 57752 197 178 52 427 20 553 1000 543124 379692 94 179903 228 114 78 421 13 566 1000 306396 211312 70 13384all 204 164 58 427 17 556 1000 1008718 708430 196 37149
Sikkim 1 0 0 0 0 0 0 0 0 0 0 02 0 0 0 0 0 0 0 0 0 0 03 250 316 1 567 1 432 1000 4307 3022 20 2345all 250 316 1 567 1 432 1000 4307 3022 20 2345
Tamil Nadu 1 101 215 81 398 44 559 1000 302603 233392 44 71472 159 223 78 460 32 508 1000 720842 560358 151 226943 172 174 130 477 44 479 1000 960540 728574 220 33131all 157 198 104 459 40 502 1000 1983985 1522323 415 62972

Appendix A
NSS Report No. 553: Employment and Unemployment situation in cities and towns in IndiaA-71
Table (C3): Per 1000 distribution of person-days of persons of age 15 years and above by broad current daily activity status for different size class of towns for each State/UT
urban person
state/ all- Indiasize class of town
current daily activity status estimated number of persons (00)
number of sampleworking
unemployed
not in labour
force totalself
employedregular
employeescasual labour
totalall ages
ages 15 years &
aboveblocks
persons of ages
15 years & above
(11-21, 61, 62)
(31, 71, 72)
(41, 42 & 51)
(11-72) (81, 82) (91-98)
(1) (2) (3) (4) (5) (6) (7) (8) (9) (10) (11) (12) (13)Tripura 1 0 0 0 0 0 0 0 0 0 0 0
2 125 249 35 408 90 502 1000 11526 9709 19 32903 172 166 59 397 94 509 1000 28100 21688 49 7637all 158 191 51 400 93 507 1000 39626 31396 68 10927
Uttaranchal 1 0 0 0 0 0 0 0 0 0 0 02 197 167 79 443 27 530 1000 85422 61494 24 45083 189 188 57 433 32 535 1000 67607 45376 68 11137all 194 176 70 439 29 532 1000 153029 106870 92 15645
Uttar Pradesh 1 203 143 62 408 24 568 1000 635656 463017 54 108292 196 153 57 406 15 580 1000 1069377 743703 158 314023 259 83 77 419 22 560 1000 771407 494047 175 33768all 216 130 64 410 19 571 1000 2476439 1700767 387 75999
West Bengal 1 161 198 76 435 24 541 1000 281132 227838 76 115362 204 185 45 434 34 531 1000 768314 597136 204 338103 266 104 76 447 26 528 1000 225042 171406 64 10969all 205 174 58 437 30 533 1000 1274488 996379 344 56315
A & N Islands 1 0 0 0 0 0 0 0 0 0 0 02 82 386 38 506 56 438 1000 7829 6105 31 48933 18 370 31 419 42 539 1000 1103 857 5 728all 74 384 37 495 54 451 1000 8931 6963 36 5621
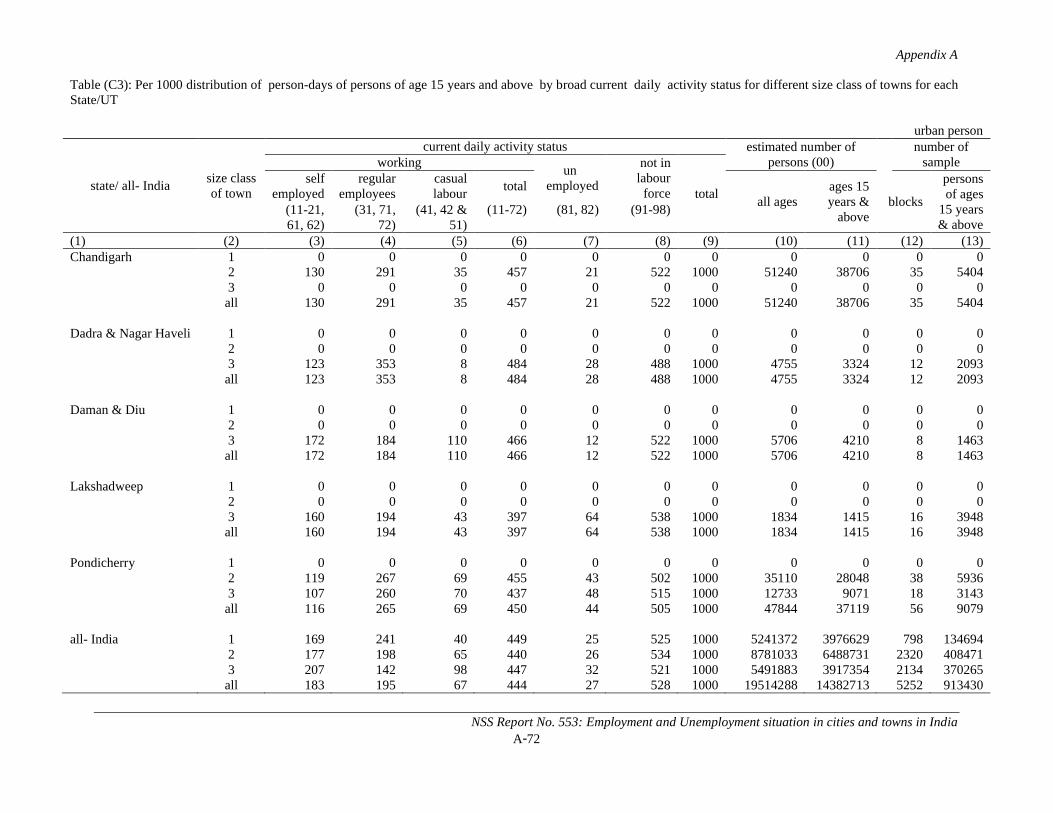
Appendix A
NSS Report No. 553: Employment and Unemployment situation in cities and towns in IndiaA-72
Table (C3): Per 1000 distribution of person-days of persons of age 15 years and above by broad current daily activity status for different size class of towns for each State/UT
urban person
state/ all- Indiasize class of town
current daily activity status estimated number of persons (00)
number of sampleworking
unemployed
not in labour
force totalself
employedregular
employeescasual labour
totalall ages
ages 15 years &
aboveblocks
persons of ages
15 years & above
(11-21, 61, 62)
(31, 71, 72)
(41, 42 & 51)
(11-72) (81, 82) (91-98)
(1) (2) (3) (4) (5) (6) (7) (8) (9) (10) (11) (12) (13)Chandigarh 1 0 0 0 0 0 0 0 0 0 0 0
2 130 291 35 457 21 522 1000 51240 38706 35 54043 0 0 0 0 0 0 0 0 0 0 0
all 130 291 35 457 21 522 1000 51240 38706 35 5404
Dadra & Nagar Haveli 1 0 0 0 0 0 0 0 0 0 0 02 0 0 0 0 0 0 0 0 0 0 03 123 353 8 484 28 488 1000 4755 3324 12 2093
all 123 353 8 484 28 488 1000 4755 3324 12 2093
Daman & Diu 1 0 0 0 0 0 0 0 0 0 0 02 0 0 0 0 0 0 0 0 0 0 03 172 184 110 466 12 522 1000 5706 4210 8 1463
all 172 184 110 466 12 522 1000 5706 4210 8 1463
Lakshadweep 1 0 0 0 0 0 0 0 0 0 0 02 0 0 0 0 0 0 0 0 0 0 03 160 194 43 397 64 538 1000 1834 1415 16 3948
all 160 194 43 397 64 538 1000 1834 1415 16 3948
Pondicherry 1 0 0 0 0 0 0 0 0 0 0 02 119 267 69 455 43 502 1000 35110 28048 38 59363 107 260 70 437 48 515 1000 12733 9071 18 3143
all 116 265 69 450 44 505 1000 47844 37119 56 9079
all- India 1 169 241 40 449 25 525 1000 5241372 3976629 798 1346942 177 198 65 440 26 534 1000 8781033 6488731 2320 4084713 207 142 98 447 32 521 1000 5491883 3917354 2134 370265
all 183 195 67 444 27 528 1000 19514288 14382713 5252 913430
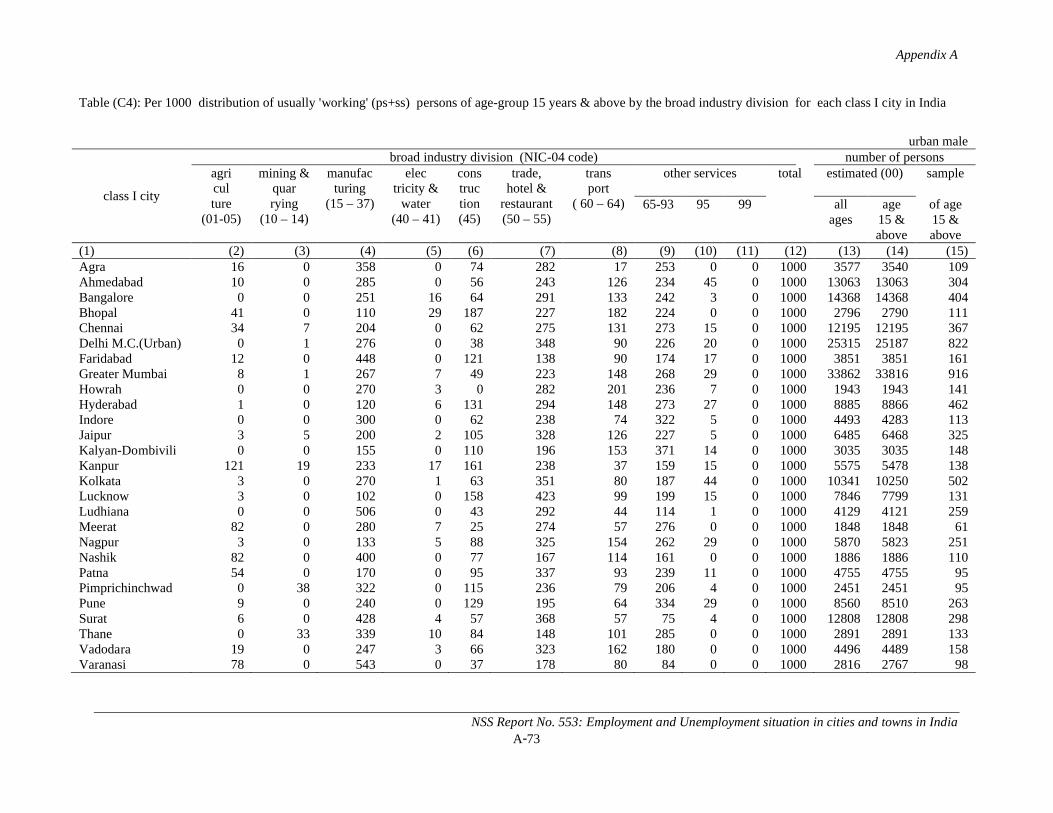
Appendix A
NSS Report No. 553: Employment and Unemployment situation in cities and towns in IndiaA-73
Table (C4): Per 1000 distribution of usually 'working' (ps+ss) persons of age-group 15 years & above by the broad industry division for each class I city in India
urban male
class I city
broad industry division (NIC-04 code) number of personsagriculture
(01-05)
mining & quarrying
(10 – 14)
manufacturing
(15 – 37)
electricity &
water(40 – 41)
construction(45)
trade,hotel &
restaurant(50 – 55)
transport
( 60 – 64)
other services total estimated (00) sample
65-93 95 99 all ages
age15 & above
of age 15 & above
(1) (2) (3) (4) (5) (6) (7) (8) (9) (10) (11) (12) (13) (14) (15)Agra 16 0 358 0 74 282 17 253 0 0 1000 3577 3540 109Ahmedabad 10 0 285 0 56 243 126 234 45 0 1000 13063 13063 304Bangalore 0 0 251 16 64 291 133 242 3 0 1000 14368 14368 404Bhopal 41 0 110 29 187 227 182 224 0 0 1000 2796 2790 111Chennai 34 7 204 0 62 275 131 273 15 0 1000 12195 12195 367Delhi M.C.(Urban) 0 1 276 0 38 348 90 226 20 0 1000 25315 25187 822Faridabad 12 0 448 0 121 138 90 174 17 0 1000 3851 3851 161Greater Mumbai 8 1 267 7 49 223 148 268 29 0 1000 33862 33816 916Howrah 0 0 270 3 0 282 201 236 7 0 1000 1943 1943 141Hyderabad 1 0 120 6 131 294 148 273 27 0 1000 8885 8866 462Indore 0 0 300 0 62 238 74 322 5 0 1000 4493 4283 113Jaipur 3 5 200 2 105 328 126 227 5 0 1000 6485 6468 325Kalyan-Dombivili 0 0 155 0 110 196 153 371 14 0 1000 3035 3035 148Kanpur 121 19 233 17 161 238 37 159 15 0 1000 5575 5478 138Kolkata 3 0 270 1 63 351 80 187 44 0 1000 10341 10250 502Lucknow 3 0 102 0 158 423 99 199 15 0 1000 7846 7799 131Ludhiana 0 0 506 0 43 292 44 114 1 0 1000 4129 4121 259Meerat 82 0 280 7 25 274 57 276 0 0 1000 1848 1848 61Nagpur 3 0 133 5 88 325 154 262 29 0 1000 5870 5823 251Nashik 82 0 400 0 77 167 114 161 0 0 1000 1886 1886 110Patna 54 0 170 0 95 337 93 239 11 0 1000 4755 4755 95Pimprichinchwad 0 38 322 0 115 236 79 206 4 0 1000 2451 2451 95Pune 9 0 240 0 129 195 64 334 29 0 1000 8560 8510 263Surat 6 0 428 4 57 368 57 75 4 0 1000 12808 12808 298Thane 0 33 339 10 84 148 101 285 0 0 1000 2891 2891 133Vadodara 19 0 247 3 66 323 162 180 0 0 1000 4496 4489 158Varanasi 78 0 543 0 37 178 80 84 0 0 1000 2816 2767 98
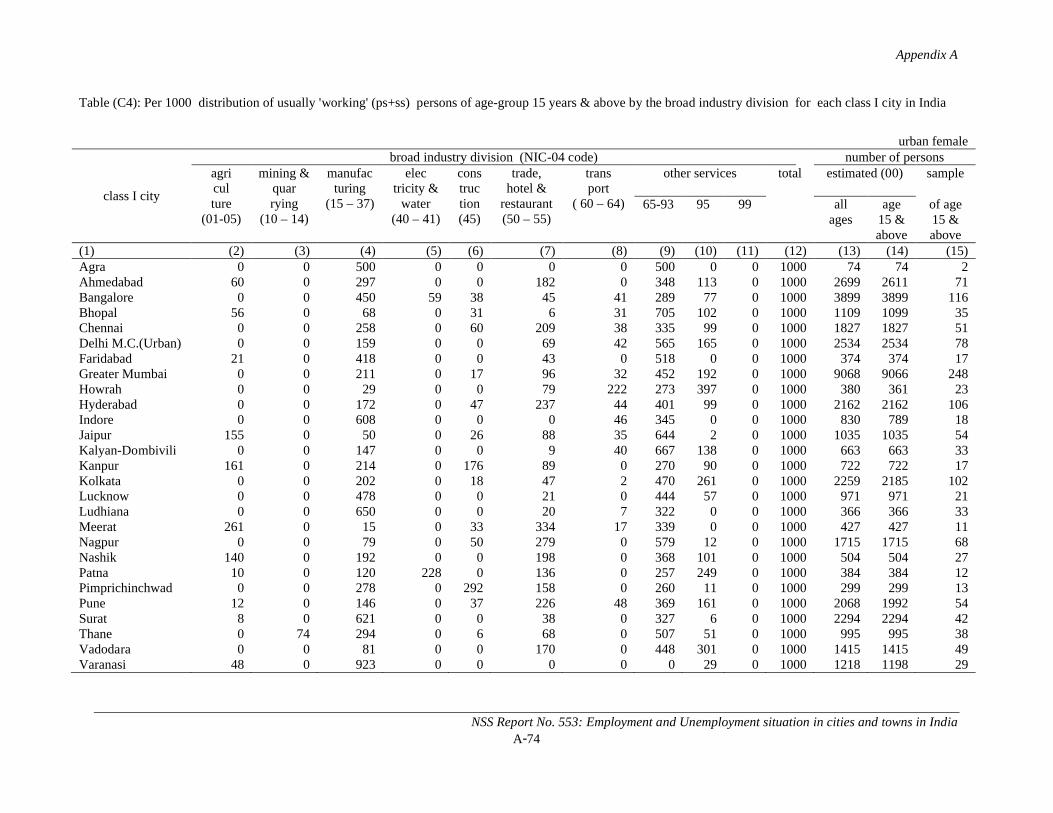
Appendix A
NSS Report No. 553: Employment and Unemployment situation in cities and towns in IndiaA-74
Table (C4): Per 1000 distribution of usually 'working' (ps+ss) persons of age-group 15 years & above by the broad industry division for each class I city in India
urban female
class I city
broad industry division (NIC-04 code) number of personsagriculture
(01-05)
mining & quarrying
(10 – 14)
manufacturing
(15 – 37)
electricity &
water(40 – 41)
construction(45)
trade,hotel &
restaurant(50 – 55)
transport
( 60 – 64)
other services total estimated (00) sample
65-93 95 99 all ages
age15 & above
of age 15 & above
(1) (2) (3) (4) (5) (6) (7) (8) (9) (10) (11) (12) (13) (14) (15)Agra 0 0 500 0 0 0 0 500 0 0 1000 74 74 2Ahmedabad 60 0 297 0 0 182 0 348 113 0 1000 2699 2611 71Bangalore 0 0 450 59 38 45 41 289 77 0 1000 3899 3899 116Bhopal 56 0 68 0 31 6 31 705 102 0 1000 1109 1099 35Chennai 0 0 258 0 60 209 38 335 99 0 1000 1827 1827 51Delhi M.C.(Urban) 0 0 159 0 0 69 42 565 165 0 1000 2534 2534 78Faridabad 21 0 418 0 0 43 0 518 0 0 1000 374 374 17Greater Mumbai 0 0 211 0 17 96 32 452 192 0 1000 9068 9066 248Howrah 0 0 29 0 0 79 222 273 397 0 1000 380 361 23Hyderabad 0 0 172 0 47 237 44 401 99 0 1000 2162 2162 106Indore 0 0 608 0 0 0 46 345 0 0 1000 830 789 18Jaipur 155 0 50 0 26 88 35 644 2 0 1000 1035 1035 54Kalyan-Dombivili 0 0 147 0 0 9 40 667 138 0 1000 663 663 33Kanpur 161 0 214 0 176 89 0 270 90 0 1000 722 722 17Kolkata 0 0 202 0 18 47 2 470 261 0 1000 2259 2185 102Lucknow 0 0 478 0 0 21 0 444 57 0 1000 971 971 21Ludhiana 0 0 650 0 0 20 7 322 0 0 1000 366 366 33Meerat 261 0 15 0 33 334 17 339 0 0 1000 427 427 11Nagpur 0 0 79 0 50 279 0 579 12 0 1000 1715 1715 68Nashik 140 0 192 0 0 198 0 368 101 0 1000 504 504 27Patna 10 0 120 228 0 136 0 257 249 0 1000 384 384 12Pimprichinchwad 0 0 278 0 292 158 0 260 11 0 1000 299 299 13Pune 12 0 146 0 37 226 48 369 161 0 1000 2068 1992 54Surat 8 0 621 0 0 38 0 327 6 0 1000 2294 2294 42Thane 0 74 294 0 6 68 0 507 51 0 1000 995 995 38Vadodara 0 0 81 0 0 170 0 448 301 0 1000 1415 1415 49Varanasi 48 0 923 0 0 0 0 0 29 0 1000 1218 1198 29
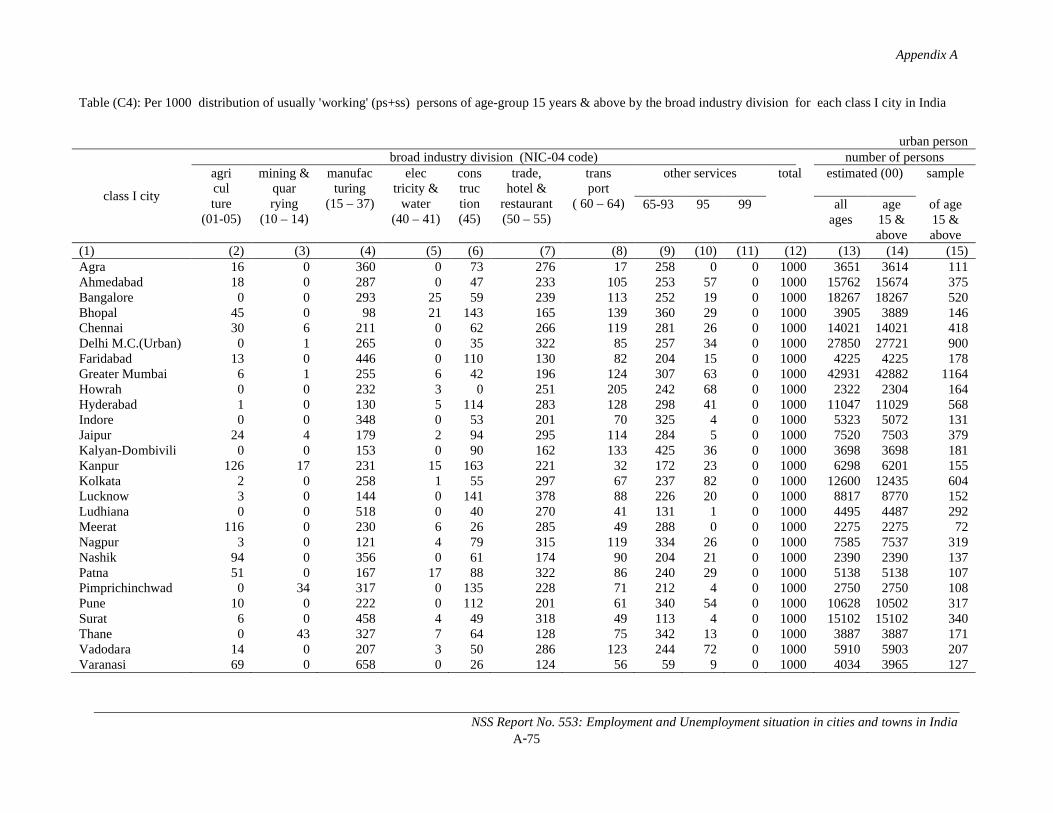
Appendix A
NSS Report No. 553: Employment and Unemployment situation in cities and towns in IndiaA-75
Table (C4): Per 1000 distribution of usually 'working' (ps+ss) persons of age-group 15 years & above by the broad industry division for each class I city in India
urban person
class I city
broad industry division (NIC-04 code) number of personsagriculture
(01-05)
mining & quarrying
(10 – 14)
manufacturing
(15 – 37)
electricity &
water(40 – 41)
construction(45)
trade,hotel &
restaurant(50 – 55)
transport
( 60 – 64)
other services total estimated (00) sample
65-93 95 99 all ages
age15 & above
of age 15 & above
(1) (2) (3) (4) (5) (6) (7) (8) (9) (10) (11) (12) (13) (14) (15)Agra 16 0 360 0 73 276 17 258 0 0 1000 3651 3614 111Ahmedabad 18 0 287 0 47 233 105 253 57 0 1000 15762 15674 375Bangalore 0 0 293 25 59 239 113 252 19 0 1000 18267 18267 520Bhopal 45 0 98 21 143 165 139 360 29 0 1000 3905 3889 146Chennai 30 6 211 0 62 266 119 281 26 0 1000 14021 14021 418Delhi M.C.(Urban) 0 1 265 0 35 322 85 257 34 0 1000 27850 27721 900Faridabad 13 0 446 0 110 130 82 204 15 0 1000 4225 4225 178Greater Mumbai 6 1 255 6 42 196 124 307 63 0 1000 42931 42882 1164Howrah 0 0 232 3 0 251 205 242 68 0 1000 2322 2304 164Hyderabad 1 0 130 5 114 283 128 298 41 0 1000 11047 11029 568Indore 0 0 348 0 53 201 70 325 4 0 1000 5323 5072 131Jaipur 24 4 179 2 94 295 114 284 5 0 1000 7520 7503 379Kalyan-Dombivili 0 0 153 0 90 162 133 425 36 0 1000 3698 3698 181Kanpur 126 17 231 15 163 221 32 172 23 0 1000 6298 6201 155Kolkata 2 0 258 1 55 297 67 237 82 0 1000 12600 12435 604Lucknow 3 0 144 0 141 378 88 226 20 0 1000 8817 8770 152Ludhiana 0 0 518 0 40 270 41 131 1 0 1000 4495 4487 292Meerat 116 0 230 6 26 285 49 288 0 0 1000 2275 2275 72Nagpur 3 0 121 4 79 315 119 334 26 0 1000 7585 7537 319Nashik 94 0 356 0 61 174 90 204 21 0 1000 2390 2390 137Patna 51 0 167 17 88 322 86 240 29 0 1000 5138 5138 107Pimprichinchwad 0 34 317 0 135 228 71 212 4 0 1000 2750 2750 108Pune 10 0 222 0 112 201 61 340 54 0 1000 10628 10502 317Surat 6 0 458 4 49 318 49 113 4 0 1000 15102 15102 340Thane 0 43 327 7 64 128 75 342 13 0 1000 3887 3887 171Vadodara 14 0 207 3 50 286 123 244 72 0 1000 5910 5903 207Varanasi 69 0 658 0 26 124 56 59 9 0 1000 4034 3965 127
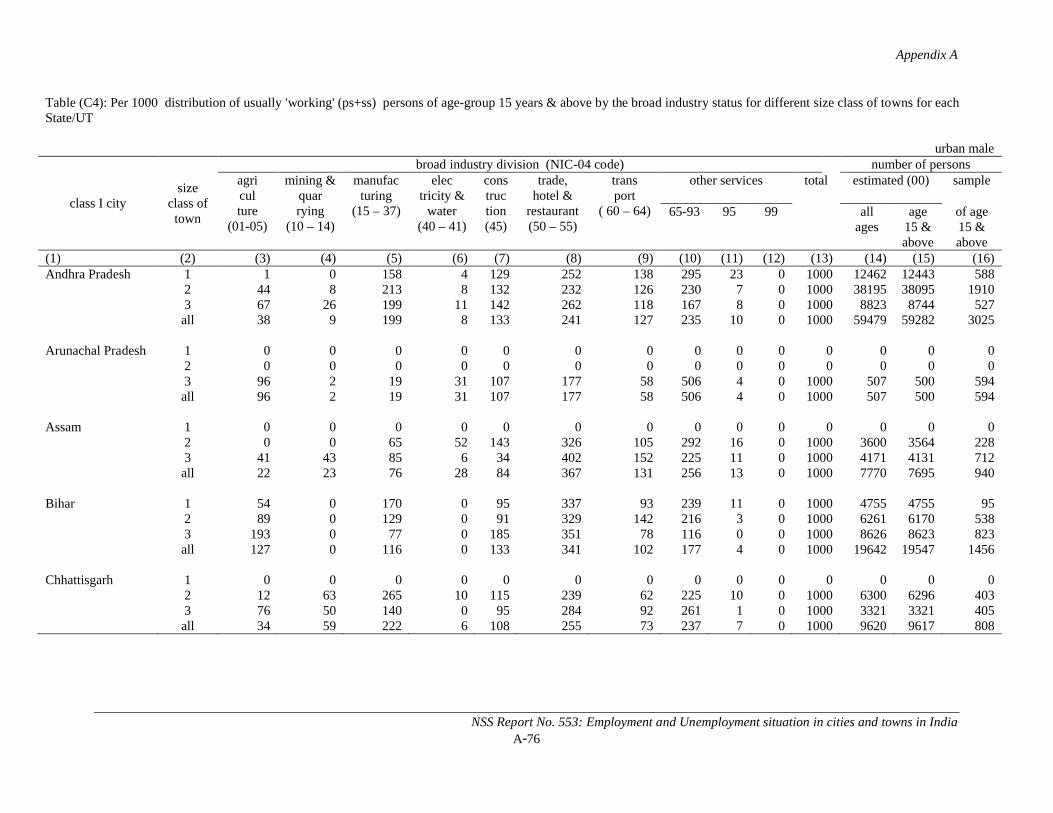
Appendix A
NSS Report No. 553: Employment and Unemployment situation in cities and towns in IndiaA-76
Table (C4): Per 1000 distribution of usually 'working' (ps+ss) persons of age-group 15 years & above by the broad industry status for different size class of towns for each State/UT
urban male
class I citysize
class of town
broad industry division (NIC-04 code) number of personsagriculture
(01-05)
mining & quarrying
(10 – 14)
manufacturing
(15 – 37)
electricity &
water(40 – 41)
construction(45)
trade,hotel &
restaurant(50 – 55)
transport
( 60 – 64)
other services total estimated (00) sample
65-93 95 99 all ages
age15 & above
of age 15 & above
(1) (2) (3) (4) (5) (6) (7) (8) (9) (10) (11) (12) (13) (14) (15) (16)Andhra Pradesh 1 1 0 158 4 129 252 138 295 23 0 1000 12462 12443 588
2 44 8 213 8 132 232 126 230 7 0 1000 38195 38095 19103 67 26 199 11 142 262 118 167 8 0 1000 8823 8744 527all 38 9 199 8 133 241 127 235 10 0 1000 59479 59282 3025
Arunachal Pradesh 1 0 0 0 0 0 0 0 0 0 0 0 0 0 02 0 0 0 0 0 0 0 0 0 0 0 0 0 03 96 2 19 31 107 177 58 506 4 0 1000 507 500 594all 96 2 19 31 107 177 58 506 4 0 1000 507 500 594
Assam 1 0 0 0 0 0 0 0 0 0 0 0 0 0 02 0 0 65 52 143 326 105 292 16 0 1000 3600 3564 2283 41 43 85 6 34 402 152 225 11 0 1000 4171 4131 712all 22 23 76 28 84 367 131 256 13 0 1000 7770 7695 940
Bihar 1 54 0 170 0 95 337 93 239 11 0 1000 4755 4755 952 89 0 129 0 91 329 142 216 3 0 1000 6261 6170 5383 193 0 77 0 185 351 78 116 0 0 1000 8626 8623 823all 127 0 116 0 133 341 102 177 4 0 1000 19642 19547 1456
Chhattisgarh 1 0 0 0 0 0 0 0 0 0 0 0 0 0 02 12 63 265 10 115 239 62 225 10 0 1000 6300 6296 4033 76 50 140 0 95 284 92 261 1 0 1000 3321 3321 405all 34 59 222 6 108 255 73 237 7 0 1000 9620 9617 808
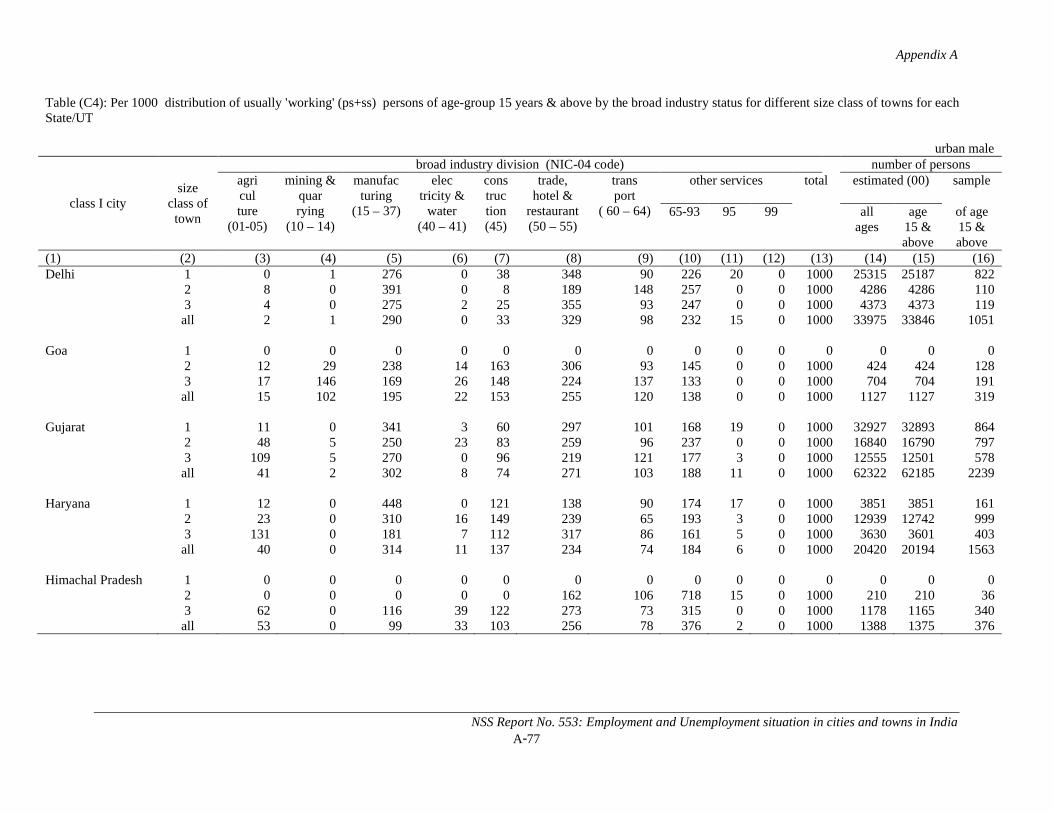
Appendix A
NSS Report No. 553: Employment and Unemployment situation in cities and towns in IndiaA-77
Table (C4): Per 1000 distribution of usually 'working' (ps+ss) persons of age-group 15 years & above by the broad industry status for different size class of towns for each State/UT
urban male
class I citysize
class of town
broad industry division (NIC-04 code) number of personsagriculture
(01-05)
mining & quarrying
(10 – 14)
manufacturing
(15 – 37)
electricity &
water(40 – 41)
construction(45)
trade,hotel &
restaurant(50 – 55)
transport
( 60 – 64)
other services total estimated (00) sample
65-93 95 99 all ages
age15 & above
of age 15 & above
(1) (2) (3) (4) (5) (6) (7) (8) (9) (10) (11) (12) (13) (14) (15) (16)Delhi 1 0 1 276 0 38 348 90 226 20 0 1000 25315 25187 822
2 8 0 391 0 8 189 148 257 0 0 1000 4286 4286 1103 4 0 275 2 25 355 93 247 0 0 1000 4373 4373 119all 2 1 290 0 33 329 98 232 15 0 1000 33975 33846 1051
Goa 1 0 0 0 0 0 0 0 0 0 0 0 0 0 02 12 29 238 14 163 306 93 145 0 0 1000 424 424 1283 17 146 169 26 148 224 137 133 0 0 1000 704 704 191all 15 102 195 22 153 255 120 138 0 0 1000 1127 1127 319
Gujarat 1 11 0 341 3 60 297 101 168 19 0 1000 32927 32893 8642 48 5 250 23 83 259 96 237 0 0 1000 16840 16790 7973 109 5 270 0 96 219 121 177 3 0 1000 12555 12501 578all 41 2 302 8 74 271 103 188 11 0 1000 62322 62185 2239
Haryana 1 12 0 448 0 121 138 90 174 17 0 1000 3851 3851 1612 23 0 310 16 149 239 65 193 3 0 1000 12939 12742 9993 131 0 181 7 112 317 86 161 5 0 1000 3630 3601 403all 40 0 314 11 137 234 74 184 6 0 1000 20420 20194 1563
Himachal Pradesh 1 0 0 0 0 0 0 0 0 0 0 0 0 0 02 0 0 0 0 0 162 106 718 15 0 1000 210 210 363 62 0 116 39 122 273 73 315 0 0 1000 1178 1165 340all 53 0 99 33 103 256 78 376 2 0 1000 1388 1375 376
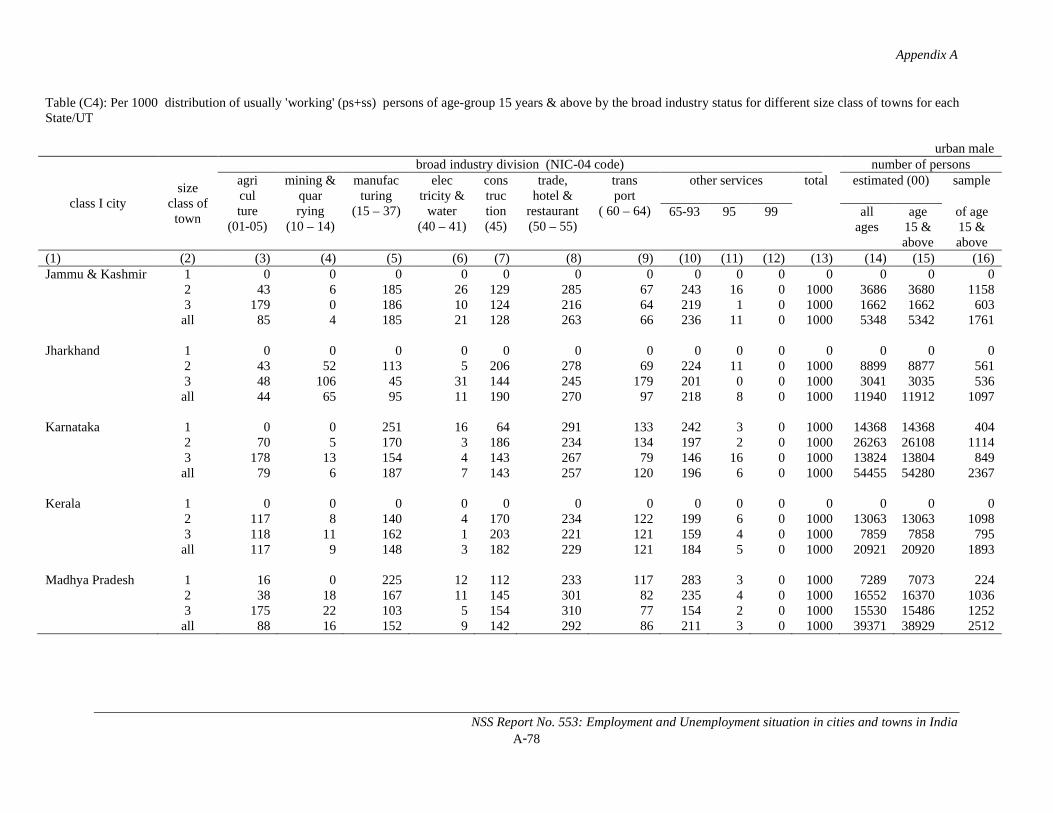
Appendix A
NSS Report No. 553: Employment and Unemployment situation in cities and towns in IndiaA-78
Table (C4): Per 1000 distribution of usually 'working' (ps+ss) persons of age-group 15 years & above by the broad industry status for different size class of towns for each State/UT
urban male
class I citysize
class of town
broad industry division (NIC-04 code) number of personsagriculture
(01-05)
mining & quarrying
(10 – 14)
manufacturing
(15 – 37)
electricity &
water(40 – 41)
construction(45)
trade,hotel &
restaurant(50 – 55)
transport
( 60 – 64)
other services total estimated (00) sample
65-93 95 99 all ages
age15 & above
of age 15 & above
(1) (2) (3) (4) (5) (6) (7) (8) (9) (10) (11) (12) (13) (14) (15) (16)Jammu & Kashmir 1 0 0 0 0 0 0 0 0 0 0 0 0 0 0
2 43 6 185 26 129 285 67 243 16 0 1000 3686 3680 11583 179 0 186 10 124 216 64 219 1 0 1000 1662 1662 603all 85 4 185 21 128 263 66 236 11 0 1000 5348 5342 1761
Jharkhand 1 0 0 0 0 0 0 0 0 0 0 0 0 0 02 43 52 113 5 206 278 69 224 11 0 1000 8899 8877 5613 48 106 45 31 144 245 179 201 0 0 1000 3041 3035 536all 44 65 95 11 190 270 97 218 8 0 1000 11940 11912 1097
Karnataka 1 0 0 251 16 64 291 133 242 3 0 1000 14368 14368 4042 70 5 170 3 186 234 134 197 2 0 1000 26263 26108 11143 178 13 154 4 143 267 79 146 16 0 1000 13824 13804 849all 79 6 187 7 143 257 120 196 6 0 1000 54455 54280 2367
Kerala 1 0 0 0 0 0 0 0 0 0 0 0 0 0 02 117 8 140 4 170 234 122 199 6 0 1000 13063 13063 10983 118 11 162 1 203 221 121 159 4 0 1000 7859 7858 795all 117 9 148 3 182 229 121 184 5 0 1000 20921 20920 1893
Madhya Pradesh 1 16 0 225 12 112 233 117 283 3 0 1000 7289 7073 2242 38 18 167 11 145 301 82 235 4 0 1000 16552 16370 10363 175 22 103 5 154 310 77 154 2 0 1000 15530 15486 1252all 88 16 152 9 142 292 86 211 3 0 1000 39371 38929 2512
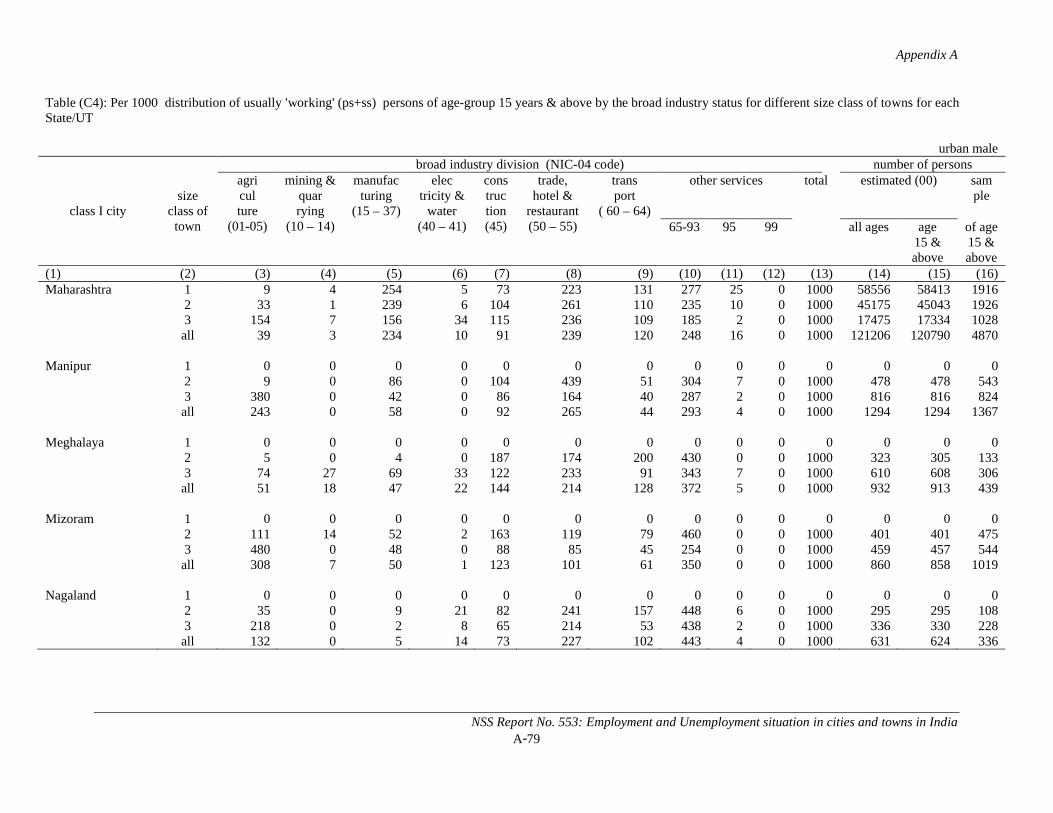
Appendix A
NSS Report No. 553: Employment and Unemployment situation in cities and towns in IndiaA-79
Table (C4): Per 1000 distribution of usually 'working' (ps+ss) persons of age-group 15 years & above by the broad industry status for different size class of towns for each State/UT
urban male
class I citysize
class of town
broad industry division (NIC-04 code) number of personsagriculture
(01-05)
mining & quarrying
(10 – 14)
manufacturing
(15 – 37)
electricity &
water(40 – 41)
construction(45)
trade,hotel &
restaurant(50 – 55)
transport
( 60 – 64)
other services total estimated (00) sample
65-93 95 99 all ages age15 & above
of age 15 & above
(1) (2) (3) (4) (5) (6) (7) (8) (9) (10) (11) (12) (13) (14) (15) (16)Maharashtra 1 9 4 254 5 73 223 131 277 25 0 1000 58556 58413 1916
2 33 1 239 6 104 261 110 235 10 0 1000 45175 45043 19263 154 7 156 34 115 236 109 185 2 0 1000 17475 17334 1028all 39 3 234 10 91 239 120 248 16 0 1000 121206 120790 4870
Manipur 1 0 0 0 0 0 0 0 0 0 0 0 0 0 02 9 0 86 0 104 439 51 304 7 0 1000 478 478 5433 380 0 42 0 86 164 40 287 2 0 1000 816 816 824all 243 0 58 0 92 265 44 293 4 0 1000 1294 1294 1367
Meghalaya 1 0 0 0 0 0 0 0 0 0 0 0 0 0 02 5 0 4 0 187 174 200 430 0 0 1000 323 305 1333 74 27 69 33 122 233 91 343 7 0 1000 610 608 306all 51 18 47 22 144 214 128 372 5 0 1000 932 913 439
Mizoram 1 0 0 0 0 0 0 0 0 0 0 0 0 0 02 111 14 52 2 163 119 79 460 0 0 1000 401 401 4753 480 0 48 0 88 85 45 254 0 0 1000 459 457 544all 308 7 50 1 123 101 61 350 0 0 1000 860 858 1019
Nagaland 1 0 0 0 0 0 0 0 0 0 0 0 0 0 02 35 0 9 21 82 241 157 448 6 0 1000 295 295 1083 218 0 2 8 65 214 53 438 2 0 1000 336 330 228all 132 0 5 14 73 227 102 443 4 0 1000 631 624 336
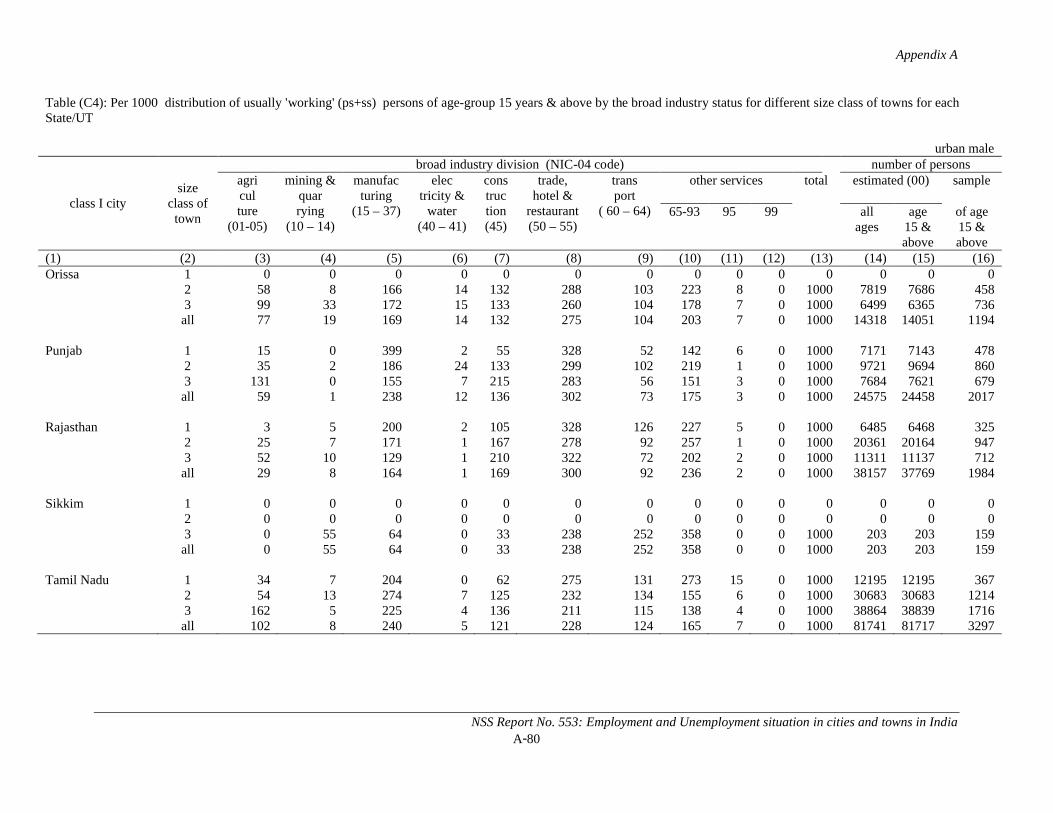
Appendix A
NSS Report No. 553: Employment and Unemployment situation in cities and towns in IndiaA-80
Table (C4): Per 1000 distribution of usually 'working' (ps+ss) persons of age-group 15 years & above by the broad industry status for different size class of towns for each State/UT
urban male
class I citysize
class of town
broad industry division (NIC-04 code) number of personsagriculture
(01-05)
mining & quarrying
(10 – 14)
manufacturing
(15 – 37)
electricity &
water(40 – 41)
construction(45)
trade,hotel &
restaurant(50 – 55)
transport
( 60 – 64)
other services total estimated (00) sample
65-93 95 99 all ages
age15 & above
of age 15 & above
(1) (2) (3) (4) (5) (6) (7) (8) (9) (10) (11) (12) (13) (14) (15) (16)Orissa 1 0 0 0 0 0 0 0 0 0 0 0 0 0 0
2 58 8 166 14 132 288 103 223 8 0 1000 7819 7686 4583 99 33 172 15 133 260 104 178 7 0 1000 6499 6365 736all 77 19 169 14 132 275 104 203 7 0 1000 14318 14051 1194
Punjab 1 15 0 399 2 55 328 52 142 6 0 1000 7171 7143 4782 35 2 186 24 133 299 102 219 1 0 1000 9721 9694 8603 131 0 155 7 215 283 56 151 3 0 1000 7684 7621 679all 59 1 238 12 136 302 73 175 3 0 1000 24575 24458 2017
Rajasthan 1 3 5 200 2 105 328 126 227 5 0 1000 6485 6468 3252 25 7 171 1 167 278 92 257 1 0 1000 20361 20164 9473 52 10 129 1 210 322 72 202 2 0 1000 11311 11137 712all 29 8 164 1 169 300 92 236 2 0 1000 38157 37769 1984
Sikkim 1 0 0 0 0 0 0 0 0 0 0 0 0 0 02 0 0 0 0 0 0 0 0 0 0 0 0 0 03 0 55 64 0 33 238 252 358 0 0 1000 203 203 159all 0 55 64 0 33 238 252 358 0 0 1000 203 203 159
Tamil Nadu 1 34 7 204 0 62 275 131 273 15 0 1000 12195 12195 3672 54 13 274 7 125 232 134 155 6 0 1000 30683 30683 12143 162 5 225 4 136 211 115 138 4 0 1000 38864 38839 1716all 102 8 240 5 121 228 124 165 7 0 1000 81741 81717 3297
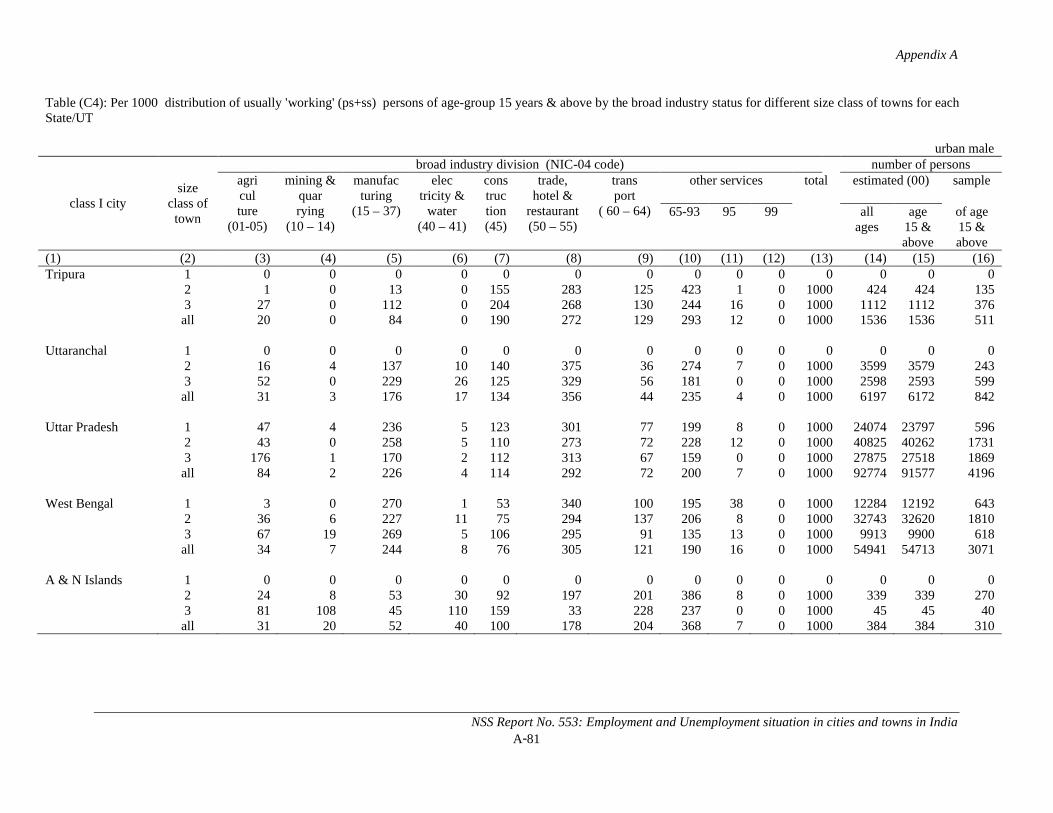
Appendix A
NSS Report No. 553: Employment and Unemployment situation in cities and towns in IndiaA-81
Table (C4): Per 1000 distribution of usually 'working' (ps+ss) persons of age-group 15 years & above by the broad industry status for different size class of towns for each State/UT
urban male
class I citysize
class of town
broad industry division (NIC-04 code) number of personsagriculture
(01-05)
mining & quarrying
(10 – 14)
manufacturing
(15 – 37)
electricity &
water(40 – 41)
construction(45)
trade,hotel &
restaurant(50 – 55)
transport
( 60 – 64)
other services total estimated (00) sample
65-93 95 99 all ages
age15 & above
of age 15 & above
(1) (2) (3) (4) (5) (6) (7) (8) (9) (10) (11) (12) (13) (14) (15) (16)Tripura 1 0 0 0 0 0 0 0 0 0 0 0 0 0 0
2 1 0 13 0 155 283 125 423 1 0 1000 424 424 1353 27 0 112 0 204 268 130 244 16 0 1000 1112 1112 376all 20 0 84 0 190 272 129 293 12 0 1000 1536 1536 511
Uttaranchal 1 0 0 0 0 0 0 0 0 0 0 0 0 0 02 16 4 137 10 140 375 36 274 7 0 1000 3599 3579 2433 52 0 229 26 125 329 56 181 0 0 1000 2598 2593 599all 31 3 176 17 134 356 44 235 4 0 1000 6197 6172 842
Uttar Pradesh 1 47 4 236 5 123 301 77 199 8 0 1000 24074 23797 5962 43 0 258 5 110 273 72 228 12 0 1000 40825 40262 17313 176 1 170 2 112 313 67 159 0 0 1000 27875 27518 1869all 84 2 226 4 114 292 72 200 7 0 1000 92774 91577 4196
West Bengal 1 3 0 270 1 53 340 100 195 38 0 1000 12284 12192 6432 36 6 227 11 75 294 137 206 8 0 1000 32743 32620 18103 67 19 269 5 106 295 91 135 13 0 1000 9913 9900 618all 34 7 244 8 76 305 121 190 16 0 1000 54941 54713 3071
A & N Islands 1 0 0 0 0 0 0 0 0 0 0 0 0 0 02 24 8 53 30 92 197 201 386 8 0 1000 339 339 2703 81 108 45 110 159 33 228 237 0 0 1000 45 45 40all 31 20 52 40 100 178 204 368 7 0 1000 384 384 310
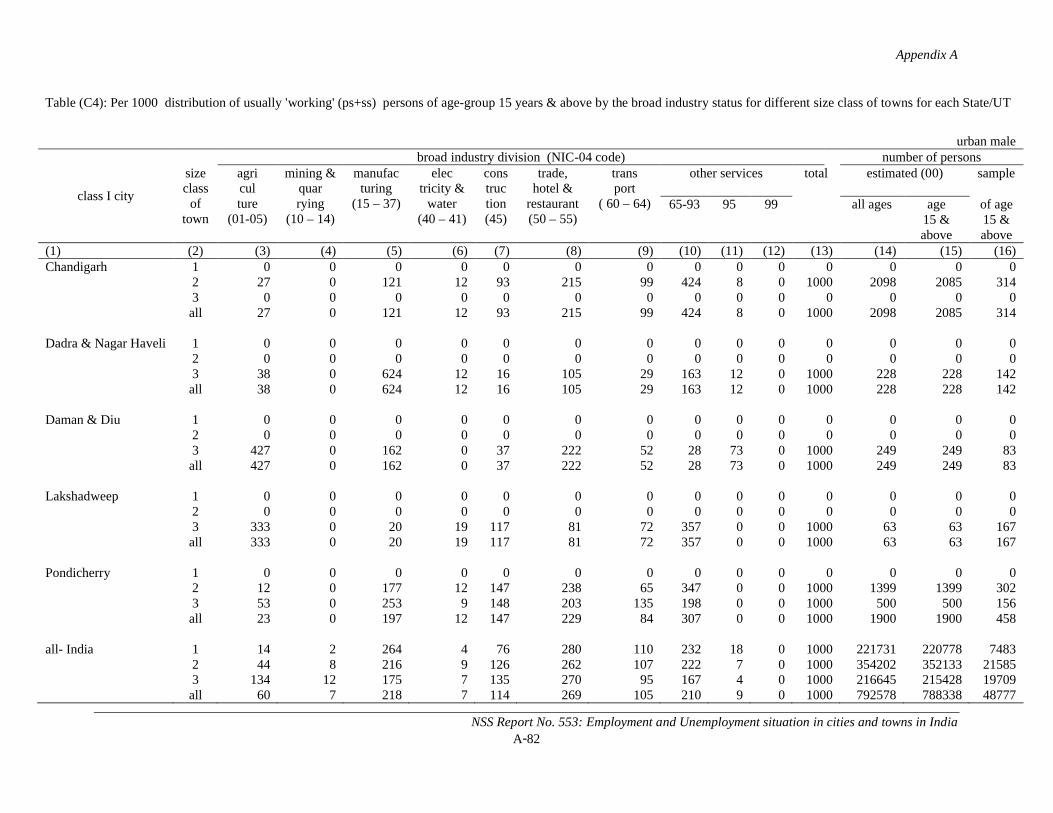
Appendix A
NSS Report No. 553: Employment and Unemployment situation in cities and towns in IndiaA-82
Table (C4): Per 1000 distribution of usually 'working' (ps+ss) persons of age-group 15 years & above by the broad industry status for different size class of towns for each State/UT
urban male
class I city
size class
of town
broad industry division (NIC-04 code) number of personsagriculture
(01-05)
mining & quarrying
(10 – 14)
manufacturing
(15 – 37)
electricity &
water(40 – 41)
construction(45)
trade,hotel &
restaurant(50 – 55)
transport
( 60 – 64)
other services total estimated (00) sample
65-93 95 99 all ages age15 & above
of age 15 & above
(1) (2) (3) (4) (5) (6) (7) (8) (9) (10) (11) (12) (13) (14) (15) (16)Chandigarh 1 0 0 0 0 0 0 0 0 0 0 0 0 0 0
2 27 0 121 12 93 215 99 424 8 0 1000 2098 2085 3143 0 0 0 0 0 0 0 0 0 0 0 0 0 0all 27 0 121 12 93 215 99 424 8 0 1000 2098 2085 314
Dadra & Nagar Haveli 1 0 0 0 0 0 0 0 0 0 0 0 0 0 02 0 0 0 0 0 0 0 0 0 0 0 0 0 03 38 0 624 12 16 105 29 163 12 0 1000 228 228 142all 38 0 624 12 16 105 29 163 12 0 1000 228 228 142
Daman & Diu 1 0 0 0 0 0 0 0 0 0 0 0 0 0 02 0 0 0 0 0 0 0 0 0 0 0 0 0 03 427 0 162 0 37 222 52 28 73 0 1000 249 249 83all 427 0 162 0 37 222 52 28 73 0 1000 249 249 83
Lakshadweep 1 0 0 0 0 0 0 0 0 0 0 0 0 0 02 0 0 0 0 0 0 0 0 0 0 0 0 0 03 333 0 20 19 117 81 72 357 0 0 1000 63 63 167all 333 0 20 19 117 81 72 357 0 0 1000 63 63 167
Pondicherry 1 0 0 0 0 0 0 0 0 0 0 0 0 0 02 12 0 177 12 147 238 65 347 0 0 1000 1399 1399 3023 53 0 253 9 148 203 135 198 0 0 1000 500 500 156all 23 0 197 12 147 229 84 307 0 0 1000 1900 1900 458
all- India 1 14 2 264 4 76 280 110 232 18 0 1000 221731 220778 74832 44 8 216 9 126 262 107 222 7 0 1000 354202 352133 215853 134 12 175 7 135 270 95 167 4 0 1000 216645 215428 19709all 60 7 218 7 114 269 105 210 9 0 1000 792578 788338 48777
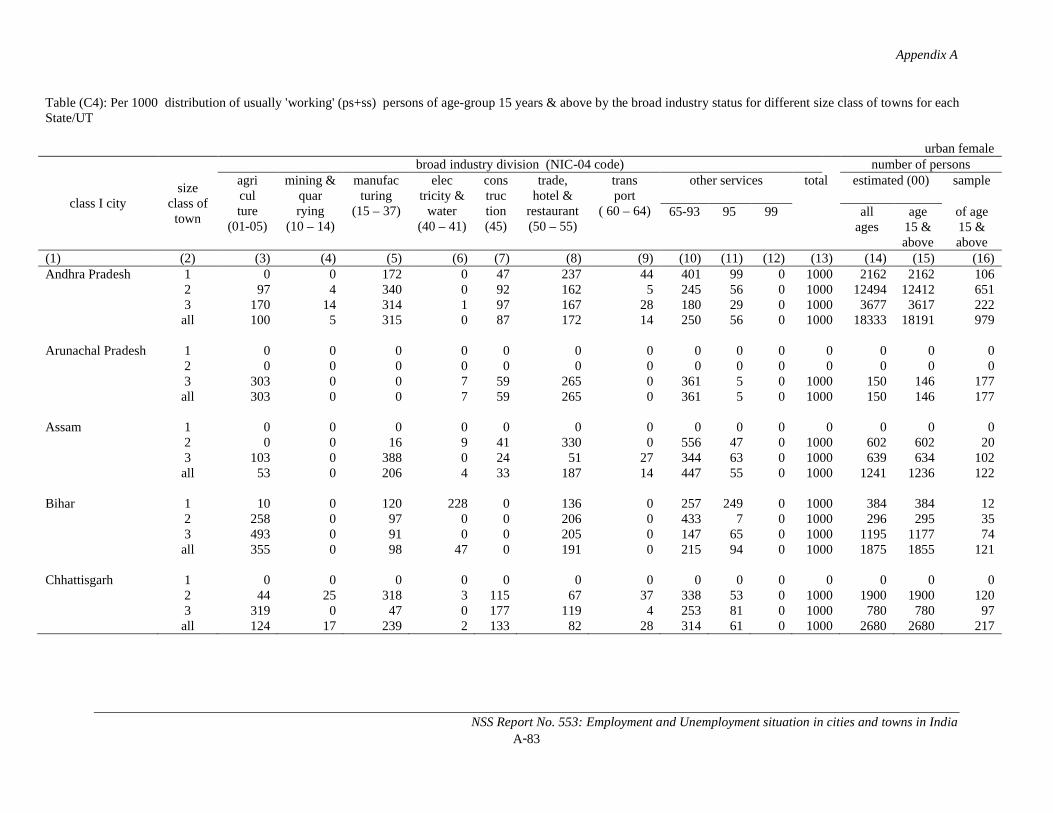
Appendix A
NSS Report No. 553: Employment and Unemployment situation in cities and towns in IndiaA-83
Table (C4): Per 1000 distribution of usually 'working' (ps+ss) persons of age-group 15 years & above by the broad industry status for different size class of towns for each State/UT
urban female
class I citysize
class of town
broad industry division (NIC-04 code) number of personsagriculture
(01-05)
mining & quarrying
(10 – 14)
manufacturing
(15 – 37)
electricity &
water(40 – 41)
construction(45)
trade,hotel &
restaurant(50 – 55)
transport
( 60 – 64)
other services total estimated (00) sample
65-93 95 99 all ages
age15 & above
of age 15 & above
(1) (2) (3) (4) (5) (6) (7) (8) (9) (10) (11) (12) (13) (14) (15) (16)Andhra Pradesh 1 0 0 172 0 47 237 44 401 99 0 1000 2162 2162 106
2 97 4 340 0 92 162 5 245 56 0 1000 12494 12412 6513 170 14 314 1 97 167 28 180 29 0 1000 3677 3617 222all 100 5 315 0 87 172 14 250 56 0 1000 18333 18191 979
Arunachal Pradesh 1 0 0 0 0 0 0 0 0 0 0 0 0 0 02 0 0 0 0 0 0 0 0 0 0 0 0 0 03 303 0 0 7 59 265 0 361 5 0 1000 150 146 177all 303 0 0 7 59 265 0 361 5 0 1000 150 146 177
Assam 1 0 0 0 0 0 0 0 0 0 0 0 0 0 02 0 0 16 9 41 330 0 556 47 0 1000 602 602 203 103 0 388 0 24 51 27 344 63 0 1000 639 634 102all 53 0 206 4 33 187 14 447 55 0 1000 1241 1236 122
Bihar 1 10 0 120 228 0 136 0 257 249 0 1000 384 384 122 258 0 97 0 0 206 0 433 7 0 1000 296 295 353 493 0 91 0 0 205 0 147 65 0 1000 1195 1177 74all 355 0 98 47 0 191 0 215 94 0 1000 1875 1855 121
Chhattisgarh 1 0 0 0 0 0 0 0 0 0 0 0 0 0 02 44 25 318 3 115 67 37 338 53 0 1000 1900 1900 1203 319 0 47 0 177 119 4 253 81 0 1000 780 780 97all 124 17 239 2 133 82 28 314 61 0 1000 2680 2680 217
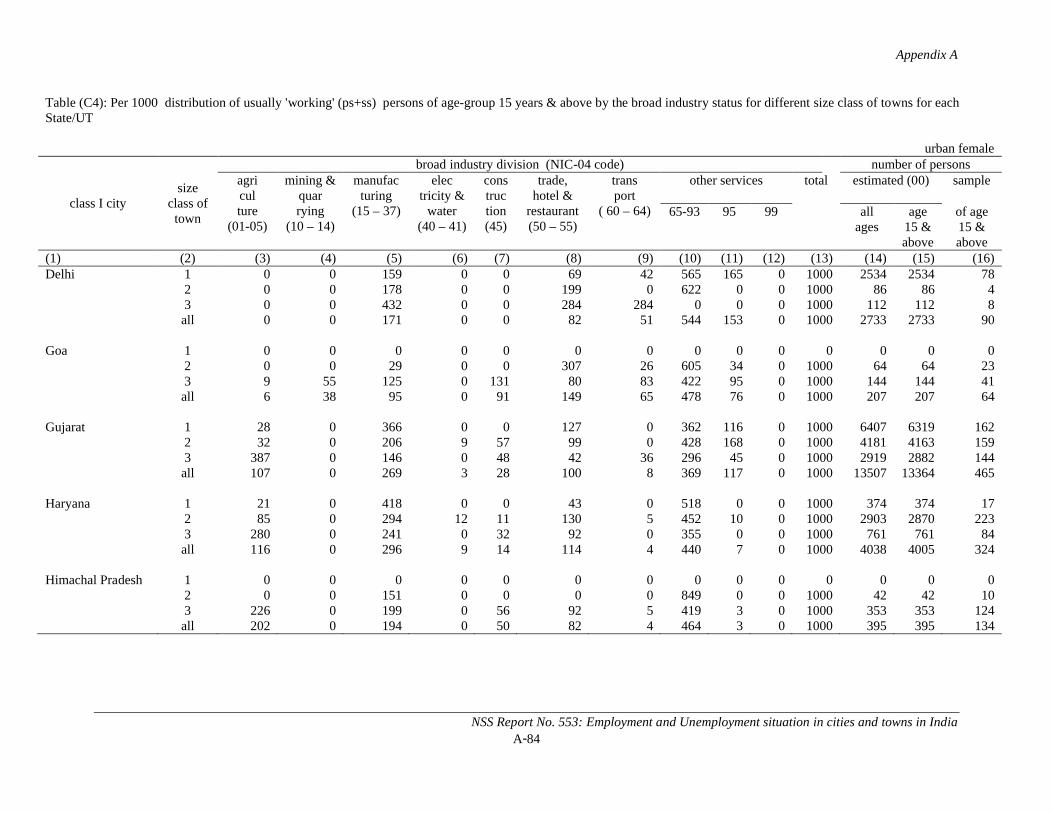
Appendix A
NSS Report No. 553: Employment and Unemployment situation in cities and towns in IndiaA-84
Table (C4): Per 1000 distribution of usually 'working' (ps+ss) persons of age-group 15 years & above by the broad industry status for different size class of towns for each State/UT
urban female
class I citysize
class of town
broad industry division (NIC-04 code) number of personsagriculture
(01-05)
mining & quarrying
(10 – 14)
manufacturing
(15 – 37)
electricity &
water(40 – 41)
construction(45)
trade,hotel &
restaurant(50 – 55)
transport
( 60 – 64)
other services total estimated (00) sample
65-93 95 99 all ages
age15 & above
of age 15 & above
(1) (2) (3) (4) (5) (6) (7) (8) (9) (10) (11) (12) (13) (14) (15) (16)Delhi 1 0 0 159 0 0 69 42 565 165 0 1000 2534 2534 78
2 0 0 178 0 0 199 0 622 0 0 1000 86 86 43 0 0 432 0 0 284 284 0 0 0 1000 112 112 8all 0 0 171 0 0 82 51 544 153 0 1000 2733 2733 90
Goa 1 0 0 0 0 0 0 0 0 0 0 0 0 0 02 0 0 29 0 0 307 26 605 34 0 1000 64 64 233 9 55 125 0 131 80 83 422 95 0 1000 144 144 41all 6 38 95 0 91 149 65 478 76 0 1000 207 207 64
Gujarat 1 28 0 366 0 0 127 0 362 116 0 1000 6407 6319 1622 32 0 206 9 57 99 0 428 168 0 1000 4181 4163 1593 387 0 146 0 48 42 36 296 45 0 1000 2919 2882 144all 107 0 269 3 28 100 8 369 117 0 1000 13507 13364 465
Haryana 1 21 0 418 0 0 43 0 518 0 0 1000 374 374 172 85 0 294 12 11 130 5 452 10 0 1000 2903 2870 2233 280 0 241 0 32 92 0 355 0 0 1000 761 761 84all 116 0 296 9 14 114 4 440 7 0 1000 4038 4005 324
Himachal Pradesh 1 0 0 0 0 0 0 0 0 0 0 0 0 0 02 0 0 151 0 0 0 0 849 0 0 1000 42 42 103 226 0 199 0 56 92 5 419 3 0 1000 353 353 124all 202 0 194 0 50 82 4 464 3 0 1000 395 395 134
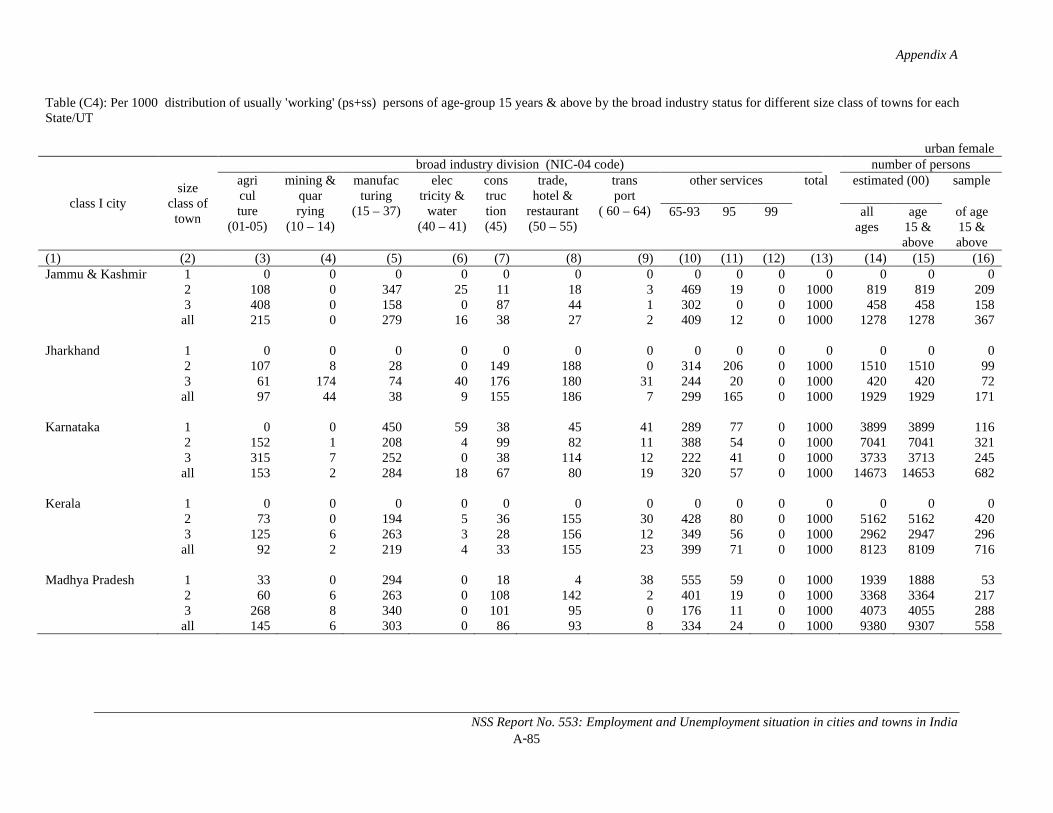
Appendix A
NSS Report No. 553: Employment and Unemployment situation in cities and towns in IndiaA-85
Table (C4): Per 1000 distribution of usually 'working' (ps+ss) persons of age-group 15 years & above by the broad industry status for different size class of towns for each State/UT
urban female
class I citysize
class of town
broad industry division (NIC-04 code) number of personsagriculture
(01-05)
mining & quarrying
(10 – 14)
manufacturing
(15 – 37)
electricity &
water(40 – 41)
construction(45)
trade,hotel &
restaurant(50 – 55)
transport
( 60 – 64)
other services total estimated (00) sample
65-93 95 99 all ages
age15 & above
of age 15 & above
(1) (2) (3) (4) (5) (6) (7) (8) (9) (10) (11) (12) (13) (14) (15) (16)Jammu & Kashmir 1 0 0 0 0 0 0 0 0 0 0 0 0 0 0
2 108 0 347 25 11 18 3 469 19 0 1000 819 819 2093 408 0 158 0 87 44 1 302 0 0 1000 458 458 158all 215 0 279 16 38 27 2 409 12 0 1000 1278 1278 367
Jharkhand 1 0 0 0 0 0 0 0 0 0 0 0 0 0 02 107 8 28 0 149 188 0 314 206 0 1000 1510 1510 993 61 174 74 40 176 180 31 244 20 0 1000 420 420 72all 97 44 38 9 155 186 7 299 165 0 1000 1929 1929 171
Karnataka 1 0 0 450 59 38 45 41 289 77 0 1000 3899 3899 1162 152 1 208 4 99 82 11 388 54 0 1000 7041 7041 3213 315 7 252 0 38 114 12 222 41 0 1000 3733 3713 245all 153 2 284 18 67 80 19 320 57 0 1000 14673 14653 682
Kerala 1 0 0 0 0 0 0 0 0 0 0 0 0 0 02 73 0 194 5 36 155 30 428 80 0 1000 5162 5162 4203 125 6 263 3 28 156 12 349 56 0 1000 2962 2947 296all 92 2 219 4 33 155 23 399 71 0 1000 8123 8109 716
Madhya Pradesh 1 33 0 294 0 18 4 38 555 59 0 1000 1939 1888 532 60 6 263 0 108 142 2 401 19 0 1000 3368 3364 2173 268 8 340 0 101 95 0 176 11 0 1000 4073 4055 288all 145 6 303 0 86 93 8 334 24 0 1000 9380 9307 558
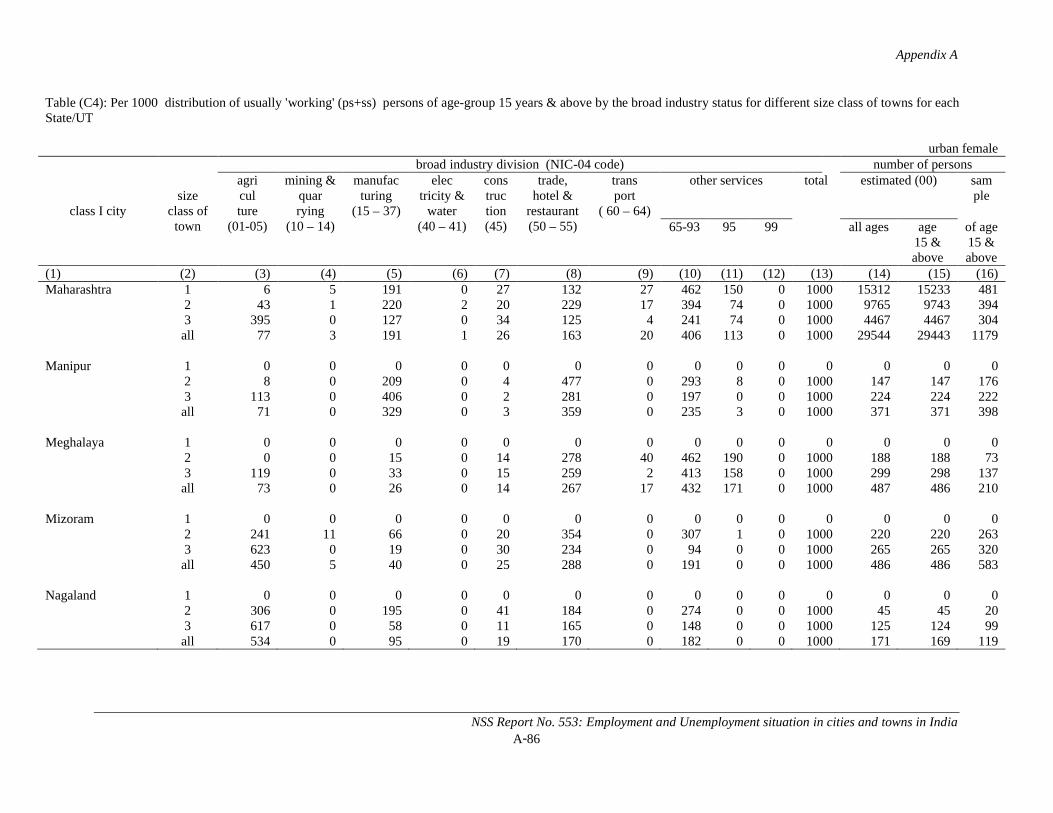
Appendix A
NSS Report No. 553: Employment and Unemployment situation in cities and towns in IndiaA-86
Table (C4): Per 1000 distribution of usually 'working' (ps+ss) persons of age-group 15 years & above by the broad industry status for different size class of towns for each State/UT
urban female
class I citysize
class of town
broad industry division (NIC-04 code) number of personsagriculture
(01-05)
mining & quarrying
(10 – 14)
manufacturing
(15 – 37)
electricity &
water(40 – 41)
construction(45)
trade,hotel &
restaurant(50 – 55)
transport
( 60 – 64)
other services total estimated (00) sample
65-93 95 99 all ages age15 & above
of age 15 & above
(1) (2) (3) (4) (5) (6) (7) (8) (9) (10) (11) (12) (13) (14) (15) (16)Maharashtra 1 6 5 191 0 27 132 27 462 150 0 1000 15312 15233 481
2 43 1 220 2 20 229 17 394 74 0 1000 9765 9743 3943 395 0 127 0 34 125 4 241 74 0 1000 4467 4467 304all 77 3 191 1 26 163 20 406 113 0 1000 29544 29443 1179
Manipur 1 0 0 0 0 0 0 0 0 0 0 0 0 0 02 8 0 209 0 4 477 0 293 8 0 1000 147 147 1763 113 0 406 0 2 281 0 197 0 0 1000 224 224 222all 71 0 329 0 3 359 0 235 3 0 1000 371 371 398
Meghalaya 1 0 0 0 0 0 0 0 0 0 0 0 0 0 02 0 0 15 0 14 278 40 462 190 0 1000 188 188 733 119 0 33 0 15 259 2 413 158 0 1000 299 298 137all 73 0 26 0 14 267 17 432 171 0 1000 487 486 210
Mizoram 1 0 0 0 0 0 0 0 0 0 0 0 0 0 02 241 11 66 0 20 354 0 307 1 0 1000 220 220 2633 623 0 19 0 30 234 0 94 0 0 1000 265 265 320all 450 5 40 0 25 288 0 191 0 0 1000 486 486 583
Nagaland 1 0 0 0 0 0 0 0 0 0 0 0 0 0 02 306 0 195 0 41 184 0 274 0 0 1000 45 45 203 617 0 58 0 11 165 0 148 0 0 1000 125 124 99all 534 0 95 0 19 170 0 182 0 0 1000 171 169 119
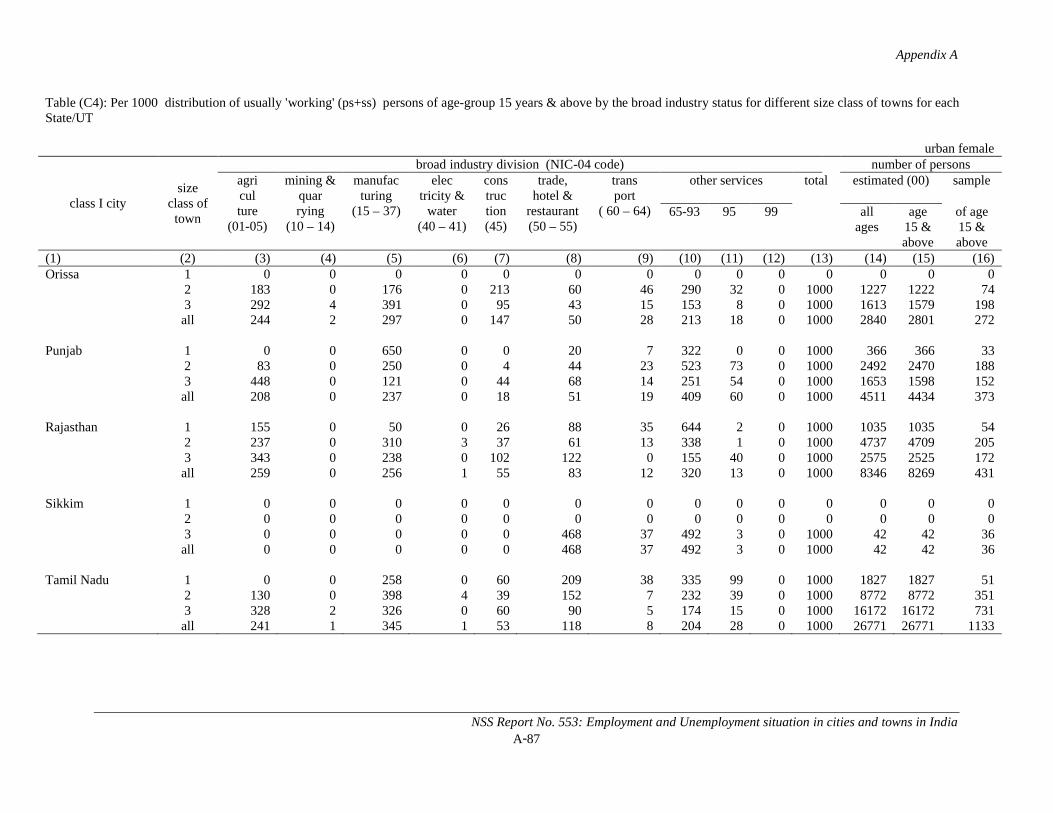
Appendix A
NSS Report No. 553: Employment and Unemployment situation in cities and towns in IndiaA-87
Table (C4): Per 1000 distribution of usually 'working' (ps+ss) persons of age-group 15 years & above by the broad industry status for different size class of towns for each State/UT
urban female
class I citysize
class of town
broad industry division (NIC-04 code) number of personsagriculture
(01-05)
mining & quarrying
(10 – 14)
manufacturing
(15 – 37)
electricity &
water(40 – 41)
construction(45)
trade,hotel &
restaurant(50 – 55)
transport
( 60 – 64)
other services total estimated (00) sample
65-93 95 99 all ages
age15 & above
of age 15 & above
(1) (2) (3) (4) (5) (6) (7) (8) (9) (10) (11) (12) (13) (14) (15) (16)Orissa 1 0 0 0 0 0 0 0 0 0 0 0 0 0 0
2 183 0 176 0 213 60 46 290 32 0 1000 1227 1222 743 292 4 391 0 95 43 15 153 8 0 1000 1613 1579 198all 244 2 297 0 147 50 28 213 18 0 1000 2840 2801 272
Punjab 1 0 0 650 0 0 20 7 322 0 0 1000 366 366 332 83 0 250 0 4 44 23 523 73 0 1000 2492 2470 1883 448 0 121 0 44 68 14 251 54 0 1000 1653 1598 152all 208 0 237 0 18 51 19 409 60 0 1000 4511 4434 373
Rajasthan 1 155 0 50 0 26 88 35 644 2 0 1000 1035 1035 542 237 0 310 3 37 61 13 338 1 0 1000 4737 4709 2053 343 0 238 0 102 122 0 155 40 0 1000 2575 2525 172all 259 0 256 1 55 83 12 320 13 0 1000 8346 8269 431
Sikkim 1 0 0 0 0 0 0 0 0 0 0 0 0 0 02 0 0 0 0 0 0 0 0 0 0 0 0 0 03 0 0 0 0 0 468 37 492 3 0 1000 42 42 36all 0 0 0 0 0 468 37 492 3 0 1000 42 42 36
Tamil Nadu 1 0 0 258 0 60 209 38 335 99 0 1000 1827 1827 512 130 0 398 4 39 152 7 232 39 0 1000 8772 8772 3513 328 2 326 0 60 90 5 174 15 0 1000 16172 16172 731all 241 1 345 1 53 118 8 204 28 0 1000 26771 26771 1133
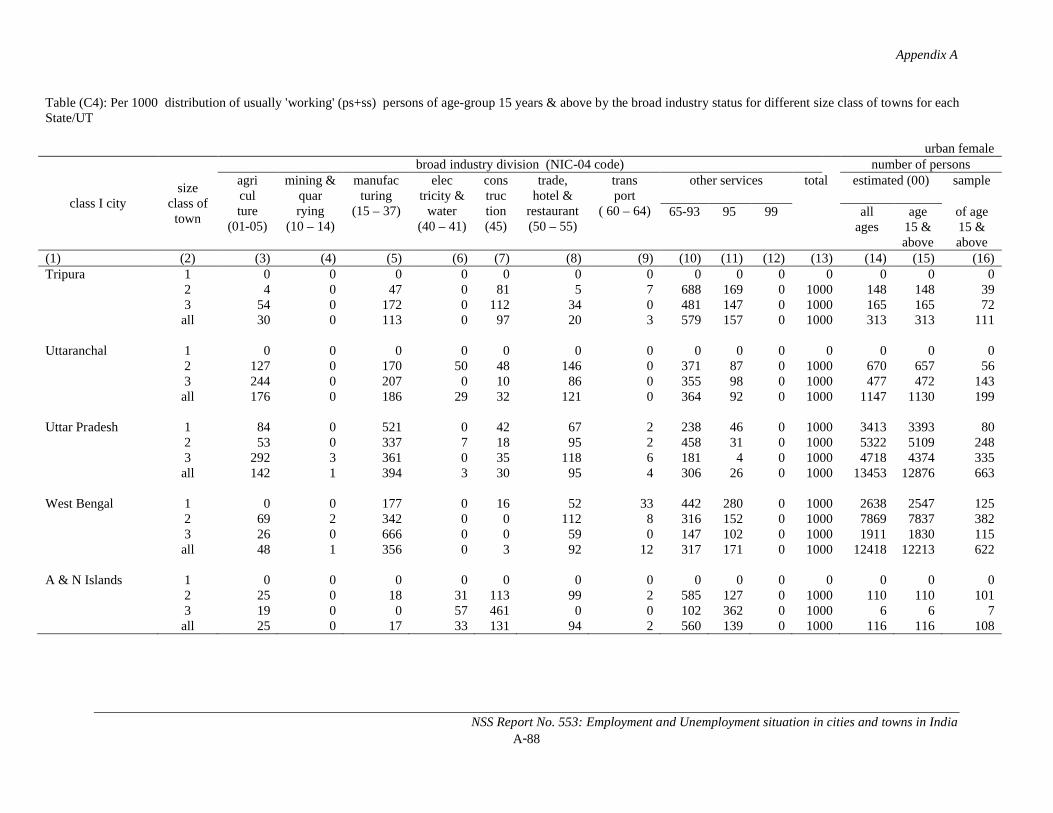
Appendix A
NSS Report No. 553: Employment and Unemployment situation in cities and towns in IndiaA-88
Table (C4): Per 1000 distribution of usually 'working' (ps+ss) persons of age-group 15 years & above by the broad industry status for different size class of towns for each State/UT
urban female
class I citysize
class of town
broad industry division (NIC-04 code) number of personsagriculture
(01-05)
mining & quarrying
(10 – 14)
manufacturing
(15 – 37)
electricity &
water(40 – 41)
construction(45)
trade,hotel &
restaurant(50 – 55)
transport
( 60 – 64)
other services total estimated (00) sample
65-93 95 99 all ages
age15 & above
of age 15 & above
(1) (2) (3) (4) (5) (6) (7) (8) (9) (10) (11) (12) (13) (14) (15) (16)Tripura 1 0 0 0 0 0 0 0 0 0 0 0 0 0 0
2 4 0 47 0 81 5 7 688 169 0 1000 148 148 393 54 0 172 0 112 34 0 481 147 0 1000 165 165 72all 30 0 113 0 97 20 3 579 157 0 1000 313 313 111
Uttaranchal 1 0 0 0 0 0 0 0 0 0 0 0 0 0 02 127 0 170 50 48 146 0 371 87 0 1000 670 657 563 244 0 207 0 10 86 0 355 98 0 1000 477 472 143all 176 0 186 29 32 121 0 364 92 0 1000 1147 1130 199
Uttar Pradesh 1 84 0 521 0 42 67 2 238 46 0 1000 3413 3393 802 53 0 337 7 18 95 2 458 31 0 1000 5322 5109 2483 292 3 361 0 35 118 6 181 4 0 1000 4718 4374 335all 142 1 394 3 30 95 4 306 26 0 1000 13453 12876 663
West Bengal 1 0 0 177 0 16 52 33 442 280 0 1000 2638 2547 1252 69 2 342 0 0 112 8 316 152 0 1000 7869 7837 3823 26 0 666 0 0 59 0 147 102 0 1000 1911 1830 115all 48 1 356 0 3 92 12 317 171 0 1000 12418 12213 622
A & N Islands 1 0 0 0 0 0 0 0 0 0 0 0 0 0 02 25 0 18 31 113 99 2 585 127 0 1000 110 110 1013 19 0 0 57 461 0 0 102 362 0 1000 6 6 7all 25 0 17 33 131 94 2 560 139 0 1000 116 116 108
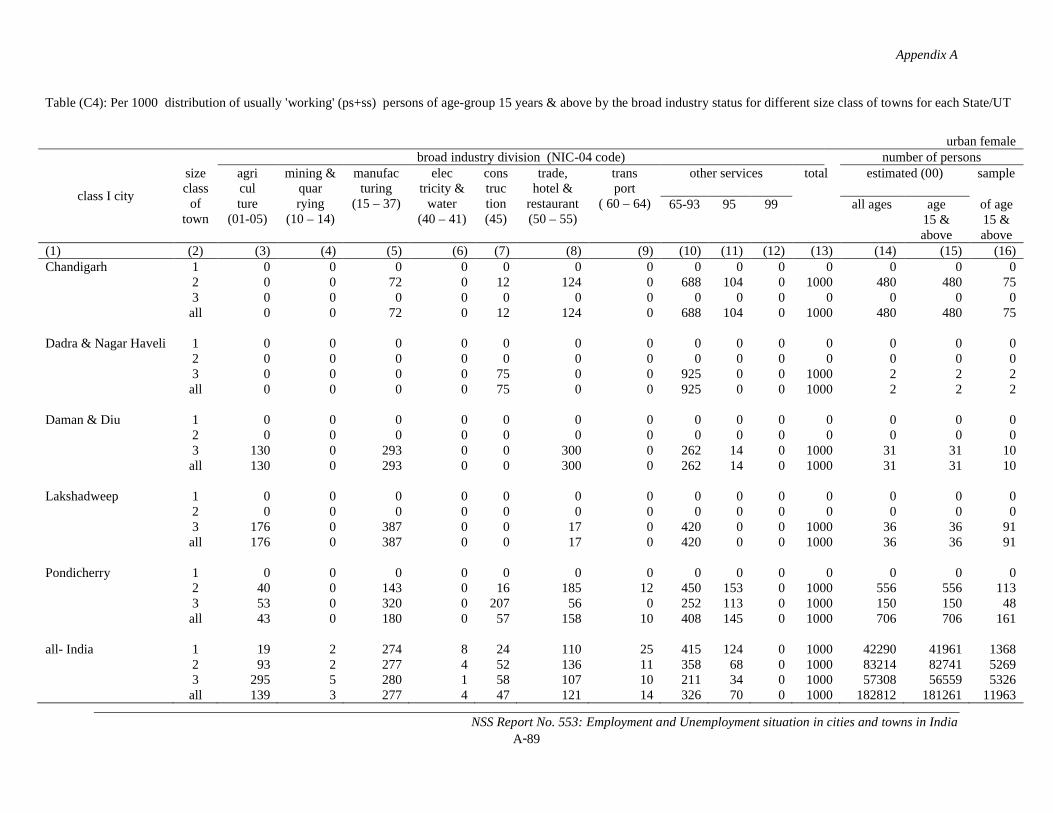
Appendix A
NSS Report No. 553: Employment and Unemployment situation in cities and towns in IndiaA-89
Table (C4): Per 1000 distribution of usually 'working' (ps+ss) persons of age-group 15 years & above by the broad industry status for different size class of towns for each State/UT
urban female
class I city
size class
of town
broad industry division (NIC-04 code) number of personsagriculture
(01-05)
mining & quarrying
(10 – 14)
manufacturing
(15 – 37)
electricity &
water(40 – 41)
construction(45)
trade,hotel &
restaurant(50 – 55)
transport
( 60 – 64)
other services total estimated (00) sample
65-93 95 99 all ages age15 & above
of age 15 & above
(1) (2) (3) (4) (5) (6) (7) (8) (9) (10) (11) (12) (13) (14) (15) (16)Chandigarh 1 0 0 0 0 0 0 0 0 0 0 0 0 0 0
2 0 0 72 0 12 124 0 688 104 0 1000 480 480 753 0 0 0 0 0 0 0 0 0 0 0 0 0 0all 0 0 72 0 12 124 0 688 104 0 1000 480 480 75
Dadra & Nagar Haveli 1 0 0 0 0 0 0 0 0 0 0 0 0 0 02 0 0 0 0 0 0 0 0 0 0 0 0 0 03 0 0 0 0 75 0 0 925 0 0 1000 2 2 2all 0 0 0 0 75 0 0 925 0 0 1000 2 2 2
Daman & Diu 1 0 0 0 0 0 0 0 0 0 0 0 0 0 02 0 0 0 0 0 0 0 0 0 0 0 0 0 03 130 0 293 0 0 300 0 262 14 0 1000 31 31 10all 130 0 293 0 0 300 0 262 14 0 1000 31 31 10
Lakshadweep 1 0 0 0 0 0 0 0 0 0 0 0 0 0 02 0 0 0 0 0 0 0 0 0 0 0 0 0 03 176 0 387 0 0 17 0 420 0 0 1000 36 36 91all 176 0 387 0 0 17 0 420 0 0 1000 36 36 91
Pondicherry 1 0 0 0 0 0 0 0 0 0 0 0 0 0 02 40 0 143 0 16 185 12 450 153 0 1000 556 556 1133 53 0 320 0 207 56 0 252 113 0 1000 150 150 48all 43 0 180 0 57 158 10 408 145 0 1000 706 706 161
all- India 1 19 2 274 8 24 110 25 415 124 0 1000 42290 41961 13682 93 2 277 4 52 136 11 358 68 0 1000 83214 82741 52693 295 5 280 1 58 107 10 211 34 0 1000 57308 56559 5326all 139 3 277 4 47 121 14 326 70 0 1000 182812 181261 11963
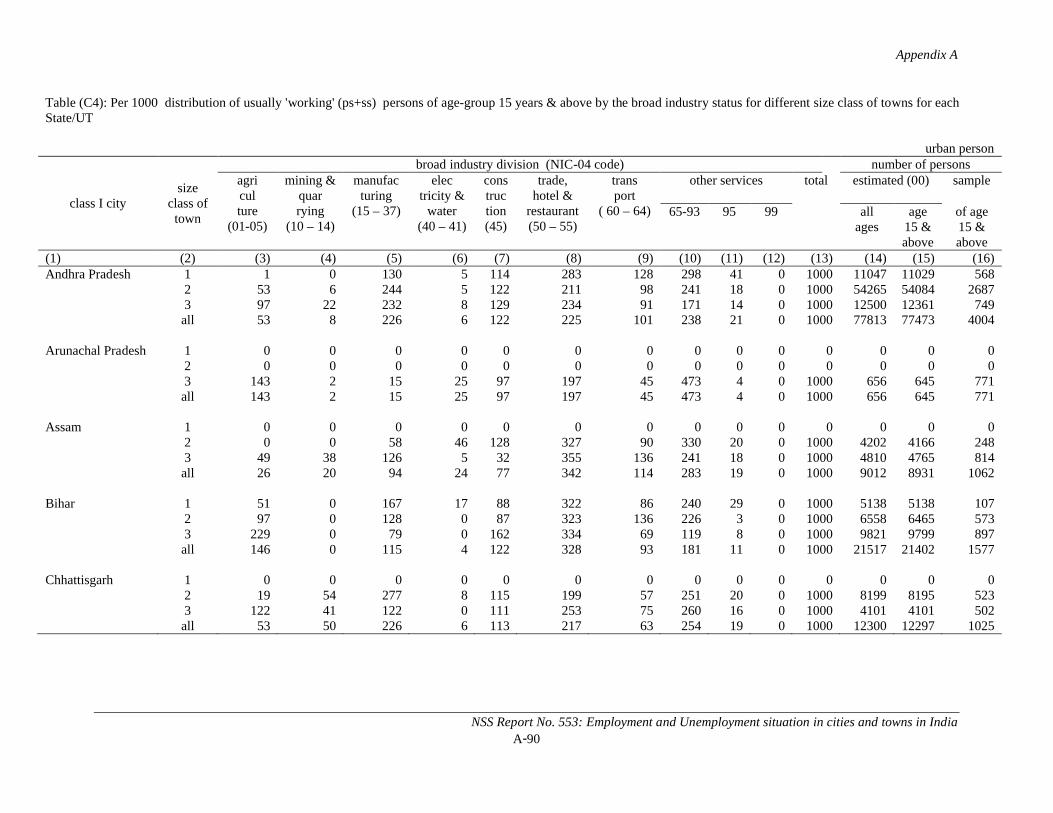
Appendix A
NSS Report No. 553: Employment and Unemployment situation in cities and towns in IndiaA-90
Table (C4): Per 1000 distribution of usually 'working' (ps+ss) persons of age-group 15 years & above by the broad industry status for different size class of towns for each State/UT
urban person
class I citysize
class of town
broad industry division (NIC-04 code) number of personsagriculture
(01-05)
mining & quarrying
(10 – 14)
manufacturing
(15 – 37)
electricity &
water(40 – 41)
construction(45)
trade,hotel &
restaurant(50 – 55)
transport
( 60 – 64)
other services total estimated (00) sample
65-93 95 99 all ages
age15 & above
of age 15 & above
(1) (2) (3) (4) (5) (6) (7) (8) (9) (10) (11) (12) (13) (14) (15) (16)Andhra Pradesh 1 1 0 130 5 114 283 128 298 41 0 1000 11047 11029 568
2 53 6 244 5 122 211 98 241 18 0 1000 54265 54084 26873 97 22 232 8 129 234 91 171 14 0 1000 12500 12361 749all 53 8 226 6 122 225 101 238 21 0 1000 77813 77473 4004
Arunachal Pradesh 1 0 0 0 0 0 0 0 0 0 0 0 0 0 02 0 0 0 0 0 0 0 0 0 0 0 0 0 03 143 2 15 25 97 197 45 473 4 0 1000 656 645 771all 143 2 15 25 97 197 45 473 4 0 1000 656 645 771
Assam 1 0 0 0 0 0 0 0 0 0 0 0 0 0 02 0 0 58 46 128 327 90 330 20 0 1000 4202 4166 2483 49 38 126 5 32 355 136 241 18 0 1000 4810 4765 814all 26 20 94 24 77 342 114 283 19 0 1000 9012 8931 1062
Bihar 1 51 0 167 17 88 322 86 240 29 0 1000 5138 5138 1072 97 0 128 0 87 323 136 226 3 0 1000 6558 6465 5733 229 0 79 0 162 334 69 119 8 0 1000 9821 9799 897all 146 0 115 4 122 328 93 181 11 0 1000 21517 21402 1577
Chhattisgarh 1 0 0 0 0 0 0 0 0 0 0 0 0 0 02 19 54 277 8 115 199 57 251 20 0 1000 8199 8195 5233 122 41 122 0 111 253 75 260 16 0 1000 4101 4101 502all 53 50 226 6 113 217 63 254 19 0 1000 12300 12297 1025
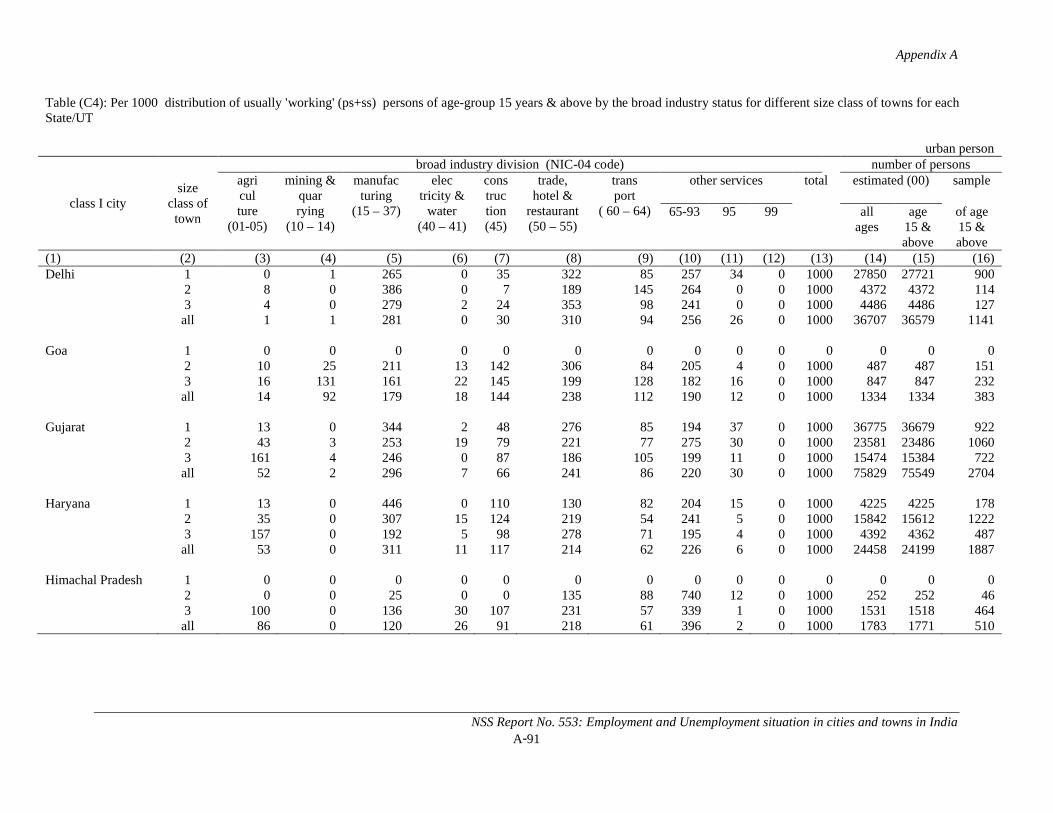
Appendix A
NSS Report No. 553: Employment and Unemployment situation in cities and towns in IndiaA-91
Table (C4): Per 1000 distribution of usually 'working' (ps+ss) persons of age-group 15 years & above by the broad industry status for different size class of towns for each State/UT
urban person
class I citysize
class of town
broad industry division (NIC-04 code) number of personsagriculture
(01-05)
mining & quarrying
(10 – 14)
manufacturing
(15 – 37)
electricity &
water(40 – 41)
construction(45)
trade,hotel &
restaurant(50 – 55)
transport
( 60 – 64)
other services total estimated (00) sample
65-93 95 99 all ages
age15 & above
of age 15 & above
(1) (2) (3) (4) (5) (6) (7) (8) (9) (10) (11) (12) (13) (14) (15) (16)Delhi 1 0 1 265 0 35 322 85 257 34 0 1000 27850 27721 900
2 8 0 386 0 7 189 145 264 0 0 1000 4372 4372 1143 4 0 279 2 24 353 98 241 0 0 1000 4486 4486 127all 1 1 281 0 30 310 94 256 26 0 1000 36707 36579 1141
Goa 1 0 0 0 0 0 0 0 0 0 0 0 0 0 02 10 25 211 13 142 306 84 205 4 0 1000 487 487 1513 16 131 161 22 145 199 128 182 16 0 1000 847 847 232all 14 92 179 18 144 238 112 190 12 0 1000 1334 1334 383
Gujarat 1 13 0 344 2 48 276 85 194 37 0 1000 36775 36679 9222 43 3 253 19 79 221 77 275 30 0 1000 23581 23486 10603 161 4 246 0 87 186 105 199 11 0 1000 15474 15384 722all 52 2 296 7 66 241 86 220 30 0 1000 75829 75549 2704
Haryana 1 13 0 446 0 110 130 82 204 15 0 1000 4225 4225 1782 35 0 307 15 124 219 54 241 5 0 1000 15842 15612 12223 157 0 192 5 98 278 71 195 4 0 1000 4392 4362 487all 53 0 311 11 117 214 62 226 6 0 1000 24458 24199 1887
Himachal Pradesh 1 0 0 0 0 0 0 0 0 0 0 0 0 0 02 0 0 25 0 0 135 88 740 12 0 1000 252 252 463 100 0 136 30 107 231 57 339 1 0 1000 1531 1518 464all 86 0 120 26 91 218 61 396 2 0 1000 1783 1771 510
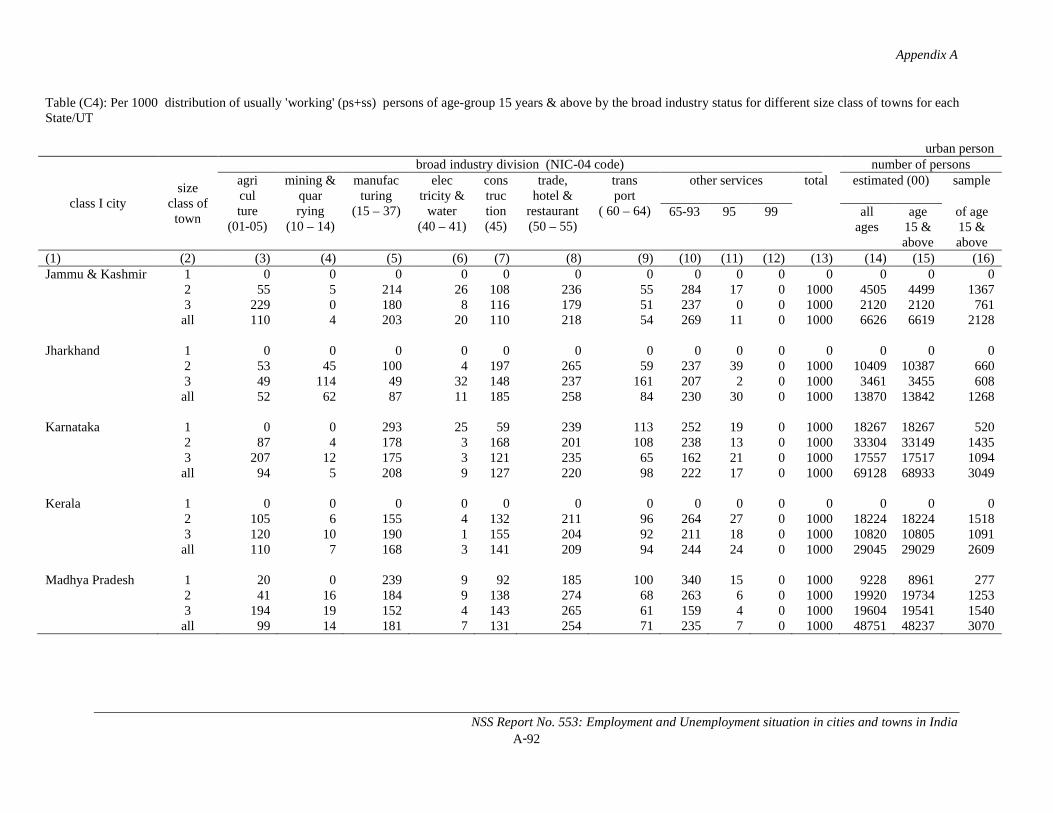
Appendix A
NSS Report No. 553: Employment and Unemployment situation in cities and towns in IndiaA-92
Table (C4): Per 1000 distribution of usually 'working' (ps+ss) persons of age-group 15 years & above by the broad industry status for different size class of towns for each State/UT
urban person
class I citysize
class of town
broad industry division (NIC-04 code) number of personsagriculture
(01-05)
mining & quarrying
(10 – 14)
manufacturing
(15 – 37)
electricity &
water(40 – 41)
construction(45)
trade,hotel &
restaurant(50 – 55)
transport
( 60 – 64)
other services total estimated (00) sample
65-93 95 99 all ages
age15 & above
of age 15 & above
(1) (2) (3) (4) (5) (6) (7) (8) (9) (10) (11) (12) (13) (14) (15) (16)Jammu & Kashmir 1 0 0 0 0 0 0 0 0 0 0 0 0 0 0
2 55 5 214 26 108 236 55 284 17 0 1000 4505 4499 13673 229 0 180 8 116 179 51 237 0 0 1000 2120 2120 761all 110 4 203 20 110 218 54 269 11 0 1000 6626 6619 2128
Jharkhand 1 0 0 0 0 0 0 0 0 0 0 0 0 0 02 53 45 100 4 197 265 59 237 39 0 1000 10409 10387 6603 49 114 49 32 148 237 161 207 2 0 1000 3461 3455 608all 52 62 87 11 185 258 84 230 30 0 1000 13870 13842 1268
Karnataka 1 0 0 293 25 59 239 113 252 19 0 1000 18267 18267 5202 87 4 178 3 168 201 108 238 13 0 1000 33304 33149 14353 207 12 175 3 121 235 65 162 21 0 1000 17557 17517 1094all 94 5 208 9 127 220 98 222 17 0 1000 69128 68933 3049
Kerala 1 0 0 0 0 0 0 0 0 0 0 0 0 0 02 105 6 155 4 132 211 96 264 27 0 1000 18224 18224 15183 120 10 190 1 155 204 92 211 18 0 1000 10820 10805 1091all 110 7 168 3 141 209 94 244 24 0 1000 29045 29029 2609
Madhya Pradesh 1 20 0 239 9 92 185 100 340 15 0 1000 9228 8961 2772 41 16 184 9 138 274 68 263 6 0 1000 19920 19734 12533 194 19 152 4 143 265 61 159 4 0 1000 19604 19541 1540all 99 14 181 7 131 254 71 235 7 0 1000 48751 48237 3070
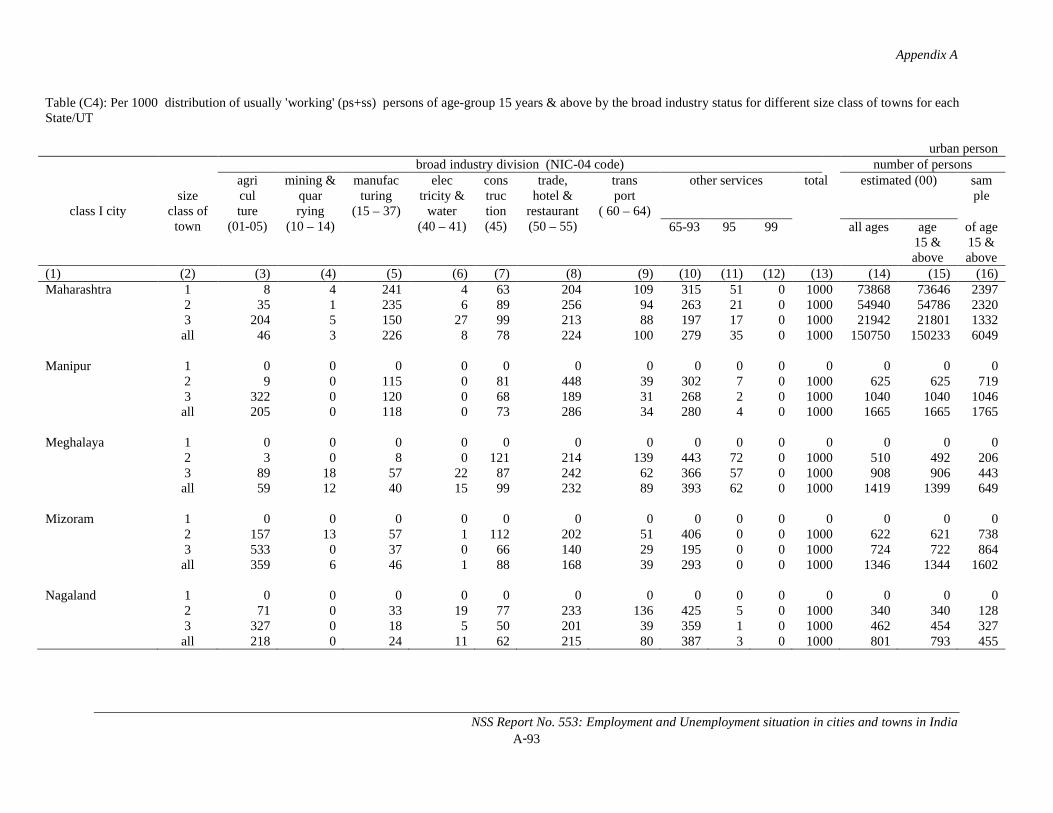
Appendix A
NSS Report No. 553: Employment and Unemployment situation in cities and towns in IndiaA-93
Table (C4): Per 1000 distribution of usually 'working' (ps+ss) persons of age-group 15 years & above by the broad industry status for different size class of towns for each State/UT
urban person
class I citysize
class of town
broad industry division (NIC-04 code) number of personsagriculture
(01-05)
mining & quarrying
(10 – 14)
manufacturing
(15 – 37)
electricity &
water(40 – 41)
construction(45)
trade,hotel &
restaurant(50 – 55)
transport
( 60 – 64)
other services total estimated (00) sample
65-93 95 99 all ages age15 & above
of age 15 & above
(1) (2) (3) (4) (5) (6) (7) (8) (9) (10) (11) (12) (13) (14) (15) (16)Maharashtra 1 8 4 241 4 63 204 109 315 51 0 1000 73868 73646 2397
2 35 1 235 6 89 256 94 263 21 0 1000 54940 54786 23203 204 5 150 27 99 213 88 197 17 0 1000 21942 21801 1332all 46 3 226 8 78 224 100 279 35 0 1000 150750 150233 6049
Manipur 1 0 0 0 0 0 0 0 0 0 0 0 0 0 02 9 0 115 0 81 448 39 302 7 0 1000 625 625 7193 322 0 120 0 68 189 31 268 2 0 1000 1040 1040 1046all 205 0 118 0 73 286 34 280 4 0 1000 1665 1665 1765
Meghalaya 1 0 0 0 0 0 0 0 0 0 0 0 0 0 02 3 0 8 0 121 214 139 443 72 0 1000 510 492 2063 89 18 57 22 87 242 62 366 57 0 1000 908 906 443all 59 12 40 15 99 232 89 393 62 0 1000 1419 1399 649
Mizoram 1 0 0 0 0 0 0 0 0 0 0 0 0 0 02 157 13 57 1 112 202 51 406 0 0 1000 622 621 7383 533 0 37 0 66 140 29 195 0 0 1000 724 722 864all 359 6 46 1 88 168 39 293 0 0 1000 1346 1344 1602
Nagaland 1 0 0 0 0 0 0 0 0 0 0 0 0 0 02 71 0 33 19 77 233 136 425 5 0 1000 340 340 1283 327 0 18 5 50 201 39 359 1 0 1000 462 454 327all 218 0 24 11 62 215 80 387 3 0 1000 801 793 455
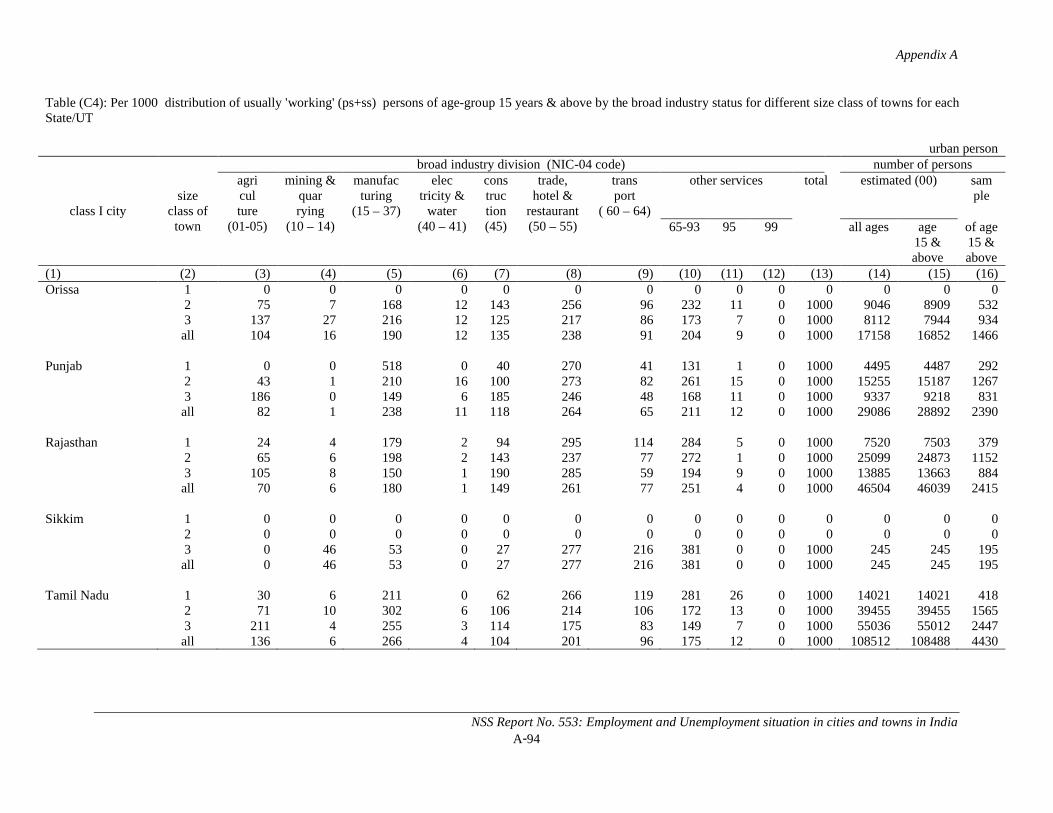
Appendix A
NSS Report No. 553: Employment and Unemployment situation in cities and towns in IndiaA-94
Table (C4): Per 1000 distribution of usually 'working' (ps+ss) persons of age-group 15 years & above by the broad industry status for different size class of towns for each State/UT
urban person
class I citysize
class of town
broad industry division (NIC-04 code) number of personsagriculture
(01-05)
mining & quarrying
(10 – 14)
manufacturing
(15 – 37)
electricity &
water(40 – 41)
construction(45)
trade,hotel &
restaurant(50 – 55)
transport
( 60 – 64)
other services total estimated (00) sample
65-93 95 99 all ages age15 & above
of age 15 & above
(1) (2) (3) (4) (5) (6) (7) (8) (9) (10) (11) (12) (13) (14) (15) (16)Orissa 1 0 0 0 0 0 0 0 0 0 0 0 0 0 0
2 75 7 168 12 143 256 96 232 11 0 1000 9046 8909 5323 137 27 216 12 125 217 86 173 7 0 1000 8112 7944 934all 104 16 190 12 135 238 91 204 9 0 1000 17158 16852 1466
Punjab 1 0 0 518 0 40 270 41 131 1 0 1000 4495 4487 2922 43 1 210 16 100 273 82 261 15 0 1000 15255 15187 12673 186 0 149 6 185 246 48 168 11 0 1000 9337 9218 831all 82 1 238 11 118 264 65 211 12 0 1000 29086 28892 2390
Rajasthan 1 24 4 179 2 94 295 114 284 5 0 1000 7520 7503 3792 65 6 198 2 143 237 77 272 1 0 1000 25099 24873 11523 105 8 150 1 190 285 59 194 9 0 1000 13885 13663 884all 70 6 180 1 149 261 77 251 4 0 1000 46504 46039 2415
Sikkim 1 0 0 0 0 0 0 0 0 0 0 0 0 0 02 0 0 0 0 0 0 0 0 0 0 0 0 0 03 0 46 53 0 27 277 216 381 0 0 1000 245 245 195all 0 46 53 0 27 277 216 381 0 0 1000 245 245 195
Tamil Nadu 1 30 6 211 0 62 266 119 281 26 0 1000 14021 14021 4182 71 10 302 6 106 214 106 172 13 0 1000 39455 39455 15653 211 4 255 3 114 175 83 149 7 0 1000 55036 55012 2447all 136 6 266 4 104 201 96 175 12 0 1000 108512 108488 4430
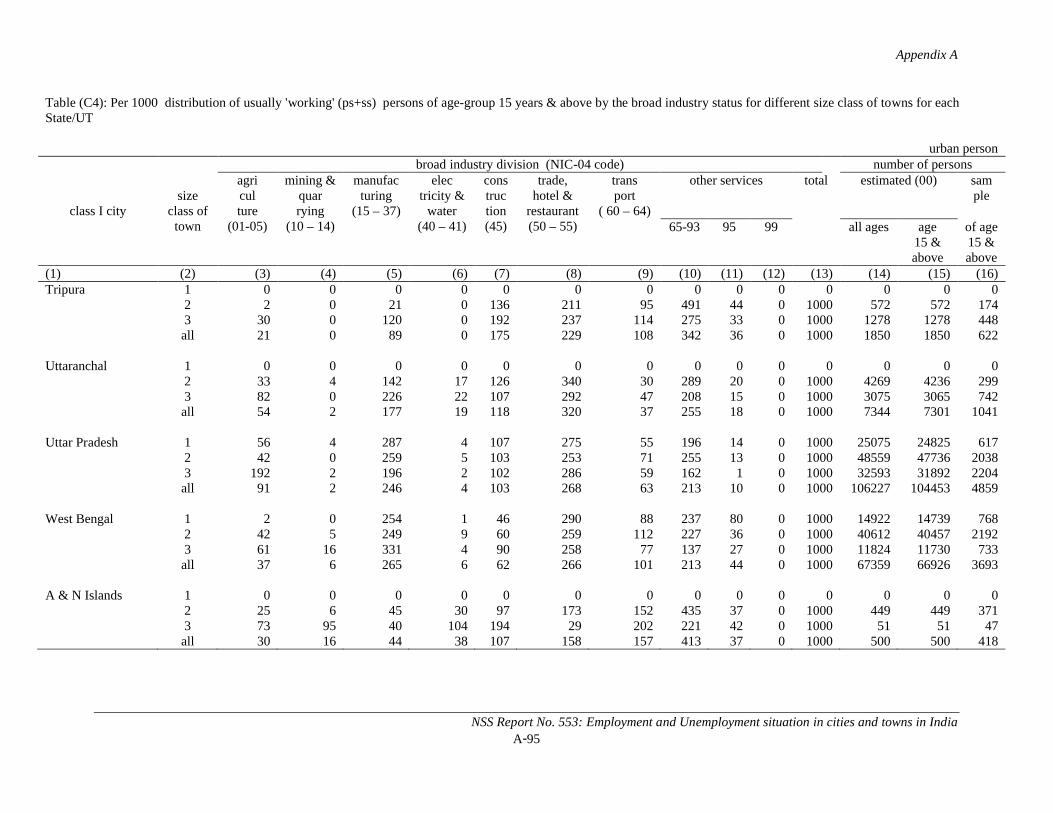
Appendix A
NSS Report No. 553: Employment and Unemployment situation in cities and towns in IndiaA-95
Table (C4): Per 1000 distribution of usually 'working' (ps+ss) persons of age-group 15 years & above by the broad industry status for different size class of towns for each State/UT
urban person
class I citysize
class of town
broad industry division (NIC-04 code) number of personsagriculture
(01-05)
mining & quarrying
(10 – 14)
manufacturing
(15 – 37)
electricity &
water(40 – 41)
construction(45)
trade,hotel &
restaurant(50 – 55)
transport
( 60 – 64)
other services total estimated (00) sample
65-93 95 99 all ages age15 & above
of age 15 & above
(1) (2) (3) (4) (5) (6) (7) (8) (9) (10) (11) (12) (13) (14) (15) (16)Tripura 1 0 0 0 0 0 0 0 0 0 0 0 0 0 0
2 2 0 21 0 136 211 95 491 44 0 1000 572 572 1743 30 0 120 0 192 237 114 275 33 0 1000 1278 1278 448all 21 0 89 0 175 229 108 342 36 0 1000 1850 1850 622
Uttaranchal 1 0 0 0 0 0 0 0 0 0 0 0 0 0 02 33 4 142 17 126 340 30 289 20 0 1000 4269 4236 2993 82 0 226 22 107 292 47 208 15 0 1000 3075 3065 742all 54 2 177 19 118 320 37 255 18 0 1000 7344 7301 1041
Uttar Pradesh 1 56 4 287 4 107 275 55 196 14 0 1000 25075 24825 6172 42 0 259 5 103 253 71 255 13 0 1000 48559 47736 20383 192 2 196 2 102 286 59 162 1 0 1000 32593 31892 2204all 91 2 246 4 103 268 63 213 10 0 1000 106227 104453 4859
West Bengal 1 2 0 254 1 46 290 88 237 80 0 1000 14922 14739 7682 42 5 249 9 60 259 112 227 36 0 1000 40612 40457 21923 61 16 331 4 90 258 77 137 27 0 1000 11824 11730 733all 37 6 265 6 62 266 101 213 44 0 1000 67359 66926 3693
A & N Islands 1 0 0 0 0 0 0 0 0 0 0 0 0 0 02 25 6 45 30 97 173 152 435 37 0 1000 449 449 3713 73 95 40 104 194 29 202 221 42 0 1000 51 51 47all 30 16 44 38 107 158 157 413 37 0 1000 500 500 418
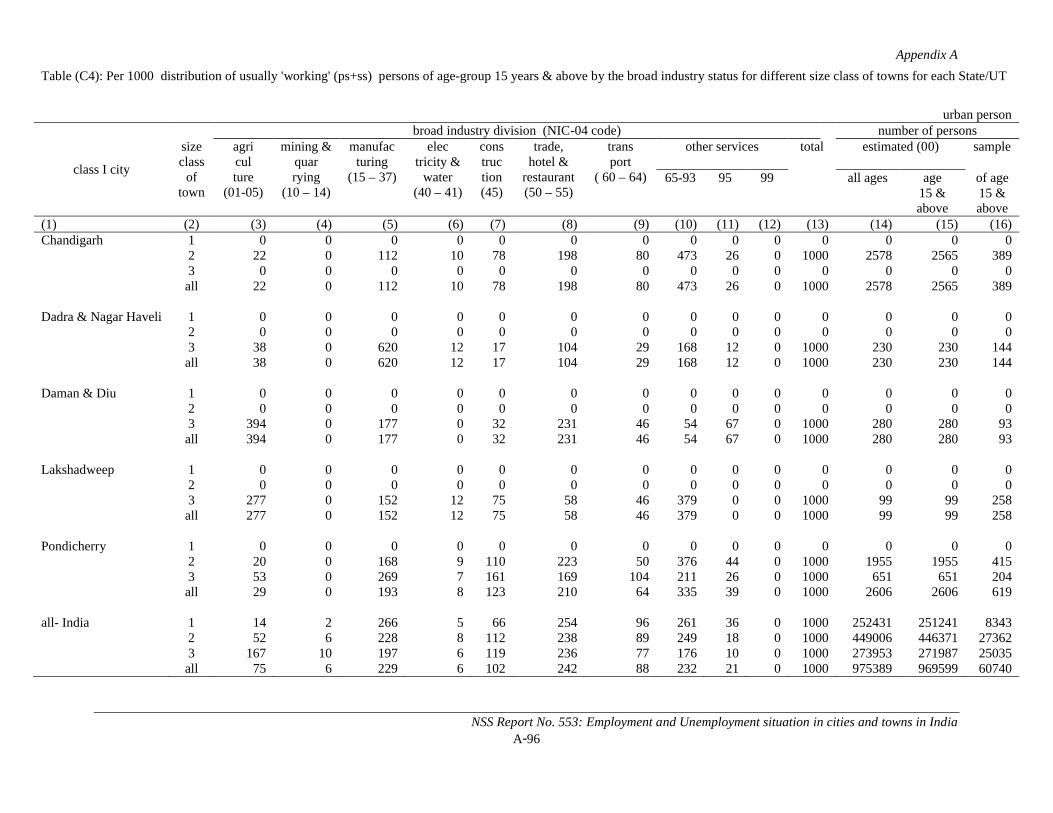
Appendix A
NSS Report No. 553: Employment and Unemployment situation in cities and towns in IndiaA-96
Table (C4): Per 1000 distribution of usually 'working' (ps+ss) persons of age-group 15 years & above by the broad industry status for different size class of towns for each State/UT
urban person
class I city
size class
of town
broad industry division (NIC-04 code) number of personsagriculture
(01-05)
mining & quarrying
(10 – 14)
manufacturing
(15 – 37)
electricity &
water(40 – 41)
construction(45)
trade,hotel &
restaurant(50 – 55)
transport
( 60 – 64)
other services total estimated (00) sample
65-93 95 99 all ages age15 & above
of age 15 & above
(1) (2) (3) (4) (5) (6) (7) (8) (9) (10) (11) (12) (13) (14) (15) (16)Chandigarh 1 0 0 0 0 0 0 0 0 0 0 0 0 0 0
2 22 0 112 10 78 198 80 473 26 0 1000 2578 2565 3893 0 0 0 0 0 0 0 0 0 0 0 0 0 0all 22 0 112 10 78 198 80 473 26 0 1000 2578 2565 389
Dadra & Nagar Haveli 1 0 0 0 0 0 0 0 0 0 0 0 0 0 02 0 0 0 0 0 0 0 0 0 0 0 0 0 03 38 0 620 12 17 104 29 168 12 0 1000 230 230 144all 38 0 620 12 17 104 29 168 12 0 1000 230 230 144
Daman & Diu 1 0 0 0 0 0 0 0 0 0 0 0 0 0 02 0 0 0 0 0 0 0 0 0 0 0 0 0 03 394 0 177 0 32 231 46 54 67 0 1000 280 280 93all 394 0 177 0 32 231 46 54 67 0 1000 280 280 93
Lakshadweep 1 0 0 0 0 0 0 0 0 0 0 0 0 0 02 0 0 0 0 0 0 0 0 0 0 0 0 0 03 277 0 152 12 75 58 46 379 0 0 1000 99 99 258all 277 0 152 12 75 58 46 379 0 0 1000 99 99 258
Pondicherry 1 0 0 0 0 0 0 0 0 0 0 0 0 0 02 20 0 168 9 110 223 50 376 44 0 1000 1955 1955 4153 53 0 269 7 161 169 104 211 26 0 1000 651 651 204all 29 0 193 8 123 210 64 335 39 0 1000 2606 2606 619
all- India 1 14 2 266 5 66 254 96 261 36 0 1000 252431 251241 83432 52 6 228 8 112 238 89 249 18 0 1000 449006 446371 273623 167 10 197 6 119 236 77 176 10 0 1000 273953 271987 25035all 75 6 229 6 102 242 88 232 21 0 1000 975389 969599 60740
Appendix B
Sample Design and Estimation Procedure
Sample Design and Estimation Procedure
NSS Report No. 553: Employment and Unemployment situation in cities and towns in IndiaB–1
Appendix - B
Sample Design and Estimation Procedure
1. Introduction
1.1 The 66th round (July 2009-June 2010) of NSS was earmarked for survey on ‘Household Consumer Expenditure’ and ‘Employment and Unemployment’. The survey covered the whole of the Indian Union except (i) interior villages of Nagaland situated beyond five kilometres of the bus route and (ii) villages in Andaman and Nicobar Islands which remain inaccessible throughout the year. All the sample first stage units of both rural and urban areas of Leh, Kargil and Poonch districts of Jammu & Kashmir became casualty and therefore these districts were outside the survey coverage. In addition to these, all the sample first stage units of the following areas were casualty in different sub-rounds: (i) in sub-rounds 1, 2, and 4, both rural and urban areas of Rajouri district of Jammu & Kashmir, (ii) in sub-round 2, urban areas of Lakhisarai district of Bihar, (iii) in sub-round 3, rural areas of Doda district of Jammu & Kashmir. The estimates of the different sub-rounds, therefore, excluded these areas. The period of survey was of one year duration starting on 1st July 2009 and ending on 30th June 2010. The survey period of this round was divided into four sub-rounds of three months’ duration each, the 1st
sub-round period ranging from July to September 2009, the 2nd sub-round period from October to December 2009 and so on. In each of these four sub-rounds equal number of sample villages/ blocks (FSUs) were allotted for survey with a view to ensuring uniform spread of sample FSUs over the entire survey period.
2 Sample Design
2.1 A stratified multi-stage design was adopted for the 66th round survey. The first stage units (FSU) were the 2001 census villages (Panchayat wards in case of Kerala) in the rural sector and Urban Frame Survey (UFS) blocks in the urban sector. In addition, two non-UFS towns of Leh and Kargil of Jammu & Kashmir were also treated as FSUs in the urban sector. The ultimate stage units (USU) were households in both the sectors. Hamlet-groups/sub-blocks constituted the intermediate stage whenever these were formed in the sample FSUs.
2.2 Selection of the first-stage units: The various steps involved before making the selection of the FSUs are discussed at length in the following few paragraphs before taking up the issue of selection of USUs within FSUs.
2.2.1 Sampling Frame for First Stage Units: For the rural sector, the list of 2001 census villages (Panchayat wards in case of Kerala) constituted the sampling frame. For the urban sector, the list of latest available UFS blocks constituted the sampling frame. For non-UFS towns, frame consisted of the individual towns (only two towns, viz., Leh & Kargil constituted this frame).
Sample Design and Estimation Procedure
NSS Report No. 553: Employment and Unemployment situation in cities and towns in IndiaB–2
2.2.2 Stratification of the first stage units: Within each district of a State/ UT, two basic strata were formed as follows:
i) rural stratum comprising of all rural areas of the district and(ii) urban stratum comprising of all the urban areas of the district.
However, within the urban areas of a district, if there were one or more towns with population 10 lakhs or more as per population census 2001 in a district, each of them formed a separate basic stratum and the remaining urban areas of the district wereconsidered as another basic stratum.
2.2.3 Sub-stratification: There was no sub-stratification in the urban sector. However, to net adequate number of child workers, for all rural strata, each stratum was divided into 2 sub-strata as follows:
sub-stratum 1: all villages with proportion of child workers (p) >2P (where P is the average proportion of child workers for the sate/ UT as per Census 2001)
sub-stratum 2: remaining villages
2.2.4 Allocation of FSU’s among Strata: At the all-India level, a total number of 12784FSUs were allocated for survey in the central sample. In addition, 24 State sample FSUs (16 for rural sector and 8 for urban sector) of Leh and Kargil districts of J & K wereincluded in the central sample. The total number of sample FSUs was allocated to the States and UTs in proportion to population as per census 2001 subject to the availability of investigators and ensuring minimum sample allocation to each State/ UT. The State/ UT level sample size was allocated between two sectors in proportion to population as per census 2001 with double weightage to urban sector subject to the restriction that urban sample size for bigger states like Maharashtra, Tamil Nadu, etc. did not exceed the rural sample size. A minimum of 16 FSUs (to the extent possible) was allocated to each state/ UT separately for rural and urban areas. Further the State level allocations for both rural and urban areas were adjusted marginally in a few cases to ensure that each stratum/ sub-stratum got a minimum allocation of 4 FSUs. Within each sector of a State/ UT, the respective sample size was allocated to the different strata/ sub-strata in proportion to the population as per census 2001. Allocations at stratum/ sub-stratum level were adjusted to multiples of 4 with a minimum sample size of 4 and equal number of samples wasallocated among the four sub rounds.
2.2.5 Selection of first-stage units: For the rural sector, from each stratum/ sub-stratum, required number of sample villages were selected by probability proportional to size with replacement (PPSWR), size being the population of the village as per Census 2001. For urban sector, from each stratum FSUs were selected by using Simple Random Sampling Without Replacement (SRSWOR). Both rural and urban samples were drawn in the form of two independent sub-samples.
2.3 Selection of Ultimate Stage Units (USU) within a FSU: The remaining paragraphs of this sub-section outlines the various steps leading to the actual selection of USUs within a FSU.
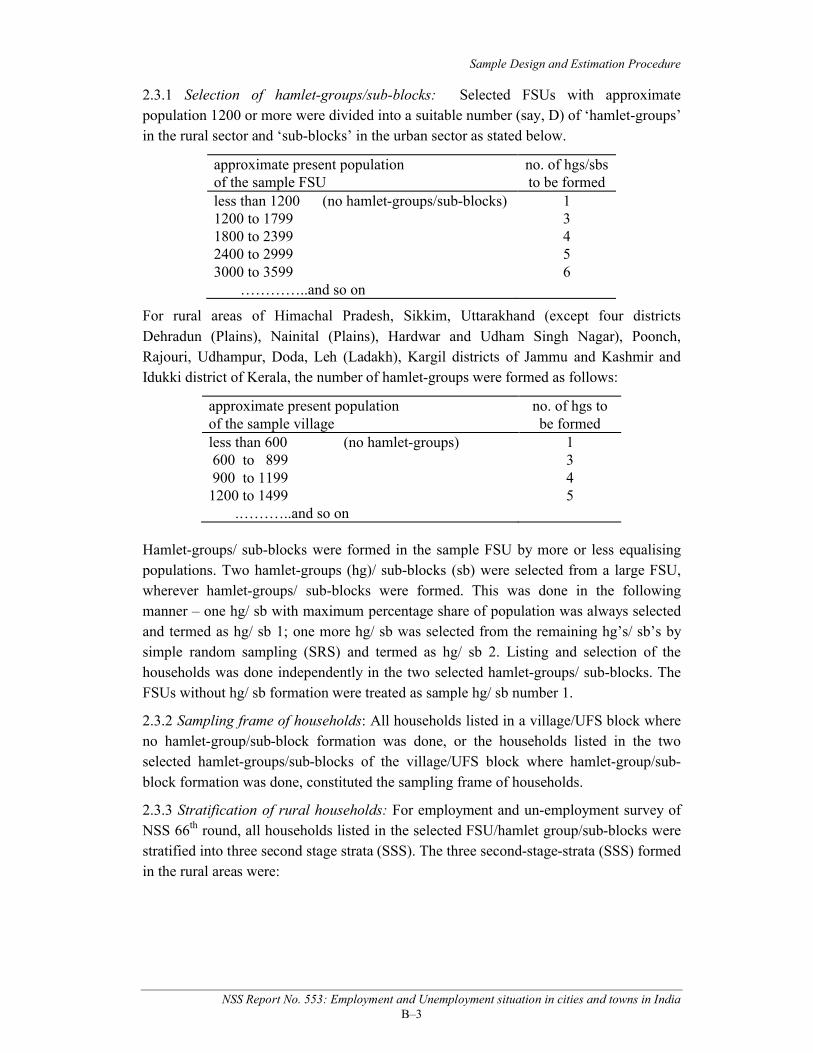
Sample Design and Estimation Procedure
NSS Report No. 553: Employment and Unemployment situation in cities and towns in IndiaB–3
2.3.1 Selection of hamlet-groups/sub-blocks: Selected FSUs with approximate population 1200 or more were divided into a suitable number (say, D) of ‘hamlet-groups’ in the rural sector and ‘sub-blocks’ in the urban sector as stated below.
approximate present populationof the sample FSU
no. of hgs/sbs to be formed
less than 1200 (no hamlet-groups/sub-blocks) 11200 to 1799 31800 to 2399 42400 to 2999 53000 to 3599 6 …………..and so on
For rural areas of Himachal Pradesh, Sikkim, Uttarakhand (except four districts Dehradun (Plains), Nainital (Plains), Hardwar and Udham Singh Nagar), Poonch, Rajouri, Udhampur, Doda, Leh (Ladakh), Kargil districts of Jammu and Kashmir and Idukki district of Kerala, the number of hamlet-groups were formed as follows:
approximate present populationof the sample village
no. of hgs to be formed
less than 600 (no hamlet-groups) 1600 to 899 3900 to 1199 4
1200 to 1499 5 .………..and so on
Hamlet-groups/ sub-blocks were formed in the sample FSU by more or less equalising populations. Two hamlet-groups (hg)/ sub-blocks (sb) were selected from a large FSU,wherever hamlet-groups/ sub-blocks were formed. This was done in the following manner – one hg/ sb with maximum percentage share of population was always selected and termed as hg/ sb 1; one more hg/ sb was selected from the remaining hg’s/ sb’s by simple random sampling (SRS) and termed as hg/ sb 2. Listing and selection of the households was done independently in the two selected hamlet-groups/ sub-blocks. The FSUs without hg/ sb formation were treated as sample hg/ sb number 1.
2.3.2 Sampling frame of households: All households listed in a village/UFS block where no hamlet-group/sub-block formation was done, or the households listed in the two selected hamlet-groups/sub-blocks of the village/UFS block where hamlet-group/sub-block formation was done, constituted the sampling frame of households.
2.3.3 Stratification of rural households: For employment and un-employment survey of NSS 66th round, all households listed in the selected FSU/hamlet group/sub-blocks were stratified into three second stage strata (SSS). The three second-stage-strata (SSS) formed in the rural areas were:
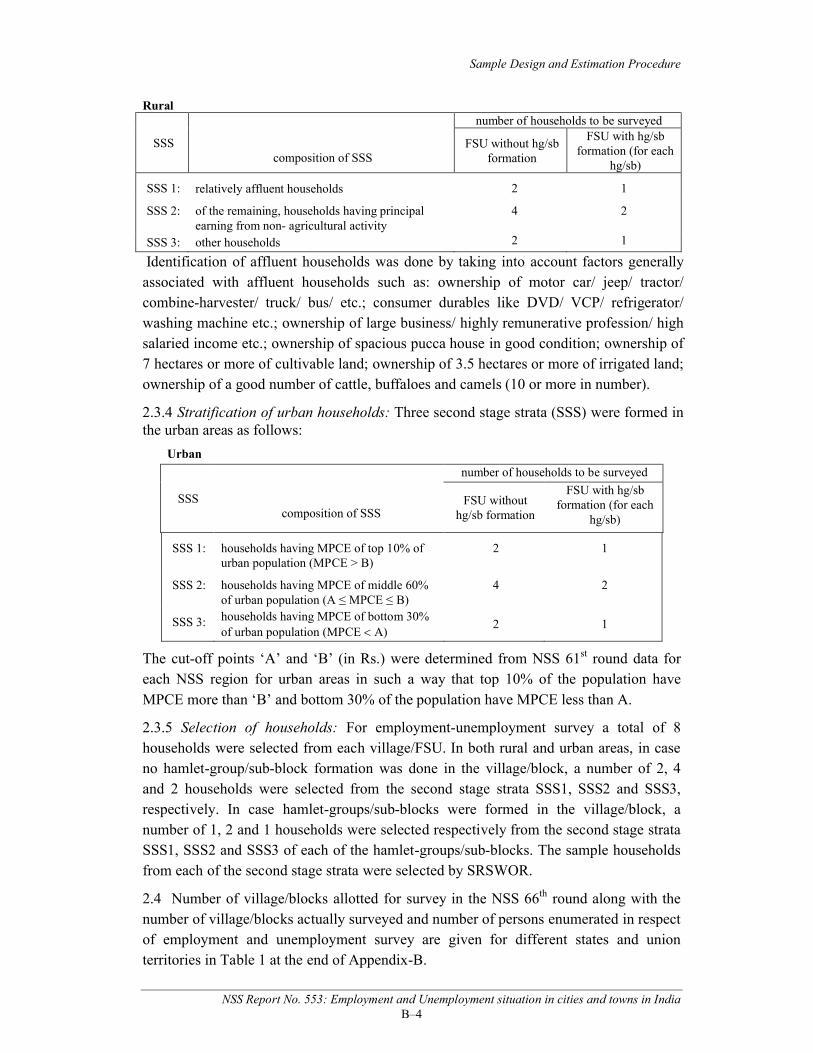
Sample Design and Estimation Procedure
NSS Report No. 553: Employment and Unemployment situation in cities and towns in IndiaB–4
Identification of affluent households was done by taking into account factors generally associated with affluent households such as: ownership of motor car/ jeep/ tractor/ combine-harvester/ truck/ bus/ etc.; consumer durables like DVD/ VCP/ refrigerator/ washing machine etc.; ownership of large business/ highly remunerative profession/ high salaried income etc.; ownership of spacious pucca house in good condition; ownership of 7 hectares or more of cultivable land; ownership of 3.5 hectares or more of irrigated land; ownership of a good number of cattle, buffaloes and camels (10 or more in number).
2.3.4 Stratification of urban households: Three second stage strata (SSS) were formed in the urban areas as follows:
Urban
SSS composition of SSS
number of households to be surveyed
FSU without hg/sb formation
FSU with hg/sb formation (for each
hg/sb)
SSS 1: households having MPCE of top 10% of urban population (MPCE > B)
2 1
SSS 2: households having MPCE of middle 60% of urban population (A ≤ MPCE ≤ B)
4 2
SSS 3: households having MPCE of bottom 30% of urban population (MPCE A)
2 1
The cut-off points ‘A’ and ‘B’ (in Rs.) were determined from NSS 61st round data for each NSS region for urban areas in such a way that top 10% of the population have MPCE more than ‘B’ and bottom 30% of the population have MPCE less than A.
2.3.5 Selection of households: For employment-unemployment survey a total of 8 households were selected from each village/FSU. In both rural and urban areas, in case no hamlet-group/sub-block formation was done in the village/block, a number of 2, 4 and 2 households were selected from the second stage strata SSS1, SSS2 and SSS3, respectively. In case hamlet-groups/sub-blocks were formed in the village/block, a number of 1, 2 and 1 households were selected respectively from the second stage strata SSS1, SSS2 and SSS3 of each of the hamlet-groups/sub-blocks. The sample households from each of the second stage strata were selected by SRSWOR.
2.4 Number of village/blocks allotted for survey in the NSS 66th round along with the number of village/blocks actually surveyed and number of persons enumerated in respect of employment and unemployment survey are given for different states and union territories in Table 1 at the end of Appendix-B.
Rural
SSS composition of SSS
number of households to be surveyed
FSU without hg/sb formation
FSU with hg/sb formation (for each
hg/sb)
SSS 1: relatively affluent households 2 1
SSS 2: of the remaining, households having principal earning from non- agricultural activity
4 2
SSS 3: other households 2 1
Sample Design and Estimation Procedure
NSS Report No. 553: Employment and Unemployment situation in cities and towns in IndiaB–5
3. Estimation Procedure
Procedures for obtaining estimates of aggregates, ratios and their RSEs is briefly indicated below:
3.1 Notations:
s = subscript for s-th stratum
t = subscript for t-th sub-stratum (only for rural sector)
m = subscript for sub-sample (m =1, 2)
i = subscript for i-th FSU [village (panchayat ward)/ block/ non-UFS town]
d = subscript for a hamlet-group/ sub-block (d = 1, 2)
j = subscript for j-th second stage stratum in an FSU/ hg/sb [ j = 1, 2 or 3]
k = subscript for k-th sample household under a particular second stage stratum within an FSU/ hg/sb
D = total number of hg’s/ sb’s formed in the sample FSU
D* = 0 if D = 1
= (D – 1) for FSUs with D > 1
N = total number of FSUs in any urban stratum
Z = total size of a rural stratum/sub-stratum (= sum of sizes for all the FSUs of a stratum/sub-stratum)
z = size of sample village used for selection.
n = number of sample FSUs surveyed including ‘zero cases’ but excluding casualty for a particular sub-sample and stratum/sub-stratum.
H = total number of households listed in a second-stage stratum of an FSU / hamlet-group or sub-block of sample FSU
h = number of households surveyed in a second-stage stratum of an FSU / hamlet-group or sub-block of sample FSU
x, y = observed value of characteristics x, y under estimation
X , Y = estimate of population total X, Y for the characteristics x, y
Under the above symbols,
ystmidjk = observed value of the characteristic y for the k-th household in the j-th second stage stratum of the d-th hg/ sb (d = 1, 2) of the i-th FSU belonging to the m-th sub-sample for the t-th sub-stratum of s-th stratum.
However, for ease of understanding, a few symbols have been suppressed in following paragraphs where they are obvious.
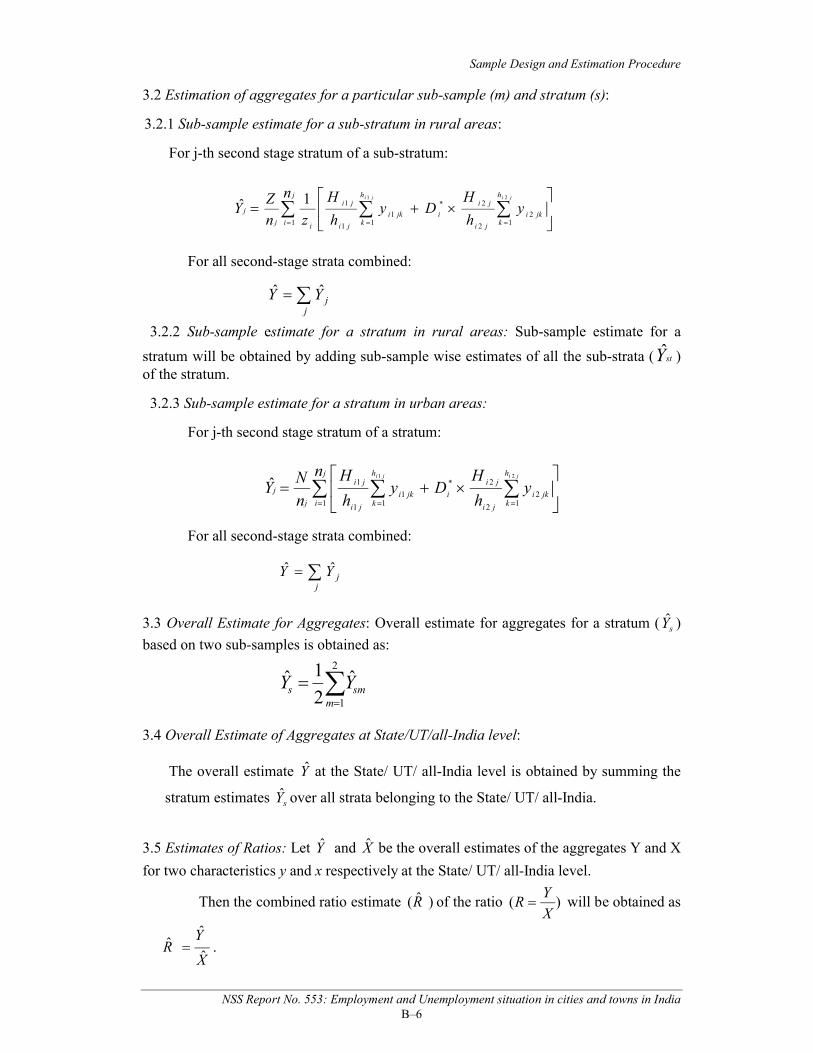
Sample Design and Estimation Procedure
NSS Report No. 553: Employment and Unemployment situation in cities and towns in IndiaB–6
3.2 Estimation of aggregates for a particular sub-sample (m) and stratum (s):
3.2.1 Sub-sample estimate for a sub-stratum in rural areas:
For j-th second stage stratum of a sub-stratum:
j
i
h
kjki
ji
ji
i
h
kjki
ji
ji
ij
j
ny
h
HDy
h
H
zn
ZY
jiji
1 12
2
2*
11
1
1211ˆ
For all second-stage strata combined:
j
jYY ˆˆ
3.2.2 Sub-sample estimate for a stratum in rural areas: Sub-sample estimate for a
stratum will be obtained by adding sub-sample wise estimates of all the sub-strata ( stY ) of the stratum.
3.2.3 Sub-sample estimate for a stratum in urban areas:
For j-th second stage stratum of a stratum:
j
i
h
kjki
ji
ji
i
h
kjki
ji
ji
j
j
ny
h
HDy
h
H
n
NY
jiji
1 12
2
2*
11
1
121
ˆ
For all second-stage strata combined:
j
jYY ˆˆ
3.3 Overall Estimate for Aggregates: Overall estimate for aggregates for a stratum ( sY )
based on two sub-samples is obtained as:
2
1
ˆ2
1ˆm
sms YY
3.4 Overall Estimate of Aggregates at State/UT/all-India level:
The overall estimate Y at the State/ UT/ all-India level is obtained by summing the
stratum estimates sY over all strata belonging to the State/ UT/ all-India.
3.5 Estimates of Ratios: Let Y and X be the overall estimates of the aggregates Y and X
for two characteristics y and x respectively at the State/ UT/ all-India level.
Then the combined ratio estimate )ˆ(R of the ratio )(X
YR will be obtained as
X
YR
ˆ
ˆˆ .
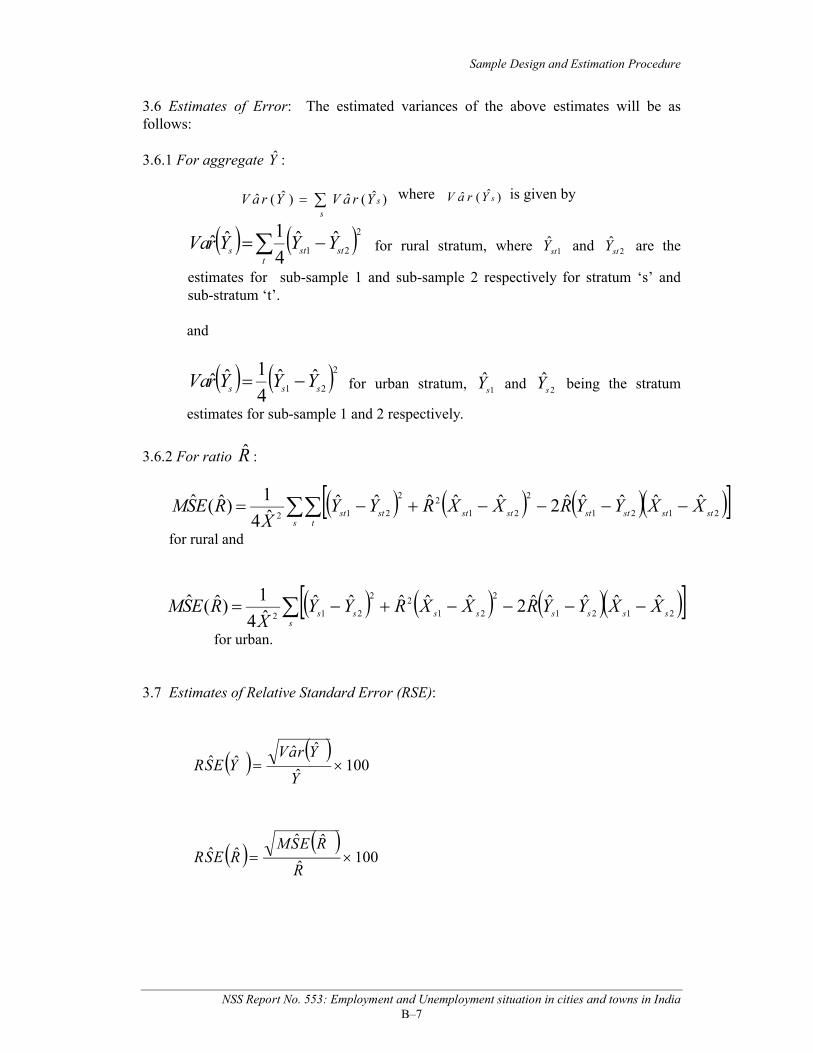
Sample Design and Estimation Procedure
NSS Report No. 553: Employment and Unemployment situation in cities and towns in IndiaB–7
3.6 Estimates of Error: The estimated variances of the above estimates will be as follows:
3.6.1 For aggregate Y :
s
sYraVYraV )ˆ(ˆ)ˆ(ˆ where )ˆ(ˆ sYraV is given by
t
ststs YYYrVa2
21ˆˆ
4
1ˆˆ for rural stratum, where 1stY and 2stY are the
estimates for sub-sample 1 and sub-sample 2 respectively for stratum ‘s’ and sub-stratum ‘t’.
and
221ˆˆ
4
1ˆˆsss YYYrVa for urban stratum, 1sY and 2sY being the stratum
estimates for sub-sample 1 and 2 respectively.
3.6.2 For ratio R :
s t
stststststststst XXYYRXXRYYX
RESM 2121
2
21
22
212ˆˆˆˆˆ2ˆˆˆˆˆ
ˆ4
1)ˆ(ˆ
for rural and
s
ssssssss XXYYRXXRYYX
RESM 2121
2
21
22
212ˆˆˆˆˆ2ˆˆˆˆˆ
ˆ4
1)ˆ(ˆ
for urban.
3.7 Estimates of Relative Standard Error (RSE):
100
ˆ
ˆˆˆˆ
Y
YraVYESR
100
ˆ
ˆˆˆˆ
R
RESMRESR
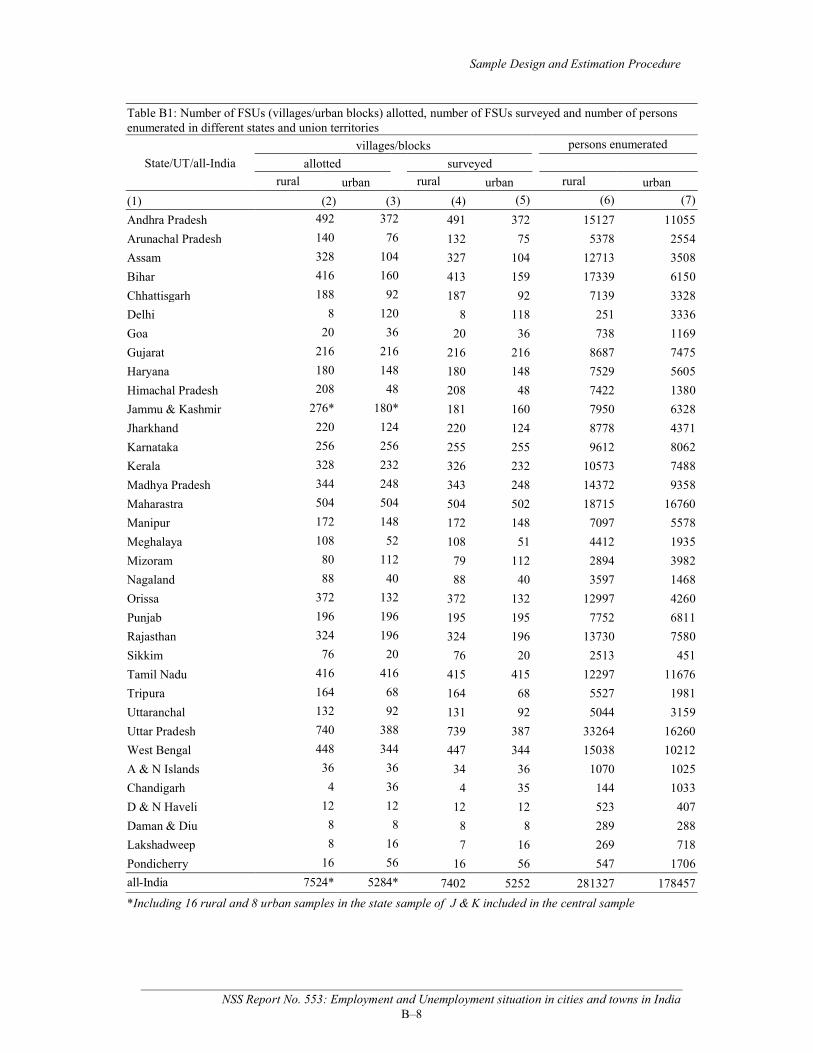
Sample Design and Estimation Procedure
NSS Report No. 553: Employment and Unemployment situation in cities and towns in IndiaB–8
Table B1: Number of FSUs (villages/urban blocks) allotted, number of FSUs surveyed and number of persons enumerated in different states and union territories
State/UT/all-India
villages/blocks persons enumerated
allotted surveyed
rural urban rural urban rural urban
(1) (2) (3) (4) (5) (6) (7)
Andhra Pradesh 492 372 491 372 15127 11055
Arunachal Pradesh 140 76 132 75 5378 2554
Assam 328 104 327 104 12713 3508
Bihar 416 160 413 159 17339 6150
Chhattisgarh 188 92 187 92 7139 3328
Delhi 8 120 8 118 251 3336
Goa 20 36 20 36 738 1169
Gujarat 216 216 216 216 8687 7475
Haryana 180 148 180 148 7529 5605
Himachal Pradesh 208 48 208 48 7422 1380
Jammu & Kashmir 276* 180* 181 160 7950 6328
Jharkhand 220 124 220 124 8778 4371
Karnataka 256 256 255 255 9612 8062
Kerala 328 232 326 232 10573 7488
Madhya Pradesh 344 248 343 248 14372 9358
Maharastra 504 504 504 502 18715 16760
Manipur 172 148 172 148 7097 5578
Meghalaya 108 52 108 51 4412 1935
Mizoram 80 112 79 112 2894 3982
Nagaland 88 40 88 40 3597 1468
Orissa 372 132 372 132 12997 4260
Punjab 196 196 195 195 7752 6811
Rajasthan 324 196 324 196 13730 7580
Sikkim 76 20 76 20 2513 451
Tamil Nadu 416 416 415 415 12297 11676
Tripura 164 68 164 68 5527 1981
Uttaranchal 132 92 131 92 5044 3159
Uttar Pradesh 740 388 739 387 33264 16260
West Bengal 448 344 447 344 15038 10212
A & N Islands 36 36 34 36 1070 1025
Chandigarh 4 36 4 35 144 1033
D & N Haveli 12 12 12 12 523 407
Daman & Diu 8 8 8 8 289 288
Lakshadweep 8 16 7 16 269 718
Pondicherry 16 56 16 56 547 1706
all-India 7524* 5284* 7402 5252 281327 178457
*Including 16 rural and 8 urban samples in the state sample of J & K included in the central sample
Appendix C
Projected Population
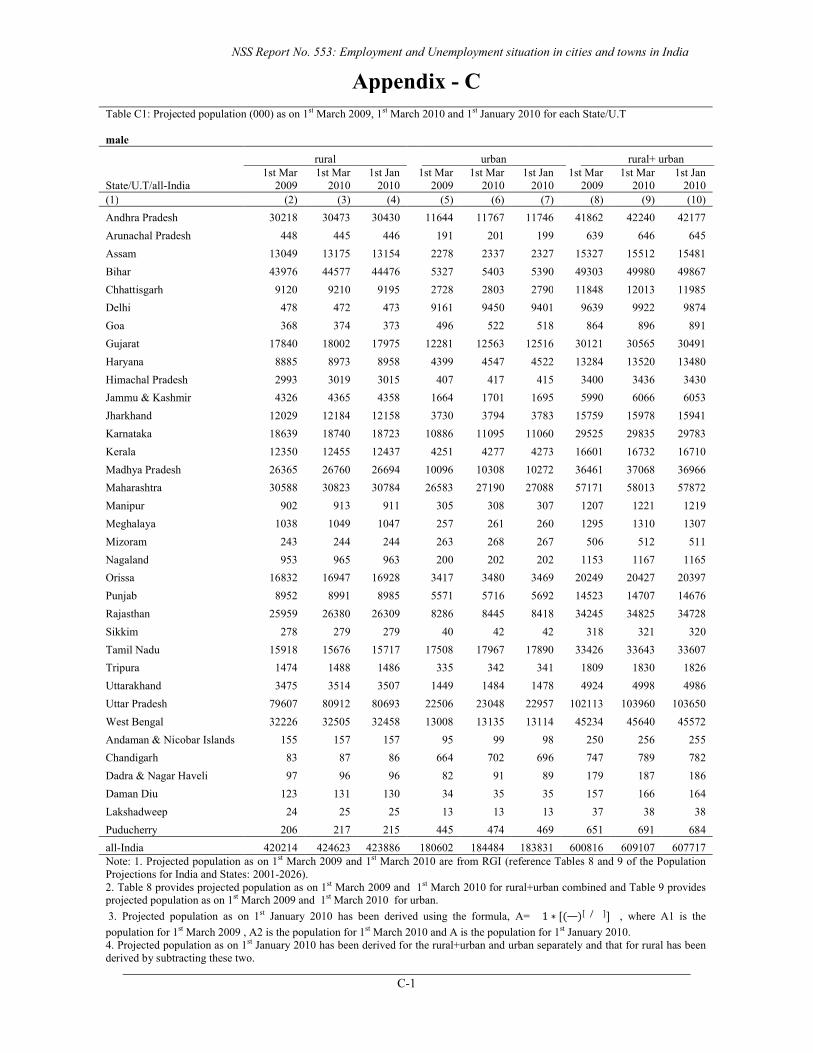
NSS Report No. 553: Employment and Unemployment situation in cities and towns in India
C-1
Table C1: Projected population (000) as on 1st March 2009, 1st March 2010 and 1st January 2010 for each State/U.T
male
State/U.T/all-India
rural urban rural+ urban1st Mar
20091st Mar
20101st Jan
20101st Mar
20091st Mar
20101st Jan
20101st Mar
20091st Mar
20101st Jan
2010(1) (2) (3) (4) (5) (6) (7) (8) (9) (10)
Andhra Pradesh 30218 30473 30430 11644 11767 11746 41862 42240 42177
Arunachal Pradesh 448 445 446 191 201 199 639 646 645
Assam 13049 13175 13154 2278 2337 2327 15327 15512 15481
Bihar 43976 44577 44476 5327 5403 5390 49303 49980 49867
Chhattisgarh 9120 9210 9195 2728 2803 2790 11848 12013 11985
Delhi 478 472 473 9161 9450 9401 9639 9922 9874
Goa 368 374 373 496 522 518 864 896 891
Gujarat 17840 18002 17975 12281 12563 12516 30121 30565 30491
Haryana 8885 8973 8958 4399 4547 4522 13284 13520 13480
Himachal Pradesh 2993 3019 3015 407 417 415 3400 3436 3430
Jammu & Kashmir 4326 4365 4358 1664 1701 1695 5990 6066 6053
Jharkhand 12029 12184 12158 3730 3794 3783 15759 15978 15941
Karnataka 18639 18740 18723 10886 11095 11060 29525 29835 29783
Kerala 12350 12455 12437 4251 4277 4273 16601 16732 16710
Madhya Pradesh 26365 26760 26694 10096 10308 10272 36461 37068 36966
Maharashtra 30588 30823 30784 26583 27190 27088 57171 58013 57872
Manipur 902 913 911 305 308 307 1207 1221 1219
Meghalaya 1038 1049 1047 257 261 260 1295 1310 1307
Mizoram 243 244 244 263 268 267 506 512 511
Nagaland 953 965 963 200 202 202 1153 1167 1165
Orissa 16832 16947 16928 3417 3480 3469 20249 20427 20397
Punjab 8952 8991 8985 5571 5716 5692 14523 14707 14676
Rajasthan 25959 26380 26309 8286 8445 8418 34245 34825 34728
Sikkim 278 279 279 40 42 42 318 321 320
Tamil Nadu 15918 15676 15717 17508 17967 17890 33426 33643 33607
Tripura 1474 1488 1486 335 342 341 1809 1830 1826
Uttarakhand 3475 3514 3507 1449 1484 1478 4924 4998 4986
Uttar Pradesh 79607 80912 80693 22506 23048 22957 102113 103960 103650
West Bengal 32226 32505 32458 13008 13135 13114 45234 45640 45572
Andaman & Nicobar Islands 155 157 157 95 99 98 250 256 255
Chandigarh 83 87 86 664 702 696 747 789 782
Dadra & Nagar Haveli 97 96 96 82 91 89 179 187 186
Daman Diu 123 131 130 34 35 35 157 166 164
Lakshadweep 24 25 25 13 13 13 37 38 38
Puducherry 206 217 215 445 474 469 651 691 684
all-India 420214 424623 423886 180602 184484 183831 600816 609107 607717Note: 1. Projected population as on 1st March 2009 and 1st March 2010 are from RGI (reference Tables 8 and 9 of the Population Projections for India and States: 2001-2026).2. Table 8 provides projected population as on 1st March 2009 and 1st March 2010 for rural+urban combined and Table 9 provides projected population as on 1st March 2009 and 1st March 2010 for urban.
3. Projected population as on 1st January 2010 has been derived using the formula, A= 1 ∗ [( )[ / ]] , where A1 is the
population for 1st March 2009 , A2 is the population for 1st March 2010 and A is the population for 1st January 2010.4. Projected population as on 1st January 2010 has been derived for the rural+urban and urban separately and that for rural has been derived by subtracting these two.
Appendix - C
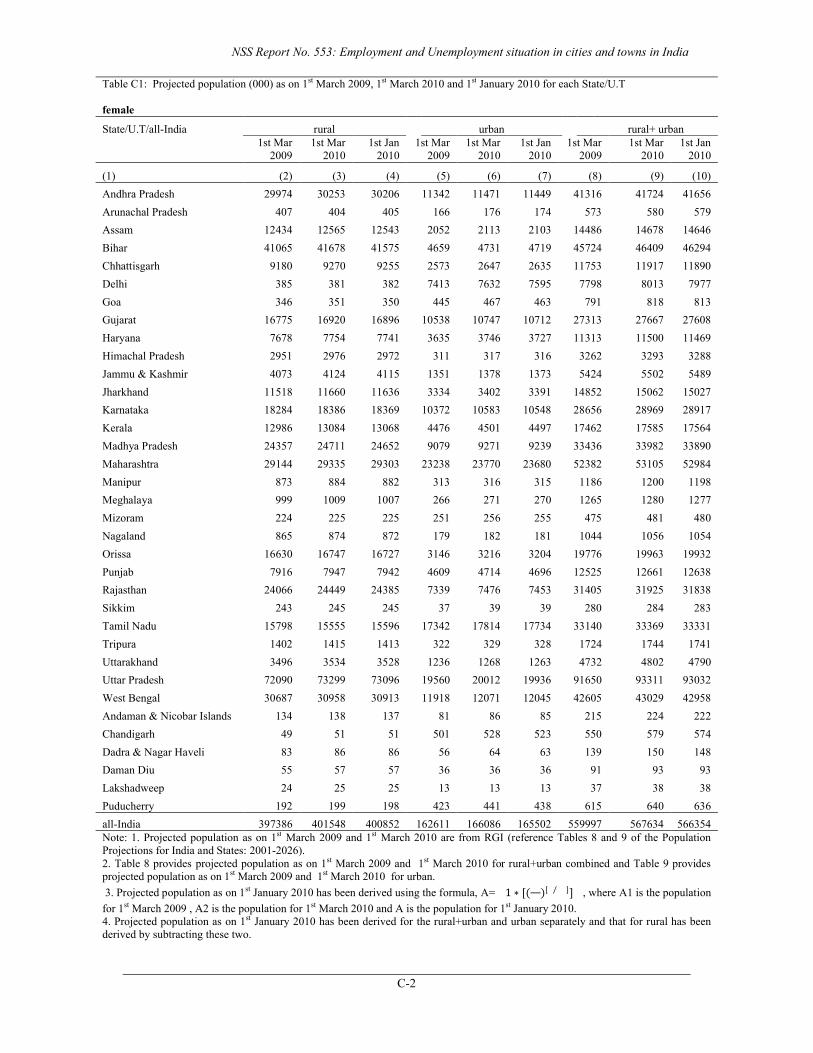
NSS Report No. 553: Employment and Unemployment situation in cities and towns in India
C-2
Table C1: Projected population (000) as on 1st March 2009, 1st March 2010 and 1st January 2010 for each State/U.T
female
State/U.T/all-India rural urban rural+ urban1st Mar
20091st Mar
20101st Jan
20101st Mar
20091st Mar
20101st Jan
20101st Mar
20091st Mar
20101st Jan
2010
(1) (2) (3) (4) (5) (6) (7) (8) (9) (10)
Andhra Pradesh 29974 30253 30206 11342 11471 11449 41316 41724 41656
Arunachal Pradesh 407 404 405 166 176 174 573 580 579
Assam 12434 12565 12543 2052 2113 2103 14486 14678 14646
Bihar 41065 41678 41575 4659 4731 4719 45724 46409 46294
Chhattisgarh 9180 9270 9255 2573 2647 2635 11753 11917 11890
Delhi 385 381 382 7413 7632 7595 7798 8013 7977
Goa 346 351 350 445 467 463 791 818 813
Gujarat 16775 16920 16896 10538 10747 10712 27313 27667 27608
Haryana 7678 7754 7741 3635 3746 3727 11313 11500 11469
Himachal Pradesh 2951 2976 2972 311 317 316 3262 3293 3288
Jammu & Kashmir 4073 4124 4115 1351 1378 1373 5424 5502 5489
Jharkhand 11518 11660 11636 3334 3402 3391 14852 15062 15027
Karnataka 18284 18386 18369 10372 10583 10548 28656 28969 28917
Kerala 12986 13084 13068 4476 4501 4497 17462 17585 17564
Madhya Pradesh 24357 24711 24652 9079 9271 9239 33436 33982 33890
Maharashtra 29144 29335 29303 23238 23770 23680 52382 53105 52984
Manipur 873 884 882 313 316 315 1186 1200 1198
Meghalaya 999 1009 1007 266 271 270 1265 1280 1277
Mizoram 224 225 225 251 256 255 475 481 480
Nagaland 865 874 872 179 182 181 1044 1056 1054
Orissa 16630 16747 16727 3146 3216 3204 19776 19963 19932
Punjab 7916 7947 7942 4609 4714 4696 12525 12661 12638
Rajasthan 24066 24449 24385 7339 7476 7453 31405 31925 31838
Sikkim 243 245 245 37 39 39 280 284 283
Tamil Nadu 15798 15555 15596 17342 17814 17734 33140 33369 33331
Tripura 1402 1415 1413 322 329 328 1724 1744 1741
Uttarakhand 3496 3534 3528 1236 1268 1263 4732 4802 4790
Uttar Pradesh 72090 73299 73096 19560 20012 19936 91650 93311 93032
West Bengal 30687 30958 30913 11918 12071 12045 42605 43029 42958
Andaman & Nicobar Islands 134 138 137 81 86 85 215 224 222
Chandigarh 49 51 51 501 528 523 550 579 574
Dadra & Nagar Haveli 83 86 86 56 64 63 139 150 148
Daman Diu 55 57 57 36 36 36 91 93 93
Lakshadweep 24 25 25 13 13 13 37 38 38
Puducherry 192 199 198 423 441 438 615 640 636
all-India 397386 401548 400852 162611 166086 165502 559997 567634 566354Note: 1. Projected population as on 1st March 2009 and 1st March 2010 are from RGI (reference Tables 8 and 9 of the Population Projections for India and States: 2001-2026).2. Table 8 provides projected population as on 1st March 2009 and 1st March 2010 for rural+urban combined and Table 9 provides projected population as on 1st March 2009 and 1st March 2010 for urban.
3. Projected population as on 1st January 2010 has been derived using the formula, A= 1 ∗ [( )[ / ]] , where A1 is the population
for 1st March 2009 , A2 is the population for 1st March 2010 and A is the population for 1st January 2010.4. Projected population as on 1st January 2010 has been derived for the rural+urban and urban separately and that for rural has been derived by subtracting these two.
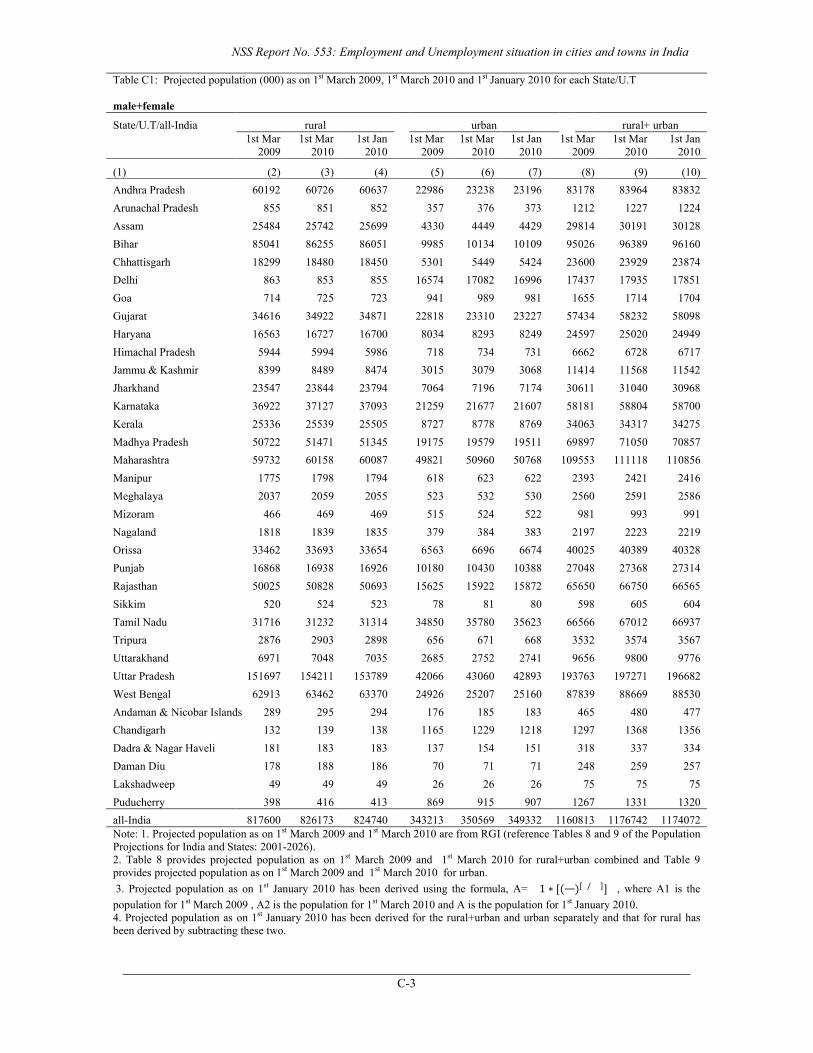
NSS Report No. 553: Employment and Unemployment situation in cities and towns in India
C-3
Table C1: Projected population (000) as on 1st March 2009, 1st March 2010 and 1st January 2010 for each State/U.T
male+female
State/U.T/all-India rural urban rural+ urban1st Mar
20091st Mar
20101st Jan
20101st Mar
20091st Mar
20101st Jan
20101st Mar
20091st Mar
20101st Jan
2010
(1) (2) (3) (4) (5) (6) (7) (8) (9) (10)
Andhra Pradesh 60192 60726 60637 22986 23238 23196 83178 83964 83832
Arunachal Pradesh 855 851 852 357 376 373 1212 1227 1224
Assam 25484 25742 25699 4330 4449 4429 29814 30191 30128
Bihar 85041 86255 86051 9985 10134 10109 95026 96389 96160
Chhattisgarh 18299 18480 18450 5301 5449 5424 23600 23929 23874
Delhi 863 853 855 16574 17082 16996 17437 17935 17851
Goa 714 725 723 941 989 981 1655 1714 1704
Gujarat 34616 34922 34871 22818 23310 23227 57434 58232 58098
Haryana 16563 16727 16700 8034 8293 8249 24597 25020 24949
Himachal Pradesh 5944 5994 5986 718 734 731 6662 6728 6717
Jammu & Kashmir 8399 8489 8474 3015 3079 3068 11414 11568 11542
Jharkhand 23547 23844 23794 7064 7196 7174 30611 31040 30968
Karnataka 36922 37127 37093 21259 21677 21607 58181 58804 58700
Kerala 25336 25539 25505 8727 8778 8769 34063 34317 34275
Madhya Pradesh 50722 51471 51345 19175 19579 19511 69897 71050 70857
Maharashtra 59732 60158 60087 49821 50960 50768 109553 111118 110856
Manipur 1775 1798 1794 618 623 622 2393 2421 2416
Meghalaya 2037 2059 2055 523 532 530 2560 2591 2586
Mizoram 466 469 469 515 524 522 981 993 991
Nagaland 1818 1839 1835 379 384 383 2197 2223 2219
Orissa 33462 33693 33654 6563 6696 6674 40025 40389 40328
Punjab 16868 16938 16926 10180 10430 10388 27048 27368 27314
Rajasthan 50025 50828 50693 15625 15922 15872 65650 66750 66565
Sikkim 520 524 523 78 81 80 598 605 604
Tamil Nadu 31716 31232 31314 34850 35780 35623 66566 67012 66937
Tripura 2876 2903 2898 656 671 668 3532 3574 3567
Uttarakhand 6971 7048 7035 2685 2752 2741 9656 9800 9776
Uttar Pradesh 151697 154211 153789 42066 43060 42893 193763 197271 196682
West Bengal 62913 63462 63370 24926 25207 25160 87839 88669 88530
Andaman & Nicobar Islands 289 295 294 176 185 183 465 480 477
Chandigarh 132 139 138 1165 1229 1218 1297 1368 1356
Dadra & Nagar Haveli 181 183 183 137 154 151 318 337 334
Daman Diu 178 188 186 70 71 71 248 259 257
Lakshadweep 49 49 49 26 26 26 75 75 75
Puducherry 398 416 413 869 915 907 1267 1331 1320
all-India 817600 826173 824740 343213 350569 349332 1160813 1176742 1174072Note: 1. Projected population as on 1st March 2009 and 1st March 2010 are from RGI (reference Tables 8 and 9 of the Population Projections for India and States: 2001-2026).2. Table 8 provides projected population as on 1st March 2009 and 1st March 2010 for rural+urban combined and Table 9 provides projected population as on 1st March 2009 and 1st March 2010 for urban.
3. Projected population as on 1st January 2010 has been derived using the formula, A= 1 ∗ [( )[ / ]] , where A1 is the
population for 1st March 2009 , A2 is the population for 1st March 2010 and A is the population for 1st January 2010.4. Projected population as on 1st January 2010 has been derived for the rural+urban and urban separately and that for rural has been derived by subtracting these two.
Appendix D
Schedule 10 (Employment and Unemployment)
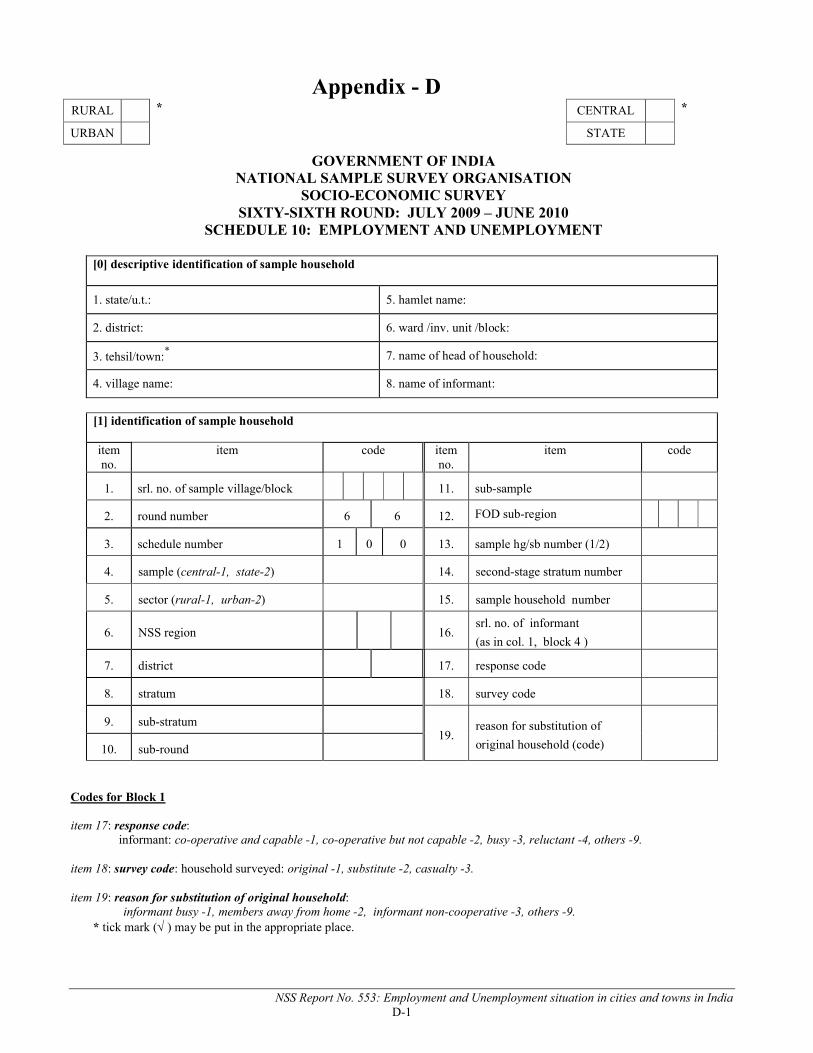
NSS Report No. 553: Employment and Unemployment situation in cities and towns in IndiaD-1
[0] descriptive identification of sample household
1. state/u.t.: 5. hamlet name:
2. district: 6. ward /inv. unit /block:
3. tehsil/town:* 7. name of head of household:
4. village name: 8. name of informant:
[1] identification of sample household
itemno.
item code item no.
item code
1. srl. no. of sample village/block 11. sub-sample
2. round number 6 6 12. FOD sub-region
3. schedule number 1 0 0 13. sample hg/sb number (1/2)
4. sample (central-1, state-2) 14. second-stage stratum number
5. sector (rural-1, urban-2) 15. sample household number
6. NSS region 16.srl. no. of informant
(as in col. 1, block 4 )
7. district 17. response code
8. stratum 18. survey code
9. sub-stratum 19.
reason for substitution of
original household (code)10. sub-round
Codes for Block 1
item 17: response code:informant: co-operative and capable -1, co-operative but not capable -2, busy -3, reluctant -4, others -9.
item 18: survey code: household surveyed: original -1, substitute -2, casualty -3.
item 19: reason for substitution of original household:informant busy -1, members away from home -2, informant non-cooperative -3, others -9.
* tick mark ( ) may be put in the appropriate place.
Appendix - DRURAL * CENTRAL *
URBAN STATE
GOVERNMENT OF INDIANATIONAL SAMPLE SURVEY ORGANISATION
SOCIO-ECONOMIC SURVEYSIXTY-SIXTH ROUND: JULY 2009 – JUNE 2010
SCHEDULE 10: EMPLOYMENT AND UNEMPLOYMENT
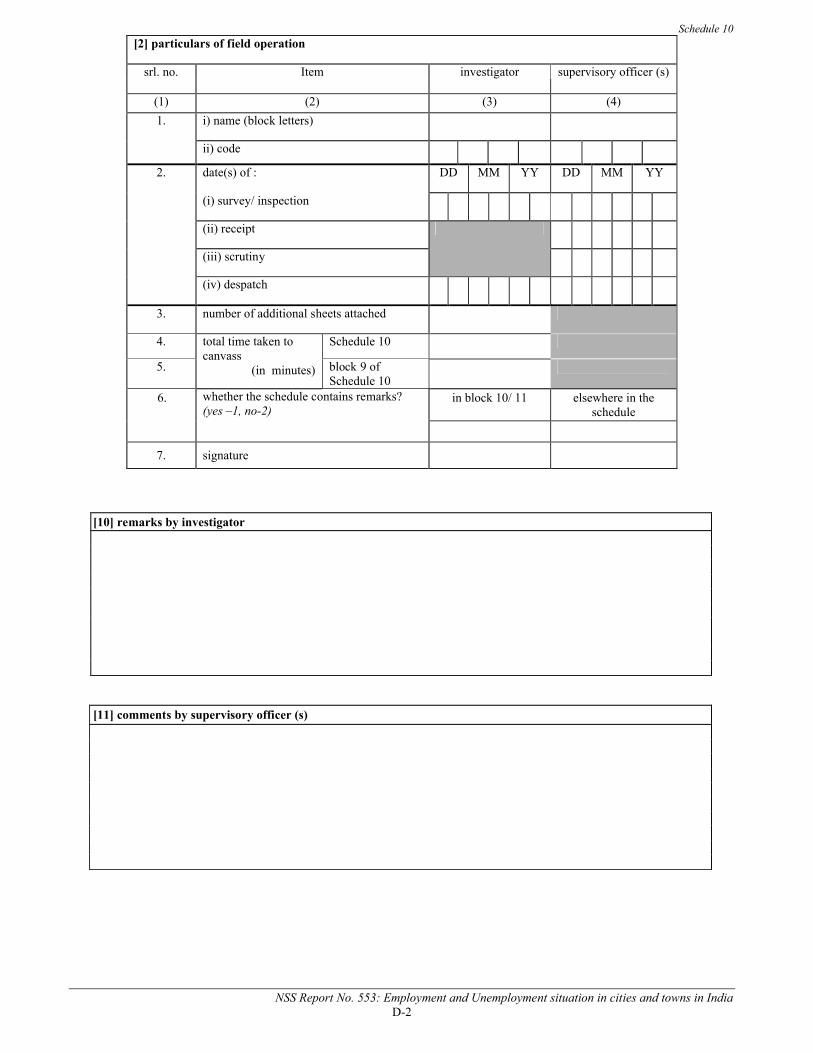
Schedule 10
NSS Report No. 553: Employment and Unemployment situation in cities and towns in IndiaD-2
[2] particulars of field operation
srl. no. Item investigator supervisory officer (s)
(1) (2) (3) (4)
1. i) name (block letters)
ii) code
2. date(s) of : DD MM YY DD MM YY
(i) survey/ inspection
(ii) receipt
(iii) scrutiny
(iv) despatch
3. number of additional sheets attached
4. total time taken to canvass
(in minutes)
Schedule 10
5. block 9 of Schedule 10
6. whether the schedule contains remarks? (yes –1, no-2)
in block 10/ 11 elsewhere in the schedule
7. signature
[10] remarks by investigator
[11] comments by supervisory officer (s)
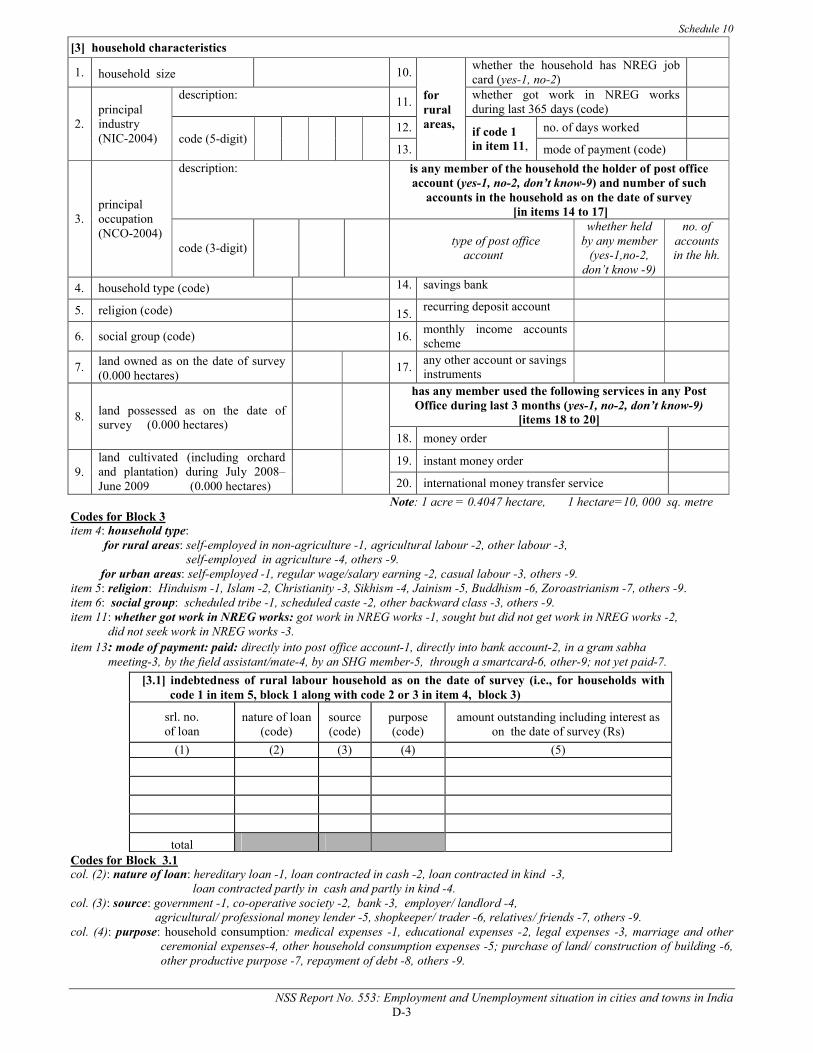
Schedule 10
NSS Report No. 553: Employment and Unemployment situation in cities and towns in IndiaD-3
[3] household characteristics
1. household size 10.
for rural areas,
whether the household has NREG job card (yes-1, no-2)
2.principalindustry(NIC-2004)
description:11.
whether got work in NREG works during last 365 days (code)
code (5-digit)12. if code 1
in item 11,
no. of days worked
13. mode of payment (code)
3.principaloccupation (NCO-2004)
description: is any member of the household the holder of post office account (yes-1, no-2, don’t know-9) and number of such
accounts in the household as on the date of survey[in items 14 to 17]
code (3-digit) type of post office
account
whether held by any member
(yes-1,no-2, don’t know -9)
no. of accounts in the hh.
4. household type (code) 14. savings bank
5. religion (code) 15.recurring deposit account
6. social group (code) 16.monthly income accounts scheme
7. land owned as on the date of survey (0.000 hectares)
17.any other account or savings instruments
8. land possessed as on the date of survey (0.000 hectares)
has any member used the following services in any Post Office during last 3 months (yes-1, no-2, don’t know-9)
[items 18 to 20]
18. money order
9.land cultivated (including orchard and plantation) during July 2008–June 2009 (0.000 hectares)
19. instant money order
20. international money transfer service
Note: 1 acre = 0.4047 hectare, 1 hectare=10, 000 sq. metreCodes for Block 3item 4: household type:
for rural areas: self-employed in non-agriculture -1, agricultural labour -2, other labour -3,self-employed in agriculture -4, others -9.
for urban areas: self-employed -1, regular wage/salary earning -2, casual labour -3, others -9.item 5: religion: Hinduism -1, Islam -2, Christianity -3, Sikhism -4, Jainism -5, Buddhism -6, Zoroastrianism -7, others -9.item 6: social group: scheduled tribe -1, scheduled caste -2, other backward class -3, others -9.item 11: whether got work in NREG works: got work in NREG works -1, sought but did not get work in NREG works -2,
did not seek work in NREG works -3.item 13: mode of payment: paid: directly into post office account-1, directly into bank account-2, in a gram sabha
meeting-3, by the field assistant/mate-4, by an SHG member-5, through a smartcard-6, other-9; not yet paid-7.
[3.1] indebtedness of rural labour household as on the date of survey (i.e., for households with code 1 in item 5, block 1 along with code 2 or 3 in item 4, block 3)
srl. no.of loan
nature of loan (code)
source(code)
purpose(code)
amount outstanding including interest as on the date of survey (Rs)
(1) (2) (3) (4) (5)
totalCodes for Block 3.1col. (2): nature of loan: hereditary loan -1, loan contracted in cash -2, loan contracted in kind -3, loan contracted partly in cash and partly in kind -4.col. (3): source: government -1, co-operative society -2, bank -3, employer/ landlord -4, agricultural/ professional money lender -5, shopkeeper/ trader -6, relatives/ friends -7, others -9.col. (4): purpose: household consumption: medical expenses -1, educational expenses -2, legal expenses -3, marriage and other
ceremonial expenses-4, other household consumption expenses -5; purchase of land/ construction of building -6, other productive purpose -7, repayment of debt -8, others -9.
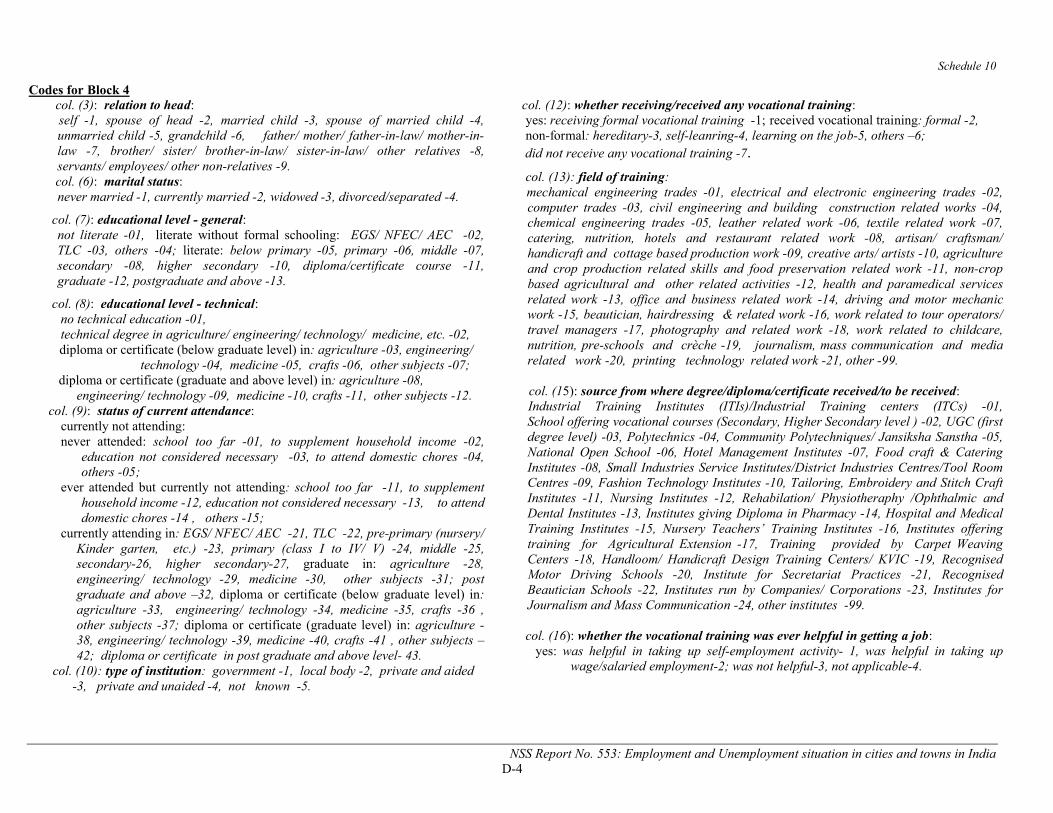
Schedule 10
NSS Report No. 553: Employment and Unemployment situation in cities and towns in IndiaD-4
Codes for Block 4 col. (3): relation to head: self -1, spouse of head -2, married child -3, spouse of married child -4,
unmarried child -5, grandchild -6, father/ mother/ father-in-law/ mother-in-law -7, brother/ sister/ brother-in-law/ sister-in-law/ other relatives -8, servants/ employees/ other non-relatives -9.
col. (6): marital status:never married -1, currently married -2, widowed -3, divorced/separated -4.
col. (7): educational level - general:not literate -01, literate without formal schooling: EGS/ NFEC/ AEC -02, TLC -03, others -04; literate: below primary -05, primary -06, middle -07, secondary -08, higher secondary -10, diploma/certificate course -11, graduate -12, postgraduate and above -13.
col. (8): educational level - technical: no technical education -01, technical degree in agriculture/ engineering/ technology/ medicine, etc. -02,
diploma or certificate (below graduate level) in: agriculture -03, engineering/ technology -04, medicine -05, crafts -06, other subjects -07;
diploma or certificate (graduate and above level) in: agriculture -08, engineering/ technology -09, medicine -10, crafts -11, other subjects -12.
col. (9): status of current attendance:currently not attending:never attended: school too far -01, to supplement household income -02,
education not considered necessary -03, to attend domestic chores -04, others -05;
ever attended but currently not attending: school too far -11, to supplement household income -12, education not considered necessary -13, to attend domestic chores -14 , others -15;
currently attending in: EGS/ NFEC/ AEC -21, TLC -22, pre-primary (nursery/ Kinder garten, etc.) -23, primary (class I to IV/ V) -24, middle -25, secondary-26, higher secondary-27, graduate in: agriculture -28, engineering/ technology -29, medicine -30, other subjects -31; post graduate and above –32, diploma or certificate (below graduate level) in:agriculture -33, engineering/ technology -34, medicine -35, crafts -36 , other subjects -37; diploma or certificate (graduate level) in: agriculture -38, engineering/ technology -39, medicine -40, crafts -41 , other subjects –42; diploma or certificate in post graduate and above level- 43.
col. (10): type of institution: government -1, local body -2, private and aided -3, private and unaided -4, not known -5.
col. (12): whether receiving/received any vocational training: yes: receiving formal vocational training -1; received vocational training: formal -2, non-formal: hereditary-3, self-leanring-4, learning on the job-5, others –6; did not receive any vocational training -7.
col. (13): field of training: mechanical engineering trades -01, electrical and electronic engineering trades -02,
computer trades -03, civil engineering and building construction related works -04, chemical engineering trades -05, leather related work -06, textile related work -07, catering, nutrition, hotels and restaurant related work -08, artisan/ craftsman/ handicraft and cottage based production work -09, creative arts/ artists -10, agriculture and crop production related skills and food preservation related work -11, non-crop based agricultural and other related activities -12, health and paramedical services related work -13, office and business related work -14, driving and motor mechanic work -15, beautician, hairdressing & related work -16, work related to tour operators/ travel managers -17, photography and related work -18, work related to childcare, nutrition, pre-schools and crèche -19, journalism, mass communication and media related work -20, printing technology related work -21, other -99.
col. (15): source from where degree/diploma/certificate received/to be received:
Industrial Training Institutes (ITIs)/Industrial Training centers (ITCs) -01, School offering vocational courses (Secondary, Higher Secondary level ) -02, UGC (first degree level) -03, Polytechnics -04, Community Polytechniques/ Jansiksha Sanstha -05, National Open School -06, Hotel Management Institutes -07, Food craft & Catering Institutes -08, Small Industries Service Institutes/District Industries Centres/Tool Room Centres -09, Fashion Technology Institutes -10, Tailoring, Embroidery and Stitch Craft Institutes -11, Nursing Institutes -12, Rehabilation/ Physiotheraphy /Ophthalmic and Dental Institutes -13, Institutes giving Diploma in Pharmacy -14, Hospital and Medical Training Institutes -15, Nursery Teachers’ Training Institutes -16, Institutes offering training for Agricultural Extension -17, Training provided by Carpet Weaving Centers -18, Handloom/ Handicraft Design Training Centers/ KVIC -19, Recognised Motor Driving Schools -20, Institute for Secretariat Practices -21, Recognised Beautician Schools -22, Institutes run by Companies/ Corporations -23, Institutes for Journalism and Mass Communication -24, other institutes -99.
col. (16): whether the vocational training was ever helpful in getting a job: yes: was helpful in taking up self-employment activity- 1, was helpful in taking up
wage/salaried employment-2; was not helpful-3, not applicable-4.
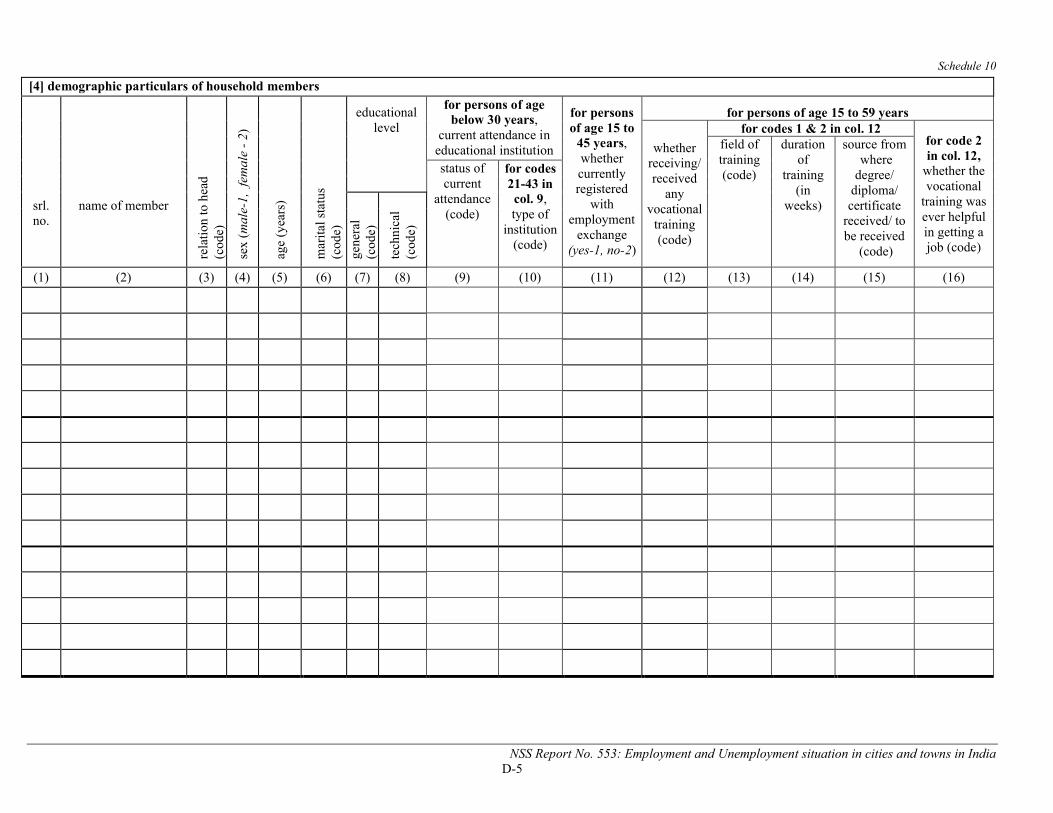
Schedule 10
NSS Report No. 553: Employment and Unemployment situation in cities and towns in IndiaD-5
[4] demographic particulars of household members
srl. no.
name of memberre
lati
on to
hea
d(c
ode)
sex
(mal
e-1,
fem
ale
-2)
age
(yea
rs)
mar
ital
sta
tus
(cod
e)
educational level
for persons of age below 30 years,
current attendance in educational institution
for persons of age 15 to
45 years, whether currentlyregistered
withemployment
exchange(yes-1, no-2)
for persons of age 15 to 59 years
whether receiving/received
anyvocational
training(code)
for codes 1 & 2 in col. 12for code 2 in col. 12,
whether the vocational
training was ever helpful in getting a job (code)
field of training (code)
duration of
training (in
weeks)
source fromwhere
degree/ diploma/ certificate
received/ to be received
(code)
status of current
attendance(code)
for codes21-43 in col. 9,type of
institution(code)
gene
ral
(cod
e)
tech
nica
l(c
ode)
(1) (2) (3) (4) (5) (6) (7) (8) (9) (10) (11) (12) (13) (14) (15) (16)
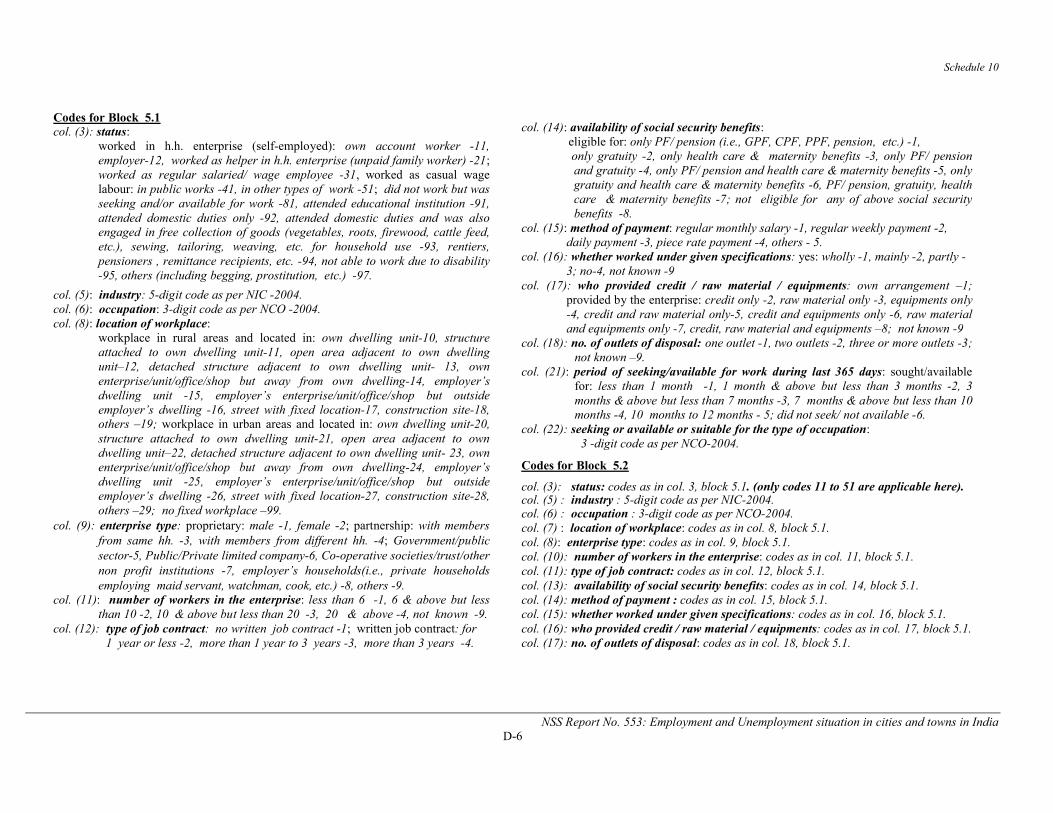
Schedule 10
NSS Report No. 553: Employment and Unemployment situation in cities and towns in IndiaD-6
Codes for Block 5.1col. (3): status:
worked in h.h. enterprise (self-employed): own account worker -11, employer-12, worked as helper in h.h. enterprise (unpaid family worker) -21;worked as regular salaried/ wage employee -31, worked as casual wage labour: in public works -41, in other types of work -51; did not work but was seeking and/or available for work -81, attended educational institution -91, attended domestic duties only -92, attended domestic duties and was also engaged in free collection of goods (vegetables, roots, firewood, cattle feed, etc.), sewing, tailoring, weaving, etc. for household use -93, rentiers, pensioners , remittance recipients, etc. -94, not able to work due to disability -95, others (including begging, prostitution, etc.) -97.
col. (5): industry: 5-digit code as per NIC -2004.col. (6): occupation: 3-digit code as per NCO -2004.col. (8): location of workplace:
workplace in rural areas and located in: own dwelling unit-10, structure attached to own dwelling unit-11, open area adjacent to own dwelling unit–12, detached structure adjacent to own dwelling unit- 13, own enterprise/unit/office/shop but away from own dwelling-14, employer’s dwelling unit -15, employer’s enterprise/unit/office/shop but outside employer’s dwelling -16, street with fixed location-17, construction site-18, others –19; workplace in urban areas and located in: own dwelling unit-20, structure attached to own dwelling unit-21, open area adjacent to own dwelling unit–22, detached structure adjacent to own dwelling unit- 23, own enterprise/unit/office/shop but away from own dwelling-24, employer’s dwelling unit -25, employer’s enterprise/unit/office/shop but outside employer’s dwelling -26, street with fixed location-27, construction site-28, others –29; no fixed workplace –99.
col. (9): enterprise type: proprietary: male -1, female -2; partnership: with members from same hh. -3, with members from different hh. -4; Government/public sector-5, Public/Private limited company-6, Co-operative societies/trust/other non profit institutions -7, employer’s households(i.e., private households employing maid servant, watchman, cook, etc.) -8, others -9.
col. (11): number of workers in the enterprise: less than 6 -1, 6 & above but less than 10 -2, 10 & above but less than 20 -3, 20 & above -4, not known -9.
col. (12): type of job contract: no written job contract -1; written job contract: for 1 year or less -2, more than 1 year to 3 years -3, more than 3 years -4.
col. (14): availability of social security benefits: eligible for: only PF/ pension (i.e., GPF, CPF, PPF, pension, etc.) -1, only gratuity -2, only health care & maternity benefits -3, only PF/ pension
and gratuity -4, only PF/ pension and health care & maternity benefits -5, only gratuity and health care & maternity benefits -6, PF/ pension, gratuity, health care & maternity benefits -7; not eligible for any of above social security benefits -8.
col. (15): method of payment: regular monthly salary -1, regular weekly payment -2, daily payment -3, piece rate payment -4, others - 5.
col. (16): whether worked under given specifications: yes: wholly -1, mainly -2, partly -3; no-4, not known -9
col. (17): who provided credit / raw material / equipments: own arrangement –1; provided by the enterprise: credit only -2, raw material only -3, equipments only -4, credit and raw material only-5, credit and equipments only -6, raw material and equipments only -7, credit, raw material and equipments –8; not known -9
col. (18): no. of outlets of disposal: one outlet -1, two outlets -2, three or more outlets -3; not known –9.
col. (21): period of seeking/available for work during last 365 days: sought/available for: less than 1 month -1, 1 month & above but less than 3 months -2, 3 months & above but less than 7 months -3, 7 months & above but less than 10 months -4, 10 months to 12 months - 5; did not seek/ not available -6.
col. (22): seeking or available or suitable for the type of occupation: 3 -digit code as per NCO-2004.
Codes for Block 5.2
col. (3): status: codes as in col. 3, block 5.1. (only codes 11 to 51 are applicable here).col. (5) : industry : 5-digit code as per NIC-2004.col. (6) : occupation : 3-digit code as per NCO-2004.col. (7) : location of workplace: codes as in col. 8, block 5.1.col. (8): enterprise type: codes as in col. 9, block 5.1.col. (10): number of workers in the enterprise: codes as in col. 11, block 5.1.col. (11): type of job contract: codes as in col. 12, block 5.1.col. (13): availability of social security benefits: codes as in col. 14, block 5.1.col. (14): method of payment : codes as in col. 15, block 5.1.col. (15): whether worked under given specifications: codes as in col. 16, block 5.1.col. (16): who provided credit / raw material / equipments: codes as in col. 17, block 5.1.col. (17): no. of outlets of disposal: codes as in col. 18, block 5.1.
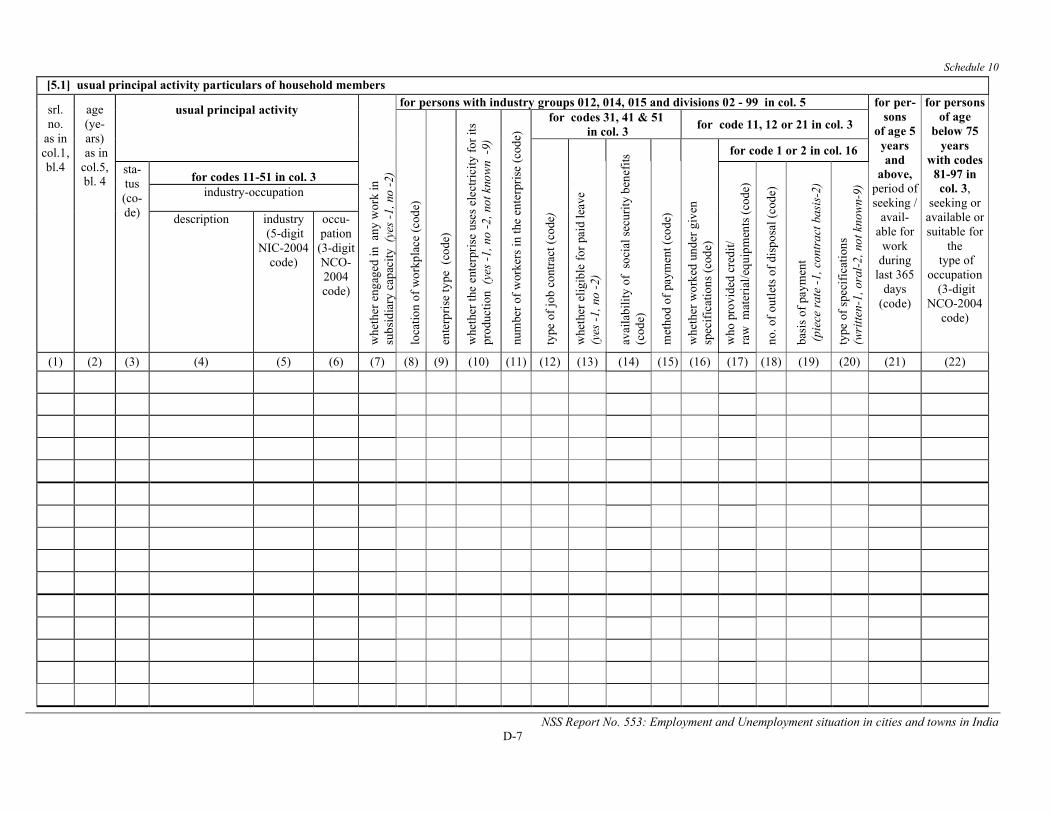
Schedule 10
NSS Report No. 553: Employment and Unemployment situation in cities and towns in IndiaD-7
[5.1] usual principal activity particulars of household members
srl. no.
as in col.1, bl.4
age (ye-ars)as in
col.5, bl. 4
usual principal activity
whe
ther
eng
aged
in a
ny w
ork
insu
bsid
iary
cap
acity
(ye
s -1
, no
-2)
for persons with industry groups 012, 014, 015 and divisions 02 - 99 in col. 5 for per-sons
of age 5 years and
above, period of seeking /
avail-able for
work during
last 365 days
(code)
for persons of age
below 75 years
with codes 81-97 in col. 3,
seeking or available or suitable for
thetype of
occupation(3-digit
NCO-2004 code)
loca
tion
of w
orkp
lace
(co
de)
ente
rpri
se ty
pe (
code
)
whe
ther
the
ente
rpri
se u
ses
elec
tric
ity f
or it
s
prod
uctio
n (
yes
-1, n
o -2
, not
kno
wn
-9)
num
ber
of w
orke
rs in
the
ente
rpri
se (
code
)
for codes 31, 41 & 51in col. 3
for code 11, 12 or 21 in col. 3
type
of
job
cont
ract
(co
de)
whe
ther
elig
ible
for
pai
dle
ave
(yes
-1,
no
-2)
avai
labi
lity
of s
ocia
l sec
urity
ben
efits
(c
ode)
met
hod
of p
aym
ent (
code
)
whe
ther
wor
ked
unde
r gi
ven
spec
ific
atio
ns (
code
)
for code 1 or 2 in col. 16
sta-tus(co-de)
for codes 11-51 in col. 3
who
pro
vide
d cr
edit/
raw
mat
eria
l/eq
uipm
ents
(co
de)
no. o
f ou
tlet
s of
dis
posa
l (co
de)
basi
s of
pay
men
t(p
iece
rat
e -1
, con
trac
t bas
is-2
)
type
of
spec
ific
atio
ns
(wri
tten-
1, o
ral-
2, n
ot k
now
n-9)industry-occupation
description industry (5-digit
NIC-2004 code)
occu-pation(3-digit NCO-2004 code)
(1) (2) (3) (4) (5) (6) (7) (8) (9) (10) (11) (12) (13) (14) (15) (16) (17) (18) (19) (20) (21) (22)
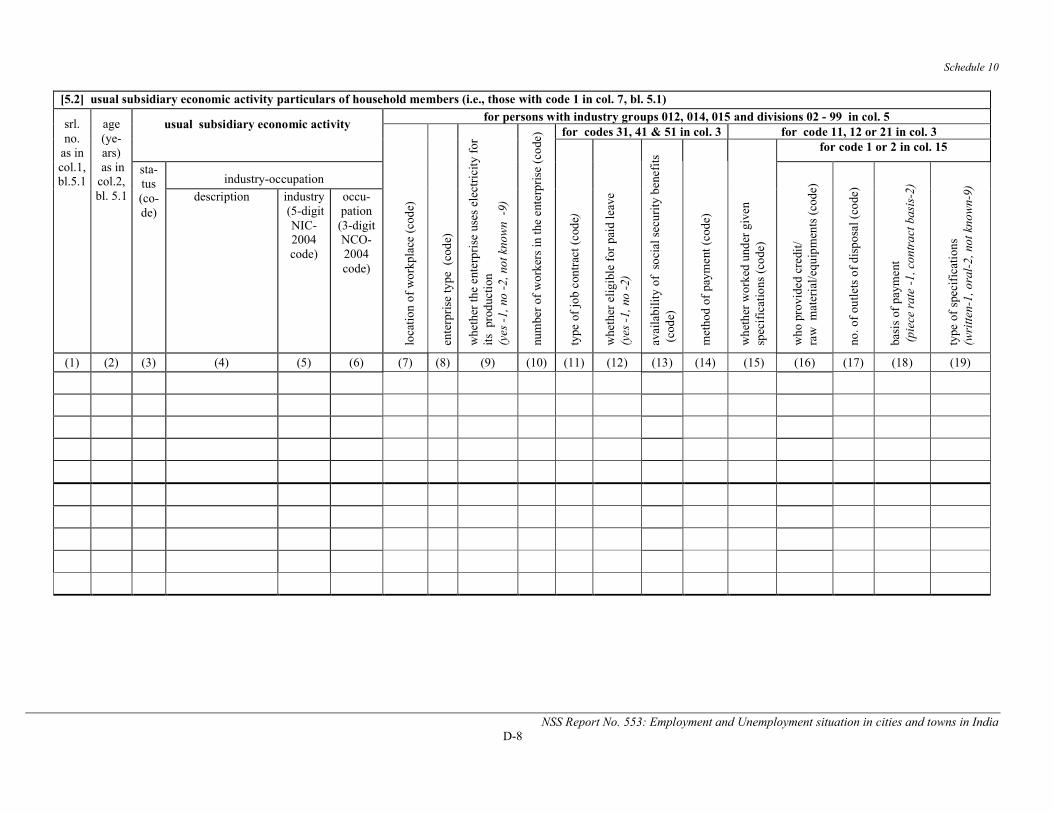
Schedule 10
NSS Report No. 553: Employment and Unemployment situation in cities and towns in IndiaD-8
[5.2] usual subsidiary economic activity particulars of household members (i.e., those with code 1 in col. 7, bl. 5.1)
srl. no.
as in col.1, bl.5.1
age (ye-ars)as in
col.2, bl. 5.1
usual subsidiary economic activityfor persons with industry groups 012, 014, 015 and divisions 02 - 99 in col. 5
loca
tion
of
wor
kpla
ce (
code
)
ente
rpri
se ty
pe (
code
)
whe
ther
the
ente
rpri
se u
ses
elec
tric
ity f
or
its p
rodu
ctio
n (y
es -
1, n
o -2
, not
kno
wn
-9)
num
ber
of w
orke
rs in
the
ente
rpri
se (
code
) for codes 31, 41 & 51 in col. 3 for code 11, 12 or 21 in col. 3
type
of
job
cont
ract
(co
de)
whe
ther
elig
ible
for
pai
d le
ave
(yes
-1,
no
-2)
avai
labi
lity
of s
ocia
l sec
urity
ben
efits
(cod
e)
met
hod
of p
aym
ent (
code
)
whe
ther
wor
ked
unde
r gi
ven
spec
ific
atio
ns (
code
)
for code 1 or 2 in col. 15
sta-tus(co-de)
industry-occupation
who
pro
vide
d cr
edit
/ra
w m
ater
ial/e
quip
men
ts (
code
)
no. o
f ou
tlets
of
disp
osal
(co
de)
basi
s of
pay
men
t(p
iece
rat
e -1
, con
trac
t bas
is-2
)
type
of
spec
ific
atio
ns
(wri
tten-
1, o
ral-
2, n
ot k
now
n-9)description industry
(5-digit NIC-2004 code)
occu-pation(3-digit NCO-2004 code)
(1) (2) (3) (4) (5) (6) (7) (8) (9) (10) (11) (12) (13) (14) (15) (16) (17) (18) (19)
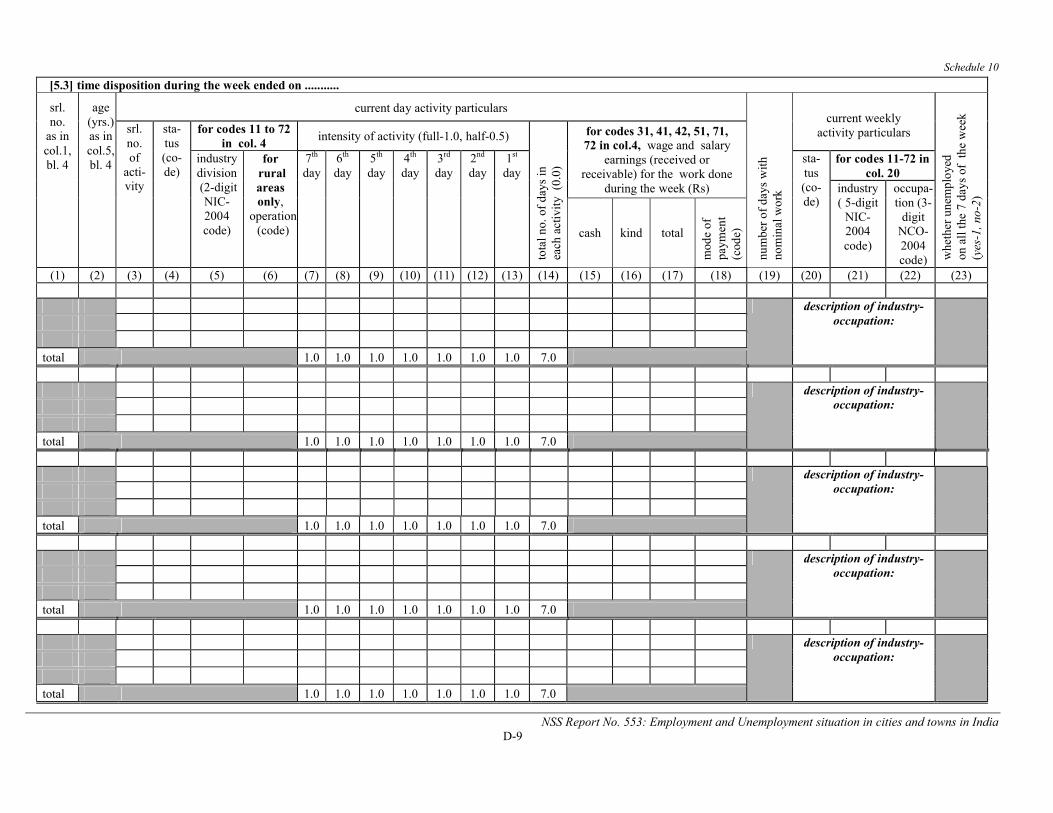
Schedule 10
NSS Report No. 553: Employment and Unemployment situation in cities and towns in IndiaD-9
[5.3] time disposition during the week ended on ...........
srl. no.
as incol.1,bl. 4
age (yrs.)as incol.5,bl. 4
current day activity particulars
num
ber
of d
ays
with
no
min
al w
ork
current weeklyactivity particulars
whe
ther
une
mpl
oyed
on
all
the
7 da
ys o
f th
e w
eek
(yes
-1, n
o-2)
srl. no.of
acti-vity
sta-tus(co-de)
for codes 11 to 72 in col. 4
intensity of activity (full-1.0, half-0.5)
tota
l no.
of
days
inea
ch a
ctiv
ity
(0.
0)
for codes 31, 41, 42, 51, 71, 72 in col.4, wage and salary
earnings (received or receivable) for the work done
during the week (Rs)
industry division(2-digitNIC-2004 code)
forrural areas only,
operation(code)
7th
day6th
day5th
day4th
day3rd
day2nd
day1st
daysta-tus (co-de)
for codes 11-72 in col. 20
industry( 5-digit
NIC-2004 code)
occupa-tion (3-
digit NCO-2004 code)
cash kind total
mod
e of
pa
ymen
t (c
ode)
(1) (2) (3) (4) (5) (6) (7) (8) (9) (10) (11) (12) (13) (14) (15) (16) (17) (18) (19) (20) (21) (22) (23)
description of industry-occupation:
total 1.0 1.0 1.0 1.0 1.0 1.0 1.0 7.0
description of industry-occupation:
total 1.0 1.0 1.0 1.0 1.0 1.0 1.0 7.0
description of industry-occupation:
total 1.0 1.0 1.0 1.0 1.0 1.0 1.0 7.0
description of industry-occupation:
total 1.0 1.0 1.0 1.0 1.0 1.0 1.0 7.0
description of industry-occupation:
total 1.0 1.0 1.0 1.0 1.0 1.0 1.0 7.0
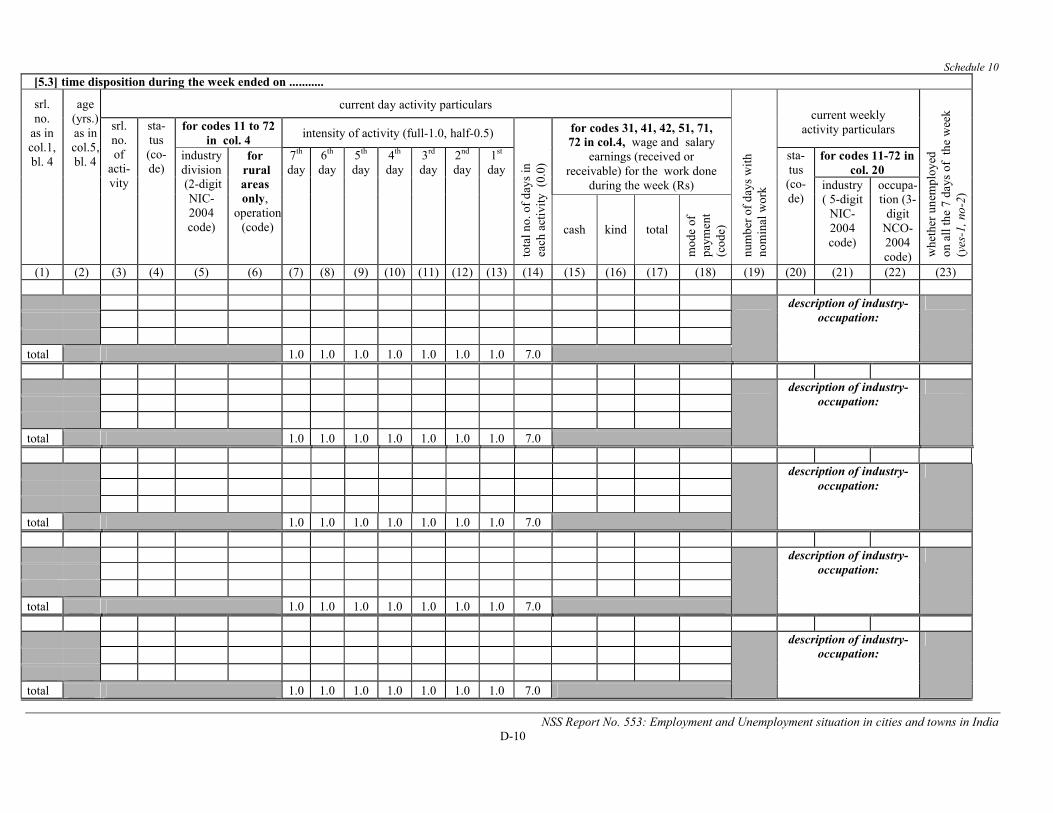
Schedule 10
NSS Report No. 553: Employment and Unemployment situation in cities and towns in IndiaD-10
[5.3] time disposition during the week ended on ...........
srl. no.
as incol.1,bl. 4
age (yrs.) as incol.5,bl. 4
current day activity particulars
num
ber
of d
ays
wit
h no
min
al w
ork
current weeklyactivity particulars
whe
ther
une
mpl
oyed
on
all
the
7 da
ys o
f th
e w
eek
(yes
-1, n
o-2)
srl. no.of
acti-vity
sta-tus(co-de)
for codes 11 to 72 in col. 4
intensity of activity (full-1.0, half-0.5)
tota
l no.
of
days
inea
ch a
ctiv
ity (
0.0)
for codes 31, 41, 42, 51, 71, 72 in col.4, wage and salary
earnings (received or receivable) for the work done
during the week (Rs)
industry division(2-digitNIC-2004 code)
forrural areas only,
operation(code)
7th
day6th
day5th
day4th
day3rd
day2nd
day1st
daysta-tus (co-de)
for codes 11-72 in col. 20
industry( 5-digit
NIC-2004 code)
occupa-tion (3-
digit NCO-2004 code)
cash kind total
mod
e of
pa
ymen
t (c
ode)
(1) (2) (3) (4) (5) (6) (7) (8) (9) (10) (11) (12) (13) (14) (15) (16) (17) (18) (19) (20) (21) (22) (23)
description of industry-occupation:
total 1.0 1.0 1.0 1.0 1.0 1.0 1.0 7.0
description of industry-occupation:
total 1.0 1.0 1.0 1.0 1.0 1.0 1.0 7.0
description of industry-occupation:
total 1.0 1.0 1.0 1.0 1.0 1.0 1.0 7.0
description of industry-occupation:
total 1.0 1.0 1.0 1.0 1.0 1.0 1.0 7.0
description of industry-occupation:
total 1.0 1.0 1.0 1.0 1.0 1.0 1.0 7.0
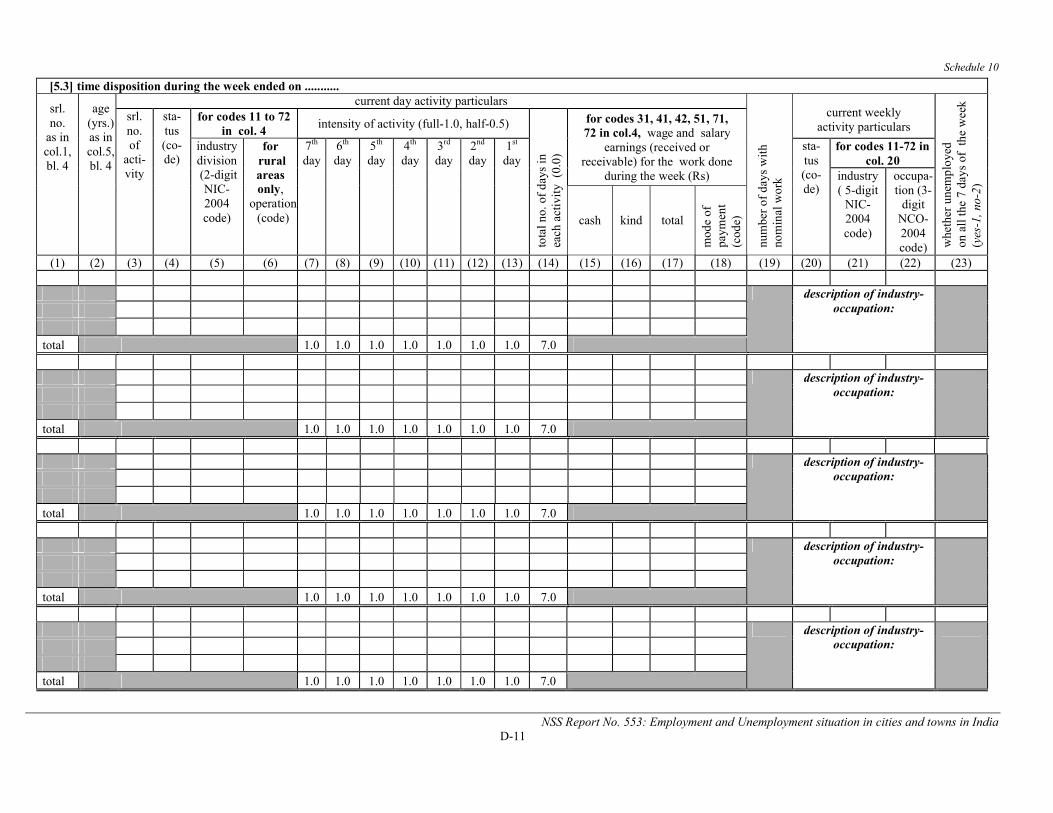
Schedule 10
NSS Report No. 553: Employment and Unemployment situation in cities and towns in IndiaD-11
[5.3] time disposition during the week ended on ...........
srl. no.
as incol.1,bl. 4
age (yrs.) as incol.5,bl. 4
current day activity particulars
num
ber
of d
ays
with
no
min
al w
ork
current weeklyactivity particulars
whe
ther
une
mpl
oyed
on
all
the
7 da
ys o
f th
e w
eek
(yes
-1, n
o-2)
srl. no.of
acti-vity
sta-tus(co-de)
for codes 11 to 72 in col. 4
intensity of activity (full-1.0, half-0.5)
tota
l no.
of
days
inea
ch a
ctiv
ity
(0.
0)
for codes 31, 41, 42, 51, 71, 72 in col.4, wage and salary
earnings (received or receivable) for the work done
during the week (Rs)
industry division(2-digitNIC-2004 code)
forrural areas only,
operation(code)
7th
day6th
day5th
day4th
day3rd
day2nd
day1st
daysta-tus (co-de)
for codes 11-72 in col. 20
industry( 5-digit
NIC-2004 code)
occupa-tion (3-
digit NCO-2004 code)
cash kind total
mod
e of
pa
ymen
t (c
ode)
(1) (2) (3) (4) (5) (6) (7) (8) (9) (10) (11) (12) (13) (14) (15) (16) (17) (18) (19) (20) (21) (22) (23)
description of industry-occupation:
total 1.0 1.0 1.0 1.0 1.0 1.0 1.0 7.0
description of industry-occupation:
total 1.0 1.0 1.0 1.0 1.0 1.0 1.0 7.0
description of industry-occupation:
total 1.0 1.0 1.0 1.0 1.0 1.0 1.0 7.0
description of industry-occupation:
total 1.0 1.0 1.0 1.0 1.0 1.0 1.0 7.0
description of industry-occupation:
total 1.0 1.0 1.0 1.0 1.0 1.0 1.0 7.0
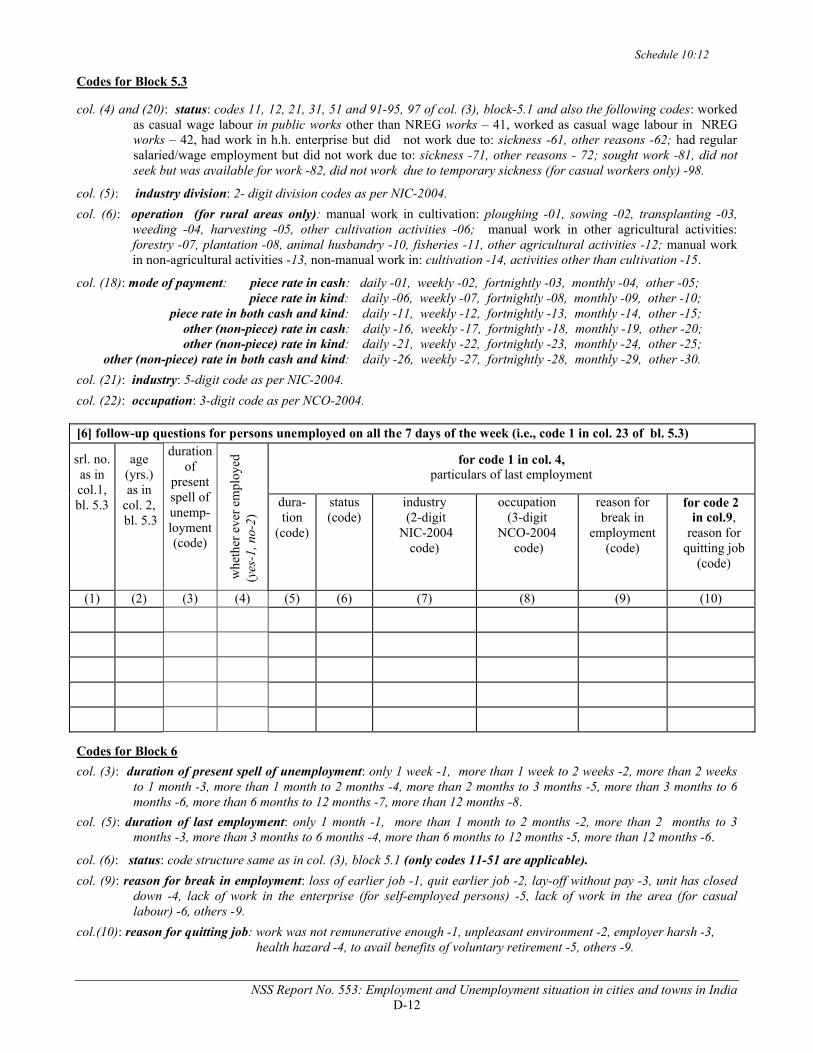
Schedule 10:12
NSS Report No. 553: Employment and Unemployment situation in cities and towns in IndiaD-12
Codes for Block 5.3
col. (4) and (20): status: codes 11, 12, 21, 31, 51 and 91-95, 97 of col. (3), block-5.1 and also the following codes: worked as casual wage labour in public works other than NREG works – 41, worked as casual wage labour in NREG works – 42, had work in h.h. enterprise but did not work due to: sickness -61, other reasons -62; had regular salaried/wage employment but did not work due to: sickness -71, other reasons - 72; sought work -81, did not seek but was available for work -82, did not work due to temporary sickness (for casual workers only) -98.
col. (5): industry division: 2- digit division codes as per NIC-2004.
col. (6): operation (for rural areas only): manual work in cultivation: ploughing -01, sowing -02, transplanting -03, weeding -04, harvesting -05, other cultivation activities -06; manual work in other agricultural activities:forestry -07, plantation -08, animal husbandry -10, fisheries -11, other agricultural activities -12; manual work in non-agricultural activities -13, non-manual work in: cultivation -14, activities other than cultivation -15.
col. (18): mode of payment: piece rate in cash: daily -01, weekly -02, fortnightly -03, monthly -04, other -05; piece rate in kind: daily -06, weekly -07, fortnightly -08, monthly -09, other -10; piece rate in both cash and kind: daily -11, weekly -12, fortnightly -13, monthly -14, other -15; other (non-piece) rate in cash: daily -16, weekly -17, fortnightly -18, monthly -19, other -20; other (non-piece) rate in kind: daily -21, weekly -22, fortnightly -23, monthly -24, other -25; other (non-piece) rate in both cash and kind: daily -26, weekly -27, fortnightly -28, monthly -29, other -30.
col. (21): industry: 5-digit code as per NIC-2004.
col. (22): occupation: 3-digit code as per NCO-2004.
[6] follow-up questions for persons unemployed on all the 7 days of the week (i.e., code 1 in col. 23 of bl. 5.3)
srl. no.as in col.1, bl. 5.3
age (yrs.)as in
col. 2,bl. 5.3
duration of
presentspell ofunemp-loyment (code)
whe
ther
eve
r em
ploy
ed(y
es-1
, no-
2)
for code 1 in col. 4,particulars of last employment
dura-tion
(code)
status(code)
industry(2-digit
NIC-2004 code)
occupation(3-digit
NCO-2004code)
reason forbreak in
employment (code)
for code 2 in col.9,
reason for quitting job
(code)
(1) (2) (3) (4) (5) (6) (7) (8) (9) (10)
Codes for Block 6
col. (3): duration of present spell of unemployment: only 1 week -1, more than 1 week to 2 weeks -2, more than 2 weeks to 1 month -3, more than 1 month to 2 months -4, more than 2 months to 3 months -5, more than 3 months to 6 months -6, more than 6 months to 12 months -7, more than 12 months -8.
col. (5): duration of last employment: only 1 month -1, more than 1 month to 2 months -2, more than 2 months to 3 months -3, more than 3 months to 6 months -4, more than 6 months to 12 months -5, more than 12 months -6.
col. (6): status: code structure same as in col. (3), block 5.1 (only codes 11-51 are applicable).
col. (9): reason for break in employment: loss of earlier job -1, quit earlier job -2, lay-off without pay -3, unit has closed down -4, lack of work in the enterprise (for self-employed persons) -5, lack of work in the area (for casual labour) -6, others -9.
col.(10): reason for quitting job: work was not remunerative enough -1, unpleasant environment -2, employer harsh -3, health hazard -4, to avail benefits of voluntary retirement -5, others -9.
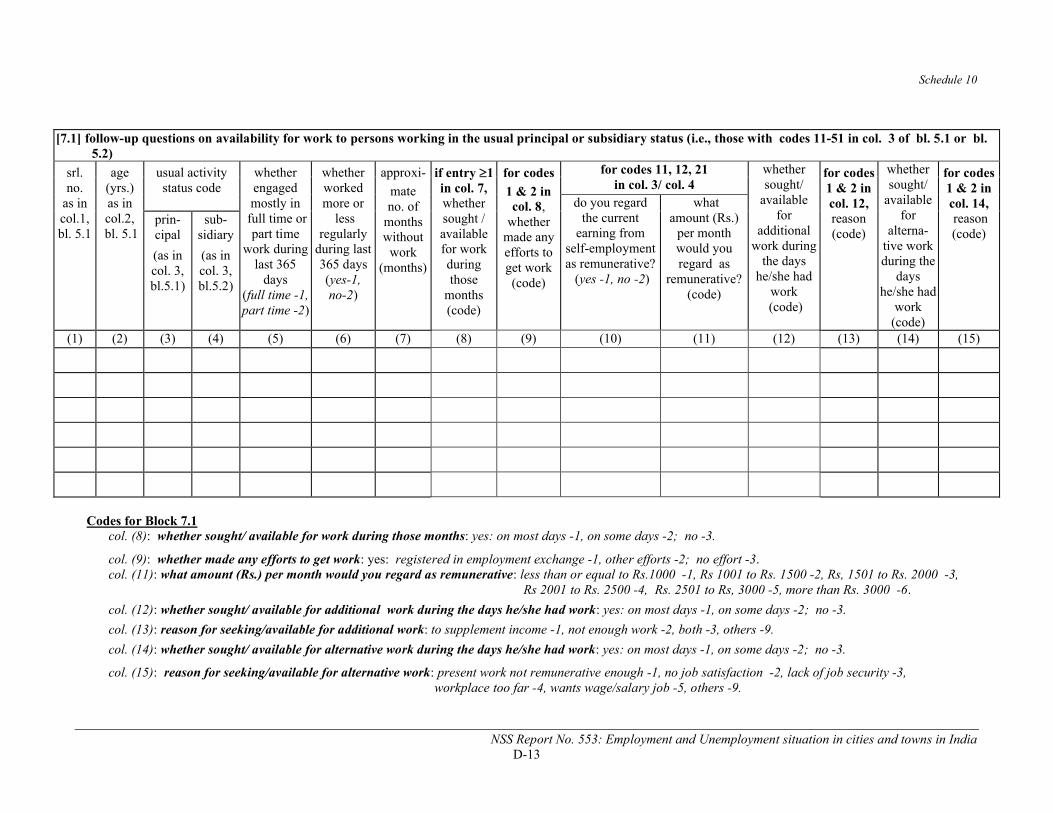
Schedule 10
NSS Report No. 553: Employment and Unemployment situation in cities and towns in IndiaD-13
[7.1] follow-up questions on availability for work to persons working in the usual principal or subsidiary status (i.e., those with codes 11-51 in col. 3 of bl. 5.1 or bl. 5.2)
srl.no.
as in col.1, bl. 5.1
age(yrs.)as in col.2, bl. 5.1
usual activitystatus code
whetherengagedmostly in
full time or part time
work during last 365
days (full time -1, part time -2)
whetherworkedmore or
less regularly
during last 365 days (yes-1, no-2)
approxi-
mateno. of
months without
work (months)
if entry 1in col. 7, whethersought / available for work during those
months(code)
for codes
1 & 2 incol. 8,
whethermade any efforts to get work (code)
for codes 11, 12, 21 in col. 3/ col. 4
whethersought/
availablefor
additional work during
the days he/she had
work(code)
for codes1 & 2 incol. 12,reason (code)
whether sought/
availablefor
alterna-tive work during the
days he/she had
work (code)
for codes1 & 2 incol. 14,reason (code)
do you regard the current
earning from self-employment as remunerative?
(yes -1, no -2)
what amount (Rs.)
per month would you regard as
remunerative?(code)
prin-cipal
(as in col. 3, bl.5.1)
sub-sidiary
(as in col. 3, bl.5.2)
(1) (2) (3) (4) (5) (6) (7) (8) (9) (10) (11) (12) (13) (14) (15)
Codes for Block 7.1col. (8): whether sought/ available for work during those months: yes: on most days -1, on some days -2; no -3.
col. (9): whether made any efforts to get work: yes: registered in employment exchange -1, other efforts -2; no effort -3.col. (11): what amount (Rs.) per month would you regard as remunerative: less than or equal to Rs.1000 -1, Rs 1001 to Rs. 1500 -2, Rs, 1501 to Rs. 2000 -3,
Rs 2001 to Rs. 2500 -4, Rs. 2501 to Rs, 3000 -5, more than Rs. 3000 -6.
col. (12): whether sought/ available for additional work during the days he/she had work: yes: on most days -1, on some days -2; no -3.
col. (13): reason for seeking/available for additional work: to supplement income -1, not enough work -2, both -3, others -9.
col. (14): whether sought/ available for alternative work during the days he/she had work: yes: on most days -1, on some days -2; no -3.
col. (15): reason for seeking/available for alternative work: present work not remunerative enough -1, no job satisfaction -2, lack of job security -3, workplace too far -4, wants wage/salary job -5, others -9.
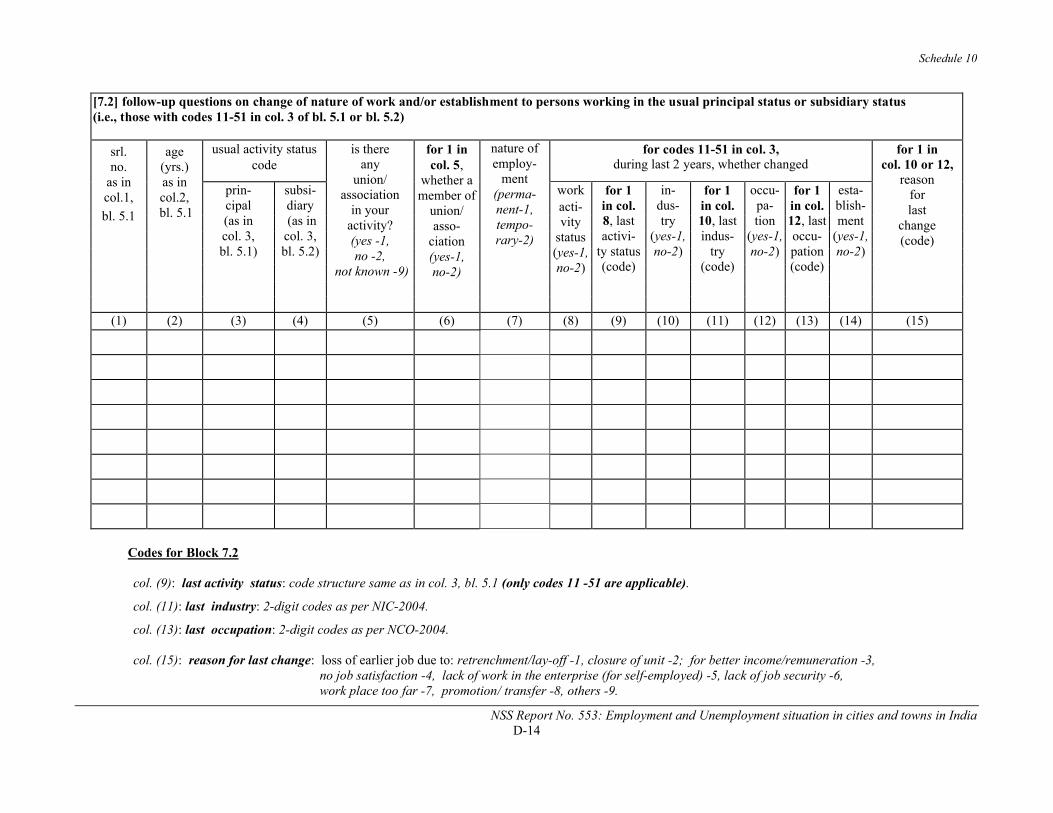
Schedule 10
NSS Report No. 553: Employment and Unemployment situation in cities and towns in IndiaD-14
[7.2] follow-up questions on change of nature of work and/or establishment to persons working in the usual principal status or subsidiary status (i.e., those with codes 11-51 in col. 3 of bl. 5.1 or bl. 5.2)
srl.no.
as in col.1,
bl. 5.1
age(yrs.)as in col.2,bl. 5.1
usual activity status code
is thereany
union/association
in youractivity?(yes -1, no -2,
not known -9)
for 1 in col. 5,
whether a member of
union/asso-
ciation(yes-1,no-2)
nature ofemploy-
ment(perma-nent-1,tempo-rary-2)
for codes 11-51 in col. 3,during last 2 years, whether changed
for 1 in col. 10 or 12,
reasonforlast
change(code)
prin-cipal(as incol. 3,bl. 5.1)
subsi-diary(as in
col. 3,bl. 5.2)
work for 1in col.8, lastactivi-
ty status(code)
in-dus-try
(yes-1,no-2)
for 1 in col.10, lastindus-
try(code)
occu-pa-tion
(yes-1,no-2)
for 1in col.12, lastoccu-pation(code)
esta-blish-ment
(yes-1,no-2)
acti-vity
status(yes-1,no-2)
(1) (2) (3) (4) (5) (6) (7) (8) (9) (10) (11) (12) (13) (14) (15)
Codes for Block 7.2
col. (9): last activity status: code structure same as in col. 3, bl. 5.1 (only codes 11 -51 are applicable).
col. (11): last industry: 2-digit codes as per NIC-2004.
col. (13): last occupation: 2-digit codes as per NCO-2004.
col. (15): reason for last change: loss of earlier job due to: retrenchment/lay-off -1, closure of unit -2; for better income/remuneration -3, no job satisfaction -4, lack of work in the enterprise (for self-employed) -5, lack of job security -6, work place too far -7, promotion/ transfer -8, others -9.
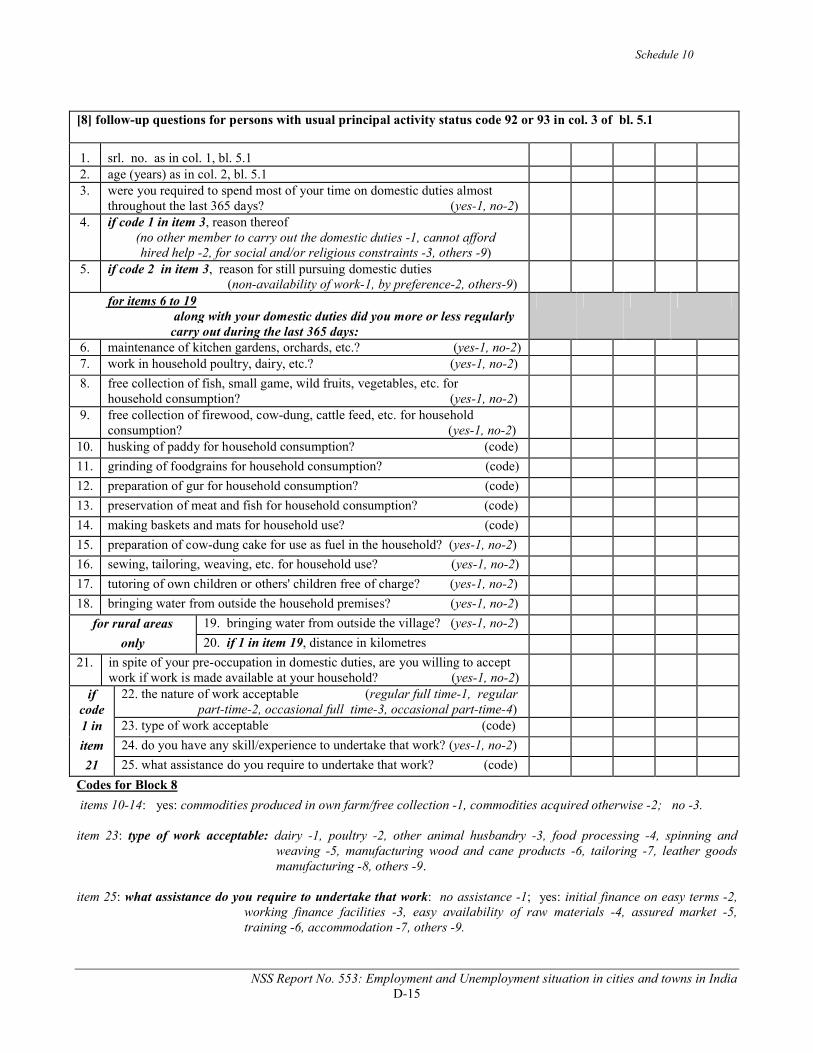
Schedule 10
NSS Report No. 553: Employment and Unemployment situation in cities and towns in IndiaD-15
[8] follow-up questions for persons with usual principal activity status code 92 or 93 in col. 3 of bl. 5.1
1. srl. no. as in col. 1, bl. 5.12. age (years) as in col. 2, bl. 5.13. were you required to spend most of your time on domestic duties almost
throughout the last 365 days? (yes-1, no-2) 4. if code 1 in item 3, reason thereof
(no other member to carry out the domestic duties -1, cannot afford hired help -2, for social and/or religious constraints -3, others -9)
5. if code 2 in item 3, reason for still pursuing domestic duties (non-availability of work-1, by preference-2, others-9)for items 6 to 19
along with your domestic duties did you more or less regularly carry out during the last 365 days:
6. maintenance of kitchen gardens, orchards, etc.? (yes-1, no-2)7. work in household poultry, dairy, etc.? (yes-1, no-2)
8. free collection of fish, small game, wild fruits, vegetables, etc. for household consumption? (yes-1, no-2)
9. free collection of firewood, cow-dung, cattle feed, etc. for household consumption? (yes-1, no-2)
10. husking of paddy for household consumption? (code)
11. grinding of foodgrains for household consumption? (code)
12. preparation of gur for household consumption? (code)
13. preservation of meat and fish for household consumption? (code)
14. making baskets and mats for household use? (code)
15. preparation of cow-dung cake for use as fuel in the household? (yes-1, no-2)
16. sewing, tailoring, weaving, etc. for household use? (yes-1, no-2)
17. tutoring of own children or others' children free of charge? (yes-1, no-2)
18. bringing water from outside the household premises? (yes-1, no-2)
for rural areas 19. bringing water from outside the village? (yes-1, no-2)
only 20. if 1 in item 19, distance in kilometres
21. in spite of your pre-occupation in domestic duties, are you willing to accept work if work is made available at your household? (yes-1, no-2)
if code
22. the nature of work acceptable (regular full time-1, regular part-time-2, occasional full time-3, occasional part-time-4)
1 in 23. type of work acceptable (code)
item 24. do you have any skill/experience to undertake that work? (yes-1, no-2)
21 25. what assistance do you require to undertake that work? (code)
Codes for Block 8
items 10-14: yes: commodities produced in own farm/free collection -1, commodities acquired otherwise -2; no -3.
item 23: type of work acceptable: dairy -1, poultry -2, other animal husbandry -3, food processing -4, spinning and weaving -5, manufacturing wood and cane products -6, tailoring -7, leather goods manufacturing -8, others -9.
item 25: what assistance do you require to undertake that work: no assistance -1; yes: initial finance on easy terms -2, working finance facilities -3, easy availability of raw materials -4, assured market -5, training -6, accommodation -7, others -9.
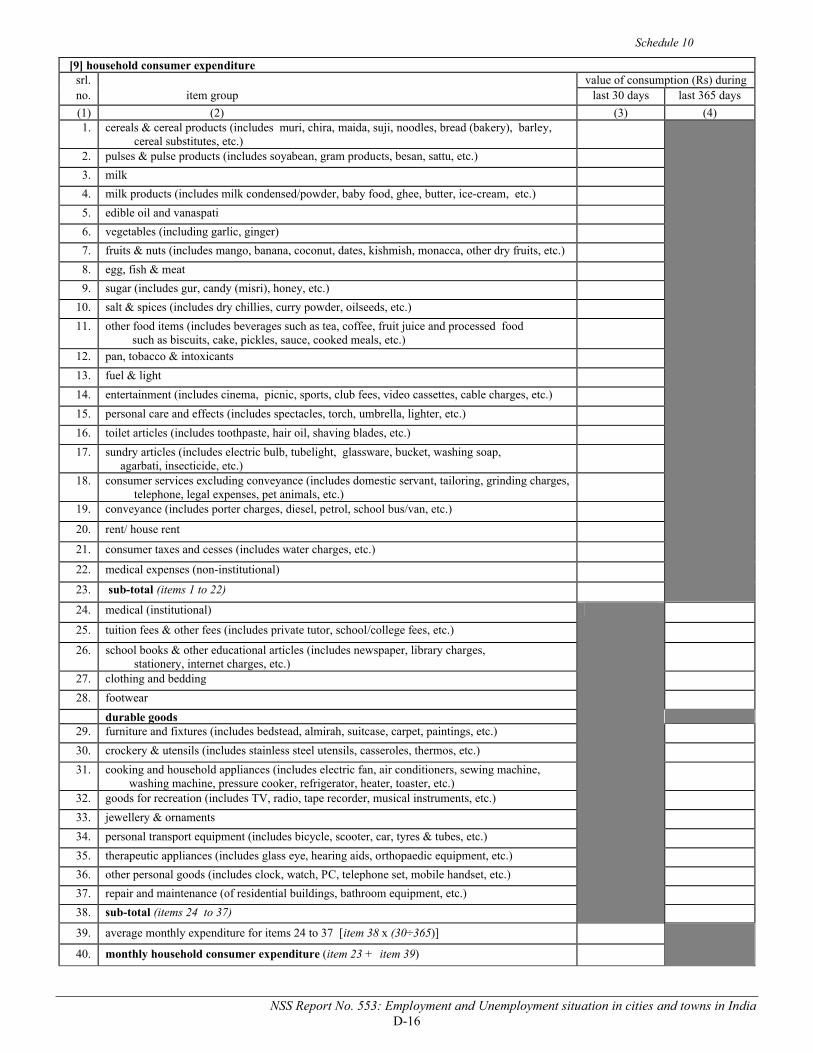
Schedule 10
NSS Report No. 553: Employment and Unemployment situation in cities and towns in IndiaD-16
[9] household consumer expendituresrl. value of consumption (Rs) duringno. item group last 30 days last 365 days
(1) (2) (3) (4)1. cereals & cereal products (includes muri, chira, maida, suji, noodles, bread (bakery), barley,
cereal substitutes, etc.)2. pulses & pulse products (includes soyabean, gram products, besan, sattu, etc.)
3. milk
4. milk products (includes milk condensed/powder, baby food, ghee, butter, ice-cream, etc.)
5. edible oil and vanaspati
6. vegetables (including garlic, ginger)
7. fruits & nuts (includes mango, banana, coconut, dates, kishmish, monacca, other dry fruits, etc.)
8. egg, fish & meat
9. sugar (includes gur, candy (misri), honey, etc.)
10. salt & spices (includes dry chillies, curry powder, oilseeds, etc.)
11. other food items (includes beverages such as tea, coffee, fruit juice and processed food such as biscuits, cake, pickles, sauce, cooked meals, etc.)
12. pan, tobacco & intoxicants
13. fuel & light
14. entertainment (includes cinema, picnic, sports, club fees, video cassettes, cable charges, etc.)
15. personal care and effects (includes spectacles, torch, umbrella, lighter, etc.)
16. toilet articles (includes toothpaste, hair oil, shaving blades, etc.)
17. sundry articles (includes electric bulb, tubelight, glassware, bucket, washing soap, agarbati, insecticide, etc.)
18. consumer services excluding conveyance (includes domestic servant, tailoring, grinding charges, telephone, legal expenses, pet animals, etc.)
19. conveyance (includes porter charges, diesel, petrol, school bus/van, etc.)
20. rent/ house rent
21. consumer taxes and cesses (includes water charges, etc.)
22. medical expenses (non-institutional)
23. sub-total (items 1 to 22)
24. medical (institutional)
25. tuition fees & other fees (includes private tutor, school/college fees, etc.)
26. school books & other educational articles (includes newspaper, library charges, stationery, internet charges, etc.)
27. clothing and bedding
28. footwear
durable goods29. furniture and fixtures (includes bedstead, almirah, suitcase, carpet, paintings, etc.)
30. crockery & utensils (includes stainless steel utensils, casseroles, thermos, etc.)
31. cooking and household appliances (includes electric fan, air conditioners, sewing machine, washing machine, pressure cooker, refrigerator, heater, toaster, etc.)
32. goods for recreation (includes TV, radio, tape recorder, musical instruments, etc.)
33. jewellery & ornaments
34. personal transport equipment (includes bicycle, scooter, car, tyres & tubes, etc.)
35. therapeutic appliances (includes glass eye, hearing aids, orthopaedic equipment, etc.)
36. other personal goods (includes clock, watch, PC, telephone set, mobile handset, etc.)
37. repair and maintenance (of residential buildings, bathroom equipment, etc.)
38. sub-total (items 24 to 37)
39. average monthly expenditure for items 24 to 37 [item 38 x (30÷365)]
40. monthly household consumer expenditure (item 23 + item 39)
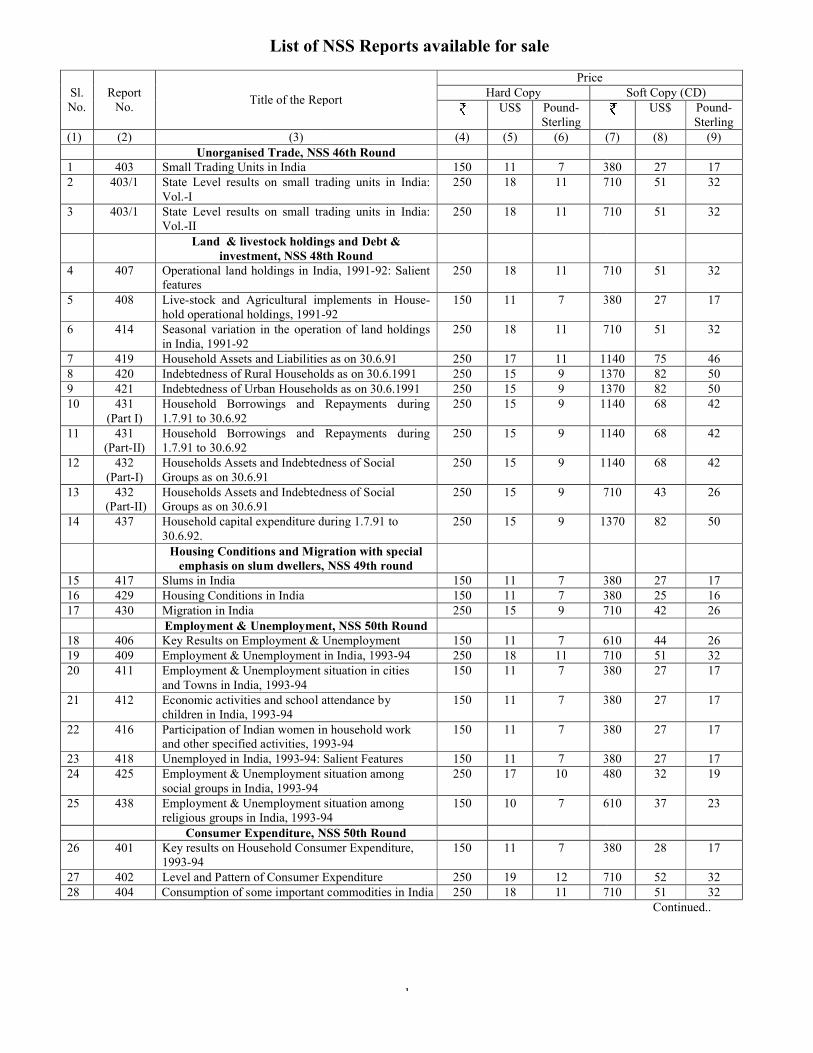
List of NSS Reports available for sale
Sl.No.
ReportNo.
Title of the Report
(1) (2) (3)Unorganised Trade, NSS 46th Round
1 403 Small Trading Units in India2 403/1 State Level results on small trading units in India:
Vol.-I3 403/1 State Level results on small trading units in India:
Vol.-IILand & livestock holdings and
investment, NSS 48th Round4 407 Operational land holdings in India, 1991
features5 408 Live-stock and Agricultural implements in House
hold operational holdings, 19916 414 Seasonal variation in the operation of land holdings
in India, 1991-927 419 Household Assets and Liabilities as on 30.6.918 420 Indebtedness of Rural Households as on 30.6.19919 421 Indebtedness of Urban Households as on 30.6.199110 431
(Part I)Household Borrowings and Repayments during 1.7.91 to 30.6.92
11 431(Part-II)
Household Borrowings and Repayments during 1.7.91 to 30.6.92
12 432 (Part-I)
Households Assets and Indebtedness of Social Groups as on 30.6.91
13 432(Part-II)
Households Assets and Indebtedness of Social Groups as on 30.6.91
14 437 Household capital expenditure during 1.7.91 30.6.92.
Housing Conditions and Migration with special emphasis on slum dwellers, NSS 49th round
15 417 Slums in India16 429 Housing Conditions in India17 430 Migration in India
Employment & Unemployment, NSS 50th Round18 406 Key Results on Employment & Unemployment19 409 Employment & Unemployment in India, 199320 411 Employment & Unemployment situation in
and Towns in India, 1993-9421 412 Economic activities and school attendance by
children in India, 1993-9422 416 Participation of Indian women in household work
and other specified activities, 199323 418 Unemployed in India, 1993-94: Salient Features24 425 Employment & Unemployment situation among
social groups in India, 1993-9425 438 Employment & Unemployment situation among
religious groups in India, 1993-94Consumer Expenditure, NSS 50th Round
26 401 Key results on Household Consumer Expenditure, 1993-94
27 402 Level and Pattern of Consumer Expenditure28 404 Consumption of some important commodities in India
1
List of NSS Reports available for sale
Title of the Report
PriceHard Copy
US$ Pound-Sterling
(4) (5) (6) (7)Unorganised Trade, NSS 46th Round
150 11 7 380State Level results on small trading units in India: 250 18 11 710
State Level results on small trading units in India: 250 18 11 710
Land & livestock holdings and Debt & investment, NSS 48th Round
Operational land holdings in India, 1991-92: Salient 250 18 11 710
stock and Agricultural implements in House-hold operational holdings, 1991-92
150 11 7 380
variation in the operation of land holdings 250 18 11 710
Household Assets and Liabilities as on 30.6.91 250 17 11 1140Indebtedness of Rural Households as on 30.6.1991 250 15 9 1370
Urban Households as on 30.6.1991 250 15 9 1370Household Borrowings and Repayments during 250 15 9 1140
Household Borrowings and Repayments during 250 15 9 1140
Households Assets and Indebtedness of Social 250 15 9 1140
Households Assets and Indebtedness of Social 250 15 9 710
Household capital expenditure during 1.7.91 to 250 15 9 1370
Housing Conditions and Migration with special emphasis on slum dwellers, NSS 49th round
150 11 7 380150 11 7 380250 15 9 710
Employment & Unemployment, NSS 50th RoundKey Results on Employment & Unemployment 150 11 7 610Employment & Unemployment in India, 1993-94 250 18 11 710Employment & Unemployment situation in cities 150 11 7 380
Economic activities and school attendance by 150 11 7 380
Participation of Indian women in household work and other specified activities, 1993-94
150 11 7 380
94: Salient Features 150 11 7 380Employment & Unemployment situation among 250 17 10 480
Employment & Unemployment situation among 94
150 10 7 610
Consumer Expenditure, NSS 50th RoundKey results on Household Consumer Expenditure, 150 11 7 380
Level and Pattern of Consumer Expenditure 250 19 12 710of some important commodities in India 250 18 11 710
Soft Copy (CD)US$ Pound-
Sterling(7) (8) (9)
380 27 17710 51 32
710 51 32
710 51 32
380 27 17
710 51 32
1140 75 461370 82 501370 82 501140 68 42
1140 68 42
1140 68 42
710 43 26
1370 82 50
380 27 17380 25 16710 42 26
610 44 26710 51 32380 27 17
380 27 17
380 27 17
380 27 17480 32 19
610 37 23
380 28 17
710 52 32710 51 32
Continued..
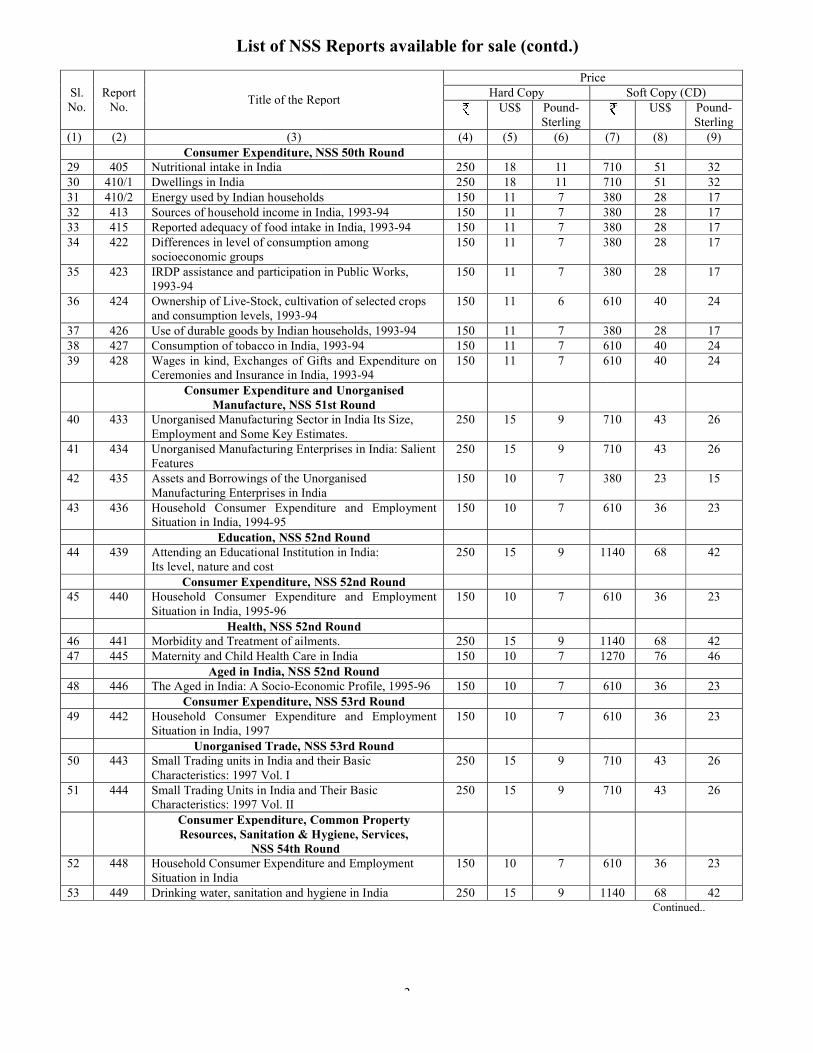
List of NSS Reports available for sale (contd.)
Sl.No.
ReportNo.
Title of the Report
(1) (2) (3)Consumer Expenditure, NSS 50th Round
29 405 Nutritional intake in India30 410/1 Dwellings in India31 410/2 Energy used by Indian households32 413 Sources of household income in India, 199333 415 Reported adequacy of food intake in India, 199334 422 Differences in level of consumption among
socioeconomic groups35 423 IRDP assistance and participation in Public Works,
1993-9436 424 Ownership of Live-Stock, cultivation of selected crops
and consumption levels, 1993-9437 426 Use of durable goods by Indian households, 199338 427 Consumption of tobacco in India, 199339 428 Wages in kind, Exchanges of Gifts and Expenditure on
Ceremonies and Insurance in India, 1993Consumer Expenditure and Unorganised
Manufacture, NSS 51st 40 433 Unorganised Manufacturing Sector in India Its Size,
Employment and Some Key Estimates.41 434 Unorganised Manufacturing Enterprises in India: Salient
Features42 435 Assets and Borrowings of the Unorganised
Manufacturing Enterprises in India43 436 Household Consumer Expenditure and Employment
Situation in India, 1994-95Education, NSS 52nd Round
44 439 Attending an Educational Institution in India: Its level, nature and cost
Consumer Expenditure, NSS 52nd Round45 440 Household Consumer Expenditure and Employment
Situation in India, 1995-96Health, NSS 52nd Round
46 441 Morbidity and Treatment of ailments.47 445 Maternity and Child Health Care in India
Aged in India, NSS 52nd Round48 446 The Aged in India: A Socio-Economic Profile, 1995
Consumer Expenditure, NSS 53rd Round49 442 Household Consumer Expenditure and Employment
Situation in India, 1997Unorganised Trade, NSS 53rd Round
50 443 Small Trading units in India and their Basic Characteristics: 1997 Vol. I
51 444 Small Trading Units in India and Their Basic Characteristics: 1997 Vol. II
Consumer Expenditure, Common Property Resources, Sanitation & Hygiene, Services,
NSS 54th Round52 448 Household Consumer Expenditure and Employment
Situation in India53 449 Drinking water, sanitation and hygiene in India
2
List of NSS Reports available for sale (contd.)
Title of the Report
PriceHard Copy
US$ Pound-Sterling
(4) (5) (6) (7)Consumer Expenditure, NSS 50th Round
250 18 11 710250 18 11 710
Energy used by Indian households 150 11 7 380Sources of household income in India, 1993-94 150 11 7 380Reported adequacy of food intake in India, 1993-94 150 11 7 380Differences in level of consumption among 150 11 7 380
and participation in Public Works, 150 11 7 380
Stock, cultivation of selected crops 150 11 6 610
Use of durable goods by Indian households, 1993-94 150 11 7 380Consumption of tobacco in India, 1993-94 150 11 7 610Wages in kind, Exchanges of Gifts and Expenditure on Ceremonies and Insurance in India, 1993-94
150 11 7 610
Consumer Expenditure and Unorganised Manufacture, NSS 51st Round
Unorganised Manufacturing Sector in India Its Size, Employment and Some Key Estimates.
250 15 9 710
Unorganised Manufacturing Enterprises in India: Salient 250 15 9 710
Unorganised Manufacturing Enterprises in India
150 10 7 380
Household Consumer Expenditure and Employment 150 10 7 610
Education, NSS 52nd RoundAttending an Educational Institution in India: 250 15 9 1140
Consumer Expenditure, NSS 52nd RoundHousehold Consumer Expenditure and Employment 150 10 7 610
52nd RoundMorbidity and Treatment of ailments. 250 15 9 1140Maternity and Child Health Care in India 150 10 7 1270
Aged in India, NSS 52nd RoundEconomic Profile, 1995-96 150 10 7 610
Consumer Expenditure, NSS 53rd RoundHousehold Consumer Expenditure and Employment 150 10 7 610
Unorganised Trade, NSS 53rd RoundSmall Trading units in India and their Basic 250 15 9 710
Small Trading Units in India and Their Basic 250 15 9 710
Consumer Expenditure, Common Property Resources, Sanitation & Hygiene, Services,
NSS 54th RoundHousehold Consumer Expenditure and Employment 150 10 7 610
Drinking water, sanitation and hygiene in India 250 15 9 1140
Soft Copy (CD)US$ Pound-
Sterling(7) (8) (9)
710 51 32710 51 32380 28 17380 28 17380 28 17380 28 17
380 28 17
610 40 24
380 28 17610 40 24610 40 24
710 43 26
710 43 26
380 23 15
610 36 23
1140 68 42
610 36 23
1140 68 421270 76 46
610 36 23
610 36 23
710 43 26
710 43 26
610 36 23
1140 68 42Continued..
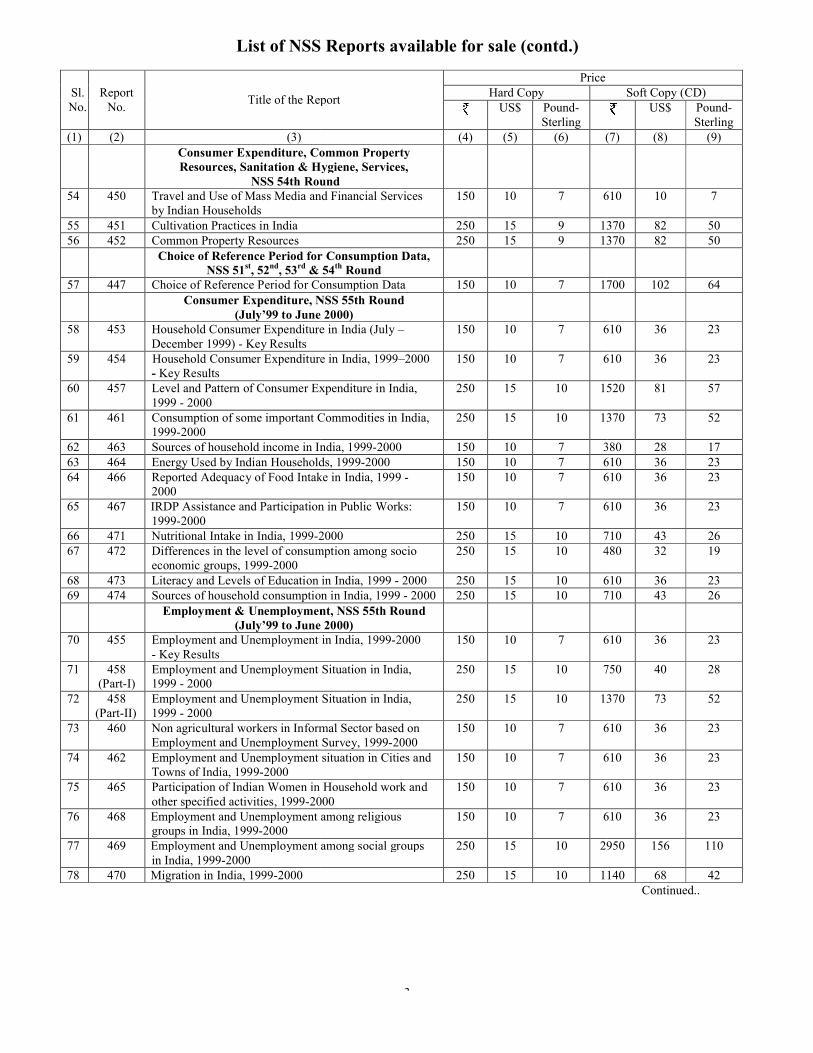
List of NSS Reports available for sale (contd.)
Sl.No.
ReportNo.
Title of the Report
(1) (2) (3)Consumer Expenditure, Common Property Resources, Sanitation & Hygiene, Services,
NSS 54th Round54 450 Travel and Use of Mass Media and Financial Services
by Indian Households55 451 Cultivation Practices in India56 452 Common Property Resources
Choice of Reference Period for Consumption Data,NSS 51st, 52nd, 53rd & 54
57 447 Choice of Reference Period for Consumption DataConsumer Expenditure, NSS 55th Round
(July’99 to June 2000)58 453 Household Consumer Expenditure in India (July
December 1999) - Key Results59 454 Household Consumer Expenditure in India, 1999
- Key Results60 457 Level and Pattern of Consumer Expenditure in India,
1999 - 200061 461 Consumption of some important Commodities in
1999-200062 463 Sources of household income in India, 199963 464 Energy Used by Indian Households, 199964 466 Reported Adequacy of Food Intake in India, 1999
200065 467 IRDP Assistance and Participation in Public Works:
1999-200066 471 Nutritional Intake in India, 1999-200067 472 Differences in the level of consumption among socio
economic groups, 1999-200068 473 Literacy and Levels of Education in India, 1999 69 474 Sources of household consumption in India, 1999
Employment & Unemployment, NSS 55th Round (July’99 to June 2000)
70 455 Employment and Unemployment in India, 1999- Key Results
71 458 (Part-I)
Employment and Unemployment Situation in India, 1999 - 2000
72 458(Part-II)
Employment and Unemployment Situation in India, 1999 - 2000
73 460 Non agricultural workers in Informal Sector based on Employment and Unemployment Survey, 1999
74 462 Employment and Unemployment situation in Cities and Towns of India, 1999-2000
75 465 Participation of Indian Women in Household work and other specified activities, 1999-2000
76 468 Employment and Unemployment among religious groups in India, 1999-2000
77 469 Employment and Unemployment among social groups in India, 1999-2000
78 470 Migration in India, 1999-2000
3
List of NSS Reports available for sale (contd.)
Title of the Report
PriceHard Copy
US$ Pound-Sterling
(4) (5) (6) (7)Consumer Expenditure, Common Property Resources, Sanitation & Hygiene, Services,
NSS 54th RoundTravel and Use of Mass Media and Financial Services 150 10 7 610
250 15 9 1370250 15 9 1370
Choice of Reference Period for Consumption Data,& 54th Round
Choice of Reference Period for Consumption Data 150 10 7 1700Consumer Expenditure, NSS 55th Round
(July’99 to June 2000)Household Consumer Expenditure in India (July – 150 10 7 610
Household Consumer Expenditure in India, 1999–2000 150 10 7 610
Level and Pattern of Consumer Expenditure in India, 250 15 10 1520
Commodities in India, 250 15 10 1370
Sources of household income in India, 1999-2000 150 10 7 380Energy Used by Indian Households, 1999-2000 150 10 7 610
of Food Intake in India, 1999 - 150 10 7 610
IRDP Assistance and Participation in Public Works: 150 10 7 610
2000 250 15 10 710consumption among socio 250 15 10 480
Literacy and Levels of Education in India, 1999 - 2000 250 15 10 610Sources of household consumption in India, 1999 - 2000 250 15 10 710
Unemployment, NSS 55th Round (July’99 to June 2000)
Employment and Unemployment in India, 1999-2000 150 10 7 610
Employment and Unemployment Situation in India, 250 15 10 750
Employment and Unemployment Situation in India, 250 15 10 1370
Non agricultural workers in Informal Sector based on Employment and Unemployment Survey, 1999-2000
150 10 7 610
Unemployment situation in Cities and 150 10 7 610
Participation of Indian Women in Household work and 2000
150 10 7 610
Employment and Unemployment among religious 150 10 7 610
Employment and Unemployment among social groups 250 15 10 2950
250 15 10 1140
Soft Copy (CD)US$ Pound-
Sterling(7) (8) (9)
610 10 7
1370 82 501370 82 50
1700 102 64
610 36 23
610 36 23
1520 81 57
1370 73 52
380 28 17610 36 23610 36 23
610 36 23
710 43 26480 32 19
610 36 23710 43 26
610 36 23
750 40 28
1370 73 52
610 36 23
610 36 23
610 36 23
610 36 23
2950 156 110
1140 68 42Continued..
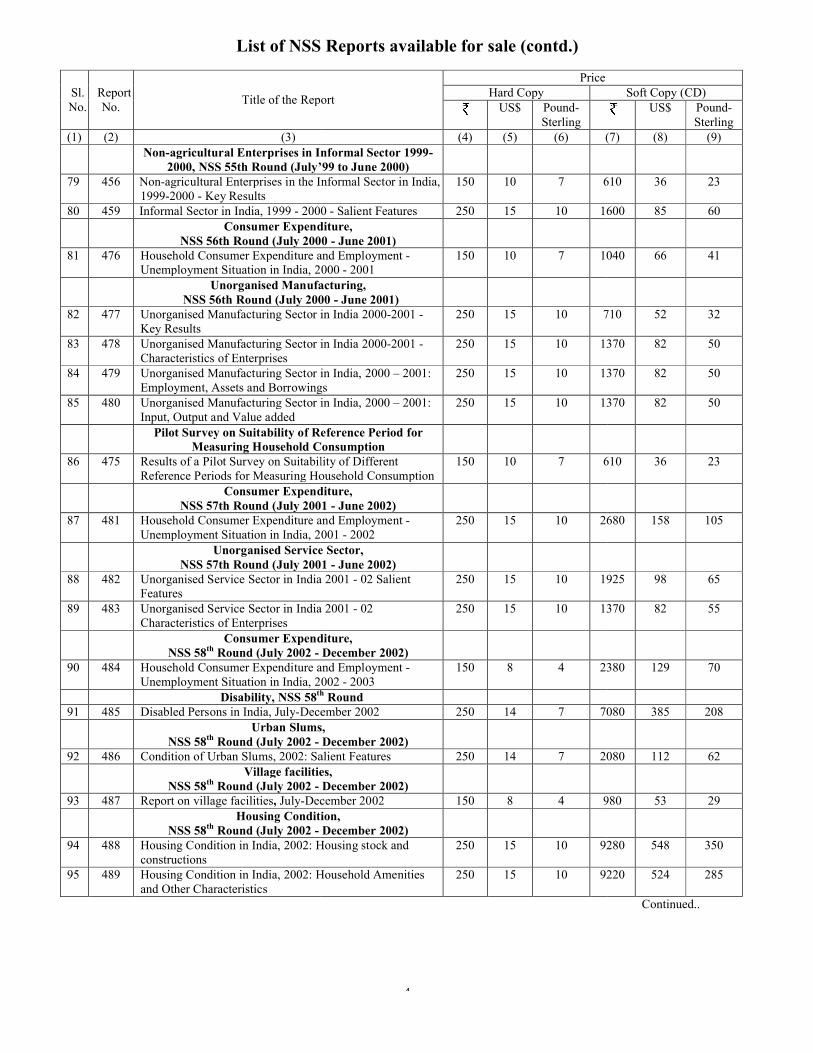
List of NSS Reports available
Sl.No.
ReportNo.
Title of the Report
(1) (2) (3)Non-agricultural Enterprises in Informal Sector 1999
2000, NSS 55th Round (July’99 to June 2000)79 456 Non-agricultural Enterprises in the Informal Sector in India,
1999-2000 - Key Results80 459 Informal Sector in India, 1999 - 2000
Consumer Expenditure, NSS 56th Round (July 2000
81 476 Household Consumer Expenditure and Employment Unemployment Situation in India, 2000
Unorganised Manufacturing, NSS 56th Round (July 2000
82 477 Unorganised Manufacturing Sector in India 2000Key Results
83 478 Unorganised Manufacturing Sector in India 2000Characteristics of Enterprises
84 479 Unorganised Manufacturing Sector in India, 2000 Employment, Assets and Borrowings
85 480 Unorganised Manufacturing Sector in India, 2000 Input, Output and Value added
Pilot Survey on Suitability of Reference Period for Measuring Household Consumption
86 475 Results of a Pilot Survey on Suitability of Different Reference Periods for Measuring Household Consumption
Consumer Expenditure, NSS 57th Round (July 2001
87 481 Household Consumer Expenditure and Employment Unemployment Situation in India, 2001
Unorganised Service Sector, NSS 57th Round (July 2001
88 482 Unorganised Service Sector in India 2001 Features
89 483 Unorganised Service Sector in India 2001 Characteristics of Enterprises
Consumer Expenditure, NSS 58th Round (July 2002 -
90 484 Household Consumer Expenditure and Employment Unemployment Situation in India, 2002
Disability, NSS 58th
91 485 Disabled Persons in India, July-December 2002Urban Slums,
NSS 58th Round (July 2002 -92 486 Condition of Urban Slums, 2002: Salient Features
Village facilities,NSS 58th Round (July 2002 -
93 487 Report on village facilities, July-December 2002Housing Condition,
NSS 58th Round (July 2002 -94 488 Housing Condition in India, 2002: Housing stock and
constructions95 489 Housing Condition in India, 2002: Household Amenities
and Other Characteristics
4
List of NSS Reports available for sale (contd.)
Title of the Report
PriceHard Copy
US$ Pound-Sterling
(4) (5) (6) (7)agricultural Enterprises in Informal Sector 1999-
(July’99 to June 2000)agricultural Enterprises in the Informal Sector in India, 150 10 7 610
2000 - Salient Features 250 15 10 1600Consumer Expenditure,
NSS 56th Round (July 2000 - June 2001)Household Consumer Expenditure and Employment -Unemployment Situation in India, 2000 - 2001
150 10 7 1040
Unorganised Manufacturing, NSS 56th Round (July 2000 - June 2001)
Unorganised Manufacturing Sector in India 2000-2001 - 250 15 10 710
Unorganised Manufacturing Sector in India 2000-2001 - 250 15 10 1370
Unorganised Manufacturing Sector in India, 2000 – 2001: Employment, Assets and Borrowings
250 15 10 1370
Unorganised Manufacturing Sector in India, 2000 – 2001: 250 15 10 1370
Pilot Survey on Suitability of Reference Period for Consumption
Results of a Pilot Survey on Suitability of Different Reference Periods for Measuring Household Consumption
150 10 7 610
Consumer Expenditure, NSS 57th Round (July 2001 - June 2002)
Expenditure and Employment -Unemployment Situation in India, 2001 - 2002
250 15 10 2680
Unorganised Service Sector, NSS 57th Round (July 2001 - June 2002)
Unorganised Service Sector in India 2001 - 02 Salient 250 15 10 1925
Unorganised Service Sector in India 2001 - 02 250 15 10 1370
Consumer Expenditure, December 2002)
Household Consumer Expenditure and Employment -Unemployment Situation in India, 2002 - 2003
150 8 4 2380
th RoundDecember 2002 250 14 7 7080
Urban Slums,December 2002)
Condition of Urban Slums, 2002: Salient Features 250 14 7 2080Village facilities,
December 2002)December 2002 150 8 4 980
Housing Condition,December 2002)
Housing Condition in India, 2002: Housing stock and 250 15 10 9280
Housing Condition in India, 2002: Household Amenities 250 15 10 9220
Soft Copy (CD)US$ Pound-
Sterling(7) (8) (9)
610 36 23
1600 85 60
1040 66 41
710 52 32
1370 82 50
1370 82 50
1370 82 50
610 36 23
2680 158 105
1925 98 65
1370 82 55
2380 129 70
7080 385 208
2080 112 62
980 53 29
9280 548 350
9220 524 285
Continued..
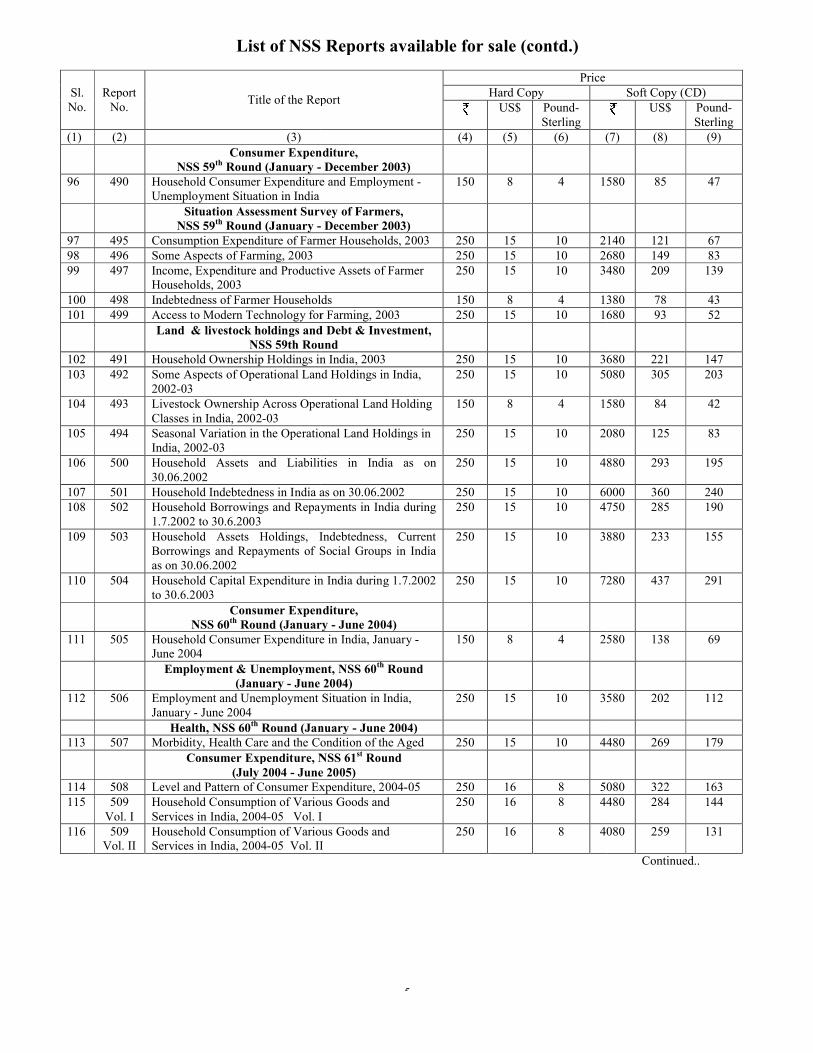
List of NSS Reports available for sale (contd.)
Sl.No.
ReportNo.
Title of the Report
(1) (2) (3)Consumer Expenditure,
NSS 59th Round (January -96 490 Household Consumer Expenditure and Employment
Unemployment Situation in IndiaSituation Assessment Survey of Farmers,
NSS 59th Round (January -97 495 Consumption Expenditure of Farmer Households, 200398 496 Some Aspects of Farming, 200399 497 Income, Expenditure and Productive Assets of Farmer
Households, 2003100 498 Indebtedness of Farmer Households101 499 Access to Modern Technology for Farming, 2003
Land & livestock holdings and Debt & Investment, NSS 59th Round
102 491 Household Ownership Holdings in India, 2003103 492 Some Aspects of Operational Land Holdings in India,
2002-03104 493 Livestock Ownership Across Operational Land Holding
Classes in India, 2002-03105 494 Seasonal Variation in the Operational Land
India, 2002-03106 500 Household Assets and Liabilities in India as on
30.06.2002107 501 Household Indebtedness in India as on 30.06.2002108 502 Household Borrowings and Repayments
1.7.2002 to 30.6.2003109 503 Household Assets Holdings, Indebtedness, Current
Borrowings and Repayments of Social Groups in India as on 30.06.2002
110 504 Household Capital Expenditure in India during 1.7.2002 to 30.6.2003
Consumer Expenditure, NSS 60th Round (January
111 505 Household Consumer Expenditure in India, January June 2004
Employment & Unemployment, NSS 60(January - June 2004)
112 506 Employment and Unemployment Situation in India, January - June 2004
Health, NSS 60th Round (January 113 507 Morbidity, Health Care and the Condition of the Aged
Consumer Expenditure, NSS 61(July 2004 - June 2005)
114 508 Level and Pattern of Consumer Expenditure, 2004115 509
Vol. IHousehold Consumption of Various Goods Services in India, 2004-05 Vol. I
116 509 Vol. II
Household Consumption of Various Goods and Services in India, 2004-05 Vol. II
5
List of NSS Reports available for sale (contd.)
Title of the Report
PriceHard Copy
US$ Pound-Sterling
(4) (5) (6) (7)Consumer Expenditure,
- December 2003)Household Consumer Expenditure and Employment - 150 8 4 1580
Situation Assessment Survey of Farmers, - December 2003)
Expenditure of Farmer Households, 2003 250 15 10 2140250 15 10 2680
Income, Expenditure and Productive Assets of Farmer 250 15 10 3480
Households 150 8 4 1380Access to Modern Technology for Farming, 2003 250 15 10 1680Land & livestock holdings and Debt & Investment,
NSS 59th RoundHousehold Ownership Holdings in India, 2003 250 15 10 3680Some Aspects of Operational Land Holdings in India, 250 15 10 5080
Livestock Ownership Across Operational Land Holding 150 8 4 1580
Seasonal Variation in the Operational Land Holdings in 250 15 10 2080
Household Assets and Liabilities in India as on 250 15 10 4880
Household Indebtedness in India as on 30.06.2002 250 15 10 6000Borrowings and Repayments in India during 250 15 10 4750
Household Assets Holdings, Indebtedness, Current Borrowings and Repayments of Social Groups in India
250 15 10 3880
Capital Expenditure in India during 1.7.2002 250 15 10 7280
Consumer Expenditure, Round (January - June 2004)
Household Consumer Expenditure in India, January - 150 8 4 2580
Unemployment, NSS 60th RoundJune 2004)
Employment and Unemployment Situation in India, 250 15 10 3580
Round (January - June 2004)Condition of the Aged 250 15 10 4480
Consumer Expenditure, NSS 61st Round June 2005)
Level and Pattern of Consumer Expenditure, 2004-05 250 16 8 5080Household Consumption of Various Goods and
05 Vol. I250 16 8 4480
Household Consumption of Various Goods and 05 Vol. II
250 16 8 4080
Soft Copy (CD)US$ Pound-
Sterling(7) (8) (9)
1580 85 47
2140 121 672680 149 833480 209 139
1380 78 431680 93 52
3680 221 1475080 305 203
1580 84 42
2080 125 83
4880 293 195
6000 360 2404750 285 190
3880 233 155
7280 437 291
2580 138 69
3580 202 112
4480 269 179
5080 322 1634480 284 144
4080 259 131
Continued..
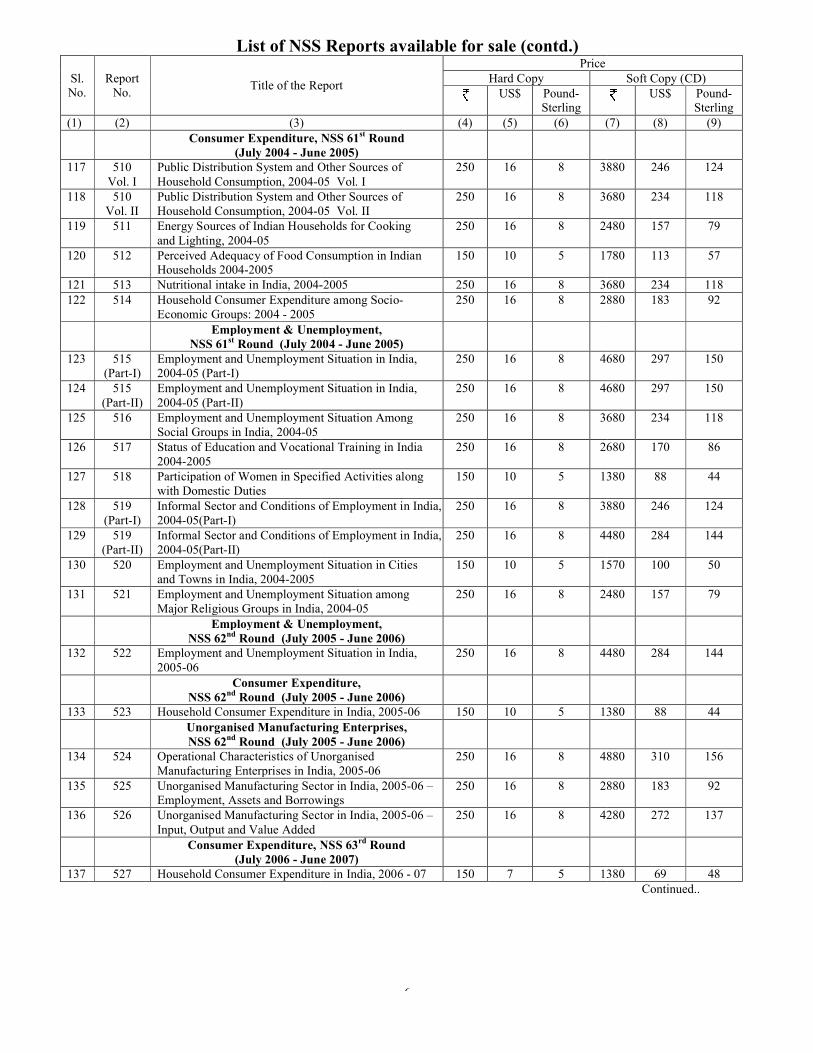
List of NSS Reports available for sale (contd.)
Sl.No.
ReportNo.
Title of the Report
(1) (2) (3)Consumer Expenditure, NSS 61
(July 2004 - June 2005)117 510
Vol. IPublic Distribution System and Other Sources of Household Consumption, 2004-05 Vol. I
118 510 Vol. II
Public Distribution System and Other Sources of Household Consumption, 2004-05 Vol. II
119 511 Energy Sources of Indian Households for Cooking and Lighting, 2004-05
120 512 Perceived Adequacy of Food Consumption in Indian Households 2004-2005
121 513 Nutritional intake in India, 2004-122 514 Household Consumer Expenditure among Socio
Economic Groups: 2004 - 2005Employment & Unemployment,
NSS 61st Round (July 2004 123 515
(Part-I)Employment and Unemployment Situation in India, 2004-05 (Part-I)
124 515 (Part-II)
Employment and Unemployment Situation in India, 2004-05 (Part-II)
125 516 Employment and Unemployment Situation Among Social Groups in India, 2004-05
126 517 Status of Education and Vocational Training in India 2004-2005
127 518 Participation of Women in Specified Activities along with Domestic Duties
128 519(Part-I)
Informal Sector and Conditions of Employment in India, 2004-05(Part-I)
129 519(Part-II)
Informal Sector and Conditions of Employment in India, 2004-05(Part-II)
130 520 Employment and Unemployment Situation in Cities and Towns in India, 2004-2005
131 521 Employment and Unemployment Situation among Major Religious Groups in India, 2004
Employment & Unemployment, NSS 62nd Round (July 2005
132 522 Employment and Unemployment Situation in India, 2005-06
Consumer Expenditure, NSS 62nd Round (July 2005
133 523 Household Consumer Expenditure in India, 2005Unorganised Manufacturing EnterprisesNSS 62nd Round (July 2005
134 524 Operational Characteristics of Unorganised Manufacturing Enterprises in India, 2005
135 525 Unorganised Manufacturing Sector in India, 2005Employment, Assets and Borrowings
136 526 Unorganised Manufacturing Sector in India, 2005Input, Output and Value Added
Consumer Expenditure, NSS 63(July 2006 - June 2007)
137 527 Household Consumer Expenditure in India, 2006
6
List of NSS Reports available for sale (contd.)
Title of the Report
PriceHard Copy
US$ Pound-Sterling
(4) (5) (6) (7)Consumer Expenditure, NSS 61st Round
June 2005)Distribution System and Other Sources of
05 Vol. I250 16 8 3880
Public Distribution System and Other Sources of 05 Vol. II
250 16 8 3680
Indian Households for Cooking 250 16 8 2480
Perceived Adequacy of Food Consumption in Indian 150 10 5 1780
-2005 250 16 8 3680Household Consumer Expenditure among Socio- 250 16 8 2880
Employment & Unemployment, Round (July 2004 - June 2005)
Employment and Unemployment Situation in India, 250 16 8 4680
Employment and Unemployment Situation in India, 250 16 8 4680
Employment and Unemployment Situation Among 250 16 8 3680
Education and Vocational Training in India 250 16 8 2680
Participation of Women in Specified Activities along 150 10 5 1380
Informal Sector and Conditions of Employment in India, 250 16 8 3880
Informal Sector and Conditions of Employment in India, 250 16 8 4480
Employment and Unemployment Situation in Cities 150 10 5 1570
Employment and Unemployment Situation among Major Religious Groups in India, 2004-05
250 16 8 2480
Employment & Unemployment, Round (July 2005 - June 2006)
Employment and Unemployment Situation in India, 250 16 8 4480
Consumer Expenditure, Round (July 2005 - June 2006)
Household Consumer Expenditure in India, 2005-06 150 10 5 1380Manufacturing Enterprises,
Round (July 2005 - June 2006)Operational Characteristics of Unorganised Manufacturing Enterprises in India, 2005-06
250 16 8 4880
Unorganised Manufacturing Sector in India, 2005-06 –Employment, Assets and Borrowings
250 16 8 2880
Unorganised Manufacturing Sector in India, 2005-06 – 250 16 8 4280
Consumer Expenditure, NSS 63rd RoundJune 2007)
Household Consumer Expenditure in India, 2006 - 07 150 7 5 1380
Soft Copy (CD)US$ Pound-
Sterling(7) (8) (9)
3880 246 124
3680 234 118
2480 157 79
1780 113 57
3680 234 1182880 183 92
4680 297 150
4680 297 150
3680 234 118
2680 170 86
1380 88 44
3880 246 124
4480 284 144
1570 100 50
2480 157 79
4480 284 144
1380 88 44
4880 310 156
2880 183 92
4280 272 137
1380 69 48Continued..
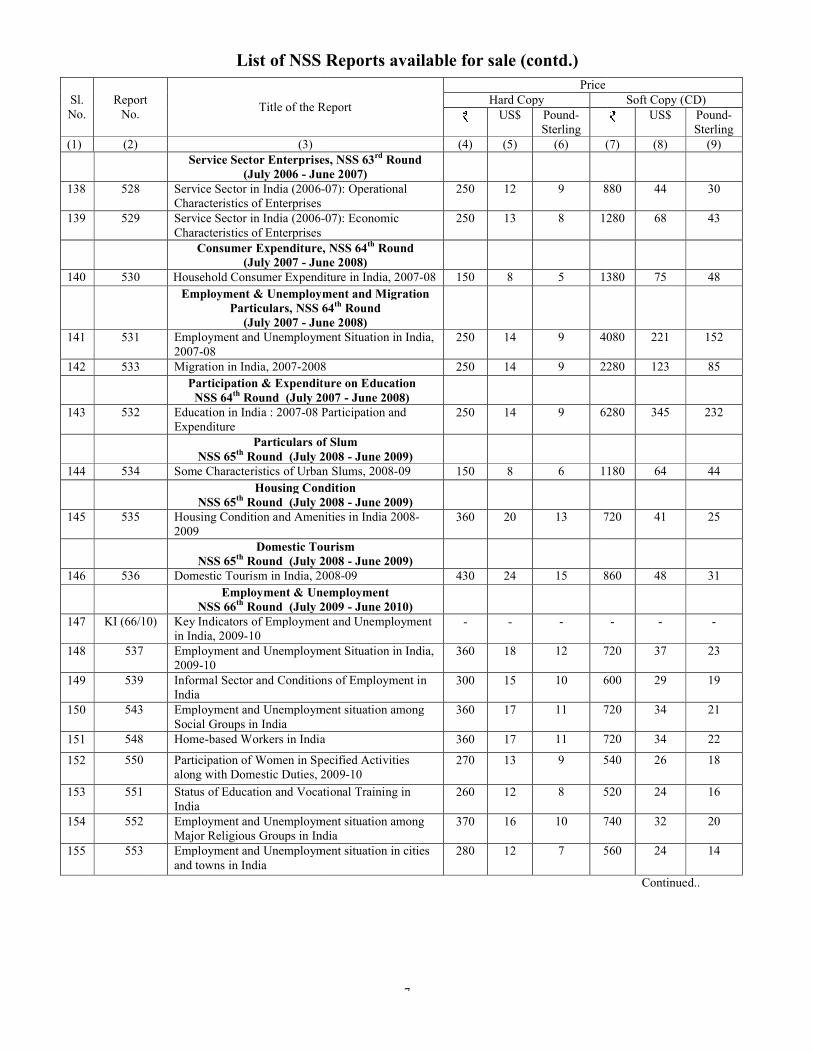
List of NSS
Sl.No.
ReportNo.
Title of the Report
(1) (2) (3)Service Sector Enterprises
(July 2006 - June 2007)138 528 Service Sector in India (2006
Characteristics of Enterprises139 529 Service Sector in India (2006
Characteristics of EnterprisesConsumer Expenditure, NSS 64
(July 2007 - June 2008)140 530 Household Consumer Expenditure in India, 2007
Employment & Unemployment and Migration Particulars, NSS 64
(July 2007 - June 2008)141 531 Employment and Unemployment Situation in India,
2007-08142 533 Migration in India, 2007-2008
Participation & Expenditure on EducationNSS 64th Round (July 2007
143 532 Education in India : 2007-08 Participation Expenditure
Particulars of SlumNSS 65th Round (July 2008
144 534 Some Characteristics of Urban SlumsHousing Condition
NSS 65th Round (July 2008 145 535 Housing Condition and Amenities in India
2009Domestic Tourism
NSS 65th Round (July 2008 146 536 Domestic Tourism in India, 2008
Employment & UnemploymentNSS 66th Round (July 2009
147 KI (66/10) Key Indicators of Employment and Unemployment in India, 2009-10
148 537 Employment and Unemployment Situation in India, 2009-10
149 539 Informal Sector and Conditions of Employment in India
150 543 Employment and Unemployment situation among Social Groups in India
151 548 Home-based Workers in India
152 550 Participation of Women in Specified Activities along with Domestic Duties, 2009
153 551 Status of Education and Vocational Training in India
154 552 Employment and Unemployment situation among Major Religious Groups in India
155 553 Employment and Unemployment situation and towns in India
7
of NSS Reports available for sale (contd.)
Title of the Report
PriceHard Copy
US$ Pound-Sterling
(4) (5) (6) (7)Service Sector Enterprises, NSS 63rd Round
June 2007)Service Sector in India (2006-07): Operational Characteristics of Enterprises
250 12 9 880
2006-07): Economic Characteristics of Enterprises
250 13 8 1280
Consumer Expenditure, NSS 64th RoundJune 2008)
umer Expenditure in India, 2007-08 150 8 5 1380Unemployment and Migration
NSS 64th Round June 2008)
Employment and Unemployment Situation in India, 250 14 9 4080
2008 250 14 9 2280Expenditure on Education
Round (July 2007 - June 2008)08 Participation and 250 14 9 6280
Particulars of SlumRound (July 2008 - June 2009)
Characteristics of Urban Slums, 2008-09 150 8 6 1180Housing Condition
Round (July 2008 - June 2009)ondition and Amenities in India 2008- 360 20 13 720
Domestic TourismRound (July 2008 - June 2009)
in India, 2008-09 430 24 15 860Employment & Unemployment
Round (July 2009 - June 2010)Key Indicators of Employment and Unemployment - - -
Employment and Unemployment Situation in India, 360 18 12 720
Informal Sector and Conditions of Employment in 300 15 10 600
Employment and Unemployment situation among 360 17 11 72
based Workers in India 360 17 11 720
Participation of Women in Specified Activities along with Domestic Duties, 2009-10
270 13 9 540
Status of Education and Vocational Training in 260 12 8 520
Employment and Unemployment situation among Groups in India
370 16 10 740
Employment and Unemployment situation in cities 280 12 7 560
Soft Copy (CD)US$ Pound-
Sterling(7) (8) (9)
880 44 30
1280 68 43
1380 75 48
4080 221 152
2280 123 85
6280 345 232
1180 64 44
720 41 25
860 48 31
- - -
720 37 23
600 29 19
720 34 21
720 34 22
540 26 18
520 24 16
740 32 20
560 24 14
Continued..
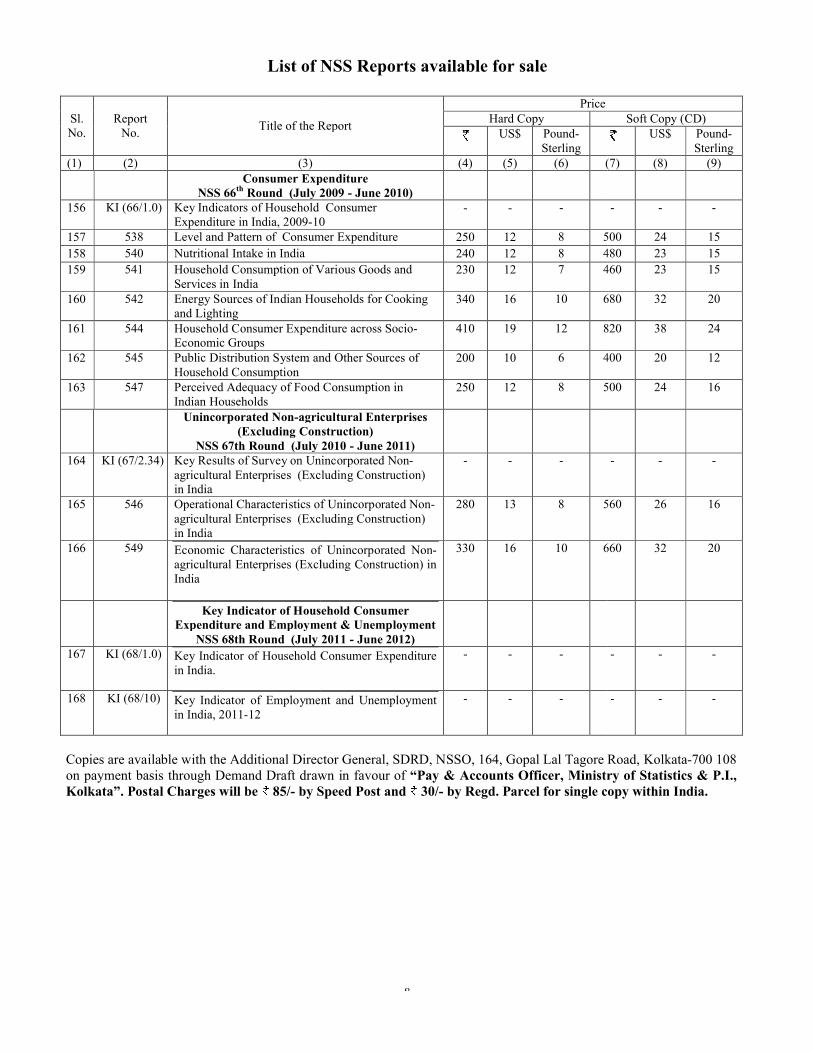
List of NSS
Sl.No.
ReportNo.
Title of the Report
(1) (2) (3)Consumer Expenditure
NSS 66th Round (July 2009 156 KI (66/1.0) Key Indicators of Household
Expenditure in India, 2009-10157 538 Level and Pattern of Consumer Expenditure158 540 Nutritional Intake in India159 541 Household Consumption of Various Goods and
Services in India160 542 Energy Sources of Indian Households for Cooking
and Lighting161 544 Household Consumer Expenditure across Socio
Economic Groups162 545 Public Distribution System and Other Sources of
Household Consumption163 547 Perceived Adequacy of Food Consumption in
Indian HouseholdsUnincorporated Non-agricultural Enterprises
(Excluding Construction)NSS 67th Round (July 2010
164 KI (67/2.34) Key Results of Survey on Unincorporated Nonagricultural Enterprises (Excluding Construction) in India
165 546 Operational Characteristics of Unincorporated Nonagricultural Enterprises (Excluding Construction)in India
166 549 Economic Characteristics of Unincorporated Nonagricultural Enterprises (Excluding Construction) in India
Key Indicator of Household Consumer Expenditure and Employment
NSS 68th Round (July 201167 KI (68/1.0) Key Indicator of Household Consumer Expenditure
in India.
168 KI (68/10) Key Indicator of Employment and Unemployment in India, 2011-12
Copies are available with the Additional Director General, SDRD, NSSO, 164, Gopal Lal Tagore Road, Kolkataon payment basis through Demand Draft drawn in favour of Kolkata”. Postal Charges will be 85/- by Speed Post and
8
List of NSS Reports available for sale
Title of the Report
PriceHard Copy
US$ Pound-Sterling
(4) (5) (6) (7)Consumer ExpenditureRound (July 2009 - June 2010)
Household Consumer 10
- - -
Consumer Expenditure 250 12 8 500240 12 8 480
of Various Goods and 230 12 7 460
Energy Sources of Indian Households for Cooking 340 16 10 680
Household Consumer Expenditure across Socio- 410 19 12 820
Distribution System and Other Sources of 200 10 6 400
Perceived Adequacy of Food Consumption in 250 12 8 500
agricultural Enterprises (Excluding Construction)
Round (July 2010 - June 2011)Key Results of Survey on Unincorporated Non-agricultural Enterprises (Excluding Construction)
- - -
Operational Characteristics of Unincorporated Non-(Excluding Construction)
280 13 8 560
Economic Characteristics of Unincorporated Non-agricultural Enterprises (Excluding Construction) in
330 16 10 660
Key Indicator of Household Consumer Expenditure and Employment & Unemployment
th Round (July 2011 - June 2012)Key Indicator of Household Consumer Expenditure - - -
Employment and Unemployment - - -
Copies are available with the Additional Director General, SDRD, NSSO, 164, Gopal Lal Tagore Road, Kolkataon payment basis through Demand Draft drawn in favour of “Pay & Accounts Officer, Ministry of Statistics & P.I.,
by Speed Post and 30/- by Regd. Parcel for single copy within India.
Soft Copy (CD)US$ Pound-
Sterling(7) (8) (9)
- - -
500 24 15480 23 15460 23 15
680 32 20
820 38 24
400 20 12
500 24 16
- - -
560 26 16
660 32 20
- - -
- - -
Copies are available with the Additional Director General, SDRD, NSSO, 164, Gopal Lal Tagore Road, Kolkata-700 108 “Pay & Accounts Officer, Ministry of Statistics & P.I.,
by Regd. Parcel for single copy within India.