Embed Size (px)
Citation preview
FEDERATION OF EURO-ASIAN STOCK EXCHANGES ANNUAL REPORT JUNE 2012
PAGE 1
TABLE OF CONTENTS
Federation of Euro-Asian Stock Exchanges 3Is Investment 10NASDAQ OMX 9Finans Asset Management 12Tayburn 16
Stock Exchange ProfilesAbu Dhabi Securities Exchange 18Amman Stock Exchange 22Bahrain Bourse 25Baku Interbank Currency Exchange 28Baku Stock Exchange 30Banja Luka Stock Exchange 34Belarusian Currency and Stock Exchange 36Belgrade Stock Exchange 39Bucharest Stock Exchange 43Bulgarian Stock Exchange 47Damascus Securities Exchange 50Egyptian Exchange 53Eurasian Trade System Commodity Exchange 57Georgian Stock Exchange 59Iraq Stock Exchange 62Istanbul Gold Exchange 65İstanbul Menkul Kıymetler Borsası 67Karachi Stock Exchange 70Kazakhstan Stock Exchange 73Kyrgyz Stock Exchange 76Lahore Stock Exchange 79Macedonian Stock Exchange 81Moldova Stock Exchange 84Mongolian Stock Exchange 87Montenegro Stock Exchange 90Muscat Securities Market 93NASDAQ OMX Armenia 96Palestine Exchange 99Sarajevo Stock Exchange 103Tehran Stock Exchange 107Tirana Stock Exchange 110“Toshkent” Republican Stock Exchange 113Turkish Derivatives Exchange (TurkDEX) 117Zagreb Stock Exchange 118
Affiliate Member ProfilesCentral Registry Agency Inc. 123Central Securities Depository of Iran 124Macedonian Central Securities Depository 125Misr for Clearing, Settlement & Central Depository 126National Depository Center of Azerbaijan 127Securities and Exchange Brokers Association of Iran (SEBA) 128Securities Depository Center (SDC) of Jordan 129Swiss Futures Options Associations (SFOA) 130Takasbank - ISE Settlement and Custody Bank, Inc. 131Tehran Securities Exchange Technology Management Company (TSETMC) 132The Association of Capital Market Intermediary Institutions of Turkey (TSPAKB) 133The South Asian Federation of Exchanges (SAFE) 134
Member List 143
FEDERATION OF EURO-ASIAN STOCK EXCHANGES (FEAS)
I.M.K.B Building, Emirgan 34467 Istanbul, TurkeyTel: (90 212) 298 2160Fax: (90 212) 298 2209E-mail: [email protected] address: www.feas.orgContacts: Mr. Mustafa Baltaci, Secretary GeneralMs. Ege Adalioglu, Deputy Secretary GeneralMrs. Susan Gogus, Deputy Secretary General
The Federation of Euro-Asian Stock Exchanges Annual Report June 2012 is published by the Federation of Euro-Asian Stock Exchanges.
All editorial material was collated and edited by the Federation of Euro-Asian Stock Exchanges. The design, production and distribution was coordinated by the Federation of Euro-Asian Stock Exchanges.
Designed by: Tayburn
Although every care has been taken to ensure the accuracy of the information contained within the publication, the Secretariat cannot be held liable for any inaccuracies, errors or omissions, nor held liable for any actions taken on the basis of the information provided herein.
© The Federation of Euro-Asian Stock Exchanges
FEDERATION OF EURO-ASIAN STOCK EXCHANGES ANNUAL REPORT JUNE 2012
PAGE 2
Established on 16 May 1995, the Federation of Euro-Asian Stock Exchanges (FEAS) today has 34 stock exchange members and 15 affiliate members in 28 countries.
MEMBERS
Abu Dhabi Securities Exchange Amman Stock ExchangeBahrain Bourse Baku Interbank Currency Exchange Baku Stock Exchange Banja Luka Stock Exchange Belarusian Currency and Stock Exchange Belgrade Stock Exchange Bucharest Stock Exchange Bulgarian Stock ExchangeDamascus Securities Exchange Egyptian Exchange Eurasian Trade System Commodity Exchange (ETS) Georgian Stock Exchange Iraq Stock Exchange Istanbul Gold Exchange İstanbul Menkul Kıymetler Borsası Karachi Stock ExchangeKazakhstan Stock Exchange Kyrgyz Stock Exchange Lahore Stock Exchange Macedonian Stock Exchange Moldova Stock Exchange Mongolian Stock Exchange Montenegro Stock Exchange Muscat Securities Market NASDAQ OMX ArmeniaPalestine ExchangeSarajevo Stock ExchangeTehran Stock Exchange Tirana Stock Exchange “Toshkent” Republican Stock Exchange Turkish Derivatives Exchange (TurkDEX) Zagreb Stock Exchange
AFFILIATE MEMBERS
Arab Federation of Exchanges (AFE) Association of Certified Capital Market Professionals (ACCMP), Jordan Central Registry Agency Inc. Central Securities Depository of Iran Macedonian Central Securities Depository Misr for Clearing, Settlement & Central Depository MSM Brokers Association, Oman National Depository Center of AzerbaijanSecurities and Exchange Brokers Association of Iran (SEBA) Securities Depository Center (SDC) of Jordan Swiss Futures Options Associations (SFOA)Takasbank - ISE Settlement and Custody Bank, Inc. Tehran Securities Exchange Technology Management Company (TSETMC) The Association of Capital Market Intermediary Institutions of Turkey (TSPAKB)The South Asian Federation of Exchanges (SAFE)
FEDERATION OF EURO-ASIAN STOCK EXCHANGES ANNUAL REPORT JUNE 2012
PAGE 3
İbrahim TurhanPresident of FEAS
The world economy expanded at a rate of 5% in 2010 and is forecasted to grow by 4,4% in 2011. Emerging economies have contributed most (7,1%) to the economic growth and are expected to keep on leading the global recovery. While strong domestic demand and capital inflows have been the most influential factors fuelling growth in emerging economies, inflation risks arising in commodity and food prices have appeared on the scene exerting pressure on policy makers. Advanced economies have experienced moderate levels of recovery in 2010, with double dip recession fears exacerbated in the mid year easing down.
In such an environment, the importance of cooperation and coordination among stock markets and regulatory authorities is once more underlined. Euro-Asia Region uniting frontier markets can be a leading model for integrated markets creating a common shield for economic turbulances while trading the mutually beneficial products.
The regulatory authorities focus more on managing risk and creating an integrated margining system and encourage investors to trade on organized exchanges. The improvement of trading technologies also facilitates the exchanges to act in coordination and to initiate new common projects such as common trading platforms. In this perspective, I believe that standing together may give us the chance to turn the global crisis into an opportunity for our markets. Within this context, the electronic connectivity and direct market access alternative that may be created among our member exchanges seems rational. In this approach, each participating exchange will keep its entity and stocks will be traded in the home country stock exchange, creating further liquidity in home markets.
In its seventeenth year of operation, FEAS accomplished some noteworthy events such as implementation of the Dow Jones FEAS Indices. The initial Dow Jones FEAS indexes were launched on June 5, 2009. Three indexes, one composite, and two regional sub-indexes, measures the performances of companies across the Euro-Asian region. The Dow Jones FEAS indexes are designed to underline index-linked investment products such as funds and structured products.
On November 2, 2011 Dow Jones Indexes and the Federation of Euro Asian Stock Exchanges (FEAS) announced the launch of the first blue-chip index derived from Euro-Asian stock exchanges, the Dow Jones FEAS Titans 50 Equal Weighted Index.
An equal-weighted measure of the 50 largest stocks traded on FEAS-member exchanges, the new gauge is designed to serve as the basis for financial products such as funds and structured products.
The Dow Jones FEAS Titans 50 Equal Weighted Index becomes the fourth member of the Dow Jones FEAS Index family; started in 2009, the index series measures the performance of companies across the Euro-Asian region. Earlier this year, the Bucharest, Palestine, Egypt and Kazakhstan exchanges were added to the Dow Jones FEAS Index universe, pushing the current total to 16.
The index universe is defined as all stocks in the Dow Jones FEAS Composite Index. Exchanges represented in the index are: Abu Dhabi (UAE), Almaty (Kazakhastan), Amman (Jordan), Banja Luka (Bosnia and Herzegovina), Belgrade (Serbia), Bucharest (Romania), Cairo (Egypt), Istanbul (Turkey), Karachi (Pakistan), Manama (Kingdom of Bahrain), Muscat (Oman), Nablus (Palestine), Sarajevo (Bosnia and Herzegovina), Skopje (Republic of Macedonia), Sofia (Bulgaria) and Zagreb (Croatia).
The ranking is calculated by weighting each stock’s float-adjusted market capitalization at 60%, sales/revenue at 20% and net income at 20%. The top 50 stocks by final rank are selected as index components.
The index is equal-weighted, with each component’s weight set to 2%. Weights are reviewed on a quarterly basis, returning to 2% using price-based weightings. And the index components are reviewed annually in May.
As mentioned above, the calculation of the Dow Jones FEAS Titans 50 Equal Weighted Index began on November 2, 2011, with real index history available daily from this date forward. Back-tested historical data have been calculated daily back to December 31, 2004, the date at which the index base value was set at 1000.
During 2011, FEAS initiated the On-Site Training Program where 10 member exchanges have applied to send their collegues for a 2 week program, hosted by Istanbul Stock Exchange. Also, the Executive Committee Meeting and Working Committee Meeting held in Ohrid, Macedonia in May; the 5th and 6th. FEAS General Assembly Meeting and Executive Committee Meeting held in Almaty, Kazakstan on September 2011. Also FEAS initiated the On Site Training Program where 10 member exchanges have applied for a 2 weeks training in Istanbul, sponsored by Istanbul Stock Exchange, Takasbank,TSPAKB and MKK. Besides these meetings, the FEAS Secretariat continues to pursue activities that will promote the growth of member stock exchanges operations such as bilateral visits, workshops seminars held by the FEAS Training Center, updating and revising e the FEAS movie and the joint ISE/FEAS projects with international associations and organizations such as the UNPRI, World Federation of Exchanges (WFE) and other International Organizations.
I also would like to take this opportunity to extend my heartfelt thanks for their contributions to Finans Asset Management, Is Investment, Deutsche-Beurse, Nasdaq OMX, Tayburn Kurumsal, and Bloomberg for making this publication possible. We hope that you will take a moment to visit our contributor section in FEAS website at www.feas.org and read their articles in the following pages.
The future outlook for our markets seems to depict that our member markets continue to provide competitive and viable financing options to both government and private sectors, while enhancing operations through technology and expanding the services offered to market participants. We surely continue to focus on the areas of increased transparency through investing in infrastructure and developing regulations to promote stronger environmental social governance. The efforts of all our Task Force Members will surely play a vital role in achieving our objectives through their commitment and hard work and the Secretariat for maintaining our cohesive organization. As we close our 16th year, we look to the future with a renewed sense of purpose and a detailed strategy for achieving our goals.
Euro-Asia Region uniting frontier markets can be a leading model for integrated markets creating a common shield for economic turbulances while trading the mutually beneficial products.
FEDERATION OF EURO-ASIAN STOCK EXCHANGES
FEDERATION OF EURO-ASIAN STOCK EXCHANGES ANNUAL REPORT JUNE 2012
PAGE 4
ORGANIZATIONThe Federation of Euro-Asian Stock Exchanges (FEAS) was established with its headquarters in Istanbul on 16 May 1995 with 12 founding members, and it has grown to 34 members and 15 affiliate members in 28 countries as a not-for-profit organization. Membership in the Federation is open to exchanges in Europe and Asia as affiliate membership is available for post trade institutions and dealer associations in the same region.
The governing body of FEAS is the General Assembly, comprised of all 34 member exchanges and 15 affiliate members. The Assembly meets once annually in a member country to discuss major issues concerning the operations of FEAS. The purpose of the meeting is to decide upon changes in the Charter and by laws, its annual budget and to approve its activity and financial reports as well as the Audit Report. The Executive Committee, made up of 13 members, is responsible for the development of Federation policies, making major administrative decisions, as mandated by the General Assembly, approving the content and scope of tasks assigned to the Working Committee, and making recommendations to the General Assembly.
The administration of the Federation is entrusted to the Secretary General, who is appointed by the General Assembly and whose office is situated at the headquarters of the Federation. Secretary General reports directly to the President.
MISSION STATEMENTThe mission of FEAS is to help create fair, efficient and transparent market environments among FEAS members and in their operating regions.
FEAS aims to minimize barriers to trade through the adoption of best practices for listing, trading
and settlement. Federation also supports promoting linkages among members for cross-border trading.
In accordance with the Mission Statement, 5-year Strategic Objectives are set up to ensure compliance with the long term mission of the Federation. These objectives are:
Objective I: Promote good “corporate governance” for exchanges, brokerage companies and listed companies. Facilitate timely disclosure of material events to achieve transparency through effective dissemination of information. Objective II: Encourage convergence among FEAS Members in their: listing requirements, trading rules technical infrastructure and settlement cycle. Objective III: Promote mechanisms for reliable, transparent and uninterrupted securities trading and settlement. Objective IV: Create greater recognition and visibility for the region’s securities and investment opportunities both locally and internationally. Objective V: Encourage the listing of “investment grade” securities in the respective home markets of the Region. Objective VI: Encourage foreign investor participation in Member Markets Objective VII: Promote linkages among the Region’s: intermediaries, data vendors, settlement and custody institutions, exchanges; and also encourage cooperation among Region’s Regulators. Objective VIII: Promote and encourage research activities and training for FEAS Members and their personnel.
Objective IX: Assist Members of FEAS to increase financial literacy through public awareness..
FEAS PROJECTS AND ACTIVITIES
This section highlights the summary of continuing programs and the activities of the Task Forces during 2011.
FEAS ONSITE TRAINING PROGRAMThe Federation of Euro-Asian Stock Exchanges (FEAS) launched an onsite training program in cooperation with its members in Turkey. The primary objective of the program is to provide participants with hands-on experience in peer institutions after a week long training program. The training will enable the participants to gain insight and perspective on different levels of the securities working environment. Further, the participants will be able to mingle with each other in exchanging views and ideas. Trainees will be assigned mentors by the sponsors during the hands-on practice.
At the end of the program, the mentor will conduct a report documenting the participant’s activities and commitment whereas the fellow will be asked to write a detailed report reflecting the value-addedness and relevance of the program. Each participant will be awarded with a certificate signed both by FEAS and the sponsoring institution.
The first group of 10 different members was trained in Istanbul in December 2011, where IMKB hosted and sponsored the On site training.
BILATERAL INITIATIVES PROGRAMThe Federation supports a fully funded bilateral visits Program to facilitate visits of personnel of FEAS members with each other for the purpose of exchange of information and experience on
FEDERATION OF EURO-ASIAN STOCK EXCHANGES
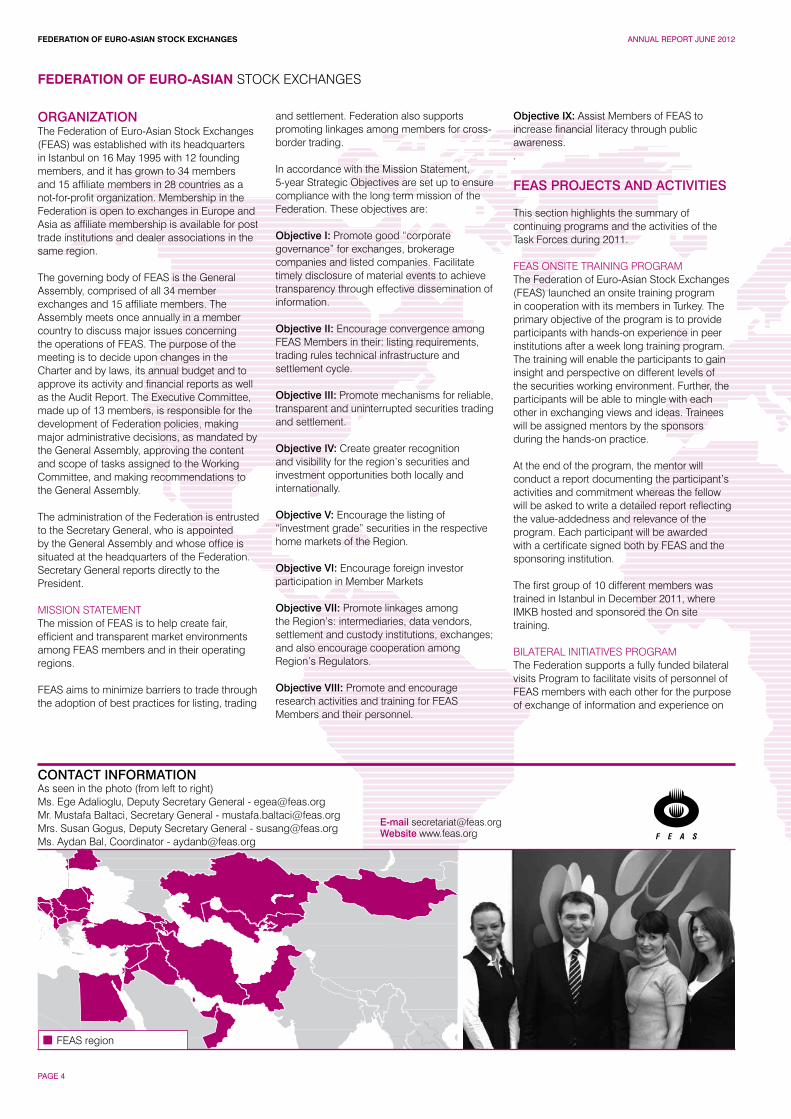
CONTACT INFORMATIONAs seen in the photo (from left to right)Ms. Ege Adalioglu, Deputy Secretary General - [email protected]. Mustafa Baltaci, Secretary General - [email protected] Mrs. Susan Gogus, Deputy Secretary General - [email protected]. Aydan Bal, Coordinator - [email protected]
E-mail [email protected] www.feas.org
FEAS region
FEDERATION OF EURO-ASIAN STOCK EXCHANGES ANNUAL REPORT JUNE 2012
PAGE 5
FEDERATION OF EURO-ASIAN STOCK EXCHANGES
specific topics of interest to both parties. Almost all Federation members have now participated in this program, which continues during 2012. Until May 2012, 8 bilateral have been successfully completed.
FEAS INDICES Three indexes were launched in June 2009; a composite, and two regional sub-indexes. The Dow Jones FEAS Indexes are designed to underlie index-linked investment products such as funds and structured products. Dow Jones FEAS Composite Index currently includes a number of component stocks in 11 member exchanges. In November 2011 a blue chip investable index was launched called the Titans 50. The index universe is defined as all stocks in the Dow Jones FEAS Composite Index. Exchanges represented in the index are: Abu Dhabi (UAE), Almaty (Kazakhstan), Amman (Jordan), Banja Luka (Bosnia and Herzegovina), Belgrade (Serbia), Bucharest (Romania), Cairo (Egypt), Istanbul (Turkey), Karachi (Pakistan), Manama (Kingdom of Bahrain), Muscat (Oman), Nablus (Palestine), Sarajevo (Bosnia and Herzegovina), Skopje (Republic of Macedonia), Sofia (Bulgaria) and Zagreb (Croatia). The 50 Blue Chip companies which are in the index were selected based on a ranking which is calculated by weighting each stock’s float-adjusted market capitalization at 60%, sales/revenue at 20% and net income at 20%. The top 50 stocks by final rank are selected as index components. REVENUE AND EXPENSE REPORTIn line with the decisions of the 17th General Assembly, the FEAS Secretariat will conduct the revenue and expense survey again in 2012 covering the financials of 2007 and 2011.
WORKING COMMITTEEIn 2011, members convened twice to hold working committee meetings. During the meetings in Macedonia on May 24, 2011, reports were presented by the task forces including Media, Blue Chip Listing, Rules and Regulations, Affiliate Members, FEAS Data Center. Updates were also provided by the Secretariat on the status of the FEAS Publications, FEAS Marketing Exhibition and FEAS History Movie, Revenue and Expense Analysis Survey Changes, Bilateral visits, Draft Financial Report and the 2011, Corporate Governance, FEAS Index and Calendar of Events.
Kazakhstan Stock Exchange hosted the working committee meetings in Almaty on September 27, 2011, prior to the General Assembly. The members had the opportunity to canvas the task force activities through reports and presentations. As a result most of the task forces have been finalized due to their completion of the mandates. Some of them were turned into projects like Affiliate Task Force and Listing Task Force. Rules and Regulation Task Force and Dealers Associations Task Force still keep their projects within the task forces.
The Secretariat provided the members with information on the latest activities mandated by the working committee participants.
Task ForcesThere are 2 task forces focusing on various sectoral topics. Each task force is steered by a member who is expected to provide guidance to task force members in producing studies on sector-related issues. The activities which have been undertaken by the task forces in 2011 are as follows:
Task Force 0901 – Rules and Regulation (Led by the Bulgarian Stock Exchange)During the meeting in Almaty, the Task Force (TF) outlined the new book which was renamed the Principles of Market Structure and Regulation (POMSaR). Further changes are being outline currently in order to finalize this publication
Task Force 1001 –Dealers Associations Affiliate, (Led by TSPAKB)The Task Force has created a draft survey on Self Regulated Organizations (SROs) with results to be compared to a similar study by IOSCO. This survey has been sent out to all members including exchanges, post trade institutions and dealer’s associations. Preliminary results will be provided at the Working Committee with final results to be given at the General Assembly.
FEAS MEETINGS IN 2011
WORKING COMMITTEE & 22ND EXECUTIVE COMMITTEE MEETINGS 24 -25 MAY 2011 – OHRID, MACEDONIAThe first working committee meeting of 2011 was held in Ohrid, Macedonia on the 24th May, 2011 at the invitation of the Macedonia Stock Exchange. The 22nd Executive Committee Meeting was held on the 25th of May following the WC meeting. The Working Committee focused on issues mandated by the General Assembly in 2010 and the Secretariat prepared a report for participants to discuss.
WC & 23RD EC AND 17TH GENERAL ASSEMBLY MEETING – SEPTEMBER 27-29 – ALMATY, KAZAKHSTANThe 17th Annual General Assembly of FEAS was held in Almaty, Kazakhstan on September 29, hosted by the Kazakhstan Stock Exchange. The Working Committee and 23rd Executive Committee meeting were also held prior to the General Assembly.
PUBLICATIONS & INFORMATION• FEAS Library: The Library can be
accessed through the Publications drop down menu on the main page at www.feas.org or through this link. http://www.feas.org/Library.aspx The FEAS Library is open to experts and organizations with financial market related material. If you would like
to make a submission to the FEAS Library, please send your electronic files and links to the FEAS secretariat at [email protected].
• FEAS Year Book (FEAS BOOK) & Magazines (INTERFEAS): This publication of annual activities of the Federation and information on its members, began in 1997 and is available electronically on the website: http://www.feas.org/Publications.aspx?Get=Annual%20Report&Top=Pubs
• FEAS Website: the FEAS website was re-
launched in March 2010 and can be found at www.feas.org. The new site contains a new home page with the FEAS movie, dedicated pages to the FEAS Indexes a more concentrated emphasis on FEAS member data with profile pages (including statistics, holidays, market policies and practices and direct links to their sites), Excel downloads for all statistical data and cross member comparisons on policies, practices and statistical data, and a News Center with headlines from member markets.
• Newsletter: A monthly publication which includes general secretariat news, statistical stock, bond and other volume comparisons on monthly, year-to-date and prior period bases, in addition to market cap, currency, number of companies traded and index statistics. Quarterly supplemental publications include quarterly statistical analysis, press releases of FEAS members and headlines of FEAS activities. Archived copies of the newsletter can be found on our website http://www.feas.org/Publications.aspx?Get=Newsletter&Top=Pubs
SUBSCRIBETo subscribe for the electronic version of FEAS publications, please go to www.feas.org and click on subscribe. Subscriptions include monthly notifications of statistics and newsletter updates, as well as advance notice of FEAS events and activities.
CONTRIBUTORS Contributor sites can be seen on the FEAS website at: http://www.feas.org/Contributors.cfm.
Finans Asset Management www.finansportfoy.com
Is Investment www.isinvestment.com
NASDAQ OMX Group www.nasdaqomx.com
Tayburn www.tayburnkurumsal.com
Bloomberg www.bloomberg.net
FEDERATION OF EURO-ASIAN STOCK EXCHANGES ANNUAL REPORT JUNE 2012
PAGE 6
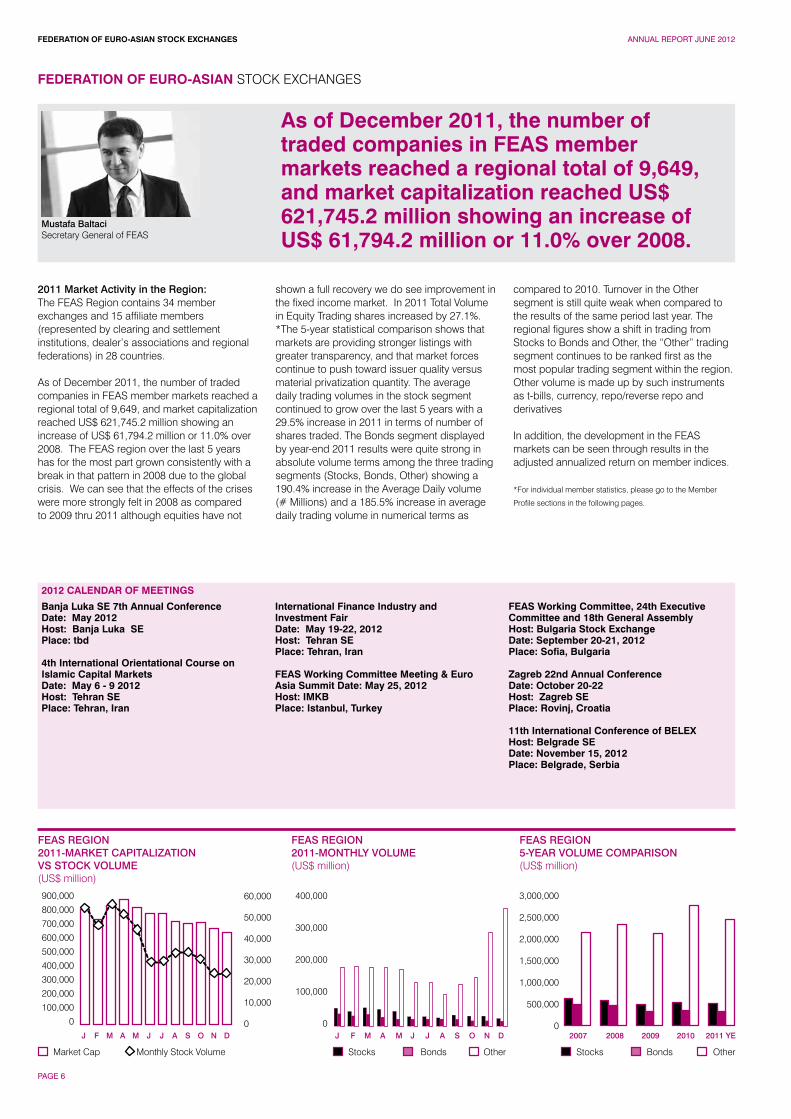
Mustafa Baltaci Secretary General of FEAS
2011 Market Activity in the Region:The FEAS Region contains 34 member exchanges and 15 affiliate members (represented by clearing and settlement institutions, dealer’s associations and regional federations) in 28 countries.
As of December 2011, the number of traded companies in FEAS member markets reached a regional total of 9,649, and market capitalization reached US$ 621,745.2 million showing an increase of US$ 61,794.2 million or 11.0% over 2008. The FEAS region over the last 5 years has for the most part grown consistently with a break in that pattern in 2008 due to the global crisis. We can see that the effects of the crises were more strongly felt in 2008 as compared to 2009 thru 2011 although equities have not
shown a full recovery we do see improvement in the fixed income market. In 2011 Total Volume in Equity Trading shares increased by 27.1%. *The 5-year statistical comparison shows that markets are providing stronger listings with greater transparency, and that market forces continue to push toward issuer quality versus material privatization quantity. The average daily trading volumes in the stock segment continued to grow over the last 5 years with a 29.5% increase in 2011 in terms of number of shares traded. The Bonds segment displayed by year-end 2011 results were quite strong in absolute volume terms among the three trading segments (Stocks, Bonds, Other) showing a 190.4% increase in the Average Daily volume (# Millions) and a 185.5% increase in average daily trading volume in numerical terms as
compared to 2010. Turnover in the Other segment is still quite weak when compared to the results of the same period last year. The regional figures show a shift in trading from Stocks to Bonds and Other, the “Other” trading segment continues to be ranked first as the most popular trading segment within the region. Other volume is made up by such instruments as t-bills, currency, repo/reverse repo and derivatives
In addition, the development in the FEAS markets can be seen through results in the adjusted annualized return on member indices.
*For individual member statistics, please go to the Member
Profile sections in the following pages.
2012 CALENDAR OF MEETINGS
Banja Luka SE 7th Annual Conference Date: May 2012Host: Banja Luka SE Place: tbd
4th International Orientational Course onIslamic Capital Markets Date: May 6 - 9 2012Host: Tehran SE Place: Tehran, Iran
International Finance Industry and Investment Fair Date: May 19-22, 2012Host: Tehran SE Place: Tehran, Iran
FEAS Working Committee Meeting & Euro Asia Summit Date: May 25, 2012Host: IMKB Place: Istanbul, Turkey
FEAS Working Committee, 24th Executive Committee and 18th General AssemblyHost: Bulgaria Stock Exchange Date: September 20-21, 2012Place: Sofia, Bulgaria
Zagreb 22nd Annual Conference Date: October 20-22Host: Zagreb SE Place: Rovinj, Croatia 11th International Conference of BELEX Host: Belgrade SE Date: November 15, 2012Place: Belgrade, Serbia
As of December 2011, the number of traded companies in FEAS member markets reached a regional total of 9,649, and market capitalization reached US$ 621,745.2 million showing an increase of US$ 61,794.2 million or 11.0% over 2008.
FEDERATION OF EURO-ASIAN STOCK EXCHANGES
900,000
800,000
700,000
600,000
500,000
400,000
300,000
200,000
100,000
0
400,000
300,000
200,000
100,000
0
3,000,000
2,500,000
2,000,000
1,500,000
1,000,000
500,000
0
60,000
50,000
40,000
30,000
20,000
10,000
0
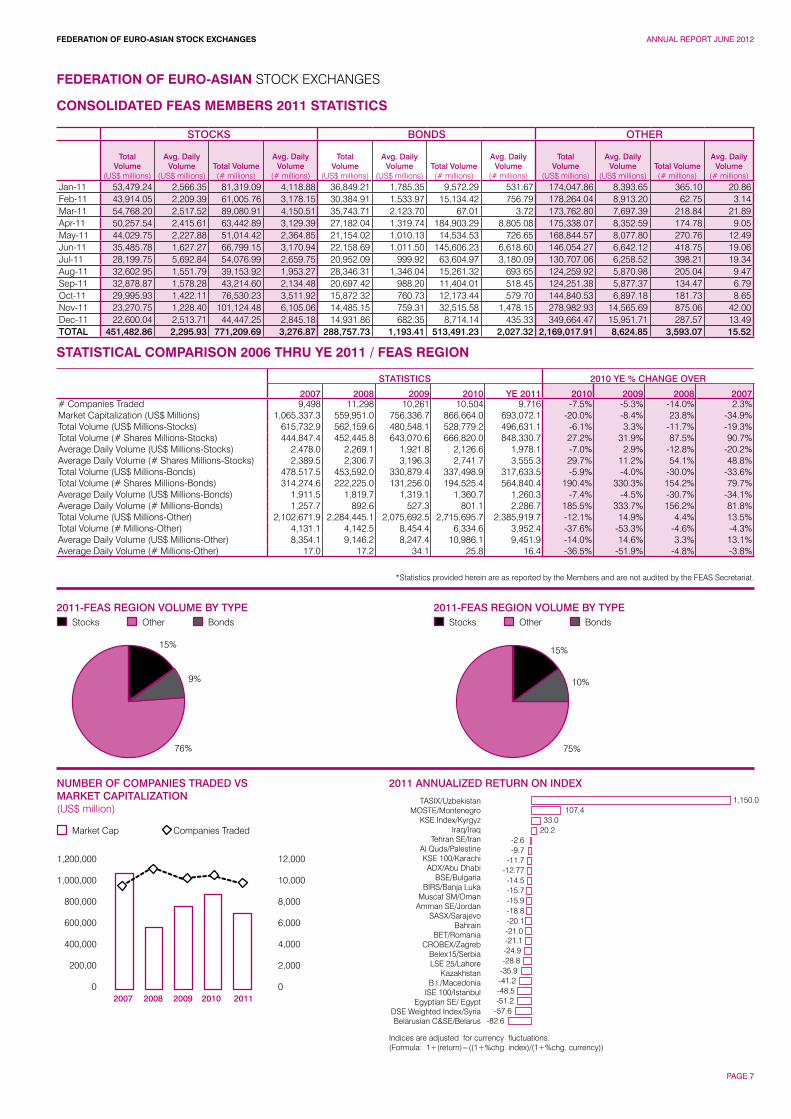
FEAS REGION2011-MARKET CAPITALIZATIONVS STOCK VOLUME(US$ million)
FEAS REGION2011-MONTHLY VOLUME(US$ million)
FEAS REGION5-YEAR VOLUME COMPARISON(US$ million)
Market Cap Monthly Stock Volume
F FJ J 2007 2008 2009 2010 2011 YEM MA AM MJ JJ JA AS SO ON ND D
Other OtherStocks StocksBonds Bonds
FEDERATION OF EURO-ASIAN STOCK EXCHANGES ANNUAL REPORT JUNE 2012
PAGE 7
FEDERATION OF EURO-ASIAN STOCK EXCHANGES
CONSOLIDATED FEAS MEMBERS 2011 STATISTICS
STATISTICAL COMPARISON 2006 THRU YE 2011 / FEAS REGION
STOCKS BONDS OTHER
Total Volume
(US$ millions)
Avg. Daily Volume
(US$ millions)Total Volume(# millions)
Avg. Daily Volume
(# millions)
Total Volume
(US$ millions)
Avg. Daily Volume
(US$ millions)Total Volume(# millions)
Avg. Daily Volume
(# millions)
Total Volume
(US$ millions)
Avg. Daily Volume
(US$ millions)Total Volume(# millions)
Avg. Daily Volume
(# millions)Jan-11 53,479.24 2,566.35 81,319.09 4,118.88 36,849.21 1,785.35 9,572.29 531.67 174,047.86 8,393.65 365.10 20.86Feb-11 43,914.05 2,209.39 61,005.76 3,178.15 30,384.91 1,533.97 15,134.42 756.79 178,264.04 8,913.20 62.75 3.14Mar-11 54,768.20 2,517.52 89,080.91 4,150.51 35,743.71 2,123.70 67.01 3.72 173,762.80 7,697.39 218.84 21.89Apr-11 50,257.54 2,415.61 63,442.89 3,129.39 27,182.04 1,319.74 184,903.29 8,805.08 175,338.07 8,352.59 174.78 9.05May-11 44,029.75 2,227.88 51,014.42 2,364.85 21,154.02 1,010.13 14,534.53 726.65 168,844.57 8,077.80 270.76 12.49Jun-11 35,485.78 1,627.27 66,799.15 3,170.94 22,158.69 1,011.50 145,606.23 6,618.60 146,054.27 6,642.12 418.75 19.06Jul-11 28,199.75 5,692.84 54,076.99 2,659.75 20,952.09 999.92 63,604.97 3,180.09 130,707.06 6,258.52 398.21 19.34Aug-11 32,602.95 1,551.79 39,153.92 1,953.27 28,346.31 1,346.04 15,261.32 693.65 124,259.92 5,870.98 205.04 9.47Sep-11 32,878.87 1,578.28 43,214.60 2,134.48 20,697.42 988.20 11,404.01 518.45 124,251.38 5,877.37 134.47 6.79Oct-11 29,995.93 1,422.11 76,530.23 3,511.92 15,872.32 760.73 12,173.44 579.70 144,840.53 6,897.18 181.73 8.65Nov-11 23,270.75 1,228.40 101,124.48 6,105.06 14,485.15 759.31 32,515.58 1,478.15 278,982.93 14,565.69 875.06 42.00Dec-11 22,600.04 2,513.71 44,447.25 2,845.18 14,931.86 682.35 8,714.14 435.33 349,664.47 15,951.71 287.57 13.49TOTAL 451,482.86 2,295.93 771,209.69 3,276.87 288,757.73 1,193.41 513,491.23 2,027.32 2,169,017.91 8,624.85 3,593.07 15.52
STATISTICS 2010 YE % CHANGE OVER 2007 2008 2009 2010 YE 2011 2010 2009 2008 2007# Companies Traded 9,498 11,298 10,261 10,504 9,716 -7.5% -5.3% -14.0% 2.3%Market Capitalization (US$ Millions) 1,065,337.3 559,951.0 756,336.7 866,664.0 693,072.1 -20.0% -8.4% 23.8% -34.9%Total Volume (US$ Millions-Stocks) 615,732.9 562,159.6 480,548.1 528,779.2 496,631.1 -6.1% 3.3% -11.7% -19.3%Total Volume (# Shares Millions-Stocks) 444,847.4 452,445.8 643,070.6 666,820.0 848,330.7 27.2% 31.9% 87.5% 90.7%Average Daily Volume (US$ Millions-Stocks) 2,478.0 2,269.1 1,921.8 2,126.6 1,978.1 -7.0% 2.9% -12.8% -20.2%Average Daily Volume (# Shares Millions-Stocks) 2,389.5 2,306.7 3,196.3 2,741.7 3,555.3 29.7% 11.2% 54.1% 48.8%Total Volume (US$ Millions-Bonds) 478,517.5 453,592.0 330,879.4 337,498.9 317,633.5 -5.9% -4.0% -30.0% -33.6%Total Volume (# Shares Millions-Bonds) 314,274.6 222,225.0 131,256.0 194,525.4 564,840.4 190.4% 330.3% 154.2% 79.7%Average Daily Volume (US$ Millions-Bonds) 1,911.5 1,819.7 1,319.1 1,360.7 1,260.3 -7.4% -4.5% -30.7% -34.1%Average Daily Volume (# Millions-Bonds) 1,257.7 892.6 527.3 801.1 2,286.7 185.5% 333.7% 156.2% 81.8%Total Volume (US$ Millions-Other) 2,102,671.9 2,284,445.1 2,075,692.5 2,715,695.7 2,385,919.7 -12.1% 14.9% 4.4% 13.5%Total Volume (# Millions-Other) 4,131.1 4,142.5 8,454.4 6,334.6 3,952.4 -37.6% -53.3% -4.6% -4.3%Average Daily Volume (US$ Millions-Other) 8,354.1 9,146.2 8,247.4 10,986.1 9,451.9 -14.0% 14.6% 3.3% 13.1%Average Daily Volume (# Millions-Other) 17.0 17.2 34.1 25.8 16.4 -36.5% -51.9% -4.8% -3.8%
2011-FEAS REGION VOLUME BY TYPE 2011-FEAS REGION VOLUME BY TYPE
76% 75%
9%
15%15%
10%
OtherStocks Bonds OtherStocks Bonds
*Statistics provided herein are as reported by the Members and are not audited by the FEAS Secretariat.
1,150.0107.4
33.020.2
-2.6-9.7
-11.7-12.77-14.5-15.7-15.9-18.8-20.1-21.0-21.1-24.9-28.8
-35.9-41.2-48.5-51.2-57.6
-82.6
1,200,000
1,000,000
800,000
600,000
400,000
200,00
0
12,000
10,000
8,000
6,000
4,000
2,000
0
NUMBER OF COMPANIES TRADED VS MARKET CAPITALIZATION(US$ million)
2011 ANNUALIZED RETURN ON INDEX
2007 2008 2009 2010 2011
TASIX/UzbekistanMOSTE/Montenegro
KSE Index/KyrgyzIraq/Iraq
Tehran SE/Iran Al Quds/PalestineKSE 100/Karachi
ADX/Abu DhabiBSE/Bulgaria
BIRS/Banja LukaMuscat SM/Oman
Amman SE/Jordan SASX/Sarajevo
Bahrain BET/Romania
CROBEX/ZagrebBelex15/SerbiaLSE 25/Lahore
KazakhstanB.I./Macedonia
ISE 100/IstanbulEgyptian SE/ Egypt
DSE Weighted Index/SyriaBelarusian C&SE/Belarus
Indices are adjusted for currency fluctuations. (Formula: 1+(return)=((1+%chg. index)/(1+%chg. currency))
Market Cap Companies Traded
FEDERATION OF EURO-ASIAN STOCK EXCHANGES ANNUAL REPORT JUNE 2012
PAGE 8
FEDERATION OF EURO-ASIAN STOCK EXCHANGES
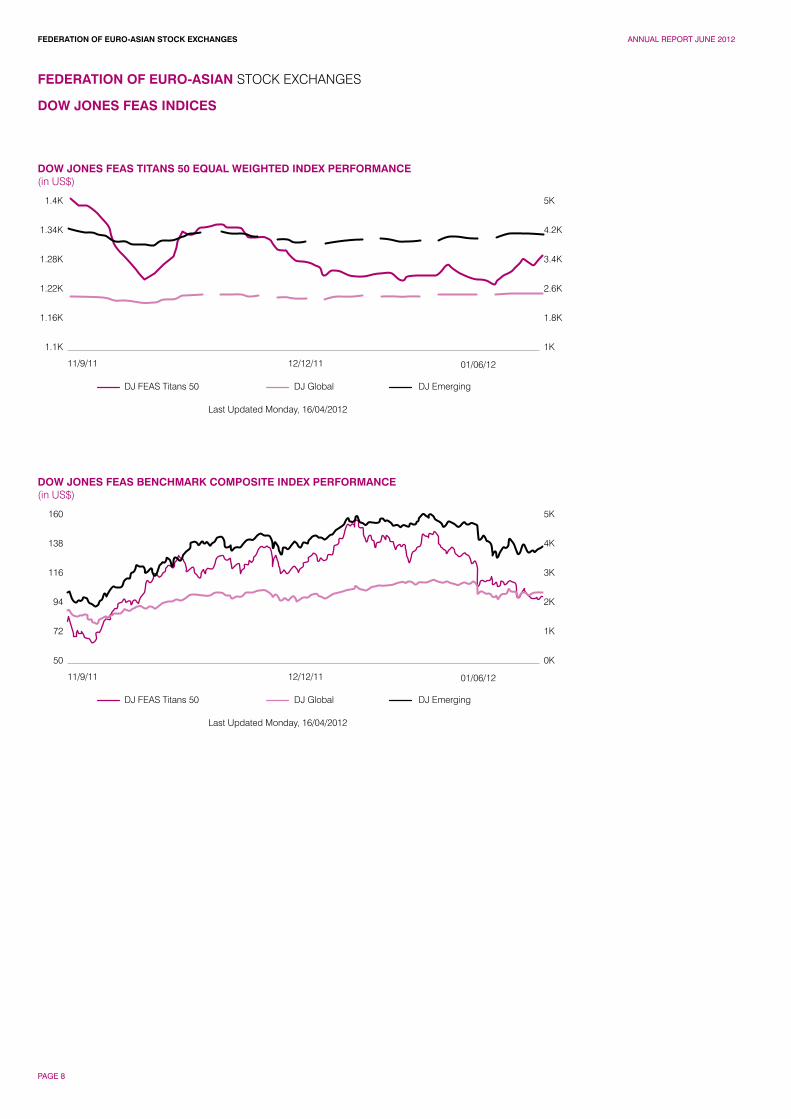
DOW JONES FEAS INDICES
DOW JONES FEAS TITANS 50 EQUAL WEIGHTED INDEX PERFORMANCE (in US$)
DOW JONES FEAS BENCHMARK COMPOSITE INDEX PERFORMANCE (in US$)
1.4K
1.34K
1.28K
1.22K
1.16K
1.1K
160
138
116
94
72
50
5K
4.2K
3.4K
2.6K
1.8K
1K
5K
4K
3K
2K
1K
0K
DJ FEAS Titans 50
DJ FEAS Titans 50
Last Updated Monday, 16/04/2012
Last Updated Monday, 16/04/2012
11/9/11
11/9/11
12/12/11
12/12/11
01/06/12
01/06/12
DJ Global
DJ Global
DJ Emerging
DJ Emerging
FEDERATION OF EURO-ASIAN STOCK EXCHANGES ANNUAL REPORT JUNE 2012
PAGE 9
CONTACT INFORMATION
Contact Name Mr. Henri Bergström E-mail [email protected] Website www.nasdaqomx.com
Robert WaghorneSenior Vice President, NASDAQ OMXDerivatives and Corporate Solutions Technology
Why CCP?
The 2008 financial crisis and today’s European debt crisis highlight the vulnerability of the financial system. By assuming counterparty risk as a way to assure the obligations of cleared trades, Clearinghouses -- and their ability to manage risk – play a crucial role.
New regulations, including the push for increased clearing of OTC instruments, and multi-asset trading are two factors increasing complexity – especially in margining and default management - and driving the demand for more sophisticated post-trade risk management systems.
The alpha on plain vanilla products has been mined away, and only the fastest and nimblest are still capturing it. Firms are looking for other opportunities globally, especially in more complex product and asset class mixtures. Clearinghouses need data management and analytics capabilities that enable them to understand the risks associated with these new alternatives.
Clearinghouses that already handle diverse products are higher up the learning curve than those that are niche-oriented. Still, there is room for innovation in areas such as combining cash and futures positions to offset margin.
Risk Management
Risk Management’s main task is to maintain the integrity of the Clearinghouse, and that is only possible with an efficient and robust risk management solution.
Clearinghouses need sophisticated modeling and stress testing capabilities to analyze the size, nature, diversity and volatility of participating banks’ portfolios and to strike the right balance between margin and guarantee fund levels. The objective: a detailed and comprehensive statistical footprint of the market and its players.
Real-time information is critical, but the speed of “real-time” data updates can range from milliseconds to minutes. The definition of “real-time” has implications for the infrastructure.
Clearinghouses also need to aggregate data flow from various exchanges and liquidity pools. New, updated and historical data enables them to perform sophisticated risk calculations that determine margin levels and influence the degree of leverage and amount of capital that can be committed to positions. Computational power plays a role. Although clouds and multi-core servers are getting cheaper, getting the data to flow at the proper speed and in the right format can be complicated.
Also, to establish proper controls, Clearinghouses should define automatic limits according to their risk policy and promptly act on any breaches.
Default Management
Increased clearing of non standard instruments and sophisticated margin models that offer cross margin benefits means increased demands on default management policies.
Clearinghouses need robust system tools for handling incidents and defaults. They also must demonstrate that they have strategies in place to resolve default situations, including execution capacity, liquidity providers and member commitment.
As part of the default management process, Clearinghouses must also maintain a financial waterfall mechanism, including a member sponsored default fund to safeguard market stability should a member default.
A clearinghouse’s integrity rests on its expertise in establishing and enforcing risk policies.
NASDAQ OMX
Real-time risk monitoringThe Nordic clearinghouse, NASDAQ OMX Clearing, recognizes the importance of sophisticated risk management technology to safely and proactively protect the clearinghouse and its members from financial risk.
To increase risk policy automation and to calculate risk in real-time across a wide range of asset classes, NASDAQ OMX recently implemented significant enhancements to
its Genium INET Clearing platform. It also integrated Sentinel Risk Manager from NASDAQ OMX to the enhanced solution. Now NASDAQ OMX Clearing has Europe’s first risk management system capable of integrating all asset classes and handling both OTC and exchange traded instruments. Managers can monitor risk in real-time using a browser-based dashboard, customize risk models and parameters for different types of asset classes and credit risks.
Sentinel Risk Manager’s integration enables the setting of limits and alarms so the risk management team is notified of any problems straightaway and can take immediate action. NASDAQ OMX Clearing runs Sentinel Risk Manager on a single server, so it is inexpensive and maintains a low footprint. Functionally, it addresses the enterprise risk needs of a clearinghouse and supports OTC clearing. Further, the solution was implemented in about six months.
FEDERATION OF EURO-ASIAN STOCK EXCHANGES ANNUAL REPORT JUNE 2012
PAGE 10
Taking customers beyond the match.
Any asset class. Anytime. Anywhere.
We are proud to be a sponsor of the
Federation of Euro-Asian Stock Exchanges.
©2012, The NASDAQ OMX Group, Inc. All Rights Reserved. Q12-0684
Q12-0684 Federation of Euro-Asian Exchanges Ad_0413b.indd 1 4/13/12 1:28 PM
VISIT THE FEAS WEBSITE
www.feas.org
• Trading statistics• Company data• Price information• Ratios• and much, much more...
Subscribe to FEAS RSS Feed atwww.feas.org/feed/index.aspxfor the latest news

FEDERATION OF EURO-ASIAN STOCK EXCHANGES ANNUAL REPORT JUNE 2012
PAGE 12
Ilhami KocGeneral Manager
Our Client Centered – Market Focused approach is geared towards having a good understanding of clients’ needs, in order to ensure the most appropriate investment strategies and alternatives are offered to meet the clients’ risk – return preferences. IS Investment provides a wide array of financial services to local and foreign investors, including Corporate Finance, Investment Advisory, Asset Management, Brokerage and Trading, Research and Risk Management.
With its largest individual and institutional customer base, IS Investment has 10 branches in Ankara, Bursa, Izmir, Adana, Istanbul (6 branches) and two representative offices in Almaty-Kazakhstan and Istanbul-Suadiye. In addition to this, IS Investment has a strong and widespread distribution network through the agency of more than 1000 Isbank branches distributed in various industry, business and residential centres all over Turkey.
IS Investment owns 99.8% of Camis Online, 70% of IS Asset Management, 74% of Efes NPL Asset Management, 37.4% of IS Investment Trust, 33% of IS Private Equity, 6% of Turkish Derivatives Exchange and Maxis Securities Ltd is a full subsidiary of IS Investment in London. Also another full subsidiary IS Investment Gulf Ltd has been established in Dubai.IS Investment, representing approximately 1/3 of the sector with its USD 2.0 billion asset size, reached USD 26.3 million consolidated net income in the first nine months of 2011. IS Investment represents more than 20% of the market with its AuM size of USD 5.9 billion.
IS Investment (ISMEN) went public in May 2007 and the only investment house rated & granted with a credit rating of ‘AAA(tur)’ with stable outlook by Fitch Ratings in November 2011. In addition to that IS Investment is the only investment house that has a corporate governance rating. Evaluating the corporate governance practices under the regulations of the CMB, JCR Eurasia Rating has assigned
8.63 points out of 10 (AAA (Trk) / Distinctive) for the overall level of compliance.
IS Investment represents a large and commanding presence in the Turkish investment market, reflected in its transaction volumes, ranking first not only in the Istanbul Stock Exchange (ISE) Stock Market since 2003, but also in the Turkish Derivatives Exchange (TurkDEX), since the foundation of the market in 2005. The company presents its investors the opportunity to make transactions both in Turkey and more than 30 different stock exchanges in the world by means of the online trading platform TradeMaster developed in 2007.
IS Investment also provides a wide range of corporate finance services including Public Offerings (equity and bond), Mergers & Acquisitions, Private Sector Advisory, Project Finance Advisory and Private Equity Advisory. Isbank since 1988 and IS Investment since its foundation together acted as the lead manager in 66 public offerings. IS Investment, which
IS Investment - the investment banking arm of İşbank - is the leading investment banking institution in Turkey.
IS INVESTMENT
Full Range of Investment Banking ServicesBrokerageInvestment AdvisoryAsset ManagementCorporate Finance: IPOs, M&As, Strategic PlanningResearch
Widest Client BaseLargest domestic network – more than 1,000 Isbank branches are our agent
Largest Assets Under ManagementUSD 5.9 billion mainly through subsidiary Is Asset Management
Volume Leader #1 in Stock Market#1 in Derivatives – TurkDEX#1 in Eurobond Transactions**among brokerage houses
Shareholders’ EquityUSD 211 Million
Only Brokerage House with a Credit RatingNational Long-Term AAA (Tur) / Stable Outlook by Fitch Ratings
Only Brokerage House with a Corporate Governance RatingAAA (Trk) / Distinctive by JCR Eurasia Rating
FACTS AND FIGURES
Date of Establishment December 18th,1996Registered Capital TL 300 Million / USD 162 MillionIssued Capital TL 260 Million / USD 140 MillionShareholders’ Equity (as of 9M11) TL 391.9 Million / USD 211.4 MillionAssets (as of 9M11) TL 3.6 Billion / USD 2.0 BillionFree-Float 29.32% Branches Adana, Ankara, Izmir, Istanbul (Akaretler, Kalamış, Levent, Maslak, Yeniköy, Yeşilköy,) Bursa, AdanaRepresentative Office Suadiye (Istanbul), Almaty (Kazakhstan) Agents More than 1,000 Isbank branchesOwnership Structure Isbank 65.65%Is Factoring 2.43%Is Leasing 2.43%Camis Investment Holding 0.17%Free Float 29.32%Subsidiaries* IS Investment’s Share Maxis Securities Limited 100.00%IS Investment Gulf Ltd. Dubai 100.00%Camis Online 99.79%Efes NPL Asset Management 74.00%IS Asset Management 70.00%IS Investment Trust 29.12%IS Private Equity 29.00%ELIDAS 10%TurkDEX 6.00%
*Subsidiaries in which IS Investment has more than 5% shares. IS Investment has also shares in Growing Enterprise Market Automatic Quotation, IS REIT, ISE Settlement and Custody Bank Inc. and Yatirim Finansman Securities.
FEDERATION OF EURO-ASIAN STOCK EXCHANGES ANNUAL REPORT JUNE 2012
PAGE 13
acted as the lead manager in 28 equity public offerings and 20 bond issues, having been involved with over 32% of the public offerings and raising funds totalling TL 13.8 billion, is the leader in the public offerings market in Turkey in terms of both size and number of transactions since foundation. Also since 2000, IS Investment has completed 88 M&A transactions with more than USD 7.9 billion total deal size – a number rendering the Company as the leading investment bank as per the M&A league rankings.
Also known with its pioneer role and innovative reputation in the sector with new products and market tools; IS Investment established the first hedge fund in Turkey, in November 2008. IS Investment has been the first local investment house to issue warrants, IS Warrants were listed in ISE in December 2010.
IS Investment has won several awards, including in the category of Euromoney Awards for Excellence “Best Equity House“ in 2007 and 2008, “Best M&A House” in 2009, and “Best Investment Bank” in 2010 and 2011. IS Investment was given “Financial Advisor of the Year in Turkey” award by FT/mergermarket in 2010 and “Best Investment Bank in Turkey” award by EMEA Finance. IS Investment was also given the prize in “The Company with the Highest Rating Score in Board” category by Corporate Governance Association of Turkey (TKYD).
In 2011 IS Investment is…• ISE Stock Market leader, with USD 60.5 bil-
lion trading volume and 7.3% market share.• TurkDEX Market leader with USD 66.2 billion
trading volume and 12.6% market share.• ISE Securities L/B Market leader with USD
1.3 billion trading volume and 24.9% market share.
• ISE Bonds&Bills, place third among broker-age houses with USD 7.5 billion trading volume and 10.2% market share.
• ISE Turkish Eurobonds Market leader among brokerage houses, with USD 159.3 million trading volume and 0.2% market share.
Since its establishment, IS Investment’s International Capital Markets Division has been providing direct access to financial
markets around the globe through its extensive counterparty network. Dedicated assistance by the industry’s top professionals have allowed our clients to have a better understanding and a broader view of investment products to achieve their goal of a well-diversified portfolio.
As on-going measures taken by the major central banks seemed to prove effective, global markets continue their gradual recoveries since the 2008 crisis, reaching closer to the pre-recession levels. However, unfortunate events following the earthquake in Japan led to the largest nuclear disaster that took an unexpected toll on Asian markets. Adding on, the markets were shaken briefly by the events like the Greek drama and the US downgrade, but then continued in a recovery mode with confidence still hang by a thread. As there is no risk free company or country in the World set by the recent examples in the markets, once again we were reminded the importance of diversification. Thus, availability of alternative investment tools for individual investors have become crucial as benefitting from such volatile movements within the market. Due to the extensive global markets coverage by a team of dedicated professionals, and a wide array of investment products, IS Investment’s clients were once again positioned at the right place at the right time.
IS Investment has been investing heavily on improving our product mix in order to satisfy the needs and spread out the single country risks of our customers. As the on-going liquidity crisis put the international capital markets to the foreground of investor’s attentions, IS Investment has already had an ever increasing activity in these markets. IS Investment has direct market access capabilities through the major equity and derivative exchanges around the world and also has execution facilities to emerging markets like in Middle East and CIS region. In equity markets, our activities are not only limited to secondary market trading as we also provide means for our customers to participate in primary issues all around the world and chance to invest through options rather than directly in cash markets. In fixed income markets, with a volume reaching almost USD 3 billion in 2010, IS Investment was rated
as the top financial firm among the other Turkish financial institutions based on transactions booked outside the exchange. Not only, as IS Investment, we concentrate purely on Turkish Eurobonds, but also focus heavily on high grade credits as well as credits from emerging market economies like Kazakhstan, Brazil, Russia and interact with more than hundred counterparties around the World.
As the financial crisis have created roller-coaster rides in the World markets, adding to the ways of diversification, the opportunities that keep on knocking increased the needs for exchange-listed derivative instruments. In order to facilitate our clients’ needs for these leveraged instruments, IS Investment launched Trade Master International in the beginning of 2008, which is giving execution capabilities to our investors for investing on their own in major equity markets and more importantly in futures markets like CBOT and CME. Also, through our experienced traders, our corporate clients can access London Metal Exchange (LME) in order to hedge their physical exposures in industrial metals. Recent trends within the industry have facilitated leveraged OTC forex trading to be regulated by the Turkish Capital Markets Board. Upon validation of statutes, IS Investment became one of the first financial institutions with a market-making license to provide leveraged forex trading capabilities to its retail and corporate clients. As a result, IS Investment officially launched its TradeMaster FX (TMFX) forex trading platform at the beginning of 2012, quickly becoming the undisputed market leader in terms of volumes traded.
Rating ourselves by far as the top Turkish institution in international capital markets, not only IS Investment will work on improving its abilities in organized exchanges around the World, but also will pursue to provide access to opportunities in emerging economies to its clients whom IS Investment made believe the importance of diversification with a little kick in it.
CONTACT INFORMATION
IS INVESTMENTIs Kuleleri, Kule-2 Kat: 12, 4. Levent 34330 Istanbul-TurkeyTel: +90 212 350 20 00 Fax: +90 212 350 20 01 www.isyatirim.com.tr / www.isinvestment.com
For International Capital Markets Contact Name Mr. Ilkay Dalkilic Tel. +90 212 350 2314 E-mail [email protected] Turkish Capital Markets Contact Name Mr. Serkan Aran Tel. +90 212 350 2324 E-mail [email protected] Almaty/Kazakhstan Rep. Office Contact Name Mr. Samad Azimov Tel. +7 727 258 1309 E-mail [email protected]
FEDERATION OF EURO-ASIAN STOCK EXCHANGES ANNUAL REPORT JUNE 2012
PAGE 14
C. Ozgur GuneriExecutive President
Finans Asset Management, a subsidiary of Finansbank, is one of the leading Exchange Traded Fund (ETF) providers in Turkey. In addition to Exchange Traded Funds, Finans Asset Management also manages mutual funds, pension funds and discretionary portfolios for high net-worth individuals and institutions.
Investors’ needs and expectations have been changing rapidly following the unpleasant memories of the recent global turmoils. Investors now seek for financial products which offer flexibility, transparency, ease of transaction, cost efficiency and safety. Changing investor needs have already started shaping the future of financial products. Finans Asset Management, the provider of many innovative financial products, has strong commitment to play a significant role to shape the future of investment services in Turkey. Award winning Exchange Traded Funds offered by Finans Asset Management attract high foreign investor interest with many advantages such as diversification, core holding, flexibility, continuous pricing, transparency, ease of transaction and ease of operations.
Exchange traded funds have become a major tool for investors to invest directly to the performance of equities, fixed income assets, commodities and currency etc. Clearly, an exchange traded fund congregates the key features of traditional mutual funds and individual stocks. ETFs represent a variety of securities that track specific indices, like index mutual funds. Besides, ETFs can be traded on the trading day in Istanbul Stock Exchange.
ETFs can be traded through any brokerage house with access to the Istanbul Stock Exchange.Retail investors can buy and sell ETFs through internet banking, telephone banking etc. Investors can trade ETFs with a single transaction through any brokerage house. ETFs are also investment instruments which can provide instant exposure to a wide range of securities. Investors can diversify their portfolio by choosing an index ETF, rather than taking concentrated risks by purchasing individual securities. ETFs reduce costs and can be traded with a narrow spread. Management fees are lower for exchange traded funds. ETFs are priced based on their Net Asset
Values, investors can follow the price moves continuously during the trading hours. ETFs’ holdings are published on a daily basis on their web sites.
Finans Asset Management launched the first exchange traded fund in Turkey in 2005, Dow Jones Istanbul 20 ETF. Since then, Finans Asset Management launched 5 more ETFs covering gold, Turkish equities and Turkish Government Fixed Income. In an attempt to meet investors’ increasing demand, Finans Asset Management recently launched two brand new ETFs. GÜMÜŞ Istanbul Silver Type B Silver Exchange Traded Fund, the First Silver ETF in Turkey that provides exposure to the performance of silver and Dolar Exchange Traded Fund, the First ETF in Turkey that provides exposure to USD / TRY parity, were listed on May 2nd in 2012.
With its expertise and commitment to exchange traded funds, Finans Asset Management will continue to expand its product portfolio and geographic presence.
With its expertise and commitment to exchange traded funds, Finans Asset Management will continue to expand its product portfolio and geographic presence.
FINANS ASSET MANAGEMENT
CONTACT INFORMATION
Contact Name Mr. C. Ozgur Guneri E-mail [email protected] Website www.finansportfoy.com
FEDERATION OF EURO-ASIAN STOCK EXCHANGES ANNUAL REPORT JUNE 2012
PAGE 15
IST30
www.ist30.com
Fund Name: Finansbank A.S. ISE 30 Type A ETFUnderlying Index: ISE National 30 Index Inception Date: 07 April 2009Management Fee: 0.95% (Annually)
Finansbank A.Ş. ISE 30 Type A Exchange Traded Fund is the first financial instrument providing exposure to ISE National 30 Index with a single transaction. IST30 consists of stocks that are mostly invested by foreign investors. Unlike index mutual funds, IST30 can be traded by any licensed banks and brokerage houses. Additionally, IST30 has less transaction costs. INAV* Ticker Trading Codes Bloomberg: IST30 TI Bloomberg: IST30 TIReuters: TRIST30 Reuters: IST30f.IS
DJIST
www.djist.com
Fund Name: Dow Jones Istanbul 20 Type A ETFUnderlying Index: Dow Jones Turkey Titans 20 Inception Date: 14 January 2005Management Fee: 0.95% (Annually)
DJIST is an exchange traded fund consisting of 20 blue-chip stocks listed on the ISE. The fund offers institutional investors the ability to gain exposure to the Turkish Capital Markets with a single transaction. INAV* Ticker Trading Codes Bloomberg: DJIST TI Bloomberg: DJIST TIReuters: DJIST Reuters: DJISTf.IS
BANKA
www.tr-banka.com
Fund Name: Turkey Large-Cap Bank Type A ETFUnderlying Index: DJ Turkey Large-Cap Banks Index Inception Date: 01 September 2009Management Fee: 0.95% (Annually)
BANKA is an exchange traded fund consisting of six banks’ stocks with the highest market capitalizations on the ISE. With BANKA, investors can participate in the performance of six Turkish banks’ stocks with a single transaction.
INAV* Ticker Trading Codes Bloomberg: BNKTR TI Bloomberg: BNKTR TIReuters: BNKTR Reuters: BNKTRf.IS
GÜMÜŞ
www.gumustr.com
Fund Name: Istanbul Silver Type B Silver Exchange Traded FundUnderlying Index: Istanbul Silver Type B Silver Exchange Traded Fund Index Inception Date: 02 May 2012 Management Fee: 0.47% (Annually)
GÜMÜŞ is the first silver Exchange Traded Fund in Turkey. The fund provides exposure to silver with a single transaction. As it is listed on the ISE and traded like a stock through any licensed banks and brokerage houses, GÜMÜŞ provides ease of transactions to investors. The fund also eliminates the storage problem of silver. GÜMÜŞ holdings are physically held at Istanbul Gold Exchange. GÜMÜŞ offers 100% replication.
INAV* Ticker Trading Codes Bloomberg: GMSTR TI Bloomberg: GMSTR TIReuters: GMSTR Reuters: GMSTRf.IS
DOLAR
www.dolartr.com
Fund Name: U.S. Treasury USDTRY Type B Exchange Traded Fund Underlying Index: US Short Term Treasury Bond Index Inception Date: 02 May 2012Management Fee: 0.37% (Annually)
• The First ETF in Turkey that provides exposure to USD/TRY parity.• DOLAR Exchange Traded Fund tracks US Short Term Treasury Bond Index.• Investors can trade USD Dollar with a single transaction through any licensed banks and brokerage houses with access to the Istanbul Stock Exchange.
INAV* Ticker Trading Codes Bloomberg: USDTR TI Bloomberg: USDTR TIReuters: ETFUSDTRY Reuters: USDTRf.IS
GT30
www.gt-30.com/etf
Fund Name: Finansbank A.Ş. GT-30 Type A ETFUnderlying Index: GT-30 Index Inception Date: 03 November 2010Management Fee: 0.95 %(Annually)
Finansbank GT30 Type-A Exchange Traded Fund is based on GT-30 Index. It includes equities of 15 prominent companies trading on the ISE in Turkey and 15 trading on the ATHEX in Greece.
INAV* Ticker Trading Codes Bloomberg: GT30 TI Bloomberg: GT30 TIReuters: TRGT30 Reuters: GT30f.IS
FBIST
www.fbist.com.tr
Fund Name: FTSE Istanbul Bond FBIST Type B ETFUnderlying Index: FTSE Turkish Lira Government. Bond Index Inception Date: 24 October 2007Management Fee: 0.51% (Annually)
FTSE Istanbul Bond ETF is an exchange traded fund allowing investors to gain direct exposure to a basket of Turkish Fixed Income Securities. FBIST can be traded on the ISE with a single transaction.
INAV* Ticker Trading Codes Bloomberg: FBIST TI Bloomberg: FBIST TI Reuters: FBIST Reuters: FBISTf.IS
GOLDIST
www.gldtr.com
Fund Name: Istanbul Gold Type B ETFUnderlying Index: Istanbul GOLD Type B Exchange Traded Fund Index Inception Date: 28 September 2006Management Fee: 0.47% (Annually)
GOLDIST is the first gold Exchange Traded Fund in Turkey. The fund provides exposure to gold with a single transaction. As it is listed on the ISE and traded like a stock through any licensed banks and brokerage houses, GOLDIST provides ease of transactions to investors. The fund also eliminates the storage problem of gold. GOLDIST holdings are physically held at Istanbul Gold Exchange. GOLDIST offers 100% replication.
INAV* Ticker Trading Codes Bloomberg: GLDTR TI Bloomberg: GLDTR TI Reuters: GLDTR Reuters: GLDTRf.IS
*For all the communication information of Exchange Traded Funds, visit www.cmb.gov.tr, Capital Markets Board of Turkey

FEDERATION OF EURO-ASIAN STOCK EXCHANGES ANNUAL REPORT JUNE 2012
PAGE 16
Ediz UsmanFounding Partner & Client Relations Director
Tayburn GroupWith 33 years of experience in international as well as European markets, Tayburn Ltd (UK) is the biggest corporate communication company in Scotland and one of the top-10 in the United Kingdom. It has been 18 years since we began blending Tayburn’s know-how with our own knowledge of the local market and putting them to work in the service of clients. For nearly two decades we have developed and offered productive, high-quality, and creative solutions for some of Turkey’s leading companies in the areas of annual reports, sustainability reports. branding, design, advertising, and marketing.
Thanks to our expert team, to the knowledge and experience acquired on our own and through Tayburn, to our customer focus, and to our innovative and creative approach to service, we are today one of the most sought-after service providers in the corporate communication segment in Turkey. Our service area as Tayburn is not limited to Turkey. Because of our world-class know-how and quality of service, we are also called upon by clients operating in Europe and in neighboring countries. Our own technological infrastructure makes it easy for us to provide such clients with fast, comprehensive service too.
Professional approach to businessOne notion defines the reason for our existence and our mission: Enable our clients to establish and maintain accurate, sustainable, and high-yield communication with their target audiences by means of our high added value products and services.
With our professional approach to business, our national and international market knowledge, and our global experience in corporate communication we transform this mission into reality for our clients.
Since the day we commenced operations, we have been doing business and taking pride in the knowledge that we have been consistently successful in the face of Turkey’s rapidly changing and developing market conditions and, what’s even more important, that we have been providing solutions that precisely serve our clients’ needs.
Printed and online corporate reporting and communicating with investors…Our activities in the area of reporting and investor relations consist of the turnkey design and delivery of:• Annual reports• Sustainability reports• COP reports • Investor relations products• Corporate presentationsas well as similar products and services that enable our clients to establish and maintain timely, precise, uninterrupted, and transparent communication with investors, shareholders, creditors, business partners, customers, employees, and the society at large.
Underlying all investor relations is the need to communicate corporate information accurately and clearly to investors, shareholders, creditors, employees, business partners, and society at large. Speed and transparency are of the utmost importance in investor relations today.
It is vitally important for publicly-held companies to keep abreast and quickly comply with the requirements of national and international regulations (Capital Markets Board, Sarbanes Oxley, NYSE, LSE, etc). Providing truthful information at the right time and in a format that is easy to understand and to access heads the list of the objectives of everyone involved in investor relations in today’s world. Tayburn offers clients in Turkey all the products and services that they need in the area of investor relations.
Conveying your message clearly to the right audience…Tayburn prepares and edits text in Turkish and other languages to ensure that its clients’ messages are conveyed to their target audiences clearly and effectively. We provide high added value corporate communication services in the following languages: Turkish, English, French, German, Italian, Spanish, Russian, Chinese, and Arabic.
High-profile corporate and consumer brands…In the areas of creating, developing, defining and maintaining standards for our clients’ corporate and consumer brands, our brand-related activities consist of:• Designing logos and emblems• Developing corporate identities from A to Z• Launching and relaunching brands• Consultancy services
Satisfying marketing needs in the product/service-consumer cycle…Our activities under the heading of marketing consist of a providing all the advertising, promotional, and corporate communication products and services that our clients may need such as:• Advertising campaigns• Corporate films• Brochures• Information kits• Electronic presentations
Functional, robust, and audience-specific web-based communication solutionsTayburn is dedicated to the creation of web-based communication solutions that are highly functional, robust, and audience-specific.
The knowledge and experience that Tayburn has built up over the years is put to work to develop whatever web-based products and services its clients might need. Regarding the ability to combine creativity with workable solutions as the bedrock of all web-based services, Tayburn comes up with solutions ranging from corporate portals to investor relations websites and from e-commerce applications to web-based annual reports and advertising / publicity campaigns.
Well aware that internet design demands a thoroughly specialized understanding and approach, Tayburn makes sure that it is equipped with all of the resources and competencies that may be required to satisfy a client’s every need.
The power of knowledge
TAYBURN
FEDERATION OF EURO-ASIAN STOCK EXCHANGES ANNUAL REPORT JUNE 2012
PAGE 17
STOCK EXCHANGE PROFILES
Abu Dhabi Securities Exchange 18 UAE Capital Market Development and Economic Outlook 20
Amman Stock Exchange 22 Jordan Capital Market Development and Economic Outlook 24
Bahrain Bourse 25 Bahrain Capital Market Development and Economic Outlook 27
Baku Interbank Currency Exchange 28
Baku Stock Exchange 30 Azerbaijan Capital Market Development and Economic Outlook 32
Banja Luka Stock Exchange 34
Belarusian Currency and Stock Exchange 36 Belarus Capital Market Development and Economic Outlook 38
Belgrade Stock Exchange 39 Serbia 2011 Economic Developments 41
Bucharest Stock Exchange 43 Romania Capital Market Development and Economic Outlook 45
Bulgarian Stock Exchange 47 Bulgarian Capital Market Development and Economic Outlook 49
Damascus Securities Exchange 50 Syria Capital Market Development and Economic Outlook 52
Egyptian Exchange 53 Egyptian Capital Market Development In 2011 55
Eurasian Trade System Commodity Exchange 57 Georgian Stock Exchange 59 Georgian Capital Market Development and Economic Outlook 61
Iraq Stock Exchange 62 Iraq Capital Market Development and Economic Outlook 64
Istanbul Gold Exchange 65
İstanbul Menkul Kıymetler Borsası 67 Turkish Capital Market Development and Economic Outlook 69
Karachi Stock Exchange 70 Pakistan Capital Market Development and Economic Outlook 72
Kazakhstan Stock Exchange 73 Kazakhstan Capital Market Development and Economic Outlook 75
Kyrgyz Stock Exchange 76 Kyrgyz Capital Market Development and Economic Outlook 78
Lahore Stock Exchange 79
Macedonian Stock Exchange 81 Macedonian Capital Market Development and Economic Outlook 83
Moldova Stock Exchange 84 Moldovan Capital Market Development and Economic Outlook 86
Mongolian Stock Exchange 87 Mongolian Capital Market Development and Economic Outlook 89
Montenegro Stock Exchange 90 Montenegro Capital Market Development and Economic Outlook 92
Muscat Securities Market 93 Oman Capital Market Development and Economic Outlook 95
NASDAQ OMX Armenia 96 Armenian Capital Market Development and Economic Outlook 98
Palestine Exchange 99 The Palestinian Economy in 2011 101
Sarajevo Stock Exchange 103 Bosnia and Herzegovina Economy 105
Tehran Stock Exchange 107 Iran Capital Market Development and Economic Outlook 109
Tirana Stock Exchange 110 Albanian Capital Market Development and Economic Outlook 112
“Toshkent” Republican Stock Exchange 113 Uzbekistan Capital Market Development and Economic Outlook 115
Turkish Derivatives Exchange (TurkDEX) 117
Zagreb Stock Exchange 118 Croatian Capital Market Development and Economic Outlook 120
FEDERATION OF EURO-ASIAN STOCK EXCHANGES ANNUAL REPORT JUNE 2012
PAGE 18
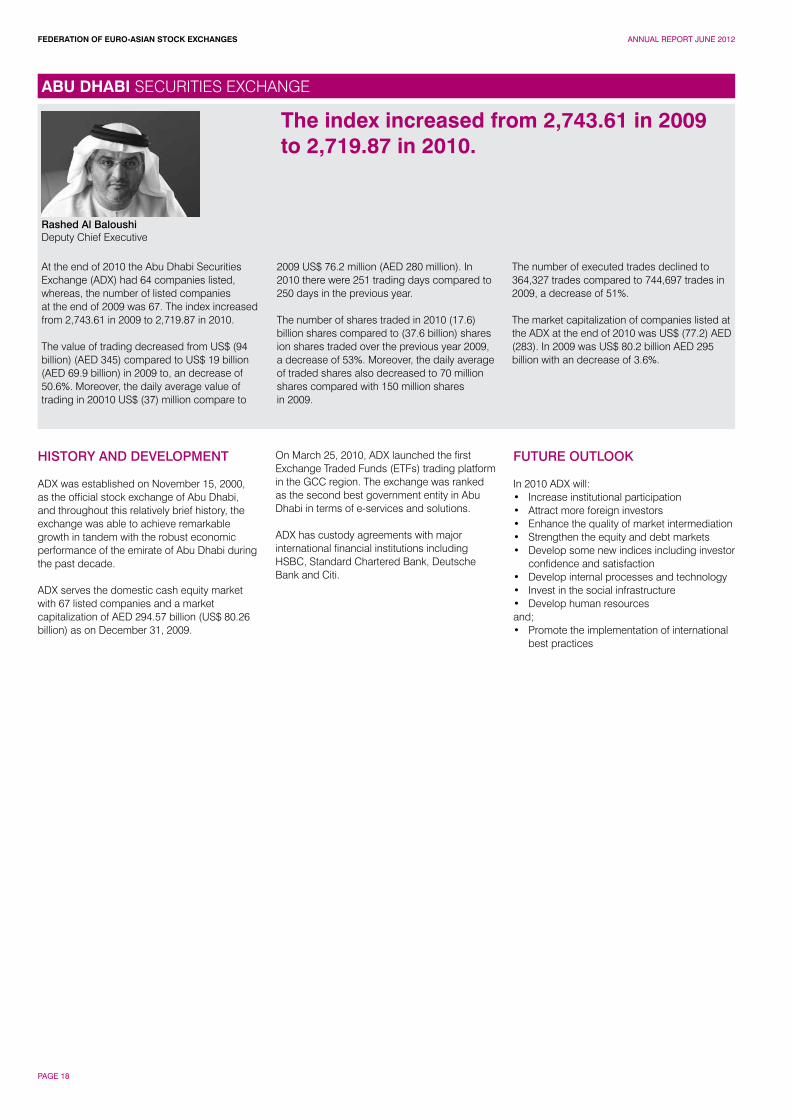
Rashed Al BaloushiDeputy Chief Executive
At the end of 2010 the Abu Dhabi Securities Exchange (ADX) had 64 companies listed, whereas, the number of listed companies at the end of 2009 was 67. The index increased from 2,743.61 in 2009 to 2,719.87 in 2010.
The value of trading decreased from US$ (94 billion) (AED 345) compared to US$ 19 billion (AED 69.9 billion) in 2009 to, an decrease of 50.6%. Moreover, the daily average value of trading in 20010 US$ (37) million compare to
2009 US$ 76.2 million (AED 280 million). In 2010 there were 251 trading days compared to 250 days in the previous year.
The number of shares traded in 2010 (17.6) billion shares compared to (37.6 billion) shares ion shares traded over the previous year 2009, a decrease of 53%. Moreover, the daily average of traded shares also decreased to 70 million shares compared with 150 million shares in 2009.
The number of executed trades declined to 364,327 trades compared to 744,697 trades in 2009, a decrease of 51%.
The market capitalization of companies listed at the ADX at the end of 2010 was US$ (77.2) AED (283). In 2009 was US$ 80.2 billion AED 295 billion with an decrease of 3.6%.
HISTORY AND DEVELOPMENT
ADX was established on November 15, 2000, as the official stock exchange of Abu Dhabi, and throughout this relatively brief history, the exchange was able to achieve remarkable growth in tandem with the robust economic performance of the emirate of Abu Dhabi during the past decade.
ADX serves the domestic cash equity market with 67 listed companies and a market capitalization of AED 294.57 billion (US$ 80.26 billion) as on December 31, 2009.
On March 25, 2010, ADX launched the first Exchange Traded Funds (ETFs) trading platform in the GCC region. The exchange was ranked as the second best government entity in Abu Dhabi in terms of e-services and solutions.
ADX has custody agreements with major international financial institutions including HSBC, Standard Chartered Bank, Deutsche Bank and Citi.
FUTURE OUTLOOK
In 2010 ADX will:• Increase institutional participation• Attract more foreign investors• Enhance the quality of market intermediation• Strengthen the equity and debt markets• Develop some new indices including investor
confidence and satisfaction• Develop internal processes and technology• Invest in the social infrastructure• Develop human resourcesand;• Promote the implementation of international
best practices
The index increased from 2,743.61 in 2009 to 2,719.87 in 2010.
ABU DHABI SECURITIES EXCHANGE

FEDERATION OF EURO-ASIAN STOCK EXCHANGES ANNUAL REPORT JUNE 2012
PAGE 19
ABU DHABI SECURITIES EXCHANGE
2011 STATISTICS
Stocks Bonds Other
Total Volume
(US$ millions)
Average Daily
Volume(US$ millions)
Total Volume(# millions)
Average Daily
Volume(# millions)
Total Volume
(US$ millions)
Average Daily
Volume(US$ millions)
Total Volume(# millions)
Average Daily
Volume(# millions)
Total Volume
(US$ millions)
Average Daily
Volume(US$ millions)
Total Volume(# millions)
Average Daily
Volume(# millions)
Jan-11 676.56 32.22 1,535.77 73.13 0.00 0.00 0.00 0.00 0.00 0.00 0.00 0.00
Feb-11 584.51 30.76 1,252.78 65.94 1.81 0.60 0.08 0.03 0.00 0.00 0.00 0.00
Mar-11 773.13 33.61 1,981.29 86.14 3.82 495.32 0.17 0.04 0.00 0.00 0.00 0.00
Apr-11 1,184.45 59.22 299.05 14.95 2.36 14.95 0.10 0.01 0.00 0.00 0.00 0.00
May-11 671.35 29.19 1,515.09 65.87 7.74 0.34 0.33 0.01 0.00 0.00 0.00 0.00
Jun-11 626.14 28.46 1,314.15 59.73 1.66 0.08 1.66 0.08 0.00 0.00 0.00 0.00
Jul-11 442.67 21.08 1,032.21 49.15 1.97 0.66 0.08 0.03 0.00 0.00 0.00 0.00
Aug-11 489.26 23.30 977.29 46.54 1.48 0.07 0.06 0.00 0.00 0.00 0.00 0.00
Sep-11 357.81 17.89 903.48 45.17 1.34 0.67 0.06 0.03 0.00 0.00 0.00 0.00
Oct-11 387.71 17.62 962.16 43.73 1.15 0.05 0.05 0.00 0.00 0.00 0.00 0.00
Nov-11 323.43 17.02 795.58 41.87 0.00 0.00 0.00 0.00 0.00 0.00 0.00 0.00
Dec-11 428.86 21.44 1,125.72 56.29 0.00 0.00 0.00 0.00 0.00 0.00 0.00 0.00
TOTAL 6,945.87 27.67 13,694.56 54.56 23.33 0.13 2.60 0.01 0.00 0.00 0.00 0.00
MarketCapitalization(US$ millions) Index
Jan-11 73,903.92 2,587Feb-11 74,476.75 2,589Mar-11 76,467.81 2,607Apr-11 77,263.47 2,696
May-11 76,809.24 2,639Jun-11 78,338.99 2,704Jul-11 76,604.50 2,620
Aug-11 76,637.08 2,616Sep-11 73,851.38 2,533Oct-11 72,975.02 2,501Nov-11 71,656.70 2,445Dec-11 71,326.88 2,402
CONTACT INFORMATION
Contact Name Mr. Saeed Khaouri E-mail [email protected] Website www.adx.ae
MONTHLY MARKET CAPITALIZATION(US$ millions)
600
500
400
300
200
100
0
3,000
2,500
2,000
1,500
1,000
500
0
90,000
80,000
70,000
60,000
50,000
40,000
30,000
20,000
10,000
0
Stocks
MONTHLY STOCK VOLUME VS INDEX(US$ millions)
Index
Jul JulAug AugSep SepOct OctNov NovDec Dec
FEDERATION OF EURO-ASIAN STOCK EXCHANGES ANNUAL REPORT JUNE 2012
PAGE 20
ADX Performance in 2011
Shares & Market Performance
• ADX General Market Index: at the end of 2011 was (2,402.28) at a percentile change of (-11.68%) in comparison to (2,719.87) in 2010.
• The traded value in ADX decreased by (-27%) from AED (34) billion in 2010 to (24) billion in 2011. Moreover, the average daily traded value decreased by (-29%) from AED (137) million in 2010 to AED (98) million in 2011.
• Trading volume decreased by (-9.60%) to (15.9) billion shares in comparison to (17.5) billion shares in 2010. The average daily trading volume decreased by (-10%) to (63) million shares in comparison to (70) million shares in 2010.
• During 2011, the number of executed trades was (283,293) thousand trades compared to (362,355) thousand transactions in 2010, a decrease that is (-22%).
• ADX’s market capitalization has declined from AED (283) billion at the end of 2010 compared to AED (261) billion at the end of 2011, with a percentile change of (-7.8%).
• The number of listed companies in 2011 was (67) compared to (64) at the end of 2010. During 2011. Ishraq Properties, which is listed under Real-estate sector, Insurance House, and National Takaful Company under Insurance sector, were listed on ADX.
• ADX’s listed companies are segmented into nine sectors according to their services and certificate of incorporation as follows: the Banks sector includes (14) companies, the Real Estate sector includes (4) companies, the Consumer Staples sector includes (5) companies, the Investment and Financial services sector includes (2) companies, the Industry sector includes (13) companies, the Telecommunication sector includes (3) companies, the Services sector includes (7) companies, the Energy sector includes (2) companies, and the Insurance sector includes (17) companies.
The Bond Market at ADX
• The trading value in 2011 was AED (85.7) Million while the trading value in 2010 was AED (424.6) Million. The trading volume in 2011 was (1) million units in comparison to (5.4) million units in 2010. There were 35 traded deals in 2011 in comparison to 73 deals traded in 2010.
Exchange Traded Funds (ETF’s)
• The Volume of ETF trading in 2011 reached (476) thousand units; while trading Value was AED (2.1) Million with 40 executed trades in 2011, in comparison to a traded Volume of (2.3) thousand units in 2010 with a trading value of AED (11.1) Million with 235 transactions.
ADX Achievements 2011
• ADX began providing the Delivery Versus Payment (DvP) service with effect from 28 April 2011. The Abu Dhabi Securities Exchange (ADX) introduced DvP following a recommendation by the International Organization of Securities Commission (IOSCO) to its member bodies. DvP is intended to reduce risk involved in securities transactions by allowing title to an asset and payment to be exchanged simultaneously. DvP is operated in stock markets in other jurisdictions, such as the London and New York Stock Exchanges.
• ADX achieved ISO 27001 certification, and became the first financial market to define and certify based on auditable international standard for information security management system (ISMS), covering its Trading, Clearing, Settlement, Registry and Depository services. ADX made it a tremendous feat, as it is one of the few organizations who choose to certify its core business services and information assets, to make it a practically sensible scope for its investors and other stakeholders. The certification was issued after a thorough auditing and validation by British Standards Institute, which gives maximum assurance to the stakeholders that their information is protected by the Exchange in the best comprehensive manner. As part of the certification process, there will be regular follow up audits to ensure the operational effectiveness of the system.
ABU DHABI SECURITIES EXCHANGE
CAPITAL MARKET DEVELOPMENT AND ECONOMIC OUTLOOK
FEDERATION OF EURO-ASIAN STOCK EXCHANGES ANNUAL REPORT JUNE 2012
PAGE 21
ADX Big Blocks Market
Abu Dhabi Securities Exchange (ADX) implemented a new Big Blocks market that will take place simultaneously during the existing trading sessions. ADX aims from this move to meet the investors’ needs and re-enforce its transparency rules and demonstrates the depth of the market.
In order to qualify, big block trades must meet the following conditions:-The number of shares to be traded must not be less than (1%) of the capital of the company.-The initiator of the trade must be one person only while the counter-parties could be numerous, not exceeding 10 investors.-The price of the transaction should not differ by more than (25%) of the previous closing price.-Big Blocks trades are subject to the transparency and disclosure rules applicable on ADX.
ADX Reconsolidated Index
Abu Dhabi Securities Exchange (ADX) applied the newly reclassified consolidated index for the local markets in an organized move to improve the level of the local financial markets to be in line with the government competitive strategy according to the best practice in the financial sector.
The launching of the new index of ADX is a step that would reflect the reality of the listed companies and its various activities which supports the studies and analytical researches logically and objectively.
Companies Listed in ADX in 2011
- Insurance House:In June 2011, Abu Dhabi Securities Exchange (ADX) listed Insurance House P.S.C, a company specialized in insurance, within its listed companies, whereby the company has launched its operations through ADX under the ticker symbol “IH”.
- Eshraq Properties:In September 2011, Abu Dhabi Securities Exchange (ADX) listed Eshraq Properties; a company specialized in developing commercial and residential properties within its listed companies, whereby the company has launched its operations through ADX under the ticker symbol “ESHRAQ”.
- National Takaful Company: In November 2011, Abu Dhabi Securities Exchange (ADX) listed National Takaful Company; a company specialized in insurance, within its listed companies, whereby the company has launched its operations through ADX under the ticker symbol “WATANIA”.
ABU DHABI SECURITIES EXCHANGE
Key Information ContactsAbu Dhabi Chamber of Commerce and Industry www.abudhabichamber.aeCentral Bank of UAE www.centralbank.aeAbu Dhabi Department of Planning and Economy www.adeconomy.ae
FEDERATION OF EURO-ASIAN STOCK EXCHANGES ANNUAL REPORT JUNE 2012
PAGE 22
Jalil TarifChief Executive Officer
The year 2011 has witnessed many events that had negative impacts on stock exchanges around the world most notably the downgrade of the sovereign debt rating of several European countries due to the European sovereign debt crisis, in addition to the downgrade of the American sovereign debt rating. Moreover, the Arab region has witnessed a political turmoil that took place in several Arab countries, these political distresses had a negative impact on Stock Exchanges in the region, even in countries whose political environment wasn’t affected by that turmoil and stayed stable, as in the case of Jordan.
On the other hand, the ASE managed to retain the confidence of investors, and this was reflected in the foreign investors’ ownership in the ASE which stood at around 51%, and the positive net investment of foreign investors.In 2011, the ASE continued with its efforts in developing the market, through updating the technical infrastructure, and on the legislative level, the ASE made amendments to the Listing Securities Directives which aimed at keeping the listing of the companies that are actively being traded and getting rid of companies that are not being traded.
As for the performance of the ASE, the Free Float Weighted Price Index went down during 2011 by 15.9% to close at 1995 points compared with its 2010 closing of 2374 points. The trading value witnessed a decrease in 2011 and reached US$ 4 billion. The number of transactions stood at 1.3 million transactions while the number of traded shares reached 4.1 billion. With regard to the foreign investment in the ASE, the net of non-Jordanian investments for the year 2011 showed an increase of US$ 111 million compared to a decrease of US$ 21 million during 2010.
HISTORY AND DEVELOPMENT
The Amman Stock Exchange (ASE) was established in March 1999 as a non-profit, private institution with administrative and financial autonomy. It is authorized to function as an exchange for the trading of securities. The Exchange is governed by a seven-member board of directors. A Chief Executive Officer oversees day-to-day responsibilities and reports to the board. The ASE membership is comprised of Jordan’s 68 brokerage firms.
The history of securities trading in Jordan traces its origins back to the 1930s. In 1976, the Amman Financial Market was established to create a regulated trading market. More recently, as part of Jordan’s move to upgrade its capital market, a Securities Law was enacted in 1997 separating the supervisory and legislative roles from those of exchange operations. As a result, the Jordan Securities Commission (JSC) was created in the year 1997, the ASE and the Securities Depository Center (SDC) were established in 1999. The JSC supervises the issuance of and trading in securities and monitors and regulates the market. The SDC oversees clearing and settlement and maintains ownership records.
To provide a transparent and efficient market, the ASE implemented internationally recognized directives regarding market divisions and listing criteria. It also adopted procedures for improving regulatory effectiveness.
The ASE is charged with: • Providing companies with means of raising
capital by listing on the ASE, • Encouraging an active market in listed
securities based on the effective determination of prices and fair and transparent trading,
• Providing modern and effective facilities and equipment for trading, recording the trades and dissemination of prices,
• Monitoring and regulating trading, in coordination with the JSC as necessary, to ensure compliance with the law, a fair market and investor protection,
• Setting out and enforcing a professional code of ethics among its member directors and staff,
• Ensuring the provision of timely and accurate information of issuers to the market and disseminating market information to the public.
On March 26th 2000, the ASE launched an automated order-driven Electronic Trading System. The system is in compliance with international standards and takes into account the G-30 recommendations. This system also offers brokers immediate access to stock prices and orders and enables members to trade remotely.
On May 2006, The ASE has activated a new version of the electronic trading system (NSC V2+), which comes as part of the efforts to meet the increasing needs of the Jordanian capital market and in order to raise the capacity of the current electronic trading system to accommodate the increase in the daily trading volume.
On March 22nd 2009, The ASE launched the new version of the electronic trading system NSC V900, this project is considered a quantum leap for the concerned institutions as the electronic trading system has now become linked with the SDC systems and the JSC new monitoring systems. The new version will help develop the trading process at the ASE and enhance the capacity of the electronic trading system.
On July 14th 2010, the ASE Launched the Internet Trading service. This service is seen as a major opportunity for a large number of investors to trade in securities regardless of their geographic location. In addition, the service will help increase the number of investors at the ASE and enhance their aptitude to engage in securities trading.
FUTURE OUTLOOK
The Amman Stock Exchange will embark on a number of key projects that will ensure maintaining the lead that the ASE has amongst Arab and regional stock exchanges. These projects can be summarized as follows: • Continuing the construction works of the
Jordan National Financial Center. • Continuing upgrading the technical
infrastructure.• Launching new Indexes.• Launching new financial instruments.
The ASE has continued in 2011 with its efforts, aiming at developing the market, and increasing its efficiency.
AMMAN STOCK EXCHANGE
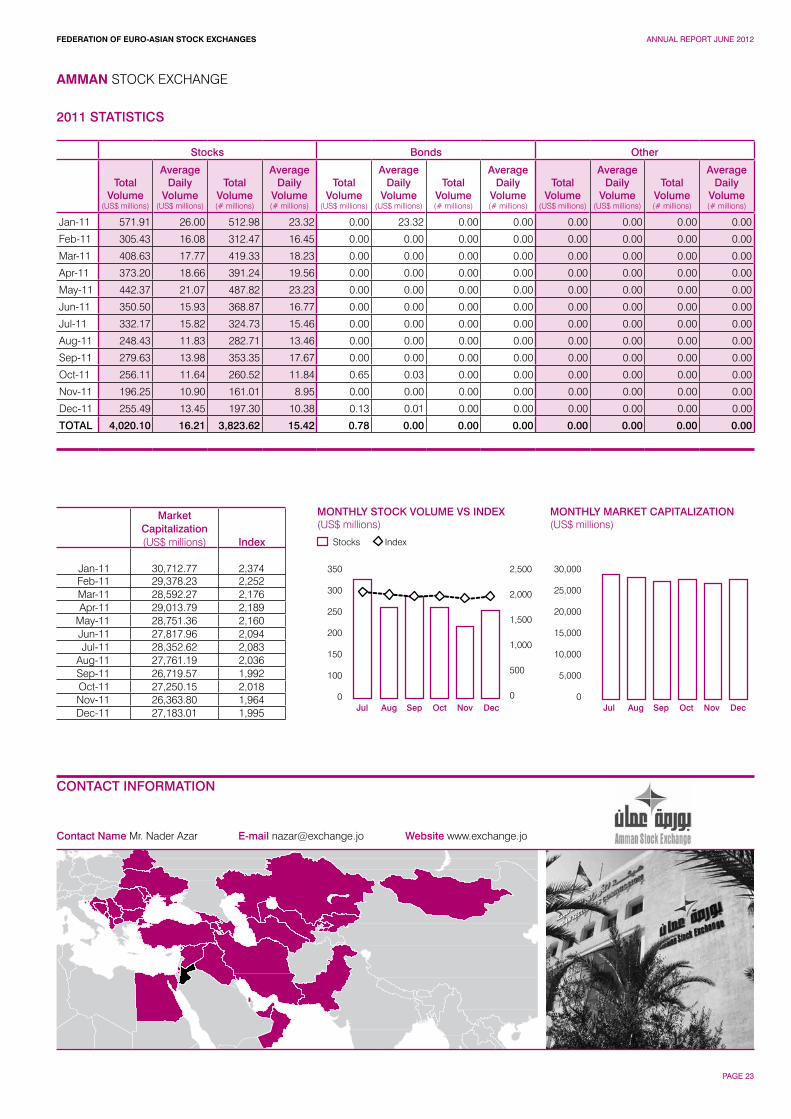
FEDERATION OF EURO-ASIAN STOCK EXCHANGES ANNUAL REPORT JUNE 2012
PAGE 23
AMMAN STOCK EXCHANGE
CONTACT INFORMATION
Contact Name Mr. Nader Azar E-mail [email protected] Website www.exchange.jo
MONTHLY MARKET CAPITALIZATION(US$ millions)
350
300
250
200
150
100
0
2,500
2,000
1,500
1,000
500
0
30,000
25,000
20,000
15,000
10,000
5,000
0
Stocks
MONTHLY STOCK VOLUME VS INDEX(US$ millions)
Index
Jul JulAug AugSep SepOct OctNov NovDec Dec
2011 STATISTICS
Stocks Bonds Other
Total Volume
(US$ millions)
Average Daily
Volume(US$ millions)
Total Volume(# millions)
Average Daily
Volume(# millions)
Total Volume
(US$ millions)
Average Daily
Volume(US$ millions)
Total Volume(# millions)
Average Daily
Volume(# millions)
Total Volume
(US$ millions)
Average Daily
Volume(US$ millions)
Total Volume(# millions)
Average Daily
Volume(# millions)
Jan-11 571.91 26.00 512.98 23.32 0.00 23.32 0.00 0.00 0.00 0.00 0.00 0.00
Feb-11 305.43 16.08 312.47 16.45 0.00 0.00 0.00 0.00 0.00 0.00 0.00 0.00
Mar-11 408.63 17.77 419.33 18.23 0.00 0.00 0.00 0.00 0.00 0.00 0.00 0.00
Apr-11 373.20 18.66 391.24 19.56 0.00 0.00 0.00 0.00 0.00 0.00 0.00 0.00
May-11 442.37 21.07 487.82 23.23 0.00 0.00 0.00 0.00 0.00 0.00 0.00 0.00
Jun-11 350.50 15.93 368.87 16.77 0.00 0.00 0.00 0.00 0.00 0.00 0.00 0.00
Jul-11 332.17 15.82 324.73 15.46 0.00 0.00 0.00 0.00 0.00 0.00 0.00 0.00
Aug-11 248.43 11.83 282.71 13.46 0.00 0.00 0.00 0.00 0.00 0.00 0.00 0.00
Sep-11 279.63 13.98 353.35 17.67 0.00 0.00 0.00 0.00 0.00 0.00 0.00 0.00
Oct-11 256.11 11.64 260.52 11.84 0.65 0.03 0.00 0.00 0.00 0.00 0.00 0.00
Nov-11 196.25 10.90 161.01 8.95 0.00 0.00 0.00 0.00 0.00 0.00 0.00 0.00
Dec-11 255.49 13.45 197.30 10.38 0.13 0.01 0.00 0.00 0.00 0.00 0.00 0.00
TOTAL 4,020.10 16.21 3,823.62 15.42 0.78 0.00 0.00 0.00 0.00 0.00 0.00 0.00
MarketCapitalization(US$ millions) Index
Jan-11 30,712.77 2,374Feb-11 29,378.23 2,252Mar-11 28,592.27 2,176Apr-11 29,013.79 2,189
May-11 28,751.36 2,160Jun-11 27,817.96 2,094Jul-11 28,352.62 2,083
Aug-11 27,761.19 2,036Sep-11 26,719.57 1,992Oct-11 27,250.15 2,018Nov-11 26,363.80 1,964Dec-11 27,183.01 1,995
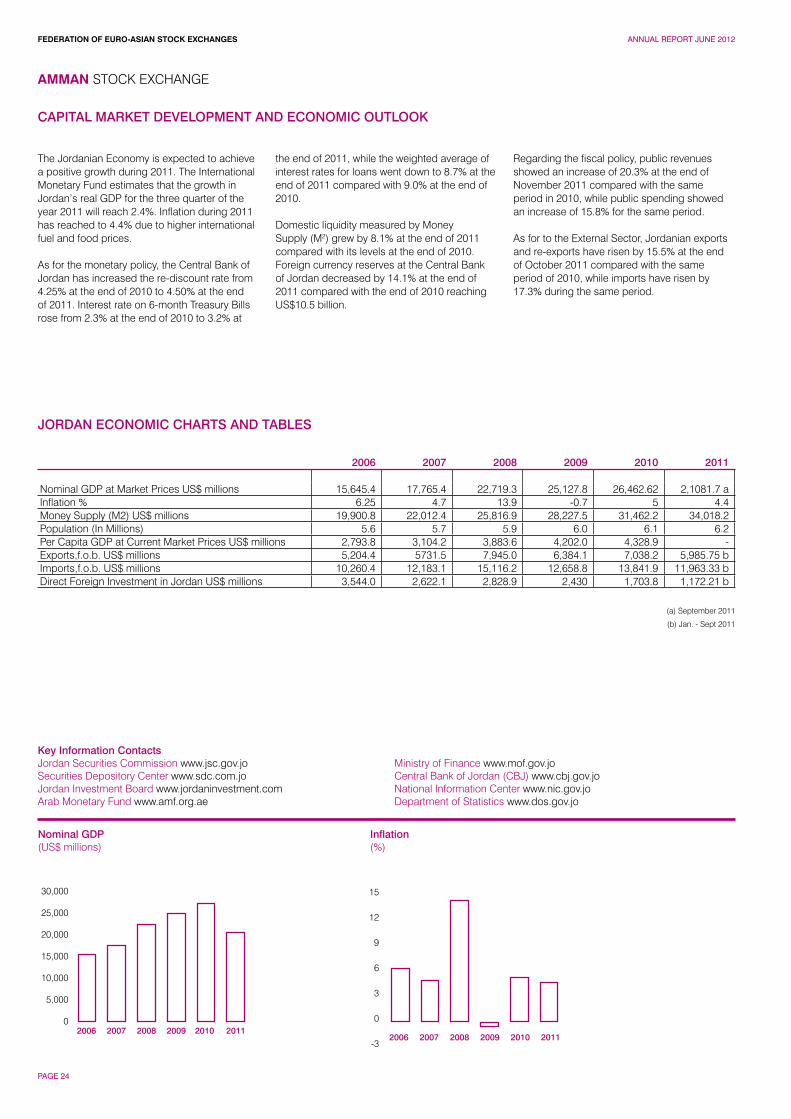
FEDERATION OF EURO-ASIAN STOCK EXCHANGES ANNUAL REPORT JUNE 2012
PAGE 24
20062006
30,000
25,000
20,000
15,000
10,000
5,000
0
15
12
9
6
3
0
-3
Nominal GDP(US$ millions)
Inflation (%)
The Jordanian Economy is expected to achieve a positive growth during 2011. The International Monetary Fund estimates that the growth in Jordan’s real GDP for the three quarter of the year 2011 will reach 2.4%. Inflation during 2011 has reached to 4.4% due to higher international fuel and food prices.
As for the monetary policy, the Central Bank of Jordan has increased the re-discount rate from 4.25% at the end of 2010 to 4.50% at the end of 2011. Interest rate on 6-month Treasury Bills rose from 2.3% at the end of 2010 to 3.2% at
the end of 2011, while the weighted average of interest rates for loans went down to 8.7% at the end of 2011 compared with 9.0% at the end of 2010.
Domestic liquidity measured by Money Supply (M2) grew by 8.1% at the end of 2011 compared with its levels at the end of 2010. Foreign currency reserves at the Central Bank of Jordan decreased by 14.1% at the end of 2011 compared with the end of 2010 reaching US$10.5 billion.
Regarding the fiscal policy, public revenues showed an increase of 20.3% at the end of November 2011 compared with the same period in 2010, while public spending showed an increase of 15.8% for the same period.
As for to the External Sector, Jordanian exports and re-exports have risen by 15.5% at the end of October 2011 compared with the same period of 2010, while imports have risen by 17.3% during the same period.
AMMAN STOCK EXCHANGE
JORDAN ECONOMIC CHARTS AND TABLES
2006 2007 2008 2009 2010 2011
Nominal GDP at Market Prices US$ millions 15,645.4 17,765.4 22,719.3 25,127.8 26,462.62 2,1081.7 aInflation % 6.25 4.7 13.9 -0.7 5 4.4Money Supply (M2) US$ millions 19,900.8 22,012.4 25,816.9 28,227.5 31,462.2 34,018.2Population (In Millions) 5.6 5.7 5.9 6.0 6.1 6.2Per Capita GDP at Current Market Prices US$ millions 2,793.8 3,104.2 3,883.6 4,202.0 4,328.9 -Exports,f.o.b. US$ millions 5,204.4 5731.5 7,945.0 6,384.1 7,038.2 5,985.75 bImports,f.o.b. US$ millions 10,260.4 12,183.1 15,116.2 12,658.8 13,841.9 11,963.33 bDirect Foreign Investment in Jordan US$ millions 3,544.0 2,622.1 2,828.9 2,430 1,703.8 1,172.21 b
Key Information ContactsJordan Securities Commission www.jsc.gov.joSecurities Depository Center www.sdc.com.joJordan Investment Board www.jordaninvestment.comArab Monetary Fund www.amf.org.ae
Ministry of Finance www.mof.gov.joCentral Bank of Jordan (CBJ) www.cbj.gov.joNational Information Center www.nic.gov.joDepartment of Statistics www.dos.gov.jo
20072007
20082008
20092009
20102010
20112011
(a) September 2011
(b) Jan. - Sept 2011
CAPITAL MARKET DEVELOPMENT AND ECONOMIC OUTLOOK
FEDERATION OF EURO-ASIAN STOCK EXCHANGES ANNUAL REPORT JUNE 2012
PAGE 25
Yusif HumoodChairman
Despite the signs of relative recovery from the global financial crisis that had an impact on different countries worldwide in 2008 along with the increase in oil prices during the second half of 2009, the response of the market indices in the region to this recovery varied among markets. The reasons for such variation are partly psychological reasons, and the other part goes back to the distinctive characteristics of each market that differentiates one market from another.
The performance of Bahrain All Share Index this year and the volume and value of shares traded reflects the psychological state that prevailed among investors at Bahrain Bourse resulting from the consequences of the crisis in spite of the good financial results reported by the majority of companies listed at the Exchange. This has led to a 19.17% drop in the index compared to its closing at the end of 2008.
In line with the development strategy approved by the Board of Directors of Bahrain Bourse five years ago, one of the major decisions in the history of the capital markets’ sector was made with the issuance of Resolution No. (57) of 2009 in respect of corporatizing the Exchange and transforming it to a shareholding company, paving the way to major legal, administrative,
and technical modifications that would change how the Exchange operates.Bahrain Bourse has completed the major part of its relocation project to Bahrain Financial Harbour in 2009. The new premises have been equipped with advanced technology and systems in a way that will enhance Bahrain Bourse’s competitiveness to provide more services. This will also enable Bahrain Bourse to provide the technical infrastructure that would encourage companies to benefit from these facilities.
Bahrain Bourse continued the development of its trading mechanisms in a way that will attract different segments of investors and clients, and increase their profitability when trading in the shares of listed companies at the Exchange. In addition, the bourse widened its scope of cooperation with leading regional and international financial institutions to be able to provide its custodian services at the Exchange with the aim of enabling local and foreign institutional clients to invest at Bahrain Bourse and benefit from the opportunities available.
Looking into Bahrain Bourse’s financial performance in 2009, the global crisis had an effect on the financial status of the Exchange where the operating surplus activate revenue
reported a deficit of BD 127,180 thousand compared to the surplus in 2008. The accumulated surplus also decreased slightly from BD 3,950,112 to BD 3,822,932, recording a drop of 3.21%.On behalf of the members of Bahrain Bourse’s Board of Directors and staff, I would like to express my thanks and gratitude to His Majesty King Hamad bin Isa bin Salman Al Khalifa, King of the Kingdom of Bahrain and His Royal Highness Prince Khalifa bin Salman Al Khalifa, the Prime Minister, and His Royal Highness Prince Salman bin Hamad Al Khalifa, the Crown Prince and Deputy Supreme Commander for their guidance and continuous support of Bahrain Bourse.
I would also like to extend my thanks to the Central Bank of Bahrain’s Chairman and members of the Board of Directors for their support of Bahrain Bourse. I would also like to thank the members of the Board of Directors of Bahrain Bourse for their opinions and contributions to the development of the bourse in the previous years. I would also like to thank Bahrain Bourse’s management and staff for their hard work during the year, hoping that such efforts will continue to further develop the Exchange.
HISTORY AND DEVELOPMENT
Bahrain Bourse (BHB) was established as a shareholding company according to Law No. 60 for the year 2010 to replace Bahrain Stock Exchange (BSE) that was established in 1987.
The first Bahraini Public Shareholding Company was established in 1957. Since then, more local public shareholding companies began to operate, reaching their peak in the beginning of the 1980’s. During this period, shares of public shareholding companies were being actively traded in a non-official market called “Al Jowhara Market”. Such market soon collapsed along with the collapse of the Souk Al-Manakh stock market crash in Kuwait at the beginning of the 80’s of the last century.
Following the crash, the Bahraini Government in cooperation with the International Finance Corporation (IFC) prepared a feasibility study to establish an official stock market in Bahrain. As a result of the recommendation of the study, the Bahraini Government established Bahrain Stock Exchange in 1987 according to Amiri Decree No. 4. The Exchange officially commenced operations in June 1989 with 29 Bahraini
shareholding companies listed. The only instruments traded at that time were common shares.
Since the bourse’s establishment in 1989 (formerly Bahrain Stock Exchange), trading was conducted manually through a system called “Auctional Trading” System. Using this system, the broker had to write the bid and offer orders that they receive from the investor on the trading boards at the trading floor. The transaction takes place when the bid and offer prices match.
In 1999, BHB implemented the Automated Trading System (ATS) to carry out all the bourse’s transactions electronically, replacing the old manual system.
In 2002, the legislative and regulatory authority and supervision of BHB was transferred from the Ministry of Commerce to the Central Bank of Bahrain (CBB) in which CBB regulates and supervises all the bourse’s activities.
With the development of the bourse, government institutions and companies started issuing several investment instruments taking advantage of the legislative and technical
infrastructure established by the bourse. Since then, the bourse witnessed the listing and registration of preferred shares, bonds, sukuk, and mutual funds, making it the first bourse to list such instruments in the region.
In 2010, Bahrain Bourse moved to its new premises at Bahrain Financial Harbour after preparing the new premises with the latest technological equipment in order to support the bourse’s efforts to provide a variety of advanced services that satisfy issuers, brokers and investors.
FUTURE OUTLOOK
In the year 2010, Bahrain Bourse will continue its efforts to attract more local, regional, and international mutual funds. The bourse will continue to attract more listed companies, both local and international and will also seek more cooperation with stock exchanges worldwide, with the aim of exchanging information and expertise. In addition, Bahrain Bourse will pursue strategic partnerships in many different areas that we hope to add value to all parties involved.
Bahrain Bourse continued the development of its trading mechanisms in a way that will attract different segments of investors and clients, and increase their profitability.
BAHRAIN BOURSE
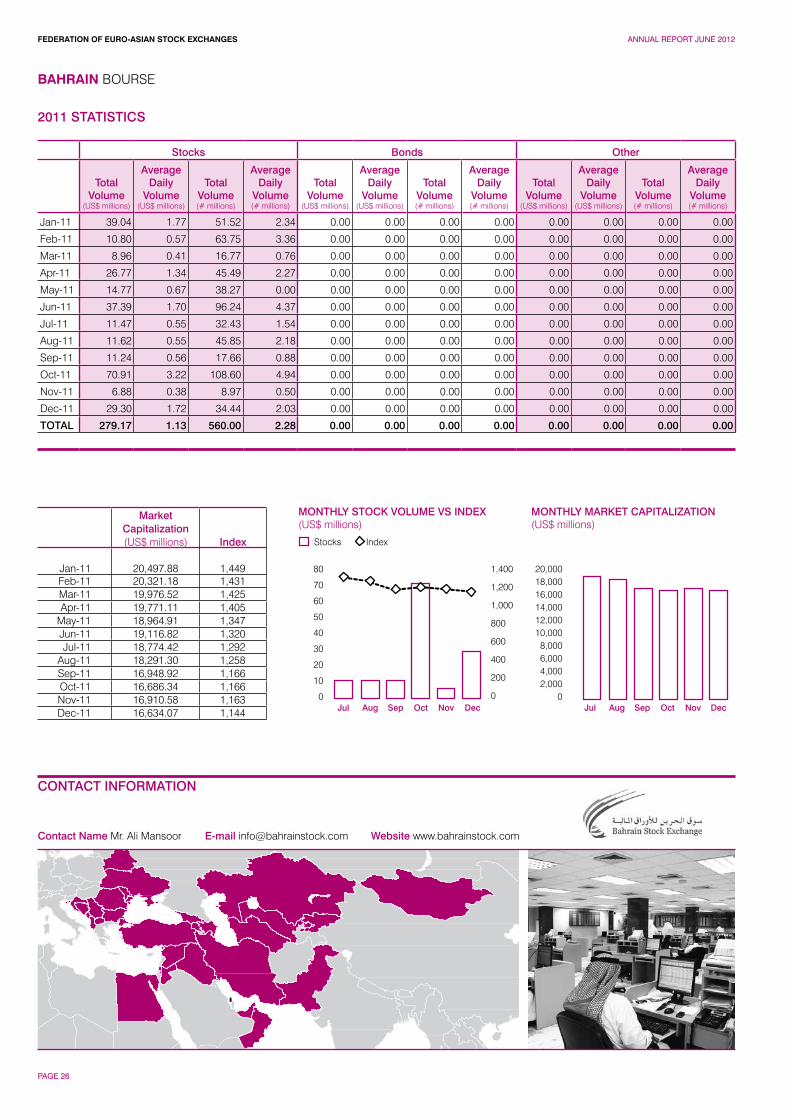
FEDERATION OF EURO-ASIAN STOCK EXCHANGES ANNUAL REPORT JUNE 2012
PAGE 26
BAHRAIN BOURSE
CONTACT INFORMATION
Contact Name Mr. Ali Mansoor E-mail [email protected] Website www.bahrainstock.com
MONTHLY MARKET CAPITALIZATION(US$ millions)
80
70
60
50
40
30
20
10
0
1,400
1,200
1,000
800
600
400
200
0
20,00018,00016,00014,00012,000 10,0008,0006,0004,0002,000
0
Stocks
MONTHLY STOCK VOLUME VS INDEX(US$ millions)
Index
Jul JulAug AugSep SepOct OctNov NovDec Dec
2011 STATISTICS
Stocks Bonds Other
Total Volume
(US$ millions)
Average Daily
Volume(US$ millions)
Total Volume(# millions)
Average Daily
Volume(# millions)
Total Volume
(US$ millions)
Average Daily
Volume(US$ millions)
Total Volume(# millions)
Average Daily
Volume(# millions)
Total Volume
(US$ millions)
Average Daily
Volume(US$ millions)
Total Volume(# millions)
Average Daily
Volume(# millions)
Jan-11 39.04 1.77 51.52 2.34 0.00 0.00 0.00 0.00 0.00 0.00 0.00 0.00
Feb-11 10.80 0.57 63.75 3.36 0.00 0.00 0.00 0.00 0.00 0.00 0.00 0.00
Mar-11 8.96 0.41 16.77 0.76 0.00 0.00 0.00 0.00 0.00 0.00 0.00 0.00
Apr-11 26.77 1.34 45.49 2.27 0.00 0.00 0.00 0.00 0.00 0.00 0.00 0.00
May-11 14.77 0.67 38.27 0.00 0.00 0.00 0.00 0.00 0.00 0.00 0.00 0.00
Jun-11 37.39 1.70 96.24 4.37 0.00 0.00 0.00 0.00 0.00 0.00 0.00 0.00
Jul-11 11.47 0.55 32.43 1.54 0.00 0.00 0.00 0.00 0.00 0.00 0.00 0.00
Aug-11 11.62 0.55 45.85 2.18 0.00 0.00 0.00 0.00 0.00 0.00 0.00 0.00
Sep-11 11.24 0.56 17.66 0.88 0.00 0.00 0.00 0.00 0.00 0.00 0.00 0.00
Oct-11 70.91 3.22 108.60 4.94 0.00 0.00 0.00 0.00 0.00 0.00 0.00 0.00
Nov-11 6.88 0.38 8.97 0.50 0.00 0.00 0.00 0.00 0.00 0.00 0.00 0.00
Dec-11 29.30 1.72 34.44 2.03 0.00 0.00 0.00 0.00 0.00 0.00 0.00 0.00
TOTAL 279.17 1.13 560.00 2.28 0.00 0.00 0.00 0.00 0.00 0.00 0.00 0.00
MarketCapitalization(US$ millions) Index
Jan-11 20,497.88 1,449Feb-11 20,321.18 1,431Mar-11 19,976.52 1,425Apr-11 19,771.11 1,405
May-11 18,964.91 1,347Jun-11 19,116.82 1,320Jul-11 18,774.42 1,292
Aug-11 18,291.30 1,258Sep-11 16,948.92 1,166Oct-11 16,686.34 1,166Nov-11 16,910.58 1,163Dec-11 16,634.07 1,144
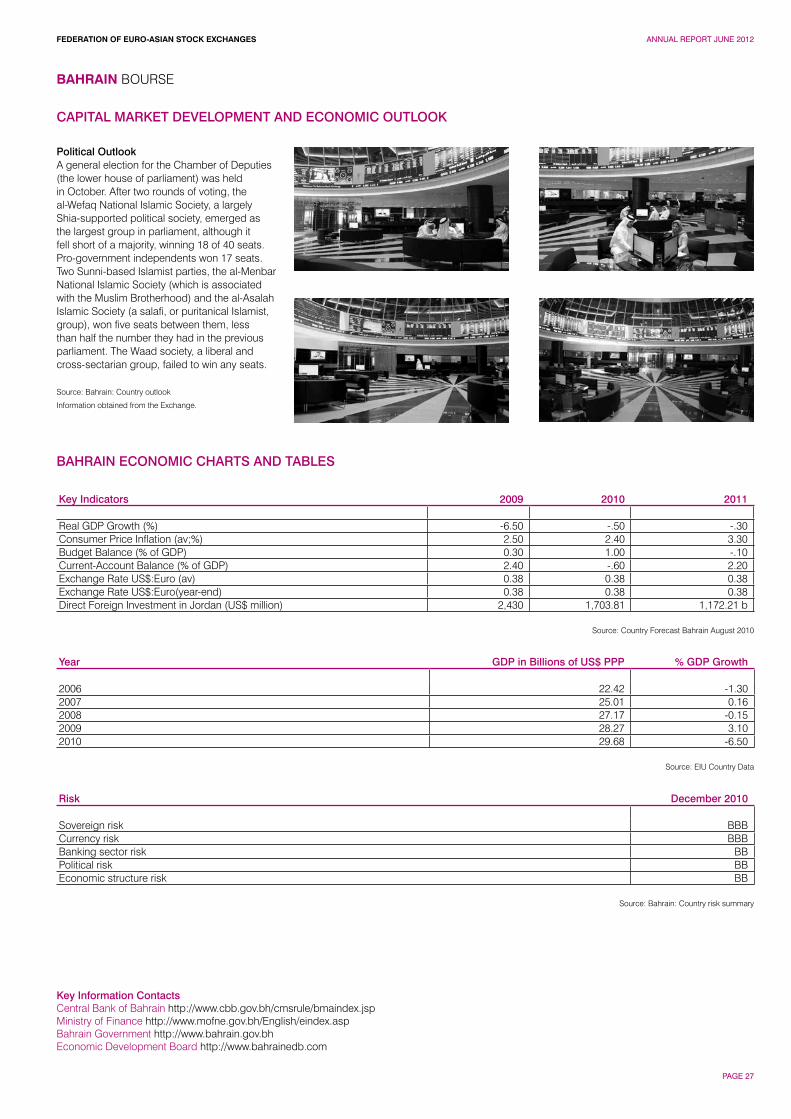
FEDERATION OF EURO-ASIAN STOCK EXCHANGES ANNUAL REPORT JUNE 2012
PAGE 27
BAHRAIN BOURSE
CAPITAL MARKET DEVELOPMENT AND ECONOMIC OUTLOOK
Political OutlookA general election for the Chamber of Deputies (the lower house of parliament) was held in October. After two rounds of voting, the al-Wefaq National Islamic Society, a largely Shia-supported political society, emerged as the largest group in parliament, although it fell short of a majority, winning 18 of 40 seats. Pro-government independents won 17 seats. Two Sunni-based Islamist parties, the al-Menbar National Islamic Society (which is associated with the Muslim Brotherhood) and the al-Asalah Islamic Society (a salafi, or puritanical Islamist, group), won five seats between them, less than half the number they had in the previous parliament. The Waad society, a liberal and cross-sectarian group, failed to win any seats.
Source: Bahrain: Country outlook
Information obtained from the Exchange.
BAHRAIN ECONOMIC CHARTS AND TABLES
Key Indicators 2009 2010 2011
Real GDP Growth (%) -6.50 -.50 -.30Consumer Price Inflation (av;%) 2.50 2.40 3.30Budget Balance (% of GDP) 0.30 1.00 -.10Current-Account Balance (% of GDP) 2.40 -.60 2.20Exchange Rate US$:Euro (av) 0.38 0.38 0.38Exchange Rate US$:Euro(year-end) 0.38 0.38 0.38Direct Foreign Investment in Jordan (US$ million) 2,430 1,703.81 1,172.21 b
Source: Country Forecast Bahrain August 2010
Year GDP in Billions of US$ PPP % GDP Growth
2006 22.42 -1.302007 25.01 0.162008 27.17 -0.152009 28.27 3.102010 29.68 -6.50
Source: EIU Country Data
Risk December 2010
Sovereign risk BBBCurrency risk BBBBanking sector risk BBPolitical risk BBEconomic structure risk BB
Source: Bahrain: Country risk summary
Key Information ContactsCentral Bank of Bahrain http://www.cbb.gov.bh/cmsrule/bmaindex.jspMinistry of Finance http://www.mofne.gov.bh/English/eindex.aspBahrain Government http://www.bahrain.gov.bhEconomic Development Board http://www.bahrainedb.com
FEDERATION OF EURO-ASIAN STOCK EXCHANGES ANNUAL REPORT JUNE 2012
PAGE 28
Farkhad Amirbekov General Manager of BBVB
The dynamic growth of the Azerbaijan economy increases in the credit ratings and the subsequent arrival of large investors promote the further development of the financial infrastructure of the country. Today the BBVB takes a central role in the infrastructure of the Azerbaijan capital market, integrating on a uniform technological platform trading and settlement systems. I am sure that the dynamic growth of the Azerbaijan economy and development of the exchange infrastructure will promote further growth and the appeal of the financial market of the country.
In the near future BBVB plans to introduce new technological ideas, new financial tools and services for clients. We will continue to work on perfection of a technological infrastructure
for the exchange and a control system of risks. The main objective of exchange innovations is not only the service of currency transactions of banks but for us it is very important, that the exchange market began to play more significant role in the banking system. Therefore I especially would like to allocate such projects, as the start of the market for currency swaps. The main objective of development of the exchange currency market consists in the increase of its appeal in the expansion of a number of the interconnected tools. We make plans, proceeding from necessity to correspond to the world standards both on technologies and on a spectrum of offered tools and services. For this purpose all of our perspective projects are subjected to these same standards.
It is obvious, that creation of a uniform exchange centre in the region will provide not only close integration of Azerbaijan into the world market, but also will give the stability to the country’s financial system. And here the importance of the exchange market as infrastructural element of a financial system consists in performance of a variety of unique functions, of which realization by other institutes either is impossible, or is inconvenient. I sincerely hope that realization of these plans will allow us to strengthen our positions, rendering best practices level service to our trade participants. This will lead the BBVB to become a basis for the creation of a world class regional financial centre.
HISTORY AND DEVELOPMENT
Central Bank of Azerbaijan and the four biggest state banks of Azerbaijan Republic founded the Baku Interbank Currency Exchange (Baki Banklarasi Valyuta Birjasi- BBVB) on 26 July 1993 and this year it marks decade from the moment of the beginning of activity in the financial market. Becoming from the beginning of the activity one of the central financial institutions of the country, BBVB is today for the business public of Azerbaijan an original symbol of economic reforms. Using the advanced information technologies and being based on successful experience in the creation of the universal trading platforms, BBVB by volumes of trades and number of financial tools became the largest exchange institute in the Caucasian region. Main historical dates18 October 1991 Declaration of Independence of the Azerbaijan Republic15 August 1992 Putting in circulation national currency - Manat21 June 1993 Establishment of the BBVB26 August 1994 Beginning of regular exchange trading in the currency market31 March 1995 First credit auction of the National Bank at the BBVB20 September 1996 First T-bill auction22 January 1997 First exchange trading in the BBVB Stock Department 5 May 1997 The beginning of preparation of the first rating estimations of banks
1 July 1997 Creation of the first exchange site30 August 1997 Beginning of trading in the Organized Interbank Currency Market (OICM) 25 September 1997 First trading in the OICM by means of universal trading e-network of the BBVB17 December 1997 Corresponding emerging market membership status in WFE6 March 1998 Signing in Baku Protocol on cooperation of BBVB with Istanbul Stock Exchange2 October 1998 Full member of FEAS (Istanbul)24 February 1999 Membership in the Azerbaijan Commercial Chamber (Baku)14 December 1999 Membership in the Azerbaijan Commercial Banks Association (Baku)20 April 2000 Co-founder and membership in the International Association of CIS Exchanges (Moscow)3 July 2001 Signing in Moscow Arrangement on strategic cooperation of BBVB with MICEX (Moscow Interbank Currency Exchange)27 March 2002 Start of e – system of trades on Interbank credits – the Organized Interbank Credit Market8 July 2002 Creation of the commission on trading limits9 July 2002 Start of Bourse E – System of Trades (BEST)24 November 2003 Signing in Almati agreement on mutual cooperation of BBVB with KASE (Kazakhstan Stock Exchange)16 June 2004 Signing in Baku agreement on mutual cooperation of BBVB with BSE (Bulgarian Stock Exchange)
31 August 2004 Registration of index AzeriREI developed by experts BBVB16 June 2005 Start of the tool - currency swap in Bourse E – system of trade (BEST)1 January 2006 Technical transition of BEST system for using denominated manat14 August 2007 Signing in Baku agreement on mutual cooperation of BBVB with TICEX (Tbilisi Interbank Currency Exchange)1 May 2008 Start of the settlement - trading system of BEST28 February 2008 Signing in Moldova agreement on mutual cooperation of BBVB with MOLDSE (Moldova Stock Exchange)21 October 2009 Introduction of the new tool in the Organized Interbank Money Market
FUTURE OUTLOOK 2012
• Development of settlement and clearing services, in particularly software for management of banks trading limits on money and the currency markets;
• Improvement of the risk management system in realization of clearing operations;
• Further increasing professional skills of Exchange’s personnel;
• Development of modern corporate governance principles;
• Development of Internet–technologies and e–commerce;
• Intensification of activity in organized interbank money market.
I am sure that dynamical growth of the Azerbaijan economy and development of an exchange infrastructure will promote the further growth of appeal of the financial market of the country.
BAKU INTERBANK CURRENCY EXCHANGE
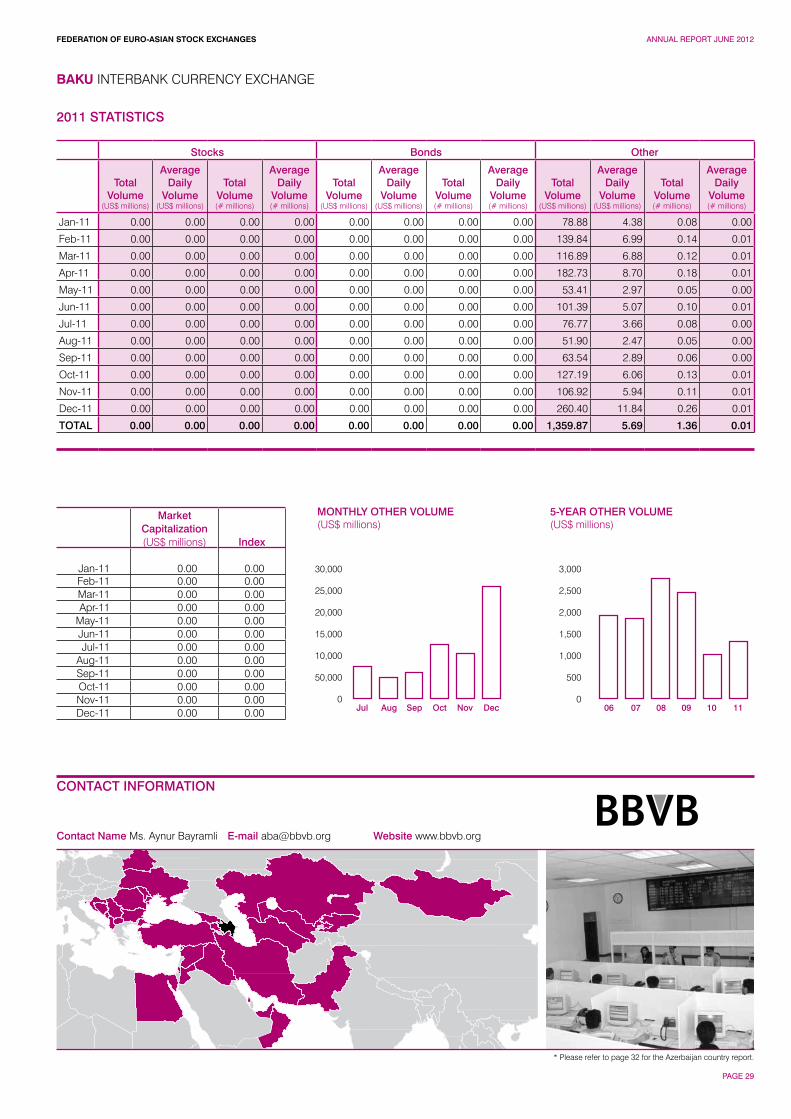
FEDERATION OF EURO-ASIAN STOCK EXCHANGES ANNUAL REPORT JUNE 2012
PAGE 29
BAKU INTERBANK CURRENCY EXCHANGE
CONTACT INFORMATION
Contact Name Ms. Aynur Bayramli E-mail [email protected] Website www.bbvb.org
* Please refer to page 32 for the Azerbaijan country report.
5-YEAR OTHER VOLUME(US$ millions)
30,000
25,000
20,000
15,000
10,000
50,000
0
3,000
2,500
2,000
1,500
1,000
500
0
MONTHLY OTHER VOLUME (US$ millions)
Jul 06Aug 07Sep 08Oct 09Nov 10Dec 11
2011 STATISTICS
Stocks Bonds Other
Total Volume
(US$ millions)
Average Daily
Volume(US$ millions)
Total Volume(# millions)
Average Daily
Volume(# millions)
Total Volume
(US$ millions)
Average Daily
Volume(US$ millions)
Total Volume(# millions)
Average Daily
Volume(# millions)
Total Volume
(US$ millions)
Average Daily
Volume(US$ millions)
Total Volume(# millions)
Average Daily
Volume(# millions)
Jan-11 0.00 0.00 0.00 0.00 0.00 0.00 0.00 0.00 78.88 4.38 0.08 0.00
Feb-11 0.00 0.00 0.00 0.00 0.00 0.00 0.00 0.00 139.84 6.99 0.14 0.01
Mar-11 0.00 0.00 0.00 0.00 0.00 0.00 0.00 0.00 116.89 6.88 0.12 0.01
Apr-11 0.00 0.00 0.00 0.00 0.00 0.00 0.00 0.00 182.73 8.70 0.18 0.01
May-11 0.00 0.00 0.00 0.00 0.00 0.00 0.00 0.00 53.41 2.97 0.05 0.00
Jun-11 0.00 0.00 0.00 0.00 0.00 0.00 0.00 0.00 101.39 5.07 0.10 0.01
Jul-11 0.00 0.00 0.00 0.00 0.00 0.00 0.00 0.00 76.77 3.66 0.08 0.00
Aug-11 0.00 0.00 0.00 0.00 0.00 0.00 0.00 0.00 51.90 2.47 0.05 0.00
Sep-11 0.00 0.00 0.00 0.00 0.00 0.00 0.00 0.00 63.54 2.89 0.06 0.00
Oct-11 0.00 0.00 0.00 0.00 0.00 0.00 0.00 0.00 127.19 6.06 0.13 0.01
Nov-11 0.00 0.00 0.00 0.00 0.00 0.00 0.00 0.00 106.92 5.94 0.11 0.01
Dec-11 0.00 0.00 0.00 0.00 0.00 0.00 0.00 0.00 260.40 11.84 0.26 0.01
TOTAL 0.00 0.00 0.00 0.00 0.00 0.00 0.00 0.00 1,359.87 5.69 1.36 0.01
MarketCapitalization(US$ millions) Index
Jan-11 0.00 0.00 Feb-11 0.00 0.00 Mar-11 0.00 0.00 Apr-11 0.00 0.00
May-11 0.00 0.00 Jun-11 0.00 0.00 Jul-11 0.00 0.00
Aug-11 0.00 0.00 Sep-11 0.00 0.00 Oct-11 0.00 0.00 Nov-11 0.00 0.00 Dec-11 0.00 0.00
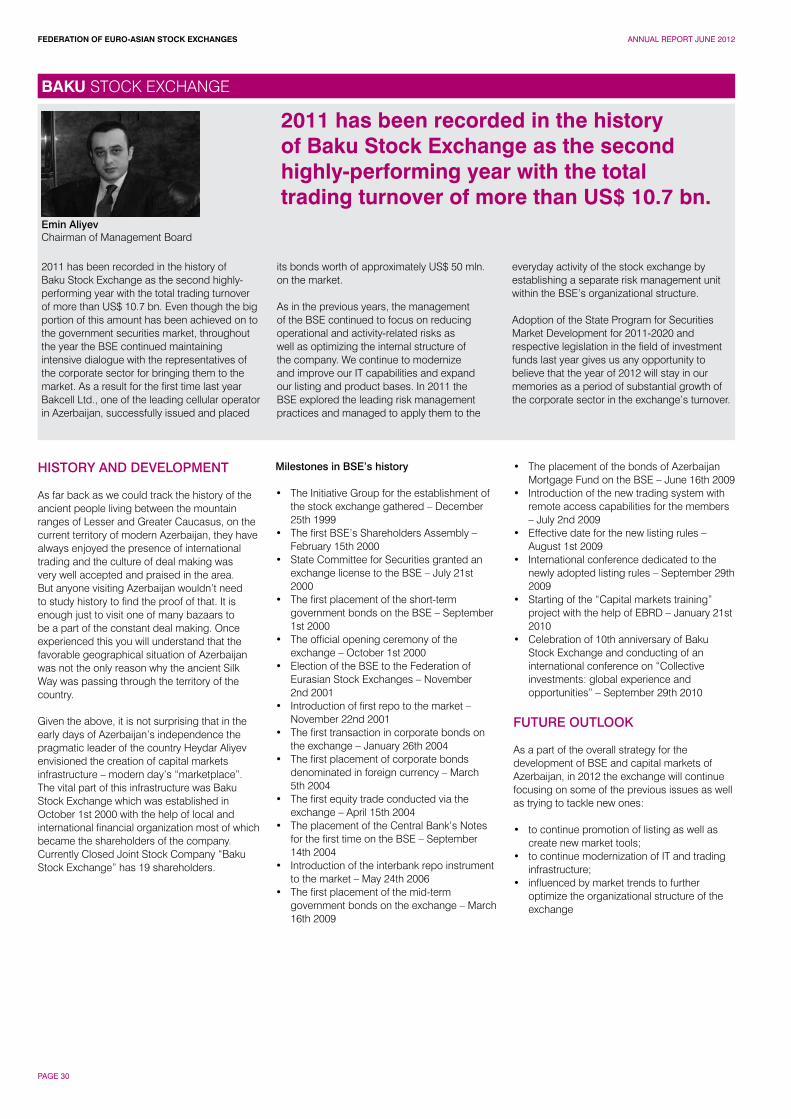
FEDERATION OF EURO-ASIAN STOCK EXCHANGES ANNUAL REPORT JUNE 2012
PAGE 30
Emin AliyevChairman of Management Board
2011 has been recorded in the history of Baku Stock Exchange as the second highly-performing year with the total trading turnover of more than US$ 10.7 bn. Even though the big portion of this amount has been achieved on to the government securities market, throughout the year the BSE continued maintaining intensive dialogue with the representatives of the corporate sector for bringing them to the market. As a result for the first time last year Bakcell Ltd., one of the leading cellular operator in Azerbaijan, successfully issued and placed
its bonds worth of approximately US$ 50 mln. on the market. As in the previous years, the management of the BSE continued to focus on reducing operational and activity-related risks as well as optimizing the internal structure of the company. We continue to modernize and improve our IT capabilities and expand our listing and product bases. In 2011 the BSE explored the leading risk management practices and managed to apply them to the
everyday activity of the stock exchange by establishing a separate risk management unit within the BSE’s organizational structure. Adoption of the State Program for Securities Market Development for 2011-2020 and respective legislation in the field of investment funds last year gives us any opportunity to believe that the year of 2012 will stay in our memories as a period of substantial growth of the corporate sector in the exchange’s turnover.
HISTORY AND DEVELOPMENT
As far back as we could track the history of the ancient people living between the mountain ranges of Lesser and Greater Caucasus, on the current territory of modern Azerbaijan, they have always enjoyed the presence of international trading and the culture of deal making was very well accepted and praised in the area. But anyone visiting Azerbaijan wouldn’t need to study history to find the proof of that. It is enough just to visit one of many bazaars to be a part of the constant deal making. Once experienced this you will understand that the favorable geographical situation of Azerbaijan was not the only reason why the ancient Silk Way was passing through the territory of the country.
Given the above, it is not surprising that in the early days of Azerbaijan’s independence the pragmatic leader of the country Heydar Aliyev envisioned the creation of capital markets infrastructure – modern day’s “marketplace”. The vital part of this infrastructure was Baku Stock Exchange which was established in October 1st 2000 with the help of local and international financial organization most of which became the shareholders of the company. Currently Closed Joint Stock Company “Baku Stock Exchange” has 19 shareholders.
Milestones in BSE’s history • The Initiative Group for the establishment of
the stock exchange gathered – December 25th 1999
• The first BSE’s Shareholders Assembly – February 15th 2000
• State Committee for Securities granted an exchange license to the BSE – July 21st 2000
• The first placement of the short-term government bonds on the BSE – September 1st 2000
• The official opening ceremony of the exchange – October 1st 2000
• Election of the BSE to the Federation of Eurasian Stock Exchanges – November 2nd 2001
• Introduction of first repo to the market – November 22nd 2001
• The first transaction in corporate bonds on the exchange – January 26th 2004
• The first placement of corporate bonds denominated in foreign currency – March 5th 2004
• The first equity trade conducted via the exchange – April 15th 2004
• The placement of the Central Bank’s Notes for the first time on the BSE – September 14th 2004
• Introduction of the interbank repo instrument to the market – May 24th 2006
• The first placement of the mid-term government bonds on the exchange – March 16th 2009
• The placement of the bonds of Azerbaijan Mortgage Fund on the BSE – June 16th 2009
• Introduction of the new trading system with remote access capabilities for the members – July 2nd 2009
• Effective date for the new listing rules – August 1st 2009
• International conference dedicated to the newly adopted listing rules – September 29th 2009
• Starting of the “Capital markets training” project with the help of EBRD – January 21st 2010
• Celebration of 10th anniversary of Baku Stock Exchange and conducting of an international conference on “Collective investments: global experience and opportunities” – September 29th 2010
FUTURE OUTLOOK
As a part of the overall strategy for the development of BSE and capital markets of Azerbaijan, in 2012 the exchange will continue focusing on some of the previous issues as well as trying to tackle new ones:
• to continue promotion of listing as well as create new market tools;
• to continue modernization of IT and trading infrastructure;
• influenced by market trends to further optimize the organizational structure of the exchange
2011 has been recorded in the history of Baku Stock Exchange as the second highly-performing year with the total trading turnover of more than US$ 10.7 bn.
BAKU STOCK EXCHANGE
FEDERATION OF EURO-ASIAN STOCK EXCHANGES ANNUAL REPORT JUNE 2012
PAGE 31
BAKU STOCK EXCHANGE
CONTACT INFORMATION
Contact Name Mr. Kamran Aliyev E-mail [email protected] Website www.bse.az
VOLUME BY TYPE(%)
1,200
1,000
800
600
400
200
0
MONTHLY STOCK VOLUME (US$ millions)
Jul Aug Sep Oct Nov Dec
20
12
68
Stocks Bonds Other
2011 STATISTICS
Stocks Bonds Other
Total Volume
(US$ millions)
Average Daily
Volume(US$ millions)
Total Volume(# millions)
Average Daily
Volume(# millions)
Total Volume
(US$ millions)
Average Daily
Volume(US$ millions)
Total Volume(# millions)
Average Daily
Volume(# millions)
Total Volume
(US$ millions)
Average Daily
Volume(US$ millions)
Total Volume(# millions)
Average Daily
Volume(# millions)
Jan-11 2.55 0.14 0.93 0.05 118.59 6.59 0.55 0.03 105.84 5.88 0.84 0.05
Feb-11 2.74 0.15 1.22 0.07 183.15 10.17 1.20 0.07 689.93 34.50 5.49 0.27
Mar-11 28.52 1.78 10.42 0.65 255.30 15.02 1.35 0.08 703.85 41.40 5.59 0.33
Apr-11 35.81 1.79 1.35 0.07 228.18 11.41 1.40 0.07 821.15 41.06 6.51 0.33
May-11 1.71 0.10 0.91 0.05 181.74 10.10 1.25 0.07 695.75 34.79 5.51 0.28
Jun-11 1.84 0.10 0.19 0.01 214.71 14.31 1.35 0.09 431.58 22.71 3.40 0.18
Jul-11 16.00 0.80 1.11 0.06 74.92 3.75 0.34 0.02 959.94 45.71 7.56 0.36
Aug-11 13.67 0.72 0.20 0.01 107.72 5.67 0.57 0.03 813.59 38.74 6.41 0.31
Sep-11 7.95 0.44 34.54 1.92 159.54 8.86 0.34 0.02 159.54 7.25 2.72 0.12
Oct-11 5.27 0.29 5.15 0.29 133.14 7.40 0.33 0.02 352.95 16.81 2.78 0.13
Nov-11 7.15 0.45 2.15 0.13 144.53 9.03 0.61 0.04 453.86 23.89 3.58 0.19
Dec-11 1,087.71 51.18 43.13 1.95 308.33 14.02 0.76 0.03 948.81 43.13 7.47 0.34
TOTAL 1,210.92 5.63 100.96 0.45 2,109.91 9.63 10.05 0.05 7,136.79 29.74 57.85 0.24
MarketCapitalization(US$ millions) Index
Jan-11 0.00 0.00 Feb-11 0.00 0.00 Mar-11 0.00 0.00 Apr-11 0.00 0.00
May-11 0.00 0.00 Jun-11 0.00 0.00 Jul-11 0.00 0.00
Aug-11 0.00 0.00 Sep-11 0.00 0.00 Oct-11 0.00 0.00 Nov-11 0.00 0.00 Dec-11 0.00 0.00
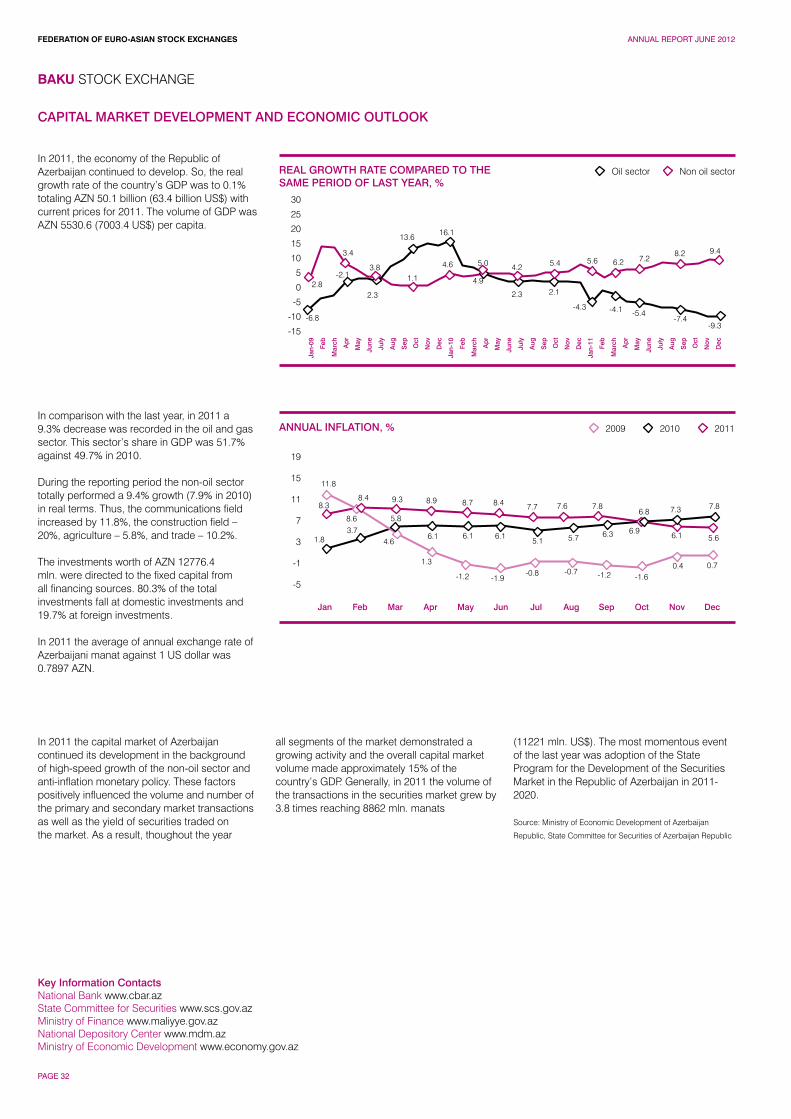
FEDERATION OF EURO-ASIAN STOCK EXCHANGES ANNUAL REPORT JUNE 2012
PAGE 32
In 2011, the economy of the Republic of Azerbaijan continued to develop. So, the real growth rate of the country’s GDP was to 0.1% totaling AZN 50.1 billion (63.4 billion US$) with current prices for 2011. The volume of GDP was AZN 5530.6 (7003.4 US$) per capita.
In comparison with the last year, in 2011 a 9.3% decrease was recorded in the oil and gas sector. This sector’s share in GDP was 51.7% against 49.7% in 2010.
During the reporting period the non-oil sector totally performed a 9.4% growth (7.9% in 2010) in real terms. Thus, the communications field increased by 11.8%, the construction field – 20%, agriculture – 5.8%, and trade – 10.2%.
The investments worth of AZN 12776.4 mln. were directed to the fixed capital from all financing sources. 80.3% of the total investments fall at domestic investments and 19.7% at foreign investments.
In 2011 the average of annual exchange rate of Azerbaijani manat against 1 US dollar was 0.7897 AZN.
In 2011 the capital market of Azerbaijan continued its development in the background of high-speed growth of the non-oil sector and anti-inflation monetary policy. These factors positively influenced the volume and number of the primary and secondary market transactions as well as the yield of securities traded on the market. As a result, thoughout the year
all segments of the market demonstrated a growing activity and the overall capital market volume made approximately 15% of the country’s GDP. Generally, in 2011 the volume of the transactions in the securities market grew by 3.8 times reaching 8862 mln. manats
(11221 mln. US$). The most momentous event of the last year was adoption of the State Program for the Development of the Securities Market in the Republic of Azerbaijan in 2011-2020.
Source: Ministry of Economic Development of Azerbaijan
Republic, State Committee for Securities of Azerbaijan Republic
BAKU STOCK EXCHANGE
Key Information ContactsNational Bank www.cbar.az State Committee for Securities www.scs.gov.az Ministry of Finance www.maliyye.gov.az National Depository Center www.mdm.az Ministry of Economic Development www.economy.gov.az
CAPITAL MARKET DEVELOPMENT AND ECONOMIC OUTLOOK
Jan-
09
Feb
Mar
ch Ap
r
May
June
July
Aug
Sep Oct
Nov
Dec
Jan
-10
Feb
Mar
ch Ap
r
May
June
July
Aug
Sep Oct
Nov
Dec
Jan-
11
Feb
Mar
ch Ap
r
May
June
July
Aug
Sep Oct
Nov
Dec
30
25
20
15
10
5
0
-5
-10
-15
REAL GROWTH RATE COMPARED TO THE SAME PERIOD OF LAST YEAR, %
Oil sector Non oil sector
2.8
-6.8
-2.1
3.4
2.3
13.6 16.1
3.81.1
4.6
4.9
2.3 2.1
-4.3 -4.1 -5.4-7.4
-9.3
5.0 4.2 5.4 5.6 6.2 7.28.2 9.4
Jan Feb Mar Apr May Jun Jul Aug Sep Oct Nov Dec
19
15
11
7
3
-1
-5
ANNUAL INFLATION, % 20102009 2011
8.3
8.6
4.61.83.7
5.8
6.1 6.1 6.15.1 5.7 6.3
6.8 7.3 7.8
1.3
-1.2 -1.9-0.8 -0.7 -1.2 -1.6
0.4 0.7
8.4 9.3 8.9 8.7 8.4 7.7 7.6 7.8
6.9 6.1 5.6
11.8
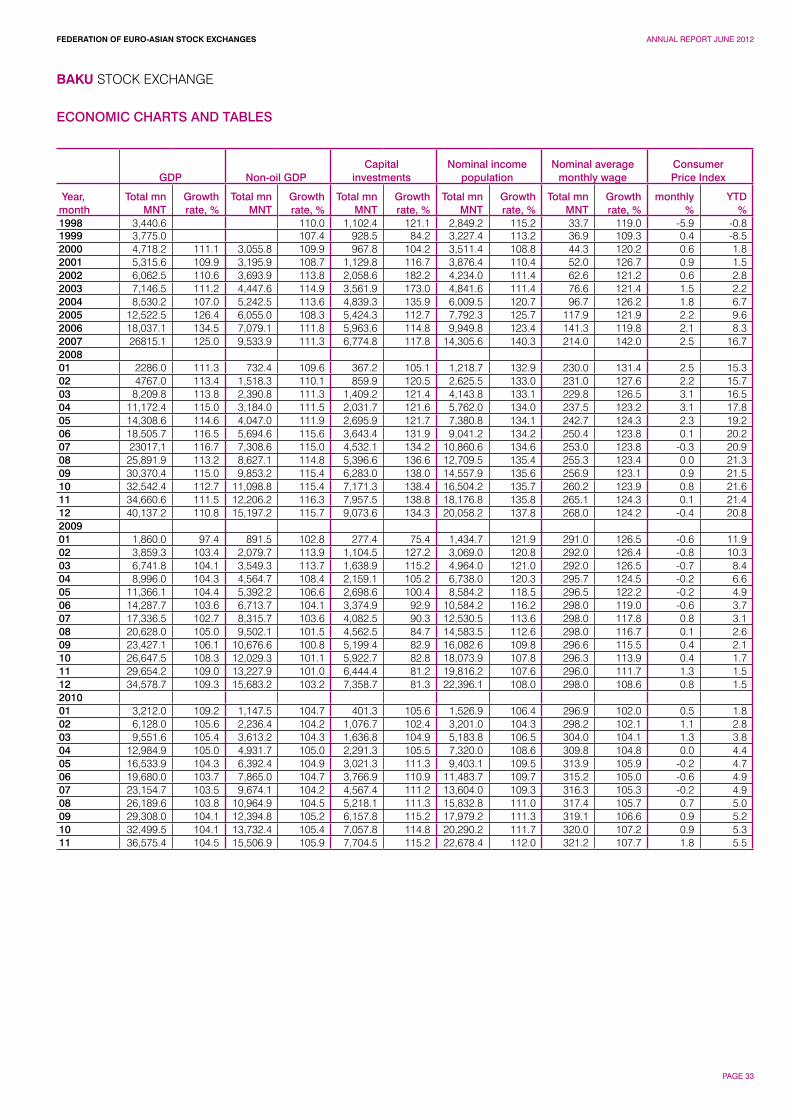
FEDERATION OF EURO-ASIAN STOCK EXCHANGES ANNUAL REPORT JUNE 2012
PAGE 33
BAKU STOCK EXCHANGE
ECONOMIC CHARTS AND TABLES
GDP Non-oil GDPCapital
investmentsNominal income
populationNominal average
monthly wageConsumer Price Index
Year, month
Total mn MNT
Growth rate, %
Total mn MNT
Growth rate, %
Total mn MNT
Growth rate, %
Total mn MNT
Growth rate, %
Total mn MNT
Growth rate, %
monthly %
YTD %
1998 3,440.6 110.0 1,102.4 121.1 2,849.2 115.2 33.7 119.0 -5.9 -0.81999 3,775.0 107.4 928.5 84.2 3,227.4 113.2 36.9 109.3 0.4 -8.52000 4,718.2 111.1 3,055.8 109.9 967.8 104.2 3,511.4 108.8 44.3 120.2 0.6 1.82001 5,315.6 109.9 3,195.9 108.7 1,129.8 116.7 3,876.4 110.4 52.0 126.7 0.9 1.52002 6,062.5 110.6 3,693.9 113.8 2,058.6 182.2 4,234.0 111.4 62.6 121.2 0.6 2.82003 7,146.5 111.2 4,447.6 114.9 3,561.9 173.0 4,841.6 111.4 76.6 121.4 1.5 2.22004 8,530.2 107.0 5,242.5 113.6 4,839.3 135.9 6,009.5 120.7 96.7 126.2 1.8 6.72005 12,522.5 126.4 6,055.0 108.3 5,424.3 112.7 7,792.3 125.7 117.9 121.9 2.2 9.62006 18,037.1 134.5 7,079.1 111.8 5,963.6 114.8 9,949.8 123.4 141.3 119.8 2.1 8.32007 26815.1 125.0 9,533.9 111.3 6,774.8 117.8 14,305.6 140.3 214.0 142.0 2.5 16.72008 01 2286.0 111.3 732.4 109.6 367.2 105.1 1,218.7 132.9 230.0 131.4 2.5 15.302 4767.0 113.4 1,518.3 110.1 859.9 120.5 2,625.5 133.0 231.0 127.6 2.2 15.703 8,209.8 113.8 2,390.8 111.3 1,409.2 121.4 4,143.8 133.1 229.8 126.5 3.1 16.504 11,172.4 115.0 3,184.0 111.5 2,031.7 121.6 5,762.0 134.0 237.5 123.2 3.1 17.805 14,308.6 114.6 4,047.0 111.9 2,695.9 121.7 7,380.8 134.1 242.7 124.3 2.3 19.206 18,505.7 116.5 5,694.6 115.6 3,643.4 131.9 9,041.2 134.2 250.4 123.8 0.1 20.207 23017,1 116.7 7,308.6 115.0 4,532.1 134.2 10,860.6 134.6 253.0 123.8 -0.3 20.908 25,891.9 113.2 8,627.1 114.8 5,396.6 136.6 12,709.5 135.4 255.3 123.4 0.0 21.309 30,370.4 115.0 9,853.2 115.4 6,283.0 138.0 14,557.9 135.6 256.9 123.1 0.9 21.510 32,542.4 112.7 11,098.8 115.4 7,171.3 138.4 16,504.2 135.7 260.2 123.9 0.8 21.611 34,660.6 111.5 12,206.2 116.3 7,957.5 138.8 18,176.8 135.8 265.1 124.3 0.1 21.412 40,137.2 110.8 15,197.2 115.7 9,073.6 134.3 20,058.2 137.8 268.0 124.2 -0.4 20.82009 01 1,860.0 97.4 891.5 102.8 277.4 75.4 1,434.7 121.9 291.0 126.5 -0.6 11.902 3,859.3 103.4 2,079.7 113.9 1,104.5 127.2 3,069.0 120.8 292.0 126.4 -0.8 10.303 6,741.8 104.1 3,549.3 113.7 1,638.9 115.2 4,964.0 121.0 292.0 126.5 -0.7 8.404 8,996.0 104.3 4,564.7 108.4 2,159.1 105.2 6,738.0 120.3 295.7 124.5 -0.2 6.605 11,366.1 104.4 5,392.2 106.6 2,698.6 100.4 8,584.2 118.5 296.5 122.2 -0.2 4.906 14,287.7 103.6 6,713.7 104.1 3,374.9 92.9 10,584.2 116.2 298.0 119.0 -0.6 3.707 17,336.5 102.7 8,315.7 103.6 4,082.5 90.3 12,530.5 113.6 298.0 117.8 0.8 3.108 20,628.0 105.0 9,502.1 101.5 4,562.5 84.7 14,583.5 112.6 298.0 116.7 0.1 2.609 23,427.1 106.1 10,676.6 100.8 5,199.4 82.9 16,082.6 109.8 296.6 115.5 0.4 2.110 26,647.5 108.3 12,029.3 101.1 5,922.7 82.8 18,073.9 107.8 296.3 113.9 0.4 1.711 29,654.2 109.0 13,227.9 101.0 6,444.4 81.2 19,816.2 107.6 296.0 111.7 1.3 1.512 34,578.7 109.3 15,683.2 103.2 7,358.7 81.3 22,396.1 108.0 298.0 108.6 0.8 1.52010 01 3,212.0 109.2 1,147.5 104.7 401.3 105.6 1,526.9 106.4 296.9 102.0 0.5 1.802 6,128.0 105.6 2,236.4 104.2 1,076.7 102.4 3,201.0 104.3 298.2 102.1 1.1 2.803 9,551.6 105.4 3,613.2 104.3 1,636.8 104.9 5,183.8 106.5 304.0 104.1 1.3 3.804 12,984.9 105.0 4,931.7 105.0 2,291.3 105.5 7,320.0 108.6 309.8 104.8 0.0 4.405 16,533.9 104.3 6,392.4 104.9 3,021.3 111.3 9,403.1 109.5 313.9 105.9 -0.2 4.706 19,680.0 103.7 7,865.0 104.7 3,766.9 110.9 11,483.7 109.7 315.2 105.0 -0.6 4.907 23,154.7 103.5 9,674.1 104.2 4,567.4 111.2 13,604.0 109.3 316.3 105.3 -0.2 4.908 26,189.6 103.8 10,964.9 104.5 5,218.1 111.3 15,832.8 111.0 317.4 105.7 0.7 5.009 29,308.0 104.1 12,394.8 105.2 6,157.8 115.2 17,979.2 111.3 319.1 106.6 0.9 5.210 32,499.5 104.1 13,732.4 105.4 7,057.8 114.8 20,290.2 111.7 320.0 107.2 0.9 5.311 36,575.4 104.5 15,506.9 105.9 7,704.5 115.2 22,678.4 112.0 321.2 107.7 1.8 5.5
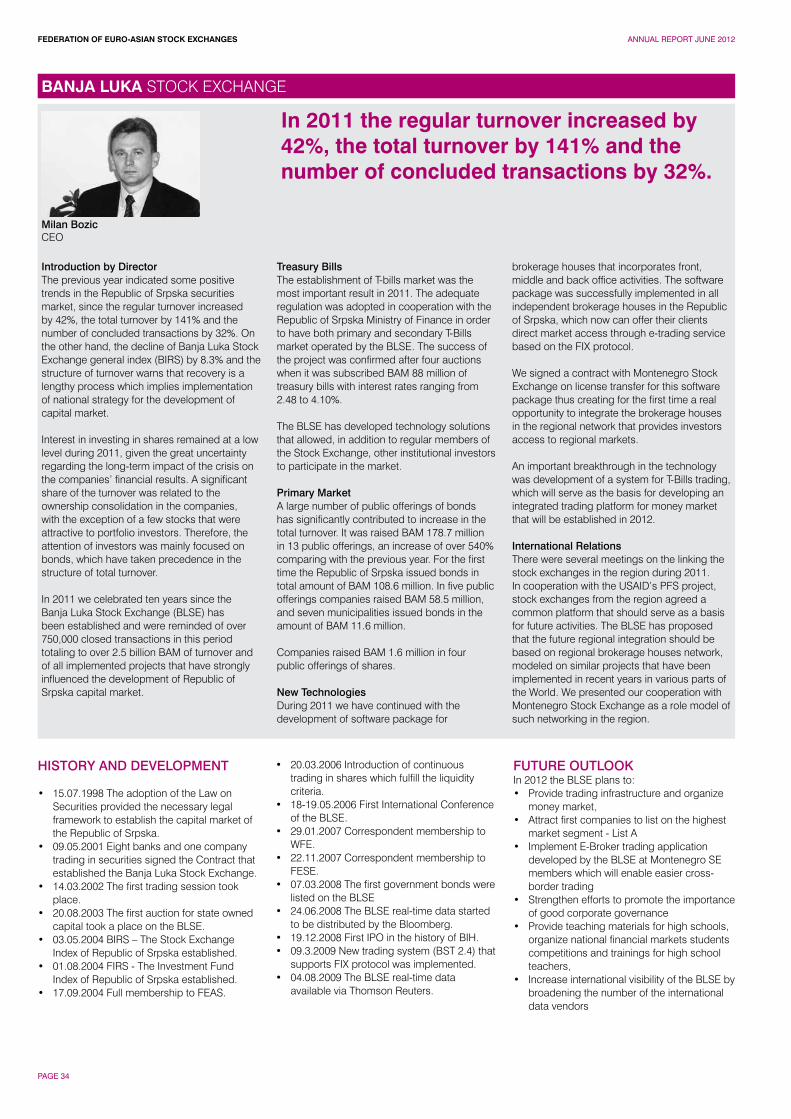
FEDERATION OF EURO-ASIAN STOCK EXCHANGES ANNUAL REPORT JUNE 2012
PAGE 34
Milan BozicCEO
Introduction by DirectorThe previous year indicated some positive trends in the Republic of Srpska securities market, since the regular turnover increased by 42%, the total turnover by 141% and the number of concluded transactions by 32%. On the other hand, the decline of Banja Luka Stock Exchange general index (BIRS) by 8.3% and the structure of turnover warns that recovery is a lengthy process which implies implementation of national strategy for the development of capital market. Interest in investing in shares remained at a low level during 2011, given the great uncertainty regarding the long-term impact of the crisis on the companies’ financial results. A significant share of the turnover was related to the ownership consolidation in the companies, with the exception of a few stocks that were attractive to portfolio investors. Therefore, the attention of investors was mainly focused on bonds, which have taken precedence in the structure of total turnover.
In 2011 we celebrated ten years since the Banja Luka Stock Exchange (BLSE) has been established and were reminded of over 750,000 closed transactions in this period totaling to over 2.5 billion BAM of turnover and of all implemented projects that have strongly influenced the development of Republic of Srpska capital market.
Treasury Bills The establishment of T-bills market was the most important result in 2011. The adequate regulation was adopted in cooperation with the Republic of Srpska Ministry of Finance in order to have both primary and secondary T-Bills market operated by the BLSE. The success of the project was confirmed after four auctions when it was subscribed BAM 88 million of treasury bills with interest rates ranging from 2.48 to 4.10%.
The BLSE has developed technology solutions that allowed, in addition to regular members of the Stock Exchange, other institutional investors to participate in the market.
Primary MarketA large number of public offerings of bonds has significantly contributed to increase in the total turnover. It was raised BAM 178.7 million in 13 public offerings, an increase of over 540% comparing with the previous year. For the first time the Republic of Srpska issued bonds in total amount of BAM 108.6 million. In five public offerings companies raised BAM 58.5 million, and seven municipalities issued bonds in the amount of BAM 11.6 million.
Companies raised BAM 1.6 million in four public offerings of shares.
New Technologies During 2011 we have continued with the development of software package for
brokerage houses that incorporates front, middle and back office activities. The software package was successfully implemented in all independent brokerage houses in the Republic of Srpska, which now can offer their clients direct market access through e-trading service based on the FIX protocol.
We signed a contract with Montenegro Stock Exchange on license transfer for this software package thus creating for the first time a real opportunity to integrate the brokerage houses in the regional network that provides investors access to regional markets.
An important breakthrough in the technology was development of a system for T-Bills trading, which will serve as the basis for developing an integrated trading platform for money market that will be established in 2012.
International RelationsThere were several meetings on the linking the stock exchanges in the region during 2011. In cooperation with the USAID’s PFS project, stock exchanges from the region agreed a common platform that should serve as a basis for future activities. The BLSE has proposed that the future regional integration should be based on regional brokerage houses network, modeled on similar projects that have been implemented in recent years in various parts of the World. We presented our cooperation with Montenegro Stock Exchange as a role model of such networking in the region.
HISTORY AND DEVELOPMENT
• 15.07.1998 The adoption of the Law on Securities provided the necessary legal framework to establish the capital market of the Republic of Srpska.
• 09.05.2001 Eight banks and one company trading in securities signed the Contract that established the Banja Luka Stock Exchange.
• 14.03.2002 The first trading session took place.
• 20.08.2003 The first auction for state owned capital took a place on the BLSE.
• 03.05.2004 BIRS – The Stock Exchange Index of Republic of Srpska established.
• 01.08.2004 FIRS - The Investment Fund Index of Republic of Srpska established.
• 17.09.2004 Full membership to FEAS.
• 20.03.2006 Introduction of continuous trading in shares which fulfill the liquidity criteria.
• 18-19.05.2006 First International Conference of the BLSE.
• 29.01.2007 Correspondent membership to WFE.
• 22.11.2007 Correspondent membership to FESE.
• 07.03.2008 The first government bonds were listed on the BLSE
• 24.06.2008 The BLSE real-time data started to be distributed by the Bloomberg.
• 19.12.2008 First IPO in the history of BIH.• 09.3.2009 New trading system (BST 2.4) that
supports FIX protocol was implemented.• 04.08.2009 The BLSE real-time data
available via Thomson Reuters.
FUTURE OUTLOOKIn 2012 the BLSE plans to:• Provide trading infrastructure and organize
money market,• Attract first companies to list on the highest
market segment - List A• Implement E-Broker trading application
developed by the BLSE at Montenegro SE members which will enable easier cross-border trading
• Strengthen efforts to promote the importance of good corporate governance
• Provide teaching materials for high schools, organize national financial markets students competitions and trainings for high school teachers,
• Increase international visibility of the BLSE by broadening the number of the international data vendors
In 2011 the regular turnover increased by 42%, the total turnover by 141% and the number of concluded transactions by 32%.
BANJA LUKA STOCK EXCHANGE
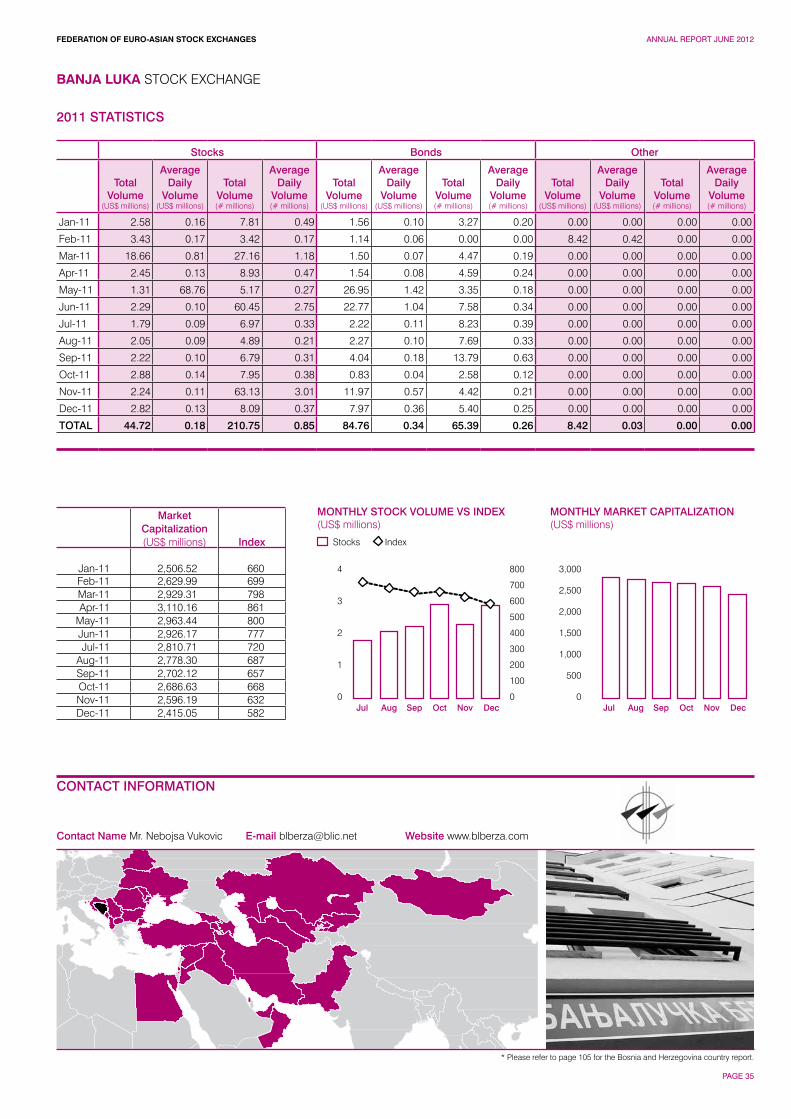
FEDERATION OF EURO-ASIAN STOCK EXCHANGES ANNUAL REPORT JUNE 2012
PAGE 35
BANJA LUKA STOCK EXCHANGE
CONTACT INFORMATION
Contact Name Mr. Nebojsa Vukovic E-mail [email protected] Website www.blberza.com
MONTHLY MARKET CAPITALIZATION(US$ millions)
4
3
2
1
0
800
700
600
500
400
300
200
100
0
3,000
2,500
2,000
1,500
1,000
500
0
Stocks
MONTHLY STOCK VOLUME VS INDEX(US$ millions)
Index
Jul JulAug AugSep SepOct OctNov NovDec Dec
2011 STATISTICS
Stocks Bonds Other
Total Volume
(US$ millions)
Average Daily
Volume(US$ millions)
Total Volume(# millions)
Average Daily
Volume(# millions)
Total Volume
(US$ millions)
Average Daily
Volume(US$ millions)
Total Volume(# millions)
Average Daily
Volume(# millions)
Total Volume
(US$ millions)
Average Daily
Volume(US$ millions)
Total Volume(# millions)
Average Daily
Volume(# millions)
Jan-11 2.58 0.16 7.81 0.49 1.56 0.10 3.27 0.20 0.00 0.00 0.00 0.00
Feb-11 3.43 0.17 3.42 0.17 1.14 0.06 0.00 0.00 8.42 0.42 0.00 0.00
Mar-11 18.66 0.81 27.16 1.18 1.50 0.07 4.47 0.19 0.00 0.00 0.00 0.00
Apr-11 2.45 0.13 8.93 0.47 1.54 0.08 4.59 0.24 0.00 0.00 0.00 0.00
May-11 1.31 68.76 5.17 0.27 26.95 1.42 3.35 0.18 0.00 0.00 0.00 0.00
Jun-11 2.29 0.10 60.45 2.75 22.77 1.04 7.58 0.34 0.00 0.00 0.00 0.00
Jul-11 1.79 0.09 6.97 0.33 2.22 0.11 8.23 0.39 0.00 0.00 0.00 0.00
Aug-11 2.05 0.09 4.89 0.21 2.27 0.10 7.69 0.33 0.00 0.00 0.00 0.00
Sep-11 2.22 0.10 6.79 0.31 4.04 0.18 13.79 0.63 0.00 0.00 0.00 0.00
Oct-11 2.88 0.14 7.95 0.38 0.83 0.04 2.58 0.12 0.00 0.00 0.00 0.00
Nov-11 2.24 0.11 63.13 3.01 11.97 0.57 4.42 0.21 0.00 0.00 0.00 0.00
Dec-11 2.82 0.13 8.09 0.37 7.97 0.36 5.40 0.25 0.00 0.00 0.00 0.00
TOTAL 44.72 0.18 210.75 0.85 84.76 0.34 65.39 0.26 8.42 0.03 0.00 0.00
MarketCapitalization(US$ millions) Index
Jan-11 2,506.52 660Feb-11 2,629.99 699Mar-11 2,929.31 798Apr-11 3,110.16 861
May-11 2,963.44 800Jun-11 2,926.17 777Jul-11 2,810.71 720
Aug-11 2,778.30 687Sep-11 2,702.12 657Oct-11 2,686.63 668Nov-11 2,596.19 632Dec-11 2,415.05 582
* Please refer to page 105 for the Bosnia and Herzegovina country report.
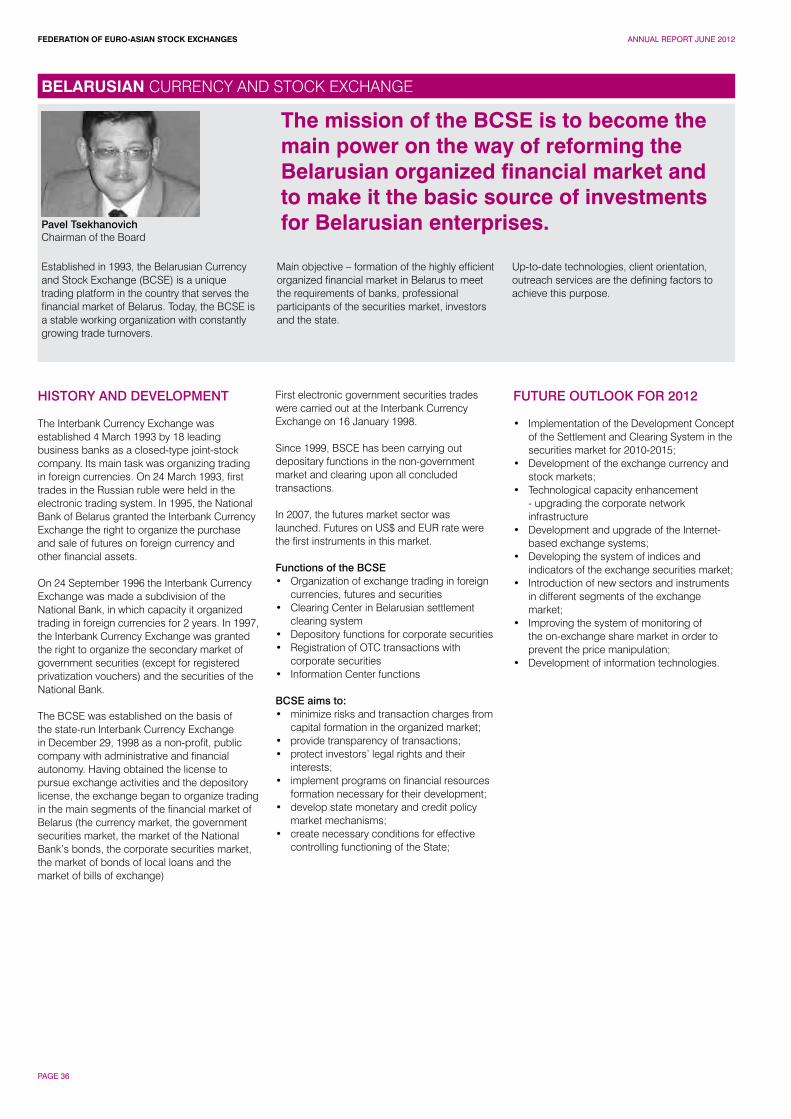
FEDERATION OF EURO-ASIAN STOCK EXCHANGES ANNUAL REPORT JUNE 2012
PAGE 36
Pavel TsekhanovichChairman of the Board
Established in 1993, the Belarusian Currency and Stock Exchange (BCSE) is a unique trading platform in the country that serves the financial market of Belarus. Today, the BCSE is a stable working organization with constantly growing trade turnovers.
Main objective – formation of the highly efficient organized financial market in Belarus to meet the requirements of banks, professional participants of the securities market, investors and the state.
Up-to-date technologies, client orientation, outreach services are the defining factors to achieve this purpose.
HISTORY AND DEVELOPMENT
The Interbank Currency Exchange was established 4 March 1993 by 18 leading business banks as a closed-type joint-stock company. Its main task was organizing trading in foreign currencies. On 24 March 1993, firsttrades in the Russian ruble were held in the electronic trading system. In 1995, the National Bank of Belarus granted the Interbank Currency Exchange the right to organize the purchase and sale of futures on foreign currency and other financial assets.
On 24 September 1996 the Interbank Currency Exchange was made a subdivision of the National Bank, in which capacity it organized trading in foreign currencies for 2 years. In 1997, the Interbank Currency Exchange was granted the right to organize the secondary market of government securities (except for registered privatization vouchers) and the securities of the National Bank.
The BCSE was established on the basis of the state-run Interbank Currency Exchange in December 29, 1998 as a non-profit, public company with administrative and financial autonomy. Having obtained the license to pursue exchange activities and the depository license, the exchange began to organize trading in the main segments of the financial market of Belarus (the currency market, the government securities market, the market of the National Bank’s bonds, the corporate securities market, the market of bonds of local loans and the market of bills of exchange)
First electronic government securities trades were carried out at the Interbank Currency Exchange on 16 January 1998.
Since 1999, BSCE has been carrying out depositary functions in the non-government market and clearing upon all concluded transactions.
In 2007, the futures market sector was launched. Futures on US$ and EUR rate were the first instruments in this market.
Functions of the BCSE• Organization of exchange trading in foreign
currencies, futures and securities• Clearing Center in Belarusian settlement
clearing system• Depository functions for corporate securities• Registration of OTC transactions with
corporate securities• Information Center functions
BCSE aims to:• minimize risks and transaction charges from
capital formation in the organized market;• provide transparency of transactions;• protect investors’ legal rights and their
interests;• implement programs on financial resources
formation necessary for their development;• develop state monetary and credit policy
market mechanisms;• create necessary conditions for effective
controlling functioning of the State;
FUTURE OUTLOOK FOR 2012
• Implementation of the Development Concept of the Settlement and Clearing System in the securities market for 2010-2015;
• Development of the exchange currency and stock markets;
• Technological capacity enhancement - upgrading the corporate network infrastructure
• Development and upgrade of the Internet-based exchange systems;
• Developing the system of indices and indicators of the exchange securities market;
• Introduction of new sectors and instruments in different segments of the exchange market;
• Improving the system of monitoring of the on-exchange share market in order to prevent the price manipulation;
• Development of information technologies.
The mission of the BCSE is to become the main power on the way of reforming the Belarusian organized financial market and to make it the basic source of investments for Belarusian enterprises.
BELARUSIAN CURRENCY AND STOCK EXCHANGE
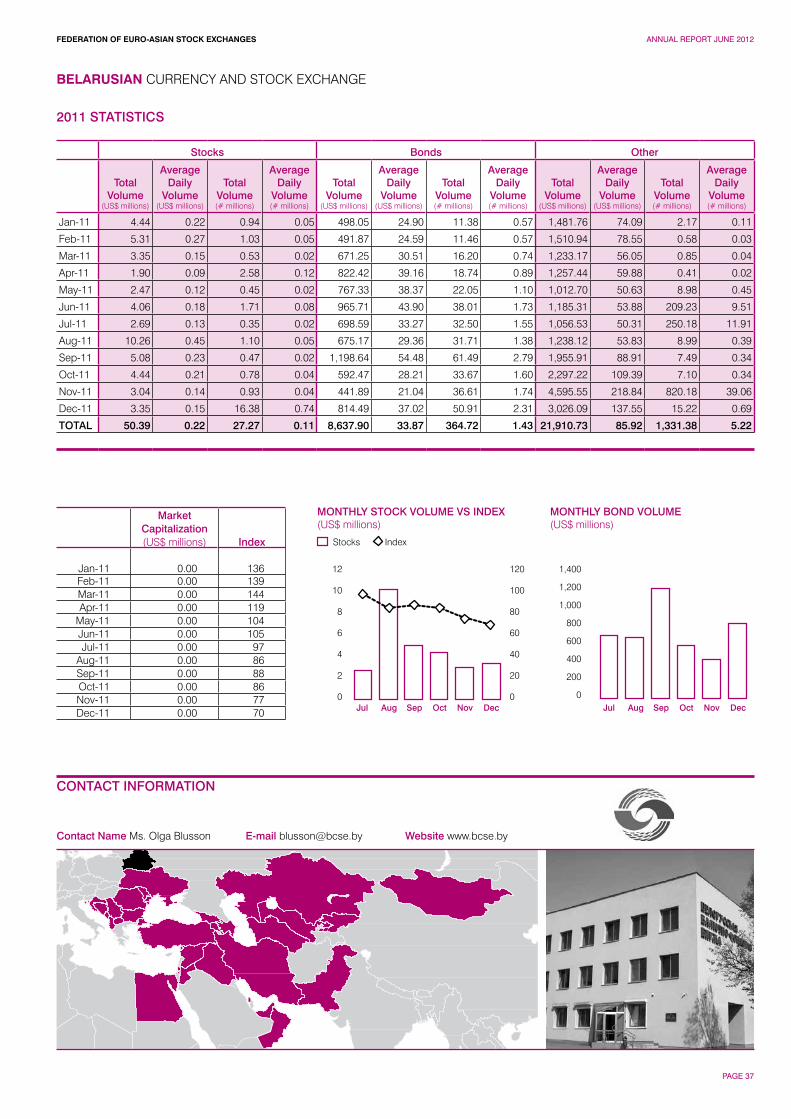
FEDERATION OF EURO-ASIAN STOCK EXCHANGES ANNUAL REPORT JUNE 2012
PAGE 37
BELARUSIAN CURRENCY AND STOCK EXCHANGE
CONTACT INFORMATION
Contact Name Ms. Olga Blusson E-mail [email protected] Website www.bcse.by
MONTHLY BOND VOLUME(US$ millions)
12
10
8
6
4
2
0
120
100
80
60
40
20
0
1,400
1,200
1,000
800
600
400
200
0
Stocks
MONTHLY STOCK VOLUME VS INDEX(US$ millions)
Index
Jul JulAug AugSep SepOct OctNov NovDec Dec
2011 STATISTICS
Stocks Bonds Other
Total Volume
(US$ millions)
Average Daily
Volume(US$ millions)
Total Volume(# millions)
Average Daily
Volume(# millions)
Total Volume
(US$ millions)
Average Daily
Volume(US$ millions)
Total Volume(# millions)
Average Daily
Volume(# millions)
Total Volume
(US$ millions)
Average Daily
Volume(US$ millions)
Total Volume(# millions)
Average Daily
Volume(# millions)
Jan-11 4.44 0.22 0.94 0.05 498.05 24.90 11.38 0.57 1,481.76 74.09 2.17 0.11
Feb-11 5.31 0.27 1.03 0.05 491.87 24.59 11.46 0.57 1,510.94 78.55 0.58 0.03
Mar-11 3.35 0.15 0.53 0.02 671.25 30.51 16.20 0.74 1,233.17 56.05 0.85 0.04
Apr-11 1.90 0.09 2.58 0.12 822.42 39.16 18.74 0.89 1,257.44 59.88 0.41 0.02
May-11 2.47 0.12 0.45 0.02 767.33 38.37 22.05 1.10 1,012.70 50.63 8.98 0.45
Jun-11 4.06 0.18 1.71 0.08 965.71 43.90 38.01 1.73 1,185.31 53.88 209.23 9.51
Jul-11 2.69 0.13 0.35 0.02 698.59 33.27 32.50 1.55 1,056.53 50.31 250.18 11.91
Aug-11 10.26 0.45 1.10 0.05 675.17 29.36 31.71 1.38 1,238.12 53.83 8.99 0.39
Sep-11 5.08 0.23 0.47 0.02 1,198.64 54.48 61.49 2.79 1,955.91 88.91 7.49 0.34
Oct-11 4.44 0.21 0.78 0.04 592.47 28.21 33.67 1.60 2,297.22 109.39 7.10 0.34
Nov-11 3.04 0.14 0.93 0.04 441.89 21.04 36.61 1.74 4,595.55 218.84 820.18 39.06
Dec-11 3.35 0.15 16.38 0.74 814.49 37.02 50.91 2.31 3,026.09 137.55 15.22 0.69
TOTAL 50.39 0.22 27.27 0.11 8,637.90 33.87 364.72 1.43 21,910.73 85.92 1,331.38 5.22
MarketCapitalization(US$ millions) Index
Jan-11 0.00 136Feb-11 0.00 139Mar-11 0.00 144Apr-11 0.00 119
May-11 0.00 104Jun-11 0.00 105Jul-11 0.00 97
Aug-11 0.00 86Sep-11 0.00 88Oct-11 0.00 86Nov-11 0.00 77Dec-11 0.00 70
FEDERATION OF EURO-ASIAN STOCK EXCHANGES ANNUAL REPORT JUNE 2012
PAGE 38
KEY SOLUTIONS OF THE GOVERNMENT ON THE SECURITIES MARKET DEVELOPMENT
• Tax liberalization for operations in bonds;• Simplification of bond issue procedure;• Introduction of on-exchange bonds as a
separate type of bonds;• Cancellation of the moratorium on free
circulation of stocks;• Transition to exchange market circulation for
all stocks of open joint-stock companies;• Municipal bond market formation
BCSE ACTIVITY TODAY
Since the first days of its formation (December 1998), the Belarusian Currency and Stock Exchange has been participating in the technological development of the stock market, improving its regulatory framework and involving a wide range of financial assets in the exchange turnover.
Today the BCSE is the only trading floor in the republic serving as a basis for a nationwide trade system in all major segments of the financial market: currency, stock and futures. Except for the organization of trading, the BCSE functions as the settlement and clearing system operator, provides information and depository services, electronic document services, registration of OTC transactions in securities.Currently, the trading floor is widely used not only by banks and broker and dealer companies, but also by the government in performing its essential economic functions, including: • privatization transactions carried out by the
State Property Committee; • establishment of the official exchange rate
of Belarusian ruble to the Russian ruble and US dollar by the National Bank upon trading totals in foreign currency;
• transactions in stock market securities concluded by the National Bank in order to regulate bank liquidity through direct and reverse REPO auctions;
• financing state budget deficits by the Ministry of Finance through primary placement of government securities at the BCSE.
The instruments traded in the currency exchange market includes 23 currencies, including USD, RUB, EUR, UAH, AUD, GBP, DKK, ISK, CAD, LVL, LTL, NOK, PLN, SEK, CHF, EEK, JPY. Total annual 2011 volume of the exchange trades in foreign currencies amounted to USD 17.0 billion.
Currency futures on the U.S. dollar, Euro, Russian ruble rates, Euro to U.S. dollar rate set by the European Central Bank, as well as futures on the coupon yield of government securities - are the instruments circulating in the futures market segment. Annual 2011 volume of the exchange trades in futures amounted to USD 8.6 million.
Annual 2011 volume of transactions in securities of all types amounted to USD 8.7 billion, including USD 6964.1 million of Government bonds market volume, USD 1673.7 million of corporate bonds market volume, and USD 50.4 million of shares market volume.
The range of securities traded at the BCSE covers government bonds of the Ministry of Finance, short-term bonds of the National Bank, mortgage, investment, exchange-traded bonds and stocks.
Annual 2011 volume of purchase and sale OTC transactions amounted to USD 4.8 billion.
All the business processes associated with trades organization, settlement and clearing services, depository activities, quotation support, transactions registration in the OTC market, and information services, are fully automated, starting from submission of a bid to the trading system from a remote terminal of the trade participant and ending with signing a protocol upon trading results with the use of cryptographic information protection within the System of Electronic Documents (SED)Continuity of exchange activities is achieved by using a disaster-resistant architecture that implies usage of two computer centers: primary and backup. The access to the BCSE program complex can be provided by allocated circuits and the Internet. Hard- and software system of the BCSE has a multistage protection system to prevent external entry and damage to the BCSE and trade participants.• The software complex of the BCSE includes
the following elements: • three separate electronic trading systems
(for the currency, stock and futures markets); • clearing and depository complex; • system of electronic documents and digital
signature; • 4 electronic information systems.
Recently, the BCSE has implemented various trading mechanisms and settlement options, which are combined to provide the best possible circulation mode of the financial assets. In particular, the BCSE offers 10 modes of exchange trading, and 4 settlement codes, including the classic double auctions modes, REPO transactions, American and Dutch auctions, etc.
An important element in the protection of investors’ interests is building a robust settlement and clearing system which provides high speed and ensures transaction execution. This is exactly the system the BCSE offers its clients. The settlement bank in all segments of the exchange market is the National Bank, which also acts as the guarantor of transactions execution in the currency market by assuming the liabilities of insolvent participants. The settlement depository is the Republican Central Securities Depository. The BCSE is the operator of the clearing and settlement system, and it coordinates the interaction between all its elements. Clearing is carried out through multilateral netting. A 100-percent pre-deposit of funds is used to prevent risks. Such settlement and clearing system unifies all settlements, secures the DVP principle, enables to carry out settlements on the day of transaction and ensures efficient use of investors’ funds.
Except for organizing trades in the stock market, the BCSE registers transactions in all types of securities concluded in the OTC market. The registration is performed in automated mode using the electronic system IQS “The OTC Market”. Combining the functions of trade organization and OTC transactions registration, the BCSE disposes a unique database on the history of circulation for all securities issued in Belarus.
The BCSE renders a wide range of information services targeted at different customer categories - from individual investors to large companies, operating in the Belarusian financial market - by means of accumulating and processing the information on the state, conditions and development trends of the financial market of the republic.
BELARUSIAN CURRENCY AND STOCK EXCHANGE
Key Information ContactsOfficial Website of Belarus www.belarus.by/en/ President of Belarus www.president.gov.by/en/ Ministry of Economy www.economy.gov.by/en/Ministry of Foreign Affaires www.mfa.gov.by/eng / National Investment Agency /www.invest.belarus.by/en/ Belarusian Telegraph Agency (National Source of News) www.belta.by/en/
CAPITAL MARKET DEVELOPMENT AND ECONOMIC OUTLOOK
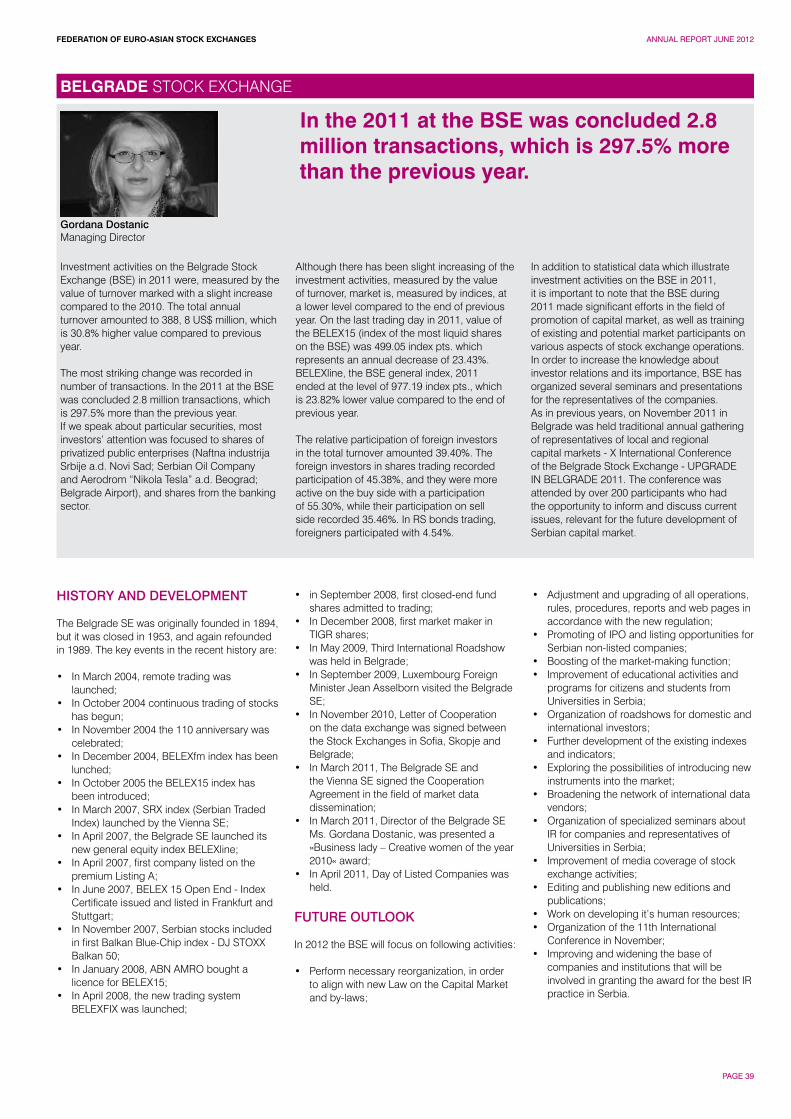
FEDERATION OF EURO-ASIAN STOCK EXCHANGES ANNUAL REPORT JUNE 2012
PAGE 39
Gordana DostanicManaging Director
Investment activities on the Belgrade Stock Exchange (BSE) in 2011 were, measured by the value of turnover marked with a slight increase compared to the 2010. The total annual turnover amounted to 388, 8 US$ million, which is 30.8% higher value compared to previous year.
The most striking change was recorded in number of transactions. In the 2011 at the BSE was concluded 2.8 million transactions, which is 297.5% more than the previous year. If we speak about particular securities, most investors’ attention was focused to shares of privatized public enterprises (Naftna industrija Srbije a.d. Novi Sad; Serbian Oil Company and Aerodrom “Nikola Tesla” a.d. Beograd; Belgrade Airport), and shares from the banking sector.
Although there has been slight increasing of the investment activities, measured by the value of turnover, market is, measured by indices, at a lower level compared to the end of previous year. On the last trading day in 2011, value of the BELEX15 (index of the most liquid shares on the BSE) was 499.05 index pts. which represents an annual decrease of 23.43%. BELEXline, the BSE general index, 2011 ended at the level of 977.19 index pts., which is 23.82% lower value compared to the end of previous year.
The relative participation of foreign investors in the total turnover amounted 39.40%. The foreign investors in shares trading recorded participation of 45.38%, and they were more active on the buy side with a participation of 55.30%, while their participation on sell side recorded 35.46%. In RS bonds trading, foreigners participated with 4.54%.
In addition to statistical data which illustrate investment activities on the BSE in 2011, it is important to note that the BSE during 2011 made significant efforts in the field of promotion of capital market, as well as training of existing and potential market participants on various aspects of stock exchange operations. In order to increase the knowledge about investor relations and its importance, BSE has organized several seminars and presentations for the representatives of the companies. As in previous years, on November 2011 in Belgrade was held traditional annual gathering of representatives of local and regional capital markets - X International Conference of the Belgrade Stock Exchange - UPGRADE IN BELGRADE 2011. The conference was attended by over 200 participants who had the opportunity to inform and discuss current issues, relevant for the future development of Serbian capital market.
In the 2011 at the BSE was concluded 2.8 million transactions, which is 297.5% more than the previous year.
BELGRADE STOCK EXCHANGE
HISTORY AND DEVELOPMENT
The Belgrade SE was originally founded in 1894, but it was closed in 1953, and again refounded in 1989. The key events in the recent history are:
• In March 2004, remote trading was launched;
• In October 2004 continuous trading of stocks has begun;
• In November 2004 the 110 anniversary was celebrated;
• In December 2004, BELEXfm index has been lunched;
• In October 2005 the BELEX15 index has been introduced;
• In March 2007, SRX index (Serbian Traded Index) launched by the Vienna SE;
• In April 2007, the Belgrade SE launched its new general equity index BELEXline;
• In April 2007, first company listed on the premium Listing A;
• In June 2007, BELEX 15 Open End - Index Certificate issued and listed in Frankfurt and Stuttgart;
• In November 2007, Serbian stocks included in first Balkan Blue-Chip index - DJ STOXX Balkan 50;
• In January 2008, ABN AMRO bought a licence for BELEX15;
• In April 2008, the new trading system BELEXFIX was launched;
• in September 2008, first closed-end fund shares admitted to trading;
• In December 2008, first market maker in TIGR shares;
• In May 2009, Third International Roadshow was held in Belgrade;
• In September 2009, Luxembourg Foreign Minister Jean Asselborn visited the Belgrade SE;
• In November 2010, Letter of Cooperation on the data exchange was signed between the Stock Exchanges in Sofia, Skopje and Belgrade;
• In March 2011, The Belgrade SE and the Vienna SE signed the Cooperation Agreement in the field of market data dissemination;
• In March 2011, Director of the Belgrade SE Ms. Gordana Dostanic, was presented a »Business lady – Creative women of the year 2010« award;
• In April 2011, Day of Listed Companies was held.
FUTURE OUTLOOK
In 2012 the BSE will focus on following activities:
• Perform necessary reorganization, in order to align with new Law on the Capital Market and by-laws;
• Adjustment and upgrading of all operations, rules, procedures, reports and web pages in accordance with the new regulation;
• Promoting of IPO and listing opportunities for Serbian non-listed companies;
• Boosting of the market-making function;• Improvement of educational activities and
programs for citizens and students from Universities in Serbia;
• Organization of roadshows for domestic and international investors;
• Further development of the existing indexes and indicators;
• Exploring the possibilities of introducing new instruments into the market;
• Broadening the network of international data vendors;
• Organization of specialized seminars about IR for companies and representatives of Universities in Serbia;
• Improvement of media coverage of stock exchange activities;
• Editing and publishing new editions and publications;
• Work on developing it’s human resources;• Organization of the 11th International
Conference in November;• Improving and widening the base of
companies and institutions that will be involved in granting the award for the best IR practice in Serbia.
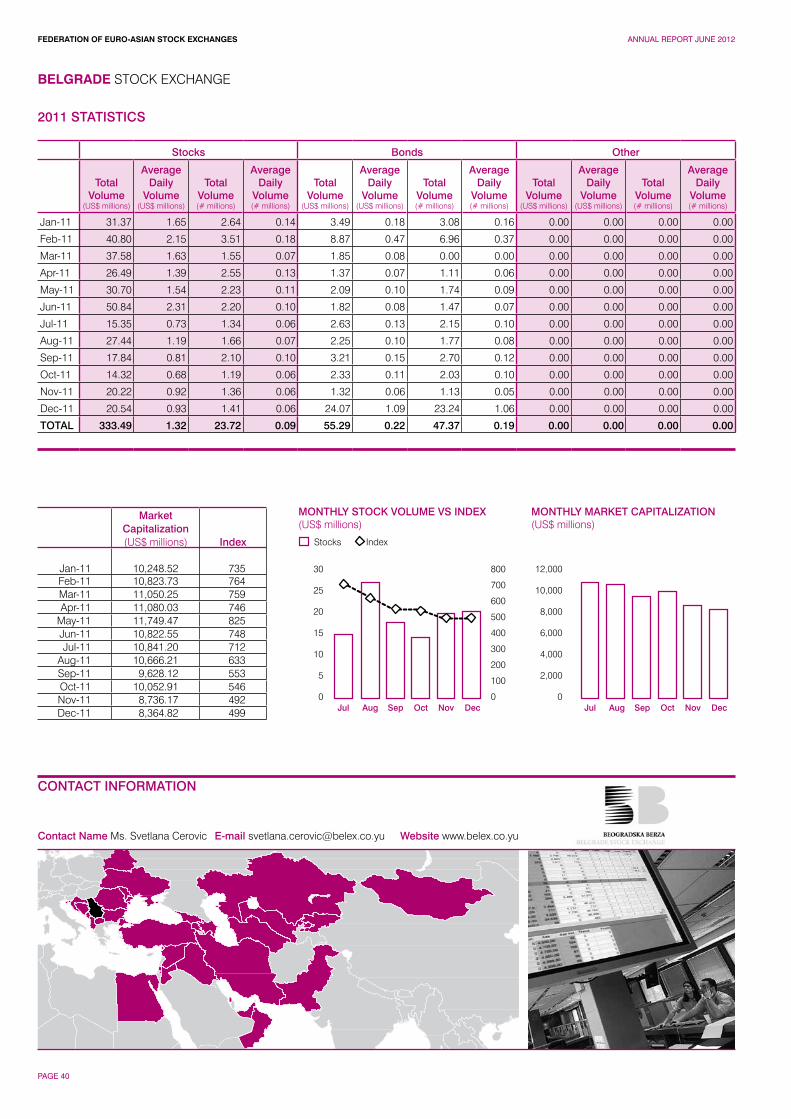
FEDERATION OF EURO-ASIAN STOCK EXCHANGES ANNUAL REPORT JUNE 2012
PAGE 40
BELGRADE STOCK EXCHANGE
CONTACT INFORMATION
Contact Name Ms. Svetlana Cerovic E-mail [email protected] Website www.belex.co.yu
MONTHLY MARKET CAPITALIZATION(US$ millions)
30
25
20
15
10
5
0
800
700
600
500
400
300
200
100
0
12,000
10,000
8,000
6,000
4,000
2,000
0
Stocks
MONTHLY STOCK VOLUME VS INDEX(US$ millions)
Index
Jul JulAug AugSep SepOct OctNov NovDec Dec
2011 STATISTICS
Stocks Bonds Other
Total Volume
(US$ millions)
Average Daily
Volume(US$ millions)
Total Volume(# millions)
Average Daily
Volume(# millions)
Total Volume
(US$ millions)
Average Daily
Volume(US$ millions)
Total Volume(# millions)
Average Daily
Volume(# millions)
Total Volume
(US$ millions)
Average Daily
Volume(US$ millions)
Total Volume(# millions)
Average Daily
Volume(# millions)
Jan-11 31.37 1.65 2.64 0.14 3.49 0.18 3.08 0.16 0.00 0.00 0.00 0.00
Feb-11 40.80 2.15 3.51 0.18 8.87 0.47 6.96 0.37 0.00 0.00 0.00 0.00
Mar-11 37.58 1.63 1.55 0.07 1.85 0.08 0.00 0.00 0.00 0.00 0.00 0.00
Apr-11 26.49 1.39 2.55 0.13 1.37 0.07 1.11 0.06 0.00 0.00 0.00 0.00
May-11 30.70 1.54 2.23 0.11 2.09 0.10 1.74 0.09 0.00 0.00 0.00 0.00
Jun-11 50.84 2.31 2.20 0.10 1.82 0.08 1.47 0.07 0.00 0.00 0.00 0.00
Jul-11 15.35 0.73 1.34 0.06 2.63 0.13 2.15 0.10 0.00 0.00 0.00 0.00
Aug-11 27.44 1.19 1.66 0.07 2.25 0.10 1.77 0.08 0.00 0.00 0.00 0.00
Sep-11 17.84 0.81 2.10 0.10 3.21 0.15 2.70 0.12 0.00 0.00 0.00 0.00
Oct-11 14.32 0.68 1.19 0.06 2.33 0.11 2.03 0.10 0.00 0.00 0.00 0.00
Nov-11 20.22 0.92 1.36 0.06 1.32 0.06 1.13 0.05 0.00 0.00 0.00 0.00
Dec-11 20.54 0.93 1.41 0.06 24.07 1.09 23.24 1.06 0.00 0.00 0.00 0.00
TOTAL 333.49 1.32 23.72 0.09 55.29 0.22 47.37 0.19 0.00 0.00 0.00 0.00
MarketCapitalization(US$ millions) Index
Jan-11 10,248.52 735Feb-11 10,823.73 764Mar-11 11,050.25 759Apr-11 11,080.03 746
May-11 11,749.47 825Jun-11 10,822.55 748Jul-11 10,841.20 712
Aug-11 10,666.21 633Sep-11 9,628.12 553Oct-11 10,052.91 546Nov-11 8,736.17 492Dec-11 8,364.82 499
FEDERATION OF EURO-ASIAN STOCK EXCHANGES ANNUAL REPORT JUNE 2012
PAGE 41
Serbia has persisted in its commitment to move towards the EU membership. The country, however, still faces a number of domestic and international challenges which include slow progress of the reform process while mitigating the effect of the global and euro zone economic crisis in Serbia, taking the necessary steps to combat corruption and taking responsible attitude when dealing with the situation in Kosovo, by pursuing all peaceful, political, and diplomatic means to retain Kosovo. In 2011 Serbia continued with its policy of accessing the EU and has begun to implement a broad reform agenda to advance the government’s EU integration goals. The European Commission issued its opinion on Serbia on October 12, 2011 recommending that Serbia be granted formal EU candidate status.
While considerable efforts have been made in transforming the economy over the past years, the pace of reforms slowed down in the wake of the recession. A number of structural rigidities persist, restraining the country’s capacity to create a viable market economy and a business-friendly environment. The privatization and/or liquidation of public enterprises process has been ongoing since 2001. Privatization of the socially-owned companies continued in the wake of the recent crisis but at a slower pace given unfavorable market conditions.
New Law on Capital market was passed and came into effect in November 2011. It is aimed at increasing investor protection, downsizing systemic risk and enhancing market liberalization. New Law on Companies followed, to harmonize with the EU Directives, latest solutions from the comparable laws and with the new Law on Capital Market, as well to remove restrictions from the process of incorporation of companies, foremost to enhance legal framework of Serbia.
The estimations for Q4 2011 show that real y-o-y GDP growth at last year’s prices was only 0.8%. Taking that into account, real gross GDP growth in 2011 equaled 1.9%. Trade flows and manufacturing succumbed to spillover effects from the worsening euro zone crisis. Since the EU crisis, macroeconomic stability has been broadly maintained, although the economy has been hit by the downturn.
In December 2011, industrial production declined by 0.5% relative to November, posting only a 0.1% increase y-o-y. In the period Jan-Dec 2011, relative to the same period 2010, industrial production increased by 2.1%. Broken down by sector, a y-o-y growth in December was recorded for mining (19%), electricity, gas, steam and air-conditioning supply (14.2%), while manufacturing contracted by 4.8%.
According to seasonally adjusted data, manufacturing increased in December by 0.2%. Within manufacturing, the largest positive contribution to total production came from the production of basic pharmaceutical products and preparations and coke and petroleum products. Conversely, the greatest negative contribution to total industry was provided by the production of food, chemicals and chemical products and base metals.
Retail trade turnover in 2011, compared to 2010 decreased by 7.3% at current prices and by 16.7% at constant prices.
In 2011 the value of exports, expressed in Euros, went up by 14.1%, while imports rose by 14.5%.
Number of employees in 2011 year is lower than the previous year by 2.8%. Number of male employees decreased 4.6% and the number of employed women by 0.5%.
The average net salaries and wages paid in the period Jan-Dec 2011 in the Republic of Serbia, compared to the average net salaries and wages paid in the period Jan - Dec 2010, were by 11.2% increased in nominal terms and by 0.2% increased in real terms.
At end-2011, inflation came close to the upper bound of the target (6%), settling at 7% year-on-year. Despite exhibiting high short-term volatility, overall in 2011, the exchange rate of the dinar was relatively stable with minimum intervention by the NBS (net sale of EUR 45 mln).
Source: NBS, Statistical Office of the Republic of Serbia
BELGRADE STOCK EXCHANGE
Key Information ContactsNational Bank of Serbia www.nbs.rsSecurities and Exchange Commission www.sec.gov.rsCentral Securities Depository and Clearing House www.crhov.rs Ministry of Economy and Regional Development www.merr.gov.rs
2011 ECONOMIC DEVELOPMENTS
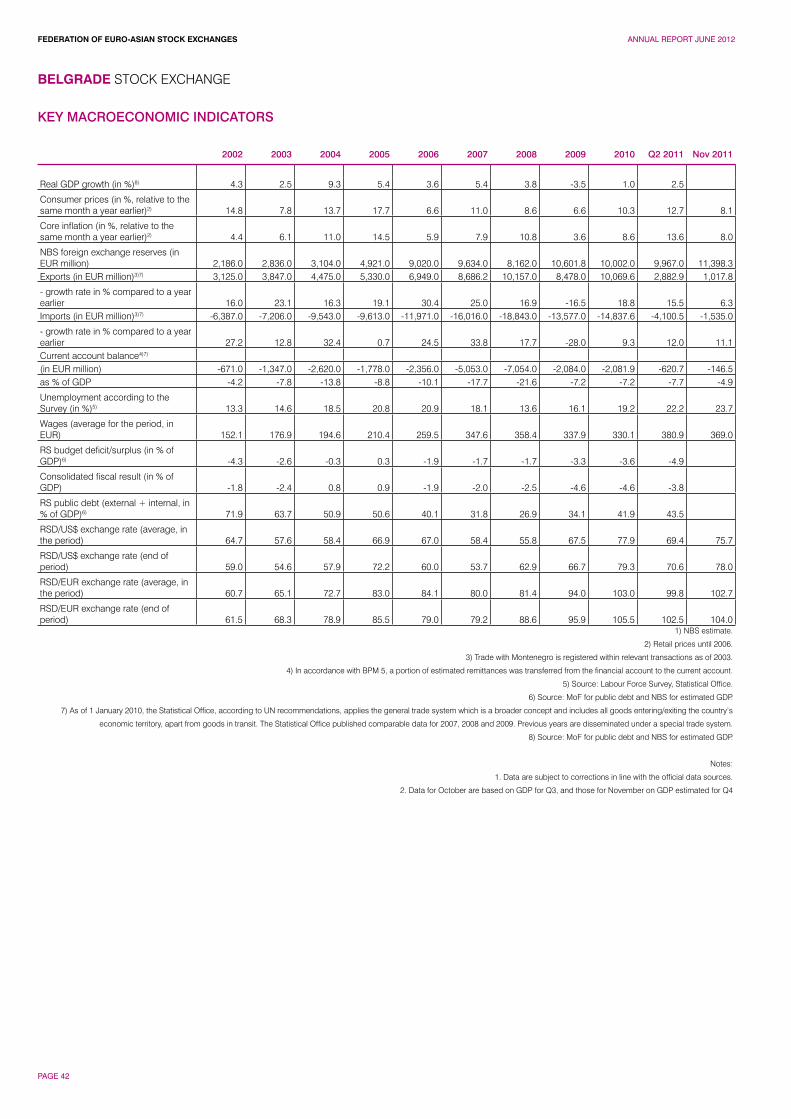
FEDERATION OF EURO-ASIAN STOCK EXCHANGES ANNUAL REPORT JUNE 2012
PAGE 42
BELGRADE STOCK EXCHANGE
KEY MACROECONOMIC INDICATORS
2002 2003 2004 2005 2006 2007 2008 2009 2010 Q2 2011 Nov 2011
Real GDP growth (in %)8) 4.3 2.5 9.3 5.4 3.6 5.4 3.8 -3.5 1.0 2.5
Consumer prices (in %, relative to the same month a year earlier)2) 14.8 7.8 13.7 17.7 6.6 11.0 8.6 6.6 10.3 12.7 8.1
Core inflation (in %, relative to the same month a year earlier)2) 4.4 6.1 11.0 14.5 5.9 7.9 10.8 3.6 8.6 13.6 8.0
NBS foreign exchange reserves (in EUR million) 2,186.0 2,836.0 3,104.0 4,921.0 9,020.0 9,634.0 8,162.0 10,601.8 10,002.0 9,967.0 11,398.3Exports (in EUR million)3)7) 3,125.0 3,847.0 4,475.0 5,330.0 6,949.0 8,686.2 10,157.0 8,478.0 10,069.6 2,882.9 1,017.8
- growth rate in % compared to a year earlier 16.0 23.1 16.3 19.1 30.4 25.0 16.9 -16.5 18.8 15.5 6.3Imports (in EUR million)3)7) -6,387.0 -7,206.0 -9,543.0 -9,613.0 -11,971.0 -16,016.0 -18,843.0 -13,577.0 -14,837.6 -4,100.5 -1,535.0
- growth rate in % compared to a year earlier 27.2 12.8 32.4 0.7 24.5 33.8 17.7 -28.0 9.3 12.0 11.1Current account balance4)7)
(in EUR million) -671.0 -1,347.0 -2,620.0 -1,778.0 -2,356.0 -5,053.0 -7,054.0 -2,084.0 -2,081.9 -620.7 -146.5as % of GDP -4.2 -7.8 -13.8 -8.8 -10.1 -17.7 -21.6 -7.2 -7.2 -7.7 -4.9
Unemployment according to the Survey (in %)5) 13.3 14.6 18.5 20.8 20.9 18.1 13.6 16.1 19.2 22.2 23.7
Wages (average for the period, in EUR) 152.1 176.9 194.6 210.4 259.5 347.6 358.4 337.9 330.1 380.9 369.0
RS budget deficit/surplus (in % of GDP)6) -4.3 -2.6 -0.3 0.3 -1.9 -1.7 -1.7 -3.3 -3.6 -4.9
Consolidated fiscal result (in % of GDP) -1.8 -2.4 0.8 0.9 -1.9 -2.0 -2.5 -4.6 -4.6 -3.8
RS public debt (external + internal, in % of GDP)6) 71.9 63.7 50.9 50.6 40.1 31.8 26.9 34.1 41.9 43.5
RSD/US$ exchange rate (average, in the period) 64.7 57.6 58.4 66.9 67.0 58.4 55.8 67.5 77.9 69.4 75.7
RSD/US$ exchange rate (end of period) 59.0 54.6 57.9 72.2 60.0 53.7 62.9 66.7 79.3 70.6 78.0
RSD/EUR exchange rate (average, in the period) 60.7 65.1 72.7 83.0 84.1 80.0 81.4 94.0 103.0 99.8 102.7
RSD/EUR exchange rate (end of period) 61.5 68.3 78.9 85.5 79.0 79.2 88.6 95.9 105.5 102.5 104.0
1) NBS estimate.
2) Retail prices until 2006.
3) Trade with Montenegro is registered within relevant transactions as of 2003.
4) In accordance with BPM 5, a portion of estimated remittances was transferred from the financial account to the current account.
5) Source: Labour Force Survey, Statistical Office.
6) Source: MoF for public debt and NBS for estimated GDP.
7) As of 1 January 2010, the Statistical Office, according to UN recommendations, applies the general trade system which is a broader concept and includes all goods entering/exiting the country’s
economic territory, apart from goods in transit. The Statistical Office published comparable data for 2007, 2008 and 2009. Previous years are disseminated under a special trade system.
8) Source: MoF for public debt and NBS for estimated GDP.
Notes:
1. Data are subject to corrections in line with the official data sources.
2. Data for October are based on GDP for Q3, and those for November on GDP estimated for Q4
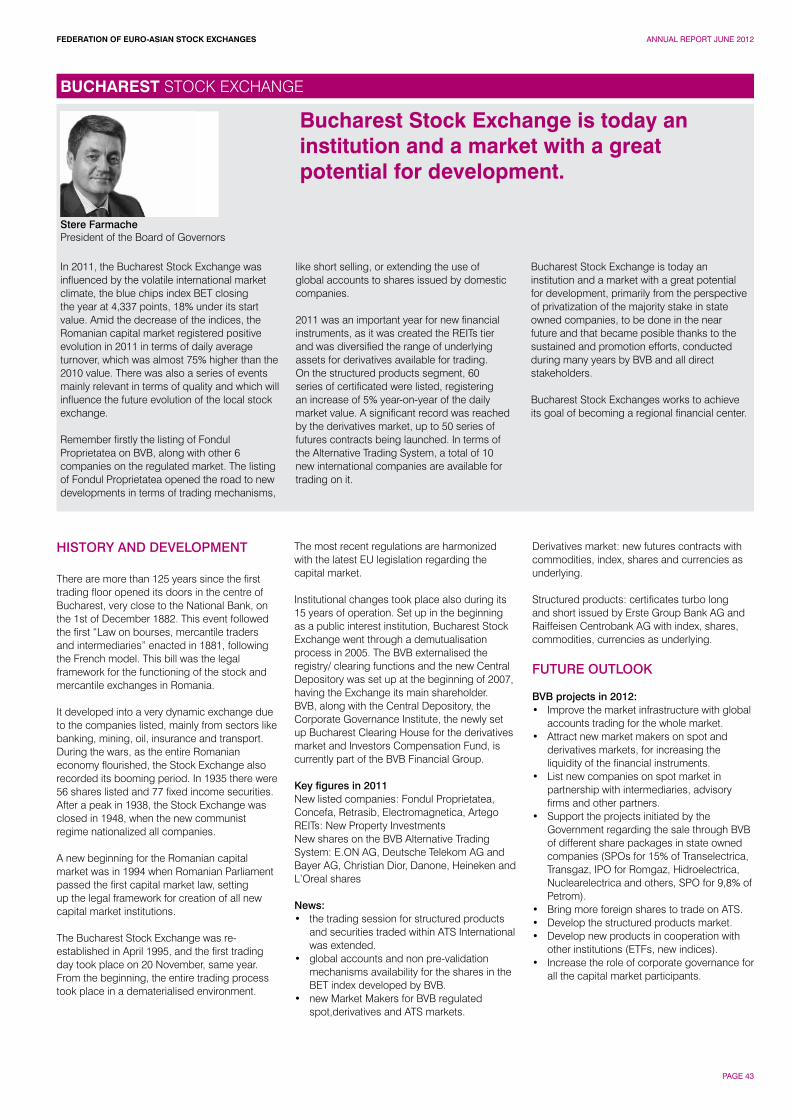
FEDERATION OF EURO-ASIAN STOCK EXCHANGES ANNUAL REPORT JUNE 2012
PAGE 43
Stere FarmachePresident of the Board of Governors
In 2011, the Bucharest Stock Exchange was influenced by the volatile international market climate, the blue chips index BET closing the year at 4,337 points, 18% under its start value. Amid the decrease of the indices, the Romanian capital market registered positive evolution in 2011 in terms of daily average turnover, which was almost 75% higher than the 2010 value. There was also a series of events mainly relevant in terms of quality and which will influence the future evolution of the local stock exchange.
Remember firstly the listing of Fondul Proprietatea on BVB, along with other 6 companies on the regulated market. The listing of Fondul Proprietatea opened the road to new developments in terms of trading mechanisms,
like short selling, or extending the use of global accounts to shares issued by domestic companies.
2011 was an important year for new financial instruments, as it was created the REITs tier and was diversified the range of underlying assets for derivatives available for trading. On the structured products segment, 60 series of certificated were listed, registering an increase of 5% year-on-year of the daily market value. A significant record was reached by the derivatives market, up to 50 series of futures contracts being launched. In terms of the Alternative Trading System, a total of 10 new international companies are available for trading on it.
Bucharest Stock Exchange is today an institution and a market with a great potential for development, primarily from the perspective of privatization of the majority stake in state owned companies, to be done in the near future and that became posible thanks to the sustained and promotion efforts, conducted during many years by BVB and all direct stakeholders.
Bucharest Stock Exchanges works to achieve its goal of becoming a regional financial center.
HISTORY AND DEVELOPMENT
There are more than 125 years since the first trading floor opened its doors in the centre of Bucharest, very close to the National Bank, on the 1st of December 1882. This event followed the first “Law on bourses, mercantile traders and intermediaries” enacted in 1881, following the French model. This bill was the legal framework for the functioning of the stock and mercantile exchanges in Romania.
It developed into a very dynamic exchange due to the companies listed, mainly from sectors like banking, mining, oil, insurance and transport. During the wars, as the entire Romanian economy flourished, the Stock Exchange also recorded its booming period. In 1935 there were 56 shares listed and 77 fixed income securities. After a peak in 1938, the Stock Exchange was closed in 1948, when the new communist regime nationalized all companies.
A new beginning for the Romanian capital market was in 1994 when Romanian Parliament passed the first capital market law, setting up the legal framework for creation of all new capital market institutions.
The Bucharest Stock Exchange was re-established in April 1995, and the first trading day took place on 20 November, same year. From the beginning, the entire trading process took place in a dematerialised environment.
The most recent regulations are harmonized with the latest EU legislation regarding the capital market.
Institutional changes took place also during its 15 years of operation. Set up in the beginning as a public interest institution, Bucharest Stock Exchange went through a demutualisation process in 2005. The BVB externalised the registry/ clearing functions and the new Central Depository was set up at the beginning of 2007, having the Exchange its main shareholder. BVB, along with the Central Depository, the Corporate Governance Institute, the newly set up Bucharest Clearing House for the derivatives market and Investors Compensation Fund, is currently part of the BVB Financial Group.
Key figures in 2011New listed companies: Fondul Proprietatea, Concefa, Retrasib, Electromagnetica, ArtegoREITs: New Property Investments New shares on the BVB Alternative Trading System: E.ON AG, Deutsche Telekom AG and Bayer AG, Christian Dior, Danone, Heineken and L’Oreal shares
News:• the trading session for structured products
and securities traded within ATS International was extended.
• global accounts and non pre-validation mechanisms availability for the shares in the BET index developed by BVB.
• new Market Makers for BVB regulated spot,derivatives and ATS markets.
Derivatives market: new futures contracts with commodities, index, shares and currencies as underlying.
Structured products: certificates turbo long and short issued by Erste Group Bank AG and Raiffeisen Centrobank AG with index, shares, commodities, currencies as underlying.
FUTURE OUTLOOK
BVB projects in 2012:• Improve the market infrastructure with global
accounts trading for the whole market.• Attract new market makers on spot and
derivatives markets, for increasing the liquidity of the financial instruments.
• List new companies on spot market in partnership with intermediaries, advisory firms and other partners.
• Support the projects initiated by the Government regarding the sale through BVB of different share packages in state owned companies (SPOs for 15% of Transelectrica, Transgaz, IPO for Romgaz, Hidroelectrica, Nuclearelectrica and others, SPO for 9,8% of Petrom).
• Bring more foreign shares to trade on ATS. • Develop the structured products market.• Develop new products in cooperation with
other institutions (ETFs, new indices).• Increase the role of corporate governance for
all the capital market participants.
Bucharest Stock Exchange is today an institution and a market with a great potential for development.
BUCHAREST STOCK EXCHANGE
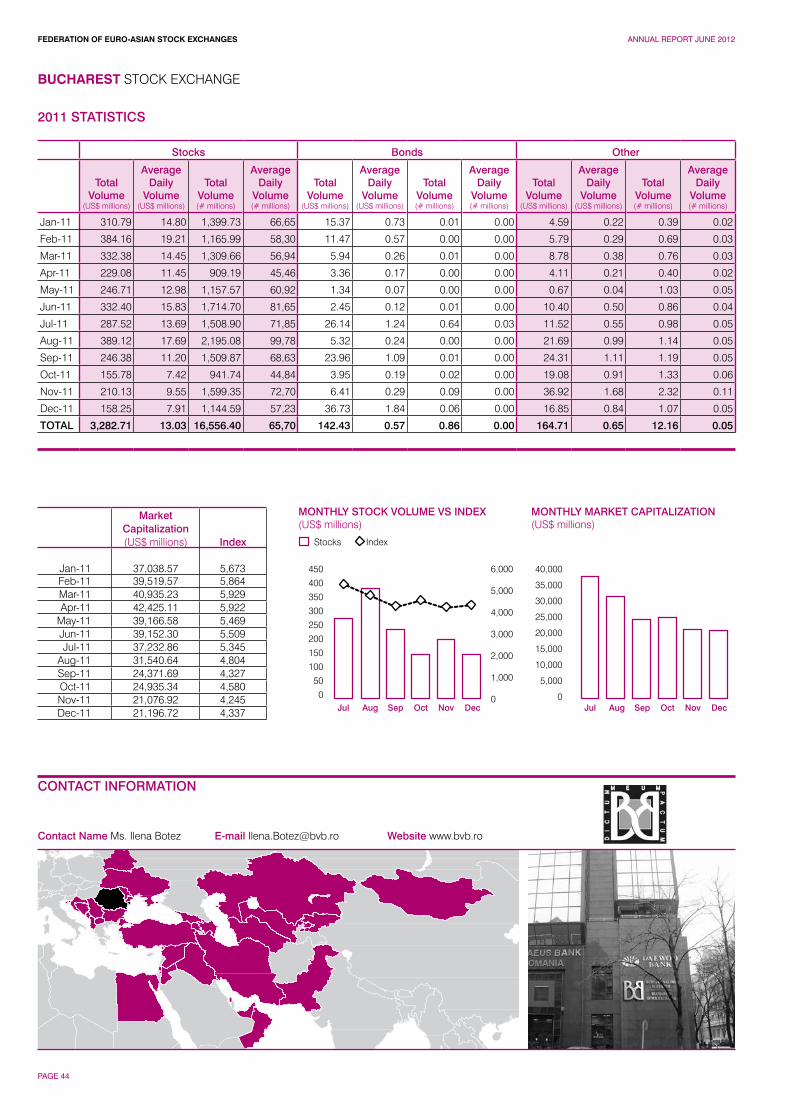
FEDERATION OF EURO-ASIAN STOCK EXCHANGES ANNUAL REPORT JUNE 2012
PAGE 44
BUCHAREST STOCK EXCHANGE
CONTACT INFORMATION
Contact Name Ms. Ilena Botez E-mail [email protected] Website www.bvb.ro
MONTHLY MARKET CAPITALIZATION(US$ millions)
450
400
350
300
250
200
150
100
50
0
6,000
5,000
4,000
3,000
2,000
1,000
0
40,000
35,000
30,000
25,000
20,000
15,000
10,000
5,000
0
Stocks
MONTHLY STOCK VOLUME VS INDEX(US$ millions)
Index
Jul JulAug AugSep SepOct OctNov NovDec Dec
2011 STATISTICS
Stocks Bonds Other
Total Volume
(US$ millions)
Average Daily
Volume(US$ millions)
Total Volume(# millions)
Average Daily
Volume(# millions)
Total Volume
(US$ millions)
Average Daily
Volume(US$ millions)
Total Volume(# millions)
Average Daily
Volume(# millions)
Total Volume
(US$ millions)
Average Daily
Volume(US$ millions)
Total Volume(# millions)
Average Daily
Volume(# millions)
Jan-11 310.79 14.80 1,399.73 66,65 15.37 0.73 0.01 0.00 4.59 0.22 0.39 0.02
Feb-11 384.16 19.21 1,165.99 58,30 11.47 0.57 0.00 0.00 5.79 0.29 0.69 0.03
Mar-11 332.38 14.45 1,309.66 56,94 5.94 0.26 0.01 0.00 8.78 0.38 0.76 0.03
Apr-11 229.08 11.45 909.19 45,46 3.36 0.17 0.00 0.00 4.11 0.21 0.40 0.02
May-11 246.71 12.98 1,157.57 60,92 1.34 0.07 0.00 0.00 0.67 0.04 1.03 0.05
Jun-11 332.40 15.83 1,714.70 81,65 2.45 0.12 0.01 0.00 10.40 0.50 0.86 0.04
Jul-11 287.52 13.69 1,508.90 71,85 26.14 1.24 0.64 0.03 11.52 0.55 0.98 0.05
Aug-11 389.12 17.69 2,195.08 99,78 5.32 0.24 0.00 0.00 21.69 0.99 1.14 0.05
Sep-11 246.38 11.20 1,509.87 68,63 23.96 1.09 0.01 0.00 24.31 1.11 1.19 0.05
Oct-11 155.78 7.42 941.74 44,84 3.95 0.19 0.02 0.00 19.08 0.91 1.33 0.06
Nov-11 210.13 9.55 1,599.35 72,70 6.41 0.29 0.09 0.00 36.92 1.68 2.32 0.11
Dec-11 158.25 7.91 1,144.59 57,23 36.73 1.84 0.06 0.00 16.85 0.84 1.07 0.05
TOTAL 3,282.71 13.03 16,556.40 65,70 142.43 0.57 0.86 0.00 164.71 0.65 12.16 0.05
MarketCapitalization(US$ millions) Index
Jan-11 37,038.57 5,673Feb-11 39,519.57 5,864Mar-11 40,935.23 5,929Apr-11 42,425.11 5,922
May-11 39,166.58 5,469Jun-11 39,152.30 5,509Jul-11 37,232.86 5,345
Aug-11 31,540.64 4,804Sep-11 24,371.69 4,327Oct-11 24,935.34 4,580Nov-11 21,076.92 4,245Dec-11 21,196.72 4,337
FEDERATION OF EURO-ASIAN STOCK EXCHANGES ANNUAL REPORT JUNE 2012
PAGE 45
Economic and Political EnvironmentThe government will continue to face legal challenges from the opposition as it tries to pass laws through parliament by “taking responsibility” for legislation, which prevents laws from being debated, or amended, in parliament. This in effect forces the opposition to call a vote of no confidence, which requires a majority of both chambers of parliament (236 out of 471 potential votes, regardless of the number actually voting) to be successful and overturn the legislation. The government “assumed responsibility” for the draft unitary wage law and the draft law on the public-sector wage bill for 2011 on December 14th. The opposition filed votes of no confidence in the government to oppose the bills, but both attempts to defeat the bills failed.
The unitary wage bill, which establishes a single wage “spine” for all public-sector workers, with jobs graded according to predetermined rules and a maximum differential between the highest and lowest wage, will enable the government to determine the total size of the public-sector wage bill and prevent the payment of arbitrary wages as a form of political patronage. The public-sector wage law for 2011 establishes that public-sector wages will rise by 15% in 2011 compared with their October 2010 level, following the 25% cut in public-sector wages in July, which opposition parties, together with the junior coalition partner, the Hungarian Union of Democrats in Romania (HUDR), had viewed as a temporary measure. Both bills were required under the IMF stand-by agreement.
Economic EnvironmentThe continued build-up of stocks in the third quarter prevented a more substantial fall in GDP than the recorded year-on-year fall of 2.5% (2.2% when adjusted for seasonality and the number of working days). The Economist Intelligence Unit estimates on the basis of data provided by the National Statistical Institute (INSSE) that increases in stocks were equivalent to 5.2% of GDP (unadjusted for seasonality and the number of working days) in the third quarter of 2010, compared with 0.9% in the year-earlier period. Additions to stocks, after adjusting for seasonality and the number of working days, were equivalent to 3.7% of GDP. There was also a modest improvement in net exports, which rose from minus 7.2% of GDP in the second quarter to minus 4.3% in the third quarter on a gross basis, while the trade deficit (including services) improved as a percentage of GDP in each quarter of 2010 (adjusted for seasonality and the number of working days).
Data from the INSSE indicate that gross fixed capital formation (GFCF) grew from the equivalent of 17.1% of GDP in the first quarter to 26.8% of GDP in the third quarter on a gross basis, while consumption fell from 90% of GDP to 72.2% over the same period. However, after adjusting for seasonality and the number of working days, GFCF fell from 25% of GDP in the first quarter to 21.3% in the third quarter, while consumption rose slightly from 79.6% to 80.7%. GFCF (on a gross basis) fell by 13.7% year on year in the third quarter and by 16.1% in the first three quarters.
Sovereign riskStable: Domestic public debt is rising fast, but foreign-exchange reserve coverage is good. The Economist Intelligence Unit expects the authorities to sign a new IMF agreement in early 2011, and Romania should not experience financing difficulties in 2011-12.
Currency riskStable: Estimates of equilibrium exchange rates suggest that the leu is still overvalued, posing problems for competitiveness. Although the leu steadied in the third quarter of 2010, it remains vulnerable to negative market sentiment.
Banking sector riskStable: The risk of contagion from the Greek crisis has receded. However, the wider euro zone crisis remains a cause for concern. Banks face deteriorating asset quality and rising provisioning costs that are squeezing profits.
* The Economist Intelligence Unit, January 10, 2011
Information obtained from the Exchange.
BUCHAREST STOCK EXCHANGE
Key Information ContactsNational Securities Commission www.cnvmr.ro National Bank of Romania www.bnro.roNational Institute of Statistics www.insse.ro Ministry of Public Finance www.mfinante.ro Romanian capital market www.kmarket.roRomanian Asset Management Association www.aaf.ro Private Pension System Supervisory Commission www.csspp.ro
CAPITAL MARKET DEVELOPMENT AND ECONOMIC OUTLOOK
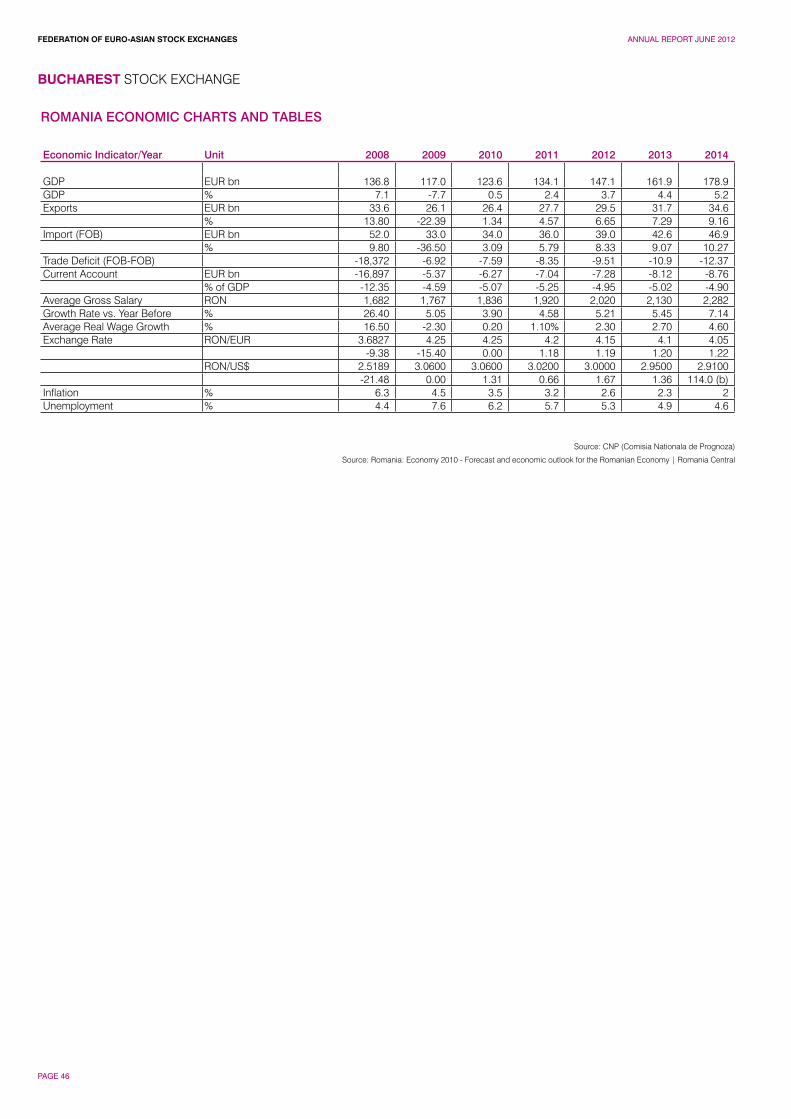
FEDERATION OF EURO-ASIAN STOCK EXCHANGES ANNUAL REPORT JUNE 2012
PAGE 46
BUCHAREST STOCK EXCHANGE
ROMANIA ECONOMIC CHARTS AND TABLES
Economic Indicator/Year Unit 2008 2009 2010 2011 2012 2013 2014
GDP EUR bn 136.8 117.0 123.6 134.1 147.1 161.9 178.9GDP % 7.1 -7.7 0.5 2.4 3.7 4.4 5.2Exports EUR bn 33.6 26.1 26.4 27.7 29.5 31.7 34.6 % 13.80 -22.39 1.34 4.57 6.65 7.29 9.16Import (FOB) EUR bn 52.0 33.0 34.0 36.0 39.0 42.6 46.9 % 9.80 -36.50 3.09 5.79 8.33 9.07 10.27Trade Deficit (FOB-FOB) -18,372 -6.92 -7.59 -8.35 -9.51 -10.9 -12.37Current Account EUR bn -16,897 -5.37 -6.27 -7.04 -7.28 -8.12 -8.76 % of GDP -12.35 -4.59 -5.07 -5.25 -4.95 -5.02 -4.90Average Gross Salary RON 1,682 1,767 1,836 1,920 2,020 2,130 2,282Growth Rate vs. Year Before % 26.40 5.05 3.90 4.58 5.21 5.45 7.14Average Real Wage Growth % 16.50 -2.30 0.20 1.10% 2.30 2.70 4.60Exchange Rate RON/EUR 3.6827 4.25 4.25 4.2 4.15 4.1 4.05 -9.38 -15.40 0.00 1.18 1.19 1.20 1.22 RON/US$ 2.5189 3.0600 3.0600 3.0200 3.0000 2.9500 2.9100 -21.48 0.00 1.31 0.66 1.67 1.36 114.0 (b)Inflation % 6.3 4.5 3.5 3.2 2.6 2.3 2Unemployment % 4.4 7.6 6.2 5.7 5.3 4.9 4.6
Source: CNP (Comisia Nationala de Prognoza)
Source: Romania: Economy 2010 - Forecast and economic outlook for the Romanian Economy | Romania Central
FEDERATION OF EURO-ASIAN STOCK EXCHANGES ANNUAL REPORT JUNE 2012
PAGE 47
Ivan Takev CEO
Due to the turmoil in the global financial markets and the overall economic uncertainty, in 2011 Bulgarian Stock Exchange continued to operate within a very complex business environment. Restoring confidence in the stock market is one of the primary goals of the Exchange; however, it has turned out to be quite a challenging task, although it has to be acknowledged that other factors, like the pace of recovery of the Bulgarian and European economy, also play an important role in improving the overall situation.
Among the measures that are to have a serious impact on the market is the introduction of additional requirements to the companies listed on the highest segment of the BSE, the Premium Market. As of 1st March 2012, all issuers that are traded on the Premium segment shall be obliged to disclose
regulated information to the public in both the Bulgarian and the English languages. Any non-compliance with the disclosure rules is to be sanctioned and the companies will be eventually transferred to the less prestigious market, the Bulgarian Alternative Stock Market (BaSE).
The lack of IPOs and newly listed companies on BSE in the last couple of years, which is due to the stagnant and uncertain economic situation, has not diminished our ambition to attract good performing private companies to the stock market. This is to remain a major goal of ours in 2012, along with the broadening of our investor base and the launch of new financial instruments.
After its successful debut last year as a public company, BSE will be certainly perceived as an attractive partner by foreign exchanges where the 50% controlling government stake in our Exchange will be put up for sale. Negotiations with potential strategic investors are expected to commence this year.
I would like to avail myself of this opportunity to reiterate once again the important role that FEAS plays in promoting regional co-operation. Thanks to the continuous efforts of the Organization, its member exchanges have received invaluable assistance where tackling different issues linked to the development of the stock markets.
HISTORY AND DEVELOPMENT
The first Stock Exchange Act was adopted in 1907 and regulated the structure and operations of stock and commodities exchanges. The Securities, Stock Exchanges & Investment Intermediaries Act was adopted in July 1995, which led to a process of stock exchange consolidation. In July 1997, the present Bulgarian Stock Exchange-Sofia was established. In accordance with the requirements of the new law, a Securities & Stock Exchange Commission was set up.
On 9 October 1997 the Commission officially licensed the BSE-Sofia. The first trading session on the regulated market took place on 21 October 1997. By the end of 1999 there were 32 companies listed on the Official Market and about 1,000 companies admitted for trading on the Free (OTC) Market as a result of the mass privatization program. On 6 December 2001 the Commission officially licensed the BSE-Sofia to organize an Unofficial Market, which replaced the Free Market and set clear rules for regulation of all companies traded on the Exchange.
In December 1999 a new Public Offering of Securities Act was adopted by the Parliament. The law is aimed at providing protection for investors and creating prerequisites for the development of a transparent capital market in Bulgaria with criteria similar to those of the European Union.
The Securities & Stock Exchange Commission was first renamed the National Securities Commission, but in March 2003 it was replaced by a new supervisory body - the Financial Supervision Commission (FSC). More than just a name change, the move pulled together the regulation of a number of financial (non-banking) sectors under one body. The regulatory changes during the year directly improved conditions for investors and issuers, as well as underlined the government’s commitment to encourage wider overall development of the capital markets.
FUTURE OUTLOOK 2012
The Bulgarian capital market has been suffering from very low investors’ activity since the start of the crisis, which naturally results in low overall liquidity. The outflow of foreign investors marked the start of the crisis and their return perhaps will mark the turning point in the recovery. The overall stock market performance remained weak throughout the year and far under the levels of the pre-crisis period.
The year ended with the successful privatization of the 33% state-owned stake in the electricity distribution company EVN through the Bulgarian Stock Exchange. The sale of the state–owned stakes in the other two electricity distribution companies, E.ON and CEZ, and their listing on the Exchange are expected to be finalised by end-June of the current year.
Improvement in the corporate governance quality of local public companies will be among the main priorities of BSE-Sofia in 2012. Recent changes in the Exchange rules set additional requirements to the companies listed on the highest Exchange segment, Premium. Effective as from March 1 all Premium companies will be obliged to disclose regulated information to the public, both in Bulgarian and English. In addition, issuers that do not disclose regulated information according to the terms specified will be periodically transferred to the Bulgarian Alternative Stock Market, BaSE.
Further efforts will also be put into attracting new issuers and investors, as well as introducing new financial instruments. All these are ongoing commitments by the BSE-Sofia management that are laid out in the 2-year BSE-Sofia development strategy till the end of 2012. In addition, negotiations are expected to start with potential strategic partners that are interested in acquiring the 50% controlling government stake in the Bulgarian Stock Exchange. Bulgarian Stock Exchange has always put significant efforts to develop the regional co-operation among stock exchanges in Southeast Europe. In 2012 the Exchange will continue to promote new forms of interaction and common initiatives with the neighboring exchanges that will make the regional market more visible on the global investment map.
After its successful debut last year as a public company, BSE will be certainly perceived as an attractive partner by foreign exchanges.
BULGARIAN STOCK EXCHANGE
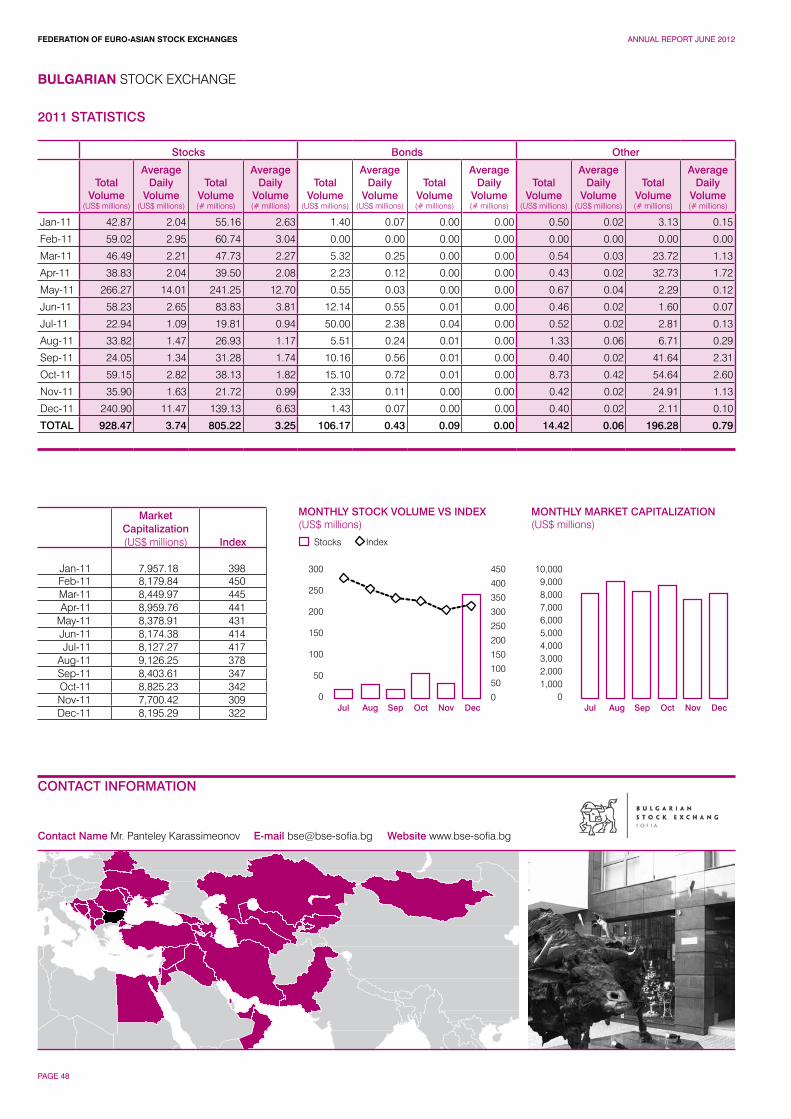
FEDERATION OF EURO-ASIAN STOCK EXCHANGES ANNUAL REPORT JUNE 2012
PAGE 48
BULGARIAN STOCK EXCHANGE
CONTACT INFORMATION
Contact Name Mr. Panteley Karassimeonov E-mail [email protected] Website www.bse-sofia.bg
MONTHLY MARKET CAPITALIZATION(US$ millions)
300
250
200
150
100
50
0
450
400
350
300
250
200
150
100
50
0
10,0009,0008,0007,0006,0005,0004,0003,0002,0001,000
0
Stocks
MONTHLY STOCK VOLUME VS INDEX(US$ millions)
Index
Jul JulAug AugSep SepOct OctNov NovDec Dec
2011 STATISTICS
Stocks Bonds Other
Total Volume
(US$ millions)
Average Daily
Volume(US$ millions)
Total Volume(# millions)
Average Daily
Volume(# millions)
Total Volume
(US$ millions)
Average Daily
Volume(US$ millions)
Total Volume(# millions)
Average Daily
Volume(# millions)
Total Volume
(US$ millions)
Average Daily
Volume(US$ millions)
Total Volume(# millions)
Average Daily
Volume(# millions)
Jan-11 42.87 2.04 55.16 2.63 1.40 0.07 0.00 0.00 0.50 0.02 3.13 0.15
Feb-11 59.02 2.95 60.74 3.04 0.00 0.00 0.00 0.00 0.00 0.00 0.00 0.00
Mar-11 46.49 2.21 47.73 2.27 5.32 0.25 0.00 0.00 0.54 0.03 23.72 1.13
Apr-11 38.83 2.04 39.50 2.08 2.23 0.12 0.00 0.00 0.43 0.02 32.73 1.72
May-11 266.27 14.01 241.25 12.70 0.55 0.03 0.00 0.00 0.67 0.04 2.29 0.12
Jun-11 58.23 2.65 83.83 3.81 12.14 0.55 0.01 0.00 0.46 0.02 1.60 0.07
Jul-11 22.94 1.09 19.81 0.94 50.00 2.38 0.04 0.00 0.52 0.02 2.81 0.13
Aug-11 33.82 1.47 26.93 1.17 5.51 0.24 0.01 0.00 1.33 0.06 6.71 0.29
Sep-11 24.05 1.34 31.28 1.74 10.16 0.56 0.01 0.00 0.40 0.02 41.64 2.31
Oct-11 59.15 2.82 38.13 1.82 15.10 0.72 0.01 0.00 8.73 0.42 54.64 2.60
Nov-11 35.90 1.63 21.72 0.99 2.33 0.11 0.00 0.00 0.42 0.02 24.91 1.13
Dec-11 240.90 11.47 139.13 6.63 1.43 0.07 0.00 0.00 0.40 0.02 2.11 0.10
TOTAL 928.47 3.74 805.22 3.25 106.17 0.43 0.09 0.00 14.42 0.06 196.28 0.79
MarketCapitalization(US$ millions) Index
Jan-11 7,957.18 398Feb-11 8,179.84 450Mar-11 8,449.97 445Apr-11 8,959.76 441
May-11 8,378.91 431Jun-11 8,174.38 414Jul-11 8,127.27 417
Aug-11 9,126.25 378Sep-11 8,403.61 347Oct-11 8,825.23 342Nov-11 7,700.42 309Dec-11 8,195.29 322
FEDERATION OF EURO-ASIAN STOCK EXCHANGES ANNUAL REPORT JUNE 2012
PAGE 49
2011 was yet another year of low liquidity for the Bulgarian Stock Exchange - Sofia (BSE-Sofia) as a result of the ongoing economic crisis in the country. The turnover generated on the regulated market increased by 5% totaling BGN 717 million. The main reason for the slight increase came from the successful privatization of the state stakes in the electricity distribution companies EVN Bulgaria Elektrorazpredelenie and EVN Bulgaria Elektrosnabdjavane in December, when a total of 33% of the capital of the two companies were sold for over BGN 94 million. The turnover at the Special purpose vehicle market rose by more than 51% while bond trading volumes were similar to those in 2010.
The number of issues of financial instruments listed for trading on the markets of BSE-Sofia amounted to 507 as at 31 December 2011, which constituted a decrease by 21 issues where compared to the end of 2010. Last year 18 issues of financial instruments were admitted to trading on the Exchange, which was a drop by 28% compared to 2010. In conditions of low liquidity and uncertain external environment, the number of newly registered shares and bonds remained almost unchanged compared to 2010. During the year there were no new initial public offerings, warrant issues and units of mutual funds. The number of registered capital increases was 12% higher due to the larger number of capital increases with rights in 2011.
The number of delisted issues of financial instruments was 39 in 2011 which represented a decrease by 24% compared to 2010. The decrease was because of the smaller number of delisted share issues – 4 in 2011 compared to 16 in 2010.
The market capitalization of BSE-Sofia reached BGN 11 729.41 million by the end of 2011 which was an annual increase of some 15.6%. Three of the four indices of BSE-Sofia decreased their value in 2011. The main index SOFIX lost 11% and the equal-weighted indicator BGTR 30 – 13.2%. The decline was more moderate with the local broad index BG 40 which lost only 1.65%. Indices’ biggest losses were in the second half of the year. BG REIT which contains companies that operate in the field of securitization of real estate or land was the only index that increased its value in 2011 (+18.9%).
BULGARIAN STOCK EXCHANGE
Key Information ContactsFinancial Supervision Commission www.fsc.bg Central Depository www.csd-bg.bgBulgarian National Bank www.bnb.bgInvest Bulgaria Agency www.investbg.government.bg National Statistical Institute www.nsi.bg
BULGARIAN ECONOMIC CHARTS AND TABLES Indicator 2009 2010 2011
GDP in BGN million 66,256 70,474 75,265Real GDP growth -5.50% 0.40% 1.70%Inflation 0.60% 4.30% 2.80%Average exchange rate of US$ for the year 1.4055 1.4779 1.4065Exchange rate of the US$ at the year-end 1.3641 1.4728 1.5116Unemployment rate at the year-end 9.13% 9.24% 10.40%Basic interest rate at the year-end 0.55% 0.18% 0.22%
Source: Bulgarian National Bank
CAPITAL MARKET DEVELOPMENT AND ECONOMIC OUTLOOK
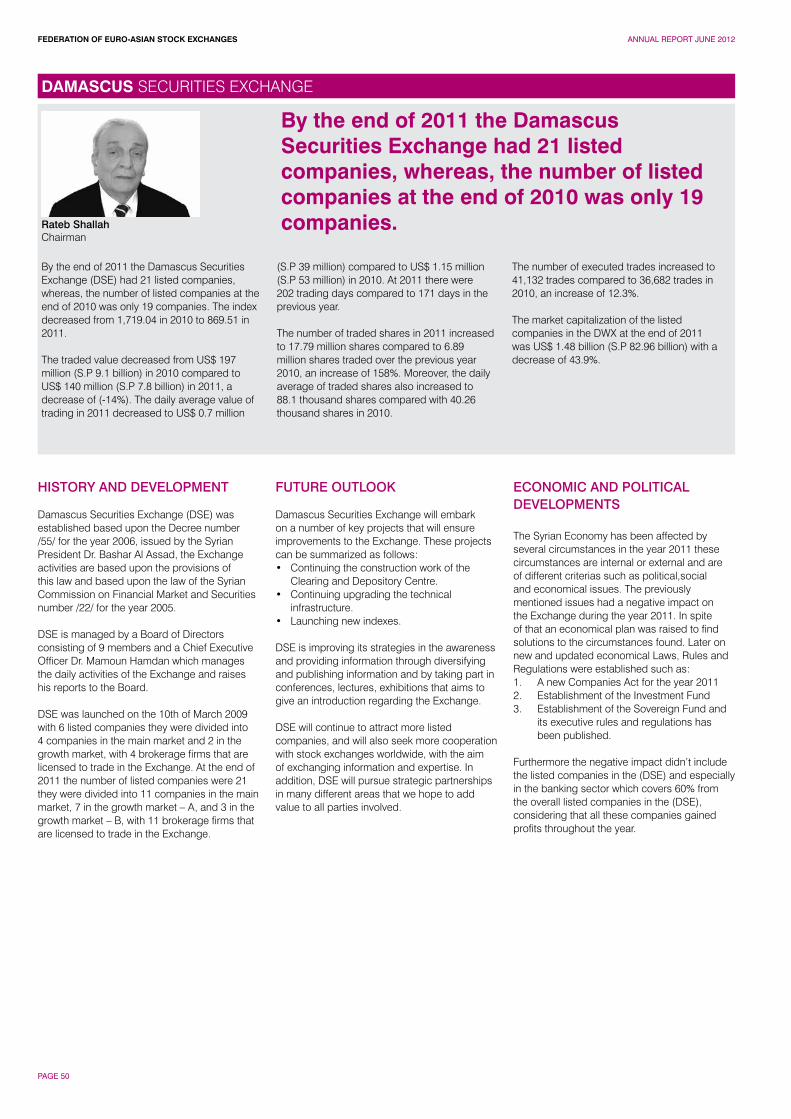
FEDERATION OF EURO-ASIAN STOCK EXCHANGES ANNUAL REPORT JUNE 2012
PAGE 50
Rateb ShallahChairman
By the end of 2011 the Damascus Securities Exchange (DSE) had 21 listed companies, whereas, the number of listed companies at the end of 2010 was only 19 companies. The index decreased from 1,719.04 in 2010 to 869.51 in 2011.
The traded value decreased from US$ 197 million (S.P 9.1 billion) in 2010 compared to US$ 140 million (S.P 7.8 billion) in 2011, a decrease of (-14%). The daily average value of trading in 2011 decreased to US$ 0.7 million
(S.P 39 million) compared to US$ 1.15 million (S.P 53 million) in 2010. At 2011 there were 202 trading days compared to 171 days in the previous year.
The number of traded shares in 2011 increased to 17.79 million shares compared to 6.89 million shares traded over the previous year 2010, an increase of 158%. Moreover, the daily average of traded shares also increased to 88.1 thousand shares compared with 40.26 thousand shares in 2010.
The number of executed trades increased to 41,132 trades compared to 36,682 trades in 2010, an increase of 12.3%.
The market capitalization of the listed companies in the DWX at the end of 2011 was US$ 1.48 billion (S.P 82.96 billion) with a decrease of 43.9%.
HISTORY AND DEVELOPMENT
Damascus Securities Exchange (DSE) was established based upon the Decree number /55/ for the year 2006, issued by the Syrian President Dr. Bashar Al Assad, the Exchange activities are based upon the provisions of this law and based upon the law of the Syrian Commission on Financial Market and Securities number /22/ for the year 2005.
DSE is managed by a Board of Directors consisting of 9 members and a Chief Executive Officer Dr. Mamoun Hamdan which manages the daily activities of the Exchange and raises his reports to the Board.
DSE was launched on the 10th of March 2009 with 6 listed companies they were divided into 4 companies in the main market and 2 in the growth market, with 4 brokerage firms that are licensed to trade in the Exchange. At the end of 2011 the number of listed companies were 21 they were divided into 11 companies in the main market, 7 in the growth market – A, and 3 in the growth market – B, with 11 brokerage firms that are licensed to trade in the Exchange.
FUTURE OUTLOOK
Damascus Securities Exchange will embark on a number of key projects that will ensure improvements to the Exchange. These projects can be summarized as follows:• Continuing the construction work of the
Clearing and Depository Centre.• Continuing upgrading the technical
infrastructure.• Launching new indexes.
DSE is improving its strategies in the awareness and providing information through diversifying and publishing information and by taking part in conferences, lectures, exhibitions that aims to give an introduction regarding the Exchange.
DSE will continue to attract more listed companies, and will also seek more cooperation with stock exchanges worldwide, with the aim of exchanging information and expertise. In addition, DSE will pursue strategic partnerships in many different areas that we hope to add value to all parties involved.
ECONOMIC AND POLITICAL DEVELOPMENTS
The Syrian Economy has been affected by several circumstances in the year 2011 these circumstances are internal or external and are of different criterias such as political,social and economical issues. The previously mentioned issues had a negative impact on the Exchange during the year 2011. In spite of that an economical plan was raised to find solutions to the circumstances found. Later on new and updated economical Laws, Rules and Regulations were established such as:1. A new Companies Act for the year 20112. Establishment of the Investment Fund3. Establishment of the Sovereign Fund and
its executive rules and regulations has been published.
Furthermore the negative impact didn’t include the listed companies in the (DSE) and especially in the banking sector which covers 60% from the overall listed companies in the (DSE), considering that all these companies gained profits throughout the year.
By the end of 2011 the Damascus Securities Exchange had 21 listed companies, whereas, the number of listed companies at the end of 2010 was only 19 companies.
DAMASCUS SECURITIES EXCHANGE

FEDERATION OF EURO-ASIAN STOCK EXCHANGES ANNUAL REPORT JUNE 2012
PAGE 51
DAMASCUS SECURITIES EXCHANGE
CONTACT INFORMATION
Contact Name Lubano Abdo E-mail [email protected] Website www.dse.sy
MONTHLY MARKET CAPITALIZATION(US$ millions)
16
14
12
10
8
6
4
2
0
1,200
1,000
800
600
400
200
0
2,500
2,000
1,500
1,000
500
0
Stocks
MONTHLY STOCK VOLUME VS INDEX(US$ millions)
Index
Jul JulAug AugSep SepOct OctNov NovDec Dec
2011 STATISTICS
Stocks Bonds Other
Total Volume
(US$ millions)
Average Daily
Volume(US$ millions)
Total Volume(# millions)
Average Daily
Volume(# millions)
Total Volume
(US$ millions)
Average Daily
Volume(US$ millions)
Total Volume(# millions)
Average Daily
Volume(# millions)
Total Volume
(US$ millions)
Average Daily
Volume(US$ millions)
Total Volume(# millions)
Average Daily
Volume(# millions)
Jan-11 16.11 0.95 0.71 0.04 0.00 0.00 0.00 0.00 0.00 0.00 0.00 0.00
Feb-11 28.60 1.51 1.08 0.06 0.00 0.00 0.00 0.00 0.00 0.00 0.00 0.00
Mar-11 18.32 0.96 0.96 0.05 0.00 0.00 0.00 0.00 0.00 0.00 0.00 0.00
Apr-11 20.41 1.13 0.84 0.05 0.00 0.00 0.00 0.00 0.00 0.00 0.00 0.00
May-11 18.75 0.85 1.11 0.05 0.00 0.00 0.00 0.00 0.00 0.00 0.00 0.00
Jun-11 12.28 0.56 0.98 0.04 0.00 0.00 0.00 0.00 0.00 0.00 0.00 0.00
Jul-11 12.16 0.58 3.06 0.15 0.00 0.00 0.00 0.00 0.00 0.00 0.00 0.00
Aug-11 8.52 0.53 2.52 0.16 0.00 0.00 0.00 0.00 0.00 0.00 0.00 0.00
Sep-11 5.05 0.42 1.71 0.14 0.00 0.00 0.00 0.00 0.00 0.00 0.00 0.00
Oct-11 6.45 0.50 1.43 0.11 0.00 0.00 0.00 0.00 0.00 0.00 0.00 0.00
Nov-11 14.25 1.30 1.91 0.17 0.00 0.00 0.00 0.00 0.00 0.00 0.00 0.00
Dec-11 3.60 0.30 1.49 0.12 0.00 0.00 0.00 0.00 0.00 0.00 0.00 0.00
TOTAL 164.52 0.81 17.79 0.09 0.00 0.00 0.00 0.00 0.00 0.00 0.00 0.00
MarketCapitalization(US$ millions) Index
Jan-11 3,214.46 1,721Feb-11 3,024.38 1,629Mar-11 2,728.43 1,452Apr-11 2,287.17 1,216
May-11 2,318.48 1,233Jun-11 2,012.19 1,032Jul-11 1,961.12 1,006
Aug-11 1,913.40 951Sep-11 1,927.18 958Oct-11 1,743.89 903Nov-11 1,595.03 847Dec-11 1,488.64 870
FEDERATION OF EURO-ASIAN STOCK EXCHANGES ANNUAL REPORT JUNE 2012
PAGE 52
DAMASCUS SECURITIES EXCHANGE
Key Information ContactsDamascus Securities Exchange www.dse.sy
Political OutlookA reflection to Syria’s economic development in 2010 will show a determination economy, willing to plan and execute sustainable progress, in its multiple dimensions. Touching on the various aspects revolving in and around the economy, the Syrian internal and external mechanisms are drawing clear plans to encourage public, private, and co-operations, in enhancing the economic performance for the coming years.
The public and private sectors are working on multiple fronts to set a productive base across Syria’s key economic drivers. Through various mechanisms as fiscal, monetary, social, and technological policies, decision makers at different levels are tackling the progress of investment frameworks, business environments, trade agreements and political relations.
Economic PerformanceOn a country-wide level, Syria’s economy in 2010 indicated an expected 5% real GDP growth, with an additional 0.5% increase through 2011, as per the International Monetary Fund (IMF). Projected indicators had shown nominal GDP standing at 59.6 billion US$ at end of 2010, with an expected increase of 6.6 billion US$ throughout 2011, to reach a total 66 billion US$.
Meanwhile, the consumer price level remained at a moderate 5% and is expected to remain as is through 2011. Unemployment continued to show concern as it stood at almost 11%. Furthermore, the overall fiscal deficit is expected at 2.6 billion US$ for 2010, accounting for a smaller share of GDP compared to 2009, namely 4.3% versus 5.4%, respectively. The higher revenue in oil revenues and reduction in fuel subsidies were the main drivers to fiscal adjustments. Moreover, the government budget is expecting a spending of 17.8 billion US$, representing a 12% rise that is mostly represented by investment expenditures.
The Oil & Gas sector, and despite an average decline of 4.1% per annum in oil GDP’s real growth, the oil sector was estimated to grow 0.2% in real terms during 2010. This growth remains small despite government efforts to attract foreign investments for new exploration and production. Nevertheless, crude oil production has risen 3.1% yearly on average, reaching 387,357 barrels per day in the third quarter of 2010. The production at new and smaller fields outweighs the dwindling productions of mature sites; however, this is only a temporary situation. Meanwhile, gas production is on a priority list as multiple co operations are in the pipeline to increase production and export lines with strategic trade partners.
The Construction & Real Estate sector has attracted huge attention on the economic map. The lack of supply, low real interest rates, lack of proper investment opportunities, and rising cash flows from Gulf investors and Iraqi immigrants have all contributed to a sharp increase in the price of real estate properties. Consequently, major developers have taken initiative to build large commercial and residential spaces in both urban and rural areas. Accordingly, the trend has reversed with light price adjustments in the last eighteen months.
The Trade & Services sector marked strong activity through 2010. The number of visitors reached 6.6 million through September, noting an increase of 46% year-on-year. Tourist expenditures reached 6.5 billion US$ within the abovementioned period, and the industry as a whole contributed to 5.2% of GDP. In addition, the telecom sub-sector has been run by two large operators that have contributed to a 42% in mobile subscribers, while the landline network increased subscribers by 6.6% as of end 2009. Currently, six companies are bidding to take a pie of the sector’s success that is about to accommodate a third operator.
The Financial sector has witnessed various incentives in attracting funds and increasing lending volumes. In spite of the effects of the crisis on remittances and FDI, the Syrian financial sector has been supported by lower reserve requirements, lower interest rates, and increased credit exposure limits. The money supply expanded 12% year-on-year in July 2010, and has moved in line with GDP growth. The last quarter of 2010 saw the first sale of government bonds. While the financial sector has made an outstanding growth in terms of assets, deposits, and credit, the financial community awaits the introduction of more financial instruments and better allocation mechanisms to the sector’s excess liquidity.
The Syrian capital market currently stands at an average daily trading value of 43 million SP and an average daily trading volume of 34 thousand shares. The market index posted an approximate 71.9% gain in 2010. It is currently composed of 20 companies listed within 5 sectors, namely, Banking, Insurance, Service, Industrial, and Agricultural. The Banking sector holds the highest market capitalization at 131 billion SP, out of a total 144 billion SP. The market is currently receiving coverage by 12 financial brokerage companies.
In retrospect, the Syrian economy in 2010 continued to show strength through multiple key sectors. Despite multiple drawbacks resulting from a world crisis recovery, regional slowdown in investments, and difficulties of moving into an open market economy, the Syrian economy and its key decision- makers are showing resilience in creating stability and progress in increasing the performance of internal & external economic indicators. Looking forward onto the development 7 execution of Syria’s 5-year plan, the targets set for infrastructure and investment planning are providing solid confidence for local, regional, and international participants.
Information obtained from the Exchange.
CAPITAL MARKET DEVELOPMENT AND ECONOMIC OUTLOOK
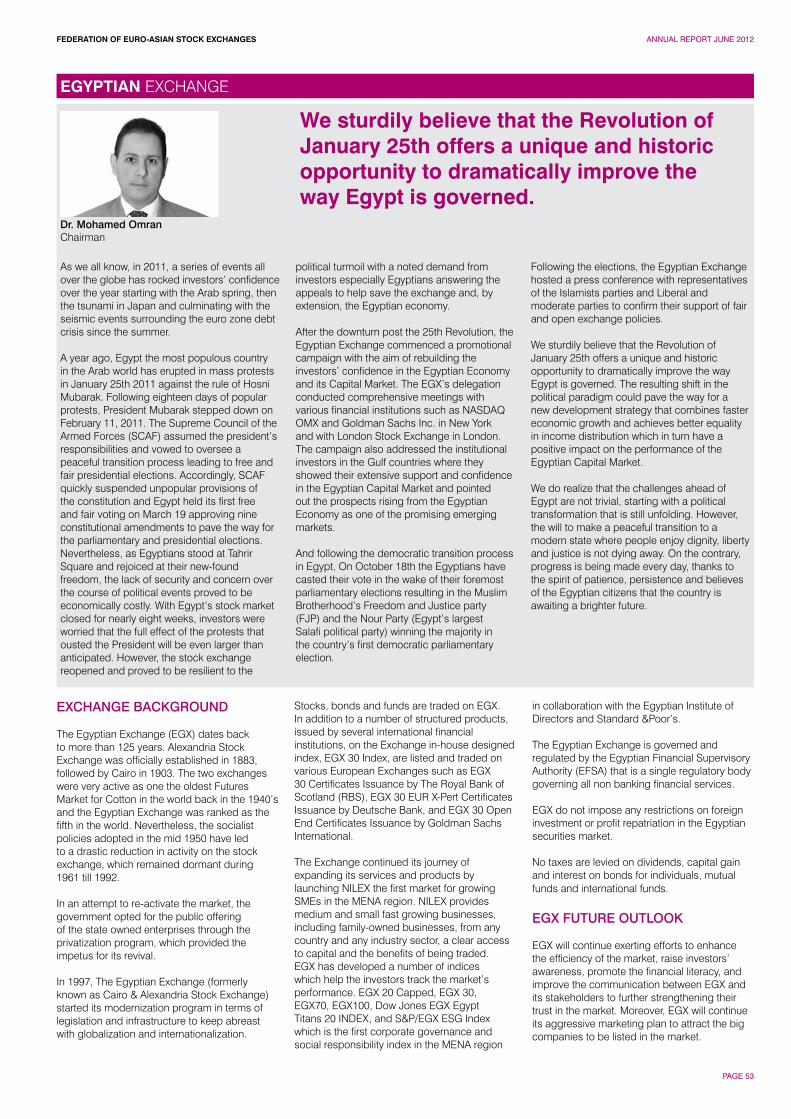
FEDERATION OF EURO-ASIAN STOCK EXCHANGES ANNUAL REPORT JUNE 2012
PAGE 53
Dr. Mohamed OmranChairman
As we all know, in 2011, a series of events all over the globe has rocked investors’ confidence over the year starting with the Arab spring, then the tsunami in Japan and culminating with the seismic events surrounding the euro zone debt crisis since the summer.
A year ago, Egypt the most populous country in the Arab world has erupted in mass protests in January 25th 2011 against the rule of Hosni Mubarak. Following eighteen days of popular protests, President Mubarak stepped down on February 11, 2011. The Supreme Council of the Armed Forces (SCAF) assumed the president’s responsibilities and vowed to oversee a peaceful transition process leading to free and fair presidential elections. Accordingly, SCAF quickly suspended unpopular provisions of the constitution and Egypt held its first free and fair voting on March 19 approving nine constitutional amendments to pave the way for the parliamentary and presidential elections. Nevertheless, as Egyptians stood at Tahrir Square and rejoiced at their new-found freedom, the lack of security and concern over the course of political events proved to be economically costly. With Egypt’s stock market closed for nearly eight weeks, investors were worried that the full effect of the protests that ousted the President will be even larger than anticipated. However, the stock exchange reopened and proved to be resilient to the
political turmoil with a noted demand from investors especially Egyptians answering the appeals to help save the exchange and, by extension, the Egyptian economy.
After the downturn post the 25th Revolution, the Egyptian Exchange commenced a promotional campaign with the aim of rebuilding the investors’ confidence in the Egyptian Economy and its Capital Market. The EGX’s delegation conducted comprehensive meetings with various financial institutions such as NASDAQ OMX and Goldman Sachs Inc. in New York and with London Stock Exchange in London. The campaign also addressed the institutional investors in the Gulf countries where they showed their extensive support and confidence in the Egyptian Capital Market and pointed out the prospects rising from the Egyptian Economy as one of the promising emerging markets.
And following the democratic transition process in Egypt, On October 18th the Egyptians have casted their vote in the wake of their foremost parliamentary elections resulting in the Muslim Brotherhood’s Freedom and Justice party (FJP) and the Nour Party (Egypt’s largest Salafi political party) winning the majority in the country’s first democratic parliamentary election.
Following the elections, the Egyptian Exchange hosted a press conference with representatives of the Islamists parties and Liberal and moderate parties to confirm their support of fair and open exchange policies.
We sturdily believe that the Revolution of January 25th offers a unique and historic opportunity to dramatically improve the way Egypt is governed. The resulting shift in the political paradigm could pave the way for a new development strategy that combines faster economic growth and achieves better equality in income distribution which in turn have a positive impact on the performance of the Egyptian Capital Market.
We do realize that the challenges ahead of Egypt are not trivial, starting with a political transformation that is still unfolding. However, the will to make a peaceful transition to a modern state where people enjoy dignity, liberty and justice is not dying away. On the contrary, progress is being made every day, thanks to the spirit of patience, persistence and believes of the Egyptian citizens that the country is awaiting a brighter future.
EXCHANGE BACKGROUND
The Egyptian Exchange (EGX) dates back to more than 125 years. Alexandria Stock Exchange was officially established in 1883, followed by Cairo in 1903. The two exchanges were very active as one the oldest Futures Market for Cotton in the world back in the 1940’s and the Egyptian Exchange was ranked as the fifth in the world. Nevertheless, the socialist policies adopted in the mid 1950 have led to a drastic reduction in activity on the stock exchange, which remained dormant during 1961 till 1992.
In an attempt to re-activate the market, the government opted for the public offering of the state owned enterprises through the privatization program, which provided the impetus for its revival.
In 1997, The Egyptian Exchange (formerly known as Cairo & Alexandria Stock Exchange) started its modernization program in terms of legislation and infrastructure to keep abreast with globalization and internationalization.
Stocks, bonds and funds are traded on EGX. In addition to a number of structured products, issued by several international financial institutions, on the Exchange in-house designed index, EGX 30 Index, are listed and traded on various European Exchanges such as EGX 30 Certificates Issuance by The Royal Bank of Scotland (RBS), EGX 30 EUR X-Pert Certificates Issuance by Deutsche Bank, and EGX 30 Open End Certificates Issuance by Goldman Sachs International.
The Exchange continued its journey of expanding its services and products by launching NILEX the first market for growing SMEs in the MENA region. NILEX provides medium and small fast growing businesses, including family-owned businesses, from any country and any industry sector, a clear access to capital and the benefits of being traded.EGX has developed a number of indices which help the investors track the market’s performance. EGX 20 Capped, EGX 30, EGX70, EGX100, Dow Jones EGX Egypt Titans 20 INDEX, and S&P/EGX ESG Index which is the first corporate governance and social responsibility index in the MENA region
in collaboration with the Egyptian Institute of Directors and Standard &Poor’s.
The Egyptian Exchange is governed and regulated by the Egyptian Financial Supervisory Authority (EFSA) that is a single regulatory body governing all non banking financial services.
EGX do not impose any restrictions on foreign investment or profit repatriation in the Egyptian securities market.
No taxes are levied on dividends, capital gain and interest on bonds for individuals, mutual funds and international funds.
EGX FUTURE OUTLOOK
EGX will continue exerting efforts to enhance the efficiency of the market, raise investors’ awareness, promote the financial literacy, and improve the communication between EGX and its stakeholders to further strengthening their trust in the market. Moreover, EGX will continue its aggressive marketing plan to attract the big companies to be listed in the market.
We sturdily believe that the Revolution of January 25th offers a unique and historic opportunity to dramatically improve the way Egypt is governed.
EGYPTIAN EXCHANGE
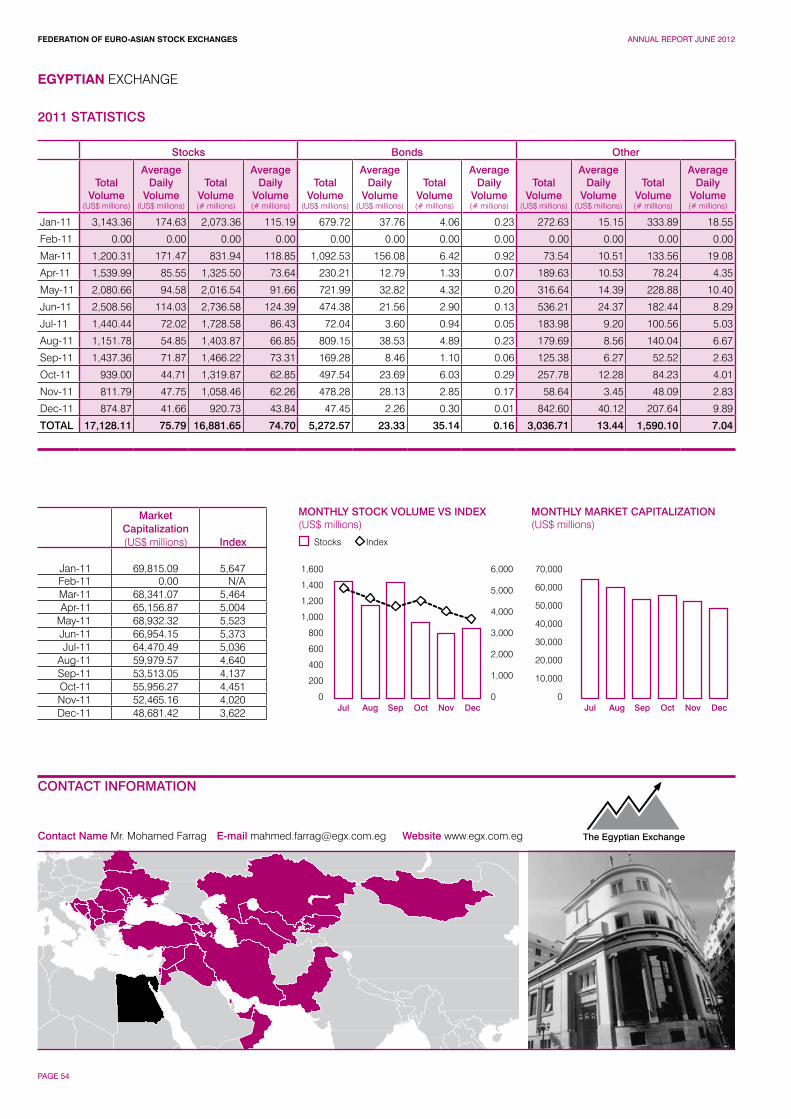
FEDERATION OF EURO-ASIAN STOCK EXCHANGES ANNUAL REPORT JUNE 2012
PAGE 54
EGYPTIAN EXCHANGE
CONTACT INFORMATION
Contact Name Mr. Mohamed Farrag E-mail [email protected] Website www.egx.com.eg
1,600
1,400
1,200
1,000
800
600
400
200
0
MONTHLY MARKET CAPITALIZATION(US$ millions)
6,000
5,000
4,000
3,000
2,000
1,000
0
70,000
60,000
50,000
40,000
30,000
20,000
10,000
0
MONTHLY STOCK VOLUME VS INDEX(US$ millions)
Stocks Index
Jul JulAug AugSep SepOct OctNov NovDec Dec
2011 STATISTICS
Stocks Bonds Other
Total Volume
(US$ millions)
Average Daily
Volume(US$ millions)
Total Volume(# millions)
Average Daily
Volume(# millions)
Total Volume
(US$ millions)
Average Daily
Volume(US$ millions)
Total Volume(# millions)
Average Daily
Volume(# millions)
Total Volume
(US$ millions)
Average Daily
Volume(US$ millions)
Total Volume(# millions)
Average Daily
Volume(# millions)
Jan-11 3,143.36 174.63 2,073.36 115.19 679.72 37.76 4.06 0.23 272.63 15.15 333.89 18.55
Feb-11 0.00 0.00 0.00 0.00 0.00 0.00 0.00 0.00 0.00 0.00 0.00 0.00
Mar-11 1,200.31 171.47 831.94 118.85 1,092.53 156.08 6.42 0.92 73.54 10.51 133.56 19.08
Apr-11 1,539.99 85.55 1,325.50 73.64 230.21 12.79 1.33 0.07 189.63 10.53 78.24 4.35
May-11 2,080.66 94.58 2,016.54 91.66 721.99 32.82 4.32 0.20 316.64 14.39 228.88 10.40
Jun-11 2,508.56 114.03 2,736.58 124.39 474.38 21.56 2.90 0.13 536.21 24.37 182.44 8.29
Jul-11 1,440.44 72.02 1,728.58 86.43 72.04 3.60 0.94 0.05 183.98 9.20 100.56 5.03
Aug-11 1,151.78 54.85 1,403.87 66.85 809.15 38.53 4.89 0.23 179.69 8.56 140.04 6.67
Sep-11 1,437.36 71.87 1,466.22 73.31 169.28 8.46 1.10 0.06 125.38 6.27 52.52 2.63
Oct-11 939.00 44.71 1,319.87 62.85 497.54 23.69 6.03 0.29 257.78 12.28 84.23 4.01
Nov-11 811.79 47.75 1,058.46 62.26 478.28 28.13 2.85 0.17 58.64 3.45 48.09 2.83
Dec-11 874.87 41.66 920.73 43.84 47.45 2.26 0.30 0.01 842.60 40.12 207.64 9.89
TOTAL 17,128.11 75.79 16,881.65 74.70 5,272.57 23.33 35.14 0.16 3,036.71 13.44 1,590.10 7.04
MarketCapitalization(US$ millions) Index
Jan-11 69,815.09 5,647Feb-11 0.00 N/A Mar-11 68,341.07 5,464Apr-11 65,156.87 5,004
May-11 68,932.32 5,523Jun-11 66,954.15 5,373Jul-11 64,470.49 5,036
Aug-11 59,979.57 4,640Sep-11 53,513.05 4,137Oct-11 55,956.27 4,451Nov-11 52,465.16 4,020Dec-11 48,681.42 3,622
FEDERATION OF EURO-ASIAN STOCK EXCHANGES ANNUAL REPORT JUNE 2012
PAGE 55
The year 2011 was considered a remarkable year in the history of the Egyptian capital market, after few years of overcoming a number of crises that hardly knocked other markets, this year the Egyptian Exchange faced both internal and external tensions.
On the internal level, the year started with the 25th of January revolution, toppling down the old regime. A transitional phase started which lead the economy to retreat to one of its worst levels ever. The economic growth plummeted to its lowest levels with a notable aggravating budget deficit due to the declining revenues and increased spending in line with the fears of diminishing reserves. This in turn led the foreign investment to hit its lowest levels within seven years to record US$ 2.2 billion on FY 2010/2011. In addition, Egypt’s Government bonds credit rating was downgraded four times within one year.
On the external level, the situation was not very different; with the heightening of the economic crisis attributable to the deterioration of the debt pinch in the U.S. and the downgrading of its credit worthiness. Moreover, the US debt crisis spread in other countries, especially in Europe, representing a real threat to the global financial system and running the risk of downward spiral of uncertainty and financial instability. Meanwhile, fears of a global recession, lingers over, tumbling the global markets performance sharply.
With EGX recording year-on-year losses of around 50%, however, a large part of the losses has been recorded prior to the 28th of January. The market lost 21% in January, while in the following 9 months; post the revolution, the market lost around 30%. Worth mentioning, after the revolution EGX performance mimicked that of global capital markets which were affected by the global crisis.
And due to political unrest and the banking sector instability at the time, EGX was forced to suspend trading to provide the legal entities the proper time to undertake the necessary measures for preventing the outflow of capital involved in illegal acts.
Legislative Amendments to Increase Market Depth During 2011, EFSA and EGX management focused on the legislative side in order to achieve greater market protection. The year started with precautionary measures which largely contributed to minimizing the market decline after re-opening. EFSA has undertaken several precautionary measures for trading resumption on EGX to assure the highest level of protection for investors’ rights. First, the price limits on the listed shares were amended, according to which trading is suspended on a stock for half an hour after a 5% change, and is fixed and trading will continue till the end of the trading session after a 10% change.
Moreover, EFSA approved several important amendments including the adjustment of the specialized activities standards (margin trading, short selling and intraday trading) to include larger number of listed companies, the listing rules with regards to initial public offerings, treasury stocks and enforcing companies to release their shareholders structure and a preliminary approval on the rules governing the issuance and trading of sukuk in an attempt to develop new investment tools to attract more investments to the Egyptian capital market. Furthermore, intraday trading rules have been altered to be re-activated after being hindered post the revolution.
Despite the hard circumstances Egypt is witnessing, EGX played a leading role in financing companies. Year 2011 witnessed the listing of 9 companies, 4 in the main market and 5 in NILEX with a total value of LE 558.6 million vs. 16 companies, with a total LE 1.9 billion in 2010.
The total value of raised capital reached LE 7 billion during 2011, with 7 companies increasing their capital through SPOs with a value of LE 2.32 billion, 20 companies through stock dividends worth LE 2.9 billion, while the remaining took place through cash, Mergers & Acquisitions, Swaps…. etc.
Due to the internal pressures and the aggravation of the global crisis, foreign investments in the Egyptian market recorded an outflow of LE 4.3 billion during 2011. Despite this efflux, the Egyptian market is still maintaining strong foreign investments, where the outflow in 2011 represents less than half of
the net Non-Arab foreign inflow in 2010 (more than LE 8.4 billion), and less than 12% of the net Non-Arab foreign inflow during the past 5 years (around LE 33 billion).
Nonetheless, the out flow is considered moderate, as it represents less than half of the non-Arab foreign inflows in the Egyptian market during 2010 (LE 8.4 billion).
Moreover, European investments dominated foreign investments on EGX in 2011, capturing around 49% of the total foreign investments, after excluding deals. USA & Canada investments accounted for 27% of the foreign investments, while 18% were owed to Arab Investments.
The Egyptian market was dominated by Institutions, accounting for 59% of the value traded during 2011, as opposed to 52% during 2010. In addition, individuals accounted for 41% of the value traded during 2011, as opposed to 48% during the previous year.
The Egyptian Market Remains One of the Most Attractive Markets in the Region According to Standard and Poor’s, the Egyptian market is considered one of the most attractive markets in the Middle East and Africa Region recording a PE of 10.47 vs. 15.86 for the region. Meanwhile, the market recorded a high DY of 10.40% vs. an average DY for the region of 3.58% by the end of December 2011.
Due to the transitional phase events which coincided with the global crisis, average daily trading recorded around LE 716 million in 2011 declining from LE 1.3 billion in 2010. Noteworthy, the last quarter of the year witnessed a sharp decline in the average daily trading to record LE 255 million.
On the other side and despite the harsh economic conditions, 79% of the listed companies attained profits during the first half of the year. Similarly, in NILEX, 15 companies recorded a net profit during the first half.
Absolute Reform to NILEX Listing, Trading and Disclosure Rules took place this year to re-direct NILEX to its primary goal as a gateway for financing SMEs’ to grow. Listing rules have been amended to ensure the presence of promising companies with organized plans to increase their capital. Additionally, trading rules.
EGYPTIAN EXCHANGE
Key Information ContactsMinistry of Finance www.mof.gov.eg Ministry of Investment www.investment.gov.egCentral Bank of Egypt www.cbe.org.eg Egyptian Financial Supervisory Authority www.efsa.gov.egMisr for Clearing, Depository and Central Registry www.mcsd.com.eg SMEs Market (NILEX) www.nilex.egyptse.com
CAPITAL MARKET DEVELOPMENT IN 2011
FEDERATION OF EURO-ASIAN STOCK EXCHANGES ANNUAL REPORT JUNE 2012
PAGE 56
have taken place to modify the trading system in NILEX to match that of the main market in order to achieve higher liquidity. Moreover, special techniques have been put forth to calculate the closing price and ensure the safety of the transactions. Worth mentioning, the modified trading system helped in securing NILEX from the decline in liquidity witnessed in the main market.
The rules stated that the file of the Nominated Sponsors should be transferred from EFSA to EGX management to guarantee activating their role.
Despite the internal crisis, NILEX succeeded in increasing the number of companies listed in the market, by almost one third, to reach 20 companies.
In line with the Egyptian Exchange belief in the importance of helping companies to raise their capital during the critical phase, EGX formed a team to attract new companies to list in the exchange. In addition, The Egyptian Exchange (EGX) and The General Authority for Investment (GAFI) signed a Memorandum of Understanding for mutual cooperation aiming to attract new SMEs to list on NILEX. Worth mentioning, GAFI has an ample database for potential companies which will help EGX in attracting more companies to list in NILEX.
On the international front, EGX management has undertaken several promotional campaigns abroad post the revolution to restore confidence in the Egyptian market. The promotional campaigns aimed at the Gulf region, Europe and the United states, with dozens of interested foreign institutions participating.
Worth mentioning, the promotional campaigns largely contributed to improving the image of the Egyptian Economy.
Moreover, EGX invited a number of public figures and representatives of various institutions for the opening of trading sessions, to draw the attention of the society to the Egyptian Exchange and its importance for the economic well being.
Launching New Indices as well as including Egypt in Regional Indices Meanwhile, to enhance access to information, EGX launched a new index, EGX 20 Capped index, designed to capture the performance of the most active 20 companies in terms of market capitalization and liquidity, capping the weight of any constituent to a maximum of 10%.
Egypt also joined the Dow Jones FEAS Titans 50 Equal Weighted Index designed to serve as the basis for financial products such as funds and structured products.
Continuous Educational Awareness Efforts In light of the critical situation which calls for unity and concerted efforts to help the capital market overcome the crisis, EGX has launched several national campaigns to attract more investments and promoted the funds investment’s awareness campaign. Moreover, EGX visited many universities nationwide in an attempt to help students better understand stock exchange investment basics and launched a new stock market simulation targeting secondary school students and visiting nearly 90 schools nationwide.
Consequently, the market conditions the number of coded investors in the Egyptian market increased by around 36 thousand new investor vs. around 35 thousand new investor in 2010.
Market Looks Forward to Passing the Transition Period During the first round of the parliamentary elections the market witnessed a strong rise in the indices performance. EGX 30 index soared by 11%, EGX 70 and EGX 100 increased by 19% and 15%, respectively, with relatively high trading volumes during that period. This indicates that investors are yearning for political stability to return to the market, which reflects the strength of the listed companies.
Moreover, the volume traded recorded 18.5 billion securities in 2011 compared to 33 billion securities in 2010. Likewise, the number of transactions recorded 5.6 million transactions versus 10 million in 2010. The market capitalization concluded the year at LE 294 billion as opposed to LE 488 billion at the end of 2010, with a decline of 40% and representing 21% of GDP.
Moreover, the bond market witnessed a huge drop in trading activity during 2011 as opposed to the previous year, due to the political climate, in addition to the downgrading of Egypt’s government bonds four times during the year to reach B2.
The value of bonds traded reached LE 31 billion in comparison to LE 63 billion the previous year. Likewise, the volume of bonds traded fell recording 35 million bonds, versus 66 million bonds in 2010.
Treasury Bonds issued through the Primary Dealers System still account for the lion’s share of the total bond activity, making up 99% of the total bonds value and 86% of the bonds’ total volume traded during the year.
Similarly, corporate bonds witnessed a decline in their trading activity in 2011, with their value traded registering LE 227 million, down from LE 562 million last year. Meanwhile, their volume traded reached 1.7 million bonds versus 5.5 million bonds for the previous year.
EGYPTIAN EXCHANGE
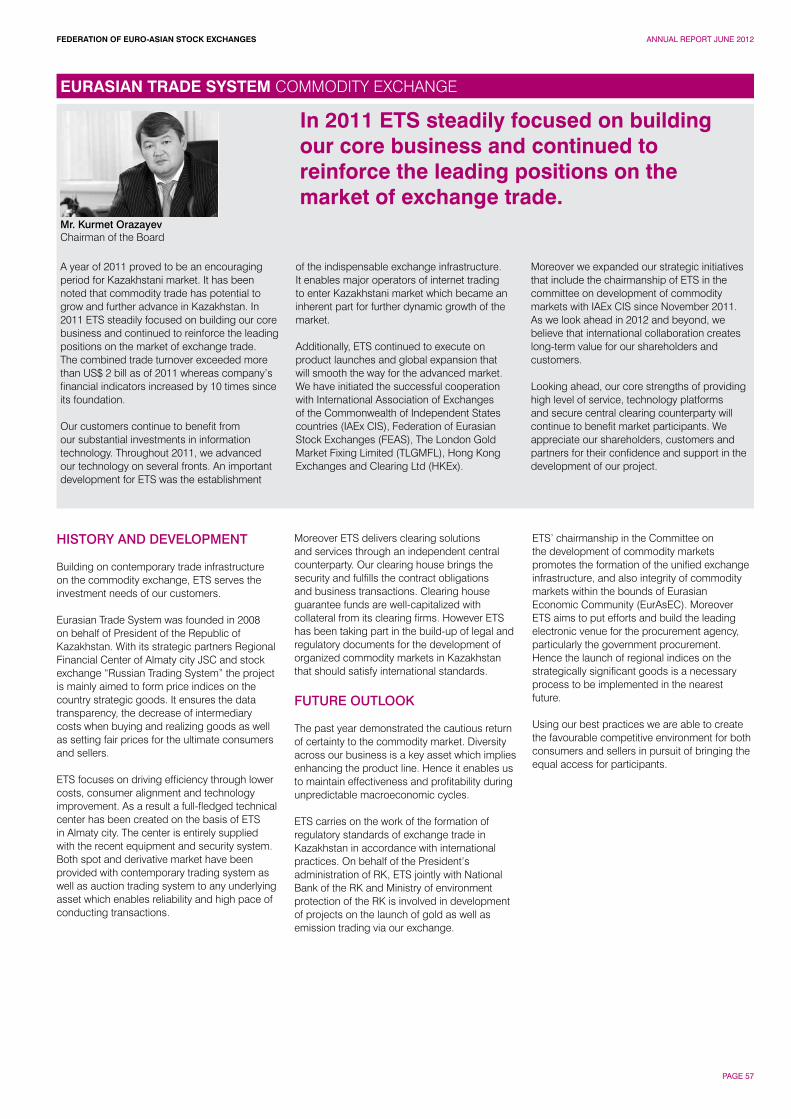
FEDERATION OF EURO-ASIAN STOCK EXCHANGES ANNUAL REPORT JUNE 2012
PAGE 57
Mr. Kurmet OrazayevChairman of the Board
A year of 2011 proved to be an encouraging period for Kazakhstani market. It has been noted that commodity trade has potential to grow and further advance in Kazakhstan. In 2011 ETS steadily focused on building our core business and continued to reinforce the leading positions on the market of exchange trade. The combined trade turnover exceeded more than US$ 2 bill as of 2011 whereas company’s financial indicators increased by 10 times since its foundation.
Our customers continue to benefit from our substantial investments in information technology. Throughout 2011, we advanced our technology on several fronts. An important development for ETS was the establishment
of the indispensable exchange infrastructure. It enables major operators of internet trading to enter Kazakhstani market which became an inherent part for further dynamic growth of the market.
Additionally, ETS continued to execute on product launches and global expansion that will smooth the way for the advanced market. We have initiated the successful cooperation with International Association of Exchanges of the Commonwealth of Independent States countries (IAEx CIS), Federation of Eurasian Stock Exchanges (FEAS), The London Gold Market Fixing Limited (TLGMFL), Hong Kong Exchanges and Clearing Ltd (HKEx).
Moreover we expanded our strategic initiatives that include the chairmanship of ETS in the committee on development of commodity markets with IAEx CIS since November 2011. As we look ahead in 2012 and beyond, we believe that international collaboration creates long-term value for our shareholders and customers.
Looking ahead, our core strengths of providing high level of service, technology platforms and secure central clearing counterparty will continue to benefit market participants. We appreciate our shareholders, customers and partners for their confidence and support in the development of our project.
HISTORY AND DEVELOPMENT
Building on contemporary trade infrastructure on the commodity exchange, ETS serves the investment needs of our customers.
Eurasian Trade System was founded in 2008 on behalf of President of the Republic of Kazakhstan. With its strategic partners Regional Financial Center of Almaty city JSC and stock exchange “Russian Trading System” the project is mainly aimed to form price indices on the country strategic goods. It ensures the data transparency, the decrease of intermediary costs when buying and realizing goods as well as setting fair prices for the ultimate consumers and sellers.
ETS focuses on driving efficiency through lower costs, consumer alignment and technology improvement. As a result a full-fledged technical center has been created on the basis of ETS in Almaty city. The center is entirely supplied with the recent equipment and security system. Both spot and derivative market have been provided with contemporary trading system as well as auction trading system to any underlying asset which enables reliability and high pace of conducting transactions.
Moreover ETS delivers clearing solutions and services through an independent central counterparty. Our clearing house brings the security and fulfills the contract obligations and business transactions. Clearing house guarantee funds are well-capitalized with collateral from its clearing firms. However ETS has been taking part in the build-up of legal and regulatory documents for the development of organized commodity markets in Kazakhstan that should satisfy international standards.
FUTURE OUTLOOK
The past year demonstrated the cautious return of certainty to the commodity market. Diversity across our business is a key asset which implies enhancing the product line. Hence it enables us to maintain effectiveness and profitability during unpredictable macroeconomic cycles.
ETS carries on the work of the formation of regulatory standards of exchange trade in Kazakhstan in accordance with international practices. On behalf of the President’s administration of RK, ETS jointly with National Bank of the RK and Ministry of environment protection of the RK is involved in development of projects on the launch of gold as well as emission trading via our exchange.
ETS’ chairmanship in the Committee on the development of commodity markets promotes the formation of the unified exchange infrastructure, and also integrity of commodity markets within the bounds of Eurasian Economic Community (EurAsEC). Moreover ETS aims to put efforts and build the leading electronic venue for the procurement agency, particularly the government procurement. Hence the launch of regional indices on the strategically significant goods is a necessary process to be implemented in the nearest future.
Using our best practices we are able to create the favourable competitive environment for both consumers and sellers in pursuit of bringing the equal access for participants.
In 2011 ETS steadily focused on building our core business and continued to reinforce the leading positions on the market of exchange trade.
EURASIAN TRADE SYSTEM COMMODITY EXCHANGE
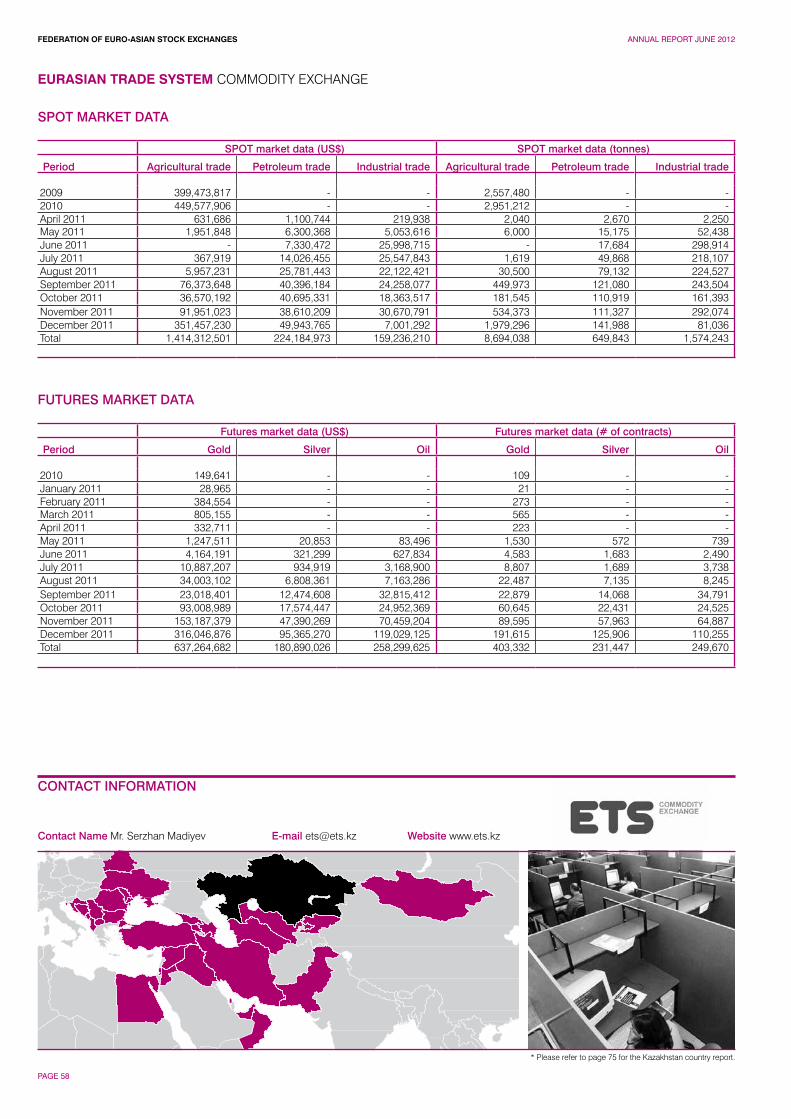
FEDERATION OF EURO-ASIAN STOCK EXCHANGES ANNUAL REPORT JUNE 2012
PAGE 58
EURASIAN TRADE SYSTEM COMMODITY EXCHANGE
CONTACT INFORMATION
Contact Name Mr. Serzhan Madiyev E-mail [email protected] Website www.ets.kz
SPOT MARKET DATA
SPOT market data (US$) SPOT market data (tonnes)
Period Agricultural trade Petroleum trade Industrial trade Agricultural trade Petroleum trade Industrial trade
2009 399,473,817 - - 2,557,480 - -2010 449,577,906 - - 2,951,212 - -April 2011 631,686 1,100,744 219,938 2,040 2,670 2,250May 2011 1,951,848 6,300,368 5,053,616 6,000 15,175 52,438June 2011 - 7,330,472 25,998,715 - 17,684 298,914July 2011 367,919 14,026,455 25,547,843 1,619 49,868 218,107August 2011 5,957,231 25,781,443 22,122,421 30,500 79,132 224,527September 2011 76,373,648 40,396,184 24,258,077 449,973 121,080 243,504October 2011 36,570,192 40,695,331 18,363,517 181,545 110,919 161,393November 2011 91,951,023 38,610,209 30,670,791 534,373 111,327 292,074December 2011 351,457,230 49,943,765 7,001,292 1,979,296 141,988 81,036Total 1,414,312,501 224,184,973 159,236,210 8,694,038 649,843 1,574,243
FUTURES MARKET DATA
Futures market data (US$) Futures market data (# of contracts)
Period Gold Silver Oil Gold Silver Oil
2010 149,641 - - 109 - -January 2011 28,965 - - 21 - -February 2011 384,554 - - 273 - -March 2011 805,155 - - 565 - -April 2011 332,711 - - 223 - -May 2011 1,247,511 20,853 83,496 1,530 572 739June 2011 4,164,191 321,299 627,834 4,583 1,683 2,490July 2011 10,887,207 934,919 3,168,900 8,807 1,689 3,738August 2011 34,003,102 6,808,361 7,163,286 22,487 7,135 8,245September 2011 23,018,401 12,474,608 32,815,412 22,879 14,068 34,791October 2011 93,008,989 17,574,447 24,952,369 60,645 22,431 24,525November 2011 153,187,379 47,390,269 70,459,204 89,595 57,963 64,887December 2011 316,046,876 95,365,270 119,029,125 191,615 125,906 110,255Total 637,264,682 180,890,026 258,299,625 403,332 231,447 249,670
* Please refer to page 75 for the Kazakhstan country report.
FEDERATION OF EURO-ASIAN STOCK EXCHANGES ANNUAL REPORT JUNE 2012
PAGE 59
George LoladzeChairman of the Supervisory Board
2011, on the background of processes developing at the world financial markets, turned out to be somewhat difficult year for us - as to many stock exchanges in the world; however, at the same time, the year was quite interesting – because practically the whole period was devoted to development and implementation of necessary procedural and software improvements both at GSE and GCSD.
We have important news this year as well – from 2011 GSE is fully represented at Bloomberg: investors and other interested parties can receive GSE trading data and standard information about listed companies, as well as to monitor in real time GSE trading sessions.
We continue promotion of IPO opportunities with potential Georgian issuers and have some progress in this regard. As a result we hope to have number of IPOs at GSE this year providing for increased liquidity and making our market more interesting and attractive for investors.
HISTORY AND DEVELOPMENT
Equity securities first appeared in Georgia in 1991 after the declaration of independence that signaled the beginning of market-oriented reforms. A vast majority of the newly established joint-stock companies were owned by a rather small number of private shareholders and trading in these shares was relatively inactive. With the launching of the Mass Privatization Program in 1994, approximately 1,300 state-owned enterprises were organized as joint-stock companies, creating about half a million individual private shareholders. However, during a five-year period (1994-1999), the lack of an appropriate legal framework and organized market infrastructure seriously impeded the secondary trading of these shares and any over-the-counter market activity was nearly nonexistent.
The Georgian Stock Exchange (GSE) was founded in 1999 by a group of Georgian securities market professionals, leading banks, investment and insurance companies. It is the only organized securities market in Georgia. Designed and established with the assistance of the United States Agency for International Development (USAID) and operating within the legal framework of corporate and securities laws drafted with the assistance of American and German experts, the GSE can assert that it is designed and operated to comply with “global best practices” and offers an attractive investment environment to foreign investors.
Official trading at the GSE began in March 2000. The number of companies admitted for trading at the GSE trading system increased gradually and by the end of 2004 reached 277. Practically all of these companies are former state owned and operated companies transformed into joint-stock companies and then privatized.
2004, was a landmark year for the GSE, due to the unprecedented increase in basic trading figures compared with previous years, reflecting the overall revitalization of the economy in the wake of the “Rose Revolution” of 2003.
In the end of November, 2006 Bank of Georgia (GSE:BOG), the company listed at the GSE since 2001, concluded successful IPO at the London Stock Exchange Main Market and through issuance of GDRs raised circa US$ 160 ml. The bank is the first Georgian company ever and the second bank rom the CIS since 1999 listed on the London Stock Exchange.
In 2007 the remote trading system was practically implemented at the GSE.
In 2008 significant amendments were made in Georgian legislation, GSE Charter and Rules ensuring GSE demutualization, stock-exchange membership for various licensed financial institutions, including remote membership for respective foreign entities. In August 2009 the decision on GSE capital increase was taken by GSE General Meeting of Shareholders with purpose of attraction of NASDAQ-OMX as a strategic partner. In May, 2010 the GSE Supervisory Board took decision on introduction of the official stock exchange indicator - GSE index (GSX). GSX is published on a daily basis at the GSE website.
In November, 2010 the Georgian Central Securities Depository – the 99% subsidiary of GSE – completed fundamental amendments to it self-regulation rules inspirited by intention of one of the largest global custodians to start operations in Georgia. In the end of 2010 the National Bank of Georgia adopted new regulation according to which the procedure of public offering in Georgia of the securities admitted for trading at the eligible foreign exchanges is dramatically simplified.
In March 2011 an agreement was signed between GSE and Bloomberg, one of the largest data vendors, regarding GSE real time and end-of-day data dissemination.
FUTURE OUTLOOK
In 2012 the Georgian Stock Exchange plans to:
1. Make important changes in its trading system and trading rules so as to increase the efficiency of trading and increase the liquidity of the market:
• Further improve remote trading system for brokerage companies;
• Establish electronic links between stock exchange, central depository, brokerage companies, banks and securities registrars;
• Introduce partially guaranteed trading of securities.
2. Launch a new web-site for the GSE, which along with traditional statistics will provide corporate reports database for the companies who are admitted to the trading system.
3. Sign the data distribution agreements with large global data vendors.
4. Finalize upgrade of the Georgian Central Securities Depository clearing and settlement system, thus increasing efficiency of operations for large institutional investors and global custodians.
We continue promotion of IPO opportunities with potential Georgian issuers.
GEORGIAN STOCK EXCHANGE
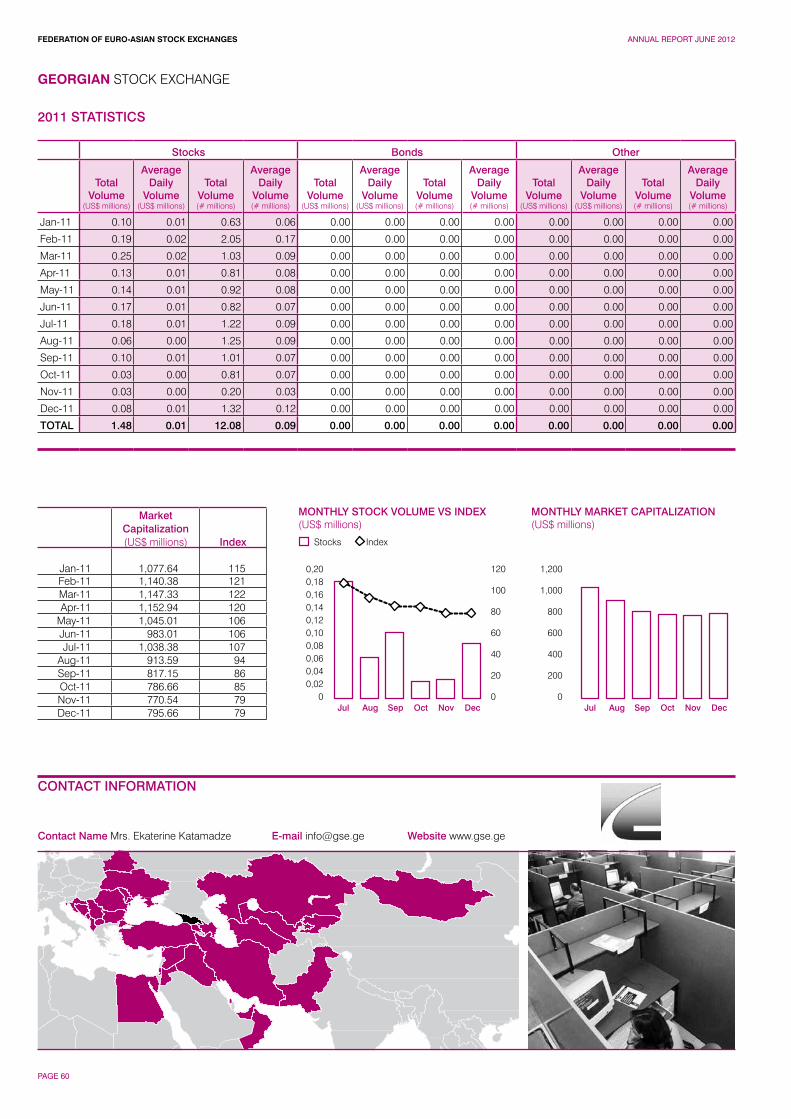
FEDERATION OF EURO-ASIAN STOCK EXCHANGES ANNUAL REPORT JUNE 2012
PAGE 60
GEORGIAN STOCK EXCHANGE
CONTACT INFORMATION
Contact Name Mrs. Ekaterine Katamadze E-mail [email protected] Website www.gse.ge
MONTHLY MARKET CAPITALIZATION(US$ millions)
0,200,180,160,140,120,100,080,060,040,02
0
120
100
80
60
40
20
0
1,200
1,000
800
600
400
200
0
Stocks
MONTHLY STOCK VOLUME VS INDEX(US$ millions)
Index
Jul JulAug AugSep SepOct OctNov NovDec Dec
2011 STATISTICS
Stocks Bonds Other
Total Volume
(US$ millions)
Average Daily
Volume(US$ millions)
Total Volume(# millions)
Average Daily
Volume(# millions)
Total Volume
(US$ millions)
Average Daily
Volume(US$ millions)
Total Volume(# millions)
Average Daily
Volume(# millions)
Total Volume
(US$ millions)
Average Daily
Volume(US$ millions)
Total Volume(# millions)
Average Daily
Volume(# millions)
Jan-11 0.10 0.01 0.63 0.06 0.00 0.00 0.00 0.00 0.00 0.00 0.00 0.00
Feb-11 0.19 0.02 2.05 0.17 0.00 0.00 0.00 0.00 0.00 0.00 0.00 0.00
Mar-11 0.25 0.02 1.03 0.09 0.00 0.00 0.00 0.00 0.00 0.00 0.00 0.00
Apr-11 0.13 0.01 0.81 0.08 0.00 0.00 0.00 0.00 0.00 0.00 0.00 0.00
May-11 0.14 0.01 0.92 0.08 0.00 0.00 0.00 0.00 0.00 0.00 0.00 0.00
Jun-11 0.17 0.01 0.82 0.07 0.00 0.00 0.00 0.00 0.00 0.00 0.00 0.00
Jul-11 0.18 0.01 1.22 0.09 0.00 0.00 0.00 0.00 0.00 0.00 0.00 0.00
Aug-11 0.06 0.00 1.25 0.09 0.00 0.00 0.00 0.00 0.00 0.00 0.00 0.00
Sep-11 0.10 0.01 1.01 0.07 0.00 0.00 0.00 0.00 0.00 0.00 0.00 0.00
Oct-11 0.03 0.00 0.81 0.07 0.00 0.00 0.00 0.00 0.00 0.00 0.00 0.00
Nov-11 0.03 0.00 0.20 0.03 0.00 0.00 0.00 0.00 0.00 0.00 0.00 0.00
Dec-11 0.08 0.01 1.32 0.12 0.00 0.00 0.00 0.00 0.00 0.00 0.00 0.00
TOTAL 1.48 0.01 12.08 0.09 0.00 0.00 0.00 0.00 0.00 0.00 0.00 0.00
MarketCapitalization(US$ millions) Index
Jan-11 1,077.64 115Feb-11 1,140.38 121Mar-11 1,147.33 122Apr-11 1,152.94 120
May-11 1,045.01 106Jun-11 983.01 106Jul-11 1,038.38 107
Aug-11 913.59 94Sep-11 817.15 86Oct-11 786.66 85Nov-11 770.54 79Dec-11 795.66 79
FEDERATION OF EURO-ASIAN STOCK EXCHANGES ANNUAL REPORT JUNE 2012
PAGE 61
Despite existing concerns that political process in Georgia may develop in unpredictable manner, fortunately, clear signs of increased stability and inevitability of elections process are in place. Today, practically there is no doubt that for political parties the next two years will be period of preparation to elections (parliamentary - 2012 and presidential - 2013), election campaigns and the related processes. This will definitely put grounds for stable political and economic development of the country.
No doubt, there still remain many political and social problems, first of all related with occupation of 20% of the country (Abkhazia and Tskhinvali region) by Russian military forces and the heaviest burden of about half million refugees from the mentioned regions. However, the likeliness of worsening of the situation is very low, though chances for restoring territorial integrity of the country in 2012 are also very low.
As for the economic situation, until mid-2008, the Georgian economy was growing rapidly, fueled by high levels of foreign direct investment and strong credit growth. But in August of that year, the armed conflict with Russia over the disputed Tskhinvali region proved a devastating setback for Georgia’s economy, prompting the authorities to request a US$ 750 million Stand-By Arrangement (SBA) from the IMF and to secure emergency financing from donors totaling US$ 4.5 billion for next three years. In the months that followed, Georgia’s difficulties were compounded by the impact of the global economic crisis. However, the country authorities’ economic program has been successful in putting a floor on the contraction of economic activity in 2009 and in restoring confidence. On the back of these achievements, the economic recovery that started in the second half of 2009 transferred into impressive growth in 2011.
According the National Statistics Office of Georgia in 2011, using the rapid estimation method, the yearly real GDP growth reached 6.8% (compared with projected 4.5%). The Trade turnover for 2011 reached US$9247 mln, up 36% y-o-y. Export grew faster than import and the Trade Balance Deficit share in trade turnover has downward trend since 2007. In 2011 the ratio narrowed down to 52.7%.
At a White House meeting on January 30, 2012, US President Barack Obama and Georgian President Mikheil Saakashvili have among other issues discussed security cooperation
and a possible free-trade agreement. President Obama told the Georgian leader that a free-trade agreement (FTA) with Tbilisi was a “possibility” and would be a “win-win” situation for both countries.
On November 22nd, 2011 Standard & Poor’s Ratings Services raised its long-term foreign and local currency ratings on the Government of Georgia to “BB-“ from “B+”. At the same time, the short-term foreign- and local-currency ratings were affirmed at ‘B’. The outlook on the ratings is stable. The recovery rating is ‘4’. The transfer and convertibility (T&C) assessment is ‘BB’. In accordance with the report, the upgrade reflects Georgia’s strong growth prospects and improving public finances. These strengths are underpinned by its commitment to market-oriented policies and its previous structural reforms and fiscal consolidation. The upgrade also reflects an important stabilization in Georgia’s geopolitical and domestic political environments.
S&P’s estimates that per capita GDP growth will average just over 6.0% during 2005-2014, above that of similarly rated peers. FDI inflows (averaging 6% of GDP annually) alongside public sector investment will support growth in tourism, agriculture, energy, and infrastructure. Georgia’s fiscal deficit has narrowed significantly to an estimated 3.7% of GDP in 2011. This is from 9.2% in 2009. S&P’s expects that the government will adhere to its newly legislated fiscal rules, which oblige it to reduce the deficit to 3.0% of GDP by 2013.
In December 2011 Fitch Ratings has upgraded Georgia’s Long-term foreign and local currency Issuer Default Ratings (IDR) to ‘BB-’ from ‘B+’. The Outlooks on the ratings are Stable. The agency has also upgraded the Country Ceiling to ‘BB’ and affirmed the Short-term foreign currency IDR at ‘B’. The rating on senior unsecured debt has been upgraded to ‘BB-’ from ‘B+’. According to Fitch:
• Real GDP is set to grow by an average of 5.5% in 2012-13, faster than the ‘BB’ median, as Georgia reaps the benefits of past structural reforms. Georgia is investing in infrastructure that will enable it to take full advantage of its role as a transit country for the region. Growth areas include hydroelectric power and tourism. Exports are diversified by product and by market, affording some resilience to slower global growth.
• Georgia has reduced its budget deficit to an estimated 3.7% of GDP in 2011, from 6.6% of GDP in 2010. The high share of capital spending and the government’s current surplus gives it further flexibility if needed.
• General government debt is set to decline in 2012-13 from the peak of 37% of GDP reached in 2010. Concessional terms bring down debt servicing costs relative to peers. Georgia has smoothed its maturity profile following a successful Eurobond issue in April 2011, whose proceeds were used to buy back the majority of a Eurobond maturing in 2013.
“The upgrade reflects Georgia’s strong growth performance, the government’s progress in reining in the fiscal deficit, a reduction in inflation and a rise in foreign exchange reserves,” says Charles Seville, Director in Fitch’s Sovereign team. “We consider the second in a row upgrade of Georgia by the rating agencies as yet another reflection of our continuous adherence to the market economy principles and the macro-economic prudence. This is very good news in the environment when there are too few good economic news on the global market.” commented Nika Gilauri, Prime Minister of Georgia.
As for the business climate in the country, the country has made remarkable strides over the last few years—the World Bank’s Doing Business Index ranks Georgia first in Eastern Europe and Central Asia and first among lower middle-income countries. Georgia has also moved up quickly through the ranks of Transparency International’s Corruption Perception Index, and there’s a general perception that interactions between the public and the government are now free of corruption.
GEORGIAN STOCK EXCHANGE
Key Information ContactsNational Bank of Georgia www.nbg.gov.geMinistry of Finance of Georgia www.mof.geGeorgian Central Securities Depository www.gcsd.geGeorgian Corporate Directors Association www.gcda.ge
CAPITAL MARKET DEVELOPMENT AND ECONOMIC OUTLOOK
FEDERATION OF EURO-ASIAN STOCK EXCHANGES ANNUAL REPORT JUNE 2012
PAGE 62
Taha Ahmed Abdul SalamCEO
Iraq Stock Exchange (ISX) has been established under the Law (74), on April 18th,2004 and started its operations in June 2004. The ISX operates under the oversight of the Iraq Securities Commission (ISC).The exchange is a self-regulated organization, independent financially and administratively from the Iraqi government, It is organized as a non-profit entity that is owned by its members, namely licensed brokerage firms. It is regulated by the Iraq Securities Commission and follows the operational procedures outlined in its by-laws that are fully compliant with the IraqiSecurities Law.
ISX started operations in 2004 with manual trading till April 2009. Since April 18th, 2009 till now ISX has been using Automation trading, holding five sessions weekly from Sunday to Thursday. ISX introduced a new index in June 2010 after the Automation went live. ISX has organized a number of training courses for Brokerage firms and training courses for the IT staff and other ISX employees. These trainingcourses include Automation Trading in ISX and run TWS for the brokers, (Equator & Horizon SYSTEMS).
The ISX publishes a monthly newsletter called the Capital Market. Published in Arabic, the Capital Market covers all financial events within the ISX and the listed companies. ISX also update its information through the website: www.isx-iq.net. The ISX has successfully joined FEAS (Federation of Euro-Asia Stock Exchanges) on September 21st, 2005, and the Federation of Arab Stock Exchange in June 2006.
HISTORY AND DEVELOPMENT
1. For the period of 1992-2003 the Baghdad Stock Exchange was operating and was well known.
The previous Baghdad Stock Exchange was established by the law No. 24 in 1991. The market was related to the government and it listed (113) different companies, some private and others from the mixed sector. During that period, especially in 2003, the market had gained an annual trading volume exceeding, US$17.5 million. However, this market was closed by a decision of its Governing Council in March 19, 2003.
2. Establishment of Iraq Stock Exchange On 18 of April 2004, the temporary law
No. 74 was issued. It gave the authority to establish two important capital development bodies concerning financial sectors, they are:
A. Iraq Stock Exchange (ISX). B. Iraq Security Commission (ISC).
3. Meaning of Iraq Stock Exchange The ISX is an entity capital market not
related or powered by the government. It is directed by a Board of Governors (BOG) and consists of nine members, representing different economic sectors of investment.
The market is where the investments, exchange stocks, purchasing and selling takes place. It is considered one of the channels in which funds can flow between persons and commissions through different sectors that may help to mobilize and develop financing and financial channels in order to give readiness for different investments.
FUTURE OUTLOOK
1. Organizing (232) trading sessions in average five sessions weekly, and supervised and accurate trading dealings according to rules and electronic trading instructions and disclosure about transactions based the on the effected ratios and Special orders.
2. Publishing daily tickers on ISX Website during trading sessions which has been started in December 2011.
3. Issuing (232) end-of-session daily reports and yearly reports on ISX Website in addition to publishing listed companies guide and financial statements.
4. End-of-session prices published by Bloomberg and Thomson Routers starting from January 2012.
5. Monitoring, surveillance of trading limitations using Cap Formula T+0 which is supposed to be changed to new Clearing and Settlement Cap Formula T+2 instead of current formula T+ 0 after the ISC approval of the Custodian Banks regulations.Inspection plans for all brokerage firms to check files and documents integrity.
6. Electronic trading support for Al-Rabee Brokerage branch in Erbil and Sulimaniya Erbil branch started electronic trading through ISX system since May, 2011.
7. However, Iraq Stock exchange will support any brokerage firms planning to have
branches in other governorates.
8. Encouraging the non-listed companies to be listed in ISX.
9. Inviting new firms and select the best five for 2012 to be licensed as brokerage firms.
10. Upgrade ISX electronic trading system to new advanced version from OMX NASDAQ.
11. Representing Iraq Stock Exchange in relevant conferences locally and globally.
12. Holding workshops to educate and encourage investment in ISX.
ISX introduced a new index in June 2010 after the Automation went live.
IRAQ STOCK EXCHANGE
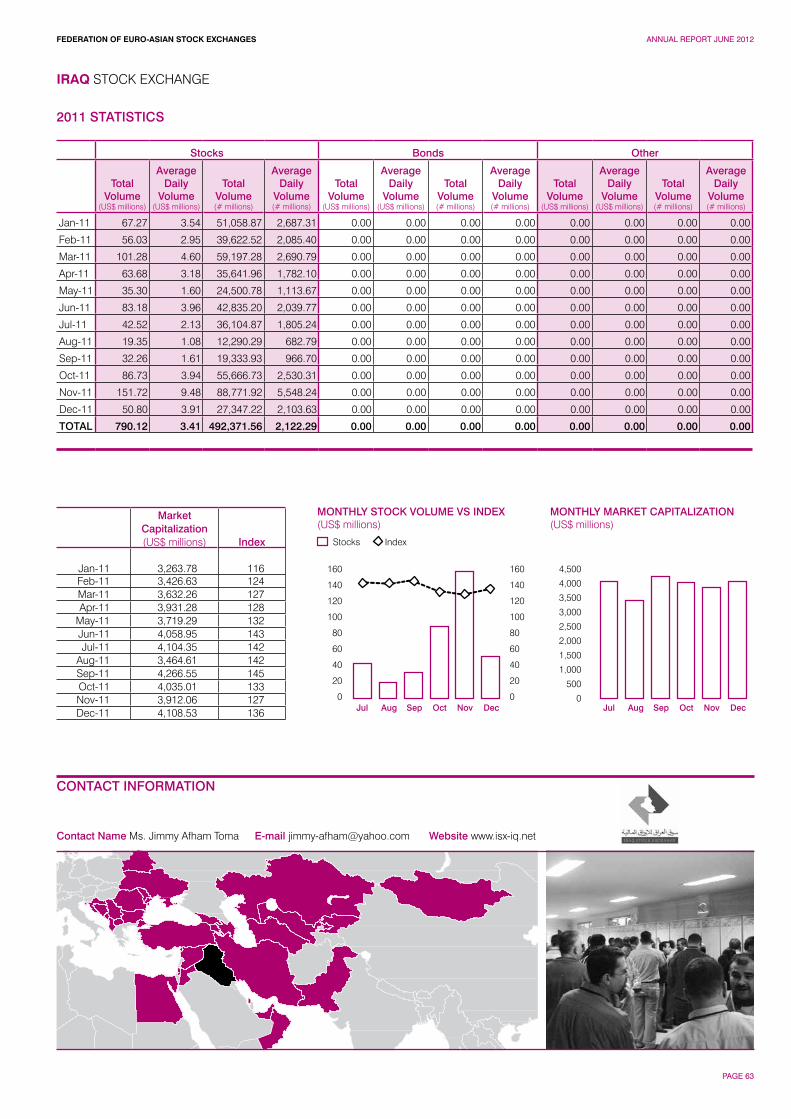
FEDERATION OF EURO-ASIAN STOCK EXCHANGES ANNUAL REPORT JUNE 2012
PAGE 63
IRAQ STOCK EXCHANGE
CONTACT INFORMATION
Contact Name Ms. Jimmy Afham Toma E-mail [email protected] Website www.isx-iq.net
MONTHLY MARKET CAPITALIZATION(US$ millions)
160
140
120
100
80
60
40
20
0
160
140
120
100
80
60
40
20
0
4,500
4,000
3,500
3,000
2,500
2,000
1,500
1,000
500
0
Stocks
MONTHLY STOCK VOLUME VS INDEX(US$ millions)
Index
Jul JulAug AugSep SepOct OctNov NovDec Dec
2011 STATISTICS
Stocks Bonds Other
Total Volume
(US$ millions)
Average Daily
Volume(US$ millions)
Total Volume(# millions)
Average Daily
Volume(# millions)
Total Volume
(US$ millions)
Average Daily
Volume(US$ millions)
Total Volume(# millions)
Average Daily
Volume(# millions)
Total Volume
(US$ millions)
Average Daily
Volume(US$ millions)
Total Volume(# millions)
Average Daily
Volume(# millions)
Jan-11 67.27 3.54 51,058.87 2,687.31 0.00 0.00 0.00 0.00 0.00 0.00 0.00 0.00
Feb-11 56.03 2.95 39,622.52 2,085.40 0.00 0.00 0.00 0.00 0.00 0.00 0.00 0.00
Mar-11 101.28 4.60 59,197.28 2,690.79 0.00 0.00 0.00 0.00 0.00 0.00 0.00 0.00
Apr-11 63.68 3.18 35,641.96 1,782.10 0.00 0.00 0.00 0.00 0.00 0.00 0.00 0.00
May-11 35.30 1.60 24,500.78 1,113.67 0.00 0.00 0.00 0.00 0.00 0.00 0.00 0.00
Jun-11 83.18 3.96 42,835.20 2,039.77 0.00 0.00 0.00 0.00 0.00 0.00 0.00 0.00
Jul-11 42.52 2.13 36,104.87 1,805.24 0.00 0.00 0.00 0.00 0.00 0.00 0.00 0.00
Aug-11 19.35 1.08 12,290.29 682.79 0.00 0.00 0.00 0.00 0.00 0.00 0.00 0.00
Sep-11 32.26 1.61 19,333.93 966.70 0.00 0.00 0.00 0.00 0.00 0.00 0.00 0.00
Oct-11 86.73 3.94 55,666.73 2,530.31 0.00 0.00 0.00 0.00 0.00 0.00 0.00 0.00
Nov-11 151.72 9.48 88,771.92 5,548.24 0.00 0.00 0.00 0.00 0.00 0.00 0.00 0.00
Dec-11 50.80 3.91 27,347.22 2,103.63 0.00 0.00 0.00 0.00 0.00 0.00 0.00 0.00
TOTAL 790.12 3.41 492,371.56 2,122.29 0.00 0.00 0.00 0.00 0.00 0.00 0.00 0.00
MarketCapitalization(US$ millions) Index
Jan-11 3,263.78 116Feb-11 3,426.63 124Mar-11 3,632.26 127Apr-11 3,931.28 128
May-11 3,719.29 132Jun-11 4,058.95 143Jul-11 4,104.35 142
Aug-11 3,464.61 142Sep-11 4,266.55 145Oct-11 4,035.01 133Nov-11 3,912.06 127Dec-11 4,108.53 136
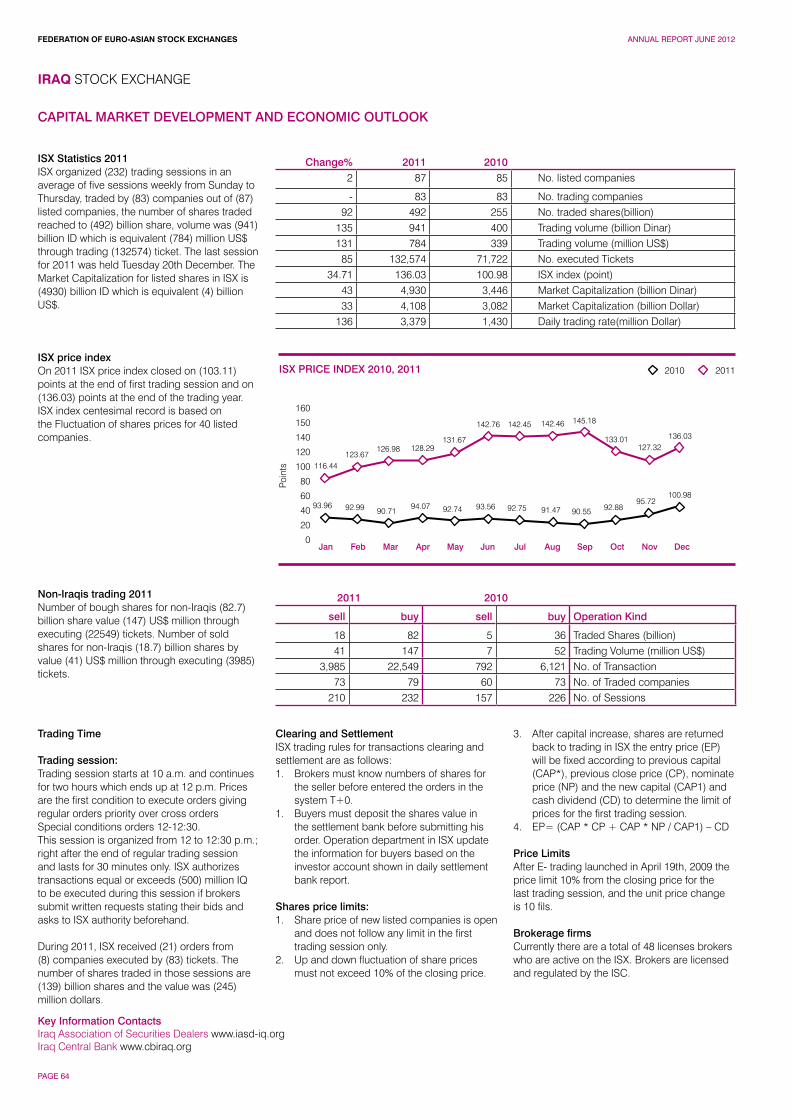
FEDERATION OF EURO-ASIAN STOCK EXCHANGES ANNUAL REPORT JUNE 2012
PAGE 64
ISX Statistics 2011ISX organized (232) trading sessions in an average of five sessions weekly from Sunday to Thursday, traded by (83) companies out of (87) listed companies, the number of shares traded reached to (492) billion share, volume was (941) billion ID which is equivalent (784) million US$ through trading (132574) ticket. The last session for 2011 was held Tuesday 20th December. The Market Capitalization for listed shares in ISX is (4930) billion ID which is equivalent (4) billion US$.
ISX price index On 2011 ISX price index closed on (103.11) points at the end of first trading session and on (136.03) points at the end of the trading year.ISX index centesimal record is based on the Fluctuation of shares prices for 40 listed companies.
Non-Iraqis trading 2011Number of bough shares for non-Iraqis (82.7) billion share value (147) US$ million through executing (22549) tickets. Number of sold shares for non-Iraqis (18.7) billion shares by value (41) US$ million through executing (3985) tickets.
IRAQ STOCK EXCHANGE
Key Information ContactsIraq Association of Securities Dealers www.iasd-iq.orgIraq Central Bank www.cbiraq.org
CAPITAL MARKET DEVELOPMENT AND ECONOMIC OUTLOOK
Change% 2011 2010 2 87 85 No. listed companies
- 83 83 No. trading companies92 492 255 No. traded shares(billion)
135 941 400 Trading volume (billion Dinar)131 784 339 Trading volume (million US$)
85 132,574 71,722 No. executed Tickets 34.71 136.03 100.98 ISX index (point)
43 4,930 3,446 Market Capitalization (billion Dinar) 33 4,108 3,082 Market Capitalization (billion Dollar)
136 3,379 1,430 Daily trading rate(million Dollar)
2011 2010
sell buy sell buy Operation Kind
18 82 5 36 Traded Shares (billion)41 147 7 52 Trading Volume (million US$)
3,985 22,549 792 6,121 No. of Transaction73 79 60 73 No. of Traded companies
210 232 157 226 No. of Sessions
Trading Time
Trading session: Trading session starts at 10 a.m. and continues for two hours which ends up at 12 p.m. Prices are the first condition to execute orders giving regular orders priority over cross ordersSpecial conditions orders 12-12:30. This session is organized from 12 to 12:30 p.m.; right after the end of regular trading session and lasts for 30 minutes only. ISX authorizes transactions equal or exceeds (500) million IQ to be executed during this session if brokers submit written requests stating their bids and asks to ISX authority beforehand.
During 2011, ISX received (21) orders from (8) companies executed by (83) tickets. The number of shares traded in those sessions are (139) billion shares and the value was (245) million dollars.
Clearing and Settlement ISX trading rules for transactions clearing and settlement are as follows: 1. Brokers must know numbers of shares for
the seller before entered the orders in the system T+0.
1. Buyers must deposit the shares value in the settlement bank before submitting his order. Operation department in ISX update the information for buyers based on the investor account shown in daily settlement bank report.
Shares price limits:1. Share price of new listed companies is open
and does not follow any limit in the first trading session only.
2. Up and down fluctuation of share prices must not exceed 10% of the closing price.
3. After capital increase, shares are returned back to trading in ISX the entry price (EP) will be fixed according to previous capital (CAP*), previous close price (CP), nominate price (NP) and the new capital (CAP1) and cash dividend (CD) to determine the limit of prices for the first trading session.
4. EP= (CAP * CP + CAP * NP / CAP1) – CD
Price LimitsAfter E- trading launched in April 19th, 2009 the price limit 10% from the closing price for the last trading session, and the unit price change is 10 fils.
Brokerage firmsCurrently there are a total of 48 licenses brokers who are active on the ISX. Brokers are licensed and regulated by the ISC.
Jan
160
150
140
120
100
80
60
40
20
0
ISX PRICE INDEX 2010, 2011
Feb Mar Apr May Jun Jul Aug Sep Oct Nov Dec
Poin
ts
2010 2011
116.44
93.96 92.99 90.7194.07 92.74 93.56 92.75 91.47 90.55 92.88
95.72100.98
123.67126.98 128.29
131.67
142.76 142.45 142.46 145.18
133.01127.32
136.03
FEDERATION OF EURO-ASIAN STOCK EXCHANGES ANNUAL REPORT JUNE 2012
PAGE 65
Osman Sarac Chairman
Istanbul Gold Exchange targets to stimulate local business and international attention with all other globally competitive enterprises which will provide Turkey to be a central hub for the gold business, due to its strategic position, as it lies in the heart of a major gold trade area, exposed to Middle East, Europe and Gulf States.
In 2011 we have managed technical infrastructural studies as well as market structures and gold backed financial instruments studies. We have been making important steps to integrate international communities.
For the integration of the Exchange to the international markets, there have been important steps since 2007. In March 2008 we have been an associate member to London Bullion Market Association, by May 2008 we
have joined World Federation of Diamond Bourses, by February 2010, we are honored to be part of a large family with distinguished members, FEAS as an affiliate member. The Exchange became a member of the Kimberley Process Certification Scheme (KPCS), in August 2007, which aims to curb the flow of conflict diamonds, with 49 participants worldwide.
The Turkish gold jewelry market has undergone a major revival since the early 1990s with the traditional and long-standing historical affinity for gold jewelry adjusted for modern tastes. Turkey is now the world’s fourth largest market for gold jewelry, third largest manufacturing centre and second biggest exporter.
The annual export is estimated at US$ 3.3 billion, part of which is from gold bars and other way of direct jewelry exports to wholesalers
and retailers abroad while the bulk comes from sales to tourists sold in the local market. By 2011, by the increase of gold prices since 2007 huge amount of gold came to the market as scrap and Turkey turned to be an exporter of gold in the market. The supply of scrap gold to the market continued in 2011 and an annual amount of 90-100 tons of gold was supplied to the market.
The annual amount of gold imported to Turkey through IGE was 79 tons with a rise of 42.9 tons from 2010 which represented a rise of 88% y-o-y. The silver import of IGE was to be 42 tons with a rise of 22 tons from 2010 which represented a rise of 113% y-o-y. The amount of rises in demand of gold and silver depend on the economic recovery in 2011 and raise of consuming demand in gold and silver as investment tool in banking system as well as jewelry sector.
GENERAL INFORMATION
Istanbul Gold Exchange is a state institution which has an autonomous system for precious metals trading in organized market conditions with time and price priority. Gold prices on the Istanbul Gold Exchange are determined by the market generally reflecting trends in international prices. Members of Istanbul Gold Exchange are authorized to import gold to Turkey.
Services Provided• Spot gold. Silver, platinum and palladium
trading. • Diamond and Precious Stones Market,• Precious Metals Lending Market
transactions. • Physical settlement of the transactions. • Depository for the precious metals belonging
to mutual funds and gold ETF in Turkey. • Depository for individual investors. • Authority for Kimberley Process Certification
Scheme for rough diamonds in Turkey. • Determination of local and international
Precious Metals Refineries whose products can be imported to Turkey and be transacted in the Exchange.
Brief HistoryIstanbul Gold Exchange began its operations on July 26, 1995. The Exchange has two types of markets: Precious Metals Market, Precious
Metal Lending Market. In markets, standard and non-standard gold, silver and platinum are traded.
Spot gold trading started at the opening of the Exchange. Silver and non standard precious metals started to trade in 1999. Precious Metals Lending Market started its operations in Istanbul Gold Exchange on March 24, 2000 for the purpose of bringing supply and demand into an organized market, lowering the production costs of the jewellery sector and securitization of gold.
Domestic or foreign banks, precious metals companies, currency offices, precious metals producing and marketing companies and precious metals refineries that obtained the membership certificate from the Under-Secretariat of Turkish Treasury and complied with the requirements set forth by the IGE Board of Directors can trade on the Exchange.
There are 88 members consisting of 22 banks, 35 Exchange Offices, 21 Precious Metals Brokerage Houses and 10 Precious Metals producing and marketing companies.
Form of Settlement and TransfersThrough member accounts by Clearing Center and determined Clearing Bank
Legal StatusState Institution
Settlement PeriodFrom T+0 up to T+9
Regulated by• State Ministry • Undersecretariat of Treasury
Board of Directors: 5 Members• President of the Exchange • Vakifbank T.A.O (Bank)• Atasay Kiymetli Madenler A.S. (Precious
Metals Brokerage House)• Istanbul Altin Rafinerisi A.S. (Precious Metals
Refinery)• Kuveyt Türk Katılım Bankası A.S. (Bank)
Memberships to International Organizations• London Bullion Market Association (LBMA)• World Federation of Diamond Bourses
(WFDB) • Federation of Euro-Asian Stock Exchanges
(FEAS)
FUTURE OUTLOOK
In 2012 IGE intends to:
• To complete the new infrastructure for internet based 24 hours trading.
• Establish the customer based ordering trading system and mobile trading system
• Establishment and implementation of Base Metals Market in IGE.
• Establishment and implementation of Currency Market in the Exchange.
• Establishment and implementation of Carbon Rights and Licenses Market in the Exchange.
In 2011 we have managed technical infrastructural studies as well as market structures and gold backed financial instruments studies.
ISTANBUL GOLD EXCHANGE
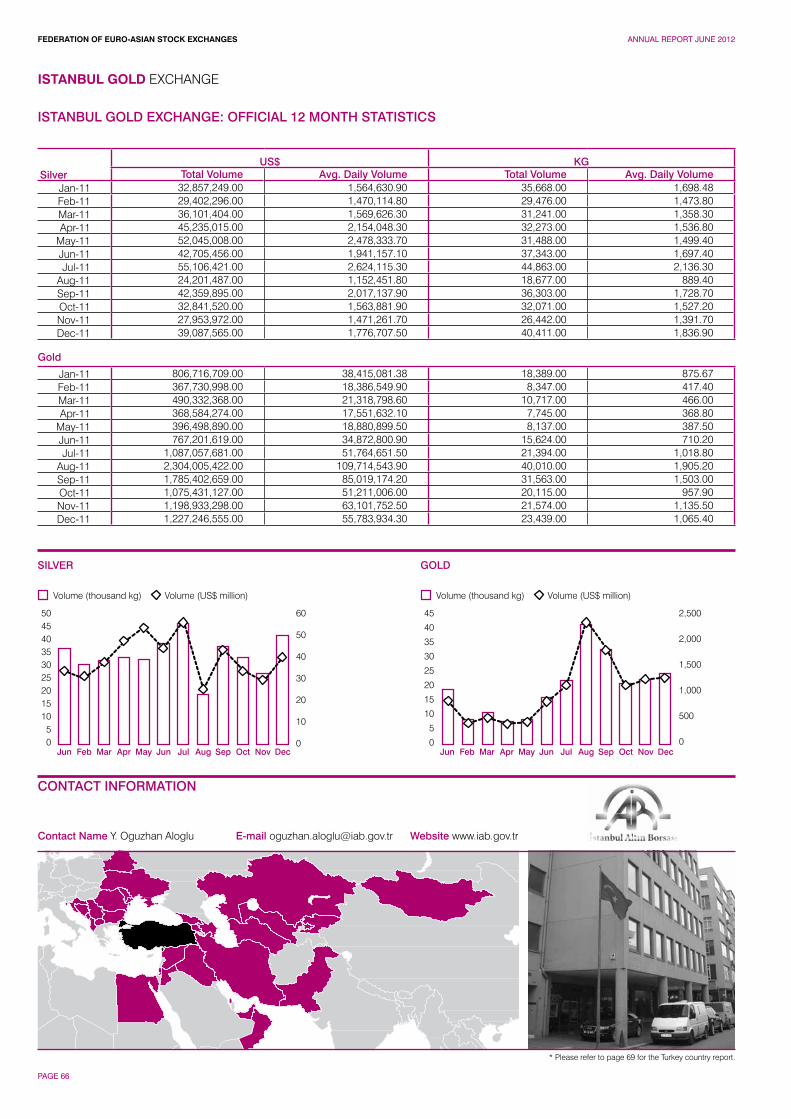
FEDERATION OF EURO-ASIAN STOCK EXCHANGES ANNUAL REPORT JUNE 2012
PAGE 66
45
40
35
30
25
20
15
10
5
0
2,500
2,000
1,500
1,000
500
0
Volume (thousand kg)
GOLD
Volume (US$ million)
JulJunMayAprMarFebJun Aug Sep Oct Nov Dec
504540353025201510
50
60
50
40
30
20
10
0
Volume (thousand kg)
SILVER
Volume (US$ million)
JulJunMayAprMarFebJun Aug Sep Oct Nov Dec
ISTANBUL GOLD EXCHANGE
ISTANBUL GOLD EXCHANGE: OFFICIAL 12 MONTH STATISTICS
Silver US$ KG
Total Volume Avg. Daily Volume Total Volume Avg. Daily VolumeJan-11 32,857,249.00 1,564,630.90 35,668.00 1,698.48Feb-11 29,402,296.00 1,470,114.80 29,476.00 1,473.80Mar-11 36,101,404.00 1,569,626.30 31,241.00 1,358.30Apr-11 45,235,015.00 2,154,048.30 32,273.00 1,536.80
May-11 52,045,008.00 2,478,333.70 31,488.00 1,499.40Jun-11 42,705,456.00 1,941,157.10 37,343.00 1,697.40Jul-11 55,106,421.00 2,624,115.30 44,863.00 2,136.30
Aug-11 24,201,487.00 1,152,451.80 18,677.00 889.40Sep-11 42,359,895.00 2,017,137.90 36,303.00 1,728.70Oct-11 32,841,520.00 1,563,881.90 32,071.00 1,527.20Nov-11 27,953,972.00 1,471,261.70 26,442.00 1,391.70Dec-11 39,087,565.00 1,776,707.50 40,411.00 1,836.90
Gold
Jan-11 806,716,709.00 38,415,081.38 18,389.00 875.67Feb-11 367,730,998.00 18,386,549.90 8,347.00 417.40 Mar-11 490,332,368.00 21,318,798.60 10,717.00 466.00Apr-11 368,584,274.00 17,551,632.10 7,745.00 368.80
May-11 396,498,890.00 18,880,899.50 8,137.00 387.50Jun-11 767,201,619.00 34,872,800.90 15,624.00 710.20Jul-11 1,087,057,681.00 51,764,651.50 21,394.00 1,018.80
Aug-11 2,304,005,422.00 109,714,543.90 40,010.00 1,905.20Sep-11 1,785,402,659.00 85,019,174.20 31,563.00 1,503.00Oct-11 1,075,431,127.00 51,211,006.00 20,115.00 957.90Nov-11 1,198,933,298.00 63,101,752.50 21,574.00 1,135.50Dec-11 1,227,246,555.00 55,783,934.30 23,439.00 1,065.40
CONTACT INFORMATION
Contact Name Y. Oguzhan Aloglu E-mail [email protected] Website www.iab.gov.tr
* Please refer to page 69 for the Turkey country report.
FEDERATION OF EURO-ASIAN STOCK EXCHANGES ANNUAL REPORT JUNE 2012
PAGE 67
İbrahim TurhanChairman & CEO
İstanbul Menkul Kıymetler Borsası (İMKB) works together with all its stakeholders to move forward with the mission of contributing to the development of the Turkish economy. As one of the key components of the financial system, with its US$ 261 billion market cap as of March 2012 and high growth potential, İMKB aims to improve the depth of the market further and to augment the amount of funds channeled to the economy.
The nationwide IPO Campaign, which has been underway for more than two years, has set to bearing fruits. In 2011, 27 companies went public resulting with the highest number of IPOs since 2000. Similarly, corporate bonds market has signaled a healthy growth as a result of decreased public sector borrowing requirements. The dynamism brought to the market by the IPO Campaign has also influenced foreign companies. This influence can be observes when referring to the listing applications we have received from foreign companies.
İMKB has registered a success story in government debt securities market as well. The exchange hosts virtually 4/5th of the trading
volume in fixed income securities and the over-the-counter market transactions of government securities run in small quantities. In terms of traded value, the ISE Bonds and Bills Market is one of the top ten markets of the world in 2011.
İMKB has sustained its immense efforts to improve sustained efforts to markets operations and surveillance for market efficiency and integrity. In due respect, automatic circuit breaker system has been put in place along with continuous auction with or without market makers and single price auction methods, order cancellation, and reduced price ticks. Anonymity of order executers has been another policy action so as to support a more effective price formation and to prevent adverse market movements.
İMKB has subscribed to innovative ideas and policies. In line with the efforts to offer new markets and financial instruments to investors, a market for trading of warrants of financial intermediaries has been launched. Emerging Companies Market for SMEs has been initiated, and three sub- markets under the Bonds and Bills Market (the Offerings Market for Qualified Investors, the Repo Market for Specified
Securities and the Interbank Repo Market) have been introduced. Equity repo market will up and running before the end of the year.
The Istanbul International Financial Center (IFC) strategy plays an essential role in delivering a roadmap for the financial industry towards making Istanbul a global center of economy and commerce. İMKB constitutes the backbone of this multi-pronged strategy towards targets for listing and trading.
Putting all these in a context, innovation, investors and issuers will be the three main pillars paving the way of İMKB. The commitment to working with the regulators, intermediaries, fund managers and other involved parties to devise new products and markets will be the denominator for innovation. İMKB will engage more in the public offering initiative by putting the corporate governance and sustainability at the forefront. Meanwhile, the joint action of all parties on investor awareness and financial literacy will underpin the efforts to strengthen the demand side. It is our firm belief that the concerted efforts of the sectoral institutions will lead us to create synergy and success on all the targeted areas.
HISTORY AND DEVELOPMENT
In 1981, the Capital Market Law was enacted and one year later, the Capital Markets Board was established. In October 1984, the Parliament approved the Regulations for the Establishment and Operations of Securities Exchanges and İMKB was formally inaugurated in 1985.
İMKB provides a fair and transparent marketplace for trading of a wide variety of securities from stocks, exchange traded funds, warrants to government bonds, Treasury bills, corporate bonds, money market instruments (repo/reverse repo) and foreign securities. Currently, there are four markets operating at the İMKB; the Stock Market, the Bonds and Bills Market, the Foreign Securities Market and the Emerging Companies Market. İMKB was recognized as a “Designated Offshore Securities Market” by the U.S. Securities and Exchange Commission in 1993, and was designated as an “appropriate foreign investment market for private and institutional Japanese investors” by the Japan Securities Dealers Association in 1995. İMKB has been
approved by the Austrian Ministry of Finance as a regulated market in accordance with the regulations of the Austrian Investment Fund Act in 2000. Foreign investors now account for a substantial volume of daily trading and hold around 62% of the publicly-held stocks in their portfolios amounting to US$ 45.6 billion, as of end-2011.
İMKB currently owns 32.63% of the İMKB Settlement and Custody Bank, 30% of the Central Registry Agency and 18% of the Turkish Derivatives Exchange. On the international level, İMKB has participations in the Kyrgyz Stock Exchange, Baku Stock Exchange and Sarajevo Stock Exchange with stakes of 24.51%, 5.26% and 5% respectively.
FUTURE OUTLOOK
• İMKB is planning to introduce a closing session at the Stock Market by the end January 2012.
• The technical infrastructure of the Stock Market Trading System is planned to be changed for better market efficiency.
• İMKB is steering a joint initiative for creating an order routing platform to serve as a single access point from and to the local as well as regional exchanges. This platform will consolidate the liquidity of the local and regional markets and as a consequence, contribute to the global recognition of the local securities industry.
• İMKB is planning to launch the Equity Repo Market. Another plan is planning to introduce the market-maker system for the private sector borrowing instruments.
• “İMKB Sustainability Index” is planned to be completed in 2012.
• İMKB, along with other sectoral institutions initiated an IPO Campaign in 2010. Similar events were organized in 2011 as well. This year İMKB also initiated an “Investor Campaign”, aimed at attracting savings to capital markets.
In 2011, 27 companies went public resulting with the highest number of IPOs since 2000.
İSTANBUL MENKUL KIYMETLER BORSASI
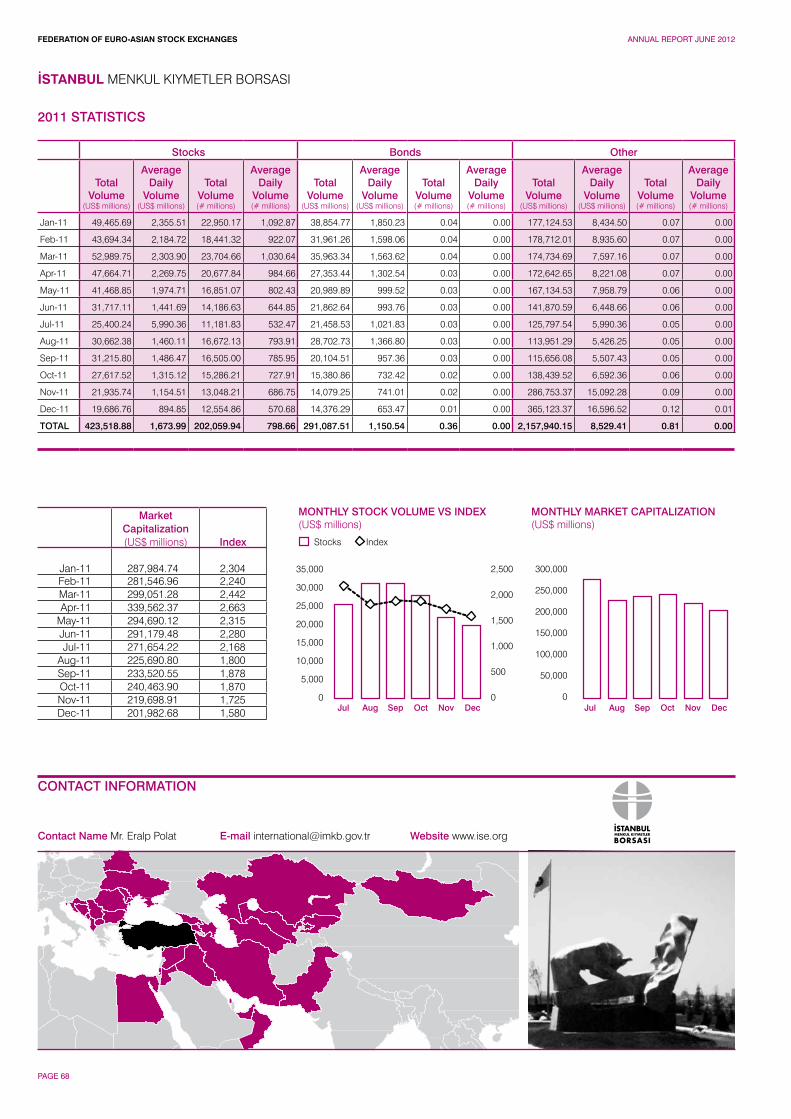
FEDERATION OF EURO-ASIAN STOCK EXCHANGES ANNUAL REPORT JUNE 2012
PAGE 68
Contact Name Mr. Eralp Polat E-mail [email protected] Website www.ise.org
İSTANBUL MENKUL KIYMETLER BORSASI
CONTACT INFORMATION
MONTHLY MARKET CAPITALIZATION(US$ millions)
35,000
30,000
25,000
20,000
15,000
10,000
5,000
0
2,500
2,000
1,500
1,000
500
0
300,000
250,000
200,000
150,000
100,000
50,000
0
Stocks
MONTHLY STOCK VOLUME VS INDEX(US$ millions)
Index
Jul JulAug AugSep SepOct OctNov NovDec Dec
2011 STATISTICS
Stocks Bonds Other
Total Volume
(US$ millions)
Average Daily
Volume(US$ millions)
Total Volume(# millions)
Average Daily
Volume(# millions)
Total Volume
(US$ millions)
Average Daily
Volume(US$ millions)
Total Volume(# millions)
Average Daily
Volume(# millions)
Total Volume
(US$ millions)
Average Daily
Volume(US$ millions)
Total Volume(# millions)
Average Daily
Volume(# millions)
Jan-11 49,465.69 2,355.51 22,950.17 1,092.87 38,854.77 1,850.23 0.04 0.00 177,124.53 8,434.50 0.07 0.00
Feb-11 43,694.34 2,184.72 18,441.32 922.07 31,961.26 1,598.06 0.04 0.00 178,712.01 8,935.60 0.07 0.00
Mar-11 52,989.75 2,303.90 23,704.66 1,030.64 35,963.34 1,563.62 0.04 0.00 174,734.69 7,597.16 0.07 0.00
Apr-11 47,664.71 2,269.75 20,677.84 984.66 27,353.44 1,302.54 0.03 0.00 172,642.65 8,221.08 0.07 0.00
May-11 41,468.85 1,974.71 16,851.07 802.43 20,989.89 999.52 0.03 0.00 167,134.53 7,958.79 0.06 0.00
Jun-11 31,717.11 1,441.69 14,186.63 644.85 21,862.64 993.76 0.03 0.00 141,870.59 6,448.66 0.06 0.00
Jul-11 25,400.24 5,990.36 11,181.83 532.47 21,458.53 1,021.83 0.03 0.00 125,797.54 5,990.36 0.05 0.00
Aug-11 30,662.38 1,460.11 16,672.13 793.91 28,702.73 1,366.80 0.03 0.00 113,951.29 5,426.25 0.05 0.00
Sep-11 31,215.80 1,486.47 16,505.00 785.95 20,104.51 957.36 0.03 0.00 115,656.08 5,507.43 0.05 0.00
Oct-11 27,617.52 1,315.12 15,286.21 727.91 15,380.86 732.42 0.02 0.00 138,439.52 6,592.36 0.06 0.00
Nov-11 21,935.74 1,154.51 13,048.21 686.75 14,079.25 741.01 0.02 0.00 286,753.37 15,092.28 0.09 0.00
Dec-11 19,686.76 894.85 12,554.86 570.68 14,376.29 653.47 0.01 0.00 365,123.37 16,596.52 0.12 0.01
TOTAL 423,518.88 1,673.99 202,059.94 798.66 291,087.51 1,150.54 0.36 0.00 2,157,940.15 8,529.41 0.81 0.00
MarketCapitalization(US$ millions) Index
Jan-11 287,984.74 2,304Feb-11 281,546.96 2,240Mar-11 299,051.28 2,442Apr-11 339,562.37 2,663
May-11 294,690.12 2,315Jun-11 291,179.48 2,280Jul-11 271,654.22 2,168
Aug-11 225,690.80 1,800Sep-11 233,520.55 1,878Oct-11 240,463.90 1,870Nov-11 219,698.91 1,725Dec-11 201,982.68 1,580
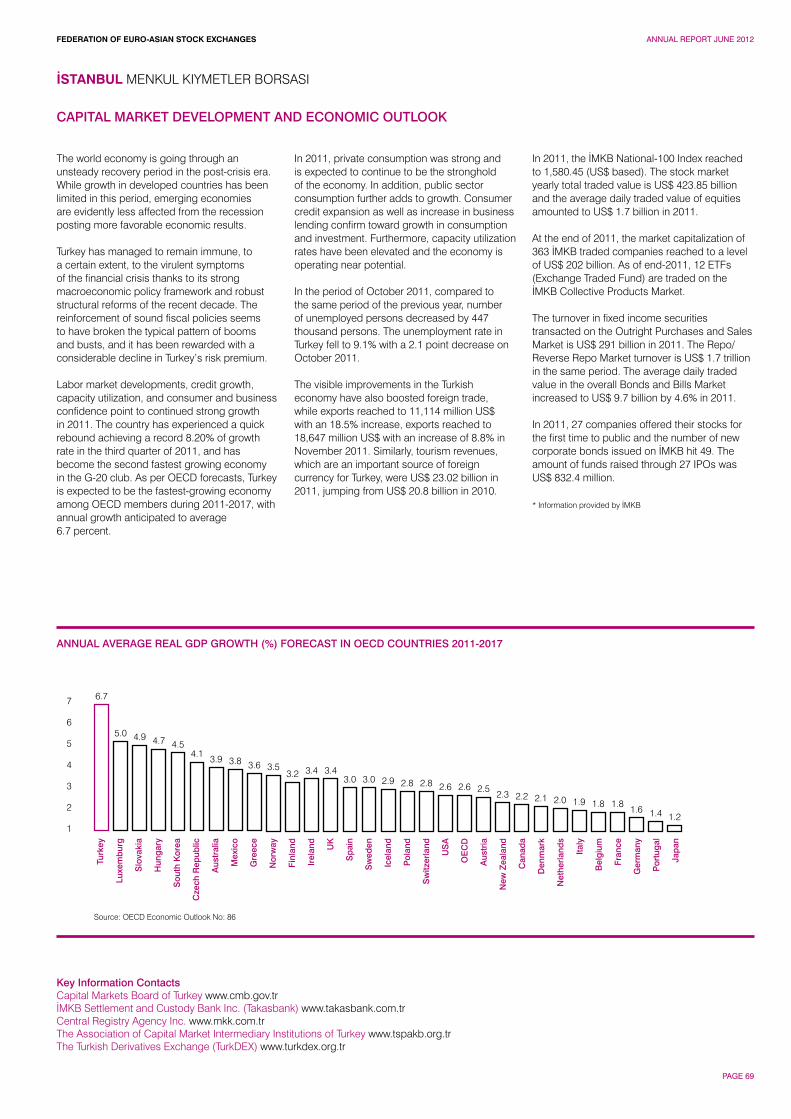
FEDERATION OF EURO-ASIAN STOCK EXCHANGES ANNUAL REPORT JUNE 2012
PAGE 69
The world economy is going through an unsteady recovery period in the post-crisis era. While growth in developed countries has been limited in this period, emerging economies are evidently less affected from the recession posting more favorable economic results.
Turkey has managed to remain immune, to a certain extent, to the virulent symptoms of the financial crisis thanks to its strong macroeconomic policy framework and robust structural reforms of the recent decade. The reinforcement of sound fiscal policies seems to have broken the typical pattern of booms and busts, and it has been rewarded with a considerable decline in Turkey’s risk premium.
Labor market developments, credit growth, capacity utilization, and consumer and business confidence point to continued strong growth in 2011. The country has experienced a quick rebound achieving a record 8.20% of growth rate in the third quarter of 2011, and has become the second fastest growing economy in the G-20 club. As per OECD forecasts, Turkey is expected to be the fastest-growing economy among OECD members during 2011-2017, with annual growth anticipated to average 6.7 percent.
In 2011, private consumption was strong and is expected to continue to be the stronghold of the economy. In addition, public sector consumption further adds to growth. Consumer credit expansion as well as increase in business lending confirm toward growth in consumption and investment. Furthermore, capacity utilization rates have been elevated and the economy is operating near potential.
In the period of October 2011, compared to the same period of the previous year, number of unemployed persons decreased by 447 thousand persons. The unemployment rate in Turkey fell to 9.1% with a 2.1 point decrease on October 2011.
The visible improvements in the Turkish economy have also boosted foreign trade, while exports reached to 11,114 million US$ with an 18.5% increase, exports reached to 18,647 million US$ with an increase of 8.8% in November 2011. Similarly, tourism revenues, which are an important source of foreign currency for Turkey, were US$ 23.02 billion in 2011, jumping from US$ 20.8 billion in 2010.
In 2011, the İMKB National-100 Index reached to 1,580.45 (US$ based). The stock market yearly total traded value is US$ 423.85 billion and the average daily traded value of equities amounted to US$ 1.7 billion in 2011.
At the end of 2011, the market capitalization of 363 İMKB traded companies reached to a level of US$ 202 billion. As of end-2011, 12 ETFs (Exchange Traded Fund) are traded on the İMKB Collective Products Market.
The turnover in fixed income securities transacted on the Outright Purchases and Sales Market is US$ 291 billion in 2011. The Repo/Reverse Repo Market turnover is US$ 1.7 trillion in the same period. The average daily traded value in the overall Bonds and Bills Market increased to US$ 9.7 billion by 4.6% in 2011.
In 2011, 27 companies offered their stocks for the first time to public and the number of new corporate bonds issued on İMKB hit 49. The amount of funds raised through 27 IPOs was US$ 832.4 million.
* Information provided by İMKB
İSTANBUL MENKUL KIYMETLER BORSASI
Key Information ContactsCapital Markets Board of Turkey www.cmb.gov.tr İMKB Settlement and Custody Bank Inc. (Takasbank) www.takasbank.com.tr Central Registry Agency Inc. www.mkk.com.tr The Association of Capital Market Intermediary Institutions of Turkey www.tspakb.org.tr The Turkish Derivatives Exchange (TurkDEX) www.turkdex.org.tr
ANNUAL AVERAGE REAL GDP GROWTH (%) FORECAST IN OECD COUNTRIES 2011-2017
7
6
5
4
3
2
1
Turk
ey
Luxe
mb
urg
Slo
vaki
a
Hun
gar
y
Sou
th K
orea
Cze
ch R
epub
lic
Aus
tral
ia
Mex
ico
Gre
ece
Nor
way
Finl
and
Irel
and
UK
Sp
ain
Sw
eden
Icel
and
Pol
and
Sw
itzer
land
US
A
OE
CD
Aus
tria
New
Zea
land
Can
ada
Den
mar
k
Net
herl
and
s
Italy
Bel
giu
m
Fran
ce
Ger
man
y
Por
tug
al
Jap
an
Source: OECD Economic Outlook No: 86
6.7
5.0 4.9 4.7 4.54.1 3.9 3.8 3.6 3.5
3.2 3.4 3.43.0 3.0 2.9 2.8 2.8 2.6 2.6 2.5
2.3 2.2 2.1 2.0 1.9 1.8 1.81.6 1.4 1.2
CAPITAL MARKET DEVELOPMENT AND ECONOMIC OUTLOOK
FEDERATION OF EURO-ASIAN STOCK EXCHANGES ANNUAL REPORT JUNE 2012
PAGE 70
Nadeem NaqviManaging Director
The year 2010-2011 was full of challenges, economic growth managed to grow by 2.4%. Global economic conditions also affected the domestic economy. The global economy slow down further due to deep-seated euro zone sovereign debt crisis, fragile financial conditions, and intractable fiscal issues running through other developed economies such as USA and England. The downgrade in credit ratings of many advanced economies has complicated the matters to raise debt finance.Despite being a slow year, the headline inflation averaged at 13.7%, agriculture sector managed to overcome the floods and posted real growth of 1.2 percent, services sector on the other hand supported the growth and shown the growth of 4.1 percent. Strong remittances and
gradual monetary easing by the State Bank of Pakistan led to encouraging corporate performance. The KSE 100 index declined by 5.61 percent in 2011.
It is also encouraging to note that four companies raised equity capital of Rs.16,010.92 million and seven companies listed their TFCs of Rs.16,254.8 million in 2011 this signals a path to recovery in market activity for the next year.
To restore volumes and liquidity KSE launched Margin Trading, Margin Financing and Securities Lending and Borrowing products as some of the landmark initiatives. To enhance Risk management measures at KSE the
Exchange in conjunction with the National Clearing Company of Pakistan introduced an exposure drop-out facility for members who have met their settlement obligations, this will increase the capacity to trade and/ or reinvest in the market due to prompt margin release. Exchange also developed an online reporting system to facilitate Brokerage Houses in complying with SECP Rule pertaining to intimation to the Exchange regarding any fall in the Net Capital Balance.
Moving forward, we remain committed to enhancing our risk management and surveillance measures to further increase transparency and to ensure a level playing field for all investors.
HISTORY AND DEVELOPMENT The KSE is the biggest and most liquid exchange amongst the three exchanges of Pakistan. It came into existence on 18 September 1947. It was later converted and registered as a company limited by guarantee on 10 March 1949. Initially, only five companies were listed with a paid-up capital of Rs. 37 million (US$ 0.62 million).
The year 2010-2011 was full of challenges, economic growth managed to grow by 2.4%. Global economic conditions also affected the domestic economy. The global economy slow down further due to deep-seated euro zone sovereign debt crisis, fragile financial conditions, and intractable fiscal issues running through other developed economies such as USA and England. The downgrade in credit ratings of many advanced economies has complicated the matters to raise debt finance.
The KSE 100 Index registered decline of 5.6 percent and closed at 11347.66 points. As of Dec 31, 2011, ordinary shares of 638 companies were listed having listed capital of Rs. 1,048.44 billion (US$ 11.67 billion) with the market capitalization of Rs.2,945.78 billion (US$ 32.80 billion).
In 1991 the secondary market was opened to foreign investors on an equal basis with local participants. This measure, along with a policy of privatization, has resulted in rapid growth of the market since 1991.
ManagementThe KSE has an independent Board of Directors (10 directors) with representation from the Members of the Exchange & from the Corporate Community. Five directors are elected from amongst the 200 members of the Exchange and four non member directors are nominated by Regulator i.e., SECP, the Chairman is elected by Board from amongst non member Directors whereas, Managing Director is ex-officio member of the board.
KSE is in process of demutualization, it is presently a company limited by guarantee, will be converted into a company limited by shares.
Automation of the Exchange KSE has a fully automated trading system with T+2 settlement system whereby all trades settle on the second day after the trade. Internet based trading system was also launched in December, 2004 to provide an additional facility for investors to enter their orders. KSE has also launched a single exchange-traded market for trading corporate bonds in Pakistan using BATS. KSE’s BATS provide live system based, on screen electronic Trading Platform which offer, market participants a transparent and efficient trading system features and facilities crucial for the Debt market Securities Trading. KSE also launched Stock Index Futures Contract and sector indices. This marks a momentous achievement for the KSE
Unique Identification Number was introduced to provide a traceable link between every order entered at the trading system of the Exchange. VaR based margining system was also introduced in place of a slab based Risk management system. The new RMS included, amongst others, a new netting regime; a margining system based on Value at Risk (VaR) and Capital Adequacy. KSE has also adopted the FIX protocol (Financial Information Exchange) for both trading and market data. The National Clearing & Settlement Company and Central Depository System has also been introduced. Transparency of the listed companies has been enhanced with the introduction of quality audits, quarterly financial reports and timely dividend payouts. Corporate governance is also now the part of the KSE’s listing regulation.
FUTURE OUTLOOK 2012
Introduction of New Products and New Measures:KSE plans to introduce new products into the market, to further cater to the growing needs of its investors and help develop Pakistan’s capital markets. KSE will be introducing: Exchange Traded Funds, new derivative products- options, etc, and Introduction of SME board.
Corporatization and Demutualization of stock Exchange:KSE is in process of demutualization, it is presently a company limited by guarantee, will be converted into a company limited by shares.
We remain committed to enhancing our risk management and surveillance measures.
KARACHI STOCK EXCHANGE
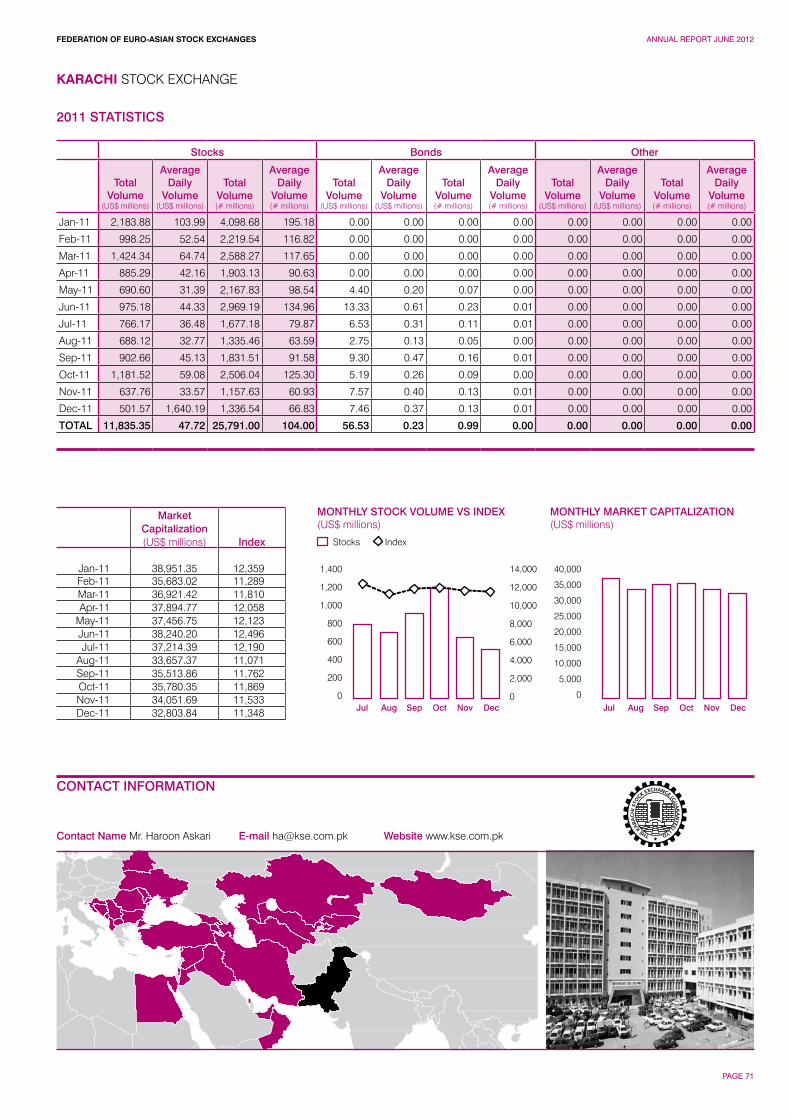
FEDERATION OF EURO-ASIAN STOCK EXCHANGES ANNUAL REPORT JUNE 2012
PAGE 71
Contact Name Mr. Haroon Askari E-mail [email protected] Website www.kse.com.pk
KARACHI STOCK EXCHANGE
CONTACT INFORMATION
MONTHLY MARKET CAPITALIZATION(US$ millions)
1,400
1,200
1,000
800
600
400
200
0
14,000
12,000
10,000
8,000
6,000
4,000
2,000
0
40,000
35,000
30,000
25,000
20,000
15,000
10,000
5,000
0
Stocks
MONTHLY STOCK VOLUME VS INDEX(US$ millions)
Index
Jul JulAug AugSep SepOct OctNov NovDec Dec
2011 STATISTICS
Stocks Bonds Other
Total Volume
(US$ millions)
Average Daily
Volume(US$ millions)
Total Volume(# millions)
Average Daily
Volume(# millions)
Total Volume
(US$ millions)
Average Daily
Volume(US$ millions)
Total Volume(# millions)
Average Daily
Volume(# millions)
Total Volume
(US$ millions)
Average Daily
Volume(US$ millions)
Total Volume(# millions)
Average Daily
Volume(# millions)
Jan-11 2,183.88 103.99 4,098.68 195.18 0.00 0.00 0.00 0.00 0.00 0.00 0.00 0.00
Feb-11 998.25 52.54 2,219.54 116.82 0.00 0.00 0.00 0.00 0.00 0.00 0.00 0.00
Mar-11 1,424.34 64.74 2,588.27 117.65 0.00 0.00 0.00 0.00 0.00 0.00 0.00 0.00
Apr-11 885.29 42.16 1,903.13 90.63 0.00 0.00 0.00 0.00 0.00 0.00 0.00 0.00
May-11 690.60 31.39 2,167.83 98.54 4.40 0.20 0.07 0.00 0.00 0.00 0.00 0.00
Jun-11 975.18 44.33 2,969.19 134.96 13.33 0.61 0.23 0.01 0.00 0.00 0.00 0.00
Jul-11 766.17 36.48 1,677.18 79.87 6.53 0.31 0.11 0.01 0.00 0.00 0.00 0.00
Aug-11 688.12 32.77 1,335.46 63.59 2.75 0.13 0.05 0.00 0.00 0.00 0.00 0.00
Sep-11 902.66 45.13 1,831.51 91.58 9.30 0.47 0.16 0.01 0.00 0.00 0.00 0.00
Oct-11 1,181.52 59.08 2,506.04 125.30 5.19 0.26 0.09 0.00 0.00 0.00 0.00 0.00
Nov-11 637.76 33.57 1,157.63 60.93 7.57 0.40 0.13 0.01 0.00 0.00 0.00 0.00
Dec-11 501.57 1,640.19 1,336.54 66.83 7.46 0.37 0.13 0.01 0.00 0.00 0.00 0.00
TOTAL 11,835.35 47.72 25,791.00 104.00 56.53 0.23 0.99 0.00 0.00 0.00 0.00 0.00
MarketCapitalization(US$ millions) Index
Jan-11 38,951.35 12,359Feb-11 35,683.02 11,289Mar-11 36,921.42 11,810Apr-11 37,894.77 12,058
May-11 37,456.75 12,123Jun-11 38,240.20 12,496Jul-11 37,214.39 12,190
Aug-11 33,657.37 11,071Sep-11 35,513.86 11,762Oct-11 35,780.35 11,869Nov-11 34,051.69 11,533Dec-11 32,803.84 11,348
FEDERATION OF EURO-ASIAN STOCK EXCHANGES ANNUAL REPORT JUNE 2012
PAGE 72
The macroeconomic landscape of the country was badly affected by devastating floods in July 2010, which directly affected about 20 million people, mostly by destruction of property, livelihood and infrastructure; thereby inflicted significant damage to the fragile economy. ADB approved a US$ 650 million loan to Pakistan which was used to rebuild the damaged infrastructure. Shortage of power and gas, escalating utilities costs, high borrowing cost exacerbated the situation for Large Scale Manufacturing as well as Service sectors. The fiscal position remained weak with poor revenue generation whilst expenditure escalated. Real GDP growth in the outgoing year was recorded at 2.4% as compared to 3.8% in the previous Fiscal Year. Nevertheless, our economy has shown strong capacity to overcome challenges originated from both internal and external economic environment while struggling towards achieving long term sustainable growth.
PERFORMANCE OF THE MARKETThe market started in the FY 2010-11 with some positive note as LSE-25 Index starting from 3092.70 points. The market and the Index reached the lowest level of 2970.86 points of the period under review and closed at 3051.12 points at the close of the financial year. Local investors remained jittery while seeking clarity on the modalities of Capital Gain Tax (CGT). Investment in capital market during the period July-March 2010-11 by the foreign investors depicted a net inflow of US$ 301.5 million. Corporate profitability increased in year 2011 but profitability concentrated in few large companies in the Energy, Telecom and Banking sectors.
During the period under review, seven Open end Funds were listed. Further, two companies, one TFC and one Participation Term Certificate were in the pipeline of listings. Two Closed end Funds were converted into Open End Funds. Twelve securities were delisted out of which three companies merged with other companies, seven companies went into Winding Up by
Court Orders, one Open end Fund matured and fully redeemed and one Company was de-listed after the buy-back the shares by the sponsors.
Total companies listed at LSE were 496 as compared to 510 companies in the previous year. The total listed capital increased from Rs. 842.596 billion (US$ 9.362 billion) to Rs. 888.190 billion (US$ 9.868 billion) as on June 30, 2011. Similarly, the aggregate market capitalization increased from Rs. 2,622.928 billion (US$ 29.143 billion) to Rs. 3,166.044 billion (US$ 35.178 billion) as on June 30, 2011. The volumes of the Exchange shrunk considerably i.e. by 66%. During the period under review, total share volume of regular market reduced to 1,124.762 million shares as compared to previous FY figure of 3,362.668 million shares.
Complementing the efforts of members and listed companies in seeking to find better levels of optimum operational efficiency, LSE continued to identify areas of improvement as part of the Exchange’s present and future development.
KARACHI STOCK EXCHANGE
Key Information ContactsGovernment of Pakistan www.pak.gov.pkMinistry of Finance www.finance.gov.pkPrivatization Commission www.privatisation.gov.pkState Bank of Pakistan www.sbp.org.pkSecurity and Exchange Commission of Pakistan www.secp.gov.pk
CAPITAL MARKET DEVELOPMENT AND ECONOMIC OUTLOOK
FEDERATION OF EURO-ASIAN STOCK EXCHANGES ANNUAL REPORT JUNE 2012
PAGE 73
Kadyrzhan DamitovPresident
2011 was a productive year, full of accomplishments in strategic development and international cooperation. It was a great honor for KASE to host 17th General Assembly of FEAS in Almaty, and we believe that it has considerably contributed to further development and international recognition of Kazakhstani financial market. We plan to remain an active member of FEAS and continue our cooperation with its member exchanges on joint projects in the future.
During 2011 we have introduced several projects in order to improve regulatory, technical and technological frameworks, as set out in KASE Development Strategy 2011-2013. Among these are continuing modernization of IT infrastructure, reaching international
standards on stock exchange operations, improving services, such as Direct Market Access and remote membership, further development of derivatives market, and many others.
Being a part of a global financial market KASE performance was affected by negative tendencies in economy in 2011. KASE Index has dropped by 37.5%, but at the same time trading volumes remained approximately same, with only 3% drop, totaling US$ 199.1 bn. The reason behind this tendency is low industry diversification and number of companies included in KASE Index as well as moderate level of market liquidity. In the same time, although trading in shares slowed compared
to 2010, trading volumes in corporate bonds market have increased by 8.7%.
We are working with the Government of Kazakhstan and regulator on the highly anticipated People’s IPO program that should commence in the middle of 2012 and we believe that it will bring the necessary attractive instruments on supply side that would boost Kazakhstani financial market. We hope that this government program will give momentum to blue-chip companies towards IPO within the next 2-3 years. It is likely that they will give a good example of “going public” to other companies in Kazakhstan in the future. We are now working on the improvement of market infrastructure to support this initiative.
HISTORY AND DEVELOPMENT
The major highlight of 2011 was the 17th General Assembly of Federation of Euro-Asian Stock Exchanges (FEAS) hosted by KASE in Almaty. Within the framework of this event, KASE also held First Meeting of Eurasia Group on Corporate Governance for Capital Market Development of the Organization for Economic Co-operation and Development and the marketing exhibition which were attended by over 120 participants from 23 countries, including 16 stock exchanges. KASE has become a member of FEAS in 1997 and considering its active participation within the organization was elected a member of its Executive Committee in 2010. The decision to conduct General Assembly in Almaty was made in December 2010, during the 16th General Assembly held in Istanbul.
Moreover, in regard to international cooperation, KASE obtained an affiliate membership in the South-Asian Federation of Exchanges, signed Memorandums of Understanding (MOU) with Korea Exchange, Istanbul Stock Exchange and Tehran Exchange, aimed at further development of capital markets in the respective countries as well as Kazakhstan. Within the framework of MOU signed with Korea Exchange, parties commenced a joint consulting project aimed at improvement of current regulatory and infrastructural environment of KASE.
KASE introduced T+0 gross settlement with full prepayment scheme on stock market that decreased a number of defaults to almost zero. Also introduction of FIX-gateway allowed external information systems to connect to KASE trading system and this improved the attractiveness of KASE to foreign investors.KASE also worked on further development of the derivatives market that was launched in December 2010, by conducting various regulatory and marketing activities, from discussing issues with the regulators to marketing presentations.
KASE became a part of Dow Jones FEAS Index universe, by joining Dow Jones FEAS Titans 50 Equal Weighted Index, the first blue-chip index derived from Euro-Asian stock exchanges, and Dow Jones FEAS Composite Index.
With support of KASE a new professional union was formed in Kazakhstan in 2011– the Exchange Association of Kazakhstan (EAK) that is aimed at uniting local exchanges’ efforts towards development of organized trading in Kazakhstan.
FUTURE OUTLOOK
In 2012 KASE is planning to work further on its strategic development projects following the successful implementation of some of the major projects in 2011.
The global scale of the 17th FEAS General Assembly in Almaty helped KASE raise awareness of some of the issues that global markets face at the moment, propose changes, and continue to extend its international relationships with foreign fellow exchanges.
2011 was a starting point for a highly anticipated People’s IPO program. This is an initiative of the Government of Kazakhstan to conduct IPO of companies that are a part of state-owned “Sovereign Wealth Fund “Samruk-Kazyna” JSC. It is planned that the first group of companies will go public in the second half of 2012. Through IPOs the Sovereign Wealth Fund is planning to privatize approx. 5-15% of these companies. KASE being one of its major participants prioritized its medium- and long-term projects to successfully support the conduct of IPOs on Kazakhstani stock market.
In order to improve the information disclosure of its listed companies KASE plans to introduce electronic document management system named “IS2IN” (“issuer to investor”). In the short-term perspective KASE plans to create an automated surveillance system in order to prevent price manipulations and insider trading.
KASE continues its work on introduction of Remote Membership to create favorable conditions for non-residents of the Republic of Kazakhstan to become members of KASE. In the same time, Direct Market Access capability is set to be introduced in 2012 to allow clients of the members of KASE to access the KASE trading system directly.
During 2011 we have introduced several projects in order to improve regulatory, technical and technological frameworks.
KAZAKHSTAN STOCK EXCHANGE
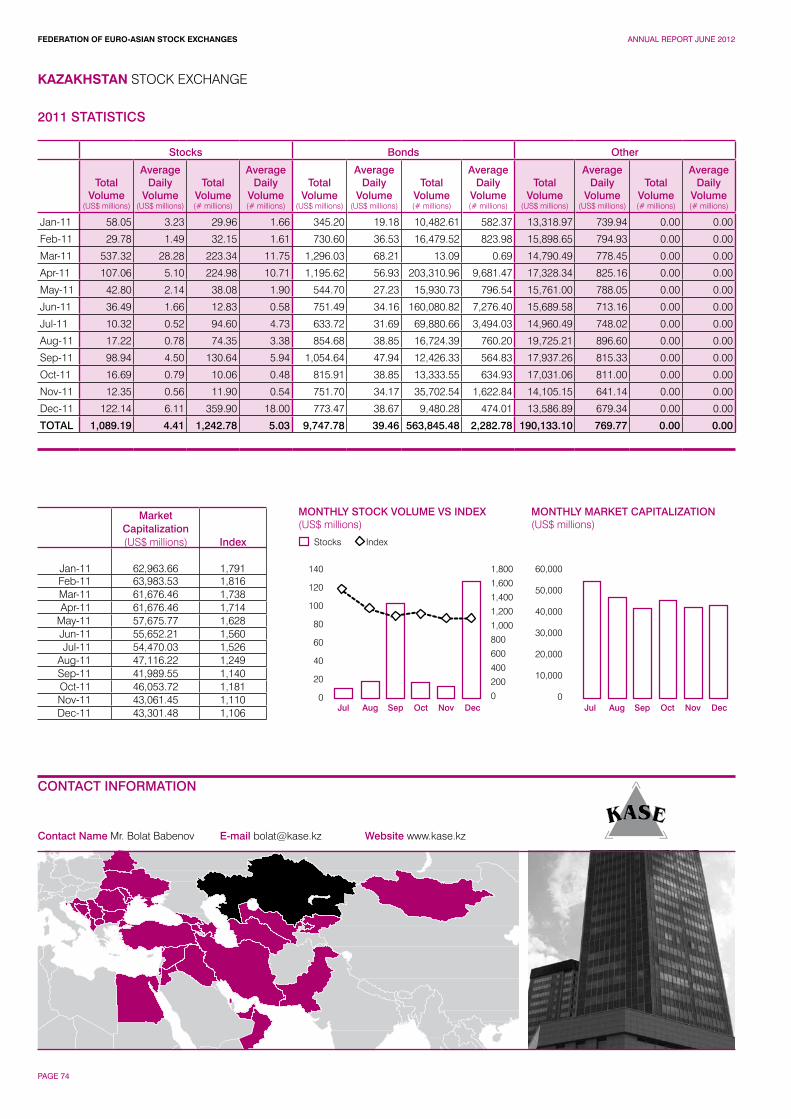
FEDERATION OF EURO-ASIAN STOCK EXCHANGES ANNUAL REPORT JUNE 2012
PAGE 74
KAZAKHSTAN STOCK EXCHANGE
CONTACT INFORMATION
Contact Name Mr. Bolat Babenov E-mail [email protected] Website www.kase.kz
MONTHLY MARKET CAPITALIZATION(US$ millions)
140
120
100
80
60
40
20
0
1,800
1,600
1,400
1,200
1,000
800
600
400
200
0
60,000
50,000
40,000
30,000
20,000
10,000
0
Stocks
MONTHLY STOCK VOLUME VS INDEX(US$ millions)
Index
Jul JulAug AugSep SepOct OctNov NovDec Dec
2011 STATISTICS
Stocks Bonds Other
Total Volume
(US$ millions)
Average Daily
Volume(US$ millions)
Total Volume(# millions)
Average Daily
Volume(# millions)
Total Volume
(US$ millions)
Average Daily
Volume(US$ millions)
Total Volume(# millions)
Average Daily
Volume(# millions)
Total Volume
(US$ millions)
Average Daily
Volume(US$ millions)
Total Volume(# millions)
Average Daily
Volume(# millions)
Jan-11 58.05 3.23 29.96 1.66 345.20 19.18 10,482.61 582.37 13,318.97 739.94 0.00 0.00
Feb-11 29.78 1.49 32.15 1.61 730.60 36.53 16,479.52 823.98 15,898.65 794.93 0.00 0.00
Mar-11 537.32 28.28 223.34 11.75 1,296.03 68.21 13.09 0.69 14,790.49 778.45 0.00 0.00
Apr-11 107.06 5.10 224.98 10.71 1,195.62 56.93 203,310.96 9,681.47 17,328.34 825.16 0.00 0.00
May-11 42.80 2.14 38.08 1.90 544.70 27.23 15,930.73 796.54 15,761.00 788.05 0.00 0.00
Jun-11 36.49 1.66 12.83 0.58 751.49 34.16 160,080.82 7,276.40 15,689.58 713.16 0.00 0.00
Jul-11 10.32 0.52 94.60 4.73 633.72 31.69 69,880.66 3,494.03 14,960.49 748.02 0.00 0.00
Aug-11 17.22 0.78 74.35 3.38 854.68 38.85 16,724.39 760.20 19,725.21 896.60 0.00 0.00
Sep-11 98.94 4.50 130.64 5.94 1,054.64 47.94 12,426.33 564.83 17,937.26 815.33 0.00 0.00
Oct-11 16.69 0.79 10.06 0.48 815.91 38.85 13,333.55 634.93 17,031.06 811.00 0.00 0.00
Nov-11 12.35 0.56 11.90 0.54 751.70 34.17 35,702.54 1,622.84 14,105.15 641.14 0.00 0.00
Dec-11 122.14 6.11 359.90 18.00 773.47 38.67 9,480.28 474.01 13,586.89 679.34 0.00 0.00
TOTAL 1,089.19 4.41 1,242.78 5.03 9,747.78 39.46 563,845.48 2,282.78 190,133.10 769.77 0.00 0.00
MarketCapitalization(US$ millions) Index
Jan-11 62,963.66 1,791Feb-11 63,983.53 1,816Mar-11 61,676.46 1,738Apr-11 61,676.46 1,714
May-11 57,675.77 1,628Jun-11 55,652.21 1,560Jul-11 54,470.03 1,526
Aug-11 47,116.22 1,249Sep-11 41,989.55 1,140Oct-11 46,053.72 1,181Nov-11 43,061.45 1,110Dec-11 43,301.48 1,106
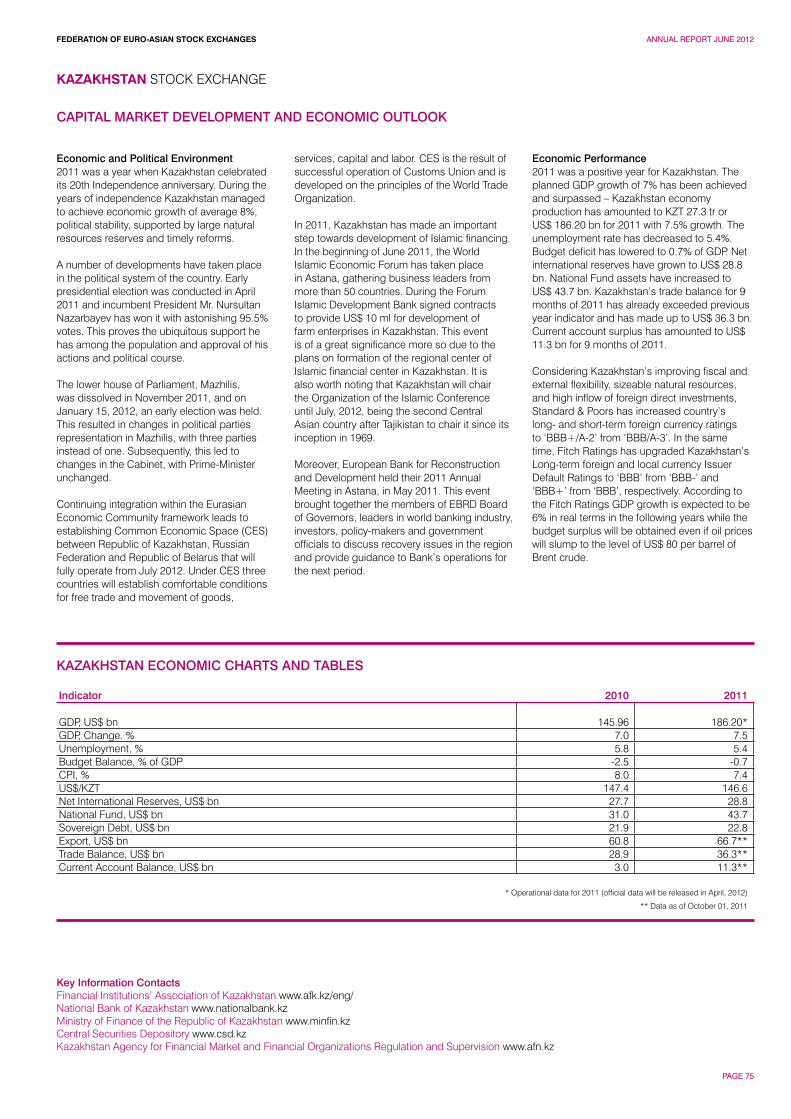
FEDERATION OF EURO-ASIAN STOCK EXCHANGES ANNUAL REPORT JUNE 2012
PAGE 75
Economic and Political Environment2011 was a year when Kazakhstan celebrated its 20th Independence anniversary. During the years of independence Kazakhstan managed to achieve economic growth of average 8%, political stability, supported by large natural resources reserves and timely reforms.
A number of developments have taken place in the political system of the country. Early presidential election was conducted in April 2011 and incumbent President Mr. Nursultan Nazarbayev has won it with astonishing 95.5% votes. This proves the ubiquitous support he has among the population and approval of his actions and political course.
The lower house of Parliament, Mazhilis, was dissolved in November 2011, and on January 15, 2012, an early election was held. This resulted in changes in political parties representation in Mazhilis, with three parties instead of one. Subsequently, this led to changes in the Cabinet, with Prime-Minister unchanged.
Continuing integration within the Eurasian Economic Community framework leads to establishing Common Economic Space (CES) between Republic of Kazakhstan, Russian Federation and Republic of Belarus that will fully operate from July 2012. Under CES three countries will establish comfortable conditions for free trade and movement of goods,
services, capital and labor. CES is the result of successful operation of Customs Union and is developed on the principles of the World Trade Organization.
In 2011, Kazakhstan has made an important step towards development of Islamic financing. In the beginning of June 2011, the World Islamic Economic Forum has taken place in Astana, gathering business leaders from more than 50 countries. During the Forum Islamic Development Bank signed contracts to provide US$ 10 ml for development of farm enterprises in Kazakhstan. This event is of a great significance more so due to the plans on formation of the regional center of Islamic financial center in Kazakhstan. It is also worth noting that Kazakhstan will chair the Organization of the Islamic Conference until July, 2012, being the second Central Asian country after Tajikistan to chair it since its inception in 1969.
Moreover, European Bank for Reconstruction and Development held their 2011 Annual Meeting in Astana, in May 2011. This event brought together the members of EBRD Board of Governors, leaders in world banking industry, investors, policy-makers and government officials to discuss recovery issues in the region and provide guidance to Bank’s operations for the next period.
Economic Performance2011 was a positive year for Kazakhstan. The planned GDP growth of 7% has been achieved and surpassed – Kazakhstan economy production has amounted to KZT 27.3 tr or US$ 186.20 bn for 2011 with 7.5% growth. The unemployment rate has decreased to 5.4%. Budget deficit has lowered to 0.7% of GDP. Net international reserves have grown to US$ 28.8 bn. National Fund assets have increased to US$ 43.7 bn. Kazakhstan’s trade balance for 9 months of 2011 has already exceeded previous year indicator and has made up to US$ 36.3 bn. Current account surplus has amounted to US$ 11.3 bn for 9 months of 2011.
Considering Kazakhstan’s improving fiscal and external flexibility, sizeable natural resources, and high inflow of foreign direct investments, Standard & Poors has increased country’s long- and short-term foreign currency ratings to ‘BBB+/A-2’ from ‘BBB/A-3’. In the same time, Fitch Ratings has upgraded Kazakhstan’s Long-term foreign and local currency Issuer Default Ratings to ‘BBB’ from ‘BBB-’ and ‘BBB+’ from ‘BBB’, respectively. According to the Fitch Ratings GDP growth is expected to be 6% in real terms in the following years while the budget surplus will be obtained even if oil prices will slump to the level of US$ 80 per barrel of Brent crude.
KAZAKHSTAN STOCK EXCHANGE
Key Information ContactsFinancial Institutions’ Association of Kazakhstan www.afk.kz/eng/National Bank of Kazakhstan www.nationalbank.kzMinistry of Finance of the Republic of Kazakhstan www.minfin.kzCentral Securities Depository www.csd.kzKazakhstan Agency for Financial Market and Financial Organizations Regulation and Supervision www.afn.kz
KAZAKHSTAN ECONOMIC CHARTS AND TABLES Indicator 2010 2011
GDP, US$ bn 145.96 186.20*GDP, Change. % 7.0 7.5Unemployment, % 5.8 5.4Budget Balance, % of GDP -2.5 -0.7CPI, % 8.0 7.4US$/KZT 147.4 146.6Net International Reserves, US$ bn 27.7 28.8National Fund, US$ bn 31.0 43.7Sovereign Debt, US$ bn 21.9 22.8Export, US$ bn 60.8 66.7**Trade Balance, US$ bn 28.9 36.3**Current Account Balance, US$ bn 3.0 11.3**
* Operational data for 2011 (official data will be released in April, 2012)
** Data as of October 01, 2011
CAPITAL MARKET DEVELOPMENT AND ECONOMIC OUTLOOK
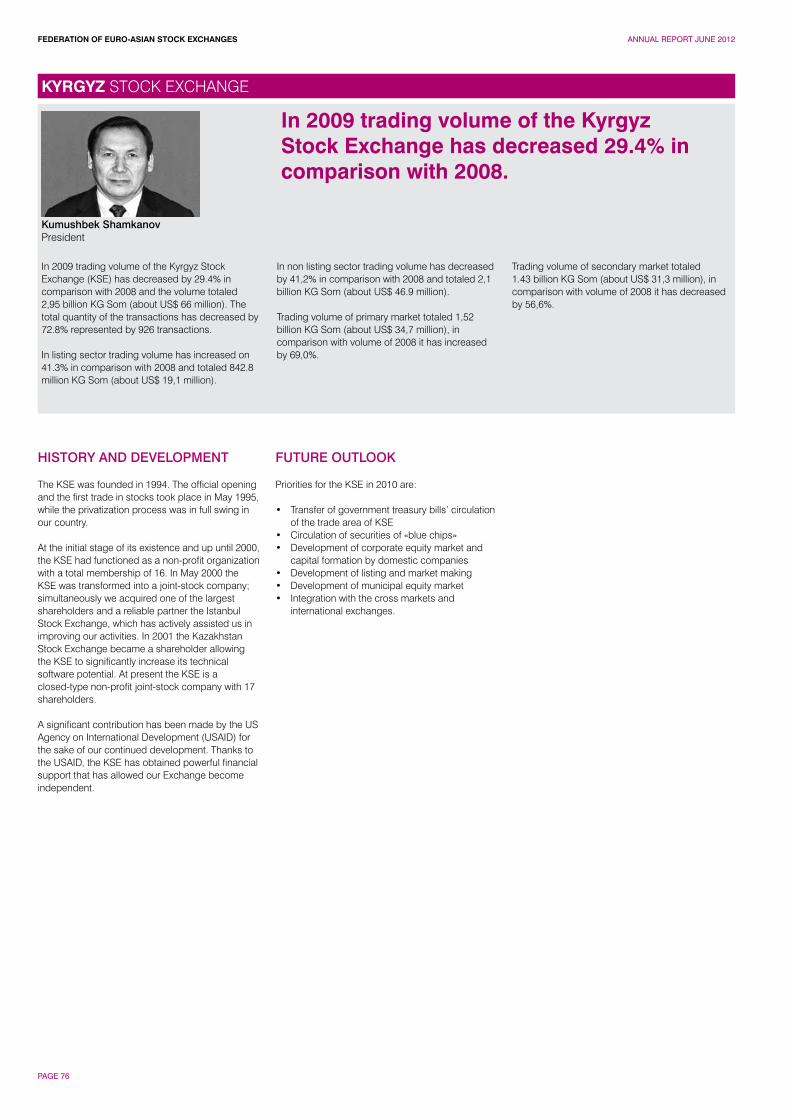
FEDERATION OF EURO-ASIAN STOCK EXCHANGES ANNUAL REPORT JUNE 2012
PAGE 76
Kumushbek ShamkanovPresident
In 2009 trading volume of the Kyrgyz Stock Exchange (KSE) has decreased by 29.4% in comparison with 2008 and the volume totaled 2,95 billion KG Som (about US$ 66 million). The total quantity of the transactions has decreased by 72.8% represented by 926 transactions.
In listing sector trading volume has increased on 41.3% in comparison with 2008 and totaled 842.8 million KG Som (about US$ 19,1 million).
In non listing sector trading volume has decreased by 41,2% in comparison with 2008 and totaled 2,1 billion KG Som (about US$ 46.9 million).
Trading volume of primary market totaled 1,52 billion KG Som (about US$ 34,7 million), in comparison with volume of 2008 it has increased by 69,0%.
Trading volume of secondary market totaled 1.43 billion KG Som (about US$ 31,3 million), in comparison with volume of 2008 it has decreased by 56,6%.
HISTORY AND DEVELOPMENT
The KSE was founded in 1994. The official opening and the first trade in stocks took place in May 1995, while the privatization process was in full swing in our country.
At the initial stage of its existence and up until 2000, the KSE had functioned as a non-profit organization with a total membership of 16. In May 2000 the KSE was transformed into a joint-stock company; simultaneously we acquired one of the largest shareholders and a reliable partner the Istanbul Stock Exchange, which has actively assisted us in improving our activities. In 2001 the Kazakhstan Stock Exchange became a shareholder allowing the KSE to significantly increase its technical software potential. At present the KSE is a closed-type non-profit joint-stock company with 17 shareholders.
A significant contribution has been made by the US Agency on International Development (USAID) for the sake of our continued development. Thanks to the USAID, the KSE has obtained powerful financial support that has allowed our Exchange become independent.
FUTURE OUTLOOK
Priorities for the KSE in 2010 are:
• Transfer of government treasury bills’ circulation of the trade area of KSE
• Circulation of securities of «blue chips»• Development of corporate equity market and
capital formation by domestic companies• Development of listing and market making• Development of municipal equity market • Integration with the cross markets and
international exchanges.
In 2009 trading volume of the Kyrgyz Stock Exchange has decreased 29.4% in comparison with 2008.
KYRGYZ STOCK EXCHANGE
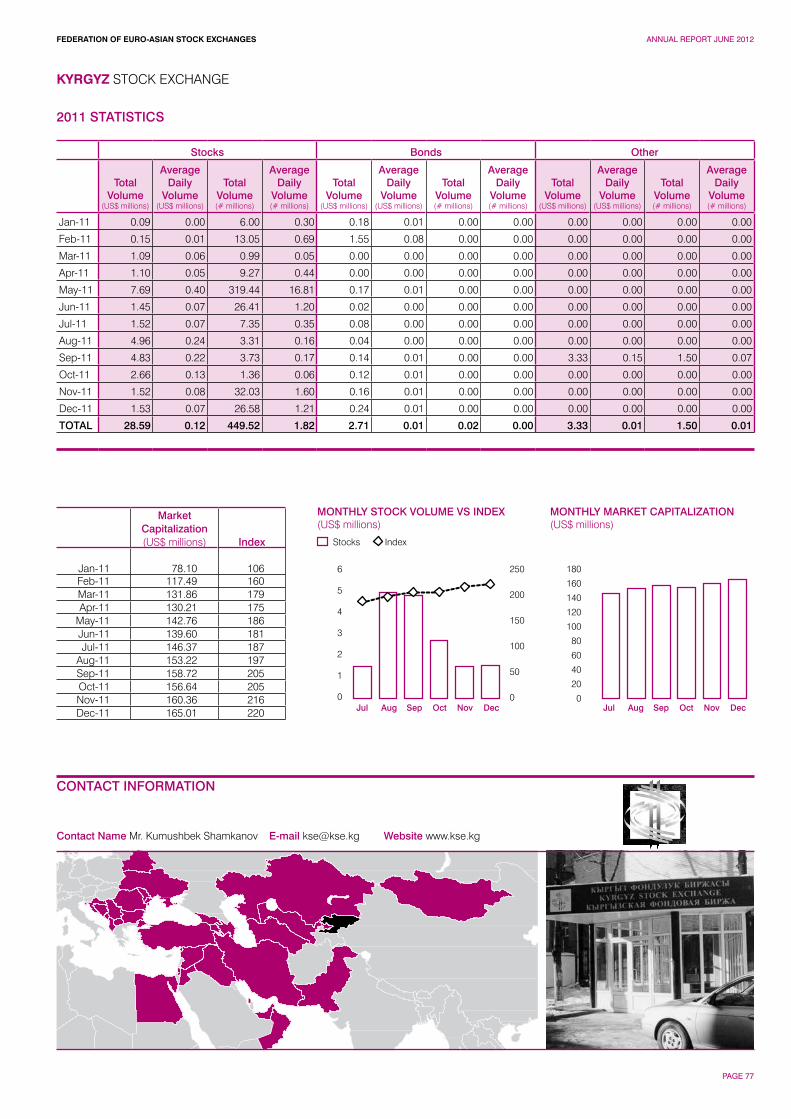
FEDERATION OF EURO-ASIAN STOCK EXCHANGES ANNUAL REPORT JUNE 2012
PAGE 77
Contact Name Mr. Kumushbek Shamkanov E-mail [email protected] Website www.kse.kg
KYRGYZ STOCK EXCHANGE
CONTACT INFORMATION
MONTHLY MARKET CAPITALIZATION(US$ millions)
6
5
4
3
2
1
0
250
200
150
100
50
0
180
160
140
120
100
80
60
40
20
0
Stocks
MONTHLY STOCK VOLUME VS INDEX(US$ millions)
Index
Jul JulAug AugSep SepOct OctNov NovDec Dec
2011 STATISTICS
Stocks Bonds Other
Total Volume
(US$ millions)
Average Daily
Volume(US$ millions)
Total Volume(# millions)
Average Daily
Volume(# millions)
Total Volume
(US$ millions)
Average Daily
Volume(US$ millions)
Total Volume(# millions)
Average Daily
Volume(# millions)
Total Volume
(US$ millions)
Average Daily
Volume(US$ millions)
Total Volume(# millions)
Average Daily
Volume(# millions)
Jan-11 0.09 0.00 6.00 0.30 0.18 0.01 0.00 0.00 0.00 0.00 0.00 0.00
Feb-11 0.15 0.01 13.05 0.69 1.55 0.08 0.00 0.00 0.00 0.00 0.00 0.00
Mar-11 1.09 0.06 0.99 0.05 0.00 0.00 0.00 0.00 0.00 0.00 0.00 0.00
Apr-11 1.10 0.05 9.27 0.44 0.00 0.00 0.00 0.00 0.00 0.00 0.00 0.00
May-11 7.69 0.40 319.44 16.81 0.17 0.01 0.00 0.00 0.00 0.00 0.00 0.00
Jun-11 1.45 0.07 26.41 1.20 0.02 0.00 0.00 0.00 0.00 0.00 0.00 0.00
Jul-11 1.52 0.07 7.35 0.35 0.08 0.00 0.00 0.00 0.00 0.00 0.00 0.00
Aug-11 4.96 0.24 3.31 0.16 0.04 0.00 0.00 0.00 0.00 0.00 0.00 0.00
Sep-11 4.83 0.22 3.73 0.17 0.14 0.01 0.00 0.00 3.33 0.15 1.50 0.07
Oct-11 2.66 0.13 1.36 0.06 0.12 0.01 0.00 0.00 0.00 0.00 0.00 0.00
Nov-11 1.52 0.08 32.03 1.60 0.16 0.01 0.00 0.00 0.00 0.00 0.00 0.00
Dec-11 1.53 0.07 26.58 1.21 0.24 0.01 0.00 0.00 0.00 0.00 0.00 0.00
TOTAL 28.59 0.12 449.52 1.82 2.71 0.01 0.02 0.00 3.33 0.01 1.50 0.01
MarketCapitalization(US$ millions) Index
Jan-11 78.10 106Feb-11 117.49 160Mar-11 131.86 179Apr-11 130.21 175
May-11 142.76 186Jun-11 139.60 181Jul-11 146.37 187
Aug-11 153.22 197Sep-11 158.72 205Oct-11 156.64 205Nov-11 160.36 216Dec-11 165.01 220
FEDERATION OF EURO-ASIAN STOCK EXCHANGES ANNUAL REPORT JUNE 2012
PAGE 78
Economic performance Economic downturns in Kazakhstan and the Russian Federation (the major economic partners) and the country’s power shortfalls took economic performance in 2009 down to 2.3% from 8.4% in 2008. Their difficulties hit the economy through reductions in three channels: remittances from migrant workers (which constituted around 20% of GDP in 2008); inflows of foreign direct investment; and demand for exports.
GDP growth was driven mainly by a robust performance of agriculture (due to favorable weather conditions), which grew by 7.3%. Construction increased by 6.3%, after a 10.8% contraction the prior year, a rebound primarily due to activity in the hydropower generation and mining subsectors, rehabilitation and construction of roads, and residential building. However, industry overall declined by 3.4% because of reduced output in the textile and sewing industry, transport equipment, electric energy, and gas and water distribution. Gold production also declined.
The government forecasts its budget deficit at 5.1% of GDP in 2010. The widening deficit is a result of the increased budgetary allocations for the development budget (mainly infrastructure projects), monetization of benefits, higher pensions, and increased compensation to vulnerable groups (to offset an increase in electricity and heating tariffs). The National Bank of the Kyrgyz Republic (NBKR) followed an expansionary monetary policy. It reduced banks’ reserve requirement from 10% at the start of
the year to 9.5% from June; and lowered the discount rate from 14.4% in January to a record low 0.9% at year-end. Although the commercial banks’ lending rate remained almost unchanged (at about 20%), credit to the private sector surged by 46.5%. For the year, money supply rose by 20.4%, carried by increased net foreign assets (reflecting the budget assistance) and the expanded credit to the private sector.
Among financial reforms, a deposit insurance scheme was launched in April 2009, covering deposits up to Som100,000 ($2,290). All banks are required to participate. A new law under which agricultural land can be used as collateral for loan receipts was adopted on 29 June 2009. In the energy sector, the government believes that the new tariff will bring the sector to cost-recovery levels and attract private investment. It has no plans for any further tariff increases this year. The PRC made a preliminary agreement to grant a $342 million loan for a power transmission line, which would help the country ensure energy security. Construction is expected to start in 2011 and finish 2 years later.
In October 2009, the country embarked on a government sector reform under which the number of ministries and agencies has been reduced. The reform also envisages cutting the number of government employees by 30% and aims to streamline the work of government and cut other costs.
Economic prospectsGDP is projected to grow at 5.5% and 6.0% in 2010 and 2011, respectively. The expansion is mainly due to the expected recovery of Kazakhstan and the Russian Federation, boosting demand for exports, foreign direct investment inflows, and migrants’ remittances—the last of which will directly bolster private consumption. Foreign-financed hydropower projects should carry on underpinning strong construction growth, but until all those projects are brought into commission (the first is scheduled for May), power shortfalls will continue to hamper manufacturing. The government will also provide impetus to growth as it is planning to raise spending on wages and pensions and on infrastructure, the latter with financing assistance from development partners.
The expected increase in global food and oil prices will exert upward pressure on prices, though the contracted import price for natural gas will fall by about 10%, as will stronger workers’ remittances. These forces will push up inflation in 2010 and 2011, to 8.5% and 9.0%, respectively. Given the large import share in the consumer basket, the NBKR will use the exchange rate to mitigate inflation. Credit growth will remain subject to the bottlenecks that face Kazakh banks (which account for half the banking sector) in supplying capital to their subsidiaries in this country. However, increased foreign exchange inflows may allow the NBKR to adopt an accommodative credit policy.
Information obtained from the Exchange.
KYRGYZ STOCK EXCHANGE
Key Information ContactsNational Bank of the Kyrgyz Republic www.nbkr.kgMinistry of Finance www.minfin.kgThe Service of Supervision and Regulations of Financial Market of Kyrgyz Republic www.nsc.kg Ministry of Foreign Trade and Industry of the Kyrgyz Republic www.mvtp.kg
CAPITAL MARKET DEVELOPMENT AND ECONOMIC OUTLOOK
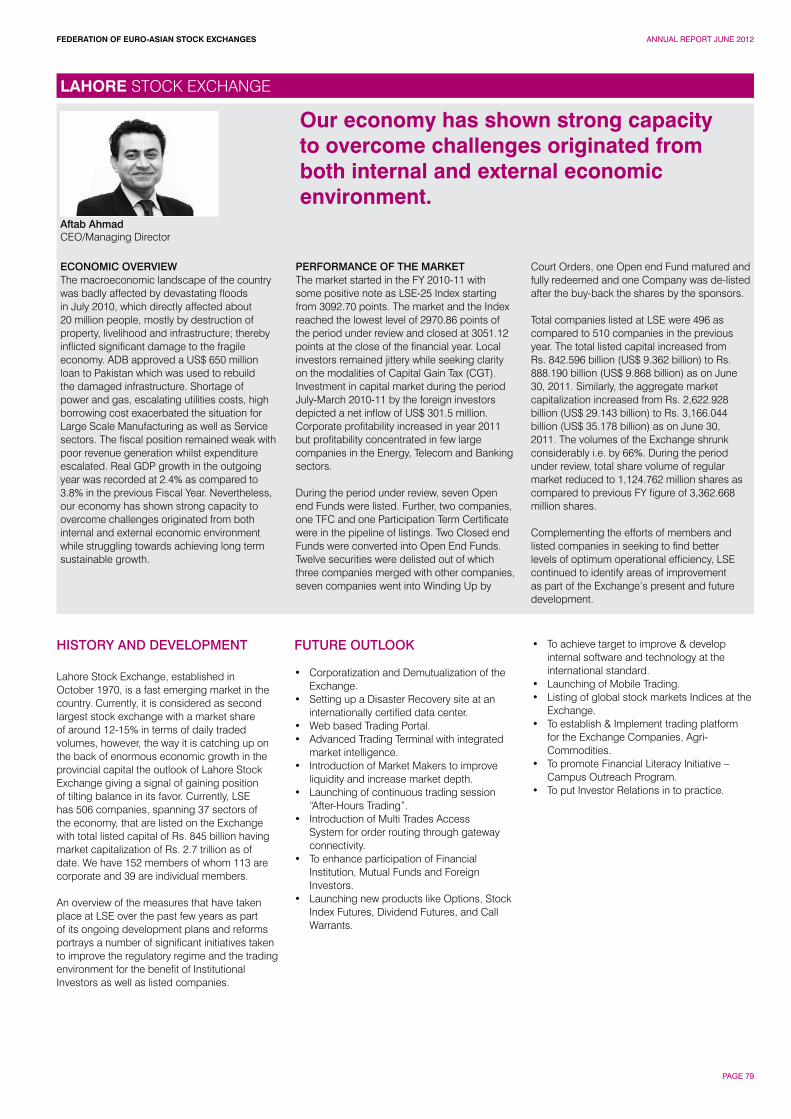
FEDERATION OF EURO-ASIAN STOCK EXCHANGES ANNUAL REPORT JUNE 2012
PAGE 79
Aftab AhmadCEO/Managing Director
HISTORY AND DEVELOPMENT
Lahore Stock Exchange, established in October 1970, is a fast emerging market in the country. Currently, it is considered as second largest stock exchange with a market share of around 12-15% in terms of daily traded volumes, however, the way it is catching up on the back of enormous economic growth in the provincial capital the outlook of Lahore Stock Exchange giving a signal of gaining position of tilting balance in its favor. Currently, LSE has 506 companies, spanning 37 sectors of the economy, that are listed on the Exchange with total listed capital of Rs. 845 billion having market capitalization of Rs. 2.7 trillion as of date. We have 152 members of whom 113 are corporate and 39 are individual members.
An overview of the measures that have taken place at LSE over the past few years as part of its ongoing development plans and reforms portrays a number of significant initiatives taken to improve the regulatory regime and the trading environment for the benefit of Institutional Investors as well as listed companies.
FUTURE OUTLOOK
• Corporatization and Demutualization of the Exchange.
• Setting up a Disaster Recovery site at an internationally certified data center.
• Web based Trading Portal.• Advanced Trading Terminal with integrated
market intelligence.• Introduction of Market Makers to improve
liquidity and increase market depth.• Launching of continuous trading session
“After-Hours Trading”.• Introduction of Multi Trades Access
System for order routing through gateway connectivity.
• To enhance participation of Financial Institution, Mutual Funds and Foreign Investors.
• Launching new products like Options, Stock Index Futures, Dividend Futures, and Call Warrants.
• To achieve target to improve & develop internal software and technology at the international standard.
• Launching of Mobile Trading.• Listing of global stock markets Indices at the
Exchange.• To establish & Implement trading platform
for the Exchange Companies, Agri-Commodities.
• To promote Financial Literacy Initiative – Campus Outreach Program.
• To put Investor Relations in to practice.
Our economy has shown strong capacity to overcome challenges originated from both internal and external economic environment.
LAHORE STOCK EXCHANGE
ECONOMIC OVERVIEWThe macroeconomic landscape of the country was badly affected by devastating floods in July 2010, which directly affected about 20 million people, mostly by destruction of property, livelihood and infrastructure; thereby inflicted significant damage to the fragile economy. ADB approved a US$ 650 million loan to Pakistan which was used to rebuild the damaged infrastructure. Shortage of power and gas, escalating utilities costs, high borrowing cost exacerbated the situation for Large Scale Manufacturing as well as Service sectors. The fiscal position remained weak with poor revenue generation whilst expenditure escalated. Real GDP growth in the outgoing year was recorded at 2.4% as compared to 3.8% in the previous Fiscal Year. Nevertheless, our economy has shown strong capacity to overcome challenges originated from both internal and external economic environment while struggling towards achieving long term sustainable growth.
PERFORMANCE OF THE MARKETThe market started in the FY 2010-11 with some positive note as LSE-25 Index starting from 3092.70 points. The market and the Index reached the lowest level of 2970.86 points of the period under review and closed at 3051.12 points at the close of the financial year. Local investors remained jittery while seeking clarity on the modalities of Capital Gain Tax (CGT). Investment in capital market during the period July-March 2010-11 by the foreign investors depicted a net inflow of US$ 301.5 million. Corporate profitability increased in year 2011 but profitability concentrated in few large companies in the Energy, Telecom and Banking sectors.
During the period under review, seven Open end Funds were listed. Further, two companies, one TFC and one Participation Term Certificate were in the pipeline of listings. Two Closed end Funds were converted into Open End Funds. Twelve securities were delisted out of which three companies merged with other companies, seven companies went into Winding Up by
Court Orders, one Open end Fund matured and fully redeemed and one Company was de-listed after the buy-back the shares by the sponsors.
Total companies listed at LSE were 496 as compared to 510 companies in the previous year. The total listed capital increased from Rs. 842.596 billion (US$ 9.362 billion) to Rs. 888.190 billion (US$ 9.868 billion) as on June 30, 2011. Similarly, the aggregate market capitalization increased from Rs. 2,622.928 billion (US$ 29.143 billion) to Rs. 3,166.044 billion (US$ 35.178 billion) as on June 30, 2011. The volumes of the Exchange shrunk considerably i.e. by 66%. During the period under review, total share volume of regular market reduced to 1,124.762 million shares as compared to previous FY figure of 3,362.668 million shares.
Complementing the efforts of members and listed companies in seeking to find better levels of optimum operational efficiency, LSE continued to identify areas of improvement as part of the Exchange’s present and future development.
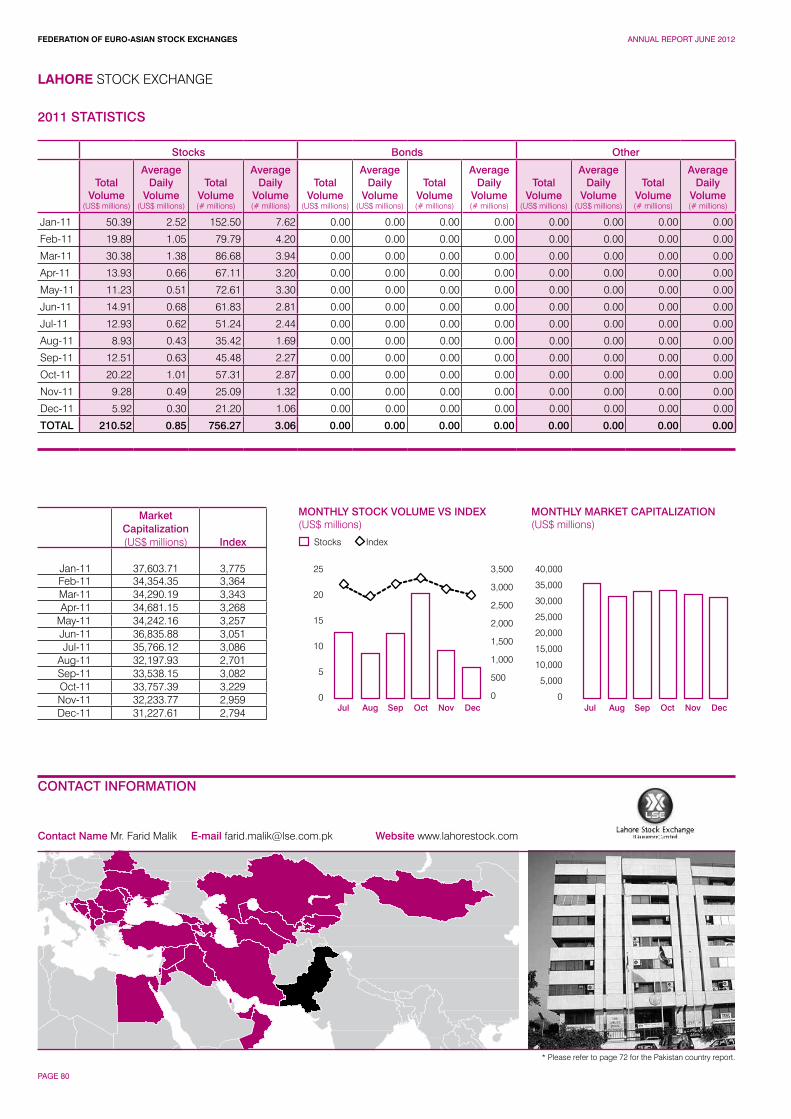
FEDERATION OF EURO-ASIAN STOCK EXCHANGES ANNUAL REPORT JUNE 2012
PAGE 80
Contact Name Mr. Farid Malik E-mail [email protected] Website www.lahorestock.com
LAHORE STOCK EXCHANGE
CONTACT INFORMATION
MONTHLY MARKET CAPITALIZATION(US$ millions)
25
20
15
10
5
0
3,500
3,000
2,500
2,000
1,500
1,000
500
0
40,000
35,000
30,000
25,000
20,000
15,000
10,000
5,000
0
Stocks
MONTHLY STOCK VOLUME VS INDEX(US$ millions)
Index
Jul JulAug AugSep SepOct OctNov NovDec Dec
2011 STATISTICS
Stocks Bonds Other
Total Volume
(US$ millions)
Average Daily
Volume(US$ millions)
Total Volume(# millions)
Average Daily
Volume(# millions)
Total Volume
(US$ millions)
Average Daily
Volume(US$ millions)
Total Volume(# millions)
Average Daily
Volume(# millions)
Total Volume
(US$ millions)
Average Daily
Volume(US$ millions)
Total Volume(# millions)
Average Daily
Volume(# millions)
Jan-11 50.39 2.52 152.50 7.62 0.00 0.00 0.00 0.00 0.00 0.00 0.00 0.00
Feb-11 19.89 1.05 79.79 4.20 0.00 0.00 0.00 0.00 0.00 0.00 0.00 0.00
Mar-11 30.38 1.38 86.68 3.94 0.00 0.00 0.00 0.00 0.00 0.00 0.00 0.00
Apr-11 13.93 0.66 67.11 3.20 0.00 0.00 0.00 0.00 0.00 0.00 0.00 0.00
May-11 11.23 0.51 72.61 3.30 0.00 0.00 0.00 0.00 0.00 0.00 0.00 0.00
Jun-11 14.91 0.68 61.83 2.81 0.00 0.00 0.00 0.00 0.00 0.00 0.00 0.00
Jul-11 12.93 0.62 51.24 2.44 0.00 0.00 0.00 0.00 0.00 0.00 0.00 0.00
Aug-11 8.93 0.43 35.42 1.69 0.00 0.00 0.00 0.00 0.00 0.00 0.00 0.00
Sep-11 12.51 0.63 45.48 2.27 0.00 0.00 0.00 0.00 0.00 0.00 0.00 0.00
Oct-11 20.22 1.01 57.31 2.87 0.00 0.00 0.00 0.00 0.00 0.00 0.00 0.00
Nov-11 9.28 0.49 25.09 1.32 0.00 0.00 0.00 0.00 0.00 0.00 0.00 0.00
Dec-11 5.92 0.30 21.20 1.06 0.00 0.00 0.00 0.00 0.00 0.00 0.00 0.00
TOTAL 210.52 0.85 756.27 3.06 0.00 0.00 0.00 0.00 0.00 0.00 0.00 0.00
MarketCapitalization(US$ millions) Index
Jan-11 37,603.71 3,775Feb-11 34,354.35 3,364Mar-11 34,290.19 3,343Apr-11 34,681.15 3,268
May-11 34,242.16 3,257Jun-11 36,835.88 3,051Jul-11 35,766.12 3,086
Aug-11 32,197.93 2,701Sep-11 33,538.15 3,082Oct-11 33,757.39 3,229Nov-11 32,233.77 2,959Dec-11 31,227.61 2,794
* Please refer to page 72 for the Pakistan country report.
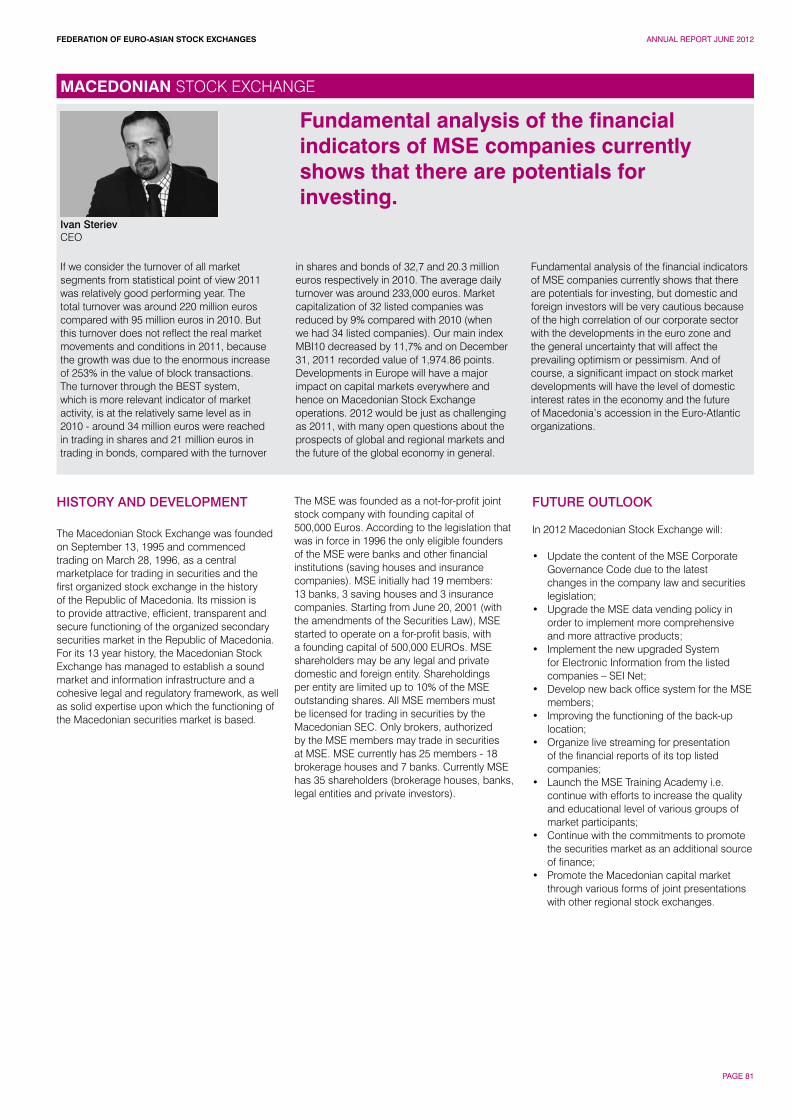
FEDERATION OF EURO-ASIAN STOCK EXCHANGES ANNUAL REPORT JUNE 2012
PAGE 81
Ivan SterievCEO
If we consider the turnover of all market segments from statistical point of view 2011 was relatively good performing year. The total turnover was around 220 million euros compared with 95 million euros in 2010. But this turnover does not reflect the real market movements and conditions in 2011, because the growth was due to the enormous increase of 253% in the value of block transactions. The turnover through the BEST system, which is more relevant indicator of market activity, is at the relatively same level as in 2010 - around 34 million euros were reached in trading in shares and 21 million euros in trading in bonds, compared with the turnover
in shares and bonds of 32,7 and 20.3 million euros respectively in 2010. The average daily turnover was around 233,000 euros. Market capitalization of 32 listed companies was reduced by 9% compared with 2010 (when we had 34 listed companies). Our main index MBI10 decreased by 11,7% and on December 31, 2011 recorded value of 1,974.86 points. Developments in Europe will have a major impact on capital markets everywhere and hence on Macedonian Stock Exchange operations. 2012 would be just as challenging as 2011, with many open questions about the prospects of global and regional markets and the future of the global economy in general.
Fundamental analysis of the financial indicators of MSE companies currently shows that there are potentials for investing, but domestic and foreign investors will be very cautious because of the high correlation of our corporate sector with the developments in the euro zone and the general uncertainty that will affect the prevailing optimism or pessimism. And of course, a significant impact on stock market developments will have the level of domestic interest rates in the economy and the future of Macedonia’s accession in the Euro-Atlantic organizations.
HISTORY AND DEVELOPMENT
The Macedonian Stock Exchange was founded on September 13, 1995 and commenced trading on March 28, 1996, as a central marketplace for trading in securities and the first organized stock exchange in the history of the Republic of Macedonia. Its mission is to provide attractive, efficient, transparent and secure functioning of the organized secondary securities market in the Republic of Macedonia. For its 13 year history, the Macedonian Stock Exchange has managed to establish a sound market and information infrastructure and a cohesive legal and regulatory framework, as well as solid expertise upon which the functioning of the Macedonian securities market is based.
The MSE was founded as a not-for-profit joint stock company with founding capital of500,000 Euros. According to the legislation that was in force in 1996 the only eligible founders of the MSE were banks and other financial institutions (saving houses and insurance companies). MSE initially had 19 members: 13 banks, 3 saving houses and 3 insurance companies. Starting from June 20, 2001 (with the amendments of the Securities Law), MSE started to operate on a for-profit basis, with a founding capital of 500,000 EUROs. MSE shareholders may be any legal and private domestic and foreign entity. Shareholdings per entity are limited up to 10% of the MSE outstanding shares. All MSE members must be licensed for trading in securities by the Macedonian SEC. Only brokers, authorized by the MSE members may trade in securities at MSE. MSE currently has 25 members - 18 brokerage houses and 7 banks. Currently MSE has 35 shareholders (brokerage houses, banks, legal entities and private investors).
FUTURE OUTLOOK
In 2012 Macedonian Stock Exchange will:
• Update the content of the MSE Corporate Governance Code due to the latest changes in the company law and securities legislation;
• Upgrade the MSE data vending policy in order to implement more comprehensive and more attractive products;
• Implement the new upgraded System for Electronic Information from the listed companies – SEI Net;
• Develop new back office system for the MSE members;
• Improving the functioning of the back-up location;
• Organize live streaming for presentation of the financial reports of its top listed companies;
• Launch the MSE Training Academy i.e. continue with efforts to increase the quality and educational level of various groups of market participants;
• Continue with the commitments to promote the securities market as an additional source of finance;
• Promote the Macedonian capital market through various forms of joint presentations with other regional stock exchanges.
Fundamental analysis of the financial indicators of MSE companies currently shows that there are potentials for investing.
MACEDONIAN STOCK EXCHANGE
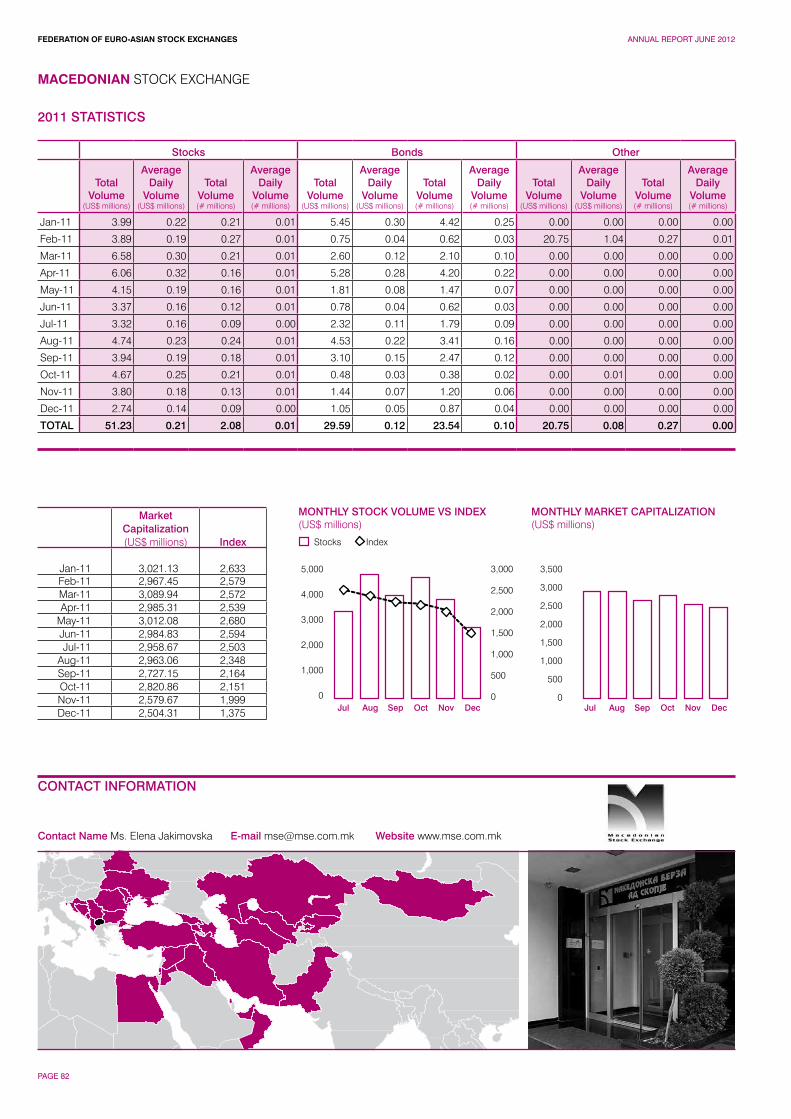
FEDERATION OF EURO-ASIAN STOCK EXCHANGES ANNUAL REPORT JUNE 2012
PAGE 82
MACEDONIAN STOCK EXCHANGE
CONTACT INFORMATION
Contact Name Ms. Elena Jakimovska E-mail [email protected] Website www.mse.com.mk
MONTHLY MARKET CAPITALIZATION(US$ millions)
5,000
4,000
3,000
2,000
1,000
0
3,000
2,500
2,000
1,500
1,000
500
0
3,500
3,000
2,500
2,000
1,500
1,000
500
0
Stocks
MONTHLY STOCK VOLUME VS INDEX(US$ millions)
Index
Jul JulAug AugSep SepOct OctNov NovDec Dec
2011 STATISTICS
Stocks Bonds Other
Total Volume
(US$ millions)
Average Daily
Volume(US$ millions)
Total Volume(# millions)
Average Daily
Volume(# millions)
Total Volume
(US$ millions)
Average Daily
Volume(US$ millions)
Total Volume(# millions)
Average Daily
Volume(# millions)
Total Volume
(US$ millions)
Average Daily
Volume(US$ millions)
Total Volume(# millions)
Average Daily
Volume(# millions)
Jan-11 3.99 0.22 0.21 0.01 5.45 0.30 4.42 0.25 0.00 0.00 0.00 0.00
Feb-11 3.89 0.19 0.27 0.01 0.75 0.04 0.62 0.03 20.75 1.04 0.27 0.01
Mar-11 6.58 0.30 0.21 0.01 2.60 0.12 2.10 0.10 0.00 0.00 0.00 0.00
Apr-11 6.06 0.32 0.16 0.01 5.28 0.28 4.20 0.22 0.00 0.00 0.00 0.00
May-11 4.15 0.19 0.16 0.01 1.81 0.08 1.47 0.07 0.00 0.00 0.00 0.00
Jun-11 3.37 0.16 0.12 0.01 0.78 0.04 0.62 0.03 0.00 0.00 0.00 0.00
Jul-11 3.32 0.16 0.09 0.00 2.32 0.11 1.79 0.09 0.00 0.00 0.00 0.00
Aug-11 4.74 0.23 0.24 0.01 4.53 0.22 3.41 0.16 0.00 0.00 0.00 0.00
Sep-11 3.94 0.19 0.18 0.01 3.10 0.15 2.47 0.12 0.00 0.00 0.00 0.00
Oct-11 4.67 0.25 0.21 0.01 0.48 0.03 0.38 0.02 0.00 0.01 0.00 0.00
Nov-11 3.80 0.18 0.13 0.01 1.44 0.07 1.20 0.06 0.00 0.00 0.00 0.00
Dec-11 2.74 0.14 0.09 0.00 1.05 0.05 0.87 0.04 0.00 0.00 0.00 0.00
TOTAL 51.23 0.21 2.08 0.01 29.59 0.12 23.54 0.10 20.75 0.08 0.27 0.00
MarketCapitalization(US$ millions) Index
Jan-11 3,021.13 2,633Feb-11 2,967.45 2,579Mar-11 3,089.94 2,572Apr-11 2,985.31 2,539
May-11 3,012.08 2,680Jun-11 2,984.83 2,594Jul-11 2,958.67 2,503
Aug-11 2,963.06 2,348Sep-11 2,727.15 2,164Oct-11 2,820.86 2,151Nov-11 2,579.67 1,999Dec-11 2,504.31 1,375
FEDERATION OF EURO-ASIAN STOCK EXCHANGES ANNUAL REPORT JUNE 2012
PAGE 83
Overview1. The economy has strengthened over the past year, but now faces a worsening external environment that has created new risks and headwinds to growth. Sound overall macroeconomic policies, low public debt, and limited cross-border financial linkages should help shield Macedonia from the impact of adverse external conditions. Nonetheless, the authorities should be prepared to respond to slowing growth and heightened risks.Macroeconomic and financial outlook2. The mission expects growth to be 3 percent in 2011, based largely on the strong performance in the first half of the year. Weak growth in trading partners and heightened financial stress in the euro area are expected to weigh on prospects for growth in 2012. These factors are expected to reduce demand for Macedonia’s exports and contribute to tighter domestic financial conditions. The mission expects growth to be 2 percent in 2012, with risks tilted clearly to the downside. Inflation is expected to decline to 2 percent in 2012, as the effects of higher food and commodity prices fade and in response to slowing domestic demand.
3. The mission expects the current account deficit to be around 51/2 percent of GDP in 2011 and 6 to 61/2 percent of GDP in 2012. This reflects a slowing of both exports and imports next year in response to weaker growth externally and in Macedonia. Foreign direct investment and external borrowing by the government are expected to provide adequate financing, allowing a modest accumulation of international reserves. Over the medium term the current account is expected to stabilize at levels that can be financed largely by foreign direct investment.
4. Financial sector indicators continue to suggest sound overall conditions. The capital adequacy ratio has climbed to nearly 17 percent, with tier one capital at 14 percent. Non-performing loans rose somewhat in the third quarter of this year, but remain below their post-crisis peak and are fully covered by bank provisions. Profitability is low but positive, and profits are being used largely to strengthen capital buffers. Loans continue to be financed predominantly by local deposits, with limited reliance on external financing.
Risks5. The possibility of an accelerated economic downturn and intensification of financial stress in the euro area poses significant risks for Macedonia. In such circumstances, demand for Macedonian exports would contract sharply and external financing for the public and private sectors, including foreign direct investment, could become more scarce. The inflow of
private transfers, which are an important source of support to the economy, could also be affected. In such a scenario, economic growth could fall considerably below the mission’s baseline projections, and balance of payments pressures could arise. Several factors could help shield Macedonia from adverse external developments. First, the lack of reliance on external financing for the banking and corporate sectors reduces the likelihood of bank funding pressures or deleveraging. Moreover, bank credit has grown moderately over the past two years, so is less vulnerable to a rapid slowdown than in the run-up to the 2008 crisis. Second, the current account deficit is much lower than in 2008, lessening the magnitude of needed adjustment in the event of external shocks. Further, a strong pipeline of projects that are planned or already underway will provide a base for foreign direct investment in the coming year.Fiscal policy.
6. The mission views the government’s deficit target of 21/2 percent of GDP in 2012 as appropriate in light of economic prospects. This fiscal stance strikes a balance between supporting output and employment, and the need to keep deficits in line with available financing and maintain debt ratios at moderate levels. Over the medium term, it will be important to reduce deficits to preserve debt sustainability and to maintain space to respond to future economic cycles.
7. The expected slowdown in economic growth will translate into a reduction in revenues relative to the 2012 budget assumptions. The mission welcomes the authorities’ intention to respond by reducing expenditure if necessary to achieve the deficit target in the 2012 budget. In this context, it recommends that the authorities plan at an early stage how best to reduce spending relative to budgeted amounts in response to anticipated revenue shortfalls.
8. The mission encourages the authorities to continue with their efforts to strengthen their public debt management strategy and increase the size of the domestic debt market. This is needed to reduce the reliance on external debt markets, which can be volatile and unpredictable as a result of events outside of Macedonia. Compared to other countries in the region and elsewhere, the size of domestic public debt is small, suggesting there is significant room for growth. Moreover, the ample liquidity of the domestic banking system, including significant holdings of central bank debt instruments, points to room for increased domestic public debt without crowding out private investment. A deeper domestic debt market, with longer-term maturities, will also help to build domestic yield curve, which will support development of private debt markets.
In this context, the recent auction of a five-year treasury bond is a welcome development. As the government lengthens its debt maturities over time, including further issuance of five-year bonds, it should respond to changing market conditions and offer higher interest rates if necessary. The mission also encourages the authorities to access private external debt markets at an early stage to pre-finance its borrowing needs, to address the risk that conditions could worsen and markets become more closed.
Monetary Policy and Financial Stability9. The National Bank of the Republic of Macedonia (NBRM) has kept its reference interest rate unchanged at 4 percent over the course of 2011. The mission views this as an appropriate stance. International reserves are at broadly adequate levels, there is little evidence of significant pressures in the balance of payments, inflation is contained, and growth of bank credit and domestic demand has been moderate. Looking forward, the NBRM should be alert to the possibility of balance of payments pressure that could result from adverse external developments and should be prepared to respond promptly.
10. Conservative and independent regulation and supervision by the NBRM has contributed to the stability of the banking system. The authorities should be prepared for the risk of adverse external developments. This calls for continued vigilance in monitoring capital ratios, trends in deposits, loan quality, and bank liquidity, and for contingency planning for risk scenarios. The mission welcomes recent actions to facilitate bank access to liquidity from the NBRM and to the initiation of regular meetings of the Financial Stability Committee. It encourages the authorities to complete their agenda of legal changes to ensure they are fully equipped to respond to any future pressures. This includes further widening the class of assets that banks may use to access NBRM liquidity to include bank loans; addressing the risk of court challenges to decisions on licensing, administration, or closing of banks; and closing gaps in the authority to impose fit and proper requirements on bank managers and owners.
Conclusion11. Macedonia should be prepared for weak growth in its trading partner, with downside risks, in the coming year. A record of sound macroeconomic and financial policies and limited imbalances provide important buffers. Nonetheless, the authorities should plan in advance for a slowdown in growth and remain vigilant to heightened risks.
MACEDONIAN STOCK EXCHANGE
Key Information ContactsCentral Securities Depository www.cdhv.org.mkSecurities & Exchange Commission www.sec.gov.mkNational Bank of the Republic of Macedonia www.nbrm.gov.mk Ministry of Finance www.fin.gov.mk
CAPITAL MARKET DEVELOPMENT AND ECONOMIC OUTLOOK
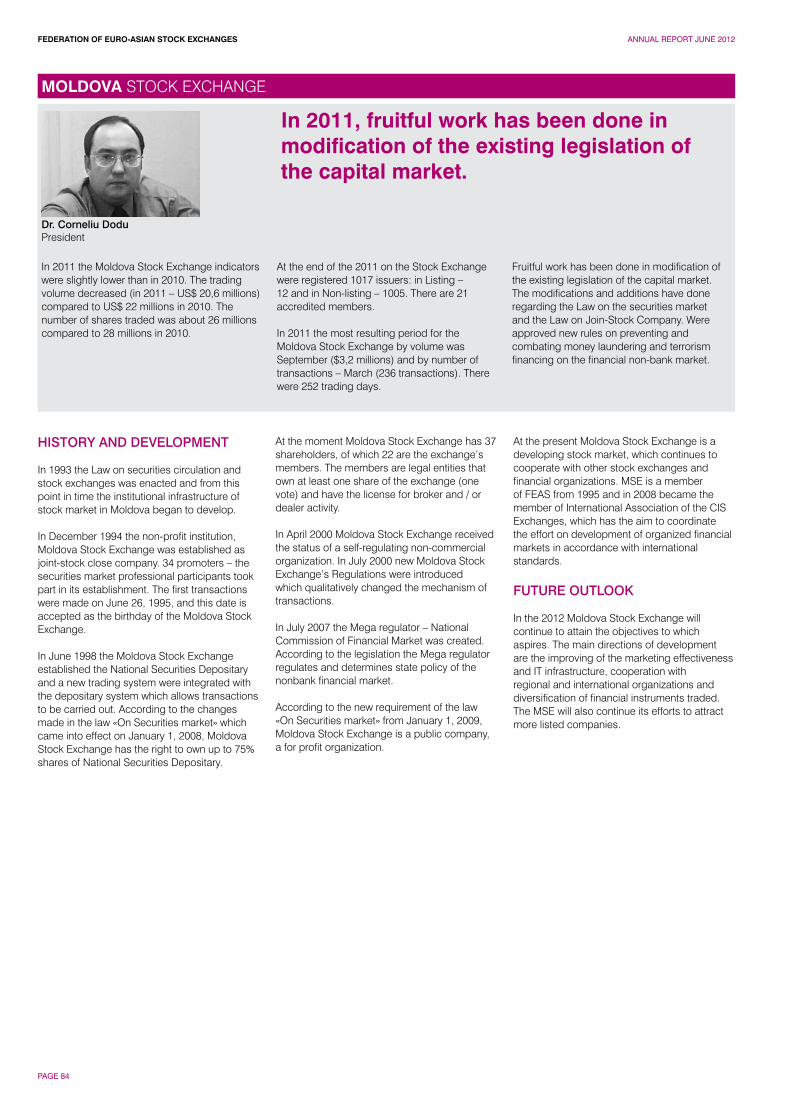
FEDERATION OF EURO-ASIAN STOCK EXCHANGES ANNUAL REPORT JUNE 2012
PAGE 84
Dr. Corneliu DoduPresident
In 2011 the Moldova Stock Exchange indicators were slightly lower than in 2010. The trading volume decreased (in 2011 – US$ 20,6 millions) compared to US$ 22 millions in 2010. The number of shares traded was about 26 millions compared to 28 millions in 2010.
At the end of the 2011 on the Stock Exchange were registered 1017 issuers: in Listing – 12 and in Non-listing – 1005. There are 21 accredited members.
In 2011 the most resulting period for the Moldova Stock Exchange by volume was September ($3,2 millions) and by number of transactions – March (236 transactions). There were 252 trading days.
Fruitful work has been done in modification of the existing legislation of the capital market. The modifications and additions have done regarding the Law on the securities market and the Law on Join-Stock Company. Were approved new rules on preventing and combating money laundering and terrorism financing on the financial non-bank market.
HISTORY AND DEVELOPMENT
In 1993 the Law on securities circulation and stock exchanges was enacted and from this point in time the institutional infrastructure of stock market in Moldova began to develop.
In December 1994 the non-profit institution, Moldova Stock Exchange was established as joint-stock close company. 34 promoters – the securities market professional participants took part in its establishment. The first transactions were made on June 26, 1995, and this date is accepted as the birthday of the Moldova Stock Exchange.
In June 1998 the Moldova Stock Exchange established the National Securities Depositary and a new trading system were integrated with the depositary system which allows transactions to be carried out. According to the changes made in the law «On Securities market» which came into effect on January 1, 2008, Moldova Stock Exchange has the right to own up to 75% shares of National Securities Depositary.
At the moment Moldova Stock Exchange has 37 shareholders, of which 22 are the exchange’s members. The members are legal entities that own at least one share of the exchange (one vote) and have the license for broker and / or dealer activity.
In April 2000 Moldova Stock Exchange received the status of a self-regulating non-commercial organization. In July 2000 new Moldova Stock Exchange’s Regulations were introduced which qualitatively changed the mechanism of transactions.
In July 2007 the Mega regulator – National Commission of Financial Market was created. According to the legislation the Mega regulator regulates and determines state policy of the nonbank financial market.
According to the new requirement of the law «On Securities market» from January 1, 2009, Moldova Stock Exchange is a public company, a for profit organization.
At the present Moldova Stock Exchange is a developing stock market, which continues to cooperate with other stock exchanges and financial organizations. MSE is a member of FEAS from 1995 and in 2008 became the member of International Association of the CIS Exchanges, which has the aim to coordinate the effort on development of organized financial markets in accordance with international standards.
FUTURE OUTLOOK
In the 2012 Moldova Stock Exchange will continue to attain the objectives to which aspires. The main directions of development are the improving of the marketing effectiveness and IT infrastructure, cooperation with regional and international organizations and diversification of financial instruments traded. The MSE will also continue its efforts to attract more listed companies.
In 2011, fruitful work has been done in modification of the existing legislation of the capital market.
MOLDOVA STOCK EXCHANGE
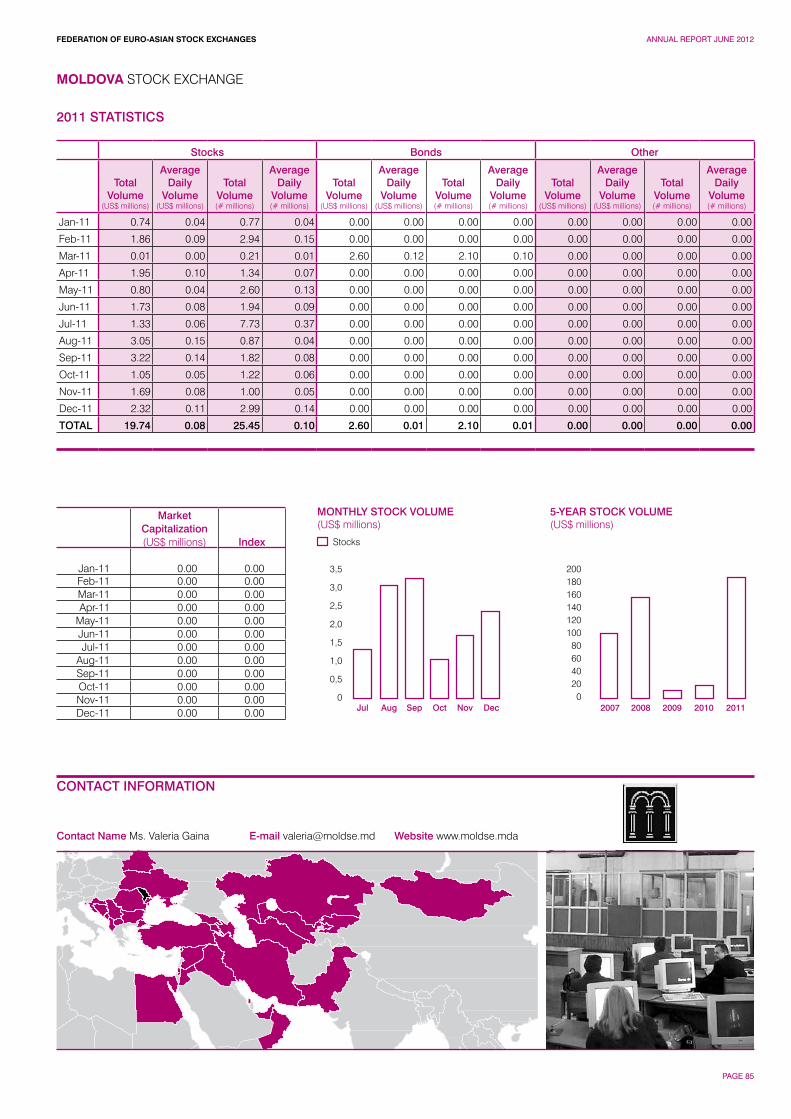
FEDERATION OF EURO-ASIAN STOCK EXCHANGES ANNUAL REPORT JUNE 2012
PAGE 85
Contact Name Ms. Valeria Gaina E-mail [email protected] Website www.moldse.mda
MOLDOVA STOCK EXCHANGE
CONTACT INFORMATION
5-YEAR STOCK VOLUME(US$ millions)
3,5
3,0
2,5
2,0
1,5
1,0
0,5
0
200180160140120100806040200
Stocks
MONTHLY STOCK VOLUME (US$ millions)
Jul Aug Sep Oct Nov Dec 2007 2008 2009 2010 2011
2011 STATISTICS
Stocks Bonds Other
Total Volume
(US$ millions)
Average Daily
Volume(US$ millions)
Total Volume(# millions)
Average Daily
Volume(# millions)
Total Volume
(US$ millions)
Average Daily
Volume(US$ millions)
Total Volume(# millions)
Average Daily
Volume(# millions)
Total Volume
(US$ millions)
Average Daily
Volume(US$ millions)
Total Volume(# millions)
Average Daily
Volume(# millions)
Jan-11 0.74 0.04 0.77 0.04 0.00 0.00 0.00 0.00 0.00 0.00 0.00 0.00
Feb-11 1.86 0.09 2.94 0.15 0.00 0.00 0.00 0.00 0.00 0.00 0.00 0.00
Mar-11 0.01 0.00 0.21 0.01 2.60 0.12 2.10 0.10 0.00 0.00 0.00 0.00
Apr-11 1.95 0.10 1.34 0.07 0.00 0.00 0.00 0.00 0.00 0.00 0.00 0.00
May-11 0.80 0.04 2.60 0.13 0.00 0.00 0.00 0.00 0.00 0.00 0.00 0.00
Jun-11 1.73 0.08 1.94 0.09 0.00 0.00 0.00 0.00 0.00 0.00 0.00 0.00
Jul-11 1.33 0.06 7.73 0.37 0.00 0.00 0.00 0.00 0.00 0.00 0.00 0.00
Aug-11 3.05 0.15 0.87 0.04 0.00 0.00 0.00 0.00 0.00 0.00 0.00 0.00
Sep-11 3.22 0.14 1.82 0.08 0.00 0.00 0.00 0.00 0.00 0.00 0.00 0.00
Oct-11 1.05 0.05 1.22 0.06 0.00 0.00 0.00 0.00 0.00 0.00 0.00 0.00
Nov-11 1.69 0.08 1.00 0.05 0.00 0.00 0.00 0.00 0.00 0.00 0.00 0.00
Dec-11 2.32 0.11 2.99 0.14 0.00 0.00 0.00 0.00 0.00 0.00 0.00 0.00
TOTAL 19.74 0.08 25.45 0.10 2.60 0.01 2.10 0.01 0.00 0.00 0.00 0.00
MarketCapitalization(US$ millions) Index
Jan-11 0.00 0.00Feb-11 0.00 0.00Mar-11 0.00 0.00Apr-11 0.00 0.00
May-11 0.00 0.00Jun-11 0.00 0.00Jul-11 0.00 0.00
Aug-11 0.00 0.00Sep-11 0.00 0.00Oct-11 0.00 0.00Nov-11 0.00 0.00Dec-11 0.00 0.00
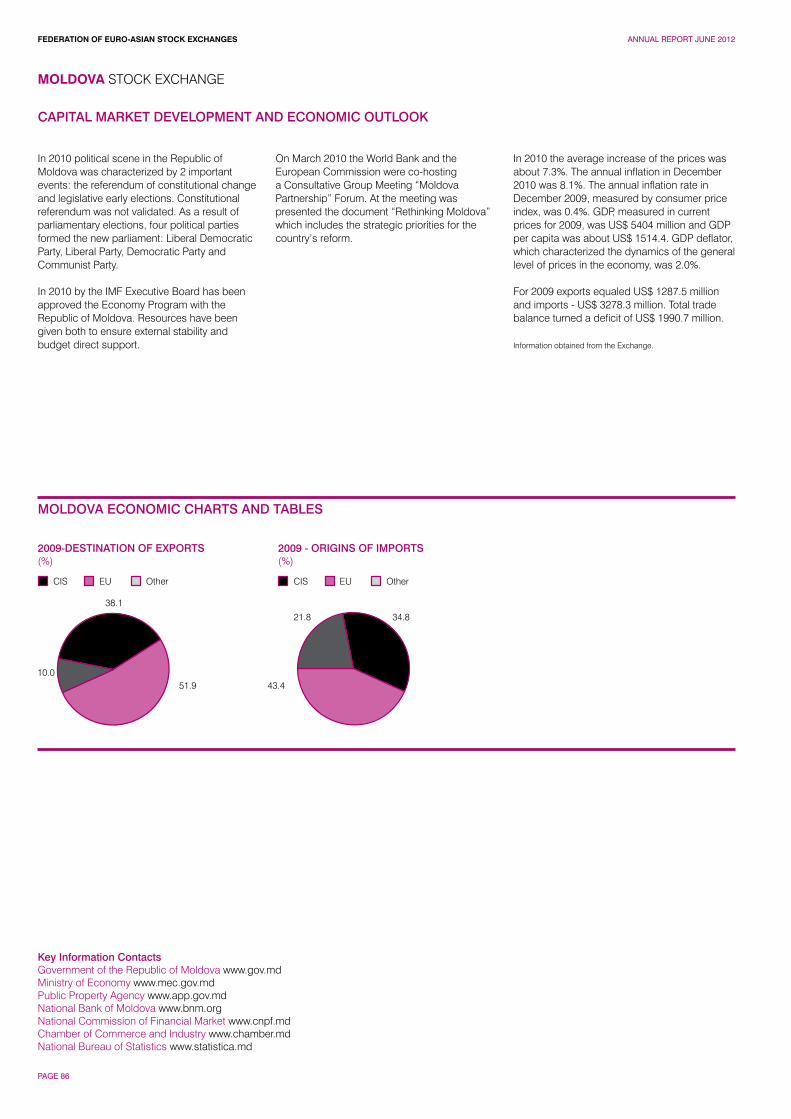
FEDERATION OF EURO-ASIAN STOCK EXCHANGES ANNUAL REPORT JUNE 2012
PAGE 86
In 2010 political scene in the Republic of Moldova was characterized by 2 important events: the referendum of constitutional change and legislative early elections. Constitutional referendum was not validated. As a result of parliamentary elections, four political parties formed the new parliament: Liberal Democratic Party, Liberal Party, Democratic Party and Communist Party.
In 2010 by the IMF Executive Board has been approved the Economy Program with the Republic of Moldova. Resources have been given both to ensure external stability and budget direct support.
On March 2010 the World Bank and the European Commission were co-hosting a Consultative Group Meeting “Moldova Partnership” Forum. At the meeting was presented the document “Rethinking Moldova” which includes the strategic priorities for the country’s reform.
In 2010 the average increase of the prices was about 7.3%. The annual inflation in December 2010 was 8.1%. The annual inflation rate in December 2009, measured by consumer price index, was 0.4%. GDP, measured in current prices for 2009, was US$ 5404 million and GDP per capita was about US$ 1514.4. GDP deflator, which characterized the dynamics of the general level of prices in the economy, was 2.0%.
For 2009 exports equaled US$ 1287.5 million and imports - US$ 3278.3 million. Total trade balance turned a deficit of US$ 1990.7 million.
Information obtained from the Exchange.
MOLDOVA STOCK EXCHANGE
Key Information ContactsGovernment of the Republic of Moldova www.gov.mdMinistry of Economy www.mec.gov.mdPublic Property Agency www.app.gov.mdNational Bank of Moldova www.bnm.orgNational Commission of Financial Market www.cnpf.mdChamber of Commerce and Industry www.chamber.mdNational Bureau of Statistics www.statistica.md
CAPITAL MARKET DEVELOPMENT AND ECONOMIC OUTLOOK
MOLDOVA ECONOMIC CHARTS AND TABLES
2009-DESTINATION OF EXPORTS (%)
38.1
10.051.9
EUCIS Other
2009 - ORIGINS OF IMPORTS (%)
34.821.8
43.4
EUCIS Other
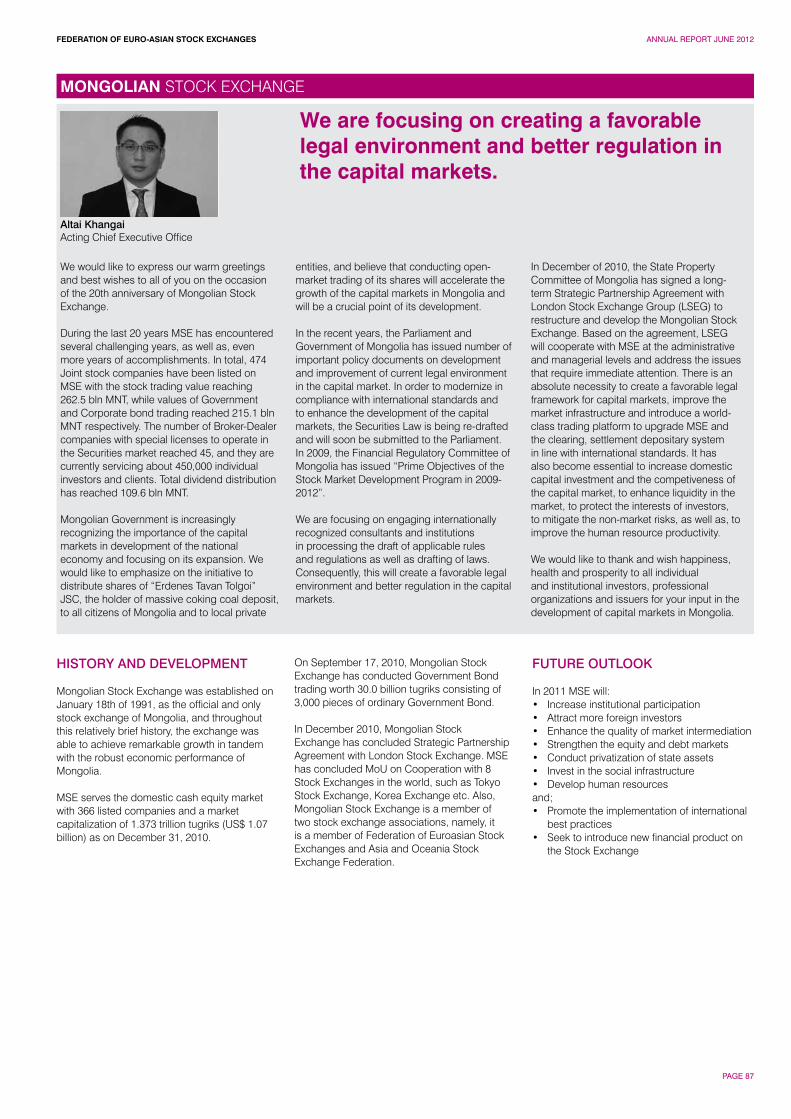
FEDERATION OF EURO-ASIAN STOCK EXCHANGES ANNUAL REPORT JUNE 2012
PAGE 87
Altai KhangaiActing Chief Executive Office
We would like to express our warm greetings and best wishes to all of you on the occasion of the 20th anniversary of Mongolian Stock Exchange.
During the last 20 years MSE has encountered several challenging years, as well as, even more years of accomplishments. In total, 474 Joint stock companies have been listed on MSE with the stock trading value reaching 262.5 bln MNT, while values of Government and Corporate bond trading reached 215.1 bln MNT respectively. The number of Broker-Dealer companies with special licenses to operate in the Securities market reached 45, and they are currently servicing about 450,000 individual investors and clients. Total dividend distribution has reached 109.6 bln MNT.
Mongolian Government is increasingly recognizing the importance of the capital markets in development of the national economy and focusing on its expansion. We would like to emphasize on the initiative to distribute shares of “Erdenes Tavan Tolgoi” JSC, the holder of massive coking coal deposit, to all citizens of Mongolia and to local private
entities, and believe that conducting open-market trading of its shares will accelerate the growth of the capital markets in Mongolia and will be a crucial point of its development. In the recent years, the Parliament and Government of Mongolia has issued number of important policy documents on development and improvement of current legal environment in the capital market. In order to modernize in compliance with international standards and to enhance the development of the capital markets, the Securities Law is being re-drafted and will soon be submitted to the Parliament. In 2009, the Financial Regulatory Committee of Mongolia has issued “Prime Objectives of the Stock Market Development Program in 2009-2012”.
We are focusing on engaging internationally recognized consultants and institutions in processing the draft of applicable rules and regulations as well as drafting of laws. Consequently, this will create a favorable legal environment and better regulation in the capital markets.
In December of 2010, the State Property Committee of Mongolia has signed a long-term Strategic Partnership Agreement with London Stock Exchange Group (LSEG) to restructure and develop the Mongolian Stock Exchange. Based on the agreement, LSEG will cooperate with MSE at the administrative and managerial levels and address the issues that require immediate attention. There is an absolute necessity to create a favorable legal framework for capital markets, improve the market infrastructure and introduce a world-class trading platform to upgrade MSE and the clearing, settlement depositary system in line with international standards. It has also become essential to increase domestic capital investment and the competiveness of the capital market, to enhance liquidity in the market, to protect the interests of investors, to mitigate the non-market risks, as well as, to improve the human resource productivity.
We would like to thank and wish happiness, health and prosperity to all individual and institutional investors, professional organizations and issuers for your input in the development of capital markets in Mongolia.
HISTORY AND DEVELOPMENT
Mongolian Stock Exchange was established on January 18th of 1991, as the official and only stock exchange of Mongolia, and throughout this relatively brief history, the exchange was able to achieve remarkable growth in tandem with the robust economic performance of Mongolia.
MSE serves the domestic cash equity market with 366 listed companies and a market capitalization of 1.373 trillion tugriks (US$ 1.07 billion) as on December 31, 2010.
On September 17, 2010, Mongolian Stock Exchange has conducted Government Bond trading worth 30.0 billion tugriks consisting of 3,000 pieces of ordinary Government Bond.
In December 2010, Mongolian Stock Exchange has concluded Strategic Partnership Agreement with London Stock Exchange. MSE has concluded MoU on Cooperation with 8 Stock Exchanges in the world, such as Tokyo Stock Exchange, Korea Exchange etc. Also, Mongolian Stock Exchange is a member of two stock exchange associations, namely, it is a member of Federation of Euroasian Stock Exchanges and Asia and Oceania Stock Exchange Federation.
FUTURE OUTLOOK
In 2011 MSE will:• Increase institutional participation• Attract more foreign investors• Enhance the quality of market intermediation• Strengthen the equity and debt markets• Conduct privatization of state assets• Invest in the social infrastructure• Develop human resourcesand;• Promote the implementation of international
best practices• Seek to introduce new financial product on
the Stock Exchange
We are focusing on creating a favorable legal environment and better regulation in the capital markets.
MONGOLIAN STOCK EXCHANGE
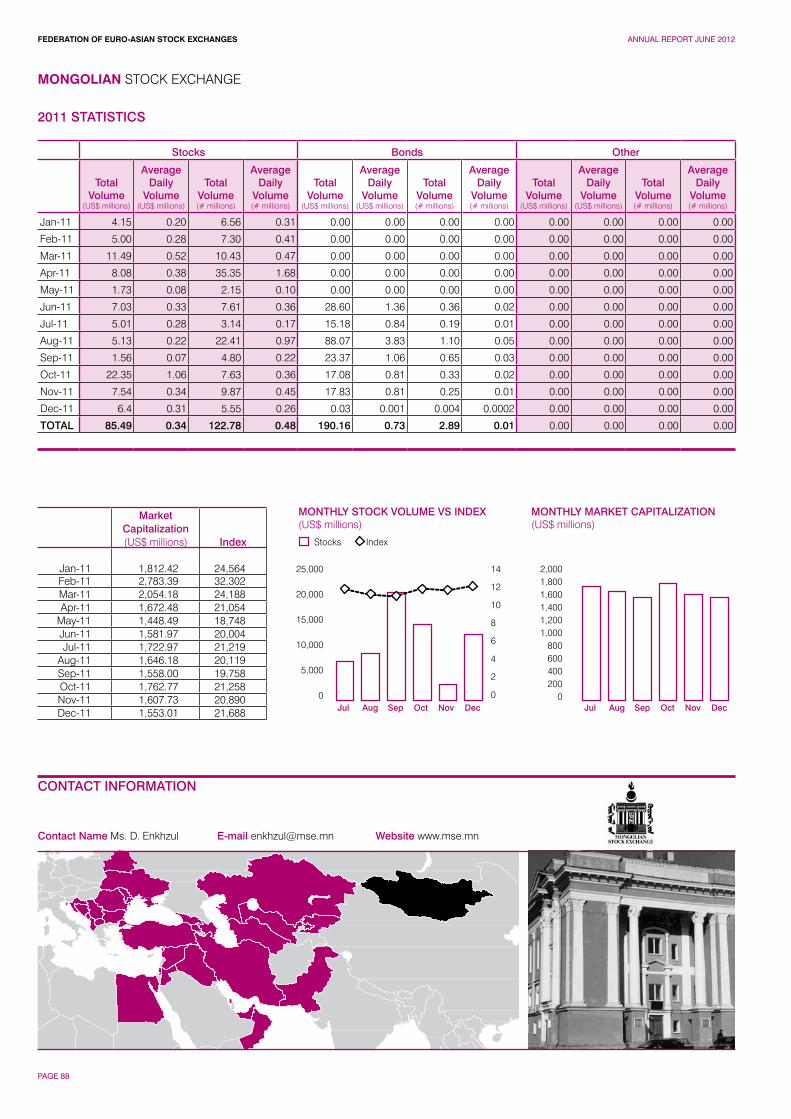
FEDERATION OF EURO-ASIAN STOCK EXCHANGES ANNUAL REPORT JUNE 2012
PAGE 88
Contact Name Ms. D. Enkhzul E-mail [email protected] Website www.mse.mn
MONGOLIAN STOCK EXCHANGE
CONTACT INFORMATION
2011 STATISTICS
Stocks Bonds Other
Total Volume
(US$ millions)
Average Daily
Volume(US$ millions)
Total Volume(# millions)
Average Daily
Volume(# millions)
Total Volume
(US$ millions)
Average Daily
Volume(US$ millions)
Total Volume(# millions)
Average Daily
Volume(# millions)
Total Volume
(US$ millions)
Average Daily
Volume(US$ millions)
Total Volume(# millions)
Average Daily
Volume(# millions)
Jan-11 4.15 0.20 6.56 0.31 0.00 0.00 0.00 0.00 0.00 0.00 0.00 0.00
Feb-11 5.00 0.28 7.30 0.41 0.00 0.00 0.00 0.00 0.00 0.00 0.00 0.00
Mar-11 11.49 0.52 10.43 0.47 0.00 0.00 0.00 0.00 0.00 0.00 0.00 0.00
Apr-11 8.08 0.38 35.35 1.68 0.00 0.00 0.00 0.00 0.00 0.00 0.00 0.00
May-11 1.73 0.08 2.15 0.10 0.00 0.00 0.00 0.00 0.00 0.00 0.00 0.00
Jun-11 7.03 0.33 7.61 0.36 28.60 1.36 0.36 0.02 0.00 0.00 0.00 0.00
Jul-11 5.01 0.28 3.14 0.17 15.18 0.84 0.19 0.01 0.00 0.00 0.00 0.00
Aug-11 5.13 0.22 22.41 0.97 88.07 3.83 1.10 0.05 0.00 0.00 0.00 0.00
Sep-11 1.56 0.07 4.80 0.22 23.37 1.06 0.65 0.03 0.00 0.00 0.00 0.00
Oct-11 22.35 1.06 7.63 0.36 17.08 0.81 0.33 0.02 0.00 0.00 0.00 0.00
Nov-11 7.54 0.34 9.87 0.45 17.83 0.81 0.25 0.01 0.00 0.00 0.00 0.00
Dec-11 6.4 0.31 5.55 0.26 0.03 0.001 0.004 0.0002 0.00 0.00 0.00 0.00
TOTAL 85.49 0.34 122.78 0.48 190.16 0.73 2.89 0.01 0.00 0.00 0.00 0.00
MarketCapitalization(US$ millions) Index
Jan-11 1,812.42 24,564Feb-11 2,783.39 32,302Mar-11 2,054.18 24,188Apr-11 1,672.48 21,054
May-11 1,448.49 18,748Jun-11 1,581.97 20,004Jul-11 1,722.97 21,219
Aug-11 1,646.18 20,119Sep-11 1,558.00 19,758Oct-11 1,762.77 21,258Nov-11 1,607.73 20,890Dec-11 1,553.01 21,688
25,000
20,000
15,000
10,000
5,000
0
14
12
10
8
6
4
2
0
Stocks
MONTHLY STOCK VOLUME VS INDEX(US$ millions)
Index
Jul Aug Sep Oct Nov Dec
MONTHLY MARKET CAPITALIZATION(US$ millions)
2,0001,8001,6001,4001,2001,000
800600400200
0Jul Aug Sep Oct Nov Dec
FEDERATION OF EURO-ASIAN STOCK EXCHANGES ANNUAL REPORT JUNE 2012
PAGE 89
Political Outlook The outlook for the domestic political scene is stable, and the president, Elbegdorj Tsakhia and, prime minister, Batbold Sukhbaatar will maintain the Mongolia’s relatively liberal social and economic policies, as well as its multi-lateral foreign policy stance. Mongolia’s foreign policy will continue to be based on its close relationship with its two neighbors, Russia and China, as well and developing close relationship with its “Third Neighboors”, the US, Japan and Western Countries.
These ties have been strengthened by a series of bilateral visits with the Russia, China and Japan and other countries. Mongolia has also signed agreement on setting up state owned JV of Mongolia and Russia, Dornod Uran” to extract and mine uranium resources. Mongolia also has significant presence of Western capital in the form of investment by Ivanhoe Mines and Rio Tinto in its masive Oyu Tolgoi copper and gold project in South Gobi region.
There are no immediate threats in North East Asian region, which Mongolia is located, except an issue of North Korea.
Mongolian peacekeepers also participate actively in international peacekeeping efforts in such countries as Chad and Sudan, as well as participating in military operations of US-led coalition in Iraq and Afghanistan.
As well as seeking close relationship with its two neighbors, Russia and China, Mongolia will seek to have balance by developing close strategic relationships with US, Japan and EU. Taking notice of its overreliance from China on exports of commodities, Mongolian Government will seek to build a new railroad route to reach markets of Japan and South Korea via Russia.
Economic PerformanceMongolian economy expected to have grown at a rate of 8% in 2010 and as of September 2010 Industrial production grew at annual rate of 15%. According to Bank of Mongolia, Mongolian Official Foreign Currency Reserve hit US$ 2 billion US$ at the end of 2010.
In 2010 Mongolia made a foreign trade with 132 countries of the world and total foreign trade turnover reached 6177.1 million US$, from which export stood at 2899.2 million US$ and imports at 3277.9 million US$. The total foreign trade turnover increased by 53.5% and exports increased by 53.8% and imports increased by 53.3% respectively.
Total number of unemployed people who registered with relevant authorities as of end of December 2010 stood at 38.3 thousand people.
Consumer price index has increased by 13.0% compared to the same period last year in December 2010. The average yearly inflation rate was at 10.1%.
In 2010 Government of Mongolian began to hand out 10,000 tugriks to each citizen every month and beginning from January 1, 2011 it will hand out 21,000 tugriks to each citizen, which will boost domestic consumption.
Mongolian National Tugrik (MNT) was the best performing currency of the world in 2010 and it appreciated by 16% and stood at 1,257.18 against a US$. The authorities also agreed to allow greater exchange rate flexibility, to strengthen the fragile banking system, and to improve the targeting of social spending. Investment in mining has increased a lot.
The outlook of economy in 2011 looks very bright and Mongolian economy is expected to grow by 12% in 2011 according to a forecast by Economic Intelligence Unit. Cash handouts to citizens will increase domestic consumption, but will also push inflation higher.
As for copper, the price is projected to remain at high levels (more than 9,000 US$ per ton) during the forecast period, which will stimulate production. In 2010 coal became the largest export commodity in terms of value and it is expected to remain same in 2011.
Prospects for development of new mines brightened considerably in October 2009, when the government signed an agreement with an international mining company to exploit the Oyu Tolgoi copper and gold deposit. Investment in this project is expected to total US$ 6 billion production is projected to start in 2013. The long-awaited Oyu Tolgoi agreement and subsequent construction will raise investor confidence and have knock-on effects on other parts of the economy.
Moreover, the government is considering proposals to mine the large Tavan Tolgoi coal deposit with international partners and distribute share vouchers after organizing it as Joint Stock Company. The valuation of Tavan Tolgoi deposit by international experts range from 30-40 billion US$ and it has 6.5 billion tonnes of coal reserve. FDI inflows into mining are expected to rise significantly over the forecast period.
Investment is expected to increase further, driven by Oyu Tolgoi. Also, Mongolian Government is planning to build a railroad from Tavan tolgoi deposit to Russia via Gobi Desert and Eastern Mongolia with a plan to transport it to Russian Pacific ocean ports to Japan and South Korea.
Moreover, after abolishment of 68% Windfall Profits Tax on gold and copper takes its effect beginning from January 1, 2011, the gold sold to Central Bank and related tax revenue is likely to increase, because gold industry will come out of shadow.
Also, uranium mining and extraction is likely start in 2011.
Information obtained from the Exchange.
MONGOLIAN STOCK EXCHANGE
Key Information ContactsNational Statistics Office www.nso.mnBank of Mongolia www.mongolbank.mnNational Development and Innovation Committee www.ndic.gov.mn
CAPITAL MARKET DEVELOPMENT AND ECONOMIC OUTLOOK
FEDERATION OF EURO-ASIAN STOCK EXCHANGES ANNUAL REPORT JUNE 2012
PAGE 90
Mr. Gojko MaksimovicActing CEO
Actual events that marked the previous year such as the global financial crisis, showed that the strongest economy, at first developed and stable market can be unpredictable and directly affected by unforeseeable repercussions that are progressive, breakneck speed reflect on all branches of the economy including the securities market. The key to success of any activity, in our case, recovery of financial markets lies in the synergy of all stakeholders who participate in it, and synchronized activities restore confidence of domestic and foreign investors. Continued implementation and further development of legislation pursuant EU and developed markets
through further tax relief and benefits for participants in the financial markets, particularly in the area of fund groups (pension and investment funds), the constant promotion of the domestic market as the individual performances, and within region will choose back investors. The period of stagnation stock activity should certainly be used in the further implementation and construction of corporate culture within the company and market introduction of new materials, derivatives and short-term securities, which will be the first and crucial step in the return of foreign investors in our market. The period of recovery is not, and will not be easy and fast, but according to earlier
experience, a proven, that after each rain, the sun again in sight. From this crisis should draw lessons not to repeat mistakes, and take as long as possible with a positive balance. The market will always exist, traders also, long-term or short-term securities, futures options, swaps, market and other material.
Montenegro Stock Exchange will continue to be a locomotive for further development of the Montenegrian securities market, its promoter, and active participant of international integration.
HISTORY AND DEVELOPMENT
The MSE was set up in June 1993 pursuant to the Act on Money and Capital Markets (1989). The first founding members were the four Montenegrin banks: Montenegrobanka a.d. Podgorica, Pljevaljska banka a.d. Pljevlja, Beranska banka a.d. Berane, Hipotekarna banka a.d. Podgorica, and the Republic of Montenegro, i.e. Montenegrin Agency for Economic Restructuring and Foreign Investments.
During the constitutional meeting held on 7 July 1997, the MSE harmonized its operations with the Exchange through the exchange operations and exchange intermediaries Act. Another three banks and two insurance companies joined the founding–members of the Exchange: Podgoriaka banka a.d. Podgorica, Jugobanka a.d. Podgorica, Niksicka banka a.d. Niksic, Lovcen osiguranje a.d. Podgorica and Swiss osiguranje a.d. Podgorica.
In order to increase its capital share, the MSE issued additional shares, upon the approval of the Federal Commission for Securities and Financial Markets. The shares were subscribed and paid for by several Yugoslav banks, as well as the Federal Government.
In order to comply with The Law on Securities of the Republic of Montenegro, the MSE issued a third issue of shares. The importance of this issue which was sold successfully with 100% subscription was instrumental in the further development of the capital market of Montenegro because with the sale of this issue 10 new shareholders emerged as owners of the MSE from banking sector, insurance companies and private companies from all spheres of economy. As of today, the MSE has 23 shareholders. The MSE moved to its new premises in the new business district of the city.
FUTURE OUTLOOK
Montenegro Stock Exchange Has Big Plans for the Year Ahead...It aims to raise the level of market liquidity and to implement a new information system project, funded by the government of Luxemburg. This is expected to start soon. The project management has been entrusted to the Luxemburg stock exchange, while the technical implementation will be carried out in cooperation with the Belgrade Stock Exchange. The system has been designed in accordance with world standards and functions in all areas in accordance with MIFID, which is of crucial importance to Montenegro as future member of the European Union. Apart from the implementation of the new system, it is of vital importance for Montenegro to have the Luxemburg stock exchange as its partner.
This is just one in a series of projects that have been planned to take place through this cooperation. This year’s plan also envisages the development of a new index in cooperation with the Vienna stock exchange, with which Montenegroberza has already worked successfully over a long period of time. This index will be calculated and published at the Vienna stock exchange and will consequently directly expose companies in the index to monitoring by world investors.
In addition to this, it has been planned that at least one Montenegrin company should appear in the index that includes FEAS countries, and which will be calculated and published by the world known index provider Dow Jones. It is also intended to enrich the market with new material, i.e. derivative securities, which will expand the range of products on offer and will refresh the market. Implementation of the project is planned to take place with cooperation from European agencies that are specialized in this segment of the market. The first foreign listing in the market will also be worked on through the IPO process.
The Montenegroberza web site will be enriched by increasing the quality of its reporting in terms of data necessary for performing the analyses of investments, particularly in risk management.
Some educational activities are also planned in order to enrich knowledge regarding the importance of corporate governance, and to increase the number of companies that accept the Corporate Governance Codex in Montenegro. The corporate governance sector is of vital importance in joint stock companies and it is directly related to the stock exchange market as it directly contributes to the protection of shareholders’ interests. Code of Corporate Governance for Montenegro was formed in May 2009, as a result of cooperation between the Montenegrin Stock Exchange and International Finance Corporation (IFC).
Testing of a Scorecard methodology in Montenegro In cooperation of Montenegroberza and International Financial Corporation (IFC) within the project “Promotion of Corporate the testing of a Scorecard methodology was carried out in six companies. Montenegroberza supported Governance in Montenegro” and recommended this kind of testing to the listed compaies in Montenegro. The code was accepted by five listed companies, and not all of them tested the actual level of application of standards. Six listed companies agreed to test the actual level of corporate governance: Plantaze JSC, Zeljeznicka infrastruktura JSC, Zeljeznicki prevoz JSC, Montecargo JSC, Pobjeda JSC and Zetatrans JSC. IFC provided consultations for those companies free of charge through in-house workshops. Testing of scorecard methodology gave some results and highlighted some problems regarding the actual situation of Corporate Governance in Montenegrin companies. Scorecard show that the most problematic areas were: supervision and control, transparency, and Board of Directors (election of members).
Continuous development of our market is the basis of the future of the MSE, a future in which the MSE strongly believes.
MONTENEGRO STOCK EXCHANGE
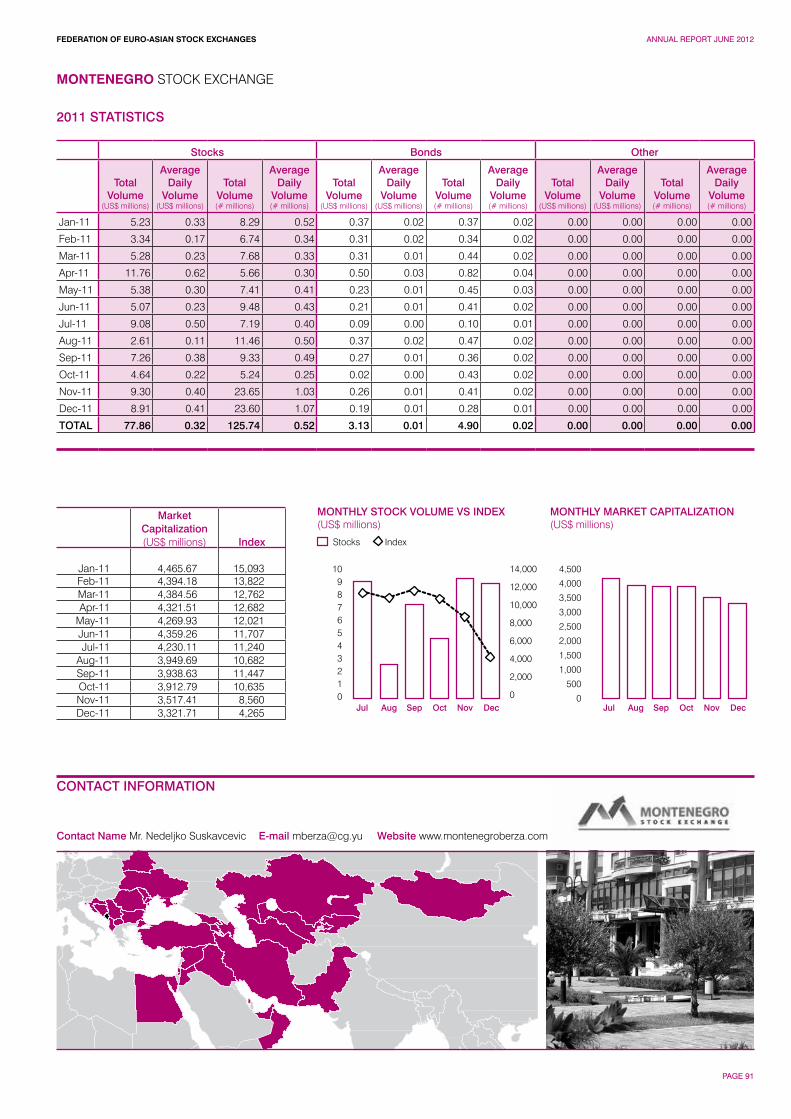
FEDERATION OF EURO-ASIAN STOCK EXCHANGES ANNUAL REPORT JUNE 2012
PAGE 91
Contact Name Mr. Nedeljko Suskavcevic E-mail [email protected] Website www.montenegroberza.com
MONTENEGRO STOCK EXCHANGE
CONTACT INFORMATION
MONTHLY MARKET CAPITALIZATION(US$ millions)
109876543210
14,000
12,000
10,000
8,000
6,000
4,000
2,000
0
4,500
4,000
3,500
3,000
2,500
2,000
1,500
1,000
500
0
Stocks
MONTHLY STOCK VOLUME VS INDEX(US$ millions)
Index
Jul JulAug AugSep SepOct OctNov NovDec Dec
2011 STATISTICS
Stocks Bonds Other
Total Volume
(US$ millions)
Average Daily
Volume(US$ millions)
Total Volume(# millions)
Average Daily
Volume(# millions)
Total Volume
(US$ millions)
Average Daily
Volume(US$ millions)
Total Volume(# millions)
Average Daily
Volume(# millions)
Total Volume
(US$ millions)
Average Daily
Volume(US$ millions)
Total Volume(# millions)
Average Daily
Volume(# millions)
Jan-11 5.23 0.33 8.29 0.52 0.37 0.02 0.37 0.02 0.00 0.00 0.00 0.00
Feb-11 3.34 0.17 6.74 0.34 0.31 0.02 0.34 0.02 0.00 0.00 0.00 0.00
Mar-11 5.28 0.23 7.68 0.33 0.31 0.01 0.44 0.02 0.00 0.00 0.00 0.00
Apr-11 11.76 0.62 5.66 0.30 0.50 0.03 0.82 0.04 0.00 0.00 0.00 0.00
May-11 5.38 0.30 7.41 0.41 0.23 0.01 0.45 0.03 0.00 0.00 0.00 0.00
Jun-11 5.07 0.23 9.48 0.43 0.21 0.01 0.41 0.02 0.00 0.00 0.00 0.00
Jul-11 9.08 0.50 7.19 0.40 0.09 0.00 0.10 0.01 0.00 0.00 0.00 0.00
Aug-11 2.61 0.11 11.46 0.50 0.37 0.02 0.47 0.02 0.00 0.00 0.00 0.00
Sep-11 7.26 0.38 9.33 0.49 0.27 0.01 0.36 0.02 0.00 0.00 0.00 0.00
Oct-11 4.64 0.22 5.24 0.25 0.02 0.00 0.43 0.02 0.00 0.00 0.00 0.00
Nov-11 9.30 0.40 23.65 1.03 0.26 0.01 0.41 0.02 0.00 0.00 0.00 0.00
Dec-11 8.91 0.41 23.60 1.07 0.19 0.01 0.28 0.01 0.00 0.00 0.00 0.00
TOTAL 77.86 0.32 125.74 0.52 3.13 0.01 4.90 0.02 0.00 0.00 0.00 0.00
MarketCapitalization(US$ millions) Index
Jan-11 4,465.67 15,093Feb-11 4,394.18 13,822Mar-11 4,384.56 12,762Apr-11 4,321.51 12,682
May-11 4,269.93 12,021Jun-11 4,359.26 11,707Jul-11 4,230.11 11,240
Aug-11 3,949.69 10,682Sep-11 3,938.63 11,447Oct-11 3,912.79 10,635Nov-11 3,517.41 8,560Dec-11 3,321.71 4,265
FEDERATION OF EURO-ASIAN STOCK EXCHANGES ANNUAL REPORT JUNE 2012
PAGE 92
Political InformationMontenegro has continued to make progress in addressing the political criteria. It has improved its legal framework and has strengthened its administrative and institutional capacity. Regarding human rights and the respect for and protection of minority groups, the legal and policy framework is largely in place and broadly corresponds to European and international standards. The institutional framework is largely adequate. However, there are gaps in implementation in all fields.
The main concerns relate to the following areas: effectiveness of anti-discrimantion policies, freedom of expression and government relations with the civil society as well as the situation regarding displaced persons from Croatia, Bosnia and Herzegovina and Kosovo. Furthermore, Montenegro needs to intensify its efforts to consolidate its rule of law, in particular in the fight against corruption and organised crime, which still remain a serious problem. Montenegro plays a constructive role in Maintaining regional stability and in fostering good neighbourly relations with other Western Balkan and EU countries.
The Prime Minister of Montengro Mr Milo Djukanovic has stepped down, and new Prime Minister of Montenegro is Mr Igor Luksic, ex Minister of finance in the Government of Montenegro.
Business Environment The business environment in 2010 was characterized by problems related to a lack of liquidity, a lack of financial resources, and a slowdown in the Montenegrin economy. The major laws that influenced business, which were adopted during the fourth quarter, were Law on Excise, the Law on Financing for Local Governments, the Labor Law and changes in the level of the minimum wage.
Macroeconomic Outlook The fourth quarter of 2010, at a macroeconomic level, was the one in which recovery from the financial crisis was seen. Inflation is still at a very low level, and in the labour market only slightly positive trends can be seen so far regarding any increases in wages. Although a decrease was recorded in comparison with the same period last year, the FDI volume is at quite a high level considering the absence of any major privatization takeovers in 2010 (unlike those seen in 2009).
Banking SectorTotal bank assets amounted to EUR3,007.5 million at end-August 2010, EUR2,907.6 million at end-September and EUR2,917.6 million at end-October 2010. In comparison with last year, total bank assets during these three months were lower. Total bank deposits amounted to EUR1,786.2 million at end-October 2010, thus showing a month-to-previous-month growth of 0.2%. At end-September 2010, when compared with August, the total amount of deposits had decreased by 4.5%.
Privatization and InvestmentsMontenegro still has not used all of its potential for attracting new investment. There are three big projects that lie ahead: the construction of a highway, the construction of hydropower plants on the River Moraca and the construction of a new tourist resort on the Lustica peninsula. Additionally, the World Bank’s new strategy envisages a large amount of credit support to Montenegro in the areas of agriculture, health, higher education and science, and in the remediation of environmentally problematic issues. EBRD and IFC also plan to finance some large projects in Montenegro: a power network upgrade, the construction of a highway bypass in Podgorica and to make improvements to the water supply system in the municipality of Danilovgrad.
Economic Freedom According to the report ‘Economic Freedom of the World’ published by the Heritage Foundation and the Wall Street Journal, Montenegro’s economic freedom score is 62.5, making its economy the 76th freest in the 2011 index. Its score has decreased by 1.1 points since last year, primarily because of an explosion of growth in government spending. Montenegro ranks as 34 out of 43 countries in the European region, and its overall score is above average in the world.
Capital Market The Montenegro Stock Exchange in Montenegro began to operate as one in January 2011 after a technical merger of the Nex and the Montenegro Stock Exchange at the end of December 2010. Following this event, the NEX Stock Exchange ceased to exist as a legal entity.
Montenegro Officially Becomes an EU Candidate CountryOn Friday, December 17th, 2010, at a two-day summit in Brussels, the European Council backed a recommendation made by the European Commission to grant candidate status to Montenegro. However, this decision does not guarantee an easy journey towards joining the Union, since no date for the opening of membership talks has been set yet. This is a signal that the country, which has a population of just 630,000, needs to speed up reforms. Montenegro is the fifth candidate country in line for membership, together with Croatia, Iceland, Macedonia and Turkey.
Information obtained from the Exchange.
MONTENEGRO STOCK EXCHANGE
Key Information ContactsSecurities Commission of Montenegro www.scmn.cg.yuCentral Depository Agency www.cda.cg.yuCentral Bank of Montenegro www.cb-cg.orgMinistry of Finance www.ministarstvo-finansija.cg.yuMontenegro Statistical Office www.monstat.cg.yu
CAPITAL MARKET DEVELOPMENT AND ECONOMIC OUTLOOK
FEDERATION OF EURO-ASIAN STOCK EXCHANGES ANNUAL REPORT JUNE 2012
PAGE 93
Ahmed Saleh Al-MarhoonDirector General
We are all aware of the negative impacts of the global economic crisis and the Arab spring events on the performance of Arab and Gulf financial markets. This is evident from the continued degradation of investors’ confidence in these markets and the resulting decline of trading volumes and price indices. Financial market data show that the average fall in global capital markets reached around 11.6%, while Arab and Gulf capital markets declined by around 18% and 11.8% respectively.
The performance of Muscat Securities Market has been, to a large extent, influenced by all these circumstances. Trading volumes continued to fall for the second year running to reach around US$ 2.5 billion in 2011 compared to US$ 3.4 billion at the end of 2010, thus posting a decline of 22.9%. Meanwhile, the number of traded shares fell by 21.2% to reach 6.2 billion in 2011 compared to 7.9 billion in 2010. Muscat Securities Market Index, better known as MSM-30 plunged by 15.7% to close at 5695 points compared to 6754 points in 2010. The same trend applied to market capitalization of the listed securities, which declined by 5.1% to reach US$ 26.8 billion by the end of 2011 compared to US$ 28.3 billion in 2010.
Muscat Securities Market has, during the year 2011, implemented a number of projects in various aspects related to the development of the market.
Margin Trade Regulation has been approved by CMA in 15 January 2012 after halt since 1998. Hence brokerage firms can now provide this service to their clients.
In the field of information security the MSM has been awarded ISO 27001 certification by the British Standard Institute (BSI) in recognition of MSM information security management system (ISMS) covering it’s Networking and security solution.
The MSM launched, during the current month, the latest NYSE Technologies version V.90 of the trading system and other related systems. Furthermore, brokerage companies have been connected with the trading system via modern and advanced network using state-of-the-art MPLS technology (Multiprotocol Label Switching). This new technology increases the level of information security and secrecy through Virtual Private Network (VPN) technology.
On training, Muscat Securities Market has signed a cooperation agreement with Bombay Stock Exchange Training Institute to deliver training programs in the securities and capital markets fields in the Sultanate. Both MSM and BSE have organized, in Muscat, training programs on analyzing the dynamics of stock markets.
The MSM introduced, in its website, an advanced system for prompt analysis of listed companies` data. The analyses will be published on MSM website to enable, brokerage companies, investors and other interested parties, base their investment decisions on solid grounds.
It is worth mentioning that Muscat Securities Market has made extensive contacts with the World Federation of Exchanges (WFE) in order to upgrade the level of MSM membership from an affiliate to a full member. The market has already submitted all the necessary documents and information to the Federation.
MSM DEVELOPMENT
Muscat Securities Market has implemented a number of projects related to the development of the market.
In the area of information security and protection, MSM applies the best international practices in information technology, especially those related to customer information security. In this respect the MSM has obtained the international ISO 27001 in the area of information security.
The MSM launched, during the current month, the latest NYSE Technologies version V.90 of the trading system and other related systems.
All brokerage companies are now connected with the trading system via modern and advanced network using state-of-the-art MPLS technology (Multiprotocol Label Switching).
Regarding MSM Index, the market has introduced a change in the sectors forming the price index. The Banking and Investment Companies Sector was renamed to the Financial Sector. Services and Insurance Sector became the Services Sector and the Industry Sector remained unchanged. This
new amendments resulted in a reclassification of some companies in the new sectors based on their main activity. Moreover, the number of companies forming MSM sectoral indices increased to 15 instead of 10 companies.
The Market continued to implement several media and awareness programmes in the Sultanate and abroad. The MSM in cooperation with the Ministry of Education organized workshops for applied mathematics teachers all over the Sultanate.
On training, Muscat Securities Market has signed a cooperation agreement with Bombay Stock Exchange Training Institute to deliver training programmes in the securities and capital markets fields in the Sultanate.
Regarding information dissemination, Muscat Securities Market has signed an agreement with an international company to develop and update MSM website in form and content in order to keep pace with the international technical developments in the field of information.
MSM has managed, through newly introduced program in its website, to provide software for the financial performance of the listed companies. It is an advanced electronic
programme on basic and financial analysis of joint stock companies` statement.
Secured Financing Account Directives, with serious restrictions, have been issued last year allowing margin trading operations at our stock exchange.
FUTURE OUTLOOK
• Activating the Primary Market for new issues.• Diversification of our investment tools.
The MSM is now in the process of listing Exchange Traded Funds (ETFs) and Islamic instruments.
• Improving our technological systems to cope the development in the trading, clearance and settlement operations.
• Transformation of family enterprises into public joint stock companies.
• Increasing investment funds which are specialized in dealing on securities.
• Attracting foreign investments.• Introducing market makers.
For achieving these goals the MSM is dedicating more effort to improve its legal environment working mechanisms, disclosure, transparency, listing, and keeping up to date with the latest international developments.
Muscat Securities Market has, during the year 2011, implemented a number of projects in various aspects related to the development of the market.
MUSCAT SECURITIES MARKET
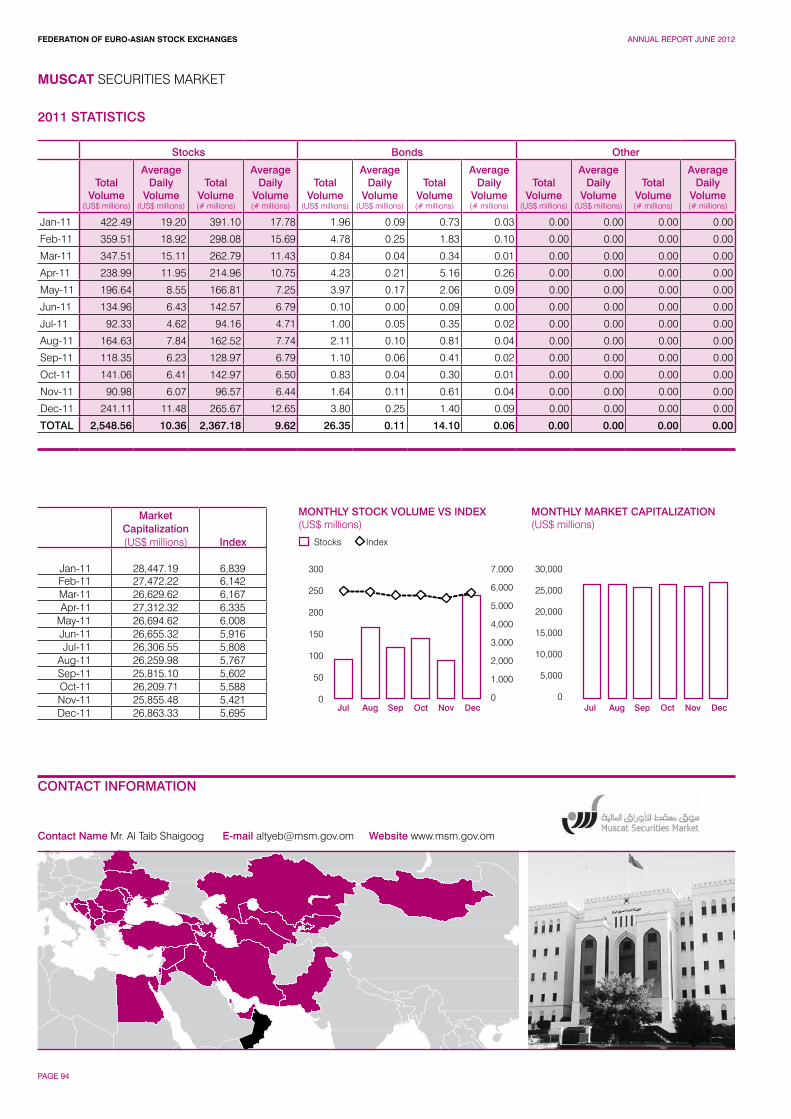
FEDERATION OF EURO-ASIAN STOCK EXCHANGES ANNUAL REPORT JUNE 2012
PAGE 94
Contact Name Mr. Al Taib Shaigoog E-mail [email protected] Website www.msm.gov.om
MUSCAT SECURITIES MARKET
CONTACT INFORMATION
MONTHLY MARKET CAPITALIZATION(US$ millions)
300
250
200
150
100
50
0
7,000
6,000
5,000
4,000
3,000
2,000
1,000
0
30,000
25,000
20,000
15,000
10,000
5,000
0
Stocks
MONTHLY STOCK VOLUME VS INDEX(US$ millions)
Index
Jul JulAug AugSep SepOct OctNov NovDec Dec
2011 STATISTICS
Stocks Bonds Other
Total Volume
(US$ millions)
Average Daily
Volume(US$ millions)
Total Volume(# millions)
Average Daily
Volume(# millions)
Total Volume
(US$ millions)
Average Daily
Volume(US$ millions)
Total Volume(# millions)
Average Daily
Volume(# millions)
Total Volume
(US$ millions)
Average Daily
Volume(US$ millions)
Total Volume(# millions)
Average Daily
Volume(# millions)
Jan-11 422.49 19.20 391.10 17.78 1.96 0.09 0.73 0.03 0.00 0.00 0.00 0.00
Feb-11 359.51 18.92 298.08 15.69 4.78 0.25 1.83 0.10 0.00 0.00 0.00 0.00
Mar-11 347.51 15.11 262.79 11.43 0.84 0.04 0.34 0.01 0.00 0.00 0.00 0.00
Apr-11 238.99 11.95 214.96 10.75 4.23 0.21 5.16 0.26 0.00 0.00 0.00 0.00
May-11 196.64 8.55 166.81 7.25 3.97 0.17 2.06 0.09 0.00 0.00 0.00 0.00
Jun-11 134.96 6.43 142.57 6.79 0.10 0.00 0.09 0.00 0.00 0.00 0.00 0.00
Jul-11 92.33 4.62 94.16 4.71 1.00 0.05 0.35 0.02 0.00 0.00 0.00 0.00
Aug-11 164.63 7.84 162.52 7.74 2.11 0.10 0.81 0.04 0.00 0.00 0.00 0.00
Sep-11 118.35 6.23 128.97 6.79 1.10 0.06 0.41 0.02 0.00 0.00 0.00 0.00
Oct-11 141.06 6.41 142.97 6.50 0.83 0.04 0.30 0.01 0.00 0.00 0.00 0.00
Nov-11 90.98 6.07 96.57 6.44 1.64 0.11 0.61 0.04 0.00 0.00 0.00 0.00
Dec-11 241.11 11.48 265.67 12.65 3.80 0.25 1.40 0.09 0.00 0.00 0.00 0.00
TOTAL 2,548.56 10.36 2,367.18 9.62 26.35 0.11 14.10 0.06 0.00 0.00 0.00 0.00
MarketCapitalization(US$ millions) Index
Jan-11 28,447.19 6,839Feb-11 27,472.22 6,142Mar-11 26,629.62 6,167Apr-11 27,312.32 6,335
May-11 26,694.62 6,008Jun-11 26,655.32 5,916Jul-11 26,306.55 5,808
Aug-11 26,259.98 5,767Sep-11 25,815.10 5,602Oct-11 26,209.71 5,588Nov-11 25,855.48 5,421Dec-11 26,863.33 5,695
FEDERATION OF EURO-ASIAN STOCK EXCHANGES ANNUAL REPORT JUNE 2012
PAGE 95
The Omani national economy continued its good performance in the year 2011 in spite of the negative developments of the global economy as a result of lowering the credit rating of the United States and the sovereign debt crisis, which hit some European economies and had spillover effects on a number of world economies. The strong performance of the Omani economy is attributed to the realistic and flexible economic policies adopted by the Sultanate as well as the increase in the rates of the oil production, the remarkable improvement in oil prices and the expansionary fiscal and monetary policies adopted by the Government to enable the economy to achieve stability and growth.
Leading amongst the indicators of the stability and growth of the Omani economy during 2011 were the overall positive results, which include a significant growth rate of 7% exceeding that of 2010 which amounted to 6%. Moreover, the balance of trade of the Sultanate achieved remarkable growth of 34% in 2011 compared to 32% in 2010. However, despite the increased public expenditure during 2011, inflation rate remained at the level of 3.6%, which is within the targeted limit of 4%.
Regarding the expectations of the Omani economy for 2012, it should be noted that in light of the wise economic and fiscal policies that support the growth and stability of the national economy, the Sultanate of Oman has increased the general expenditure approved in the budget to about RO 10 billion, with an increase of RO 800 million or 9% over the revised expenditure of the previous year 2011. Current expenditure is estimated at RO 6.4 billion, which constitutes 64% of the total general expenditure around 2.7 billion of which are investment spending, representing 27% of the total general expenditure.
The general revenues of the State for the year 2012 were estimated by about RO 8.8 billion against RO 7.3 billion in the budget of the fiscal year 2011, with an increase of RO 1.5 billion, i.e. 21 per cent compared to 2011. Oil and gas revenues constitute 81 per cent of the total revenues, whereas the current and capital revenues constitute 19 per cent thereof.The oil revenues were calculated on the basis of average price US$ 75 per barrel and average daily production of 915 thousand barrel per day.
As regards to the budget deficit, it is estimated to amount to RO 1.2 billion, i.e. 5 per cent of the Gross Domestic Production, which is a safe percentage. This deficit will be covered through the issuance of development bonds in the domestic market amounting to RO 200 million. It will also be covered from the real revenues of oil prices because the current prices are higher than those upon which basis the state revenues are calculated. In case this is not realized, the deficit shall be covered from the state general reserve.
MUSCAT SECURITIES MARKET
Key Information ContactsMinistry of National Economy www.moneoman.gov.omCapital Market Authority www.cma-oman.gov.omOman Chamber of Commerce and Industry www.cbo-oman.orgFinancial Corporation www.fincorp.orgNational Bank of Oman www.nbo.co.om
CAPITAL MARKET DEVELOPMENT AND ECONOMIC OUTLOOK
FEDERATION OF EURO-ASIAN STOCK EXCHANGES ANNUAL REPORT JUNE 2012
PAGE 96
Konstantin SaroyanChief Executive Officer
One of the major achievements of 2011 was operation of securities initial placement auction module and first ever offering of corporate bonds at the Exchange. This was an important milestone towards bringing more securities offerings and new attractive financial instruments to the Exchange – an objective, we continuously and consistently strive to achieve.
Though overall corporate securities trading remained quite low in 2011, stock market saw a 57% increase of value traded, which successfully continued previous year’s positive growth trend. At the year-end exchange market capitalization stood at around US$ 140 mln. Government bonds trading showed a slight decrease of 4% in value traded, amounting to US$ 13.9 mln, and the repurchase agreements (repo) market slowed down to US$ 5.3 mln. Currency trading slightly increased and stood at nearly US$ 0.76 bln in 2011. As in previous year, credit resources market, launched in April of 2011, was the best performing this year with value traded of US$ 4.7 bln, a 4.5 times increase over the previous year.
NASDAQ OMX Armenia was also active in organizing various events, focusing on major stakeholders – investment companies and
banks, listed companies, journalists – and aimed at sharing international expertise and implementing state-of-the-art standards of respective activities in Armenia.
In October, 2011 NASDAQ OMX Armenia and Central Depository of Armenia hosted an important international joint conference of 2 regional associations – International Association of Stock Exchanges of CIS countries (IAEx of CIS) and Association of European Central Securities Depositories (AECSD). Overall 116 representatives of 77 companies from 14 countries of CIS, Europe and Asia gathered in Yerevan to discuss issues of regional cooperation and interoperability of the Exchange and Depository business.
NASDAQ OMX Armenia also participated and spoke in one of the world’s leading economic forums, held in Russia, Saint-Petersburg International Economic Forum, presenting Armenian capital market vast experience of preparing markets to integration.General public and especially younger audiences were also in focus, with initiatives promoting awareness about capital markets and their importance in building a strong national economy.
Being the full owner of the Central Depository of Armenia, NASDAQ OMX Armenia kept concentrating on improving the depository and clearing services – primarily through continued automation and optimization of business processes, as well as introduction of new services. IN 2011 the Depository started servicing foreign nominees and signed a cooperation agreement with Russian counterpart. The expected launch of new second pillar pension system will boost the activity in the capital market, so the Depository worked closely with the Government of Armenia and the Central Bank of Armenia to create necessary preconditions for introducing the reform and servicing pension accounts and custodian information system.
NASDAQ OMX Armenia will continue to be proactive in bringing innovative technological solutions to the Exchange and the Depository and enhancing its relations with the capital market stakeholders, thus realizing its primary objective – to maintain a fair and effective marketplace where good companies can raise capital and where investors can make well-informed decisions while being properly protected.
HISTORY AND DEVELOPMENT
NASDAQ OMX Armenia (formerly Armenian Stock Exchange, Armex, renamed on 27 January 2009) is the only stock exchange currently operating in Armenia. Armex was the successor of the Association of Securities Market Participants, which was established in Armenia in 1997, and was initially registered the Securities Commission of the RA on 13 February 2001, as a self-regulatory organization. In November 2007, according to the newly adopted “Law on Securities Market”, Armex was reorganized into an open joint stock company.
Until 1 January 2006, Securities Commission of RA was the competent state authority to regulate the activities of capital market including the stock exchange in Armenia. However, with the enactment of a new law introducing unified regulatory authority for the financial market, the regulatory and supervisory powers of the Commission were transferred to the CBA.
Since 15 November 2005, foreign currency trading was introduced on Armex, which proved to be in demand: volumes of FX trading to date greatly exceed those of other instruments. On
14 December 2005, the first publicly traded corporate bonds were listed at Armex, and as of December 2008, 13 bond issues were traded on the stock exchange – most of them having market makers. In early 2008 government bonds trading was launched, as well as status of market-maker for government bonds was introduced. By the end of 2008, Armex introduced new market for REPO (repurchase agreements), as well as a mechanism for manual trades.
In April, 2010 NASDAQ OMX introduced new market for credit resources trading, providing exchange platform for interbank credits, a large segment of the Armenian financial market, thus contributing to the transparent and fair pricing of credit resources, as well as equities, debt instruments, and currency.
In 2011 NASDAQ OMX Armenia had the first ever securities offering via the stock exchange IPO system, which was an importaint step towards servicing further IPOs at the Exchange.NASDAQ OMX Armenia is currently part of the NASDAQ OMX Group. In November 2007 members of CDA and Armex transferred their shares to the CBA, and OMX Group acquired
100% thereof. After in late February 2008, NASDAQ completed its combination with OMX, NASDAQ OMX Armenia became an entity fully owned by NASDAQ OMX. On 5 June 2009, NASDAQ OMX Armenia became the owner of the 100% of the shares of the Central Depository of Armenia.
FUTURE OUTLOOK
In 2012, NASDAQ OMX Armenia plans to: • continue improving the technical
infrastructure of the stock exchange and the central depository;
• continue expanding the range of services provided to listed companies and trading members;
• carry on with efforts to promote initial public offerings of equities in the Armenian market;
• launch T+3 settlement mechanism, which will enable exchange trading without pre-deposition of securities and cash;
• establish a Guarantee Fund to increase investor protection;
• continue efforts towards increasing public awareness of the Armenian securities market.
One of the major achievements of 2011 was operation of securities initial placement auction module and first ever offering of corporate bonds at the Exchange.
NASDAQ OMX ARMENIA
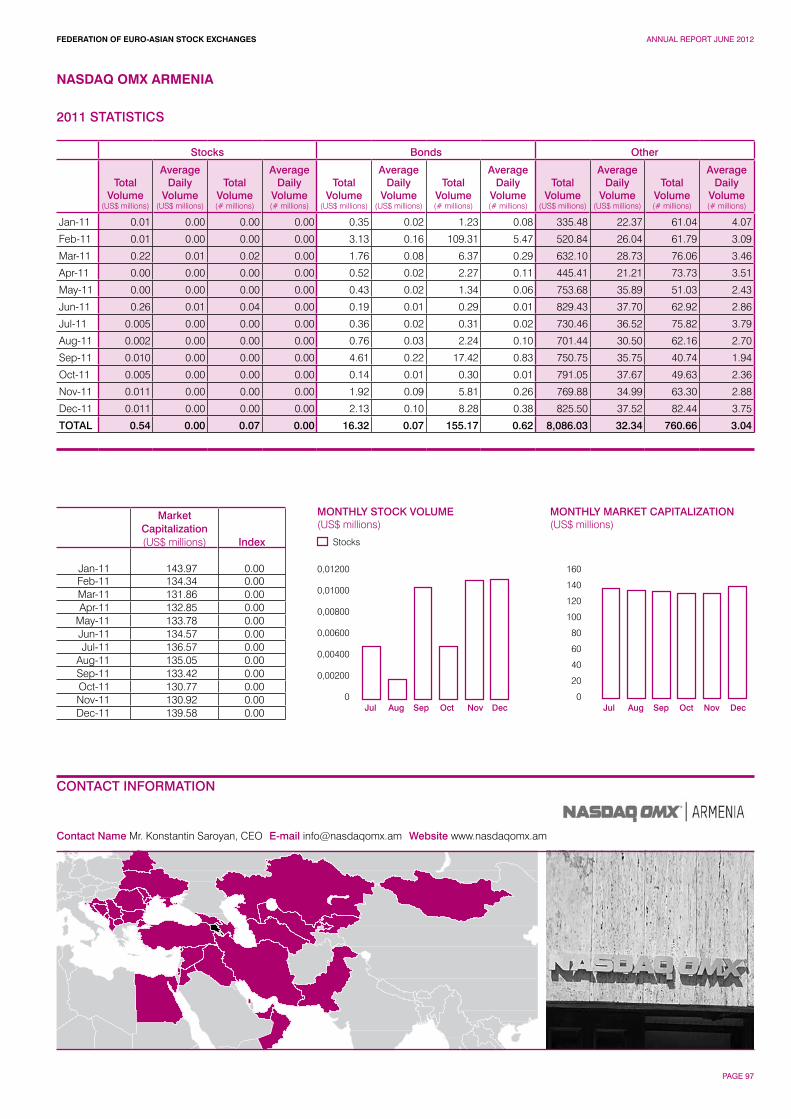
FEDERATION OF EURO-ASIAN STOCK EXCHANGES ANNUAL REPORT JUNE 2012
PAGE 97
Contact Name Mr. Konstantin Saroyan, CEO E-mail [email protected] Website www.nasdaqomx.am
NASDAQ OMX ARMENIA
CONTACT INFORMATION
MONTHLY MARKET CAPITALIZATION(US$ millions)
0,01200
0,01000
0,00800
0,00600
0,00400
0,00200
0
160
140
120
100
80
60
40
20
0
Stocks
MONTHLY STOCK VOLUME (US$ millions)
Jul JulAug AugSep SepOct OctNov NovDec Dec
2011 STATISTICS
Stocks Bonds Other
Total Volume
(US$ millions)
Average Daily
Volume(US$ millions)
Total Volume(# millions)
Average Daily
Volume(# millions)
Total Volume
(US$ millions)
Average Daily
Volume(US$ millions)
Total Volume(# millions)
Average Daily
Volume(# millions)
Total Volume
(US$ millions)
Average Daily
Volume(US$ millions)
Total Volume(# millions)
Average Daily
Volume(# millions)
Jan-11 0.01 0.00 0.00 0.00 0.35 0.02 1.23 0.08 335.48 22.37 61.04 4.07
Feb-11 0.01 0.00 0.00 0.00 3.13 0.16 109.31 5.47 520.84 26.04 61.79 3.09
Mar-11 0.22 0.01 0.02 0.00 1.76 0.08 6.37 0.29 632.10 28.73 76.06 3.46
Apr-11 0.00 0.00 0.00 0.00 0.52 0.02 2.27 0.11 445.41 21.21 73.73 3.51
May-11 0.00 0.00 0.00 0.00 0.43 0.02 1.34 0.06 753.68 35.89 51.03 2.43
Jun-11 0.26 0.01 0.04 0.00 0.19 0.01 0.29 0.01 829.43 37.70 62.92 2.86
Jul-11 0.005 0.00 0.00 0.00 0.36 0.02 0.31 0.02 730.46 36.52 75.82 3.79
Aug-11 0.002 0.00 0.00 0.00 0.76 0.03 2.24 0.10 701.44 30.50 62.16 2.70
Sep-11 0.010 0.00 0.00 0.00 4.61 0.22 17.42 0.83 750.75 35.75 40.74 1.94
Oct-11 0.005 0.00 0.00 0.00 0.14 0.01 0.30 0.01 791.05 37.67 49.63 2.36
Nov-11 0.011 0.00 0.00 0.00 1.92 0.09 5.81 0.26 769.88 34.99 63.30 2.88
Dec-11 0.011 0.00 0.00 0.00 2.13 0.10 8.28 0.38 825.50 37.52 82.44 3.75
TOTAL 0.54 0.00 0.07 0.00 16.32 0.07 155.17 0.62 8,086.03 32.34 760.66 3.04
MarketCapitalization(US$ millions) Index
Jan-11 143.97 0.00Feb-11 134.34 0.00Mar-11 131.86 0.00Apr-11 132.85 0.00
May-11 133.78 0.00Jun-11 134.57 0.00Jul-11 136.57 0.00
Aug-11 135.05 0.00Sep-11 133.42 0.00Oct-11 130.77 0.00Nov-11 130.92 0.00Dec-11 139.58 0.00
FEDERATION OF EURO-ASIAN STOCK EXCHANGES ANNUAL REPORT JUNE 2012
PAGE 98
While Armenia’s economy showed some signs of improvement as compared to 2010 the outgoing year has also been marked by inflation pressures and unemployment. At 2011 the national budget deficit was Dram14.8bn (US$40m) in the first eight months of the year, significantly smaller than the Dram26.5bn deficit in the year-before period. Armenian economy this year was again assessed as less competitive than its neighbors’.
Real GDP grew by 1.2% year on year in the first quarter and 3.9% in the second quarter. During the first quarter services and industry remained the principle drivers of increase. One of the economic sectors that showed improvement is agriculture, which was declared as one of the priorities at the end of last year. Showing a significant rise in 2011, agriculture plays an important role in the Armenian economy. Construction fell by 3.6% year on year, which can be half accounted for by base effects. Industrial production expanded by 24.7% year on year in June and by 20.2% in the second quarter. This was driven by developments in mining and metallurgy, which benefited from higher world prices for base metals in the first half. In June the mining subcomponent rose by 12.9% year on year.
Export increase of 31.1% year on year outpaced imports increase, of 11%. However, at US$603.3m, exports were dwarfed by imports, which reached US$1.89bn. Sharp increase in exports was driven by large year-on-year increases in exports of minerals, metals and food-processing products. Exports of foodstuffs
and agricultural products could rise further in the coming years with the expected opening of the first tax-free zone in Armenia, on the premises of the Zvartnots International Airport in the capital, Yerevan
The government’s fiscal position has improved since 2010, owing to improvements to tax collection and only a modest increase in government spending. The Ministry of Finance reported a national budget deficit of Dram6.56bn in the first half of 2011, down from Dram16.9bn in the year-before period.Budget revenue increased by 9% year on year robustly in the first half. The robust increase was driven by taxes and other national duties, which generated nearly 80% of total revenue.
Capital Market DevelopmentsThe year of 2011 was quite active for NASDAQ OMX Armenia and Central Depository of Armenia in terms of activation of international cooperation and establishing relations with foreign counterparts. The Companies succeeded to participate in a number of important international specialized events, like Saint Petersburg International Economic Forum, presenting Armenian capital market experience of preparing markets to integration, and Central Securities Deposittories World Forum 11 (CSD 11) as well as to host International Joint Conference of CIS Stock Exchanges and Association of Eurasia Central Securities Depositories in Yerevan.
In 2011 NASDAQ OMX Armenia launched the range of new services, including opening of pre-trading call auction in corporate securities market, organization of first ever corporate bonds IPO at the Exchange via special securities placement module of the trading system. The relevant Exchange and Depository rules, software systems were amended to ensure provision of this service.
In 2011 stock market preserved positive growth trend with value traded reaching up to AMD 200.3 mln, about 57% over the same of the previous year and showed a 2,3% grow in market capitalization. On corporate bonds market 91 trades for total value of AMD 708.98 mln were concluded, which is 75% lower than the same of the previous year. REPO trading also saw 45.6% reduction of value traded to AMD 2.05 bln. 58 trades in REPO agreements were concluded this year. Government bonds market was rather active in 2010: 39.2% fell to the share of trading in short-term government bonds, 76.8% - in long-term government bonds and 28.9% - in mid-term government bonds. Value traded in foreign currency market was AMD 283.5 bln (US$ 760 mln), which is 0.6% greater than the same of the previous year. Credit resources market saw value traded of AMD 2,734 bln in 2011. This year average monthly value traded 3.5 times exceeded the same of the previous year.
NASDAQ OMX ARMENIA
Key Information ContactsNASDAQ OMX www.nasdaqomx.comThe Central Bank of Armenia www.cba.am The Central Depository of Armenia www.nasdaqomx.am
CAPITAL MARKET DEVELOPMENT AND ECONOMIC OUTLOOK
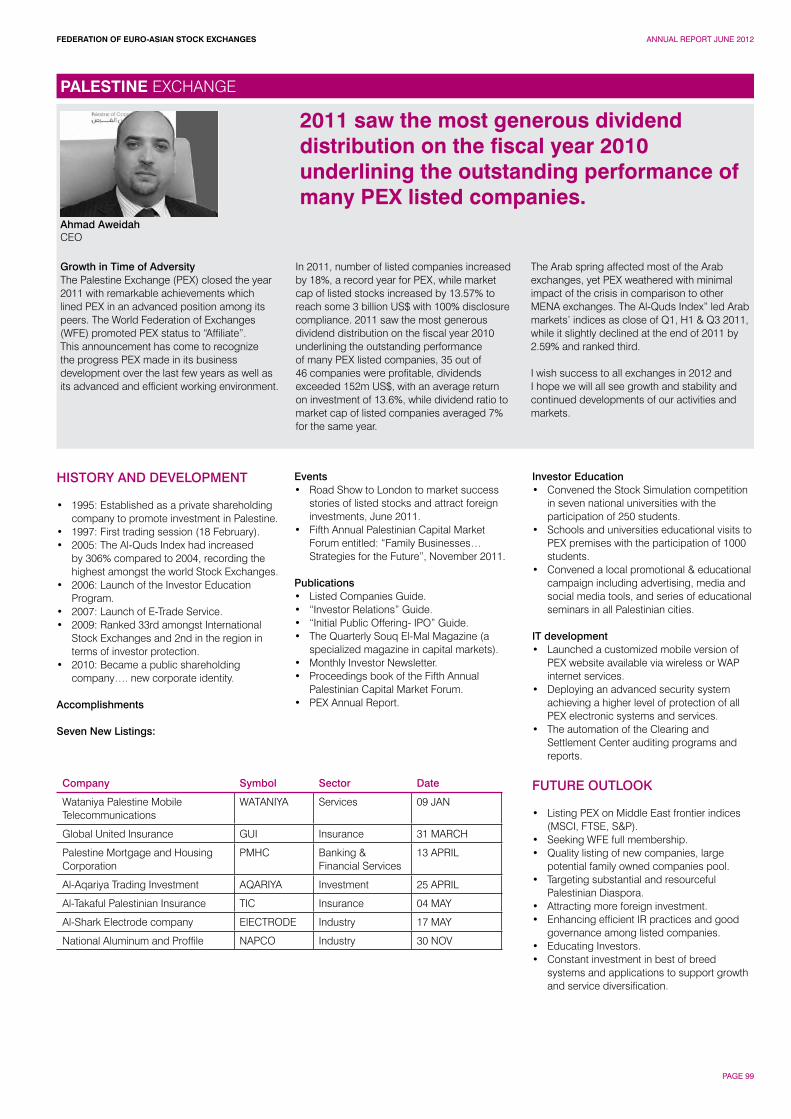
FEDERATION OF EURO-ASIAN STOCK EXCHANGES ANNUAL REPORT JUNE 2012
PAGE 99
Ahmad AweidahCEO
Growth in Time of AdversityThe Palestine Exchange (PEX) closed the year 2011 with remarkable achievements which lined PEX in an advanced position among its peers. The World Federation of Exchanges (WFE) promoted PEX status to “Affiliate”. This announcement has come to recognize the progress PEX made in its business development over the last few years as well as its advanced and efficient working environment.
In 2011, number of listed companies increased by 18%, a record year for PEX, while market cap of listed stocks increased by 13.57% to reach some 3 billion US$ with 100% disclosure compliance. 2011 saw the most generous dividend distribution on the fiscal year 2010 underlining the outstanding performance of many PEX listed companies, 35 out of 46 companies were profitable, dividends exceeded 152m US$, with an average return on investment of 13.6%, while dividend ratio to market cap of listed companies averaged 7% for the same year.
The Arab spring affected most of the Arab exchanges, yet PEX weathered with minimal impact of the crisis in comparison to other MENA exchanges. The Al-Quds Index” led Arab markets’ indices as close of Q1, H1 & Q3 2011, while it slightly declined at the end of 2011 by 2.59% and ranked third.
I wish success to all exchanges in 2012 and I hope we will all see growth and stability and continued developments of our activities and markets.
HISTORY AND DEVELOPMENT
• 1995: Established as a private shareholding company to promote investment in Palestine.
• 1997: First trading session (18 February). • 2005: The Al-Quds Index had increased
by 306% compared to 2004, recording the highest amongst the world Stock Exchanges.
• 2006: Launch of the Investor Education Program.
• 2007: Launch of E-Trade Service.• 2009: Ranked 33rd amongst International
Stock Exchanges and 2nd in the region in terms of investor protection.
• 2010: Became a public shareholding company…. new corporate identity.
Accomplishments
Seven New Listings:
Events• Road Show to London to market success
stories of listed stocks and attract foreign investments, June 2011.
• Fifth Annual Palestinian Capital Market Forum entitled: “Family Businesses… Strategies for the Future”, November 2011.
Publications• Listed Companies Guide.• “Investor Relations” Guide.• “Initial Public Offering- IPO” Guide.• The Quarterly Souq El-Mal Magazine (a
specialized magazine in capital markets).• Monthly Investor Newsletter.• Proceedings book of the Fifth Annual
Palestinian Capital Market Forum.• PEX Annual Report.
Investor Education• Convened the Stock Simulation competition
in seven national universities with the participation of 250 students.
• Schools and universities educational visits to PEX premises with the participation of 1000 students.
• Convened a local promotional & educational campaign including advertising, media and social media tools, and series of educational seminars in all Palestinian cities.
IT development• Launched a customized mobile version of
PEX website available via wireless or WAP internet services.
• Deploying an advanced security system achieving a higher level of protection of all PEX electronic systems and services.
• The automation of the Clearing and Settlement Center auditing programs and reports.
FUTURE OUTLOOK
• Listing PEX on Middle East frontier indices (MSCI, FTSE, S&P).
• Seeking WFE full membership.• Quality listing of new companies, large
potential family owned companies pool.• Targeting substantial and resourceful
Palestinian Diaspora.• Attracting more foreign investment.• Enhancing efficient IR practices and good
governance among listed companies. • Educating Investors. • Constant investment in best of breed
systems and applications to support growth and service diversification.
2011 saw the most generous dividend distribution on the fiscal year 2010 underlining the outstanding performance of many PEX listed companies.
PALESTINE EXCHANGE
Company Symbol Sector Date
Wataniya Palestine Mobile Telecommunications
WATANIYA Services 09 JAN
Global United Insurance GUI Insurance 31 MARCH
Palestine Mortgage and Housing Corporation
PMHC Banking & Financial Services
13 APRIL
Al-Aqariya Trading Investment AQARIYA Investment 25 APRIL
Al-Takaful Palestinian Insurance TIC Insurance 04 MAY
Al-Shark Electrode company ElECTRODE Industry 17 MAY
National Aluminum and Proffile NAPCO Industry 30 NOV
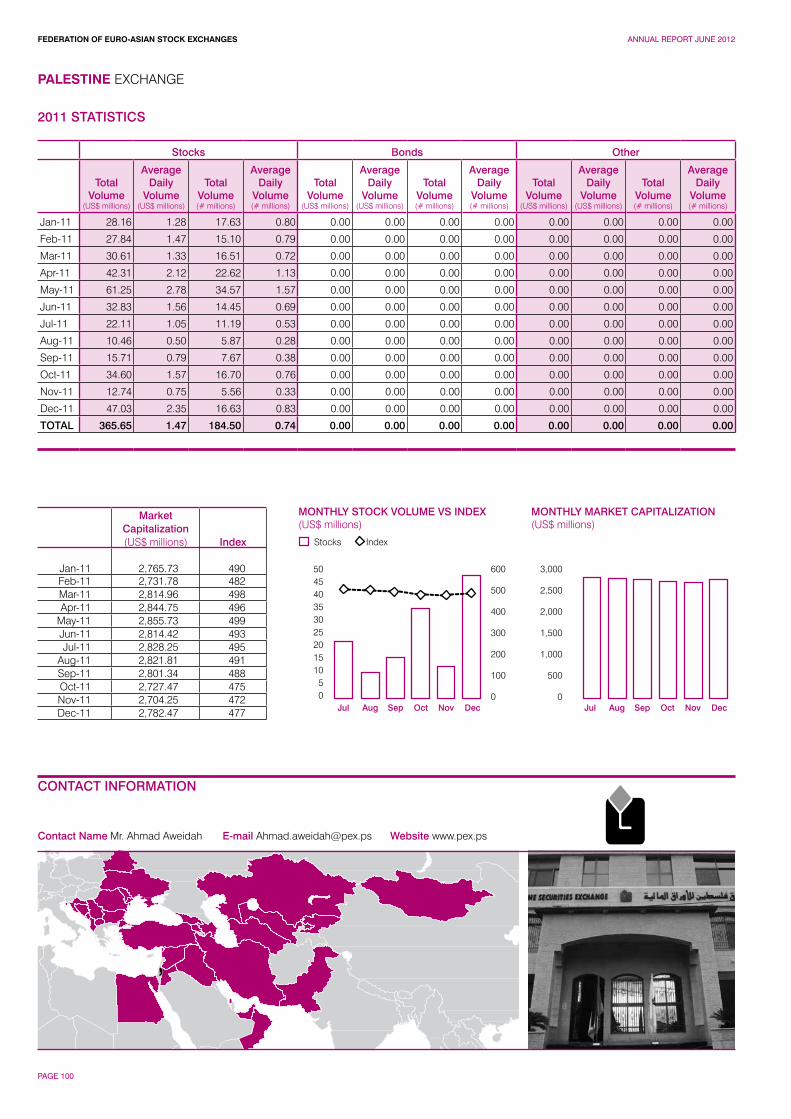
FEDERATION OF EURO-ASIAN STOCK EXCHANGES ANNUAL REPORT JUNE 2012
PAGE 100
PALESTINE EXCHANGE
CONTACT INFORMATION
Contact Name Mr. Ahmad Aweidah E-mail [email protected] Website www.pex.ps
MONTHLY MARKET CAPITALIZATION(US$ millions)
50454035302520151050
600
500
400
300
200
100
0
3,000
2,500
2,000
1,500
1,000
500
0
Stocks
MONTHLY STOCK VOLUME VS INDEX(US$ millions)
Index
Jul JulAug AugSep SepOct OctNov NovDec Dec
2011 STATISTICS
Stocks Bonds Other
Total Volume
(US$ millions)
Average Daily
Volume(US$ millions)
Total Volume(# millions)
Average Daily
Volume(# millions)
Total Volume
(US$ millions)
Average Daily
Volume(US$ millions)
Total Volume(# millions)
Average Daily
Volume(# millions)
Total Volume
(US$ millions)
Average Daily
Volume(US$ millions)
Total Volume(# millions)
Average Daily
Volume(# millions)
Jan-11 28.16 1.28 17.63 0.80 0.00 0.00 0.00 0.00 0.00 0.00 0.00 0.00
Feb-11 27.84 1.47 15.10 0.79 0.00 0.00 0.00 0.00 0.00 0.00 0.00 0.00
Mar-11 30.61 1.33 16.51 0.72 0.00 0.00 0.00 0.00 0.00 0.00 0.00 0.00
Apr-11 42.31 2.12 22.62 1.13 0.00 0.00 0.00 0.00 0.00 0.00 0.00 0.00
May-11 61.25 2.78 34.57 1.57 0.00 0.00 0.00 0.00 0.00 0.00 0.00 0.00
Jun-11 32.83 1.56 14.45 0.69 0.00 0.00 0.00 0.00 0.00 0.00 0.00 0.00
Jul-11 22.11 1.05 11.19 0.53 0.00 0.00 0.00 0.00 0.00 0.00 0.00 0.00
Aug-11 10.46 0.50 5.87 0.28 0.00 0.00 0.00 0.00 0.00 0.00 0.00 0.00
Sep-11 15.71 0.79 7.67 0.38 0.00 0.00 0.00 0.00 0.00 0.00 0.00 0.00
Oct-11 34.60 1.57 16.70 0.76 0.00 0.00 0.00 0.00 0.00 0.00 0.00 0.00
Nov-11 12.74 0.75 5.56 0.33 0.00 0.00 0.00 0.00 0.00 0.00 0.00 0.00
Dec-11 47.03 2.35 16.63 0.83 0.00 0.00 0.00 0.00 0.00 0.00 0.00 0.00
TOTAL 365.65 1.47 184.50 0.74 0.00 0.00 0.00 0.00 0.00 0.00 0.00 0.00
MarketCapitalization(US$ millions) Index
Jan-11 2,765.73 490Feb-11 2,731.78 482Mar-11 2,814.96 498Apr-11 2,844.75 496
May-11 2,855.73 499Jun-11 2,814.42 493Jul-11 2,828.25 495
Aug-11 2,821.81 491Sep-11 2,801.34 488Oct-11 2,727.47 475Nov-11 2,704.25 472Dec-11 2,782.47 477
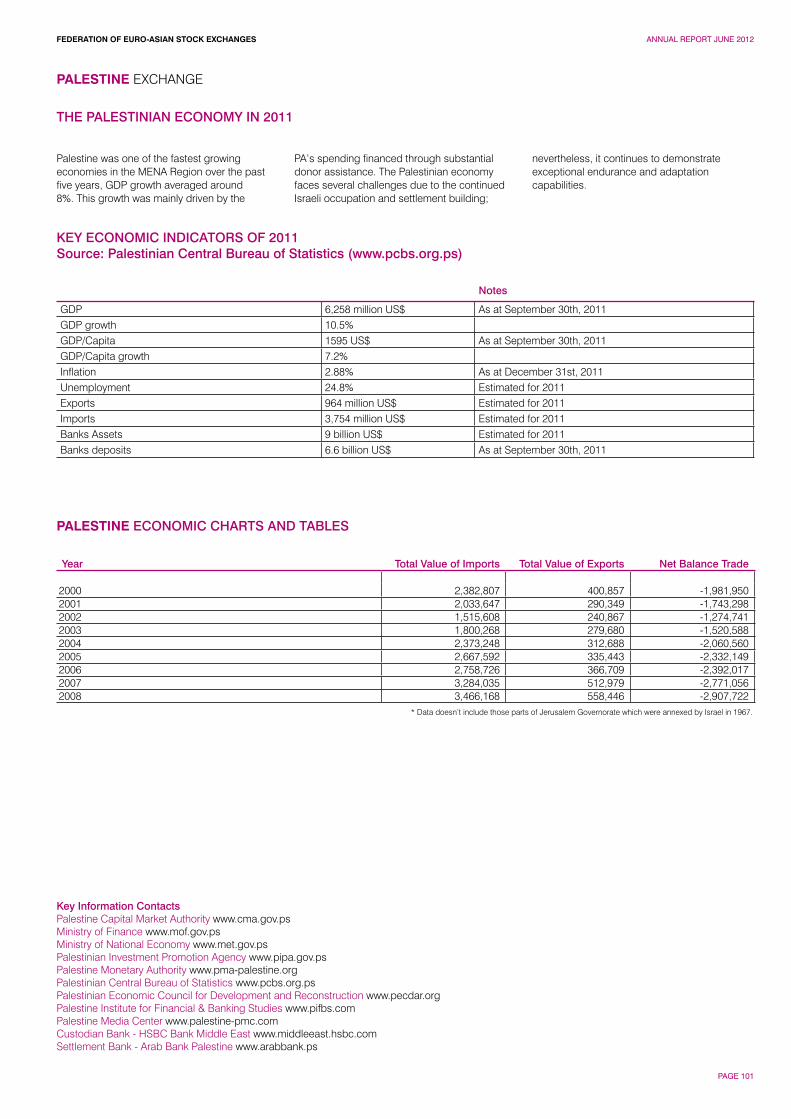
FEDERATION OF EURO-ASIAN STOCK EXCHANGES ANNUAL REPORT JUNE 2012
PAGE 101
Palestine was one of the fastest growing economies in the MENA Region over the past five years, GDP growth averaged around 8%. This growth was mainly driven by the
PA’s spending financed through substantial donor assistance. The Palestinian economy faces several challenges due to the continued Israeli occupation and settlement building;
nevertheless, it continues to demonstrate exceptional endurance and adaptation capabilities.
PALESTINE EXCHANGE
Key Information ContactsPalestine Capital Market Authority www.cma.gov.psMinistry of Finance www.mof.gov.psMinistry of National Economy www.met.gov.psPalestinian Investment Promotion Agency www.pipa.gov.psPalestine Monetary Authority www.pma-palestine.orgPalestinian Central Bureau of Statistics www.pcbs.org.ps Palestinian Economic Council for Development and Reconstruction www.pecdar.org Palestine Institute for Financial & Banking Studies www.pifbs.comPalestine Media Center www.palestine-pmc.comCustodian Bank - HSBC Bank Middle East www.middleeast.hsbc.comSettlement Bank - Arab Bank Palestine www.arabbank.ps
KEY ECONOMIC INDICATORS OF 2011Source: Palestinian Central Bureau of Statistics (www.pcbs.org.ps)
Notes
GDP 6,258 million US$ As at September 30th, 2011GDP growth 10.5% GDP/Capita 1595 US$ As at September 30th, 2011GDP/Capita growth 7.2%Inflation 2.88% As at December 31st, 2011Unemployment 24.8% Estimated for 2011Exports 964 million US$ Estimated for 2011Imports 3,754 million US$ Estimated for 2011Banks Assets 9 billion US$ Estimated for 2011Banks deposits 6.6 billion US$ As at September 30th, 2011
THE PALESTINIAN ECONOMY IN 2011
PALESTINE ECONOMIC CHARTS AND TABLES
Year Total Value of Imports Total Value of Exports Net Balance Trade
2000 2,382,807 400,857 -1,981,9502001 2,033,647 290,349 -1,743,2982002 1,515,608 240,867 -1,274,7412003 1,800,268 279,680 -1,520,5882004 2,373,248 312,688 -2,060,5602005 2,667,592 335,443 -2,332,1492006 2,758,726 366,709 -2,392,0172007 3,284,035 512,979 -2,771,0562008 3,466,168 558,446 -2,907,722
* Data doesn’t include those parts of Jerusalem Governorate which were annexed by Israel in 1967.
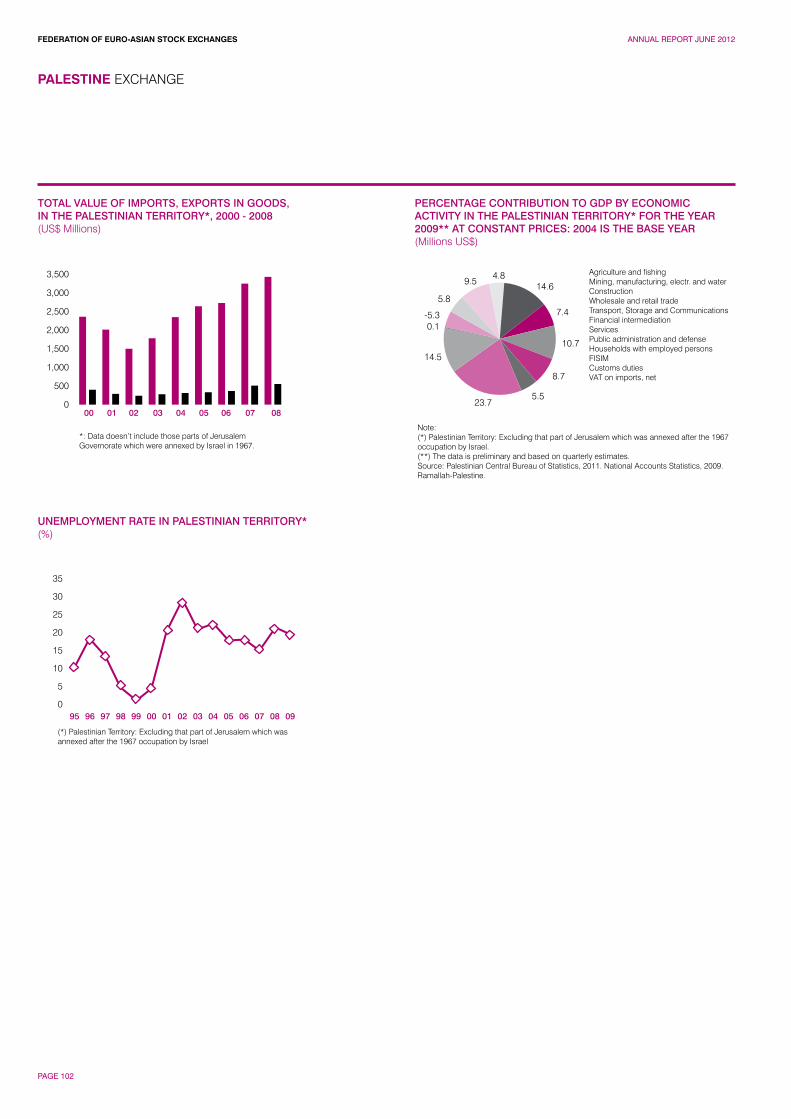
FEDERATION OF EURO-ASIAN STOCK EXCHANGES ANNUAL REPORT JUNE 2012
PAGE 102
PALESTINE EXCHANGE
TOTAL VALUE OF IMPORTS, EXPORTS IN GOODS, IN THE PALESTINIAN TERRITORY*, 2000 - 2008(US$ Millions)
PERCENTAGE CONTRIBUTION TO GDP BY ECONOMIC ACTIVITY IN THE PALESTINIAN TERRITORY* FOR THE YEAR 2009** AT CONSTANT PRICES: 2004 IS THE BASE YEAR(Millions US$)
Agriculture and fishingMining, manufacturing, electr. and waterConstructionWholesale and retail tradeTransport, Storage and CommunicationsFinancial intermediationServicesPublic administration and defenseHouseholds with employed personsFISIMCustoms dutiesVAT on imports, net
3,500
3,000
2,500
2,000
1,500
1,000
500
000 01 02 03 04 05 06 07 08
*: Data doesn’t include those parts of JerusalemGovernorate which were annexed by Israel in 1967.
(*) Palestinian Territory: Excluding that part of Jerusalem which was annexed after the 1967 occupation by Israel
Note:(*) Palestinian Territory: Excluding that part of Jerusalem which was annexed after the 1967 occupation by Israel.(**) The data is preliminary and based on quarterly estimates.Source: Palestinian Central Bureau of Statistics, 2011. National Accounts Statistics, 2009. Ramallah-Palestine.
14.6
7.4
10.7
8.7
5.523.7
14.5
0.1-5.3
5.8
9.54.8
35
30
25
20
15
10
5
0
UNEMPLOYMENT RATE IN PALESTINIAN TERRITORY*(%)
95 96 97 98 99 00 01 02 03 04 05 06 07 08 09
FEDERATION OF EURO-ASIAN STOCK EXCHANGES ANNUAL REPORT JUNE 2012
PAGE 103
Zlatan DedicGeneral Manager
An unfavourable political environment, a low level of Foreign Direct Investments, a non-stimulative business ambient and unsatisfactory commitment to economic reforms - all of these factors did not contribute the development of the capital market in the Federation of Bosnia Hercegovina in 2011. Nevertheless, SASE accomplished some significant improvements: the trading result were significantly better compared to 2010, the BIFX and SASX-30 indices had a positive annual return, and important measures to the development of the market have been undertaken; the Stock Exchange attracted new shareholders and for the first time in three years showed a positive financial result.
The annual turnover was positively influenced by two successful treasury bill auctions through which the Federation collected over 90 million KM through the market. Significant efforts by the staff in 2011 led to the implementation of new measures aimed at development of the market and to shrink the gap vis-a-vis the developed markets. Amongst the most important one was the mass-delisting of low liquid and non-transparent securities from the market, more stringent listing requirements, the possibility to delist securities if the issuer neglects its disclosure requirements, introduction of volatility interruptions and the change of the static price limits.
Besided measures for a more thorough surveillance over the trading process and especially the business operations of the trading members (Red Flags, investors black book, restricted accounts etc.), SASE implemented also the surveillance of the IT-system of the trading members.
The year behind us was a hard but successful year. Before us lies another year filled with challenges to advance the quality of the capital market in the Federation of Bosnia-Hercegovina, to which we look in confidence and optimism.
HISTORY AND DEVELOPMENT
The Sarajevo Stock Exchange (SASE) was founded in September of 2001 by eight brokerage houses and commenced trading on April 12 of 2002. The SASE is a joint-stock company and a central marketplace for securities trading in the Federation of Bosnia and Herzegovina. The SASE currently has 12 members, whose headquarters are spread around the Federation of Bosnia and Herzegovina, the majority being in the capital, Sarajevo. Trading on the SASE is performed electronically through an order driven electronic trading system BTS (Stock Exchange System).
SASX-10 is the main index on the Sarajevo Stock Exchange. It reflect the price movement of the top 10 issuers on the Sarajevo Stock Exchange (excluding investment funds) ranked by market capitalization and frequency of trading. In 2009 was performed a segmentation of Free market on the Primary Free market, the Secondary Free market and the Market for the issuers in the bankruptcy proceedings.
Turnover on SASE has risen substantially, which can be illustrated by the fact that in 2007 it rose up to US$ 961.5 million - more than in 2005 and 2006 combined. There were 4 mutual funds founded in 2007, and more are currently in preparation. In 2009 as a result of global financial crisis sharp decrease in turnover affected SASE where we finished the year with US$ 153,7 million. The effects of financial crisis were even more strongly reflected in 2010, so that annual total turnover on SASE was US$ 74,9 million.
In 2011, the amount of the total turnover was US$ 165,7 million, and regarding to 2010, is increased by 125,50% - if we exclude the primary emissions, then it is an increase of 41,72%; indices BIFX and SASX-30 are in positive zone; it was taken a series of measures to improve the capital market; SASE has received the new shareholders in the process of recapitalization, and after three years in losses, SASE ended 2011 with a profit of US$ 49.038.
FUTURE OUTLOOK
In 2011, for the first time since the beginning of the crisis of 2007, the trend of ever falling yearly turnovers was broken. Even without the turnover from the primary auctions for government treasury bills, the turnover in 2011 was 42% higher than in the previous year. In 2012, we expect to see more government debt securities on the market, including long-term bonds and short term treasury bills. Given the high excess liquidity of the banking market, we do not expect a great deal of secondary trading with these securities, at least not in the first half of the year.
Although announced each year, we have reasons to believe that in 2012 we will see the privatization of some companies where the state has at least a minority stake. The need to finance the budget deficit will make it necessary for the state to sell their stake in some companies, despite the current crisis on the markets and the low interest of investors.
We also see the potential that the state will take a greater role in the development of the financial markets in general, and the capital market in special in 2012. For the first time in ten years, representatives from the government are taking an active role in defining a strategy for the development of this segment of the Bosnian economy.
In 2012, SASE will put emphasis on the education of domestic investors, who still are hesitant to engage in securities trading.
SASE attracted new shareholders and for the first time in three years showed a positive financial result.
SARAJEVO STOCK EXCHANGE
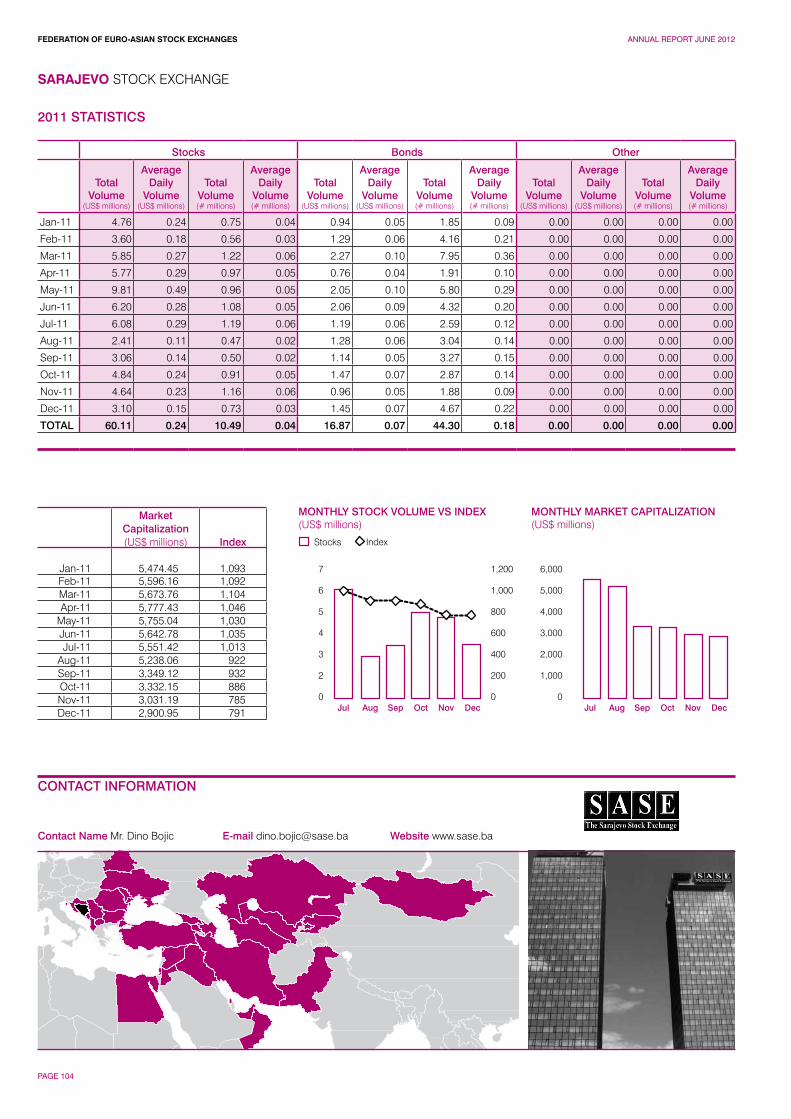
FEDERATION OF EURO-ASIAN STOCK EXCHANGES ANNUAL REPORT JUNE 2012
PAGE 104
Contact Name Mr. Dino Bojic E-mail [email protected] Website www.sase.ba
SARAJEVO STOCK EXCHANGE
CONTACT INFORMATION
MONTHLY MARKET CAPITALIZATION(US$ millions)
7
6
5
4
3
2
0
1,200
1,000
800
600
400
200
0
6,000
5,000
4,000
3,000
2,000
1,000
0
Stocks
MONTHLY STOCK VOLUME VS INDEX(US$ millions)
Index
Jul JulAug AugSep SepOct OctNov NovDec Dec
2011 STATISTICS
Stocks Bonds Other
Total Volume
(US$ millions)
Average Daily
Volume(US$ millions)
Total Volume(# millions)
Average Daily
Volume(# millions)
Total Volume
(US$ millions)
Average Daily
Volume(US$ millions)
Total Volume(# millions)
Average Daily
Volume(# millions)
Total Volume
(US$ millions)
Average Daily
Volume(US$ millions)
Total Volume(# millions)
Average Daily
Volume(# millions)
Jan-11 4.76 0.24 0.75 0.04 0.94 0.05 1.85 0.09 0.00 0.00 0.00 0.00
Feb-11 3.60 0.18 0.56 0.03 1.29 0.06 4.16 0.21 0.00 0.00 0.00 0.00
Mar-11 5.85 0.27 1.22 0.06 2.27 0.10 7.95 0.36 0.00 0.00 0.00 0.00
Apr-11 5.77 0.29 0.97 0.05 0.76 0.04 1.91 0.10 0.00 0.00 0.00 0.00
May-11 9.81 0.49 0.96 0.05 2.05 0.10 5.80 0.29 0.00 0.00 0.00 0.00
Jun-11 6.20 0.28 1.08 0.05 2.06 0.09 4.32 0.20 0.00 0.00 0.00 0.00
Jul-11 6.08 0.29 1.19 0.06 1.19 0.06 2.59 0.12 0.00 0.00 0.00 0.00
Aug-11 2.41 0.11 0.47 0.02 1.28 0.06 3.04 0.14 0.00 0.00 0.00 0.00
Sep-11 3.06 0.14 0.50 0.02 1.14 0.05 3.27 0.15 0.00 0.00 0.00 0.00
Oct-11 4.84 0.24 0.91 0.05 1.47 0.07 2.87 0.14 0.00 0.00 0.00 0.00
Nov-11 4.64 0.23 1.16 0.06 0.96 0.05 1.88 0.09 0.00 0.00 0.00 0.00
Dec-11 3.10 0.15 0.73 0.03 1.45 0.07 4.67 0.22 0.00 0.00 0.00 0.00
TOTAL 60.11 0.24 10.49 0.04 16.87 0.07 44.30 0.18 0.00 0.00 0.00 0.00
MarketCapitalization(US$ millions) Index
Jan-11 5,474.45 1,093Feb-11 5,596.16 1,092Mar-11 5,673.76 1,104Apr-11 5,777.43 1,046
May-11 5,755.04 1,030Jun-11 5,642.78 1,035Jul-11 5,551.42 1,013
Aug-11 5,238.06 922Sep-11 3,349.12 932Oct-11 3,332.15 886Nov-11 3,031.19 785Dec-11 2,900.95 791
FEDERATION OF EURO-ASIAN STOCK EXCHANGES ANNUAL REPORT JUNE 2012
PAGE 105
Difficulties with forming governments at State and Federation levels after the general elections in October 2010 and the failure of the Fiscal Council to adopt the Global Framework for Fiscal Policies for 2011-13 had a bearing on economic and fiscal policy. In a situation of increased uncertainty over the short- and medium-term path of fiscal policy, the authorities submitted their fifth Economic and Fiscal Programme for 2011-13 in January 2011. The programme is thus fragmented and does not reflect a coherent formulation of economic and fiscal policies. It is not fully integrated into budgetary procedures and its objectives are not adequately quantified or backed by concrete policy measures. The performance under the International Monetary Fund (IMF) Stand-By Arrangement remained broadly satisfactory until October 2010 when the IMF Board approved the second and third reviews. However, due to the difficulty of forming a government at State-level, further programme discussions were delayed. The first World Bank Development Loan was disbursed in October 2010. Overall, the consensus on economic and fiscal policy essentials has weakened.
Macroeconomic StabilityAfter the recession in 2009 with a drop in real GDP of 2.9%, the country moderately recovered in 2010. It recorded a positive real growth rate of 0.7%, driven by external demand. Domestic demand picked up, supported by a relatively stable inflow of remittances. Industrial production increased slightly in 2010 led by export-oriented industries, but unemployment remained very high. Per capita income, measured in purchasing power standards (PPS), fell to 30% of the EU-27 average in 2010 from 31% in 2009. As a result of fiscal adjustment measures implemented under the IMF programme and increased revenues, the budgetary situation eased. Due to improvements in the trade and current account deficits and the comfortable level of foreign reserves, the external financing needs decreased in 2010. The indicators available for 2011 suggest that the economic recovery is gaining strength as industrial production increased by 8.1% year-on-year in the first seven months of the year.
Overall, the economy is slowly gaining steam after the 2009 recession, but the recovery is fragile.
The current account deficit fell further from 6.2% of GDP in 2009 to 5.6% in 2010. The trade deficit fell by 4.8%, shrinking from 27.8% of GDP in 2009 to 25.9% in 2010, which contributed to the improvement of the current account. Exports rose by 27.7% nominally, and imports by 10.2%. Surpluses in the services and income accounts decreased by 8.6% and 23.2%, respectively, while that of the current transfer account increased by 3.1%, supported by the relatively stable flow of remittances. The current account deficit was financed mainly by new loans from abroad. However, the trend of an improving trade balance was reversed in the second half of 2010 when the nominal increase of imports exceeded that of exports. This deterioration continued in the first half of 2011 when the trade gap increased by 18.3% yearon-year. Imports and exports increased both by 18.3%, mining and manufacturing being the main sectors recording export growth. Bosnia and Herzegovina’s external public debt increased by 20.2% in 2010, from 21.8% of GDP in 2009 to 25.7% in 2010, mainly due to the disbursements made in the context of the IMF and World Bank programmes. In the first half of 2011, the external
public debt decreased slightly by 1.5%. Public international creditors account for 89% of the country’s external public debt. The largest creditor remains the World Bank group. Official foreign exchange reserves decreased by 5.7% in the first half of 2011 from end-2010, though still covering around five months of imports. Overall, external imbalances have slowly started to rise after the sharp contraction experienced in 2009 and the first half of 2010, although the current account deficit is still much lower than before the crisis.
The average unemployment rate in 2010 stood at a very high 27.2%. Registered unemployment reached 43.1% in June 2011, while according to the Labour Force Survey (LFS) following the International Labour Organisation (ILO) methodology conducted annually in April/May, unemployment increased to 27.6% in 2011 from 27.2% in 2010. It was particularly high among the young population (57.9% for people aged between 15 and 24, according to the LFS). In the first half of 2011 the highest year-on-year growth in employment was registered in education, real estate and health, while employment fell in agriculture, mining and manufacturing industries, as well as in trade and construction. Despite the already large size of the public sector in Bosnia and Herzegovina, the number of employees in the public administration increased further, by 2.1% year-on-year in the first six months of 2011. Average monthly nominal gross wages increased by 1.8% in 2010 and remained relatively stable in the first seven months of 2011. Structural rigidities such as the high rates of social contributions, poorly targeted social transfers and low labour mobility, are continuing to hamper job creation and the propensity to work. Overall, labour market conditions remained poor and were not supported by the weak growth dynamics. Annual inflation reached 2.1% in 2010, up from -0.4% in 2009. The inflationary trend was mainly driven by the rise in food and transport prices towards the end of the year. Inflation continued to rise in the first seven months of 2011, reaching 3.9% in July, pushing the 12- month moving average inflation rate up to 3.1%. The monetary policy of the Central Bank continued to be conducted under a currency board arrangement, with the euro as the anchor currency, enjoying a high level of confidence and credibility. Monetary policy settings remained unchanged throughout 2010. As of February 2011 the minimum reserve requirement for short-term deposits was lowered from 14% to 10%. Nevertheless, the banking system’s reserves with the Central Bank remain significantly above the minimum required level. The M2 monetary aggregate increased by 6% year-on-year in July. Overall, monetary and financial stability have been preserved while inflation is picking up.
The fiscal performance in 2010 benefitted from the recovering economic activity, whichb resulted in increasing revenues, and from the adjustment measures implemented under the bIMF programme. The consolidated budget deficit fell to 2.5% of GDP, which is well below the 2009 outcome of 4.5%. However, the share of general government in GDP remains high, with 2010 revenues at 44.4% of GDP. Adjustment measures on the expenditure side included cuts in wages and benefits in the public sector, which resulted in only a marginal 0.5% rise of the consolidated wage bill in nominal terms. Consolidated revenues increased by 5% in 2010. 44% of the revenues originated from
indirect taxes which increased by 6.7%, driven by the recovering economic activity, the development of imports and import prices and the increase of excise duties on tobacco and oil derivatives which counteracted the continuous reduction of duties and tariffs as set out in the Interim Agreement on trade, in force since mid-2008. Expenses increased by 1.6% year-on-year in 2010. Current spending dominates the budget with wages accounting for 29.2% of overall expenditure and subsidies and transfers (mainly social benefits) for 39.2%. The balance of the collected social contributions against the paid out social benefits returned on the positive side due to the simultaneous rise of the contributions and drop of the benefits. The flat income tax rate in Republika Srpska was raised from 8% to 10% as of 2011 and the non-taxable income threshold was abolished. Following amendments to the Law on Social Contributions in Republika Srpska, the overall social contribution rate increased from 30.6% to 33% of the gross salary as of January 2011.Excise duties on tobacco were raised as of 2011.
Budget planning for 2011 and beyond, as well as the sustainability and credibility of fiscal policy in Bosnia and Herzegovina, were seriously hampered by the non-adoption of the Global Framework for Fiscal Policies for the periods 2011-2013 and 2012-2014. The Parliament of Republika Srpska adopted the Entity’s 2011 budget in December 2010. It planned the same nominal expenditure as the budget for 2010. In the Federation, a temporary budget was in place in the first quarter. The Federation 2011 budget was adopted in March and showed a total amount of expenditure planned 9% lower than in 2010, with high uncertainties surrounding its financing. At the State-level, temporary budgets were in place during the first three quarters of 2011. The 2011 State-level budget was adopted by the Presidency in April, showing an increase in volume by 2% compared to 2010. However, it remains to be adopted by the Parliament. All budgets were established in the absence of a medium-term budgetary strategy. The Federation revised in July its 2011 budget to allow for some increase of specific social benefits, partly compensated by cuts in investment and the wage bill. Republika Srpska is planning to rebalance its 2011 budget in October. In May 2011, the distribution coefficients for the allocation of indirect revenues from the Single Account of the Indirect Taxation Authority were corrected for the first time since 2008. The share for the Federation was lowered slightly from 64.39% to 63.98% in the benefit of Republika Srpska’s share which went up slightly from 32.06% to 32.47%. The share for Brcko District remained at 3.55%. The shares are based on final consumption data. Overall, the reliability and predictability of fiscal policy in Bosnia and Herzegovina suffered from the failure to agree on Global Fiscal Frameworks which is a serious obstacle for medium-term budgetary planning and sustainability.
General government debt, both domestic and foreign, stood at 38.8% of GDP in 2010, up from 34.5% in 2009. External debt accounts for 25.7% of GDP and domestic debt for 13.1%. Domestic public debt is managed and served by the Entities (49.5% Federation, 49% Republika Srpska, 1.5% Brcko District). Verification of claims related to old foreign currency savings has advanced. Both Republika Srpska and the Federation continued issuing bonds in 2010 and 2011 to service the
BOSNIA AND HERZEGOVINA ECONOMY
FEDERATION OF EURO-ASIAN STOCK EXCHANGES ANNUAL REPORT JUNE 2012
PAGE 106
SARAJEVO STOCK EXCHANGE
debt. In addition, Republika Srpska issued for the first time short-term T-bills in May and June 2011 serving as temporary financing to Republika Srpska cash-based budget deficit. The offers were met by high demand and achieved relatively favourable conditions. Overall, even though the debt-to-GDP ratio is still relatively moderate, its upward trend needs to be monitored carefully.
Although there is evidence of an ongoing trend of economic recovery, the incomplete reform process acts as an impediment to laying the foundations for solid and more domestic-driven growth in Bosnia and Herzegovina. The growing trade gap and increasing current account deficit suggest that external imbalances are again taking shape. The productive capacity and competitiveness of the economy remain weak, as domestic sources of growth are not adequately exploited and national savings remain low. The currency board arrangement enjoys a high level of confidence and credibility, while the failure to agree on a Global Framework for Fiscal Policies for 2011-2013 and 2012-2014 severely threatens the transparency, reliability and sustainability of public finances and is a serious impediment for short- and medium-term budgetary and general economic planning. Overall, the worsening quality of budgetary processes is putting a strain on the viability of macroeconomic policies, even though financial and monetary stability has been preserved. Interplay of market forces.
The private sector’s share in GDP is estimated to have remained stable at around 60% of GDP in 2010. In Republika Srpska there has been no further progress in the privatisation agenda. Following a government decision not to initiate their privatisation, strategic companies such as the power utility, Banja Luka airport and the postal company remain public. Around 69% EN of the initial stock of State-owned capital intended for privatisation had been sold by September 2011, unchanged from a year earlier. In the Federation, only one out of nine companies included in the revised privatisation plan has been partly privatised by stock exchange transactions with the achieved price being less than half of the company’s estimated value. Attempts to privatise the remaining eight companies were unsuccessful, in some cases in spite of repeated offerings. None of the companies considered “strategic” such as the power utility and a tobacco factory were subject to privatisation. The planned restructuring and liquidation of socially-owned enterprises has made slow progress. Most prices are liberalised, even though a number of administered prices remain (e.g. for utilities, including electricity and gas). Overall, the planned privatisation process did not advance for the third consecutive year.
Market Entry and Exit Following the economic crisis, the number of newly registered companies dropped by around 50% in 2010. Property registration procedures were significantly shortened during 2010 in some courts, for example from 84 to 33 days in the Sarajevo Court. The time needed to start a business was reduced from 60 to 55 days, on average, over 2010. Court registration timelines and costs are harmonised between the Entities, including the notary fees. However, the process for obtaining all the necessary documents and permits remains lengthy and companies must still register in both Entities if they want to do business in the whole country. Under the second stage of the “legislative guillotine” project in the Federation, seven bylaws have been adopted in various ministries to streamline 109 business-related administrative procedures, and some administrative improvements have also been implemented at Canton and municipal levels. Labour tax procedures have been streamlined. Overall, some improvements can be reported, particularly in registration procedures.
The Legal System The legal system in Bosnia and Herzegovina remains complex. Even though the standard of legislation is relatively high in some areas, implementation and application of laws in practice is often poor due to the weak enforcement capacity of key institutions. The average time to resolve a dispute before court in order to enforce a contract remains high at 595 days. The rule of law is weak and the judicial system often does not function efficiently, is subject to obstruction by the parties and does not cover commercial activities adequately. Overall, weak rule of law, corruption and unreliable contract enforcement continue to hamper the business environment.
Financial Sector Development The financial sector is dominated by banks that are engaged mainly in traditional credit and savings activities. The share of claims on the private sector in relation to GDP decreased to around 55% in early 2011, from 58% a year earlier. Twenty-nine banks are operating in the country, one less than in the previous year as one bank in the Federation is undergoing a liquidation procedure. Two banks are under provisional administration. Twenty-one banks are under foreign ownership, seven under domestic private ownership and one is majority Stateowned. Despite losing some 2.4% of their share, the five largest still account for more than half of the total assets of the banking sector. Banks with foreign ownership accounted for approximately 90% of the total banking system assets in 2010. Banking sector assets remained relatively stable between the third quarter of 2010 and the second quarter of 2011. The capital adequacy ratio decreased slightly from 15.6% in the third quarter of 2010 to EN 15.5% in the second quarter of 2011, comfortably above the legal minimum of 12%, which itself is significantly higher than the 8% required in the Basel II Accord. After an aggregate net profit of some € 12.6 million in 2009, the banking sector finished 2010 with an aggregate net loss of € 63.6 million. The quality of the loan portfolio continued to deteriorate. The share of non-performing loans to total loans reached 11.8% in the second quarter
of 2011, the highest level since 2001, up from 9.2% in the third quarter of 2010, while the volume of loans increased. Nevertheless, banking profitability indicators showed a remarkable upward trend in the second quarter of 2011. The return on average equity increased from -3.5% in the third quarter of 2010 to 3.5%, while the return on average assets rose from -0.4% to 0.4%. Liquidity indicators deteriorated slightly during the same period with the rates of liquid to total assets falling from 29.3% to 26.2% and of liquid assets to short-term financial liabilities from 50.3% to 46.2%. Twenty-five banks are participating in the deposit guarantee scheme. Its coverage level remained unchanged at around € 18,000. In March 2011, Republika Srpska amended the Law on the Banking Agency, establishing a banking system ombudsman and widening the Agency’s responsibilities for supervision and protection against money laundering and financing of terrorism. The amendment also assigns the Agency customer protection functions. Overall, despite the increasing non-performing loan ratio, financial stability was safeguarded.
Annual credit growth continued its upward trend and reached 6.7% in July 2011, though from a low base. Loans to households grew slightly by 2.8%, while those to private enterprises increased by 7.7%. The recovery of deposits has lost pace in an annual comparison, growing by 2.2% in July. Households remained the main contributors to this development, increasing their savings by 10.7%, while the corporate sector reduced its deposits by 6.6%. As a consequence of these developments, the loans-to-deposits ratio climbed from 113.5% in October 2010 to 120% in July 2011. The spread between average loan and deposit interest rates of commercial banks decreased by 18 base points in the fourth quarter of 2010 compared to the previous quarter, reaching 7.87 percentage points, mainly due to reduced lending rates. This level points to still high intermediation costs. Overall, after the sharp correction experienced during the financial and economic crisis, credit activities are gaining strength again.
In the first half of 2011, local stock markets regained some previously lost ground, recording an upswing of 4% and 7.2% for the main indices of the Sarajevo and the Banja Luka stock exchanges, respectively. Their combined market capitalisation recovered somewhat to around 47% of GDP in the first seven months of 2011, up from 44% in mid-2010. The cumulative turnover almost doubled year-on-year in January-July 2011, mainly influenced by two T-bills issues of Republika Srpska (May-June 2011). The insurance sector remained small and relatively weak, accounting for 1.9% of GDP in 2010, representing marginal increase. The annual growth of premiums picked up slightly to 2.9%, as compared to 1.4% annual rise in 2009. The market was dominated by the non-life insurance segment, which accounted for 84.2% of the total. The number of companies active on the market decreased to 25 at the end of 2010, after the Federation’s Insurance Supervisory Agency revoked the licence of Hercegovina Osiguranje. Overall, financial intermediation by the non-banking sector remained shallow.
Source IMF
FEDERATION OF EURO-ASIAN STOCK EXCHANGES ANNUAL REPORT JUNE 2012
PAGE 107
Hassan GhalibafCEO
Tehran Stock Exchange (TSE), as one of the largest emerging markets in the Middle East and North Africa region, has 347 listed companies and 87 securities firms as its members (December 2011).
TSE finalized its five-year Strategic Plan last year under the vision of An Excellent Exchange in the Region and a Driver for Economic Growth in the Country. The Strategic Plan exemplifies our dedication to quality and demonstrates our commitment to keep our markets in line with the evolving world standards. Under the three concepts of transparency, efficiency and integrity, our efforts are directed to activating the market by discovering local companies through TSE comprehensive marketing plan and developing new projects such as educational programs for promoting public investment culture in the country and plan for obtaining ISO 27001 certification for TSE’s IT Security Management System. Our response to the challenges is to pay special attention to
sustaining and improving the attractiveness and competitiveness of our market, with liquidity and efficiency. While addressing them, we also take the opportunity to secure some notable advances for TSE and increase our attractiveness for both issuers and investors. We embarked on significant market and regulatory reforms to facilitate raising capital by issuers. TSE continues to strive for the establishment of a strong presence as a major global exchange. In promoting international relationship and creating opportunities, we are discussing with index providers to enhance our benchmark index. Also, Tehran Stock Exchange is the chairman of FEAS working committee for 2011-2012 period.
Online trading as a new service is now supported by TSE for both individual and institutional investors with a highly efficient, modern, and user-friendly system, which allows customers to place their orders directly to the Exchange’s trading system and set their
own bid/ask prices from all over the world through the dedicated access provided by the brokerage firms. This facility offers brokers the opportunity to concentrate more on the added value services, such as professional advisory and market analysis and lower their operating costs. It has been now over one and a half years that derivatives market is launched in the Exchange, initially with single-stock futures contract on some of TSE’s listed companies’ shares. More studies are being carried out for establishing option market. We are committed to safeguarding and expanding the investments of our clients by utilizing all our resources and maximizing the stakeholder’s benefits. That is designed to evolve alongside the emerging trends in the international markets. At TSE, sustainable improvement is an unending process. We strive to adopt the highest standards of the operations and quality control, according to the international standards and are constantly upgrading the expertise of our team.
HISTORY AND DEVELOPMENT
Tehran Stock Exchange (TSE) was founded in 1967, by starting with only six listed companies. Since then, the Exchange has experienced considerable changes in the path of development. Today, five years after its demutualization, which took place on 6 December 2006, TSE has gradually demonstrated its potentiality as a leading Exchange in the region and developed into an ever growing marketplace, including more than three hundred and forty listed companies with a market capitalization of above US$ 100 billion (December 2011). TSE is aiming at promoting the Iranian capital market to respond to the socio-economic development requirements of the nation. The Exchange helps and stimulates industrial, as well as economic growth and development of the country’s financial sector. TSE is preparing to maintain a strong and transparent market in order to give opportunity to the investors to convert their cash into securities at a fair and honest price and vice versa, and is developing to become a highly liquid secondary market for securities to raise funds and win confidence
from all stakeholders. TSE is planning to operate as a world-class marketplace for Iranian securities and derivatives products. It strives to offer issuers access to a wide national marketplace.
By servicing Iran’s substantial long-term demand for capital and exchange services in accordance with international standards and practices, it is believed that TSE has the potential to become one of the preeminent Exchanges in the Persian Gulf region and beyond.
Privatization, as a priority is both followed by the State and managed by TSE on the one hand, to facilitate the economic reforms, and on the other one, to improve and support the Iranian securities market. Moreover, financing through capital market is felt as an obligation for the Iranian economy’s growth and in this fashion, shares of two banks, two petrochemical companies and a provider of electronic services were listed and publically offered in the Exchange in 2011. For the coming year, introducing option market is in the agenda.
FUTURE OUTLOOK
• Expanding the country’s capital market share by increasing the number of listed companies, improving market liquidity and introducing new financial tools.
• Applying effective rules and procedures to protect market integrity through re-engineering of procedures and setting new or enhancing old rules and regulations.
• Expanding market with the use of updated and efficient technology and processes.
• Developing financial knowledge and improving investment and shareholding culture in Iran by educational programs and use of mass media.
• Facilitating market access by means of information technology.
• Observing accountability and transparency in co-operation with the stakeholders.
• Developing channels of knowledge-sharing with other Exchanges.
TSE finalized its five-year Strategic Plan last year under the vision of An Excellent Exchange in the Region and a Driver for Economic Growth in the Country.
TEHRAN STOCK EXCHANGE
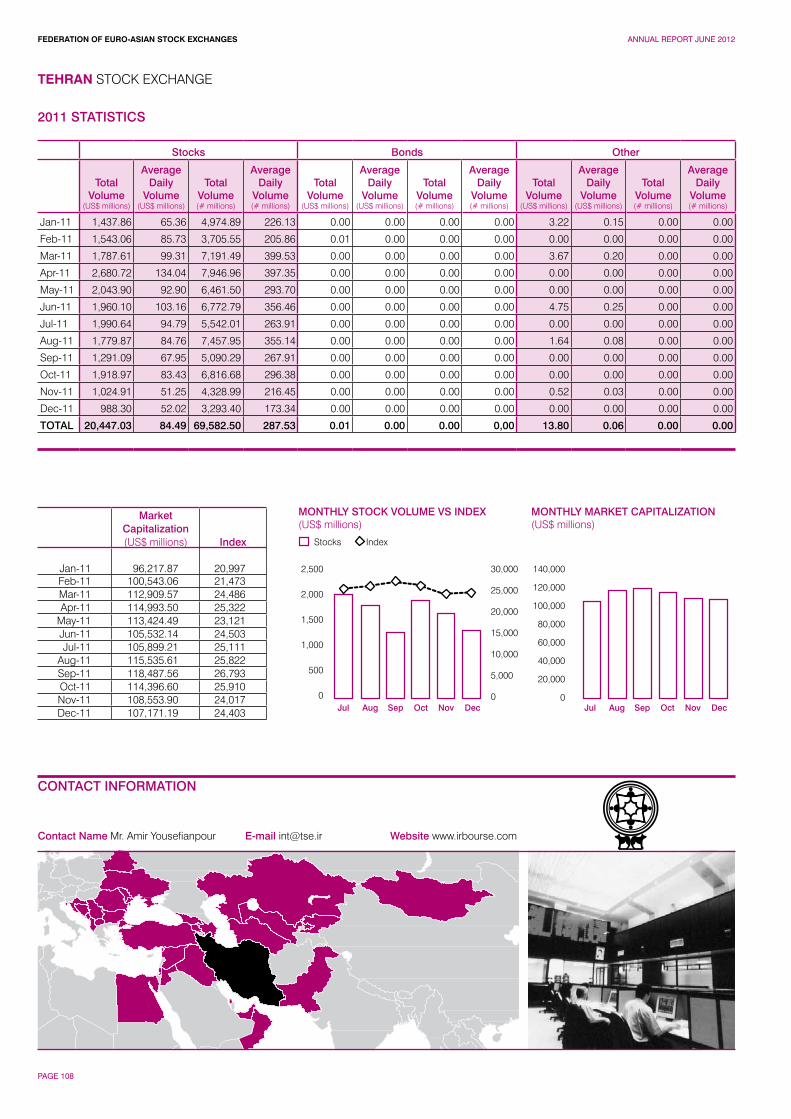
FEDERATION OF EURO-ASIAN STOCK EXCHANGES ANNUAL REPORT JUNE 2012
PAGE 108
Contact Name Mr. Amir Yousefianpour E-mail [email protected] Website www.irbourse.com
TEHRAN STOCK EXCHANGE
CONTACT INFORMATION
MONTHLY MARKET CAPITALIZATION(US$ millions)
2,500
2,000
1,500
1,000
500
0
30,000
25,000
20,000
15,000
10,000
5,000
0
140,000
120,000
100,000
80,000
60,000
40,000
20,000
0
Stocks
MONTHLY STOCK VOLUME VS INDEX(US$ millions)
Index
Jul JulAug AugSep SepOct OctNov NovDec Dec
2011 STATISTICS
Stocks Bonds Other
Total Volume
(US$ millions)
Average Daily
Volume(US$ millions)
Total Volume(# millions)
Average Daily
Volume(# millions)
Total Volume
(US$ millions)
Average Daily
Volume(US$ millions)
Total Volume(# millions)
Average Daily
Volume(# millions)
Total Volume
(US$ millions)
Average Daily
Volume(US$ millions)
Total Volume(# millions)
Average Daily
Volume(# millions)
Jan-11 1,437.86 65.36 4,974.89 226.13 0.00 0.00 0.00 0.00 3.22 0.15 0.00 0.00
Feb-11 1,543.06 85.73 3,705.55 205.86 0.01 0.00 0.00 0.00 0.00 0.00 0.00 0.00
Mar-11 1,787.61 99.31 7,191.49 399.53 0.00 0.00 0.00 0.00 3.67 0.20 0.00 0.00
Apr-11 2,680.72 134.04 7,946.96 397.35 0.00 0.00 0.00 0.00 0.00 0.00 0.00 0.00
May-11 2,043.90 92.90 6,461.50 293.70 0.00 0.00 0.00 0.00 0.00 0.00 0.00 0.00
Jun-11 1,960.10 103.16 6,772.79 356.46 0.00 0.00 0.00 0.00 4.75 0.25 0.00 0.00
Jul-11 1,990.64 94.79 5,542.01 263.91 0.00 0.00 0.00 0.00 0.00 0.00 0.00 0.00
Aug-11 1,779.87 84.76 7,457.95 355.14 0.00 0.00 0.00 0.00 1.64 0.08 0.00 0.00
Sep-11 1,291.09 67.95 5,090.29 267.91 0.00 0.00 0.00 0.00 0.00 0.00 0.00 0.00
Oct-11 1,918.97 83.43 6,816.68 296.38 0.00 0.00 0.00 0.00 0.00 0.00 0.00 0.00
Nov-11 1,024.91 51.25 4,328.99 216.45 0.00 0.00 0.00 0.00 0.52 0.03 0.00 0.00
Dec-11 988.30 52.02 3,293.40 173.34 0.00 0.00 0.00 0.00 0.00 0.00 0.00 0.00
TOTAL 20,447.03 84.49 69,582.50 287.53 0.01 0.00 0.00 0,00 13.80 0.06 0.00 0.00
MarketCapitalization(US$ millions) Index
Jan-11 96,217.87 20,997Feb-11 100,543.06 21,473Mar-11 112,909.57 24,486Apr-11 114,993.50 25,322
May-11 113,424.49 23,121Jun-11 105,532.14 24,503Jul-11 105,899.21 25,111
Aug-11 115,535.61 25,822Sep-11 118,487.56 26,793Oct-11 114,396.60 25,910Nov-11 108,553.90 24,017Dec-11 107,171.19 24,403
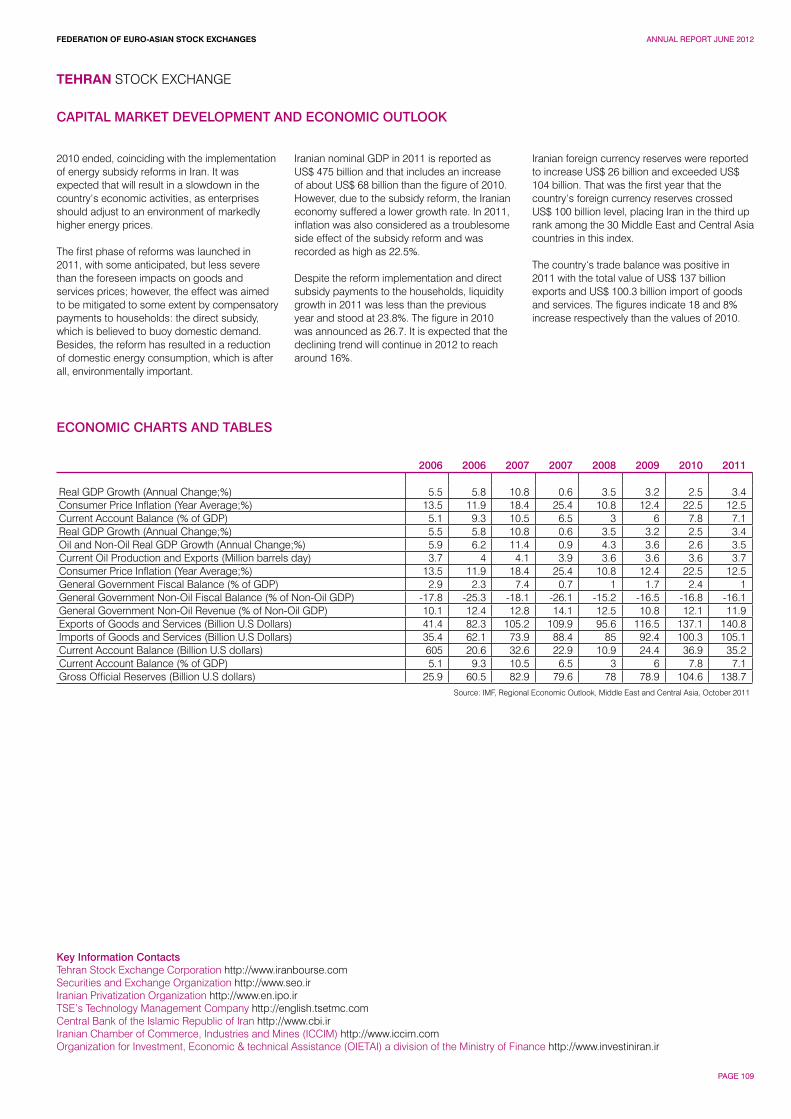
FEDERATION OF EURO-ASIAN STOCK EXCHANGES ANNUAL REPORT JUNE 2012
PAGE 109
2010 ended, coinciding with the implementation of energy subsidy reforms in Iran. It was expected that will result in a slowdown in the country‘s economic activities, as enterprises should adjust to an environment of markedly higher energy prices.
The first phase of reforms was launched in 2011, with some anticipated, but less severe than the foreseen impacts on goods and services prices; however, the effect was aimed to be mitigated to some extent by compensatory payments to households: the direct subsidy, which is believed to buoy domestic demand. Besides, the reform has resulted in a reduction of domestic energy consumption, which is after all, environmentally important.
Iranian nominal GDP in 2011 is reported as US$ 475 billion and that includes an increase of about US$ 68 billion than the figure of 2010. However, due to the subsidy reform, the Iranian economy suffered a lower growth rate. In 2011, inflation was also considered as a troublesome side effect of the subsidy reform and was recorded as high as 22.5%.
Despite the reform implementation and direct subsidy payments to the households, liquidity growth in 2011 was less than the previous year and stood at 23.8%. The figure in 2010 was announced as 26.7. It is expected that the declining trend will continue in 2012 to reach around 16%.
Iranian foreign currency reserves were reported to increase US$ 26 billion and exceeded US$ 104 billion. That was the first year that the country‘s foreign currency reserves crossed US$ 100 billion level, placing Iran in the third up rank among the 30 Middle East and Central Asia countries in this index.
The country‘s trade balance was positive in 2011 with the total value of US$ 137 billion exports and US$ 100.3 billion import of goods and services. The figures indicate 18 and 8% increase respectively than the values of 2010.
TEHRAN STOCK EXCHANGE
Key Information ContactsTehran Stock Exchange Corporation http://www.iranbourse.comSecurities and Exchange Organization http://www.seo.irIranian Privatization Organization http://www.en.ipo.irTSE’s Technology Management Company http://english.tsetmc.comCentral Bank of the Islamic Republic of Iran http://www.cbi.irIranian Chamber of Commerce, Industries and Mines (ICCIM) http://www.iccim.comOrganization for Investment, Economic & technical Assistance (OIETAI) a division of the Ministry of Finance http://www.investiniran.ir
ECONOMIC CHARTS AND TABLES
2006 2006 2007 2007 2008 2009 2010 2011
Real GDP Growth (Annual Change;%) 5.5 5.8 10.8 0.6 3.5 3.2 2.5 3.4Consumer Price Inflation (Year Average;%) 13.5 11.9 18.4 25.4 10.8 12.4 22.5 12.5Current Account Balance (% of GDP) 5.1 9.3 10.5 6.5 3 6 7.8 7.1Real GDP Growth (Annual Change;%) 5.5 5.8 10.8 0.6 3.5 3.2 2.5 3.4Oil and Non-Oil Real GDP Growth (Annual Change;%) 5.9 6.2 11.4 0.9 4.3 3.6 2.6 3.5Current Oil Production and Exports (Million barrels day) 3.7 4 4.1 3.9 3.6 3.6 3.6 3.7Consumer Price Inflation (Year Average;%) 13.5 11.9 18.4 25.4 10.8 12.4 22.5 12.5General Government Fiscal Balance (% of GDP) 2.9 2.3 7.4 0.7 1 1.7 2.4 1General Government Non-Oil Fiscal Balance (% of Non-Oil GDP) -17.8 -25.3 -18.1 -26.1 -15.2 -16.5 -16.8 -16.1General Government Non-Oil Revenue (% of Non-Oil GDP) 10.1 12.4 12.8 14.1 12.5 10.8 12.1 11.9Exports of Goods and Services (Billion U.S Dollars) 41.4 82.3 105.2 109.9 95.6 116.5 137.1 140.8Imports of Goods and Services (Billion U.S Dollars) 35.4 62.1 73.9 88.4 85 92.4 100.3 105.1Current Account Balance (Billion U.S dollars) 605 20.6 32.6 22.9 10.9 24.4 36.9 35.2Current Account Balance (% of GDP) 5.1 9.3 10.5 6.5 3 6 7.8 7.1Gross Official Reserves (Billion U.S dollars) 25.9 60.5 82.9 79.6 78 78.9 104.6 138.7
Source: IMF, Regional Economic Outlook, Middle East and Central Asia, October 2011
CAPITAL MARKET DEVELOPMENT AND ECONOMIC OUTLOOK
FEDERATION OF EURO-ASIAN STOCK EXCHANGES ANNUAL REPORT JUNE 2012
PAGE 110
HISTORY AND DEVELOPMENT
TSE is the first and the only stock exchange in Albania, established in 1996 originally as a department of Bank of Albania (BoA). The activity at hand, at that time, was the trading of the T-Bills with 12 months-to-maturity, five series of government bonds and privatization vouchers. It also held out the primary auctions for Treasury Bills until August 1st, 1998, than this market moved to Monetary Operations Department, at BoA.
TSE was structured as a joint stock company and a state - owned one,, on March 2002, and shareholder was State, represented by Minister of Finance (100% of the shares). It’s authorized and subscribed Capital is equal to 20,000,000 lek (~EUR163,000) with a no. of shares of 20,000. On 07.13.2007, after several periodical - limited licenses since 2002, the Albanian Financial Supervisory Authority, licensed Tirana Stock Exchange with an infinite validity license. The license empowers TSE “To operate as a securities market for the trading of Government/Corporate Debt Securities and Shares” with no time restriction.
Market Structure -TradingTSE is an order-driven “open outcry – call market” which uses a manual trading system with physical presence of licensed commissioners (members) on the trading floor. Securities’ prices on the trading sessions are set according to “single price method”, while trading is held:- every Monday and Wednesday, from 10.00 - 12.00,for the official market.- every Friday for trading in the parallel market.
The eligible tradable instruments are: shares, government and corporate bonds. In order to trade, TSE commissioners should be physically presented in the trading sessions. Each trading session is conducted in two rounds. Organized as an auction market, TSE calculates a single price for each tradable instrument, at the end of each trading day.
Clearing and settlement for every type of securities traded at TSE, is done on a net basis within T+3, in full accordance with “Delivery versus Payment – DVP” principle. Clearing and settlement for transactions executed at TSE is done in cooperation with second tier commercial banks and Albanian Share Registrar for joint-stock company shares.
MembershipTSE records 5 licensed members, three commercial banks and two private companies, which offer brokerage services for investors.
FUTURE OUTLOOK
Activating the securities market as a common trading platform for several financial instruments, will be the strategic objective of the TSE. Achievement of such an important goal shall be carried out through:• Working closely with and assisting in
the continuance of domestic top level businesses, TSE members, etc. to make them aware of advantages the securities market may offer them as well as providing these stockholders with necessary information, in order to be listed at TSE,
• Bilateral negotiations with Albanian Government towards the inclusion of TSE in the privatization process of the state-owned enterprises (SOEs). These negotiations will cover identification of potential strategic and non-strategic state owned companies, which can be privatized through IPO,
• Negotiations with the Albanian Government and the Ministry of Finance towards the assignment of TSE, by Ministry of Finance (MoF), as Government’s agent in organizing primary auction for long-term public debt securities,
• Negotiation and cooperation with MoF and AFSA towards the compilation of legal and fiscal incentives, which are deemed necessary to encourage private companies to raise their capital through IPOs and TSE listing,
• Performance of a marketing campaign, in full compliance with the marketing program compiled by TSE with a final objective to attract domestic business at exchange listing,
• In cooperation with AFSA, carrying out of a continued public education & information campaign regarding the securities market and advantages that provides its use,
• Improvement of information technology at TSE in order to make it possible to provide the market with an appropriate Electronic Trading System for securities,
• Keeping fruitful cooperation with institutions in the region, regarding the exchange of experiences and staff training, targeting further improvement of human resources capacity within the filed of securities market.
Anila FurerajGeneral Manager
Tirana Stock Exchange is the only securities market in Albania. The development of transparent capital market, based on international standards and activation of capital market as a trading platform for different financial instruments, is the main objective of TSE.
The presence of an active domestic capital market and efficient, would give companies the option to increase capital by understanding that brings real benefits for the capital market. An active and efficient capital market will expand the capital market in Albania by providing various investment opportunities and
mechanisms to ensure efficient and transparent pricing will increase access to finance for Albanian companies.
As requirement of new law “On Securities” were draw the Rules of Tirana Stock Exchange that was approved by Financial Supervisory Authority Board. In these rules are include in a systematic manner rules of membership, listing, trading, clearing and settlement of transaction on securities that will be trading in Tirana Stock Exchange. Rules of Tirana Stock Exchange were prepared and adapted with contemporary general principals for functioning of capital market of
European countries and have like purpose protections of investors and ensure a full transparency of companies that will be listing in Exchange, protection of minor stakeholders interests and ensure the equal treatment for all shareholders, application of International Standard of Accounting for all companies that be listing in Exchange and prevention of illegal practice in trading securities on Exchange.
The capital market needs for particularly attention from business. Till offer and demand for the market product will be in continuously in development, than time is coming that activity of this market will grow and will be useful for participant of this market.
The development of transparent capital market, based on international standards and activation of capital market as a trading platform for different financial instruments, is the main objective of TSE.
TIRANA STOCK EXCHANGE
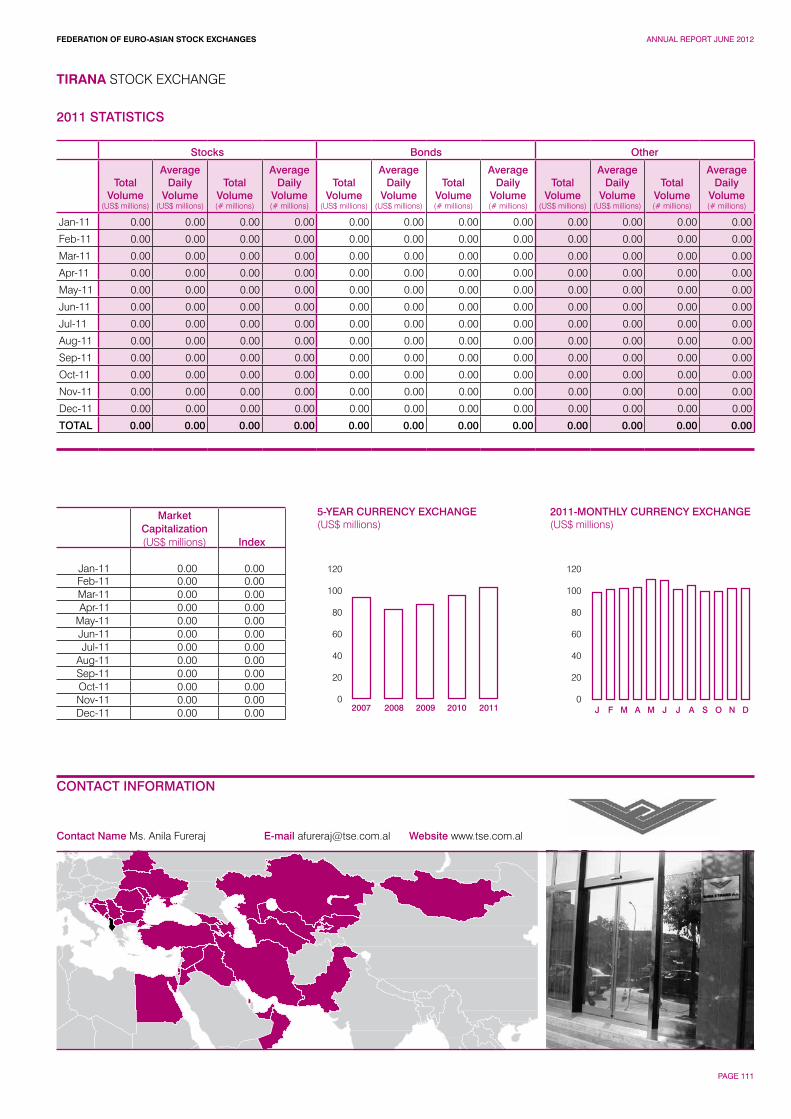
FEDERATION OF EURO-ASIAN STOCK EXCHANGES ANNUAL REPORT JUNE 2012
PAGE 111
Contact Name Ms. Anila Fureraj E-mail [email protected] Website www.tse.com.al
TIRANA STOCK EXCHANGE
CONTACT INFORMATION
2011-MONTHLY CURRENCY EXCHANGE(US$ millions)
120
100
80
60
40
20
0
120
100
80
60
40
20
0
5-YEAR CURRENCY EXCHANGE(US$ millions)
2007 2008 2009 2010 2011 J F M A M J J A S O N D
2011 STATISTICS
Stocks Bonds Other
Total Volume
(US$ millions)
Average Daily
Volume(US$ millions)
Total Volume(# millions)
Average Daily
Volume(# millions)
Total Volume
(US$ millions)
Average Daily
Volume(US$ millions)
Total Volume(# millions)
Average Daily
Volume(# millions)
Total Volume
(US$ millions)
Average Daily
Volume(US$ millions)
Total Volume(# millions)
Average Daily
Volume(# millions)
Jan-11 0.00 0.00 0.00 0.00 0.00 0.00 0.00 0.00 0.00 0.00 0.00 0.00
Feb-11 0.00 0.00 0.00 0.00 0.00 0.00 0.00 0.00 0.00 0.00 0.00 0.00
Mar-11 0.00 0.00 0.00 0.00 0.00 0.00 0.00 0.00 0.00 0.00 0.00 0.00
Apr-11 0.00 0.00 0.00 0.00 0.00 0.00 0.00 0.00 0.00 0.00 0.00 0.00
May-11 0.00 0.00 0.00 0.00 0.00 0.00 0.00 0.00 0.00 0.00 0.00 0.00
Jun-11 0.00 0.00 0.00 0.00 0.00 0.00 0.00 0.00 0.00 0.00 0.00 0.00
Jul-11 0.00 0.00 0.00 0.00 0.00 0.00 0.00 0.00 0.00 0.00 0.00 0.00
Aug-11 0.00 0.00 0.00 0.00 0.00 0.00 0.00 0.00 0.00 0.00 0.00 0.00
Sep-11 0.00 0.00 0.00 0.00 0.00 0.00 0.00 0.00 0.00 0.00 0.00 0.00
Oct-11 0.00 0.00 0.00 0.00 0.00 0.00 0.00 0.00 0.00 0.00 0.00 0.00
Nov-11 0.00 0.00 0.00 0.00 0.00 0.00 0.00 0.00 0.00 0.00 0.00 0.00
Dec-11 0.00 0.00 0.00 0.00 0.00 0.00 0.00 0.00 0.00 0.00 0.00 0.00
TOTAL 0.00 0.00 0.00 0.00 0.00 0.00 0.00 0.00 0.00 0.00 0.00 0.00
MarketCapitalization(US$ millions) Index
Jan-11 0.00 0.00Feb-11 0.00 0.00Mar-11 0.00 0.00Apr-11 0.00 0.00
May-11 0.00 0.00Jun-11 0.00 0.00Jul-11 0.00 0.00
Aug-11 0.00 0.00Sep-11 0.00 0.00Oct-11 0.00 0.00Nov-11 0.00 0.00Dec-11 0.00 0.00
FEDERATION OF EURO-ASIAN STOCK EXCHANGES ANNUAL REPORT JUNE 2012
PAGE 112
Economic situation The Albanian economy faced with more challenges in 2011. Albania’s economy maintained its positive growth rates during this year. The economic growth stood at 3%.Annual growth of Albanian exports in value for the first eleven months of the year was 19.9%, implying slower rates compared with the corresponding period of a year earlier. On the other hand, imports accelerated their annual growth to 12.2%. Trade deficit widened by 8.1%, illustrating negative effects of price rise in global markets. The trade deficit reveals that about 50% of its increase is created by the balance of electric energy exchange.
Annualized contraction of net exports deficit is assessed to be resulting from imports of goods and services decline by about 4.2% in real terms and exports upsurge by about 8.6%.
The exchange rate has been stable and inflation has been entirely within the objectives set by the Bank of Albania increased by 2.9% annually.
Financial markets during the second half of 2011 were calm and reflected relatively downward premiums on liquidity risk and inflation. Successive key rate cuts were swiftly reflected in the interbank market. In the primary market, government security yields dropped, reflecting the key interest rate cut as well as the low demand of the public sector for loans. Moreover, transmission of monetary policy signals is expected to be extended fully to the deposits and loans market, in accordance with the transmission mechanism time lags.
Fiscal policy was stimulating in 2011, materialized in positive contribution of public spending to aggregate demand. At the end of November, budget deficit was ALL 38 billion, reflecting expansion by about 65% in annual terms. However, the budget deficit has remained within levels provided in the budget plan for 2011. The deficit created by the scheme of social security system has exceeded the budget deficit by about 34%. Current surplus estimated to 18.1 billion, or about 15.7% higher than the same period a year ago.
* Information provided by the Tirana Stock Exchange.
TIRANA STOCK EXCHANGE
Key Information ContactsBank of Albania www.bankofalbania.orgMinistry of Finance www.minfin.gov.alAlbanian Institute of Statistics www.instat.gov.alAlbanian Financial Supervisory Authority www.amf.gov.alMinistry of Economy www.mete.gov.al
CAPITAL MARKET DEVELOPMENT AND ECONOMIC OUTLOOK
FEDERATION OF EURO-ASIAN STOCK EXCHANGES ANNUAL REPORT JUNE 2012
PAGE 113
Shahruh Hakimov Chairman of the Executive Board
Main indicators of the activities of the “Toshkent” Republican Stock Exchange for 2011
“Toshkent” Republican Stock Exchange is the main marketplace on corporate securities market in the Republic of Uzbekistan.
Analysis of the dynamics of stocks turnover for the last five years shows that current year securities market showed a very rapid growth. Thus, in 2007-2008, the volume of securities’ transactions slightly exceeded the mark of UZS 100 bln., however, in the next two years there was a decline in the stocks turnover.
Year 2011 was the most productive for the entire period of the Exchange. As a result of significant recovery of the stock market and activation of its members in the current year, turnover of securities amounted to UZS 213.1 bln., which is more than 3 times higher than similar indicator in 2010. One of the main indicators of the republic’s securities market competitiveness is the degree of the secondary stock market development. Proof of this is the dominance of the securities secondary circulation market in the structure of the total stock market turnover for the past five years.
Primary market share in 2011 accounts for 47.0% of total stock market turnover, or UZS 100.2 bln.
According to the results of 2011 share of issues of banks’ securities in primary placement of newly issued stocks and bonds of all joint-stock companies accounts for the major part of placements - 67.8% of total volumes of new issues.
Second place among successfully allocated new issues through the Stock Exchange belongs to enterprises of industrial sector - 25.8%.
Securities of commercial banks also hold a leading position in the secondary stock market - 65.4% of secondary circulation volume. Great interest of investors in the secondary stock market comparatively to previous years is aroused also by the securities of industrial enterprises - 19.4%.
Analysis of indicators on the activities of the Stock Exchange in 2011 throughout sectors of economy shows that an increasing demand for securities of enterprises of non-commodities sectors with higher added value has had a
large impact on the stock market. Among them the most investment attractive were securities of companies engaged in the financial services sector, particularly banks.
So, if in 2008 share of securities of commercial banks constituted 39.1% of total stock market turnover, then according to 2011 results this indicator constituted 64.4%, i.e. increased by 1.6 times.
High indicators of the banking sector are achieved largely through the actions undertaken to implement the Program of measures to further increase capitalization and investment activity of commercial banks for 2010-2012, approved by the Decree of the President of the Republic of Uzbekistan of April 6, 2010 No. PP-1317 “On measures to further enhance financial stability and increase investment activity of the banking system”.
Also, significant amount of operations has been performed with securities of industrial enterprises, which accounted for 21.6% (46.0 billion sums) of the total stock turnover.
In general, the structure of total primary and secondary securities turnover on the Stock Exchange in 2011 by major sectors is as follows:- share of financial sector enterprises accounts for 67.7% of the turnover, or UZS 144.6 bln. (commercial banks - 64.4%, insurance companies - 2.8% and leasing companies - 0.5%). In comparison to previous year, the turnover of securities of the financial sector enterprises as a whole grew by 3.7 times; - share of industrial sector enterprises - 21.6% of the turnover or UZS 46.0 bln., (increase by almost 3.5 times);- share of agricultural sector enterprises – 2.0% or UZS 4.2 bln. (increase by 1.4 times). One of the main current priorities is to attract well performing and the most financially stable national companies as well as their stocks to be listed on the Stock Exchange.
It should be noted that recently taken measures to make listing procedures more attractive and transparent have given positive effect.
So, if in 2006 number of listed companies was only 4, then in 2011 official stock exchange listing of the “Toshkent” RSE included shares of 100 joint-stock companies. Among the listed companies are commercial banks, insurance companies, enterprises of oil and gas industry, light industry, production of construction materials, agriculture, energy, metallurgy sectors, etc.
In recent years there has been a significant increase in the share of turnover of stocks of listed companies in the total turnover of the Exchange. So, if in 2008 this indicator was 37.5%, then in 2011 it reached to 49.6%.
Important advantage of a joint-stock company being listed in stock exchange is the regular quotation of prices for its securities, resulting in the formation of market mechanism of determination of fair price of the securities, which in turn promotes the growth of its capitalization.
So, as of December 31, 2011 indicator of market capitalization of joint stock companies shares included in the official stock exchange listing, amounted to UZS 5 282.8 bln. (increase by 11.3% compared with that as of December 31, 2010).
The share of capitalization of listed companies from the whole capitalization of the joint-stock companies whose shares are traded on the stock market is 58.1%.
One of the main factors that activate the stock exchange functions is expansion of the number of potential investors. At present, more than ever before, opportunity to get “quick money” by trading securities has increased. World practice shows that these securities offer higher returns and more reliable protection against inflation than any other type of investment. It is obvious that in our country a class of investors, that activate their participation in the securities market and understand that by acquiring shares of joint-stock companies, they become owners of tangible assets that have a real prospect of growth, is gradually beginning to shape.
There is no doubt that raising the level of investor confidence in the stock market instruments and expansion of the participation of population and legal entities in the securities market is one of the major objectives in the future work of “Toshkent” Republican Stock Exchange. Accordingly, the promotion of investments in financial instruments, informing the public and investors about advantages and perspectives of the domestic stock market, creating favorable conditions for securities trading will ultimately allow more people and corporate entities to participate in the processes of attracting and investing financial resources in order to both generating additional incomes and realize investments projects vital for the development of national economy.
Year 2011 was the most productive for the entire period of the Exchange.
“TOSHKENT” REPUBLICAN STOCK EXCHANGE
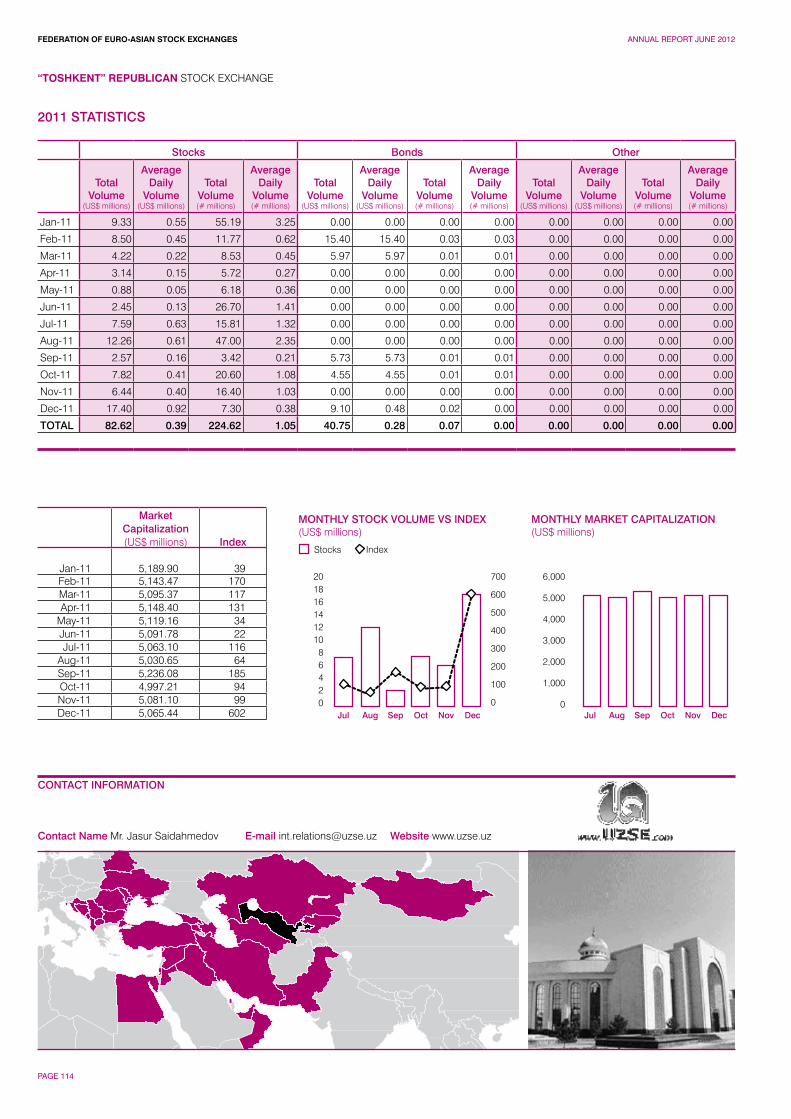
FEDERATION OF EURO-ASIAN STOCK EXCHANGES ANNUAL REPORT JUNE 2012
PAGE 114
Contact Name Mr. Jasur Saidahmedov E-mail [email protected] Website www.uzse.uz
“TOSHKENT” REPUBLICAN STOCK EXCHANGE
CONTACT INFORMATION
MONTHLY MARKET CAPITALIZATION(US$ millions)
20181614121086420
700
600
500
400
300
200
100
0
6,000
5,000
4,000
3,000
2,000
1,000
0
Stocks
MONTHLY STOCK VOLUME VS INDEX(US$ millions)
Index
Jul JulAug AugSep SepOct OctNov NovDec Dec
2011 STATISTICS
Stocks Bonds Other
Total Volume
(US$ millions)
Average Daily
Volume(US$ millions)
Total Volume(# millions)
Average Daily
Volume(# millions)
Total Volume
(US$ millions)
Average Daily
Volume(US$ millions)
Total Volume(# millions)
Average Daily
Volume(# millions)
Total Volume
(US$ millions)
Average Daily
Volume(US$ millions)
Total Volume(# millions)
Average Daily
Volume(# millions)
Jan-11 9.33 0.55 55.19 3.25 0.00 0.00 0.00 0.00 0.00 0.00 0.00 0.00
Feb-11 8.50 0.45 11.77 0.62 15.40 15.40 0.03 0.03 0.00 0.00 0.00 0.00
Mar-11 4.22 0.22 8.53 0.45 5.97 5.97 0.01 0.01 0.00 0.00 0.00 0.00
Apr-11 3.14 0.15 5.72 0.27 0.00 0.00 0.00 0.00 0.00 0.00 0.00 0.00
May-11 0.88 0.05 6.18 0.36 0.00 0.00 0.00 0.00 0.00 0.00 0.00 0.00
Jun-11 2.45 0.13 26.70 1.41 0.00 0.00 0.00 0.00 0.00 0.00 0.00 0.00
Jul-11 7.59 0.63 15.81 1.32 0.00 0.00 0.00 0.00 0.00 0.00 0.00 0.00
Aug-11 12.26 0.61 47.00 2.35 0.00 0.00 0.00 0.00 0.00 0.00 0.00 0.00
Sep-11 2.57 0.16 3.42 0.21 5.73 5.73 0.01 0.01 0.00 0.00 0.00 0.00
Oct-11 7.82 0.41 20.60 1.08 4.55 4.55 0.01 0.01 0.00 0.00 0.00 0.00
Nov-11 6.44 0.40 16.40 1.03 0.00 0.00 0.00 0.00 0.00 0.00 0.00 0.00
Dec-11 17.40 0.92 7.30 0.38 9.10 0.48 0.02 0.00 0.00 0.00 0.00 0.00
TOTAL 82.62 0.39 224.62 1.05 40.75 0.28 0.07 0.00 0.00 0.00 0.00 0.00
MarketCapitalization(US$ millions) Index
Jan-11 5,189.90 39Feb-11 5,143.47 170Mar-11 5,095.37 117Apr-11 5,148.40 131
May-11 5,119.16 34Jun-11 5,091.78 22Jul-11 5,063.10 116
Aug-11 5,030.65 64Sep-11 5,236.08 185Oct-11 4,997.21 94Nov-11 5,081.10 99Dec-11 5,065.44 602
FEDERATION OF EURO-ASIAN STOCK EXCHANGES ANNUAL REPORT JUNE 2012
PAGE 115
“TOSHKENT” REPUBLICAN STOCK EXCHANGE
Key Information ContactsState Property Committee www.spc.gov.uzMinistry of Finance www.mf.uz/engNational Bank of Uzbekistan http://eng.nbu.com/about/history/index.phpState Central Securities Depository www.deponet.uz/english.shtmlPortal of the State Authority www.gov.uz/en
Despite the global recession and economic contraction among its major trading partners, Uzbekistan continued its strong economic performance in 2009 with GDP growth of 8.1%. The economy was affected by the recession through weaker external demand and lower remittance inflows.
The government responded to the recession early with a large-scale anticrisis program for 2009–2012, which was adopted at end-2008. Measures included substantial public infrastructure investment, tax preferences to exporting industries and small and medium-sized enterprises, increases in public sector wages, and recapitalization of commercial banks. The program was financed through the government budget, state-owned enterprises (SOEs), and the Fund for Reconstruction and Development (FRD), a sovereign wealth management fund established in 2006. Healthy budget revenues and good export performance of gold and natural gas supported the program’s implementation. As a result, GDP growth was sustained by output gains in industry, including construction (11.2%) and services (14.0%). Nonconstruction industrial growth is attributable to increased production of hydrocarbons, machinery, and chemicals, which together accounted for 42% of total industrial production. These three subsectors combined posted growth of 13.1%. The performance of other industrial subsectors was more modest, with the output of nonferrous metallurgy (mainly gold, silver, and copper) growing by 2.6%.
Within industry, construction shot up by 33.1%. This gain was driven primarily by an increase in fixed capital investment. According to official data, such investment rose by 24.8% in 2009. Construction output was lifted by public infrastructure development projects in rural areas. Notable sources of construction demand were large SOEs under government-led sector modernization and renovation programs (primarily manufacturing and mining). The share of fixed capital investment in GDP increased from 23.0% in 2008 to an estimated 26.1% in 2009. Rapidly growing telecommunications and financial markets were one of the major contributors to growth in services: mobile subscriber numbers have increased 10-fold in less than 4 years. The financial services market is growing fast in areas of microfinancing and bank debit card processing. In response to rising demand for credit from microenterprises, especially in rural areas, the volume of microfinance lending reached US$ 200 million in 2009.
The government reported that foreign direct investment in 2009 increased by 80% from 2008. The bulk of the increase came from expansion of activities in the hydrocarbons and communications sectors. In December 2008, the government established the first free industrialeconomic zone in the Navoi region (FIEZ Navoi), which provides tax and customs preferential facilities for foreign investors. By end-2009, the government had signed 37 investment agreements with various foreign investors for FIEZ Navoi amounting to more than US$ 500 million. The first investment outlays are expected this year.
The latest estimate of the year-average consumer price index by the International Monetary Fund is 12.5%. Broad money growth is estimated at 34.0% in 2009. The depreciation of the local currency supported exports. Sharp falls in the Kazakhstan tenge and Russian ruble against their respective major trade partners added downward pressure on the nominal exchange rate. The main elements of the anticrisis program implemented through fiscal policy were recapitalization of commercial banks to support lending; increased public infrastructure development to support job creation; and tax exemptions to support exporting industries and small and mediumsized enterprises. The government also increased public sector wages by 40% on average in 2009. These expenditures were offset by strong revenue receipts stemming from high export prices (especially for gold and gas) and tax reforms. The general government budget is estimated to have posted a surplus of 0.2% of GDP in 2009. Including the FRD, the consolidated budget surplus is estimated at 4.4% of GDP
The crisis had impacts on exports and remittances. Exports to Uzbekistan’s main markets, namely Kazakhstan, the Russian Federation, and Ukraine, and remittances from Kazakhstan and the Russian Federation, were heavily affected. Nonhydrocarbon exports contracted by 11% in 2009. Machinery (with a 61% decrease to US$ 341 million) and cotton (a 6% drop to US$ 1.0 billion) were among the worst hit, but their lower export revenues were offset by strong global demand for gold and income from natural gas sales to the Russian Federation (the largest customer). Hydrocarbon
CAPITAL MARKET DEVELOPMENT AND ECONOMIC OUTLOOK
FEDERATION OF EURO-ASIAN STOCK EXCHANGES ANNUAL REPORT JUNE 2012
PAGE 116
“TOSHKENT” REPUBLICAN STOCK EXCHANGE
exports increased by 41% to US$ 4.0 billion. With the gold and gas prices hitting records, export revenue increased by about 2.0% relative to 2008. The growth of imports is estimated at 25.8% in 2009. As in past years, machinery and equipment were the largest import items, reflecting infrastructure development. The sharp fall in export growth, increased imports, and lower remittances cut the current account surplus to an estimated 12.0% of GDP at end-2009, down from 16.7% in 2008
In the framework of its anticrisis program for 2009–2012, the government will continue its infrastructure development initiatives as well as sector modernization programs. This implies significant investment commitments, most of which will be financed by domestic banks, the FRD, and SOEs. Domestic investments by SOEs will be geared toward the hydrocarbon, energy, chemical, and transport sectors. Foreign direct investment will also provide important financing for investment. The government’s investment program envisages a US$ 2.4 billion inflow of foreign direct investment in 2010, out of which US$ 2.0 billion will be directed to hydrocarbons. In April 2009, the national oil and gas company, Uzbekneftegaz, established a US$ 2.5 billion international joint venture to produce gas-to-liquid synthetic fuel.
Due to the active industrial policy, foreign investments are expected to increase steadily in the near future. At FIEZ Navoi, 16 investment projects for a total amount of US$ 200 million are forecast to start in 2010. A major part of the foreign investment is expected to be from Asia and the Middle East. The government plans to attract about US$ 1.0 billion of investment into FIEZ Navoi in the medium term. It has supported the private sector through reductions in rates of unified and fixed taxes, as well as value-added tax refunds and soft loans through commercial banks for exporters.
Economic ProspectsDue to the economic recovery of the major trading partners as well as the government’s active industrial policies, improved export performance and higher investment inflows are expected to be major drivers of growth in the forecast period (at 8.5% and 9.0%). International prices for Uzbekistan’s major export commodities look favorable in 2010 and 2011
The downside risks to these forecasts lie in external factors related to the situations in the main trading partners, as well as persistent fundamental imbalances in industrial countries. On the domestic side, timely implementation of the investment program and continued efforts on sector modernization would ensure intended outcomes of the government’s anticrisis program. Well-designed public and private investment, including commercial bank lending, will benefit a broader population through improved access to credit and increased employment opportunities.
The government will continue increasing its social and infrastructure expenditures while broadening the tax base and reducing tax rates. The 2010 budget, approved by Parliament at end-December 2009, envisages increasing these expenditures to 13.5% of GDP in 2010, up from an estimated 11.5% in 2009. The rates of both corporate and personal income taxes will be decreased to stimulate business investment and private consumption. The corporate and personal income tax rates will fall by 1 percentage point to bring rates to 9% for corporations, 8% for small businesses, and 11% for individuals.
The revenue will be sustained by the recovery in international commodity prices for certain exports that weakened in 2009, counterbalancing the increasing expenditures. The consolidated budget, including the FRD, is seen posting a surplus of 5.5% of GDP in 2010 and 6.5% of GDP in 2011.
Investment will also be boosted by increased bank lending and FRD resources. The banking sector increased its lending to small businesses by 50% in 2009, and this trend is expected to continue in 2010 and 2011 in light of significant demand for small and micro-lending. A new direction in the investment activities will be residential construction. The rural residential housing construction program for 2010 plans to allocate up to SUM588.7 billion ($390 million) for this purpose. A large portion of funding will come from the new Rural Construction Bank, established in 2009, in which the government is the majority shareholder. Strong external demand and rising exports will stimulate growth in net foreign assets and the money supply, creating inflation pressures that will be boosted by the large increases in public sector wages. It is expected that nominal depreciation of the sum will be gradual. Thus, fully sterilizing the excess liquidity from the large foreign exchange inflows may be a challenge. As a result of these factors, the government forecasts inflation at about 9% in 2010–2011.
The gradual recovery of the global economy and expected growth of world trade will underpin the current account surplus. The country will benefit from the international prices of its main export commodities, which will stay high on rebound.
Export gains will be partly offset by rising imports. Import growth will be determined mainly by demand for inputs into modernization of manufacturing and public infrastructure development, and by higher global commodity prices. The current account surplus is forecast at 13.0% in 2010 and 14.0% in 2011.
Information obtained from the Exchange.
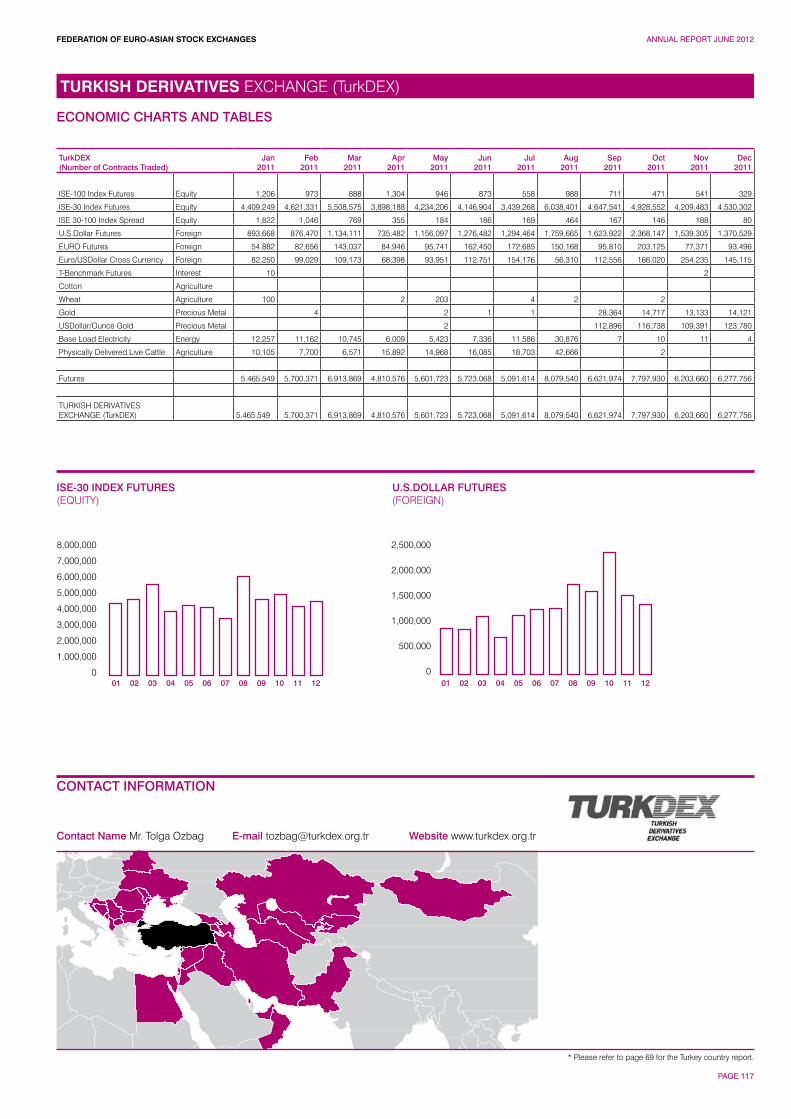
FEDERATION OF EURO-ASIAN STOCK EXCHANGES ANNUAL REPORT JUNE 2012
PAGE 117
TURKISH DERIVATIVES EXCHANGE (TurkDEX)
U.S.DOLLAR FUTURES(FOREIGN)
2,500,000
2,000,000
1,500,000
1,000,000
500,000
00201 03 04 05 06 07 08 09 10 11 12
Contact Name Mr. Tolga Ozbag E-mail [email protected] Website www.turkdex.org.tr
CONTACT INFORMATION
ECONOMIC CHARTS AND TABLES
TurkDEX (Number of Contracts Traded)
Jan 2011
Feb 2011
Mar 2011
Apr 2011
May 2011
Jun 2011
Jul 2011
Aug 2011
Sep 2011
Oct 2011
Nov 2011
Dec 2011
ISE-100 Index Futures Equity 1,206 973 888 1,304 946 873 558 988 711 471 541 329
ISE-30 Index Futures Equity 4,409,249 4,621,331 5,508,575 3,898,188 4,234,206 4,146,904 3,439,268 6,038,401 4,647,541 4,928,552 4,209,483 4,530,302
ISE 30-100 Index Spread Equity 1,822 1,046 769 355 184 186 169 464 167 146 188 80
U.S.Dollar Futures Foreign 893,668 876,470 1,134,111 735,482 1,156,097 1,276,482 1,294,464 1,759,665 1,623,922 2,368,147 1,539,305 1,370,529
EURO Futures Foreign 54,882 82,656 143,037 84,946 95,741 162,450 172,685 150,168 95,810 203,125 77,371 93,496
Euro/USDollar Cross Currency Foreign 82,250 99,029 109,173 68,398 93,951 112,751 154,176 56,310 112,556 166,020 254,235 145,115
T-Benchmark Futures Interest 10 2
Cotton Agriculture
Wheat Agriculture 100 2 203 4 2 2
Gold Precious Metal 4 2 1 1 28,364 14,717 13,133 14,121
USDollar/Ounce Gold Precious Metal 2 112,896 116,738 109,391 123,780
Base Load Electricity Energy 12,257 11,162 10,745 6,009 5,423 7,336 11,586 30,876 7 10 11 4
Physically Delivered Live Cattle Agriculture 10,105 7,700 6,571 15,892 14,968 16,085 18,703 42,666 2
Futures 5,465,549 5,700,371 6,913,869 4,810,576 5,601,723 5,723,068 5,091,614 8,079,540 6,621,974 7,797,930 6,203,660 6,277,756
TURKISH DERIVATIVES EXCHANGE (TurkDEX) 5.465.549 5,700,371 6,913,869 4,810,576 5,601,723 5,723,068 5,091,614 8,079,540 6,621,974 7,797,930 6,203,660 6,277,756
ISE-30 INDEX FUTURES(EQUITY)
8,000,000
7,000,000
6,000,000
5,000,000
4,000,000
3,000,000
2,000,000
1,000,000
00201 03 04 05 06 07 08 09 10 11 12
* Please refer to page 69 for the Turkey country report.
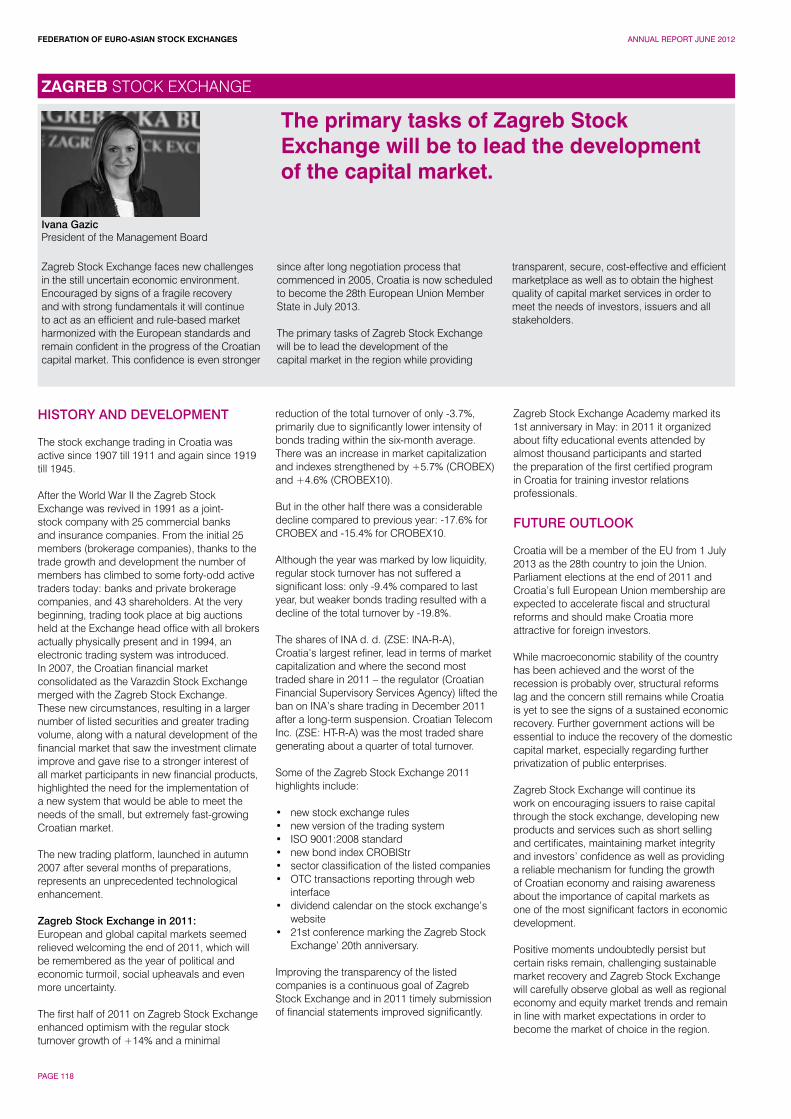
FEDERATION OF EURO-ASIAN STOCK EXCHANGES ANNUAL REPORT JUNE 2012
PAGE 118
HISTORY AND DEVELOPMENT
The stock exchange trading in Croatia was active since 1907 till 1911 and again since 1919 till 1945.
After the World War II the Zagreb Stock Exchange was revived in 1991 as a joint-stock company with 25 commercial banks and insurance companies. From the initial 25 members (brokerage companies), thanks to the trade growth and development the number of members has climbed to some forty-odd active traders today: banks and private brokerage companies, and 43 shareholders. At the very beginning, trading took place at big auctions held at the Exchange head office with all brokers actually physically present and in 1994, an electronic trading system was introduced.In 2007, the Croatian financial market consolidated as the Varazdin Stock Exchange merged with the Zagreb Stock Exchange. These new circumstances, resulting in a larger number of listed securities and greater trading volume, along with a natural development of the financial market that saw the investment climate improve and gave rise to a stronger interest of all market participants in new financial products, highlighted the need for the implementation of a new system that would be able to meet the needs of the small, but extremely fast-growing Croatian market.
The new trading platform, launched in autumn 2007 after several months of preparations, represents an unprecedented technological enhancement.
Zagreb Stock Exchange in 2011:European and global capital markets seemed relieved welcoming the end of 2011, which will be remembered as the year of political and economic turmoil, social upheavals and even more uncertainty.
The first half of 2011 on Zagreb Stock Exchange enhanced optimism with the regular stock turnover growth of +14% and a minimal
reduction of the total turnover of only -3.7%, primarily due to significantly lower intensity of bonds trading within the six-month average. There was an increase in market capitalization and indexes strengthened by +5.7% (CROBEX) and +4.6% (CROBEX10).
But in the other half there was a considerable decline compared to previous year: -17.6% for CROBEX and -15.4% for CROBEX10.
Although the year was marked by low liquidity, regular stock turnover has not suffered a significant loss: only -9.4% compared to last year, but weaker bonds trading resulted with a decline of the total turnover by -19.8%.
The shares of INA d. d. (ZSE: INA-R-A), Croatia’s largest refiner, lead in terms of market capitalization and where the second most traded share in 2011 – the regulator (Croatian Financial Supervisory Services Agency) lifted the ban on INA’s share trading in December 2011 after a long-term suspension. Croatian Telecom Inc. (ZSE: HT-R-A) was the most traded share generating about a quarter of total turnover.
Some of the Zagreb Stock Exchange 2011 highlights include:
• new stock exchange rules • new version of the trading system • ISO 9001:2008 standard • new bond index CROBIStr • sector classification of the listed companies • OTC transactions reporting through web
interface • dividend calendar on the stock exchange’s
website• 21st conference marking the Zagreb Stock
Exchange’ 20th anniversary.
Improving the transparency of the listed companies is a continuous goal of Zagreb Stock Exchange and in 2011 timely submission of financial statements improved significantly.
Zagreb Stock Exchange Academy marked its 1st anniversary in May: in 2011 it organized about fifty educational events attended by almost thousand participants and started the preparation of the first certified program in Croatia for training investor relations professionals.
FUTURE OUTLOOK
Croatia will be a member of the EU from 1 July 2013 as the 28th country to join the Union. Parliament elections at the end of 2011 and Croatia’s full European Union membership are expected to accelerate fiscal and structural reforms and should make Croatia more attractive for foreign investors.
While macroeconomic stability of the country has been achieved and the worst of the recession is probably over, structural reforms lag and the concern still remains while Croatia is yet to see the signs of a sustained economic recovery. Further government actions will be essential to induce the recovery of the domestic capital market, especially regarding further privatization of public enterprises.
Zagreb Stock Exchange will continue its work on encouraging issuers to raise capital through the stock exchange, developing new products and services such as short selling and certificates, maintaining market integrity and investors’ confidence as well as providing a reliable mechanism for funding the growth of Croatian economy and raising awareness about the importance of capital markets as one of the most significant factors in economic development.
Positive moments undoubtedly persist but certain risks remain, challenging sustainable market recovery and Zagreb Stock Exchange will carefully observe global as well as regional economy and equity market trends and remain in line with market expectations in order to become the market of choice in the region.
Ivana GazicPresident of the Management Board
Zagreb Stock Exchange faces new challenges in the still uncertain economic environment. Encouraged by signs of a fragile recovery and with strong fundamentals it will continue to act as an efficient and rule-based market harmonized with the European standards and remain confident in the progress of the Croatian capital market. This confidence is even stronger
since after long negotiation process that commenced in 2005, Croatia is now scheduled to become the 28th European Union Member State in July 2013.
The primary tasks of Zagreb Stock Exchange will be to lead the development of the capital market in the region while providing
transparent, secure, cost-effective and efficient marketplace as well as to obtain the highest quality of capital market services in order to meet the needs of investors, issuers and all stakeholders.
The primary tasks of Zagreb Stock Exchange will be to lead the development of the capital market.
ZAGREB STOCK EXCHANGE
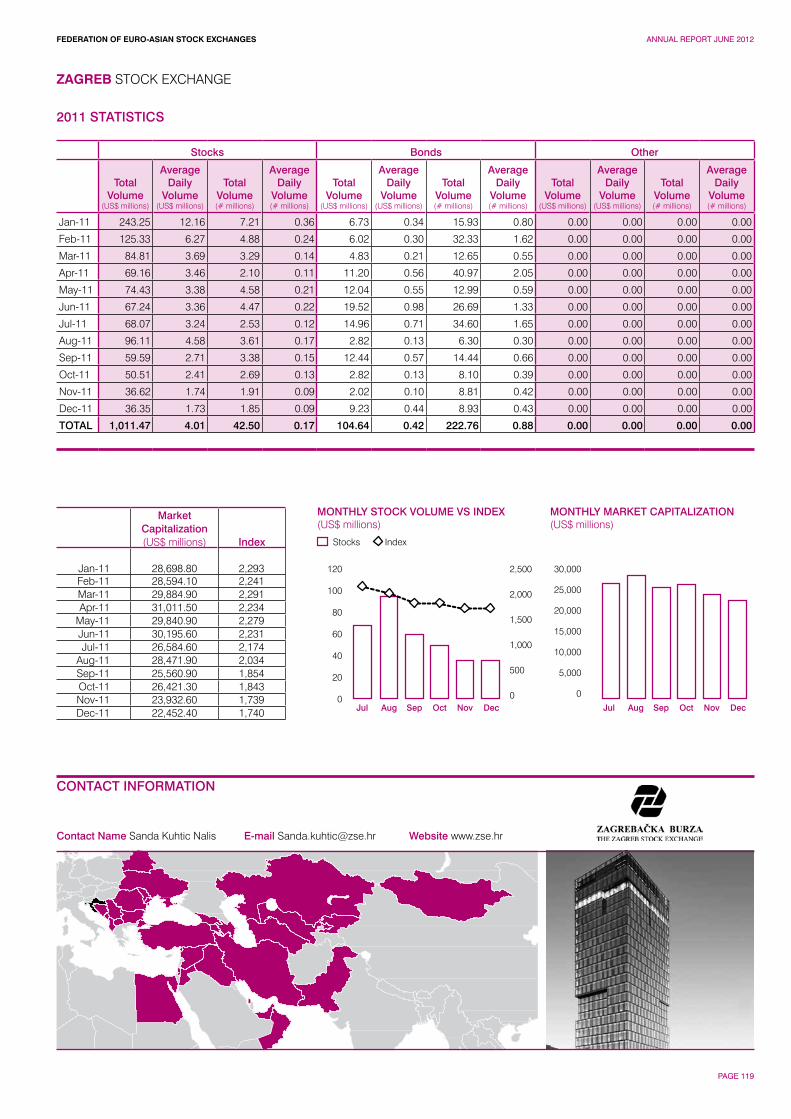
FEDERATION OF EURO-ASIAN STOCK EXCHANGES ANNUAL REPORT JUNE 2012
PAGE 119
Contact Name Sanda Kuhtic Nalis E-mail [email protected] Website www.zse.hr
ZAGREB STOCK EXCHANGE
CONTACT INFORMATION
MONTHLY MARKET CAPITALIZATION(US$ millions)
120
100
80
60
40
20
0
2,500
2,000
1,500
1,000
500
0
30,000
25,000
20,000
15,000
10,000
5,000
0
Stocks
MONTHLY STOCK VOLUME VS INDEX(US$ millions)
Index
Jul JulAug AugSep SepOct OctNov NovDec Dec
2011 STATISTICS
Stocks Bonds Other
Total Volume
(US$ millions)
Average Daily
Volume(US$ millions)
Total Volume(# millions)
Average Daily
Volume(# millions)
Total Volume
(US$ millions)
Average Daily
Volume(US$ millions)
Total Volume(# millions)
Average Daily
Volume(# millions)
Total Volume
(US$ millions)
Average Daily
Volume(US$ millions)
Total Volume(# millions)
Average Daily
Volume(# millions)
Jan-11 243.25 12.16 7.21 0.36 6.73 0.34 15.93 0.80 0.00 0.00 0.00 0.00
Feb-11 125.33 6.27 4.88 0.24 6.02 0.30 32.33 1.62 0.00 0.00 0.00 0.00
Mar-11 84.81 3.69 3.29 0.14 4.83 0.21 12.65 0.55 0.00 0.00 0.00 0.00
Apr-11 69.16 3.46 2.10 0.11 11.20 0.56 40.97 2.05 0.00 0.00 0.00 0.00
May-11 74.43 3.38 4.58 0.21 12.04 0.55 12.99 0.59 0.00 0.00 0.00 0.00
Jun-11 67.24 3.36 4.47 0.22 19.52 0.98 26.69 1.33 0.00 0.00 0.00 0.00
Jul-11 68.07 3.24 2.53 0.12 14.96 0.71 34.60 1.65 0.00 0.00 0.00 0.00
Aug-11 96.11 4.58 3.61 0.17 2.82 0.13 6.30 0.30 0.00 0.00 0.00 0.00
Sep-11 59.59 2.71 3.38 0.15 12.44 0.57 14.44 0.66 0.00 0.00 0.00 0.00
Oct-11 50.51 2.41 2.69 0.13 2.82 0.13 8.10 0.39 0.00 0.00 0.00 0.00
Nov-11 36.62 1.74 1.91 0.09 2.02 0.10 8.81 0.42 0.00 0.00 0.00 0.00
Dec-11 36.35 1.73 1.85 0.09 9.23 0.44 8.93 0.43 0.00 0.00 0.00 0.00
TOTAL 1,011.47 4.01 42.50 0.17 104.64 0.42 222.76 0.88 0.00 0.00 0.00 0.00
MarketCapitalization(US$ millions) Index
Jan-11 28,698.80 2,293Feb-11 28,594.10 2,241Mar-11 29,884.90 2,291Apr-11 31,011.50 2,234
May-11 29,840.90 2,279Jun-11 30,195.60 2,231Jul-11 26,584.60 2,174
Aug-11 28,471.90 2,034Sep-11 25,560.90 1,854Oct-11 26,421.30 1,843Nov-11 23,932.60 1,739Dec-11 22,452.40 1,740
FEDERATION OF EURO-ASIAN STOCK EXCHANGES ANNUAL REPORT JUNE 2012
PAGE 120
In the period until 1 July 2013 all EU member states are to ratify the Treaty finally making Croatia an EU member state. After winning the parliamentary elections on 4 December, the centre-left coalition formed the Government, having sat on opposition benches for eight years. The new Government faces a heavy task of curbing economic recovery amid unfavourable developments in the environment.
In Q1 2012 we expect investors to focus primarily on news from the economic and political scene, to be more exact, developments in the euro area, and to a lesser degree on companies’ fundamentals. Macroeconomic outlook for the majority of CEE countries is not rosy (except for Poland) due to their high dependence on exports to euro area markets. Therefore, equity markets will not receive support from this side. Despite relatively favourable internal factors of some markets, we expect the external influences to prevail, pushing down all indices in the region.
Risk aversion and investor reluctance fuelled by the European debt crisis is expected to continue in the domestic market in 2012. Therefore, we do not expect significant changes or increase in turnover until the improvement in the economic situation occurs. Investors will surely monitor all the moves of the new Government. The possible privatisations of state-owned companies due to the public finance situation could bring some life and optimism to the Zagreb Stock Exchange in 2012, provided they are carried out through the stock exchange.*
* Raiffeisenbank Austria d.d.
Economic Research Department
ZAGREB STOCK EXCHANGE
Key Information ContactsCroatian Agency for Supervision of Financial Services www.hanfa.hrMinistry of Finance www.mfin.hrCroatian Government www.vlada.hrCroatian National Bank www.hnb.hr
CAPITAL MARKET DEVELOPMENT AND ECONOMIC OUTLOOK
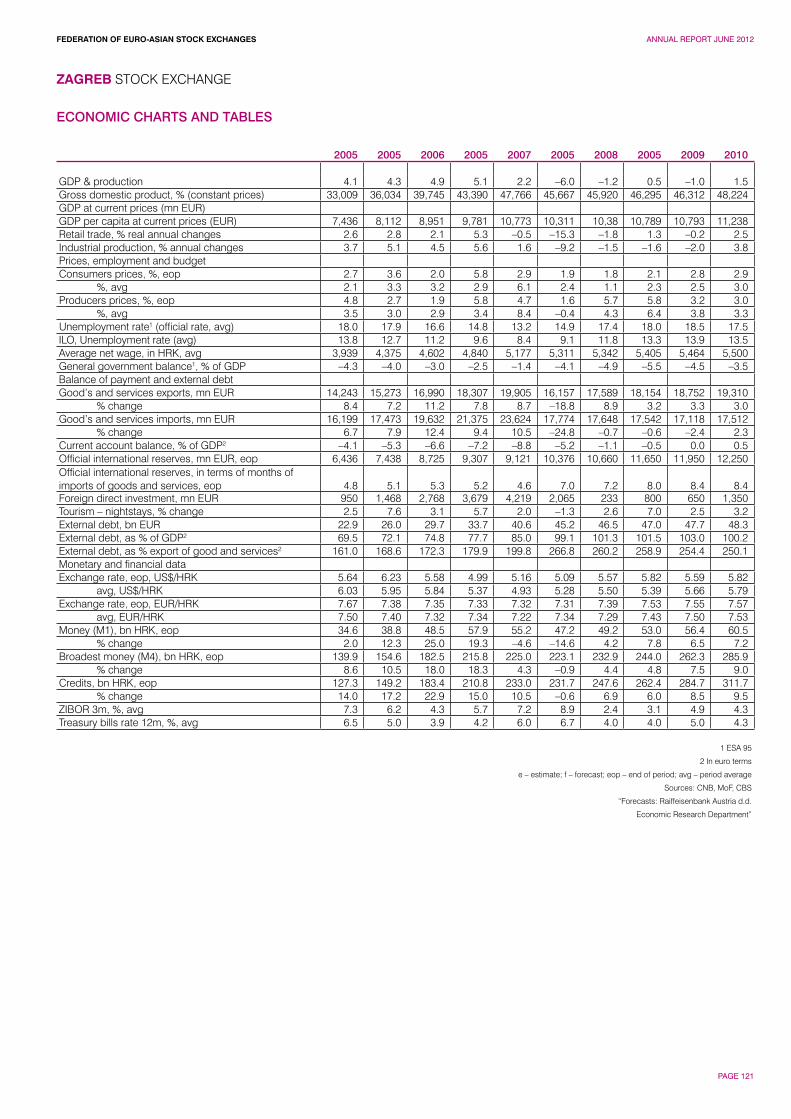
FEDERATION OF EURO-ASIAN STOCK EXCHANGES ANNUAL REPORT JUNE 2012
PAGE 121
ZAGREB STOCK EXCHANGE
ECONOMIC CHARTS AND TABLES
2005 2005 2006 2005 2007 2005 2008 2005 2009 2010
GDP & production 4.1 4.3 4.9 5.1 2.2 –6.0 –1.2 0.5 –1.0 1.5Gross domestic product, % (constant prices) 33,009 36,034 39,745 43,390 47,766 45,667 45,920 46,295 46,312 48,224GDP at current prices (mn EUR) GDP per capita at current prices (EUR) 7,436 8,112 8,951 9,781 10,773 10,311 10,38 10,789 10,793 11,238Retail trade, % real annual changes 2.6 2.8 2.1 5.3 –0.5 –15.3 –1.8 1.3 –0.2 2.5Industrial production, % annual changes 3.7 5.1 4.5 5.6 1.6 –9.2 –1.5 –1.6 –2.0 3.8Prices, employment and budgetConsumers prices, %, eop 2.7 3.6 2.0 5.8 2.9 1.9 1.8 2.1 2.8 2.9
%, avg 2.1 3.3 3.2 2.9 6.1 2.4 1.1 2.3 2.5 3.0Producers prices, %, eop 4.8 2.7 1.9 5.8 4.7 1.6 5.7 5.8 3.2 3.0
%, avg 3.5 3.0 2.9 3.4 8.4 –0.4 4.3 6.4 3.8 3.3Unemployment rate1 (official rate, avg) 18.0 17.9 16.6 14.8 13.2 14.9 17.4 18.0 18.5 17.5ILO, Unemployment rate (avg) 13.8 12.7 11.2 9.6 8.4 9.1 11.8 13.3 13.9 13.5Average net wage, in HRK, avg 3,939 4,375 4,602 4,840 5,177 5,311 5,342 5,405 5,464 5,500General government balance1, % of GDP –4.3 –4.0 –3.0 –2.5 –1.4 –4.1 –4.9 –5.5 –4.5 –3.5Balance of payment and external debtGood’s and services exports, mn EUR 14,243 15,273 16,990 18,307 19,905 16,157 17,589 18,154 18,752 19,310
% change 8.4 7.2 11.2 7.8 8.7 –18.8 8.9 3.2 3.3 3.0Good’s and services imports, mn EUR 16,199 17,473 19,632 21,375 23,624 17,774 17,648 17,542 17,118 17,512
% change 6.7 7.9 12.4 9.4 10.5 –24.8 –0.7 –0.6 –2.4 2.3Current account balance, % of GDP2 –4.1 –5.3 –6.6 –7.2 –8.8 –5.2 –1.1 –0.5 0.0 0.5Official international reserves, mn EUR, eop 6,436 7,438 8,725 9,307 9,121 10,376 10,660 11,650 11,950 12,250Official international reserves, in terms of months of imports of goods and services, eop 4.8 5.1 5.3 5.2 4.6 7.0 7.2 8.0 8.4 8.4Foreign direct investment, mn EUR 950 1,468 2,768 3,679 4,219 2,065 233 800 650 1,350Tourism – nightstays, % change 2.5 7.6 3.1 5.7 2.0 –1.3 2.6 7.0 2.5 3.2External debt, bn EUR 22.9 26.0 29.7 33.7 40.6 45.2 46.5 47.0 47.7 48.3External debt, as % of GDP2 69.5 72.1 74.8 77.7 85.0 99.1 101.3 101.5 103.0 100.2External debt, as % export of good and services2 161.0 168.6 172.3 179.9 199.8 266.8 260.2 258.9 254.4 250.1Monetary and financial dataExchange rate, eop, US$/HRK 5.64 6.23 5.58 4.99 5.16 5.09 5.57 5.82 5.59 5.82
avg, US$/HRK 6.03 5.95 5.84 5.37 4.93 5.28 5.50 5.39 5.66 5.79Exchange rate, eop, EUR/HRK 7.67 7.38 7.35 7.33 7.32 7.31 7.39 7.53 7.55 7.57
avg, EUR/HRK 7.50 7.40 7.32 7.34 7.22 7.34 7.29 7.43 7.50 7.53Money (M1), bn HRK, eop 34.6 38.8 48.5 57.9 55.2 47.2 49.2 53.0 56.4 60.5
% change 2.0 12.3 25.0 19.3 –4.6 –14.6 4.2 7.8 6.5 7.2Broadest money (M4), bn HRK, eop 139.9 154.6 182.5 215.8 225.0 223.1 232.9 244.0 262.3 285.9
% change 8.6 10.5 18.0 18.3 4.3 –0.9 4.4 4.8 7.5 9.0Credits, bn HRK, eop 127.3 149.2 183.4 210.8 233.0 231.7 247.6 262.4 284.7 311.7
% change 14.0 17.2 22.9 15.0 10.5 –0.6 6.9 6.0 8.5 9.5ZIBOR 3m, %, avg 7.3 6.2 4.3 5.7 7.2 8.9 2.4 3.1 4.9 4.3Treasury bills rate 12m, %, avg 6.5 5.0 3.9 4.2 6.0 6.7 4.0 4.0 5.0 4.3
1 ESA 95
2 In euro terms
e – estimate; f – forecast; eop – end of period; avg – period average
Sources: CNB, MoF, CBS
“Forecasts: Raiffeisenbank Austria d.d.
Economic Research Department”
FEDERATION OF EURO-ASIAN STOCK EXCHANGES ANNUAL REPORT JUNE 2012
PAGE 122
AFFILIATE MEMBER PROFILES
Central Registry Agency Inc. 123
Central Securities Depository of Iran 124
Macedonian Central Securities Depository 125
Misr for Clearing, Settlement & Central Depository 126
National Depository Center of Azerbaijan 127
Securities and Exchange Brokers Association of Iran (SEBA) 128
Securities Depository Center (SDC) of Jordan 129
Swiss Futures Options Associations (SFOA) 130
Takasbank - Ise Settlement and Custody Bank, Inc. 131
Tehran Securities Exchange Technology Management Company (TSETMC) 132
The Association of Capital Market Intermediary Institutions of Turkey (TSPAKB) 133
The South Asian Federation of Exchanges (SAFE) 134
FEDERATION OF EURO-ASIAN STOCK EXCHANGES ANNUAL REPORT JUNE 2012
PAGE 123
HISTORY AND DEVELOPMENT
CRA was established in accordance with the Article 10/A of the Turkish Capital Markets Law in 2001 as the central depository for and registrar of dematerialized capital market instruments and rights affixed thereon with respect to issuers, intermediary institutions, and beneficial owners. As of 2011, equities traded at the Istanbul Stock Exchange, mutual funds, exchange traded funds, corporate bonds, bank bills, warrants, covered bonds and asset backed securities were dematerialized on the CRA platform.
All depository operations regarding dematerialized capital market instruments (e.g. opening of investor accounts, corporate actions, and securities issues) are conducted by CRA participants via the Central Dematerialization System software, CDS, a proprietary software developed in-house. CRA also acts as the securities agent for on-exchange settlements of equities traded at the ISE and real time DVP settlements of equities for Securities Lending and Borrowing facility of Takasbank through the integrated system with Takasbank.
CRA also manages and represents the Investors Protection Fund, an investor protection scheme against obligations arising from equities transactions of intermediary institutions and banks for which a liquidation or bankruptcy decision is made by regulatory authorities.
Form of SecuritiesDematerialized.
Legal StatusJoint stock company.
Type of Commercial EntityFor-profit, user-owned joint stock company.
Regulated byCRA’s overall functions are subject to the oversight and approval of the CMB.
Size of the Investors Protection FundUS$ 117 million (approx. as of year-end)
Ownership30% Istanbul Stock Exchange (ISE)64.9% ISE Settlement and Custody Bank (Takasbank)5% The Association of Capital Market Intermediary Institutions of Turkey (TSPAKB) 0.1% Istanbul Gold Exchange (IGE)
Board of Directors: 7 MembersThe Capital Markets Board of Turkey (CMB): 1 (Chairman)ISE: 2Takasbank: 2TSPAKB: 1CRA: 1 (CEO of CRA)
Memberships to International OrganizationsEuropean Central Securities Depositories Association (ECSDA)International Securities Services Association (ISSA)Federation of Euro-Asian Stock Exchange (FEAS)
FUTURE OUTLOOK
In 2012 CRA plans to achieve the following:• The next phases of the e-GOVERNANCE
Portal, which will support and provide applications such as blogs, enhanced
agendas, improved surveys, electronic proxy delegation and voting, electronic general assembly meetings and investor meetings will be put into service.
• Analyses on the e-GENERAL ASSEMBLY MEETING project were completed in 2011. According to the newly adopted legislation, The Electronic General Assembly Meeting System (EGAMS) will be launched in July 2012.
• The e-DATA WAREHOUSE project, which will establish CRA as the single data warehouse and distributor of detailed capital markets data on an investor basis, is planned to be finalized in the second half of 2012.
• The electronic safekeeping of dematerialized warehouse receipts in the CDS will go live following the regulations of the Ministry of Customs and Commerce.
• CRA will finalize the dematerialization process for the Turkish Government Debt Securities in July 2012 with respect to the official decision of the CMB.
• The first phase of the Public Disclosure Platform (PDP) - Central Dematerialized System (CDS) Integration Project, which will enable straight through processing of corporate actions notifications (issuer-to-investor) in SWIFT formats, will be completed in 2012.
• Introduction of pre-matching in FOP settlement of transactions.
Dr. Yakup ErgincanCEO and Board Member
2011 was a difficult year for the world economy. Sovereign debt problems in the Eurozone countries, rating downgrades of developed economies such as the USA and France, and political developments in the Middle East together created a dismal global economic environment. But the Turkish economy decoupled itself from the global turmoil with high growth and relatively strong fundamentals of capital markets.
One of the most significant developments in the Turkish post-trade sector was the reductions in custody and corporate actions related service
fees by CRA. We believe that the changes will dramatically increase cost efficiency in the post-trade infrastructure.
In 2011, the first foreign currency denominated private sector debt instrument, the first covered bond and the first asset backed security were issued in dematerialized form through CRA. CRA launched the first phase of its pioneering e-GOVERNANCE portal and continued working on adjacent projects such as the e-GENERAL ASSEMBLY and e-COMPANY platforms in 2011. The projects, when finalized, will improve the level of corporate governance by enhancing issuer-shareholder relations, and CRA will
become one of the most advanced CSDs in the world in issuer and investor services.
In parallel to these projects a databank project was started for the gathering and distribution of detailed capital markets data. Furthermore, CRA increased the pace of the system integration project between the Central Dematerialized System and the Public Disclosure Platform (PDP).
CRA will continue to contribute towards making Istanbul an international financial centre by facilitating one of the safest and most efficient capital infrastructures in the world.
One of the most significant developments in the Turkish post-trade sector was the reductions in custody and corporate actions related service fees by CRA.
CENTRAL REGISTRY AGENCY INC.
Contact Name Mr. Ozgur Uysal E-mail [email protected] Website www.mkk.com.tr
CONTACT INFORMATION
* Please refer to page 69 for the Turkey country report.
FEDERATION OF EURO-ASIAN STOCK EXCHANGES ANNUAL REPORT JUNE 2012
PAGE 124
OBJECTIVESThe objectives for which the company is established are:
1. Opening and custody of funds/securities accounts related to stock exchange, over the counter market, commodity exchange belonging to brokers, shareholders and other financial institutions, real or legal persons.
2. Registration, encoding, custody, clearing and settlement of trade transactions on stock exchange, commodity exchange and other financial tools.
3. Depositing different kind of securities in company’s operating system.
4. Depositing Pledged securities for real and legal entities and release of the pledge on the beneficiaries demands.
5. Borrowing, lending and exchange of securities as a mediator.
6. Providing and performing latest essential information for shareholders and brokers.
7. Applying suitable electronic systems on clearing and settlements.
8. Handling corporate actions for joint stock companies including:
A. Registration and custody of shareholders’ names and records and give necessary services to the issuers of securities.
B. Prepare and present necessary information to the listed companies and their shareholders.
C. Holding general meetings for member companies and over the counter (OTC) market companies.
D. Receiving information about general meetings and informing their investors.
E. Receiving information about dividend, bonus share, right issues and deliver these information to the shareholders.
9. Settlement of funds, Clearing and Depositing of the foreign securities.
10. Presenting professional necessary services to stock exchanges, over the counter market, commodity exchange, the issuer of securities, brokers and other market participants.
11. Providing necessary authorized financial activities also services, consulting and commercial activities in relation with stock exchange, commodity exchange and over the counter market.
12. Cooperating with regional exchanges and related institutions.
13. Changing the method of settlement from the current semi mechanized system to a full mechanized, efficient system through using Real Time Gross Settlement (RTGS).
14. Establishing and managing settlement guarantee funds, also accepting the role of CCP.
15. Providing warehouses and managing their activities for better performance of commodity exchange services.
16. and regulation – Performing other duties which have been or shall be assigned to the company by law.
FUTURE OUTLOOK1. In order to elevate the Capital Market’s
position in Iran’s economy and organize Securities Market, according to Act No. 90 of the fifth development plan, all post-trade services of Iran commodities exchange including cash market, advance purchase, credit also futures and option contracts (which will operate in the commodities exchange in near future), will all be centralized in Central Securities Depository of Iran (CSDI).
2. To increase the efficiency and Straight Through Processing of various post-trade services, Central Securities Depository of Iran is determined to perform the settlement registry and Corporate Actions on a fully electronic and dematerialized basis.
3. CSDI has a pervasive plan under construction on Data Dissemination to provide members and market activists with required information and reports; aiming at facilitating Mobile Trading, Online Trading, and Virtual Trading, the first phase of which has been delivered for online trades.
4. In order to increase functionality and eliminate risks of settlement and operations, CSDI has decided to establish “Professional Bank of Capital Market”, in which Settlement of Trades, various Financial Tools and Corporate Actions Affairs will all be performed.
5. Due to the ever-increasing growth of financial markets followed by an increase in the activities of its fundamental institutions, CSDI intends to acquire a pervasive Software (entrusted to a contractor), to cover the post-trade services of markets in which CSDI is responsible for their Settlement.
6. CSDI which is responsible for clearing & settlement of Tehran Stock Exchange (TSE) and OTC trades, in order to cover settlement risks, has proposed the guarantee fund scheme which will be indispensable after approval of legal authorities. Also CSDI is ready to generalize the guarantee fund to the commodities stock exchange.
7. In addition to the settlement guarantee fund, CSDI will examine feasibility of using other risk management mechanisms and handling clearing members’ default to optimize risk covering mechanisms as well as moving towards becoming a CCP.
8. CSDI is a major shareholder of “Central Asset Management of Capital Market Company” (private joint stock co.) which has been established in the current year. Executive actions of this company in delivering activities of intermediary institutions for financing through Islamic financial tools (Sukuk) will begin the next year.
Alireza Hajinorouzi CEO
Our objective is to guarantee the security and efficiency of Iran’s stock market through developing and improving the settlement procedure of the securities trades via concentrating on increasing the efficiency and reducing the risk and costs.
CENTRAL SECURITIES DEPOSITORY OF IRAN
Contact Name Mr. Alireza Hajinorouzi E-mail [email protected], [email protected] Website www.csdiran.com Address 14, Azhari St., Hafez Ave., Tehran 1134844413Phone +9821 667 49 180 Fax +9821 667 49 257
CONTACT INFORMATION
* Please refer to page 109 for the Iran country report.
FEDERATION OF EURO-ASIAN STOCK EXCHANGES ANNUAL REPORT JUNE 2012
PAGE 125
FUTURE OUTLOOK 2012
The following general goals have guided the Macedonian CSD in the fulfilment of its purpose. It is proposed that they remain unchanged in the 2012 plan period:• Sustain protection of investors, especially
small shareholders, from fraudulent, abusive, and unfair practices in Macedonian securities markets.
• foster the development of fair, efficient, dynamic and competitive securities markets that will provide investment opportunities and access to capital for the benefit of Macedonians in all sectors.
• maintain an efficient, effective, responsive and enforceable regulatory framework that serves and protects market participants in all jurisdictions of Macedonia and balances national harmonization with regional flexibility.
• ensure that Macedonia will participate actively and effectively in international regulatory arrangements and organizations
The primary thrusts in fulfilment of these goals have been largely focused on building both legal framework and technological systems. Progress has been achieved in developing common rules, policies, approaches and systems covering of the following issues:• safety and efficiency;• right of everybody that has submitted
a request and is eligible according to the prescribed requirements to become participant in the Depository operations;
• equality and parity of the participants in the Depository operations and beneficiaries of its services;
• regular notification of the participants in the operations of the Depository and the beneficiaries of its services;
• solving the disputes between the Depository and the participants, issuers and holders, as well as between the participants in an efficient manner and by agreement.
Darinka DamjanovicActing CEO
In years to come, Macedonian Central Securities Depository will focus on introducing new financial instruments in Macedonian Capital Market.
The primary objective of introducing new financial instruments such as municipal bonds is enabling more efficient financing of budget needs of municipalities and in other hand to give new trading material to capital market which is essential in this time of reduced turnover at Macedonian Stock Exchange.
The beginning of the year was marked by first successful Initial Public Offer under new by-laws issued by Securities Exchange Commission. In November 2011 another successful Initial Public Offer took place and another one is in preparation.
Since 1 January 2011, the New Guaranty Fund was established according latest changes in Securities Law, in which 20 members of Macedonian Central Securities Depository contribute with its own assets. Fortunately during 2011 there was no need to activate
funds for purpose of failed transactions. From 2011 new account types were introduced, such as omnibus account. Most of foreign investors are using services of custodian banks, and are opening custodian accounts at CSD.
Macedonian Central Securities Depository will investigate possibilities for integration with other depositories from the region, particularly in the field of cross border settlement with domestic securities which shall be traded on other markets from the region.
Macedonian Central Securities Depository will focus on introducing new financial instruments in Macedonian Capital Market.
MACEDONIAN CENTRAL SECURITIES DEPOSITORY
Contact Name Ms. Sofija Vidovic E-mail [email protected] Website www.cdhv.org.mk
CONTACT INFORMATION
* Please refer to page 83 for the Macedonia country report.
FEDERATION OF EURO-ASIAN STOCK EXCHANGES ANNUAL REPORT JUNE 2012
PAGE 126
Role of the DepositoryMCDR is the sole Egyptian CSD providing clearing and settlement services to the Cairo and Alexandria Stock Exchanges (CASE). MCDR operates as both the depository and the clearing house. It is a not for-profit private company owned by the stock exchanges, local banks and its participants. It was incorporated under the Capital Market Law No 95 of 1992, commenced operations in October 1996 and is currently governed by the Depository and Central Registry Law No 93 of 2000. It is regulated by the Capital Markets Authority (CMA).
Use of the central depository in the market for settlement and safekeeping is compulsory by law, where securities in the depository are held in certificated form. Equities are held via book-entry, with certificates immobilized in MCDR’s vaults. All securities are treated as fungible and may be transferred or pledged by bookkeeping entry without actual physical delivery.
MCDR’s authorized capital is EGP 250 million issued and paid capital is EGP 140 million. MCDR Main Activities & Services 1. Clearing and settlement of operations
executed at the Egyptian Exchange.2. Central depository and registry of all listed
and unlisted securities
3. Management of securities accounts for custodian banks and issuers.
4. Handling corporate actions (cash and stock dividends etc.) according to the issuers’ assemblies’ decisions.
5. Management of the Settlement Guarantee Fund to eliminate suspended movements due to brokers’ defaults (securities and/or cash).
6. Management of a pledge system for all securities lodged into the central depository.
7. Repatriation of international investors’ funds.8. Customer servicing through the MCDR’s
front office, the call center, the Internet, the SMS and finally through direct phones or faxes.
Legal StatusPrivate Joint-Stock Company
Type of Commercial EntityNot for-profit company
Regulated byDepository and Registry law number 93 of year 2000
Form of SecuritiesImmobilized in the book entry form
Form of SettlementNet cash settlement, gross securities settlement
Settlement DatesT+0 Same Day Trading Settlement T+1 Treasury BondsT+2 Dematerialized securitiesT+4 Physical securitiesMisr for Central Clearing, Depository & Registry - MCDR’s achievements through year 2009• MCDR was granted A+ in Thomas Murray
Depository Risks assessments.• MCDR signed a NDA with Linkup Markets to
become a member.• MCDR signed a MoU with JASDEC Japan
for mutual co-operation.• MCDR was granted ISO 27001 which allows
the company to operate an Information Security Management System
• MCDR issued its first Egyptian Depository Receipt
• MCDR was granted the license by Egyptian Financial Supervisory Authority - EFSA to act as a Depository Bank.
• MCDR opened accounts with Clearstream and Eurobank for securities and cash settlements.
Mohamed S. Abdel Salam Chairman & Managing Director
MCDR was established at the end of 1994 to complete the infra structure of the Egyptian capital market. In time, MCDR has become the biggest central registry firm among the major and emerging markets in the world. MCDR’s staff never spare any efforts to maintain the highest standard of services provided to the Egyptian market. As a result of its qualified performance, MCDR was awarded International Star Award for Quality WQC in the Diamond for the Quality standards commitment applied through MCDR on November 26, 2007 in the Concorde La Fayette in Paris with the ISO in
Management (QC100), the International Gold Star for Quality in Geneva in 2001 for significant contribution to the business world, for high standing and professionalism demonstrated by prestigious performance, B.I.D. (Business Initiative Directions) presented its special recognition award to MCDR. Also MCDR was granted the highest level of efficiency, following the results of an assessment panel of depository companies conducted by JPMorgan–Chase, with a score of 1.25 points on a scale of 1 to 3 where depository that closely resemble the best practice is rated 1,
meet some of the requirements but not fully meet the preferred practice rated 2 and finally depositories that are deficient are rated 3.
The assessment revealed that MCDR has abided by all the rules and high standards set by the SEC in Rule 17f-5 which even have been developed to be more tough by amendments in Rule 17f-7 to secure American foreign investments. Secure, stable and encouraging investment environment is the goal of MCDR. This is never enough as MCDR will proceed its stable steps towards the top of elite depositories.
Secure, stable and encouraging investment environment is the goal of MCDR.
MISR FOR CLEARING, SETTLEMENT & CENTRAL DEPOSITORY
Contact Name Mohamed S. Abdel Salam E-mail [email protected] Website www.mcdr.com.egAddress 70 El-Gomhoria St., P.O. Box 1536 Attaba, Cairo, Egypt Phone +2022 5971 505-506-509 Fax +202 5971 670-523
CONTACT INFORMATION
* Please refer to page 55 for the Egypt country report.
FEDERATION OF EURO-ASIAN STOCK EXCHANGES ANNUAL REPORT JUNE 2012
PAGE 127
Brief HistoryThe concept of National Depository System was first introduced in the “State Program of privatization of the state ownership in Azerbaijan Republic 1995-1998”. In accordance with the State Program the Depository System was formed for regulated holding of de-/materialized securities, leading of shareholders registers, registration of owners of securities as well as transactions with them and also for rendering all other depository services. In order to advance the Depository System and its regulatory framework, the presidential degrees “On the National Depository System” and “On the Rules on leading of the shareholder’s registry of the joint-stock companies created during the privatization of the state firms and specialized check investment funds” were adopted in 1997. The creation of the National Depository Center was stipulated by the provisions of “On the National Depository System” regulations.
On the 18 September, 1997 The National Depository Center was created. The National Property Committee acted as a holder of 100% shares of the National Depository Center. The shares of NDC were then handed over to the State Committee for Securities after its creation in 1999. As a result NDC was newly founded by the State Committee for Securities on the 8 September 1999 and passed the national registration on 17 September 1999. The National Depository Center has a license on depository and registrational activities granted by the State
Committee for Securities of the Republic of Azerbaijan.
Since December 22, 2004, the NDC joined the Association of Eurasian Central Securities Depositaries (AECSD) as a full member. On November 17, 2006 the NDC came into global partnership agreement with the Association of National Numbering Agencies (ANNA) and was appointed as a National Numbering Agency. NDC is also member of International Securities Services Association (ISSA).
According to the regulations “On the National Depository System” the National Depository Center is the state organization, which plays the main role in the National Depository System, engaging the depository activity and carrying records of other depositories that are included in depository system of the country.
Future OutlookOn the early stages of the stock market development the National Depository Centre carried out the function of keeping registry of shareholders and depositing shares of joint-stock companies formed as a result of the state privatization program. However, nowadays the current condition of the stock market demands infrastructural and systematic advancement of the Depository. Having examined the challenges coming from the today’s stock market and analyzed internal capabilities, the NDC has worked out a strategic vision and prepared the
itemized action plan for the depository system conversion. The strategic vision of the NDC aims to achieve the following objectives:• To stimulate institutional development of the
NDC by implementing the globally accepted Corporate Governance standards;
• To launch large-scale clearing operations in order to ensure the synchronized securities and funds entitlements settlement;
In order to reach its strategic objectives, the NDC plans to implement the following projects and arrangements:
• To improve the organizational structure of the Depository and to accommodate it to the strategic vision and action plan;
• To implement the highest corporate governance standards;
• To refine internal audit and controlling channels;
• To arrange systematic Risk Analysis and Management approach;
• To re-regulate internal document management procedures;
• To create feasible electronic transmission links with the Baku Stock Exchange;
• To join SWIFT network;• To implement paperless documentation
turnover with the professional participants of the Market;
• To create effective electronic Customers Inquiries Management network.
Bakhtiyar AzizovChief Executive Office
National Depository Center has gone through significant functional, structural and operational reforms during the 2009. Despite the global economic and financial downturn, NDC not only finished the year with an operating profit, but also put a great emphasis on material and technical advancement of the organization.
The value of the assets kept in custody by the National Depository Centre neared AZN 3.3 bln. At present, NDC serves approximately 1300 issuers, circa 100 000 investors and 10 broker organizations.
In order to ensure proper and transparent registration of the transactions in accordance with internationally accepted principles the NDC started implementing the International Financial Reporting Standards, including
international financial reporting, accounting and auditing standards. Under the market’s institutional strengthening strategy, the process of transforming the NDC into the centralized depository for the corporate and public securities is being closely consulted and guided by a number of international experts and institutions, and we constantly work on new projects with them.
Joint projects with the Islamic Development Bank, Turkey’s IMKB Takasbank central depository, EU’s TACIS Project, World Bank etc are just another illustrative evidence of the above mentioned. Measures to advance our technology platform undertaken in 2009, as a constituent element of our business processes optimization strategy
in registry keeping, depository services or any other services rendered, were utterly efficacious for protecting investors rights as well as increasing the protection level of kept in custody assets.
One of the ambitious tasks that the NDC sets for itself in 2010 is to start implementing electronic settlement and clearing services of reciprocal obligations between market participants involved into securities trading. This will surely increase not only transactional responsiveness, but also transparency and security of operations.
We believe we can expect an intensive and seminal 2010 ahead and infrastructural advancements will be principal mission and the highest aim for us.
National Depository Center has gone through significant functional, structural and operational reforms during the 2009.
NATIONAL DEPOSITORY CENTER OF AZERBAIJAN
Contact Name Rasim Mammadov E-mail [email protected] Website www.mdm.azAddress 19, Bul-Bul Avenue, Baku AZ1000 Azerbaijan
CONTACT INFORMATION
* Please refer to page 32 for the Azerbaijan country report.
FEDERATION OF EURO-ASIAN STOCK EXCHANGES ANNUAL REPORT JUNE 2012
PAGE 128
SECURITIES AND EXCHANGE BROKERS ASSOCIATION OF IRAN (SEBA)
IntroductionThe plans of NDC in 2011 was not only to improve operational sphere, but also to strengthen obtained achievements by becoming a central institutional body protecting customer rights, implementing high standards on corporate governance and financial transparency in securities sphere and being an example with its services and experience in securities market.
The main target of our organizaton is to make NDC the central settlement depository organizaton, applying leading international experience and recommendations from foreign experts.
Corporate Governance Formation of NDC 2011 was remained in memory as a year of positive changes in corporate governance and operational sphere of National Depository Center. All corporate management organs including new Supervisory and Executive boards and Internal Audit were formed during this year. The heads of operation, IT and finance divisions had been also appointed. As a result in 2011 NDC full accopmlished corporate formation of the company.
Legal framework of Internal AuditThe regulation on Internal Audit, performing functions of control of NDC and methodology guidelines on organization and performing of Internal Audit were accepted by Supervision Board.
The regulation and methodology guidelines were prepared on the basic of current legislation, charter of NDC and recommendations in corporate governance sphere prepared by International Finance Corporation(IFC).
The internal auditor is responcible for internal control systems efficiency, checking and estimation of systems providing application and efficiency of risk management procedures and methodology of risk assessment, accuracy of financial statements, implementation of procedures in compliance with legislation and internal rule of the organization and also for giving conclusions on audit results and given recommendations and their implementation.The 2011-2012 Audit Program was accepted by Supervision Board of NDC for application of audit supervision. The program includes reveiw of operational risks, adherence of ficancial planing procedures, issues with indepted depositors and issuer companies, actions of NDC during the procedure of phasing out of securities of liquidated companies, risk redusing measures, combination
and division of labor between Customer Service Department and Operational Department, organization and use of archive of NDC and organization of clerical work of General Affairs Department.
The electronic order routing system linking NDC and BSE(Baku Stock Exchange was launched In the first quarter of 2011.
Starting from February, 2011, securities trading on BSE has started to go through the newly launched electronic order routing system integrated between National Depository Center and Baku Stock Exchange, adapts the process of the corporate securities trading and their depository registration to the international standards level.
The newly established system minimizes the paperwork turnover, simplifies the transactions registration procedures and makes multiple intraday trades with the same securities possible for professional participants of securities market.
The main advantage of the electronic order routing system is that it allows the professional participants involved in trade to remotely connect to the NDC’s accounts system in order to access the necessary information on their clients, as well as use it during the trade at stock exchange.
The order routing exchange system has been realized after the adoption of amendments to the “Depository Activities” Standards and “Brokerage Activities in the Securities Market” Rules by the State Committee for Securities of Azerbaijan Republic.
In order to decrease system risk and solve operational problems the technical comeete consisting of employers of NDC and BSE was created.
Steps to Improve Information SecurityImproving of information security systems providing protection of the information kept in NDC from foreign interventions, technical bugs and other risks is one of the missions of our organization. The thorough research on transition to İSO 27001 standards was conducted for this purpose. Also the seminars by our Turkish colleague from Takasbank were held and roadmap was prepared and presented.
Financial budgeting in NDC The procedures on “ Finance planing and control” were accepted by General Meeting of Shareholders of NDC. Thus, implementation of accounting policy, financial transparency and corporate governance standards of organization were provided.The procedures on “ Finance planing and control” also was took into considiration for plaing of assets for implementation of development plan of NDC, performing finanlical planing in compliance with tax legislation and International Financial Reporting Standards and sustainable management of cash and floating assets.
Operational results (for 20/12/2012)NDC finished 2011 with an operating profit. 30 new contracts with issuers were signed and as a result additional AZN 1 537 000 were involved in depository.
Informartion on 216 contracts with issuers was updated. 4285 transaction with total value AZN 457, 8 mln were registered.
225 new issues with total value AZN 889 mln were registered on primary market.
NCD recorded a profit of AZN 290 550, 78 in 2011 with income AZN 1 252 234,72 and expences AZN 961 683,94.
Future outlook Nowadays the current condition of the stock market demands infrastructural and systematic advancement of the Depository. Having examined the contemporary challenges coming from the today’s stock market and analyzed internal capabilities, the NDC has worked out a strategic vision and prepared the itemized action plan for the depository system conversion.
The strategic vision of the NDC aims to achieve the following objectives:• Becoming a central institutional body• Applying advanced international standards on
securities transactions • Applying standards on corporate governance • Developing of internal recourses
Hossein Khezli KharaziGeneral Secretary
The main target of our organizaton is to make NDC the central settlement depository organizaton, applying leading international experience and recommendations from foreign experts.
Contact Name Mr. Amir Yousefianpour E-mail [email protected] Website www.seba.irAddress Second floor, # 17, Sibouyeh intersection, Shahid Qandi street, Sohrevardi avenue, Tehran Phone 0098 21 88524145-6 Fax 0098 21 88525988
CONTACT INFORMATION
* Please refer to page 109 for the Iran country report.
FEDERATION OF EURO-ASIAN STOCK EXCHANGES ANNUAL REPORT JUNE 2012
PAGE 129
Role of the DepositoryThe Securities Depository Center of Jordan is a public utility institution established in the Hashemite Kingdom of Jordan by virtue of the Securities Law. The SDC commenced operation in May 1999 and is the only entity in Jordan that is legally empowered to oversee the registration of securities, deposit of securities, transfer of ownership, safekeeping of securities and clearing and settlement of securities transactions.
The SDC is one of the most important institutions in Jordan’s capital market as it holds the ownership register of all public shareholding companies where ownership registration is in the beneficial owner name where nominee & street names does not apply.
As a key component in the modernization of the capital market, the SDC implemented a delivery-versus-payment (DVP) settlement protocol. DVP, a globally recommended settlement methodology that ensures the simultaneous delivery of securities against final payment of funds. The ownership is transferred on T+2 and backdated to T, these transfers are final and irrevocable, and financial settlements are currently conducted via the Central Bank of Jordan’s Real Time Gross Settlement System (RTGS-JO) which is a central real time, gross final & irrevocable electronic settlement system, using SWIFT instructions to effect transfers with immediate value.
It is worth mentioning that the Tight coupling environment set in March 2009 in the Jordanian Capital Market, introducing linkage between the SDC & the ASE that in turn, organize trading and reduce risks related to trade’s transactions that in turn positively reflects on clearing and settlement process at the SDC and reduce risks in the Jordan Capital Market. During the year 2010, the SDC continued to improve and enhance the electronic linkage with the institutions of capital market in the Kingdom.
The SDC also developed the “Securities Central Operation Registry Processing & Information Online (SCORPIO)” system. SCORPIO, an SDC-designed and implemented system, is bilingual and it provides a complete solution for the registration, deposit and clearing and settlement.
The SDC offers different services to investors in securities including pledging services, providing investors with statements of their securities balances that show the securities owned by them and their distributions among members; in addition to providing investors with the ability to freeze their securities in the central registry. There are no restrictions on the remittance of investment funds into or out of Jordan, all income & capital gained from investment in Jordan are exempted from tax; this includes cash & stock dividends. However, (5%) applies to interest gained from credit balances.
The SDC is in the final stages of completing many projects, including: new client identification system, enhancing risk management measure in the settlement cycle and improving electronic lien system.
The most prominent achievement of the SDC is implementing the business continuity & disaster recovery plans according to the requirements of the international standards and its positive effects on the SDC’s performance such as security, continuity of business operations, maintaining market readiness, reducing the cost of risk management and serving 24/7 of all members with high speed link.
Participation CriteriaThe SDC’s members are public shareholding companies, brokers, custodians and any other entity determine by the Board of Commission of JSC.
Eligible PledgeePledgees are not considered members in that capacity yet. However, it is within the SDC’s Plans as soon as the legal framework for it is approved.
IssuersMembership is obligatory for public shareholding companies by virtue of the Securities Law.
Size of Guarantee FundJOD 21.2 million (US$ 29.9 million) as of 31 December, 2010.
Does the SDC act as a central counter partyNo
Memberships in other International OrganizationsInternational Organization of Securities Commissions (IOSCO) Association of National Numbering Agencies (ANNA)Africa & Middle East Depositories Association (AMEDA)Federation of Euro-Stock Exchanges (FEAS)Union of Arab Stock Exchanges (UASE)Central Securities Depositories (CSD) Association of Global Custodian (AGC)Thomas Murray (TM)
Legal StatusPublic utility institution
Type of Commercial EntityNot for profit
Regulated byJordan Securities Commission
Form of SecuritiesDematerialized no physical certificates being issued in Jordan
Form of SettlementBook Entry
Settlement CycleT+2
Turnaround Trades Allowed provided the same broker in the same settlement cycle
Numbering• ISIN CODES complying with the International Standard ISO-6166• CFI Code complying with the International Standard ISO-10962
Samir JaradatChief Executive Officer
As part of Jordan’s vision towards establishing a progressive economy and a dynamic investment environment, the Securities Depository Center (SDC) was established as a public utility institution and began operating in 1999. Ever since the SDC became the sole entity empowered the responsibilities of registering, depositing, transferring ownership, safekeeping, and clearing and settlement of securities. Accordingly, the SDC built Securities Central Operation Registry Processing and Information Online (SCORPIO)® system in order to provide various services
to investors, its members including public shareholding companies, brokers and custodians such services include investor identification and account set up, statement of ownership balance, statements of account, pledging, freezing, online account viewing. The SDC plays a vital role in supporting transparency through an initiative known as “Data For All, Not Just For Sale”, from this initiative the SDC provides various services through its website such as the online account viewing, statistical data, members’ area and an electronic initial public offering (e-IPO). In addition
to the information that is provided in a timely, accurate and updated manner such as board members’ names, holdings and trades, major shareholders, financial figures and statistical data.
Recently, the SDC has provided new electronic services on its website that enable the investor to view corporate actions and all aspects related to it, in addition to, dynamic charts that provides analysis of trading.
The SDC plays a vital role in supporting transparency through an initiative known as “Data For All, Not Just For Sale”.
SECURITIES DEPOSITORY CENTER (SDC) OF JORDAN
Contact Name Mr. Samir Jaradat E-mail [email protected] Website www.sdc.com.joAddress The Securities Depository Center (SDC) 2nd Floor - Capital Market Building, Al-Mansour Bin Abi Amer StreetAl-Abdali Area, Al-Madina Al-Riyadiya District, Amman, The Hashemite Kingdom of Jordan P.O.B. (212465) Amman 11121 Jordan
CONTACT INFORMATION
* Please refer to page 24 for the Jordan country report.
FEDERATION OF EURO-ASIAN STOCK EXCHANGES ANNUAL REPORT JUNE 2012
PAGE 130
Swiss Futures and Options Association (SFOA)The Swiss Futures and Options Association (SFOA) - previously Swiss Commodities, Futures and Options Association - was founded in 1979 as a non-profit professional association.
A global missionIts mission is to support the growth and development of the global derivatives industry and the strengthening of market integrity through its annual international gathering and conference and regulatory summit, as well as its initiatives in the area of education and editing of industry focused publications.
The goals of the association• To serve the industry, the participants in the
industry and their products - in the widest sense - and to help set the standards of quality and service for its members.
• To set a basis for self-regulation for all those who are involved or interested in becoming involved in the futures and options industry.
• To inform all our members and friends about news relating to the industry, opportunities offered for personal development by means of attending seminars, road shows and presentations.
• To present new products and the opportunities offered by their use, in a realistic and concise manner.
• To organize presentations, seminars and workshops which promote specific markets or market segments and to educate practitioners and those who would like to become industry participants.
• To actively participate and co-operate with those public and/or government entities in charge of drafting new legislation and/or
•
of reviewing and adapting existing ones, avoiding though to get involved in any kind of lobbying activity.
• To maintain and develop existing and establish new links with International Organizations (i.e. UNCTAD), Associations and Federations (i.e. FEAS, FIA, FOA, ICMA, FECIF, CIFA, SBA etc.) for the benefit of their and our members.
• To organize an International Forum providing top ranking industry professionals with the opportunity to meet, and to offer the possibility to publicly debate topics crucial to the industry.
• To organize the International « Bürgenstock » Regulator’s Meeting, unique in its attendance and purpose.
• To provide the emerging markets with a platform of discussion and exchange of ideas with well-established markets and market participants in close cooperation with AFM – the Association of Futures Markets.
• To assist individuals and institutions to locate the best source of information and service to suit their specific needs and, if needed, to assist them in their research for facts and figures about the industry, its participants and products.
Next international industry meeting33rd Intl. SFOA “Bürgenstock” Symposium, Interlaken/ Switzerland, to take place from 5th to 7th September 2012. Program includes information about the International Regulators’ meeting, the Emerging Markets Forum and the Structured Products Forum. For complete information please refer to our internet page http://www.sfoa.org/index.php?nav=Program-informations&snav=Introduction
Swiss Derivatives ReviewThe Swiss Derivatives Review (SDR) is the official publication of the Swiss Futures and Options Association featuring articles about regulation, education, products, events etc. being in relation with the associations goals. SDR is published 3 times yearly and close to 10’000 copies are printed, sent to subscribers and distributed at international industry events, at no charge to the reader. A electronic version of the past editions is downloadable from our internet site: http://www.sfoa.org/index.php?nav=Swiss-derivatives-review&snav=Magazine
Board of DirectorsChairman Otto E. Naegeli, OEN Consulting, TorricellaVice Chairman Patrick J. Catania, Asia West Group, ChicagoPresident and CEO Paul-André Jacot, Derivacom, GenevaMembers François Bouclier, Newedge Group, GenevaDaniel Grossrieder, UBS AG, ZurichMichael Hofmann, ABN AMRO Clearing Bank N.V., Frankfurt a/MainAndrew Lowenthal, CBOE Futures Exchange, ChicagoMark Mills, Merrill Lynch Intl., LondonMichael Peters, EUREX, Frankfurt a/ MainMarkus Pfister, Bank Vontobel AG., ZurichFrancesco Ranza, Banque Privée Ed. de Rothschild SA, GenevaRobert Ray, CME Group, LondonChristian Reuss, Scoach Schweiz AG, ZurichLamon Rutten, Multi Commodity Exchange of India Ltd., Mumbai Alan van Griethuysen, NYSE Euronext, Amsterdam
Otto E. NaegeliChairmanSwiss Futures and Options Association
A special word of appreciationIn my capacity as Chairman of the Swiss Futures and Options Association, I would like to express my gratitude and pleasure to be associated with the Federation of Euro-Asian
Stock Exchanges. I hope that this will help us in our mutual effort to further contribute to strengthen the ties between FEAS and SFOA. I believe that this is a further step to harmonize market practices and behavior globally.
SFOA’s mission is to support the growth and development of the global derivatives industry 2and the strengthening of market integrity
SWISS FUTURES OPTIONS ASSOCIATIONS (SFOA)
Contact Name Mrs. Carol Gregoir E-mail [email protected] Website www.sfoa.org
CONTACT INFORMATION
FEDERATION OF EURO-ASIAN STOCK EXCHANGES ANNUAL REPORT JUNE 2012
PAGE 131
GENERAL INFORMATIONTakasbank is incorporated as a non-deposit taking investment bank and is authorized by the Capital Markets Board of Turkey to function as: the Clearing and Settlement Institution for the ISE markets, the Clearing House for the Turkish Derivatives Exchange, the National Numbering Agency of Turkey and the Custodian for the Mutual Funds and Pension Funds incorporated in Turkey.
Services Provided• Central clearing and settlement for the organized
markets of ISE and Turkish Derivatives Exchange (TurkDEX),
• Cash settlement and transfer facilities (domestic and cross-border),
• Cross-border settlement and custody services,• Real Time Gross DvP settlement (among brokers
and custodians) for equities via integration with SWIFT system
• Takasbank Money Market,• Securities Lending and Borrowing Market (SLB),• Cash Credits, • Allocation of ISIN and CFI for securities issued in
Turkey
Brief HistoryTakasbank started as a department within the Istanbul Stock Exchange (ISE) in 1988. In 1996, it was transformed into a sector-specific non-deposit taking investment bank and renamed Takasbank (ISE Settlement and Custody Bank, Inc.)
Form of SecuritiesDematerialized
Form of Settlement and Transfers:Book-entry
Legal StatusJoint stock company
Settlement PeriodEquities: T+2Bonds and Bills: T+0Derivatives: T+1
Type of Commercial EntityPrivate sector for-profit company
Does Takasbank Act as a CentralCounter Party?Takasbank acts as a Central Counter Party for TurkDEX, but does not act as a Central Counter Party for ISE markets.
Regulated byCapital Markets Board of TurkeyBanking Regulation and Supervision AgencyCentral Bank of Turkey
Size of Guarantee Fund (As of December 2011)ISE Equities Market: US$ 31 millionISE Bonds and Bills Market: US$ 37 millionTurkDEX: US$ 47 millionOwnershipIstanbul Stock Exchange (ISE): 36.64%Banks (16): 31.34%Brokerage Houses (64): 32.02%
Board of Directors: 11 MembersIstanbul Stock Exchange: 4Banks: 3Brokerage Houses: 2Capital Markets Board: 1and the President and CEO of Takasbank.
Memberships to International OrganizationsAssociation of National Numbering Agency (ANNA) International Securities Services Association (ISSA)SWIFTAssociation of European CSDs (ECSDA)Federation of Euro-Asian Stock Exchange (FEAS)Institute of International Finance (IIF)Organization of Islamic Conference (OIC)World Federation of Exchanges (WFE)
Future OutlookIn 2012, Takasbank intends to:• Actively participate to the studies of “Istanbul
International Finance Center” project;• Continue its efforts to become a Central
Counterparty for equities and establish a central collateralization system;
• Continue the studies to become an international hub (ICSD) for cross-border clearing & settlement transactions;
• Continue its efforts for attracting interest for Turkey Electronic Fund Platform, which started its operations on January 2011 to create a larger distribution channel for market participants, and developing the infra-structure for the integration with international fund platforms;
• Contribute to the development of an Options Market Clearing and Settlement infra-structure;
• Contribute to the development of international standards for securities and implementing these standards in Turkey;
• Continue its studies for the infra-sturucture development of clearing & settlement of stock repo market to be opened in the ISE;
• Contribute to the realization of the dematerialization of domestic debt instruments (i.e. T-Bills and G-Bonds).
Murat ULUSGeneral Manager & Board Member
Takasbank has accomplished many innovative projects and created new mechanisms during the course of 2011, in order to provide a more trustworthy environment to all capital market participants and to enhance the increase of cross-border trade volume. Takasbank continued its studies to become a Central Counterparty(CCP) for all organized markets operating within Istanbul Stock Exchange and Turkish Derivatives Exchange (TurkDEX). Initially, as the first phase of our CCP studies, we are developing the infra-structure of the risk management for derivative products traded in TurkDEX markets through using SPAN software in order to reduce risk in clearing & settlement. Also, it is worth mentioning that as of 2 September 2011, Takasbank has begun to give trade repository services to For-Ex trades & transactions. According to the related comminique of Capital Markets Board, customer collaterals and transaction details regarding OTC Derivatives (For-Ex) should be declared to Takasbank.
In order to expand its services globally, Takasbank has also started studies to become an International Central Securities Depository (ICSD) in 2011. With the realization of this project, Takasbank aims to provide settlement & custody services in a standard manner to a wide variety of customers world-wide via flexible and
modern system infra-structure compatible with other structures operating globally.
With a distinctive role in the development of Turkish capital markets, Takasbank continued its efforts for attracting interest for Turkey Electronic Fund Platform, which started its operations on January 2011 to create a larger distribution channel for market participants. In 2012, Takasbank will contribute developing the infra-structure for the integration with international fund platforms. Also in 2011, Takasbank has begun to give cash settlement & collateral management services for Turkish Electricity Market as a “Central Settlement Bank”.
In the framework of FEAS efforts, Takasbank shared its accumulated experience and knowledge about the clearing and settlement issues in Turkish capital markets with its peers in the region. In this context, Takasbank both provided consultancy and training. With regard to consultancy, on 15-25 May 2011, Takasbank provided consultancy services to National Depository Center of Azerbaijan(NDC) for “Central Clearing and Settlement Capacity Building within National Depository Center” in the framework of the project “Support for the Improvement of the Investment and Export Climate - EuropeAid/126666/C/SER/AZ”.
As regards FEAS training efforts, on November 2011, Takasbank gave On-Site training to Armenian and Syrian capital markets participants. Also on October- December 2011, Takasbank gave training to 3 groups comprising of Azerbaijan capital market participants within the sponsorship of Turkish Republic Prime Ministry Turkish Cooperation and Development Administration. This training encompassed clearing & settlement transactions as well as IT infra-structure underlying these transactions.
Within the responsibility of its FEAS membership, Takasbank actively participated to the Executive Committee (EC) and Working Committee (WC) meetings of FEAS held in Ohrid, Macedonia on May 2011 as well as to the General Assembly, EC and WC meetings held in Almaty, Kazakhstan on September 2011. In this WC meeting, Takasbank was assigned to a project on linkages with ISE and other member exchanges and has been asked to give a report on issues within the CSDs to set up linkages.
Being a member of FEAS, I sincerely want to express that Takasbank will continue its studies on clearing, settlement, and custody issues which will bring enriched expertise and knowledge to post-trade institutions operating in the FEAS region.
Takasbank has accomplished many innovative projects and created new mechanisms during the course of 2011.
TAKASBANK - ISE SETTLEMENT AND CUSTODY BANK, INC.
Contact Name Ms. Necla Küçükçolak E-mail [email protected] Website www.takasbank.com.tr
CONTACT INFORMATION
* Please refer to page 69 for the Turkey country report.
FEDERATION OF EURO-ASIAN STOCK EXCHANGES ANNUAL REPORT JUNE 2012
PAGE 132
Other ProjectsFinancial Information Processing of Iran (FIPI)TSETMC started a new project titled “Financial Information Processing of Iran” (FIPI). The main objective of the project is to establish a Data Warehouse to gather and maintain all important information and data in Iranian financial markets. Stored data and information are processed and delivered via different mediums (such as a website, Decision Support Systems and Standard reports) to various users.
Digital Signature CertificateTSETMC defined a new project with Iranian Commerce Ministry to become a Certified Authorization (CA) body for the Iranian Capital Market. Iranian Ministry of Commerce acts as a root CA in Iran and authorized TSETMC to provide Digital Signature Certificate to capital market’s participants. Such certificate has a vital rule in electronic commerce as both parties could transact digitally with very high level integrity, privacy, authentication and none-repudiation.
General InformationTehran Stock Exchange Services Company (TSETMC) is a subsidiary of the Securities and Exchange (SEO) of Iran. SEO regulates and overseas the Iranian capital market. TSETMC was established on June 1994 as an independent company owned by Tehran Stock Exchange (TSE) and its members. With the implementation of the new Capital Market Act by the Iranian Parliament, SEO was established and the ownership of TSETMC was transferred to SEO. The TSETMC’s main function is to develop, maintain, operate, and promote systems for all stages of the trade-cycle services in Iran.
Specifically, TSETMC is responsible to: • maintain all hardware and software used for trade
and post trade activities • develop and enhance existing software
applications
• provide consultancy and technical advice to main exchanges in Iran
• act as a financial information processor for the Iranian financial market.
Services ProvidedTradingMaintain Automated Trading System (ATS)Disseminate trade and financial information to interested parties
Information and SupportingProvide operational services Manage operational risks
OthersProvide consultancy Manage TSE data centersImplement specialized software
Brief HistoryTSETMC started its operation as a subsidiary of the National Informatics Corporation (NIC) of Iran in July 1984. Originally, TSETMC developed, maintained and operated the computerized system of TSE used for trade and post-trade activities. In June 1994, TSETMC was incorporated as an independent company under the ownership of the TSE, its members, and NIC. Currently, Securities and Exchange (SEO) of Iran is the sole owners of TSETMC.
Form of SecuritiesDematerialized
Form of Settlement and Transfers:Book-entry
Legal StatusPrivate Joint Stock Company
Settlement PeriodFor TSE Markets: Equities: T+3 Corporate Bonds: T+1
Type of Commercial EntityPrivate sector for-profit company
Does TSETMC act as a central counter party?No.
Regulated BySecurities and Exchange Organization of Iran (www.seo.ir)
OwnershipOwned by the Securities and Exchange Organization (SEO) of Iran
Memberships to International Organizations Affiliate Member of the Federation of Euro-Asian Stock Exchanges (FEAS)
Board of Directors: 3 MembersRepresentatives of the Securities and Exchange (SEO) of Iran Future OutlookFrom March 2008 to March 2009, TSETMC intends to:• Lead the implementation of a new trading solution• Assist CSD Iran in the implementation of a post-
trade solution• Assist brokerage firms for implementing total
brokerage solutions • Lead efforts for implementation of Straight Through
Processing (STP)• Contribute in the introduction of new instruments• Assist in the creation of the Iranian Petroleum
Exchange• Perform studies for creation of a Lending and
Borrowing market• Contribute to the development and implementation
of international standards• Initiate studies and efforts to introduce CCP at CSD
Iran• Release the first phase of Financial Information
Processing project • Continuing the Digital Signature Certificate project
Morteza KhazanedariManaging Director
TSETMC’s activities for the year 2008 are: The major project at TSETMC is to implement a new trading solution for the Tehran Stock Exchange (TSE) in the year 2008. The trading solution was installed on the purchased hardware in early April 2007. This Solution is due to come online in the winter of 2008 after finalization of internal and external User Acceptance Testing (UAT). TSETMC is also assisting the newly established CSD Iran Company for the implementation of a new post-trade solution. TSETMC has a very close relationship with CSD Iran Company since all of the post-trade activities were the responsibility
of TSETMC before the enactment of the Capital Market Act by the Iranian Parliament in 2005. CSD Iran Company is also an Affiliated Member of FEAS.
During the implementation of the new core trade and post-trade solutions, TSETMC is assisting major brokerage firms in Iran for the implementation of Brokerage Solutions.
The plan is to introduce financial and commodity derivatives markets in TSE and the newly established Iranian Mercantile Exchange (IME) in the near future. TSETMC is supporting the introduction of these markets and also their
trade and post-trade processing. TSETMC is an active member of a consortium with the responsibility to establish the Iranian Petroleum Exchange.
TSETMC is the main contributor in the development and implementation of international standards in Iran. TSETMC is helping the implementation of a DVP Model2 for TSE’s equity market. In addition, the new CSD Company would become a CCP of the equity market by 2010. TSETMC is involved with CSD Iran for the provision of needed infrastructure and risk management mechanisms.
The major project for TSETMC is to implement a new trading solution for the Tehran Stock Exchange (TSE) in the year 2008.
TEHRAN SECURITIES EXCHANGE TECHNOLOGY MANAGEMENT COMPANY (TSETMC)
Contact Name Mr. Houman Farajollahi E-mail [email protected] Website www.tsetmc.com
CONTACT INFORMATION
* Please refer to page 109 for the Iran country report.
FEDERATION OF EURO-ASIAN STOCK EXCHANGES ANNUAL REPORT JUNE 2012
PAGE 133
History and DevelopmentThe Association of Capital Market Intermediary Institutions of Turkey has been established in March 2001 as the self-regulatory organization in the Turkish capital markets. 101 brokerage firms, 1 derivatives brokerage firm and 40 banks, authorized for capital market operations, constitute the members of the Association as of end-2011.
The Association aims to: • Contribute to the development of capital markets
and intermediation activities;• Facilitate solidarity among its members; • Safeguard prudent and disciplined conduct of
business by its members; • Prevent unfair competition among members;• Enhance professional know-how in the sector.
The main functions of the Association are to: • Establish professional rules and regulations; • Set safety measures to prevent unfair competition; • Monitor professional developments, changes in
rules and regulations and inform members; • Evaluate complaints against its members; • Impose disciplinary action on members, when
necessary;
• Assist in the resolution of disputes arising from off-exchange transactions among its members or between its members and investors;
• Appoint arbitrators upon the request of concerned parties;
• Conduct research on Turkish and international capital markets;
• Offer training programs; • Issue licenses to capital market professionals
who are required to pass exams organized by the Capital Markets Board;
• Keep records of all capital market professionals;• Cooperate with related foreign institutions.
Future Outlook• The Association plans to organize a comprehensive
investor education program in 2012, in cooperation with relevant financial industry institutions.
• TSPAKB will continue to contribute to the IPO campaign in cooperation with the Istanbul Stock Exchange.
• TSPAKB will continue to take part in the Istanbul Financial Centre Project.
• TSPAKB will organize the International Council of Securities Association’s interim meeting and the International Organization of Securities Commission’s Self-Regulatory Organisations Consultative Committee meeting between 5-9 November 2012 in Istanbul.
Legal StatusNot-for-profit association.
Regulated byCapital Markets Board.
Board of Directors 7 persons chosen among members by the General Assembly, every two years. The General Assembly is the highest decision-making body, where each member firm has one voting right.
Memberships at International OrganizationsAFIE (Asia Forum for Investor Education): http://www.afie.asia ASF (Asia Securities Forum): http://www.asiasecuritiesforum.orgFEAS (Federation of Euro-Asian Stock Exchanges): http://www.feas.org ICSA (International Council of Securities Associations): http://www.icsa.bz IFIE (International Forum for Investor Education): http://www.ifie.org IOSCO (International Organization of Securities Commissions): http://www.iosco.org
Attila Köksal, CFAChairman
2011 was a challenging year for the world economy. The problems experienced in the European Union countries, the first credit rating downgrade for the United States, the devastating earthquake in Japan and political changes in the Middle East have all affected the global financial markets. Amidst this environment, in Turkey the stock market index went down, interest rates went up and the Turkish lira depreciated.
Despite all these negative developments, several regulatory amendments were undertaken and new products were introduced to our financial markets. From our Association’s point of view, while celebrating our 10th anniversary, we decided to concentrate on three main objectives in order to restructure the Turkish financial markets: enhance our employees’ knowledge, widen the investor base and diversify the range of investment products.
In 2011, we have diversified our professional development training programs. Moreover, we
participated in the newly formed Capital Markets Licensing and Training Agency.
In cooperation with other market institutions, we are running a nationwide financial education project. Our Association conducted an investor perception survey in 2010, and in the light of the results, several projects have been tailored for different target groups.
We think that foreign investor base should also be expanded along with domestic investors. Within this scope, “Turkish Capital Markets Day” was organized in Taipei, Taiwan in October 2011. Turkish delegation, including Capital Markets Board, Central Bank of Turkey, Istanbul Stock Exchange, Turkish Derivatives Exchange and other authorities discussed the opportunities of the Turkish capital markets with our Taiwanese colleagues.
We have undertaken several projects on the issuers’ side as well. The Association is involved in the Initial Public Offerings Awareness Project, initiated in 2008
by the Istanbul Stock Exchange. This project has been quite successful, as 27 new companies were listed in 2011. We have also signed another cooperation protocol with the Capital Markets Board, Istanbul Stock Exchange and the Small and Medium Size Enterprise Development Organization, to encourage listings of small and medium sized enterprises.
TSPAKB continued to serve as the information hub of the industry in 2011. We published various statistics and reports about the Turkish capital markets and the brokerage industry. We produced various research reports about the issues on the national and international agenda, in Turkish and in English.
To conclude, in Turkey there is strong coordination among capital market institutions to develop the market further and TSPAKB will continue to support efforts towards the growth of the Turkish financial sector, from expanding the product range to widening the investor base.
TSPAKB will continue to support efforts towards the growth of the Turkish financial sector, from expanding the product range to widening the investor base.
THE ASSOCIATION OF CAPITAL MARKET INTERMEDIARY INSTITUTIONS OF TURKEY (TSPAKB)
Contact Name Alparslan Budak E-mail [email protected] Website www.tspakb.org.tr Address Buyukdere Caddesi No 173 1. Levent Plaza A Blok Kat: 4 1. Levent 34394 Istanbul TURKEY Phone +90 (212) 280 8567 Fax +90 (212) 280 8589
CONTACT INFORMATION
* Please refer to page 69 for the Turkey country report.
FEDERATION OF EURO-ASIAN STOCK EXCHANGES ANNUAL REPORT JUNE 2012
PAGE 134
INTRODUCTIONSouth Asian Federation of Exchanges (SAFE) is a cooperative platform launched by the bourses in South Asia with a purpose to promote the development and harmonization of the securities markets in the region. SAFE is a not for profit association having Recognized Body status of the South Asian Association for Regional Cooperation (SAARC), and is a network exchange association of the World Federation of Exchanges (WFE).
SAFE stands to prepare and position its member markets for their orderly integration into the global financial system by enhancing the depth, inter-connectivity, integrity and transparency of its member markets. Since its inception, SAFE has worked to become a focused platform for the representatives of the exchange industry and other capital market related institutions of the Region. Additionally, the Federation has also provided a channel through which the individual stock exchanges continue to find opportunities for bilateral cooperation.
SAFE was set up in year 2000 under the initiative of Chittagong Stock Exchange, Bangladesh but now operates from its permanent Secretariat at Islamabad, Pakistan. The activities and operations of the Federation are being spearheaded by Mr. Aftab Ahmad Ch, who has been serving as the regular Secretary General of the Federation since 2005 under the appointment by the SAFE’s Executive Committee.
As of February 2012, SAFE comprises of thirty four (34) member entities from the SAARC Region (Afghanistan, Bangladesh, Bhutan, India, Maldives, Nepal, Pakistan and Sri Lanka) as well as from Kazakhstan, Mauritius and UAE; fifteen (15) regional stock & commodity
exchanges as Primary Members; six (6) Associate Members comprising of non-regional exchanges, and regional depository & clearing institutions, nine (9) Affiliate Members and four (4) Affiliate Associations.
SERVICES OFFERED BY SAFE• The Federation acts as an industry platform
to advocate, suggest and prepare regulatory changes needed for the harmonization of market practices and policies.
• SAFE stands to promote the investment potential of the region by attracting foreign institutional and portfolio investments into our regional markets. Towards this end, the Federation regularly conducts seminars, events, conferences and roundtables to highlight the investment potential of our individual as well as the regional markets.
• The Federation engages in the capacity building programs to develop the skills and expertise of the human capital for the effective management of our markets. This is done through various activities and initiatives both independently as well as in association with other domestic, regional and international entities.
• SAFE works for the adoption of the best consumer/investor protection standards in the region and towards this end, the Federation undertakes regular efforts for the spread of financial knowledge/awareness in the region.
• SAFE also provides advisory & consulting services regarding financial and capital market issues, matters and projects both within and outside the region. This is done through channelizing the involvement and participation of the regional consultants.
SAFE’S PROJECT ON REGIONAL FINANCIAL INTEGRATION: DEVELOPING A HARMONIZED REGULATORY FRAMEWORK FOR THE CAPITAL MARKETS IN PAKISTAN & SOUTH ASIA-2012/13Increased cross border financial activities, trade and economic exchanges are known to create strong intraregional links and an integrated economic region. While in South Asia, efforts have been made to promote intraregional trade, however the intraregional financial integration appears to lag behind due to asymmetric developments in the economic and financial sectors. It was in this context that SAFE had applied for USAID’s Small Grants and Ambassador’s Fund Program (SGAFP) in 2011, to develop standardized market regulations so as to create the necessary environment for an enhanced regional financial integration and achieve convergence across different markets of the Region.
The objectives of the project are: to develop harmonized market regulations for the capital markets; to standardize self regulatory framework for the management and the operations of the markets in the region; to enhance market integrity and investor confidence; to introduce consistent & common reporting standards; to improve the governance and transparency norms for the listed sector; to facilitate easy capital raising on regional basis and the promotion of cross border listings; to deepen and broaden the region’s securities markets; to assist in, relatively, free movement of capital and portfolio investments; and to promote the greater integration of the South Asian capital and financial markets.
The project is envisaged to be completed in a period of 18 months, beginning from April, 2012 till Sep 2013.
SAFE is a cooperative platform launched by the bourses in South Asia with a purpose to promote the development and harmonization of the securities markets in the region.
THE SOUTH ASIAN FEDERATION OF EXCHANGES (SAFE)
Contact Name Ahmed Aftab E-mail [email protected] Website www.safe-asia.com
CONTACT INFORMATION
Ahmed AftabSecretary General

FEDERATION OF EURO-ASIAN STOCK EXCHANGES ANNUAL REPORT JUNE 2012
PAGE 135
MEMBER LIST
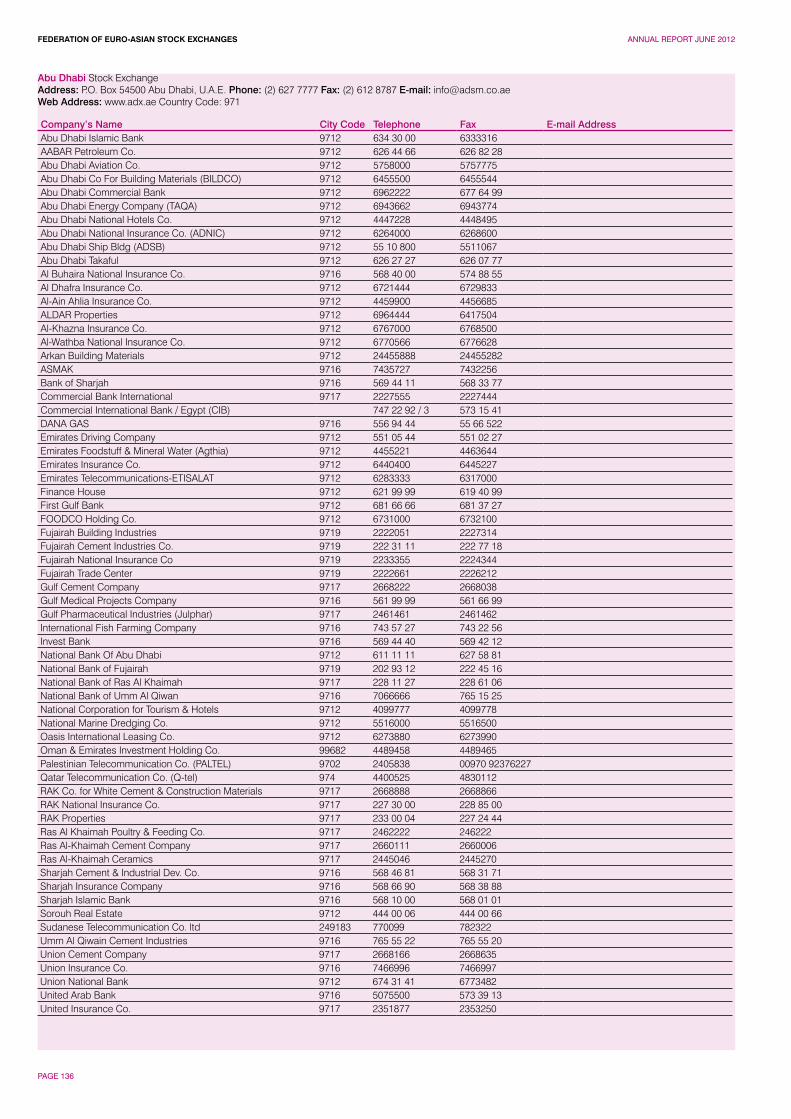
FEDERATION OF EURO-ASIAN STOCK EXCHANGES ANNUAL REPORT JUNE 2012
PAGE 136
Abu Dhabi Stock Exchange Address: P.O. Box 54500 Abu Dhabi, U.A.E. Phone: (2) 627 7777 Fax: (2) 612 8787 E-mail: [email protected] Address: www.adx.ae Country Code: 971
Company’s Name City Code Telephone Fax E-mail AddressAbu Dhabi Islamic Bank 9712 634 30 00 6333316AABAR Petroleum Co. 9712 626 44 66 626 82 28Abu Dhabi Aviation Co. 9712 5758000 5757775Abu Dhabi Co For Building Materials (BILDCO) 9712 6455500 6455544Abu Dhabi Commercial Bank 9712 6962222 677 64 99Abu Dhabi Energy Company (TAQA) 9712 6943662 6943774Abu Dhabi National Hotels Co. 9712 4447228 4448495Abu Dhabi National Insurance Co. (ADNIC) 9712 6264000 6268600Abu Dhabi Ship Bldg (ADSB) 9712 55 10 800 5511067Abu Dhabi Takaful 9712 626 27 27 626 07 77Al Buhaira National Insurance Co. 9716 568 40 00 574 88 55Al Dhafra Insurance Co. 9712 6721444 6729833Al-Ain Ahlia Insurance Co. 9712 4459900 4456685ALDAR Properties 9712 6964444 6417504Al-Khazna Insurance Co. 9712 6767000 6768500Al-Wathba National Insurance Co. 9712 6770566 6776628Arkan Building Materials 9712 24455888 24455282ASMAK 9716 7435727 7432256Bank of Sharjah 9716 569 44 11 568 33 77Commercial Bank International 9717 2227555 2227444Commercial International Bank / Egypt (CIB) 747 22 92 / 3 573 15 41DANA GAS 9716 556 94 44 55 66 522Emirates Driving Company 9712 551 05 44 551 02 27Emirates Foodstuff & Mineral Water (Agthia) 9712 4455221 4463644Emirates Insurance Co. 9712 6440400 6445227Emirates Telecommunications-ETISALAT 9712 6283333 6317000Finance House 9712 621 99 99 619 40 99First Gulf Bank 9712 681 66 66 681 37 27FOODCO Holding Co. 9712 6731000 6732100Fujairah Building Industries 9719 2222051 2227314Fujairah Cement Industries Co. 9719 222 31 11 222 77 18Fujairah National Insurance Co 9719 2233355 2224344Fujairah Trade Center 9719 2222661 2226212Gulf Cement Company 9717 2668222 2668038Gulf Medical Projects Company 9716 561 99 99 561 66 99Gulf Pharmaceutical Industries (Julphar) 9717 2461461 2461462International Fish Farming Company 9716 743 57 27 743 22 56Invest Bank 9716 569 44 40 569 42 12National Bank Of Abu Dhabi 9712 611 11 11 627 58 81National Bank of Fujairah 9719 202 93 12 222 45 16National Bank of Ras Al Khaimah 9717 228 11 27 228 61 06National Bank of Umm Al Qiwan 9716 7066666 765 15 25National Corporation for Tourism & Hotels 9712 4099777 4099778National Marine Dredging Co. 9712 5516000 5516500Oasis International Leasing Co. 9712 6273880 6273990Oman & Emirates Investment Holding Co. 99682 4489458 4489465Palestinian Telecommunication Co. (PALTEL) 9702 2405838 00970 92376227Qatar Telecommunication Co. (Q-tel) 974 4400525 4830112RAK Co. for White Cement & Construction Materials 9717 2668888 2668866RAK National Insurance Co. 9717 227 30 00 228 85 00RAK Properties 9717 233 00 04 227 24 44Ras Al Khaimah Poultry & Feeding Co. 9717 2462222 246222Ras Al-Khaimah Cement Company 9717 2660111 2660006Ras Al-Khaimah Ceramics 9717 2445046 2445270Sharjah Cement & Industrial Dev. Co. 9716 568 46 81 568 31 71Sharjah Insurance Company 9716 568 66 90 568 38 88Sharjah Islamic Bank 9716 568 10 00 568 01 01Sorouh Real Estate 9712 444 00 06 444 00 66Sudanese Telecommunication Co. ltd 249183 770099 782322Umm Al Qiwain Cement Industries 9716 765 55 22 765 55 20Union Cement Company 9717 2668166 2668635Union Insurance Co. 9716 7466996 7466997Union National Bank 9712 674 31 41 6773482United Arab Bank 9716 5075500 573 39 13United Insurance Co. 9717 2351877 2353250
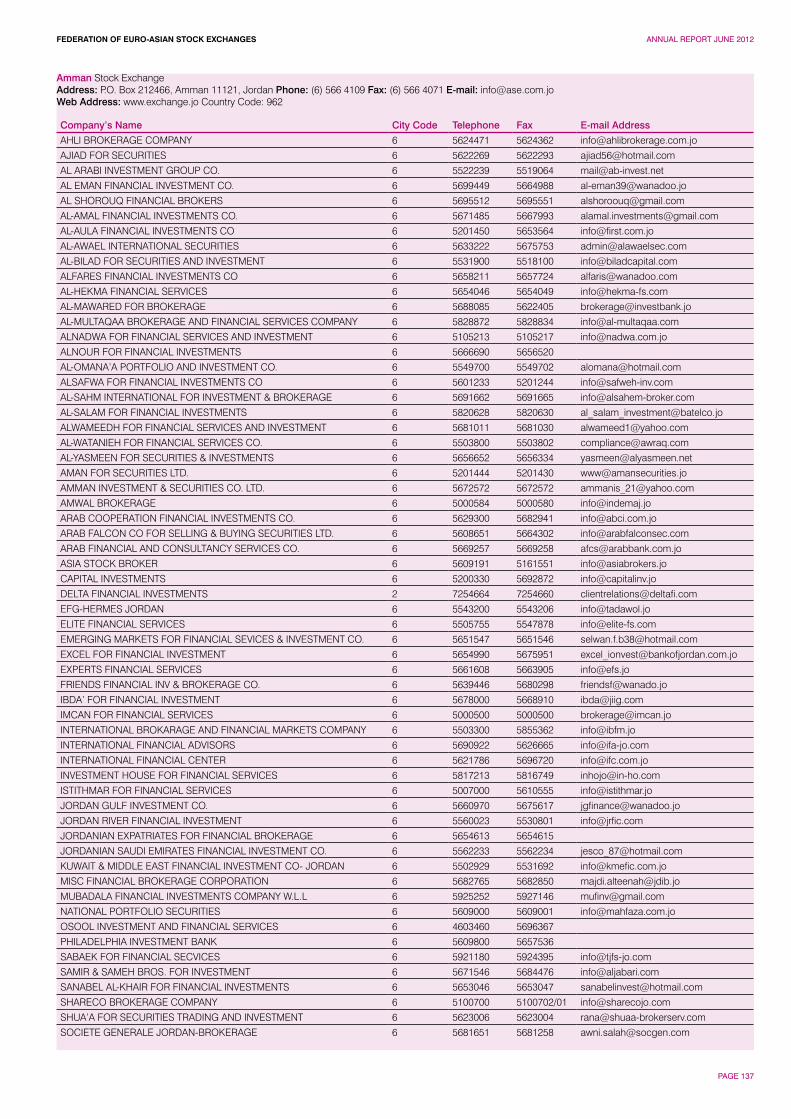
FEDERATION OF EURO-ASIAN STOCK EXCHANGES ANNUAL REPORT JUNE 2012
PAGE 137
Amman Stock ExchangeAddress: P.O. Box 212466, Amman 11121, Jordan Phone: (6) 566 4109 Fax: (6) 566 4071 E-mail: [email protected] Address: www.exchange.jo Country Code: 962
Company’s Name City Code Telephone Fax E-mail Address
AHLI BROKERAGE COMPANY 6 5624471 5624362 [email protected]
AJIAD FOR SECURITIES 6 5622269 5622293 [email protected]
AL ARABI INVESTMENT GROUP CO. 6 5522239 5519064 [email protected]
AL EMAN FINANCIAL INVESTMENT CO. 6 5699449 5664988 [email protected]
AL SHOROUQ FINANCIAL BROKERS 6 5695512 5695551 [email protected]
AL-AMAL FINANCIAL INVESTMENTS CO. 6 5671485 5667993 [email protected]
AL-AULA FINANCIAL INVESTMENTS CO 6 5201450 5653564 [email protected]
AL-AWAEL INTERNATIONAL SECURITIES 6 5633222 5675753 [email protected]
AL-BILAD FOR SECURITIES AND INVESTMENT 6 5531900 5518100 [email protected]
ALFARES FINANCIAL INVESTMENTS CO 6 5658211 5657724 [email protected]
AL-HEKMA FINANCIAL SERVICES 6 5654046 5654049 [email protected]
AL-MAWARED FOR BROKERAGE 6 5688085 5622405 [email protected]
AL-MULTAQAA BROKERAGE AND FINANCIAL SERVICES COMPANY 6 5828872 5828834 [email protected]
ALNADWA FOR FINANCIAL SERVICES AND INVESTMENT 6 5105213 5105217 [email protected]
ALNOUR FOR FINANCIAL INVESTMENTS 6 5666690 5656520
AL-OMANA’A PORTFOLIO AND INVESTMENT CO. 6 5549700 5549702 [email protected]
ALSAFWA FOR FINANCIAL INVESTMENTS CO 6 5601233 5201244 [email protected]
AL-SAHM INTERNATIONAL FOR INVESTMENT & BROKERAGE 6 5691662 5691665 [email protected]
AL-SALAM FOR FINANCIAL INVESTMENTS 6 5820628 5820630 [email protected]
ALWAMEEDH FOR FINANCIAL SERVICES AND INVESTMENT 6 5681011 5681030 [email protected]
AL-WATANIEH FOR FINANCIAL SERVICES CO. 6 5503800 5503802 [email protected]
AL-YASMEEN FOR SECURITIES & INVESTMENTS 6 5656652 5656334 [email protected]
AMAN FOR SECURITIES LTD. 6 5201444 5201430 [email protected]
AMMAN INVESTMENT & SECURITIES CO. LTD. 6 5672572 5672572 [email protected]
AMWAL BROKERAGE 6 5000584 5000580 [email protected]
ARAB COOPERATION FINANCIAL INVESTMENTS CO. 6 5629300 5682941 [email protected]
ARAB FALCON CO FOR SELLING & BUYING SECURITIES LTD. 6 5608651 5664302 [email protected]
ARAB FINANCIAL AND CONSULTANCY SERVICES CO. 6 5669257 5669258 [email protected]
ASIA STOCK BROKER 6 5609191 5161551 [email protected]
CAPITAL INVESTMENTS 6 5200330 5692872 [email protected]
DELTA FINANCIAL INVESTMENTS 2 7254664 7254660 [email protected]
EFG-HERMES JORDAN 6 5543200 5543206 [email protected]
ELITE FINANCIAL SERVICES 6 5505755 5547878 [email protected]
EMERGING MARKETS FOR FINANCIAL SEVICES & INVESTMENT CO. 6 5651547 5651546 [email protected]
EXCEL FOR FINANCIAL INVESTMENT 6 5654990 5675951 [email protected]
EXPERTS FINANCIAL SERVICES 6 5661608 5663905 [email protected]
FRIENDS FINANCIAL INV & BROKERAGE CO. 6 5639446 5680298 [email protected]
IBDA’ FOR FINANCIAL INVESTMENT 6 5678000 5668910 [email protected]
IMCAN FOR FINANCIAL SERVICES 6 5000500 5000500 [email protected]
INTERNATIONAL BROKARAGE AND FINANCIAL MARKETS COMPANY 6 5503300 5855362 [email protected]
INTERNATIONAL FINANCIAL ADVISORS 6 5690922 5626665 [email protected]
INTERNATIONAL FINANCIAL CENTER 6 5621786 5696720 [email protected]
INVESTMENT HOUSE FOR FINANCIAL SERVICES 6 5817213 5816749 [email protected]
ISTITHMAR FOR FINANCIAL SERVICES 6 5007000 5610555 [email protected]
JORDAN GULF INVESTMENT CO. 6 5660970 5675617 [email protected]
JORDAN RIVER FINANCIAL INVESTMENT 6 5560023 5530801 [email protected]
JORDANIAN EXPATRIATES FOR FINANCIAL BROKERAGE 6 5654613 5654615
JORDANIAN SAUDI EMIRATES FINANCIAL INVESTMENT CO. 6 5562233 5562234 [email protected]
KUWAIT & MIDDLE EAST FINANCIAL INVESTMENT CO- JORDAN 6 5502929 5531692 [email protected]
MISC FINANCIAL BROKERAGE CORPORATION 6 5682765 5682850 [email protected]
MUBADALA FINANCIAL INVESTMENTS COMPANY W.L.L 6 5925252 5927146 [email protected]
NATIONAL PORTFOLIO SECURITIES 6 5609000 5609001 [email protected]
OSOOL INVESTMENT AND FINANCIAL SERVICES 6 4603460 5696367
PHILADELPHIA INVESTMENT BANK 6 5609800 5657536
SABAEK FOR FINANCIAL SECVICES 6 5921180 5924395 [email protected]
SAMIR & SAMEH BROS. FOR INVESTMENT 6 5671546 5684476 [email protected]
SANABEL AL-KHAIR FOR FINANCIAL INVESTMENTS 6 5653046 5653047 [email protected]
SHARECO BROKERAGE COMPANY 6 5100700 5100702/01 [email protected]
SHUA’A FOR SECURITIES TRADING AND INVESTMENT 6 5623006 5623004 [email protected]
SOCIETE GENERALE JORDAN-BROKERAGE 6 5681651 5681258 [email protected]
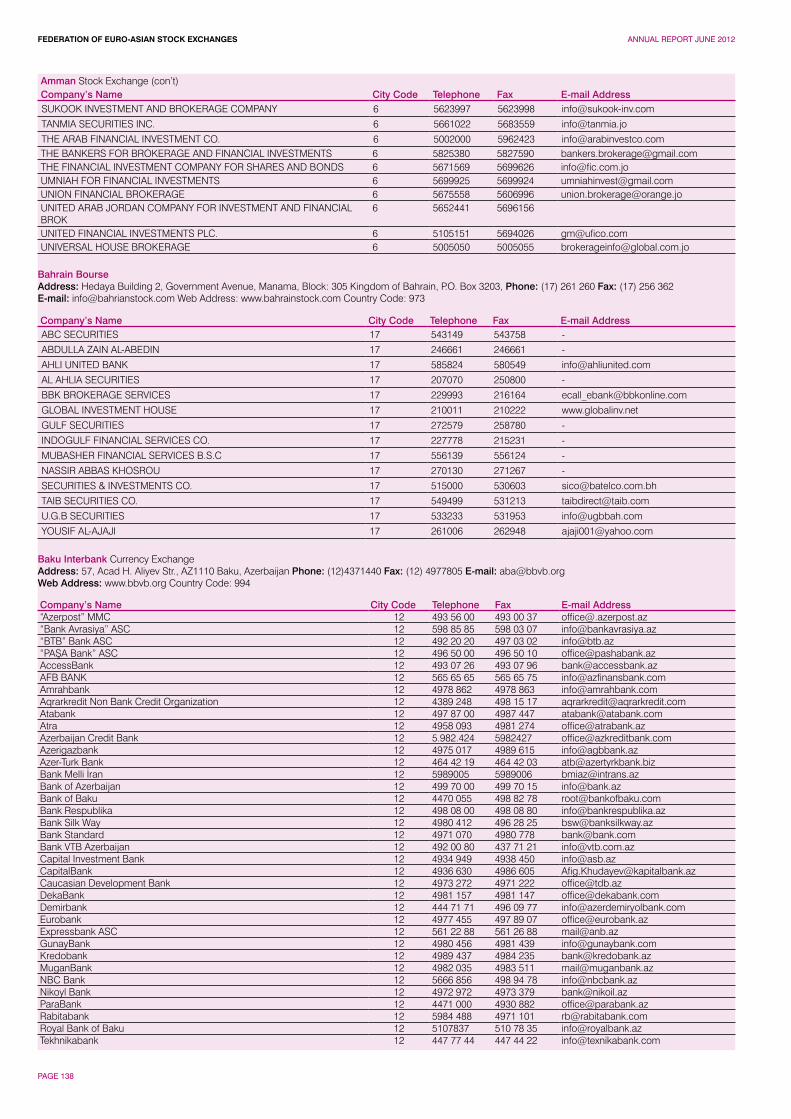
FEDERATION OF EURO-ASIAN STOCK EXCHANGES ANNUAL REPORT JUNE 2012
PAGE 138
Amman Stock Exchange (con’t)Company’s Name City Code Telephone Fax E-mail AddressSUKOOK INVESTMENT AND BROKERAGE COMPANY 6 5623997 5623998 [email protected]
TANMIA SECURITIES INC. 6 5661022 5683559 [email protected]
THE ARAB FINANCIAL INVESTMENT CO. 6 5002000 5962423 [email protected] BANKERS FOR BROKERAGE AND FINANCIAL INVESTMENTS 6 5825380 5827590 [email protected] FINANCIAL INVESTMENT COMPANY FOR SHARES AND BONDS 6 5671569 5699626 [email protected] FOR FINANCIAL INVESTMENTS 6 5699925 5699924 [email protected] FINANCIAL BROKERAGE 6 5675558 5606996 [email protected] ARAB JORDAN COMPANY FOR INVESTMENT AND FINANCIAL BROK
6 5652441 5696156
UNITED FINANCIAL INVESTMENTS PLC. 6 5105151 5694026 [email protected] HOUSE BROKERAGE 6 5005050 5005055 [email protected]
Bahrain Bourse Address: Hedaya Building 2, Government Avenue, Manama, Block: 305 Kingdom of Bahrain, P.O. Box 3203, Phone: (17) 261 260 Fax: (17) 256 362E-mail: [email protected] Web Address: www.bahrainstock.com Country Code: 973
Company’s Name City Code Telephone Fax E-mail AddressABC SECURITIES 17 543149 543758 -
ABDULLA ZAIN AL-ABEDIN 17 246661 246661 -
AHLI UNITED BANK 17 585824 580549 [email protected]
AL AHLIA SECURITIES 17 207070 250800 -
BBK BROKERAGE SERVICES 17 229993 216164 [email protected]
GLOBAL INVESTMENT HOUSE 17 210011 210222 www.globalinv.net
GULF SECURITIES 17 272579 258780 -
INDOGULF FINANCIAL SERVICES CO. 17 227778 215231 -
MUBASHER FINANCIAL SERVICES B.S.C 17 556139 556124 -
NASSIR ABBAS KHOSROU 17 270130 271267 -
SECURITIES & INVESTMENTS CO. 17 515000 530603 [email protected]
TAIB SECURITIES CO. 17 549499 531213 [email protected]
U.G.B SECURITIES 17 533233 531953 [email protected]
YOUSIF AL-AJAJI 17 261006 262948 [email protected]
Baku Interbank Currency Exchange Address: 57, Acad H. Aliyev Str., AZ1110 Baku, Azerbaijan Phone: (12)4371440 Fax: (12) 4977805 E-mail: [email protected] Address: www.bbvb.org Country Code: 994
Company’s Name City Code Telephone Fax E-mail Address“Azerpost” MMC 12 493 56 00 493 00 37 [email protected]“Bank Avrasiya” ASC 12 598 85 85 598 03 07 [email protected]“BTB” Bank ASC 12 492 20 20 497 03 02 [email protected]“PAŞA Bank” ASC 12 496 50 00 496 50 10 [email protected] 12 493 07 26 493 07 96 [email protected] BANK 12 565 65 65 565 65 75 [email protected] 12 4978 862 4978 863 [email protected] Non Bank Credit Organization 12 4389 248 498 15 17 [email protected] 12 497 87 00 4987 447 [email protected] 12 4958 093 4981 274 [email protected] Credit Bank 12 5.982.424 5982427 [email protected] 12 4975 017 4989 615 [email protected] Bank 12 464 42 19 464 42 03 [email protected] Melli İran 12 5989005 5989006 [email protected] of Azerbaijan 12 499 70 00 499 70 15 [email protected] of Baku 12 4470 055 498 82 78 [email protected] Respublika 12 498 08 00 498 08 80 [email protected] Silk Way 12 4980 412 496 28 25 [email protected] Standard 12 4971 070 4980 778 [email protected] VTB Azerbaijan 12 492 00 80 437 71 21 [email protected] Investment Bank 12 4934 949 4938 450 [email protected] 12 4936 630 4986 605 [email protected] Development Bank 12 4973 272 4971 222 [email protected] 12 4981 157 4981 147 [email protected] 12 444 71 71 496 09 77 [email protected] 12 4977 455 497 89 07 [email protected] ASC 12 561 22 88 561 26 88 [email protected] 12 4980 456 4981 439 [email protected] 12 4989 437 4984 235 [email protected] 12 4982 035 4983 511 [email protected] Bank 12 5666 856 498 94 78 [email protected] Bank 12 4972 972 4973 379 [email protected] 12 4471 000 4930 882 [email protected] 12 5984 488 4971 101 [email protected] Bank of Baku 12 5107837 510 78 35 [email protected] 12 447 77 44 447 44 22 [email protected]
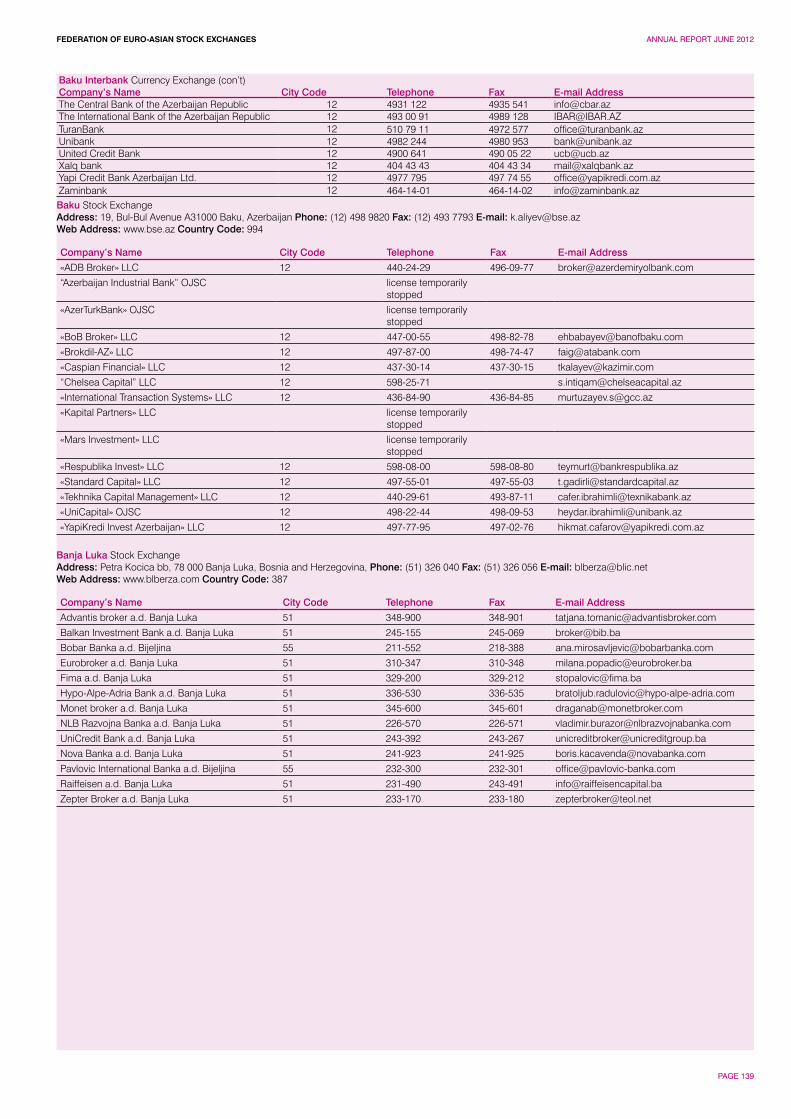
FEDERATION OF EURO-ASIAN STOCK EXCHANGES ANNUAL REPORT JUNE 2012
PAGE 139
Baku Interbank Currency Exchange (con’t)Company’s Name City Code Telephone Fax E-mail AddressThe Central Bank of the Azerbaijan Republic 12 4931 122 4935 541 [email protected] International Bank of the Azerbaijan Republic 12 493 00 91 4989 128 [email protected] 12 510 79 11 4972 577 [email protected] 12 4982 244 4980 953 [email protected] Credit Bank 12 4900 641 490 05 22 [email protected] bank 12 404 43 43 404 43 34 [email protected] Credit Bank Azerbaijan Ltd. 12 4977 795 497 74 55 [email protected] 12 464-14-01 464-14-02 [email protected] Stock Exchange Address: 19, Bul-Bul Avenue A31000 Baku, Azerbaijan Phone: (12) 498 9820 Fax: (12) 493 7793 E-mail: [email protected] Address: www.bse.az Country Code: 994
Company’s Name City Code Telephone Fax E-mail Address
«ADB Broker» LLC 12 440-24-29 496-09-77 [email protected]
“Azerbaijan Industrial Bank” OJSC license temporarily stopped
«AzerTurkBank» OJSC license temporarily stopped
«BoB Broker» LLC 12 447-00-55 498-82-78 [email protected]
«Brokdil-AZ» LLC 12 497-87-00 498-74-47 [email protected]
«Caspian Financial» LLC 12 437-30-14 437-30-15 [email protected]
“Chelsea Capital” LLC 12 598-25-71 [email protected]
«International Transaction Systems» LLC 12 436-84-90 436-84-85 [email protected]
«Kapital Partners» LLC license temporarily stopped
«Mars Investment» LLC license temporarily stopped
«Respublika Invest» LLC 12 598-08-00 598-08-80 [email protected]
«Standard Capital» LLC 12 497-55-01 497-55-03 [email protected]
«Tekhnika Capital Management» LLC 12 440-29-61 493-87-11 [email protected]
«UniCapital» OJSC 12 498-22-44 498-09-53 [email protected]
«YapiKredi Invest Azerbaijan» LLC 12 497-77-95 497-02-76 [email protected]
Banja Luka Stock ExchangeAddress: Petra Kocica bb, 78 000 Banja Luka, Bosnia and Herzegovina, Phone: (51) 326 040 Fax: (51) 326 056 E-mail: [email protected] Address: www.blberza.com Country Code: 387
Company’s Name City Code Telephone Fax E-mail Address
Advantis broker a.d. Banja Luka 51 348-900 348-901 [email protected]
Balkan Investment Bank a.d. Banja Luka 51 245-155 245-069 [email protected]
Bobar Banka a.d. Bijeljina 55 211-552 218-388 [email protected]
Eurobroker a.d. Banja Luka 51 310-347 310-348 [email protected]
Fima a.d. Banja Luka 51 329-200 329-212 [email protected]
Hypo-Alpe-Adria Bank a.d. Banja Luka 51 336-530 336-535 [email protected]
Monet broker a.d. Banja Luka 51 345-600 345-601 [email protected]
NLB Razvojna Banka a.d. Banja Luka 51 226-570 226-571 [email protected]
UniCredit Bank a.d. Banja Luka 51 243-392 243-267 [email protected]
Nova Banka a.d. Banja Luka 51 241-923 241-925 [email protected]
Pavlovic International Banka a.d. Bijeljina 55 232-300 232-301 [email protected]
Raiffeisen a.d. Banja Luka 51 231-490 243-491 [email protected]
Zepter Broker a.d. Banja Luka 51 233-170 233-180 [email protected]
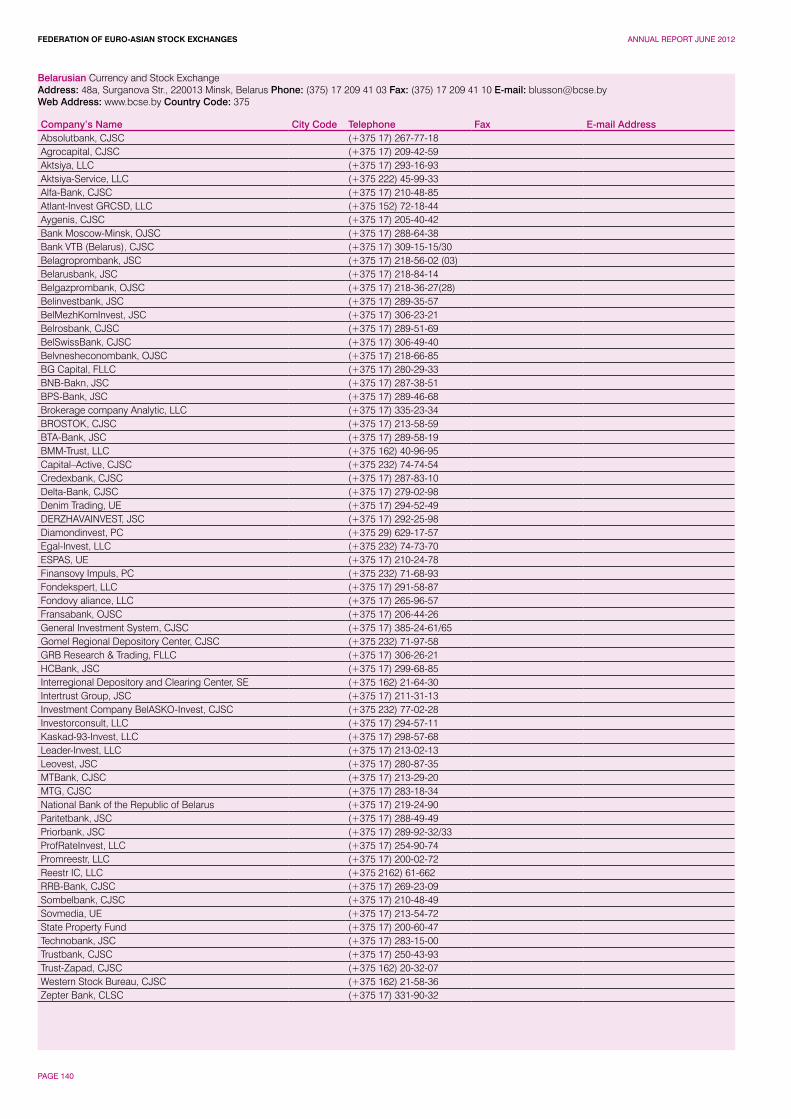
FEDERATION OF EURO-ASIAN STOCK EXCHANGES ANNUAL REPORT JUNE 2012
PAGE 140
Belarusian Currency and Stock ExchangeAddress: 48a, Surganova Str., 220013 Minsk, Belarus Phone: (375) 17 209 41 03 Fax: (375) 17 209 41 10 E-mail: [email protected] Address: www.bcse.by Country Code: 375
Company’s Name City Code Telephone Fax E-mail AddressAbsolutbank, CJSC (+375 17) 267-77-18Agrocapital, CJSC (+375 17) 209-42-59Aktsiya, LLC (+375 17) 293-16-93Aktsiya-Service, LLC (+375 222) 45-99-33Alfa-Bank, CJSC (+375 17) 210-48-85Atlant-Invest GRCSD, LLC (+375 152) 72-18-44Aygenis, CJSC (+375 17) 205-40-42Bank Moscow-Minsk, OJSC (+375 17) 288-64-38Bank VTB (Belarus), CJSC (+375 17) 309-15-15/30Belagroprombank, JSC (+375 17) 218-56-02 (03)Belarusbank, JSC (+375 17) 218-84-14Belgazprombank, OJSC (+375 17) 218-36-27(28)Belinvestbank, JSC (+375 17) 289-35-57BelMezhKomInvest, JSC (+375 17) 306-23-21Belrosbank, CJSC (+375 17) 289-51-69BelSwissBank, CJSC (+375 17) 306-49-40Belvnesheconombank, OJSC (+375 17) 218-66-85BG Capital, FLLC (+375 17) 280-29-33BNB-Bakn, JSC (+375 17) 287-38-51BPS-Bank, JSC (+375 17) 289-46-68Brokerage company Analytic, LLC (+375 17) 335-23-34BROSTOK, CJSC (+375 17) 213-58-59BTA-Bank, JSC (+375 17) 289-58-19BMM-Trust, LLC (+375 162) 40-96-95Capital–Active, CJSC (+375 232) 74-74-54Credexbank, CJSC (+375 17) 287-83-10Delta-Bank, CJSC (+375 17) 279-02-98Denim Trading, UE (+375 17) 294-52-49DERZHAVAINVEST, JSC (+375 17) 292-25-98Diamondinvest, PC (+375 29) 629-17-57Egal-Invest, LLC (+375 232) 74-73-70ESPAS, UE (+375 17) 210-24-78Finansovy Impuls, PC (+375 232) 71-68-93Fondekspert, LLC (+375 17) 291-58-87Fondovy aliance, LLC (+375 17) 265-96-57Fransabank, OJSC (+375 17) 206-44-26General Investment System, CJSC (+375 17) 385-24-61/65Gomel Regional Depository Center, CJSC (+375 232) 71-97-58GRB Research & Trading, FLLC (+375 17) 306-26-21HCBank, JSC (+375 17) 299-68-85Interregional Depository and Clearing Center, SE (+375 162) 21-64-30Intertrust Group, JSC (+375 17) 211-31-13Investment Company BelASKO-Invest, CJSC (+375 232) 77-02-28Investorconsult, LLC (+375 17) 294-57-11Kaskad-93-Invest, LLC (+375 17) 298-57-68Leader-Invest, LLC (+375 17) 213-02-13Leovest, JSC (+375 17) 280-87-35MTBank, CJSC (+375 17) 213-29-20MTG, CJSC (+375 17) 283-18-34National Bank of the Republic of Belarus (+375 17) 219-24-90Paritetbank, JSC (+375 17) 288-49-49Priorbank, JSC (+375 17) 289-92-32/33ProfRateInvest, LLC (+375 17) 254-90-74Promreestr, LLC (+375 17) 200-02-72Reestr IC, LLC (+375 2162) 61-662RRB-Bank, CJSC (+375 17) 269-23-09Sombelbank, CJSC (+375 17) 210-48-49Sovmedia, UE (+375 17) 213-54-72State Property Fund (+375 17) 200-60-47Technobank, JSC (+375 17) 283-15-00Trustbank, CJSC (+375 17) 250-43-93Trust-Zapad, CJSC (+375 162) 20-32-07Western Stock Bureau, CJSC (+375 162) 21-58-36Zepter Bank, CLSC (+375 17) 331-90-32
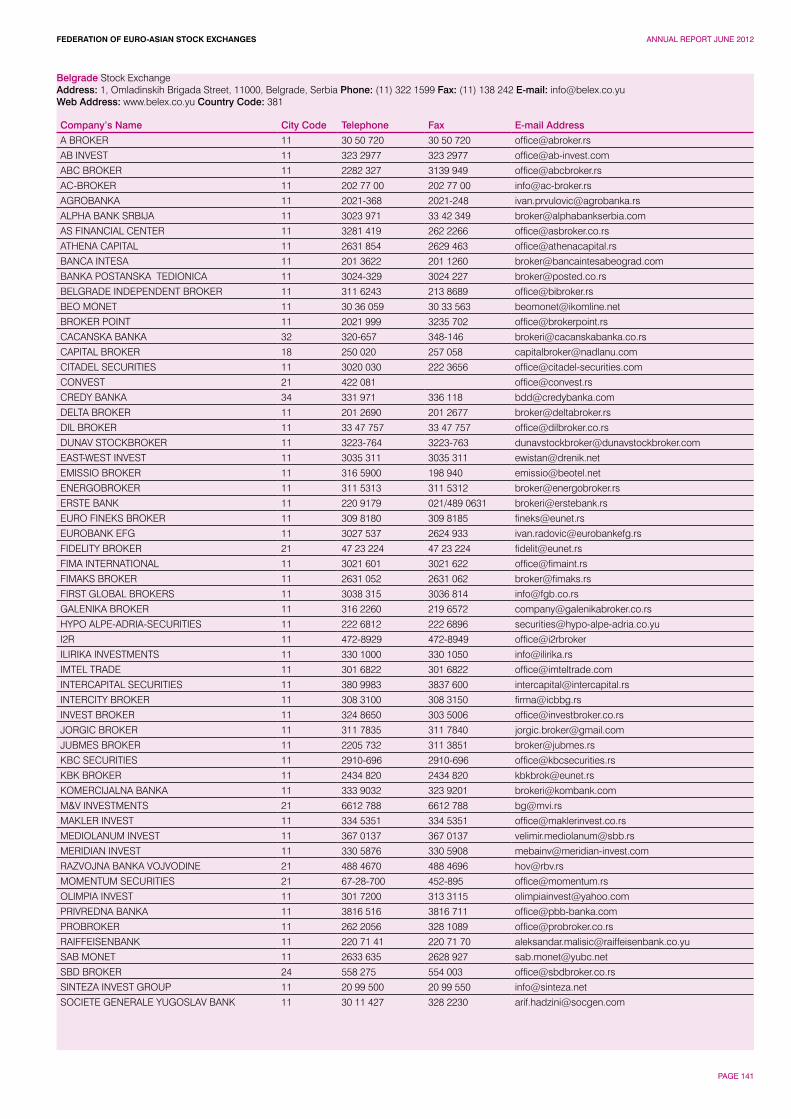
FEDERATION OF EURO-ASIAN STOCK EXCHANGES ANNUAL REPORT JUNE 2012
PAGE 141
Belgrade Stock Exchange Address: 1, Omladinskih Brigada Street, 11000, Belgrade, Serbia Phone: (11) 322 1599 Fax: (11) 138 242 E-mail: [email protected] Address: www.belex.co.yu Country Code: 381
Company’s Name City Code Telephone Fax E-mail Address
A BROKER 11 30 50 720 30 50 720 [email protected]
AB INVEST 11 323 2977 323 2977 [email protected]
ABC BROKER 11 2282 327 3139 949 [email protected]
AC-BROKER 11 202 77 00 202 77 00 [email protected]
AGROBANKA 11 2021-368 2021-248 [email protected]
ALPHA BANK SRBIJA 11 3023 971 33 42 349 [email protected]
AS FINANCIAL CENTER 11 3281 419 262 2266 [email protected]
ATHENA CAPITAL 11 2631 854 2629 463 [email protected]
BANCA INTESA 11 201 3622 201 1260 [email protected]
BANKA POSTANSKA ŠTEDIONICA 11 3024-329 3024 227 [email protected]
BELGRADE INDEPENDENT BROKER 11 311 6243 213 8689 [email protected]
BEO MONET 11 30 36 059 30 33 563 [email protected]
BROKER POINT 11 2021 999 3235 702 [email protected]
CACANSKA BANKA 32 320-657 348-146 [email protected]
CAPITAL BROKER 18 250 020 257 058 [email protected]
CITADEL SECURITIES 11 3020 030 222 3656 [email protected]
CONVEST 21 422 081 [email protected]
CREDY BANKA 34 331 971 336 118 [email protected]
DELTA BROKER 11 201 2690 201 2677 [email protected]
DIL BROKER 11 33 47 757 33 47 757 [email protected]
DUNAV STOCKBROKER 11 3223-764 3223-763 [email protected]
EAST-WEST INVEST 11 3035 311 3035 311 [email protected]
EMISSIO BROKER 11 316 5900 198 940 [email protected]
ENERGOBROKER 11 311 5313 311 5312 [email protected]
ERSTE BANK 11 220 9179 021/489 0631 [email protected]
EURO FINEKS BROKER 11 309 8180 309 8185 [email protected]
EUROBANK EFG 11 3027 537 2624 933 [email protected]
FIDELITY BROKER 21 47 23 224 47 23 224 [email protected]
FIMA INTERNATIONAL 11 3021 601 3021 622 [email protected]
FIMAKS BROKER 11 2631 052 2631 062 [email protected]
FIRST GLOBAL BROKERS 11 3038 315 3036 814 [email protected]
GALENIKA BROKER 11 316 2260 219 6572 [email protected]
HYPO ALPE-ADRIA-SECURITIES 11 222 6812 222 6896 [email protected]
I2R 11 472-8929 472-8949 office@i2rbroker
ILIRIKA INVESTMENTS 11 330 1000 330 1050 [email protected]
IMTEL TRADE 11 301 6822 301 6822 [email protected]
INTERCAPITAL SECURITIES 11 380 9983 3837 600 [email protected]
INTERCITY BROKER 11 308 3100 308 3150 [email protected]
INVEST BROKER 11 324 8650 303 5006 [email protected]
JORGIC BROKER 11 311 7835 311 7840 [email protected]
JUBMES BROKER 11 2205 732 311 3851 [email protected]
KBC SECURITIES 11 2910-696 2910-696 [email protected]
KBK BROKER 11 2434 820 2434 820 [email protected]
KOMERCIJALNA BANKA 11 333 9032 323 9201 [email protected]
M&V INVESTMENTS 21 6612 788 6612 788 [email protected]
MAKLER INVEST 11 334 5351 334 5351 [email protected]
MEDIOLANUM INVEST 11 367 0137 367 0137 [email protected]
MERIDIAN INVEST 11 330 5876 330 5908 [email protected]
RAZVOJNA BANKA VOJVODINE 21 488 4670 488 4696 [email protected]
MOMENTUM SECURITIES 21 67-28-700 452-895 [email protected]
OLIMPIA INVEST 11 301 7200 313 3115 [email protected]
PRIVREDNA BANKA 11 3816 516 3816 711 [email protected]
PROBROKER 11 262 2056 328 1089 [email protected]
RAIFFEISENBANK 11 220 71 41 220 71 70 [email protected]
SAB MONET 11 2633 635 2628 927 [email protected]
SBD BROKER 24 558 275 554 003 [email protected]
SINTEZA INVEST GROUP 11 20 99 500 20 99 550 [email protected]
SOCIETE GENERALE YUGOSLAV BANK 11 30 11 427 328 2230 [email protected]
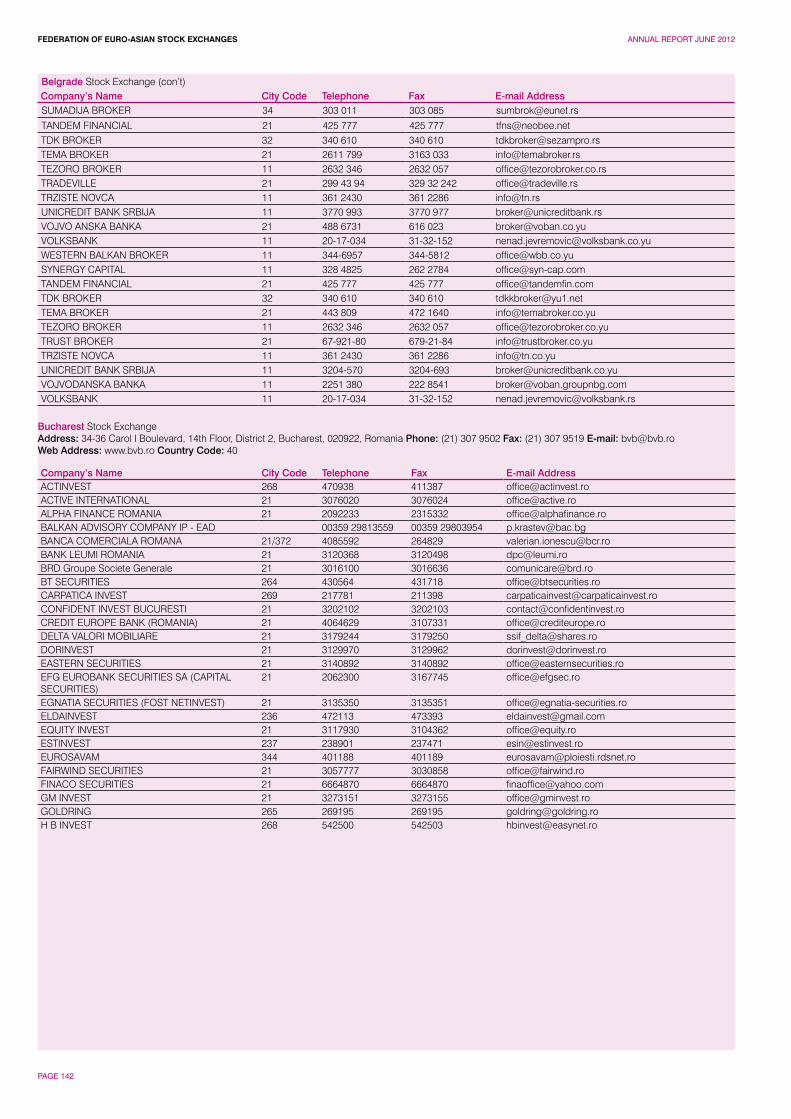
FEDERATION OF EURO-ASIAN STOCK EXCHANGES ANNUAL REPORT JUNE 2012
PAGE 142
Belgrade Stock Exchange (con’t)Company’s Name City Code Telephone Fax E-mail AddressSUMADIJA BROKER 34 303 011 303 085 [email protected]
TANDEM FINANCIAL 21 425 777 425 777 [email protected] BROKER 32 340 610 340 610 [email protected] BROKER 21 2611 799 3163 033 [email protected] BROKER 11 2632 346 2632 057 [email protected] 21 299 43 94 329 32 242 [email protected] NOVCA 11 361 2430 361 2286 [email protected] BANK SRBIJA 11 3770 993 3770 977 [email protected] ANSKA BANKA 21 488 6731 616 023 [email protected] 11 20-17-034 31-32-152 [email protected] BALKAN BROKER 11 344-6957 344-5812 [email protected] CAPITAL 11 328 4825 262 2784 [email protected] FINANCIAL 21 425 777 425 777 [email protected] BROKER 32 340 610 340 610 [email protected] BROKER 21 443 809 472 1640 [email protected] BROKER 11 2632 346 2632 057 [email protected] BROKER 21 67-921-80 679-21-84 [email protected] NOVCA 11 361 2430 361 2286 [email protected] BANK SRBIJA 11 3204-570 3204-693 [email protected] BANKA 11 2251 380 222 8541 [email protected] 11 20-17-034 31-32-152 [email protected]
Bucharest Stock Exchange Address: 34-36 Carol I Boulevard, 14th Floor, District 2, Bucharest, 020922 , Romania Phone: (21) 307 9502 Fax: (21) 307 9519 E-mail: [email protected] Address: www.bvb.ro Country Code: 40
Company’s Name City Code Telephone Fax E-mail AddressACTINVEST 268 470938 411387 [email protected] INTERNATIONAL 21 3076020 3076024 [email protected] FINANCE ROMANIA 21 2092233 2315332 [email protected] ADVISORY COMPANY IP - EAD 00359 29813559 00359 29803954 [email protected] COMERCIALA ROMANA 21/372 4085592 264829 [email protected] LEUMI ROMANIA 21 3120368 3120498 [email protected] Groupe Societe Generale 21 3016100 3016636 [email protected] SECURITIES 264 430564 431718 [email protected] INVEST 269 217781 211398 [email protected] INVEST BUCURESTI 21 3202102 3202103 [email protected] EUROPE BANK (ROMANIA) 21 4064629 3107331 [email protected] VALORI MOBILIARE 21 3179244 3179250 [email protected] 21 3129970 3129962 [email protected] SECURITIES 21 3140892 3140892 [email protected] EUROBANK SECURITIES SA (CAPITAL SECURITIES)
21 2062300 3167745 [email protected]
EGNATIA SECURITIES (FOST NETINVEST) 21 3135350 3135351 [email protected] 236 472113 473393 [email protected] INVEST 21 3117930 3104362 [email protected] 237 238901 237471 [email protected] 344 401188 401189 [email protected] SECURITIES 21 3057777 3030858 [email protected] SECURITIES 21 6664870 6664870 [email protected] INVEST 21 3273151 3273155 [email protected] 265 269195 269195 [email protected] B INVEST 268 542500 542503 [email protected]
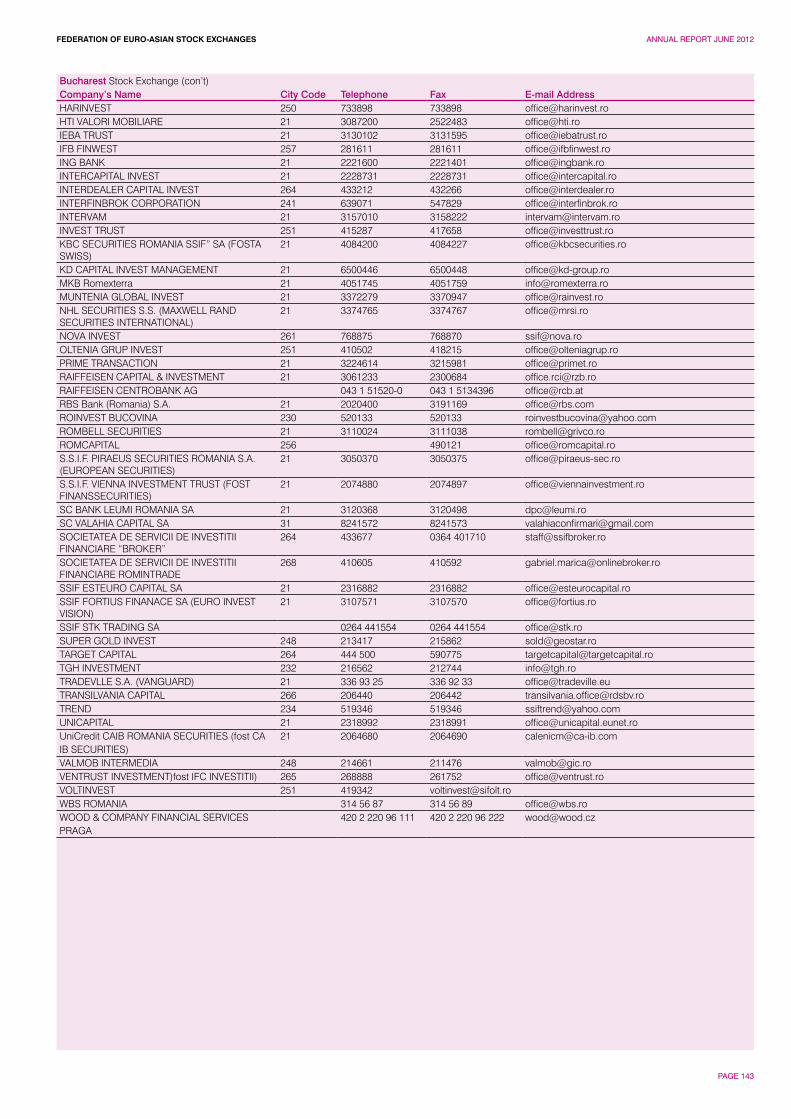
FEDERATION OF EURO-ASIAN STOCK EXCHANGES ANNUAL REPORT JUNE 2012
PAGE 143
Bucharest Stock Exchange (con’t)Company’s Name City Code Telephone Fax E-mail AddressHARINVEST 250 733898 733898 [email protected] VALORI MOBILIARE 21 3087200 2522483 [email protected] TRUST 21 3130102 3131595 [email protected] FINWEST 257 281611 281611 [email protected] BANK 21 2221600 2221401 [email protected] INVEST 21 2228731 2228731 [email protected] CAPITAL INVEST 264 433212 432266 [email protected] CORPORATION 241 639071 547829 [email protected] 21 3157010 3158222 [email protected] TRUST 251 415287 417658 [email protected] SECURITIES ROMANIA SSIF” SA (FOSTA SWISS)
21 4084200 4084227 [email protected]
KD CAPITAL INVEST MANAGEMENT 21 6500446 6500448 [email protected] Romexterra 21 4051745 4051759 [email protected] GLOBAL INVEST 21 3372279 3370947 [email protected] SECURITIES S.S. (MAXWELL RAND SECURITIES INTERNATIONAL)
21 3374765 3374767 [email protected]
NOVA INVEST 261 768875 768870 [email protected] GRUP INVEST 251 410502 418215 [email protected] TRANSACTION 21 3224614 3215981 [email protected] CAPITAL & INVESTMENT 21 3061233 2300684 [email protected] CENTROBANK AG 043 1 51520-0 043 1 5134396 [email protected] Bank (Romania) S.A. 21 2020400 3191169 [email protected] BUCOVINA 230 520133 520133 [email protected] SECURITIES 21 3110024 3111038 [email protected] 256 490121 [email protected]. PIRAEUS SECURITIES ROMANIA S.A. (EUROPEAN SECURITIES)
21 3050370 3050375 [email protected]
S.S.I.F. VIENNA INVESTMENT TRUST (FOST FINANSSECURITIES)
21 2074880 2074897 [email protected]
SC BANK LEUMI ROMANIA SA 21 3120368 3120498 [email protected] VALAHIA CAPITAL SA 31 8241572 8241573 [email protected] DE SERVICII DE INVESTITII FINANCIARE “BROKER”
264 433677 0364 401710 [email protected]
SOCIETATEA DE SERVICII DE INVESTITII FINANCIARE ROMINTRADE
268 410605 410592 [email protected]
SSIF ESTEURO CAPITAL SA 21 2316882 2316882 [email protected] FORTIUS FINANACE SA (EURO INVEST VISION)
21 3107571 3107570 [email protected]
SSIF STK TRADING SA 0264 441554 0264 441554 [email protected] GOLD INVEST 248 213417 215862 [email protected] CAPITAL 264 444 500 590775 [email protected] INVESTMENT 232 216562 212744 [email protected] S.A. (VANGUARD) 21 336 93 25 336 92 33 [email protected] CAPITAL 266 206440 206442 [email protected] 234 519346 519346 [email protected] 21 2318992 2318991 [email protected] CAIB ROMANIA SECURITIES (fost CA IB SECURITIES)
21 2064680 2064690 [email protected]
VALMOB INTERMEDIA 248 214661 211476 [email protected] INVESTMENT)fost IFC INVESTITII) 265 268888 261752 [email protected] 251 419342 [email protected] ROMANIA 314 56 87 314 56 89 [email protected] & COMPANY FINANCIAL SERVICES PRAGA
420 2 220 96 111 420 2 220 96 222 [email protected]
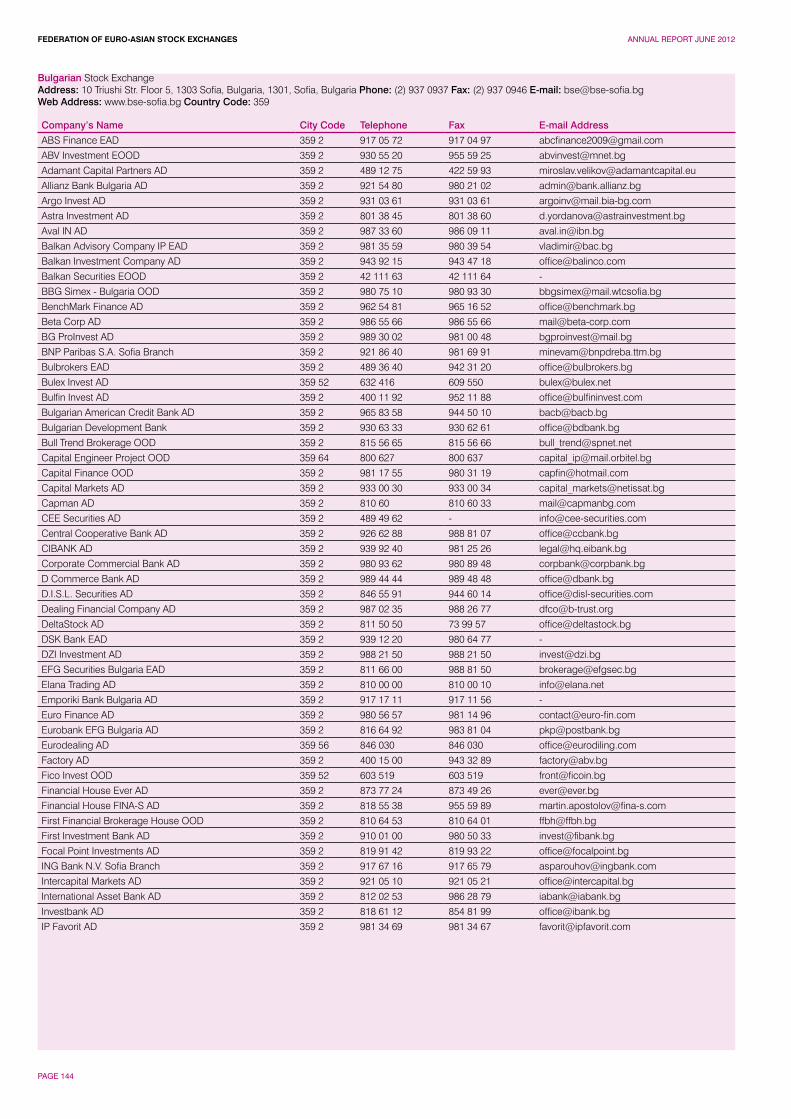
FEDERATION OF EURO-ASIAN STOCK EXCHANGES ANNUAL REPORT JUNE 2012
PAGE 144
Bulgarian Stock Exchange Address: 10 Triushi Str. Floor 5, 1303 Sofia, Bulgaria, 1301, Sofia, Bulgaria Phone: (2) 937 0937 Fax: (2) 937 0946 E-mail: [email protected] Address: www.bse-sofia.bg Country Code: 359
Company’s Name City Code Telephone Fax E-mail Address
ABS Finance EAD 359 2 917 05 72 917 04 97 [email protected]
ABV Investment EOOD 359 2 930 55 20 955 59 25 [email protected]
Adamant Capital Partners AD 359 2 489 12 75 422 59 93 [email protected]
Allianz Bank Bulgaria AD 359 2 921 54 80 980 21 02 [email protected]
Argo Invest AD 359 2 931 03 61 931 03 61 [email protected]
Astra Investment AD 359 2 801 38 45 801 38 60 [email protected]
Aval IN AD 359 2 987 33 60 986 09 11 [email protected]
Balkan Advisory Company IP EAD 359 2 981 35 59 980 39 54 [email protected]
Balkan Investment Company AD 359 2 943 92 15 943 47 18 [email protected]
Balkan Securities EOOD 359 2 42 111 63 42 111 64 -
BBG Simex - Bulgaria OOD 359 2 980 75 10 980 93 30 [email protected]
BenchMark Finance AD 359 2 962 54 81 965 16 52 [email protected]
Beta Corp AD 359 2 986 55 66 986 55 66 [email protected]
BG ProInvest AD 359 2 989 30 02 981 00 48 [email protected]
BNP Paribas S.A. Sofia Branch 359 2 921 86 40 981 69 91 [email protected]
Bulbrokers EAD 359 2 489 36 40 942 31 20 [email protected]
Bulex Invest AD 359 52 632 416 609 550 [email protected]
Bulfin Invest AD 359 2 400 11 92 952 11 88 [email protected]
Bulgarian American Credit Bank AD 359 2 965 83 58 944 50 10 [email protected]
Bulgarian Development Bank 359 2 930 63 33 930 62 61 [email protected]
Bull Trend Brokerage OOD 359 2 815 56 65 815 56 66 [email protected]
Capital Engineer Project OOD 359 64 800 627 800 637 [email protected]
Capital Finance OOD 359 2 981 17 55 980 31 19 [email protected]
Capital Markets AD 359 2 933 00 30 933 00 34 [email protected]
Capman AD 359 2 810 60 810 60 33 [email protected]
CEE Securities AD 359 2 489 49 62 - [email protected]
Central Cooperative Bank AD 359 2 926 62 88 988 81 07 [email protected]
CIBANK AD 359 2 939 92 40 981 25 26 [email protected]
Corporate Commercial Bank AD 359 2 980 93 62 980 89 48 [email protected]
D Commerce Bank AD 359 2 989 44 44 989 48 48 [email protected]
D.I.S.L. Securities AD 359 2 846 55 91 944 60 14 [email protected]
Dealing Financial Company AD 359 2 987 02 35 988 26 77 [email protected]
DeltaStock AD 359 2 811 50 50 73 99 57 [email protected]
DSK Bank EAD 359 2 939 12 20 980 64 77 -
DZI Investment AD 359 2 988 21 50 988 21 50 [email protected]
EFG Securities Bulgaria EAD 359 2 811 66 00 988 81 50 [email protected]
Elana Trading AD 359 2 810 00 00 810 00 10 [email protected]
Emporiki Bank Bulgaria AD 359 2 917 17 11 917 11 56 -
Euro Finance AD 359 2 980 56 57 981 14 96 [email protected]
Eurobank EFG Bulgaria AD 359 2 816 64 92 983 81 04 [email protected]
Eurodealing AD 359 56 846 030 846 030 [email protected]
Factory AD 359 2 400 15 00 943 32 89 [email protected]
Fico Invest OOD 359 52 603 519 603 519 [email protected]
Financial House Ever AD 359 2 873 77 24 873 49 26 [email protected]
Financial House FINA-S AD 359 2 818 55 38 955 59 89 [email protected]
First Financial Brokerage House OOD 359 2 810 64 53 810 64 01 [email protected]
First Investment Bank AD 359 2 910 01 00 980 50 33 [email protected]
Focal Point Investments AD 359 2 819 91 42 819 93 22 [email protected]
ING Bank N.V. Sofia Branch 359 2 917 67 16 917 65 79 [email protected]
Intercapital Markets AD 359 2 921 05 10 921 05 21 [email protected]
International Asset Bank AD 359 2 812 02 53 986 28 79 [email protected]
Investbank AD 359 2 818 61 12 854 81 99 [email protected]
IP Favorit AD 359 2 981 34 69 981 34 67 [email protected]
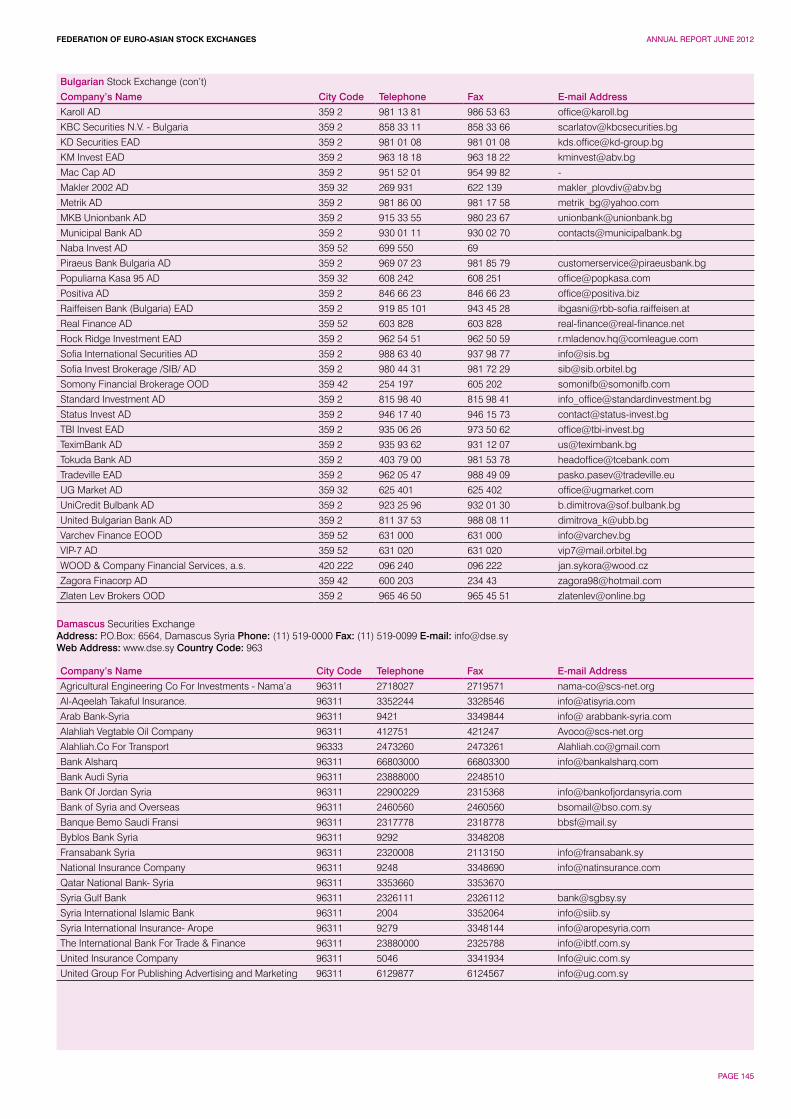
FEDERATION OF EURO-ASIAN STOCK EXCHANGES ANNUAL REPORT JUNE 2012
PAGE 145
Bulgarian Stock Exchange (con’t)
Company’s Name City Code Telephone Fax E-mail Address
Karoll AD 359 2 981 13 81 986 53 63 [email protected]
KBC Securities N.V. - Bulgaria 359 2 858 33 11 858 33 66 [email protected]
KD Securities EAD 359 2 981 01 08 981 01 08 [email protected]
KM Invest EAD 359 2 963 18 18 963 18 22 [email protected]
Mac Cap AD 359 2 951 52 01 954 99 82 -
Makler 2002 AD 359 32 269 931 622 139 [email protected]
Metrik AD 359 2 981 86 00 981 17 58 [email protected]
MKB Unionbank AD 359 2 915 33 55 980 23 67 [email protected]
Municipal Bank AD 359 2 930 01 11 930 02 70 [email protected]
Naba Invest AD 359 52 699 550 69
Piraeus Bank Bulgaria AD 359 2 969 07 23 981 85 79 [email protected]
Populiarna Kasa 95 AD 359 32 608 242 608 251 [email protected]
Positiva AD 359 2 846 66 23 846 66 23 [email protected]
Raiffeisen Bank (Bulgaria) EAD 359 2 919 85 101 943 45 28 [email protected]
Real Finance AD 359 52 603 828 603 828 [email protected]
Rock Ridge Investment EAD 359 2 962 54 51 962 50 59 [email protected]
Sofia International Securities AD 359 2 988 63 40 937 98 77 [email protected]
Sofia Invest Brokerage /SIB/ AD 359 2 980 44 31 981 72 29 [email protected]
Somony Financial Brokerage OOD 359 42 254 197 605 202 [email protected]
Standard Investment AD 359 2 815 98 40 815 98 41 [email protected]
Status Invest AD 359 2 946 17 40 946 15 73 [email protected]
TBI Invest EAD 359 2 935 06 26 973 50 62 [email protected]
TeximBank AD 359 2 935 93 62 931 12 07 [email protected]
Tokuda Bank AD 359 2 403 79 00 981 53 78 [email protected]
Tradeville EAD 359 2 962 05 47 988 49 09 [email protected]
UG Market AD 359 32 625 401 625 402 [email protected]
UniCredit Bulbank AD 359 2 923 25 96 932 01 30 [email protected]
United Bulgarian Bank AD 359 2 811 37 53 988 08 11 [email protected]
Varchev Finance EOOD 359 52 631 000 631 000 [email protected]
VIP-7 AD 359 52 631 020 631 020 [email protected]
WOOD & Company Financial Services, a.s. 420 222 096 240 096 222 [email protected]
Zagora Finacorp AD 359 42 600 203 234 43 [email protected]
Zlaten Lev Brokers OOD 359 2 965 46 50 965 45 51 [email protected]
Damascus Securities Exchange Address: P.O.Box: 6564, Damascus Syria Phone: (11) 519-0000 Fax: (11) 519-0099 E-mail: [email protected] Address: www.dse.sy Country Code: 963
Company’s Name City Code Telephone Fax E-mail Address
Agricultural Engineering Co For Investments - Nama’a 96311 2718027 2719571 [email protected]
Al-Aqeelah Takaful Insurance. 96311 3352244 3328546 [email protected]
Arab Bank-Syria 96311 9421 3349844 info@ arabbank-syria.com
Alahliah Vegtable Oil Company 96311 412751 421247 [email protected]
Alahliah.Co For Transport 96333 2473260 2473261 [email protected]
Bank Alsharq 96311 66803000 66803300 [email protected]
Bank Audi Syria 96311 23888000 2248510
Bank Of Jordan Syria 96311 22900229 2315368 [email protected]
Bank of Syria and Overseas 96311 2460560 2460560 [email protected]
Banque Bemo Saudi Fransi 96311 2317778 2318778 [email protected]
Byblos Bank Syria 96311 9292 3348208
Fransabank Syria 96311 2320008 2113150 [email protected]
National Insurance Company 96311 9248 3348690 [email protected]
Qatar National Bank- Syria 96311 3353660 3353670
Syria Gulf Bank 96311 2326111 2326112 [email protected]
Syria International Islamic Bank 96311 2004 3352064 [email protected]
Syria International Insurance- Arope 96311 9279 3348144 [email protected]
The International Bank For Trade & Finance 96311 23880000 2325788 [email protected]
United Insurance Company 96311 5046 3341934 [email protected]
United Group For Publishing Advertising and Marketing 96311 6129877 6124567 [email protected]
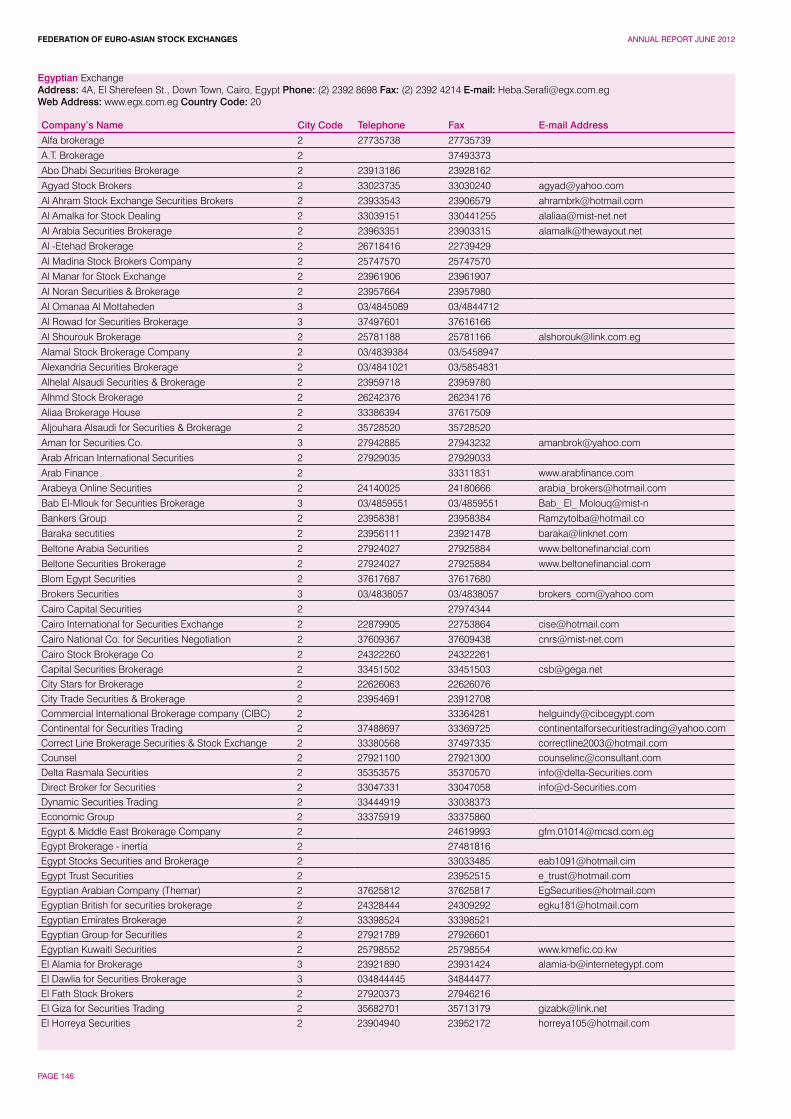
FEDERATION OF EURO-ASIAN STOCK EXCHANGES ANNUAL REPORT JUNE 2012
PAGE 146
Egyptian Exchange Address: 4A, El Sherefeen St., Down Town, Cairo, Egypt Phone: (2) 2392 8698 Fax: (2) 2392 4214 E-mail: [email protected] Address: www.egx.com.eg Country Code: 20
Company’s Name City Code Telephone Fax E-mail Address
Alfa brokerage 2 27735738 27735739
A.T. Brokerage 2 37493373
Abo Dhabi Securities Brokerage 2 23913186 23928162
Agyad Stock Brokers 2 33023735 33030240 [email protected]
Al Ahram Stock Exchange Securities Brokers 2 23933543 23906579 [email protected]
Al Amalka for Stock Dealing 2 33039151 330441255 [email protected]
Al Arabia Securities Brokerage 2 23963351 23903315 [email protected]
Al -Etehad Brokerage 2 26718416 22739429
Al Madina Stock Brokers Company 2 25747570 25747570
Al Manar for Stock Exchange 2 23961906 23961907
Al Noran Securities & Brokerage 2 23957664 23957980
Al Omanaa Al Mottaheden 3 03/4845089 03/4844712
Al Rowad for Securities Brokerage 3 37497601 37616166
Al Shourouk Brokerage 2 25781188 25781166 [email protected]
Alamal Stock Brokerage Company 2 03/4839384 03/5458947
Alexandria Securities Brokerage 2 03/4841021 03/5854831
Alhelal Alsaudi Securities & Brokerage 2 23959718 23959780
Alhmd Stock Brokerage 2 26242376 26234176
Aliaa Brokerage House 2 33386394 37617509
Aljouhara Alsaudi for Securities & Brokerage 2 35728520 35728520
Aman for Securities Co. 3 27942885 27943232 [email protected]
Arab African International Securities 2 27929035 27929033
Arab Finance 2 33311831 www.arabfinance.com
Arabeya Online Securities 2 24140025 24180666 [email protected]
Bab El-Mlouk for Securities Brokerage 3 03/4859551 03/4859551 Bab_ El_ Molouq@mist-n
Bankers Group 2 23958381 23958384 [email protected]
Baraka secutities 2 23956111 23921478 [email protected]
Beltone Arabia Securities 2 27924027 27925884 www.beltonefinancial.com
Beltone Securities Brokerage 2 27924027 27925884 www.beltonefinancial.com
Blom Egypt Securities 2 37617687 37617680
Brokers Securities 3 03/4838057 03/4838057 [email protected]
Cairo Capital Securities 2 27974344
Cairo International for Securities Exchange 2 22879905 22753864 [email protected]
Cairo National Co. for Securities Negotiation 2 37609367 37609438 [email protected]
Cairo Stock Brokerage Co 2 24322260 24322261Capital Securities Brokerage 2 33451502 33451503 [email protected] Stars for Brokerage 2 22626063 22626076City Trade Securities & Brokerage 2 23954691 23912708Commercial International Brokerage company (CIBC) 2 33364281 [email protected] for Securities Trading 2 37488697 33369725 [email protected] Line Brokerage Securities & Stock Exchange 2 33380568 37497335 [email protected] 2 27921100 27921300 [email protected] Rasmala Securities 2 35353575 35370570 [email protected] Broker for Securities 2 33047331 33047058 [email protected] Securities Trading 2 33444919 33038373Economic Group 2 33375919 33375860Egypt & Middle East Brokerage Company 2 24619993 [email protected] Brokerage - inertia 2 27481816Egypt Stocks Securities and Brokerage 2 33033485 [email protected] Trust Securities 2 23952515 [email protected] Arabian Company (Themar) 2 37625812 37625817 [email protected] British for securities brokerage 2 24328444 24309292 [email protected] Emirates Brokerage 2 33398524 33398521Egyptian Group for Securities 2 27921789 27926601Egyptian Kuwaiti Securities 2 25798552 25798554 www.kmefic.co.kwEl Alamia for Brokerage 3 23921890 23931424 [email protected] Dawlia for Securities Brokerage 3 034844445 34844477El Fath Stock Brokers 2 27920373 27946216El Giza for Securities Trading 2 35682701 35713179 [email protected] Horreya Securities 2 23904940 23952172 [email protected]
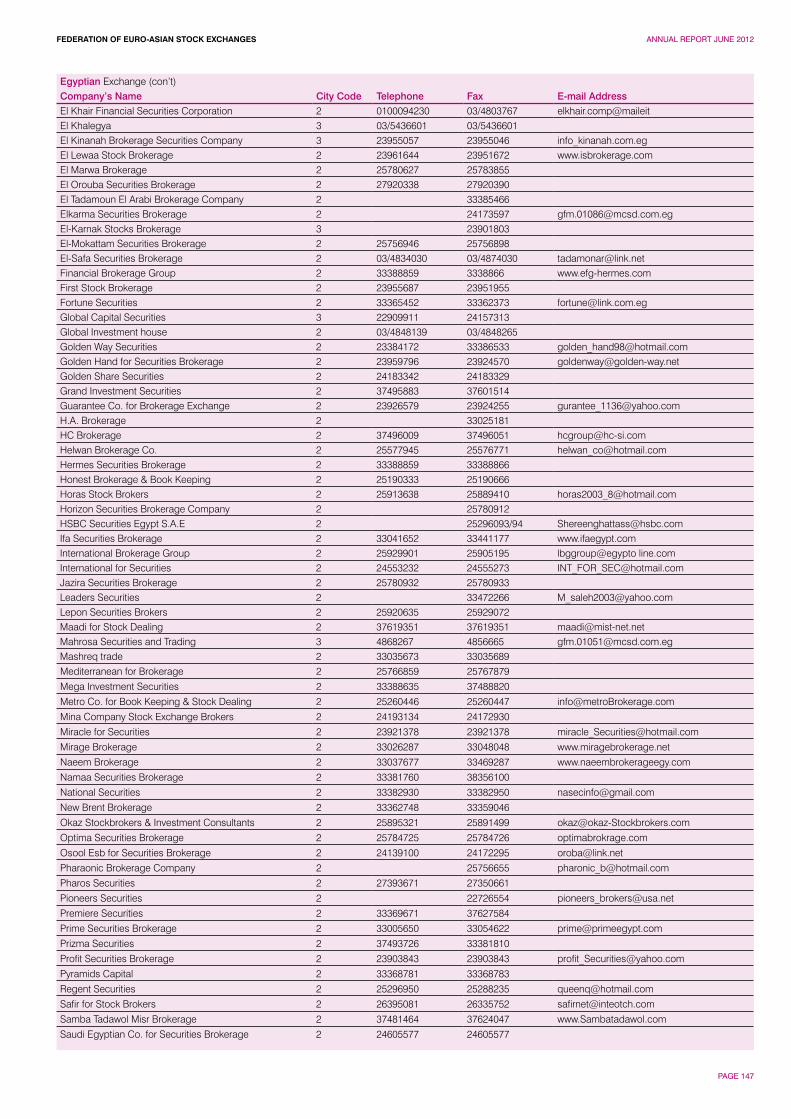
FEDERATION OF EURO-ASIAN STOCK EXCHANGES ANNUAL REPORT JUNE 2012
PAGE 147
Egyptian Exchange (con’t)Company’s Name City Code Telephone Fax E-mail AddressEl Khair Financial Securities Corporation 2 0100094230 03/4803767 elkhair.comp@maileitEl Khalegya 3 03/5436601 03/5436601El Kinanah Brokerage Securities Company 3 23955057 23955046 info_kinanah.com.egEl Lewaa Stock Brokerage 2 23961644 23951672 www.isbrokerage.comEl Marwa Brokerage 2 25780627 25783855El Orouba Securities Brokerage 2 27920338 27920390El Tadamoun El Arabi Brokerage Company 2 33385466Elkarma Securities Brokerage 2 24173597 [email protected] Stocks Brokerage 3 23901803El-Mokattam Securities Brokerage 2 25756946 25756898El-Safa Securities Brokerage 2 03/4834030 03/4874030 [email protected] Brokerage Group 2 33388859 3338866 www.efg-hermes.comFirst Stock Brokerage 2 23955687 23951955Fortune Securities 2 33365452 33362373 [email protected] Capital Securities 3 22909911 24157313Global Investment house 2 03/4848139 03/4848265Golden Way Securities 2 23384172 33386533 [email protected] Hand for Securities Brokerage 2 23959796 23924570 [email protected] Share Securities 2 24183342 24183329Grand Investment Securities 2 37495883 37601514Guarantee Co. for Brokerage Exchange 2 23926579 23924255 [email protected]. Brokerage 2 33025181HC Brokerage 2 37496009 37496051 [email protected] Brokerage Co. 2 25577945 25576771 [email protected] Securities Brokerage 2 33388859 33388866Honest Brokerage & Book Keeping 2 25190333 25190666Horas Stock Brokers 2 25913638 25889410 [email protected] Securities Brokerage Company 2 25780912HSBC Securities Egypt S.A.E 2 25296093/94 [email protected] Securities Brokerage 2 33041652 33441177 www.ifaegypt.comInternational Brokerage Group 2 25929901 25905195 lbggroup@egypto line.comInternational for Securities 2 24553232 24555273 [email protected] Securities Brokerage 2 25780932 25780933Leaders Securities 2 33472266 [email protected] Securities Brokers 2 25920635 25929072Maadi for Stock Dealing 2 37619351 37619351 [email protected] Securities and Trading 3 4868267 4856665 [email protected] trade 2 33035673 33035689Mediterranean for Brokerage 2 25766859 25767879
Mega Investment Securities 2 33388635 37488820
Metro Co. for Book Keeping & Stock Dealing 2 25260446 25260447 [email protected]
Mina Company Stock Exchange Brokers 2 24193134 24172930
Miracle for Securities 2 23921378 23921378 [email protected]
Mirage Brokerage 2 33026287 33048048 www.miragebrokerage.net
Naeem Brokerage 2 33037677 33469287 www.naeembrokerageegy.com
Namaa Securities Brokerage 2 33381760 38356100
National Securities 2 33382930 33382950 [email protected]
New Brent Brokerage 2 33362748 33359046
Okaz Stockbrokers & Investment Consultants 2 25895321 25891499 [email protected]
Optima Securities Brokerage 2 25784725 25784726 optimabrokrage.com
Osool Esb for Securities Brokerage 2 24139100 24172295 [email protected]
Pharaonic Brokerage Company 2 25756655 [email protected]
Pharos Securities 2 27393671 27350661
Pioneers Securities 2 22726554 [email protected]
Premiere Securities 2 33369671 37627584
Prime Securities Brokerage 2 33005650 33054622 [email protected]
Prizma Securities 2 37493726 33381810
Profit Securities Brokerage 2 23903843 23903843 [email protected]
Pyramids Capital 2 33368781 33368783
Regent Securities 2 25296950 25288235 [email protected]
Safir for Stock Brokers 2 26395081 26335752 [email protected]
Samba Tadawol Misr Brokerage 2 37481464 37624047 www.Sambatadawol.com
Saudi Egyptian Co. for Securities Brokerage 2 24605577 24605577
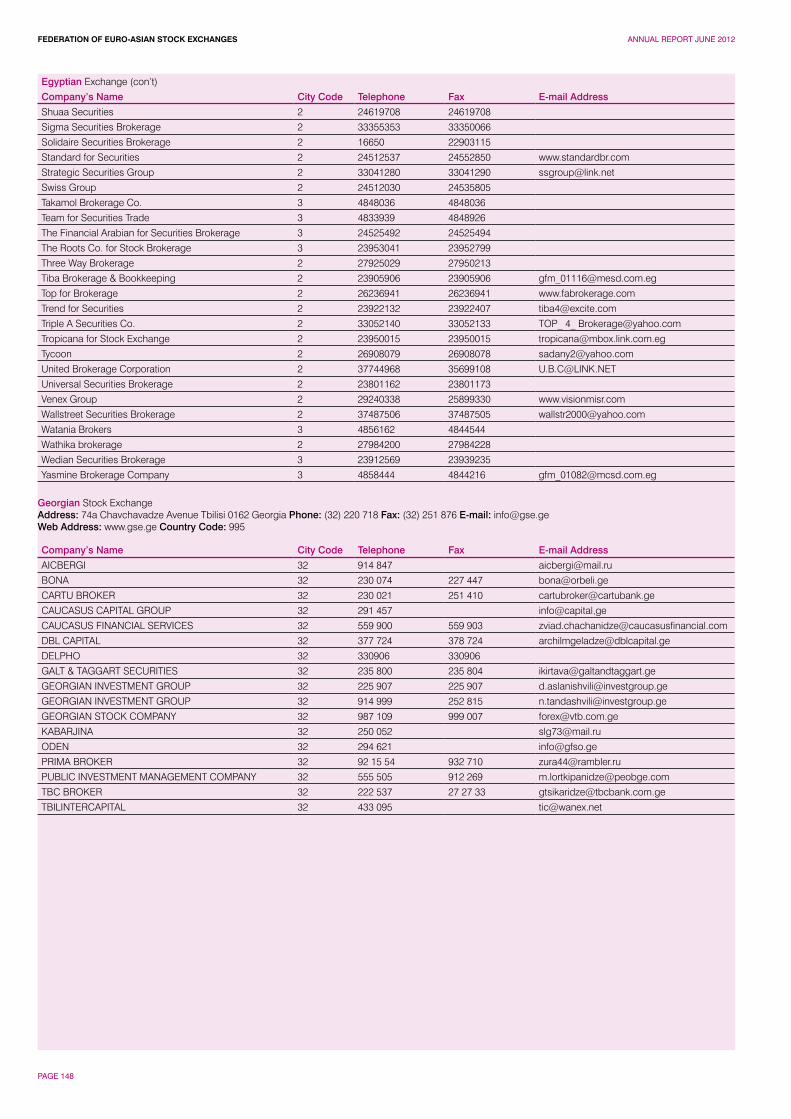
FEDERATION OF EURO-ASIAN STOCK EXCHANGES ANNUAL REPORT JUNE 2012
PAGE 148
Egyptian Exchange (con’t)
Company’s Name City Code Telephone Fax E-mail Address
Shuaa Securities 2 24619708 24619708
Sigma Securities Brokerage 2 33355353 33350066
Solidaire Securities Brokerage 2 16650 22903115
Standard for Securities 2 24512537 24552850 www.standardbr.com
Strategic Securities Group 2 33041280 33041290 [email protected]
Swiss Group 2 24512030 24535805
Takamol Brokerage Co. 3 4848036 4848036
Team for Securities Trade 3 4833939 4848926
The Financial Arabian for Securities Brokerage 3 24525492 24525494
The Roots Co. for Stock Brokerage 3 23953041 23952799
Three Way Brokerage 2 27925029 27950213
Tiba Brokerage & Bookkeeping 2 23905906 23905906 [email protected]
Top for Brokerage 2 26236941 26236941 www.fabrokerage.com
Trend for Securities 2 23922132 23922407 [email protected]
Triple A Securities Co. 2 33052140 33052133 TOP_ 4_ [email protected]
Tropicana for Stock Exchange 2 23950015 23950015 [email protected]
Tycoon 2 26908079 26908078 [email protected]
United Brokerage Corporation 2 37744968 35699108 [email protected]
Universal Securities Brokerage 2 23801162 23801173
Venex Group 2 29240338 25899330 www.visionmisr.com
Wallstreet Securities Brokerage 2 37487506 37487505 [email protected]
Watania Brokers 3 4856162 4844544
Wathika brokerage 2 27984200 27984228
Wedian Securities Brokerage 3 23912569 23939235
Yasmine Brokerage Company 3 4858444 4844216 [email protected]
Georgian Stock Exchange Address: 74a Chavchavadze Avenue Tbilisi 0162 Georgia Phone: (32) 220 718 Fax: (32) 251 876 E-mail: [email protected] Address: www.gse.ge Country Code: 995
Company’s Name City Code Telephone Fax E-mail Address
AICBERGI 32 914 847 [email protected]
BONA 32 230 074 227 447 [email protected]
CARTU BROKER 32 230 021 251 410 [email protected]
CAUCASUS CAPITAL GROUP 32 291 457 info@capital,ge
CAUCASUS FINANCIAL SERVICES 32 559 900 559 903 [email protected]
DBL CAPITAL 32 377 724 378 724 [email protected]
DELPHO 32 330906 330906
GALT & TAGGART SECURITIES 32 235 800 235 804 [email protected]
GEORGIAN INVESTMENT GROUP 32 225 907 225 907 [email protected]
GEORGIAN INVESTMENT GROUP 32 914 999 252 815 [email protected]
GEORGIAN STOCK COMPANY 32 987 109 999 007 [email protected]
KABARJINA 32 250 052 [email protected]
ODEN 32 294 621 [email protected]
PRIMA BROKER 32 92 15 54 932 710 [email protected]
PUBLIC INVESTMENT MANAGEMENT COMPANY 32 555 505 912 269 [email protected]
TBC BROKER 32 222 537 27 27 33 [email protected]
TBILINTERCAPITAL 32 433 095 [email protected]
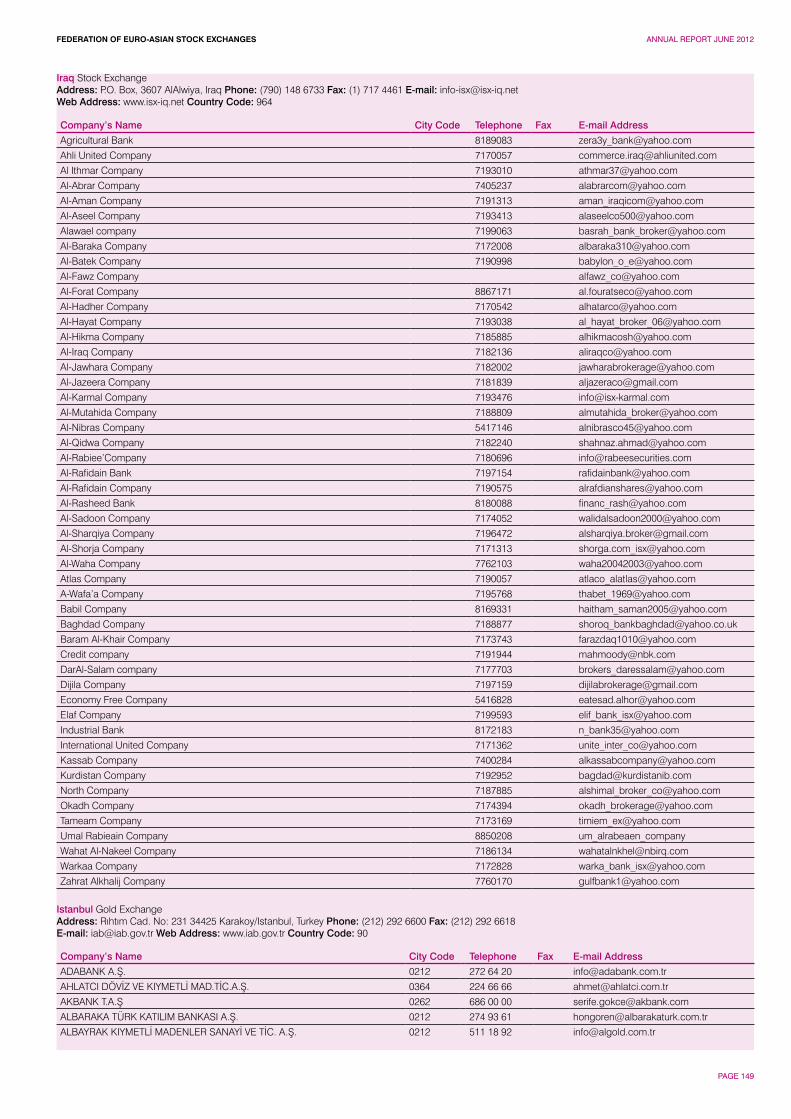
FEDERATION OF EURO-ASIAN STOCK EXCHANGES ANNUAL REPORT JUNE 2012
PAGE 149
Iraq Stock Exchange Address: P.O. Box, 3607 AlAlwiya, Iraq Phone: (790) 148 6733 Fax: (1) 717 4461 E-mail: [email protected] Address: www.isx-iq.net Country Code: 964
Company’s Name City Code Telephone Fax E-mail Address
Agricultural Bank 8189083 [email protected]
Ahli United Company 7170057 [email protected]
Al Ithmar Company 7193010 [email protected]
Al-Abrar Company 7405237 [email protected]
Al-Aman Company 7191313 [email protected]
Al-Aseel Company 7193413 [email protected]
Alawael company 7199063 [email protected]
Al-Baraka Company 7172008 [email protected]
Al-Batek Company 7190998 [email protected]
Al-Fawz Company [email protected]
Al-Forat Company 8867171 [email protected]
Al-Hadher Company 7170542 [email protected]
Al-Hayat Company 7193038 [email protected]
Al-Hikma Company 7185885 [email protected]
Al-Iraq Company 7182136 [email protected]
Al-Jawhara Company 7182002 [email protected]
Al-Jazeera Company 7181839 [email protected]
Al-Karmal Company 7193476 [email protected]
Al-Mutahida Company 7188809 [email protected]
Al-Nibras Company 5417146 [email protected]
Al-Qidwa Company 7182240 [email protected]
Al-Rabiee’Company 7180696 [email protected]
Al-Rafidain Bank 7197154 [email protected]
Al-Rafidain Company 7190575 [email protected]
Al-Rasheed Bank 8180088 [email protected]
Al-Sadoon Company 7174052 [email protected]
Al-Sharqiya Company 7196472 [email protected]
Al-Shorja Company 7171313 [email protected]
Al-Waha Company 7762103 [email protected]
Atlas Company 7190057 [email protected]
A-Wafa’a Company 7195768 [email protected]
Babil Company 8169331 [email protected]
Baghdad Company 7188877 [email protected]
Baram Al-Khair Company 7173743 [email protected]
Credit company 7191944 [email protected]
DarAl-Salam company 7177703 [email protected]
Dijila Company 7197159 [email protected]
Economy Free Company 5416828 [email protected]
Elaf Company 7199593 [email protected]
Industrial Bank 8172183 [email protected]
International United Company 7171362 [email protected]
Kassab Company 7400284 [email protected]
Kurdistan Company 7192952 [email protected]
North Company 7187885 [email protected]
Okadh Company 7174394 [email protected]
Tameam Company 7173169 [email protected]
Umal Rabieain Company 8850208 um_alrabeaen_company
Wahat Al-Nakeel Company 7186134 [email protected]
Warkaa Company 7172828 [email protected]
Zahrat Alkhalij Company 7760170 [email protected]
Istanbul Gold Exchange Address: Rıhtım Cad. No: 231 34425 Karakoy/Istanbul, Turkey Phone: (212) 292 6600 Fax: (212) 292 6618E-mail: [email protected] Web Address: www.iab.gov.tr Country Code: 90
Company’s Name City Code Telephone Fax E-mail Address
ADABANK A.Ş. 0212 272 64 20 [email protected]
AHLATCI DÖVİZ VE KIYMETLİ MAD.TİC.A.Ş. 0364 224 66 66 [email protected]
AKBANK T.A.Ş 0262 686 00 00 [email protected]
ALBARAKA TÜRK KATILIM BANKASI A.Ş. 0212 274 93 61 [email protected]
ALBAYRAK KIYMETLİ MADENLER SANAYİ VE TİC. A.Ş. 0212 511 18 92 [email protected]
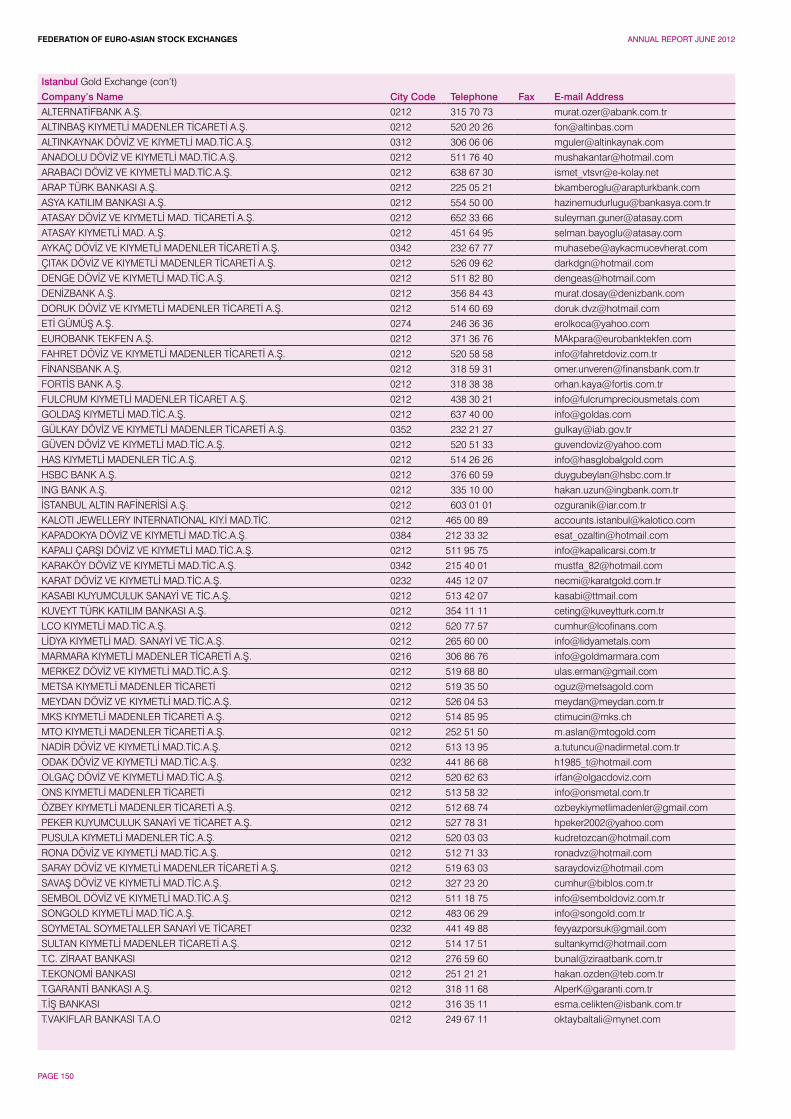
FEDERATION OF EURO-ASIAN STOCK EXCHANGES ANNUAL REPORT JUNE 2012
PAGE 150
Istanbul Gold Exchange (con’t)
Company’s Name City Code Telephone Fax E-mail Address
ALTERNATİFBANK A.Ş. 0212 315 70 73 [email protected]
ALTINBAŞ KIYMETLİ MADENLER TİCARETİ A.Ş. 0212 520 20 26 [email protected]
ALTINKAYNAK DÖVİZ VE KIYMETLİ MAD.TİC.A.Ş. 0312 306 06 06 [email protected]
ANADOLU DÖVİZ VE KIYMETLİ MAD.TİC.A.Ş. 0212 511 76 40 [email protected]
ARABACI DÖVİZ VE KIYMETLİ MAD.TİC.A.Ş. 0212 638 67 30 [email protected]
ARAP TÜRK BANKASI A.Ş. 0212 225 05 21 [email protected]
ASYA KATILIM BANKASI A.Ş. 0212 554 50 00 [email protected]
ATASAY DÖVİZ VE KIYMETLİ MAD. TİCARETİ A.Ş. 0212 652 33 66 [email protected]
ATASAY KIYMETLİ MAD. A.Ş. 0212 451 64 95 [email protected]
AYKAÇ DÖVİZ VE KIYMETLİ MADENLER TİCARETİ A.Ş. 0342 232 67 77 [email protected]
ÇITAK DÖVİZ VE KIYMETLİ MADENLER TİCARETİ A.Ş. 0212 526 09 62 [email protected]
DENGE DÖVİZ VE KIYMETLİ MAD.TİC.A.Ş. 0212 511 82 80 [email protected]
DENİZBANK A.Ş. 0212 356 84 43 [email protected]
DORUK DÖVİZ VE KIYMETLİ MADENLER TİCARETİ A.Ş. 0212 514 60 69 [email protected]
ETİ GÜMÜŞ A.Ş. 0274 246 36 36 [email protected]
EUROBANK TEKFEN A.Ş. 0212 371 36 76 [email protected]
FAHRET DÖVİZ VE KIYMETLİ MADENLER TİCARETİ A.Ş. 0212 520 58 58 [email protected]
FİNANSBANK A.Ş. 0212 318 59 31 [email protected]
FORTİS BANK A.Ş. 0212 318 38 38 [email protected]
FULCRUM KIYMETLİ MADENLER TİCARET A.Ş. 0212 438 30 21 [email protected]
GOLDAŞ KIYMETLİ MAD.TİC.A.Ş. 0212 637 40 00 [email protected]
GÜLKAY DÖVİZ VE KIYMETLİ MADENLER TİCARETİ A.Ş. 0352 232 21 27 [email protected]
GÜVEN DÖVİZ VE KIYMETLİ MAD.TİC.A.Ş. 0212 520 51 33 [email protected]
HAS KIYMETLİ MADENLER TİC.A.Ş. 0212 514 26 26 [email protected]
HSBC BANK A.Ş. 0212 376 60 59 [email protected]
ING BANK A.Ş. 0212 335 10 00 [email protected]
İSTANBUL ALTIN RAFİNERİSİ A.Ş. 0212 603 01 01 [email protected]
KALOTI JEWELLERY INTERNATIONAL KIY.İ MAD.TİC. 0212 465 00 89 [email protected]
KAPADOKYA DÖVİZ VE KIYMETLİ MAD.TİC.A.Ş. 0384 212 33 32 [email protected]
KAPALI ÇARŞI DÖVİZ VE KIYMETLİ MAD.TİC.A.Ş. 0212 511 95 75 [email protected]
KARAKÖY DÖVİZ VE KIYMETLİ MAD.TİC.A.Ş. 0342 215 40 01 [email protected]
KARAT DÖVİZ VE KIYMETLİ MAD.TİC.A.Ş. 0232 445 12 07 [email protected]
KASABI KUYUMCULUK SANAYİ VE TİC.A.Ş. 0212 513 42 07 [email protected]
KUVEYT TÜRK KATILIM BANKASI A.Ş. 0212 354 11 11 [email protected]
LCO KIYMETLİ MAD.TİC.A.Ş. 0212 520 77 57 [email protected]
LİDYA KIYMETLİ MAD. SANAYİ VE TİC.A.Ş. 0212 265 60 00 [email protected]
MARMARA KIYMETLİ MADENLER TİCARETİ A.Ş. 0216 306 86 76 [email protected]
MERKEZ DÖVİZ VE KIYMETLİ MAD.TİC.A.Ş. 0212 519 68 80 [email protected]
METSA KIYMETLİ MADENLER TİCARETİ 0212 519 35 50 [email protected]
MEYDAN DÖVİZ VE KIYMETLİ MAD.TİC.A.Ş. 0212 526 04 53 [email protected]
MKS KIYMETLİ MADENLER TİCARETİ A.Ş. 0212 514 85 95 [email protected]
MTO KIYMETLİ MADENLER TİCARETİ A.Ş. 0212 252 51 50 [email protected]
NADİR DÖVİZ VE KIYMETLİ MAD.TİC.A.Ş. 0212 513 13 95 [email protected]
ODAK DÖVİZ VE KIYMETLİ MAD.TİC.A.Ş. 0232 441 86 68 [email protected]
OLGAÇ DÖVİZ VE KIYMETLİ MAD.TİC.A.Ş. 0212 520 62 63 [email protected]
ONS KIYMETLİ MADENLER TİCARETİ 0212 513 58 32 [email protected]
ÖZBEY KIYMETLİ MADENLER TİCARETİ A.Ş. 0212 512 68 74 [email protected]
PEKER KUYUMCULUK SANAYİ VE TİCARET A.Ş. 0212 527 78 31 [email protected]
PUSULA KIYMETLİ MADENLER TİC.A.Ş. 0212 520 03 03 [email protected]
RONA DÖVİZ VE KIYMETLİ MAD.TİC.A.Ş. 0212 512 71 33 [email protected]
SARAY DÖVİZ VE KIYMETLİ MADENLER TİCARETİ A.Ş. 0212 519 63 03 [email protected]
SAVAŞ DÖVİZ VE KIYMETLİ MAD.TİC.A.Ş. 0212 327 23 20 [email protected]
SEMBOL DÖVİZ VE KIYMETLİ MAD.TİC.A.Ş. 0212 511 18 75 [email protected]
SONGOLD KIYMETLİ MAD.TİC.A.Ş. 0212 483 06 29 [email protected]
SOYMETAL SOYMETALLER SANAYİ VE TİCARET 0232 441 49 88 [email protected]
SULTAN KIYMETLİ MADENLER TİCARETİ A.Ş. 0212 514 17 51 [email protected]
T.C. ZİRAAT BANKASI 0212 276 59 60 [email protected]
T.EKONOMİ BANKASI 0212 251 21 21 [email protected]
T.GARANTİ BANKASI A.Ş. 0212 318 11 68 [email protected]
T.İŞ BANKASI 0212 316 35 11 [email protected]
T.VAKIFLAR BANKASI T.A.O 0212 249 67 11 [email protected]
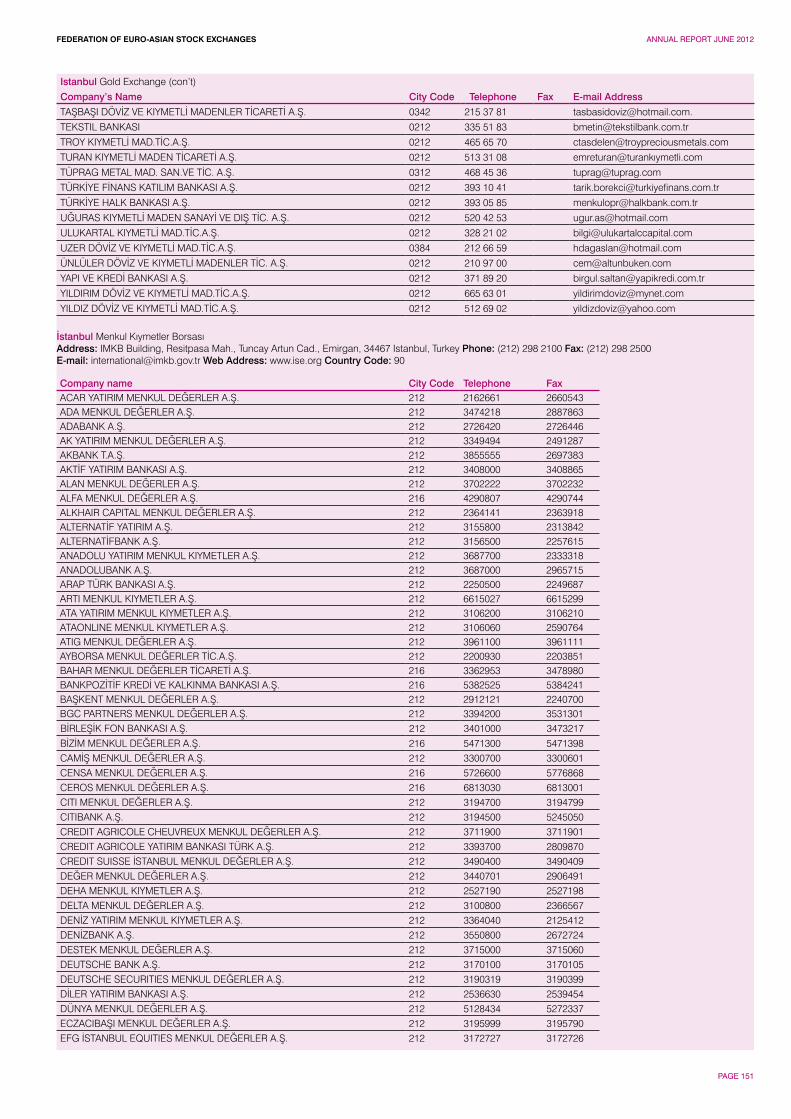
FEDERATION OF EURO-ASIAN STOCK EXCHANGES ANNUAL REPORT JUNE 2012
PAGE 151
Istanbul Gold Exchange (con’t)
Company’s Name City Code Telephone Fax E-mail Address
TAŞBAŞI DÖVİZ VE KIYMETLİ MADENLER TİCARETİ A.Ş. 0342 215 37 81 [email protected].
TEKSTIL BANKASI 0212 335 51 83 [email protected]
TROY KIYMETLİ MAD.TİC.A.Ş. 0212 465 65 70 [email protected]
TURAN KIYMETLİ MADEN TİCARETİ A.Ş. 0212 513 31 08 emreturan@turankıymetli.com
TÜPRAG METAL MAD. SAN.VE TİC. A.Ş. 0312 468 45 36 [email protected]
TÜRKİYE FİNANS KATILIM BANKASI A.Ş. 0212 393 10 41 [email protected]
TÜRKİYE HALK BANKASI A.Ş. 0212 393 05 85 [email protected]
UĞURAS KIYMETLİ MADEN SANAYİ VE DIŞ TİC. A.Ş. 0212 520 42 53 [email protected]
ULUKARTAL KIYMETLİ MAD.TİC.A.Ş. 0212 328 21 02 [email protected]
UZER DÖVİZ VE KIYMETLİ MAD.TİC.A.Ş. 0384 212 66 59 [email protected]
ÜNLÜLER DÖVİZ VE KIYMETLİ MADENLER TİC. A.Ş. 0212 210 97 00 [email protected]
YAPI VE KREDİ BANKASI A.Ş. 0212 371 89 20 [email protected]
YILDIRIM DÖVİZ VE KIYMETLİ MAD.TİC.A.Ş. 0212 665 63 01 [email protected]
YILDIZ DÖVİZ VE KIYMETLİ MAD.TİC.A.Ş. 0212 512 69 02 [email protected]
İstanbul Menkul Kıymetler BorsasıAddress: IMKB Building, Resitpasa Mah., Tuncay Artun Cad., Emirgan, 34467 Istanbul, Turkey Phone: (212) 298 2100 Fax: (212) 298 2500E-mail: [email protected] Web Address: www.ise.org Country Code: 90
Company name City Code Telephone FaxACAR YATIRIM MENKUL DEĞERLER A.Ş. 212 2162661 2660543ADA MENKUL DEĞERLER A.Ş. 212 3474218 2887863ADABANK A.Ş. 212 2726420 2726446AK YATIRIM MENKUL DEĞERLER A.Ş. 212 3349494 2491287AKBANK T.A.Ş. 212 3855555 2697383AKTİF YATIRIM BANKASI A.Ş. 212 3408000 3408865ALAN MENKUL DEĞERLER A.Ş. 212 3702222 3702232ALFA MENKUL DEĞERLER A.Ş. 216 4290807 4290744ALKHAIR CAPITAL MENKUL DEĞERLER A.Ş. 212 2364141 2363918ALTERNATİF YATIRIM A.Ş. 212 3155800 2313842ALTERNATİFBANK A.Ş. 212 3156500 2257615ANADOLU YATIRIM MENKUL KIYMETLER A.Ş. 212 3687700 2333318ANADOLUBANK A.Ş. 212 3687000 2965715ARAP TÜRK BANKASI A.Ş. 212 2250500 2249687ARTI MENKUL KIYMETLER A.Ş. 212 6615027 6615299ATA YATIRIM MENKUL KIYMETLER A.Ş. 212 3106200 3106210ATAONLINE MENKUL KIYMETLER A.Ş. 212 3106060 2590764ATIG MENKUL DEĞERLER A.Ş. 212 3961100 3961111AYBORSA MENKUL DEĞERLER TİC.A.Ş. 212 2200930 2203851BAHAR MENKUL DEĞERLER TİCARETİ A.Ş. 216 3362953 3478980BANKPOZİTİF KREDİ VE KALKINMA BANKASI A.Ş. 216 5382525 5384241BAŞKENT MENKUL DEĞERLER A.Ş. 212 2912121 2240700BGC PARTNERS MENKUL DEĞERLER A.Ş. 212 3394200 3531301BİRLEŞİK FON BANKASI A.Ş. 212 3401000 3473217BİZİM MENKUL DEĞERLER A.Ş. 216 5471300 5471398CAMİŞ MENKUL DEĞERLER A.Ş. 212 3300700 3300601CENSA MENKUL DEĞERLER A.Ş. 216 5726600 5776868CEROS MENKUL DEĞERLER A.Ş. 216 6813030 6813001CITI MENKUL DEĞERLER A.Ş. 212 3194700 3194799CITIBANK A.Ş. 212 3194500 5245050CREDIT AGRICOLE CHEUVREUX MENKUL DEĞERLER A.Ş. 212 3711900 3711901CREDIT AGRICOLE YATIRIM BANKASI TÜRK A.Ş. 212 3393700 2809870CREDIT SUISSE İSTANBUL MENKUL DEĞERLER A.Ş. 212 3490400 3490409DEĞER MENKUL DEĞERLER A.Ş. 212 3440701 2906491DEHA MENKUL KIYMETLER A.Ş. 212 2527190 2527198DELTA MENKUL DEĞERLER A.Ş. 212 3100800 2366567DENİZ YATIRIM MENKUL KIYMETLER A.Ş. 212 3364040 2125412DENİZBANK A.Ş. 212 3550800 2672724DESTEK MENKUL DEĞERLER A.Ş. 212 3715000 3715060DEUTSCHE BANK A.Ş. 212 3170100 3170105DEUTSCHE SECURITIES MENKUL DEĞERLER A.Ş. 212 3190319 3190399DİLER YATIRIM BANKASI A.Ş. 212 2536630 2539454DÜNYA MENKUL DEĞERLER A.Ş. 212 5128434 5272337ECZACIBAŞI MENKUL DEĞERLER A.Ş. 212 3195999 3195790EFG İSTANBUL EQUITIES MENKUL DEĞERLER A.Ş. 212 3172727 3172726
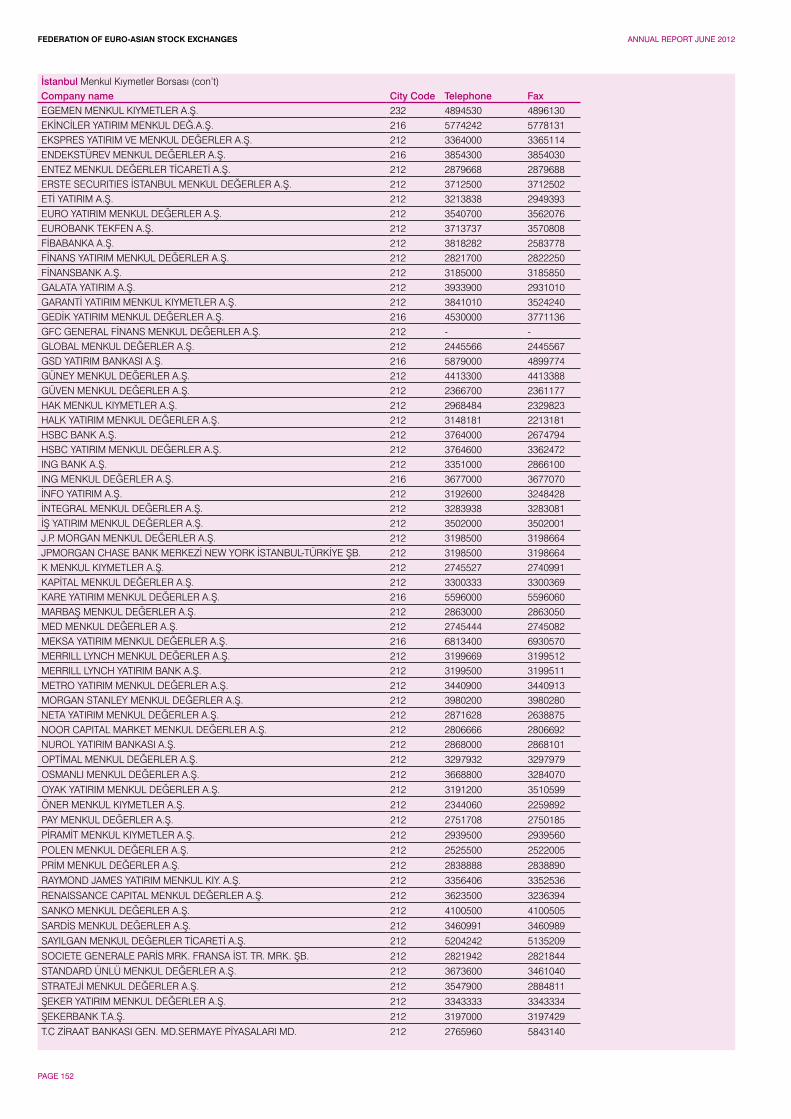
FEDERATION OF EURO-ASIAN STOCK EXCHANGES ANNUAL REPORT JUNE 2012
PAGE 152
İstanbul Menkul Kıymetler Borsası (con’t)Company name City Code Telephone FaxEGEMEN MENKUL KIYMETLER A.Ş. 232 4894530 4896130EKİNCİLER YATIRIM MENKUL DEĞ.A.Ş. 216 5774242 5778131EKSPRES YATIRIM VE MENKUL DEĞERLER A.Ş. 212 3364000 3365114ENDEKSTÜREV MENKUL DEĞERLER A.Ş. 216 3854300 3854030ENTEZ MENKUL DEĞERLER TİCARETİ A.Ş. 212 2879668 2879688ERSTE SECURITIES İSTANBUL MENKUL DEĞERLER A.Ş. 212 3712500 3712502ETİ YATIRIM A.Ş. 212 3213838 2949393EURO YATIRIM MENKUL DEĞERLER A.Ş. 212 3540700 3562076EUROBANK TEKFEN A.Ş. 212 3713737 3570808FİBABANKA A.Ş. 212 3818282 2583778FİNANS YATIRIM MENKUL DEĞERLER A.Ş. 212 2821700 2822250FİNANSBANK A.Ş. 212 3185000 3185850GALATA YATIRIM A.Ş. 212 3933900 2931010GARANTİ YATIRIM MENKUL KIYMETLER A.Ş. 212 3841010 3524240GEDİK YATIRIM MENKUL DEĞERLER A.Ş. 216 4530000 3771136GFC GENERAL FİNANS MENKUL DEĞERLER A.Ş. 212 - -GLOBAL MENKUL DEĞERLER A.Ş. 212 2445566 2445567GSD YATIRIM BANKASI A.Ş. 216 5879000 4899774GÜNEY MENKUL DEĞERLER A.Ş. 212 4413300 4413388GÜVEN MENKUL DEĞERLER A.Ş. 212 2366700 2361177HAK MENKUL KIYMETLER A.Ş. 212 2968484 2329823HALK YATIRIM MENKUL DEĞERLER A.Ş. 212 3148181 2213181HSBC BANK A.Ş. 212 3764000 2674794HSBC YATIRIM MENKUL DEĞERLER A.Ş. 212 3764600 3362472ING BANK A.Ş. 212 3351000 2866100ING MENKUL DEĞERLER A.Ş. 216 3677000 3677070İNFO YATIRIM A.Ş. 212 3192600 3248428İNTEGRAL MENKUL DEĞERLER A.Ş. 212 3283938 3283081İŞ YATIRIM MENKUL DEĞERLER A.Ş. 212 3502000 3502001J.P. MORGAN MENKUL DEĞERLER A.Ş. 212 3198500 3198664JPMORGAN CHASE BANK MERKEZİ NEW YORK İSTANBUL-TÜRKİYE ŞB. 212 3198500 3198664K MENKUL KIYMETLER A.Ş. 212 2745527 2740991KAPİTAL MENKUL DEĞERLER A.Ş. 212 3300333 3300369KARE YATIRIM MENKUL DEĞERLER A.Ş. 216 5596000 5596060MARBAŞ MENKUL DEĞERLER A.Ş. 212 2863000 2863050MED MENKUL DEĞERLER A.Ş. 212 2745444 2745082MEKSA YATIRIM MENKUL DEĞERLER A.Ş. 216 6813400 6930570MERRILL LYNCH MENKUL DEĞERLER A.Ş. 212 3199669 3199512MERRILL LYNCH YATIRIM BANK A.Ş. 212 3199500 3199511METRO YATIRIM MENKUL DEĞERLER A.Ş. 212 3440900 3440913MORGAN STANLEY MENKUL DEĞERLER A.Ş. 212 3980200 3980280NETA YATIRIM MENKUL DEĞERLER A.Ş. 212 2871628 2638875NOOR CAPITAL MARKET MENKUL DEĞERLER A.Ş. 212 2806666 2806692NUROL YATIRIM BANKASI A.Ş. 212 2868000 2868101OPTİMAL MENKUL DEĞERLER A.Ş. 212 3297932 3297979
OSMANLI MENKUL DEĞERLER A.Ş. 212 3668800 3284070
OYAK YATIRIM MENKUL DEĞERLER A.Ş. 212 3191200 3510599
ÖNER MENKUL KIYMETLER A.Ş. 212 2344060 2259892
PAY MENKUL DEĞERLER A.Ş. 212 2751708 2750185
PİRAMİT MENKUL KIYMETLER A.Ş. 212 2939500 2939560
POLEN MENKUL DEĞERLER A.Ş. 212 2525500 2522005
PRİM MENKUL DEĞERLER A.Ş. 212 2838888 2838890
RAYMOND JAMES YATIRIM MENKUL KIY. A.Ş. 212 3356406 3352536
RENAISSANCE CAPITAL MENKUL DEĞERLER A.Ş. 212 3623500 3236394
SANKO MENKUL DEĞERLER A.Ş. 212 4100500 4100505
SARDİS MENKUL DEĞERLER A.Ş. 212 3460991 3460989
SAYILGAN MENKUL DEĞERLER TİCARETİ A.Ş. 212 5204242 5135209
SOCIETE GENERALE PARİS MRK. FRANSA İST. TR. MRK. ŞB. 212 2821942 2821844
STANDARD ÜNLÜ MENKUL DEĞERLER A.Ş. 212 3673600 3461040
STRATEJİ MENKUL DEĞERLER A.Ş. 212 3547900 2884811
ŞEKER YATIRIM MENKUL DEĞERLER A.Ş. 212 3343333 3343334
ŞEKERBANK T.A.Ş. 212 3197000 3197429
T.C ZİRAAT BANKASI GEN. MD.SERMAYE PİYASALARI MD. 212 2765960 5843140
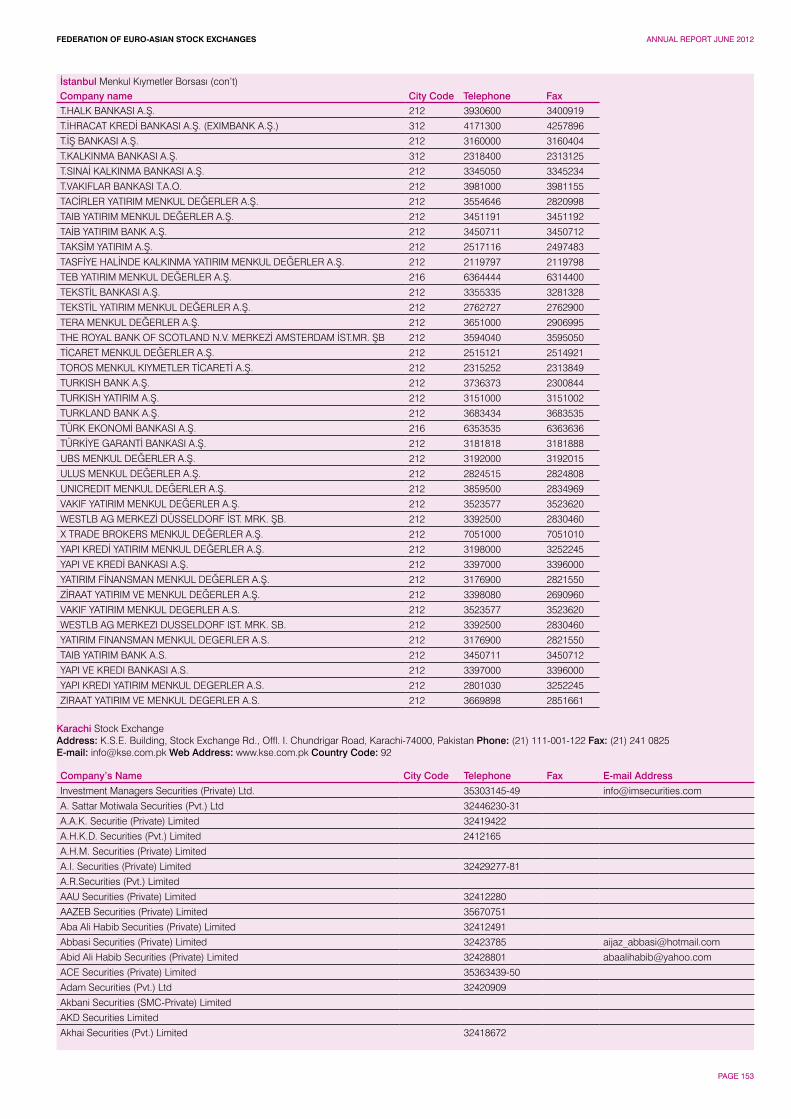
FEDERATION OF EURO-ASIAN STOCK EXCHANGES ANNUAL REPORT JUNE 2012
PAGE 153
İstanbul Menkul Kıymetler Borsası (con’t)Company name City Code Telephone FaxT.HALK BANKASI A.Ş. 212 3930600 3400919
T.İHRACAT KREDİ BANKASI A.Ş. (EXIMBANK A.Ş.) 312 4171300 4257896
T.İŞ BANKASI A.Ş. 212 3160000 3160404
T.KALKINMA BANKASI A.Ş. 312 2318400 2313125
T.SINAİ KALKINMA BANKASI A.Ş. 212 3345050 3345234
T.VAKIFLAR BANKASI T.A.O. 212 3981000 3981155
TACİRLER YATIRIM MENKUL DEĞERLER A.Ş. 212 3554646 2820998
TAIB YATIRIM MENKUL DEĞERLER A.Ş. 212 3451191 3451192
TAİB YATIRIM BANK A.Ş. 212 3450711 3450712
TAKSİM YATIRIM A.Ş. 212 2517116 2497483
TASFİYE HALİNDE KALKINMA YATIRIM MENKUL DEĞERLER A.Ş. 212 2119797 2119798
TEB YATIRIM MENKUL DEĞERLER A.Ş. 216 6364444 6314400
TEKSTİL BANKASI A.Ş. 212 3355335 3281328
TEKSTİL YATIRIM MENKUL DEĞERLER A.Ş. 212 2762727 2762900
TERA MENKUL DEĞERLER A.Ş. 212 3651000 2906995
THE ROYAL BANK OF SCOTLAND N.V. MERKEZİ AMSTERDAM İST.MR. ŞB 212 3594040 3595050
TİCARET MENKUL DEĞERLER A.Ş. 212 2515121 2514921
TOROS MENKUL KIYMETLER TİCARETİ A.Ş. 212 2315252 2313849
TURKISH BANK A.Ş. 212 3736373 2300844
TURKISH YATIRIM A.Ş. 212 3151000 3151002
TURKLAND BANK A.Ş. 212 3683434 3683535
TÜRK EKONOMİ BANKASI A.Ş. 216 6353535 6363636
TÜRKİYE GARANTİ BANKASI A.Ş. 212 3181818 3181888
UBS MENKUL DEĞERLER A.Ş. 212 3192000 3192015
ULUS MENKUL DEĞERLER A.Ş. 212 2824515 2824808
UNICREDIT MENKUL DEĞERLER A.Ş. 212 3859500 2834969
VAKIF YATIRIM MENKUL DEĞERLER A.Ş. 212 3523577 3523620
WESTLB AG MERKEZİ DÜSSELDORF İST. MRK. ŞB. 212 3392500 2830460
X TRADE BROKERS MENKUL DEĞERLER A.Ş. 212 7051000 7051010
YAPI KREDİ YATIRIM MENKUL DEĞERLER A.Ş. 212 3198000 3252245
YAPI VE KREDİ BANKASI A.Ş. 212 3397000 3396000
YATIRIM FİNANSMAN MENKUL DEĞERLER A.Ş. 212 3176900 2821550
ZİRAAT YATIRIM VE MENKUL DEĞERLER A.Ş. 212 3398080 2690960
VAKIF YATIRIM MENKUL DEGERLER A.S. 212 3523577 3523620
WESTLB AG MERKEZI DUSSELDORF IST. MRK. SB. 212 3392500 2830460
YATIRIM FINANSMAN MENKUL DEGERLER A.S. 212 3176900 2821550
TAIB YATIRIM BANK A.S. 212 3450711 3450712
YAPI VE KREDI BANKASI A.S. 212 3397000 3396000
YAPI KREDI YATIRIM MENKUL DEGERLER A.S. 212 2801030 3252245
ZIRAAT YATIRIM VE MENKUL DEGERLER A.S. 212 3669898 2851661
Karachi Stock Exchange Address: K.S.E. Building, Stock Exchange Rd., Offl. I. Chundrigar Road, Karachi-74000, Pakistan Phone: (21) 111-001-122 Fax: (21) 241 0825E-mail: [email protected] Web Address: www.kse.com.pk Country Code: 92
Company’s Name City Code Telephone Fax E-mail Address
Investment Managers Securities (Private) Ltd. 35303145-49 [email protected]
A. Sattar Motiwala Securities (Pvt.) Ltd 32446230-31
A.A.K. Securitie (Private) Limited 32419422
A.H.K.D. Securities (Pvt.) Limited 2412165
A.H.M. Securities (Private) Limited
A.I. Securities (Private) Limited 32429277-81
A.R.Securities (Pvt.) Limited
AAU Securities (Private) Limited 32412280
AAZEB Securities (Private) Limited 35670751
Aba Ali Habib Securities (Private) Limited 32412491
Abbasi Securities (Private) Limited 32423785 [email protected]
Abid Ali Habib Securities (Private) Limited 32428801 [email protected]
ACE Securities (Private) Limited 35363439-50
Adam Securities (Pvt.) Ltd 32420909
Akbani Securities (SMC-Private) Limited
AKD Securities Limited
Akhai Securities (Pvt.) Limited 32418672
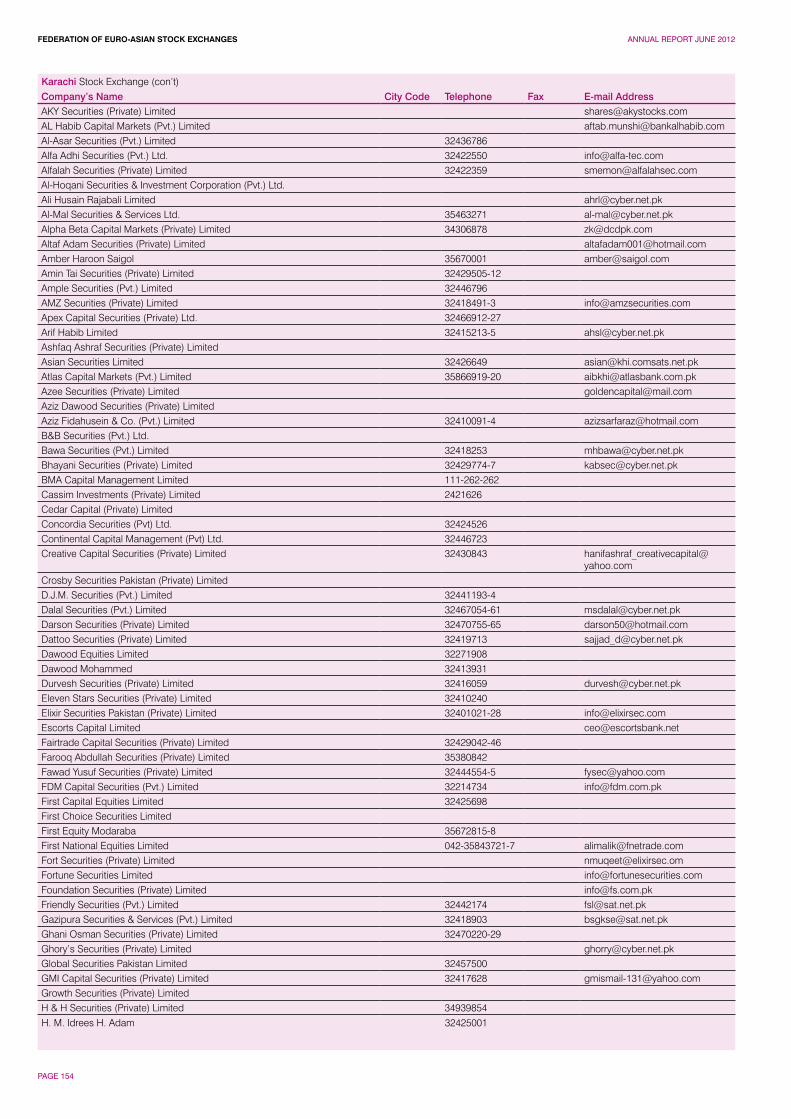
FEDERATION OF EURO-ASIAN STOCK EXCHANGES ANNUAL REPORT JUNE 2012
PAGE 154
Karachi Stock Exchange (con’t)Company’s Name City Code Telephone Fax E-mail AddressAKY Securities (Private) Limited [email protected] Habib Capital Markets (Pvt.) Limited [email protected] Securities (Pvt.) Limited 32436786Alfa Adhi Securities (Pvt.) Ltd. 32422550 [email protected] Securities (Private) Limited 32422359 [email protected] Securities & Investment Corporation (Pvt.) Ltd.Ali Husain Rajabali Limited [email protected] Securities & Services Ltd. 35463271 [email protected] Beta Capital Markets (Private) Limited 34306878 [email protected] Adam Securities (Private) Limited [email protected] Haroon Saigol 35670001 [email protected] Tai Securities (Private) Limited 32429505-12Ample Securities (Pvt.) Limited 32446796AMZ Securities (Private) Limited 32418491-3 [email protected] Capital Securities (Private) Ltd. 32466912-27Arif Habib Limited 32415213-5 [email protected] Ashraf Securities (Private) LimitedAsian Securities Limited 32426649 [email protected] Capital Markets (Pvt.) Limited 35866919-20 [email protected] Securities (Private) Limited [email protected] Dawood Securities (Private) LimitedAziz Fidahusein & Co. (Pvt.) Limited 32410091-4 [email protected]&B Securities (Pvt.) Ltd.Bawa Securities (Pvt.) Limited 32418253 [email protected] Securities (Private) Limited 32429774-7 [email protected] Capital Management Limited 111-262-262Cassim Investments (Private) Limited 2421626Cedar Capital (Private) LimitedConcordia Securities (Pvt) Ltd. 32424526Continental Capital Management (Pvt) Ltd. 32446723Creative Capital Securities (Private) Limited 32430843 hanifashraf_creativecapital@
yahoo.comCrosby Securities Pakistan (Private) LimitedD.J.M. Securities (Pvt.) Limited 32441193-4Dalal Securities (Pvt.) Limited 32467054-61 [email protected] Securities (Private) Limited 32470755-65 [email protected] Securities (Private) Limited 32419713 [email protected] Equities Limited 32271908Dawood Mohammed 32413931Durvesh Securities (Private) Limited 32416059 [email protected] Stars Securities (Private) Limited 32410240Elixir Securities Pakistan (Private) Limited 32401021-28 [email protected] Capital Limited [email protected] Capital Securities (Private) Limited 32429042-46Farooq Abdullah Securities (Private) Limited 35380842Fawad Yusuf Securities (Private) Limited 32444554-5 [email protected] Capital Securities (Pvt.) Limited 32214734 [email protected] Capital Equities Limited 32425698First Choice Securities LimitedFirst Equity Modaraba 35672815-8First National Equities Limited 042-35843721-7 [email protected] Securities (Private) Limited [email protected] Securities Limited [email protected] Securities (Private) Limited [email protected] Securities (Pvt.) Limited 32442174 [email protected] Securities & Services (Pvt.) Limited 32418903 [email protected] Osman Securities (Private) Limited 32470220-29Ghory’s Securities (Private) Limited [email protected] Securities Pakistan Limited 32457500GMI Capital Securities (Private) Limited 32417628 [email protected] Securities (Private) LimitedH & H Securities (Private) Limited 34939854H. M. Idrees H. Adam 32425001
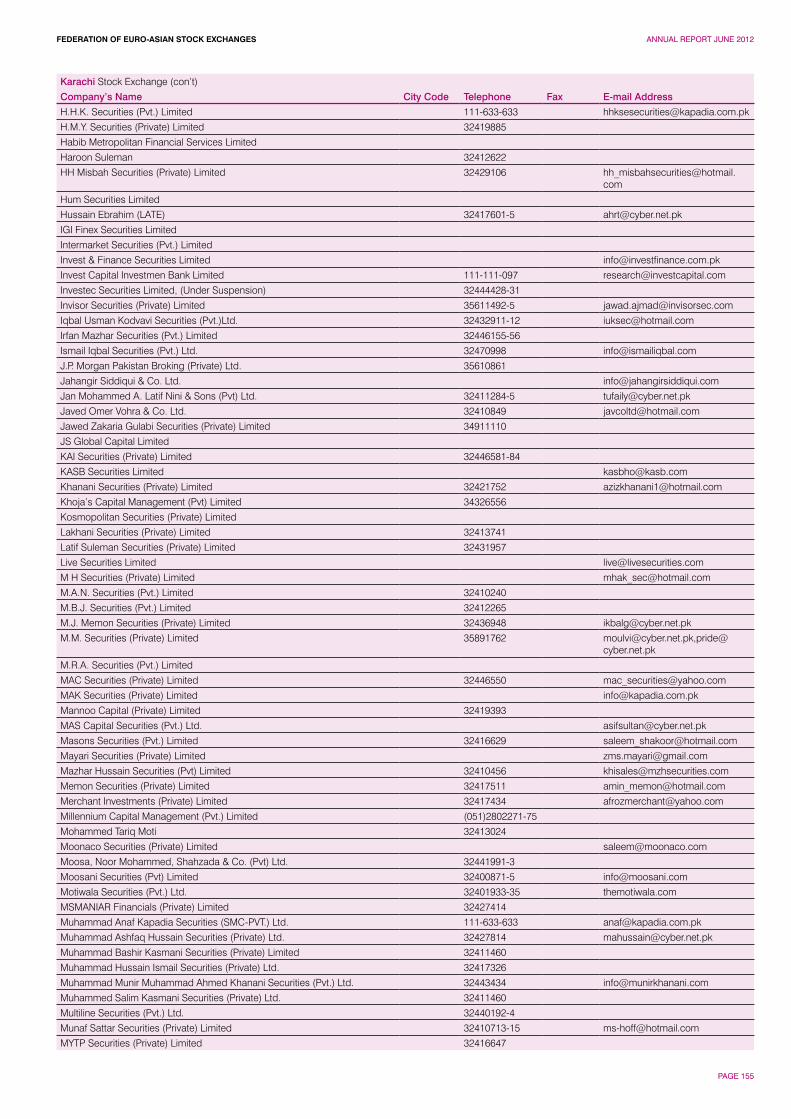
FEDERATION OF EURO-ASIAN STOCK EXCHANGES ANNUAL REPORT JUNE 2012
PAGE 155
Karachi Stock Exchange (con’t)
Company’s Name City Code Telephone Fax E-mail Address
H.H.K. Securities (Pvt.) Limited 111-633-633 [email protected]
H.M.Y. Securities (Private) Limited 32419885
Habib Metropolitan Financial Services Limited
Haroon Suleman 32412622
HH Misbah Securities (Private) Limited 32429106 [email protected]
Hum Securities Limited
Hussain Ebrahim (LATE) 32417601-5 [email protected]
IGI Finex Securities Limited
Intermarket Securities (Pvt.) Limited
Invest & Finance Securities Limited [email protected]
Invest Capital Investmen Bank Limited 111-111-097 [email protected]
Investec Securities Limited, (Under Suspension) 32444428-31
Invisor Securities (Private) Limited 35611492-5 [email protected]
Iqbal Usman Kodvavi Securities (Pvt.)Ltd. 32432911-12 [email protected]
Irfan Mazhar Securities (Pvt.) Limited 32446155-56
Ismail Iqbal Securities (Pvt.) Ltd. 32470998 [email protected]
J.P. Morgan Pakistan Broking (Private) Ltd. 35610861
Jahangir Siddiqui & Co. Ltd. [email protected]
Jan Mohammed A. Latif Nini & Sons (Pvt) Ltd. 32411284-5 [email protected]
Javed Omer Vohra & Co. Ltd. 32410849 [email protected]
Jawed Zakaria Gulabi Securities (Private) Limited 34911110
JS Global Capital Limited
KAI Securities (Private) Limited 32446581-84
KASB Securities Limited [email protected]
Khanani Securities (Private) Limited 32421752 [email protected]
Khoja’s Capital Management (Pvt) Limited 34326556
Kosmopolitan Securities (Private) Limited
Lakhani Securities (Private) Limited 32413741
Latif Suleman Securities (Private) Limited 32431957
Live Securities Limited [email protected]
M H Securities (Private) Limited [email protected]
M.A.N. Securities (Pvt.) Limited 32410240
M.B.J. Securities (Pvt.) Limited 32412265
M.J. Memon Securities (Private) Limited 32436948 [email protected]
M.M. Securities (Private) Limited 35891762 [email protected],[email protected]
M.R.A. Securities (Pvt.) Limited
MAC Securities (Private) Limited 32446550 [email protected]
MAK Securities (Private) Limited [email protected]
Mannoo Capital (Private) Limited 32419393
MAS Capital Securities (Pvt.) Ltd. [email protected]
Masons Securities (Pvt.) Limited 32416629 [email protected]
Mayari Securities (Private) Limited [email protected]
Mazhar Hussain Securities (Pvt) Limited 32410456 [email protected]
Memon Securities (Private) Limited 32417511 [email protected]
Merchant Investments (Private) Limited 32417434 [email protected]
Millennium Capital Management (Pvt.) Limited (051)2802271-75
Mohammed Tariq Moti 32413024
Moonaco Securities (Private) Limited [email protected]
Moosa, Noor Mohammed, Shahzada & Co. (Pvt) Ltd. 32441991-3
Moosani Securities (Pvt) Limited 32400871-5 [email protected]
Motiwala Securities (Pvt.) Ltd. 32401933-35 themotiwala.com
MSMANIAR Financials (Private) Limited 32427414
Muhammad Anaf Kapadia Securities (SMC-PVT.) Ltd. 111-633-633 [email protected]
Muhammad Ashfaq Hussain Securities (Private) Ltd. 32427814 [email protected]
Muhammad Bashir Kasmani Securities (Private) Limited 32411460
Muhammad Hussain Ismail Securities (Private) Ltd. 32417326
Muhammad Munir Muhammad Ahmed Khanani Securities (Pvt.) Ltd. 32443434 [email protected]
Muhammed Salim Kasmani Securities (Private) Ltd. 32411460
Multiline Securities (Pvt.) Ltd. 32440192-4
Munaf Sattar Securities (Private) Limited 32410713-15 [email protected]
MYTP Securities (Private) Limited 32416647
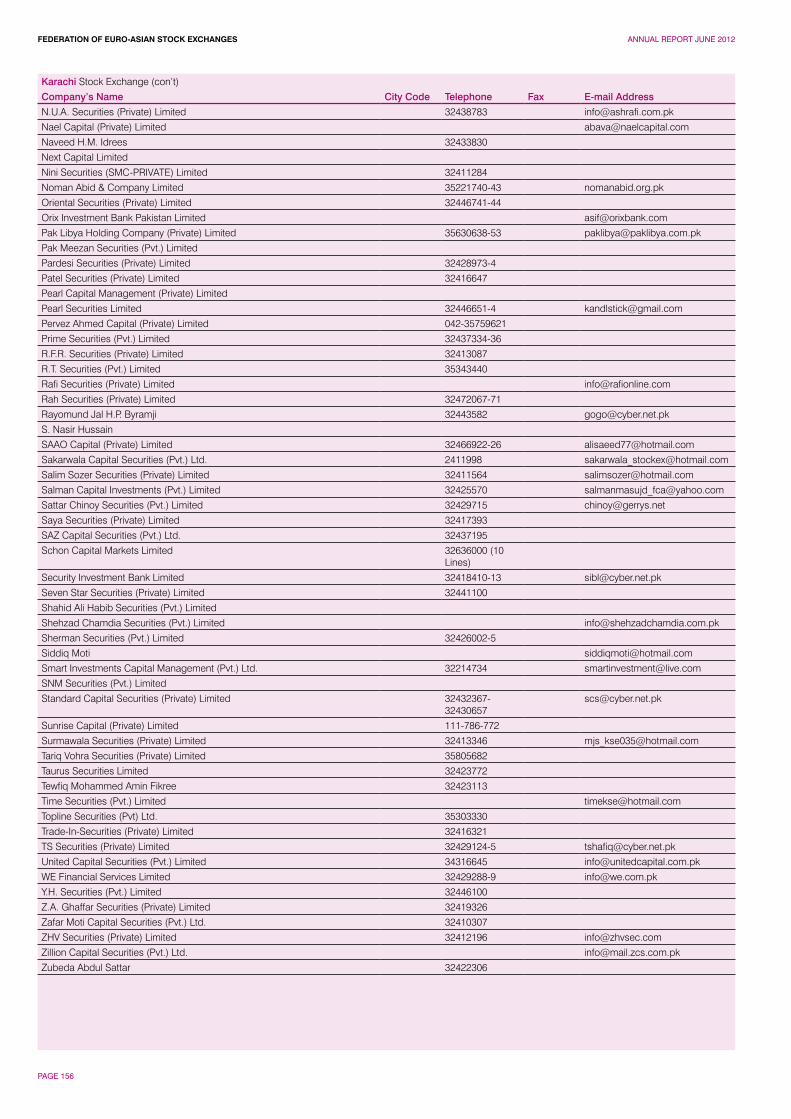
FEDERATION OF EURO-ASIAN STOCK EXCHANGES ANNUAL REPORT JUNE 2012
PAGE 156
Karachi Stock Exchange (con’t)
Company’s Name City Code Telephone Fax E-mail Address
N.U.A. Securities (Private) Limited 32438783 [email protected]
Nael Capital (Private) Limited [email protected]
Naveed H.M. Idrees 32433830
Next Capital Limited
Nini Securities (SMC-PRIVATE) Limited 32411284
Noman Abid & Company Limited 35221740-43 nomanabid.org.pk
Oriental Securities (Private) Limited 32446741-44
Orix Investment Bank Pakistan Limited [email protected]
Pak Libya Holding Company (Private) Limited 35630638-53 [email protected]
Pak Meezan Securities (Pvt.) Limited
Pardesi Securities (Private) Limited 32428973-4
Patel Securities (Private) Limited 32416647
Pearl Capital Management (Private) Limited
Pearl Securities Limited 32446651-4 [email protected]
Pervez Ahmed Capital (Private) Limited 042-35759621
Prime Securities (Pvt.) Limited 32437334-36
R.F.R. Securities (Private) Limited 32413087
R.T. Securities (Pvt.) Limited 35343440
Rafi Securities (Private) Limited [email protected]
Rah Securities (Private) Limited 32472067-71
Rayomund Jal H.P. Byramji 32443582 [email protected]
S. Nasir Hussain
SAAO Capital (Private) Limited 32466922-26 [email protected]
Sakarwala Capital Securities (Pvt.) Ltd. 2411998 [email protected]
Salim Sozer Securities (Private) Limited 32411564 [email protected]
Salman Capital Investments (Pvt.) Limited 32425570 [email protected]
Sattar Chinoy Securities (Pvt.) Limited 32429715 [email protected]
Saya Securities (Private) Limited 32417393
SAZ Capital Securities (Pvt.) Ltd. 32437195
Schon Capital Markets Limited 32636000 (10 Lines)
Security Investment Bank Limited 32418410-13 [email protected]
Seven Star Securities (Private) Limited 32441100
Shahid Ali Habib Securities (Pvt.) Limited
Shehzad Chamdia Securities (Pvt.) Limited [email protected]
Sherman Securities (Pvt.) Limited 32426002-5
Siddiq Moti [email protected]
Smart Investments Capital Management (Pvt.) Ltd. 32214734 [email protected]
SNM Securities (Pvt.) Limited
Standard Capital Securities (Private) Limited 32432367-32430657
Sunrise Capital (Private) Limited 111-786-772
Surmawala Securities (Private) Limited 32413346 [email protected]
Tariq Vohra Securities (Private) Limited 35805682
Taurus Securities Limited 32423772
Tewfiq Mohammed Amin Fikree 32423113
Time Securities (Pvt.) Limited [email protected]
Topline Securities (Pvt) Ltd. 35303330
Trade-In-Securities (Private) Limited 32416321
TS Securities (Private) Limited 32429124-5 [email protected]
United Capital Securities (Pvt.) Limited 34316645 [email protected]
WE Financial Services Limited 32429288-9 [email protected]
Y.H. Securities (Pvt.) Limited 32446100
Z.A. Ghaffar Securities (Private) Limited 32419326
Zafar Moti Capital Securities (Pvt.) Ltd. 32410307
ZHV Securities (Private) Limited 32412196 [email protected]
Zillion Capital Securities (Pvt.) Ltd. [email protected]
Zubeda Abdul Sattar 32422306
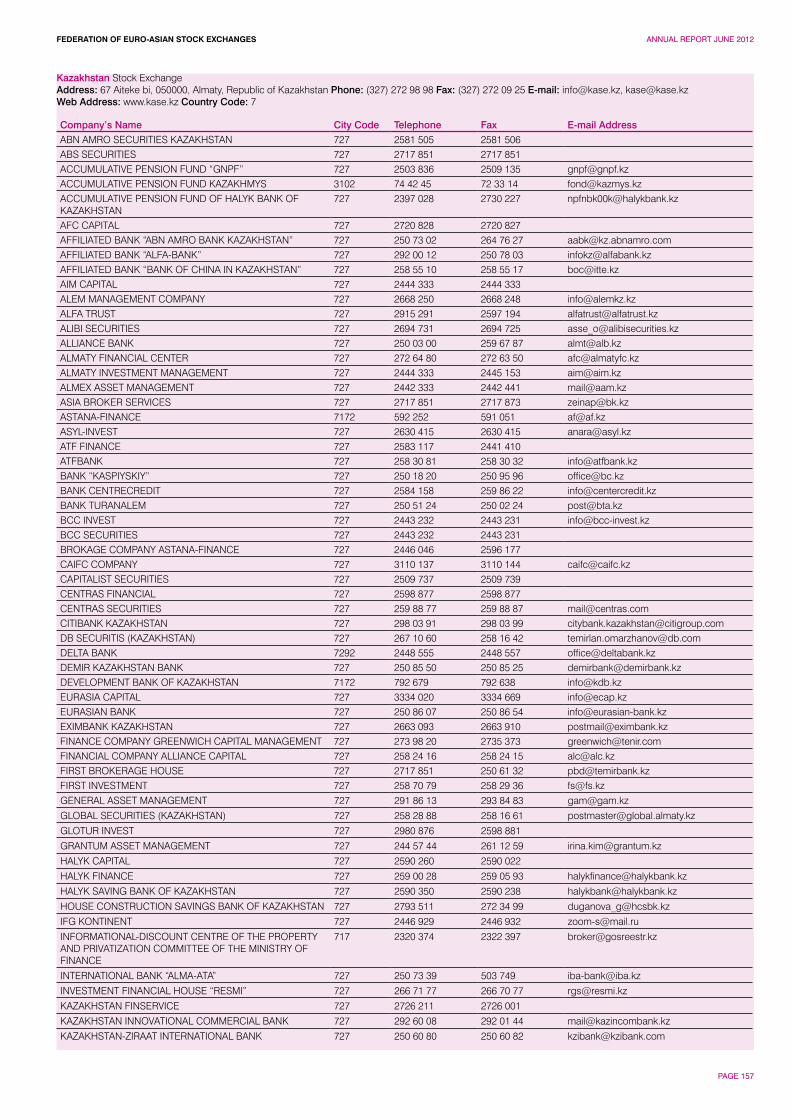
FEDERATION OF EURO-ASIAN STOCK EXCHANGES ANNUAL REPORT JUNE 2012
PAGE 157
Kazakhstan Stock Exchange Address: 67 Aiteke bi, 050000, Almaty, Republic of Kazakhstan Phone: (327) 272 98 98 Fax: (327) 272 09 25 E-mail: [email protected], [email protected] Address: www.kase.kz Country Code: 7
Company’s Name City Code Telephone Fax E-mail AddressABN AMRO SECURITIES KAZAKHSTAN 727 2581 505 2581 506ABS SECURITIES 727 2717 851 2717 851ACCUMULATIVE PENSION FUND “GNPF” 727 2503 836 2509 135 [email protected] PENSION FUND KAZAKHMYS 3102 74 42 45 72 33 14 [email protected] PENSION FUND OF HALYK BANK OF KAZAKHSTAN
727 2397 028 2730 227 [email protected]
AFC CAPITAL 727 2720 828 2720 827AFFILIATED BANK “ABN AMRO BANK KAZAKHSTAN” 727 250 73 02 264 76 27 [email protected] BANK “ALFA-BANK” 727 292 00 12 250 78 03 [email protected] BANK “BANK OF CHINA IN KAZAKHSTAN” 727 258 55 10 258 55 17 [email protected] CAPITAL 727 2444 333 2444 333ALEM MANAGEMENT COMPANY 727 2668 250 2668 248 [email protected] TRUST 727 2915 291 2597 194 [email protected] SECURITIES 727 2694 731 2694 725 [email protected] BANK 727 250 03 00 259 67 87 [email protected] FINANCIAL CENTER 727 272 64 80 272 63 50 [email protected] INVESTMENT MANAGEMENT 727 2444 333 2445 153 [email protected] ASSET MANAGEMENT 727 2442 333 2442 441 [email protected] BROKER SERVICES 727 2717 851 2717 873 [email protected] 7172 592 252 591 051 [email protected] 727 2630 415 2630 415 [email protected] FINANCE 727 2583 117 2441 410ATFBANK 727 258 30 81 258 30 32 [email protected] “KASPIYSKIY” 727 250 18 20 250 95 96 [email protected] CENTRECREDIT 727 2584 158 259 86 22 [email protected] TURANALEM 727 250 51 24 250 02 24 [email protected] INVEST 727 2443 232 2443 231 [email protected] SECURITIES 727 2443 232 2443 231BROKAGE COMPANY ASTANA-FINANCE 727 2446 046 2596 177CAIFC COMPANY 727 3110 137 3110 144 [email protected] SECURITIES 727 2509 737 2509 739CENTRAS FINANCIAL 727 2598 877 2598 877CENTRAS SECURITIES 727 259 88 77 259 88 87 [email protected] KAZAKHSTAN 727 298 03 91 298 03 99 [email protected] SECURITIS (KAZAKHSTAN) 727 267 10 60 258 16 42 [email protected] BANK 7292 2448 555 2448 557 [email protected] KAZAKHSTAN BANK 727 250 85 50 250 85 25 [email protected] BANK OF KAZAKHSTAN 7172 792 679 792 638 [email protected] CAPITAL 727 3334 020 3334 669 [email protected] BANK 727 250 86 07 250 86 54 [email protected] KAZAKHSTAN 727 2663 093 2663 910 [email protected] COMPANY GREENWICH CAPITAL MANAGEMENT 727 273 98 20 2735 373 [email protected] COMPANY ALLIANCE CAPITAL 727 258 24 16 258 24 15 [email protected] BROKERAGE HOUSE 727 2717 851 250 61 32 [email protected] INVESTMENT 727 258 70 79 258 29 36 [email protected] ASSET MANAGEMENT 727 291 86 13 293 84 83 [email protected]
GLOBAL SECURITIES (KAZAKHSTAN) 727 258 28 88 258 16 61 [email protected]
GLOTUR INVEST 727 2980 876 2598 881
GRANTUM ASSET MANAGEMENT 727 244 57 44 261 12 59 [email protected]
HALYK CAPITAL 727 2590 260 2590 022
HALYK FINANCE 727 259 00 28 259 05 93 [email protected]
HALYK SAVING BANK OF KAZAKHSTAN 727 2590 350 2590 238 [email protected]
HOUSE CONSTRUCTION SAVINGS BANK OF KAZAKHSTAN 727 2793 511 272 34 99 [email protected]
IFG KONTINENT 727 2446 929 2446 932 [email protected]
INFORMATIONAL-DISCOUNT CENTRE OF THE PROPERTY AND PRIVATIZATION COMMITTEE OF THE MINISTRY OF FINANCE
717 2320 374 2322 397 [email protected]
INTERNATIONAL BANK “ALMA-ATA” 727 250 73 39 503 749 [email protected]
INVESTMENT FINANCIAL HOUSE “RESMI” 727 266 71 77 266 70 77 [email protected]
KAZAKHSTAN FINSERVICE 727 2726 211 2726 001
KAZAKHSTAN INNOVATIONAL COMMERCIAL BANK 727 292 60 08 292 01 44 [email protected]
KAZAKHSTAN-ZIRAAT INTERNATIONAL BANK 727 250 60 80 250 60 82 [email protected]
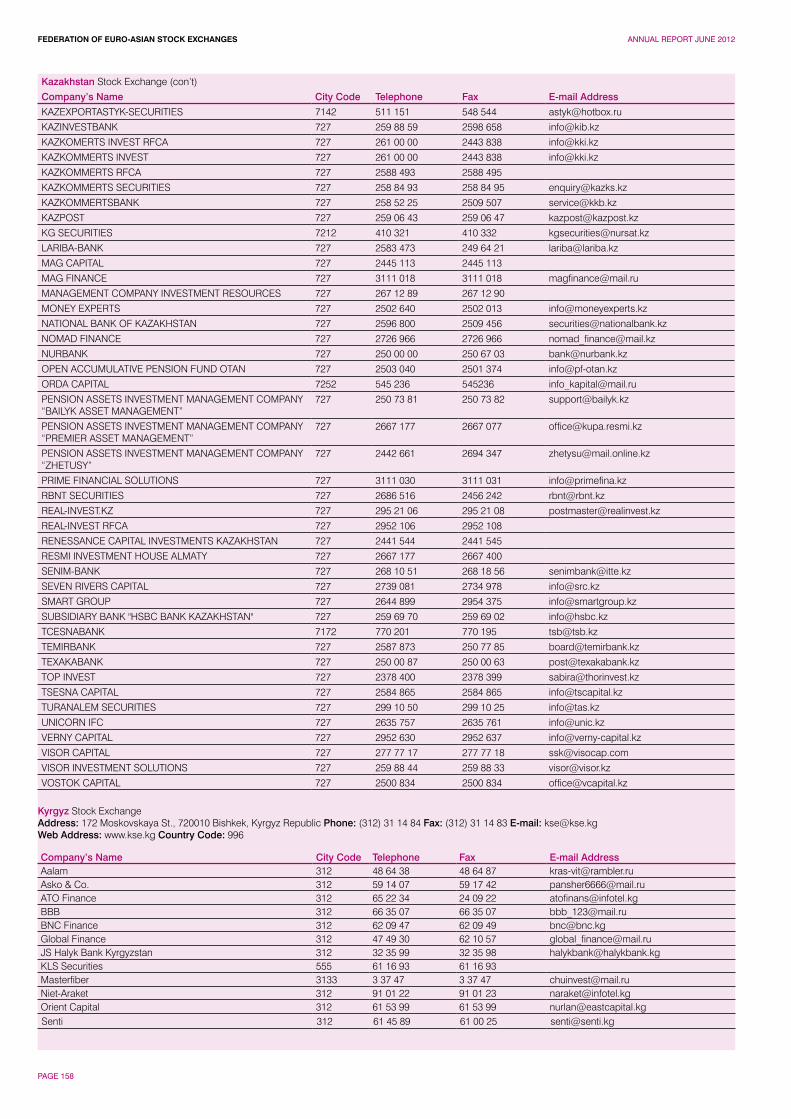
FEDERATION OF EURO-ASIAN STOCK EXCHANGES ANNUAL REPORT JUNE 2012
PAGE 158
Kazakhstan Stock Exchange (con’t)
Company’s Name City Code Telephone Fax E-mail Address
KAZEXPORTASTYK-SECURITIES 7142 511 151 548 544 [email protected]
KAZINVESTBANK 727 259 88 59 2598 658 [email protected]
KAZKOMERTS INVEST RFCA 727 261 00 00 2443 838 [email protected]
KAZKOMMERTS INVEST 727 261 00 00 2443 838 [email protected]
KAZKOMMERTS RFCA 727 2588 493 2588 495
KAZKOMMERTS SECURITIES 727 258 84 93 258 84 95 [email protected]
KAZKOMMERTSBANK 727 258 52 25 2509 507 [email protected]
KAZPOST 727 259 06 43 259 06 47 [email protected]
KG SECURITIES 7212 410 321 410 332 [email protected]
LARIBA-BANK 727 2583 473 249 64 21 [email protected]
MAG CAPITAL 727 2445 113 2445 113
MAG FINANCE 727 3111 018 3111 018 [email protected]
MANAGEMENT COMPANY INVESTMENT RESOURCES 727 267 12 89 267 12 90
MONEY EXPERTS 727 2502 640 2502 013 [email protected]
NATIONAL BANK OF KAZAKHSTAN 727 2596 800 2509 456 [email protected]
NOMAD FINANCE 727 2726 966 2726 966 [email protected]
NURBANK 727 250 00 00 250 67 03 [email protected]
OPEN ACCUMULATIVE PENSION FUND OTAN 727 2503 040 2501 374 [email protected]
ORDA CAPITAL 7252 545 236 545236 [email protected]
PENSION ASSETS INVESTMENT MANAGEMENT COMPANY “BAILYK ASSET MANAGEMENT”
727 250 73 81 250 73 82 [email protected]
PENSION ASSETS INVESTMENT MANAGEMENT COMPANY “PREMIER ASSET MANAGEMENT”
727 2667 177 2667 077 [email protected]
PENSION ASSETS INVESTMENT MANAGEMENT COMPANY “ZHETUSY”
727 2442 661 2694 347 [email protected]
PRIME FINANCIAL SOLUTIONS 727 3111 030 3111 031 [email protected]
RBNT SECURITIES 727 2686 516 2456 242 [email protected]
REAL-INVEST.KZ 727 295 21 06 295 21 08 [email protected]
REAL-INVEST RFCA 727 2952 106 2952 108
RENESSANCE CAPITAL INVESTMENTS KAZAKHSTAN 727 2441 544 2441 545
RESMI INVESTMENT HOUSE ALMATY 727 2667 177 2667 400
SENIM-BANK 727 268 10 51 268 18 56 [email protected]
SEVEN RIVERS CAPITAL 727 2739 081 2734 978 [email protected]
SMART GROUP 727 2644 899 2954 375 [email protected]
SUBSIDIARY BANK "HSBC BANK KAZAKHSTAN" 727 259 69 70 259 69 02 [email protected]
TCESNABANK 7172 770 201 770 195 [email protected]
TEMIRBANK 727 2587 873 250 77 85 [email protected]
TEXAKABANK 727 250 00 87 250 00 63 [email protected]
TOP INVEST 727 2378 400 2378 399 [email protected]
TSESNA CAPITAL 727 2584 865 2584 865 [email protected]
TURANALEM SECURITIES 727 299 10 50 299 10 25 [email protected]
UNICORN IFC 727 2635 757 2635 761 [email protected]
VERNY CAPITAL 727 2952 630 2952 637 [email protected]
VISOR CAPITAL 727 277 77 17 277 77 18 [email protected]
VISOR INVESTMENT SOLUTIONS 727 259 88 44 259 88 33 [email protected]
VOSTOK CAPITAL 727 2500 834 2500 834 [email protected]
Kyrgyz Stock Exchange Address: 172 Moskovskaya St., 720010 Bishkek, Kyrgyz Republic Phone: (312) 31 14 84 Fax: (312) 31 14 83 E-mail: [email protected] Address: www.kse.kg Country Code: 996
Company’s Name City Code Telephone Fax E-mail AddressAalam 312 48 64 38 48 64 87 [email protected] & Co. 312 59 14 07 59 17 42 [email protected] Finance 312 65 22 34 24 09 22 [email protected] 312 66 35 07 66 35 07 [email protected] Finance 312 62 09 47 62 09 49 [email protected] Finance 312 47 49 30 62 10 57 [email protected] Halyk Bank Kyrgyzstan 312 32 35 99 32 35 98 [email protected] Securities 555 61 16 93 61 16 93Masterfiber 3133 3 37 47 3 37 47 [email protected] 312 91 01 22 91 01 23 [email protected] Capital 312 61 53 99 61 53 99 [email protected] 312 61 45 89 61 00 25 [email protected]
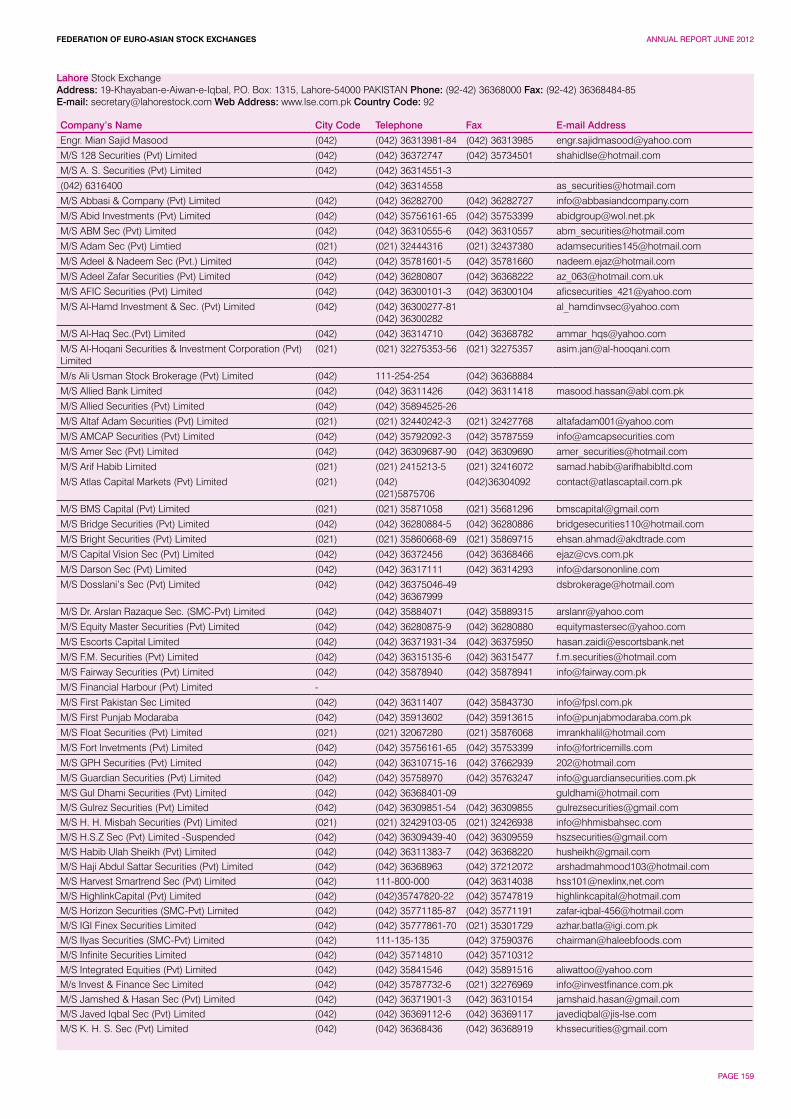
FEDERATION OF EURO-ASIAN STOCK EXCHANGES ANNUAL REPORT JUNE 2012
PAGE 159
Lahore Stock Exchange Address: 19-Khayaban-e-Aiwan-e-Iqbal, P.O. Box: 1315, Lahore-54000 PAKISTAN Phone: (92-42) 36368000 Fax: (92-42) 36368484-85 E-mail: [email protected] Web Address: www.lse.com.pk Country Code: 92
Company’s Name City Code Telephone Fax E-mail Address
Engr. Mian Sajid Masood (042) (042) 36313981-84 (042) 36313985 [email protected]
M/S 128 Securities (Pvt) Limited (042) (042) 36372747 (042) 35734501 [email protected]
M/S A. S. Securities (Pvt) Limited (042) (042) 36314551-3
(042) 6316400 (042) 36314558 [email protected]
M/S Abbasi & Company (Pvt) Limited (042) (042) 36282700 (042) 36282727 [email protected]
M/S Abid Investments (Pvt) Limited (042) (042) 35756161-65 (042) 35753399 [email protected]
M/S ABM Sec (Pvt) Limited (042) (042) 36310555-6 (042) 36310557 [email protected]
M/S Adam Sec (Pvt) Limtied (021) (021) 32444316 (021) 32437380 [email protected]
M/S Adeel & Nadeem Sec (Pvt.) Limited (042) (042) 35781601-5 (042) 35781660 [email protected]
M/S Adeel Zafar Securities (Pvt) Limited (042) (042) 36280807 (042) 36368222 [email protected]
M/S AFIC Securities (Pvt) Limited (042) (042) 36300101-3 (042) 36300104 [email protected]
M/S Al-Hamd Investment & Sec. (Pvt) Limited (042) (042) 36300277-81 (042) 36300282
M/S Al-Haq Sec.(Pvt) Limited (042) (042) 36314710 (042) 36368782 [email protected]
M/S Al-Hoqani Securities & Investment Corporation (Pvt) Limited
(021) (021) 32275353-56 (021) 32275357 [email protected]
M/s Ali Usman Stock Brokerage (Pvt) Limited (042) 111-254-254 (042) 36368884
M/S Allied Bank Limited (042) (042) 36311426 (042) 36311418 [email protected]
M/S Allied Securities (Pvt) Limited (042) (042) 35894525-26
M/S Altaf Adam Securities (Pvt) Limited (021) (021) 32440242-3 (021) 32427768 [email protected]
M/S AMCAP Securities (Pvt) Limited (042) (042) 35792092-3 (042) 35787559 [email protected]
M/S Amer Sec (Pvt) Limited (042) (042) 36309687-90 (042) 36309690 [email protected]
M/S Arif Habib Limited (021) (021) 2415213-5 (021) 32416072 [email protected]
M/S Atlas Capital Markets (Pvt) Limited (021) (042) (021)5875706
(042)36304092 [email protected]
M/S BMS Capital (Pvt) Limited (021) (021) 35871058 (021) 35681296 [email protected]
M/S Bridge Securities (Pvt) Limited (042) (042) 36280884-5 (042) 36280886 [email protected]
M/S Bright Securities (Pvt) Limited (021) (021) 35860668-69 (021) 35869715 [email protected]
M/S Capital Vision Sec (Pvt) Limited (042) (042) 36372456 (042) 36368466 [email protected]
M/S Darson Sec (Pvt) Limited (042) (042) 36317111 (042) 36314293 [email protected]
M/S Dosslani’s Sec (Pvt) Limited (042) (042) 36375046-49 (042) 36367999
M/S Dr. Arslan Razaque Sec. (SMC-Pvt) Limited (042) (042) 35884071 (042) 35889315 [email protected]
M/S Equity Master Securities (Pvt) Limited (042) (042) 36280875-9 (042) 36280880 [email protected]
M/S Escorts Capital Limited (042) (042) 36371931-34 (042) 36375950 [email protected]
M/S F.M. Securities (Pvt) Limited (042) (042) 36315135-6 (042) 36315477 [email protected]
M/S Fairway Securities (Pvt) Limited (042) (042) 35878940 (042) 35878941 [email protected]
M/S Financial Harbour (Pvt) Limited -
M/S First Pakistan Sec Limited (042) (042) 36311407 (042) 35843730 [email protected]
M/S First Punjab Modaraba (042) (042) 35913602 (042) 35913615 [email protected]
M/S Float Securities (Pvt) Limited (021) (021) 32067280 (021) 35876068 [email protected]
M/S Fort Invetments (Pvt) Limited (042) (042) 35756161-65 (042) 35753399 [email protected]
M/S GPH Securities (Pvt) Limited (042) (042) 36310715-16 (042) 37662939 [email protected]
M/S Guardian Securities (Pvt) Limited (042) (042) 35758970 (042) 35763247 [email protected]/S Gul Dhami Securities (Pvt) Limited (042) (042) 36368401-09 [email protected]/S Gulrez Securities (Pvt) Limited (042) (042) 36309851-54 (042) 36309855 [email protected]/S H. H. Misbah Securities (Pvt) Limited (021) (021) 32429103-05 (021) 32426938 [email protected]/S H.S.Z Sec (Pvt) Limited -Suspended (042) (042) 36309439-40 (042) 36309559 [email protected]/S Habib Ulah Sheikh (Pvt) Limited (042) (042) 36311383-7 (042) 36368220 [email protected]/S Haji Abdul Sattar Securities (Pvt) Limited (042) (042) 36368963 (042) 37212072 [email protected]/S Harvest Smartrend Sec (Pvt) Limited (042) 111-800-000 (042) 36314038 hss101@nexlinx,net.comM/S HighlinkCapital (Pvt) Limited (042) (042)35747820-22 (042) 35747819 [email protected]/S Horizon Securities (SMC-Pvt) Limited (042) (042) 35771185-87 (042) 35771191 [email protected]/S IGI Finex Securities Limited (042) (042) 35777861-70 (021) 35301729 [email protected]/S Ilyas Securities (SMC-Pvt) Limited (042) 111-135-135 (042) 37590376 [email protected]/S Infinite Securities Limited (042) (042) 35714810 (042) 35710312M/S Integrated Equities (Pvt) Limited (042) (042) 35841546 (042) 35891516 [email protected]/s Invest & Finance Sec Limited (042) (042) 35787732-6 (021) 32276969 [email protected]/S Jamshed & Hasan Sec (Pvt) Limited (042) (042) 36371901-3 (042) 36310154 [email protected]/S Javed Iqbal Sec (Pvt) Limited (042) (042) 36369112-6 (042) 36369117 [email protected]/S K. H. S. Sec (Pvt) Limited (042) (042) 36368436 (042) 36368919 [email protected]
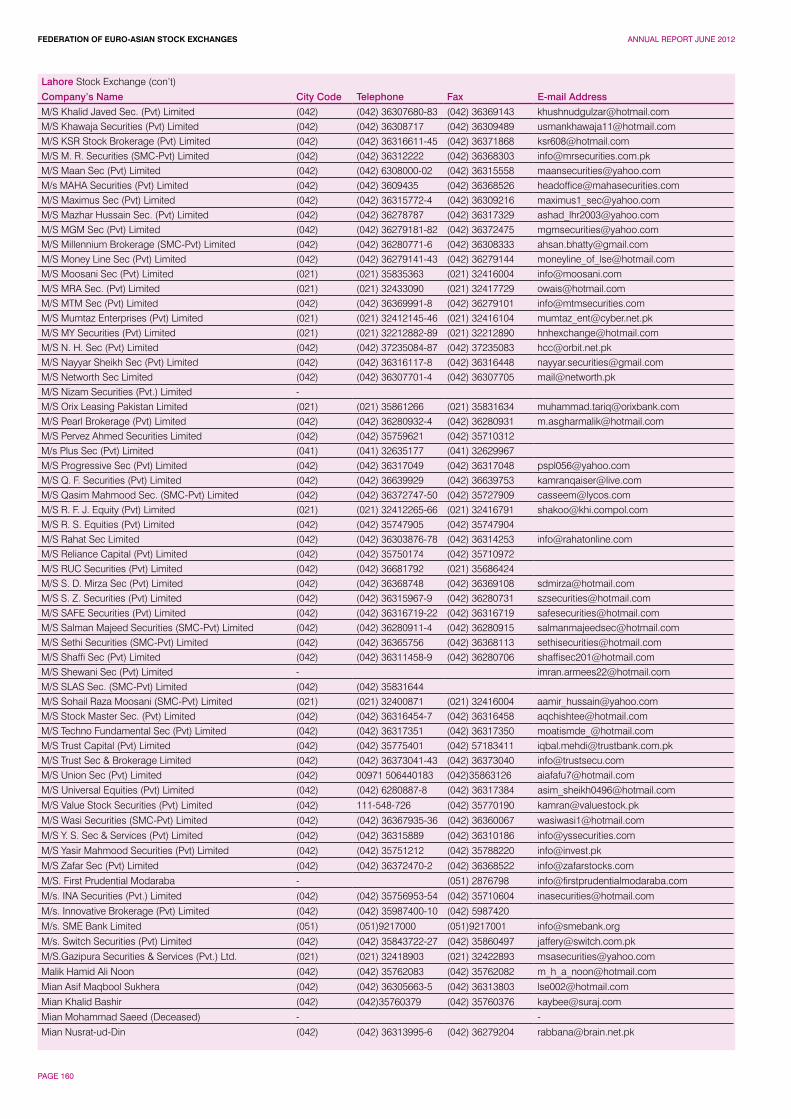
FEDERATION OF EURO-ASIAN STOCK EXCHANGES ANNUAL REPORT JUNE 2012
PAGE 160
Lahore Stock Exchange (con’t)
Company’s Name City Code Telephone Fax E-mail AddressM/S Khalid Javed Sec. (Pvt) Limited (042) (042) 36307680-83 (042) 36369143 [email protected]/S Khawaja Securities (Pvt) Limited (042) (042) 36308717 (042) 36309489 [email protected]/S KSR Stock Brokerage (Pvt) Limited (042) (042) 36316611-45 (042) 36371868 [email protected]/S M. R. Securities (SMC-Pvt) Limited (042) (042) 36312222 (042) 36368303 [email protected]/S Maan Sec (Pvt) Limited (042) (042) 6308000-02 (042) 36315558 [email protected]/s MAHA Securities (Pvt) Limited (042) (042) 3609435 (042) 36368526 [email protected]/S Maximus Sec (Pvt) Limited (042) (042) 36315772-4 (042) 36309216 [email protected]/S Mazhar Hussain Sec. (Pvt) Limited (042) (042) 36278787 (042) 36317329 [email protected]/S MGM Sec (Pvt) Limited (042) (042) 36279181-82 (042) 36372475 [email protected]/S Millennium Brokerage (SMC-Pvt) Limited (042) (042) 36280771-6 (042) 36308333 [email protected]/S Money Line Sec (Pvt) Limited (042) (042) 36279141-43 (042) 36279144 [email protected]/S Moosani Sec (Pvt) Limited (021) (021) 35835363 (021) 32416004 [email protected]/S MRA Sec. (Pvt) Limited (021) (021) 32433090 (021) 32417729 [email protected]/S MTM Sec (Pvt) Limited (042) (042) 36369991-8 (042) 36279101 [email protected]/S Mumtaz Enterprises (Pvt) Limited (021) (021) 32412145-46 (021) 32416104 [email protected]/S MY Securities (Pvt) Limited (021) (021) 32212882-89 (021) 32212890 [email protected]/S N. H. Sec (Pvt) Limited (042) (042) 37235084-87 (042) 37235083 [email protected]/S Nayyar Sheikh Sec (Pvt) Limited (042) (042) 36316117-8 (042) 36316448 [email protected]/S Networth Sec Limited (042) (042) 36307701-4 (042) 36307705 [email protected]/S Nizam Securities (Pvt.) Limited -M/S Orix Leasing Pakistan Limited (021) (021) 35861266 (021) 35831634 [email protected]/S Pearl Brokerage (Pvt) Limited (042) (042) 36280932-4 (042) 36280931 [email protected]/S Pervez Ahmed Securities Limited (042) (042) 35759621 (042) 35710312M/s Plus Sec (Pvt) Limited (041) (041) 32635177 (041) 32629967M/S Progressive Sec (Pvt) Limited (042) (042) 36317049 (042) 36317048 [email protected]/S Q. F. Securities (Pvt) Limited (042) (042) 36639929 (042) 36639753 [email protected]/S Qasim Mahmood Sec. (SMC-Pvt) Limited (042) (042) 36372747-50 (042) 35727909 [email protected]/S R. F. J. Equity (Pvt) Limited (021) (021) 32412265-66 (021) 32416791 [email protected]/S R. S. Equities (Pvt) Limited (042) (042) 35747905 (042) 35747904M/S Rahat Sec Limited (042) (042) 36303876-78 (042) 36314253 [email protected]/S Reliance Capital (Pvt) Limited (042) (042) 35750174 (042) 35710972M/S RUC Securities (Pvt) Limited (042) (042) 36681792 (021) 35686424M/S S. D. Mirza Sec (Pvt) Limited (042) (042) 36368748 (042) 36369108 [email protected]/S S. Z. Securities (Pvt) Limited (042) (042) 36315967-9 (042) 36280731 [email protected]/S SAFE Securities (Pvt) Limited (042) (042) 36316719-22 (042) 36316719 [email protected]/S Salman Majeed Securities (SMC-Pvt) Limited (042) (042) 36280911-4 (042) 36280915 [email protected]/S Sethi Securities (SMC-Pvt) Limited (042) (042) 36365756 (042) 36368113 [email protected]/S Shaffi Sec (Pvt) Limited (042) (042) 36311458-9 (042) 36280706 [email protected]/S Shewani Sec (Pvt) Limited - [email protected]/S SLAS Sec. (SMC-Pvt) Limited (042) (042) 35831644M/S Sohail Raza Moosani (SMC-Pvt) Limited (021) (021) 32400871 (021) 32416004 [email protected]/S Stock Master Sec. (Pvt) Limited (042) (042) 36316454-7 (042) 36316458 [email protected]/S Techno Fundamental Sec (Pvt) Limited (042) (042) 36317351 (042) 36317350 [email protected]/S Trust Capital (Pvt) Limited (042) (042) 35775401 (042) 57183411 [email protected]/S Trust Sec & Brokerage Limited (042) (042) 36373041-43 (042) 36373040 [email protected]/S Union Sec (Pvt) Limited (042) 00971 506440183 (042)35863126 [email protected]/S Universal Equities (Pvt) Limited (042) (042) 6280887-8 (042) 36317384 [email protected]
M/S Value Stock Securities (Pvt) Limited (042) 111-548-726 (042) 35770190 [email protected]
M/S Wasi Securities (SMC-Pvt) Limited (042) (042) 36367935-36 (042) 36360067 [email protected]
M/S Y. S. Sec & Services (Pvt) Limited (042) (042) 36315889 (042) 36310186 [email protected]
M/S Yasir Mahmood Securities (Pvt) Limited (042) (042) 35751212 (042) 35788220 [email protected]
M/S Zafar Sec (Pvt) Limited (042) (042) 36372470-2 (042) 36368522 [email protected]
M/S. First Prudential Modaraba - (051) 2876798 [email protected]
M/s. INA Securities (Pvt.) Limited (042) (042) 35756953-54 (042) 35710604 [email protected]
M/s. Innovative Brokerage (Pvt) Limited (042) (042) 35987400-10 (042) 5987420
M/s. SME Bank Limited (051) (051)9217000 (051)9217001 [email protected]
M/s. Switch Securities (Pvt) Limited (042) (042) 35843722-27 (042) 35860497 [email protected]
M/S.Gazipura Securities & Services (Pvt.) Ltd. (021) (021) 32418903 (021) 32422893 [email protected]
Malik Hamid Ali Noon (042) (042) 35762083 (042) 35762082 [email protected]
Mian Asif Maqbool Sukhera (042) (042) 36305663-5 (042) 36313803 [email protected]
Mian Khalid Bashir (042) (042)35760379 (042) 35760376 [email protected]
Mian Mohammad Saeed (Deceased) - -
Mian Nusrat-ud-Din (042) (042) 36313995-6 (042) 36279204 [email protected]
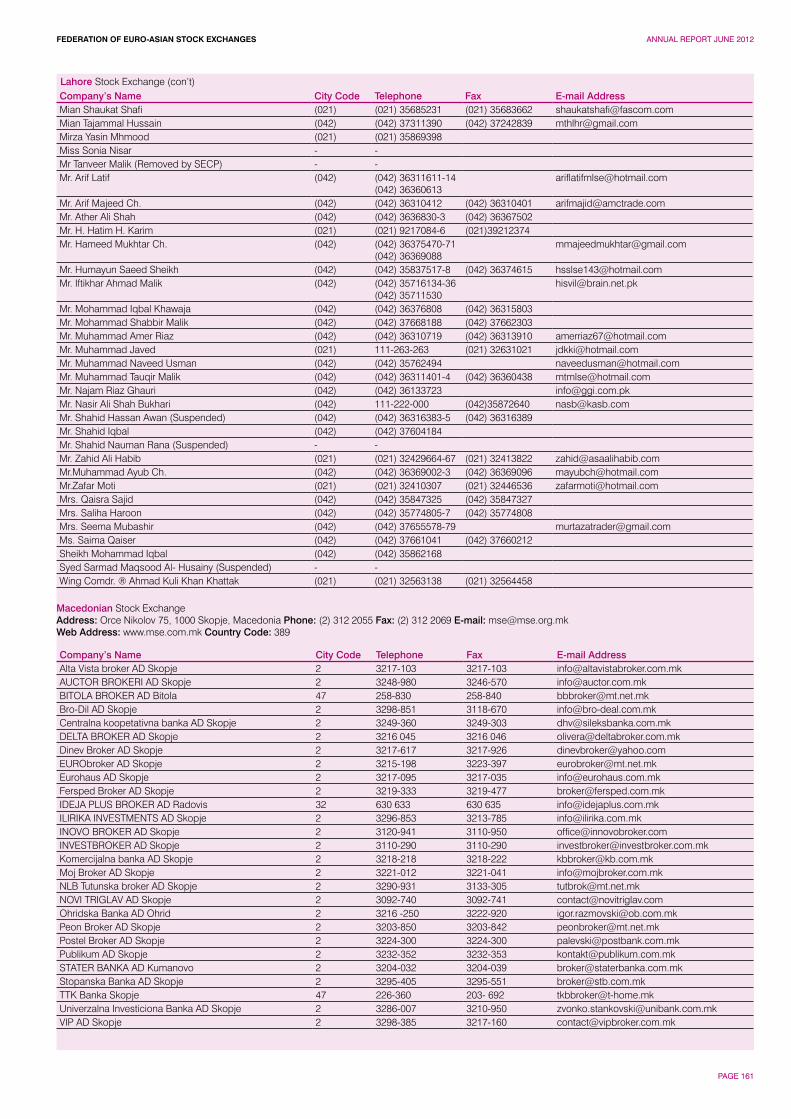
FEDERATION OF EURO-ASIAN STOCK EXCHANGES ANNUAL REPORT JUNE 2012
PAGE 161
Lahore Stock Exchange (con’t)Company’s Name City Code Telephone Fax E-mail AddressMian Shaukat Shafi (021) (021) 35685231 (021) 35683662 [email protected] Tajammal Hussain (042) (042) 37311390 (042) 37242839 [email protected] Yasin Mhmood (021) (021) 35869398Miss Sonia Nisar - -Mr Tanveer Malik (Removed by SECP) - -Mr. Arif Latif (042) (042) 36311611-14
(042) [email protected]
Mr. Arif Majeed Ch. (042) (042) 36310412 (042) 36310401 [email protected]. Ather Ali Shah (042) (042) 3636830-3 (042) 36367502Mr. H. Hatim H. Karim (021) (021) 9217084-6 (021)39212374Mr. Hameed Mukhtar Ch. (042) (042) 36375470-71
(042) [email protected]
Mr. Humayun Saeed Sheikh (042) (042) 35837517-8 (042) 36374615 [email protected]. Iftikhar Ahmad Malik (042) (042) 35716134-36
(042) [email protected]
Mr. Mohammad Iqbal Khawaja (042) (042) 36376808 (042) 36315803Mr. Mohammad Shabbir Malik (042) (042) 37668188 (042) 37662303Mr. Muhammad Amer Riaz (042) (042) 36310719 (042) 36313910 [email protected]. Muhammad Javed (021) 111-263-263 (021) 32631021 [email protected]. Muhammad Naveed Usman (042) (042) 35762494 [email protected]. Muhammad Tauqir Malik (042) (042) 36311401-4 (042) 36360438 [email protected]. Najam Riaz Ghauri (042) (042) 36133723 [email protected]. Nasir Ali Shah Bukhari (042) 111-222-000 (042)35872640 [email protected]. Shahid Hassan Awan (Suspended) (042) (042) 36316383-5 (042) 36316389Mr. Shahid Iqbal (042) (042) 37604184Mr. Shahid Nauman Rana (Suspended) - -Mr. Zahid Ali Habib (021) (021) 32429664-67 (021) 32413822 [email protected] Ayub Ch. (042) (042) 36369002-3 (042) 36369096 [email protected] Moti (021) (021) 32410307 (021) 32446536 [email protected]. Qaisra Sajid (042) (042) 35847325 (042) 35847327Mrs. Saliha Haroon (042) (042) 35774805-7 (042) 35774808Mrs. Seema Mubashir (042) (042) 37655578-79 [email protected]. Saima Qaiser (042) (042) 37661041 (042) 37660212Sheikh Mohammad Iqbal (042) (042) 35862168Syed Sarmad Maqsood Al- Husainy (Suspended) - -Wing Comdr. ® Ahmad Kuli Khan Khattak (021) (021) 32563138 (021) 32564458
Macedonian Stock Exchange Address: Orce Nikolov 75, 1000 Skopje, Macedonia Phone: (2) 312 2055 Fax: (2) 312 2069 E-mail: [email protected] Address: www.mse.com.mk Country Code: 389
Company’s Name City Code Telephone Fax E-mail AddressAlta Vista broker AD Skopje 2 3217-103 3217-103 [email protected] BROKERI AD Skopje 2 3248-980 3246-570 [email protected] BROKER AD Bitola 47 258-830 258-840 [email protected] AD Skopje 2 3298-851 3118-670 [email protected] koopetativna banka AD Skopje 2 3249-360 3249-303 [email protected] BROKER AD Skopje 2 3216 045 3216 046 [email protected] Broker AD Skopje 2 3217-617 3217-926 [email protected] AD Skopje 2 3215-198 3223-397 [email protected] AD Skopje 2 3217-095 3217-035 [email protected] Broker AD Skopje 2 3219-333 3219-477 [email protected] PLUS BROKER AD Radovis 32 630 633 630 635 [email protected] INVESTMENTS AD Skopje 2 3296-853 3213-785 [email protected] BROKER AD Skopje 2 3120-941 3110-950 [email protected] AD Skopje 2 3110-290 3110-290 [email protected] banka AD Skopje 2 3218-218 3218-222 [email protected] Broker AD Skopje 2 3221-012 3221-041 [email protected] Tutunska broker AD Skopje 2 3290-931 3133-305 [email protected] TRIGLAV AD Skopje 2 3092-740 3092-741 [email protected] Banka AD Ohrid 2 3216 -250 3222-920 [email protected] Broker AD Skopje 2 3203-850 3203-842 [email protected] Broker AD Skopje 2 3224-300 3224-300 [email protected] AD Skopje 2 3232-352 3232-353 [email protected] BANKA AD Kumanovo 2 3204-032 3204-039 [email protected] Banka AD Skopje 2 3295-405 3295-551 [email protected] Banka Skopje 47 226-360 203- 692 [email protected] Investiciona Banka AD Skopje 2 3286-007 3210-950 [email protected] AD Skopje 2 3298-385 3217-160 [email protected]
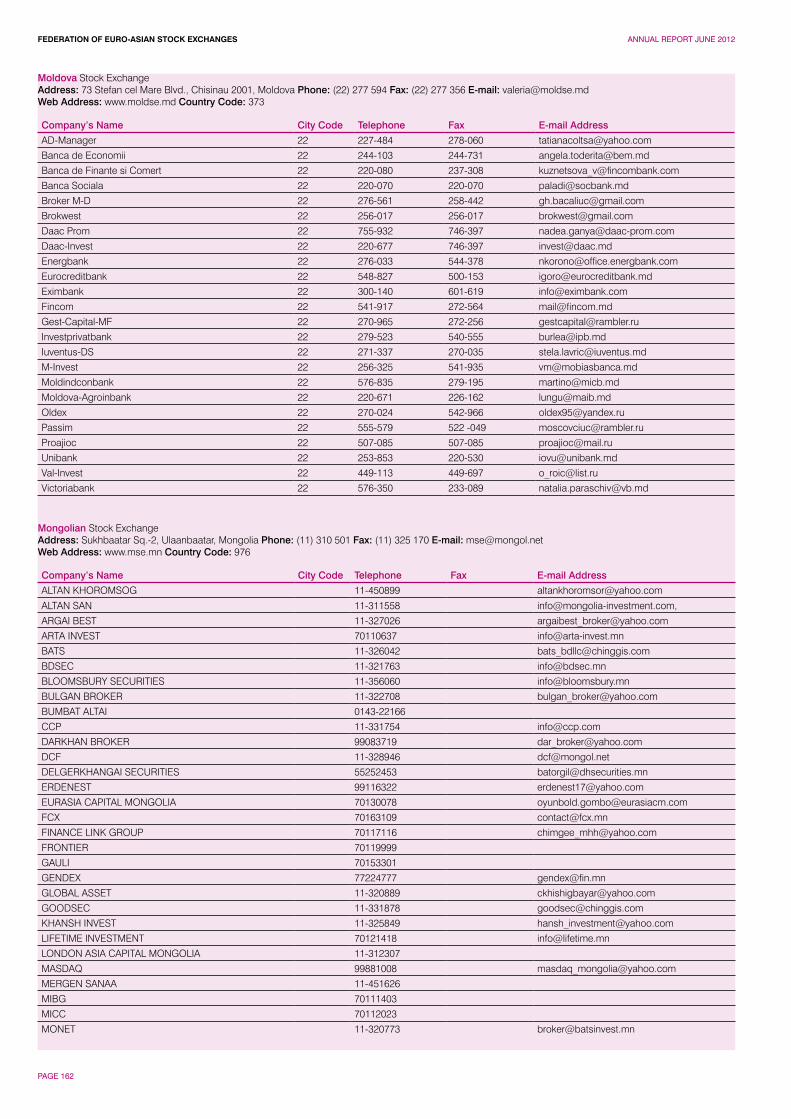
FEDERATION OF EURO-ASIAN STOCK EXCHANGES ANNUAL REPORT JUNE 2012
PAGE 162
Moldova Stock Exchange Address: 73 Stefan cel Mare Blvd., Chisinau 2001, Moldova Phone: (22) 277 594 Fax: (22) 277 356 E-mail: [email protected] Web Address: www.moldse.md Country Code: 373
Company’s Name City Code Telephone Fax E-mail Address
AD-Manager 22 227-484 278-060 [email protected]
Banca de Economii 22 244-103 244-731 [email protected]
Banca de Finante si Comert 22 220-080 237-308 [email protected]
Banca Sociala 22 220-070 220-070 [email protected]
Broker M-D 22 276-561 258-442 [email protected]
Brokwest 22 256-017 256-017 [email protected]
Daac Prom 22 755-932 746-397 [email protected]
Daac-Invest 22 220-677 746-397 [email protected]
Energbank 22 276-033 544-378 [email protected]
Eurocreditbank 22 548-827 500-153 [email protected]
Eximbank 22 300-140 601-619 [email protected]
Fincom 22 541-917 272-564 [email protected]
Gest-Capital-MF 22 270-965 272-256 [email protected]
Investprivatbank 22 279-523 540-555 [email protected]
Iuventus-DS 22 271-337 270-035 [email protected]
M-Invest 22 256-325 541-935 [email protected]
Moldindconbank 22 576-835 279-195 [email protected]
Moldova-Agroinbank 22 220-671 226-162 [email protected]
Oldex 22 270-024 542-966 [email protected]
Passim 22 555-579 522 -049 [email protected]
Proajioc 22 507-085 507-085 [email protected]
Unibank 22 253-853 220-530 [email protected]
Val-Invest 22 449-113 449-697 [email protected]
Victoriabank 22 576-350 233-089 [email protected]
Mongolian Stock Exchange Address: Sukhbaatar Sq.-2, Ulaanbaatar, Mongolia Phone: (11) 310 501 Fax: (11) 325 170 E-mail: [email protected] Address: www.mse.mn Country Code: 976
Company’s Name City Code Telephone Fax E-mail Address
ALTAN KHOROMSOG 11-450899 [email protected]
ALTAN SAN 11-311558 [email protected],
ARGAI BEST 11-327026 [email protected]
ARTA INVEST 70110637 [email protected]
BATS 11-326042 [email protected]
BDSEC 11-321763 [email protected]
BLOOMSBURY SECURITIES 11-356060 [email protected]
BULGAN BROKER 11-322708 [email protected]
BUMBAT ALTAI 0143-22166
CCP 11-331754 [email protected]
DARKHAN BROKER 99083719 [email protected]
DCF 11-328946 [email protected]
DELGERKHANGAI SECURITIES 55252453 [email protected]
ERDENEST 99116322 [email protected]
EURASIA CAPITAL MONGOLIA 70130078 [email protected]
FCX 70163109 [email protected]
FINANCE LINK GROUP 70117116 [email protected]
FRONTIER 70119999
GAULI 70153301
GENDEX 77224777 [email protected]
GLOBAL ASSET 11-320889 [email protected]
GOODSEC 11-331878 [email protected]
KHANSH INVEST 11-325849 [email protected]
LIFETIME INVESTMENT 70121418 [email protected]
LONDON ASIA CAPITAL MONGOLIA 11-312307
MASDAQ 99881008 [email protected]
MERGEN SANAA 11-451626
MIBG 70111403
MICC 70112023
MONET 11-320773 [email protected]
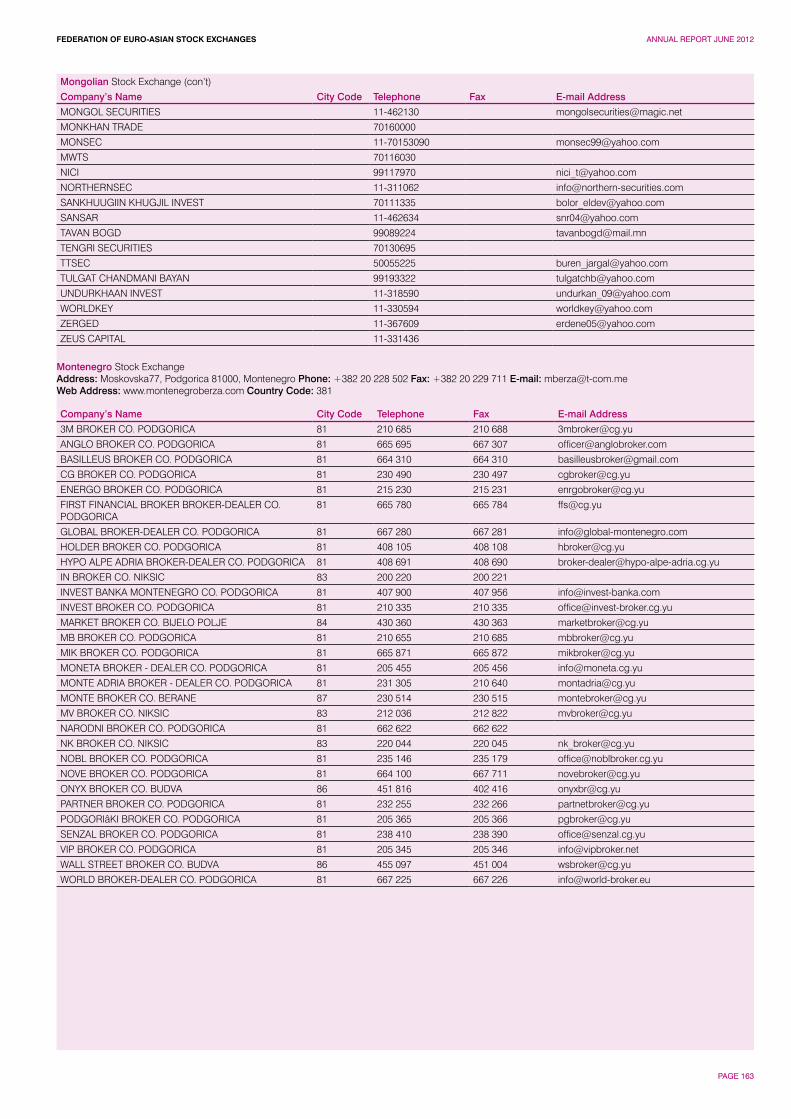
FEDERATION OF EURO-ASIAN STOCK EXCHANGES ANNUAL REPORT JUNE 2012
PAGE 163
Mongolian Stock Exchange (con’t)
Company’s Name City Code Telephone Fax E-mail Address
MONGOL SECURITIES 11-462130 [email protected]
MONKHAN TRADE 70160000
MONSEC 11-70153090 [email protected]
MWTS 70116030
NICI 99117970 [email protected]
NORTHERNSEC 11-311062 [email protected]
SANKHUUGIIN KHUGJIL INVEST 70111335 [email protected]
SANSAR 11-462634 [email protected]
TAVAN BOGD 99089224 [email protected]
TENGRI SECURITIES 70130695
TTSEC 50055225 [email protected]
TULGAT CHANDMANI BAYAN 99193322 [email protected]
UNDURKHAAN INVEST 11-318590 [email protected]
WORLDKEY 11-330594 [email protected]
ZERGED 11-367609 [email protected]
ZEUS CAPITAL 11-331436
Montenegro Stock Exchange Address: Moskovska77, Podgorica 81000, Montenegro Phone: +382 20 228 502 Fax: +382 20 229 711 E-mail: [email protected] Address: www.montenegroberza.com Country Code: 381
Company’s Name City Code Telephone Fax E-mail Address
3M BROKER CO. PODGORICA 81 210 685 210 688 [email protected]
ANGLO BROKER CO. PODGORICA 81 665 695 667 307 [email protected]
BASILLEUS BROKER CO. PODGORICA 81 664 310 664 310 [email protected]
CG BROKER CO. PODGORICA 81 230 490 230 497 [email protected]
ENERGO BROKER CO. PODGORICA 81 215 230 215 231 [email protected]
FIRST FINANCIAL BROKER BROKER-DEALER CO. PODGORICA
81 665 780 665 784 [email protected]
GLOBAL BROKER-DEALER CO. PODGORICA 81 667 280 667 281 [email protected]
HOLDER BROKER CO. PODGORICA 81 408 105 408 108 [email protected]
HYPO ALPE ADRIA BROKER-DEALER CO. PODGORICA 81 408 691 408 690 [email protected]
IN BROKER CO. NIKSIC 83 200 220 200 221
INVEST BANKA MONTENEGRO CO. PODGORICA 81 407 900 407 956 [email protected]
INVEST BROKER CO. PODGORICA 81 210 335 210 335 [email protected]
MARKET BROKER CO. BIJELO POLJE 84 430 360 430 363 [email protected]
MB BROKER CO. PODGORICA 81 210 655 210 685 [email protected]
MIK BROKER CO. PODGORICA 81 665 871 665 872 [email protected]
MONETA BROKER - DEALER CO. PODGORICA 81 205 455 205 456 [email protected]
MONTE ADRIA BROKER - DEALER CO. PODGORICA 81 231 305 210 640 [email protected]
MONTE BROKER CO. BERANE 87 230 514 230 515 [email protected]
MV BROKER CO. NIKSIC 83 212 036 212 822 [email protected]
NARODNI BROKER CO. PODGORICA 81 662 622 662 622
NK BROKER CO. NIKSIC 83 220 044 220 045 [email protected]
NOBL BROKER CO. PODGORICA 81 235 146 235 179 [email protected]
NOVE BROKER CO. PODGORICA 81 664 100 667 711 [email protected]
ONYX BROKER CO. BUDVA 86 451 816 402 416 [email protected]
PARTNER BROKER CO. PODGORICA 81 232 255 232 266 [email protected]
PODGORIâKI BROKER CO. PODGORICA 81 205 365 205 366 [email protected]
SENZAL BROKER CO. PODGORICA 81 238 410 238 390 [email protected]
VIP BROKER CO. PODGORICA 81 205 345 205 346 [email protected]
WALL STREET BROKER CO. BUDVA 86 455 097 451 004 [email protected]
WORLD BROKER-DEALER CO. PODGORICA 81 667 225 667 226 [email protected]
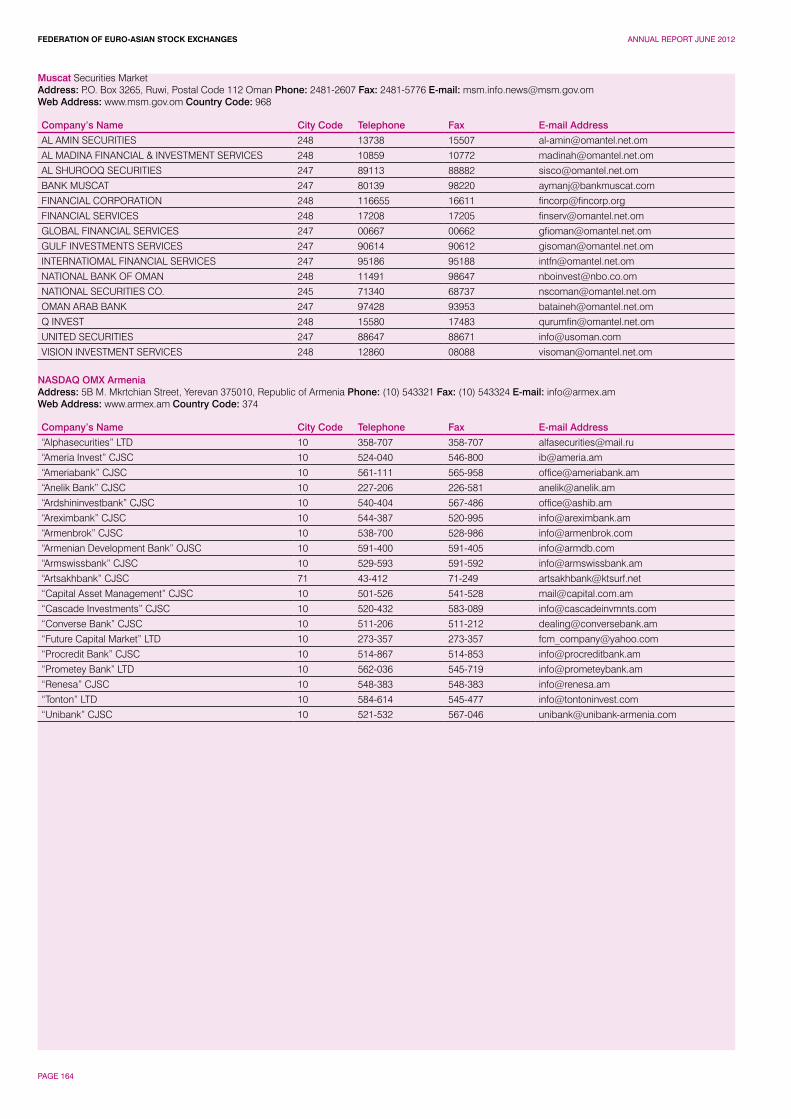
FEDERATION OF EURO-ASIAN STOCK EXCHANGES ANNUAL REPORT JUNE 2012
PAGE 164
Muscat Securities Market Address: P.O. Box 3265, Ruwi, Postal Code 112 Oman Phone: 2481-2607 Fax: 2481-5776 E-mail: [email protected] Address: www.msm.gov.om Country Code: 968
Company’s Name City Code Telephone Fax E-mail Address
AL AMIN SECURITIES 248 13738 15507 [email protected]
AL MADINA FINANCIAL & INVESTMENT SERVICES 248 10859 10772 [email protected]
AL SHUROOQ SECURITIES 247 89113 88882 [email protected]
BANK MUSCAT 247 80139 98220 [email protected]
FINANCIAL CORPORATION 248 116655 16611 [email protected]
FINANCIAL SERVICES 248 17208 17205 [email protected]
GLOBAL FINANCIAL SERVICES 247 00667 00662 [email protected]
GULF INVESTMENTS SERVICES 247 90614 90612 [email protected]
INTERNATIOMAL FINANCIAL SERVICES 247 95186 95188 [email protected]
NATIONAL BANK OF OMAN 248 11491 98647 [email protected]
NATIONAL SECURITIES CO. 245 71340 68737 [email protected]
OMAN ARAB BANK 247 97428 93953 [email protected]
Q INVEST 248 15580 17483 [email protected]
UNITED SECURITIES 247 88647 88671 [email protected]
VISION INVESTMENT SERVICES 248 12860 08088 [email protected]
NASDAQ OMX ArmeniaAddress: 5B M. Mkrtchian Street, Yerevan 375010, Republic of Armenia Phone: (10) 543321 Fax: (10) 543324 E-mail: [email protected] Address: www.armex.am Country Code: 374
Company’s Name City Code Telephone Fax E-mail Address
“Alphasecurities” LTD 10 358-707 358-707 [email protected]
“Ameria Invest” CJSC 10 524-040 546-800 [email protected]
“Ameriabank” CJSC 10 561-111 565-958 [email protected]
“Anelik Bank” CJSC 10 227-206 226-581 [email protected]
“Ardshininvestbank” CJSC 10 540-404 567-486 [email protected]
“Areximbank” CJSC 10 544-387 520-995 [email protected]
“Armenbrok” CJSC 10 538-700 528-986 [email protected]
“Armenian Development Bank” OJSC 10 591-400 591-405 [email protected]
“Armswissbank” CJSC 10 529-593 591-592 [email protected]
“Artsakhbank” CJSC 71 43-412 71-249 [email protected]
“Capital Asset Management” CJSC 10 501-526 541-528 [email protected]
“Cascade Investments” CJSC 10 520-432 583-089 [email protected]
“Converse Bank” CJSC 10 511-206 511-212 [email protected]
“Future Capital Market” LTD 10 273-357 273-357 [email protected]
“Procredit Bank” CJSC 10 514-867 514-853 [email protected]
“Prometey Bank” LTD 10 562-036 545-719 [email protected]
“Renesa” CJSC 10 548-383 548-383 [email protected]
“Tonton” LTD 10 584-614 545-477 [email protected]
“Unibank” CJSC 10 521-532 567-046 [email protected]
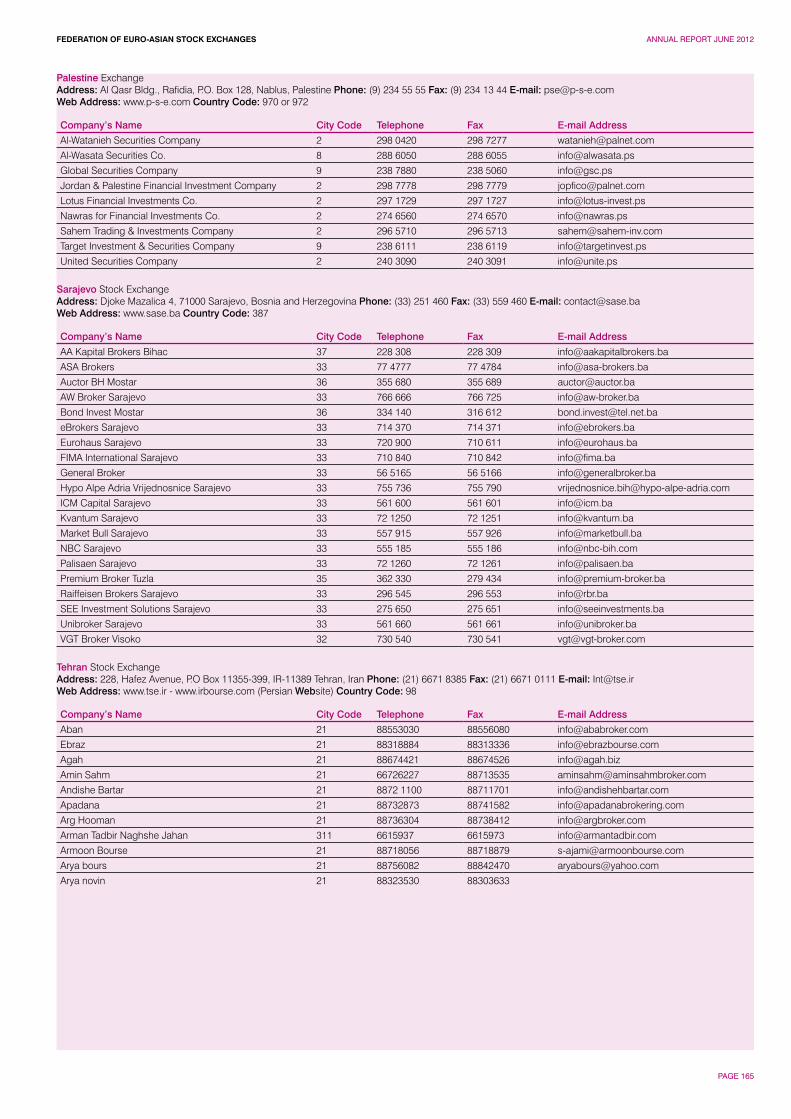
FEDERATION OF EURO-ASIAN STOCK EXCHANGES ANNUAL REPORT JUNE 2012
PAGE 165
Palestine Exchange Address: Al Qasr Bldg., Rafidia, P.O. Box 128, Nablus, Palestine Phone: (9) 234 55 55 Fax: (9) 234 13 44 E-mail: [email protected] Address: www.p-s-e.com Country Code: 970 or 972
Company’s Name City Code Telephone Fax E-mail Address
Al-Watanieh Securities Company 2 298 0420 298 7277 [email protected]
Al-Wasata Securities Co. 8 288 6050 288 6055 [email protected]
Global Securities Company 9 238 7880 238 5060 [email protected]
Jordan & Palestine Financial Investment Company 2 298 7778 298 7779 [email protected]
Lotus Financial Investments Co. 2 297 1729 297 1727 [email protected]
Nawras for Financial Investments Co. 2 274 6560 274 6570 [email protected]
Sahem Trading & Investments Company 2 296 5710 296 5713 [email protected]
Target Investment & Securities Company 9 238 6111 238 6119 [email protected]
United Securities Company 2 240 3090 240 3091 [email protected]
Sarajevo Stock Exchange Address: Djoke Mazalica 4, 71000 Sarajevo, Bosnia and Herzegovina Phone: (33) 251 460 Fax: (33) 559 460 E-mail: [email protected] Address: www.sase.ba Country Code: 387
Company’s Name City Code Telephone Fax E-mail Address
AA Kapital Brokers Bihac 37 228 308 228 309 [email protected]
ASA Brokers 33 77 4777 77 4784 [email protected]
Auctor BH Mostar 36 355 680 355 689 [email protected]
AW Broker Sarajevo 33 766 666 766 725 [email protected]
Bond Invest Mostar 36 334 140 316 612 [email protected]
eBrokers Sarajevo 33 714 370 714 371 [email protected]
Eurohaus Sarajevo 33 720 900 710 611 [email protected]
FIMA International Sarajevo 33 710 840 710 842 [email protected]
General Broker 33 56 5165 56 5166 [email protected]
Hypo Alpe Adria Vrijednosnice Sarajevo 33 755 736 755 790 [email protected]
ICM Capital Sarajevo 33 561 600 561 601 [email protected]
Kvantum Sarajevo 33 72 1250 72 1251 [email protected]
Market Bull Sarajevo 33 557 915 557 926 [email protected]
NBC Sarajevo 33 555 185 555 186 [email protected]
Palisaen Sarajevo 33 72 1260 72 1261 [email protected]
Premium Broker Tuzla 35 362 330 279 434 [email protected]
Raiffeisen Brokers Sarajevo 33 296 545 296 553 [email protected]
SEE Investment Solutions Sarajevo 33 275 650 275 651 [email protected]
Unibroker Sarajevo 33 561 660 561 661 [email protected]
VGT Broker Visoko 32 730 540 730 541 [email protected]
Tehran Stock ExchangeAddress: 228, Hafez Avenue, P.O Box 11355-399, IR-11389 Tehran, Iran Phone: (21) 6671 8385 Fax: (21) 6671 0111 E-mail: [email protected] Address: www.tse.ir - www.irbourse.com (Persian Website) Country Code: 98
Company’s Name City Code Telephone Fax E-mail Address
Aban 21 88553030 88556080 [email protected]
Ebraz 21 88318884 88313336 [email protected]
Agah 21 88674421 88674526 [email protected]
Amin Sahm 21 66726227 88713535 [email protected]
Andishe Bartar 21 8872 1100 88711701 [email protected]
Apadana 21 88732873 88741582 [email protected]
Arg Hooman 21 88736304 88738412 [email protected]
Arman Tadbir Naghshe Jahan 311 6615937 6615973 [email protected]
Armoon Bourse 21 88718056 88718879 [email protected]
Arya bours 21 88756082 88842470 [email protected]
Arya novin 21 88323530 88303633
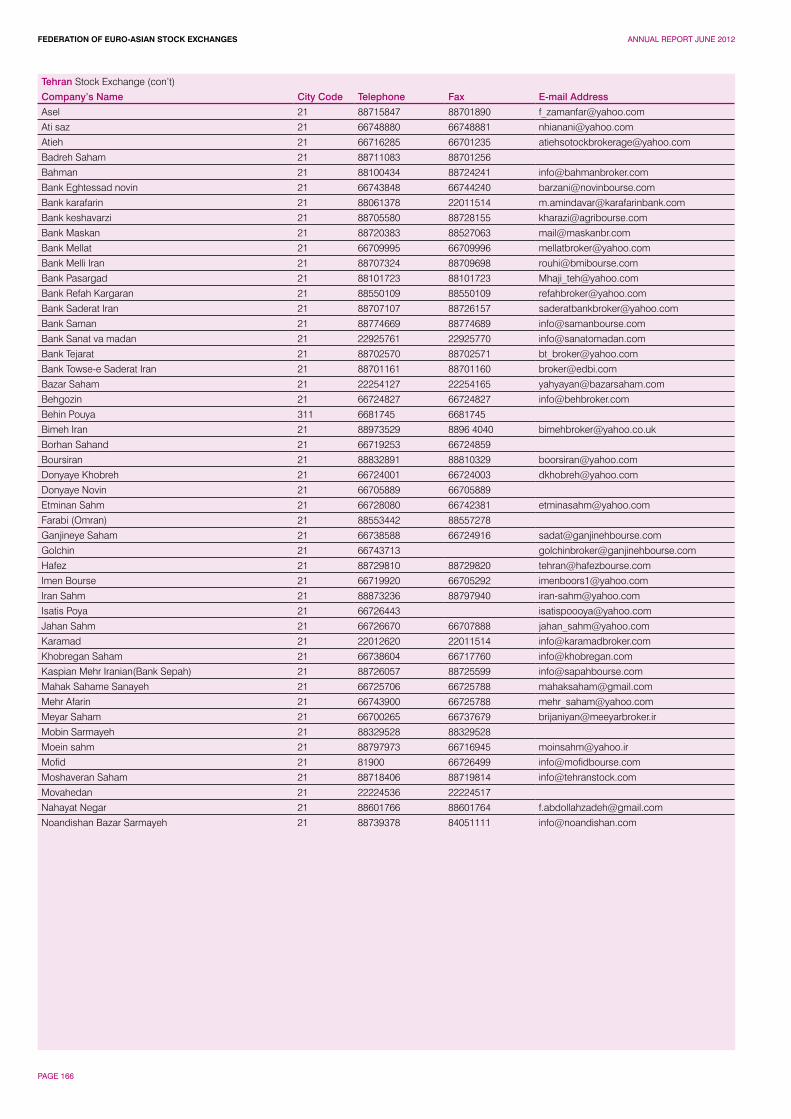
FEDERATION OF EURO-ASIAN STOCK EXCHANGES ANNUAL REPORT JUNE 2012
PAGE 166
Tehran Stock Exchange (con’t)
Company’s Name City Code Telephone Fax E-mail Address
Asel 21 88715847 88701890 [email protected]
Ati saz 21 66748880 66748881 [email protected]
Atieh 21 66716285 66701235 [email protected]
Badreh Saham 21 88711083 88701256
Bahman 21 88100434 88724241 [email protected]
Bank Eghtessad novin 21 66743848 66744240 [email protected]
Bank karafarin 21 88061378 22011514 [email protected]
Bank keshavarzi 21 88705580 88728155 [email protected]
Bank Maskan 21 88720383 88527063 [email protected]
Bank Mellat 21 66709995 66709996 [email protected]
Bank Melli Iran 21 88707324 88709698 [email protected]
Bank Pasargad 21 88101723 88101723 [email protected]
Bank Refah Kargaran 21 88550109 88550109 [email protected]
Bank Saderat Iran 21 88707107 88726157 [email protected]
Bank Saman 21 88774669 88774689 [email protected]
Bank Sanat va madan 21 22925761 22925770 [email protected]
Bank Tejarat 21 88702570 88702571 [email protected]
Bank Towse-e Saderat Iran 21 88701161 88701160 [email protected]
Bazar Saham 21 22254127 22254165 [email protected]
Behgozin 21 66724827 66724827 [email protected]
Behin Pouya 311 6681745 6681745
Bimeh Iran 21 88973529 8896 4040 [email protected]
Borhan Sahand 21 66719253 66724859
Boursiran 21 88832891 88810329 [email protected]
Donyaye Khobreh 21 66724001 66724003 [email protected]
Donyaye Novin 21 66705889 66705889
Etminan Sahm 21 66728080 66742381 [email protected]
Farabi (Omran) 21 88553442 88557278
Ganjineye Saham 21 66738588 66724916 [email protected]
Golchin 21 66743713 [email protected]
Hafez 21 88729810 88729820 [email protected]
Imen Bourse 21 66719920 66705292 [email protected]
Iran Sahm 21 88873236 88797940 [email protected]
Isatis Poya 21 66726443 [email protected]
Jahan Sahm 21 66726670 66707888 [email protected]
Karamad 21 22012620 22011514 [email protected]
Khobregan Saham 21 66738604 66717760 [email protected]
Kaspian Mehr Iranian(Bank Sepah) 21 88726057 88725599 [email protected]
Mahak Sahame Sanayeh 21 66725706 66725788 [email protected]
Mehr Afarin 21 66743900 66725788 [email protected]
Meyar Saham 21 66700265 66737679 [email protected]
Mobin Sarmayeh 21 88329528 88329528
Moein sahm 21 88797973 66716945 [email protected]
Mofid 21 81900 66726499 [email protected]
Moshaveran Saham 21 88718406 88719814 [email protected]
Movahedan 21 22224536 22224517
Nahayat Negar 21 88601766 88601764 [email protected]
Noandishan Bazar Sarmayeh 21 88739378 84051111 [email protected]
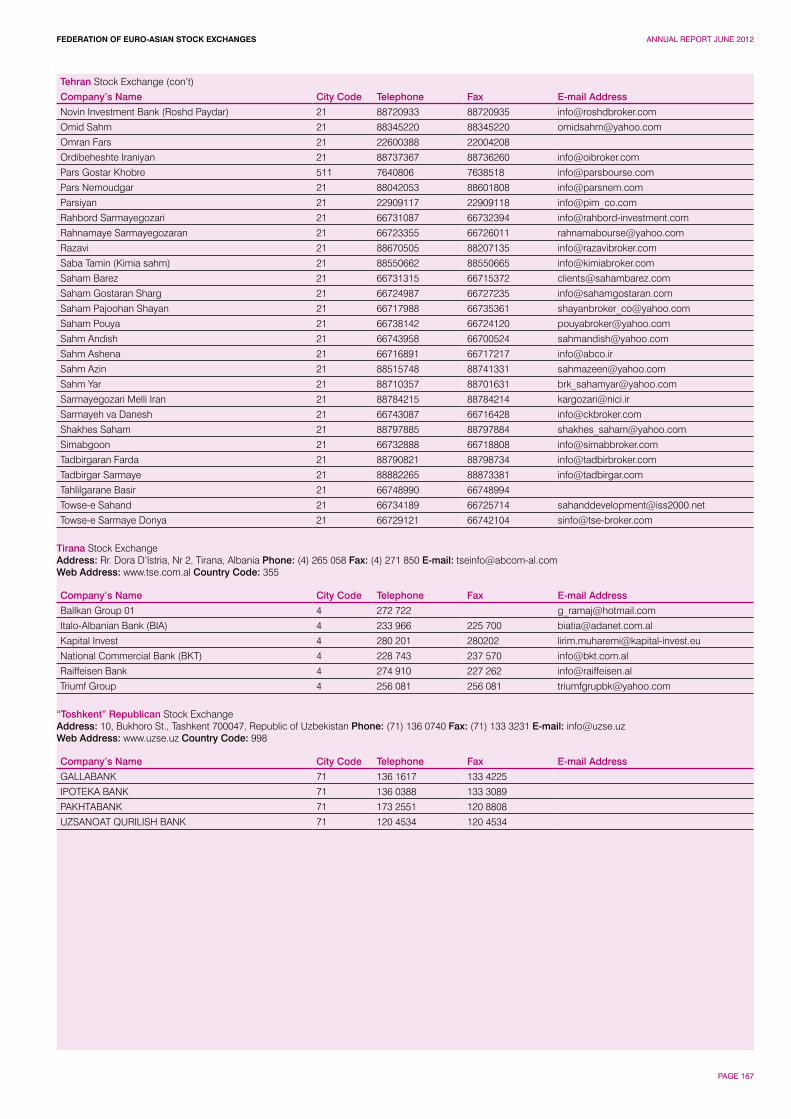
FEDERATION OF EURO-ASIAN STOCK EXCHANGES ANNUAL REPORT JUNE 2012
PAGE 167
Tehran Stock Exchange (con’t)
Company’s Name City Code Telephone Fax E-mail Address
Novin Investment Bank (Roshd Paydar) 21 88720933 88720935 [email protected]
Omid Sahm 21 88345220 88345220 [email protected]
Omran Fars 21 22600388 22004208
Ordibeheshte Iraniyan 21 88737367 88736260 [email protected]
Pars Gostar Khobre 511 7640806 7638518 [email protected]
Pars Nemoudgar 21 88042053 88601808 [email protected]
Parsiyan 21 22909117 22909118 info@pim_co.com
Rahbord Sarmayegozari 21 66731087 66732394 [email protected]
Rahnamaye Sarmayegozaran 21 66723355 66726011 [email protected]
Razavi 21 88670505 88207135 [email protected]
Saba Tamin (Kimia sahm) 21 88550662 88550665 [email protected]
Saham Barez 21 66731315 66715372 [email protected]
Saham Gostaran Sharg 21 66724987 66727235 [email protected]
Saham Pajoohan Shayan 21 66717988 66735361 [email protected]
Saham Pouya 21 66738142 66724120 [email protected]
Sahm Andish 21 66743958 66700524 [email protected]
Sahm Ashena 21 66716891 66717217 [email protected]
Sahm Azin 21 88515748 88741331 [email protected]
Sahm Yar 21 88710357 88701631 [email protected]
Sarmayegozari Melli Iran 21 88784215 88784214 [email protected]
Sarmayeh va Danesh 21 66743087 66716428 [email protected]
Shakhes Saham 21 88797885 88797884 [email protected]
Simabgoon 21 66732888 66718808 [email protected]
Tadbirgaran Farda 21 88790821 88798734 [email protected]
Tadbirgar Sarmaye 21 88882265 88873381 [email protected]
Tahlilgarane Basir 21 66748990 66748994
Towse-e Sahand 21 66734189 66725714 [email protected]
Towse-e Sarmaye Donya 21 66729121 66742104 [email protected]
Tirana Stock Exchange Address: Rr. Dora D’lstria, Nr 2, Tirana, Albania Phone: (4) 265 058 Fax: (4) 271 850 E-mail: [email protected] Address: www.tse.com.al Country Code: 355
Company’s Name City Code Telephone Fax E-mail Address
Ballkan Group 01 4 272 722 [email protected]
Italo-Albanian Bank (BIA) 4 233 966 225 700 [email protected]
Kapital Invest 4 280 201 280202 [email protected]
National Commercial Bank (BKT) 4 228 743 237 570 [email protected]
Raiffeisen Bank 4 274 910 227 262 [email protected]
Triumf Group 4 256 081 256 081 [email protected]
“Toshkent” Republican Stock Exchange Address: 10, Bukhoro St., Tashkent 700047, Republic of Uzbekistan Phone: (71) 136 0740 Fax: (71) 133 3231 E-mail: [email protected] Address: www.uzse.uz Country Code: 998
Company’s Name City Code Telephone Fax E-mail Address
GALLABANK 71 136 1617 133 4225
IPOTEKA BANK 71 136 0388 133 3089
PAKHTABANK 71 173 2551 120 8808
UZSANOAT QURILISH BANK 71 120 4534 120 4534
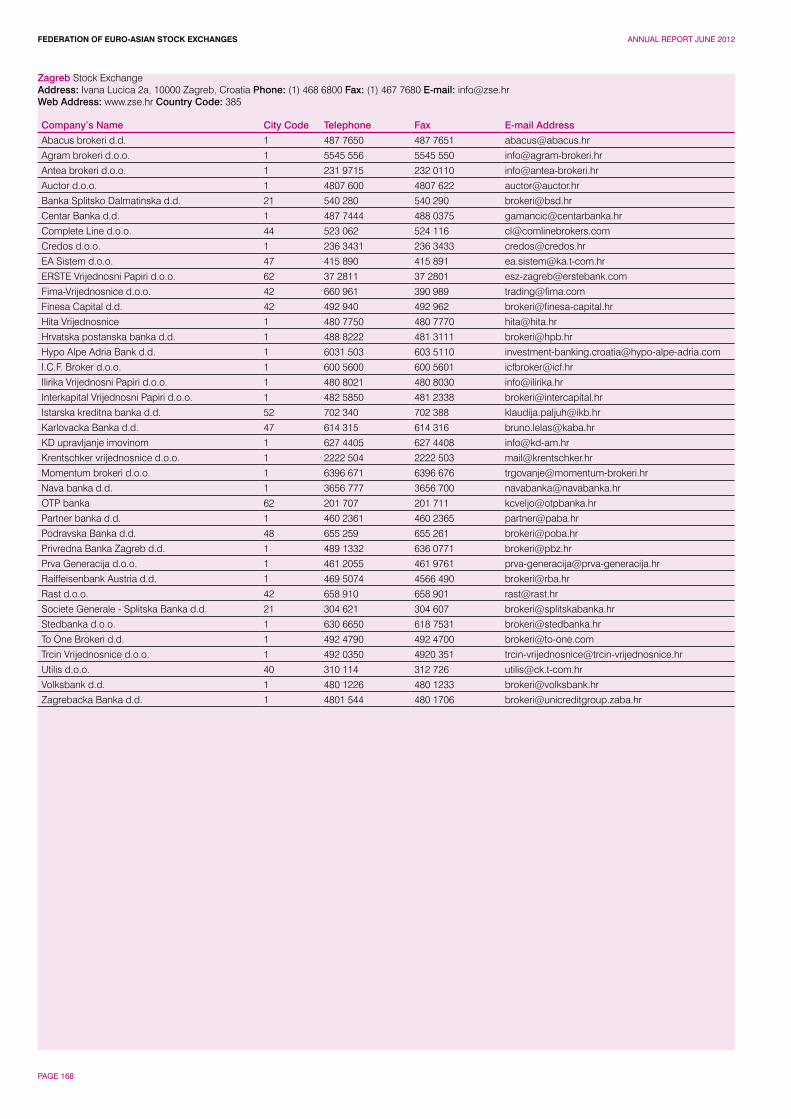
FEDERATION OF EURO-ASIAN STOCK EXCHANGES ANNUAL REPORT JUNE 2012
PAGE 168
Zagreb Stock Exchange Address: Ivana Lucica 2a, 10000 Zagreb, Croatia Phone: (1) 468 6800 Fax: (1) 467 7680 E-mail: [email protected] Address: www.zse.hr Country Code: 385
Company’s Name City Code Telephone Fax E-mail Address
Abacus brokeri d.d. 1 487 7650 487 7651 [email protected]
Agram brokeri d.o.o. 1 5545 556 5545 550 [email protected]
Antea brokeri d.o.o. 1 231 9715 232 0110 [email protected]
Auctor d.o.o. 1 4807 600 4807 622 [email protected]
Banka Splitsko Dalmatinska d.d. 21 540 280 540 290 [email protected]
Centar Banka d.d. 1 487 7444 488 0375 [email protected]
Complete Line d.o.o. 44 523 062 524 116 [email protected]
Credos d.o.o. 1 236 3431 236 3433 [email protected]
EA Sistem d.o.o. 47 415 890 415 891 [email protected]
ERSTE Vrijednosni Papiri d.o.o. 62 37 2811 37 2801 [email protected]
Fima-Vrijednosnice d.o.o. 42 660 961 390 989 [email protected]
Finesa Capital d.d. 42 492 940 492 962 [email protected]
Hita Vrijednosnice 1 480 7750 480 7770 [email protected]
Hrvatska postanska banka d.d. 1 488 8222 481 3111 [email protected]
Hypo Alpe Adria Bank d.d. 1 6031 503 603 5110 [email protected]
I.C.F. Broker d.o.o. 1 600 5600 600 5601 [email protected]
Ilirika Vrijednosni Papiri d.o.o. 1 480 8021 480 8030 [email protected]
Interkapital Vrijednosni Papiri d.o.o. 1 482 5850 481 2338 [email protected]
Istarska kreditna banka d.d. 52 702 340 702 388 [email protected]
Karlovacka Banka d.d. 47 614 315 614 316 [email protected]
KD upravljanje imovinom 1 627 4405 627 4408 [email protected]
Krentschker vrijednosnice d.o.o. 1 2222 504 2222 503 [email protected]
Momentum brokeri d.o.o. 1 6396 671 6396 676 [email protected]
Nava banka d.d. 1 3656 777 3656 700 [email protected]
OTP banka 62 201 707 201 711 [email protected]
Partner banka d.d. 1 460 2361 460 2365 [email protected]
Podravska Banka d.d. 48 655 259 655 261 [email protected]
Privredna Banka Zagreb d.d. 1 489 1332 636 0771 [email protected]
Prva Generacija d.o.o. 1 461 2055 461 9761 [email protected]
Raiffeisenbank Austria d.d. 1 469 5074 4566 490 [email protected]
Rast d.o.o. 42 658 910 658 901 [email protected]
Societe Generale - Splitska Banka d.d. 21 304 621 304 607 [email protected]
Stedbanka d.o.o. 1 630 6650 618 7531 [email protected]
To One Brokeri d.d. 1 492 4790 492 4700 [email protected]
Trcin Vrijednosnice d.o.o. 1 492 0350 4920 351 [email protected]
Utilis d.o.o. 40 310 114 312 726 [email protected]
Volksbank d.d. 1 480 1226 480 1233 [email protected]
Zagrebacka Banka d.d. 1 4801 544 480 1706 [email protected]
A subsidiary of İşbank