Embed Size (px)
Citation preview

Table of Contents
SECURITIES AND EXCHANGE COMMISSIONWASHINGTON, D.C. 20549
FORM 10-KANNUAL REPORT PURSUANT TO
SECTION 13 OR 15(d) OF THESECURITIES EXCHANGE ACT OF 1934
FOR THE FISCAL YEAR ENDED COMMISSION FILE NUMBER
DECEMBER 31, 2006 1-9608
NEWELL RUBBERMAID INC.(EXACT NAME OF REGISTRANT AS SPECIFIED IN ITS CHARTER)
DELAWARE
(State or other jurisdiction of Incorporation or organization)
36-3514169(I.R.S. Employer
Identification No.)
10 B Glenlake Parkway, Suite 300 Atlanta, Georgia 30328
(Address of principal executive offices) (Zip Code)
Registrant’s telephone number, including area code: (770) 407-3800
Securities registered pursuant to Section 12(b) of the Act: NAME OF EACH EXCHANGETITLE OF EACH CLASS ON WHICH REGISTEREDCommon Stock, $1 par value per share New York Stock Exchange Chicago Stock Exchange
Securities registered pursuant to Section 12(g) of the Act: None
Indicate by check mark if the registrant is a well-known seasoned issuer, as defined in Rule 405 of the Securities Act.Yes ☑ No o
Indicate by check mark if the registrant is not required to file reports pursuant to Section 13 or 15(d) of the Act.Yes o No ☑
Indicate by check mark whether the Registrant (1) has filed all reports required to be filed by Section 13 or 15(d) of the Securities Exchange Act of 1934during the preceding 12 months (or for such shorter period that the Registrant was required to file such reports), and (2) has been subject to such filingrequirements for the past 90 days.Yes ☑ No o
Indicate by check mark if disclosure of delinquent filers pursuant to Item 405 of Regulation S-K is not contained herein, and will not be contained, to the bestof Registrant’s knowledge, in definitive proxy or information statements incorporated by reference in Part III of this Form 10-K or any amendment to thisForm 10-K. ☑
Indicate by check mark whether the registrant is a large accelerated filer, an accelerated filer, or a non-accelerated filer. See definition of “accelerated filer andlarge accelerated filer” in Rule 12b-2 of the Exchange Act. (Check one):Large Accelerated Filer ☑ Accelerated Filer o Non-Accelerated Filer o
Indicate by check mark whether the registrant is a shell company (as defined in Rule 12b-2 of the Act).Yes o No ☑
There were 277.6 million shares of the Registrant’s Common Stock outstanding (net of treasury shares) as of January 31, 2007. The aggregate market value ofthe shares of Common Stock (based upon the closing price on the New York Stock Exchange on June 30, 2006) beneficially owned by non-affiliates of theRegistrant was approximately $7,066.3 million. For purposes of the foregoing calculation only, which is required by Form 10-K, the Registrant has includedin the shares owned by affiliates those shares owned by directors and officers of the Registrant, and such inclusion shall not be construed as an admission thatany such person is an affiliate for any purpose.
* * *
DOCUMENTS INCORPORATED BY REFERENCE
Portions of the Registrant’s Definitive Proxy Statement for its Annual Meeting of Stockholders to be held May 8, 2007.
TABLE OF CONTENTS PART I ITEM 1. BUSINESS ITEM 1A. RISK FACTORS ITEM 1B. UNRESOLVED STAFF COMMENTS ITEM 2. PROPERTIES ITEM 3. LEGAL PROCEEDINGS ITEM 4. SUBMISSION OF MATTERS TO A VOTE OF SECURITY HOLDERS SUPPLEMENTARY ITEM – EXECUTIVE OFFICERS OF THE REGISTRANTPART II
ITEM 5. MARKET FOR REGISTRANT’S COMMON EQUITY, RELATED STOCKHOLDER MATTERS AND ISSUER PURCHASESOF EQUITY SECURITIES
ITEM 6. SELECTED FINANCIAL DATA ITEM 7. MANAGEMENT’S DISCUSSION AND ANALYSIS OF FINANCIAL CONDITION AND RESULTS OF OPERATIONS ITEM 7A. QUANTITATIVE AND QUALITATIVE DISCLOSURES ABOUT MARKET RISK ITEM 8. FINANCIAL STATEMENTS AND SUPPLEMENTARY DATA ITEM 9. CHANGES IN AND DISAGREEMENTS WITH ACCOUNTANTS ON ACCOUNTING AND FINANCIAL DISCLOSURE ITEM 9A. CONTROLS AND PROCEDURES ITEM 9B. OTHER INFORMATIONPART III ITEM 10. DIRECTORS, EXECUTIVE OFFICERS AND CORPORATE GOVERNANCE ITEM 11. EXECUTIVE COMPENSATION
ITEM 12. SECURITY OWNERSHIP OF CERTAIN BENEFICIAL OWNERS AND MANAGEMENT AND RELATEDSTOCKHOLDER MATTERS
ITEM 13. CERTAIN RELATIONSHIPS AND RELATED TRANSACTIONS, AND DIRECTOR INDEPENDENCE ITEM 14. PRINCIPAL ACCOUNTANT FEES AND SERVICESPART IV ITEM 15. EXHIBITS AND FINANCIAL STATEMENT SCHEDULES SIGNATURESEXHIBIT INDEXAmendments to Credit Agreement between the Company and JPMorgan Chase Bank, NAForm of Performance Share Award Agreement under Newell Rubbermaid Inc. 2003 Stock PlanNewell Rubbermaid Inc. 2007 Supplemental Transition Bonus PlanAmendment to Newell Rubbermaid Supplemental Executive Retirement PlanStatement of Computation of Ratio of Earnings to Fixed ChargesSignificant Subsidiaries of the CompanyConsent of Ernst & Young LLP302 Certification of Chief Executive Officer302 Certification of Chief Financial Officer906 Certification of Chief Executive Officer906 Certification of Chief Financial Officer Credit Agreement Supplemental Executive Retirement Plan Form of Performance Share Award Agreement 2007 Supplemental Transition Bonus Plan Statement of Computation of Earnings to Fixed Charges Significant Subsidiaries of the Company Consent of Ernst & Young LLP 302 Certification of Chief Executive Officer 302 Certification of Chief Financial Officer 906 Certification of Chief Executive Officer 906 Certification of Chief Financial Officer
Table of Contents
PART I
ITEM 1. BUSINESS
“Newell Rubbermaid” or the “Company” refers to Newell Rubbermaid Inc. alone or with its wholly owned subsidiaries, as the context requires. When thisreport uses the words “we” or “our,” they refer to the Company and its subsidiaries unless the context otherwise requires.
WEBSITE ACCESS TO SECURITIES AND EXCHANGE COMMISSION REPORTS
The Company’s Internet website can be found at www.newellrubbermaid.com. The Company makes available free of charge on or through its website itsannual reports on Form 10-K, quarterly reports on Form 10-Q, current reports on Form 8-K, and amendments to those reports filed or furnished pursuant toSection 13(a) or 15(d) of the Securities Exchange Act of 1934 as soon as practicable after the Company files them with, or furnishes them to, the Securitiesand Exchange Commission.
GENERAL
Newell Rubbermaid is a global marketer of consumer and commercial products that touch the lives of people where they work, live and play. The Company’sstrong portfolio of brands includes Sharpie®, Paper Mate®, DYMO®, EXPO®, Waterman®, Parker®, Rolodex®, IRWIN® , LENOX®, BernzOmatic®,Rubbermaid®, Levolor®, Graco®, Calphalon® and Goody®. The Company’s multi-product offering consists of well known name-brand consumer andcommercial products in four business segments: Cleaning, Organization & Décor; Office Products; Tools & Hardware; and Home & Family.
The Company’s vision is to become a global company of large, consumer-meaningful brands (“Brands That Matter™”) and great people, known for best-in-class results. The Company’s four transformational strategic initiatives are as follows: Create Consumer-Meaningful Brands, Leverage One NewellRubbermaid, Achieve Best Total Cost and Nurture 360º Innovation.
Create Consumer-Meaningful Brands is the initiative to move from the historical focus on customer push marketing and excelling in manufacturing anddistributing products, to a new focus on consumer pull marketing and creating competitive advantage through understanding our consumers, innovating todeliver great performance and value, investing in advertising and promotion to create demand and leveraging our brands in adjacent categories around theworld. Leverage One Newell Rubbermaid is the initiative to lower cost and drive speed to market by leveraging common business activities and best practicesof our business units. This will be supported by building a common culture of shared values, with a focus on collaboration and teamwork. Achieve Best TotalCost is the initiative to achieve an optimal balance between manufacturing and sourcing and between high-cost and low-cost country manufacturing and toleverage the Company’s size and scale to drive productivity and achieve a best cost position. Nurture 360º Innovation represents the broadened definition ofinnovation to include consumer driven product invention and the successful commercialization of invention.
The Company’s results depend on the ability of its individual business units to succeed in their respective categories, each of which has some uniqueconsumers, customers and competitors. The Company’s strategic initiatives are designed to help enable these business units to generate differentiatedproducts, operate within a best-in-class cost structure and employ superior branding in order to yield premium margins on their products. Premium marginsfund incremental demand creation by the business units, driving incremental sales and profits for the Company.
Refer to the forward-looking statements section of Management’s Discussion and Analysis of Financial Condition and Results of Operations for a discussionof the Company’s forward-looking statements included in this report.
BUSINESS SEGMENTS
The Company’s reporting segments reflect the Company’s focus on building large consumer and commercial brands, promoting organizational integration,achieving operating efficiencies in sourcing and distribution, and leveraging our understanding of similar consumer segments and distribution channels.
2
Table of Contents
The Company aggregates certain of its operating segments into four reportable segments. The reportable segments are as follows: Segment Description of ProductsCleaning, Organization & Décor Material handling, cleaning, refuse, indoor/outdoor organization, home storage, food storage, drapery hardware, window treatmentsOffice Products Ball point/roller ball pens, markers, highlighters, pencils, correction fluids, office products, art supplies, on-demand labeling products, card-scanning solutionsTools & Hardware Hand tools, power tool accessories, manual paint applicators, cabinet, window and convenience hardware, propane torches, solderHome & Family (Other) Operating segments that do not meet aggregation criteria with other operating segments, including premium cookware and related kitchenware, hair care accessory
products, infant and juvenile products, including high chairs, car seats, strollers, and play
yards
In the fourth quarter of 2006, the Company combined its Cleaning & Organization and Home Fashions segments (now referred to as Cleaning, Organization& Décor) as these businesses sell to similar major customers, produce products that are used in and around the home, and leverage the same managementstructure.
Also in 2006, the Company updated its segment reporting to reflect the realignment of certain European businesses, previously reported in the formerCleaning & Organization segment, and now reported in the Home & Family segment for all periods presented. The decision to realign these businesses,which include the Graco European business, is consistent with the Company’s move from a regional management structure to a global business unit structure.
During 2006 and early 2007, the Company divested its European Cookware, Little Tikes and Home Décor Europe businesses. The European Cookware andLittle Tikes businesses were previously reported in the Home & Family operating segment. Home Décor Europe was previously reported in the HomeFashions operating segment. The results of these businesses are currently included in discontinued operations. Refer to Footnote 3 of the Notes to theConsolidated Financial Statements for additional information.
CLEANING, ORGANIZATION & DÉCOR
The Company’s Cleaning, Organization & Décor segment is conducted by the Rubbermaid Home Products, Rubbermaid Foodservice Products, RubbermaidCommercial Products and Levolor/Kirsch business units. These businesses design, manufacture or source, package and distribute semi-durable productsprimarily for use in the home and commercial settings. The products include indoor and outdoor organization, home storage, food storage, cleaning, refuse,material handling, drapery hardware, custom and stock horizontal and vertical blinds, as well as pleated, cellular and roller shades.
Rubbermaid Home Products, Rubbermaid Foodservice Products and Rubbermaid Commercial Products primarily sell their products under the Rubbermaid®,Brute®, Roughneck® and TakeAlongs® trademarks. Levolor/Kirsch primarily sells its products under the trademarks Levolor® and Kirsch®.
Rubbermaid Home Products and Rubbermaid Foodservice Products market their products directly and through distributors to mass merchants, home centers,warehouse clubs, grocery/drug stores and hardware distributors. Rubbermaid Commercial Products markets its products directly and through distributors tocommercial channels and home centers. Levolor/Kirsch markets its products directly and through distributors to mass merchants, home centers,department/specialty stores, hardware distributors, industrial/construction outlets, custom shops, select contract customers and other professional customers.
- 3 -
Table of Contents
OFFICE PRODUCTS
The Company’s Office Products segment is conducted by four business units divided geographically. The Sanford North America, Sanford Europe, SanfordLatin America and Sanford Asia Pacific businesses primarily design, manufacture or source, package and distribute fine/luxury, technical and everydaywriting instruments, technology based products and organization products, including permanent/waterbase markers, dry erase markers, overhead projectorpens, highlighters, wood-cased pencils, ballpoint pens and inks, correction fluids, office products, art supplies, on-demand labeling products and cardscanning solutions. It also distributes other writing instruments including roller ball pens and mechanical pencils for the retail marketplace.
Office Products primarily sells its products under the trademarks Sharpie®, Paper Mate®, Parker®, Waterman®, Eberhard Faber®, Berol®, Reynolds®,rotring®, uni-Ball® (used under exclusive license from Mitsubishi Pencil Co. Ltd. and its subsidiaries in North America), Expo®, Sharpie® Accent®, Vis-à-Vis®, Expresso®, Liquid Paper®, Mongol®, Foohy®, Prismacolor®, Eldon®, DYMO®, Mimio® and CardScan®.
Sanford North America markets its products directly and through distributors to mass merchants, warehouse clubs, grocery/drug stores, office superstores,office supply stores, contract stationers, and hardware distributors. Sanford Europe, Latin America and Asia Pacific market their products directly to retailers,distributors and contract stationers.
TOOLS & HARDWARE
The Company’s Tools & Hardware segment is conducted by the following business units: IRWIN North America Power Tool Accessories, IRWIN NorthAmerica Hand Tools, IRWIN Tools Europe, IRWIN Tools Latin America, LENOX and Amerock. IRWIN North America Power Tool Accessories, IRWINNorth America Hand Tools, IRWIN Tools Europe, IRWIN Tools Latin America and LENOX design, manufacture or source, package and distribute handtools and power tool accessories, propane torches, solder and accessories, and manual paint applicator products. Amerock designs, manufactures or sources,packages and distributes cabinet hardware for the retail and O.E.M. marketplace, window and door hardware for window and door manufactures andhardware for the retail marketplace.
IRWIN North America Power Tool Accessories, IRWIN North America Hand Tools, IRWIN Tools Europe and IRWIN Tools Latin America primarily selltheir products under the trademarks IRWIN®, Vise-Grip®, Marathon®, Twill®, Speedbor®, Jack®, Quick-Grip®, Unibit®, Strait-Line®, BernzOmatic®, Shur-Line® and Rubbermaid®. LENOX primarily sells its products under the LENOX® and Sterling® trademarks. Amerock primarily sells its products under thetrademarks Amerock®, Allison®, Ashland® and Bulldog®.
IRWIN North America Power Tool Accessories, IRWIN North America Hand Tools, IRWIN Tools Europe, IRWIN Tools Latin America, LENOX, andAmerock market their products directly and through distributors to mass merchants, home centers, department/specialty stores, hardware distributors,industrial/construction outlets, custom shops, select contract customers and other professional customers.
HOME & FAMILY
The Company’s Home & Family segment is conducted by the following business units: Calphalon, Graco, and Goody. Calphalon primarily designs,manufactures or sources, packages and distributes aluminum and stainless steel cookware, bakeware, cutlery and kitchen gadgets and utensils. Graco designs,manufactures or sources, packages and distributes infant and juvenile products such as swings, high chairs, car seats, strollers, and play yards. Goody designs,manufactures or sources, packages and distributes hair care accessories and grooming products.
Calphalon primarily sells its products under the trademarks Calphalon®, Kitchen Essentials®, Cooking with Calphalon™, Calphalon®One™ and Katana™.Graco primarily sells its products under the Graco® trademark. Goody markets its products primarily under the Goody®, Ace®, i|m™, STAYPUT™,Ouchless™, STYLINGSOLUTIONS™, THERAPYSOLUTIONS™ and COLOURCOLLECTION™ trademarks.
Calphalon markets and sells its products directly to department, specialty stores and through its branded retail outlets. Graco markets its products directly andthrough distributors to mass merchants, warehouse clubs, and
- 4 -
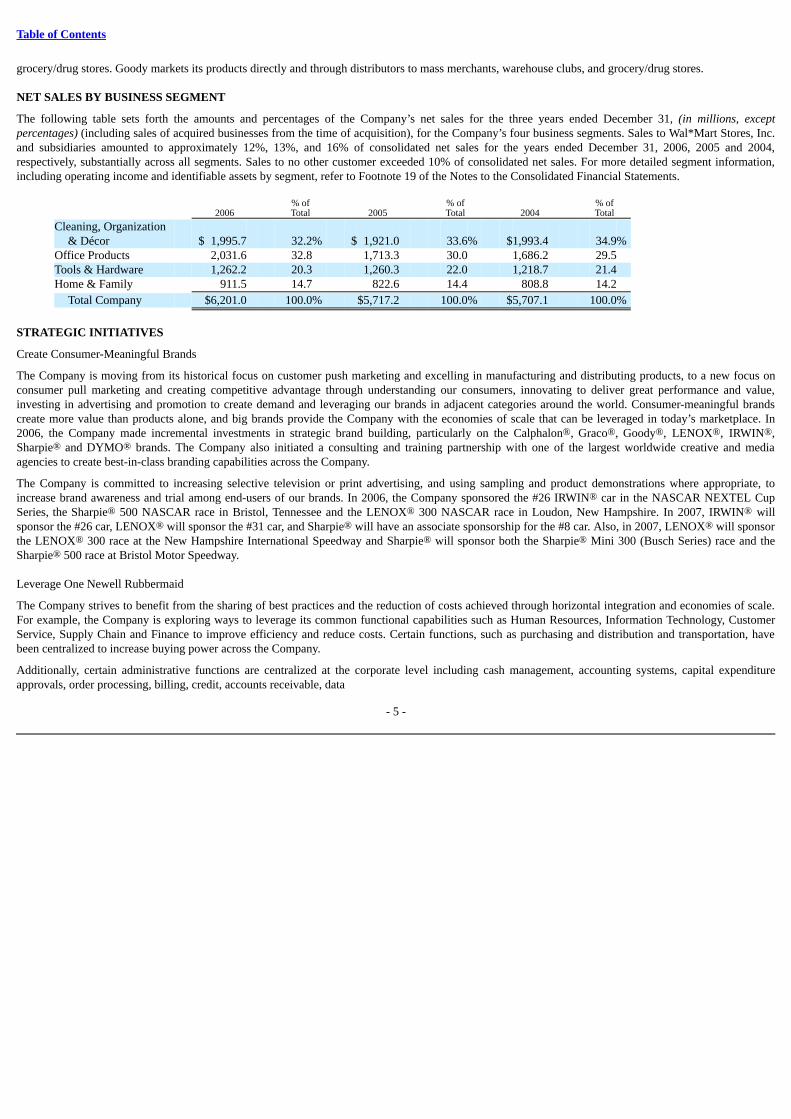
Table of Contents
grocery/drug stores. Goody markets its products directly and through distributors to mass merchants, warehouse clubs, and grocery/drug stores.
NET SALES BY BUSINESS SEGMENT
The following table sets forth the amounts and percentages of the Company’s net sales for the three years ended December 31, (in millions, exceptpercentages) (including sales of acquired businesses from the time of acquisition), for the Company’s four business segments. Sales to Wal*Mart Stores, Inc.and subsidiaries amounted to approximately 12%, 13%, and 16% of consolidated net sales for the years ended December 31, 2006, 2005 and 2004,respectively, substantially across all segments. Sales to no other customer exceeded 10% of consolidated net sales. For more detailed segment information,including operating income and identifiable assets by segment, refer to Footnote 19 of the Notes to the Consolidated Financial Statements.
% of % of % of 2006 Total 2005 Total 2004 Total
Cleaning, Organization& Décor $ 1,995.7 32.2% $ 1,921.0 33.6% $1,993.4 34.9%
Office Products 2,031.6 32.8 1,713.3 30.0 1,686.2 29.5 Tools & Hardware 1,262.2 20.3 1,260.3 22.0 1,218.7 21.4 Home & Family 911.5 14.7 822.6 14.4 808.8 14.2
Total Company $6,201.0 100.0% $5,717.2 100.0% $5,707.1 100.0%
STRATEGIC INITIATIVES
Create Consumer-Meaningful Brands
The Company is moving from its historical focus on customer push marketing and excelling in manufacturing and distributing products, to a new focus onconsumer pull marketing and creating competitive advantage through understanding our consumers, innovating to deliver great performance and value,investing in advertising and promotion to create demand and leveraging our brands in adjacent categories around the world. Consumer-meaningful brandscreate more value than products alone, and big brands provide the Company with the economies of scale that can be leveraged in today’s marketplace. In2006, the Company made incremental investments in strategic brand building, particularly on the Calphalon®, Graco®, Goody®, LENOX®, IRWIN®,Sharpie® and DYMO® brands. The Company also initiated a consulting and training partnership with one of the largest worldwide creative and mediaagencies to create best-in-class branding capabilities across the Company.
The Company is committed to increasing selective television or print advertising, and using sampling and product demonstrations where appropriate, toincrease brand awareness and trial among end-users of our brands. In 2006, the Company sponsored the #26 IRWIN® car in the NASCAR NEXTEL CupSeries, the Sharpie® 500 NASCAR race in Bristol, Tennessee and the LENOX® 300 NASCAR race in Loudon, New Hampshire. In 2007, IRWIN® willsponsor the #26 car, LENOX® will sponsor the #31 car, and Sharpie® will have an associate sponsorship for the #8 car. Also, in 2007, LENOX® will sponsorthe LENOX® 300 race at the New Hampshire International Speedway and Sharpie® will sponsor both the Sharpie® Mini 300 (Busch Series) race and theSharpie® 500 race at Bristol Motor Speedway.
Leverage One Newell Rubbermaid
The Company strives to benefit from the sharing of best practices and the reduction of costs achieved through horizontal integration and economies of scale.For example, the Company is exploring ways to leverage its common functional capabilities such as Human Resources, Information Technology, CustomerService, Supply Chain and Finance to improve efficiency and reduce costs. Certain functions, such as purchasing and distribution and transportation, havebeen centralized to increase buying power across the Company.
Additionally, certain administrative functions are centralized at the corporate level including cash management, accounting systems, capital expenditureapprovals, order processing, billing, credit, accounts receivable, data
- 5 -
Table of Contents
processing operations and legal functions. Centralization concentrates technical expertise in one location, making it easier to observe overall business trendsand manage the Company’s businesses.
The Company accelerated the process of creating shared services for the European businesses in 2006 and is evaluating expanding the scope of sharedservices in the United States. The transition of services to the Shared Service Center in Europe is approximately two-thirds complete. In addition, theCompany has recently created leadership positions — Vice President of Program Management and President of Newell Rubbermaid Europe, Middle East andAfrica — to identify and drive synergies across business units.
Finally, the Company is in the early stages of migrating multiple legacy systems and users to a common SAP global information platform, which we expectwill enable the Company to integrate and manage its worldwide business and reporting process more efficiently. Phase one implementation is currentlyplanned for the North American Office Products business in late 2007. The total company implementation will occur over several years in phases that areprimarily based on geographic region and segment.
Achieve Best Total Cost
The Company’s objective is to reduce the cost of manufacturing, sourcing and supplying product on an ongoing basis, and to leverage the Company’s size andscale, in order to achieve a best total cost position in relevant product categories. Achieving best cost positions in its categories allows the Company toincrease investment in strategic brand building initiatives. To improve productivity, the Company focuses on reducing procurement costs, material handlingcosts, manufacturing inefficiencies and removing excess overhead costs to reduce the overall cost of manufacturing products, as well as reducing the cost ofdistribution and transportation. The Company has also shifted a portion of its research and development focus to designing lower cost into future productinitiatives.
A key component of this strategy is the restructuring of the Company’s manufacturing and sourcing network to increase capacity utilization, increase thepercentage of manufacturing located in low-cost countries, and achieve a balance of company-owned manufacturing and third party sourcing partners. In thethird quarter of 2005, the Company announced a global initiative referred to as Project Acceleration aimed at strengthening and transforming the Company’sportfolio. In connection with Project Acceleration, the Board of Directors of the Company approved a restructuring plan that commenced in the fourth quarterof 2005. Project Acceleration includes the closure of approximately one-third of the Company’s 64 manufacturing facilities (as of December 31, 2005,adjusted for the divestiture of Little Tikes and Home Décor Europe), optimizing the Company’s geographic manufacturing footprint. Since the inception ofProject Acceleration, the Company has announced the closure of 14 manufacturing facilities. Project Acceleration is projected to result in cumulativerestructuring costs of approximately $375 to $400 million ($315 million — $340 million after tax). Approximately 60% of the costs are expected to be cash.Annualized savings are projected to exceed $150 million upon conclusion of the program in 2009.
The deployment of Newell Operational Excellence (Newell OPEX) throughout the Company’s manufacturing network is also aimed at delivering theCompany’s productivity targets. Newell OPEX is a methodical process focused on lean manufacturing that includes installing the right manufacturing anddistribution metrics and driving improvements quarter after quarter. In addition to the cost reductions, other key components of Newell OPEX are improvedquality and service levels and the reduction of inventory lead times.
The Company is also committed to reducing non-strategic SG&A costs throughout the organization. The Company is vigilant in creating a leaner organizationthat is more flexible in its response time, both internally and externally. The Company’s efforts to Leverage One Newell Rubbermaid through horizontalintegration will help the Company to achieve this goal.
Nurture 360º Innovation
The Company has broadened its definition of innovation beyond product invention. The Company now defines innovation as the successfulcommercialization of invention. Innovation must be more than product development. It is a rigorous, consumer centric process that permeates the entiredevelopment cycle. It begins with a deep understanding of how consumers interact with the Company’s brands and categories, and all the factors that drivetheir purchase decisions and in-use experience. That understanding must then be translated into innovative products that deliver unique features and benefits,at a best-cost position, providing the consumer with great value. Lastly, innovating how and where to
- 6 -
Table of Contents
create awareness and trial, and measuring the effectiveness of advertising and promotion spending, completes the process. The Company has pockets ofexcellence using this expanded definition of innovation, and it will continue to build on this competency.
Over the last two years, the Company launched a number of innovative new products, including the Sharpie® MINI permanent marker; Irwin® Speedbor®MAX drill bits; the Irwin® Quick-Grip® XP one handed bar clamp; Lenox® Pro Hose Air Acetylene kits; Rubbermaid® Collapsibles™ food storagecontainers; Rubbermaid® Commercial Microfiber cleaning tools and accessories and Wavebreak™ mop bucket; Calphalon® One™ Infused Anodized,Calphalon®One™ Nonstick and Contemporary Stainless lines of gourmet cookware and Katana Series™ cutlery line; Goody, Stay Put™ elastic bands andOuchless® brush collection and Graco® Mosaic™ stroller and travel system and Safe Seat™ car seats.
GROWTH STRATEGY
The Company’s growth strategy emphasizes internal growth and acquisitions. The Company is also increasingly focused on globalization.
Internal Growth
The Company focuses on internal growth principally by understanding consumers, demand creation through marketing, commercializing innovative newproducts, entering new domestic and international markets, adding new customers, cross-selling existing product lines to current customers and supporting itsUS-based customers’ international expansion. Internal growth is defined by the Company as growth from continuing businesses owned more than one yearand immaterial acquisitions.
Acquisition Strategy
The Company supplements internal growth by selectively acquiring businesses with prominent end-user focused brands and improving the profitability ofsuch businesses through the implementation of the Company’s strategic initiatives. Strategic criteria for an acquisition include: the existence of consumer-meaningful brands that respond to differentiation and innovation, global categories, favorable customer and channel dynamics, strong margin and growthpotential, focus on non-cyclical, semi-durable products, and synergies with our core categories and competencies.
During 2005, the Company acquired DYMO, a global leader in designing, manufacturing and marketing on-demand labeling solutions, from Esselte AB. Thisacquisition strengthens the Company’s global leadership position in the Office Products segment by expanding and enhancing the Company’s product linesand customer base. See Footnote 2 of the Notes to the Consolidated Financial Statements for further information on acquisitions.
Globalization
The Company is expanding from a U.S.-centric business model to one that includes international growth as an increasing focus. The growth of consumergoods economies and retail structures in several regions outside the U.S., particularly Eastern Europe, Asia, Mexico and South America, makes themattractive to the Company by providing selective opportunities to acquire businesses, develop partnerships with new foreign customers and extendrelationships with the Company’s domestic customers whose businesses are growing internationally. As a result, the Company pursues selective internationalopportunities to further its internal growth and acquisition objectives. The Company had sales outside the U.S. of approximately 26%, 24%, and 24% of totalsales in 2006, 2005, and 2004, respectively.
The Company is striving to get the right structure in place for successful globalization. For example, the Office Products businesses have been reorganized tooperate across product lines that can target global consumer acceptance. In 2006, the Company also aligned the Graco business under a global business unitstructure, reporting under the Home & Family segment, rather than by geographic location. This realignment positions the businesses to leverage research anddevelopment, branding, marketing and innovation on a global basis. The Company has also implemented the process of creating shared services for theEuropean businesses, which is approximately two-thirds complete, and has created the leadership position of President – Newell Rubbermaid Europe, MiddleEast and Africa
- 7 -
Table of Contents
to identify and drive synergies across business units in the region. Finally, the Company is in the early stages of migrating multiple legacy systems and usersto a common SAP global information platform, which we expect will enable the Company to integrate and manage its worldwide business and reportingprocess more efficiently.
DIVESTITURE AND PRODUCT LINE RATIONALIZATION
The Company consistently reviews its businesses and product offerings, assesses their strategic fit and seeks opportunities to divest non-strategic businesses.The criteria used by the Company in assessing the strategic fit include: the existence of consumer-meaningful brands that respond to differentiation andinnovation, global categories, favorable customer and channel dynamics, strong margin and growth potential, focus on non-cyclical, semi-durable products,synergies with our core categories and competencies, and the business’s actual and potential impact on the operating performance of the Company. While webelieve that the business units remaining in our portfolio constitute core businesses, the Company will continue to review its businesses and product offeringsand assess their strategic fit to identify any potential divestiture candidates.
During 2006 and early 2007, the Company divested its European Cookware, Little Tikes and Home Décor Europe businesses. During 2005, the Companydivested its Curver business. In 2004, the Company sold its U.S. picture frame business (Burnes), its Anchor Hocking glassware business, its Mirro cookwarebusiness, its Panex Brazilian low-end cookware business, its European picture frames business and its Little Tikes Commercial Play Systems business. SeeFootnote 3 of the Notes to the Consolidated Financial Statements for a description of discontinued operations.
In 2006, 2005 and 2004, the Company rationalized $60 million, $195 million and $165 million, respectively, in low-margin product sales, primarily in theformer Cleaning & Organization segment. The Company’s decision to exit these low margin product lines is consistent with its strategy to focus on highmargin, high potential opportunities that support the Company’s financial objectives.
OTHER INFORMATION
Multi-Product Offering
The Company’s broad product coverage in multiple product lines permits it to more effectively meet the needs of its customers. With families of leadingbrand names and profitable and innovative new products, the Company also can help volume purchasers sell a more profitable product mix. As a potentialsingle source for an entire product line, the Company can use program merchandising to improve product presentation, optimize display space for both salesand income and encourage impulse buying by retail customers.
Customer Marketing and Service
The Company strives to develop long-term, mutually beneficial partnerships with its customers and become their supplier and brand of choice. To achievethis goal, the Company has a value-added marketing program that offers a family of leading brand name staple products, tailored sales programs, innovativemerchandising support, in-store services and responsive top management.
The Company strives to enhance its relationships with customers through exceptional customer service. The Company’s ability to provide superior customerservice is a result of its information technology, marketing and merchandising programs designed to enhance the sales and profitability of its customers andprovide consistent on-time delivery of its products.
A critical element of the Company’s customer service is consistent on-time delivery of products to its customers. Retailers are pursuing a number of strategiesto deliver the highest-quality, best-cost products to their customers. Retailers now frequently purchase on a “just-in-time” basis in order to reduce inventorycarrying costs and increase returns on investment. As retailers shorten their lead times for orders, manufacturers need to more closely anticipate consumer-buying patterns. The Company supports its retail customers’ “just-in-time” inventory strategies through more responsive sourcing, manufacturing anddistribution capabilities and electronic communications.
- 8 -
Table of Contents
Foreign Operations
Information regarding the Company’s 2006, 2005 and 2004 foreign operations and financial information by geographic area is included in Footnote 19 of theNotes to the Consolidated Financial Statements and is incorporated by reference herein. Information regarding risks relating to the Company’s foreignoperations is set forth in Part I, Item 1A of this report and is incorporated by reference herein.
Raw Materials
The Company has multiple foreign and domestic sources of supply for substantially all of its material requirements. The raw materials and various purchasedcomponents required for its products have generally been available in sufficient quantities. The Company’s product offerings require the purchase of resin,glass, corrugate and metals, including steel, stainless steel, zinc, aluminum and gold. The Company has experienced inflation in these raw materials andexpects such inflation pressures to continue in 2007. The Company has reduced the volume of its resin purchases through product line rationalization andstrategic divestitures. See Management’s Discussion and Analysis of Financial Condition and Results of Operations for further discussion.
Backlog
The dollar value of unshipped factory orders is not material.
Seasonal Variations
The Company’s sales and operating income in the first quarter are generally lower than any other quarter during the year, driven principally by reducedvolume and the mix of products sold in the quarter.
Patents and Trademarks
The Company has many patents, trademarks, brand names and trade names that are, in the aggregate, important to its business. The Company’s mostsignificant registered trademarks are “Rubbermaid®,” “Sharpie®,” “Paper Mate®,” “LENOX®,” “IRWIN®,” “Graco®,” “Levolor®” and “DYMO®.”
Customers / Competition
The Company’s principal customers are large mass merchandisers, such as discount stores, home centers, warehouse clubs and office superstores, andcommercial distributors. The rapid growth of these large mass merchandisers, together with changes in consumer shopping patterns, have contributed to asignificant consolidation of the consumer products retail industry and the formation of dominant multi-category retailers that have strong negotiating powerwith suppliers. This environment limits the Company’s ability to recover cost increases through selling prices.
Current trends among retailers include fostering high levels of competition among suppliers, demanding innovative new products and requiring suppliers tomaintain or reduce product prices and deliver products with shorter lead times. Other trends, in the absence of a strong new product development effort orstrong end-user brands, are for the retailer to import generic products directly from foreign sources and to source and sell products, under their own privatelabel brands, that compete with products of the Company. The combination of these market influences has created an intensely competitive environment inwhich the Company’s principal customers continuously evaluate which product suppliers to use, resulting in pricing pressures and the need for strong end-user brands, the ongoing introduction of innovative new products and continuing improvements in category management and customer service. The Companycompetes with numerous manufacturers and distributors of consumer products, many of which are large and well established.
The Company’s principal methods of meeting its competitive challenges are creating and maintaining consumer-meaningful brands, differentiated products,superior customer service (including innovative “good-better-best” marketing and merchandising programs), consistent on-time delivery, outsourcing certainproduction to low cost suppliers and lower cost countries where appropriate and experienced management.
- 9 -
Table of Contents
The Company has also positioned itself to respond to the challenges of this retail environment by developing strong relationships with large, high-volumepurchasers. The Company markets its strong multi-product offering through virtually every category of high-volume retailer, including discount, drug,grocery and variety chains, warehouse clubs, department, hardware and specialty stores, home centers, office superstores, contract stationers and militaryexchanges. The Company’s largest customer, Wal*Mart (which includes Sam’s Club), accounted for approximately 12% of net sales in 2006, acrosssubstantially all business units. The Company’s top ten customers included (in alphabetical order): Ace Hardware, Boise Office, Lowe’s, Office Depot,Staples, Target, The Home Depot, Toys ‘R’ Us, United Stationers and Wal*Mart.
Environmental Matters
Information regarding the Company’s environmental matters is included in Management’s Discussion and Analysis section of this report and in Footnote 20of the Notes to the Consolidated Financial Statements and is incorporated by reference herein.
Research and Development
Information regarding the Company’s research and development costs for each of the past three fiscal years is included in Footnote 1 of the Notes to theConsolidated Financial Statements and is incorporated by reference herein.
Employees
As of December 31, 2006, the Company had approximately 23,500 employees worldwide, of whom approximately 3,500 are covered by collective bargainingagreements or, in certain countries, which have collective arrangements decreed by statute.
ITEM 1A. RISK FACTORS
The factors that are discussed below, as well as the matters that are generally set forth in this report on Form 10-K and the documents incorporated byreference herein, could materially and adversely affect the Company’s business, results of operations and financial condition.
The Company is subject to risks related to its dependence on the strength of retail economies in various parts of the world.
The Company’s business depends on the strength of the retail economies in various parts of the world, primarily in North America and to a lesser extentEurope, Central and South America and Asia. These retail economies are affected primarily by factors such as consumer demand and the condition of theretail industry, which, in turn, are affected by general economic conditions and specific events such as natural disasters and terrorist attacks. In recent years,the retail industry in the U.S. and, increasingly, elsewhere has been characterized by intense competition and consolidation among retailers. Because suchcompetition, particularly in weak retail economies, can cause retailers to struggle or fail, the Company must continuously monitor, and adapt to changes in,the profitability, creditworthiness and pricing policies of its customers.
The Company is subject to intense competition in a marketplace dominated by large retailers.
The Company competes with numerous other manufacturers and distributors of consumer and commercial products, many of which are large and wellestablished. The Company’s principal customers are large mass merchandisers, such as discount stores, home centers, warehouse clubs and office superstores,and commercial distributors. The rapid growth of these large mass merchandisers, together with changes in consumer shopping patterns, have contributed tothe formation of dominant multi-category retailers that have strong negotiating power with suppliers. Current trends among retailers include fostering highlevels of competition among suppliers, demanding innovative new products and requiring suppliers to maintain or reduce product prices and deliver productswith shorter lead times. Other trends are for retailers to import products directly from foreign sources and to source and sell products, under their own privatelabel brands, that compete with products of the Company.
- 10 -
Table of Contents
The combination of these market influences has created an intensely competitive environment in which the Company’s principal customers continuouslyevaluate which product suppliers to use, resulting in downward pricing pressures and the need for big, consumer-meaningful brands, the ongoing introductionand commercialization of innovative new products, continuing improvements in customer service, and the maintenance of strong relationships with large,high-volume purchasers. The Company also faces the risk of changes in the strategy or structure of its major retailer customers, such as overall store andinventory reductions and retailer consolidation. The resulting risks to the Company include possible loss of sales, reduced profitability and limited ability torecover cost increases through price increases.
To compete successfully, the Company must develop and commercialize a continuing stream of innovative new products that create consumerdemand.
The Company’s long-term success in this competitive retail environment depends on its ability to develop and commercialize a continuing stream ofinnovative new products that create consumer demand. The Company also faces the risk that its competitors will introduce innovative new products thatcompete with the Company’s products. The Company’s strategy includes increased investment in new product development and increased focus oninnovation. There are, nevertheless, numerous uncertainties inherent in successfully developing and commercializing innovative new products on acontinuing basis, and new product launches may not deliver expected growth results.
To compete successfully, the Company must develop and maintain big, consumer-meaningful brands.
The Company’s competitive success also depends increasingly on its ability to develop and maintain consumer-meaningful brands so that the Company’sretailer customers will need the Company’s products to meet consumer demand, and big brands to provide the Company with economies of scale. Thedevelopment and maintenance of such brands requires significant investment in brand building and marketing initiatives. While the Company is substantiallyincreasing its expenditures for advertising and other brand building and marketing initiatives, the increased investment may not deliver the anticipated results.
Price increases in raw materials could harm the Company’s financial results.
The Company purchases some raw materials, including resin, glass, corrugate, steel, gold, zinc, brass and aluminum, which are subject to price volatility andinflationary pressure. The Company attempts to reduce its exposure to increases in those costs through a variety of programs, including periodic purchases,future delivery purchases, long-term contracts and sales price adjustments. Where practical, the Company uses derivatives as part of its risk managementprocess. Raw material price increases may offset productivity gains and could materially impact the Company’s financial results.
The Company’s success depends on its ability to continuously improve productivity and streamline operations.
The Company’s success depends on its ability to continuously improve its manufacturing efficiencies, reduce supply chain costs and streamline non-strategicSG&A expenses in order to produce products at a best-cost position and free up money for investment in innovation and brand building. Project Accelerationincludes the closure of approximately one-third of the Company’s 64 manufacturing facilities (adjusted for the divestiture of Little Tikes and Home DécorEurope) between the periods January 1, 2006 and December 31, 2009. In addition, the Company is exploring ways to best leverage its functional capabilitiessuch as Human Resources, Information Technology, Customer Service, Supply Chain and Finance in order to improve efficiency and reduce costs. TheCompany runs the risk that Project Acceleration and other corporate initiatives aimed at streamlining and cost reduction may not be completed substantiallyas planned, may be more costly to implement than expected, or may not have the positive effects anticipated, or that other major productivity and streamliningprograms may be required after such projects are completed. In addition, disruptions in the Company’s ability to supply products on a timely basis, whichmay be incidental to any problems in the execution of Project Acceleration, could adversely affect the Company’s future results.
The Company’s ability to make strategic acquisitions and to integrate its acquired businesses is an important factor in the Company’s future growth.
- 11 -
Table of Contents
Although the Company has in recent years increasingly emphasized internal growth rather than growth by acquisition, the Company’s ability to continue tomake strategic acquisitions and to integrate the acquired businesses successfully, obtaining anticipated cost savings and operating income improvementswithin a reasonable period of time, remain important factors in the Company’s future growth. Furthermore, the cost of any future major acquisitions couldconstrain the Company’s access to capital and increase the Company’s borrowing costs.
The Company is subject to risks related to its international operations.
Foreign operations, especially in Europe, but also in Asia, Central and South America and Canada, are important to the Company’s business. The Company isexpanding from a U.S.-centric business model to one that includes international growth as an increasing focus. In addition, as the Company increasinglysources products in low-cost countries, particularly in the Far East, it is exposed to additional risks and uncertainties. Foreign operations can be affected byfactors such as currency devaluation, other currency fluctuations, tariffs, nationalization, exchange controls, interest rates, limitations on foreign investment inlocal business and other political, economic and regulatory risks and difficulties. The Company also faces risks due to the transportation and logisticalcomplexities inherent in increased reliance on foreign sourcing.
The Company faces challenges and uncertainties as it transforms into a company that grows through consumer-meaningful brands and new productinnovation.
The Company is undergoing a transformation from a portfolio-holding company that grew through acquisitions to a focused group of leadership platformsthat generate internal growth driven by consumer-meaningful brands and new product innovation. Such a transformation will require significant investment inbrand-building, marketing and product development and the development of the right methods for understanding how consumers interact with the Company’sbrands and categories and measuring the effectiveness of advertising and promotion spending. Although the process is well underway, there remainsignificant challenges and uncertainties.
Complications in connection with the Company’s current information system initiative may impact its results of operations, financial condition andcash flows.
The Company is in the early stages of replacing various business information systems worldwide with an enterprise resource planning system from SAP. Thepilot implementation is currently planned for the North American Office Products business in late 2007. The implementation will occur over several years inphases, primarily based on geographic region and segment. This activity involves the migration of multiple legacy systems and users to a common SAPinformation platform. Throughout this process, the Company is changing the way it conducts business and employees’ roles in processing and utilizinginformation. In addition, this conversion will impact certain interfaces with the Company’s customers and suppliers, resulting in changes to the tools we useto take orders, procure material, schedule production, remit billings, make payments and perform other business functions. Based upon the complexity of thisinitiative, there is risk that the Company will be unable to complete the implementation in accordance with its timeline and will incur additional costs, theimplementation could result in operating inefficiencies, and the implementation could impact the Company’s ability to perform necessary businesstransactions. All of these risks could adversely impact the Company’s results of operations, financial condition and cash flows.
Impairment charges could have a material adverse effect on the Company’s financial results.
Future events may occur that would adversely affect the reported value of the Company’s assets and require impairment charges. Such events may include,but are not limited to, strategic decisions made in response to changes in economic and competitive conditions, the impact of the economic environment onthe Company’s customer base, or a material adverse change in its relationship with significant customers.
Product liability claims or regulatory actions could adversely affect the Company’s financial results or harm its reputation or the value of its end-user brands.
Claims for losses or injuries purportedly caused by some of the Company’s products arise in the ordinary course of the Company’s business. In addition to therisk of substantial monetary judgments, product liability claims or regulatory actions could result in negative publicity that could harm the Company’sreputation in the marketplace or
- 12 -
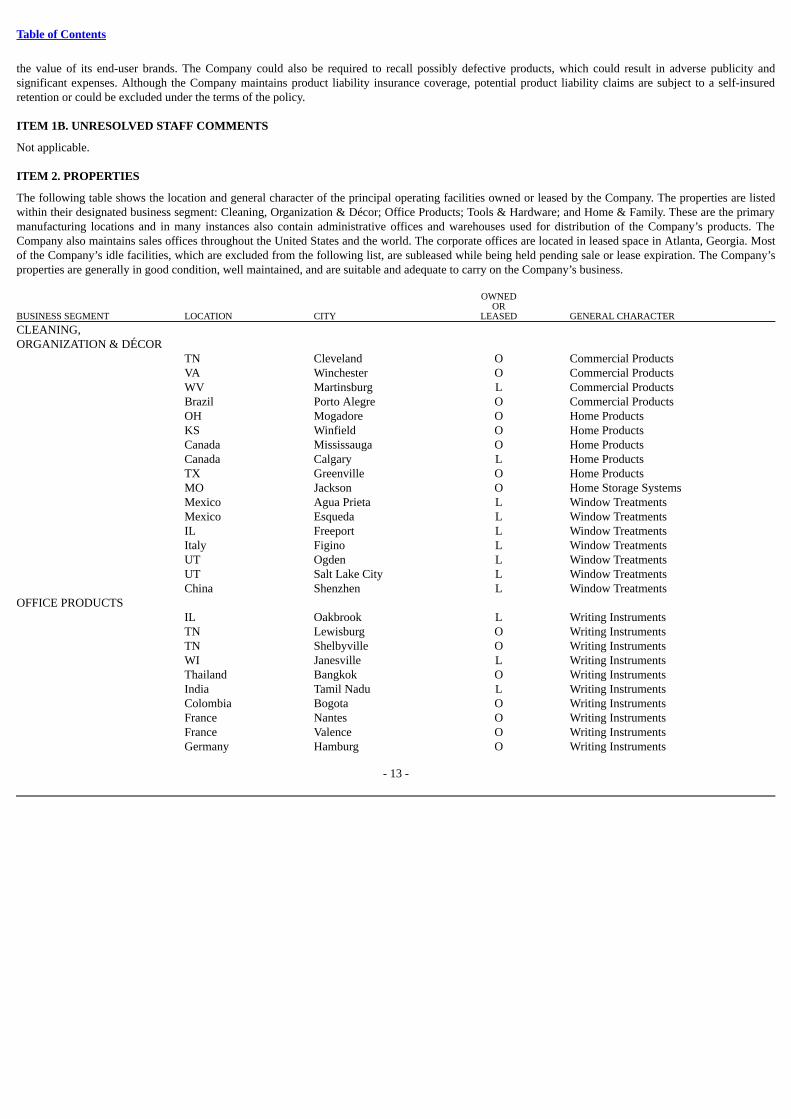
Table of Contents
the value of its end-user brands. The Company could also be required to recall possibly defective products, which could result in adverse publicity andsignificant expenses. Although the Company maintains product liability insurance coverage, potential product liability claims are subject to a self-insuredretention or could be excluded under the terms of the policy.
ITEM 1B. UNRESOLVED STAFF COMMENTS
Not applicable.
ITEM 2. PROPERTIES
The following table shows the location and general character of the principal operating facilities owned or leased by the Company. The properties are listedwithin their designated business segment: Cleaning, Organization & Décor; Office Products; Tools & Hardware; and Home & Family. These are the primarymanufacturing locations and in many instances also contain administrative offices and warehouses used for distribution of the Company’s products. TheCompany also maintains sales offices throughout the United States and the world. The corporate offices are located in leased space in Atlanta, Georgia. Mostof the Company’s idle facilities, which are excluded from the following list, are subleased while being held pending sale or lease expiration. The Company’sproperties are generally in good condition, well maintained, and are suitable and adequate to carry on the Company’s business. OWNED OR BUSINESS SEGMENT LOCATION CITY LEASED GENERAL CHARACTER
CLEANING, ORGANIZATION & DÉCOR
TNVAWVBrazilOHKSCanadaCanadaTXMOMexicoMexicoILItalyUTUTChina
ClevelandWinchesterMartinsburgPorto AlegreMogadoreWinfieldMississaugaCalgaryGreenvilleJacksonAgua PrietaEsquedaFreeportFiginoOgdenSalt Lake CityShenzhen
OOLOOOOLOOLLLLLLL
Commercial ProductsCommercial ProductsCommercial ProductsCommercial ProductsHome ProductsHome ProductsHome ProductsHome ProductsHome ProductsHome Storage SystemsWindow TreatmentsWindow TreatmentsWindow TreatmentsWindow TreatmentsWindow TreatmentsWindow TreatmentsWindow Treatments
OFFICE PRODUCTS
ILTNTNWIThailandIndiaColombiaFranceFranceGermany
OakbrookLewisburgShelbyvilleJanesvilleBangkokTamil NaduBogotaNantesValenceHamburg
LOOLOLOOOO
Writing InstrumentsWriting InstrumentsWriting InstrumentsWriting InstrumentsWriting InstrumentsWriting InstrumentsWriting InstrumentsWriting InstrumentsWriting InstrumentsWriting Instruments
- 13 -
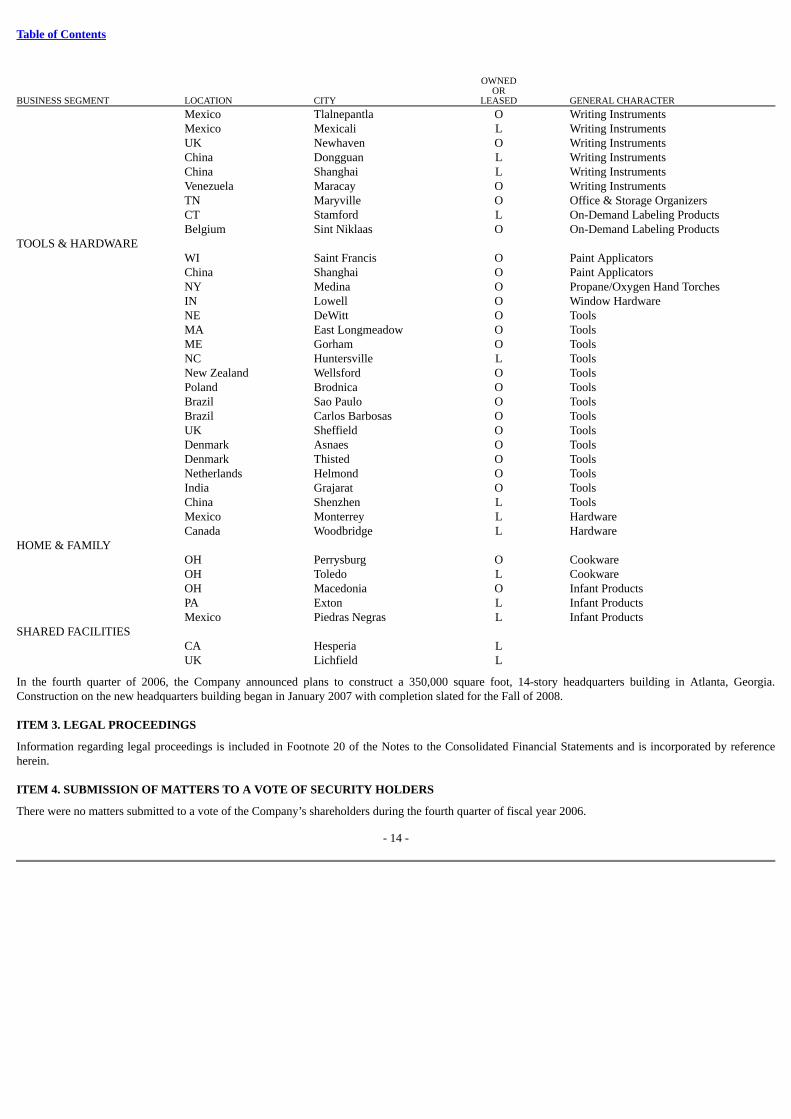
Table of Contents
OWNED OR BUSINESS SEGMENT LOCATION CITY LEASED GENERAL CHARACTER
MexicoMexicoUKChinaChinaVenezuelaTNCTBelgium
TlalnepantlaMexicaliNewhavenDongguanShanghaiMaracayMaryvilleStamfordSint Niklaas
OLOLLOOLO
Writing InstrumentsWriting InstrumentsWriting InstrumentsWriting InstrumentsWriting InstrumentsWriting InstrumentsOffice & Storage OrganizersOn-Demand Labeling ProductsOn-Demand Labeling Products
TOOLS & HARDWARE
WIChinaNYINNEMAMENCNew ZealandPolandBrazilBrazilUKDenmarkDenmarkNetherlandsIndiaChinaMexicoCanada
Saint FrancisShanghaiMedinaLowellDeWittEast LongmeadowGorhamHuntersvilleWellsfordBrodnicaSao PauloCarlos BarbosasSheffieldAsnaesThistedHelmondGrajaratShenzhenMonterreyWoodbridge
OOOOOOOLOOOOOOOOOLLL
Paint ApplicatorsPaint ApplicatorsPropane/Oxygen Hand TorchesWindow HardwareToolsToolsToolsToolsToolsToolsToolsToolsToolsToolsToolsToolsToolsToolsHardwareHardware
HOME & FAMILY
OHOHOHPAMexico
PerrysburgToledoMacedoniaExtonPiedras Negras
OLOLL
CookwareCookwareInfant ProductsInfant ProductsInfant Products
SHARED FACILITIES
CAUK
HesperiaLichfield
LL
In the fourth quarter of 2006, the Company announced plans to construct a 350,000 square foot, 14-story headquarters building in Atlanta, Georgia.Construction on the new headquarters building began in January 2007 with completion slated for the Fall of 2008.
ITEM 3. LEGAL PROCEEDINGS
Information regarding legal proceedings is included in Footnote 20 of the Notes to the Consolidated Financial Statements and is incorporated by referenceherein.
ITEM 4. SUBMISSION OF MATTERS TO A VOTE OF SECURITY HOLDERS
There were no matters submitted to a vote of the Company’s shareholders during the fourth quarter of fiscal year 2006.
- 14 -
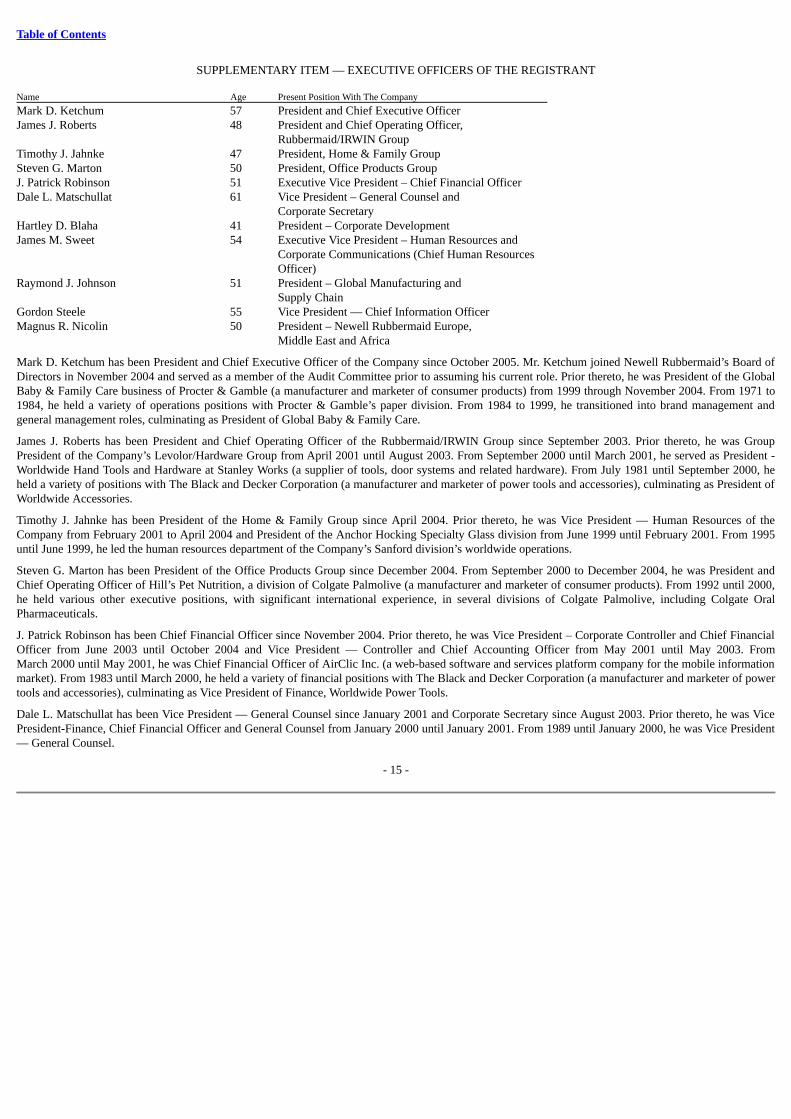
Table of Contents
SUPPLEMENTARY ITEM — EXECUTIVE OFFICERS OF THE REGISTRANT Name Age Present Position With The Company
Mark D. Ketchum 57 President and Chief Executive OfficerJames J. Roberts 48 President and Chief Operating Officer, Rubbermaid/IRWIN GroupTimothy J. Jahnke 47 President, Home & Family GroupSteven G. Marton 50 President, Office Products GroupJ. Patrick Robinson 51 Executive Vice President – Chief Financial OfficerDale L. Matschullat 61 Vice President – General Counsel and Corporate SecretaryHartley D. Blaha 41 President – Corporate DevelopmentJames M. Sweet
54
Executive Vice President – Human Resources andCorporate Communications (Chief Human ResourcesOfficer)
Raymond J. Johnson 51 President – Global Manufacturing and Supply ChainGordon Steele 55 Vice President — Chief Information OfficerMagnus R. Nicolin 50 President – Newell Rubbermaid Europe, Middle East and Africa
Mark D. Ketchum has been President and Chief Executive Officer of the Company since October 2005. Mr. Ketchum joined Newell Rubbermaid’s Board ofDirectors in November 2004 and served as a member of the Audit Committee prior to assuming his current role. Prior thereto, he was President of the GlobalBaby & Family Care business of Procter & Gamble (a manufacturer and marketer of consumer products) from 1999 through November 2004. From 1971 to1984, he held a variety of operations positions with Procter & Gamble’s paper division. From 1984 to 1999, he transitioned into brand management andgeneral management roles, culminating as President of Global Baby & Family Care.
James J. Roberts has been President and Chief Operating Officer of the Rubbermaid/IRWIN Group since September 2003. Prior thereto, he was GroupPresident of the Company’s Levolor/Hardware Group from April 2001 until August 2003. From September 2000 until March 2001, he served as President -Worldwide Hand Tools and Hardware at Stanley Works (a supplier of tools, door systems and related hardware). From July 1981 until September 2000, heheld a variety of positions with The Black and Decker Corporation (a manufacturer and marketer of power tools and accessories), culminating as President ofWorldwide Accessories.
Timothy J. Jahnke has been President of the Home & Family Group since April 2004. Prior thereto, he was Vice President — Human Resources of theCompany from February 2001 to April 2004 and President of the Anchor Hocking Specialty Glass division from June 1999 until February 2001. From 1995until June 1999, he led the human resources department of the Company’s Sanford division’s worldwide operations.
Steven G. Marton has been President of the Office Products Group since December 2004. From September 2000 to December 2004, he was President andChief Operating Officer of Hill’s Pet Nutrition, a division of Colgate Palmolive (a manufacturer and marketer of consumer products). From 1992 until 2000,he held various other executive positions, with significant international experience, in several divisions of Colgate Palmolive, including Colgate OralPharmaceuticals.
J. Patrick Robinson has been Chief Financial Officer since November 2004. Prior thereto, he was Vice President – Corporate Controller and Chief FinancialOfficer from June 2003 until October 2004 and Vice President — Controller and Chief Accounting Officer from May 2001 until May 2003. FromMarch 2000 until May 2001, he was Chief Financial Officer of AirClic Inc. (a web-based software and services platform company for the mobile informationmarket). From 1983 until March 2000, he held a variety of financial positions with The Black and Decker Corporation (a manufacturer and marketer of powertools and accessories), culminating as Vice President of Finance, Worldwide Power Tools.
Dale L. Matschullat has been Vice President — General Counsel since January 2001 and Corporate Secretary since August 2003. Prior thereto, he was VicePresident-Finance, Chief Financial Officer and General Counsel from January 2000 until January 2001. From 1989 until January 2000, he was Vice President— General Counsel.
- 15 -
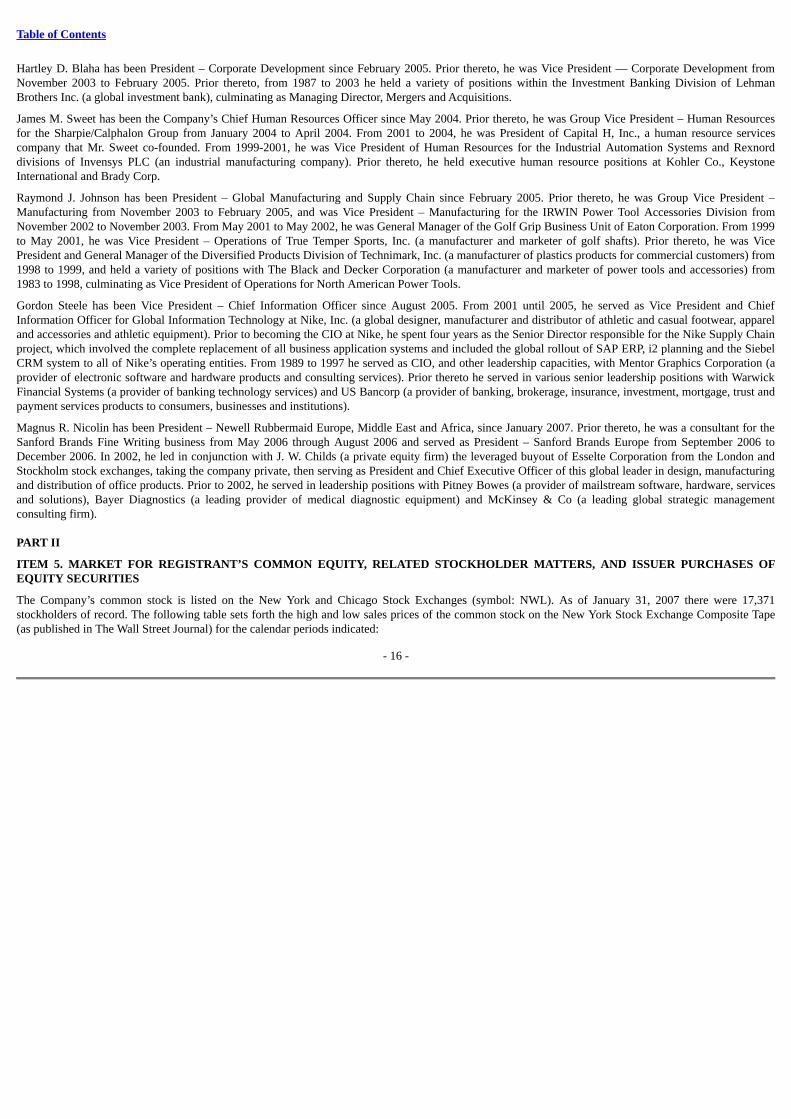
Table of Contents
Hartley D. Blaha has been President – Corporate Development since February 2005. Prior thereto, he was Vice President — Corporate Development fromNovember 2003 to February 2005. Prior thereto, from 1987 to 2003 he held a variety of positions within the Investment Banking Division of LehmanBrothers Inc. (a global investment bank), culminating as Managing Director, Mergers and Acquisitions.
James M. Sweet has been the Company’s Chief Human Resources Officer since May 2004. Prior thereto, he was Group Vice President – Human Resourcesfor the Sharpie/Calphalon Group from January 2004 to April 2004. From 2001 to 2004, he was President of Capital H, Inc., a human resource servicescompany that Mr. Sweet co-founded. From 1999-2001, he was Vice President of Human Resources for the Industrial Automation Systems and Rexnorddivisions of Invensys PLC (an industrial manufacturing company). Prior thereto, he held executive human resource positions at Kohler Co., KeystoneInternational and Brady Corp.
Raymond J. Johnson has been President – Global Manufacturing and Supply Chain since February 2005. Prior thereto, he was Group Vice President –Manufacturing from November 2003 to February 2005, and was Vice President – Manufacturing for the IRWIN Power Tool Accessories Division fromNovember 2002 to November 2003. From May 2001 to May 2002, he was General Manager of the Golf Grip Business Unit of Eaton Corporation. From 1999to May 2001, he was Vice President – Operations of True Temper Sports, Inc. (a manufacturer and marketer of golf shafts). Prior thereto, he was VicePresident and General Manager of the Diversified Products Division of Technimark, Inc. (a manufacturer of plastics products for commercial customers) from1998 to 1999, and held a variety of positions with The Black and Decker Corporation (a manufacturer and marketer of power tools and accessories) from1983 to 1998, culminating as Vice President of Operations for North American Power Tools.
Gordon Steele has been Vice President – Chief Information Officer since August 2005. From 2001 until 2005, he served as Vice President and ChiefInformation Officer for Global Information Technology at Nike, Inc. (a global designer, manufacturer and distributor of athletic and casual footwear, appareland accessories and athletic equipment). Prior to becoming the CIO at Nike, he spent four years as the Senior Director responsible for the Nike Supply Chainproject, which involved the complete replacement of all business application systems and included the global rollout of SAP ERP, i2 planning and the SiebelCRM system to all of Nike’s operating entities. From 1989 to 1997 he served as CIO, and other leadership capacities, with Mentor Graphics Corporation (aprovider of electronic software and hardware products and consulting services). Prior thereto he served in various senior leadership positions with WarwickFinancial Systems (a provider of banking technology services) and US Bancorp (a provider of banking, brokerage, insurance, investment, mortgage, trust andpayment services products to consumers, businesses and institutions).
Magnus R. Nicolin has been President – Newell Rubbermaid Europe, Middle East and Africa, since January 2007. Prior thereto, he was a consultant for theSanford Brands Fine Writing business from May 2006 through August 2006 and served as President – Sanford Brands Europe from September 2006 toDecember 2006. In 2002, he led in conjunction with J. W. Childs (a private equity firm) the leveraged buyout of Esselte Corporation from the London andStockholm stock exchanges, taking the company private, then serving as President and Chief Executive Officer of this global leader in design, manufacturingand distribution of office products. Prior to 2002, he served in leadership positions with Pitney Bowes (a provider of mailstream software, hardware, servicesand solutions), Bayer Diagnostics (a leading provider of medical diagnostic equipment) and McKinsey & Co (a leading global strategic managementconsulting firm).
PART II
ITEM 5. MARKET FOR REGISTRANT’S COMMON EQUITY, RELATED STOCKHOLDER MATTERS, AND ISSUER PURCHASES OFEQUITY SECURITIES
The Company’s common stock is listed on the New York and Chicago Stock Exchanges (symbol: NWL). As of January 31, 2007 there were 17,371stockholders of record. The following table sets forth the high and low sales prices of the common stock on the New York Stock Exchange Composite Tape(as published in The Wall Street Journal) for the calendar periods indicated:
- 16 -
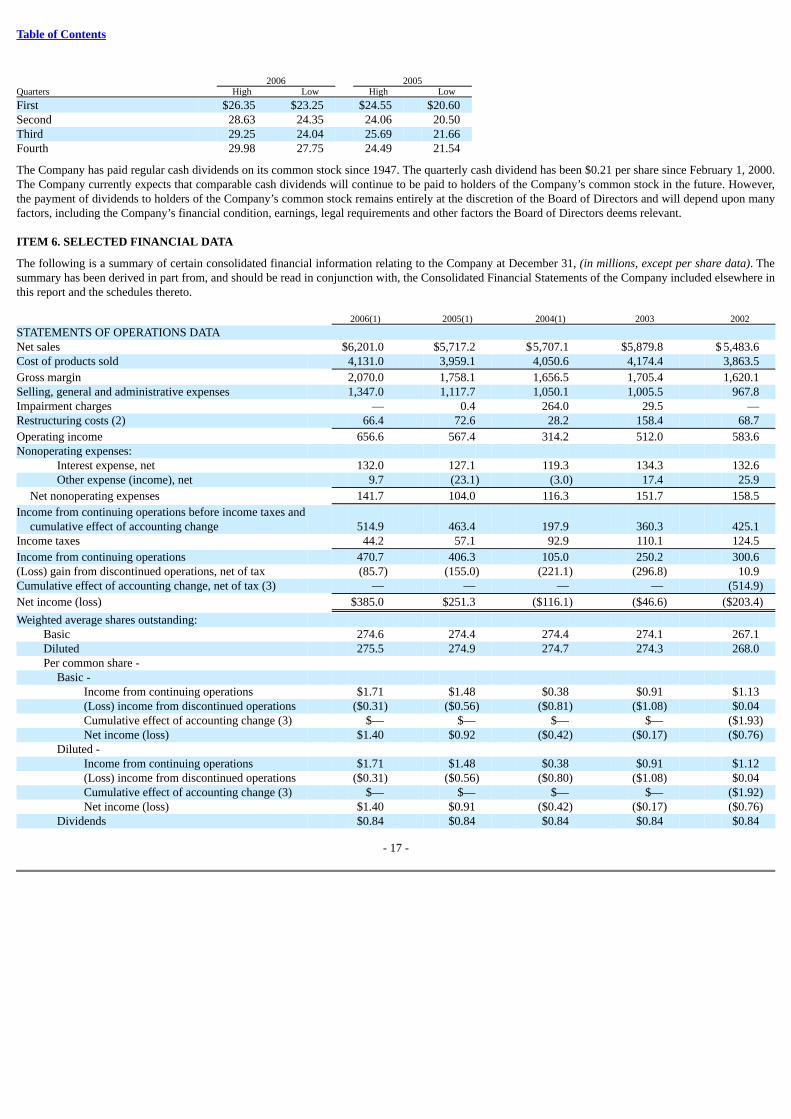
Table of Contents
2006 2005Quarters High Low High Low
First $26.35 $23.25 $24.55 $20.60 Second 28.63 24.35 24.06 20.50 Third 29.25 24.04 25.69 21.66 Fourth 29.98 27.75 24.49 21.54
The Company has paid regular cash dividends on its common stock since 1947. The quarterly cash dividend has been $0.21 per share since February 1, 2000.The Company currently expects that comparable cash dividends will continue to be paid to holders of the Company’s common stock in the future. However,the payment of dividends to holders of the Company’s common stock remains entirely at the discretion of the Board of Directors and will depend upon manyfactors, including the Company’s financial condition, earnings, legal requirements and other factors the Board of Directors deems relevant.
ITEM 6. SELECTED FINANCIAL DATA
The following is a summary of certain consolidated financial information relating to the Company at December 31, (in millions, except per share data). Thesummary has been derived in part from, and should be read in conjunction with, the Consolidated Financial Statements of the Company included elsewhere inthis report and the schedules thereto. 2006(1) 2005(1) 2004(1) 2003 2002
STATEMENTS OF OPERATIONS DATANet sales $6,201.0 $5,717.2 $5,707.1 $5,879.8 $ 5,483.6 Cost of products sold 4,131.0 3,959.1 4,050.6 4,174.4 3,863.5
Gross margin 2,070.0 1,758.1 1,656.5 1,705.4 1,620.1 Selling, general and administrative expenses 1,347.0 1,117.7 1,050.1 1,005.5 967.8 Impairment charges — 0.4 264.0 29.5 — Restructuring costs (2) 66.4 72.6 28.2 158.4 68.7
Operating income 656.6 567.4 314.2 512.0 583.6 Nonoperating expenses:
Interest expense, net 132.0 127.1 119.3 134.3 132.6 Other expense (income), net 9.7 (23.1) (3.0) 17.4 25.9
Net nonoperating expenses 141.7 104.0 116.3 151.7 158.5
Income from continuing operations before income taxes andcumulative effect of accounting change 514.9 463.4 197.9 360.3 425.1
Income taxes 44.2 57.1 92.9 110.1 124.5
Income from continuing operations 470.7 406.3 105.0 250.2 300.6 (Loss) gain from discontinued operations, net of tax (85.7) (155.0) (221.1) (296.8) 10.9 Cumulative effect of accounting change, net of tax (3) — — — — (514.9)
Net income (loss) $385.0 $251.3 ($116.1) ($46.6) ($203.4)
Weighted average shares outstanding: Basic 274.6 274.4 274.4 274.1 267.1 Diluted 275.5 274.9 274.7 274.3 268.0 Per common share -
Basic - Income from continuing operations $1.71 $1.48 $0.38 $0.91 $1.13 (Loss) income from discontinued operations ($0.31) ($0.56) ($0.81) ($1.08) $0.04 Cumulative effect of accounting change (3) $— $— $— $— ($1.93)Net income (loss) $1.40 $0.92 ($0.42) ($0.17) ($0.76)
Diluted - Income from continuing operations $1.71 $1.48 $0.38 $0.91 $1.12 (Loss) income from discontinued operations ($0.31) ($0.56) ($0.80) ($1.08) $0.04 Cumulative effect of accounting change (3) $— $— $— $— ($1.92)Net income (loss) $1.40 $0.91 ($0.42) ($0.17) ($0.76)
Dividends $0.84 $0.84 $0.84 $0.84 $0.84
- 17 -
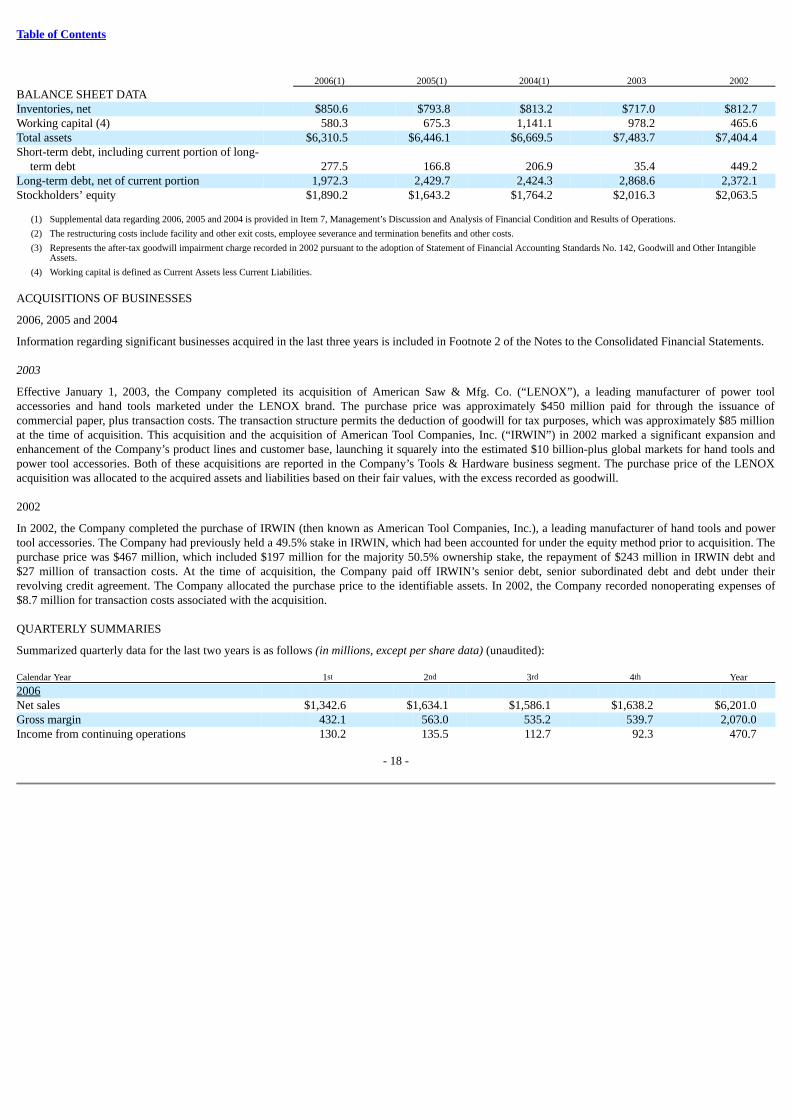
Table of Contents
2006(1) 2005(1) 2004(1) 2003 2002
BALANCE SHEET DATA Inventories, net $850.6 $793.8 $813.2 $717.0 $812.7 Working capital (4) 580.3 675.3 1,141.1 978.2 465.6 Total assets $6,310.5 $6,446.1 $6,669.5 $7,483.7 $7,404.4 Short-term debt, including current portion of long-
term debt 277.5 166.8 206.9 35.4 449.2 Long-term debt, net of current portion 1,972.3 2,429.7 2,424.3 2,868.6 2,372.1 Stockholders’ equity $1,890.2 $1,643.2 $1,764.2 $2,016.3 $2,063.5
(1) Supplemental data regarding 2006, 2005 and 2004 is provided in Item 7, Management’s Discussion and Analysis of Financial Condition and Results of Operations.
(2) The restructuring costs include facility and other exit costs, employee severance and termination benefits and other costs.
(3) Represents the after-tax goodwill impairment charge recorded in 2002 pursuant to the adoption of Statement of Financial Accounting Standards No. 142, Goodwill and Other IntangibleAssets.
(4) Working capital is defined as Current Assets less Current Liabilities.
ACQUISITIONS OF BUSINESSES
2006, 2005 and 2004
Information regarding significant businesses acquired in the last three years is included in Footnote 2 of the Notes to the Consolidated Financial Statements.
2003
Effective January 1, 2003, the Company completed its acquisition of American Saw & Mfg. Co. (“LENOX”), a leading manufacturer of power toolaccessories and hand tools marketed under the LENOX brand. The purchase price was approximately $450 million paid for through the issuance ofcommercial paper, plus transaction costs. The transaction structure permits the deduction of goodwill for tax purposes, which was approximately $85 millionat the time of acquisition. This acquisition and the acquisition of American Tool Companies, Inc. (“IRWIN”) in 2002 marked a significant expansion andenhancement of the Company’s product lines and customer base, launching it squarely into the estimated $10 billion-plus global markets for hand tools andpower tool accessories. Both of these acquisitions are reported in the Company’s Tools & Hardware business segment. The purchase price of the LENOXacquisition was allocated to the acquired assets and liabilities based on their fair values, with the excess recorded as goodwill.
2002
In 2002, the Company completed the purchase of IRWIN (then known as American Tool Companies, Inc.), a leading manufacturer of hand tools and powertool accessories. The Company had previously held a 49.5% stake in IRWIN, which had been accounted for under the equity method prior to acquisition. Thepurchase price was $467 million, which included $197 million for the majority 50.5% ownership stake, the repayment of $243 million in IRWIN debt and$27 million of transaction costs. At the time of acquisition, the Company paid off IRWIN’s senior debt, senior subordinated debt and debt under theirrevolving credit agreement. The Company allocated the purchase price to the identifiable assets. In 2002, the Company recorded nonoperating expenses of$8.7 million for transaction costs associated with the acquisition.
QUARTERLY SUMMARIES
Summarized quarterly data for the last two years is as follows (in millions, except per share data) (unaudited): Calendar Year 1st 2nd 3rd 4th Year
2006 Net sales $1,342.6 $1,634.1 $1,586.1 $1,638.2 $6,201.0 Gross margin 432.1 563.0 535.2 539.7 2,070.0 Income from continuing operations 130.2 135.5 112.7 92.3 470.7
- 18 -
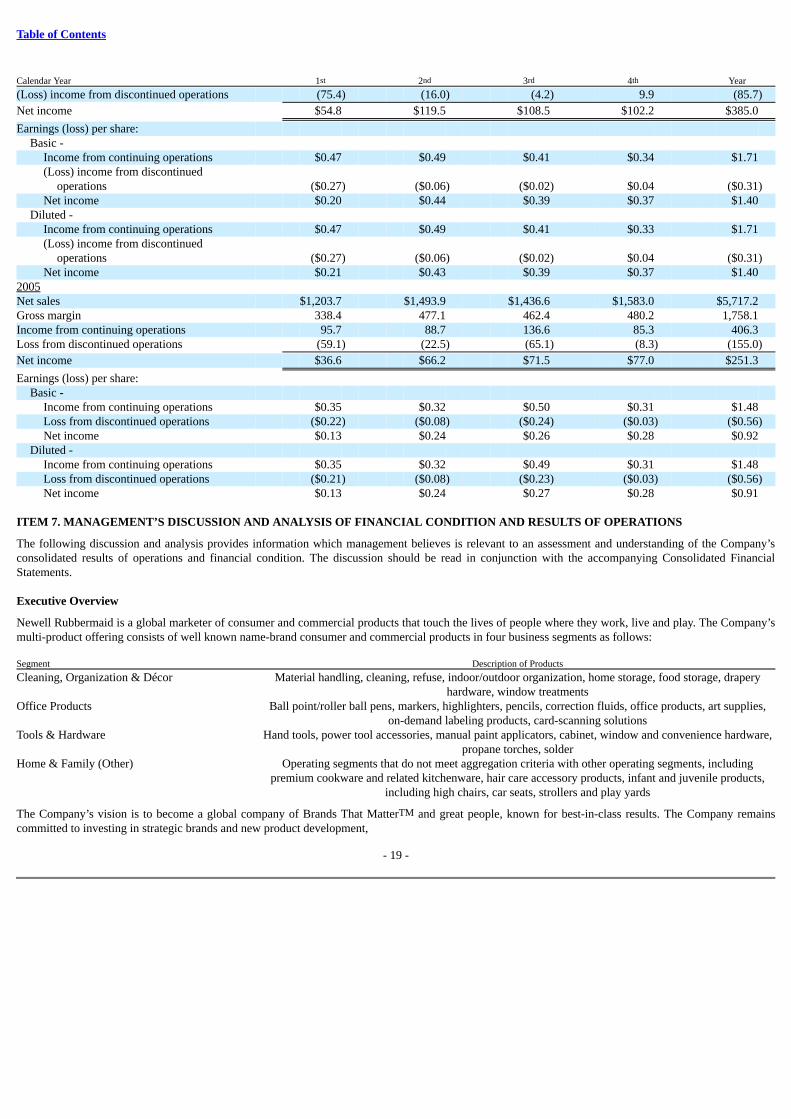
Table of Contents
Calendar Year 1st 2nd 3rd 4th Year
(Loss) income from discontinued operations (75.4) (16.0) (4.2) 9.9 (85.7)
Net income $54.8 $119.5 $108.5 $102.2 $385.0
Earnings (loss) per share: Basic -
Income from continuing operations $0.47 $0.49 $0.41 $0.34 $1.71 (Loss) income from discontinued
operations ($0.27) ($0.06) ($0.02) $0.04 ($0.31)Net income $0.20 $0.44 $0.39 $0.37 $1.40
Diluted - Income from continuing operations $0.47 $0.49 $0.41 $0.33 $1.71 (Loss) income from discontinued
operations ($0.27) ($0.06) ($0.02) $0.04 ($0.31)Net income $0.21 $0.43 $0.39 $0.37 $1.40
2005 Net sales $1,203.7 $1,493.9 $1,436.6 $1,583.0 $5,717.2 Gross margin 338.4 477.1 462.4 480.2 1,758.1 Income from continuing operations 95.7 88.7 136.6 85.3 406.3 Loss from discontinued operations (59.1) (22.5) (65.1) (8.3) (155.0)
Net income $36.6 $66.2 $71.5 $77.0 $251.3
Earnings (loss) per share: Basic -
Income from continuing operations $0.35 $0.32 $0.50 $0.31 $1.48 Loss from discontinued operations ($0.22) ($0.08) ($0.24) ($0.03) ($0.56)Net income $0.13 $0.24 $0.26 $0.28 $0.92
Diluted - Income from continuing operations $0.35 $0.32 $0.49 $0.31 $1.48 Loss from discontinued operations ($0.21) ($0.08) ($0.23) ($0.03) ($0.56)Net income $0.13 $0.24 $0.27 $0.28 $0.91
ITEM 7. MANAGEMENT’S DISCUSSION AND ANALYSIS OF FINANCIAL CONDITION AND RESULTS OF OPERATIONS
The following discussion and analysis provides information which management believes is relevant to an assessment and understanding of the Company’sconsolidated results of operations and financial condition. The discussion should be read in conjunction with the accompanying Consolidated FinancialStatements.
Executive Overview
Newell Rubbermaid is a global marketer of consumer and commercial products that touch the lives of people where they work, live and play. The Company’smulti-product offering consists of well known name-brand consumer and commercial products in four business segments as follows: Segment Description of Products
Cleaning, Organization & Décor
Material handling, cleaning, refuse, indoor/outdoor organization, home storage, food storage, draperyhardware, window treatments
Office Products
Ball point/roller ball pens, markers, highlighters, pencils, correction fluids, office products, art supplies,on-demand labeling products, card-scanning solutions
Tools & Hardware
Hand tools, power tool accessories, manual paint applicators, cabinet, window and convenience hardware,propane torches, solder
Home & Family (Other)
Operating segments that do not meet aggregation criteria with other operating segments, includingpremium cookware and related kitchenware, hair care accessory products, infant and juvenile products,
including high chairs, car seats, strollers and play yards
The Company’s vision is to become a global company of Brands That MatterTM and great people, known for best-in-class results. The Company remainscommitted to investing in strategic brands and new product development,
- 19 -
Table of Contents
strengthening its portfolio of businesses, reducing its supply chain costs and streamlining non-strategic selling, general and administrative expenses (SG&A).
In 2006, the Company began transforming into a consumer driven branding company embracing consumer pull marketing, with meaningful new productinnovation fueled by consumer insight, concept development and validation. The Company assessed its top 16 brands using a uniform methodology, andfielded incremental consumer and brand research to fill in knowledge gaps and verify our hypotheses regarding segmentation, consumer targeting and brandequity. In 2007, we expect to continue this transformation; developing formalized training and development programs to help foster the skills and talentsnecessary to achieve best-in-class consumer branding capability and building the increasing consumer understanding into our innovation and businessplanning processes. In 2006, we increased our investment in consumer understanding, innovation and demand creation (“Strategic Brand Building”) to 5.5%of sales, a 40% increase from 2005. The Company plans to continue making investments in these strategic brand building activities.
During 2006, the Company continued to make progress on strengthening its portfolio. The Company completed the integration of its acquisition of DYMOand substantially completed the sales of its European Cookware, Little Tikes and Home Décor Europe businesses.
Another key initiative of the Company is to restructure its manufacturing and sourcing network to increase capacity utilization, increase the percentage ofmanufacturing located in low-cost countries, and achieve the desired balance of company-owned manufacturing and third party sourcing partners. ProjectAcceleration remains on schedule. To date, the Company has announced approximately two-thirds of the anticipated closings or consolidations, and projectsannualized savings exceeding $150 million upon the completion of the program in 2009.
The key tenets of the Company’s strategy include building large, consumer-meaningful brands (“Brands That MatterTM”), leveraging one NewellRubbermaid, achieving a best total cost position and commercializing innovation across the enterprise. The Company’s results depend on the ability of itsindividual business units to succeed in their respective categories, each of which has some unique consumers, customers and competitors. The Company’sstrategic initiatives are designed to help enable these business units to generate differentiated products, operate within a best-in-class cost structure andemploy superior branding in order to yield premium margins on their products. Premium margins fund incremental demand creation by the business units,driving incremental sales and profits for the Company.
The Company’s emphasis in 2007 will be to deliver sales growth and gross margin expansion through increased investments in consumer understanding,innovation and demand creation activities. The Company will focus on developing best-in-class practices for these activities. The Company’s objective is tobuild brands that really matter to its consumers. The Company will put in the systems to understand its consumers in detail — how they use its products, whatthey value, and how to delight them and/or excite them. The Company will invest in more innovation that differentiates its products. The Company will investmore in advertising and other consumer marketing to increase awareness as well as trial and repeat purchases to enhance the brands. Further, the Companywill measure the effectiveness of those increased strategic brand building investments.
The Company is making the necessary investments now for the long-term success of its business. In 2007, the Company expects SG&A to increase due tocontinued investment in strategic brand building initiatives and other long-term initiatives including the SAP implementation, co-location strategies,expanded shared services in Europe and the U.S., and building organizational capability through training and development.
The following section details the Company’s performance in each of its transformational initiatives:
Create Consumer-Meaningful Brands
The Company is moving from its historical focus on push marketing and excellence in manufacturing and distributing products, to a new focus on consumerpull marketing, creating competitive advantage through better understanding our consumers, innovating to deliver great performance, investing in advertisingand promotion to create demand and leveraging our brands in adjacent categories around the world. Consumer meaningful brands create more value thanproducts alone, and big brands provide the Company with the economies of scale that can be leveraged in today’s marketplace. In 2006, the Company madeincremental investments in strategic brand building, particularly on Calphalon®, Graco®, Goody®, LENOX ®, IRWIN®, Sharpie® and DYMO®, increasingthe
- 20 -
Table of Contents
investment in strategic SG&A from approximately 4.0% of sales in 2005 to 5.5% of sales in 2006. The Company also initiated a consulting and trainingpartnership with one of the largest worldwide creative and media agencies. The objective is to create best-in-class branding capabilities across the Company.The first step was to understand the brand vitality of the Company’s 16 largest brands using a common set of metrics. The Company will then integrate thisunderstanding into its ongoing processes for product innovation, competitive analysis, strategic planning and brand marketing.
Leverage One Newell Rubbermaid
The Company is committed to leveraging the common business activities and best practices of our business units, and to build one common culture of sharedvalues, with a focus on collaboration and teamwork. The Company is exploring ways to leverage common functional capabilities such as Human Resources,Information Technology, Customer Service, Supply Chain and Finance to improve efficiency and reduce costs. This broad reaching initiative already includesprojects such as the corporate consolidation of the distribution and transportation function, and aggregating Company-wide purchasing efforts including bothdirect and indirect materials and services. During the past year, the Company also streamlined the structure of its Tools & Hardware segment to create a moreeffective organization and leverage scale efficiencies. The Company also accelerated the process of creating shared services for the European businesses andis evaluating expanding the scope of shared services in the United States. The transition of services to the Shared Service Center in Europe is approximatelytwo-thirds complete. In addition, the Company has recently created leadership positions — Vice President of Program Management and President of NewellRubbermaid Europe, Middle East and Africa — to identify and drive synergies across business units. Finally, the Company is in the early stages of migratingmultiple legacy systems and users to a common SAP global information platform, which we expect will enable the Company to integrate and manage itsworldwide business and reporting process more efficiently. Phase one implementation is currently planned for the North American Office Products businessin late 2007. The total company implementation will occur over several years in phases that are primarily based on geographic region and segment.
Achieve Best Total Cost
The Company’s objective is to reduce the cost of manufacturing, sourcing and supplying product on an ongoing basis, and to leverage the Company’s size andscale, in order to achieve a best total cost position. Achieving best cost positions in its categories allows the Company to increase investment in strategicbrand building initiatives.
Through Newell Operational Excellence and previous restructuring, the Company has made significant progress in reducing its supply chain costs anddelivering productivity savings. Project Acceleration includes the closure of approximately one-third of the Company’s 64 manufacturing facilities (as ofDecember 31, 2005, adjusted for the divestiture of Little Tikes and Home Décor Europe), optimizing the Company’s geographic manufacturing footprint.Since the inception of Project Acceleration, the Company has announced the closure of 14 manufacturing facilities. Project Acceleration is projected to resultin cumulative restructuring costs of approximately $375 to $400 million ($315 million — $340 million after tax). Approximately 60% of the costs areexpected to be cash. Annualized savings are now projected to exceed $150 million upon conclusion of the program in 2009. In 2006, the Company alsobroadened its supply chain efforts to include the realization of efficiencies in purchasing and distribution & transportation. Finally, the Company has shifted aportion of its research and development focus to designing lower cost into future product initiatives.
Nurture 360º Innovation
The Company has broadened its definition of innovation beyond product invention. The Company will define innovation as the successful commercializationof invention. Innovation must be more than product development. It is a rigorous, consumer centric process that permeates the entire development cycle. Itbegins with a deep understanding of how consumers interact with the Company’s brands and categories, and all the factors that drive their purchase decisionsand in-use experience. That understanding must then be translated into innovative products that deliver unique features and benefits, at a best-cost position,providing the consumer with great value. Lastly, innovating how and where to create awareness and trial, and measuring the effectiveness of advertising andpromotion spending, completes the process. The Company has pockets of excellence using this expanded definition of innovation, and it will continue tobuild on this competency.
- 21 -
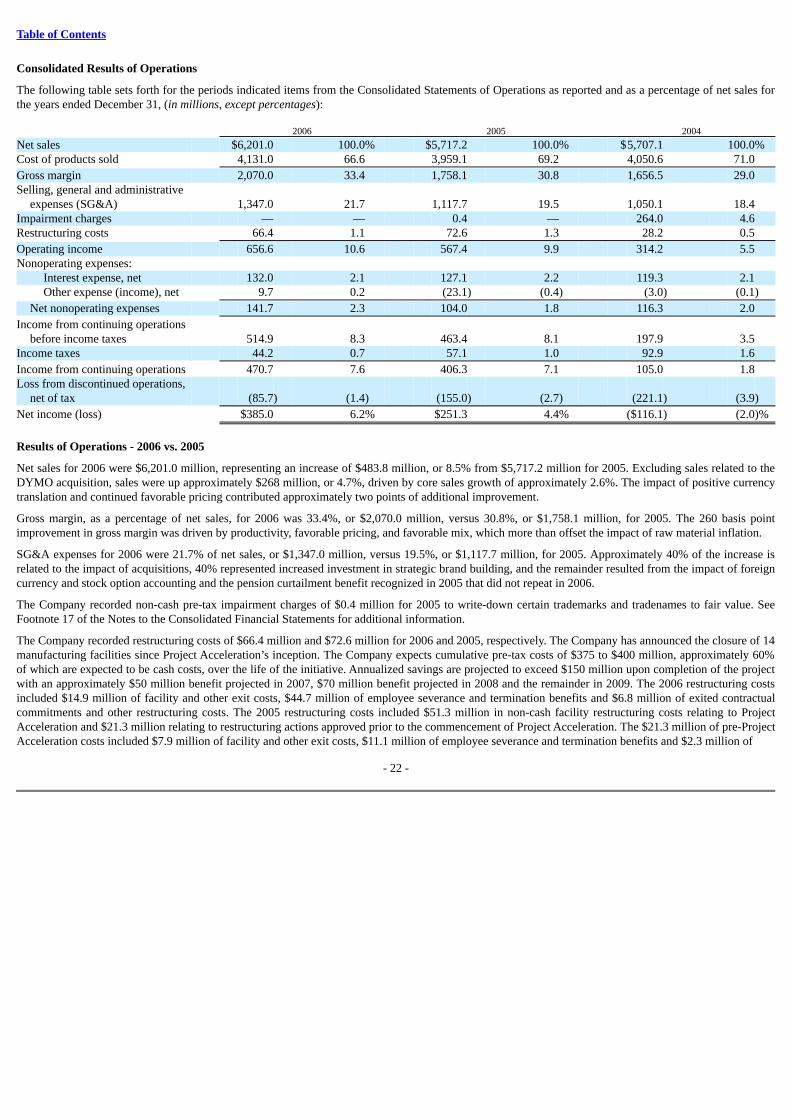
Table of Contents
Consolidated Results of Operations
The following table sets forth for the periods indicated items from the Consolidated Statements of Operations as reported and as a percentage of net sales forthe years ended December 31, (in millions, except percentages): 2006 2005 2004
Net sales $6,201.0 100.0% $5,717.2 100.0% $5,707.1 100.0%Cost of products sold 4,131.0 66.6 3,959.1 69.2 4,050.6 71.0
Gross margin 2,070.0 33.4 1,758.1 30.8 1,656.5 29.0 Selling, general and administrative
expenses (SG&A) 1,347.0 21.7 1,117.7 19.5 1,050.1 18.4 Impairment charges — — 0.4 — 264.0 4.6 Restructuring costs 66.4 1.1 72.6 1.3 28.2 0.5
Operating income 656.6 10.6 567.4 9.9 314.2 5.5 Nonoperating expenses:
Interest expense, net 132.0 2.1 127.1 2.2 119.3 2.1 Other expense (income), net 9.7 0.2 (23.1) (0.4) (3.0) (0.1)
Net nonoperating expenses 141.7 2.3 104.0 1.8 116.3 2.0
Income from continuing operationsbefore income taxes 514.9 8.3 463.4 8.1 197.9 3.5
Income taxes 44.2 0.7 57.1 1.0 92.9 1.6
Income from continuing operations 470.7 7.6 406.3 7.1 105.0 1.8 Loss from discontinued operations,
net of tax (85.7) (1.4) (155.0) (2.7) (221.1) (3.9)
Net income (loss) $385.0 6.2% $251.3 4.4% ($116.1) (2.0)%
Results of Operations - 2006 vs. 2005
Net sales for 2006 were $6,201.0 million, representing an increase of $483.8 million, or 8.5% from $5,717.2 million for 2005. Excluding sales related to theDYMO acquisition, sales were up approximately $268 million, or 4.7%, driven by core sales growth of approximately 2.6%. The impact of positive currencytranslation and continued favorable pricing contributed approximately two points of additional improvement.
Gross margin, as a percentage of net sales, for 2006 was 33.4%, or $2,070.0 million, versus 30.8%, or $1,758.1 million, for 2005. The 260 basis pointimprovement in gross margin was driven by productivity, favorable pricing, and favorable mix, which more than offset the impact of raw material inflation.
SG&A expenses for 2006 were 21.7% of net sales, or $1,347.0 million, versus 19.5%, or $1,117.7 million, for 2005. Approximately 40% of the increase isrelated to the impact of acquisitions, 40% represented increased investment in strategic brand building, and the remainder resulted from the impact of foreigncurrency and stock option accounting and the pension curtailment benefit recognized in 2005 that did not repeat in 2006.
The Company recorded non-cash pre-tax impairment charges of $0.4 million for 2005 to write-down certain trademarks and tradenames to fair value. SeeFootnote 17 of the Notes to the Consolidated Financial Statements for additional information.
The Company recorded restructuring costs of $66.4 million and $72.6 million for 2006 and 2005, respectively. The Company has announced the closure of 14manufacturing facilities since Project Acceleration’s inception. The Company expects cumulative pre-tax costs of $375 to $400 million, approximately 60%of which are expected to be cash costs, over the life of the initiative. Annualized savings are projected to exceed $150 million upon completion of the projectwith an approximately $50 million benefit projected in 2007, $70 million benefit projected in 2008 and the remainder in 2009. The 2006 restructuring costsincluded $14.9 million of facility and other exit costs, $44.7 million of employee severance and termination benefits and $6.8 million of exited contractualcommitments and other restructuring costs. The 2005 restructuring costs included $51.3 million in non-cash facility restructuring costs relating to ProjectAcceleration and $21.3 million relating to restructuring actions approved prior to the commencement of Project Acceleration. The $21.3 million of pre-ProjectAcceleration costs included $7.9 million of facility and other exit costs, $11.1 million of employee severance and termination benefits and $2.3 million of
- 22 -
Table of Contents
exited contractual commitments and other restructuring costs. See Footnote 4 of the Notes to the Consolidated Financial Statements for further information onthe restructuring costs.
Operating income for 2006 was $656.6 million, or 10.6% of net sales, versus $567.4 million, or 9.9% of net sales, in 2005. The improvement in operatingmargins is the result of the factors described above.
Net nonoperating expenses for 2006 were 2.3% of net sales, or $141.7 million, versus 1.8% of net sales, or $104.0 million, for 2005. The increase in netnonoperating expenses is mainly attributable to gains recognized in 2005 on the sale of property, plant and equipment and the liquidation of a foreignsubsidiary that did not repeat in 2006, along with an increase in net interest expense, $132.0 million for 2006 compared to $127.1 million for 2005. Theincrease in net interest expense was primarily due to higher borrowing rates and higher average debt balances. See Footnote 18 of the Notes to theConsolidated Financial Statements for further information.
The effective tax rate was 8.6% for 2006 versus 12.3% for 2005. The change in the effective tax rate is primarily related to the $102.8 million income taxbenefit recorded in 2006 compared to the net income tax benefit of $73.9 million recorded in 2005, as a result of favorable resolution of certain tax positionsand the expiration of the statute of limitations on other deductions. See Footnote 16 of the Notes to the Consolidated Financial Statements for furtherinformation.
Income from continuing operations for 2006 was $470.7 million, compared to $406.3 million for 2005. Diluted earnings per share from continuing operationswere $1.71 for 2006 compared to $1.48 for 2005.
The loss from discontinued operations for 2006 was $85.7 million, compared to $155.0 million for 2005. The gain (loss) on the disposal of discontinuedoperations for 2006 was $0.7 million, compared to $(96.8) million for 2005. The 2006 gain was primarily related to the disposal of the Little Tikes business,which was partially offset by the loss recognized on disposal of the Home Décor Europe business. The 2005 loss related primarily to the disposal of theCurver and the European Cookware businesses. The loss from operations of discontinued operations for 2006 was $86.4 million, net of tax, compared to$58.2 million, net of tax, for 2005. Diluted loss per share from discontinued operations was $0.31 for 2006 compared to $0.56 for 2005. See Footnote 3 of theNotes to the Consolidated Financial Statements for further information.
Net income for 2006 was $385.0 million, compared to $251.3 million for 2005. Diluted earnings per share was $1.40 for 2006 compared to $0.91 for 2005.
Results of Operations - 2005 vs. 2004
Net sales for 2005 were $5,717.2 million, representing a increase of $10.1 million, or 0.2% from $5,707.1 million for 2004. Excluding sales related to theDYMO acquisition, sales decreased by $14.8 million primarily due to the rationalization of unfavorable product lines and core sales decline partially offset byfavorable pricing. Positive currency translation improved sales by 0.7% for the full year.
Gross margin, as a percentage of net sales, for 2005 was 30.8%, or $1,758.1 million, versus 29.0%, or $1,656.5 million, for 2004. The improvement in grossmargin is primarily related to favorable pricing, productivity, and favorable mix driven by the rationalization of unprofitable product lines primarily in theRubbermaid Home Products business, partially offset by raw material inflation (primarily resin and steel).
SG&A expenses for 2005 were 19.5% of net sales, or $1,117.7 million, versus 18.4%, or $1,050.1 million, for 2004. The increase in SG&A was driven by theimpact from foreign currency, the impact from the acquisition of DYMO and increased investments in strategic brand building, partially offset bystreamlining.
The Company recorded non-cash pre-tax impairment charges of $0.4 million and $264.0 million for 2005 and 2004, respectively. The 2005 charges wererequired to write-down certain trademarks and tradename assets to fair value. The 2004 charges were required to write-down certain assets to fair value,primarily in the Company’s European and Latin American Office Products businesses. See Footnote 17 of the Notes to the Consolidated Financial Statementsfor additional information.
The Company recorded restructuring costs of $72.6 million and $28.2 million for 2005 and 2004, respectively. The 2005 restructuring costs included$51.3 million in non-cash facility restructuring costs relating to Project
- 23 -
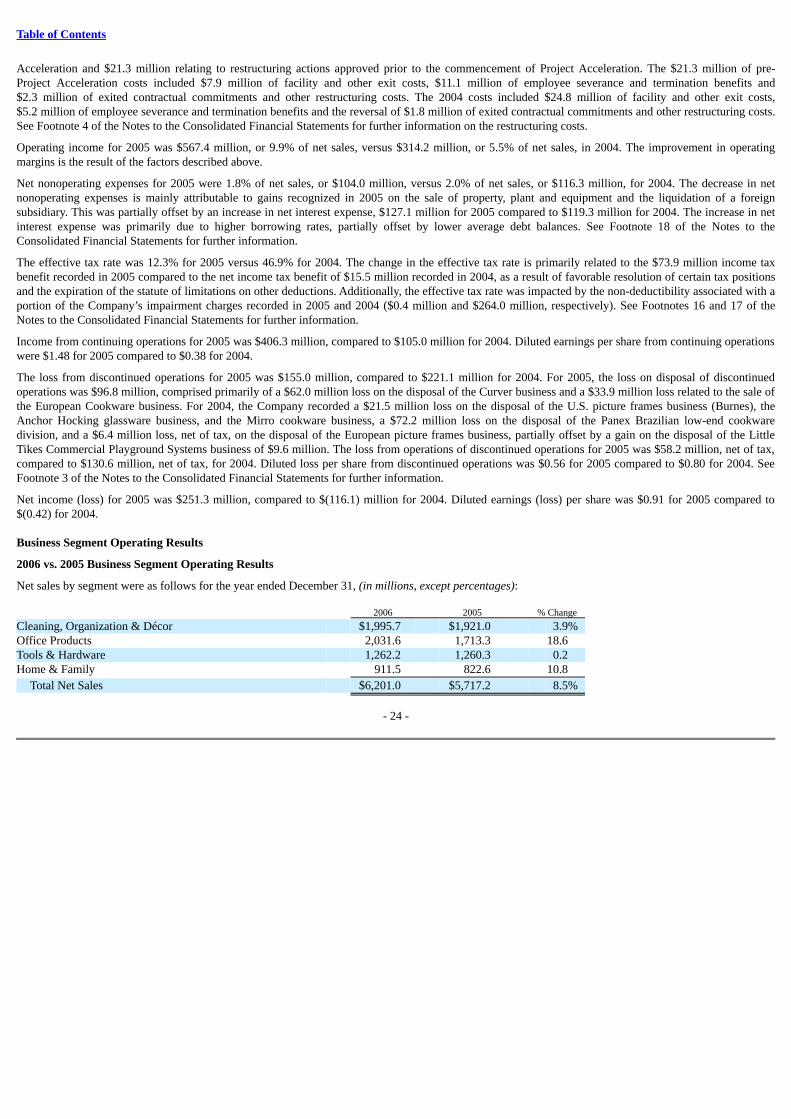
Table of Contents
Acceleration and $21.3 million relating to restructuring actions approved prior to the commencement of Project Acceleration. The $21.3 million of pre-Project Acceleration costs included $7.9 million of facility and other exit costs, $11.1 million of employee severance and termination benefits and$2.3 million of exited contractual commitments and other restructuring costs. The 2004 costs included $24.8 million of facility and other exit costs,$5.2 million of employee severance and termination benefits and the reversal of $1.8 million of exited contractual commitments and other restructuring costs.See Footnote 4 of the Notes to the Consolidated Financial Statements for further information on the restructuring costs.
Operating income for 2005 was $567.4 million, or 9.9% of net sales, versus $314.2 million, or 5.5% of net sales, in 2004. The improvement in operatingmargins is the result of the factors described above.
Net nonoperating expenses for 2005 were 1.8% of net sales, or $104.0 million, versus 2.0% of net sales, or $116.3 million, for 2004. The decrease in netnonoperating expenses is mainly attributable to gains recognized in 2005 on the sale of property, plant and equipment and the liquidation of a foreignsubsidiary. This was partially offset by an increase in net interest expense, $127.1 million for 2005 compared to $119.3 million for 2004. The increase in netinterest expense was primarily due to higher borrowing rates, partially offset by lower average debt balances. See Footnote 18 of the Notes to theConsolidated Financial Statements for further information.
The effective tax rate was 12.3% for 2005 versus 46.9% for 2004. The change in the effective tax rate is primarily related to the $73.9 million income taxbenefit recorded in 2005 compared to the net income tax benefit of $15.5 million recorded in 2004, as a result of favorable resolution of certain tax positionsand the expiration of the statute of limitations on other deductions. Additionally, the effective tax rate was impacted by the non-deductibility associated with aportion of the Company’s impairment charges recorded in 2005 and 2004 ($0.4 million and $264.0 million, respectively). See Footnotes 16 and 17 of theNotes to the Consolidated Financial Statements for further information.
Income from continuing operations for 2005 was $406.3 million, compared to $105.0 million for 2004. Diluted earnings per share from continuing operationswere $1.48 for 2005 compared to $0.38 for 2004.
The loss from discontinued operations for 2005 was $155.0 million, compared to $221.1 million for 2004. For 2005, the loss on disposal of discontinuedoperations was $96.8 million, comprised primarily of a $62.0 million loss on the disposal of the Curver business and a $33.9 million loss related to the sale ofthe European Cookware business. For 2004, the Company recorded a $21.5 million loss on the disposal of the U.S. picture frames business (Burnes), theAnchor Hocking glassware business, and the Mirro cookware business, a $72.2 million loss on the disposal of the Panex Brazilian low-end cookwaredivision, and a $6.4 million loss, net of tax, on the disposal of the European picture frames business, partially offset by a gain on the disposal of the LittleTikes Commercial Playground Systems business of $9.6 million. The loss from operations of discontinued operations for 2005 was $58.2 million, net of tax,compared to $130.6 million, net of tax, for 2004. Diluted loss per share from discontinued operations was $0.56 for 2005 compared to $0.80 for 2004. SeeFootnote 3 of the Notes to the Consolidated Financial Statements for further information.
Net income (loss) for 2005 was $251.3 million, compared to $(116.1) million for 2004. Diluted earnings (loss) per share was $0.91 for 2005 compared to$(0.42) for 2004.
Business Segment Operating Results
2006 vs. 2005 Business Segment Operating Results
Net sales by segment were as follows for the year ended December 31, (in millions, except percentages): 2006 2005 % Change
Cleaning, Organization & Décor $1,995.7 $1,921.0 3.9%Office Products 2,031.6 1,713.3 18.6 Tools & Hardware 1,262.2 1,260.3 0.2 Home & Family 911.5 822.6 10.8
Total Net Sales $6,201.0 $5,717.2 8.5%
- 24 -
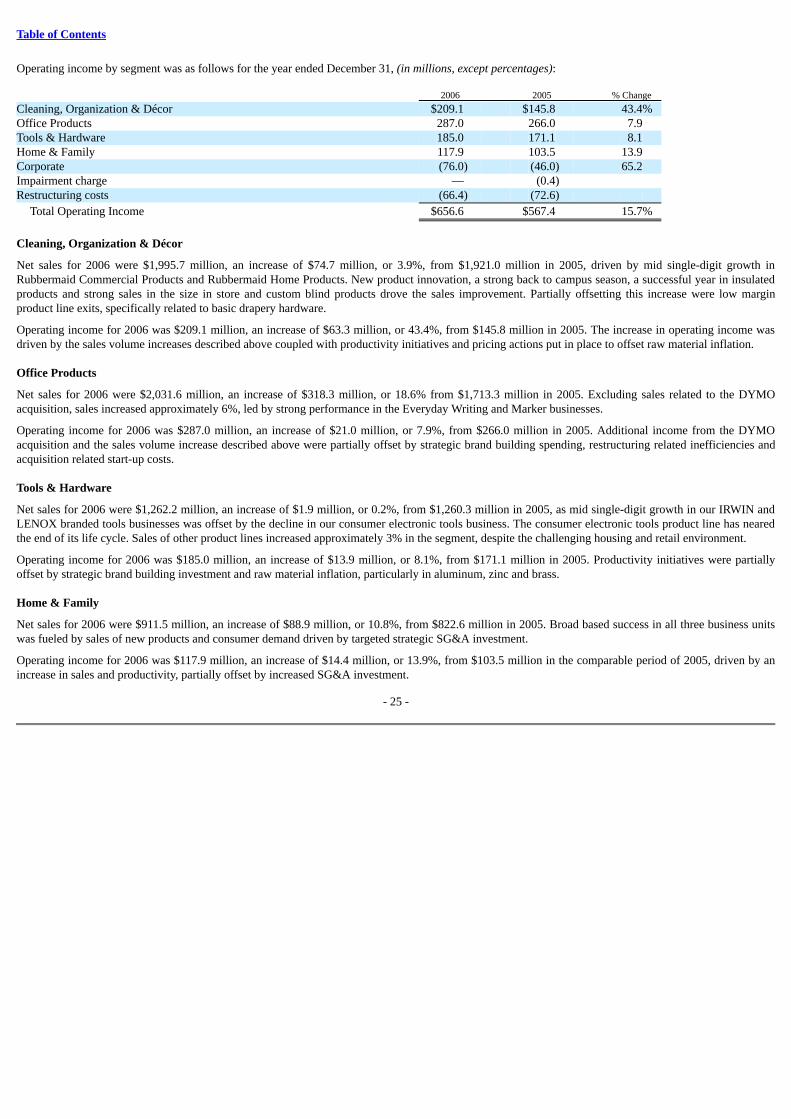
Table of Contents
Operating income by segment was as follows for the year ended December 31, (in millions, except percentages): 2006 2005 % Change
Cleaning, Organization & Décor $209.1 $145.8 43.4%Office Products 287.0 266.0 7.9 Tools & Hardware 185.0 171.1 8.1 Home & Family 117.9 103.5 13.9 Corporate (76.0) (46.0) 65.2 Impairment charge — (0.4) Restructuring costs (66.4) (72.6)
Total Operating Income $656.6 $567.4 15.7%
Cleaning, Organization & Décor
Net sales for 2006 were $1,995.7 million, an increase of $74.7 million, or 3.9%, from $1,921.0 million in 2005, driven by mid single-digit growth inRubbermaid Commercial Products and Rubbermaid Home Products. New product innovation, a strong back to campus season, a successful year in insulatedproducts and strong sales in the size in store and custom blind products drove the sales improvement. Partially offsetting this increase were low marginproduct line exits, specifically related to basic drapery hardware.
Operating income for 2006 was $209.1 million, an increase of $63.3 million, or 43.4%, from $145.8 million in 2005. The increase in operating income wasdriven by the sales volume increases described above coupled with productivity initiatives and pricing actions put in place to offset raw material inflation.
Office Products
Net sales for 2006 were $2,031.6 million, an increase of $318.3 million, or 18.6% from $1,713.3 million in 2005. Excluding sales related to the DYMOacquisition, sales increased approximately 6%, led by strong performance in the Everyday Writing and Marker businesses.
Operating income for 2006 was $287.0 million, an increase of $21.0 million, or 7.9%, from $266.0 million in 2005. Additional income from the DYMOacquisition and the sales volume increase described above were partially offset by strategic brand building spending, restructuring related inefficiencies andacquisition related start-up costs.
Tools & Hardware
Net sales for 2006 were $1,262.2 million, an increase of $1.9 million, or 0.2%, from $1,260.3 million in 2005, as mid single-digit growth in our IRWIN andLENOX branded tools businesses was offset by the decline in our consumer electronic tools business. The consumer electronic tools product line has nearedthe end of its life cycle. Sales of other product lines increased approximately 3% in the segment, despite the challenging housing and retail environment.
Operating income for 2006 was $185.0 million, an increase of $13.9 million, or 8.1%, from $171.1 million in 2005. Productivity initiatives were partiallyoffset by strategic brand building investment and raw material inflation, particularly in aluminum, zinc and brass.
Home & Family
Net sales for 2006 were $911.5 million, an increase of $88.9 million, or 10.8%, from $822.6 million in 2005. Broad based success in all three business unitswas fueled by sales of new products and consumer demand driven by targeted strategic SG&A investment.
Operating income for 2006 was $117.9 million, an increase of $14.4 million, or 13.9%, from $103.5 million in the comparable period of 2005, driven by anincrease in sales and productivity, partially offset by increased SG&A investment.
- 25 -
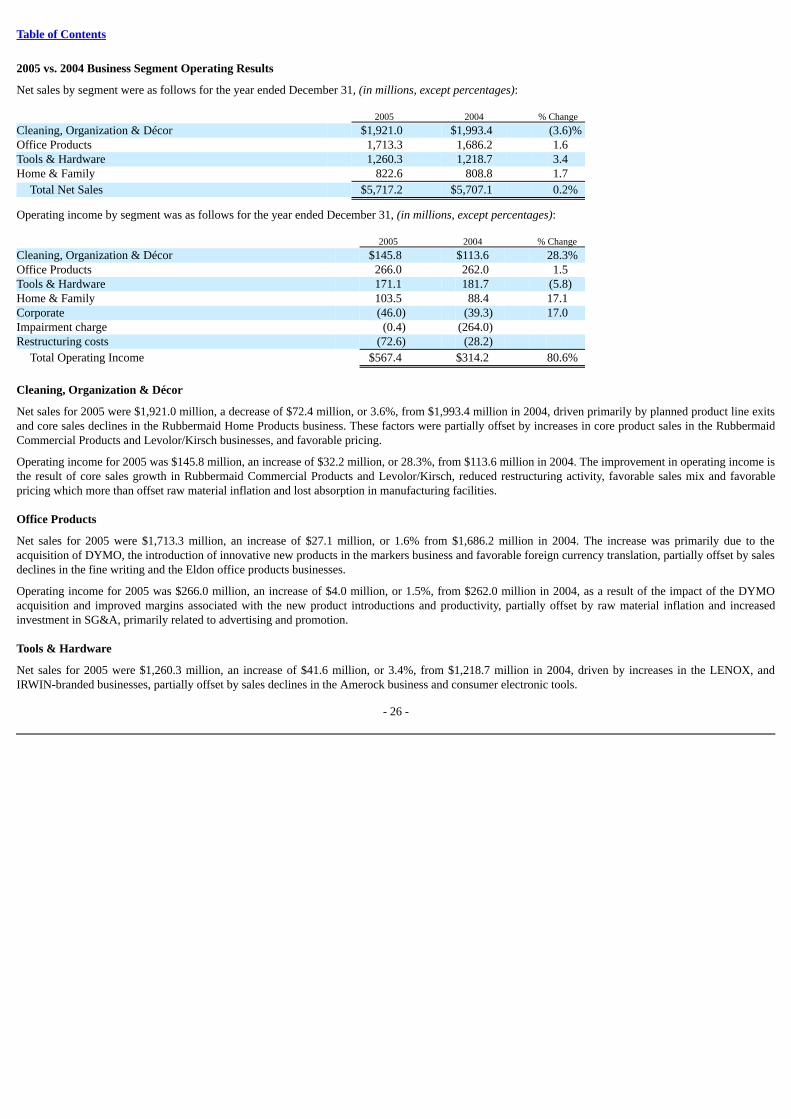
Table of Contents
2005 vs. 2004 Business Segment Operating Results
Net sales by segment were as follows for the year ended December 31, (in millions, except percentages): 2005 2004 % Change
Cleaning, Organization & Décor $1,921.0 $1,993.4 (3.6)%Office Products 1,713.3 1,686.2 1.6 Tools & Hardware 1,260.3 1,218.7 3.4 Home & Family 822.6 808.8 1.7
Total Net Sales $5,717.2 $5,707.1 0.2%
Operating income by segment was as follows for the year ended December 31, (in millions, except percentages): 2005 2004 % Change
Cleaning, Organization & Décor $145.8 $113.6 28.3%Office Products 266.0 262.0 1.5 Tools & Hardware 171.1 181.7 (5.8)Home & Family 103.5 88.4 17.1 Corporate (46.0) (39.3) 17.0 Impairment charge (0.4) (264.0) Restructuring costs (72.6) (28.2)
Total Operating Income $567.4 $314.2 80.6%
Cleaning, Organization & Décor
Net sales for 2005 were $1,921.0 million, a decrease of $72.4 million, or 3.6%, from $1,993.4 million in 2004, driven primarily by planned product line exitsand core sales declines in the Rubbermaid Home Products business. These factors were partially offset by increases in core product sales in the RubbermaidCommercial Products and Levolor/Kirsch businesses, and favorable pricing.
Operating income for 2005 was $145.8 million, an increase of $32.2 million, or 28.3%, from $113.6 million in 2004. The improvement in operating income isthe result of core sales growth in Rubbermaid Commercial Products and Levolor/Kirsch, reduced restructuring activity, favorable sales mix and favorablepricing which more than offset raw material inflation and lost absorption in manufacturing facilities.
Office Products
Net sales for 2005 were $1,713.3 million, an increase of $27.1 million, or 1.6% from $1,686.2 million in 2004. The increase was primarily due to theacquisition of DYMO, the introduction of innovative new products in the markers business and favorable foreign currency translation, partially offset by salesdeclines in the fine writing and the Eldon office products businesses.
Operating income for 2005 was $266.0 million, an increase of $4.0 million, or 1.5%, from $262.0 million in 2004, as a result of the impact of the DYMOacquisition and improved margins associated with the new product introductions and productivity, partially offset by raw material inflation and increasedinvestment in SG&A, primarily related to advertising and promotion.
Tools & Hardware
Net sales for 2005 were $1,260.3 million, an increase of $41.6 million, or 3.4%, from $1,218.7 million in 2004, driven by increases in the LENOX, andIRWIN-branded businesses, partially offset by sales declines in the Amerock business and consumer electronic tools.
- 26 -
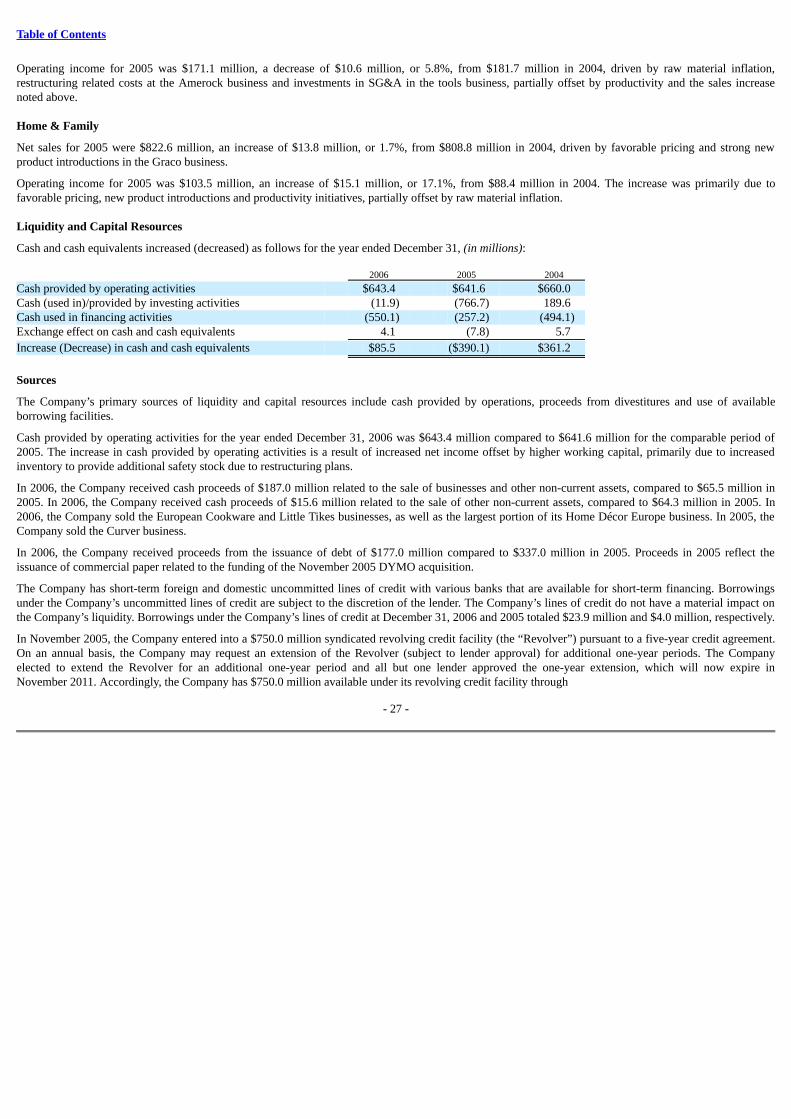
Table of Contents
Operating income for 2005 was $171.1 million, a decrease of $10.6 million, or 5.8%, from $181.7 million in 2004, driven by raw material inflation,restructuring related costs at the Amerock business and investments in SG&A in the tools business, partially offset by productivity and the sales increasenoted above.
Home & Family
Net sales for 2005 were $822.6 million, an increase of $13.8 million, or 1.7%, from $808.8 million in 2004, driven by favorable pricing and strong newproduct introductions in the Graco business.
Operating income for 2005 was $103.5 million, an increase of $15.1 million, or 17.1%, from $88.4 million in 2004. The increase was primarily due tofavorable pricing, new product introductions and productivity initiatives, partially offset by raw material inflation.
Liquidity and Capital Resources
Cash and cash equivalents increased (decreased) as follows for the year ended December 31, (in millions): 2006 2005 2004
Cash provided by operating activities $643.4 $641.6 $660.0 Cash (used in)/provided by investing activities (11.9) (766.7) 189.6 Cash used in financing activities (550.1) (257.2) (494.1)Exchange effect on cash and cash equivalents 4.1 (7.8) 5.7
Increase (Decrease) in cash and cash equivalents $85.5 ($390.1) $361.2
Sources
The Company’s primary sources of liquidity and capital resources include cash provided by operations, proceeds from divestitures and use of availableborrowing facilities.
Cash provided by operating activities for the year ended December 31, 2006 was $643.4 million compared to $641.6 million for the comparable period of2005. The increase in cash provided by operating activities is a result of increased net income offset by higher working capital, primarily due to increasedinventory to provide additional safety stock due to restructuring plans.
In 2006, the Company received cash proceeds of $187.0 million related to the sale of businesses and other non-current assets, compared to $65.5 million in2005. In 2006, the Company received cash proceeds of $15.6 million related to the sale of other non-current assets, compared to $64.3 million in 2005. In2006, the Company sold the European Cookware and Little Tikes businesses, as well as the largest portion of its Home Décor Europe business. In 2005, theCompany sold the Curver business.
In 2006, the Company received proceeds from the issuance of debt of $177.0 million compared to $337.0 million in 2005. Proceeds in 2005 reflect theissuance of commercial paper related to the funding of the November 2005 DYMO acquisition.
The Company has short-term foreign and domestic uncommitted lines of credit with various banks that are available for short-term financing. Borrowingsunder the Company’s uncommitted lines of credit are subject to the discretion of the lender. The Company’s lines of credit do not have a material impact onthe Company’s liquidity. Borrowings under the Company’s lines of credit at December 31, 2006 and 2005 totaled $23.9 million and $4.0 million, respectively.
In November 2005, the Company entered into a $750.0 million syndicated revolving credit facility (the “Revolver”) pursuant to a five-year credit agreement.On an annual basis, the Company may request an extension of the Revolver (subject to lender approval) for additional one-year periods. The Companyelected to extend the Revolver for an additional one-year period and all but one lender approved the one-year extension, which will now expire inNovember 2011. Accordingly, the Company has $750.0 million available under its revolving credit facility through
- 27 -
Table of Contents
November 2010 and $725.0 million thereafter, through November 2011. At December 31, 2006 and 2005, there were no borrowings under the Revolver.
In lieu of borrowings under the Revolver, the Company may issue up to $750.0 million of commercial paper through 2010 and $725.0 million thereafter,through 2011. The Revolver provides the committed backup liquidity required to issue commercial paper. Accordingly, commercial paper may only be issuedup to the amount available for borrowing under the Revolver. The Revolver also provides for the issuance of up to $100.0 million of standby letters of creditso long as there is a sufficient amount available for borrowing under the Revolver. At December 31, 2006, there was no commercial paper outstanding andthere were no standby letters of credit issued under the Revolver. At December 31, 2005, $202.0 million of commercial paper was outstanding and there wereno standby letters of credit issued under the Revolver.
The Revolver permits the Company to borrow funds on a variety of interest rate terms and requires, among other things, that the Company maintain certainInterest Coverage and Total Indebtedness to Total Capital Ratio, as defined in the agreement. The Revolver also limits Subsidiary Indebtedness. As ofDecember 31, 2006 and 2005, the Company was in compliance with the terms of the agreement governing the Revolver.
Under a 2001 receivables facility with a financial institution, the Company created a financing entity that is consolidated in the Company’s financialstatements. Under this facility, the Company regularly enters into transactions with the financing entity to sell an undivided interest in substantially all of theCompany’s United States trade receivables to the financing entity. In 2001, the financing entity issued $450.0 million in preferred debt securities to thefinancial institution. Certain levels of accounts receivable write-offs and other events would permit the financial institution to terminate the receivablesfacility. On September 18, 2006, in accordance with the terms of the receivables facility, the financing entity caused the preferred debt securities to beexchanged for cash of $2.2 million, a two year floating rate note in an aggregate principal amount of $448.0 million and a cash premium of $5.2 million.Because this debt matures in 2008, the entire amount is considered to be long-term. At any time prior to maturity of the note, the holder may elect to convertit into new preferred debt securities of the financing entity with a par value equal to the outstanding principal amount of the note. The note must be repaid andany preferred debt securities into which the note is converted must be retired or redeemed before the Company can have access to the financing entity’sreceivables. As of December 31, 2006 and December 31, 2005, the aggregate amount of outstanding receivables sold under this facility was $696.7 millionand $746.9 million, respectively. The receivables and the preferred debt securities or note, as applicable, are recorded in the consolidated accounts of theCompany.
Uses
The Company’s primary uses of liquidity and capital resources include acquisitions, dividend payments, capital expenditures and payments on debt.
Cash used for acquisitions was $60.6 million in 2006, compared to $740.0 million in 2005. In 2006, the Company did not invest in significant acquisitions.The cash used in 2005 related primarily to the acquisition of DYMO for $699.2 million, which was funded by $480.2 million of cash on hand and$219.0 million from existing credit facilities. See Footnote 2 of the Notes to the Consolidated Financial Statements for additional information.
Capital expenditures were $138.3 million and $92.2 million in 2006 and 2005, respectively. The increase in capital expenditures was driven by spending onthe Company’s SAP initiative. Capital expenditures for 2007 are expected to be in the range of $140 to $160 million.
In 2006, the Company made payments on notes payable and long-term debt of $511.0 million compared to $360.1 million in 2005. In 2006, the Companyused available cash to pay off commercial paper and retire a $150 million, 6.6% fixed rate medium-term note that matured. In 2005, the Company purchased750,000 shares of its 5.25% convertible preferred securities from holders at an average price of $47.075 per share ($35.3 million). See Footnote 10 of theNotes to the Consolidated Financial Statements for additional information on these transactions.
Aggregate dividends paid were $232.8 million and $231.5 million in 2006 and 2005, respectively. In 2007, the Company expects to make similar dividendpayments.
- 28 -
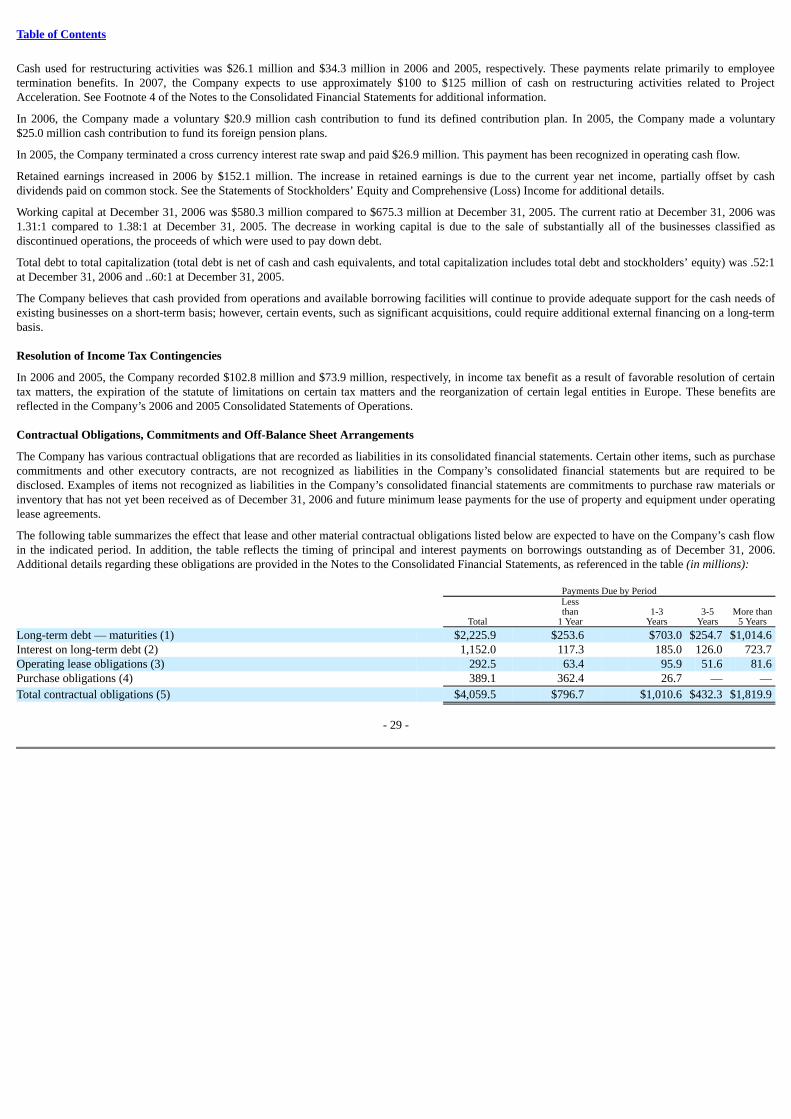
Table of Contents
Cash used for restructuring activities was $26.1 million and $34.3 million in 2006 and 2005, respectively. These payments relate primarily to employeetermination benefits. In 2007, the Company expects to use approximately $100 to $125 million of cash on restructuring activities related to ProjectAcceleration. See Footnote 4 of the Notes to the Consolidated Financial Statements for additional information.
In 2006, the Company made a voluntary $20.9 million cash contribution to fund its defined contribution plan. In 2005, the Company made a voluntary$25.0 million cash contribution to fund its foreign pension plans.
In 2005, the Company terminated a cross currency interest rate swap and paid $26.9 million. This payment has been recognized in operating cash flow.
Retained earnings increased in 2006 by $152.1 million. The increase in retained earnings is due to the current year net income, partially offset by cashdividends paid on common stock. See the Statements of Stockholders’ Equity and Comprehensive (Loss) Income for additional details.
Working capital at December 31, 2006 was $580.3 million compared to $675.3 million at December 31, 2005. The current ratio at December 31, 2006 was1.31:1 compared to 1.38:1 at December 31, 2005. The decrease in working capital is due to the sale of substantially all of the businesses classified asdiscontinued operations, the proceeds of which were used to pay down debt.
Total debt to total capitalization (total debt is net of cash and cash equivalents, and total capitalization includes total debt and stockholders’ equity) was .52:1at December 31, 2006 and ..60:1 at December 31, 2005.
The Company believes that cash provided from operations and available borrowing facilities will continue to provide adequate support for the cash needs ofexisting businesses on a short-term basis; however, certain events, such as significant acquisitions, could require additional external financing on a long-termbasis.
Resolution of Income Tax Contingencies
In 2006 and 2005, the Company recorded $102.8 million and $73.9 million, respectively, in income tax benefit as a result of favorable resolution of certaintax matters, the expiration of the statute of limitations on certain tax matters and the reorganization of certain legal entities in Europe. These benefits arereflected in the Company’s 2006 and 2005 Consolidated Statements of Operations.
Contractual Obligations, Commitments and Off-Balance Sheet Arrangements
The Company has various contractual obligations that are recorded as liabilities in its consolidated financial statements. Certain other items, such as purchasecommitments and other executory contracts, are not recognized as liabilities in the Company’s consolidated financial statements but are required to bedisclosed. Examples of items not recognized as liabilities in the Company’s consolidated financial statements are commitments to purchase raw materials orinventory that has not yet been received as of December 31, 2006 and future minimum lease payments for the use of property and equipment under operatinglease agreements.
The following table summarizes the effect that lease and other material contractual obligations listed below are expected to have on the Company’s cash flowin the indicated period. In addition, the table reflects the timing of principal and interest payments on borrowings outstanding as of December 31, 2006.Additional details regarding these obligations are provided in the Notes to the Consolidated Financial Statements, as referenced in the table (in millions): Payments Due by Period Less than 1-3 3-5 More than Total 1 Year Years Years 5 Years
Long-term debt — maturities (1) $2,225.9 $253.6 $703.0 $254.7 $1,014.6 Interest on long-term debt (2) 1,152.0 117.3 185.0 126.0 723.7 Operating lease obligations (3) 292.5 63.4 95.9 51.6 81.6 Purchase obligations (4) 389.1 362.4 26.7 — —
Total contractual obligations (5) $4,059.5 $796.7 $1,010.6 $432.3 $1,819.9
- 29 -
Table of Contents
(1) Amounts represent contractual obligations due, excluding interest, based on borrowings outstanding as of December 31, 2006. For further information relating to these obligations, seeFootnotes 9 and 10 of the Notes to the Consolidated Financial Statements.
(2) Amounts represent estimated interest expense on borrowings outstanding as of December 31, 2006. Interest on floating debt was estimated using the index rate in effect as of December 31,
2006. For further information relating to this obligation, see Footnotes 9 and 10 of the Notes to the Consolidated Financial Statements. (3) Amounts represent contractual minimum lease obligations on operating leases as of December 31, 2006. For further information relating to this obligation, see Footnote 12 of the Notes to
the Consolidated Financial Statements. (4) Primarily consists of purchase commitments entered into as of December 31, 2006 for finished goods, raw materials, components and services and joint venture interests pursuant to legally
enforceable and binding obligations, which include all significant terms. (5) Total does not include contractual obligations reported on the December 31, 2006 balance sheet as current liabilities, except for current portion of long-term debt.
The Company also has obligations with respect to its pension and post retirement medical benefit plans. See Footnote 13 of the Notes to the ConsolidatedFinancial Statements.
As of December 31, 2006, the Company had $95.4 million in standby letters of credit primarily related to the Company’s self-insurance programs, includingworkers’ compensation, product liability, and medical. See Footnote 20 of the Notes to the Consolidated Financial Statements for further information.
As of December 31, 2006, the Company did not have any significant off-balance sheet arrangements, as defined in Item 303(a)(4)(ii) of SEC Regulation S-K.
Critical Accounting Policies
The Company’s accounting policies are more fully described in Footnote 1 of the Notes to the Consolidated Financial Statements. As disclosed in Footnote 1of the Notes to the Consolidated Financial Statements, the preparation of financial statements in conformity with generally accepted accounting principlesrequires management to make estimates and assumptions about future events that affect the amounts reported in the financial statements and accompanyingfootnotes. Future events and their effects cannot be determined with absolute certainty. Therefore, the determination of estimates requires the exercise ofjudgment. Actual results inevitably will differ from those estimates, and such differences may be material to the Consolidated Financial Statements. Thefollowing sections describe the Company’s critical accounting policies.
Sales Recognition
Sales of merchandise and freight billed to customers are recognized when title passes and all substantial risks of ownership change, which generally occurseither upon shipment or upon delivery based upon contractual terms. Sales are net of provisions for cash discounts, returns, customer discounts (such asvolume or trade discounts), cooperative advertising and other sales related discounts.
Recovery of Accounts Receivable
The Company evaluates the collectibility of accounts receivable based on a combination of factors. When aware of a specific customer’s inability to meet itsfinancial obligations, such as in the case of bankruptcy filings or deterioration in the customer’s operating results or financial position, the Company records aspecific reserve for bad debt to reduce the related receivable to the amount the Company reasonably believes is collectible. The Company also recordsreserves for bad debt for all other customers based on a variety of factors, including the length of time the receivables are past due and historical collectionexperience. Accounts are reviewed for potential write-off on a case by case basis. Accounts deemed uncollectible are written off, net of expected recoveries.If circumstances related to specific customers change, the Company’s estimates of the recoverability of receivables could be further adjusted. As ofDecember 31, 2006, the Company had allowances for doubtful accounts of $26.3 million on $1,139.9 million of accounts receivable.
- 30 -
Table of Contents
Inventory Reserves
The Company reduces its inventory value for estimated obsolete and slow moving inventory in an amount equal to the difference between the cost ofinventory and the net realizable value based upon assumptions about future demand and market conditions. If actual market conditions are less favorable thanthose projected by management, additional inventory write-downs may be required.
Goodwill and Other Indefinite-Lived Intangible Assets
The Company conducts its annual test of impairment for goodwill and indefinite lived intangible assets in the third quarter because it coincides with its annualstrategic planning process for all of its businesses. The Company also tests for impairment if events or circumstances indicate that it is more likely than notthat the fair value of a reporting unit or the indefinite life intangible asset is below its carrying amount. The Company tests for impairment at the operatingsegment level.
The Company cannot predict the occurrence of certain events that might adversely affect the reported value of goodwill and other intangible assets. Suchevents may include, but are not limited to, strategic decisions made in response to economic and competitive conditions, the impact of the economicenvironment on the Company’s customer base, or a material negative change in its relationships with significant customers. Additionally, increases in the riskadjusted rate could result in impairment charges.
The Company assesses the fair value of its reporting units for its goodwill and other indefinite lived intangible assets (primarily trademarks and tradenames)in its impairment tests, generally based upon a discounted cash flow methodology, or an actual sales offer received from a prospective buyer, if available. Thediscounted cash flows are estimated utilizing various assumptions regarding future revenue and expenses, working capital, terminal value, and marketdiscount rates. The underlying assumptions used are consistent with those used in the strategic plan.
If the carrying amount of the reporting unit is greater than the fair value, goodwill impairment may be present. The Company measures the goodwillimpairment based upon the fair value of the underlying assets and liabilities of the reporting unit, including any unrecognized intangible assets, and estimatesthe implied fair value of goodwill. An impairment charge is recognized to the extent the recorded goodwill exceeds the implied fair value of goodwill.
If the carrying amount of the intangible asset exceeds its fair value, an impairment charge is recorded to the extent the recorded intangible asset exceeds thefair value.
Other Long-Lived Assets
The Company continuously evaluates if impairment indicators related to its property, plant and equipment and other long-lived assets are present. Theseimpairment indicators may include a significant decrease in the market price of a long-lived asset or asset group, a significant adverse change in the extent ormanner in which a long-lived asset or asset group is being used or in its physical condition, or a current-period operating or cash flow loss combined with ahistory of operating or cash flow losses or a forecast that demonstrates continuing losses associated with the use of a long-lived asset or asset group. Ifimpairment indicators are present, the Company estimates the future cash flows for the asset or group of assets. The sum of the undiscounted future cashflows attributable to the asset or group of assets is compared to their carrying amount. The cash flows are estimated utilizing various assumptions regardingfuture revenue and expenses, working capital, and proceeds from asset disposals on a basis consistent with the strategic plan. If the carrying amount exceedsthe sum of the undiscounted future cash flows, the Company discounts the future cash flows using a discount rate required for a similar investment of like riskand records an impairment charge as the difference between the fair value and the carrying value of the asset group. Generally, the Company performs itstesting of the asset group at the product-line level, as this is the lowest level for which identifiable cash flows are available.
Product Liability Reserves
The Company has a self-insurance program for product liability that includes reserves for self-retained losses and certain excess and aggregate risk transferinsurance. The Company uses historical loss experience combined with
- 31 -
Table of Contents
actuarial evaluation methods, review of significant individual files and the application of risk transfer programs in determining required product liabilityreserves. The Company’s actuarial evaluation methods take into account claims incurred but not reported when determining the Company’s product liabilityreserve. The Company has product liability reserves of $30.6 million as of December 31, 2006. While the Company believes that it has adequately reservedfor these claims, the ultimate outcome of these matters may exceed the amounts recorded by the Company and such additional losses may be material to theCompany’s Consolidated Financial Statements.
Legal and Environmental Reserves
The Company is subject to losses resulting from extensive and evolving federal, state, local and foreign laws and regulations, as well as contract and otherdisputes. The Company evaluates the potential legal and environmental losses relating to each specific case and determines the probable loss based onhistorical experience and estimates of cash flows for certain environmental matters. The estimated losses take into account anticipated costs associated withinvestigative and remediation efforts where an assessment has indicated that a probable liability has been incurred and the cost can be reasonably estimated.No insurance recovery is taken into account in determining the Company’s cost estimates or reserve, nor do the Company’s cost estimates or reserve reflectany discounting for present value purposes, except with respect to long-term operations and maintenance CERCLA matters which are estimated at presentvalue. The Company’s estimate of environmental response costs associated with these matters as of December 31, 2006 ranged between $15.9 million and$35.6 million. As of December 31, 2006, the Company had a reserve of $19.8 million for such environmental response costs in the aggregate, which isincluded in other accrued liabilities and other noncurrent liabilities in the Consolidated Balance Sheets.
Income Tax Contingencies
The Company establishes a tax contingency reserve for certain tax exposures when it is not probable that the Company’s tax position will be ultimatelysustained. The Company eliminates a tax contingency reserve balance when it becomes probable that the Company’s tax position will ultimately be sustained,which generally occurs when the statute of limitations for a specific exposure item has expired or when the Company has reached agreement with the taxingauthorities on the treatment of an item. The Company generally assesses its tax contingency reserves on a quarterly basis. Management cannot determine withcertainty the ultimate resolution of these tax matters. Actual results may differ from the recorded amounts.
Stock Options
Effective January 1, 2006, the Company adopted the provisions of SFAS 123(R), using the modified prospective method and therefore has not restated resultsfor prior periods. Under this transition method, stock-based compensation expense for 2006 includes compensation expense for all stock-based compensationawards granted prior to, but not yet vested as of January 1, 2006, based on the grant date fair value estimated in accordance with the original provisions ofSFAS No. 123, “Accounting for Stock-Based Compensation.” Stock-based compensation expense for all awards granted after December 31, 2005 is based onthe grant-date fair value estimated in accordance with the provisions of SFAS 123(R). The Company recognizes stock-based compensation expense on astraight-line basis over the requisite service period of the award, which is generally five years for stock options and three years for restricted stock. Prior tothe adoption of SFAS 123(R), the Company recognized stock-based compensation expense by applying the intrinsic value method in accordance withAccounting Principles Board Opinion No. 25, “Accounting for Stock Issued to Employees.”
Determining the appropriate fair value model and calculating the fair value of share-based payment awards require the input of highly subjective assumptions,including the expected life of the share-based payment awards and stock price volatility. The assumptions used in calculating the fair value of share-basedpayment awards represent management’s best estimates, but these estimates involve inherent uncertainties and the application of management judgment. As aresult, if factors change and we use different assumptions, our stock-based compensation expense could be materially different in the future. In addition, weare required to estimate the expected pre-vesting forfeiture rate and only recognize expense for those shares expected to vest. If our actual pre-vestingforfeiture rate is materially different from our estimate, the stock-based compensation expense could be significantly different from our estimates. SeeFootnote 15 of the Notes to the Consolidated Financial Statements for a further discussion of stock-based compensation.
- 32 -
Table of Contents
New Accounting Pronouncements
In June 2006, the FASB issued Interpretation 48 (“FIN 48”), “Accounting for Uncertainty in Income Taxes”, an interpretation of FASB Statement No. 109,Accounting for Income Taxes. FIN 48 clarifies the accounting for uncertainty in income taxes recognized in an enterprise’s financial statements in accordancewith FASB Statement No. 109, by defining a criterion that an individual tax position must meet for any part of the benefit of that position to be recognized inan enterprise’s financial statements. The interpretation would require a review of all tax positions accounted for in accordance with FASB Statement No. 109and apply a more-likely-than-not recognition threshold. A tax position that meets the more-likely-than-not recognition threshold is initially and subsequentlymeasured as the largest amount of tax benefit that is greater than 50 percent likely to be realized upon ultimate settlement with a taxing authority that has fullknowledge of all relevant information. Subsequent recognition, derecognition, and measurement is based on management’s best judgment given the facts,circumstances and information available at the reporting date. The guidance is effective for fiscal years beginning after December 15, 2006, which theCompany intends to adopt on January 1, 2007. The Company does not believe the new Interpretation will have a material effect on its financial position orresults of operations, however, adoption may result in the reclassification of certain income tax liabilities in our consolidated balance sheet and an immaterialadjustment to the balance of retained earnings.
In September 2006, the FASB issued SFAS No. 157, “Fair Value Measurements” (“SFAS 157”). SFAS 157 defines fair value, establishes a framework formeasuring fair value under generally accepted accounting principles, and expands disclosures about fair value measurements. SFAS 157 emphasizes that fairvalue is a market-based measurement, not an entity-specific measurement, and states that a fair value measurement should be determined based on theassumptions that market participants would use in pricing the asset or liability. This Statement applies under other accounting pronouncements that require orpermit fair value measurements, the FASB having previously concluded in those accounting pronouncements that fair value is the relevant measurementattribute. Accordingly, this Statement does not require any new fair value measurements. SFAS 157 is effective for fiscal years beginning after November 15,2007, and the Company intends to adopt the standard on January 1, 2008. The Company is currently evaluating the impact, if any, that SFAS 157 will have onits financial position, results of operations and cash flows, but does not believe the effect will be material.
In September 2006, the FASB issued SFAS No. 158, “Employers’ Accounting for Defined Benefit Pension and Other Postretirement Plans—an amendmentof FASB Statements No. 87, 88, 106, and 132(R)” (“SFAS 158”). SFAS 158 requires an employer to recognize the over-funded or under-funded status of adefined benefit postretirement plan (other than a multiemployer plan) as an asset or liability in its statement of financial position and to recognize changes inthat funded status in the year in which the changes occur through comprehensive income. SFAS 158 also requires the measurement of defined benefit planassets and obligations as of the date of the employer’s fiscal year-end statement of financial position beginning with years ending after December 15, 2008(with limited exceptions). Effective December 31, 2006, the Company recognized the funded status of its defined benefit postretirement plan and provided therequired disclosures as a result of the adoption of SFAS 158. The effect of adoption of SFAS 158 on the Company’s financial condition at December 31, 2006has been included in the accompanying consolidated financial statements. See Footnote 13 of the Notes to the Consolidated Financial Statements foradditional information. The Company currently measures defined benefit plan assets and liabilities for the majority of its plans on September 30th and expectsto adopt the measurement date provisions of SFAS 158 in 2008.
International Operations
For the years ended December 31, 2006, 2005 and 2004, the Company’s non-U.S. businesses accounted for approximately 26%, 24% and 24% of net sales,respectively (see Footnote 19 of the Notes to the Consolidated Financial Statements). Changes in both U.S. and non-U.S. net sales are shown below for theyears ended December 31, (in millions, except percentages):
- 33 -
Table of Contents
2006 vs. 2005 vs. 2005 % 2004 % 2006 2005 2004 Change Change
U.S. $4,603.4 $4,338.5 $4,365.6 6.1% (0.6)%Non-U.S 1,597.6 1,378.7 1,341.5 15.9 2.8
$6,201.0 $5,717.2 $5,707.1 8.5% 0.2%
Forward-Looking Statements
Forward-looking statements in this Report are made in reliance upon the safe harbor provisions of the Private Securities Litigation Reform Act of 1995. Suchforward-looking statements may relate to, but are not limited to, information or assumptions about the effects of Project Acceleration, sales, income/(loss),earnings per share, operating income or gross margin improvements, return on equity, return on invested capital, capital expenditures, working capital, cashflow, dividends, capital structure, debt to capitalization ratios, interest rates, internal growth rates, restructuring, impairment and other charges, potentiallosses on divestitures, impact of changes in accounting standards, pending legal proceedings and claims (including environmental matters), future economicperformance, costs and cost savings (including raw material inflation, productivity and streamlining), synergies, management’s plans, goals and objectives forfuture operations, performance and growth or the assumptions relating to any of the forward-looking statements. These statements generally are accompaniedby words such as “intend,” “anticipate,” “believe,” “estimate,” “project,” “target,” “plan,” “expect,” “will,” “should” or similar statements. The Companycautions that forward-looking statements are not guarantees because there are inherent difficulties in predicting future results. Actual results could differmaterially from those expressed or implied in the forward-looking statements. Factors that could cause actual results to differ include, but are not limited to,those matters set forth in this Report generally and Item 1A this Report.
ITEM 7A. QUANTITATIVE AND QUALITATIVE DISCLOSURES ABOUT MARKET RISK
Market Risk
The Company’s market risk is impacted by changes in interest rates, foreign currency exchange rates and certain commodity prices. Pursuant to theCompany’s policies, natural hedging techniques and derivative financial instruments may be utilized to reduce the impact of adverse changes in market prices.The Company does not hold or issue derivative instruments for trading purposes.
The Company manages interest rate exposure through its conservative debt ratio target and its mix of fixed and floating rate debt. Interest rate swaps may beused to adjust interest rate exposures when appropriate based on market conditions, and, for qualifying hedges, the interest differential of swaps is included ininterest expense.
The Company’s foreign exchange risk management policy emphasizes hedging anticipated intercompany and third party commercial transaction exposures ofone-year duration or less. The Company focuses on natural hedging techniques of the following form: 1) offsetting or netting of like foreign currency flows,2) structuring foreign subsidiary balance sheets with appropriate levels of debt to reduce subsidiary net investments and subsidiary cash flows subject toconversion risk, 3) converting excess foreign currency deposits into U.S. dollars or the relevant functional currency and 4) avoidance of risk by denominatingcontracts in the appropriate functional currency. In addition, the Company utilizes forward contracts and purchased options to hedge commercial andintercompany transactions. Gains and losses related to qualifying hedges of commercial and intercompany transactions are deferred and included in the basisof the underlying transactions. Derivatives used to hedge intercompany loans are marked to market with the corresponding gains or losses included in theCompany’s Consolidated Statements of Operations.
The Company purchases certain raw materials, including resin, corrugate, steel, stainless steel, aluminum and other metals, which are subject to pricevolatility caused by unpredictable factors. While future movements of raw material costs are uncertain, a variety of programs, including periodic raw materialpurchases, purchases of raw materials for future delivery and customer price adjustments help the Company address this risk. Where practical, the Companyuses derivatives as part of its risk management process. During 2006, the Company experienced raw material inflation, which was more than offset by pricingincreases, favorable mix and productivity.
The amounts shown below represent the estimated potential economic loss that the Company could incur from adverse changes in either interest rates orforeign exchange rates using the value-at-risk estimation model. The value-at-risk model uses historical foreign exchange rates and interest rates to estimatethe volatility and correlation
- 34 -
Table of Contents
of these rates in future periods. It estimates a loss in fair market value using statistical modeling techniques that are based on a variance/covariance approachand includes substantially all market risk exposures (specifically excluding equity-method investments). The fair value losses shown in the table below haveno impact on results of operations or financial condition, but are shown as an illustration of the impact of potential adverse changes in interest and foreigncurrency exchange rates. The following table indicates the calculated amounts for each of the years ended December 31, 2006 and 2005 (in millions, exceptpercentages): 2006 December 31, 2005 December 31, ConfidenceMarket Risk Average 2006 Average 2005 Level
Interest rates $8.0 $7.5 $9.5 $8.1 95%Foreign exchange $5.0 $3.5 $3.1 $5.6 95%
The 95% confidence interval signifies the Company’s degree of confidence that actual losses would not exceed the estimated losses shown above. Theamounts shown here disregard the possibility that interest rates and foreign currency exchange rates could move in the Company’s favor. The value-at-riskmodel assumes that all movements in these rates will be adverse. Actual experience has shown that gains and losses tend to offset each other over time, and itis highly unlikely that the Company could experience losses such as these over an extended period of time. These amounts should not be consideredprojections of future losses, because actual results may differ significantly depending upon activity in the global financial markets.
ITEM 8. FINANCIAL STATEMENTS AND SUPPLEMENTARY DATA
MANAGEMENT’S RESPONSIBILITY FOR FINANCIAL STATEMENTS AND ANNUAL REPORT ON INTERNAL CONTROL OVERFINANCIAL REPORTING
The management of Newell Rubbermaid Inc. is responsible for the accuracy and internal consistency of the preparation of the consolidated financialstatements and footnotes contained in this annual report.
The Company’s management is also responsible for establishing and maintaining adequate internal control over financial reporting. Newell Rubbermaid Inc.operates under a system of internal accounting controls designed to provide reasonable assurance regarding the reliability of financial reporting and thepreparation of published financial statements in accordance with generally accepted accounting principles. The internal accounting control system isevaluated for effectiveness by management and is tested, monitored and revised as necessary. All internal control systems, no matter how well designed, haveinherent limitations. Therefore, even those systems determined to be effective can provide only reasonable assurance with respect to financial statementpreparation and presentation.
The Company’s management assessed the effectiveness of the Company’s internal control over financial reporting as of December 31, 2006. In making itsassessment, the Company’s management used the criteria set forth by the Committee of Sponsoring Organizations of the Treadway Commission (COSO) inInternal Control—Integrated Framework. Based on the results of its evaluation, the Company’s management concluded that, as of December 31, 2006, theCompany’s internal control over financial reporting is effective based on those criteria.
The Company’s independent auditors, Ernst & Young LLP, have audited the financial statements prepared by the management of Newell Rubbermaid Inc. andmanagement’s assessment of internal control over financial reporting. Their reports on these financial statements, and on management’s assessment of internalcontrol over financial reporting, are presented below.
NEWELL RUBBERMAID INC.
Atlanta, GeorgiaFebruary 27, 2007
- 35 -
Table of Contents
Report of Independent Registered Public Accounting Firm
The Board of Directors and StockholdersNewell Rubbermaid Inc.
We have audited the accompanying consolidated balance sheets of Newell Rubbermaid Inc. as of December 31, 2006 and 2005, and the related consolidatedstatements of operations, stockholders’ equity, and cash flows for each of the three years in the period ended December 31, 2006. Our audits also included thefinancial statement schedule listed in the Index at Item 15(a). These financial statements and schedule are the responsibility of the Company’s management.Our responsibility is to express an opinion on these financial statements and schedule based on our audits.
We conducted our audits in accordance with the standards of the Public Company Accounting Oversight Board (United States). Those standards require thatwe plan and perform the audit to obtain reasonable assurance about whether the financial statements are free of material misstatement. An audit includesexamining, on a test basis, evidence supporting the amounts and disclosures in the financial statements. An audit also includes assessing the accountingprinciples used and significant estimates made by management, as well as evaluating the overall financial statement presentation. We believe that our auditsprovide a reasonable basis for our opinion.
In our opinion, the financial statements referred to above present fairly, in all material respects, the consolidated financial position of Newell Rubbermaid Inc.at December 31, 2006 and 2005, and the consolidated results of its operations and its cash flows for each of the three years in the period ended December 31,2006, in conformity with U.S. generally accepted accounting principles. Also, in our opinion, the related financial statement schedule, when considered inrelation to the basic financial statements taken as a whole, presents fairly in all material respects the information set forth therein.
As discussed in Footnotes 1 and 15, on January 1, 2006 the Company adopted the provisions of Statement of Financial Accounting Standards No. 123(R),Share Based Payment, and changed its method of accounting for share-based payments using the modified prospective transition method. Also, as discussedin Footnote 13, on December 31, 2006 the Company adopted the provisions of Statement of Financial Accounting Standards No. 158, Employers’Accounting for Defined Benefit Pension and Other Postretirement Plans, and changed its method of recognizing the funded status of its defined benefitpostretirement plans.
We also have audited, in accordance with the standards of the Public Company Accounting Oversight Board (United States), the effectiveness of NewellRubbermaid Inc.’s internal control over financial reporting as of December 31, 2006, based on criteria established in Internal Control—Integrated Frameworkissued by the Committee of Sponsoring Organizations of the Treadway Commission and our report dated February 27, 2007 expressed an unqualified opinionthereon.
/s/ Ernst & Young LLP
Chicago, IllinoisFebruary 27, 2007
- 36 -
Table of Contents
Report of Independent Registered Public Accounting Firmon Management’s Report on Internal Control over Financial Reporting
The Board of Directors and StockholdersNewell Rubbermaid Inc.
We have audited management’s assessment, included in the accompanying Management’s Responsibility for Financial Statements and Annual Report onInternal Control Over Financial Reporting, that Newell Rubbermaid Inc. maintained effective internal control over financial reporting as of December 31,2006, based on criteria established in Internal Control—Integrated Framework issued by the Committee of Sponsoring Organizations of the TreadwayCommission (the COSO criteria). Newell Rubbermaid Inc.’s management is responsible for maintaining effective internal control over financial reporting andfor its assessment of the effectiveness of internal control over financial reporting. Our responsibility is to express an opinion on management’s assessment andan opinion on the effectiveness of the company’s internal control over financial reporting based on our audit.
We conducted our audit in accordance with the standards of the Public Company Accounting Oversight Board (United States). Those standards require thatwe plan and perform the audit to obtain reasonable assurance about whether effective internal control over financial reporting was maintained in all materialrespects. Our audit included obtaining an understanding of internal control over financial reporting, evaluating management’s assessment, testing andevaluating the design and operating effectiveness of internal control, and performing such other procedures as we considered necessary in the circumstances.We believe that our audit provides a reasonable basis for our opinion.
A company’s internal control over financial reporting is a process designed to provide reasonable assurance regarding the reliability of financial reporting andthe preparation of financial statements for external purposes in accordance with generally accepted accounting principles. A company’s internal control overfinancial reporting includes those policies and procedures that (1) pertain to the maintenance of records that, in reasonable detail, accurately and fairly reflectthe transactions and dispositions of the assets of the company; (2) provide reasonable assurance that transactions are recorded as necessary to permitpreparation of financial statements in accordance with generally accepted accounting principles, and that receipts and expenditures of the company are beingmade only in accordance with authorizations of management and directors of the company; and (3) provide reasonable assurance regarding prevention ortimely detection of unauthorized acquisition, use, or disposition of the company’s assets that could have a material effect on the financial statements.
Because of its inherent limitations, internal control over financial reporting may not prevent or detect misstatements. Also, projections of any evaluation ofeffectiveness to future periods are subject to the risk that controls may become inadequate because of changes in conditions, or that the degree of compliancewith the policies or procedures may deteriorate.
In our opinion, management’s assessment that Newell Rubbermaid Inc. maintained effective internal control over financial reporting as of December 31,2006, is fairly stated, in all material respects, based on the COSO criteria. Also, in our opinion, Newell Rubbermaid Inc. maintained, in all material respects,effective internal control over financial reporting as of December 31, 2006, based on the COSO criteria.
We also have audited, in accordance with the standards of the Public Company Accounting Oversight Board (United States), the consolidated balance sheetsof Newell Rubbermaid Inc. as of December 31, 2006 and 2005, and the related consolidated statements of operations, stockholders’ equity, and cash flows foreach of the three years in the period ended December 31, 2006 of Newell Rubbermaid Inc. and our report dated February 27, 2007 expressed an unqualifiedopinion thereon. /s/ Ernst & Young LLP
Chicago, IllinoisFebruary 27, 2007
- 37 -
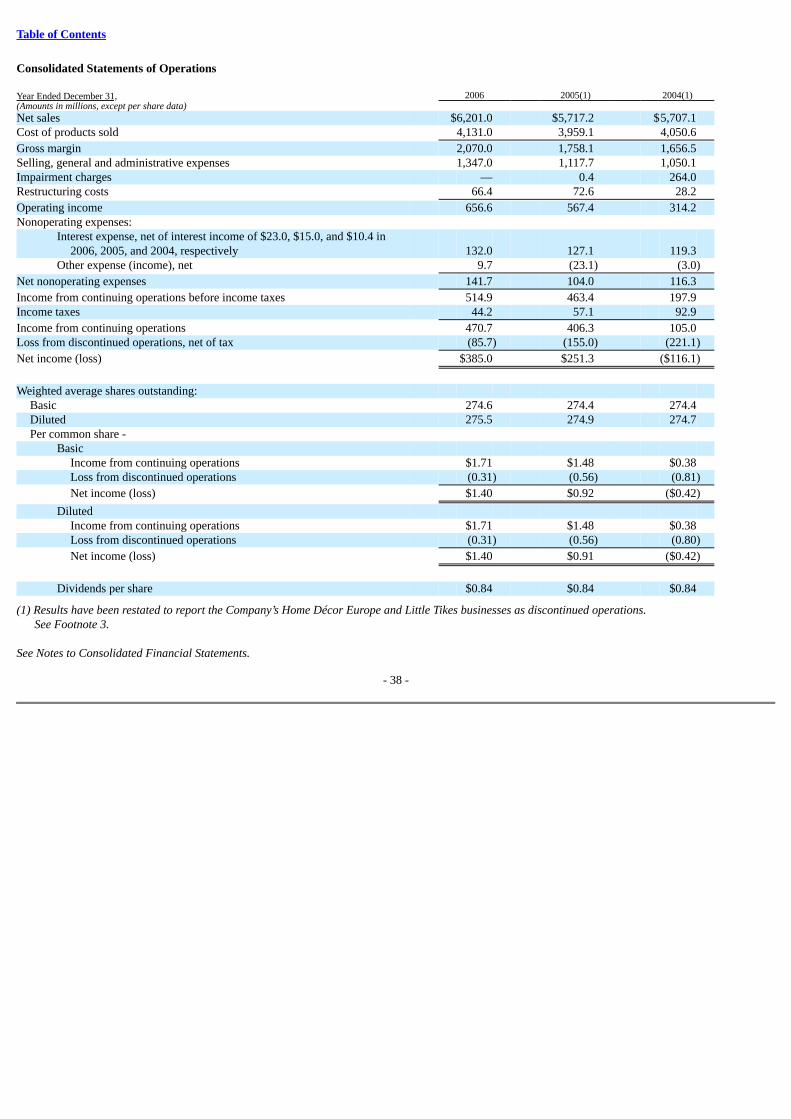
Table of Contents
Consolidated Statements of Operations Year Ended December 31, 2006 2005(1) 2004(1)(Amounts in millions, except per share data) Net sales $6,201.0 $5,717.2 $5,707.1 Cost of products sold 4,131.0 3,959.1 4,050.6
Gross margin 2,070.0 1,758.1 1,656.5 Selling, general and administrative expenses 1,347.0 1,117.7 1,050.1 Impairment charges — 0.4 264.0 Restructuring costs 66.4 72.6 28.2
Operating income 656.6 567.4 314.2 Nonoperating expenses:
Interest expense, net of interest income of $23.0, $15.0, and $10.4 in2006, 2005, and 2004, respectively 132.0 127.1 119.3
Other expense (income), net 9.7 (23.1) (3.0)
Net nonoperating expenses 141.7 104.0 116.3
Income from continuing operations before income taxes 514.9 463.4 197.9 Income taxes 44.2 57.1 92.9
Income from continuing operations 470.7 406.3 105.0 Loss from discontinued operations, net of tax (85.7) (155.0) (221.1)
Net income (loss) $385.0 $251.3 ($116.1)
Weighted average shares outstanding:
Basic 274.6 274.4 274.4 Diluted 275.5 274.9 274.7 Per common share -
Basic Income from continuing operations $1.71 $1.48 $0.38 Loss from discontinued operations (0.31) (0.56) (0.81)
Net income (loss) $1.40 $0.92 ($0.42)
Diluted Income from continuing operations $1.71 $1.48 $0.38 Loss from discontinued operations (0.31) (0.56) (0.80)
Net income (loss) $1.40 $0.91 ($0.42)
Dividends per share $0.84 $0.84 $0.84
(1) Results have been restated to report the Company’s Home Décor Europe and Little Tikes businesses as discontinued operations. See Footnote 3.
See Notes to Consolidated Financial Statements.
- 38 -
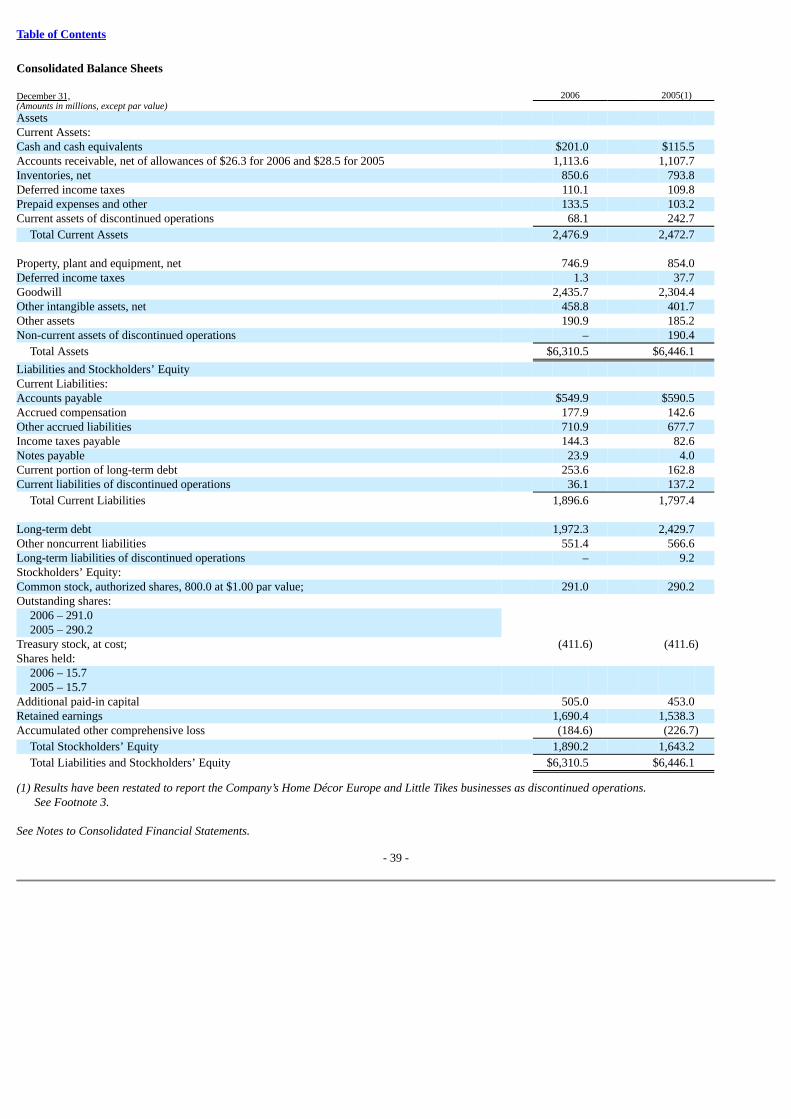
Table of Contents
Consolidated Balance Sheets December 31, 2006 2005(1)(Amounts in millions, except par value) Assets Current Assets: Cash and cash equivalents $201.0 $115.5 Accounts receivable, net of allowances of $26.3 for 2006 and $28.5 for 2005 1,113.6 1,107.7 Inventories, net 850.6 793.8 Deferred income taxes 110.1 109.8 Prepaid expenses and other 133.5 103.2 Current assets of discontinued operations 68.1 242.7
Total Current Assets 2,476.9 2,472.7 Property, plant and equipment, net 746.9 854.0 Deferred income taxes 1.3 37.7 Goodwill 2,435.7 2,304.4 Other intangible assets, net 458.8 401.7 Other assets 190.9 185.2 Non-current assets of discontinued operations – 190.4
Total Assets $6,310.5 $6,446.1
Liabilities and Stockholders’ Equity Current Liabilities: Accounts payable $549.9 $590.5 Accrued compensation 177.9 142.6 Other accrued liabilities 710.9 677.7 Income taxes payable 144.3 82.6 Notes payable 23.9 4.0 Current portion of long-term debt 253.6 162.8 Current liabilities of discontinued operations 36.1 137.2
Total Current Liabilities 1,896.6 1,797.4 Long-term debt 1,972.3 2,429.7 Other noncurrent liabilities 551.4 566.6 Long-term liabilities of discontinued operations – 9.2 Stockholders’ Equity: Common stock, authorized shares, 800.0 at $1.00 par value; 291.0 290.2 Outstanding shares:
2006 – 291.02005 – 290.2
Treasury stock, at cost; (411.6) (411.6)Shares held:
2006 – 15.72005 – 15.7
Additional paid-in capital 505.0 453.0 Retained earnings 1,690.4 1,538.3 Accumulated other comprehensive loss (184.6) (226.7)
Total Stockholders’ Equity 1,890.2 1,643.2
Total Liabilities and Stockholders’ Equity $6,310.5 $6,446.1
(1) Results have been restated to report the Company’s Home Décor Europe and Little Tikes businesses as discontinued operations. See Footnote 3.
See Notes to Consolidated Financial Statements.
- 39 -
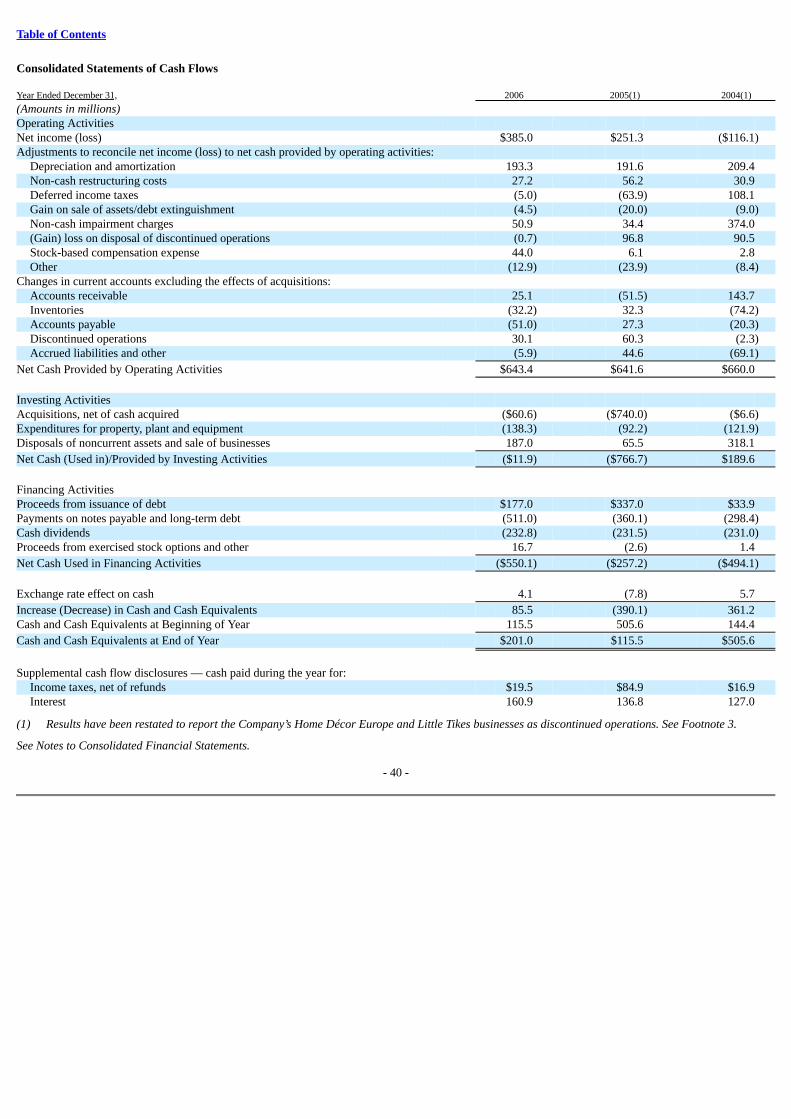
Table of Contents
Consolidated Statements of Cash Flows Year Ended December 31, 2006 2005(1) 2004(1)
(Amounts in millions) Operating Activities Net income (loss) $385.0 $251.3 ($116.1)Adjustments to reconcile net income (loss) to net cash provided by operating activities:
Depreciation and amortization 193.3 191.6 209.4 Non-cash restructuring costs 27.2 56.2 30.9 Deferred income taxes (5.0) (63.9) 108.1 Gain on sale of assets/debt extinguishment (4.5) (20.0) (9.0)Non-cash impairment charges 50.9 34.4 374.0 (Gain) loss on disposal of discontinued operations (0.7) 96.8 90.5 Stock-based compensation expense 44.0 6.1 2.8 Other (12.9) (23.9) (8.4)
Changes in current accounts excluding the effects of acquisitions: Accounts receivable 25.1 (51.5) 143.7 Inventories (32.2) 32.3 (74.2)Accounts payable (51.0) 27.3 (20.3)Discontinued operations 30.1 60.3 (2.3)Accrued liabilities and other (5.9) 44.6 (69.1)
Net Cash Provided by Operating Activities $643.4 $641.6 $660.0
Investing Activities Acquisitions, net of cash acquired ($60.6) ($740.0) ($6.6)Expenditures for property, plant and equipment (138.3) (92.2) (121.9)Disposals of noncurrent assets and sale of businesses 187.0 65.5 318.1
Net Cash (Used in)/Provided by Investing Activities ($11.9) ($766.7) $189.6
Financing Activities Proceeds from issuance of debt $177.0 $337.0 $33.9 Payments on notes payable and long-term debt (511.0) (360.1) (298.4)Cash dividends (232.8) (231.5) (231.0)Proceeds from exercised stock options and other 16.7 (2.6) 1.4
Net Cash Used in Financing Activities ($550.1) ($257.2) ($494.1)
Exchange rate effect on cash 4.1 (7.8) 5.7
Increase (Decrease) in Cash and Cash Equivalents 85.5 (390.1) 361.2 Cash and Cash Equivalents at Beginning of Year 115.5 505.6 144.4
Cash and Cash Equivalents at End of Year $201.0 $115.5 $505.6
Supplemental cash flow disclosures — cash paid during the year for:
Income taxes, net of refunds $19.5 $84.9 $16.9 Interest 160.9 136.8 127.0
(1) Results have been restated to report the Company’s Home Décor Europe and Little Tikes businesses as discontinued operations. See Footnote 3.
See Notes to Consolidated Financial Statements.
- 40 -
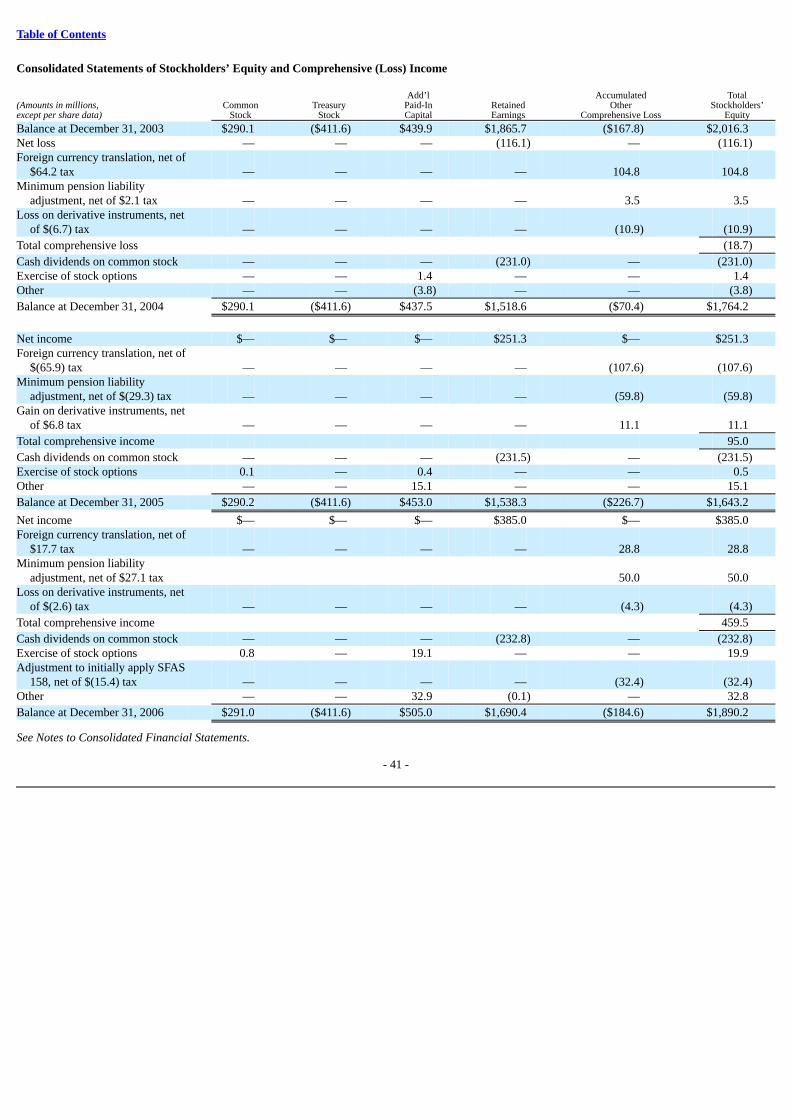
Table of Contents
Consolidated Statements of Stockholders’ Equity and Comprehensive (Loss) Income Add’l Accumulated Total(Amounts in millions, Common Treasury Paid-In Retained Other Stockholders’except per share data) Stock Stock Capital Earnings Comprehensive Loss Equity
Balance at December 31, 2003 $290.1 ($411.6) $439.9 $1,865.7 ($167.8) $2,016.3 Net loss — — — (116.1) — (116.1)Foreign currency translation, net of
$64.2 tax — — — — 104.8 104.8 Minimum pension liability
adjustment, net of $2.1 tax — — — — 3.5 3.5 Loss on derivative instruments, net
of $(6.7) tax — — — — (10.9) (10.9)
Total comprehensive loss (18.7)
Cash dividends on common stock — — — (231.0) — (231.0)Exercise of stock options — — 1.4 — — 1.4 Other — — (3.8) — — (3.8)
Balance at December 31, 2004 $290.1 ($411.6) $437.5 $1,518.6 ($70.4) $1,764.2
Net income $— $— $— $251.3 $— $251.3 Foreign currency translation, net of
$(65.9) tax — — — — (107.6) (107.6)Minimum pension liability
adjustment, net of $(29.3) tax — — — — (59.8) (59.8)Gain on derivative instruments, net
of $6.8 tax — — — — 11.1 11.1
Total comprehensive income 95.0
Cash dividends on common stock — — — (231.5) — (231.5)Exercise of stock options 0.1 — 0.4 — — 0.5 Other — — 15.1 — — 15.1
Balance at December 31, 2005 $290.2 ($411.6) $453.0 $1,538.3 ($226.7) $1,643.2
Net income $— $— $— $385.0 $— $385.0 Foreign currency translation, net of
$17.7 tax — — — — 28.8 28.8 Minimum pension liability
adjustment, net of $27.1 tax 50.0 50.0 Loss on derivative instruments, net
of $(2.6) tax — — — — (4.3) (4.3)
Total comprehensive income 459.5
Cash dividends on common stock — — — (232.8) — (232.8)Exercise of stock options 0.8 — 19.1 — — 19.9 Adjustment to initially apply SFAS
158, net of $(15.4) tax — — — — (32.4) (32.4)Other — — 32.9 (0.1) — 32.8
Balance at December 31, 2006 $291.0 ($411.6) $505.0 $1,690.4 ($184.6) $1,890.2
See Notes to Consolidated Financial Statements.
- 41 -
Table of Contents
NOTES TO CONSOLIDATED FINANCIAL STATEMENTS
FOOTNOTE 1
Description of Business and Significant Accounting Policies
Description of Business: Newell Rubbermaid is a global marketer of consumer and commercial products that touch the lives of people where they work, liveand play. The Company’s strong portfolio of brands includes Sharpie®, Paper Mate®, DYMO®, EXPO®, Waterman®, Parker®, Rolodex®, IRWIN®,LENOX®, BernzOmatic®, Rubbermaid®, Levolor®, Graco®, Calphalon® and Goody®. The Company’s multi-product offering consists of well known name-brand consumer and commercial products in four business segments: Cleaning, Organization & Décor; Office Products; Tools & Hardware; and Home &Family.
Principles of Consolidation: The Consolidated Financial Statements include the accounts of the Company, its majority owned subsidiaries and variableinterest entities where the Company is the primary beneficiary, after elimination of intercompany transactions.
Use of Estimates: The preparation of these financial statements requires the use of certain estimates by management in determining the Company’s assets,liabilities, revenue and expenses and related disclosures. Actual results could differ from those estimates.
Reclassifications: Certain 2005 and 2004 amounts have been reclassified to conform to the 2006 presentation. See Footnote 3 for a discussion ofdiscontinued operations.
Concentration of Credit Risk: The Company sells products to customers in diversified industries and geographic regions and, therefore, has no significantconcentrations of credit risk. The Company continuously evaluates the creditworthiness of its customers and generally does not require collateral.
The Company evaluates the collectibility of accounts receivable based on a combination of factors. When aware of a specific customer’s inability to meet itsfinancial obligations, such as in the case of bankruptcy filings or deterioration in the customer’s operating results or financial position, the Company records aspecific reserve for bad debt to reduce the related receivable to the amount the Company reasonably believes is collectible. The Company also recordsreserves for bad debt for all other customers based on a variety of factors, including the length of time the receivables are past due and historical collectionexperience. Accounts are reviewed for potential write-off on a on a case by case basis. Accounts deemed uncollectible are written off, net of expectedrecoveries. If circumstances related to specific customers change, the Company’s estimates of the recoverability of receivables could be further adjusted.
The Company’s forward exchange contracts, long-term cross currency interest rate swaps, and option contracts do not subject the Company to risk due toforeign exchange rate movement, because gains and losses on these instruments generally offset gains and losses on the assets, liabilities, and othertransactions being hedged. The Company is exposed to credit-related losses in the event of non-performance by counterparties to certain derivative financialinstruments. The Company does not obtain collateral or other security to support derivative financial instruments subject to credit risk, but monitors the creditstanding of the counterparties.
The credit exposure that results from commodity, interest rate, and foreign exchange is the fair value of contracts with a positive fair value as of the reportingdate. There is no credit exposure on the Company’s interest rate derivatives at December 31, 2006. The credit exposure on foreign currency derivatives atDecember 31, 2006 was $7.8 million.
Sales Recognition: Sales of merchandise and freight billed to customers are recognized when title passes and all substantial risks of ownership change, whichgenerally occurs either upon shipment or upon delivery based upon contractual terms. Sales are net of provisions for cash discounts, returns, customerdiscounts (such as volume or trade discounts), cooperative advertising and other sales related discounts.
- 42 -
Table of Contents
Cash and Cash Equivalents: Cash and cash equivalents include cash on-hand and investments that have a maturity of three months or less when purchased.
Inventories: Inventories are stated at the lower of cost or market value using the last-in, first-out (LIFO) or first-in, first-out (FIFO) methods (see Footnote 5for additional information). The Company reduces its inventory value for estimated obsolete and slow moving inventory in an amount equal to the differencebetween the cost of inventory and the net realizable value based upon assumptions about future demand and market conditions. If actual market conditions areless favorable than those projected by management, additional inventory write-downs may be required.
Property, Plant and Equipment: Property, plant, and equipment are stated at cost. Expenditures for maintenance and repairs are expensed as incurred.Depreciation expense is calculated principally on the straight-line basis. Useful lives determined by the Company are as follows: buildings and improvements(20-40 years), and machinery and equipment (3-12 years).
Goodwill and Other Indefinite-Lived Intangible Assets: The Company conducts its annual test of impairment for goodwill and indefinite lived intangibleassets in the third quarter because it coincides with its annual strategic planning process for all of its businesses. The Company also tests for impairment ifevents or circumstances indicate that it is more likely than not that the fair value of a reporting unit or the indefinite lived intangible asset is below its carryingamount.
The Company cannot predict the occurrence of certain events that might adversely affect the reported value of goodwill and other intangible assets. Suchevents may include, but are not limited to, strategic decisions made in response to economic and competitive conditions, the impact of the economicenvironment on the Company’s customer base, or a material adverse change in its relationships with significant customers.
The Company assesses the fair value of its reporting units for its goodwill and other indefinite lived intangible assets (primarily trademarks and tradenames)in its impairment tests generally based upon a discounted cash flow methodology. The discounted cash flows are estimated utilizing various assumptionsregarding future revenue and expenses, working capital, terminal value, and market discount rates. The underlying assumptions used are consistent with thoseused in the strategic plan.
Goodwill Impairment
The Company evaluates goodwill impairment one level below the reporting segment at the operating segment level (herein referred to as the reporting unit).If the carrying amount of the reporting unit is greater than the fair value, goodwill impairment may be present. The Company measures the goodwillimpairment based upon the fair value of the underlying assets and liabilities of the reporting unit, including any unrecognized intangible assets, and estimatesthe implied fair value of goodwill. An impairment charge is recognized to the extent the recorded goodwill exceeds the implied fair value of goodwill.
Other Indefinite-Lived Intangible Asset Impairment (primarily Trademarks and Tradenames)
If the carrying amount of the intangible asset exceeds its fair value, an impairment charge is recorded to the extent the recorded intangible asset exceeds thefair value.
See Footnotes 7 and 17 for additional detail on goodwill and other intangible assets.
Other Long-Lived Assets: The Company tests its other long-lived assets for impairment in accordance with Statement of Financial Accounting StandardsNo. 144 (“SFAS No. 144”), “Accounting for the Impairment or Disposal of Long-Lived Assets.” The Company evaluates if impairment indicators related toits property, plant and equipment and other long-lived assets are present. These impairment indicators may include a significant decrease in the market priceof a long-lived asset or asset group, a significant adverse change in the extent or manner in which a long-lived asset or asset group is being used or in itsphysical condition, or a current-period operating or cash flow loss combined with a history of operating or cash flow losses or a forecast that demonstratescontinuing losses associated with the use of a long-lived asset or asset group. If impairment indicators are present, the Company
- 43 -
Table of Contents
estimates the future cash flows for the asset or group of assets. The sum of the undiscounted future cash flows attributable to the asset or group of assets iscompared to their carrying amount. The cash flows are estimated utilizing various assumptions regarding future revenue and expenses, working capital, andproceeds from asset disposals on a basis consistent with the strategic plan. If the carrying amount exceeds the sum of the undiscounted future cash flows, theCompany determines the assets’ fair value by discounting the future cash flows using a discount rate required for a similar investment of like risk and recordsan impairment charge as the difference between the fair value and the carrying value of the asset group. Generally, the Company performs its testing of theasset group at the product-line level, as this is the lowest level for which identifiable cash flows are available. See Footnote 17 for additional information.
Shipping and Handling Costs: The Company records shipping and handling costs as a component of costs of products sold.
Product Liability Reserves: The Company has a self-insurance program for product liability that includes reserves for self-retained losses and certain excessand aggregate risk transfer insurance. The Company uses historical loss experience combined with actuarial evaluation methods, review of significantindividual files and the application of risk transfer programs in determining required product liability reserves. The Company’s actuarial evaluation methodstake into account claims incurred but not reported when determining the Company’s product liability reserve. While the Company believes that it hasadequately reserved for these claims, the ultimate outcome of these matters may exceed the amounts recorded by the Company and such additional lossesmay be material to the Company’s Consolidated Financial Statements.
Product Warranties: In the normal course of business, the Company offers warranties for a variety of its products. The specific terms and conditions of thewarranties vary depending upon the specific product and markets in which the products were sold. The Company accrues for the estimated cost of productwarranty at the time of sale based on historical experience.
Advertising Costs: The Company expenses advertising costs as incurred. Cooperative advertising with customers is recorded in the Consolidated FinancialStatements as a component of net sales and totaled $153.3 million, $147.4 million, and $132.3 million for 2006, 2005 and 2004, respectively. All otheradvertising costs are recorded in selling, general and administrative expenses and totaled $199.9 million, $135.6 million and $113.4 million in 2006, 2005 and2004, respectively.
Research and Development Costs: Research and development costs relating to both future and current products are charged to selling, general andadministrative expenses as incurred. These costs aggregated $102.0 million, $92.5 million, and $95.9 million in 2006, 2005 and 2004, respectively.
Derivative Financial Instruments: The Company follows SFAS No. 133, “Accounting for Derivative Instruments and Hedging Activities,” as amended.Derivative financial instruments are used only to manage certain commodity, interest rate and foreign currency risks. These instruments include commodityswaps, interest rate swaps, long-term cross currency interest rate swaps, forward exchange contracts and options. The Company’s forward exchange contracts,options and long-term cross currency interest rate swaps do not subject the Company to risk due to foreign exchange rate movement because gains and losseson these instruments generally offset gains and losses on the assets, liabilities, and other transactions being hedged.
On the date in which the Company enters into a derivative, the derivative is designated as a hedge of the identified exposure. The Company measureseffectiveness of its hedging relationships both at hedge inception and on an ongoing basis.
Interest Rate Risk Management: Gains and losses on interest rate swaps designated as cash flow hedges, to the extent that the hedge relationship has beeneffective, are deferred in other comprehensive income and recognized in interest expense over the period in which the Company recognizes interest expenseon the related debt instrument. Any ineffectiveness on these instruments is immediately recognized in interest expense in the period that the ineffectivenessoccurs.
- 44 -
Table of Contents
The Company also has designated certain interest rate swaps as fair value hedges. The Company has structured existing interest rate swap agreements to be100% effective. These instruments include interest rate swaps, long-term cross currency interest rate swaps and forward exchange contracts. Gains or lossesresulting from the early termination of interest rate swaps are deferred as an increase or decrease to the carrying value of the related debt and amortized as anadjustment to the yield of the related debt instrument over the remaining period originally covered by the swap. The cash received or paid relating to thetermination of interest rate swaps is included in Other as an operating activity in the Consolidated Statements of Cash Flows.
Foreign Currency Management: The Company utilizes forward exchange contracts and options to manage foreign exchange risk related to both known andanticipated intercompany transactions and third-party commercial transaction exposures of approximately one year in duration or less. The effective portionof the changes in fair value of these instruments is reported in other comprehensive income and reclassified into earnings in the same period or periods inwhich the hedged transactions affect earnings. Any ineffective portion is immediately recognized in earnings.
The Company also utilizes long-term cross currency interest rate swaps to hedge long-term intercompany financing transactions. Derivative instruments usedto hedge intercompany financing transactions are marked to market with the corresponding gains or losses included in accumulated other comprehensiveincome.
The fair value of foreign currency hedging instruments is recorded in the captions Prepaid expenses and other, Other assets, Other accrued liabilities or Othernoncurrent liabilities on the Consolidated Balance Sheets depending on the maturity of the Company’s cross currency interest rate swaps and forwardcontracts at December 31, 2006 and 2005. The earnings impact of cash flow hedges relating to forecasted purchases of inventory is generally reported in costof products sold to match the underlying transaction being hedged. For hedged forecasted transactions, hedge accounting is discontinued if the forecastedtransaction is no longer probable of occurring, in which case previously deferred hedging gains or losses would be recorded to earnings immediately.
Disclosures about Fair Value of Financial Instruments: The Company’s financial instruments include cash and cash equivalents, accounts receivable, notespayable and short and long-term debt. The fair value of these instruments approximates carrying values due to their short-term duration, except as follows:
Qualifying Derivative Instruments: The fair value of the Company’s qualifying derivative instruments is recorded in the Consolidated Balance Sheets and isdescribed in more detail in Footnote 11.
Long-term Debt: The fair values of the Company’s long-term debt issued under the medium-term note program and the junior convertible subordinateddebentures are based on quoted market prices and are as follows as of December 31, (in millions): 2006 2005
Medium-term note program $1,321.7 $1,473.6 Junior convertible subordinated debentures $398.1 $345.4
All other significant long-term debt is pursuant to floating rate instruments whose carrying amounts approximate fair value.
Foreign Currency Translation: Assets and liabilities of foreign subsidiaries are translated into U.S. dollars at the rates of exchange in effect at year-end. Therelated translation adjustments are made directly to accumulated other comprehensive income. Income and expenses are translated at the average monthlyrates of exchange in effect during the year. Gains and losses from foreign currency transactions of these subsidiaries are included in net income. Internationalsubsidiaries operating in highly inflationary economies translate nonmonetary assets at historical rates, while net monetary assets are translated at currentrates, with the resulting translation adjustment included in net income as other expense (income), net.
Income Tax Contingencies: The Company establishes a tax contingency reserve for certain tax exposures when it is not probable that the Company’s taxposition will be ultimately sustained. The Company eliminates a tax contingency reserve balance when it becomes probable that the Company’s tax positionwill ultimately be sustained,
- 45 -
Table of Contents
which generally occurs when the statute of limitations for a specific exposure item has expired or when the Company has reached agreement with the taxingauthorities on the treatment of an item. The Company generally assesses its tax contingency reserves on a quarterly basis. Management cannot determine withcertainty the ultimate resolution of these tax matters. Actual results may differ from the recorded amounts.
Stock-Based Compensation: Prior to January 1, 2006, the Company recognized stock-based compensation expense by applying the intrinsic value method inaccordance with Accounting Principles Board Opinion No. 25, “Accounting for Stock Issued to Employees” (“APB 25”). Under APB 25, the Companygenerally recognized compensation expense only for restricted stock grants. The Company recognized the compensation expense associated with therestricted stock ratably over the associated service period.
Effective January 1, 2006, the Company adopted the provisions of SFAS No. 123 (revised 2004), “Share-Based Payment” (“SFAS 123(R)”), using themodified prospective transition method, and therefore has not restated the results of prior periods. Under this transition method, stock-based compensationexpense for 2006 includes (i) compensation expense for all stock-based compensation awards granted prior to, but not yet vested as of January 1, 2006, basedon the grant date fair value estimated in accordance with the original provisions of SFAS No. 123, “Accounting for Stock-Based Compensation,” and(ii) compensation expense for all share-based payment awards granted after January 1, 2006 based on estimated grant-date fair values estimated in accordancewith the provision of SFAS 123(R). Compensation expense is adjusted for estimated forfeitures and is recognized on a straight-line basis over the requisiteservice period of the award, which is generally five years for stock options and three years for restricted stock. The Company estimated future forfeiture ratesbased on its historical experience. See Footnote 15 for additional information.
Accumulated Other Comprehensive Loss: The following table displays the components of accumulated other comprehensive loss (in millions): Foreign Unrecognized After-tax Accumulated Currency Pension & Other Derivative Other Translation Postretirement Hedging Comprehensive Gain Costs Gain Loss
Balance at 12/31/05 $12.8 ($246.3) $6.8 ($226.7)Disposal/liquidation of businesses (1.3) — — (1.3)Other current year changes 30.1 17.6 (4.3) 43.4
Balance at 12/31/06 $41.6 ($228.7) $2.5 ($184.6)
Recent Accounting Pronouncements: In June 2006, the Financial Accounting Standards Board (FASB) issued Interpretation 48 (“FIN 48”), “Accountingfor Uncertainty in Income Taxes”, an interpretation of FASB Statement No. 109, Accounting for Income Taxes. FIN 48 clarifies the accounting foruncertainty in income taxes recognized in an enterprise’s financial statements in accordance with FASB Statement No. 109, by defining a criterion that anindividual tax position must meet for any part of the benefit of that position to be recognized in an enterprise’s financial statements. The interpretation wouldrequire a review of all tax positions accounted for in accordance with FASB Statement No. 109 and apply a more-likely-than-not recognition threshold. A taxposition that meets the more-likely-than-not recognition threshold is initially and subsequently measured as the largest amount of tax benefit that is greaterthan 50 percent likely to be realized upon ultimate settlement with a taxing authority that has full knowledge of all relevant information. Subsequentrecognition, derecognition, and measurement is based on management’s best judgment given the facts, circumstances and information available at thereporting date. The guidance is effective for fiscal years beginning after December 15, 2006, and the Company intends to adopt the interpretation onJanuary 1, 2007. The Company does not believe FIN 48 will have a material effect on its financial position or results of operations, however, adoption mayresult in the reclassification of certain income tax liabilities in our consolidated balance sheet and an immaterial adjustment to the balance of retainedearnings.
In September 2006, the FASB issued Statement of Financial Accounting Standards (SFAS) No. 157, “Fair Value Measurements” (“SFAS 157”). SFAS 157defines fair value, establishes a framework for measuring fair value under generally accepted accounting principles, and expands disclosures about fair valuemeasurements. SFAS 157 emphasizes that fair value is a market-based measurement, not an entity-specific measurement, and states that a fair
- 46 -
Table of Contents
value measurement should be determined based on the assumptions that market participants would use in pricing the asset or liability. This Statement appliesunder other accounting pronouncements that require or permit fair value measurements, the FASB having previously concluded in those accountingpronouncements that fair value is the relevant measurement attribute. Accordingly, this Statement does not require any new fair value measurements. SFAS157 is effective for fiscal years beginning after November 15, 2007, and the Company intends to adopt the standard on January 1, 2008. The Company iscurrently evaluating the impact, if any, that SFAS 157 will have on its financial position, results of operations and cash flows, but does not believe the effectwill be material.
FOOTNOTE 2
Acquisition of DYMO
On November 23, 2005, the Company acquired DYMO, a global leader in designing, manufacturing and marketing on-demand labeling solutions, fromEsselte AB. The purchase price of $699.2 million was finalized in 2006, after consideration of certain working capital and other adjustments. The Companyfunded the purchase payment through a combination of available cash of $480.2 million and debt of $219.0 million from pre-existing credit facilities. In 2006,the Company finalized the purchase price allocation of $699.2 million to the identifiable assets and liabilities. The purchase price allocation was based onmanagement’s estimate of fair value using the assistance of third party appraisals at the date of acquisition as follows (in millions): Current assets $33.8 Property, plant & equipment, net 21.5 Goodwill 609.3 Other intangible assets, net 118.9 Other assets 0.2
Total assets $783.7
Current liabilities $38.1 Deferred income taxes 42.9 Other noncurrent liabilities 3.5
Total liabilities $84.5
- 47 -
Table of Contents
The allocation of the purchase price resulted in the recognition of $609.3 million of goodwill primarily related to the anticipated future earnings and cashflows of the DYMO business including the estimated effects of the integration of this business into the Office Products segment. The transaction resulted inthe recognition of $118.9 million in intangible assets consisting primarily of customer lists, patents, and trademarks. Approximately $77.4 million wereindefinite-lived intangible assets related to trademarks and $41.5 million related to finite-lived intangible assets that will be amortized over periods of 3 to10 years with a weighted average amortization period of 5.3 years.
The transaction summarized above was accounted for using the purchase method of accounting and the results of operations are included in the Company’sConsolidated Financial Statements since the acquisition date. The acquisition costs included in the purchase price were allocated to goodwill.
The unaudited consolidated results of operations on a pro forma basis, as though the 2005 acquisition of DYMO had been completed on January 1, 2004, areas follows for the year ended December 31, (in millions, except per share amounts): 2005 2004
Net sales $5,923.2 $5,935.4 Income from continuing operations $417.0 $119.6 Net income (loss) $262.0 ($101.5) Basic earnings (loss) per share
Income from continuing operations $1.52 $0.44 Net income (loss) $0.95 ($0.37)
Diluted earnings (loss) per share
Income from continuing operations $1.52 $0.44 Net income (loss) $0.95 ($0.37)
- 48 -
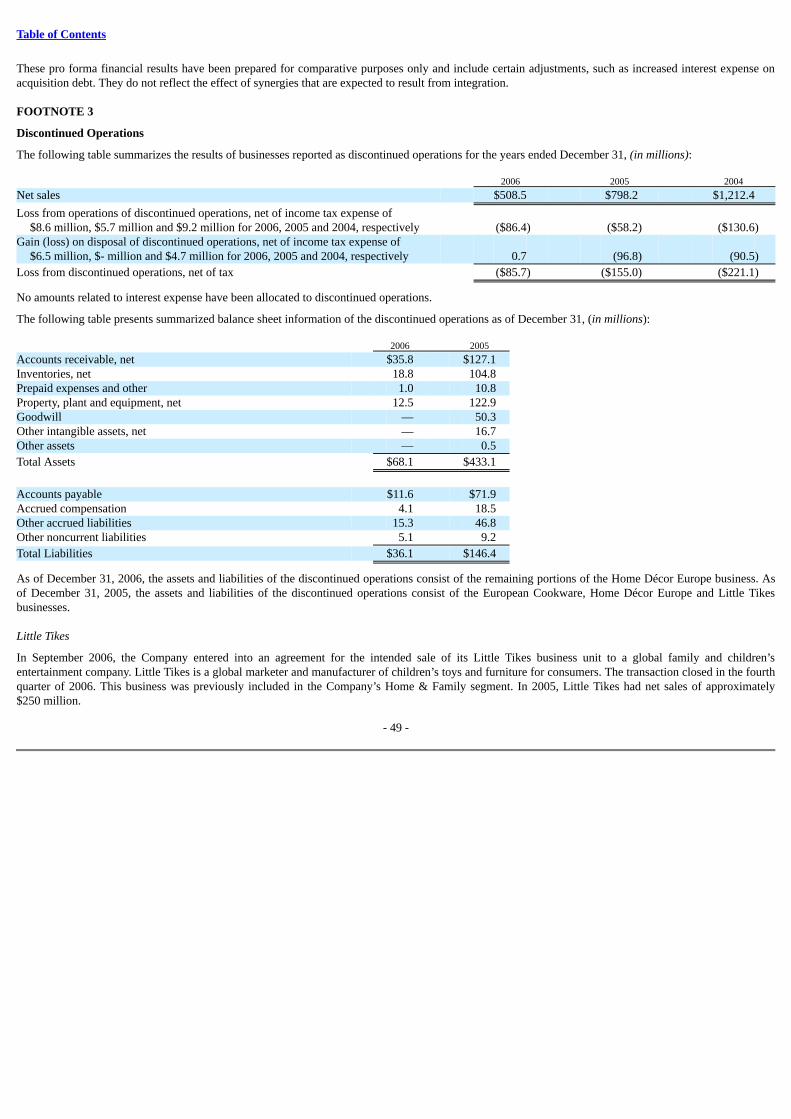
Table of Contents
These pro forma financial results have been prepared for comparative purposes only and include certain adjustments, such as increased interest expense onacquisition debt. They do not reflect the effect of synergies that are expected to result from integration.
FOOTNOTE 3
Discontinued Operations
The following table summarizes the results of businesses reported as discontinued operations for the years ended December 31, (in millions): 2006 2005 2004
Net sales $508.5 $798.2 $1,212.4
Loss from operations of discontinued operations, net of income tax expense of$8.6 million, $5.7 million and $9.2 million for 2006, 2005 and 2004, respectively ($86.4) ($58.2) ($130.6)
Gain (loss) on disposal of discontinued operations, net of income tax expense of$6.5 million, $- million and $4.7 million for 2006, 2005 and 2004, respectively 0.7 (96.8) (90.5)
Loss from discontinued operations, net of tax ($85.7) ($155.0) ($221.1)
No amounts related to interest expense have been allocated to discontinued operations.
The following table presents summarized balance sheet information of the discontinued operations as of December 31, (in millions): 2006 2005
Accounts receivable, net $35.8 $127.1 Inventories, net 18.8 104.8 Prepaid expenses and other 1.0 10.8 Property, plant and equipment, net 12.5 122.9 Goodwill — 50.3 Other intangible assets, net — 16.7 Other assets — 0.5
Total Assets $68.1 $433.1
Accounts payable $11.6 $71.9 Accrued compensation 4.1 18.5 Other accrued liabilities 15.3 46.8 Other noncurrent liabilities 5.1 9.2
Total Liabilities $36.1 $146.4
As of December 31, 2006, the assets and liabilities of the discontinued operations consist of the remaining portions of the Home Décor Europe business. Asof December 31, 2005, the assets and liabilities of the discontinued operations consist of the European Cookware, Home Décor Europe and Little Tikesbusinesses.
Little Tikes
In September 2006, the Company entered into an agreement for the intended sale of its Little Tikes business unit to a global family and children’sentertainment company. Little Tikes is a global marketer and manufacturer of children’s toys and furniture for consumers. The transaction closed in the fourthquarter of 2006. This business was previously included in the Company’s Home & Family segment. In 2005, Little Tikes had net sales of approximately$250 million.
- 49 -
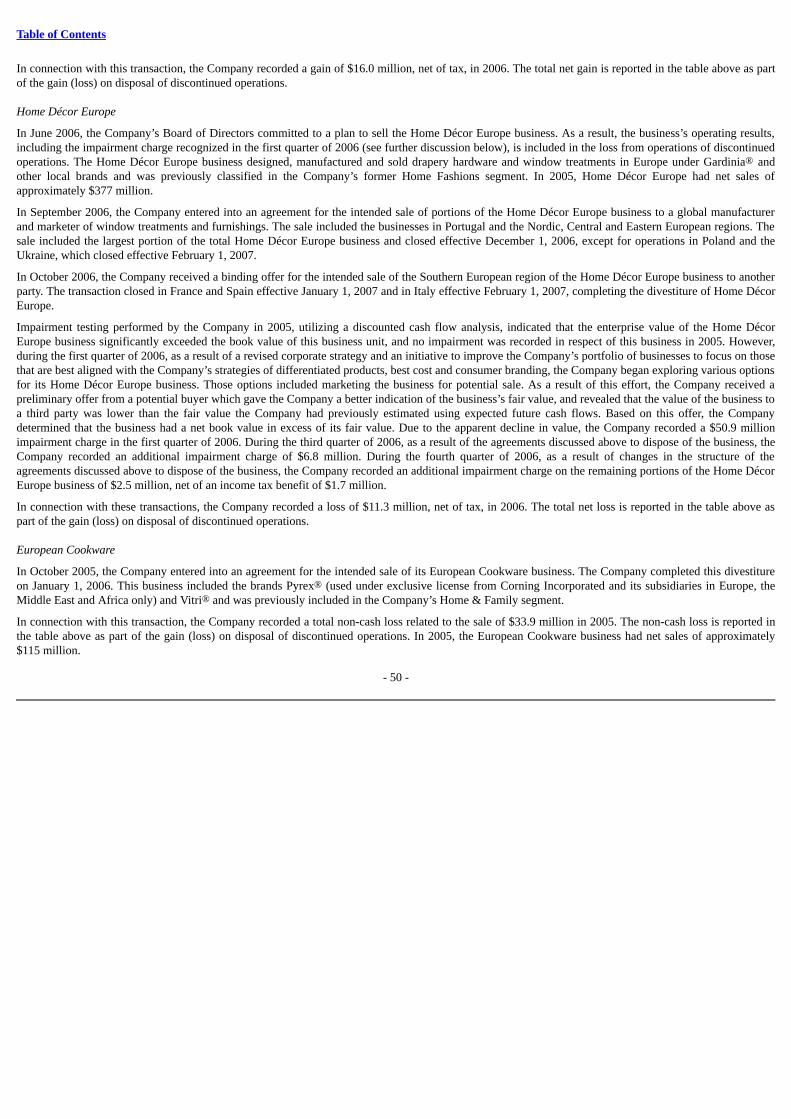
Table of Contents
In connection with this transaction, the Company recorded a gain of $16.0 million, net of tax, in 2006. The total net gain is reported in the table above as partof the gain (loss) on disposal of discontinued operations.
Home Décor Europe
In June 2006, the Company’s Board of Directors committed to a plan to sell the Home Décor Europe business. As a result, the business’s operating results,including the impairment charge recognized in the first quarter of 2006 (see further discussion below), is included in the loss from operations of discontinuedoperations. The Home Décor Europe business designed, manufactured and sold drapery hardware and window treatments in Europe under Gardinia® andother local brands and was previously classified in the Company’s former Home Fashions segment. In 2005, Home Décor Europe had net sales ofapproximately $377 million.
In September 2006, the Company entered into an agreement for the intended sale of portions of the Home Décor Europe business to a global manufacturerand marketer of window treatments and furnishings. The sale included the businesses in Portugal and the Nordic, Central and Eastern European regions. Thesale included the largest portion of the total Home Décor Europe business and closed effective December 1, 2006, except for operations in Poland and theUkraine, which closed effective February 1, 2007.
In October 2006, the Company received a binding offer for the intended sale of the Southern European region of the Home Décor Europe business to anotherparty. The transaction closed in France and Spain effective January 1, 2007 and in Italy effective February 1, 2007, completing the divestiture of Home DécorEurope.
Impairment testing performed by the Company in 2005, utilizing a discounted cash flow analysis, indicated that the enterprise value of the Home DécorEurope business significantly exceeded the book value of this business unit, and no impairment was recorded in respect of this business in 2005. However,during the first quarter of 2006, as a result of a revised corporate strategy and an initiative to improve the Company’s portfolio of businesses to focus on thosethat are best aligned with the Company’s strategies of differentiated products, best cost and consumer branding, the Company began exploring various optionsfor its Home Décor Europe business. Those options included marketing the business for potential sale. As a result of this effort, the Company received apreliminary offer from a potential buyer which gave the Company a better indication of the business’s fair value, and revealed that the value of the business toa third party was lower than the fair value the Company had previously estimated using expected future cash flows. Based on this offer, the Companydetermined that the business had a net book value in excess of its fair value. Due to the apparent decline in value, the Company recorded a $50.9 millionimpairment charge in the first quarter of 2006. During the third quarter of 2006, as a result of the agreements discussed above to dispose of the business, theCompany recorded an additional impairment charge of $6.8 million. During the fourth quarter of 2006, as a result of changes in the structure of theagreements discussed above to dispose of the business, the Company recorded an additional impairment charge on the remaining portions of the Home DécorEurope business of $2.5 million, net of an income tax benefit of $1.7 million.
In connection with these transactions, the Company recorded a loss of $11.3 million, net of tax, in 2006. The total net loss is reported in the table above aspart of the gain (loss) on disposal of discontinued operations.
European Cookware
In October 2005, the Company entered into an agreement for the intended sale of its European Cookware business. The Company completed this divestitureon January 1, 2006. This business included the brands Pyrex® (used under exclusive license from Corning Incorporated and its subsidiaries in Europe, theMiddle East and Africa only) and Vitri® and was previously included in the Company’s Home & Family segment.
In connection with this transaction, the Company recorded a total non-cash loss related to the sale of $33.9 million in 2005. The non-cash loss is reported inthe table above as part of the gain (loss) on disposal of discontinued operations. In 2005, the European Cookware business had net sales of approximately$115 million.
- 50 -
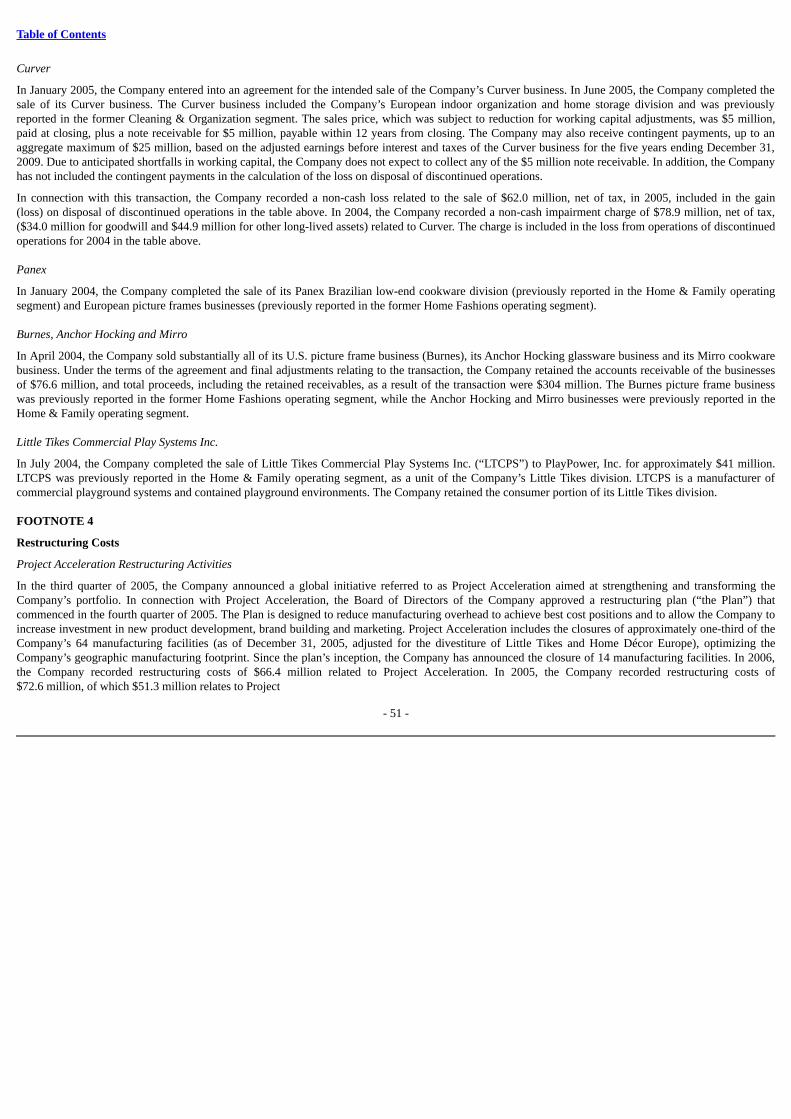
Table of Contents
Curver
In January 2005, the Company entered into an agreement for the intended sale of the Company’s Curver business. In June 2005, the Company completed thesale of its Curver business. The Curver business included the Company’s European indoor organization and home storage division and was previouslyreported in the former Cleaning & Organization segment. The sales price, which was subject to reduction for working capital adjustments, was $5 million,paid at closing, plus a note receivable for $5 million, payable within 12 years from closing. The Company may also receive contingent payments, up to anaggregate maximum of $25 million, based on the adjusted earnings before interest and taxes of the Curver business for the five years ending December 31,2009. Due to anticipated shortfalls in working capital, the Company does not expect to collect any of the $5 million note receivable. In addition, the Companyhas not included the contingent payments in the calculation of the loss on disposal of discontinued operations.
In connection with this transaction, the Company recorded a non-cash loss related to the sale of $62.0 million, net of tax, in 2005, included in the gain(loss) on disposal of discontinued operations in the table above. In 2004, the Company recorded a non-cash impairment charge of $78.9 million, net of tax,($34.0 million for goodwill and $44.9 million for other long-lived assets) related to Curver. The charge is included in the loss from operations of discontinuedoperations for 2004 in the table above.
Panex
In January 2004, the Company completed the sale of its Panex Brazilian low-end cookware division (previously reported in the Home & Family operatingsegment) and European picture frames businesses (previously reported in the former Home Fashions operating segment).
Burnes, Anchor Hocking and Mirro
In April 2004, the Company sold substantially all of its U.S. picture frame business (Burnes), its Anchor Hocking glassware business and its Mirro cookwarebusiness. Under the terms of the agreement and final adjustments relating to the transaction, the Company retained the accounts receivable of the businessesof $76.6 million, and total proceeds, including the retained receivables, as a result of the transaction were $304 million. The Burnes picture frame businesswas previously reported in the former Home Fashions operating segment, while the Anchor Hocking and Mirro businesses were previously reported in theHome & Family operating segment.
Little Tikes Commercial Play Systems Inc.
In July 2004, the Company completed the sale of Little Tikes Commercial Play Systems Inc. (“LTCPS”) to PlayPower, Inc. for approximately $41 million.LTCPS was previously reported in the Home & Family operating segment, as a unit of the Company’s Little Tikes division. LTCPS is a manufacturer ofcommercial playground systems and contained playground environments. The Company retained the consumer portion of its Little Tikes division.
FOOTNOTE 4
Restructuring Costs
Project Acceleration Restructuring Activities
In the third quarter of 2005, the Company announced a global initiative referred to as Project Acceleration aimed at strengthening and transforming theCompany’s portfolio. In connection with Project Acceleration, the Board of Directors of the Company approved a restructuring plan (“the Plan”) thatcommenced in the fourth quarter of 2005. The Plan is designed to reduce manufacturing overhead to achieve best cost positions and to allow the Company toincrease investment in new product development, brand building and marketing. Project Acceleration includes the closures of approximately one-third of theCompany’s 64 manufacturing facilities (as of December 31, 2005, adjusted for the divestiture of Little Tikes and Home Décor Europe), optimizing theCompany’s geographic manufacturing footprint. Since the plan’s inception, the Company has announced the closure of 14 manufacturing facilities. In 2006,the Company recorded restructuring costs of $66.4 million related to Project Acceleration. In 2005, the Company recorded restructuring costs of$72.6 million, of which $51.3 million relates to Project
- 51 -
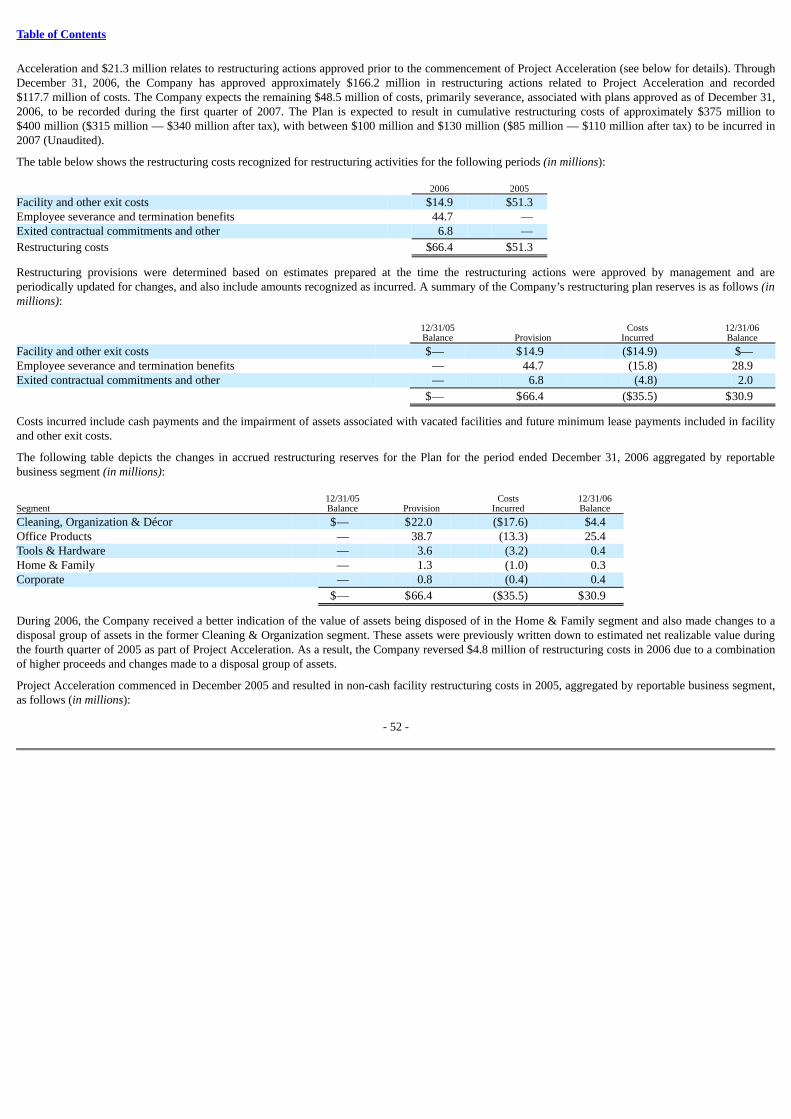
Table of Contents
Acceleration and $21.3 million relates to restructuring actions approved prior to the commencement of Project Acceleration (see below for details). ThroughDecember 31, 2006, the Company has approved approximately $166.2 million in restructuring actions related to Project Acceleration and recorded$117.7 million of costs. The Company expects the remaining $48.5 million of costs, primarily severance, associated with plans approved as of December 31,2006, to be recorded during the first quarter of 2007. The Plan is expected to result in cumulative restructuring costs of approximately $375 million to$400 million ($315 million — $340 million after tax), with between $100 million and $130 million ($85 million — $110 million after tax) to be incurred in2007 (Unaudited).
The table below shows the restructuring costs recognized for restructuring activities for the following periods (in millions): 2006 2005
Facility and other exit costs $14.9 $51.3 Employee severance and termination benefits 44.7 — Exited contractual commitments and other 6.8 —
Restructuring costs $66.4 $51.3
Restructuring provisions were determined based on estimates prepared at the time the restructuring actions were approved by management and areperiodically updated for changes, and also include amounts recognized as incurred. A summary of the Company’s restructuring plan reserves is as follows (inmillions): 12/31/05 Costs 12/31/06 Balance Provision Incurred Balance
Facility and other exit costs $— $14.9 ($14.9) $— Employee severance and termination benefits — 44.7 (15.8) 28.9 Exited contractual commitments and other — 6.8 (4.8) 2.0
$— $66.4 ($35.5) $30.9
Costs incurred include cash payments and the impairment of assets associated with vacated facilities and future minimum lease payments included in facilityand other exit costs.
The following table depicts the changes in accrued restructuring reserves for the Plan for the period ended December 31, 2006 aggregated by reportablebusiness segment (in millions): 12/31/05 Costs 12/31/06Segment Balance Provision Incurred Balance
Cleaning, Organization & Décor $— $22.0 ($17.6) $4.4 Office Products — 38.7 (13.3) 25.4 Tools & Hardware — 3.6 (3.2) 0.4 Home & Family — 1.3 (1.0) 0.3 Corporate — 0.8 (0.4) 0.4
$— $66.4 ($35.5) $30.9
During 2006, the Company received a better indication of the value of assets being disposed of in the Home & Family segment and also made changes to adisposal group of assets in the former Cleaning & Organization segment. These assets were previously written down to estimated net realizable value duringthe fourth quarter of 2005 as part of Project Acceleration. As a result, the Company reversed $4.8 million of restructuring costs in 2006 due to a combinationof higher proceeds and changes made to a disposal group of assets.
Project Acceleration commenced in December 2005 and resulted in non-cash facility restructuring costs in 2005, aggregated by reportable business segment,as follows (in millions):
- 52 -
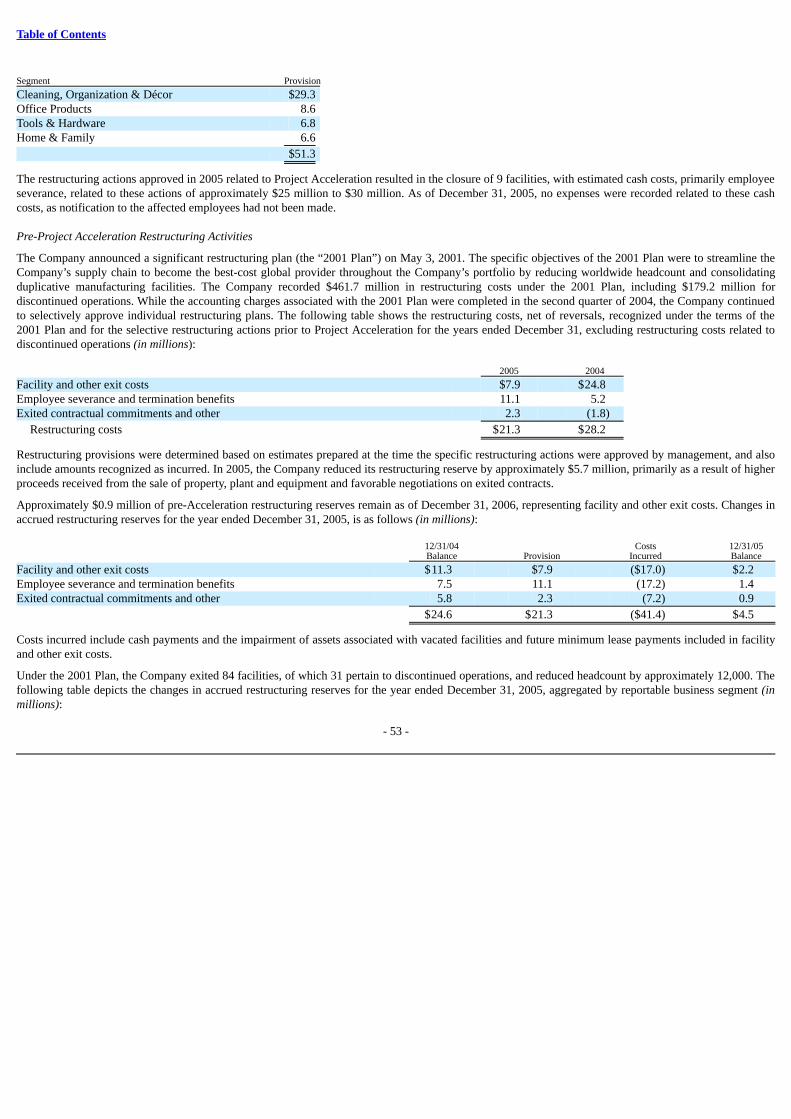
Table of Contents
Segment Provision
Cleaning, Organization & Décor $29.3 Office Products 8.6 Tools & Hardware 6.8 Home & Family 6.6
$51.3
The restructuring actions approved in 2005 related to Project Acceleration resulted in the closure of 9 facilities, with estimated cash costs, primarily employeeseverance, related to these actions of approximately $25 million to $30 million. As of December 31, 2005, no expenses were recorded related to these cashcosts, as notification to the affected employees had not been made.
Pre-Project Acceleration Restructuring Activities
The Company announced a significant restructuring plan (the “2001 Plan”) on May 3, 2001. The specific objectives of the 2001 Plan were to streamline theCompany’s supply chain to become the best-cost global provider throughout the Company’s portfolio by reducing worldwide headcount and consolidatingduplicative manufacturing facilities. The Company recorded $461.7 million in restructuring costs under the 2001 Plan, including $179.2 million fordiscontinued operations. While the accounting charges associated with the 2001 Plan were completed in the second quarter of 2004, the Company continuedto selectively approve individual restructuring plans. The following table shows the restructuring costs, net of reversals, recognized under the terms of the2001 Plan and for the selective restructuring actions prior to Project Acceleration for the years ended December 31, excluding restructuring costs related todiscontinued operations (in millions): 2005 2004
Facility and other exit costs $7.9 $24.8 Employee severance and termination benefits 11.1 5.2 Exited contractual commitments and other 2.3 (1.8)
Restructuring costs $21.3 $28.2
Restructuring provisions were determined based on estimates prepared at the time the specific restructuring actions were approved by management, and alsoinclude amounts recognized as incurred. In 2005, the Company reduced its restructuring reserve by approximately $5.7 million, primarily as a result of higherproceeds received from the sale of property, plant and equipment and favorable negotiations on exited contracts.
Approximately $0.9 million of pre-Acceleration restructuring reserves remain as of December 31, 2006, representing facility and other exit costs. Changes inaccrued restructuring reserves for the year ended December 31, 2005, is as follows (in millions): 12/31/04 Costs 12/31/05 Balance Provision Incurred Balance
Facility and other exit costs $11.3 $7.9 ($17.0) $2.2 Employee severance and termination benefits 7.5 11.1 (17.2) 1.4 Exited contractual commitments and other 5.8 2.3 (7.2) 0.9
$24.6 $21.3 ($41.4) $4.5
Costs incurred include cash payments and the impairment of assets associated with vacated facilities and future minimum lease payments included in facilityand other exit costs.
Under the 2001 Plan, the Company exited 84 facilities, of which 31 pertain to discontinued operations, and reduced headcount by approximately 12,000. Thefollowing table depicts the changes in accrued restructuring reserves for the year ended December 31, 2005, aggregated by reportable business segment (inmillions):
- 53 -
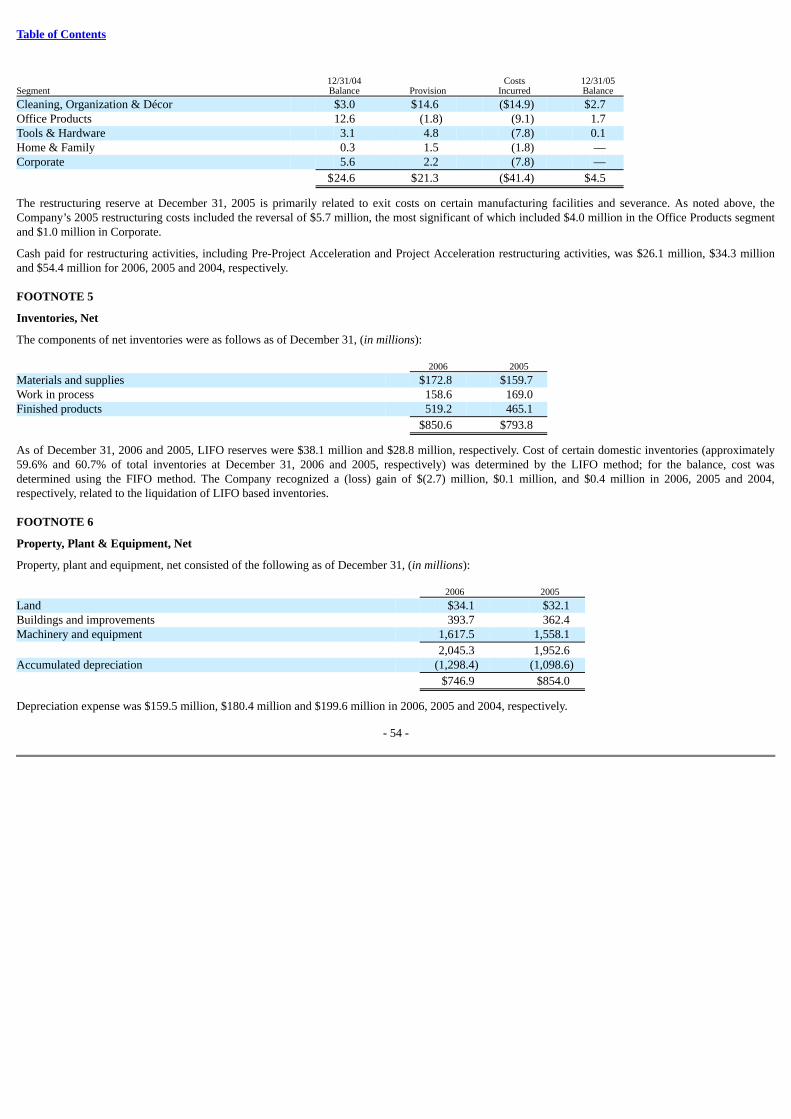
Table of Contents
12/31/04 Costs 12/31/05Segment Balance Provision Incurred Balance
Cleaning, Organization & Décor $3.0 $14.6 ($14.9) $2.7 Office Products 12.6 (1.8) (9.1) 1.7 Tools & Hardware 3.1 4.8 (7.8) 0.1 Home & Family 0.3 1.5 (1.8) — Corporate 5.6 2.2 (7.8) —
$24.6 $21.3 ($41.4) $4.5
The restructuring reserve at December 31, 2005 is primarily related to exit costs on certain manufacturing facilities and severance. As noted above, theCompany’s 2005 restructuring costs included the reversal of $5.7 million, the most significant of which included $4.0 million in the Office Products segmentand $1.0 million in Corporate.
Cash paid for restructuring activities, including Pre-Project Acceleration and Project Acceleration restructuring activities, was $26.1 million, $34.3 millionand $54.4 million for 2006, 2005 and 2004, respectively.
FOOTNOTE 5
Inventories, Net
The components of net inventories were as follows as of December 31, (in millions): 2006 2005
Materials and supplies $172.8 $159.7 Work in process 158.6 169.0 Finished products 519.2 465.1
$850.6 $793.8
As of December 31, 2006 and 2005, LIFO reserves were $38.1 million and $28.8 million, respectively. Cost of certain domestic inventories (approximately59.6% and 60.7% of total inventories at December 31, 2006 and 2005, respectively) was determined by the LIFO method; for the balance, cost wasdetermined using the FIFO method. The Company recognized a (loss) gain of $(2.7) million, $0.1 million, and $0.4 million in 2006, 2005 and 2004,respectively, related to the liquidation of LIFO based inventories.
FOOTNOTE 6
Property, Plant & Equipment, Net
Property, plant and equipment, net consisted of the following as of December 31, (in millions): 2006 2005
Land $34.1 $32.1 Buildings and improvements 393.7 362.4 Machinery and equipment 1,617.5 1,558.1
2,045.3 1,952.6 Accumulated depreciation (1,298.4) (1,098.6)
$746.9 $854.0
Depreciation expense was $159.5 million, $180.4 million and $199.6 million in 2006, 2005 and 2004, respectively.
- 54 -
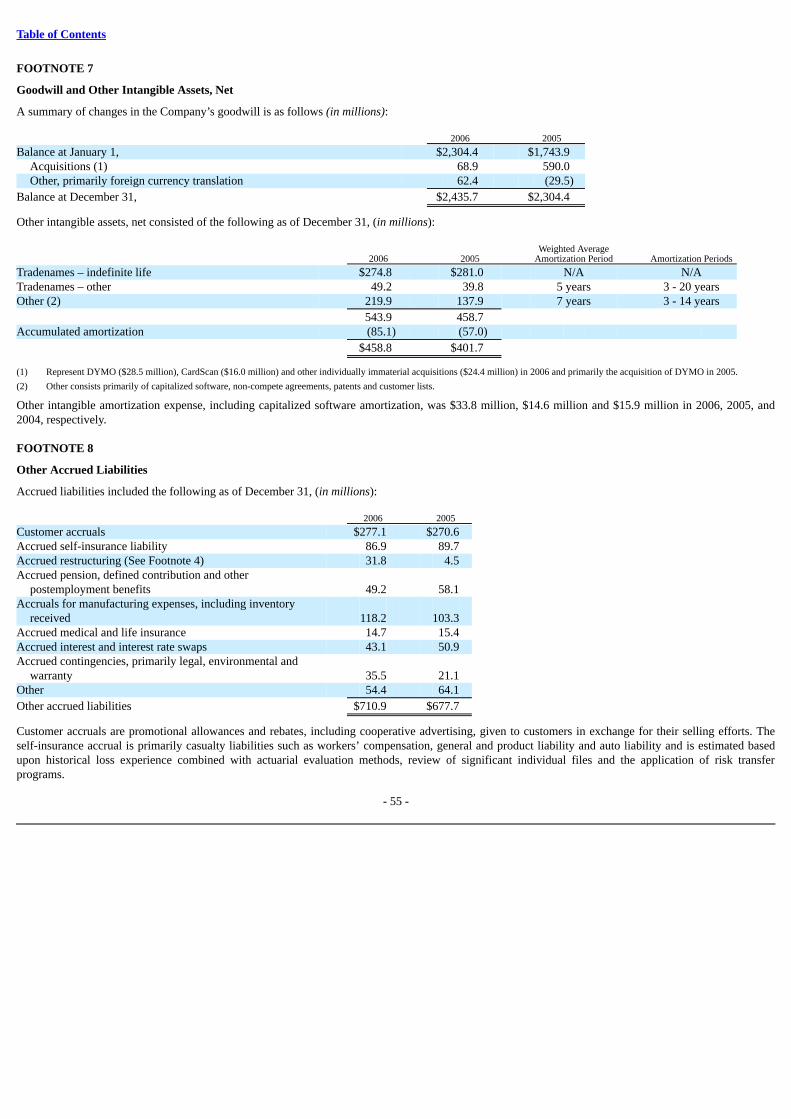
Table of Contents
FOOTNOTE 7
Goodwill and Other Intangible Assets, Net
A summary of changes in the Company’s goodwill is as follows (in millions): 2006 2005
Balance at January 1, $2,304.4 $1,743.9 Acquisitions (1) 68.9 590.0 Other, primarily foreign currency translation 62.4 (29.5)
Balance at December 31, $2,435.7 $2,304.4
Other intangible assets, net consisted of the following as of December 31, (in millions): Weighted Average 2006 2005 Amortization Period Amortization Periods
Tradenames – indefinite life $274.8 $281.0 N/A N/A Tradenames – other 49.2 39.8 5 years 3 - 20 yearsOther (2) 219.9 137.9 7 years 3 - 14 years
543.9 458.7 Accumulated amortization (85.1) (57.0)
$458.8 $401.7
(1) Represent DYMO ($28.5 million), CardScan ($16.0 million) and other individually immaterial acquisitions ($24.4 million) in 2006 and primarily the acquisition of DYMO in 2005.
(2) Other consists primarily of capitalized software, non-compete agreements, patents and customer lists.
Other intangible amortization expense, including capitalized software amortization, was $33.8 million, $14.6 million and $15.9 million in 2006, 2005, and2004, respectively.
FOOTNOTE 8
Other Accrued Liabilities
Accrued liabilities included the following as of December 31, (in millions): 2006 2005
Customer accruals $277.1 $270.6 Accrued self-insurance liability 86.9 89.7 Accrued restructuring (See Footnote 4) 31.8 4.5 Accrued pension, defined contribution and other
postemployment benefits 49.2 58.1 Accruals for manufacturing expenses, including inventory
received 118.2 103.3 Accrued medical and life insurance 14.7 15.4 Accrued interest and interest rate swaps 43.1 50.9 Accrued contingencies, primarily legal, environmental and
warranty 35.5 21.1 Other 54.4 64.1
Other accrued liabilities $710.9 $677.7
Customer accruals are promotional allowances and rebates, including cooperative advertising, given to customers in exchange for their selling efforts. Theself-insurance accrual is primarily casualty liabilities such as workers’ compensation, general and product liability and auto liability and is estimated basedupon historical loss experience combined with actuarial evaluation methods, review of significant individual files and the application of risk transferprograms.
- 55 -
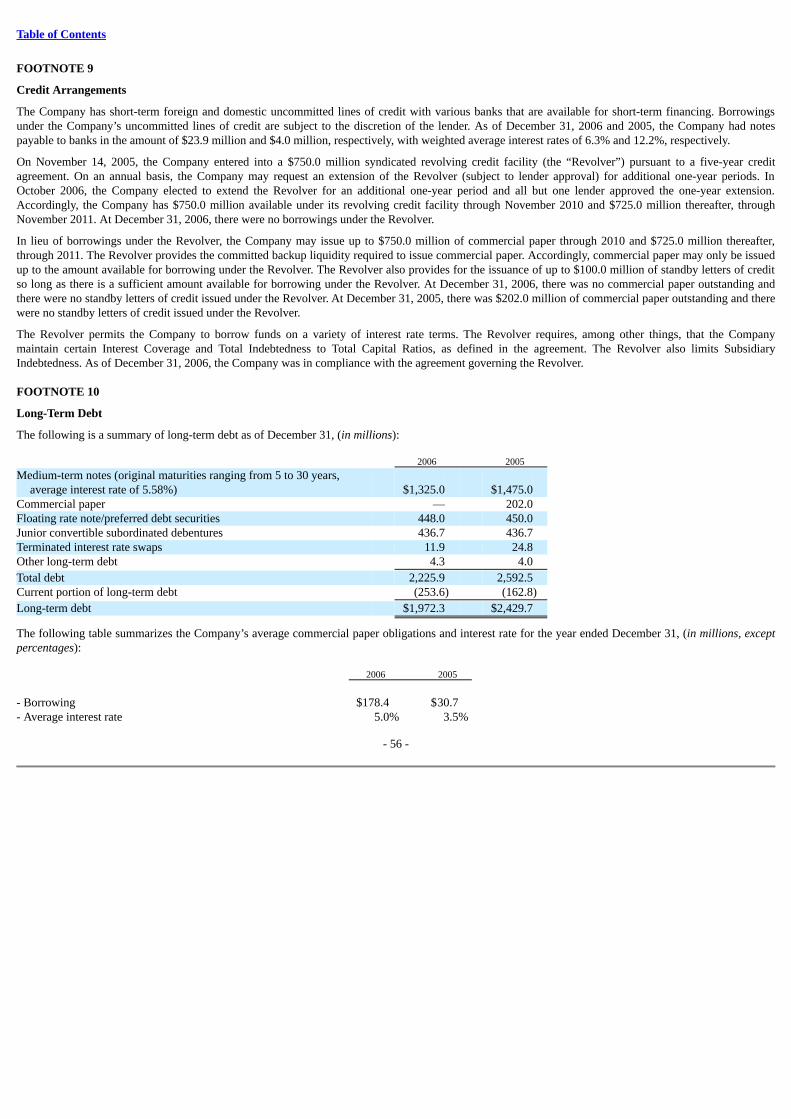
Table of Contents
FOOTNOTE 9
Credit Arrangements
The Company has short-term foreign and domestic uncommitted lines of credit with various banks that are available for short-term financing. Borrowingsunder the Company’s uncommitted lines of credit are subject to the discretion of the lender. As of December 31, 2006 and 2005, the Company had notespayable to banks in the amount of $23.9 million and $4.0 million, respectively, with weighted average interest rates of 6.3% and 12.2%, respectively.
On November 14, 2005, the Company entered into a $750.0 million syndicated revolving credit facility (the “Revolver”) pursuant to a five-year creditagreement. On an annual basis, the Company may request an extension of the Revolver (subject to lender approval) for additional one-year periods. InOctober 2006, the Company elected to extend the Revolver for an additional one-year period and all but one lender approved the one-year extension.Accordingly, the Company has $750.0 million available under its revolving credit facility through November 2010 and $725.0 million thereafter, throughNovember 2011. At December 31, 2006, there were no borrowings under the Revolver.
In lieu of borrowings under the Revolver, the Company may issue up to $750.0 million of commercial paper through 2010 and $725.0 million thereafter,through 2011. The Revolver provides the committed backup liquidity required to issue commercial paper. Accordingly, commercial paper may only be issuedup to the amount available for borrowing under the Revolver. The Revolver also provides for the issuance of up to $100.0 million of standby letters of creditso long as there is a sufficient amount available for borrowing under the Revolver. At December 31, 2006, there was no commercial paper outstanding andthere were no standby letters of credit issued under the Revolver. At December 31, 2005, there was $202.0 million of commercial paper outstanding and therewere no standby letters of credit issued under the Revolver.
The Revolver permits the Company to borrow funds on a variety of interest rate terms. The Revolver requires, among other things, that the Companymaintain certain Interest Coverage and Total Indebtedness to Total Capital Ratios, as defined in the agreement. The Revolver also limits SubsidiaryIndebtedness. As of December 31, 2006, the Company was in compliance with the agreement governing the Revolver.
FOOTNOTE 10
Long-Term Debt
The following is a summary of long-term debt as of December 31, (in millions): 2006 2005
Medium-term notes (original maturities ranging from 5 to 30 years,average interest rate of 5.58%) $1,325.0 $1,475.0
Commercial paper — 202.0 Floating rate note/preferred debt securities 448.0 450.0 Junior convertible subordinated debentures 436.7 436.7 Terminated interest rate swaps 11.9 24.8 Other long-term debt 4.3 4.0
Total debt 2,225.9 2,592.5 Current portion of long-term debt (253.6) (162.8)
Long-term debt $1,972.3 $2,429.7
The following table summarizes the Company’s average commercial paper obligations and interest rate for the year ended December 31, (in millions, exceptpercentages): 2006 2005
- Borrowing $178.4 $30.7 - Average interest rate 5.0% 3.5%
- 56 -
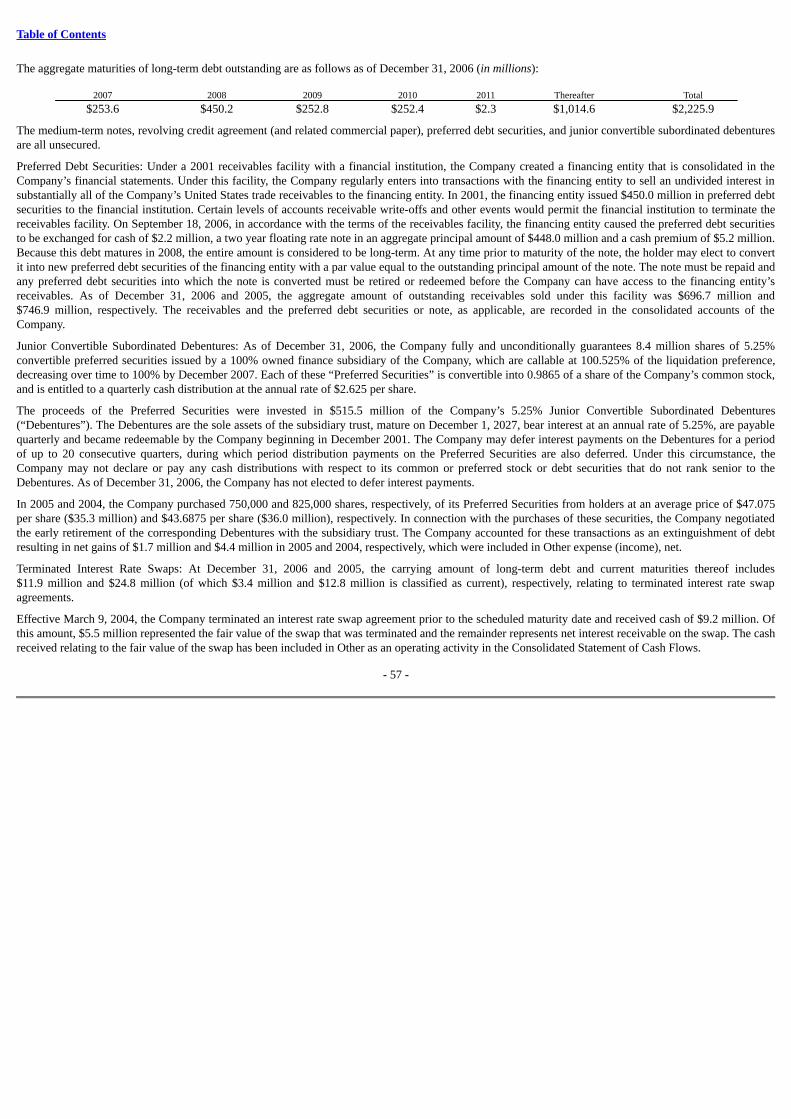
Table of Contents
The aggregate maturities of long-term debt outstanding are as follows as of December 31, 2006 (in millions):
2007 2008 2009 2010 2011 Thereafter Total
$253.6 $450.2 $252.8 $252.4 $2.3 $1,014.6 $2,225.9
The medium-term notes, revolving credit agreement (and related commercial paper), preferred debt securities, and junior convertible subordinated debenturesare all unsecured.
Preferred Debt Securities: Under a 2001 receivables facility with a financial institution, the Company created a financing entity that is consolidated in theCompany’s financial statements. Under this facility, the Company regularly enters into transactions with the financing entity to sell an undivided interest insubstantially all of the Company’s United States trade receivables to the financing entity. In 2001, the financing entity issued $450.0 million in preferred debtsecurities to the financial institution. Certain levels of accounts receivable write-offs and other events would permit the financial institution to terminate thereceivables facility. On September 18, 2006, in accordance with the terms of the receivables facility, the financing entity caused the preferred debt securitiesto be exchanged for cash of $2.2 million, a two year floating rate note in an aggregate principal amount of $448.0 million and a cash premium of $5.2 million.Because this debt matures in 2008, the entire amount is considered to be long-term. At any time prior to maturity of the note, the holder may elect to convertit into new preferred debt securities of the financing entity with a par value equal to the outstanding principal amount of the note. The note must be repaid andany preferred debt securities into which the note is converted must be retired or redeemed before the Company can have access to the financing entity’sreceivables. As of December 31, 2006 and 2005, the aggregate amount of outstanding receivables sold under this facility was $696.7 million and$746.9 million, respectively. The receivables and the preferred debt securities or note, as applicable, are recorded in the consolidated accounts of theCompany.
Junior Convertible Subordinated Debentures: As of December 31, 2006, the Company fully and unconditionally guarantees 8.4 million shares of 5.25%convertible preferred securities issued by a 100% owned finance subsidiary of the Company, which are callable at 100.525% of the liquidation preference,decreasing over time to 100% by December 2007. Each of these “Preferred Securities” is convertible into 0.9865 of a share of the Company’s common stock,and is entitled to a quarterly cash distribution at the annual rate of $2.625 per share.
The proceeds of the Preferred Securities were invested in $515.5 million of the Company’s 5.25% Junior Convertible Subordinated Debentures(“Debentures”). The Debentures are the sole assets of the subsidiary trust, mature on December 1, 2027, bear interest at an annual rate of 5.25%, are payablequarterly and became redeemable by the Company beginning in December 2001. The Company may defer interest payments on the Debentures for a periodof up to 20 consecutive quarters, during which period distribution payments on the Preferred Securities are also deferred. Under this circumstance, theCompany may not declare or pay any cash distributions with respect to its common or preferred stock or debt securities that do not rank senior to theDebentures. As of December 31, 2006, the Company has not elected to defer interest payments.
In 2005 and 2004, the Company purchased 750,000 and 825,000 shares, respectively, of its Preferred Securities from holders at an average price of $47.075per share ($35.3 million) and $43.6875 per share ($36.0 million), respectively. In connection with the purchases of these securities, the Company negotiatedthe early retirement of the corresponding Debentures with the subsidiary trust. The Company accounted for these transactions as an extinguishment of debtresulting in net gains of $1.7 million and $4.4 million in 2005 and 2004, respectively, which were included in Other expense (income), net.
Terminated Interest Rate Swaps: At December 31, 2006 and 2005, the carrying amount of long-term debt and current maturities thereof includes$11.9 million and $24.8 million (of which $3.4 million and $12.8 million is classified as current), respectively, relating to terminated interest rate swapagreements.
Effective March 9, 2004, the Company terminated an interest rate swap agreement prior to the scheduled maturity date and received cash of $9.2 million. Ofthis amount, $5.5 million represented the fair value of the swap that was terminated and the remainder represents net interest receivable on the swap. The cashreceived relating to the fair value of the swap has been included in Other as an operating activity in the Consolidated Statement of Cash Flows.
- 57 -
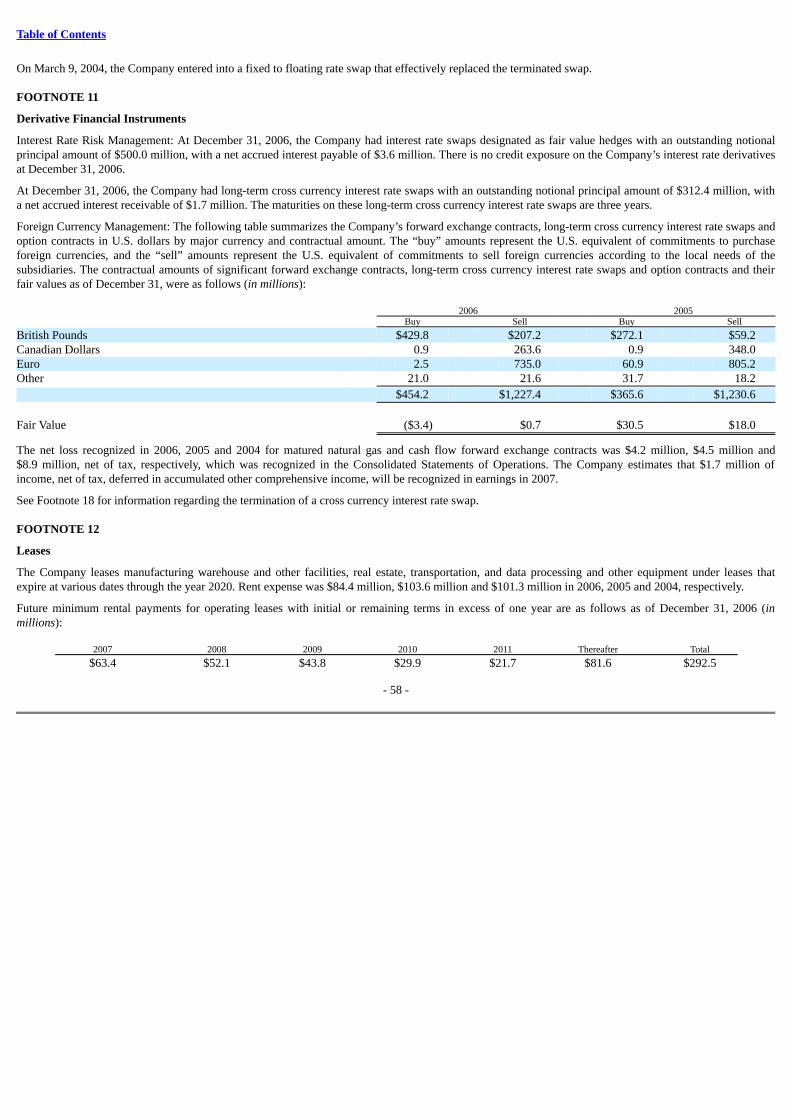
Table of Contents
On March 9, 2004, the Company entered into a fixed to floating rate swap that effectively replaced the terminated swap.
FOOTNOTE 11
Derivative Financial Instruments
Interest Rate Risk Management: At December 31, 2006, the Company had interest rate swaps designated as fair value hedges with an outstanding notionalprincipal amount of $500.0 million, with a net accrued interest payable of $3.6 million. There is no credit exposure on the Company’s interest rate derivativesat December 31, 2006.
At December 31, 2006, the Company had long-term cross currency interest rate swaps with an outstanding notional principal amount of $312.4 million, witha net accrued interest receivable of $1.7 million. The maturities on these long-term cross currency interest rate swaps are three years.
Foreign Currency Management: The following table summarizes the Company’s forward exchange contracts, long-term cross currency interest rate swaps andoption contracts in U.S. dollars by major currency and contractual amount. The “buy” amounts represent the U.S. equivalent of commitments to purchaseforeign currencies, and the “sell” amounts represent the U.S. equivalent of commitments to sell foreign currencies according to the local needs of thesubsidiaries. The contractual amounts of significant forward exchange contracts, long-term cross currency interest rate swaps and option contracts and theirfair values as of December 31, were as follows (in millions): 2006 2005 Buy Sell Buy Sell
British Pounds $429.8 $207.2 $272.1 $59.2 Canadian Dollars 0.9 263.6 0.9 348.0 Euro 2.5 735.0 60.9 805.2 Other 21.0 21.6 31.7 18.2
$454.2 $1,227.4 $365.6 $1,230.6
Fair Value ($3.4) $0.7 $30.5 $18.0
The net loss recognized in 2006, 2005 and 2004 for matured natural gas and cash flow forward exchange contracts was $4.2 million, $4.5 million and$8.9 million, net of tax, respectively, which was recognized in the Consolidated Statements of Operations. The Company estimates that $1.7 million ofincome, net of tax, deferred in accumulated other comprehensive income, will be recognized in earnings in 2007.
See Footnote 18 for information regarding the termination of a cross currency interest rate swap.
FOOTNOTE 12
Leases
The Company leases manufacturing warehouse and other facilities, real estate, transportation, and data processing and other equipment under leases thatexpire at various dates through the year 2020. Rent expense was $84.4 million, $103.6 million and $101.3 million in 2006, 2005 and 2004, respectively.
Future minimum rental payments for operating leases with initial or remaining terms in excess of one year are as follows as of December 31, 2006 (inmillions):
2007 2008 2009 2010 2011 Thereafter Total
$63.4 $52.1 $43.8 $29.9 $21.7 $81.6 $292.5
- 58 -
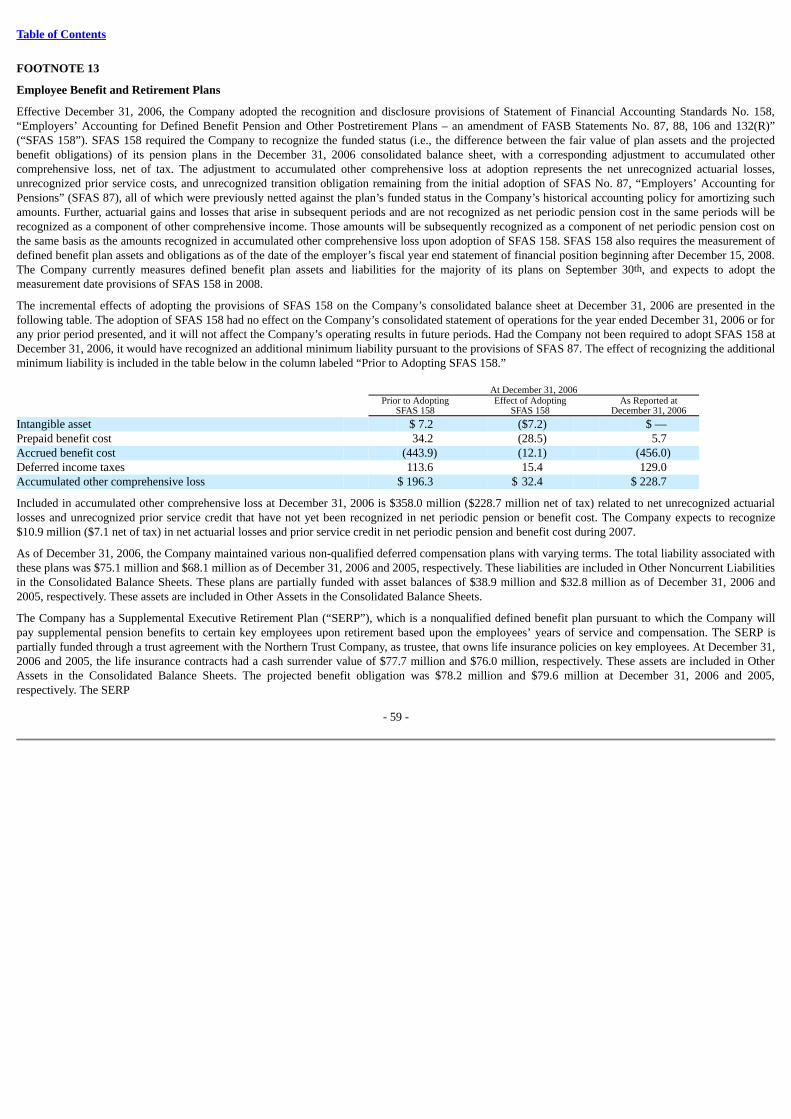
Table of Contents
FOOTNOTE 13
Employee Benefit and Retirement Plans
Effective December 31, 2006, the Company adopted the recognition and disclosure provisions of Statement of Financial Accounting Standards No. 158,“Employers’ Accounting for Defined Benefit Pension and Other Postretirement Plans – an amendment of FASB Statements No. 87, 88, 106 and 132(R)”(“SFAS 158”). SFAS 158 required the Company to recognize the funded status (i.e., the difference between the fair value of plan assets and the projectedbenefit obligations) of its pension plans in the December 31, 2006 consolidated balance sheet, with a corresponding adjustment to accumulated othercomprehensive loss, net of tax. The adjustment to accumulated other comprehensive loss at adoption represents the net unrecognized actuarial losses,unrecognized prior service costs, and unrecognized transition obligation remaining from the initial adoption of SFAS No. 87, “Employers’ Accounting forPensions” (SFAS 87), all of which were previously netted against the plan’s funded status in the Company’s historical accounting policy for amortizing suchamounts. Further, actuarial gains and losses that arise in subsequent periods and are not recognized as net periodic pension cost in the same periods will berecognized as a component of other comprehensive income. Those amounts will be subsequently recognized as a component of net periodic pension cost onthe same basis as the amounts recognized in accumulated other comprehensive loss upon adoption of SFAS 158. SFAS 158 also requires the measurement ofdefined benefit plan assets and obligations as of the date of the employer’s fiscal year end statement of financial position beginning after December 15, 2008.The Company currently measures defined benefit plan assets and liabilities for the majority of its plans on September 30th, and expects to adopt themeasurement date provisions of SFAS 158 in 2008.
The incremental effects of adopting the provisions of SFAS 158 on the Company’s consolidated balance sheet at December 31, 2006 are presented in thefollowing table. The adoption of SFAS 158 had no effect on the Company’s consolidated statement of operations for the year ended December 31, 2006 or forany prior period presented, and it will not affect the Company’s operating results in future periods. Had the Company not been required to adopt SFAS 158 atDecember 31, 2006, it would have recognized an additional minimum liability pursuant to the provisions of SFAS 87. The effect of recognizing the additionalminimum liability is included in the table below in the column labeled “Prior to Adopting SFAS 158.” At December 31, 2006 Prior to Adopting Effect of Adopting As Reported at SFAS 158 SFAS 158 December 31, 2006
Intangible asset $ 7.2 ($7.2) $ — Prepaid benefit cost 34.2 (28.5) 5.7 Accrued benefit cost (443.9) (12.1) (456.0)Deferred income taxes 113.6 15.4 129.0 Accumulated other comprehensive loss $ 196.3 $ 32.4 $ 228.7
Included in accumulated other comprehensive loss at December 31, 2006 is $358.0 million ($228.7 million net of tax) related to net unrecognized actuariallosses and unrecognized prior service credit that have not yet been recognized in net periodic pension or benefit cost. The Company expects to recognize$10.9 million ($7.1 net of tax) in net actuarial losses and prior service credit in net periodic pension and benefit cost during 2007.
As of December 31, 2006, the Company maintained various non-qualified deferred compensation plans with varying terms. The total liability associated withthese plans was $75.1 million and $68.1 million as of December 31, 2006 and 2005, respectively. These liabilities are included in Other Noncurrent Liabilitiesin the Consolidated Balance Sheets. These plans are partially funded with asset balances of $38.9 million and $32.8 million as of December 31, 2006 and2005, respectively. These assets are included in Other Assets in the Consolidated Balance Sheets.
The Company has a Supplemental Executive Retirement Plan (“SERP”), which is a nonqualified defined benefit plan pursuant to which the Company willpay supplemental pension benefits to certain key employees upon retirement based upon the employees’ years of service and compensation. The SERP ispartially funded through a trust agreement with the Northern Trust Company, as trustee, that owns life insurance policies on key employees. At December 31,2006 and 2005, the life insurance contracts had a cash surrender value of $77.7 million and $76.0 million, respectively. These assets are included in OtherAssets in the Consolidated Balance Sheets. The projected benefit obligation was $78.2 million and $79.6 million at December 31, 2006 and 2005,respectively. The SERP
- 59 -
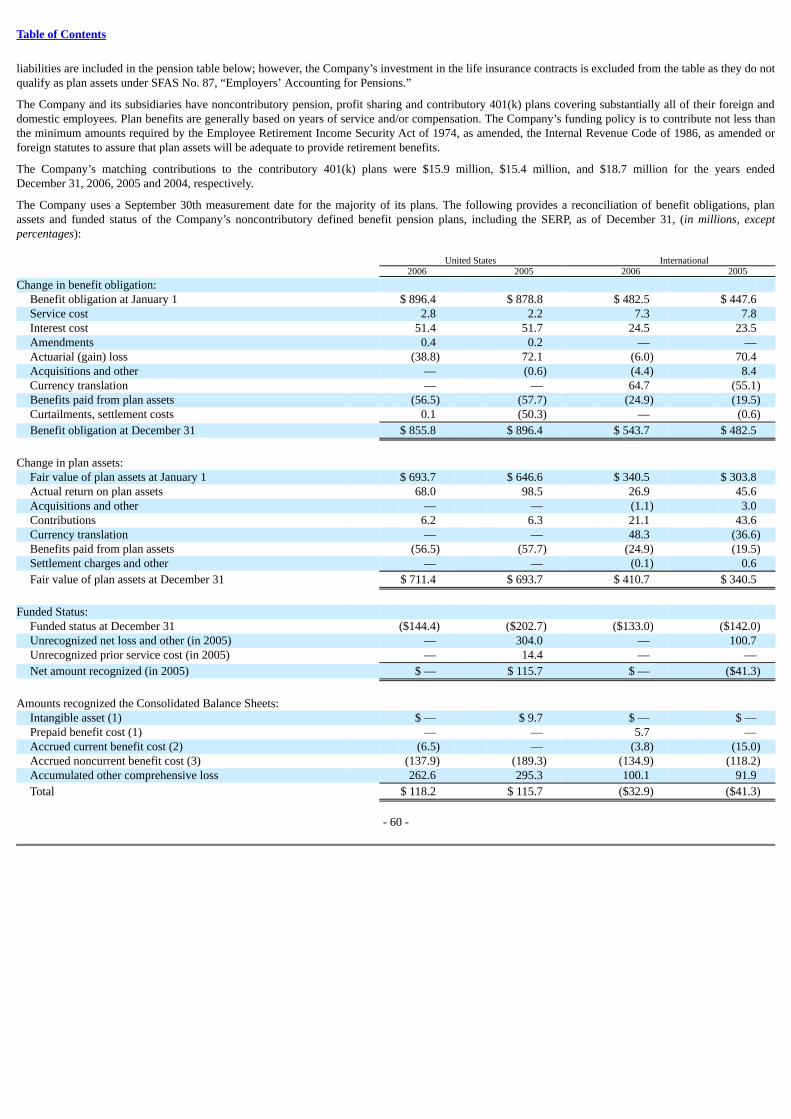
Table of Contents
liabilities are included in the pension table below; however, the Company’s investment in the life insurance contracts is excluded from the table as they do notqualify as plan assets under SFAS No. 87, “Employers’ Accounting for Pensions.”
The Company and its subsidiaries have noncontributory pension, profit sharing and contributory 401(k) plans covering substantially all of their foreign anddomestic employees. Plan benefits are generally based on years of service and/or compensation. The Company’s funding policy is to contribute not less thanthe minimum amounts required by the Employee Retirement Income Security Act of 1974, as amended, the Internal Revenue Code of 1986, as amended orforeign statutes to assure that plan assets will be adequate to provide retirement benefits.
The Company’s matching contributions to the contributory 401(k) plans were $15.9 million, $15.4 million, and $18.7 million for the years endedDecember 31, 2006, 2005 and 2004, respectively.
The Company uses a September 30th measurement date for the majority of its plans. The following provides a reconciliation of benefit obligations, planassets and funded status of the Company’s noncontributory defined benefit pension plans, including the SERP, as of December 31, (in millions, exceptpercentages): United States International 2006 2005 2006 2005
Change in benefit obligation: Benefit obligation at January 1 $ 896.4 $ 878.8 $ 482.5 $ 447.6 Service cost 2.8 2.2 7.3 7.8 Interest cost 51.4 51.7 24.5 23.5 Amendments 0.4 0.2 — — Actuarial (gain) loss (38.8) 72.1 (6.0) 70.4 Acquisitions and other — (0.6) (4.4) 8.4 Currency translation — — 64.7 (55.1)Benefits paid from plan assets (56.5) (57.7) (24.9) (19.5)Curtailments, settlement costs 0.1 (50.3) — (0.6)
Benefit obligation at December 31 $ 855.8 $ 896.4 $ 543.7 $ 482.5
Change in plan assets:
Fair value of plan assets at January 1 $ 693.7 $ 646.6 $ 340.5 $ 303.8 Actual return on plan assets 68.0 98.5 26.9 45.6 Acquisitions and other — — (1.1) 3.0 Contributions 6.2 6.3 21.1 43.6 Currency translation — — 48.3 (36.6)Benefits paid from plan assets (56.5) (57.7) (24.9) (19.5)Settlement charges and other — — (0.1) 0.6
Fair value of plan assets at December 31 $ 711.4 $ 693.7 $ 410.7 $ 340.5
Funded Status:
Funded status at December 31 ($144.4) ($202.7) ($133.0) ($142.0)Unrecognized net loss and other (in 2005) — 304.0 — 100.7 Unrecognized prior service cost (in 2005) — 14.4 — —
Net amount recognized (in 2005) $ — $ 115.7 $ — ($41.3)
Amounts recognized the Consolidated Balance Sheets:
Intangible asset (1) $ — $ 9.7 $ — $ — Prepaid benefit cost (1) — — 5.7 — Accrued current benefit cost (2) (6.5) — (3.8) (15.0)Accrued noncurrent benefit cost (3) (137.9) (189.3) (134.9) (118.2)Accumulated other comprehensive loss 262.6 295.3 100.1 91.9
Total $ 118.2 $ 115.7 ($32.9) ($41.3)
- 60 -
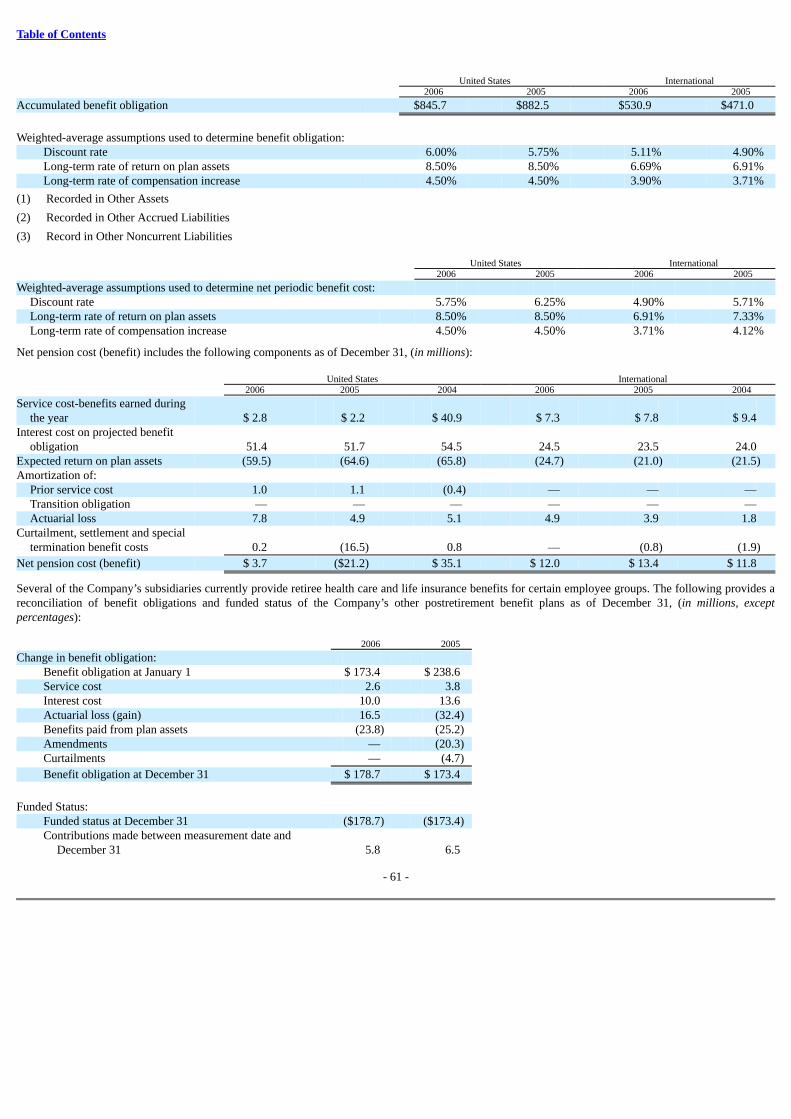
Table of Contents
United States International 2006 2005 2006 2005
Accumulated benefit obligation $845.7 $882.5 $530.9 $471.0
Weighted-average assumptions used to determine benefit obligation:
Discount rate 6.00% 5.75% 5.11% 4.90%Long-term rate of return on plan assets 8.50% 8.50% 6.69% 6.91%Long-term rate of compensation increase 4.50% 4.50% 3.90% 3.71%
(1) Recorded in Other Assets
(2) Recorded in Other Accrued Liabilities
(3) Record in Other Noncurrent Liabilities United States International 2006 2005 2006 2005
Weighted-average assumptions used to determine net periodic benefit cost: Discount rate 5.75% 6.25% 4.90% 5.71%Long-term rate of return on plan assets 8.50% 8.50% 6.91% 7.33%Long-term rate of compensation increase 4.50% 4.50% 3.71% 4.12%
Net pension cost (benefit) includes the following components as of December 31, (in millions): United States International 2006 2005 2004 2006 2005 2004
Service cost-benefits earned duringthe year $ 2.8 $ 2.2 $ 40.9 $ 7.3 $ 7.8 $ 9.4
Interest cost on projected benefitobligation 51.4 51.7 54.5 24.5 23.5 24.0
Expected return on plan assets (59.5) (64.6) (65.8) (24.7) (21.0) (21.5)Amortization of:
Prior service cost 1.0 1.1 (0.4) — — — Transition obligation — — — — — — Actuarial loss 7.8 4.9 5.1 4.9 3.9 1.8
Curtailment, settlement and specialtermination benefit costs 0.2 (16.5) 0.8 — (0.8) (1.9)
Net pension cost (benefit) $ 3.7 ($21.2) $ 35.1 $ 12.0 $ 13.4 $ 11.8
Several of the Company’s subsidiaries currently provide retiree health care and life insurance benefits for certain employee groups. The following provides areconciliation of benefit obligations and funded status of the Company’s other postretirement benefit plans as of December 31, (in millions, exceptpercentages): 2006 2005
Change in benefit obligation: Benefit obligation at January 1 $ 173.4 $ 238.6 Service cost 2.6 3.8 Interest cost 10.0 13.6 Actuarial loss (gain) 16.5 (32.4)Benefits paid from plan assets (23.8) (25.2)Amendments — (20.3)Curtailments — (4.7)
Benefit obligation at December 31 $ 178.7 $ 173.4
Funded Status:
Funded status at December 31 ($178.7) ($173.4)Contributions made between measurement date and
December 31 5.8 6.5
- 61 -
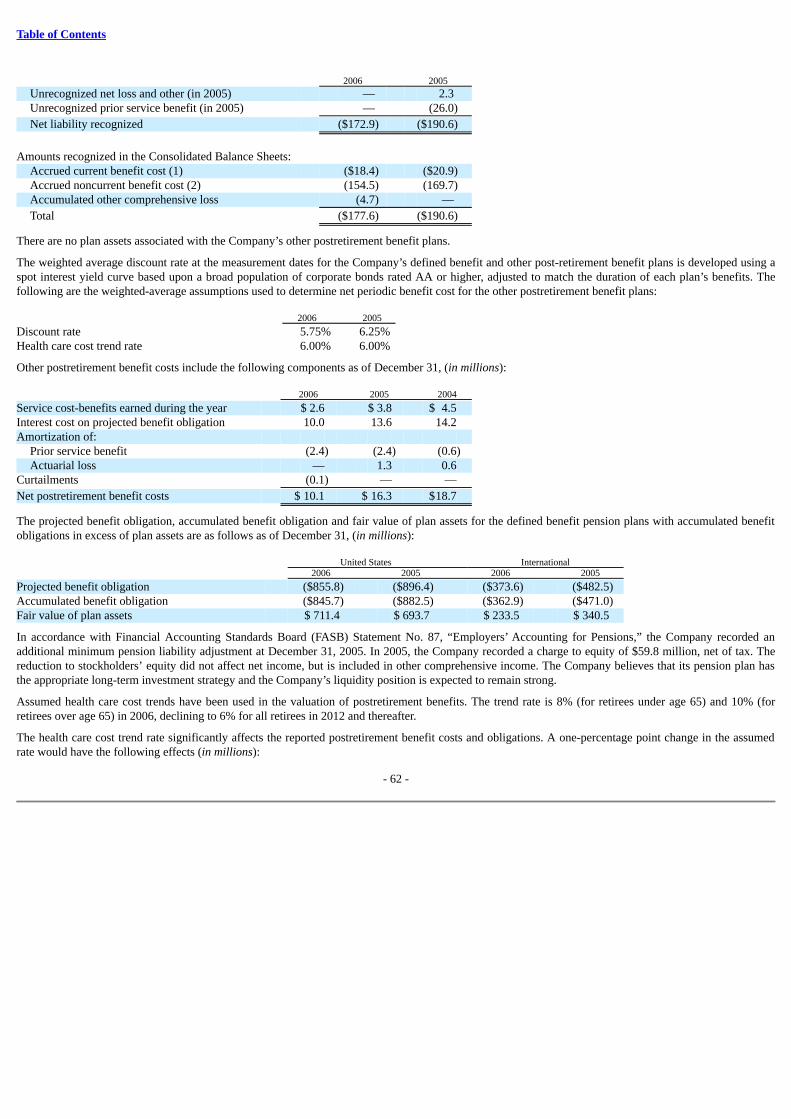
Table of Contents
2006 2005
Unrecognized net loss and other (in 2005) — 2.3 Unrecognized prior service benefit (in 2005) — (26.0)
Net liability recognized ($172.9) ($190.6)
Amounts recognized in the Consolidated Balance Sheets:
Accrued current benefit cost (1) ($18.4) ($20.9)Accrued noncurrent benefit cost (2) (154.5) (169.7)Accumulated other comprehensive loss (4.7) —
Total ($177.6) ($190.6)
There are no plan assets associated with the Company’s other postretirement benefit plans.
The weighted average discount rate at the measurement dates for the Company’s defined benefit and other post-retirement benefit plans is developed using aspot interest yield curve based upon a broad population of corporate bonds rated AA or higher, adjusted to match the duration of each plan’s benefits. Thefollowing are the weighted-average assumptions used to determine net periodic benefit cost for the other postretirement benefit plans: 2006 2005
Discount rate 5.75% 6.25%Health care cost trend rate 6.00% 6.00%
Other postretirement benefit costs include the following components as of December 31, (in millions): 2006 2005 2004
Service cost-benefits earned during the year $ 2.6 $ 3.8 $ 4.5 Interest cost on projected benefit obligation 10.0 13.6 14.2 Amortization of:
Prior service benefit (2.4) (2.4) (0.6)Actuarial loss — 1.3 0.6
Curtailments (0.1) — —
Net postretirement benefit costs $ 10.1 $ 16.3 $18.7
The projected benefit obligation, accumulated benefit obligation and fair value of plan assets for the defined benefit pension plans with accumulated benefitobligations in excess of plan assets are as follows as of December 31, (in millions): United States International 2006 2005 2006 2005
Projected benefit obligation ($855.8) ($896.4) ($373.6) ($482.5)Accumulated benefit obligation ($845.7) ($882.5) ($362.9) ($471.0)Fair value of plan assets $ 711.4 $ 693.7 $ 233.5 $ 340.5
In accordance with Financial Accounting Standards Board (FASB) Statement No. 87, “Employers’ Accounting for Pensions,” the Company recorded anadditional minimum pension liability adjustment at December 31, 2005. In 2005, the Company recorded a charge to equity of $59.8 million, net of tax. Thereduction to stockholders’ equity did not affect net income, but is included in other comprehensive income. The Company believes that its pension plan hasthe appropriate long-term investment strategy and the Company’s liquidity position is expected to remain strong.
Assumed health care cost trends have been used in the valuation of postretirement benefits. The trend rate is 8% (for retirees under age 65) and 10% (forretirees over age 65) in 2006, declining to 6% for all retirees in 2012 and thereafter.
The health care cost trend rate significantly affects the reported postretirement benefit costs and obligations. A one-percentage point change in the assumedrate would have the following effects (in millions):
- 62 -
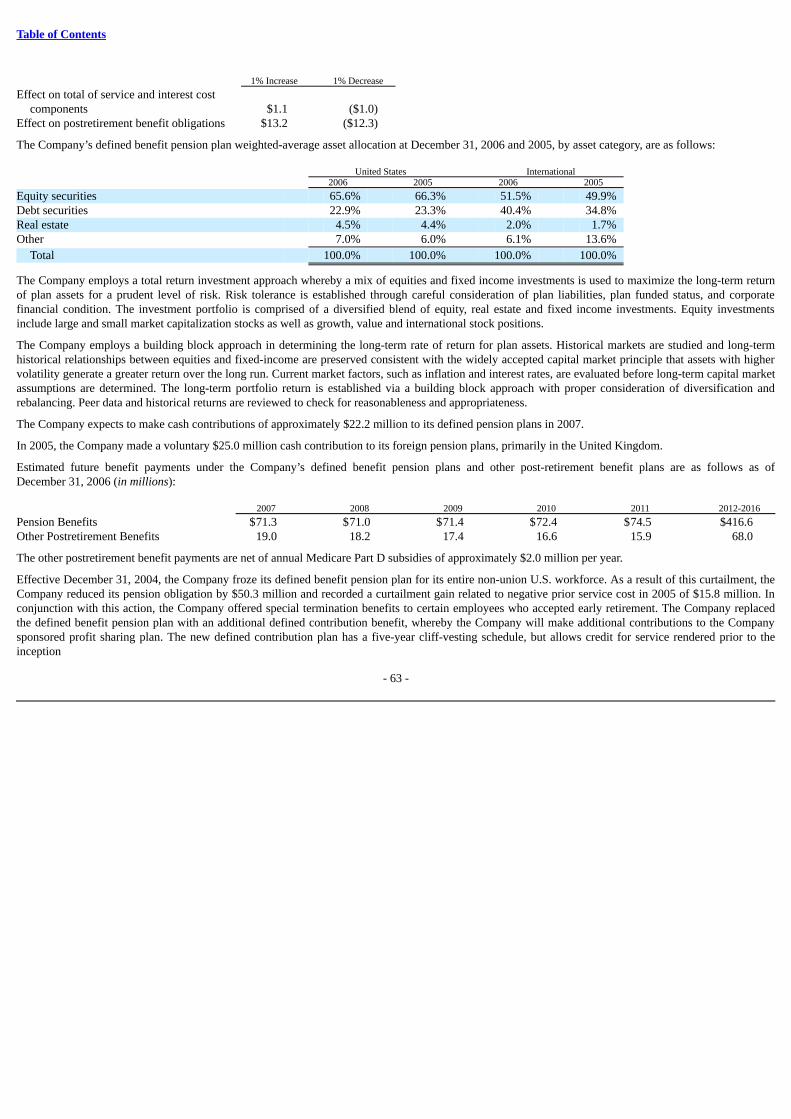
Table of Contents
1% Increase 1% Decrease
Effect on total of service and interest costcomponents $1.1 ($1.0)
Effect on postretirement benefit obligations $13.2 ($12.3)
The Company’s defined benefit pension plan weighted-average asset allocation at December 31, 2006 and 2005, by asset category, are as follows: United States International 2006 2005 2006 2005
Equity securities 65.6% 66.3% 51.5% 49.9%Debt securities 22.9% 23.3% 40.4% 34.8%Real estate 4.5% 4.4% 2.0% 1.7%Other 7.0% 6.0% 6.1% 13.6%
Total 100.0% 100.0% 100.0% 100.0%
The Company employs a total return investment approach whereby a mix of equities and fixed income investments is used to maximize the long-term returnof plan assets for a prudent level of risk. Risk tolerance is established through careful consideration of plan liabilities, plan funded status, and corporatefinancial condition. The investment portfolio is comprised of a diversified blend of equity, real estate and fixed income investments. Equity investmentsinclude large and small market capitalization stocks as well as growth, value and international stock positions.
The Company employs a building block approach in determining the long-term rate of return for plan assets. Historical markets are studied and long-termhistorical relationships between equities and fixed-income are preserved consistent with the widely accepted capital market principle that assets with highervolatility generate a greater return over the long run. Current market factors, such as inflation and interest rates, are evaluated before long-term capital marketassumptions are determined. The long-term portfolio return is established via a building block approach with proper consideration of diversification andrebalancing. Peer data and historical returns are reviewed to check for reasonableness and appropriateness.
The Company expects to make cash contributions of approximately $22.2 million to its defined pension plans in 2007.
In 2005, the Company made a voluntary $25.0 million cash contribution to its foreign pension plans, primarily in the United Kingdom.
Estimated future benefit payments under the Company’s defined benefit pension plans and other post-retirement benefit plans are as follows as ofDecember 31, 2006 (in millions): 2007 2008 2009 2010 2011 2012-2016
Pension Benefits $71.3 $71.0 $71.4 $72.4 $74.5 $416.6 Other Postretirement Benefits 19.0 18.2 17.4 16.6 15.9 68.0
The other postretirement benefit payments are net of annual Medicare Part D subsidies of approximately $2.0 million per year.
Effective December 31, 2004, the Company froze its defined benefit pension plan for its entire non-union U.S. workforce. As a result of this curtailment, theCompany reduced its pension obligation by $50.3 million and recorded a curtailment gain related to negative prior service cost in 2005 of $15.8 million. Inconjunction with this action, the Company offered special termination benefits to certain employees who accepted early retirement. The Company replacedthe defined benefit pension plan with an additional defined contribution benefit, whereby the Company will make additional contributions to the Companysponsored profit sharing plan. The new defined contribution plan has a five-year cliff-vesting schedule, but allows credit for service rendered prior to theinception
- 63 -
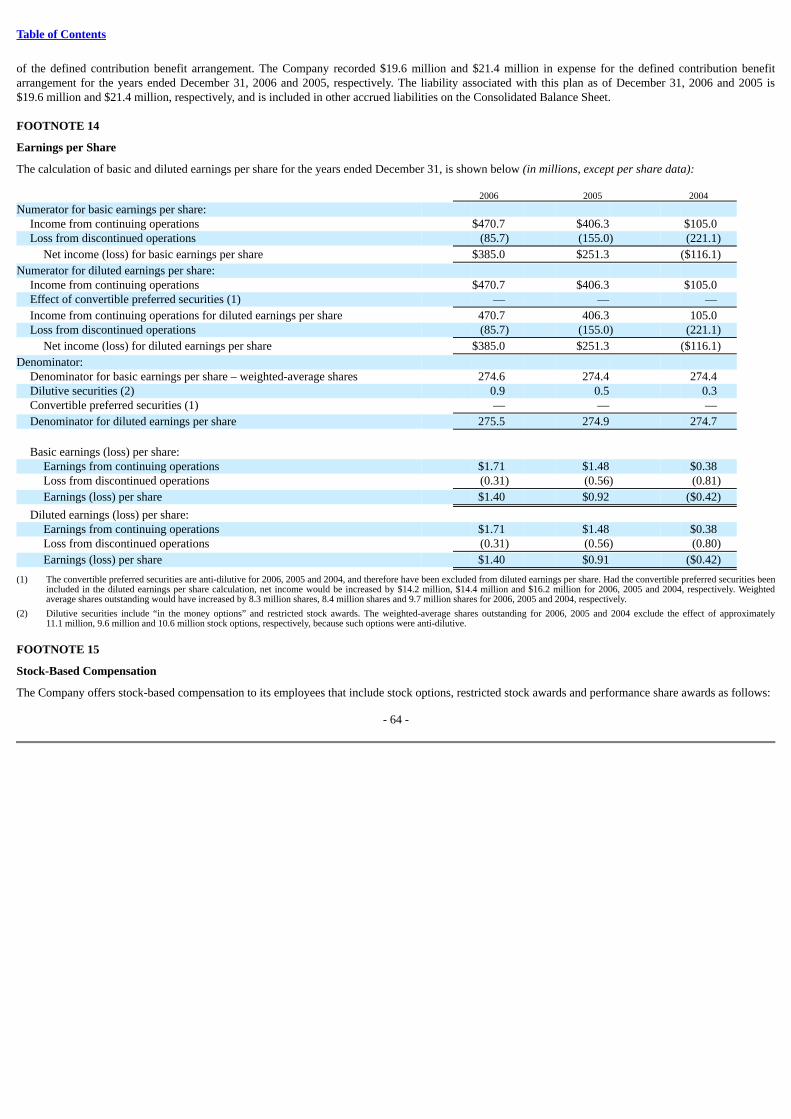
Table of Contents
of the defined contribution benefit arrangement. The Company recorded $19.6 million and $21.4 million in expense for the defined contribution benefitarrangement for the years ended December 31, 2006 and 2005, respectively. The liability associated with this plan as of December 31, 2006 and 2005 is$19.6 million and $21.4 million, respectively, and is included in other accrued liabilities on the Consolidated Balance Sheet.
FOOTNOTE 14
Earnings per Share
The calculation of basic and diluted earnings per share for the years ended December 31, is shown below (in millions, except per share data): 2006 2005 2004
Numerator for basic earnings per share: Income from continuing operations $470.7 $406.3 $105.0 Loss from discontinued operations (85.7) (155.0) (221.1)
Net income (loss) for basic earnings per share $385.0 $251.3 ($116.1)
Numerator for diluted earnings per share: Income from continuing operations $470.7 $406.3 $105.0 Effect of convertible preferred securities (1) — — —
Income from continuing operations for diluted earnings per share 470.7 406.3 105.0 Loss from discontinued operations (85.7) (155.0) (221.1)
Net income (loss) for diluted earnings per share $385.0 $251.3 ($116.1)
Denominator: Denominator for basic earnings per share – weighted-average shares 274.6 274.4 274.4 Dilutive securities (2) 0.9 0.5 0.3 Convertible preferred securities (1) — — —
Denominator for diluted earnings per share 275.5 274.9 274.7
Basic earnings (loss) per share:
Earnings from continuing operations $1.71 $1.48 $0.38 Loss from discontinued operations (0.31) (0.56) (0.81)
Earnings (loss) per share $1.40 $0.92 ($0.42)
Diluted earnings (loss) per share: Earnings from continuing operations $1.71 $1.48 $0.38 Loss from discontinued operations (0.31) (0.56) (0.80)
Earnings (loss) per share $1.40 $0.91 ($0.42)
(1) The convertible preferred securities are anti-dilutive for 2006, 2005 and 2004, and therefore have been excluded from diluted earnings per share. Had the convertible preferred securities beenincluded in the diluted earnings per share calculation, net income would be increased by $14.2 million, $14.4 million and $16.2 million for 2006, 2005 and 2004, respectively. Weightedaverage shares outstanding would have increased by 8.3 million shares, 8.4 million shares and 9.7 million shares for 2006, 2005 and 2004, respectively.
(2) Dilutive securities include “in the money options” and restricted stock awards. The weighted-average shares outstanding for 2006, 2005 and 2004 exclude the effect of approximately11.1 million, 9.6 million and 10.6 million stock options, respectively, because such options were anti-dilutive.
FOOTNOTE 15
Stock-Based Compensation
The Company offers stock-based compensation to its employees that include stock options, restricted stock awards and performance share awards as follows:
- 64 -
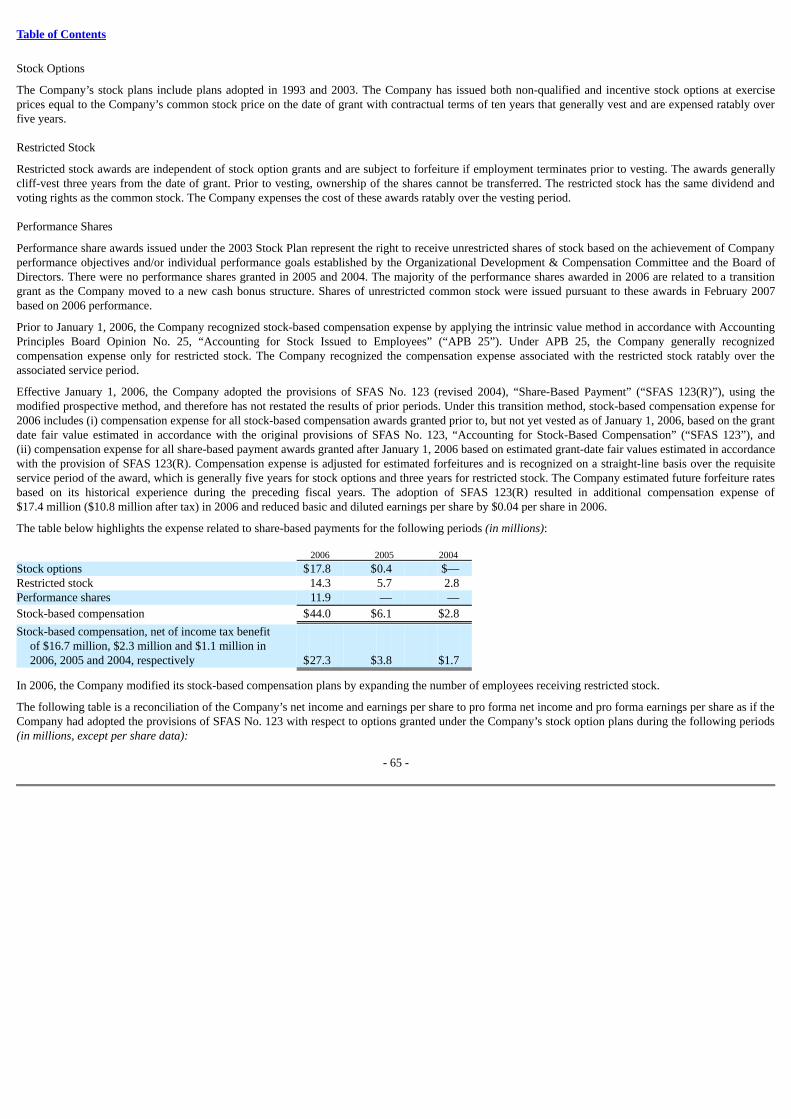
Table of Contents
Stock Options
The Company’s stock plans include plans adopted in 1993 and 2003. The Company has issued both non-qualified and incentive stock options at exerciseprices equal to the Company’s common stock price on the date of grant with contractual terms of ten years that generally vest and are expensed ratably overfive years.
Restricted Stock
Restricted stock awards are independent of stock option grants and are subject to forfeiture if employment terminates prior to vesting. The awards generallycliff-vest three years from the date of grant. Prior to vesting, ownership of the shares cannot be transferred. The restricted stock has the same dividend andvoting rights as the common stock. The Company expenses the cost of these awards ratably over the vesting period.
Performance Shares
Performance share awards issued under the 2003 Stock Plan represent the right to receive unrestricted shares of stock based on the achievement of Companyperformance objectives and/or individual performance goals established by the Organizational Development & Compensation Committee and the Board ofDirectors. There were no performance shares granted in 2005 and 2004. The majority of the performance shares awarded in 2006 are related to a transitiongrant as the Company moved to a new cash bonus structure. Shares of unrestricted common stock were issued pursuant to these awards in February 2007based on 2006 performance.
Prior to January 1, 2006, the Company recognized stock-based compensation expense by applying the intrinsic value method in accordance with AccountingPrinciples Board Opinion No. 25, “Accounting for Stock Issued to Employees” (“APB 25”). Under APB 25, the Company generally recognizedcompensation expense only for restricted stock. The Company recognized the compensation expense associated with the restricted stock ratably over theassociated service period.
Effective January 1, 2006, the Company adopted the provisions of SFAS No. 123 (revised 2004), “Share-Based Payment” (“SFAS 123(R)”), using themodified prospective method, and therefore has not restated the results of prior periods. Under this transition method, stock-based compensation expense for2006 includes (i) compensation expense for all stock-based compensation awards granted prior to, but not yet vested as of January 1, 2006, based on the grantdate fair value estimated in accordance with the original provisions of SFAS No. 123, “Accounting for Stock-Based Compensation” (“SFAS 123”), and(ii) compensation expense for all share-based payment awards granted after January 1, 2006 based on estimated grant-date fair values estimated in accordancewith the provision of SFAS 123(R). Compensation expense is adjusted for estimated forfeitures and is recognized on a straight-line basis over the requisiteservice period of the award, which is generally five years for stock options and three years for restricted stock. The Company estimated future forfeiture ratesbased on its historical experience during the preceding fiscal years. The adoption of SFAS 123(R) resulted in additional compensation expense of$17.4 million ($10.8 million after tax) in 2006 and reduced basic and diluted earnings per share by $0.04 per share in 2006.
The table below highlights the expense related to share-based payments for the following periods (in millions): 2006 2005 2004
Stock options $17.8 $0.4 $— Restricted stock 14.3 5.7 2.8 Performance shares 11.9 — —
Stock-based compensation $44.0 $6.1 $2.8
Stock-based compensation, net of income tax benefitof $16.7 million, $2.3 million and $1.1 million in2006, 2005 and 2004, respectively $27.3 $3.8 $1.7
In 2006, the Company modified its stock-based compensation plans by expanding the number of employees receiving restricted stock.
The following table is a reconciliation of the Company’s net income and earnings per share to pro forma net income and pro forma earnings per share as if theCompany had adopted the provisions of SFAS No. 123 with respect to options granted under the Company’s stock option plans during the following periods(in millions, except per share data):
- 65 -
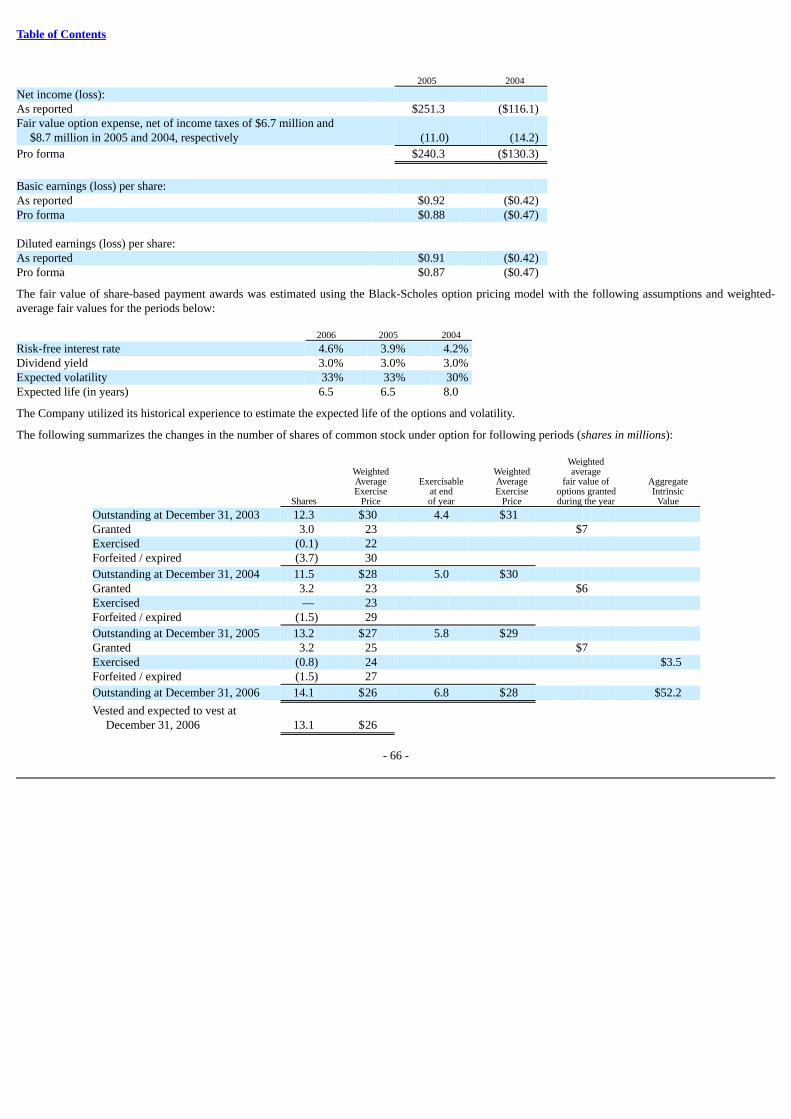
Table of Contents
2005 2004
Net income (loss): As reported $251.3 ($116.1)Fair value option expense, net of income taxes of $6.7 million and
$8.7 million in 2005 and 2004, respectively (11.0) (14.2)
Pro forma $240.3 ($130.3)
Basic earnings (loss) per share: As reported $0.92 ($0.42)Pro forma $0.88 ($0.47) Diluted earnings (loss) per share: As reported $0.91 ($0.42)Pro forma $0.87 ($0.47)
The fair value of share-based payment awards was estimated using the Black-Scholes option pricing model with the following assumptions and weighted-average fair values for the periods below: 2006 2005 2004
Risk-free interest rate 4.6% 3.9% 4.2%Dividend yield 3.0% 3.0% 3.0%Expected volatility 33% 33% 30%Expected life (in years) 6.5 6.5 8.0
The Company utilized its historical experience to estimate the expected life of the options and volatility.
The following summarizes the changes in the number of shares of common stock under option for following periods (shares in millions): Weighted Weighted Weighted average Average Exercisable Average fair value of Aggregate Exercise at end Exercise options granted Intrinsic Shares Price of year Price during the year Value
Outstanding at December 31, 2003 12.3 $30 4.4 $31 Granted 3.0 23 $7 Exercised (0.1) 22 Forfeited / expired (3.7) 30
Outstanding at December 31, 2004 11.5 $28 5.0 $30 Granted 3.2 23 $6 Exercised — 23 Forfeited / expired (1.5) 29
Outstanding at December 31, 2005 13.2 $27 5.8 $29 Granted 3.2 25 $7 Exercised (0.8) 24 $3.5 Forfeited / expired (1.5) 27
Outstanding at December 31, 2006 14.1 $26 6.8 $28 $52.2
Vested and expected to vest atDecember 31, 2006 13.1 $26
- 66 -
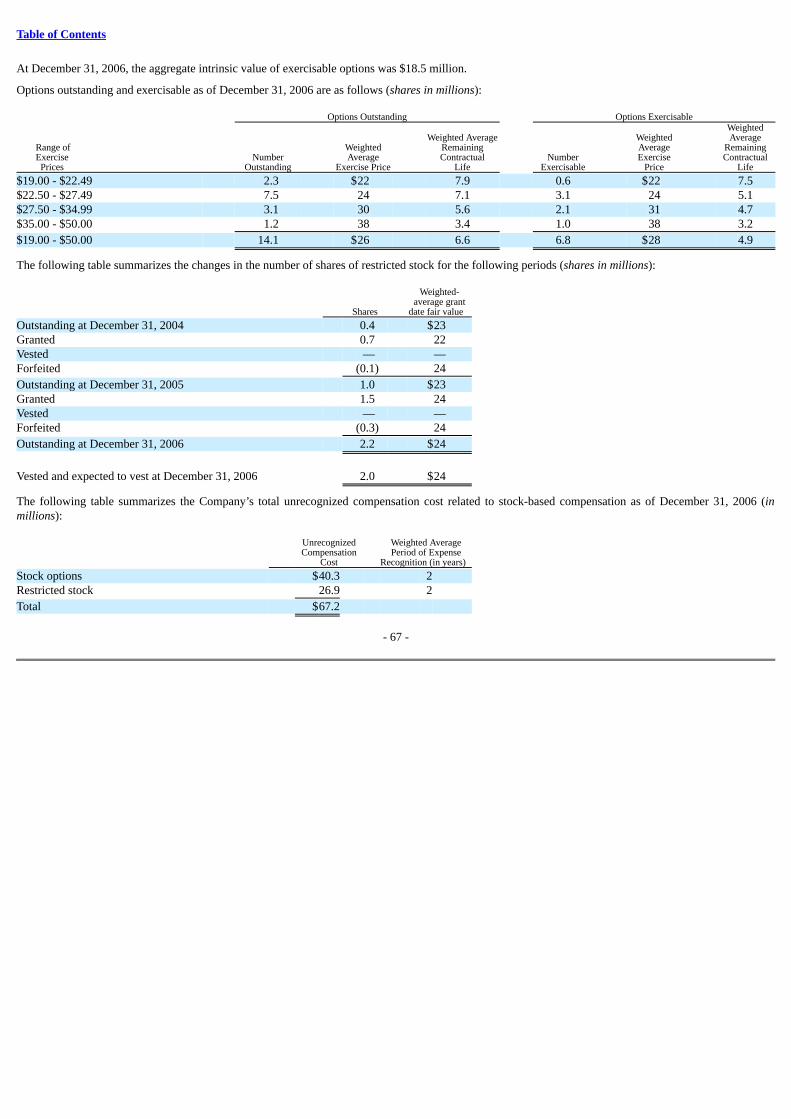
Table of Contents
At December 31, 2006, the aggregate intrinsic value of exercisable options was $18.5 million.
Options outstanding and exercisable as of December 31, 2006 are as follows (shares in millions): Options Outstanding Options Exercisable Weighted Weighted Average Weighted Average Range of Weighted Remaining Average Remaining Exercise Number Average Contractual Number Exercise Contractual Prices Outstanding Exercise Price Life Exercisable Price Life
$19.00 - $22.49 2.3 $22 7.9 0.6 $22 7.5 $22.50 - $27.49 7.5 24 7.1 3.1 24 5.1 $27.50 - $34.99 3.1 30 5.6 2.1 31 4.7 $35.00 - $50.00 1.2 38 3.4 1.0 38 3.2
$19.00 - $50.00 14.1 $26 6.6 6.8 $28 4.9
The following table summarizes the changes in the number of shares of restricted stock for the following periods (shares in millions): Weighted- average grant Shares date fair value
Outstanding at December 31, 2004 0.4 $23 Granted 0.7 22 Vested — — Forfeited (0.1) 24
Outstanding at December 31, 2005 1.0 $23 Granted 1.5 24 Vested — — Forfeited (0.3) 24
Outstanding at December 31, 2006 2.2 $24
Vested and expected to vest at December 31, 2006 2.0 $24
The following table summarizes the Company’s total unrecognized compensation cost related to stock-based compensation as of December 31, 2006 (inmillions): Unrecognized Weighted Average Compensation Period of Expense Cost Recognition (in years)
Stock options $40.3 2 Restricted stock 26.9 2
Total $67.2
- 67 -
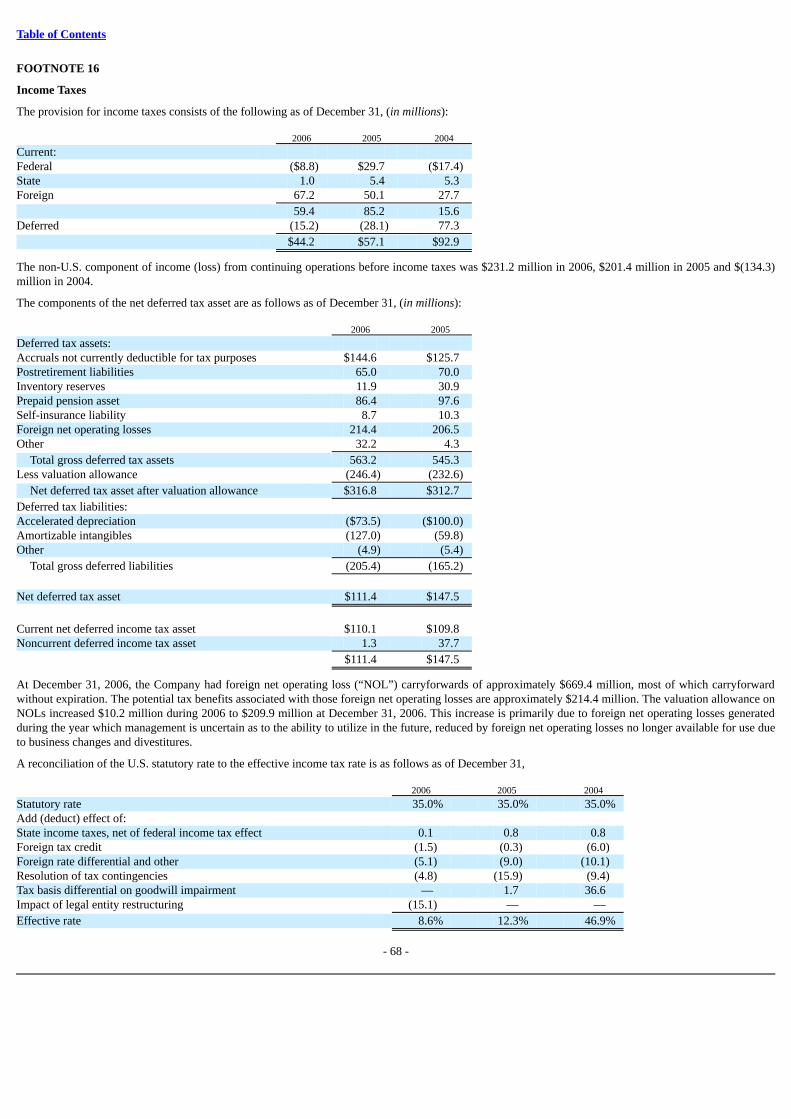
Table of Contents
FOOTNOTE 16
Income Taxes
The provision for income taxes consists of the following as of December 31, (in millions): 2006 2005 2004
Current: Federal ($8.8) $29.7 ($17.4)State 1.0 5.4 5.3 Foreign 67.2 50.1 27.7
59.4 85.2 15.6 Deferred (15.2) (28.1) 77.3
$44.2 $57.1 $92.9
The non-U.S. component of income (loss) from continuing operations before income taxes was $231.2 million in 2006, $201.4 million in 2005 and $(134.3)million in 2004.
The components of the net deferred tax asset are as follows as of December 31, (in millions): 2006 2005
Deferred tax assets: Accruals not currently deductible for tax purposes $144.6 $125.7 Postretirement liabilities 65.0 70.0 Inventory reserves 11.9 30.9 Prepaid pension asset 86.4 97.6 Self-insurance liability 8.7 10.3 Foreign net operating losses 214.4 206.5 Other 32.2 4.3
Total gross deferred tax assets 563.2 545.3 Less valuation allowance (246.4) (232.6)
Net deferred tax asset after valuation allowance $316.8 $312.7
Deferred tax liabilities: Accelerated depreciation ($73.5) ($100.0)Amortizable intangibles (127.0) (59.8)Other (4.9) (5.4)
Total gross deferred liabilities (205.4) (165.2)
Net deferred tax asset $111.4 $147.5
Current net deferred income tax asset $110.1 $109.8 Noncurrent deferred income tax asset 1.3 37.7
$111.4 $147.5
At December 31, 2006, the Company had foreign net operating loss (“NOL”) carryforwards of approximately $669.4 million, most of which carryforwardwithout expiration. The potential tax benefits associated with those foreign net operating losses are approximately $214.4 million. The valuation allowance onNOLs increased $10.2 million during 2006 to $209.9 million at December 31, 2006. This increase is primarily due to foreign net operating losses generatedduring the year which management is uncertain as to the ability to utilize in the future, reduced by foreign net operating losses no longer available for use dueto business changes and divestitures.
A reconciliation of the U.S. statutory rate to the effective income tax rate is as follows as of December 31, 2006 2005 2004
Statutory rate 35.0% 35.0% 35.0%Add (deduct) effect of: State income taxes, net of federal income tax effect 0.1 0.8 0.8 Foreign tax credit (1.5) (0.3) (6.0)Foreign rate differential and other (5.1) (9.0) (10.1)Resolution of tax contingencies (4.8) (15.9) (9.4)Tax basis differential on goodwill impairment — 1.7 36.6 Impact of legal entity restructuring (15.1) — —
Effective rate 8.6% 12.3% 46.9%
- 68 -
Table of Contents
No U.S. deferred taxes have been provided on the undistributed non-U.S. subsidiary earnings that are considered to be permanently invested. AtDecember 31, 2006, the estimated amount of total unremitted non-U.S. subsidiary earnings is $417.9 million.
Significant Income Tax Matters and Resolution of Tax Contingencies
2006
The Company completed the reorganization of certain legal entities in Europe which resulted in the recognition of an income tax benefit of $78.0 million.
The Company determined that it would more likely than not be able to utilize certain capital loss carryforwards that it previously believed would expireunused as a result of expected capital gains. Accordingly, the Company reversed an income tax valuation reserve of $3.6 million.
The statute of limitations on certain transactions for which the Company had provided tax reserves, in whole or in part, expired resulting in the reversal of theprovisions and interest accrued thereon in the amount of $21.2 million.
2005
In January 2005, the Company reached agreement with the Internal Revenue Service (IRS) relating to the appropriate treatment of a specific deductionincluded in the Company’s 2003 U.S. federal income tax return. The Company requested accelerated review of the transaction under the IRS’ Pre-FilingAgreement Program that resulted in affirmative resolution in late January 2005. A $58.6 million benefit was recorded in income taxes for 2005 related to thisissue. The amount was fully reserved as of December 31, 2004.
In 2005, the statute of limitations on certain tax positions for which the Company had provided tax reserves, in whole or in part, expired resulting in thereversal of the provisions and interest accrued thereon in the amounts of $15.3 million.
2004
In 2004, the Company received a refund of $2.9 million from the IRS relating to amounts previously paid and recorded this amount as a reduction to incometaxes. Also during 2004, the statute of limitations on certain transactions for which the Company had provided tax reserves, in whole or in part, expiredresulting in the reversal of the provisions and interest accrued thereon in the amount of $43.6 million. Accordingly, the impact was recorded as a reduction toincome taxes.
In 2004, due to significant restructuring activity and certain changes in the Company’s business model affecting the utilization of net operating losscarryovers, particularly in certain European countries, the valuation allowance on certain net operating losses previously tax-benefited was increased by$31.0 million. This amount was recorded in income taxes for 2004.
FOOTNOTE 17
Impairment Charges
2006
There were no non-cash impairment charges recorded in 2006.
2005
In 2005, the Company recorded non-cash impairment charges of $0.4 million for trademarks and tradenames related to businesses in the Company’s Tools &Hardware segment.
- 69 -
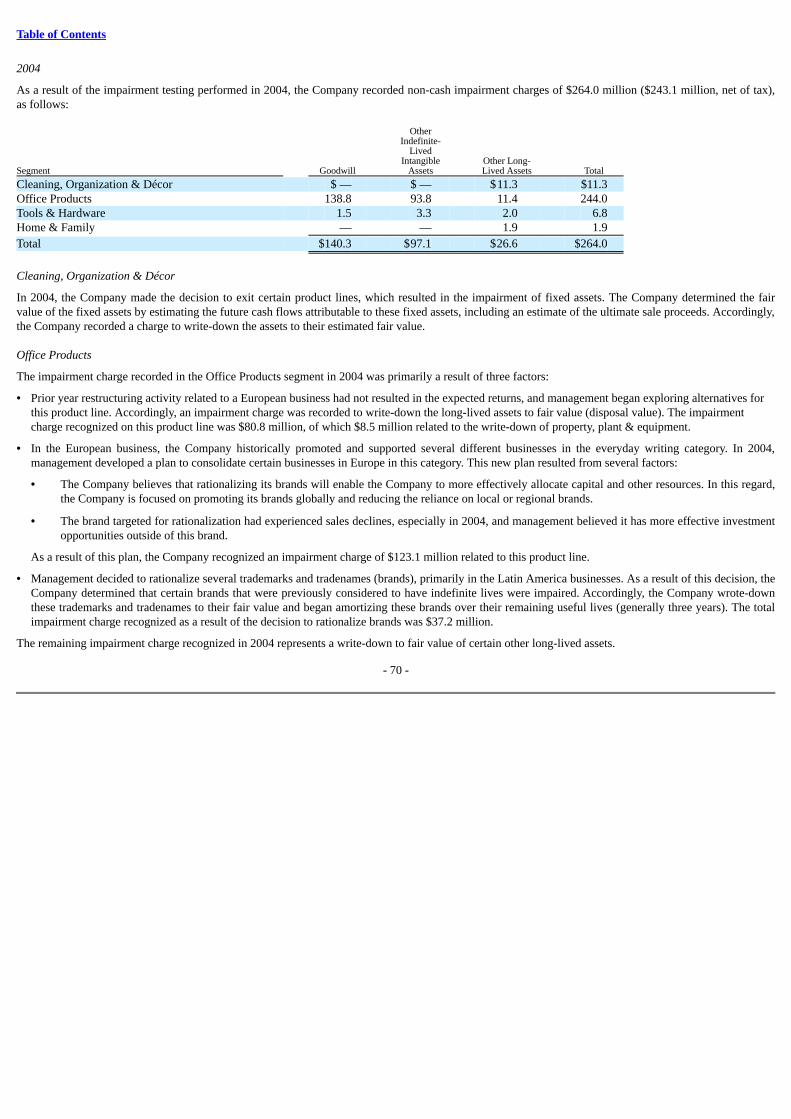
Table of Contents
2004
As a result of the impairment testing performed in 2004, the Company recorded non-cash impairment charges of $264.0 million ($243.1 million, net of tax),as follows: Other Indefinite- Lived Intangible Other Long- Segment Goodwill Assets Lived Assets Total
Cleaning, Organization & Décor $ — $ — $11.3 $11.3 Office Products 138.8 93.8 11.4 244.0 Tools & Hardware 1.5 3.3 2.0 6.8 Home & Family — — 1.9 1.9
Total $140.3 $97.1 $26.6 $264.0
Cleaning, Organization & Décor
In 2004, the Company made the decision to exit certain product lines, which resulted in the impairment of fixed assets. The Company determined the fairvalue of the fixed assets by estimating the future cash flows attributable to these fixed assets, including an estimate of the ultimate sale proceeds. Accordingly,the Company recorded a charge to write-down the assets to their estimated fair value.
Office Products
The impairment charge recorded in the Office Products segment in 2004 was primarily a result of three factors:
• Prior year restructuring activity related to a European business had not resulted in the expected returns, and management began exploring alternatives forthis product line. Accordingly, an impairment charge was recorded to write-down the long-lived assets to fair value (disposal value). The impairmentcharge recognized on this product line was $80.8 million, of which $8.5 million related to the write-down of property, plant & equipment.
• In the European business, the Company historically promoted and supported several different businesses in the everyday writing category. In 2004,management developed a plan to consolidate certain businesses in Europe in this category. This new plan resulted from several factors:
• The Company believes that rationalizing its brands will enable the Company to more effectively allocate capital and other resources. In this regard,the Company is focused on promoting its brands globally and reducing the reliance on local or regional brands.
• The brand targeted for rationalization had experienced sales declines, especially in 2004, and management believed it has more effective investmentopportunities outside of this brand.
As a result of this plan, the Company recognized an impairment charge of $123.1 million related to this product line.
• Management decided to rationalize several trademarks and tradenames (brands), primarily in the Latin America businesses. As a result of this decision, theCompany determined that certain brands that were previously considered to have indefinite lives were impaired. Accordingly, the Company wrote-downthese trademarks and tradenames to their fair value and began amortizing these brands over their remaining useful lives (generally three years). The totalimpairment charge recognized as a result of the decision to rationalize brands was $37.2 million.
The remaining impairment charge recognized in 2004 represents a write-down to fair value of certain other long-lived assets.
- 70 -
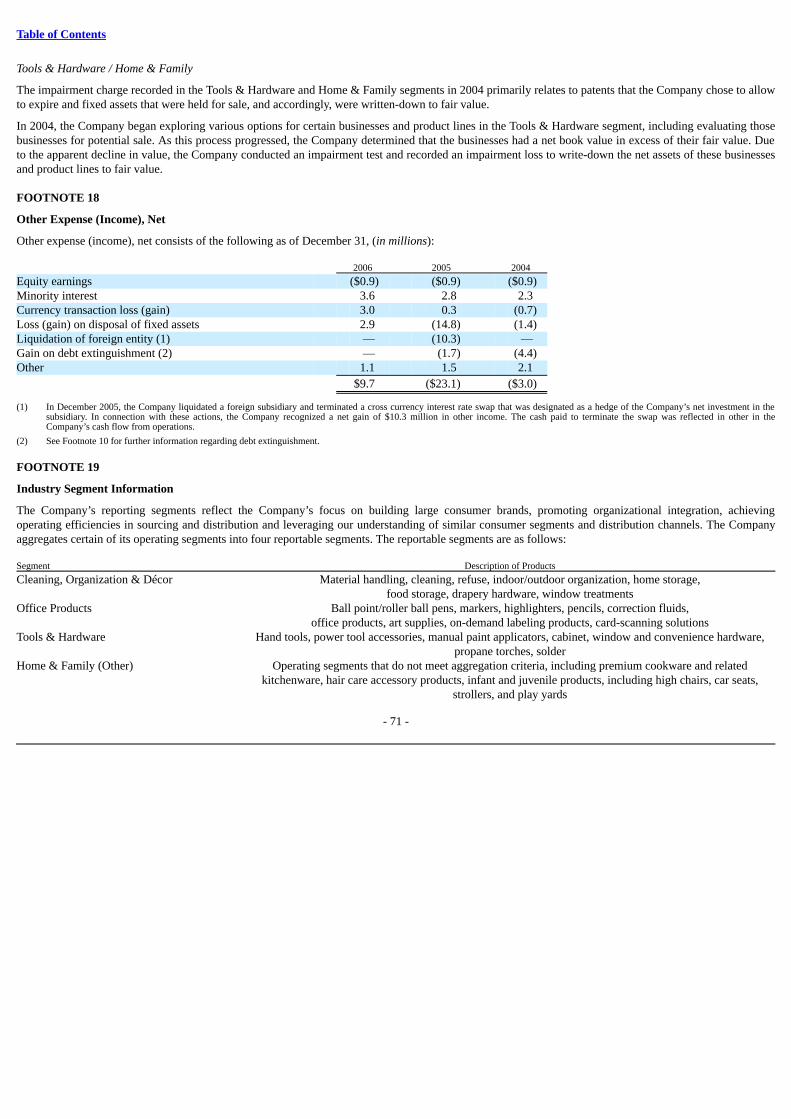
Table of Contents
Tools & Hardware / Home & Family
The impairment charge recorded in the Tools & Hardware and Home & Family segments in 2004 primarily relates to patents that the Company chose to allowto expire and fixed assets that were held for sale, and accordingly, were written-down to fair value.
In 2004, the Company began exploring various options for certain businesses and product lines in the Tools & Hardware segment, including evaluating thosebusinesses for potential sale. As this process progressed, the Company determined that the businesses had a net book value in excess of their fair value. Dueto the apparent decline in value, the Company conducted an impairment test and recorded an impairment loss to write-down the net assets of these businessesand product lines to fair value.
FOOTNOTE 18
Other Expense (Income), Net
Other expense (income), net consists of the following as of December 31, (in millions): 2006 2005 2004
Equity earnings ($0.9) ($0.9) ($0.9)Minority interest 3.6 2.8 2.3 Currency transaction loss (gain) 3.0 0.3 (0.7)Loss (gain) on disposal of fixed assets 2.9 (14.8) (1.4)Liquidation of foreign entity (1) — (10.3) — Gain on debt extinguishment (2) — (1.7) (4.4)Other 1.1 1.5 2.1
$9.7 ($23.1) ($3.0)
(1) In December 2005, the Company liquidated a foreign subsidiary and terminated a cross currency interest rate swap that was designated as a hedge of the Company’s net investment in thesubsidiary. In connection with these actions, the Company recognized a net gain of $10.3 million in other income. The cash paid to terminate the swap was reflected in other in theCompany’s cash flow from operations.
(2) See Footnote 10 for further information regarding debt extinguishment.
FOOTNOTE 19
Industry Segment Information
The Company’s reporting segments reflect the Company’s focus on building large consumer brands, promoting organizational integration, achievingoperating efficiencies in sourcing and distribution and leveraging our understanding of similar consumer segments and distribution channels. The Companyaggregates certain of its operating segments into four reportable segments. The reportable segments are as follows: Segment Description of Products
Cleaning, Organization & Décor
Material handling, cleaning, refuse, indoor/outdoor organization, home storage,food storage, drapery hardware, window treatments
Office Products
Ball point/roller ball pens, markers, highlighters, pencils, correction fluids,office products, art supplies, on-demand labeling products, card-scanning solutions
Tools & Hardware
Hand tools, power tool accessories, manual paint applicators, cabinet, window and convenience hardware,propane torches, solder
Home & Family (Other)
Operating segments that do not meet aggregation criteria, including premium cookware and relatedkitchenware, hair care accessory products, infant and juvenile products, including high chairs, car seats,
strollers, and play yards
- 71 -
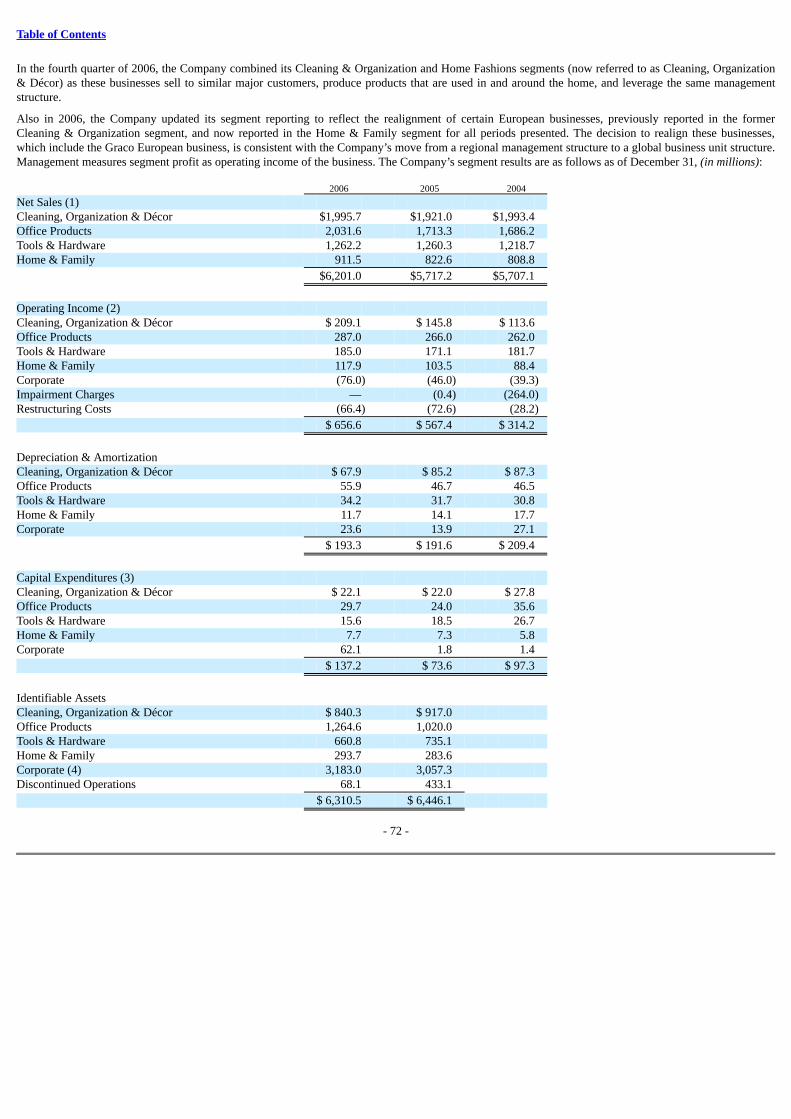
Table of Contents
In the fourth quarter of 2006, the Company combined its Cleaning & Organization and Home Fashions segments (now referred to as Cleaning, Organization& Décor) as these businesses sell to similar major customers, produce products that are used in and around the home, and leverage the same managementstructure.
Also in 2006, the Company updated its segment reporting to reflect the realignment of certain European businesses, previously reported in the formerCleaning & Organization segment, and now reported in the Home & Family segment for all periods presented. The decision to realign these businesses,which include the Graco European business, is consistent with the Company’s move from a regional management structure to a global business unit structure.Management measures segment profit as operating income of the business. The Company’s segment results are as follows as of December 31, (in millions): 2006 2005 2004
Net Sales (1) Cleaning, Organization & Décor $1,995.7 $1,921.0 $1,993.4 Office Products 2,031.6 1,713.3 1,686.2 Tools & Hardware 1,262.2 1,260.3 1,218.7 Home & Family 911.5 822.6 808.8
$6,201.0 $5,717.2 $5,707.1
Operating Income (2) Cleaning, Organization & Décor $ 209.1 $ 145.8 $ 113.6 Office Products 287.0 266.0 262.0 Tools & Hardware 185.0 171.1 181.7 Home & Family 117.9 103.5 88.4 Corporate (76.0) (46.0) (39.3)Impairment Charges — (0.4) (264.0)Restructuring Costs (66.4) (72.6) (28.2)
$ 656.6 $ 567.4 $ 314.2
Depreciation & Amortization Cleaning, Organization & Décor $ 67.9 $ 85.2 $ 87.3 Office Products 55.9 46.7 46.5 Tools & Hardware 34.2 31.7 30.8 Home & Family 11.7 14.1 17.7 Corporate 23.6 13.9 27.1
$ 193.3 $ 191.6 $ 209.4
Capital Expenditures (3) Cleaning, Organization & Décor $ 22.1 $ 22.0 $ 27.8 Office Products 29.7 24.0 35.6 Tools & Hardware 15.6 18.5 26.7 Home & Family 7.7 7.3 5.8 Corporate 62.1 1.8 1.4
$ 137.2 $ 73.6 $ 97.3
Identifiable Assets Cleaning, Organization & Décor $ 840.3 $ 917.0 Office Products 1,264.6 1,020.0 Tools & Hardware 660.8 735.1 Home & Family 293.7 283.6 Corporate (4) 3,183.0 3,057.3 Discontinued Operations 68.1 433.1
$ 6,310.5 $ 6,446.1
- 72 -
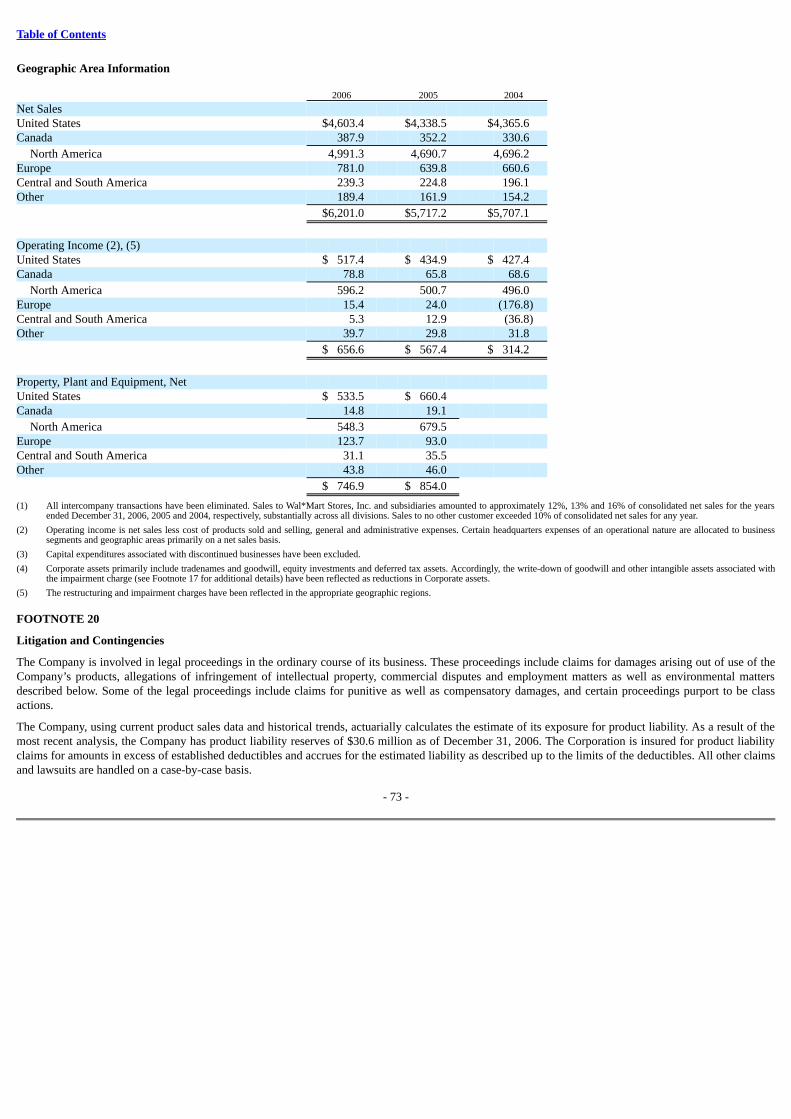
Table of Contents
Geographic Area Information 2006 2005 2004
Net Sales United States $4,603.4 $4,338.5 $4,365.6 Canada 387.9 352.2 330.6
North America 4,991.3 4,690.7 4,696.2 Europe 781.0 639.8 660.6 Central and South America 239.3 224.8 196.1 Other 189.4 161.9 154.2
$6,201.0 $5,717.2 $5,707.1
Operating Income (2), (5) United States $ 517.4 $ 434.9 $ 427.4 Canada 78.8 65.8 68.6
North America 596.2 500.7 496.0 Europe 15.4 24.0 (176.8)Central and South America 5.3 12.9 (36.8)Other 39.7 29.8 31.8
$ 656.6 $ 567.4 $ 314.2
Property, Plant and Equipment, Net United States $ 533.5 $ 660.4 Canada 14.8 19.1
North America 548.3 679.5 Europe 123.7 93.0 Central and South America 31.1 35.5 Other 43.8 46.0
$ 746.9 $ 854.0
(1) All intercompany transactions have been eliminated. Sales to Wal*Mart Stores, Inc. and subsidiaries amounted to approximately 12%, 13% and 16% of consolidated net sales for the yearsended December 31, 2006, 2005 and 2004, respectively, substantially across all divisions. Sales to no other customer exceeded 10% of consolidated net sales for any year.
(2) Operating income is net sales less cost of products sold and selling, general and administrative expenses. Certain headquarters expenses of an operational nature are allocated to businesssegments and geographic areas primarily on a net sales basis.
(3) Capital expenditures associated with discontinued businesses have been excluded.
(4) Corporate assets primarily include tradenames and goodwill, equity investments and deferred tax assets. Accordingly, the write-down of goodwill and other intangible assets associated withthe impairment charge (see Footnote 17 for additional details) have been reflected as reductions in Corporate assets.
(5) The restructuring and impairment charges have been reflected in the appropriate geographic regions.
FOOTNOTE 20
Litigation and Contingencies
The Company is involved in legal proceedings in the ordinary course of its business. These proceedings include claims for damages arising out of use of theCompany’s products, allegations of infringement of intellectual property, commercial disputes and employment matters as well as environmental mattersdescribed below. Some of the legal proceedings include claims for punitive as well as compensatory damages, and certain proceedings purport to be classactions.
The Company, using current product sales data and historical trends, actuarially calculates the estimate of its exposure for product liability. As a result of themost recent analysis, the Company has product liability reserves of $30.6 million as of December 31, 2006. The Corporation is insured for product liabilityclaims for amounts in excess of established deductibles and accrues for the estimated liability as described up to the limits of the deductibles. All other claimsand lawsuits are handled on a case-by-case basis.
- 73 -
Table of Contents
As of December 31, 2006, the Company was involved in various matters concerning federal and state environmental laws and regulations, including mattersin which the Company has been identified by the U.S. Environmental Protection Agency and certain state environmental agencies as a potentially responsibleparty (“PRP”) at contaminated sites under the Federal Comprehensive Environmental Response, Compensation and Liability Act (“CERCLA”) andequivalent state laws.
In assessing its environmental response costs, the Company has considered several factors, including the extent of the Company’s volumetric contribution ateach site relative to that of other PRPs; the kind of waste; the terms of existing cost sharing and other applicable agreements; the financial ability of otherPRPs to share in the payment of requisite costs; the Company’s prior experience with similar sites; environmental studies and cost estimates available to theCompany; the effects of inflation on cost estimates; and the extent to which the Company’s, and other parties’, status as PRPs is disputed.
The Company’s estimate of environmental response costs associated with these matters as of December 31, 2006 ranged between $15.9 million and$35.6 million. As of December 31, 2006, the Company had a reserve equal to $19.8 million for such environmental response costs in the aggregate, which isincluded in other accrued liabilities and other noncurrent liabilities in the Consolidated Balance Sheets. No insurance recovery was taken into account indetermining the Company’s cost estimates or reserve, nor do the Company’s cost estimates or reserve reflect any discounting for present value purposes,except with respect to four long-term (30 year) operations and maintenance CERCLA matters which are estimated at their present value of $9.5 million.
Because of the uncertainties associated with environmental investigations and response activities, the possibility that the Company could be identified as aPRP at sites identified in the future that require the incurrence of environmental response costs and the possibility of additional sites as a result of businessesacquired, actual costs to be incurred by the Company may vary from the Company’s estimates.
Although management of the Company cannot predict the ultimate outcome of these legal proceedings with certainty, it believes that the ultimate resolutionof the Company’s legal proceedings, including any amounts it may be required to pay in excess of amounts reserved, will not have a material effect on theCompany’s Consolidated Financial Statements.
In the normal course of business and as part of its acquisition and divestiture strategy, the Company may provide certain representations and indemnificationsrelated to legal, environmental, product liability, tax or other types of issues. Based on the nature of these representations and indemnifications, it is notpossible to predict the maximum potential payments under all of these agreements due to the conditional nature of the Company’s obligations and the uniquefacts and circumstances involved in each particular agreement. Historically, payments made by the Company under these agreements did not have a materialeffect on the Company’s business, financial condition or results of operation.
As of December 31, 2006, the Company had $95.4 million in standby letters of credit primarily related to the Company’s self-insurance programs, includingworkers’ compensation, product liability, and medical.
ITEM 9. CHANGES IN AND DISAGREEMENTS WITH ACCOUNTANTS ON ACCOUNTING AND FINANCIAL DISCLOSURE
Not applicable.
ITEM 9A. CONTROLS AND PROCEDURES
(a) Evaluation of Disclosure Controls and Procedures. As of December 31, 2006, an evaluation was performed by the Company’s management, underthe supervision and with the participation of the Company’s chief executive officer and chief financial officer, of the effectiveness of the Company’sdisclosure controls and procedures. Based on that evaluation, the chief executive officer and the chief financial officer concluded that the Company’sdisclosure controls and procedures were effective.
(b) Management’s Report on Internal Control Over Financial Reporting. The Company’s management’s
- 74 -
Table of Contents
annual report on internal control over financial reporting is set forth under Item 8 of this annual report and is incorporated herein by reference.
(c) Attestation Report of the Registered Public Accounting Firm. The attestation report of Ernst & Young LLP, the Company’s independent registeredpublic accounting firm, on management’s assessment of the Company’s internal control over financial reporting is set forth under Item 8 of thisannual report and is incorporated herein by reference.
(d) Changes in Internal Control Over Financial Reporting. There were no changes in the Company’s internal control over financial reporting thatoccurred during the quarter ended December 31, 2006 that have materially affected, or are reasonably likely to materially affect, the Company’sinternal control over financial reporting.
ITEM 9B. OTHER INFORMATION
Not applicable.
PART III
ITEM 10. DIRECTORS, EXECUTIVE OFFICERS AND CORPORATE GOVERNANCE
Information required under this Item with respect to Directors will be contained in the Company’s Proxy Statement for the Annual Meeting of Stockholders tobe held May 8, 2007 (the “Proxy Statement”) under the captions “Election of Directors” and “Information Regarding Board of Directors and Committees andCorporate Governance,” which information is incorporated by reference herein.
Information required under this Item with respect to Executive Officers of the Company is included as a supplemental item at the end of Part I of this report.
Information required under this Item with respect to compliance with Section 16(a) of the Exchange Act will be included in the Proxy Statement under thecaption “Section 16(a) Beneficial Ownership Compliance Reporting,” which information is incorporated by reference herein.
Information required under this Item with respect to the Company’s Code of Ethics for Senior Financial Officers will be included in the Proxy Statementunder the caption “Information Regarding Board of Directors and Committees and Corporate Governance — Code of Ethics,” which information isincorporated by reference herein.
Information required under this Item with respect to the audit committee and audit committee financial experts will be included in the Proxy Statement underthe caption “Information Regarding Board of Directors and Committees and Corporate Governance — Committees — Audit Committee,” which informationis incorporated by reference herein.
Information required under this Item with respect to communications between security holders and Directors will be included in the Proxy Statement underthe caption “Information Regarding Board of Directors and Committees and Corporate Governance — Director Nomination Process,” and “InformationRegarding Board of Directors and Committees and Corporate Governance – Communications with the Board of Directors,” which information is incorporatedby reference herein.
ITEM 11. EXECUTIVE COMPENSATION
Information required under this Item will be included in the Proxy Statement under the captions “Organizational Development & Compensation CommitteeReport” and “Executive Compensation,” which information is incorporated by reference herein.
ITEM 12. SECURITY OWNERSHIP OF CERTAIN BENEFICIAL OWNERS AND MANAGEMENT AND RELATED STOCKHOLDERMATTERS
- 75 -
Table of Contents
Information required under this Item will be included in the Proxy Statement under the captions “Certain Beneficial Owners” and “Equity Compensation PlanInformation,” which information is incorporated by reference herein.
ITEM 13. CERTAIN RELATIONSHIPS AND RELATED TRANSACTIONS, AND DIRECTOR INDEPENDENCE
Information required under this Item with respect to certain relationships and related transactions will be included in the Proxy Statement under the caption“Certain Relationships and Related Transactions,” which information is incorporated by reference herein.
Information required under this Item with respect to director independence will be included in the Proxy Statement under the caption “Information RegardingBoard of Directors and Committees and Corporate Governance – Director Independence,” which information is incorporated by reference herein.
ITEM 14. PRINCIPAL ACCOUNTANT FEES AND SERVICES
Information required under this Item will be included in the Proxy Statement under the caption “Ratification of Appointment of Independent RegisteredPublic Accounting Firm,” which information is incorporated by reference herein.
PART IV
ITEM 15. EXHIBITS AND FINANCIAL STATEMENT SCHEDULES
(a)(1) The following is a list of the financial statements of Newell Rubbermaid Inc. included in this report on Form 10-K, which are filed herewith pursuant toItem 8:
Report of Independent Registered Public Accounting Firm
Consolidated Statements of Operations — Years Ended December 31, 2006, 2005 and 2004
Consolidated Balance Sheets — December 31, 2006 and 2005
Consolidated Statements of Cash Flows — Years Ended December 31, 2006, 2005 and 2004
Consolidated Statements of Stockholders’ Equity and Comprehensive (Loss) Income — Years Ended December 31, 2006, 2005 and 2004
Notes to Consolidated Financial Statements — December 31, 2006, 2005 and 2004
(2) The following consolidated financial statement schedule of the Company included in this report on Form 10-K is filed herewith pursuant to Item 15(c) andappears immediately following the Exhibit Index:
SCHEDULE II — VALUATION AND QUALIFYING ACCOUNTS
All other financial schedules are not required under the related instructions or are inapplicable and, therefore, have been omitted.
(3) The exhibits filed herewith are listed on the Exhibit Index filed as part of this report on Form 10-K. Each management contract or compensatory plan orarrangement of the Company listed on the Exhibit Index is separately identified by an asterisk.
- 76 -
Table of Contents
(b) EXHIBIT INDEX Exhibit Number Description of Exhibit Item 3.
Articles of Incorporation and By-Laws
3.1
Restated Certificate of Incorporation of Newell Rubbermaid Inc., as amended as of April 5, 2001(incorporated by reference to Exhibit 3.1 to the Company’s Quarterly Report on Form 10-Q for thequarterly period ended March 31, 2001).
3.2
By-Laws of Newell Rubbermaid Inc., as amended (incorporated by reference to Exhibit 3.1 of theCompany’s Quarterly Report on Form 10-Q for the quarterly period ended March 31, 2006).
Item 4.
Instruments Defining theRights of Security Holders,Including Indentures
4.1
Restated Certificate of Incorporation of Newell Rubbermaid Inc., as amended as of April 5, 2001, isincluded in Item 3.1.
4.2 By-Laws of Newell Rubbermaid Inc., as amended, are included in Item 3.2.
4.3
Indenture dated as of April 15, 1992, between the Company and The Chase Manhattan Bank (nowknown as JPMorgan Chase Bank), as Trustee (incorporated by reference to Exhibit 4.4 to theCompany’s Report on Form 8 amending the Company’s Quarterly Report on Form 10-Q for thequarterly period ended March 31, 1992, File No. 001-09608).
4.4
Indenture dated as of November 1, 1995, between the Company and The Chase Manhattan Bank(now known as JPMorgan Chase Bank), as Trustee (incorporated by reference to Exhibit 4.4 to theCompany’s Report on Form 8 amending the Company’s Quarterly Report on Form 10-Q for thequarterly period ended March 31, 1992, File No. 001-09608).
4.5
Junior Convertible Subordinated Indenture for the 5.25% Convertible Subordinated Debentures,dated as of December 12, 1997, between the Company and The Chase Manhattan Bank (now knownas JPMorgan Chase Bank), as Indenture Trustee (incorporated by reference to Exhibit 4.3 to theCompany’s Registration Statement on Form S-3, File No. 333-47261, filed March 3, 1998 (the“1998 Form S-3”)).
4.6
Specimen Common Stock Certificate (incorporated by reference to Exhibit 4.7 to the Company’sQuarterly Report on Form 10-Q for the quarterly period ended September 30, 2006).
4.7
Credit Agreement, dated as of November 14, 2005, by and among, the Company, JPMorgan ChaseBank, N.A., as administrative agent, and each lender a signatory thereto (incorporated by referenceto Exhibit 10.1 to the Company’s Current Report on Form 8-K dated November 14, 2005), asamended effective October 10, 2006, and as further amended as of October 12, 2006 (whichamendments are included as Exhibit 4.7 to this Report).
- 77 -
Table of Contents
Exhibit Number Description of Exhibit
Pursuant to item 601(b)(4)(iii)(A) of Regulation S-K, the Company is not filing certain documents.The Company agrees to furnish a copy of each such document upon the request of the Commission.
Item 10.
Material Contracts
*10.1
Newell Rubbermaid Inc. Management Cash Bonus Plan, effective January 1, 2002, as amendedeffective November 9, 2005 (incorporated by reference to Exhibit 10.3 to the Company’s AnnualReport on Form 10-K for the year ended December 31, 2002, and to Exhibit 10.2 to the Company’sQuarterly Report on Form 10-Q for the quarter ended March 31, 2006).
*10.2
Newell Co. Deferred Compensation Plan, as amended and restated effective January 1, 1997(incorporated by reference to Exhibit 10.3 to the Company’s Annual Report on Form 10-K for theyear ended December 31, 1998, File No. 001-09608).
*10.3
Newell Rubbermaid Inc. 2002 Deferred Compensation Plan, as amended and restated as of January 1,2004 (incorporated by reference to Exhibit 10.1 to the Company’s Quarterly Report on Form 10-Q forthe quarterly period ended March 31, 2004).
*10.4
Rubbermaid Incorporated 1993 Deferred Compensation Plan (incorporated by reference to Exhibit Aof the Rubbermaid Incorporated Proxy Statement for the April 27, 1993 Annual Meeting ofShareholders, File No. 001-04188).
*10.5
Newell Rubbermaid Supplemental Executive Retirement Plan, effective January 1, 2004 (incorporatedby reference to Exhibit 10.3 to the Company’s Quarterly Report on Form 10-Q for the quarterlyperiod ended March 31, 2004), as amended effective January 1, 2007 (which amendment is includedas Exhibit 10.5 to this Report).
*10.6
Newell Rubbermaid Inc. 1993 Stock Option Plan, effective February 9, 1993, as amended May 26,1999 and August 15, 2001 (incorporated by reference to Exhibit 10.12 to the Company’s QuarterlyReport on Form 10-Q for the quarterly period ended June 30, 1999, File No. 001-09608, andExhibit 10 to the Company’s Quarterly Report on Form 10-Q for the quarterly period endedSeptember 30, 2001).
*10.7
Newell Rubbermaid Inc. 2003 Stock Plan, as amended and restated effective February 8, 2006, and asamended effective August 9, 2006 (incorporated by reference to Appendix B to the Company’s ProxyStatement, dated April 3, 2006, and Exhibit 10.2 to the Company’s Quarterly Report on Form 10-Qfor the quarter ended September 30, 2006).
*10.8
Forms of Stock Option Agreement under the Newell Rubbermaid Inc. 2003 Stock Plan, as amendedand restated effective February 8, 2006 (incorporated by reference to Exhibit 10.2 to the Company’sQuarterly Report on Form 10-Q for the quarter ended June 30, 2006).
- 78 -
Table of Contents
Exhibit Number Description of Exhibit
*10.9
Form of Stock Option Agreement for Chief Executive Officer under Newell Rubbermaid Inc. 2003Stock Plan, prior to its amendment and restatement effective February 8, 2006 (incorporated byreference to Exhibit 10.6 to the Company’s Quarterly Report on Form 10-Q for the quarter endedMarch 31, 2006).
*10.10
Stock Option Agreement granted to Mark D. Ketchum November 9, 2005 under the NewellRubbermaid Inc. 2003 Stock Plan, prior to its amendment and restatement effective February 8, 2006(incorporated by reference to Exhibit 10.3 to the Company’s Current Report on Form 8-K datedNovember 9, 2006).
*10.11
Forms of Restricted Stock Award Agreement under the Newell Rubbermaid Inc. 2003 Stock Plan, asamended and restated effective February 8, 2006 (incorporated by reference to Exhibit 10.3 to theCompany’s Quarterly Report on Form 10-Q for the quarter ended June 30, 2006).
*10.12
Form of Performance Share Award Agreement under the Newell Rubbermaid Inc. 2003 Stock Plan,as amended and restated effective February 8, 2006.
*10.13
Performance Share Award Agreement granted to Mark D. Ketchum March 22, 2006 under the NewellRubbermaid Inc. 2003 Stock Plan, as amended and restated effective February 8, 2006 (incorporatedby reference to Exhibit 10.4 to the Company’s Quarterly Report on Form 10-Q for the quarter endedJune 30, 2006).
*10.14
2005 Long Term Incentive Plan under the Newell Rubbermaid Inc. 2003 Stock Plan (incorporated byreference to Exhibit 10.1 to the Company’s Quarterly Report on Form 10-Q for the quarter endedSeptember 30, 2005).
*10.15
Amended 2006 Long Term Incentive Plan under the Newell Rubbermaid Inc. 2003 Stock Plan(incorporated by reference to Exhibit 10.1 to the Company’s Quarterly Report on Form 10-Q for thequarter ended March 31, 2006).
*10.16 Newell Rubbermaid Inc. 2007 Supplemental Transition Bonus Plan.
*10.17
Form of Employment Security Agreement with certain of Company’s Executive Officers and alimited number of other senior management employees (incorporated by reference to Exhibit 10 tothe Company’s Current Report on Form 8-K dated November 10, 2004).
*10.18
Compensation Arrangement for Mark D. Ketchum dated February 13, 2006 (incorporated byreference to Exhibit 10.3 to the Company’s Quarterly Report on Form 10-Q for the quarter endedMarch 31, 2006).
10.19
Amended and Restated Trust Agreement, dated as of December 12, 1997, among the Company, asDepositor, The Chase Manhattan Bank (now known as JPMorgan Chase Bank), as Property Trustee,Chase Manhattan Delaware, as Delaware Trustee, and the Administrative Trustees (incorporated byreference to Exhibit 4.2 to the Company’s Registration Statement on Form S-3, File No. 333-47261,filed March 3, 1998).
- 79 -
Table of Contents
Exhibit Number Description of Exhibit
10.20
Indenture dated as of April 15, 1992, between the Company and The Chase Manhattan Bank (nowknown as JPMorgan Chase Bank), as Trustee, is included in Item 4.3.
10.21
Indenture dated as of November 1, 1995, between the Company and The Chase Manhattan Bank (nowknown as JPMorgan Chase Bank), as Trustee, is included in Item 4.4.
10.22
Junior Convertible Subordinated Indenture for the 5.25% Convertible Subordinated Debentures, datedas of December 12, 1997, between the Company and The Chase Manhattan Bank (now known asJPMorgan Chase Bank), as Indenture Trustee, is included in Item 4.5.
10.23
Credit Agreement, dated as of November 14, 2005, by and among, the Company, JPMorgan ChaseBank, N.A., as administrative agent, and each lender a signatory thereto, as amended effectiveOctober 10, 2006, and as further amended as of October 12, 2006, is included in Item 4.7.
Item 12.
Statement reComputation of Ratios
12
Statement of Computation of Earnings to Fixed Charges.
Item 14.
Code of Ethics
14
Code of Ethics for Senior Financial Officers (incorporated by reference to Exhibit 14 of theCompany’s Annual Report on Form 10-K for the year ended December 31, 2003).
Item 21.
Subsidiaries of theRegistrant
21
Significant Subsidiaries of the Company.
Item 23.
Consent of experts andcounsel
23.1
Consent of Ernst & Young LLP.
Item 31.
Rule13a-14(a)/15d-14(a)Certifications
31.1
Certification of Chief Executive Officer Pursuant to Rule 13a-14(a) or Rule 15d-14(a), As AdoptedPursuant to Section 302 of the Sarbanes-Oxley Act of 2002.
31.2
Certification of Chief Financial Officer Pursuant to Rule 13a-14(a) or Rule 15d-14(a) , As AdoptedPursuant to Section 302 of the Sarbanes-Oxley Act of 2002.
Item 32.
Section 1350Certifications
32.1
Certification of Chief Executive Officer Pursuant to 18 U.S.C. Section 1350, as Adopted Pursuant toSection 906 of the Sarbanes-Oxley Act of 2002.
32.2
Certification of Chief Financial Officer Pursuant to 18 U.S.C. Section 1350, as Adopted pursuant toSection 906 of the Sarbanes-Oxley Act of 2002.
* Management contract or compensatory plan or arrangement of the Company.
- 80 -
Table of Contents
SIGNATURES
Pursuant to the requirements of Section 13 or 15(d) of the Securities Exchange Act of 1934, the Registrant has duly caused this report to be signed on itsbehalf by the undersigned, thereunto duly authorized. NEWELL RUBBERMAID INC.Registrant By /s/ J. Patrick RobinsonTitle Executive Vice President — Chief Financial OfficerDate February 28, 2007
Pursuant to the requirements of the Securities Exchange Act of 1934, this report has been signed below on February 28, 2007 by the following persons onbehalf of the Registrant and in the capacities indicated.
Signature Title
/s/ Mark D. Ketchum President, Chief Executive Officer and Director
Mark D. Ketchum /s/ J. Patrick Robinson Executive Vice President — Chief Financial Officer
J. Patrick Robinson /s/ Ricky T. Dillon Vice President – Corporate Controller and Chief Accounting Officer
Ricky T. Dillon /s/ William D. Marohn Chairman of the Board and Director
William D. Marohn /s/ Thomas E. Clarke Director
Thomas E. Clarke /s/ Scott S. Cowen Director
Scott S. Cowen /s/ Michael T. Cowhig Director
Michael T. Cowhig /s/ Elizabeth Cuthbert Millett Director
Elizabeth Cuthbert Millett /s/ Cynthia A. Montgomery Director
Cynthia A. Montgomery /s/ Allan P. Newell Director
Allan P. Newell /s/ Steven J. Strobel Director
Steven J. Strobel /s/ Gordon R. Sullivan Director
Gordon R. Sullivan /s/ Michael A. Todman Director
Michael A. Todman /s/ Raymond G. Viault Director
Raymond G. Viault
- 81 -
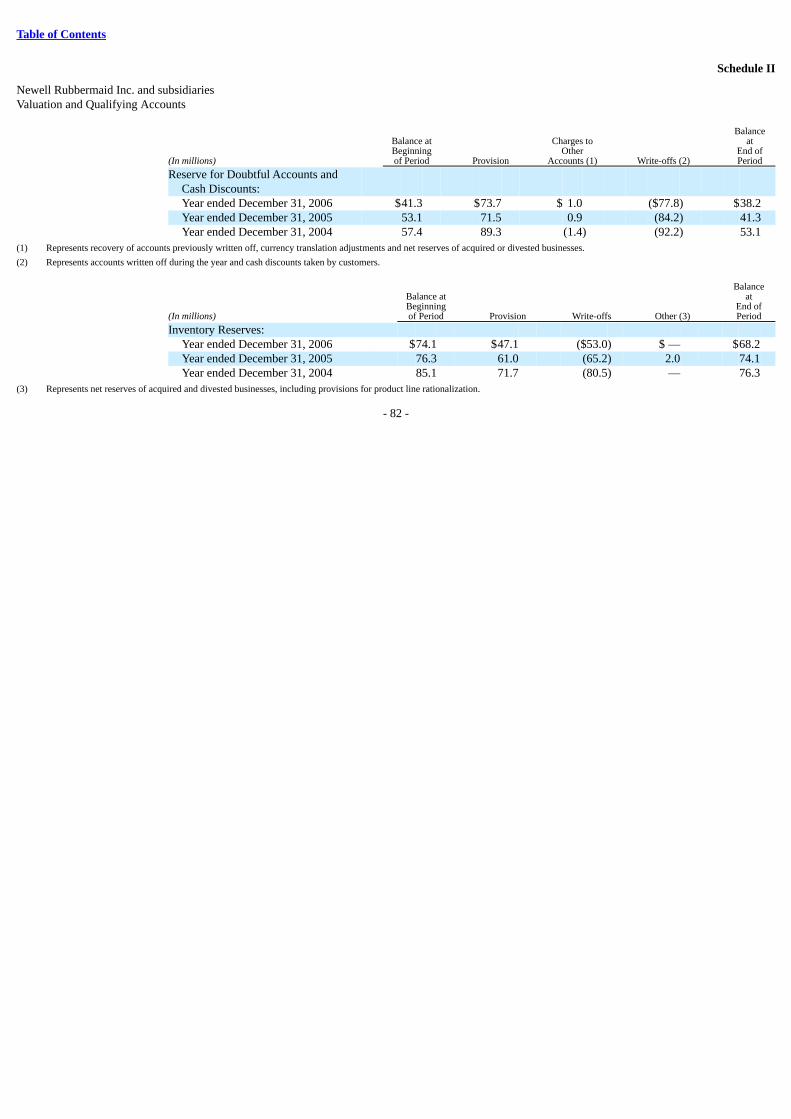
Table of Contents
Schedule II
Newell Rubbermaid Inc. and subsidiariesValuation and Qualifying Accounts
Balance Balance at Charges to at Beginning Other End of(In millions) of Period Provision Accounts (1) Write-offs (2) Period
Reserve for Doubtful Accounts andCash Discounts: Year ended December 31, 2006 $41.3 $73.7 $ 1.0 ($77.8) $38.2 Year ended December 31, 2005 53.1 71.5 0.9 (84.2) 41.3 Year ended December 31, 2004 57.4 89.3 (1.4) (92.2) 53.1
(1) Represents recovery of accounts previously written off, currency translation adjustments and net reserves of acquired or divested businesses.
(2) Represents accounts written off during the year and cash discounts taken by customers. Balance Balance at at Beginning End of(In millions) of Period Provision Write-offs Other (3) Period
Inventory Reserves: Year ended December 31, 2006 $74.1 $47.1 ($53.0) $ — $68.2 Year ended December 31, 2005 76.3 61.0 (65.2) 2.0 74.1 Year ended December 31, 2004 85.1 71.7 (80.5) — 76.3
(3) Represents net reserves of acquired and divested businesses, including provisions for product line rationalization.
- 82 -
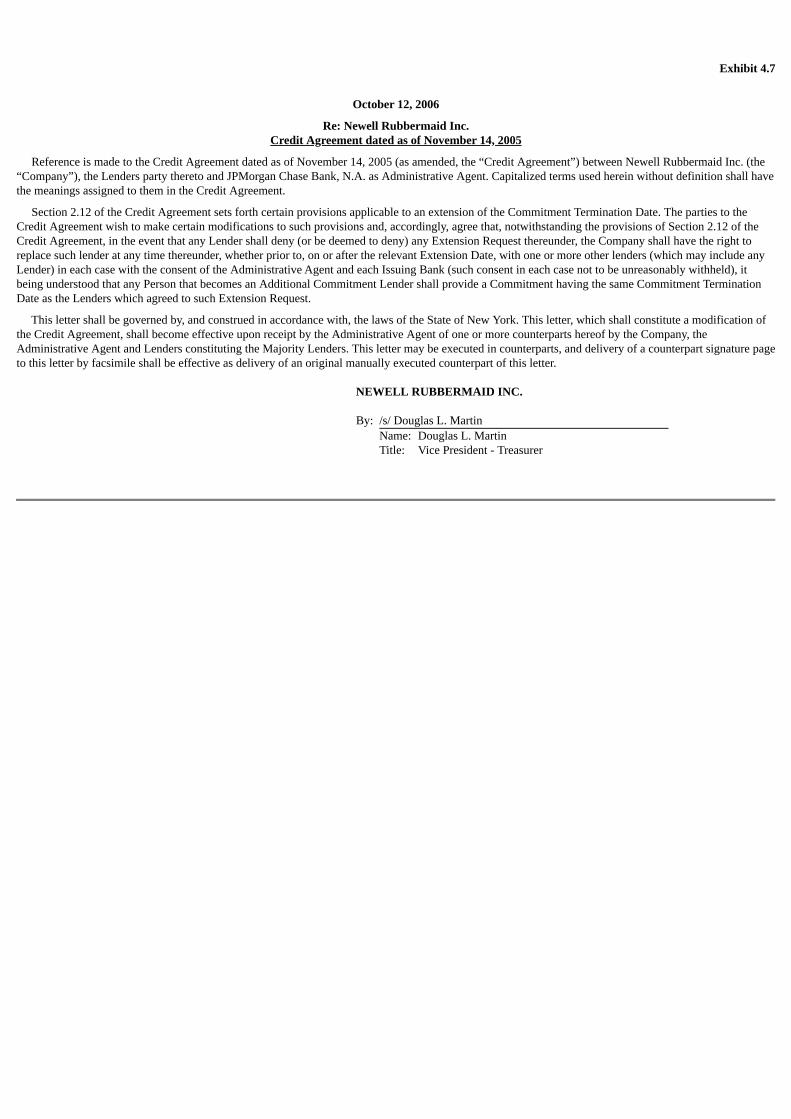
Exhibit 4.7
October 12, 2006
Re: Newell Rubbermaid Inc.Credit Agreement dated as of November 14, 2005
Reference is made to the Credit Agreement dated as of November 14, 2005 (as amended, the “Credit Agreement”) between Newell Rubbermaid Inc. (the“Company”), the Lenders party thereto and JPMorgan Chase Bank, N.A. as Administrative Agent. Capitalized terms used herein without definition shall havethe meanings assigned to them in the Credit Agreement.
Section 2.12 of the Credit Agreement sets forth certain provisions applicable to an extension of the Commitment Termination Date. The parties to theCredit Agreement wish to make certain modifications to such provisions and, accordingly, agree that, notwithstanding the provisions of Section 2.12 of theCredit Agreement, in the event that any Lender shall deny (or be deemed to deny) any Extension Request thereunder, the Company shall have the right toreplace such lender at any time thereunder, whether prior to, on or after the relevant Extension Date, with one or more other lenders (which may include anyLender) in each case with the consent of the Administrative Agent and each Issuing Bank (such consent in each case not to be unreasonably withheld), itbeing understood that any Person that becomes an Additional Commitment Lender shall provide a Commitment having the same Commitment TerminationDate as the Lenders which agreed to such Extension Request.
This letter shall be governed by, and construed in accordance with, the laws of the State of New York. This letter, which shall constitute a modification ofthe Credit Agreement, shall become effective upon receipt by the Administrative Agent of one or more counterparts hereof by the Company, theAdministrative Agent and Lenders constituting the Majority Lenders. This letter may be executed in counterparts, and delivery of a counterpart signature pageto this letter by facsimile shall be effective as delivery of an original manually executed counterpart of this letter. NEWELL RUBBERMAID INC.
By: /s/ Douglas L. Martin Name: Douglas L. Martin Title: Vice President - Treasurer
LENDERS JPMORGAN CHASE BANK, N.A. as a Lender and as the Administrative Agent By: /s/ Anthony W. White
Name: Anthony W. White Title: Vice President BANK OF AMERICA, N.A. By: /s/ Sharon Burks Horos
Name: Sharon Burks Horos Title: Vice President BARCLAYS BANK PLC By: /s/ David Barton
Name: David Barton Title: Associate Director BNP P ARIBAS By: /s/ Andrew Strait
Name: Andrew Strait Title: Managing Director By: /s/ Tomasz Rydel
Name: Tomasz Rydel Title: Vice President CITICORP USA, INC. By: /s/ Richard M. Levin
Name: Richard M. Levin Title: Director
LEHMAN COMMERCIAL PAPER INC. By: /s/ Janine M. Shugan
Name: Janine M. Shugan Title: Authorized Signatory THE BANK OF TOKYO-MITSUBISHI UFJ, LTD.
CHICAGO BRANCH (f/k/a The Bank of Tokyo – Mitsubishi, Ltd.,Chicago Branch)
By: /s/ Tsuguyuki Umene
Name: Tsuguyuki Umene Title: Deputy General Deputy
WILLIAM STREET COMMITMENT CORPORATION(Recourse only to assets of William Street CommitmentCorporation)
By: /s/ Mark Walton
Name: Mark Walton Title: Assistant Vice President ING BANK, N.V., DUBLIN BRANCH By: /s/ Maurice Kenny
Name: Maurice Kenny Title: Vice President By: /s/ Aidan Neill
Name: Aidan Neill Title: Vice President
THE NORTHERN TRUST COMPANY By: /s/ Anu Agarwal
Name: Anu Agarwal Title: 2nd Vice President THE BANK OF NEW YORK By: /s/ Walter C. Parelli
Name: Walter C. Parelli Title: Vice President NATIONAL AUSTRALIA BANK By: /s/ Eduardo Salazar
Name: Eduardo Salazar Title: Senior Vice President and Head of Corporate Banking U.S. BANK, N.A. By: /s/ James N. DeVries
Name: James N. DeVries Title: Senior Vice President
EXTENSION AGREEMENT
JPMorgan Chase Bank, N.A., as Administrative Agent under the Credit Agreement referred to below270 Park AvenueNew York, NY 10017
Gentlemen:
The undersigned hereby agrees to extend, effective October 10, 2006, the Commitment Termination Date under the Credit Agreement dated as ofNovember 14, 2005 (the “Credit Agreement”) among Newell Rubbermaid Inc., a Delaware corporation (the “Company”), the Lenders party thereto,JPMorgan Chase Bank, N.A., as Administrative Agent (the “Administrative Agent”), for one year to November 14, 2011. Terms defined in the CreditAgreement are used herein with the same meaning.
This Extension Agreement shall be construed in accordance with and governed by the law of the State of New York. By:
Name: Title: Agreed and accepted: NEWELL RUBBERMAID INC. By: /s/ Douglas L. Martin
Name: Douglas L. Martin Title: Vice President – Treasurer JPMORGAN CHASE BANK, N.A., as Administrative Agent
By: /s/ Anthony W. White
Name: Anthony W. White Title: Vice President
This Extension Agreement was countersigned by the following parties: JPMORGAN CHASE BANK, N.A. By: /s/ Anthony W. White
Name: Anthony W. White Title: Vice President BANK OF AMERICA, N.A. By: /s/ Sharon Burks Horos
Name: Sharon Burks Horos Title: Vice President BARCLAYS BANK PLC By: /s/ David Barton
Name: David Barton Title: Associate Director BNP P ARIBAS By: /s/ Andrew Strait
Name: Andrew Strait Title: Managing Director By: /s/ Christopher Grumboski
Name: Christopher Grumboski Title: Director CITICORP USA, INC. By: /s/ Richard M. Levin
Name: Richard M. Levin Title: Director
LEHMAN COMMERCIAL PAPER INC. By: /s/ Janine M. Shugan
Name: Janine M. Shugan Title: Authorized Signatory THE BANK OF TOKYO-MITSUBISHI UFJ, LTD.
CHICAGO BRANCH (f/k/a The Bank of Tokyo – Mitsubishi, Ltd.,Chicago Branch)
By: /s/ Tsuguyuki Umene
Name: Tsuguyuki Umene Title: Deputy General Manager
WILLIAM STREET COMMITMENT CORPORATION(Recourse only to assets of William Street Commitment Corporation)
By: /s/ Mark Walton
Name: Mark Walton Title: Assistant Vice President ING BANK, N.V., DUBLIN BRANCH By: /s/ Emma Condon
Name: Emma Condon Title: Manager By: /s/ Aidan Neill
Name: Aidan Neill Title: Vice President
THE NORTHERN TRUST COMPANY By: /s/ Lisa McDermott
Name: Lisa McDermott Title: Vice President NATIONAL AUSTRALIA BANK LIMITED By: /s/ Eduardo Salazar
Name: Eduardo Salazar Title: Senior Vice President U.S. BANK NATIONAL ASSOCIATION By: /s/ James N. DeVries
Name: James N. DeVries Title: Senior Vice President
Exhibit 10.5
AMENDMENT TONEWELL RUBBERMAID
SUPPLEMENTAL EXECUTIVE RETIREMENT PLAN
WHEREAS, Newell Operating Company (the “Company”) maintains the Newell Rubbermaid Supplemental Executive Retirement Plan, as amended andrestated effective January 1, 2004 (the “Plan”), which provides for the Traditional SERP Benefit; and
WHEREAS, the Board of Directors of Newell Rubbermaid Inc. and the Board of Directors of the Company approved an amendment to the Plan to:(i) provide that no employee may commence or recommence participation in the Traditional SERP Benefit on or after January 1, 2007, and (ii) effective as ofJanuary 1, 2007, adjust the benefit formula to restore benefits lost due to the restructuring of the target bonus opportunities under the Newell Rubbermaid Inc.Management Cash Bonus Plan,
NOW, THEREFORE, the Plan is hereby amended, effective January 1, 2007, in the following respects:
1. Section 3.2 of the Plan is amended by the addition of the following paragraph at the end thereof:
Notwithstanding the foregoing, any New High Level Executive who would first become eligible (or reeligible) for the SERP under Section 3.3 on or afterJanuary 1, 2007 shall not become a Participant in the Traditional SERP Benefit. Further, no additional Executive shall otherwise become a Participant inthe Traditional SERP Benefit (or reparticipate therein) on or after January 1, 2007.
2. Section 4.2 of the Plan is amended by the addition of the following paragraph at the end thereof:
Notwithstanding the foregoing, effective for a bonus paid on or after January 1, 2007, a Participant’s “bonus” for a year for purposes of the secondparagraph hereof shall be the amount of the bonus which would have been paid to him in such year if the bonus formula in effect for the Participant’scurrent job classification under the Newell Rubbermaid Inc. Management Cash Bonus Plan for calendar year 2005 was applied to determine the bonuspaid to him in such year, as determined by the Company.
IN WITNESS WHEREOF, Newell Operating Company has hereunto caused its name to be effective as of the 1st day of January, 2007.
NEWELL OPERATING COMPANY
By: /s/ Dale L. Matschullat Dale L. Matschullat, Vice President — General Counsel and Corporate Secretary
Exhibit 10.12
NEWELL RUBBERMAID INC. 2003 STOCK PLAN
PERFORMANCE SHARE AWARD AGREEMENT
A Performance Share Award (the “Award”) granted by Newell Rubbermaid Inc., a Delaware corporation (the “Company”), to the employee named in theattached Award letter (the “Grantee”), relating to the common stock, par value $1.00 per share (the “Common Stock”), of the Company, shall be subject to thefollowing terms and conditions and the provisions of the Newell Rubbermaid Inc. 2003 Stock Plan, as amended and restated effective February 8, 2006 (the“Plan”), a copy of which is attached hereto and the terms of which are hereby incorporated by reference:
1. Acceptance by Grantee. The receipt of the Award is conditioned upon its acceptance by the Grantee in the space provided therefor at the end of theattached Award letter and the return of an executed copy of such Award letter to the Human Resources – Compensation department of the Company no laterthan 60 days after the Award Date set forth therein or, if later, 30 days after the Grantee receives this Agreement.
2. Issuance of Shares. Prior to March 15, 2007, the Grantee shall be entitled to receive a number of shares of Common Stock (the “Award Shares”) havinga Fair Market Value (determined as of the Payout Date) equal to the product of the Payout Percentage multiplied by the Target Award. For purposes of thisAward, (i) “Payout Date” shall mean the date on which the Award Shares, if any, are issued to Grantee pursuant to this Award; (ii) “Payout Percentage” shallmean the percentage, not to exceed 100%, of the target cash bonus earned by Grantee under the Company’s Management Cash Bonus Plan for the 12-monthperiod ending December 31, 2006; and (iii) “Target Award” shall mean the value of Grantee’s target Performance Share award, which amount shall becalculated by multiplying the Grantee’s base salary earned during the 12-month period ending December 31, 2006 by the percentage of the Grantee’s basesalary indicated as the target Award in the attached Award letter; provided that transfer of employment to a different position within the Company or any of itsaffiliates may result in adjustment of the percentage of the Grantee’s base salary used to determine the Target Award, in the discretion of the Vice President –Human Resources.
3. Transfer Restrictions. This Award shall not be sold, assigned, pledged or otherwise transferred, voluntarily or involuntarily, by the Grantee (or his estateor personal representative, as the case may be). Award Shares, once issued, shall be freely transferable and subject to no restrictions on transfer, other than anysuch restrictions arising under federal, state or foreign securities laws.
4. Death, Disability or Retirement. In the event that the Grantee’s employment with the Company and all of its affiliates terminates due to the Grantee’sdeath, disability or retirement, this Award and the Grantee’s right (or the right of his estate or personal representative, as the case may be) to receive theAward Shares shall vest in full upon the date of such termination. For purposes of this Award, (i) “disability” means (as determined by the Committee in itssole discretion) the inability of the Grantee to engage in any substantial gainful activity by reason of any medically determinable physical or mentalimpairment which is expected to result in death or disability or which has lasted or can be expected to last for a continuous period of not less than 12 months;and (ii) “retirement” means the Grantee’s termination from employment with the Company and all affiliates without cause (as determined by the Committeein its sole discretion) when the Grantee is 65 or older.
5. Normal Vesting; Forfeiture. Grantee’s right to receive the Award Shares shall vest in full in the event that the Grantee remains actively employed by theCompany or any of its affiliates as of
4/2006
December 31, 2006. Subject to the next following sentence, the Award shall be forfeited to the Company in the event that the Grantee’s employment with theCompany and all affiliates is terminated, voluntarily or involuntarily, at any time prior to December 31, 2006 for any reason other than the Grantee’s death,disability or retirement (as described in Section 4 above). For the avoidance of doubt, any transfer of employment to a different position within the Companyor any of its affiliates shall not result in a forfeiture of the Award. The foregoing provisions of this Section 5 shall be subject to the provisions of any writtenemployment security agreement or severance agreement that has been or may be executed by the Grantee and the Company, and the provisions in suchemployment security agreement or severance agreement concerning the vesting of an Award in connection with the Grantee’s termination of employmentshall supercede any inconsistent or contrary provision of this Section 5.
6. Withholding Taxes. If applicable, the Grantee shall pay to the Company an amount sufficient to satisfy all minimum Federal, state and local withholdingtax requirements prior to the delivery of any certificate for Award Shares. Payment of such taxes may be made by a method specified in the Plan andapproved by the Committee.
7. Rights as Stockholder. Prior to the issuance of the Award Shares, the Grantee shall not possess any rights of a stockholder in respect of such shares byvirtue of this Award. Upon issuance of the Award Shares, the Grantee shall be entitled to all of the rights of a stockholder of the Company with respect to theAward Shares, including the right to vote such shares and to receive dividends and other distributions payable with respect to such Award Shares from thePayout Date.
8. Share Delivery. Delivery of the Award Shares will be by book-entry credit to an account in the Grantee’s name established by the Company with theCompany’s transfer agent, or, provided that the Grantee has complied with all obligations and conditions set forth in the Plan and this Agreement, theCompany shall, upon written request from the Grantee (or his estate or personal representative, as the case may be), issue certificates in the name of theGrantee (or his estate or personal representative) representing such Award Shares.
9. Administration. The Award shall be administered in accordance with such regulations as the Organizational Development and Compensation Committeeof the Board of Directors of the Company (the “Committee”) shall from time to time adopt.
10. Performance Goals. The Award is intended qualify as “performance-based compensation” within the meaning of Section 162(m) of the Code. Theparties acknowledge that the issuance of Award Shares will be determined based on the same performance goals that are utilized for determining cash awardsunder the Company’s Management Cash Bonus Plan for the 12-month period ending December 31, 2006, and that such goals have been established inaccordance with Sections 3.3 and 9.2 of the Plan and Section 162(m) of the Code. Following the completion of such 12-month period, the Committee shalldetermine, in its sole judgment, the extent to which such performance goals have been achieved and shall authorize the issuance of Award Shares to theGrantee in accordance with the terms of this Award.
11. Governing Law. This Agreement, and the Award, shall be construed, administered and governed in all respects under and by the laws of the State ofDelaware.
12. Stockholder Approval. This Agreement, and the Award, are subject in all respects to approval of the Plan (in the form amended and restated as ofFebruary 8, 2006) by the stockholders of the Company at the 2006 annual meeting. In the event such approval is not obtained, this Agreement and the Awardshall automatically be canceled and shall thereafter be null and void and of no further force or effect.
4/2006
-2-

IN WITNESS WHEREOF, this Agreement is executed by the Company this th day of , , effective as of the 8th day ofFebruary, 2006. NEWELL RUBBERMAID INC. By:
4/2006
-3-
Exhibit 10.16
Newell Rubbermaid Inc.2007 Supplemental Transition Bonus Plan
1. Name
Newell Rubbermaid Inc. 2007 Supplemental Transition Bonus Plan
2. Effective Date
February 6, 2007
3. Purpose
To provide a supplemental cash bonus, in addition to the payouts under the Bonus Plan, in order to compensate participating key employees for atemporary reduction of their overall target compensation as a result of the reduction of the percentage of salary payable under the Bonus Plan for meetingperformance goals at the target level.
4. Definitions
(a) The term “Company” means Newell Rubbermaid Inc. and its subsidiaries.
(b) The term “Board” means the Board of Directors of Newell Rubbermaid Inc.
(c) The term “Bonus Plan” means the Newell Rubbermaid Management Inc. Cash Bonus Plan, or, in the case of any Participant domiciled outside of theUnited States, the applicable local cash bonus plan in which such individual participates.
(d) The term “Plan Year” means the calendar year 2007.
(e) The term “Committee” means the Organizational Development & Compensation Committee of the Board.
(f) The term “Participant” means (i) any active “regular” key employee of the Company at the level of Director (Level 6) or above, domiciled in theUnited States, who was employed by the Company on or prior to December 31, 2005, or (ii) any active “regular” key employee of the Company atthe level of Director (Level 6) or above, domiciled outside of the United States, who was employed by the Company on or prior to December 31,2006; provided, however, that (i) the Company’s Chief Executive Officer shall not be a Participant for purposes of this Transition Plan, and (ii) noemployee who received a restricted stock award under the Company’s 2003 Stock Plan in February 2005 under the methodology set forth in theCompany’s Long-Term Incentive Plan, as the same was then in effect, shall be a Participant for purposes of this Transition Plan.
(g) The term “Payout Percentage” shall mean the percentage, not to exceed 100%, of the target cash bonus earned by the Participant under the BonusPlan for the Plan Year.
(h) The term “Salary” means a Participant’s base annual salary earned during the Plan Year while a Participant, exclusive of commissions and bonuses.
(i) The term “Target Award” shall mean an amount calculated by multiplying the Participant’s Salary earned during the Plan Year by the percentage ofthe Participant’s Salary indicated as the target bonus payout in Section 6 of this Transition Plan; provided that transfer of employment to a differentposition within the Company may result in adjustment of the percentage of the Participant’s Salary used to determine the Target Award, in thediscretion of the Vice President – Chief Human Resources Officer.
(j) The term “Transition Plan” shall mean this Newell Rubbermaid Inc. 2007 Supplemental Transition Bonus Plan.
4. Annual Incentive Awards
At the end of the Plan Year, the incentive compensation to be awarded to each Participant under this Transition Plan shall be equal to the PayoutPercentage for such Participant multiplied by the Target Award for such Participant.
5. Bonus Plan Awards
A Participant domiciled in the United States will be eligible to receive a target bonus payout (as a percentage of Salary) equal to the following, based uponsuch Participant’s applicable classification under the Bonus Plan as of December 31, 2005: A/B (35.5%); A/C (25.0%); A (22.5%); B/C (15%). A Participantdomiciled outside of the United States will be eligible to receive a target bonus payout (as a percentage of salary) that equals the reduction in suchParticipant’s target bonus payout (as a percentage of salary) under the Bonus Plan from its 2006 level to its 2007 level, as determined by the Company’smanagement. The maximum bonus payout percentage for incentive awards to any Participant under the Transition Plan shall be equal to the target bonuspayout percentage for such Participant. In no event shall any employee receive an incentive award under the Plan that, when added to any incentive awardreceived by such employee under the Bonus Plan, exceeds $2,900,000 for any calendar year.
6. Plan Limitations
Notwithstanding anything herein to the contrary, for Transition Plan purposes, no award will be made to a Participant whose employment terminatedduring the Plan Year unless the termination was due to retirement, disability, death or any other cause approved by the Committee.
7. Payment of Incentive Awards
A Participant’s award under the Plan shall be paid in cash to the Participant, or his/her beneficiary or beneficiaries in the event of his/her death, prior toMarch 15 of the calendar year immediately following the Plan Year, unless he/she elects to have a part or all of the award deferred as provided in Section 9below.
8. Deferral of Awards
In lieu of receiving an award as provided in Section 8 above, a Participant who is eligible for participation in the Newell Rubbermaid Inc. 2002 DeferredCompensation Plan may elect to defer all or part of his/her incentive award in accordance with the terms of such Deferred Compensation Plan.
9. Management Rights
Corporate Management or, in the case of any Participant that reports directly to the Chief Executive Officer, the Board reserves the right to canceleligibility of a bonus participant at any time and refuse or reduce bonus payment for any reason.
10. Amendments
The Board may either modify or eliminate the Plan if in its judgment such modification or elimination does not materially or adversely affect the bestinterests of the Company or of the stockholders; provided, that such modification or elimination shall not affect the obligation of the Company to pay anyincentive compensation after it has been earned.
11. Employment Rights
Nothing contained in the Plan shall be construed as conferring a right upon any employee to be continued in the employment of the Company.
13. Retirement Plans
Notwithstanding anything else set forth herein or in any other retirement or other compensatory benefit plan, agreement or arrangement established by theCompany, no bonus payment received under this Transition Plan shall be deemed to be bonus or otherwise included in “annual compensation” or “FinalAverage Pay” for purposes of calculating or determining a Participant’s benefits under the Newell Rubbermaid Supplemental Executive Retirement Plan, orincluded in the annual compensation of a Participant for purposes of determining any Company contribution to the SERP Cash Sub-Account of suchParticipant under the Newell Rubbermaid Inc. 2002 Deferred Compensation Plan.
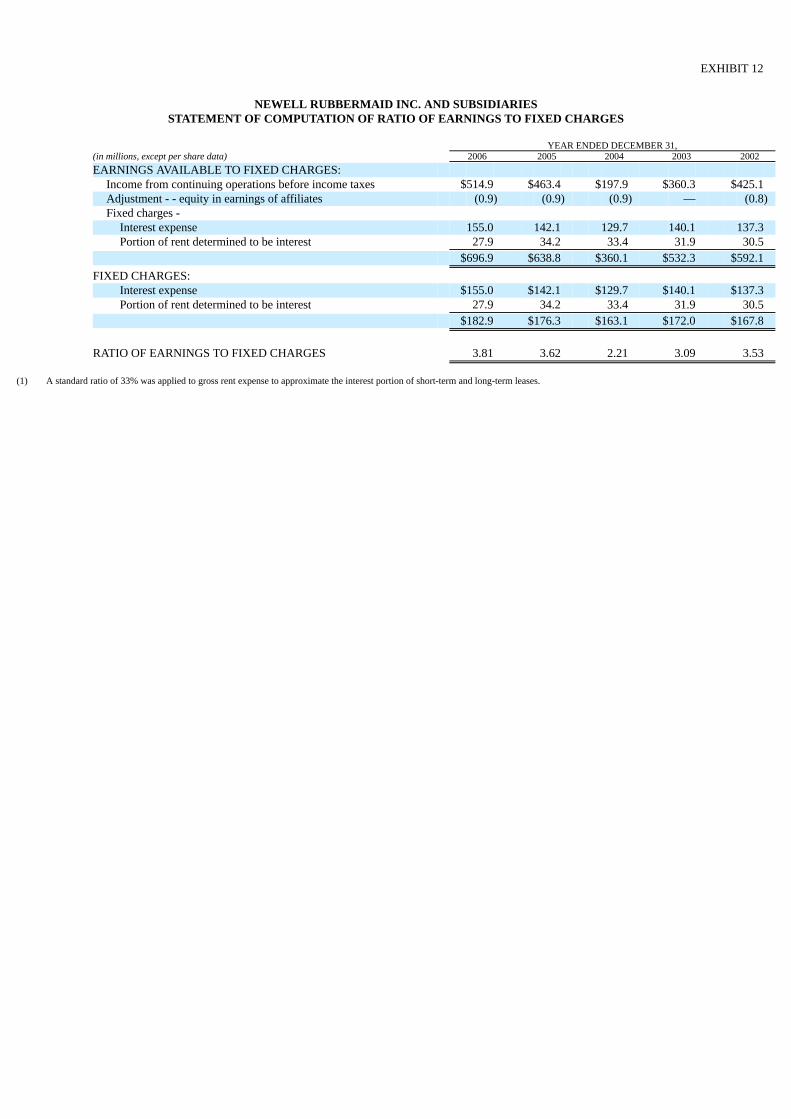
EXHIBIT 12
NEWELL RUBBERMAID INC. AND SUBSIDIARIESSTATEMENT OF COMPUTATION OF RATIO OF EARNINGS TO FIXED CHARGES
YEAR ENDED DECEMBER 31,(in millions, except per share data) 2006 2005 2004 2003 2002
EARNINGS AVAILABLE TO FIXED CHARGES: Income from continuing operations before income taxes $514.9 $463.4 $197.9 $360.3 $425.1 Adjustment - - equity in earnings of affiliates (0.9) (0.9) (0.9) — (0.8)Fixed charges -
Interest expense 155.0 142.1 129.7 140.1 137.3 Portion of rent determined to be interest 27.9 34.2 33.4 31.9 30.5
$696.9 $638.8 $360.1 $532.3 $592.1
FIXED CHARGES: Interest expense $155.0 $142.1 $129.7 $140.1 $137.3 Portion of rent determined to be interest 27.9 34.2 33.4 31.9 30.5
$182.9 $176.3 $163.1 $172.0 $167.8
RATIO OF EARNINGS TO FIXED CHARGES 3.81 3.62 2.21 3.09 3.53
(1) A standard ratio of 33% was applied to gross rent expense to approximate the interest portion of short-term and long-term leases.
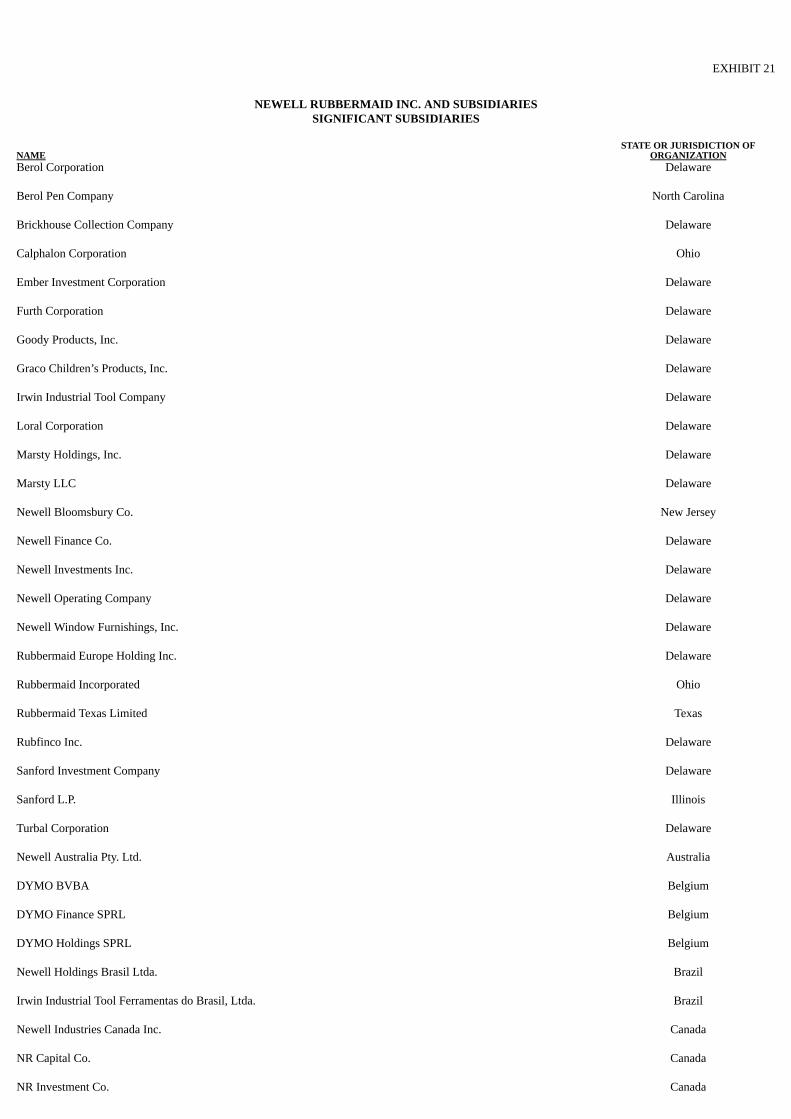
EXHIBIT 21
NEWELL RUBBERMAID INC. AND SUBSIDIARIESSIGNIFICANT SUBSIDIARIES
STATE OR JURISDICTION OFNAME ORGANIZATIONBerol Corporation Delaware Berol Pen Company North Carolina Brickhouse Collection Company Delaware Calphalon Corporation Ohio Ember Investment Corporation Delaware Furth Corporation Delaware Goody Products, Inc. Delaware Graco Children’s Products, Inc. Delaware Irwin Industrial Tool Company Delaware Loral Corporation Delaware Marsty Holdings, Inc. Delaware Marsty LLC Delaware Newell Bloomsbury Co. New Jersey Newell Finance Co. Delaware Newell Investments Inc. Delaware Newell Operating Company Delaware Newell Window Furnishings, Inc. Delaware Rubbermaid Europe Holding Inc. Delaware Rubbermaid Incorporated Ohio Rubbermaid Texas Limited Texas Rubfinco Inc. Delaware Sanford Investment Company Delaware Sanford L.P. Illinois Turbal Corporation Delaware Newell Australia Pty. Ltd. Australia DYMO BVBA Belgium DYMO Finance SPRL Belgium DYMO Holdings SPRL Belgium Newell Holdings Brasil Ltda. Brazil Irwin Industrial Tool Ferramentas do Brasil, Ltda. Brazil Newell Industries Canada Inc. Canada NR Capital Co. Canada NR Investment Co. Canada
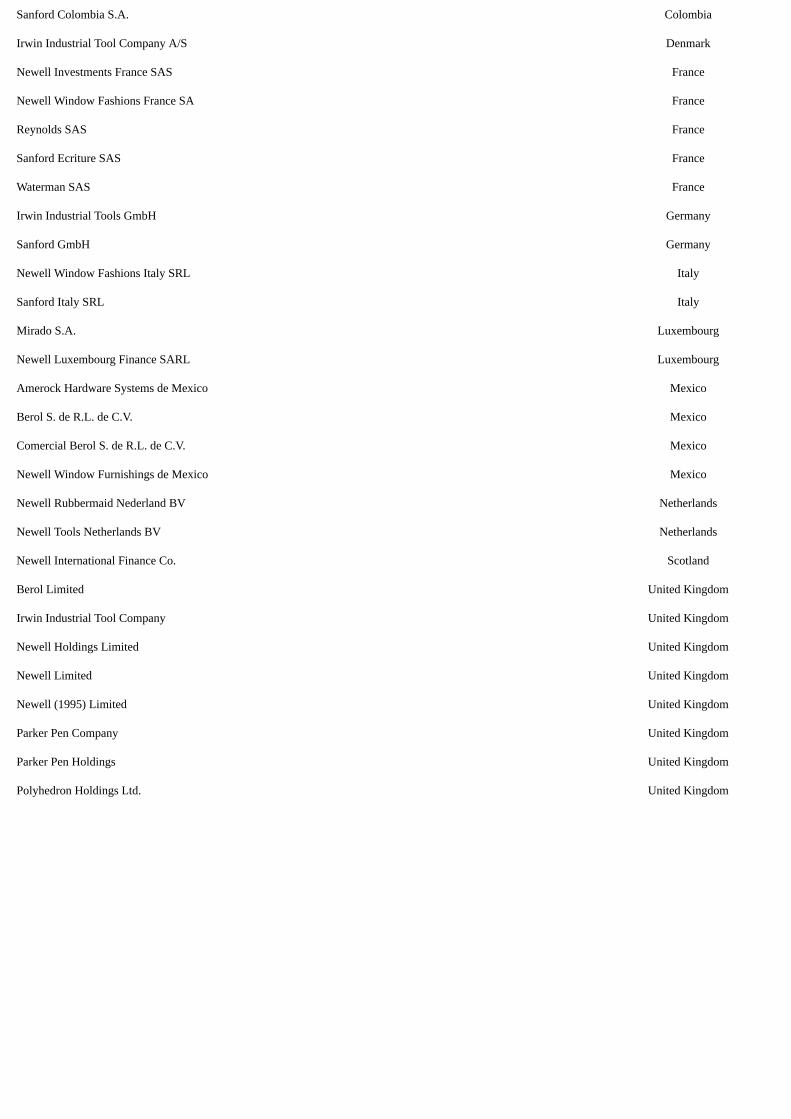
Sanford Colombia S.A. Colombia Irwin Industrial Tool Company A/S Denmark Newell Investments France SAS France Newell Window Fashions France SA France Reynolds SAS France Sanford Ecriture SAS France Waterman SAS France Irwin Industrial Tools GmbH Germany Sanford GmbH Germany Newell Window Fashions Italy SRL Italy Sanford Italy SRL Italy Mirado S.A. Luxembourg Newell Luxembourg Finance SARL Luxembourg Amerock Hardware Systems de Mexico Mexico Berol S. de R.L. de C.V. Mexico Comercial Berol S. de R.L. de C.V. Mexico Newell Window Furnishings de Mexico Mexico Newell Rubbermaid Nederland BV Netherlands Newell Tools Netherlands BV Netherlands Newell International Finance Co. Scotland Berol Limited United Kingdom Irwin Industrial Tool Company United Kingdom Newell Holdings Limited United Kingdom Newell Limited United Kingdom Newell (1995) Limited United Kingdom Parker Pen Company United Kingdom Parker Pen Holdings United Kingdom Polyhedron Holdings Ltd. United Kingdom
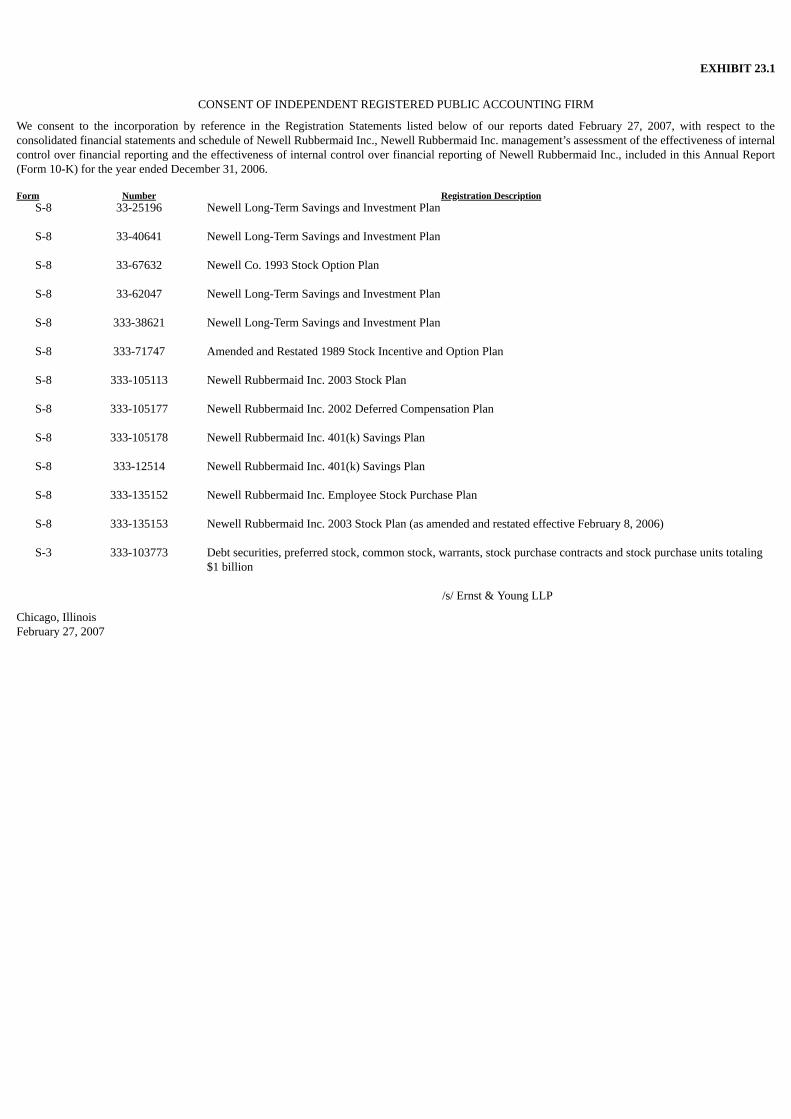
EXHIBIT 23.1
CONSENT OF INDEPENDENT REGISTERED PUBLIC ACCOUNTING FIRM
We consent to the incorporation by reference in the Registration Statements listed below of our reports dated February 27, 2007, with respect to theconsolidated financial statements and schedule of Newell Rubbermaid Inc., Newell Rubbermaid Inc. management’s assessment of the effectiveness of internalcontrol over financial reporting and the effectiveness of internal control over financial reporting of Newell Rubbermaid Inc., included in this Annual Report(Form 10-K) for the year ended December 31, 2006. Form Number Registration Description
S-8 33-25196 Newell Long-Term Savings and Investment Plan
S-8 33-40641 Newell Long-Term Savings and Investment Plan
S-8 33-67632 Newell Co. 1993 Stock Option Plan
S-8 33-62047 Newell Long-Term Savings and Investment Plan
S-8 333-38621 Newell Long-Term Savings and Investment Plan
S-8 333-71747 Amended and Restated 1989 Stock Incentive and Option Plan
S-8 333-105113 Newell Rubbermaid Inc. 2003 Stock Plan
S-8 333-105177 Newell Rubbermaid Inc. 2002 Deferred Compensation Plan
S-8 333-105178 Newell Rubbermaid Inc. 401(k) Savings Plan
S-8 333-12514 Newell Rubbermaid Inc. 401(k) Savings Plan
S-8 333-135152 Newell Rubbermaid Inc. Employee Stock Purchase Plan
S-8 333-135153 Newell Rubbermaid Inc. 2003 Stock Plan (as amended and restated effective February 8, 2006)
S-3
333-103773
Debt securities, preferred stock, common stock, warrants, stock purchase contracts and stock purchase units totaling$1 billion
/s/ Ernst & Young LLP
Chicago, IllinoisFebruary 27, 2007
EXHIBIT 31.1
CERTIFICATION
I, Mark D. Ketchum, certify that:
1. I have reviewed this annual report on Form 10-K for the year ended December 31, 2006 of Newell Rubbermaid Inc.;
2. Based on my knowledge, this report does not contain any untrue statement of a material fact or omit to state a material fact necessary to make thestatements made, in light of the circumstances under which such statements were made, not misleading with respect to the period covered by this report;
3. Based on my knowledge, the financial statements, and other financial information included in this report, fairly present in all material respects thefinancial condition, results of operations and cash flows of the registrant as of, and for, the periods presented in this report;
4. The registrant’s other certifying officer(s) and I are responsible for establishing and maintaining disclosure controls and procedures (as defined inExchange Act Rules 13a-15(e) and 15d-15(e)) and internal control over financial reporting (as defined in Exchange Act Rules 13a-15(f) and 15d-15(f)) forthe registrant and have:
(a) Designed such disclosure controls and procedures, or caused such disclosure controls and procedures to be designed under our supervision, to ensurethat material information relating to the registrant, including its consolidated subsidiaries, is made known to us by others within those entities,particularly during the period in which this report is being prepared;
(b) Designed such internal control over financial reporting, or caused such internal control over financial reporting to be designed under our supervision,to provide reasonable assurance regarding the reliability of financial reporting and the preparation of financial statements for external purposes inaccordance with generally accepted accounting principles;
(c) Evaluated the effectiveness of the registrant’s disclosure controls and procedures and presented in this report our conclusions about the effectivenessof the disclosure controls and procedures, as of the end of the period covered by this report based on such evaluation; and
(d) Disclosed in this report any change in the registrant’s internal control over financial reporting that occurred during the registrant’s most recent fiscalquarter (the registrant’s fourth fiscal quarter in the case of an annual report) that has materially affected, or is reasonably likely to materially affect,the registrant’s internal control over financial reporting; and
5. The registrant’s other certifying officer(s) and I have disclosed, based on our most recent evaluation of internal control over financial reporting, to theregistrant’s auditors and the audit committee of the registrant’s board of directors (or persons performing the equivalent functions):
(a) All significant deficiencies and material weaknesses in the design or operation of internal control over financial reporting which are reasonablylikely to adversely affect the registrant’s ability to record, process, summarize and report financial information; and
(b) Any fraud, whether or not material, that involves management or other employees who have a significant role in the registrant’s internal control overfinancial reporting.
Date: March 1, 2007
/s/ Mark D. Ketchum
Mark D. Ketchum
Chief Executive Officer
EXHIBIT 31.2
CERTIFICATION
I, J. Patrick Robinson, certify that:
1. I have reviewed this annual report on Form 10-K for the year ended December 31, 2006 of Newell Rubbermaid Inc.;
2. Based on my knowledge, this report does not contain any untrue statement of a material fact or omit to state a material fact necessary to make thestatements made, in light of the circumstances under which such statements were made, not misleading with respect to the period covered by this report;
3. Based on my knowledge, the financial statements, and other financial information included in this report, fairly present in all material respects thefinancial condition, results of operations and cash flows of the registrant as of, and for, the periods presented in this report;
4. The registrant’s other certifying officer(s) and I are responsible for establishing and maintaining disclosure controls and procedures (as defined inExchange Act Rules 13a-15(e) and 15d-15(e)) and internal control over financial reporting (as defined in Exchange Act Rules 13a-15(f) and 15d-15(f)) forthe registrant and have:
(a) Designed such disclosure controls and procedures, or caused such disclosure controls and procedures to be designed under our supervision, to ensurethat material information relating to the registrant, including its consolidated subsidiaries, is made known to us by others within those entities,particularly during the period in which this report is being prepared;
(b) Designed such internal control over financial reporting, or caused such internal control over financial reporting to be designed under our supervision,to provide reasonable assurance regarding the reliability of financial reporting and the preparation of financial statements for external purposes inaccordance with generally accepted accounting principles;
(c) Evaluated the effectiveness of the registrant’s disclosure controls and procedures and presented in this report our conclusions about the effectivenessof the disclosure controls and procedures, as of the end of the period covered by this report based on such evaluation; and
(d) Disclosed in this report any change in the registrant’s internal control over financial reporting that occurred during the registrant’s most recent fiscalquarter (the registrant’s fourth fiscal quarter in the case of an annual report) that has materially affected, or is reasonably likely to materially affect,the registrant’s internal control over financial reporting; and
5. The registrant’s other certifying officer(s) and I have disclosed, based on our most recent evaluation of internal control over financial reporting, to theregistrant’s auditors and the audit committee of the registrant’s board of directors (or persons performing the equivalent functions):
(a) All significant deficiencies and material weaknesses in the design or operation of internal control over financial reporting which are reasonablylikely to adversely affect the registrant’s ability to record, process, summarize and report financial information; and
(b) Any fraud, whether or not material, that involves management or other employees who have a significant role in the registrant’s internal control overfinancial reporting.
Date: March 1, 2007
/s/ J. Patrick Robinson
J. Patrick Robinson
Chief Financial Officer

EXHIBIT 32.1
CERTIFICATION PURSUANT TO18 U.S.C. SECTION 1350,
AS ADOPTED PURSUANT TOSECTION 906 OF THE SARBANES-OXLEY ACT OF 2002
In connection with the Annual Report of Newell Rubbermaid Inc. (the “Company”) on Form 10-K for the period ending December 31, 2006 as filed with theSecurities and Exchange Commission on the date hereof (the “Report”), I, Mark D. Ketchum, Chief Executive Officer of the Company, certify, pursuant to 18U.S.C. § 1350, as adopted pursuant to § 906 of the Sarbanes-Oxley Act of 2002, that:
(1) The Report fully complies with the requirements of section 13(a) or 15(d) of the Securities Exchange Act of 1934; and
(2) The information contained in the Report fairly presents, in all material respects, the financial condition and results of operations of the Company.
/s/ Mark D. Ketchum
Mark D. KetchumChief Executive OfficerMarch 1, 2007

EXHIBIT 32.2
CERTIFICATION PURSUANT TO18 U.S.C. SECTION 1350,
AS ADOPTED PURSUANT TOSECTION 906 OF THE SARBANES-OXLEY ACT OF 2002
In connection with the Annual Report of Newell Rubbermaid Inc. (the “Company”) on Form 10-K for the period ending December 31, 2006 as filed with theSecurities and Exchange Commission on the date hereof (the “Report”), I, J. Patrick Robinson, Chief Financial Officer of the Company, certify, pursuant to18 U.S.C. § 1350, as adopted pursuant to § 906 of the Sarbanes-Oxley Act of 2002, that:
(1) The Report fully complies with the requirements of section 13(a) or 15(d) of the Securities Exchange Act of 1934; and
(2) The information contained in the Report fairly presents, in all material respects, the financial condition and results of operations of the Company.
/s/ J. Patrick Robinson
J. Patrick RobinsonChief Financial OfficerMarch 1, 2007