Embed Size (px)
Citation preview

1 | P a g e
DRAFT BUDGET AND MTREF
2019/20

2 | P a g e
PREPARED BY: BUDGET AND TREASURY OFFICE
Table of Contents PART 1 – BUDGET
1. Mayor’s Budget Speech 2. Resolutions 3. Executive Summary 4. Consolidated Overview 5. Operating Revenue Framework 6. Operating Expenditure Framework 7. Capital Expenditure PART 2 –ANNUAL BUDGET TABLES 8. Annual Budget Tables 9. Municipal Managers Quality certificate PART 3 – SUPPORTING DOCUMENTATION ANNEXURES Annexure 1 Tariff of Charges Annexure 2 Budget Related Policies 1. Mayor’s Budget Speech Refer to attached Mayor’s Speech
2. Resolution Refer to attached Council Resolution
Glossary Adjustments Budget – Prescribed in section 28 of the MFMA. The formal means by which a municipality may revise its annual budget during the year. Allocations – Money received from Provincial or National Government or other municipalities. Assessment Rates – Local Government taxation based on an assessed value of a property. To determine the rates payable, the assessed ratable value is multiplied by the rate in the rand. Budget – The financial plan of the Municipality. Budget Related Policy – Policy of a municipality affecting or affected by the budget, such as the tariffs policy, rates policy and credit control and debt collection policy.

3 | P a g e
Capital Expenditure – Spending on assets such as land, buildings and machinery. Any capital expenditure must be reflected as an asset on the Municipality’s Statement of Financial Position. Cash flow statement – A statement showing when actual cash will be received and spent by the Municipality. Cash payments do not always coincide with budgeted expenditure timings. For example, when an invoice is received by the Municipality it scores as expenditure in the month it is received, even though it may not be paid in the same period. DORA – Division of Revenue Act. Annual piece of legislation that shows the amount of allocations from national to local government. Equitable Share – A general grant paid to municipalities. It is predominantly targeted to help with free basic services. Fruitless and wasteful expenditure – Expenditure that was made in vain and would have been avoided had reasonable care been exercised. GFS – Government Finance Statistics. An internationally recognized classification system that facilitates like for like comparison between municipalities. GRAP – Generally Recognized Accounting Practice. The new standard for municipal accounting and basis upon which the Annual Financial Statements are prepared. IDP – Integrated Development Plan. The main strategic planning document of the Municipality KPI’s – Key Performance Indicators. Measures of service output and/or outcome. MFMA – The Municipal Finance Management Act – no 53 of 2003. The principle piece of legislation relating to municipal financial management. MTREF – Medium Term Revenue and Expenditure Framework. A medium term financial plan, usually 3 years, based on a fixed first year and indicative further two years budget allocations. Also includes details of the previous and current years’ financial position. Operating Expenditure – Spending on the day to day expenses of the Municipality such as salaries and wages. SDBIP – Service Delivery and Budget Implementation Plan. A detailed plan comprising quarterly performance targets and monthly budget estimates. Strategic Objectives – The main priorities of the Municipality as set out in the IDP. Budgeted spending must contribute towards the achievement of the strategic objectives. Unauthorized expenditure – Generally, spending without, or in excess of, an approved budget. Virement – A transfer of budget. Virement Policy - The policy that sets out the rules for budget transfers. Virements are normally allowed within a vote. Transfers between votes must be agreed by Council through an Adjustments Budget.

4 | P a g e
Vote – One of the main segments into which a budget is divided. In RAY NKONYENI LOCAL Municipality this means at directorate level.
3. Executive Summary
The application of sound financial management principles for the compilation of the RAY NKONYENI LOCAL Municipality’s Budget is essential and critical to ensure that the municipality remains financially viable and that municipal services are provided sustainability, economically and equitably to all communities. The RAY NKONYENI LOCAL Municipality’s business and service delivery priorities were reviewed as part of this year’s planning and budget process. Where appropriate, funds were transferred from low- to high-priority programmes so as to maintain sound financial stewardship. A critical review was also undertaken of expenditures on noncore and ‘nice to have’ items. The municipality has embarked on implementing a range of revenue collection strategies to optimize the collection of debt owed by consumers. Furthermore, the municipality has undertaken various customer care initiatives to ensure the municipality truly involves all citizens in the process of ensuring a people lead government. National Treasury’s MFMA Circular No. 94 were used to guide the compilation of the 2019/20 MTREF which indicates the following amongst other things: guidance on budgeting for municipalities affected by redetermination of boundaries. 3.1 MFMA Circulars
National Treasury sent out MFMA Circular No. 94 providing guidance to municipalities on their 2019/20 budgets and Medium Term Revenue and Expenditure Framework (MTREF). It is essential reading material in order to understand the background to this budget. National Treasury has also set out the requirements for funding the budget and producing a credible budget.
The overview of South African economy and inflation targets
The economic and revenue outlook has deteriorated since the October 2018 Medium Term Budget Policy Statement (MTBPS). Funding pressures from state-owned companies have increased and require government financial support. Given these developments, the 2019 Budget proposes large-scale expenditure reprioritisation and tax measures that narrow the deficit from 4.5 per cent of GDP in 2019/20 to 4 per cent by 2021/22. The 2018 MTBPS noted that weak economic performance and revenue shortfalls had contributed to some slippage in fiscal projections. Since then, economic growth has remained subdued and the domestic GDP outlook has been revised down. In the current year, tax revenue will be R15.4 billion below the 2018 MTBPS estimate. Funding pressures from Eskom and other financially distressed state-owned companies have increased, with several requesting state support to continue operating. In this context, the 2019 Budget

5 | P a g e
proposes a series of tax and expenditure measures aimed at narrowing the deficit and stabilising the debt-to-GDP ratio. Additions to spending amount to R75.3 billion over the medium term, consisting mainly of transfers to support the reconfiguration of Eskom. These additions are partially offset by reductions to expenditure baselines and proposed savings from compensation adjustments totalling R50.3 billion. Tax measures raise an additional R15 billion in 2019/20 and R10 billion in 2020/21. In combination, these measures are expected to narrow the consolidated budget deficit from a projected 4.5 per cent of GDP in 2019/20 to 4 per cent of GDP in 2021/22. Gross national debt is projected to stabilize at 60.2 per cent of GDP in 2023/24. Net loan debt (gross loan debt excluding government’s cash balances) stabilizes at 57.3 per cent of GDP in 2024/25. The GDP growth rate is forecasted at 1.5 per cent in 2019, 1.7 per cent in 2020 and 2.1 per cent in 2021. The revisions take into account weaker investment outcomes in 2018, a more fragile recovery in household income and slower export demand than expected due to moderating global growth. Consumer inflation has also been revised down due to lower oil prices and food inflation than previously assumed. The main risks to the economic outlook are continued policy uncertainty and deterioration in the finances of state-owned entities. These factors, alongside continued high unemployment and slow growth will continue to exert pressure on municipal revenue generation and collection levels hence a conservative approach is advised for municipal revenue projections. Municipalities affected by the drought should also consider its impact on revenue generation. In this context, municipalities will have to improve their efforts to limit non-priority spending and to implement stringent cost-containment measures. 3.1.1 Funding the Budget Section 18(1) of the MFMA states that an annual budget may only be funded from:
Realistically anticipated revenues to be collected;
Cash-backed accumulated funds from previous years’ surpluses not Committed for other purposes; and
Borrowed funds, but only for the capital budget referred to in section 17(2).
Achievement of this requirement in totality effectively means that a Council has surplus in its budget by ensuring that a budgeted outflow does not exceed planned inflows. Under old budget formats income generated approach was a key objective and this assisted in ensuring that outflows were matched by inflows, provided revenue collections were realistic. However, GRAP compliant budgets necessitate that budget ‘balancing’ be much more comprehensive. New budgeting and accounting formats demand that the budgeted Statement of Financial Performance, the Budgeted Statement of Financial Position and the Budgeted Statement of Cash Flows must be considered simultaneously to ensure effective financial management and sustainability.
3.1.2 A Credible Budget Amongst other things, a credible budget is a budget that:
Funds only activities consistent with the revised IDP and vice versa ensuring the IDP is realistically achievable given the financial constraints of the municipality;

6 | P a g e
Is achievable in terms of agreed service delivery and performance targets;
Contains revenue and expenditure projections that are consistent with current and past performance and supported by documented evidence of future assumptions;
Does not jeopardize the financial viability of the municipality (ensures that the financial position is maintained within generally accepted prudential limits and that obligations can be met in the short, medium and long term); and
Provides managers with appropriate levels of delegation sufficient to meet their financial management responsibilities.
A budget sets out certain service delivery levels and associated financial implications. Therefore the community should realistically expect to receive these promised service delivery levels and understand the associated financial implications. Major under spending due to under collection of revenue or poor planning is a clear example of a budget that is not credible and unrealistic. Furthermore, budgets tabled for consultation at least 90 days prior to the start of the budget year should already be credible and fairly close to the final approved budget. The main challenges experienced during the compilation of the Budget 2019/20 MTREF can be summarized as follows:
• The ongoing difficulties in the national and local economy; • Aging and poorly maintained roads and electricity infrastructure; • The need to reprioritize projects and expenditure within the existing resource
envelope given the cash flow realities and declining cash position of the municipality; • The increased cost and electricity (due to tariff increases from Eskom), which is
placing upward pressure on service tariffs to residents. Continuous high tariff increases are not sustainable - as there will be point where services will no-longer be affordable;
• Wage increases for municipal staff that continue to exceed consumer inflation, as well as the need to fill critical vacancies;
The following budget principles and guidelines directly informed the compilation of the 2019/20 Budget: • The 2019/20 Adjustments Budget priorities and targets for Ray Nkonyeni
municipality, as well as the base line allocations contained in that Adjustments Budget were adopted as the upper limits for the 2019/20 budget;
• Audited AFS for 2017/18 for Ray Nkonyeni municipality were also used as a guide for the compilation of the 2019/20 Budget.
• Intermediate service level standards were used to inform the measurable objectives, targets and backlog eradication goals;
• The 2018 Division of Revenue Bill issued on February 2019 details the allocations that the municipality need to be reflected in the budget
• Tariff and property rate increases should be affordable and should generally not exceed inflation as measured by the CPI, except where there are price increases in the inputs of services that are beyond the control of the municipality, for instance the cost of bulk electricity. In addition, tariffs need to remain or move towards being cost reflective, and should take into account the need to address infrastructure backlogs;
• There will be no budget allocated to national and provincial funded projects unless the necessary grants to the municipality are reflected in the national and provincial budget and have been gazette as required by the annual Division of Revenue Act;
• The relevant policy developments in the different sectors proposals from the National Energy Regulator of South Africa (NERSA)

7 | P a g e
• Macro-economics forecast has been taken into account when preparing the salaries budget, the current CPI plus 1. percent for 2019/20 financial year.
• The upper limit was set for the following items and allocations to these items had to be supported by a list and/or motivation setting out the intention and cost of the expenditure which was used to priorities expenditures:
- Special Projects;
- Consultant Fees;
- Furniture and office equipment;
- Special Events;
- Refreshments and entertainment;
- Ad-hoc travelling; and
- Subsistence, Travelling & Conference fees In view of the aforementioned, the following table is a consolidated overview of the proposed 2019/20 Medium-term Revenue and Expenditure Framework.

8 | P a g e
4. Table 1 Consolidated Overview
Description 2015/16 2016/17 2017/18
R thousandsAudited
Outcome
Audited
Outcome
Audited
Outcome
Original
Budget
Adjusted
Budget
Full Year
Forecast
Pre-audit
outcome
Budget Year
2019/20
Budget Year
+1 2020/21
Budget Year
+2 2021/22
Financial Performance
Property rates – 316,117 389,818 404,757 405,289 445,337 117,532 429,640 455,418 482,743
Serv ice charges – 147,571 163,162 189,052 189,052 166,460 36,339 214,956 227,854 241,525
Inv estment rev enue – 5,251 3,618 20,192 4,703 3,183 (14,100) 4,985 5,284 5,601
Transfers recognised - operational – 195,660 258,802 218,970 221,763 219,283 87,009 358,926 397,927 535,854
Other ow n rev enue – 121,646 42,962 139,193 73,449 54,411 25,062 78,857 83,597 88,659
Total Revenue (excluding capital transfers and
contributions)
– 786,246 858,362 972,164 894,255 888,675 251,841 1,087,364 1,170,080 1,354,382
Employ ee costs – 324,070 358,167 359,939 378,898 334,747 30,096 413,959 438,356 468,674
Remuneration of councillors – 22,044 25,954 30,943 28,856 25,647 4,551 30,876 33,037 35,350
Depreciation & asset impairment – 61,710 134,674 62,000 58,900 – – 56,400 60,200 63,798
Finance charges – 3,130 – – – 1,625 – – – –
Materials and bulk purchases – 109,036 93,612 92,177 92,509 87,114 11,189 100,138 106,154 112,525
Transfers and grants – – 39,126 4,705 5,570 4,282 973 12,795 13,092 14,232
Other ex penditure – 377,796 321,914 395,599 307,811 247,145 38,929 424,748 475,781 603,362
Total Expenditure – 897,786 973,447 945,363 872,544 700,561 85,738 1,038,916 1,126,620 1,297,941
Surplus/(Deficit) – (111,540) (115,085) 26,801 21,711 188,114 166,103 48,448 43,460 56,440
Transfers and subsidies - capital (monetary allocations) (National / Prov incial and District)– 96,720 86,798 197,500 207,587 101,887 42,030 82,795 77,138 81,526
Contributions recognised - capital & contributed assets – – – – – – – – – –
Surplus/(Deficit) after capital transfers &
contributions
– (14,821) (28,287) 224,301 229,298 290,001 208,134 131,243 120,598 137,966
Share of surplus/ (deficit) of associate – – – – – – – – – –
Surplus/(Deficit) for the year – (14,821) (28,287) 224,301 229,298 290,001 208,134 131,243 120,598 137,966
Capital expenditure & funds sources
Capital expenditure – – 73,176 196,159 200,733 613,182 135,373 130,094 69,593 75,758
Transfers recognised - capital – – (74,697) – – – (11,399) – – –
Borrow ing – – – – – – – – – –
Internally generated funds – – (165) – – – 165 – – –
Total sources of capital funds – – (74,862) – – – (11,234) – – –
Financial position
Total current assets – 33,153 341,068 560,056 504,603 504,603 – 181,971 324,433 131,317
Total non current assets – 243,300 1,903,704 1,640,472 1,739,368 1,739,368 – 1,813,062 1,822,455 1,834,414
Total current liabilities – 62,432 199,975 619,476 619,476 619,476 – 385,789 377,397 372,136
Total non current liabilities – – 139,377 140,195 140,195 140,195 – 140,195 140,195 140,195
Community w ealth/Equity – 214,021 1,905,419 1,440,856 1,484,299 1,484,299 – 1,469,048 1,629,295 1,453,400
Cash flows
Net cash from (used) operating – 193,614 165,998 196,953 180,218 180,218 – 215,225 210,274 233,263
Net cash from (used) inv esting – (103,176) (514,022) (223,131) (227,653) (227,653) – (130,094) (69,593) (75,758)
Net cash from (used) financing – (6,778) 40,886 12,704 17,426 17,426 – – – –
Cash/cash equivalents at the year end – 93,557 (307,138) 80,083 65,249 65,249 – 150,379 291,061 448,566
Cash backing/surplus reconciliation
Cash and inv estments av ailable – 20,372 65,006 308,163 252,710 252,710 – 150,379 291,061 96,042
Application of cash and inv estments – (10,349) (19,125) 24,647 37,880 37,394 – (28,199) (29,890) (31,694)
Balance - surplus (shortfall) – 30,721 84,132 283,517 214,831 215,317 – 178,578 320,951 127,736
Asset management
Asset register summary (WDV) – – – – – – – – – –
Depreciation – 65,807 134,674 62,000 58,900 – – 55,000 58,300 61,798
Renew al and Upgrading of Ex isting Assets – – 16,179 22,850 27,181 – – 15,600 7,648 14,699
Repairs and Maintenance – 33,443 1 – 200 – – – – –
Free services
Cost of Free Basic Serv ices prov ided – – – – – – – – – –
Rev enue cost of free serv ices prov ided – – – – – – – – – –
Households below minimum service level
Water: – – – – – – – – – –
Sanitation/sew erage: – – – – – – – – – –
Energy : – – – – – – 2 2 2 2
Refuse: – – – – – – 23 23 23 23
2019/20 Medium Term Revenue &
Expenditure FrameworkCurrent Year 2018/19
KZN216 Ray Nkonyeni - Table A1 Budget Summary

9 | P a g e
Total operating revenue is R 1,170 billion and increase by R 77 million over the 2020/22 MTREF. Total operating expenditure excluding capital expenditure for the 2019/20 budget will be R 1, 038 billion and overall budgeted performance is showing a surplus of R 1,31 million. The budget performance also include non-cash item for depreciation and asset impairment to the value of R 56. million. Capital expenditure for the year as per the budget amounts to R 130 million. This budget is funded through transfer’s recognized capital and internal funds.
5. Operating Revenue Framework
For RAY NKONYENI LOCAL Municipality to continue improving the quality of services provided to its citizens it needs to generate the required revenue. In these tough economic times strong revenue management is fundamental to the financial sustainability of every municipality. The reality is that we are faced with development backlogs and poverty. The expenditure required to address these challenges will inevitably always exceed available funding; hence difficult choices have to be made in relation to tariff increases and balancing expenditures against realistically anticipated revenues. The municipality’s revenue strategy is built around the following key components: • National Treasury’s guidelines and macroeconomic policy; • Growth in the municipality and continued economic development; • Efficient revenue management, which aims to ensure a 100 per cent annual
collection rate for property rates and other key service charges; • Electricity tariff increases as approved by the National Electricity Regulator of South
Africa (NERSA); • Achievement of full cost recovery of specific user charges especially in relation to
trading services; • Determining the tariff escalation rate by establishing/calculating the revenue
requirement of each service; • The municipality’s Property Rates Policy approved in terms of the Municipal Property
Rates Act, 2004 (Act 6 of 2004) (MPRA); • Increase ability to extend new services and recover costs; • The municipality’s Indigent Policy and rendering of free basic services; and
The following table is a summary of the 2019/20 MTREF (classified by main revenue source):

10 | P a g e
Table 2 Summary of revenue classified by main revenue source
KZN216 Ray Nkonyeni - Table A4 Budgeted Financial Performance (revenue and expenditure)
Description Ref 2015/16 2016/17 2017/18
R thousand 1Audited
Outcome
Audited
Outcome
Audited
Outcome
Original
Budget
Adjusted
Budget
Full Year
Forecast
Pre-audit
outcome
Budget Year
2019/20
Budget Year
+1 2020/21
Budget Year
+2 2021/22
Revenue By Source
Property rates 2 – 316,117 389,818 404,757 405,289 445,337 117,532 429,640 455,418 482,743
Serv ice charges - electricity rev enue 2 – 106,140 114,466 126,417 126,417 110,327 21,373 143,563 152,177 161,308
Serv ice charges - w ater rev enue 2 – – – – – – – – – –
Serv ice charges - sanitation rev enue 2 – – – – – – – – – –
Serv ice charges - refuse rev enue 2 – 41,431 48,696 62,635 62,635 56,133 14,966 71,393 75,677 80,217
Rental of facilities and equipment – 2,791 2,662 3,533 3,533 2,736 8,061 2,762 2,942 3,132
Interest earned - ex ternal inv estments – 5,251 3,618 20,192 4,703 3,183 (14,100) 4,985 5,284 5,601
Interest earned - outstanding debtors – 11,498 12,578 468 12,887 17,971 2,920 13,812 14,539 15,415
Div idends receiv ed – – – – – – – – – –
Fines, penalties and forfeits – 83,939 8,199 86,587 12,591 2,012 286 13,521 14,352 15,231
Licences and permits – 3,823 6,024 11,100 1,901 6,886 1,488 2,305 2,442 2,574
Agency serv ices – 4,817 3,429 6,000 8,985 3,597 793 9,524 10,096 10,701
Transfers and subsidies – 195,660 258,802 218,970 221,763 219,283 87,009 358,926 397,927 535,854
Other rev enue 2 – 14,778 10,070 31,506 33,552 21,209 11,514 36,933 39,227 41,606
Gains on disposal of PPE – – – – – – – – – –
Total Revenue (excluding capital transfers
and contributions)
– 786,246 858,362 972,164 894,255 888,675 251,841 1,087,364 1,170,080 1,354,382
2019/20 Medium Term Revenue &
Expenditure FrameworkCurrent Year 2018/19
Revenue generated from rates, services charges and transfers from grants forms a significant percentage of the revenue basket for the municipality. Rates, service charge revenues and transfers and grants comprise more than two thirds of the total revenue mix. In the 2019/20 financial year, revenue from rates, services charges, other revenue and transfers and grants totaled R 1 087 billion. Property rate revenue increased by 6 percent from R 405.4 million to R 430 million, this growth can be mainly attributed to the implementation of the new valuation roll, and service charges, investment and other revenue also increased as a results of municipal management adopting financial viability recovery and improvement plan. Property rates are the first largest revenue source totaling R430 million rand in 2019/20. The second and third largest sources are revenue from transfers and grants operational followed by service charges which are R359 million and R215million respectively. Other revenue’ which consists of various items such as income received from permits and licenses, building plan fees, connection fees, transport fees and advertisement fees. Departments have been urged to review the tariffs of these items on an annual basis to ensure they are cost reflective and market related. Figure 1 Sources of revenue Table 3 Operating Transfers and Grant Receipts KZN216 Ray Nkonyeni - Table A3 Budgeted Financial Performance (revenue and expenditure by municipal vote)
Vote Description Ref 2015/16 2016/17 2017/18
R thousandAudited
Outcome
Audited
Outcome
Audited
Outcome
Original
Budget
Adjusted
Budget
Full Year
Forecast
Budget Year
2019/20
Budget Year
+1 2020/21
Budget Year
+2 2021/22
Revenue by Vote 1
Vote 1 - BUDGET AND TREASURY – – 488,132 429,778 427,354 482,919 452,431 478,927 507,543
Vote 2 - TECHNICAL SERVICES – – 167,025 206,734 206,919 165,435 354,969 383,910 522,355
Vote 3 - CORPORATE SERVICES – – 2,187 129,619 139,706 63,234 3,625 3,843 4,074
Vote 4 - STRATEGIC PLANNING – – 176,037 185,468 189,523 185,306 205,608 222,456 241,076
Vote 5 - ECONOMIC DEVELOPMENT AND PLANNING – – 31,973 37,377 36,313 10,571 40,807 38,695 34,349
Vote 6 - PUBLIC SAFETY – – 74,448 177,587 98,687 67,790 40,008 42,317 44,818
Vote 7 - COMMUNITY SERVICES – – 5,358 3,101 3,340 15,308 72,710 77,071 81,693
Vote 8 - NULL – – – – – – – – –
Vote 9 - NULL – – – – – – – – –
Vote 10 - NULL – – – – – – – – –
Vote 11 - NULL – – – – – – – – –
Vote 12 - NULL – – – – – – – – –
Vote 13 - NULL – – – – – – – – –
Vote 14 - NULL – – – – – – – – –
Vote 15 - NULL – – – – – – – – –
Total Revenue by Vote 2 – – 945,160 1,169,664 1,101,842 990,562 1,170,159 1,247,218 1,435,908
Current Year 2018/192019/20 Medium Term Revenue &
Expenditure Framework

11 | P a g e
Expenditure by Vote to be appropriated 1
Vote 1 - BUDGET AND TREASURY 486 – 123,066 84,317 71,159 60,441 61,397 73,506 71,382
Vote 2 - TECHNICAL SERVICES 162 – 232,448 169,706 175,695 161,887 327,947 366,956 498,281
Vote 3 - CORPORATE SERVICES – – 83,181 94,579 99,528 88,854 89,800 95,529 101,723
Vote 4 - STRATEGIC PLANNING 324 – 178,094 158,548 155,998 85,974 156,391 167,971 178,757
Vote 5 - ECONOMIC DEVELOPMENT AND PLANNING 1,133 – 33,952 41,661 39,996 22,266 48,058 45,548 48,717
Vote 6 - PUBLIC SAFETY 162 – 195,652 249,214 177,117 148,120 152,913 165,650 173,875
Vote 7 - COMMUNITY SERVICES – – 127,053 147,338 153,051 133,019 202,410 211,459 225,206
Vote 8 - NULL 1,619 – – – – – – – –
Vote 9 - NULL 1,619 – – – – – – – –
Vote 10 - NULL 1,619 – – – – – – – –
Vote 11 - NULL 1,619 – – – – – – – –
Vote 12 - NULL 1,619 – – – – – – – –
Vote 13 - NULL 1,619 – – – – – – – –
Vote 14 - NULL 1,619 – – – – – – – –
Vote 15 - NULL 1,619 – – – – – – – –
Total Expenditure by Vote 2 15,220 – 973,447 945,363 872,544 700,561 1,038,916 1,126,620 1,297,941
Surplus/(Deficit) for the year 2 (15,220) – (28,287) 224,301 229,298 290,001 131,243 120,598 137,966 Tariff-setting is a pivotal and strategic part of the compilation of any budget. When rates, tariffs and other charges were revised, local economic conditions, input costs and the affordability of services were taken into account to ensure the financial sustainability of the municipality.
National Treasury continues to encourage municipalities to keep increases in rates, tariffs and other charges as low as possible. Municipalities must justify in their budget documentation all increases in excess of the 6 per cent upper boundary of the South African Reserve Bank’s inflation target. Excessive increases are likely to be counterproductive, resulting in higher levels of non-payment.
The percentage increases of Eskom bulk tariffs are far beyond the mentioned inflation target. Given that these tariff increases are determined by external agencies, the impact they have on the municipality’s electricity and in these tariffs are largely outside the control of the municipality It must also be appreciated that the consumer price index, as measured by CPI, is not a good measure of the cost increases of goods and services relevant to municipalities. The basket of goods and services utilized for the calculation of the CPI consist of items such as food, petrol and medical services, whereas the cost drivers of a municipality are informed by items such as the cost of remuneration, bulk purchases of electricity, petrol, diesel, chemicals, cement etc. The current challenge facing the municipality is managing the gap between cost drivers and tariffs levied, as any shortfall must be made up by either operational efficiency gains or service level reductions.
5.1. Property Rates
National Treasury’s MFMA Circular No. 58 and 59 deals, inter alia with the implementation of the Municipal Property Rates Act, with the regulations issued by the Department of Co-operative Governance. These regulations came into effect on 1 July 2009 and prescribe the rate ratio for the non-residential categories, public service infrastructure and agricultural properties relative to residential properties. The implementation of these regulations was done in the previous budget process and the Property Rates Policy of the Municipality has been amended accordingly. The following stipulations in the Property Rates Policy are highlighted:

12 | P a g e
• The first R15 000 of the market value of a property used for residential purposes is excluded from the rate-able value (Section 17(h) of the MPRA). In addition to this rebate, a further R85 000 and R50 000 reduction on the market value of a property for residential and vacant land categories respectively ,will be granted in terms of the municipality’s own Property Rates Policy;
• 100 per cent rebate will be granted to registered indigents and child headed household in terms of the Indigent Policy;
• For pensioners, physically and mentally disabled persons whose household income equal 2 state pensions, 4 state pensions and 6 state pensions will receive a rebate of 75%, 50% and 25 % respectively in terms of Rates policy.
• Indigents, in terms of the indigent policy are exempt from paying rates if the value of the property is less than R320 000.00.
The categories of rate-able properties for purposes of levying rates the proposed rates increase for the 2019/20 financial year is 5 per cent and the table below reflect individual municipality tariff for rates since the new valuation and new tariffs will be implemented in 2019/20 budget year.
5.2. Sale of Electricity and Impact of Tariff Increases
The consumer tariff had to be increased by 9.4 per cent to offset the additional bulk purchase cost from 1 July 2018. Furthermore, it should be noted that given the magnitude of the tariff increase, it is expected to depress growth in electricity consumption, which will have a negative impact on the municipality’s revenue from electricity.
5.3. Waste Removal and Impact of Tariff Increases
The municipality has implemented a solid waste strategy to ensure that this service can be rendered in a sustainable manner over the medium to long-term. The main contributors to solid waste are maintenance on vehicles, increases in general expenditure such as petrol and diesel and the cost of remuneration. Currently solid waste removal is operating at a surplus. 5.4. Other Tariff of Charges Other tariff of charges such licenses and permits, town planning, fines and other revenue have been increased by 6 per cent and tariff of charges is attached as annexure. 6. Operating Expenditure Framework The Municipality’s expenditure framework for the 2019/20 budget and MTREF is informed by the following:
• Budget constraint (operating expenditure should not exceed operating revenue) unless there are existing uncommitted cash-backed reserves to fund any deficit;
• Funding of the budget over the medium-term as informed by Section 18 and 19 of the MFMA;
• Operational gains and efficiencies will be directed to funding the capital budget and other core services; and

13 | P a g e
Table 5 Summary of operating expenditure by standard classification item
KZN216 Ray Nkonyeni - Table A4 Budgeted Financial Performance (revenue and expenditure)
Description Ref 2015/16 2016/17 2017/18
R thousand 1Audited
Outcome
Audited
Outcome
Audited
Outcome
Original
Budget
Adjusted
Budget
Full Year
Forecast
Pre-audit
outcome
Budget Year
2019/20
Budget Year
+1 2020/21
Budget Year
+2 2021/22
2019/20 Medium Term Revenue &
Expenditure FrameworkCurrent Year 2018/19

14 | P a g e
Table 6 Employee related costs details and councilors KZN216 Ray Nkonyeni - Supporting Table SA22 Summary councillor and staff benefits
Summary of Employee and Councillor
remunerationRef 2015/16 2016/17 2017/18
R thousandAudited
Outcome
Audited
Outcome
Audited
Outcome
Original
Budget
Adjusted
Budget
Full Year
Forecast
Budget Year
2019/20
Budget Year
+1 2020/21
Budget Year
+2 2021/22
A B C D E F G H I
Councillors (Political Office Bearers plus Other) 1
Basic Salaries and Wages – – 21,438 27,872 24,351 21,642 26,055 27,879 29,831
Pension and UIF Contributions – – – – – – – – –
Medical Aid Contributions – – – – – – – – –
Motor Vehicle Allow ance – – 2,600 – – – – – –
Cellphone Allow ance – – 1,916 3,071 4,505 4,006 4,821 5,158 5,519
Housing Allow ances – – – – – – – – –
Other benefits and allow ances – – – – – – – – –
Sub Total - Councillors – – 25,954 30,943 28,856 25,647 30,876 33,037 35,350
% increase 4 – – 19.2% (6.7%) (11.1%) 20.4% 7.0% 7.0%
Senior Managers of the Municipality 2
Basic Salaries and Wages – – – – – – – – –
Pension and UIF Contributions – – – – – – – – –
Medical Aid Contributions – – – – – – – – –
Ov ertime – – – – – – – – –
Performance Bonus – – – – – – – – –
Motor Vehicle Allow ance 3 – – – – – – – – –
Cellphone Allow ance 3 – – – – – – – – –
Housing Allow ances 3 – – – – – – – – –
Other benefits and allow ances 3 – – – – – – – – –
Pay ments in lieu of leav e – – – – – – – – –
Long serv ice aw ards – – – – – – – – –
Post-retirement benefit obligations 6 – – – – – – – – –
Sub Total - Senior Managers of Municipality – – – – – – – – –
% increase 4 – – – – – – – –
Other Municipal Staff
Basic Salaries and Wages – – 285,503 291,065 306,356 271,541 340,310 359,731 384,681
Pension and UIF Contributions – – 1,888 2,087 1,936 1,734 2,072 2,217 2,372
Medical Aid Contributions – – 16,192 19,027 16,858 15,164 18,048 19,310 20,659
Ov ertime – – 18,909 14,030 19,030 17,575 16,211 17,182 18,200
Performance Bonus – – 18,903 18,176 16,707 12,500 17,818 19,065 20,400
Motor Vehicle Allow ance 3 – – 13,537 13,339 14,819 13,400 16,065 17,173 18,426
Cellphone Allow ance 3 – – – – – – – – –
Housing Allow ances 3 – – 3,236 2,095 3,191 2,832 3,437 3,678 3,936
Other benefits and allow ances 3 – – – – – – – – –
Pay ments in lieu of leav e – – – – – – – – –
Long serv ice aw ards – – – – – – – – –
Post-retirement benefit obligations 6 – – – 120 – – – – –
Sub Total - Other Municipal Staff – – 358,167 359,939 378,898 334,747 413,959 438,356 468,674
% increase 4 – – 0.5% 5.3% (11.7%) 23.7% 5.9% 6.9%
Total Parent Municipality – – 384,121 390,882 407,754 360,394 444,835 471,393 504,024
– – 1.8% 4.3% (11.6%) 23.4% 6.0% 6.9%
Current Year 2018/192019/20 Medium Term Revenue &
Expenditure Framework
The budgeted allocation for employee related costs, senior management and councilors for the 2019/20 financial year totals R 445 million, which equals 42 per cent of the total operating expenditure. The salary increases have been factored into this budget at a percentage increase of 7 per cent for the 2019/20 financial year and also it must be noted that there are other line items which are excluded in employee costs e.g. overtime, standby allowances, salaries temps, pension funds contributions which were not kept at 7 per cent increase as compared to basic salary increase. The cost associated with the remuneration of councilors is determined by the Minister of Co-operative Governance and Traditional Affairs in accordance with the Remuneration of Public Office Bearers Act, 1998 (Act 20 of 1998). The most recent proclamation in this regard has been taken into account in compiling the municipality’s budget.

15 | P a g e
Provision for depreciation and asset impairment has been informed by the Municipality’s Asset Management Policy. Depreciation is widely considered a proxy for the measurement of the rate asset consumption. Budget appropriations in this regard total R 56 million for the 2019/20 financial and equates to 5 per cent of the total operating expenditure and depreciation decreased by 5 percent as compare to adjustment budget; because 2019/20 was based on the actual depreciation, asset disposals and additions. Note that the implementation of GRAP 17 accounting standard has meant bringing a range of assets previously not included in the assets register onto the register. This has resulted in a significant increase in depreciation relative to previous years. Bulk purchases are directly informed by the purchase of electricity from Eskom. The annual price increases have been factored into the budget appropriations and directly inform the revenue provisions. The increase is 9.3 per cent as per NERSA Guidelines. Repairs and maintenance comprises of amongst others the purchase of fuel, diesel, materials for maintenance, potholes, cleaning materials and chemicals. This group of expenditure has been prioritized to ensure sustainability of the municipality’s infrastructure especially potholes. The municipality has also budgeted for repairs and maintenance budgeted. Contracted services equal to 26 per cent of the expenditure budget and has been budgeted at R278 million. Other expenditure comprises of various line items relating to the daily operations of the municipality. This group of expenditure has also been identified as an area in which cost savings and efficiencies can be achieved. The salient features of general expenses have been the following:
Typical workstream Draft Budget amount
Farm workers 221 000,00
HIV awareness 195 000,00
Training of Councillors 350 000,00
Public participation outreach
programme180 000,00
Mayoral roadshows & Izimbizo 1 400 000,00
Children’s Right 185 000,00
Development of Cultural Skills, Maiden
ceremony and Libraries outreach795 000,00
Indigenous Festival 100 000,00
Ugu Jazz 300 000,00
Disability Empowerment 420 000,00
Econonic Development incl. Mayoral
Fair7 950 000,00
Women’s Open Golf and Academy 950 000,00
Gender Empowerment 260 000,00
Youth Development 3 821 500,00
•Tertiary registration 400 000,00
•Other programmes 3 421 500,00

16 | P a g e
Comedy Show 100 000,00
Gamalakhe Music festival 350 000,00
Uvukile gospel Concert 250 000,00
Community Awards 400 000,00
Back to School 400 000,00
South Coast Bike week 1 000 000,00
Welcoming road Block 50 000,00
Salga Games 500 000,00
Shobashobane commemoration 150 000,00
Special functions 2 000 000,00
Women’s Caucus 300 000,00
Masikandi Festival 250 000,00
Spring Carnival 100 000,00
Caucus fund 250 000,00
Streetlights installation 1 000 000,00
Ward comittees 2 100 000,00
Roads Infrastructure & related: R75 025 000,00
• Tarring of Roads R15 645 000
• Bridges R19 250 000
• Potholes Repairs R15 250 000
• Preventative maintenance (Roads) R5 900 000
• Plant Hire (Roads) R5 980 000
• Concrete strips R7 000 000
• Storm water R4 500 000
• Gravel roads R1 500 000
6.1. Priority given to repairs and maintenance During the compilation of the 2019/20 MTREF operational repairs and maintenance was identified as a strategic imperative owing to the aging of the municipality’s infrastructure and historic deferred maintenance especially roads. The municipality has an infrastructure maintenance plan to ensure that assets are in good condition. 6.2 Free Basic Services: Basic Social Service Package The social package assists households that are poor or face circumstances that limit their ability to pay for services. To receive these free services the households are required to register in terms of the Municipality’s Indigent Policy and the policy is reviewed annually. The cost of the social package of the registered indigent households is largely financed by national government through the local government equitable share received in terms of the annual Division of Revenue Act.

17 | P a g e
7. Capital Expenditure Framework KZN216 Ray Nkonyeni - Table A5 Budgeted Capital Expenditure by vote, functional classification and funding
Vote Description Ref 2015/16 2016/17 2017/18
R thousand 1Audited
Outcome
Audited
Outcome
Audited
Outcome
Original
Budget
Adjusted
Budget
Full Year
Forecast
Pre-audit
outcome
Budget Year
2019/20
Budget Year
+1 2020/21
Budget Year
+2 2021/22
Single-year expenditure to be appropriated 2
Vote 1 - BUDGET AND TREASURY – – 256 273 504 648 256 323 278 278
Vote 2 - TECHNICAL SERVICES – – 38,499 189,311 191,864 617,944 113,092 69,830 45,478 60,042
Vote 3 - CORPORATE SERVICES – – 127 255 559 380 127 229 206 206
Vote 4 - STRATEGIC PLANNING – – 1,128 9,393 9,060 6,988 1,145 25,897 12,968 8,018
Vote 5 - ECONOMIC DEVELOPMENT AND PLANNING – – 21,489 5,638 5,613 1,545 21,569 15,573 522 522
Vote 6 - PUBLIC SAFETY – – 403 711 640 11 403 640 576 576
Vote 7 - COMMUNITY SERVICES – – 20,994 17,550 19,413 62,406 25,118 17,602 9,565 6,116
Vote 8 - NULL – – – – – – – – – –
Vote 9 - NULL – – – – – – – – – –
Vote 10 - NULL – – – – – – – – – –
Vote 11 - NULL – – – – – – – – – –
Vote 12 - NULL – – – – – – – – – –
Vote 13 - NULL – – – – – – – – – –
Vote 14 - NULL – – – – – – – – – –
Vote 15 - NULL – – – – – – – – – –
Capital single-year expenditure sub-total – – 82,896 223,131 227,653 689,921 161,710 130,094 69,593 75,758
Total Capital Expenditure - Vote – – 82,896 223,131 227,653 689,921 161,710 130,094 69,593 75,758
Capital Expenditure - Functional
Governance and administration – – 1,490 880 1,095 2,024 1,490 900 797 797
Ex ecutiv e and council – – 1,084 100 90 211 1,084 70 63 63
Finance and administration – – 406 780 1,005 1,813 406 830 734 734
Internal audit – – – – – – – – – –
Community and public safety – – 16,704 141,171 151,015 424,206 68,729 15,791 7,707 4,207
Community and social serv ices – – 16,484 17,050 19,145 62,263 18,669 15,782 7,699 4,199
Sport and recreation – – 0 – – – 1,937 – – –
Public safety – – 206 – – – 206 – – –
Housing – – 13 124,121 131,870 361,943 47,916 9 8 8
Health – – – – – – – – – –
Economic and environmental services – – 54,982 54,107 48,622 186,952 65,154 80,463 37,612 39,287
Planning and dev elopment – – 21,490 14,679 14,311 7,537 21,588 31,938 13,222 8,272
Road transport – – 33,367 39,428 34,311 179,415 43,442 47,725 23,542 30,116
Env ironmental protection – – 124 – – – 124 800 848 899
Trading services – – – – – – – 23,706 23,477 31,467
Energy sources – – – – – – – 22,686 22,459 30,449
Water management – – – – – – – – – –
Waste w ater management – – – – – – – – – –
Waste management – – – – – – – 1,020 1,018 1,018
Other – – – – – – – 9,235 – –
Total Capital Expenditure - Functional 3 – – 73,176 196,159 200,733 613,182 135,373 130,094 69,593 75,758
Funded by:
National Gov ernment – – (73,952) – – – (22,446) 80,795 67,464 73,375
Prov incial Gov ernment – – (745) – – – 11,047 3,000 – –
District Municipality – – – – – – – – – –
Other transfers and grants – – – – – – – – – –
Transfers recognised - capital 4 – – (74,697) – – – (11,399) 83,795 67,464 73,375
Borrowing 6 – – – – – – – – – –
Internally generated funds – – (165) – – – 165 46,299 2,129 2,383
Total Capital Funding 7 – – (74,862) – – – (11,234) 130,094 69,593 75,758
Current Year 2018/192019/20 Medium Term Revenue &
Expenditure Framework
The main source of funding of the 2019/20 Capital budget of R 130 million is transfers recognized capital from National and provincial departments, followed by internally generated funds from reserves of R46 million. Capital projects are group per cluster, municipal wide and departmental. RAY NKONYENI LOCAL has 7 clusters.

18 | P a g e
PART 2 MAIN BUDGET TABLES 8. Annual Budget Tables The following are the main budget tables as required in terms of section 8 of the Municipal Budget and Reporting Regulations. Table 8 MBRR Table A1 - Budget Summary
Description 2015/16 2016/17 2017/18
R thousandsAudited
Outcome
Audited
Outcome
Audited
Outcome
Original
Budget
Adjusted
Budget
Full Year
Forecast
Pre-audit
outcome
Budget Year
2019/20
Budget Year
+1 2020/21
Budget Year
+2 2021/22
Financial Performance
Property rates – 316,117 389,818 404,757 405,289 445,337 117,532 429,640 455,418 482,743
Serv ice charges – 147,571 163,162 189,052 189,052 166,460 36,339 214,956 227,854 241,525
Inv estment rev enue – 5,251 3,618 20,192 4,703 3,183 (14,100) 4,985 5,284 5,601
Transfers recognised - operational – 195,660 258,802 218,970 221,763 219,283 87,009 358,926 397,927 535,854
Other ow n rev enue – 121,646 42,962 139,193 73,449 54,411 25,062 78,857 83,597 88,659
Total Revenue (excluding capital transfers and
contributions)
– 786,246 858,362 972,164 894,255 888,675 251,841 1,087,364 1,170,080 1,354,382
Employ ee costs – 324,070 358,167 359,939 378,898 334,747 30,096 413,959 438,356 468,674
Remuneration of councillors – 22,044 25,954 30,943 28,856 25,647 4,551 30,876 33,037 35,350
Depreciation & asset impairment – 61,710 134,674 62,000 58,900 – – 56,400 60,200 63,798
Finance charges – 3,130 – – – 1,625 – – – –
Materials and bulk purchases – 109,036 93,612 92,177 92,509 87,114 11,189 100,138 106,154 112,525
Transfers and grants – – 39,126 4,705 5,570 4,282 973 12,795 13,092 14,232
Other ex penditure – 377,796 321,914 395,599 307,811 247,145 38,929 424,748 475,781 603,362
Total Expenditure – 897,786 973,447 945,363 872,544 700,561 85,738 1,038,916 1,126,620 1,297,941
Surplus/(Deficit) – (111,540) (115,085) 26,801 21,711 188,114 166,103 48,448 43,460 56,440
Transfers and subsidies - capital (monetary allocations) (National / Prov incial and District)– 96,720 86,798 197,500 207,587 101,887 42,030 82,795 77,138 81,526
Contributions recognised - capital & contributed assets – – – – – – – – – –
Surplus/(Deficit) after capital transfers &
contributions
– (14,821) (28,287) 224,301 229,298 290,001 208,134 131,243 120,598 137,966
Share of surplus/ (deficit) of associate – – – – – – – – – –
Surplus/(Deficit) for the year – (14,821) (28,287) 224,301 229,298 290,001 208,134 131,243 120,598 137,966
Capital expenditure & funds sources
Capital expenditure – – 73,176 196,159 200,733 613,182 135,373 130,094 69,593 75,758
Transfers recognised - capital – – (74,697) – – – (11,399) – – –
Borrow ing – – – – – – – – – –
Internally generated funds – – (165) – – – 165 – – –
Total sources of capital funds – – (74,862) – – – (11,234) – – –
Financial position
Total current assets – 33,153 341,068 560,056 504,603 504,603 – 181,971 324,433 131,317
Total non current assets – 243,300 1,903,704 1,640,472 1,739,368 1,739,368 – 1,813,062 1,822,455 1,834,414
Total current liabilities – 62,432 199,975 619,476 619,476 619,476 – 385,789 377,397 372,136
Total non current liabilities – – 139,377 140,195 140,195 140,195 – 140,195 140,195 140,195
Community w ealth/Equity – 214,021 1,905,419 1,440,856 1,484,299 1,484,299 – 1,469,048 1,629,295 1,453,400
Cash flows
Net cash from (used) operating – 193,614 165,998 196,953 180,218 180,218 – 215,225 210,274 233,263
Net cash from (used) inv esting – (103,176) (514,022) (223,131) (227,653) (227,653) – (130,094) (69,593) (75,758)
Net cash from (used) financing – (6,778) 40,886 12,704 17,426 17,426 – – – –
Cash/cash equivalents at the year end – 93,557 (307,138) 80,083 65,249 65,249 – 150,379 291,061 448,566
Cash backing/surplus reconciliation
Cash and inv estments av ailable – 20,372 65,006 308,163 252,710 252,710 – 150,379 291,061 96,042
Application of cash and inv estments – (10,349) (19,125) 24,647 37,880 37,394 – (28,199) (29,890) (31,694)
Balance - surplus (shortfall) – 30,721 84,132 283,517 214,831 215,317 – 178,578 320,951 127,736
Asset management
Asset register summary (WDV) – – – – – – – – – –
Depreciation – 65,807 134,674 62,000 58,900 – – 55,000 58,300 61,798
Renew al and Upgrading of Ex isting Assets – – 16,179 22,850 27,181 – – 15,600 7,648 14,699
Repairs and Maintenance – 33,443 1 – 200 – – – – –
Free services
Cost of Free Basic Serv ices prov ided – – – – – – – – – –
Rev enue cost of free serv ices prov ided – – – – – – – – – –
Households below minimum service level
Water: – – – – – – – – – –
Sanitation/sew erage: – – – – – – – – – –
Energy : – – – – – – 2 2 2 2
Refuse: – – – – – – 23 23 23 23
2019/20 Medium Term Revenue &
Expenditure FrameworkCurrent Year 2018/19
KZN216 Ray Nkonyeni - Table A1 Budget Summary
Table A1 is a budget summary and provides a concise overview of the municipality’s budget from all of the major financial perspectives (financial performance, capital

19 | P a g e
expenditure and funding sources, financial position, cash flow, MFMA funding compliance and asset management).
The table provides an overview of the amounts approved by Council for operating performance, resources deployed to capital expenditure, financial position, cash and funding compliance, as well as the municipality’s commitment to eliminating basic service delivery backlogs.
Table 9 MBRR Table A2 - Budgeted Financial Performance (revenue and expenditure by standard classification) KZN216 Ray Nkonyeni - Table A2 Budgeted Financial Performance (revenue and expenditure by functional classification)
Functional Classification Description Ref 2015/16 2016/17 2017/18
R thousand 1Audited
Outcome
Audited
Outcome
Audited
Outcome
Original
Budget
Adjusted
Budget
Full Year
Forecast
Budget Year
2019/20
Budget Year
+1 2020/21
Budget Year
+2 2021/22
Revenue - Functional
Governance and administration – – 666,356 618,666 617,298 670,618 661,665 705,226 752,692
Ex ecutiv e and council – – 176,037 185,468 186,523 185,306 205,608 222,456 241,076
Finance and administration – – 490,319 433,198 430,775 485,312 456,057 482,770 511,616
Internal audit – – – – – – – – –
Community and public safety – – 46,866 140,130 150,815 76,887 138,232 165,280 283,575
Community and social serv ices – – 11,595 13,631 13,870 15,138 14,399 15,169 16,040
Sport and recreation – – – 100 100 77 106 112 119
Public safety – – 1,271 200 560 631 466 494 524
Housing – – 34,000 126,199 136,286 61,041 123,260 149,504 266,892
Health – – – – – – – – –
Economic and environmental services – – 40,822 191,427 116,552 56,758 129,844 122,986 131,417
Planning and dev elopment – – 28,703 27,189 31,573 7,694 32,907 30,312 32,169
Road transport – – 11,674 163,979 84,719 49,024 96,661 92,382 98,938
Env ironmental protection – – 446 260 260 39 276 292 310
Trading services – – 187,845 209,252 209,437 183,423 232,518 245,343 266,044
Energy sources – – 133,025 146,417 146,602 124,681 160,913 169,442 185,589
Water management – – – – – – – – –
Waste w ater management – – – – – – – – –
Waste management – – 54,821 62,835 62,835 58,742 71,605 75,901 80,455
Other 4 – – 3,270 10,188 7,740 2,877 7,900 8,384 2,180
Total Revenue - Functional 2 – – 945,160 1,169,664 1,101,842 990,562 1,170,159 1,247,218 1,435,908
Expenditure - Functional
Governance and administration – – 372,450 319,007 309,499 220,554 313,452 343,212 358,428
Ex ecutiv e and council – – 150,404 122,226 117,372 55,249 114,408 123,149 130,900
Finance and administration – – 203,709 166,702 159,564 139,635 164,572 183,316 188,354
Internal audit – – 18,336 30,079 32,562 25,670 34,472 36,747 39,174
Community and public safety – – 124,108 87,224 92,782 77,827 226,943 262,989 385,474
Community and social serv ices – – 19,230 26,284 28,828 22,169 42,680 45,378 48,310
Sport and recreation – – 10,259 4,821 5,149 4,204 5,963 8,995 6,809
Public safety – – 48,132 42,402 46,399 40,950 46,801 49,983 53,382
Housing – – 46,487 13,717 12,405 10,505 131,499 158,633 276,973
Health – – – – – – – – –
Economic and environmental services – – 205,918 258,804 184,748 154,518 204,134 211,437 225,131
Planning and dev elopment – – 26,965 34,317 33,928 24,421 42,723 39,932 42,519
Road transport – – 158,408 201,657 130,787 112,886 137,126 145,763 155,325
Env ironmental protection – – 20,546 22,830 20,033 17,212 24,285 25,742 27,287
Trading services – – 259,894 267,796 274,107 245,408 283,976 297,937 316,902
Energy sources – – 121,295 105,714 107,091 101,810 115,485 122,507 129,967
Water management – – – – – – – – –
Waste w ater management – – – – – – – – –
Waste management – – 138,599 162,082 167,016 143,598 168,491 175,430 186,935
Other 4 – – 11,076 12,532 11,408 2,254 10,411 11,046 12,007
Total Expenditure - Functional 3 – – 973,447 945,363 872,544 700,561 1,038,916 1,126,620 1,297,941
Surplus/(Deficit) for the year – – (28,287) 224,301 229,298 290,001 131,243 120,598 137,966
Current Year 2018/192019/20 Medium Term Revenue &
Expenditure Framework
Explanatory notes to MBRR Table A2 - Budgeted Financial Performance (revenue and expenditure by standard classification)
Table A2 is a view of the budgeted financial performance in relation to revenue and expenditure per standard classification. The modified GFS standard classification divides the municipal services into 15 functional areas. Municipal revenue, operating expenditure and capital expenditure are then classified in terms if each of these

20 | P a g e
functional areas which enables the National Treasury to compile ‘whole of government’ reports.
Note that as a general principle the revenues for the Trading Services should exceed their expenditures. The table highlights that both Electricity function and Waste management function are able to finance its services. As both service charges are reflecting a surplus.
• Other functions that show a deficit between revenue and expenditure are being financed from rates revenues, other revenue sources and transfers recognized operational from both National and provincial departments.
Table 10 MBRR Table A3 - Budgeted Financial Performance (revenue and expenditure by vote)
KZN216 Ray Nkonyeni - Table A3 Budgeted Financial Performance (revenue and expenditure by municipal vote)
Vote Description Ref 2015/16 2016/17 2017/18
R thousandAudited
Outcome
Audited
Outcome
Audited
Outcome
Original
Budget
Adjusted
Budget
Full Year
Forecast
Budget Year
2019/20
Budget Year
+1 2020/21
Budget Year
+2 2021/22
Revenue by Vote 1
Vote 1 - BUDGET AND TREASURY – – 488,132 429,778 427,354 482,919 452,431 478,927 507,543
Vote 2 - TECHNICAL SERVICES – – 167,025 206,734 206,919 165,435 354,969 383,910 522,355
Vote 3 - CORPORATE SERVICES – – 2,187 129,619 139,706 63,234 3,625 3,843 4,074
Vote 4 - STRATEGIC PLANNING – – 176,037 185,468 189,523 185,306 205,608 222,456 241,076
Vote 5 - ECONOMIC DEVELOPMENT AND PLANNING – – 31,973 37,377 36,313 10,571 40,807 38,695 34,349
Vote 6 - PUBLIC SAFETY – – 74,448 177,587 98,687 67,790 40,008 42,317 44,818
Vote 7 - COMMUNITY SERVICES – – 5,358 3,101 3,340 15,308 72,710 77,071 81,693
Vote 8 - NULL – – – – – – – – –
Vote 9 - NULL – – – – – – – – –
Vote 10 - NULL – – – – – – – – –
Vote 11 - NULL – – – – – – – – –
Vote 12 - NULL – – – – – – – – –
Vote 13 - NULL – – – – – – – – –
Vote 14 - NULL – – – – – – – – –
Vote 15 - NULL – – – – – – – – –
Total Revenue by Vote 2 – – 945,160 1,169,664 1,101,842 990,562 1,170,159 1,247,218 1,435,908
Expenditure by Vote to be appropriated 1
Vote 1 - BUDGET AND TREASURY 486 – 123,066 84,317 71,159 60,441 61,397 73,506 71,382
Vote 2 - TECHNICAL SERVICES 162 – 232,448 169,706 175,695 161,887 327,947 366,956 498,281
Vote 3 - CORPORATE SERVICES – – 83,181 94,579 99,528 88,854 89,800 95,529 101,723
Vote 4 - STRATEGIC PLANNING 324 – 178,094 158,548 155,998 85,974 156,391 167,971 178,757
Vote 5 - ECONOMIC DEVELOPMENT AND PLANNING 1,133 – 33,952 41,661 39,996 22,266 48,058 45,548 48,717
Vote 6 - PUBLIC SAFETY 162 – 195,652 249,214 177,117 148,120 152,913 165,650 173,875
Vote 7 - COMMUNITY SERVICES – – 127,053 147,338 153,051 133,019 202,410 211,459 225,206
Vote 8 - NULL 1,619 – – – – – – – –
Vote 9 - NULL 1,619 – – – – – – – –
Vote 10 - NULL 1,619 – – – – – – – –
Vote 11 - NULL 1,619 – – – – – – – –
Vote 12 - NULL 1,619 – – – – – – – –
Vote 13 - NULL 1,619 – – – – – – – –
Vote 14 - NULL 1,619 – – – – – – – –
Vote 15 - NULL 1,619 – – – – – – – –
Total Expenditure by Vote 2 15,220 – 973,447 945,363 872,544 700,561 1,038,916 1,126,620 1,297,941
Surplus/(Deficit) for the year 2 (15,220) – (28,287) 224,301 229,298 290,001 131,243 120,598 137,966
Current Year 2018/192019/20 Medium Term Revenue &
Expenditure Framework
Table A3 is a view of the budgeted financial performance in relation to the revenue
and expenditure per municipal vote. This table facilitates the view of the budgeted
operating performance in relation to the organizational structure of the Municipality.
This means it is possible to present the operating surplus or deficit of a vote.

21 | P a g e
Table11 MBRR Table A4 - Budgeted Financial Performance (revenue and expenditure)
KZN216 Ray Nkonyeni - Table A4 Budgeted Financial Performance (revenue and expenditure)
Description Ref 2015/16 2016/17 2017/18
R thousand 1Audited
Outcome
Audited
Outcome
Audited
Outcome
Original
Budget
Adjusted
Budget
Full Year
Forecast
Pre-audit
outcome
Budget Year
2019/20
Budget Year
+1 2020/21
Budget Year
+2 2021/22
Revenue By Source
Property rates 2 – 316,117 389,818 404,757 405,289 445,337 117,532 429,640 455,418 482,743
Serv ice charges - electricity rev enue 2 – 106,140 114,466 126,417 126,417 110,327 21,373 143,563 152,177 161,308
Serv ice charges - w ater rev enue 2 – – – – – – – – – –
Serv ice charges - sanitation rev enue 2 – – – – – – – – – –
Serv ice charges - refuse rev enue 2 – 41,431 48,696 62,635 62,635 56,133 14,966 71,393 75,677 80,217
Rental of facilities and equipment – 2,791 2,662 3,533 3,533 2,736 8,061 2,762 2,942 3,132
Interest earned - ex ternal inv estments – 5,251 3,618 20,192 4,703 3,183 (14,100) 4,985 5,284 5,601
Interest earned - outstanding debtors – 11,498 12,578 468 12,887 17,971 2,920 13,812 14,539 15,415
Div idends receiv ed – – – – – – – – – –
Fines, penalties and forfeits – 83,939 8,199 86,587 12,591 2,012 286 13,521 14,352 15,231
Licences and permits – 3,823 6,024 11,100 1,901 6,886 1,488 2,305 2,442 2,574
Agency serv ices – 4,817 3,429 6,000 8,985 3,597 793 9,524 10,096 10,701
Transfers and subsidies – 195,660 258,802 218,970 221,763 219,283 87,009 358,926 397,927 535,854
Other rev enue 2 – 14,778 10,070 31,506 33,552 21,209 11,514 36,933 39,227 41,606
Gains on disposal of PPE – – – – – – – – – –
Total Revenue (excluding capital transfers
and contributions)
– 786,246 858,362 972,164 894,255 888,675 251,841 1,087,364 1,170,080 1,354,382
Expenditure By Type
Employ ee related costs 2 – 324,070 358,167 359,939 378,898 334,747 30,096 413,959 438,356 468,674
Remuneration of councillors – 22,044 25,954 30,943 28,856 25,647 4,551 30,876 33,037 35,350
Debt impairment 3 – 126,158 36,465 3,200 5,989 3,545 395 12,211 13,183 14,238
Depreciation & asset impairment 2 – 61,710 134,674 62,000 58,900 – – 56,400 60,200 63,798
Finance charges – 3,130 – – – 1,625 – – – –
Bulk purchases 2 – 75,594 87,168 86,620 86,620 82,707 10,578 94,676 100,357 106,378
Other materials 8 – 33,442 6,444 5,556 5,889 4,408 611 5,461 5,797 6,147
Contracted serv ices – 32,290 285,449 392,399 301,822 243,600 38,535 277,573 318,807 436,221
Transfers and subsidies – – 39,126 4,705 5,570 4,282 973 12,795 13,092 14,232
Other ex penditure 4, 5 – 219,349 – – – – – 134,963 143,791 152,903
Loss on disposal of PPE – – – – – – – – – –
Total Expenditure – 897,786 973,447 945,363 872,544 700,561 85,738 1,038,916 1,126,620 1,297,941
Surplus/(Deficit) – (111,540) (115,085) 26,801 21,711 188,114 166,103 48,448 43,460 56,440
Transfers and subsidies - capital (monetary
allocations) (National / Prov incial and District) – 96,720 86,798 197,500 207,587 101,887 42,030 82,795 77,138 81,526
Transfers and subsidies - capital (monetary
allocations) (National / Prov incial Departmental
Agencies, Households, Non-profit Institutions,
Priv ate Enterprises, Public Corporatons, Higher 6 – – – – – – – – – –
Transfers and subsidies - capital (in-kind - all) – – – – – – – – – –
Surplus/(Deficit) after capital transfers &
contributions
– (14,821) (28,287) 224,301 229,298 290,001 208,134 131,243 120,598 137,966
Tax ation – – – – – – – – – –
Surplus/(Deficit) after taxation – (14,821) (28,287) 224,301 229,298 290,001 208,134 131,243 120,598 137,966
Attributable to minorities – – – – – – – – – –
Surplus/(Deficit) attributable to municipality – (14,821) (28,287) 224,301 229,298 290,001 208,134 131,243 120,598 137,966
Share of surplus/ (deficit) of associate 7 – – – – – – – – – –
Surplus/(Deficit) for the year – (14,821) (28,287) 224,301 229,298 290,001 208,134 131,243 120,598 137,966
2019/20 Medium Term Revenue &
Expenditure FrameworkCurrent Year 2018/19
Explanatory notes to Table A4 - Budgeted Financial Performance (revenue and expenditure) 1. Total operating revenue is R1, 087 billion and total capital revenue is R82.8 million in
2019/20
2. Total revenue for 2019/20 financial year is R 1.18 billion.
3. Revenue to be generated from property rates is R430 million in the 2019/20 financial
year therefore remains a main funding source for the municipality.
4. Transfers recognized – operating includes the local government equitable share and
other operating grants from national and provincial government amounts to R359
million. It needs to be noted that in real terms the grants receipts from national
government are growing rapidly over the MTREF. The municipality is not grant
dependent since major part of revenue is own funding however we still has to ensure
that we collect every single cent that is due to us.

22 | P a g e
Table 12 MBRR Table A5 - Budgeted Capital Expenditure by vote, standard classification and funding source
KZN216 Ray Nkonyeni - Table A5 Budgeted Capital Expenditure by vote, functional classification and funding
Vote Description Ref 2015/16 2016/17 2017/18
R thousand 1Audited
Outcome
Audited
Outcome
Audited
Outcome
Original
Budget
Adjusted
Budget
Full Year
Forecast
Pre-audit
outcome
Budget Year
2019/20
Budget Year
+1 2020/21
Budget Year
+2 2021/22
Capital expenditure - Vote
Multi-year expenditure to be appropriated 2
Vote 1 - BUDGET AND TREASURY – – – – – – – – – –
Vote 2 - TECHNICAL SERVICES – – – – – – – – – –
Vote 3 - CORPORATE SERVICES – – – – – – – – – –
Vote 4 - STRATEGIC PLANNING – – – – – – – – – –
Vote 5 - ECONOMIC DEVELOPMENT AND PLANNING – – – – – – – – – –
Vote 6 - PUBLIC SAFETY – – – – – – – – – –
Vote 7 - COMMUNITY SERVICES – – – – – – – – – –
Vote 8 - NULL – – – – – – – – – –
Vote 9 - NULL – – – – – – – – – –
Vote 10 - NULL – – – – – – – – – –
Vote 11 - NULL – – – – – – – – – –
Vote 12 - NULL – – – – – – – – – –
Vote 13 - NULL – – – – – – – – – –
Vote 14 - NULL – – – – – – – – – –
Vote 15 - NULL – – – – – – – – – –
Capital multi-year expenditure sub-total 7 – – – – – – – – – –
Single-year expenditure to be appropriated 2
Vote 1 - BUDGET AND TREASURY – – 256 273 504 648 256 323 278 278
Vote 2 - TECHNICAL SERVICES – – 38,499 189,311 191,864 617,944 113,092 69,830 45,478 60,042
Vote 3 - CORPORATE SERVICES – – 127 255 559 380 127 229 206 206
Vote 4 - STRATEGIC PLANNING – – 1,128 9,393 9,060 6,988 1,145 25,897 12,968 8,018
Vote 5 - ECONOMIC DEVELOPMENT AND PLANNING – – 21,489 5,638 5,613 1,545 21,569 15,573 522 522
Vote 6 - PUBLIC SAFETY – – 403 711 640 11 403 640 576 576
Vote 7 - COMMUNITY SERVICES – – 20,994 17,550 19,413 62,406 25,118 17,602 9,565 6,116
Vote 8 - NULL – – – – – – – – – –
Vote 9 - NULL – – – – – – – – – –
Vote 10 - NULL – – – – – – – – – –
Vote 11 - NULL – – – – – – – – – –
Vote 12 - NULL – – – – – – – – – –
Vote 13 - NULL – – – – – – – – – –
Vote 14 - NULL – – – – – – – – – –
Vote 15 - NULL – – – – – – – – – –
Capital single-year expenditure sub-total – – 82,896 223,131 227,653 689,921 161,710 130,094 69,593 75,758
Total Capital Expenditure - Vote – – 82,896 223,131 227,653 689,921 161,710 130,094 69,593 75,758
Capital Expenditure - Functional
Governance and administration – – 1,490 880 1,095 2,024 1,490 900 797 797
Ex ecutiv e and council – – 1,084 100 90 211 1,084 70 63 63
Finance and administration – – 406 780 1,005 1,813 406 830 734 734
Internal audit – – – – – – – – – –
Community and public safety – – 16,704 141,171 151,015 424,206 68,729 15,791 7,707 4,207
Community and social serv ices – – 16,484 17,050 19,145 62,263 18,669 15,782 7,699 4,199
Sport and recreation – – 0 – – – 1,937 – – –
Public safety – – 206 – – – 206 – – –
Housing – – 13 124,121 131,870 361,943 47,916 9 8 8
Health – – – – – – – – – –
Economic and environmental services – – 54,982 54,107 48,622 186,952 65,154 80,463 37,612 39,287
Planning and dev elopment – – 21,490 14,679 14,311 7,537 21,588 31,938 13,222 8,272
Road transport – – 33,367 39,428 34,311 179,415 43,442 47,725 23,542 30,116
Env ironmental protection – – 124 – – – 124 800 848 899
Trading services – – – – – – – 23,706 23,477 31,467
Energy sources – – – – – – – 22,686 22,459 30,449
Water management – – – – – – – – – –
Waste w ater management – – – – – – – – – –
Waste management – – – – – – – 1,020 1,018 1,018
Other – – – – – – – 9,235 – –
Total Capital Expenditure - Functional 3 – – 73,176 196,159 200,733 613,182 135,373 130,094 69,593 75,758
Funded by:
National Gov ernment – – (73,952) – – – (22,446) 80,795 69,593 75,758
Prov incial Gov ernment – – (745) – – – 11,047 3,000 – –
District Municipality – – – – – – – – – –
Other transfers and grants – – – – – – – – – –
Transfers recognised - capital 4 – – (74,697) – – – (11,399) 83,795 69,593 75,758
Borrowing 6 – – – – – – – – – –
Internally generated funds – – (165) – – – 165 46,299 – –
Total Capital Funding 7 – – (74,862) – – – (11,234) 130,094 69,593 75,758
2019/20 Medium Term Revenue &
Expenditure FrameworkCurrent Year 2018/19

23 | P a g e
Explanatory notes to Table A5 - Budgeted Capital Expenditure by vote, standard classification and funding source
Table A5 is a breakdown of the capital programme in relation to capital expenditure by municipal vote (multi-year and single-year appropriations); capital expenditure by standard classification; and the funding sources necessary to fund the capital budget, including information on capital transfers from national and provincial departments.
The MFMA provides that a municipality may approve multi-year or single-year capital budget appropriations.
Single-year capital expenditure has been appropriated at R130 million for the 2019/20 financial year.
Unlike multi-year capital appropriations, single-year appropriations relate to expenditure that will be incurred in the specific budget year such as the procurement of vehicles and specialized tools and equipment. The budget appropriations for the two outer years are indicative allocations based on the departmental business plans as informed by the IDP and will be reviewed on an annual basis to assess the relevance of the expenditure in relation to the strategic objectives and service delivery imperatives of the municipality. For the purpose of funding assessment of the MTREF, these appropriations have been included but no commitments will be incurred against single-year appropriations for the two outer-years.
The capital programme is funded from capital and provincial grants and transfers and internally generated funds

24 | P a g e
Table 13 MBRR Table A6 - Budgeted Financial Position KZN216 Ray Nkonyeni - Table A6 Budgeted Financial Position
Description Ref 2015/16 2016/17 2017/18
R thousandAudited
Outcome
Audited
Outcome
Audited
Outcome
Original
Budget
Adjusted
Budget
Full Year
Forecast
Pre-audit
outcome
Budget Year
2019/20
Budget Year
+1 2020/21
Budget Year
+2 2021/22
ASSETS
Current assets
Cash – 20,372 (8,226) 26,624 65,249 65,249 – 88,828 226,097 96,042
Call inv estment deposits 1 – – 73,233 281,539 187,461 187,461 – 61,551 64,964 –
Consumer debtors 1 – – 183,005 31,177 31,177 31,177 – 22,786 24,404 26,132
Other debtors – 8,735 74,436 214,811 214,811 214,811 – 2,901 3,065 3,240
Current portion of long-term receiv ables – 680 3,453 680 680 680 – 680 680 680
Inv entory 2 – 3,367 15,168 5,224 5,224 5,224 – 5,224 5,224 5,224
Total current assets – 33,153 341,068 560,056 504,603 504,603 – 181,971 324,433 131,317
Non current assets
Long-term receiv ables – 7,157 6,655 7,157 7,157 7,157 – 7,157 7,157 7,157
Inv estments – – – – – – – – – –
Inv estment property – 235,788 – 235,621 235,621 235,621 – 235,621 235,621 235,621
Inv estment in Associate – – – – – – – – – –
Property , plant and equipment 3 – – 1,472,577 1,395,703 1,494,599 1,494,599 – 1,568,293 1,577,685 1,589,645
Biological – – – – – – – – – –
Intangible – 354 – 354 354 354 – 354 354 354
Other non-current assets – – 424,472 1,637 1,637 1,637 – 1,637 1,637 1,637
Total non current assets – 243,300 1,903,704 1,640,472 1,739,368 1,739,368 – 1,813,062 1,822,455 1,834,414
TOTAL ASSETS – 276,453 2,244,771 2,200,528 2,243,971 2,243,971 – 1,995,033 2,146,888 1,965,731
LIABILITIES
Current liabilities
Bank ov erdraft 1 – – – – – – – – – –
Borrow ing 4 – – 9,995 10,220 10,220 10,220 – 13,928 5,403 –
Consumer deposits – 22,926 23,108 282,963 282,963 282,963 – 282,963 282,963 282,963
Trade and other pay ables 4 – – 161,882 242,582 242,582 242,582 – 5,186 5,320 5,462
Prov isions – 39,506 4,990 83,712 83,712 83,712 – 83,712 83,712 83,712
Total current liabilities – 62,432 199,975 619,476 619,476 619,476 – 385,789 377,397 372,136
Non current liabilities
Borrow ing – – 11,236 11,357 11,357 11,357 – 11,357 11,357 11,357
Prov isions – – 128,141 128,838 128,838 128,838 – 128,838 128,838 128,838
Total non current liabilities – – 139,377 140,195 140,195 140,195 – 140,195 140,195 140,195
TOTAL LIABILITIES – 62,432 339,352 759,672 759,672 759,672 – 525,984 517,593 512,332
NET ASSETS 5 – 214,021 1,905,419 1,440,856 1,484,299 1,484,299 – 1,469,048 1,629,295 1,453,400
COMMUNITY WEALTH/EQUITY
Accumulated Surplus/(Deficit) – (14,821) 1,568,302 224,301 229,298 229,298 – 131,243 120,598 137,966
Reserv es 4 – 228,842 337,117 1,216,555 1,255,001 1,255,001 – 1,337,805 1,508,698 1,315,434
TOTAL COMMUNITY WEALTH/EQUITY 5 – 214,021 1,905,419 1,440,856 1,484,299 1,484,299 – 1,469,048 1,629,295 1,453,400
2019/20 Medium Term Revenue &
Expenditure FrameworkCurrent Year 2018/19
Explanatory notes to Table A6 - Budgeted Financial Position
Table A6 is consistent with international standards of good financial management practice, and improves understand ability for councillors and management of the impact of the budget on the statement of financial position (balance sheet).
This format of presenting the statement of financial position is aligned to GRAP1, which is generally aligned to the international version which presents Assets less Liabilities as “accounting” Community Wealth. The order of items within each group illustrates items in order of liquidity; i.e. assets readily converted to cash, or liabilities immediately required to be met from cash, appear first.
• Call investments deposits; • Consumer debtors; • Property, plant and equipment; • Trade and other payables; • Provisions non -current; • Changes in net assets; and • Reserves

25 | P a g e
The statement of financial position shows that the municipality is financially health as assets exceeds liabilities. Table 14 MBRR Table A7 - Budgeted Cash Flow Statement KZN216 Ray Nkonyeni - Table A7 Budgeted Cash Flows
Description Ref 2015/16 2016/17 2017/18
R thousandAudited
Outcome
Audited
Outcome
Audited
Outcome
Original
Budget
Adjusted
Budget
Full Year
Forecast
Pre-audit
outcome
Budget Year
2019/20
Budget Year
+1 2020/21
Budget Year
+2 2021/22
CASH FLOW FROM OPERATING ACTIVITIES
Receipts
Property rates – 142,528 247,704 396,662 317,330 317,330 – 452,616 480,013 509,077
Serv ice charges – 178,819 117,122 177,699 168,814 168,814 – 214,766 227,663 241,323
Other rev enue – 59,820 30,384 56,686 53,852 53,852 – 67,947 72,124 76,484
Gov ernment - operating 1 – 264,852 258,802 232,938 221,234 221,234 – 358,926 397,927 535,854
Gov ernment - capital 1 – – 86,798 182,163 211,116 211,116 – 82,795 77,138 81,526
Interest – 5,251 16,196 19,407 15,526 15,526 – 18,796 19,823 21,016
Div idends – – – – – – – – –
Payments
Suppliers and employ ees – (449,577) (551,882) (859,300) (802,085) (802,085) – (975,662) (1,059,817) (1,226,998)
Finance charges – (3,130) – (3,400) – – – – – –
Transfers and Grants 1 – (4,949) (39,126) (5,903) (5,570) (5,570) – (4,960) (4,597) (5,018)
NET CASH FROM/(USED) OPERATING ACTIVITIES – 193,614 165,998 196,953 180,218 180,218 – 215,225 210,274 233,263
CASH FLOWS FROM INVESTING ACTIVITIES
Receipts
Proceeds on disposal of PPE – – – – – – – – – –
Decrease (Increase) in non-current debtors – – (6,655) – – – – – – –
Decrease (increase) other non-current receiv ables – – (424,472) – – – – – – –
Decrease (increase) in non-current inv estments – – – – – – – – – –
Payments
Capital assets – (103,176) (82,896) (223,131) (227,653) (227,653) – (130,094) (69,593) (75,758)
NET CASH FROM/(USED) INVESTING ACTIVITIES – (103,176) (514,022) (223,131) (227,653) (227,653) – (130,094) (69,593) (75,758)
CASH FLOWS FROM FINANCING ACTIVITIES
Receipts
Short term loans – – (3,453) – – – – – – –
Borrow ing long term/refinancing – – 21,231 – – – – – – –
Increase (decrease) in consumer deposits – – 23,108 22,926 25,426 25,426 – – – –
Payments
Repay ment of borrow ing – (6,778) – (10,223) (8,000) (8,000) – – – –
NET CASH FROM/(USED) FINANCING ACTIVITIES – (6,778) 40,886 12,704 17,426 17,426 – – – –
NET INCREASE/ (DECREASE) IN CASH HELD – 83,659 (307,138) (13,474) (30,009) (30,009) – 85,130 140,681 157,506
Cash/cash equiv alents at the y ear begin: 2 – 9,898 – 93,557 95,257 95,257 – 65,249 150,379 291,061
Cash/cash equiv alents at the y ear end: 2 – 93,557 (307,138) 80,083 65,249 65,249 – 150,379 291,061 448,566
2019/20 Medium Term Revenue &
Expenditure FrameworkCurrent Year 2018/19
26 | P a g e
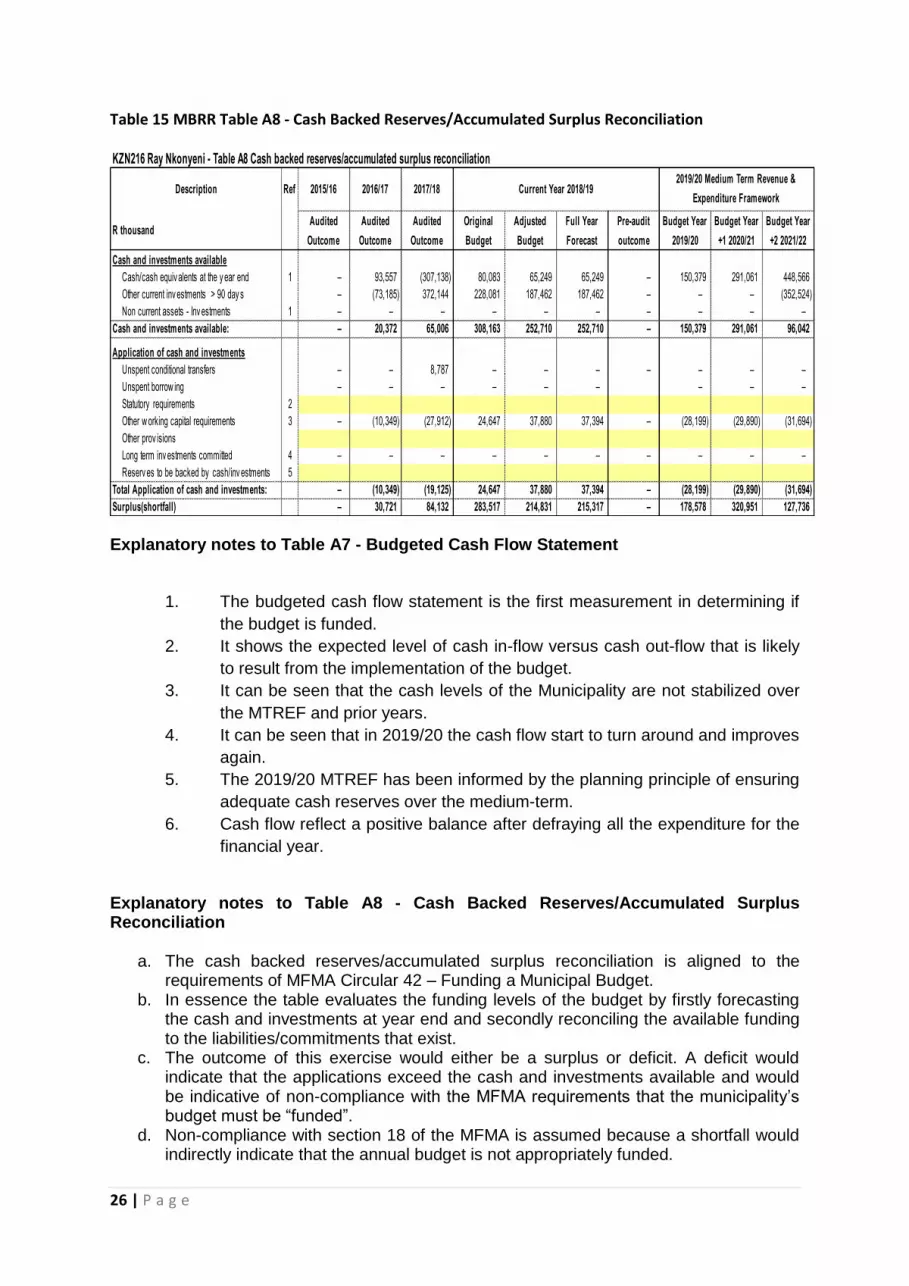
Table 15 MBRR Table A8 - Cash Backed Reserves/Accumulated Surplus Reconciliation
KZN216 Ray Nkonyeni - Table A8 Cash backed reserves/accumulated surplus reconciliation
Description Ref 2015/16 2016/17 2017/18
R thousandAudited
Outcome
Audited
Outcome
Audited
Outcome
Original
Budget
Adjusted
Budget
Full Year
Forecast
Pre-audit
outcome
Budget Year
2019/20
Budget Year
+1 2020/21
Budget Year
+2 2021/22
Cash and investments available
Cash/cash equiv alents at the y ear end 1 – 93,557 (307,138) 80,083 65,249 65,249 – 150,379 291,061 448,566
Other current inv estments > 90 day s – (73,185) 372,144 228,081 187,462 187,462 – – – (352,524)
Non current assets - Inv estments 1 – – – – – – – – – –
Cash and investments available: – 20,372 65,006 308,163 252,710 252,710 – 150,379 291,061 96,042
Application of cash and investments
Unspent conditional transfers – – 8,787 – – – – – – –
Unspent borrow ing – – – – – – – – –
Statutory requirements 2
Other w orking capital requirements 3 – (10,349) (27,912) 24,647 37,880 37,394 – (28,199) (29,890) (31,694)
Other prov isions
Long term inv estments committed 4 – – – – – – – – – –
Reserv es to be backed by cash/inv estments 5
Total Application of cash and investments: – (10,349) (19,125) 24,647 37,880 37,394 – (28,199) (29,890) (31,694)
Surplus(shortfall) – 30,721 84,132 283,517 214,831 215,317 – 178,578 320,951 127,736
2019/20 Medium Term Revenue &
Expenditure FrameworkCurrent Year 2018/19
Explanatory notes to Table A7 - Budgeted Cash Flow Statement
1. The budgeted cash flow statement is the first measurement in determining if
the budget is funded.
2. It shows the expected level of cash in-flow versus cash out-flow that is likely
to result from the implementation of the budget.
3. It can be seen that the cash levels of the Municipality are not stabilized over
the MTREF and prior years.
4. It can be seen that in 2019/20 the cash flow start to turn around and improves
again.
5. The 2019/20 MTREF has been informed by the planning principle of ensuring
adequate cash reserves over the medium-term.
6. Cash flow reflect a positive balance after defraying all the expenditure for the
financial year.
Explanatory notes to Table A8 - Cash Backed Reserves/Accumulated Surplus Reconciliation
a. The cash backed reserves/accumulated surplus reconciliation is aligned to the requirements of MFMA Circular 42 – Funding a Municipal Budget.
b. In essence the table evaluates the funding levels of the budget by firstly forecasting the cash and investments at year end and secondly reconciling the available funding to the liabilities/commitments that exist.
c. The outcome of this exercise would either be a surplus or deficit. A deficit would indicate that the applications exceed the cash and investments available and would be indicative of non-compliance with the MFMA requirements that the municipality’s budget must be “funded”.
d. Non-compliance with section 18 of the MFMA is assumed because a shortfall would indirectly indicate that the annual budget is not appropriately funded.
27 | P a g e
e. From the table it can be seen that for the municipality is operating at a surplus. f. Considering the requirements of section 18 of the MFMA, it can be concluded that
the adopted 2019/20 MTREF was funded as it reflect a positive balance in funding measurement.
g. This reflects that the budget will be able to pay it expenditure for the current year and also be able to pay it obligations. It is assumed that all grants will be spend 100% and if not it is cash backed since our budget reflect a positive after all the current years expenditure paid and it liabilities.
h. As part of the budgeting and planning guidelines that informed the compilation of the 2019/20 MTREF the end objective of the medium-term framework was to ensure the budget is funded aligned to section 18 of the MFMA.
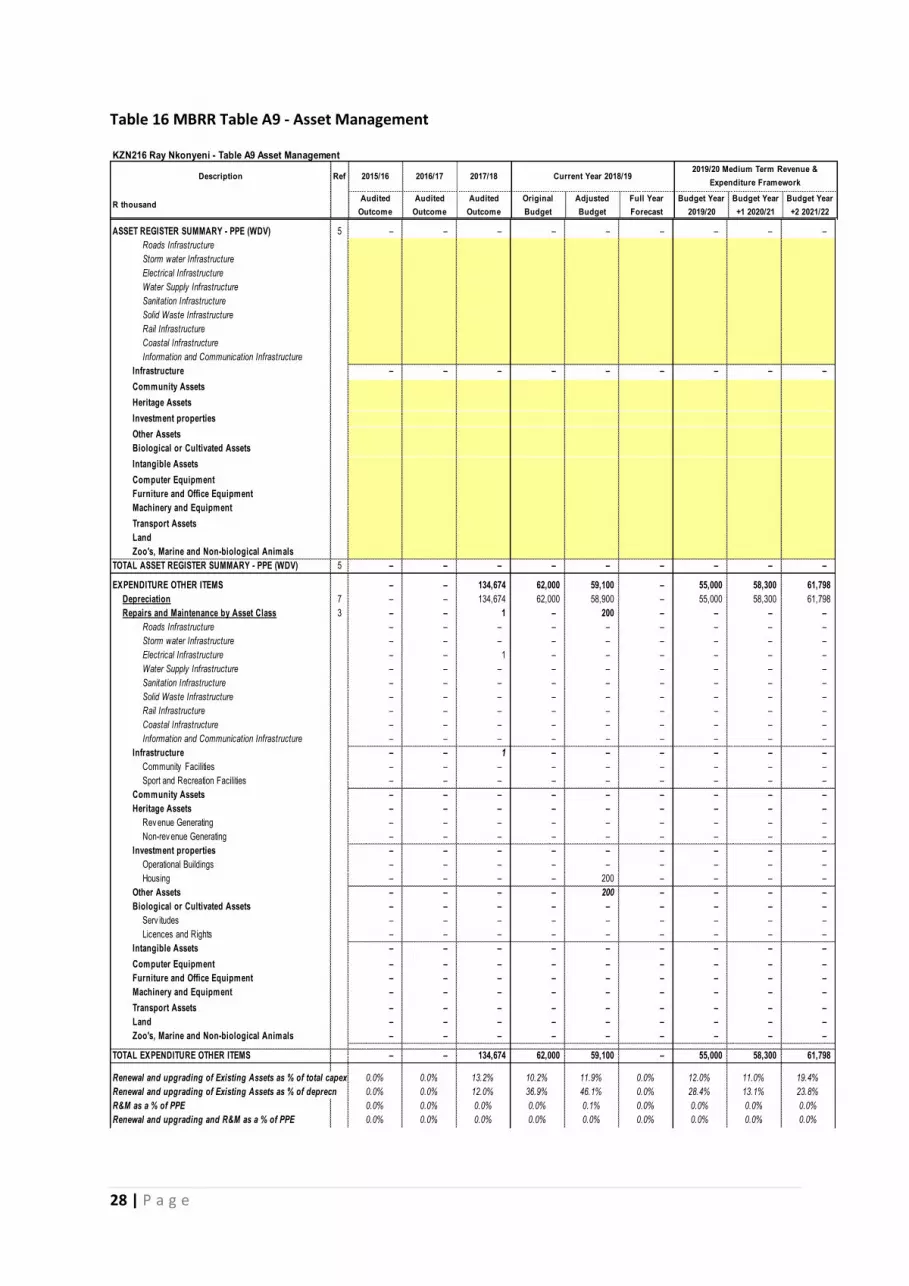
28 | P a g e
Table 16 MBRR Table A9 - Asset Management
KZN216 Ray Nkonyeni - Table A9 Asset Management
Description Ref 2015/16 2016/17 2017/18
R thousandAudited
Outcome
Audited
Outcome
Audited
Outcome
Original
Budget
Adjusted
Budget
Full Year
Forecast
Budget Year
2019/20
Budget Year
+1 2020/21
Budget Year
+2 2021/22
Current Year 2018/192019/20 Medium Term Revenue &
Expenditure Framework
ASSET REGISTER SUMMARY - PPE (WDV) 5 – – – – – – – – –
Roads Infrastructure
Storm water Infrastructure
Electrical Infrastructure
Water Supply Infrastructure
Sanitation Infrastructure
Solid Waste Infrastructure
Rail Infrastructure
Coastal Infrastructure
Information and Communication Infrastructure
Infrastructure – – – – – – – – –
Community Assets
Heritage Assets
Investment properties
Other Assets
Biological or Cultivated Assets
Intangible Assets
Computer Equipment
Furniture and Office Equipment
Machinery and Equipment
Transport Assets
Land
Zoo's, Marine and Non-biological Animals
TOTAL ASSET REGISTER SUMMARY - PPE (WDV) 5 – – – – – – – – –
EXPENDITURE OTHER ITEMS – – 134,674 62,000 59,100 – 55,000 58,300 61,798
Depreciation 7 – – 134,674 62,000 58,900 – 55,000 58,300 61,798
Repairs and Maintenance by Asset Class 3 – – 1 – 200 – – – –
Roads Infrastructure – – – – – – – – –
Storm water Infrastructure – – – – – – – – –
Electrical Infrastructure – – 1 – – – – – –
Water Supply Infrastructure – – – – – – – – –
Sanitation Infrastructure – – – – – – – – –
Solid Waste Infrastructure – – – – – – – – –
Rail Infrastructure – – – – – – – – –
Coastal Infrastructure – – – – – – – – –
Information and Communication Infrastructure – – – – – – – – –
Infrastructure – – 1 – – – – – –
Community Facilities – – – – – – – – –
Sport and Recreation Facilities – – – – – – – – –
Community Assets – – – – – – – – –
Heritage Assets – – – – – – – – –
Rev enue Generating – – – – – – – – –
Non-rev enue Generating – – – – – – – – –
Investment properties – – – – – – – – –
Operational Buildings – – – – – – – – –
Housing – – – – 200 – – – –
Other Assets – – – – 200 – – – –
Biological or Cultivated Assets – – – – – – – – –
Serv itudes – – – – – – – – –
Licences and Rights – – – – – – – – –
Intangible Assets – – – – – – – – –
Computer Equipment – – – – – – – – –
Furniture and Office Equipment – – – – – – – – –
Machinery and Equipment – – – – – – – – –
Transport Assets – – – – – – – – –
Land – – – – – – – – –
Zoo's, Marine and Non-biological Animals – – – – – – – – –
TOTAL EXPENDITURE OTHER ITEMS – – 134,674 62,000 59,100 – 55,000 58,300 61,798
Renewal and upgrading of Existing Assets as % of total capex 0.0% 0.0% 13.2% 10.2% 11.9% 0.0% 12.0% 11.0% 19.4%
Renewal and upgrading of Existing Assets as % of deprecn 0.0% 0.0% 12.0% 36.9% 46.1% 0.0% 28.4% 13.1% 23.8%
R&M as a % of PPE 0.0% 0.0% 0.0% 0.0% 0.1% 0.0% 0.0% 0.0% 0.0%
Renewal and upgrading and R&M as a % of PPE 0.0% 0.0% 0.0% 0.0% 0.0% 0.0% 0.0% 0.0% 0.0%

29 | P a g e
Explanatory notes to Table A9 - Asset Management
1 Table A9 provides an overview of municipal capital allocations to building new assets
and the renewal of existing assets, as well as spending on repairs and maintenance
by asset class.
2 National Treasury has recommended that municipalities should allocate at least 40
per cent of the capital budget to the renewal of existing assets, and allocations to
repairs and maintenance should be 8 per cent of PPE. However due to the fact that
there is a lack of infrastructure in the municipality major part of funds are injected to
new capital projects, it does not meet this recommendation and funds are directed to
new and renewal of capital asset and 3.2% to repairs and maintenance.
Basic Service Delivery Measurement
1 The municipality does not provide services such as water, sanitation, energy and
refuse removal.
2 Water and sanitation is provided by UGu District municipality, energy is supplied both
by municipality and Eskom.
3 Refuse removal is done in urban area and the rural part of the municipality uses its
own dump site.
Assumptions used in preparation of the budget over the MTREF
Collection and expenditure rates
Property rates 98%
Penalties and Collection Charges 95%
Electricity 95%
Refuse Removal 95%
Rental of facilities 95%
Interest earned in investment 100%
Interest earned on outstanding debts 95%
Fines 7.2%
Licenses and Permits 95%
Agency Fees 100%
Transfers and Grants – operational 100%
Transfers and Grants – Capital 100%
Other revenue 80%
Expenditure
Employee related cost 100%
Remuneration of councilors 100%
Debt impairment 100%
Bulk Purchases 95%
Finance Charges 100%
Contracted services 95%
Transfers and Grants 100%
Other Expenditure 90%
Oher Material 98%
Capital performance =100%
Year-end accruals =10% of total operating budget

30 | P a g e
=15% of capital budget
Provisions =10%
Part 3: Supporting Documentation
Overview of the annual budget process
Section 53 of the MFMA requires the Mayor of the municipality to provide general political guidance in the budget process and the setting of priorities that must guide the preparation of the budget. In addition Chapter 2 of the Municipal Budget and Reporting Regulations states that the Mayor of the municipality must establish a Budget Steering Committee to provide technical assistance to the Mayor in discharging the responsibilities set out in section 53 of the Act. The Budget Steering Committee consists of the Municipal Manager and senior officials of the municipality meeting under the chairpersonship of the MMC for Finance. The primary aim of the Budget Steering Committee is to ensure:
1 that the process followed to compile the budget complies with legislation and good budget practices;
2 that there is proper alignment between the policy and service delivery priorities set out in the Municipality’s IDP and the budget, taking into account the need to protect the financial sustainability of municipality;
3 That the municipality’s revenue and tariff setting strategies ensure that the cash resources needed to deliver services are available; and that the various spending priorities of the different municipal departments are properly evaluated and prioritized in the allocation of resources.
Budget Process Overview
In terms of section 21 of the MFMA the Mayor is required to table in Council ten months before the start of the new financial year (i.e. in August 2011) a time schedule that sets out the process to revise the IDP and prepare the budget. The Mayor tabled in Council the required IDP and budget time schedule on 29 August 2018. Key dates applicable to the process were:
July 2018– Prepare joint process plan for IDP, PMS and Budget and advertise draft IDFP review; August 2018–Submit process plan to IDP forum, portfolio committees and council. Liaise with national and provincial governments for planning and budgeting process; September 2018– Assessment of objectives, strategies and projects against cross cutting issues. Assessment of alignment of IDP strategies & projects for medium term in relation to NSDP and PGDF. Determine funding availability & requirements per sector plan and where relevant prepare business plan/ terms of reference and roll out accordingly; October 2018 – Review and confirm objectives, strategies and projects at IDPRF workshop. Review capital, institutional, operational, maintenance projects. Estimate available resources and provide guidance for way forward for budgeting;

31 | P a g e
November 2018–Submit revised projects to Treasury. Submit first Draft IDP to IDP steering committee and council for in principle approval December 2018 – Submit budget instructions and 2019/20 budget framework to all relevant persons. Submit draft IDP to COGTA for assessment. Preparation of summary of available funds (internal and external); January 2019 - Council considers the 2018/2019 Mid-year Review and Adjustments Budget; February 2019 – Assess financial feasibility of proposed new projects based on existing and potential funds. Consideration of draft budget; March 2019 - Tabling in Council of the draft 2019/20 IDP and 2019/20 Draft MTREF for public consultation; April 2019 – Public consultation; May2019 –Finalisation of the 2019/20 IDP and 2019/20 MTREF, taking into consideration comments received from the public, comments from National Treasury, and updated information from the most recent Division of Revenue Bill and financial framework; and tabling of the 2019/20 MTREF before Council for consideration and approval.
There were no deviations from the key dates set out in the Budget Time Schedule tabled in Council. These are the IDP and Budget process schedule for individual municipalities and both municipality did not deviate from processes.
IDP and Service Delivery and Budget Implementation Plan
The Municipality’s IDP is its principal strategic planning instrument, which directly guides and informs its planning, budget, management and development actions. This framework is rolled out into objectives, key performance indicators and targets for implementation which directly inform the Service Delivery and Budget Implementation Plan. The Process Plan applicable to the fifth revision cycle included the following key IDP processes and deliverables:
Registration of community needs; Compilation of departmental business plans including key performance indicators and targets; Financial planning and budgeting process; Public participation process; Compilation of the SDBIP, and The review of the performance management and monitoring processes.
The IDP has been taken into a business and financial planning process leading up to the 2019/20 budget, based on the approved 2018/19 Budget, Mid-year Review and adjustments budget. The business planning process has subsequently been refined in the light of current economic circumstances and the resulting revenue projections. With the compilation of the 2019/20 budget, each department/function had to review the business planning process, including the setting of priorities and targets after reviewing the mid-year and third quarter performance against the 2019/20 Departmental Service Delivery and Budget Implementation Plan. Business planning links back to priority needs and master planning, and essentially informed the detail operating budget appropriations and three-year capital programme.

32 | P a g e
Financial Modelling and Key Planning Drivers
As part of the compilation of the 2019/20 budget, extensive financial modelling was undertaken to ensure affordability and long-term financial sustainability. The following key factors and planning strategies have informed the compilation of the 2019/20 budget:
Municipality growth Policy priorities and strategic objectives Asset maintenance Economic climate and trends (i.e. inflation) Performance trends The approved 2018/19 adjustments budget and performance against the SDBIP Cash Flow Management Strategy Debtor payment levels Investment possibilities The need for tariff increases versus the ability of the community to pay for services; Improved and sustainable service delivery
In addition to the above, the strategic guidance given in National Treasury’s MFMA Circulars 89 and 91 has been taken into consideration in the planning and prioritisation process. Community Consultation
The Table 2019/20 Budget as tabled before Council on 29 March 2019 for community consultation has been published on the municipality’s website and hard copies has been made available at municipal offices and other community centres. In addition budget road shows will held in different municipal clusters. Inputs were also collected via suggestion box and e-mails. All documents in the appropriate format (electronic and printed) will provided to National Treasury, and other national and provincial departments in accordance with section 23 of the MFMA, to provide an opportunity for them to make inputs. Ward Committees were utilised to facilitate the community consultation process during April. The applicable dates and venues were published in the local newspapers. Imbizo’s will be held to further ensure transparency and interaction. Other stakeholders involved in the consultation will include churches, non-governmental institutions and community-based organisations. Submissions received during the community consultation process and additional information regarding revenue and expenditure and individual capital projects will be addressed, and where relevant considered as part of the 2019/20 final budget.
Overview of alignment of annual budget with IDP
The Constitution mandates local government with the responsibility to exercise local developmental and cooperative governance. The eradication of imbalances in South African society can only be realized through a credible integrated developmental planning process. Municipalities in South Africa need to utilise integrated development planning as a method to plan future development in their areas and so find the best solutions to achieve sound long-

33 | P a g e
term development goals. A municipal IDP provides a five year strategic programme of action aimed at setting short, medium and long term strategic and budget priorities to create a development platform, which correlates with the term of office of the political incumbents. The plan aligns the resources and the capacity of a municipality to its overall development aims and guides the municipal budget. An IDP is therefore a key instrument which municipalities use to provide vision, leadership and direction to all those that have a role to play in the development of a municipal area. The IDP enables municipalities to make the best use of scarce resources and speed up service delivery. Integrated developmental planning in the South African context is amongst others, an approach to planning aimed at involving the municipality and the community to jointly find the best solutions towards sustainable development. Furthermore, integrated development planning provides a strategic environment for managing and guiding all planning, development and decision making in the municipality. It is important that the IDP developed by municipalities correlate with National and Provincial intent. It must aim to co-ordinate the work of local and other spheres of government in a coherent plan to improve the quality of life for all the people living in that area. Applied to the Municipality, issues of national and provincial importance should be reflected in the IDP of the municipality. A clear understanding of such intent is therefore imperative to ensure that the Municipality’s strategically complies with the key national and provincial priorities. The aim of this revision cycle was to develop and coordinate a coherent plan to improve the quality of life for all the people living in the area, also reflecting issues of national and provincial importance. One of the key objectives is therefore to ensure that there exists alignment between national and provincial priorities, policies and strategies and the Municipality’s response to these requirements. The national and provincial priorities, policies and strategies of importance include amongst others:
Green Paper on National Strategic Planning of 2009; Government Programme of Action; Development Facilitation Act of 1995; Provincial Growth and Development Strategy (GGDS); National and Provincial spatial development perspectives; Relevant sector plans such as transportation, legislation and policy; National Key Performance Indicators (NKPIs); Accelerated and Shared Growth Initiative (ASGISA); National Development Plan (NDP) National Spatial Development Perspective (NSDP) and The National Priority Outcomes.
The Constitution requires local government to relate its management, budgeting and planning functions to its objectives. This gives a clear indication of the intended purposes of municipal integrated development planning. Legislation stipulates clearly that a municipality must not only give effect to its IDP, but must also conduct its affairs in a manner which is consistent with its IDP. The following table highlights the IDP’s six strategic objectives for the 2019/20 Budget and further planning refinements that have directly informed the compilation of the budget:
IDP Strategic Objectives
2019/20 Financial Year

34 | P a g e
1. Financial Viability
2. Basic Service delivery and infrastructure
3. Good governance and public participation
4. Local economic Development
5. Municipal transformation and institutional development
6. Spatial analysis and environmental management
In order to ensure integrated and focused service delivery between all spheres of government it was important for the Municipality to align its budget priorities with that of national and provincial government. All spheres of government place a high priority on infrastructure development, economic development and job creation, efficient service delivery, poverty alleviation and building sound institutional arrangements. In line with the MSA, the IDP constitutes a single, inclusive strategic plan for the Municipality. The five-year programme responds to the development challenges and opportunities faced by the Municipality by identifying the key performance areas to achieve the five the strategic objectives mentioned above. In addition to the five-year IDP, the municipality undertakes an extensive planning and developmental strategy which primarily focuses on a longer-term horizon; 15 to 20 years. This process is aimed at influencing the development path by proposing a substantial programme of public-led investment to restructure current patterns of settlement, activity and access to resources in the Municipality so as to promote greater equity and enhanced opportunity. It provides direction to the Municipality’s IDP, associated sectoral plans and strategies, and the allocation of resources of the Municipality and other service delivery partners. The 2019/20 Budget has therefore been directly informed by the IDP revision process and the following tables provide a reconciliation between the IDP strategic objectives and operating revenue, operating expenditure and capital expenditure.

35 | P a g e
Table SA3 Detail financial position
KZN216 Ray Nkonyeni - Supporting Table SA3 Supportinging detail to 'Budgeted Financial Position'
2015/16 2016/17 2017/18
Audited
Outcome
Audited
Outcome
Audited
Outcome
Original
Budget
Adjusted
Budget
Full Year
Forecast
Pre-audit
outcome
Budget Year
2019/20
Budget Year
+1 2020/21
Budget Year
+2 2021/22
R thousand
ASSETS
Call investment deposits
Call deposits – – 73,233 281,539 187,461 187,461 – 61,551 64,964 –
Other current inv estments – – – – – – – – – –
Total Call investment deposits 2 – – 73,233 281,539 187,461 187,461 – 61,551 64,964 –
Consumer debtors
Consumer debtors – – 183,005 31,177 31,177 31,177 – 22,786 24,404 26,132
Less: Prov ision for debt impairment – – – – – – – – – –
Total Consumer debtors 2 – – 183,005 31,177 31,177 31,177 – 22,786 24,404 26,132
Debt impairment provision
Balance at the beginning of the y ear
Contributions to the prov ision – – – – – – – – – –
Bad debts w ritten off
Balance at end of year – – – – – – – – – –
Property, plant and equipment (PPE)
PPE at cost/v aluation (ex cl. finance leases) – – 2,709,341 2,652,223 3,087,043 3,087,043 – 3,217,137 3,286,729 3,362,487
Leases recognised as PPE 3 – – – – – – – – – –
Less: Accumulated depreciation – – 1,236,763 1,256,520 1,592,444 1,592,444 – 1,648,844 1,709,044 1,772,842
Total Property, plant and equipment (PPE) 2 – – 1,472,577 1,395,703 1,494,599 1,494,599 – 1,568,293 1,577,685 1,589,645
LIABILITIES
Current liabilities - Borrowing
Short term loans (other than bank ov erdraft) – – 9,995 – – – – – – –
Current portion of long-term liabilities – – – 10,220 10,220 10,220 – 13,928 5,403 –
Total Current liabilities - Borrowing – – 9,995 10,220 10,220 10,220 – 13,928 5,403 –
Trade and other payables
Trade Pay ables 5 – – 147,228 239,582 239,582 239,582 – 2,186 2,320 2,462
Other creditors – – – 3,000 3,000 3,000 – 3,000 3,000 3,000
Unspent conditional transfers – – 8,787 – – – – – – –
VAT – – 5,867 – – – – – – –
Total Trade and other payables 2 – – 161,882 242,582 242,582 242,582 – 5,186 5,320 5,462
Non current liabilities - Borrowing
Borrow ing 4 – – 11,164 11,357 11,357 11,357 – 11,357 11,357 11,357
Finance leases (including PPP asset element) – – 72 – – – – – – –
Total Non current liabilities - Borrowing – – 11,236 11,357 11,357 11,357 – 11,357 11,357 11,357
Provisions - non-current
Retirement benefits – – – – – – – – – –
List other major provision items
Refuse landfill site rehabilitation – – 35,093 94,669 94,669 94,669 – 94,669 94,669 94,669
Other – – 93,048 34,169 34,169 34,169 – 34,169 34,169 34,169
Total Provisions - non-current – – 128,141 128,838 128,838 128,838 – 128,838 128,838 128,838
CHANGES IN NET ASSETS
Accumulated Surplus/(Deficit)
Accumulated Surplus/(Deficit) - opening balance – – 1,596,588 – – – – – – –
GRAP adjustments
Restated balance – – 1,596,588 – – – – – – –
Surplus/(Deficit) – (14,821) (28,287) 224,301 229,298 290,001 208,134 131,243 120,598 137,966
Appropriations to Reserv es – – – – – – – – – –
Transfers from Reserv es – – – – – – – – – –
Depreciation offsets
Other adjustments
Accumulated Surplus/(Deficit) 1 – (14,821) 1,568,302 224,301 229,298 290,001 208,134 131,243 120,598 137,966
Reserves
Housing Dev elopment Fund – – – – – – – – – –
Capital replacement – – – – – – – – – –
Self-insurance – – – – – – – – – –
Other reserv es – – – – – – – – – –
Rev aluation – 228,842 337,117 1,216,555 1,255,001 1,255,001 – 1,337,805 1,508,698 1,315,434
Total Reserves 2 – 228,842 337,117 1,216,555 1,255,001 1,255,001 – 1,337,805 1,508,698 1,315,434
TOTAL COMMUNITY WEALTH/EQUITY 2 – 214,021 1,905,419 1,440,856 1,484,299 1,545,002 208,134 1,469,048 1,629,295 1,453,400
Description Ref
2019/20 Medium Term Revenue &
Expenditure FrameworkCurrent Year 2018/19

36 | P a g e
Explanatory notes to Table SA3
This table is a supporting table to table A6 and it has detailed information that is summarized
in table A6.
Table SA4 Reconciliation of IDP strategic objectives and Budget
Strategic Objective GoalGoal
Code2015/16 2016/17 2017/18
R thousand
Audited
Outcome
Audited
Outcome
Audited
Outcome
Original
Budget
Adjusted
Budget
Full Year
Forecast
Budget Year
2019/20
Budget Year
+1 2020/21
Budget Year
+2 2021/22
Good Gov ernance and Public
Participation
Clean administration & sound
public participation
– 882,965 945,160 226,684 226,684 226,684 205,608 222,456 241,076
– – – 6,698 6,698 6,698
– – –
Basic Serv ice deliv ery and
Infrastructure
Electricty , Roads , Housing
and accelerate capital
ex penditure
7,550 7,550 7,550
Local Economic Dev elopment Youth empow erment,LED
strategy ,supporting SMMEs
404,757 404,757 404,757
Municipal Financial Viability
and Management
Sound financial management 22,814 22,814 22,814
128,995 128,995 128,995 964,551 1,024,762 1,194,832
Spatial and Env ironment Health hy gienically safe
env ironment
26,493 26,493 26,493
Public Safety 91,617 91,617 91,617
Community Facilities 254,055 186,233 74,953
Allocations to other priorities 2
Total Revenue (excluding capital transfers and contributions) 1 – 882,965 945,160 1,169,664 1,101,842 990,562 1,170,159 1,247,218 1,435,908
Current Year 2018/192019/20 Medium Term Revenue &
Expenditure FrameworkRef

37 | P a g e
Table SA8 performance indicators
KZN216 Ray Nkonyeni - Supporting Table SA8 Performance indicators and benchmarks
2015/16 2016/17 2017/18
Audited
Outcome
Audited
Outcome
Audited
Outcome
Original
Budget
Adjusted
Budget
Full Year
Forecast
Pre-audit
outcome
Budget Year
2019/20
Budget Year
+1 2020/21
Budget Year
+2 2021/22
Borrowing Management
Credit Rating
Capital Charges to Operating Ex penditure Interest & Principal Paid /Operating
Ex penditure
0.0% 1.1% 0.0% 1.1% 0.9% 1.4% 0.0% 0.0% 0.0% 0.0%
Capital Charges to Ow n Rev enue Finance charges & Repay ment of
borrow ing /Ow n Rev enue
0.0% 1.7% 0.0% 1.4% 1.2% 1.4% 0.0% 0.0% 0.0% 0.0%
Borrow ed funding of 'ow n' capital ex penditure Borrow ing/Capital ex penditure ex cl.
transfers and grants and contributions
0.0% 0.0% 11.3% 0.0% 0.0% 0.0% 0.0% 0.0% 0.0% 0.0%
Safety of Capital
Gearing Long Term Borrow ing/ Funds &
Reserv es
0.0% 0.0% 3.3% 0.9% 0.9% 0.9% 0.0% 0.8% 0.8% 0.9%
Liquidity
Current Ratio Current assets/current liabilities – 0.5 1.7 0.9 0.8 0.8 – 0.5 0.9 0.4
Current Ratio adjusted for aged debtors Current assets less debtors > 90
day s/current liabilities
– 0.5 1.7 0.9 0.8 0.8 – 0.5 0.9 0.4
Liquidity Ratio Monetary Assets/Current Liabilities – 0.3 0.3 0.5 0.4 0.4 – 0.4 0.8 0.3
Revenue Management
Annual Debtors Collection Rate (Pay ment
Lev el %)
Last 12 Mths Receipts/Last 12 Mths
Billing
0.0% 69.3% -12.0% 96.7% 81.8% 79.5% 0.0% 103.5% 103.6%
Current Debtors Collection Rate (Cash
receipts % of Ratepay er & Other rev enue)
0.0% 69.3% 66.0% 96.7% 81.8% 79.5% 0.0% 103.5% 103.6% 103.6%
Outstanding Debtors to Rev enue Total Outstanding Debtors to Annual
Rev enue
0.0% 2.1% 31.2% 26.1% 28.4% 28.6% 0.0% 3.1% 3.0% 2.7%
Longstanding Debtors Recov ered Debtors > 12 Mths Recov ered/Total
Debtors > 12 Months Old
Creditors Management
Creditors Sy stem Efficiency % of Creditors Paid Within Terms
(w ithin`MFMA' s 65(e))
Creditors to Cash and Inv estments 0.0% 0.0% -47.9% 299.2% 367.2% 367.2% 0.0% 1.5% 0.8% 0.5%
Other Indicators
Total Volume Losses (kW)
Total Cost of Losses (Rand '000)
% Volume (units purchased and
generated less units sold)/units
purchased and generated
Total Volume Losses (kℓ)
Total Cost of Losses (Rand '000)
% Volume (units purchased and
generated less units sold)/units
purchased and generated
Employ ee costs Employ ee costs/(Total Rev enue - capital
rev enue)
0.0% 41.2% 41.7% 37.0% 42.4% 37.7% 12.0% 38.1% 37.5% 34.6%
Remuneration Total remuneration/(Total Rev enue -
capital rev enue)
0.0% 0.0% 44.8% 40.2% 45.6% 40.6% 40.9% 40.3% 37.2%
Repairs & Maintenance R&M/(Total Rev enue ex cluding capital
rev enue)
0.0% 4.3% 0.0% 0.0% 0.0% 0.0% 0.0% 0.0% 0.0%
Finance charges & Depreciation FC&D/(Total Rev enue - capital rev enue) 0.0% 8.2% 15.7% 6.4% 6.6% 0.2% 0.0% 5.2% 5.1% 4.7%
IDP regulation financial viability indicators
i. Debt cov erage (Total Operating Rev enue - Operating
Grants)/Debt serv ice pay ments due
w ithin financial y ear)
– 36.5 20.2 32.0 32.0 32.0 8.8 36.7 36.7 38.9
ii.O/S Serv ice Debtors to Rev enue Total outstanding serv ice debtors/annual
rev enue receiv ed for serv ices
0.0% 2.0% 47.0% 41.3% 41.3% 40.1% 0.0% 4.1% 4.1% 4.1%
iii. Cost cov erage (Av ailable cash + Inv estments)/monthly
fix ed operational ex penditure
– 1.7 (4.6) 1.1 1.0 1.1 – 2.0 3.6 4.8
References
1. Consumer debtors > 12 months old are excluded from current assets
2. Only include if services provided by the municipality
Calculation data
Debtors > 90 day s
Monthly fix ed operational ex penditure – 56,469 66,315 72,092 66,378 57,136 7,033 73,789 80,298 93,707
Fix ed operational ex penditure % assumption 40.0% 40.0% 40.0% 40.0% 40.0% 40.0% 40.0% 40.0% 40.0% 40.0%
Ow n capex – – 157,593 223,131 227,653 689,921 173,110 130,094 69,593 75,758
Borrow ing – – 17,778 – – – – – – –
Water Distribution Losses (2)
Description of financial indicator
2019/20 Medium Term Revenue &
Expenditure Framework
Basis of calculation
Current Year 2018/19
Electricity Distribution Losses (2)

38 | P a g e
Table SA13b Service Tariffs by Category
KZN216 Ray Nkonyeni - Supporting Table SA13b Service Tariffs by category - explanatory
2019/20 Medium Term Revenue &
Expenditure Framework
Budget Year
2019/20
Budget Year
+1 2020/21
Budget Year
+2 2021/22
Exemptions, reductions and rebates (Rands)
rates 10,652,831 22,525,449 22,449,157 23,661,411 24,962,789 26,460,556
2,645,860 - - - - -
25,845,000 26,098,493 - - - -
7,314,629 38,440,018 40,090,927 42,255,837 44,579,908 47,254,703
Current Year
2018/192017/182016/17Description Ref
Provide description of
tariff structure where
appropriate
2015/16
Table SA14 Households Bills
KZN216 Ray Nkonyeni - Supporting Table SA14 Household bills
2015/16 2016/17 2017/18 2019/20 Medium Term Revenue & Expenditure Framework
Audited
Outcome
Audited
Outcome
Audited
OutcomeOriginal Budget Adjusted Budget
Full Year
ForecastBudget Year 2019/20 Budget Year 2019/20 Budget Year +1 2020/21
Budget Year +2
2021/22
Rand/cent % incr.
Monthly Account for
Household - 'Middle Income
Rates and services charges:
Property rates 21,075,684.07 21,813,333.01 21,813,333.01 21,813,333.01 0.05 2,212,946,800.0% 23,324,459.00 24,607,305.00 26,083,743.30
Electricity : Basic lev y –
Electricity : Consumption 267,640.36 277,007.78 277,007.78 277,007.78 0.07 29,584,431.0% 311,819.90 328,969.99 348,708.19
Water: Basic lev y –
Water: Consumption –
Sanitation –
Refuse remov al 2,651,131.90 2,743,921.51 2,743,921.51 2,743,921.51 0.05 288,660,543.0% 3,042,482.12 3,209,818.64 3,402,407.76
Other
sub-total – 23,994,456.33 24,834,262.30 24,834,262.30 24,834,262.30 0.17 7.4% 26,678,761.02 28,146,093.63 29,834,859.25
VAT on Serv ices
Total large household bill: – 23,994,456.33 24,834,262.30 24,834,262.30 24,834,262.30 0.17 7.4% 26,678,761.02 28,146,093.63 29,834,859.25
% increase/-decrease – 3.5% – – (100.0%) 15,656,549,794.4% 5.5% 6.0%
Description
Current Year 2018/19
Table SA15 Investment particulars
KZN216 Ray Nkonyeni - Supporting Table SA15 Investment particulars by type
2015/16 2016/17 2017/18
Audited
Outcome
Audited
Outcome
Audited
Outcome
Original
Budget
Adjusted
Budget
Full Year
Forecast
Budget Year
2019/20
Budget Year
+1 2020/21
Budget Year
+2 2021/22
R thousand
Parent municipality
Securities - National Gov ernment
Listed Corporate Bonds
Deposits - Bank 66,888 37,144 37,144 37,144 60,317 61,551 64,964
Deposits - Public Inv estment Commissioners
Deposits - Corporation for Public Deposits
Bankers Acceptance Certificates
Negotiable Certificates of Deposit - Banks
Guaranteed Endow ment Policies (sinking)
Repurchase Agreements - Banks
Municipal Bonds
Municipality sub-total 1 – 66,888 37,144 37,144 37,144 60,317 61,551 64,964 –
Current Year 2018/192019/20 Medium Term Revenue &
Expenditure Framework
RefInvestment type
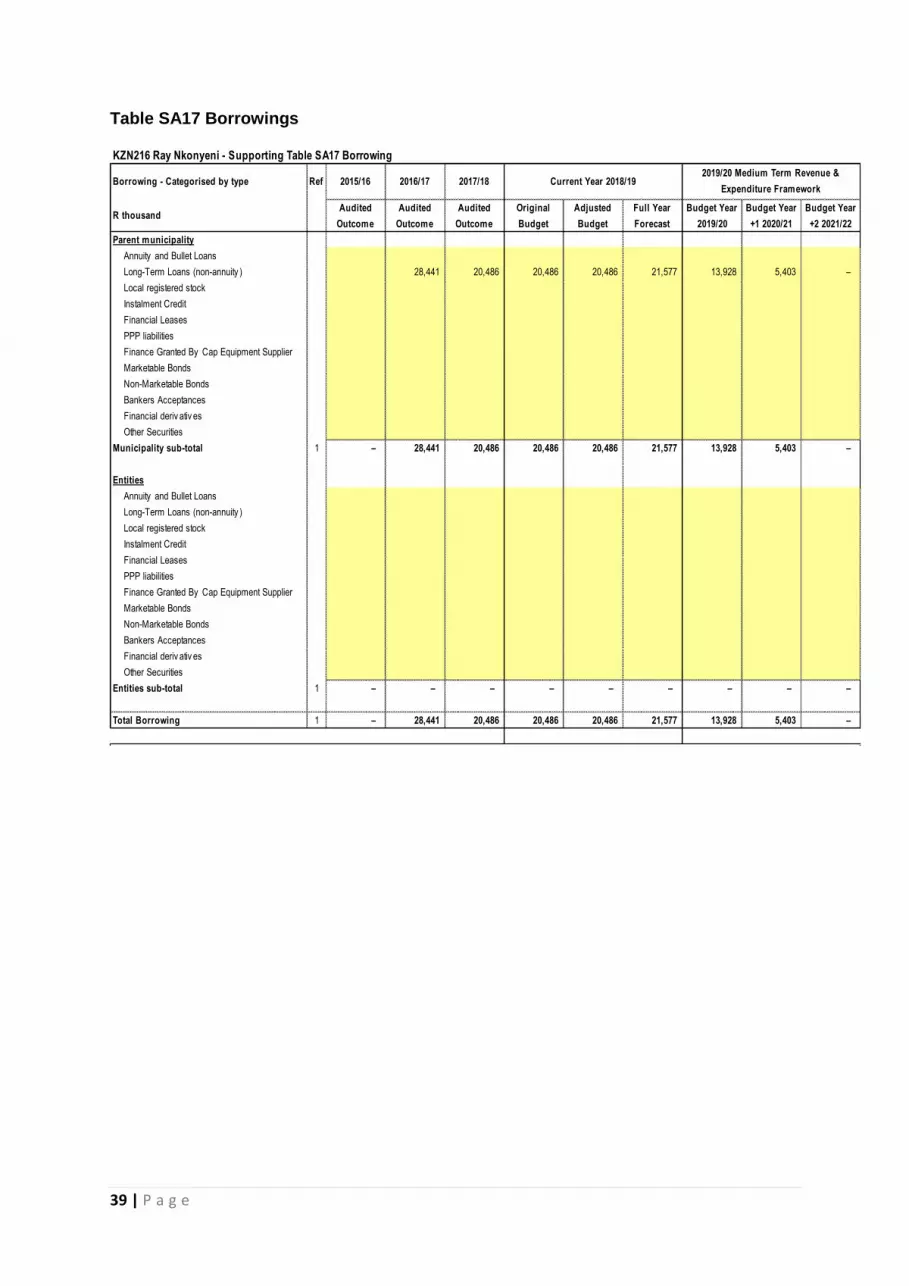
39 | P a g e
Table SA17 Borrowings
KZN216 Ray Nkonyeni - Supporting Table SA17 Borrowing
Borrowing - Categorised by type Ref 2015/16 2016/17 2017/18
R thousandAudited
Outcome
Audited
Outcome
Audited
Outcome
Original
Budget
Adjusted
Budget
Full Year
Forecast
Budget Year
2019/20
Budget Year
+1 2020/21
Budget Year
+2 2021/22
Parent municipality
Annuity and Bullet Loans
Long-Term Loans (non-annuity ) 28,441 20,486 20,486 20,486 21,577 13,928 5,403 –
Local registered stock
Instalment Credit
Financial Leases
PPP liabilities
Finance Granted By Cap Equipment Supplier
Marketable Bonds
Non-Marketable Bonds
Bankers Acceptances
Financial deriv ativ es
Other Securities
Municipality sub-total 1 – 28,441 20,486 20,486 20,486 21,577 13,928 5,403 –
Entities
Annuity and Bullet Loans
Long-Term Loans (non-annuity )
Local registered stock
Instalment Credit
Financial Leases
PPP liabilities
Finance Granted By Cap Equipment Supplier
Marketable Bonds
Non-Marketable Bonds
Bankers Acceptances
Financial deriv ativ es
Other Securities
Entities sub-total 1 – – – – – – – – –
Total Borrowing 1 – 28,441 20,486 20,486 20,486 21,577 13,928 5,403 –
Current Year 2018/192019/20 Medium Term Revenue &
Expenditure Framework

40 | P a g e
Table SA18 Transfers and Grants Receipts
KZN216 Ray Nkonyeni - Supporting Table SA18 Transfers and grant receipts
Description Ref 2015/16 2016/17 2017/18
R thousandAudited
Outcome
Audited
Outcome
Audited
Outcome
Original
Budget
Adjusted
Budget
Full Year
Forecast
Budget Year
2019/20
Budget Year
+1 2020/21
Budget Year
+2 2021/22
RECEIPTS: 1, 2
Operating Transfers and Grants
National Government: – 170,781 204,738 212,985 212,985 212,985 229,513 241,456 267,076
Local Gov ernment Equitable Share – 145,299 175,566 185,324 185,324 185,324 205,608 222,456 241,076
Finance Management – 3,562 3,600 3,600 3,600 3,600 2,500 2,000 2,000
Integrated National Electrification Programme – 10,681 14,000 14,000 14,000 14,000 9,000 9,000 15,000
EPWP Incentiv e – 2,660 3,306 4,061 4,061 4,061 4,405 – –
Municipal Dermacation Transition Grant – 8,579 8,266 – – – – – –
Energy Efficiency and Demand Management – 6,000 6,000 6,000 8,000 8,000 9,000
– –
Provincial Government: – 9,140 16,702 19,953 19,953 19,953 18,374 19,111 19,947
Accreditation Grant – – 5,082 4,337 4,337 4,337 4,520 4,520 4,520
Museum Grant – 334 350 368 368 368 386 407 429
Prov incialisation of Libraries Grant – 7,436 9,670 10,894 10,894 10,894 11,439 12,011 12,672
Community Library Serv ice Grant – 1,045 – 1,338 1,338 1,338 2,029 2,173 2,326
0 – 325 1,600 3,016 3,016 3,016 – – –
District Municipality: – – – 144 144 – – – –
[insert description] – – – – – – – – –
– – – 144 144 – – – –
Other grant providers: – – (150) 1,225 2,725 – 118,740 144,984 262,372
KZN Human Settlement – – – – – – 118,740 144,984 262,372
– – (150) 1,225 2,725 – – – –
Total Operating Transfers and Grants 5 – 179,921 221,290 234,307 235,807 232,938 366,627 405,551 549,395
Capital Transfers and Grants
National Government: – 76,618 62,615 57,301 57,301 57,301 80,795 67,464 73,375
Municipal Infrastructure Grant (MIG) – 76,618 62,615 57,301 57,301 57,301 70,795 64,964 69,875
Neighbourhood Dev elopment Partnership – – – – – – 10,000 2,500 3,500
– – – – – – – – –
– – – – – – – – –
Rural Transport Serv ices and Infrastructure – – – – – – – – –
Tow n Planning Grant – – – – – – – – –
Provincial Government: – – 20,147 126,199 136,286 50,979 3,000 3,000 3,000
Human Settlement – – 20,147 126,199 136,286 50,979 – – –
Margate Airport Grant 3,000 3,000 3,000
District Municipality: – – 66,651 71,301 71,301 50,908 – – –
[insert description] – – – – – – – – –
Disaster Management Grant – – 66,651 71,301 71,301 50,908 – – –
Other grant providers: – – – – – – – – –
– – – – – – – – –
– – – – – – – – –
Total Capital Transfers and Grants 5 – 76,618 149,413 254,801 264,888 159,188 83,795 70,464 76,375
TOTAL RECEIPTS OF TRANSFERS & GRANTS – 256,539 370,703 489,108 500,695 392,126 450,422 476,015 625,770
Current Year 2018/192019/20 Medium Term Revenue &
Expenditure Framework
Explanatory notes to Table SA18 Grants and subsidies Receipts
1. This table reflects all expected grants receipts from national, provincial and other
organization.
2. National treasury and provincial treasury grants are gazette in DORA and provincial
gazette.

41 | P a g e
Table SA 19 Grants and subsidies Expenditure
KZN216 Ray Nkonyeni - Supporting Table SA19 Expenditure on transfers and grant programme
Description Ref 2015/16 2016/17 2017/18
R thousandAudited
Outcome
Audited
Outcome
Audited
Outcome
Original
Budget
Adjusted
Budget
Full Year
Forecast
Budget Year
2019/20
Budget Year
+1 2020/21
Budget Year
+2 2021/22
EXPENDITURE: 1
Operating expenditure of Transfers and Grants
National Government: – 170,781 204,738 212,985 212,985 212,985 229,513 241,456 267,076
Local Gov ernment Equitable Share 145,299 175,566 185,324 185,324 185,324 205,608 222,456 241,076
Finance Management 3,562 3,600 3,600 3,600 3,600 2,500 2,000 2,000
Integrated National Electrification Programme 10,681 14,000 14,000 14,000 14,000 9,000 9,000 15,000
EPWP Incentiv e 2,660 3,306 4,061 4,061 4,061 4,405 – –
Municipal Dermacation Transition Grant 8,579 8,266 – – – – – –
Energy Efficiency and Demand Management 6,000 6,000 6,000 8,000 8,000 9,000
0
Provincial Government: – 9,140 16,702 19,953 19,953 19,953 18,374 19,111 19,947
Accreditation Grant – 5,082 4,337 4,337 4,337 4,520 4,520 4,520
Museum Grant 334 350 368 368 368 386 407 429
Prov incialisation of Libraries Grant 7,436 9,670 10,894 10,894 10,894 11,439 12,011 12,672
Community Library Serv ice Grant 1,045 – 1,338 1,338 1,338 2,029 2,173 2,326
0 325 1,600 3,016 3,016 3,016 – – –
District Municipality: – – – 144 144 – – – –
[insert description] – – – – – – – –
– – 144 144 – – – –
Other grant providers: – – (150) 1,225 2,725 – 118,740 144,984 262,372
KZN Human Settlement – – – – – 118,740 144,984 262,372
– (150) 1,225 2,725 – – – –
Total operating expenditure of Transfers and Grants: – 179,921 221,290 234,307 235,807 232,938 366,627 405,551 549,395
Capital expenditure of Transfers and Grants
National Government: – 76,618 62,615 57,301 57,301 57,301 80,795 67,464 73,375
Municipal Infrastructure Grant (MIG) 76,618 62,615 57,301 57,301 57,301 70,795 64,964 69,875
Neighbourhood Dev elopment Partnership – – – – – 10,000 2,500 3,500
Rural Transport Serv ices and Infrastructure
Tow n Planning Grant
Provincial Government: – – – – – – 3,000 3,000 3,000
Human Settlement
Margate Airport Grant 3,000 3,000 3,000
District Municipality: – – 66,651 71,301 71,301 50,908 – – –
[insert description] – – 66,651 71,301 71,301 50,908 – – –
Other grant providers: – – – – – – – – –
0
Total capital expenditure of Transfers and Grants – 76,618 129,266 128,602 128,602 108,209 83,795 70,464 76,375
TOTAL EXPENDITURE OF TRANSFERS AND GRANTS – 256,539 350,556 362,909 364,409 341,147 450,422 476,015 625,770
Current Year 2018/192019/20 Medium Term Revenue &
Expenditure Framework

42 | P a g e
Table SA20 Reconciliation of transfers, grant receipts and unspent funds
KZN216 Ray Nkonyeni - Supporting Table SA20 Reconciliation of transfers, grant receipts and unspent funds
Description Ref 2015/16 2016/17 2017/18
R thousandAudited
Outcome
Audited
Outcome
Audited
Outcome
Original
Budget
Adjusted
Budget
Full Year
Forecast
Budget Year
2019/20
Budget Year
+1 2020/21
Budget Year
+2 2021/22
Operating transfers and grants: 1,3
National Government:
Balance unspent at beginning of the y ear
Current y ear receipts
Conditions met - transferred to revenue – – – – – – – – –
Conditions still to be met - transferred to liabilities
Provincial Government:
Balance unspent at beginning of the y ear
Current y ear receipts
Conditions met - transferred to revenue – – – – – – – – –
Conditions still to be met - transferred to liabilities
District Municipality:
Balance unspent at beginning of the y ear
Current y ear receipts
Conditions met - transferred to revenue – – – – – – – – –
Conditions still to be met - transferred to liabilities
Other grant providers:
Balance unspent at beginning of the y ear
Current y ear receipts
Conditions met - transferred to revenue – – – – – – – – –
Conditions still to be met - transferred to liabilities
Total operating transfers and grants revenue – – – – – – – – –
Total operating transfers and grants - CTBM 2 – – – – – – – – –
Capital transfers and grants: 1,3
National Government:
Balance unspent at beginning of the y ear
Current y ear receipts
Conditions met - transferred to revenue – – – – – – – – –
Conditions still to be met - transferred to liabilities
Provincial Government:
Balance unspent at beginning of the y ear
Current y ear receipts
Conditions met - transferred to revenue – – – – – – – – –
Conditions still to be met - transferred to liabilities
District Municipality:
Balance unspent at beginning of the y ear
Current y ear receipts
Conditions met - transferred to revenue – – – – – – – – –
Conditions still to be met - transferred to liabilities
Other grant providers:
Balance unspent at beginning of the y ear
Current y ear receipts
Conditions met - transferred to revenue – – – – – – – – –
Conditions still to be met - transferred to liabilities
Total capital transfers and grants revenue – – – – – – – – –
Total capital transfers and grants - CTBM 2 – – – – – – – – –
TOTAL TRANSFERS AND GRANTS REVENUE – – – – – – – – –
TOTAL TRANSFERS AND GRANTS - CTBM – – – – – – – – –
Current Year 2018/192019/20 Medium Term Revenue &
Expenditure Framework

43 | P a g e
Table SA21 Grants and Subsidy made by the Municipality
KZN216 Ray Nkonyeni - Supporting Table SA21 Transfers and grants made by the municipality
Description Ref 2015/16 2016/17 2017/18
R thousandAudited
Outcome
Audited
Outcome
Audited
Outcome
Original
Budget
Adjusted
Budget
Full Year
Forecast
Pre-audit
outcome
Budget Year
2019/20
Budget Year
+1 2020/21
Budget Year
+2 2021/22
Cash Transfers to other municipalities
1 – – – – – – – – – –
– – – – – – – – – –
– – – – – – – – – –
Total Cash Transfers To Municipalities: – – – – – – – – – –
Cash Transfers to Entities/Other External Mechanisms
0 2 – – – – – – – – – –
– – – – – – – – – –
Total Cash Transfers To Entities/Ems' – – – – – – – – – –
Cash Transfers to other Organs of State
0 3 – – – – – – – – – –
– – – – – – – – – –
Total Cash Transfers To Other Organs Of State: – – – – – – – – – –
Cash Transfers to Organisations
ugu south coast tourism, golf tournament etc – – 39,126 4,705 5,570 4,282 973 12,795 13,092 14,232
– – – – – – – – – –
Total Cash Transfers To Organisations – – 39,126 4,705 5,570 4,282 973 12,795 13,092 14,232
Cash Transfers to Groups of Individuals
0 – – – – – – – – – –
– – – – – – – – – –
Total Cash Transfers To Groups Of Individuals: – – – – – – – – – –
TOTAL CASH TRANSFERS AND GRANTS 6 – – – 4,705 5,570 4,282 973 12,795 13,092 14,232
2019/20 Medium Term Revenue &
Expenditure FrameworkCurrent Year 2018/19

44 | P a g e
Table SA22 Councilors and Staff Benefits
KZN216 Ray Nkonyeni - Supporting Table SA22 Summary councillor and staff benefits
Summary of Employee and Councillor
remunerationRef 2015/16 2016/17 2017/18
R thousandAudited
Outcome
Audited
Outcome
Audited
Outcome
Original
Budget
Adjusted
Budget
Full Year
Forecast
Budget Year
2019/20
Budget Year
+1 2020/21
Budget Year
+2 2021/22
A B C D E F G H I
Councillors (Political Office Bearers plus Other) 1
Basic Salaries and Wages – – 21,438 27,872 24,351 21,642 26,055 27,879 29,831
Pension and UIF Contributions – – – – – – – – –
Medical Aid Contributions – – – – – – – – –
Motor Vehicle Allow ance – – 2,600 – – – – – –
Cellphone Allow ance – – 1,916 3,071 4,505 4,006 4,821 5,158 5,519
Housing Allow ances – – – – – – – – –
Other benefits and allow ances – – – – – – – – –
Sub Total - Councillors – – 25,954 30,943 28,856 25,647 30,876 33,037 35,350
% increase 4 – – 19.2% (6.7%) (11.1%) 20.4% 7.0% 7.0%
Senior Managers of the Municipality 2
Basic Salaries and Wages – – – – – – – – –
Pension and UIF Contributions – – – – – – – – –
Medical Aid Contributions – – – – – – – – –
Ov ertime – – – – – – – – –
Performance Bonus – – – – – – – – –
Motor Vehicle Allow ance 3 – – – – – – – – –
Cellphone Allow ance 3 – – – – – – – – –
Housing Allow ances 3 – – – – – – – – –
Other benefits and allow ances 3 – – – – – – – – –
Pay ments in lieu of leav e – – – – – – – – –
Long serv ice aw ards – – – – – – – – –
Post-retirement benefit obligations 6 – – – – – – – – –
Sub Total - Senior Managers of Municipality – – – – – – – – –
% increase 4 – – – – – – – –
Other Municipal Staff
Basic Salaries and Wages – – 285,503 291,065 306,356 271,541 340,310 359,731 384,681
Pension and UIF Contributions – – 1,888 2,087 1,936 1,734 2,072 2,217 2,372
Medical Aid Contributions – – 16,192 19,027 16,858 15,164 18,048 19,310 20,659
Ov ertime – – 18,909 14,030 19,030 17,575 16,211 17,182 18,200
Performance Bonus – – 18,903 18,176 16,707 12,500 17,818 19,065 20,400
Motor Vehicle Allow ance 3 – – 13,537 13,339 14,819 13,400 16,065 17,173 18,426
Cellphone Allow ance 3 – – – – – – – – –
Housing Allow ances 3 – – 3,236 2,095 3,191 2,832 3,437 3,678 3,936
Other benefits and allow ances 3 – – – – – – – – –
Pay ments in lieu of leav e – – – – – – – – –
Long serv ice aw ards – – – – – – – – –
Post-retirement benefit obligations 6 – – – 120 – – – – –
Sub Total - Other Municipal Staff – – 358,167 359,939 378,898 334,747 413,959 438,356 468,674
% increase 4 – – 0.5% 5.3% (11.7%) 23.7% 5.9% 6.9%
Total Parent Municipality – – 384,121 390,882 407,754 360,394 444,835 471,393 504,024
Current Year 2018/192019/20 Medium Term Revenue &
Expenditure Framework
Explanatory notes to Table SA22 Councilors and Staff Benefits
1. The remuneration of councilors and staff are as per the councilor’s upper limit approved
by the MEC and staff as per SALGA respectively.

45 | P a g e
Table SA36 List of Capital Projects
KZN216 Ray Nkonyeni - Supporting Table SA36 Detailed capital budget
R thousand
Function Project Description
Audited
Outcome
2017/18
Current Year
2018/19
Full Year
Forecast
Budget Year
2019/20
Budget Year
+1 2020/21
Budget Year
+2 2021/22
Parent municipality:
List all capital projects grouped by Function
Transport and Roads Shibase Road 1,478
Transport and Roads Kaw useni Pedestrian Bridge (Shibe to Mv olomi School) 834 2,000 750 1,000
Transport and Roads Kaw useni Pedestrian Bridge (Godloza to Mbomv ini School) –
Transport and Roads Kaw useni Vehicular Bridge (Mgudlw a School) 150
Transport and Roads Kaw useni Vehicular Bridge (Bhuka School) 150
Transport and Roads Khandalesizw e to Ntshebeni Pedestrian Bridge 28
Transport and Roads Gadlogadla to Makhany a Road v ehicular Bridge 228
Transport and Roads Qashela to Munga Pedestrian Bridge 228 2,500 1,000 –
Transport and Roads Shibase Pedestrian Bridge (Near Sima's House) 228
Transport and Roads Ntshomela Pedestrian Bridge (Sgodaneni) 228 2,000 700 –
Transport and Roads Esidlidlini Pedestrian Bridge (Dlov ina) 228 1,500 1,000 1,324
Transport and Roads Mjw eni Pedestrain Bridge 228 1,200 500 1,000
Transport and Roads Ny anisw eni & Dumezw eni Pedestrian Bridge 228
Transport and Roads Maqobo Pedestrian Bridge 228 2,000 500 1,000
Transport and Roads Mbhele Vehicular Bridge –
Transport and Roads Nonganjana Pedestrian Bridge –
Transport and Roads Nsebesha Pedestrian Bridge –
Transport and Roads Vulindlela Vehicular Bridge –
Transport and Roads Ngqumbela Road and Causew ay – 300 1,200 250
Transport and Roads Mahlal Vehicular Bridge –
Transport and Roads Mbew u Pedestrian Bridge –
Transport and Roads Manqoba Pedestrian Bridge –
Transport and Roads Sodoma Pedestrian Bridge –
Transport and Roads Marine Driv e/ Knox Gore Traffic Signal 100
Transport and Roads Smith Street Upgrade 323 3,000 1,000 –
Transport and Roads Mkanti Road 1,500 1,500 – –
Transport and Roads Thongazi Pedestrian Bridge 823 900 – –
Transport and Roads William Connor Street Steel Structures –
Transport and Roads Rehabilitation of College Road Southbroom –
Transport and Roads Tarring of Nositha Main Road 4,993 5,000 2,500 2,000
Transport and Roads Mpakeni Road Upgrade & bridge 1,361
Transport and Roads Masele Pedestrain Bridge 27
Transport and Roads Mthin'Ow omile Pedestrian Bridge –
Transport and Roads Danca Pedestrian Bridge –
Transport and Roads Nzama Pedestrian Bridge –
Transport and Roads Ethangeni Pedestrian Bridge –
Transport and Roads Fezile Mkhw anazi Stormw ater – 1,800 – –
Transport and Roads Dressing Pedestrian Bridge 365 300 – –
Transport and Roads Kw asithole Pedestrian / Vehicular Bridge 228 1,500 500 –
Transport and Roads Mazubane Pedestrian Bridge 228 300 500 –
Transport and Roads Bar to Ngw emabala Pedestrian Bridge – 250 1,000 500
Transport and Roads Madala to Mdlungw ana Vehicular Bridge – 1,000 500 –
Transport and Roads Mbili Pedestrian Bridge 285 1,000 500 –
Transport and Roads Tarring of Jesus Road 2,005 3,000 800 –
Transport and Roads Bheki Gatsheni Pedestrian Bridge –
Transport and Roads Mbili Pedestrian Bridge –
Transport and Roads Shozi Pedestrian Bridge –
Transport and Roads Mnganka Vehicular Bridge 56 1,200 500 –
Transport and Roads Nqw ane Pedestrian Bridge 56 300 500 –
Transport and Roads Mazubane/Dikw e Pedestrian Bridge –
Transport and Roads Port Shepstone CBD Pedestrian Crossings 500
Transport and Roads Acacia Road Stormw ater - Seapark 300 2,000 – –
Transport and Roads Tarring of George Mbhele High Road 273 1,800 – –
Transport and Roads Louisiana Housing Storm w ater and ring road 911 2,045 3,000 5,000
2019/20 Medium Term Revenue &
Expenditure Framework

46 | P a g e
Transport and Roads Chibini Pedestrian Bridge –
Transport and Roads Ntshambili Vehicular Bridge –
Transport and Roads Banana Beach Pedestrian Bridge 182 500 1,000 500
Transport and Roads Road Rehabilitation Piet Retief 7,746
Transport and Roads Road Rehabilitation Phase 7 (Tarred) –
Transport and Roads Road Rehabilitation Phase 7 (Grav el) 4,557 7,000 4,000 10,000
Transport and Roads Stormw ater - Urban 400 1,500 1,500 1,500
Transport and Roads Rural Stormw ater 311 1,500 1,500 3,500
Transport and Roads Bhosiki Hall Phase 2 - Parking and Stormw ater 550 1,500 – –
Transport and Roads Bhobhoy i Organic Storage Facility –
Transport and Roads Mv uzane road and Vehiclular Bridge 223 500 2,000 3,000
Community Serv ices Community Hall w ard 30 3,445 2,250 1,000 –
Community Serv ices Community Hall w ard 33 373 2,500 2,500 500
Community Serv ices Nkulu Community Hall Ward 36 228 350 1,500 1,000
Community Serv ices Community Hall Ward 34 911 2,500 2,000 –
Community Serv ices Community Hall Ward 9 3,645 2,500 500 –
Community Serv ices Dumezulu Community Hall Phase 2 200 200 1,500 2,000
Community Serv ices Community Hall Ward 5 734 3,000 500 500
Community Serv ices Community Hall Ward 3 (Masinenge) 228
Community Serv ices Community Hall Ward 20 823 3,000 500 –
Community Serv ices Community Hall Ward 16 –
Community Serv ices Sportsfield Waed 31 17
Community Serv ices Thokothe Sportsfield Concrete Road 2,594
Community Serv ices Upgrade of Mgolomi Sportfield Ward 4 716
Community Serv ices Upgrade of Vusushaba Sportfield Ward 4 500 2,000 500 –
Community Serv ices Upgrade Domba/JB Sportfield Ward 14 6,945 1,000 – –
Community Serv ices Outdoor GYM Facilities (Per Cluster) – 1,000 1,000 2,000
Community Serv ices Staff Depot Ablution Facilities - Phase 3 200 1,000 1,000 500
Community Serv ices Nkonka Sportsfield 30
Community Serv ices WARD 26 NEW COMMUNITY HALL 1,471
Community Serv ices Bhambay i Sportsfield 50
Community Serv ices DTS: Izotsha Memorial Park Crematorium 3,000 7,000 – –
Electricity Electrification Projects 6,000
Electricity Highmasts Installation 1,582 200 – –
Electricity Highmasts –
Electricity Electrification Infills - Various Wards 8,000 9,000 9,000 15,000
Electricity Installation of New Street Lights 1,556 1,000 1,000 2,000
Electricity Mini Sub Housing Cov ers 200 300 300 300
Electricity Electrical Cable replacement (Infrastructure) 500 500 500 500
Electricity Mini Substations Replacement 500 1,000 1,000 1,000
Electricity Inter Sw itches (RMU) Replacement 1,000 1,000 1,000 1,000
Electricity Bulk Electrical Supply to New Dev elopments ( Within Distribution Area) 1,500 1,500 1,500 1,500
Electricity Energy Effiecency DSM 6,000 7,920 7,920 8,910
Public Safety Port Shestone Temporary Tax i Rank 5,383 5,383 – –
Community Serv ices Port Shestone Fishing Pier 200 700 – –
Public Safety Dick King Parking Fencing 500 1,000 – –
Departmental Capital (Computer, furniture & Machinery ) 4,199 4,596 4,872 5,164
Municipal w ade NEIGHBOURHOOD DEVELOPMENT PARTNERSHIP GRANT (WARD 18) – 10,000 2,500 3,500
Municipal w ade RATIONALISATION OF OFFICE SPACE (P/SHEPSTONE & UVONGO) – 3,000 – –
Municipal w ade AIRPORT RUNWAY RENEWAL 9,000 – –
Municipal w ade BLUE FLAG FACILITIES REFUBRISHMENT 800 800 800
Municipal w ade Marburg Motor Mechanic Workshop 1,000 1,000 –
Housing Masinenge 127,136
Parent Capital expenditure – 223,131 130,094 70,842 76,748

47 | P a g e
Legislation compliance status
Compliance with the MFMA implementation requirements have been substantially adhered to through the following activities: In year reporting Reporting to National Treasury in electronic format was fully complied with on a monthly basis. Section 71 reporting to the Executive Mayor (within 10 working days).
Internship programme The Municipality is participating in the Municipal Financial Management Internship programme and has employed five interns undergoing training in various divisions of the Financial Services Department. Of the five interns four have been appointed permanently. The remaining two are still under the training and municipality has an obligation to replace the vacant positions of the three interns. Budget and Treasury Office The Budget and Treasury Office has been established in accordance with the MFMA. Audit Committee An Audit Committee is shared with other municipalities within the district and is fully functional. Service Delivery and Implementation Plan The detail 2019/20 draft SDBIP document will be compiled and will be tabled before council. Annual Report Annual report is compiled in terms of the MFMA and National Treasury requirements.
The other tables in the budget are for property rates and this information may not be
consolidated since we will be using our individual valuation roll and tariffs.


