Embed Size (px)
Citation preview
GALVESTONT O U R I S T M O B I L I T Y S T R A T E G Y
JUNE 2018
DRAFT
1-1 Introduction
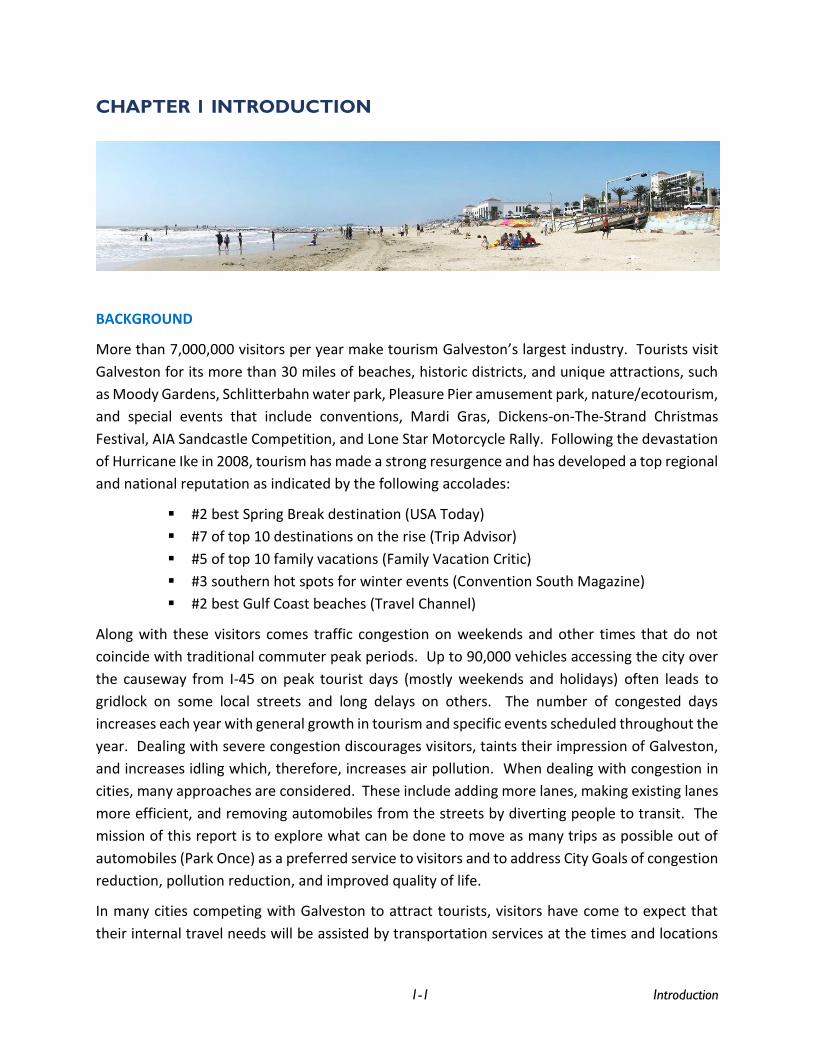
CHAPTER 1 INTRODUCTION
BACKGROUND
More than 7,000,000 visitors per year make tourism Galveston’s largest industry. Tourists visit
Galveston for its more than 30 miles of beaches, historic districts, and unique attractions, such
as Moody Gardens, Schlitterbahn water park, Pleasure Pier amusement park, nature/ecotourism,
and special events that include conventions, Mardi Gras, Dickens-on-The-Strand Christmas
Festival, AIA Sandcastle Competition, and Lone Star Motorcycle Rally. Following the devastation
of Hurricane Ike in 2008, tourism has made a strong resurgence and has developed a top regional
and national reputation as indicated by the following accolades:
▪ #2 best Spring Break destination (USA Today)
▪ #7 of top 10 destinations on the rise (Trip Advisor)
▪ #5 of top 10 family vacations (Family Vacation Critic)
▪ #3 southern hot spots for winter events (Convention South Magazine)
▪ #2 best Gulf Coast beaches (Travel Channel)
Along with these visitors comes traffic congestion on weekends and other times that do not
coincide with traditional commuter peak periods. Up to 90,000 vehicles accessing the city over
the causeway from I-45 on peak tourist days (mostly weekends and holidays) often leads to
gridlock on some local streets and long delays on others. The number of congested days
increases each year with general growth in tourism and specific events scheduled throughout the
year. Dealing with severe congestion discourages visitors, taints their impression of Galveston,
and increases idling which, therefore, increases air pollution. When dealing with congestion in
cities, many approaches are considered. These include adding more lanes, making existing lanes
more efficient, and removing automobiles from the streets by diverting people to transit. The
mission of this report is to explore what can be done to move as many trips as possible out of
automobiles (Park Once) as a preferred service to visitors and to address City Goals of congestion
reduction, pollution reduction, and improved quality of life.
In many cities competing with Galveston to attract tourists, visitors have come to expect that
their internal travel needs will be assisted by transportation services at the times and locations
THE GOODMAN CORPORATION
1-2 Introduction
DRAFT
of most interest to them. In some situations, the ride is part of the tourist experience, in others
the appeal is, “relax while on vacation and leave the driving to us.” Tourist-oriented
transportation has the potential to enhance the visitor experience through reduced traffic
congestion and a more pedestrian-oriented ambiance. Some tourist communities have created
attractive areas by implementing auto-free zones.
Galveston is at a decision point as to the extent to which the community and the tourist industry
should offer these types of services, how they interact with other city goals, and ways to optimize
that service. Most involved in tourism feel it is a necessity, citing most of the same reasons stated
above related to competitive service and experiences along with combatting traffic congestion
associated with increasing numbers of visitors.
Despite the importance and prevalence of the tourism industry in Galveston, until recently Island
Transit has been a service with ridership primarily serving island residents and workers. Prior to
Hurricane Ike, a significant number of tourists were transported on a regular basis when the rail
trolley and so-called E-bus services were in operation. Over time both systems deteriorated and
were finally devastated by Hurricane Ike in 2008. Since that time, tourists have used Island
Transit only in the rare instance of inadvertently discovering that one of the fixed routes actually
served their trip need. Very little had been done to increase the use of Island Transit as a whole
by visitors or to make the system more appealing, available, and understandable to those who
do not live in Galveston.
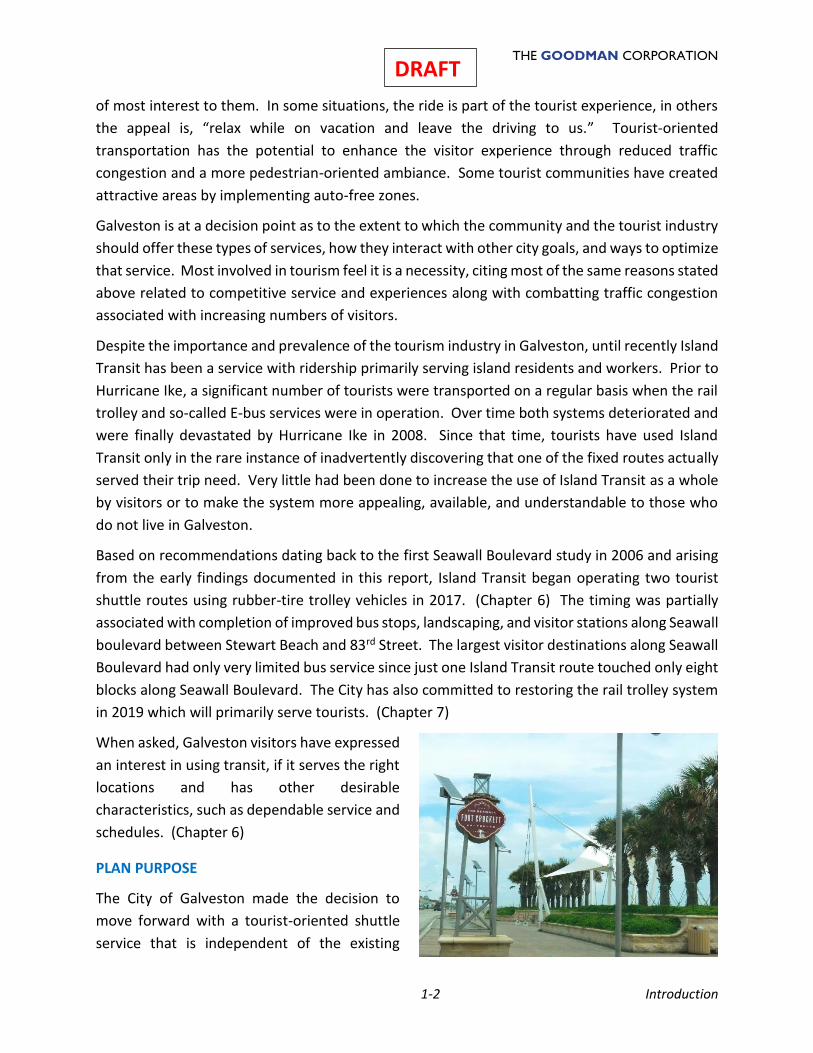
Based on recommendations dating back to the first Seawall Boulevard study in 2006 and arising
from the early findings documented in this report, Island Transit began operating two tourist
shuttle routes using rubber-tire trolley vehicles in 2017. (Chapter 6) The timing was partially
associated with completion of improved bus stops, landscaping, and visitor stations along Seawall
boulevard between Stewart Beach and 83rd Street. The largest visitor destinations along Seawall
Boulevard had only very limited bus service since just one Island Transit route touched only eight
blocks along Seawall Boulevard. The City has also committed to restoring the rail trolley system
in 2019 which will primarily serve tourists. (Chapter 7)
When asked, Galveston visitors have expressed
an interest in using transit, if it serves the right
locations and has other desirable
characteristics, such as dependable service and
schedules. (Chapter 6)
PLAN PURPOSE
The City of Galveston made the decision to
move forward with a tourist-oriented shuttle
service that is independent of the existing
THE GOODMAN CORPORATION
1-3 Introduction
DRAFT
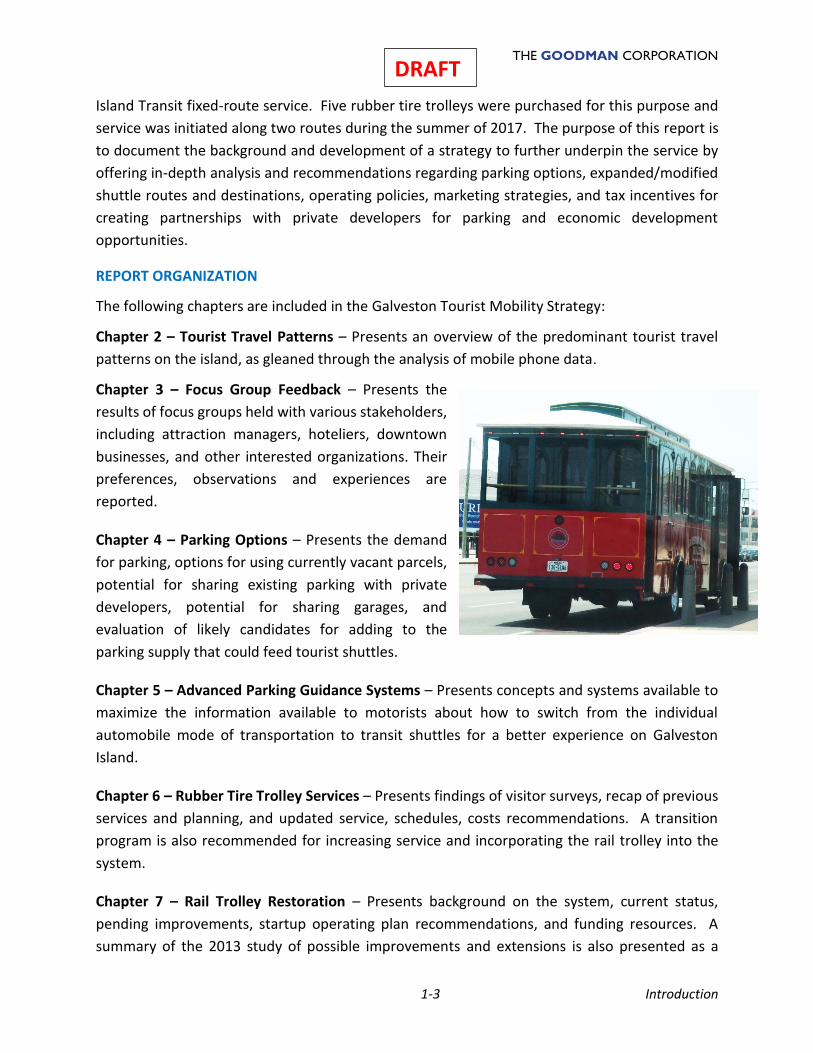
Island Transit fixed-route service. Five rubber tire trolleys were purchased for this purpose and
service was initiated along two routes during the summer of 2017. The purpose of this report is
to document the background and development of a strategy to further underpin the service by
offering in-depth analysis and recommendations regarding parking options, expanded/modified
shuttle routes and destinations, operating policies, marketing strategies, and tax incentives for
creating partnerships with private developers for parking and economic development
opportunities.
REPORT ORGANIZATION
The following chapters are included in the Galveston Tourist Mobility Strategy:
Chapter 2 – Tourist Travel Patterns – Presents an overview of the predominant tourist travel
patterns on the island, as gleaned through the analysis of mobile phone data.
Chapter 3 – Focus Group Feedback – Presents the
results of focus groups held with various stakeholders,
including attraction managers, hoteliers, downtown
businesses, and other interested organizations. Their
preferences, observations and experiences are
reported.
Chapter 4 – Parking Options – Presents the demand
for parking, options for using currently vacant parcels,
potential for sharing existing parking with private
developers, potential for sharing garages, and
evaluation of likely candidates for adding to the
parking supply that could feed tourist shuttles.
Chapter 5 – Advanced Parking Guidance Systems – Presents concepts and systems available to
maximize the information available to motorists about how to switch from the individual
automobile mode of transportation to transit shuttles for a better experience on Galveston
Island.
Chapter 6 – Rubber Tire Trolley Services – Presents findings of visitor surveys, recap of previous
services and planning, and updated service, schedules, costs recommendations. A transition
program is also recommended for increasing service and incorporating the rail trolley into the
system.
Chapter 7 – Rail Trolley Restoration – Presents background on the system, current status,
pending improvements, startup operating plan recommendations, and funding resources. A
summary of the 2013 study of possible improvements and extensions is also presented as a
THE GOODMAN CORPORATION
1-4 Introduction
DRAFT
reference point as questions about changes
come up over the next few years.
Chapter 8 – Marketing and Customer Interface
– Presents an overview of actions that are
extremely important to the success of tourist
transit services. The learning curve about the
services provided is restarted every week with a
new batch of visitors. Topics covered include
customer interface technologies, printed
materials, geographic coverage targets, support
components, press releases, other tactics and
incentives.
Chapter 9 – Economic Development Tools for Tourism Mobility Objectives – This chapter
examines ways to provide incentives for shared parking and public/private partnerships
introduced in Chapter 4. Tax abatement agreements, tax increment reinvestment zones, Chapter
380 agreements, and other innovative approaches are presented along with recommendations
for a comprehensive city program.
Chapter 10 – Parking and Mobility Strategy – Summarizes the recommendations in this report
for an overall strategy that can be implemented as city policy with regard to tourist
transportation. It can be reviewed as a free-standing summary.
2-1 Tourist Travel Patterns
CHAPTER 2 TOURIST TRAVEL PATTERNS
The attractions to be connected via a tourist transportation system are mostly already known.
The specifics and intensity of the operating concept and interaction with parking are the subject
of this strategy report. Feedback provided by the focus group stakeholders as presented in
Chapter 3 is one piece of the puzzle toward that end. In this chapter a creative data resource is
used to supplement travel patterns by tourists while they are in Galveston. Cell phone
movements can now be tapped to provide a picture of tourist behavior during various time
periods.
DATA SOURCE
To gain an understanding of the predominant tourist travel patterns on the island, mobile phone
data was purchased and analyzed. The provider is a company specializing in the collection and
aggregation of data under license with the major phone carriers. It is based on the anonymized
tracking of mobile phone movements through proprietary algorithms. Data can be differentiated
into resident and visitor trips based on the known “home” location of the phone (i.e. where the
phone spends the majority of nighttime hours). Although not perfect and with limits as to
geographic fine tuning, it is possible to use the data to gain insight into how visitors are moving
throughout the island, independent of the travel patterns of those who live in Galveston.
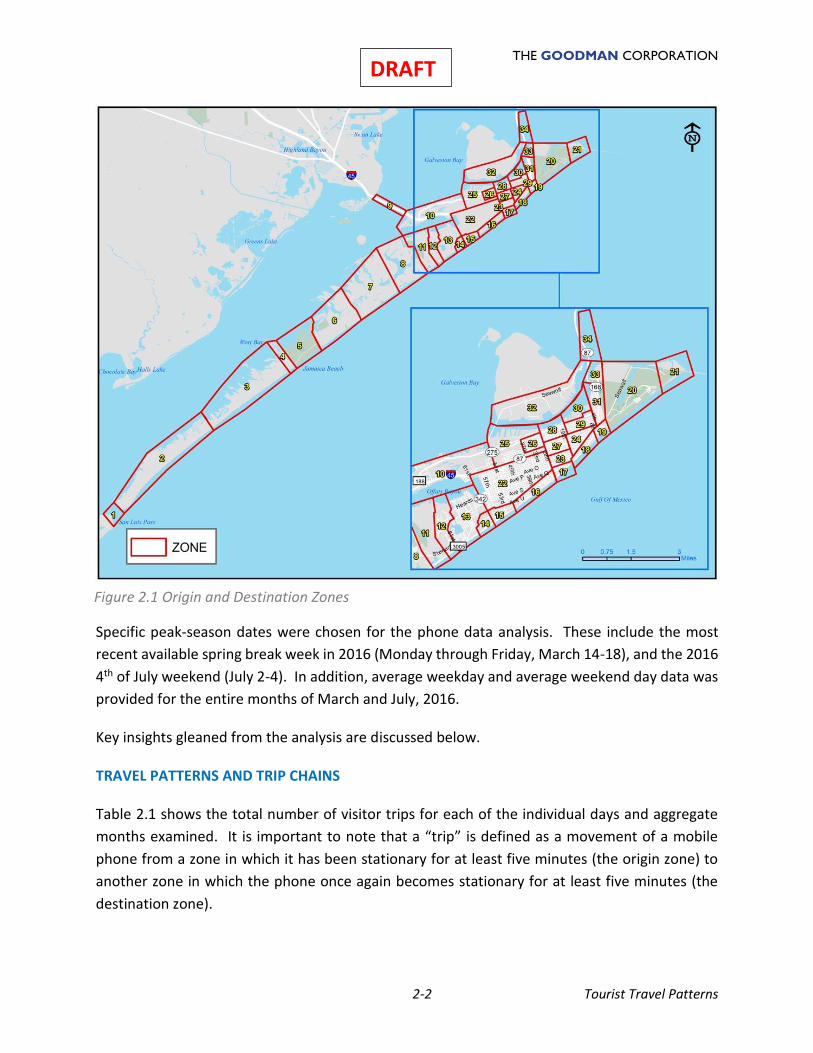
To perform the analysis, the island was divided into 34 zones (Figure 2. 1) which define the origin
and destination locations of trip movements. The zones were developed to specifically address
the needs of this study. Each major tourist attraction (e.g. Pleasure Pier, Downtown, Moody
Gardens/Schlitterbahn, etc.) has its own zone. Size and shape of zones also reflect the
peculiarities of the source data.
THE GOODMAN CORPORATION
2-2 Tourist Travel Patterns
DRAFT
Specific peak-season dates were chosen for the phone data analysis. These include the most
recent available spring break week in 2016 (Monday through Friday, March 14-18), and the 2016
4th of July weekend (July 2-4). In addition, average weekday and average weekend day data was
provided for the entire months of March and July, 2016.
Key insights gleaned from the analysis are discussed below.
TRAVEL PATTERNS AND TRIP CHAINS
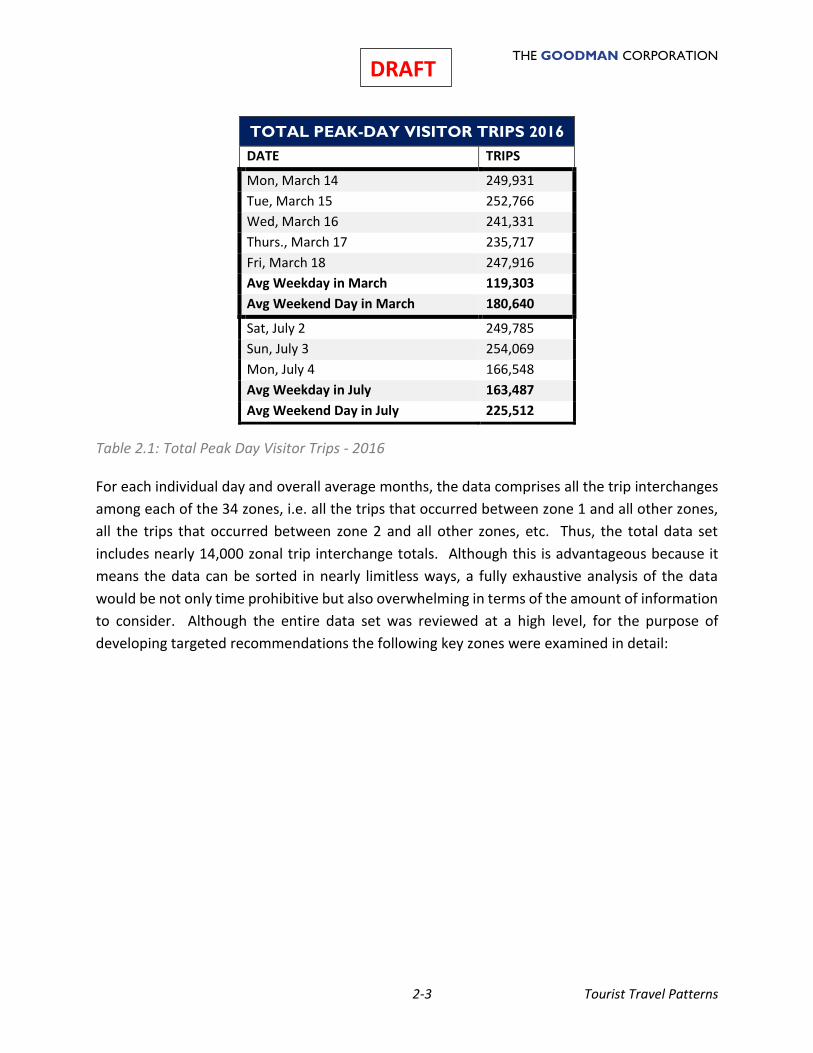
Table 2.1 shows the total number of visitor trips for each of the individual days and aggregate
months examined. It is important to note that a “trip” is defined as a movement of a mobile
phone from a zone in which it has been stationary for at least five minutes (the origin zone) to
another zone in which the phone once again becomes stationary for at least five minutes (the
destination zone).
Figure 2.1 Origin and Destination Zones
THE GOODMAN CORPORATION
2-3 Tourist Travel Patterns
DRAFT
TOTAL PEAK-DAY VISITOR TRIPS 2016
DATE TRIPS
Mon, March 14 249,931
Tue, March 15 252,766
Wed, March 16 241,331
Thurs., March 17 235,717
Fri, March 18 247,916
Avg Weekday in March 119,303
Avg Weekend Day in March 180,640
Sat, July 2 249,785
Sun, July 3 254,069
Mon, July 4 166,548
Avg Weekday in July 163,487
Avg Weekend Day in July 225,512
Table 2.1: Total Peak Day Visitor Trips - 2016
For each individual day and overall average months, the data comprises all the trip interchanges
among each of the 34 zones, i.e. all the trips that occurred between zone 1 and all other zones,
all the trips that occurred between zone 2 and all other zones, etc. Thus, the total data set
includes nearly 14,000 zonal trip interchange totals. Although this is advantageous because it
means the data can be sorted in nearly limitless ways, a fully exhaustive analysis of the data
would be not only time prohibitive but also overwhelming in terms of the amount of information
to consider. Although the entire data set was reviewed at a high level, for the purpose of
developing targeted recommendations the following key zones were examined in detail:
THE GOODMAN CORPORATION
2-4 Tourist Travel Patterns
DRAFT
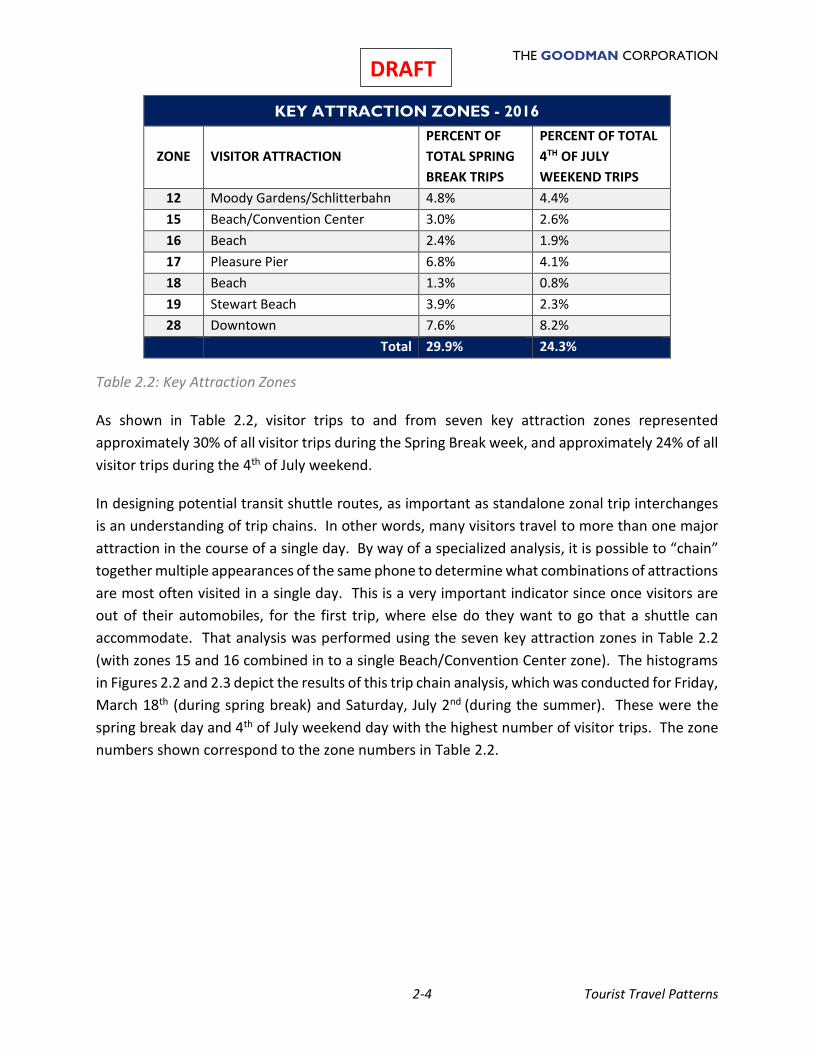
KEY ATTRACTION ZONES - 2016
ZONE VISITOR ATTRACTION
PERCENT OF
TOTAL SPRING
BREAK TRIPS
PERCENT OF TOTAL
4TH OF JULY
WEEKEND TRIPS
12 Moody Gardens/Schlitterbahn 4.8% 4.4%
15 Beach/Convention Center 3.0% 2.6%
16 Beach 2.4% 1.9%
17 Pleasure Pier 6.8% 4.1%
18 Beach 1.3% 0.8%
19 Stewart Beach 3.9% 2.3%
28 Downtown 7.6% 8.2%
Total 29.9% 24.3%
Table 2.2: Key Attraction Zones
As shown in Table 2.2, visitor trips to and from seven key attraction zones represented
approximately 30% of all visitor trips during the Spring Break week, and approximately 24% of all
visitor trips during the 4th of July weekend.
In designing potential transit shuttle routes, as important as standalone zonal trip interchanges
is an understanding of trip chains. In other words, many visitors travel to more than one major
attraction in the course of a single day. By way of a specialized analysis, it is possible to “chain”
together multiple appearances of the same phone to determine what combinations of attractions
are most often visited in a single day. This is a very important indicator since once visitors are
out of their automobiles, for the first trip, where else do they want to go that a shuttle can
accommodate. That analysis was performed using the seven key attraction zones in Table 2.2
(with zones 15 and 16 combined in to a single Beach/Convention Center zone). The histograms
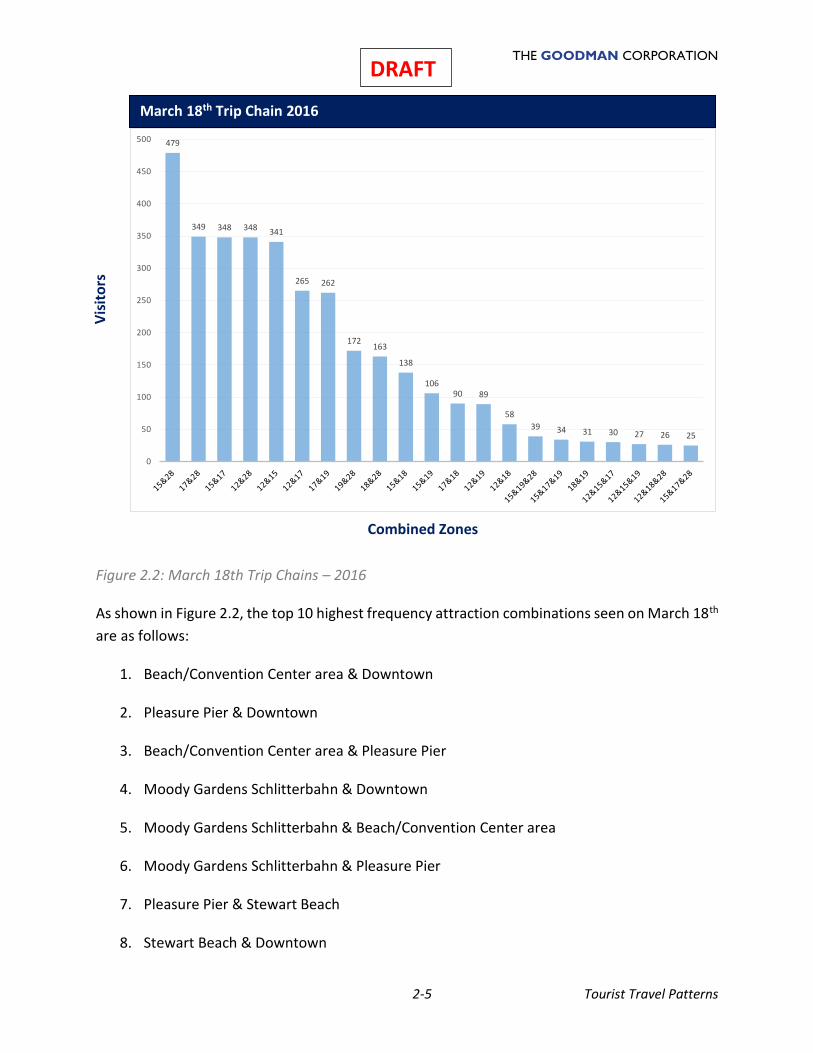
in Figures 2.2 and 2.3 depict the results of this trip chain analysis, which was conducted for Friday,
March 18th (during spring break) and Saturday, July 2nd (during the summer). These were the
spring break day and 4th of July weekend day with the highest number of visitor trips. The zone
numbers shown correspond to the zone numbers in Table 2.2.
THE GOODMAN CORPORATION
2-5 Tourist Travel Patterns
DRAFT
Figure 2.2: March 18th Trip Chains – 2016
As shown in Figure 2.2, the top 10 highest frequency attraction combinations seen on March 18th
are as follows:
1. Beach/Convention Center area & Downtown
2. Pleasure Pier & Downtown
3. Beach/Convention Center area & Pleasure Pier
4. Moody Gardens Schlitterbahn & Downtown
5. Moody Gardens Schlitterbahn & Beach/Convention Center area
6. Moody Gardens Schlitterbahn & Pleasure Pier
7. Pleasure Pier & Stewart Beach
8. Stewart Beach & Downtown
March 18th Trip Chain 2016
479
349 348 348 341
265 262
172163
138
10690 89
58
39 34 31 30 27 26 25
0
50
100
150
200
250
300
350
400
450
500
Vis
ito
rs
Combined Zones
THE GOODMAN CORPORATION
2-6 Tourist Travel Patterns
DRAFT
9. Beach (east of Pleasure Pier) & Downtown
10. Beach/Convention Center area & Beach (east of Pleasure Pier)
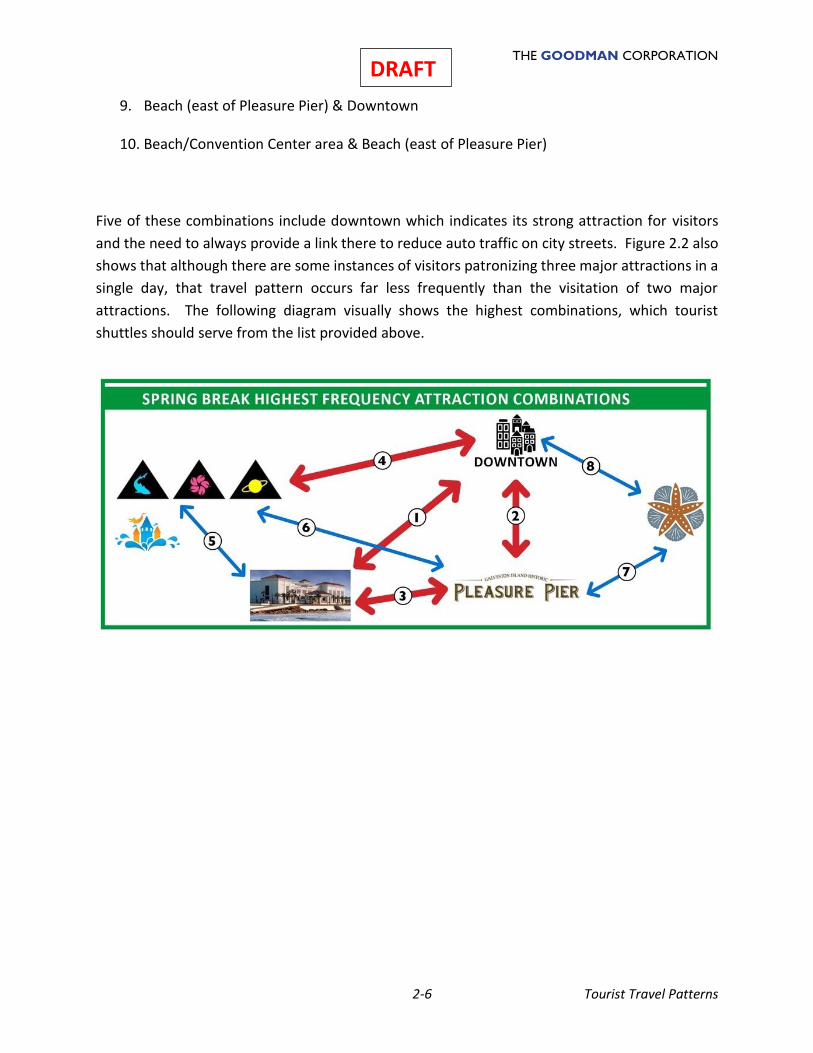
Five of these combinations include downtown which indicates its strong attraction for visitors
and the need to always provide a link there to reduce auto traffic on city streets. Figure 2.2 also
shows that although there are some instances of visitors patronizing three major attractions in a
single day, that travel pattern occurs far less frequently than the visitation of two major
attractions. The following diagram visually shows the highest combinations, which tourist
shuttles should serve from the list provided above.
THE GOODMAN CORPORATION
2-7 Tourist Travel Patterns
DRAFT
Figure 2.3: July 2nd Trip Chains - 2016
Figure 2.3 shows that the top 10 highest frequency attraction combinations seen on July 2nd are
as follows:
1. Moody Gardens/Schlitterbahn & Beach/Convention Center area
2. Moody Gardens/Schlitterbahn & Downtown
3. Beach/Convention Center area & Downtown
4. Beach/Convention Center area & Pleasure Pier
5. Pleasure Pier & Downtown
6. Moody Gardens/Schlitterbahn & Pleasure Pier
7. Pleasure Pier & Stewart Beach
8. Stewart Beach & Downtown
9. Beach/Convention Center area & Stewart Beach
10. Pleasure Pier & Beach (east of Pleasure Pier)
Need to add x-axis label “Combined
Zones” and y-axis label “Visitors)
July 2nd Trip Chains - 2016
Combined Zones
Vis
ito
rs
440
361347
330
294 293
165156
128116
102 99 94 87
41 37 35 35 34 31 30 26 25
0
50
100
150
200
250
300
350
400
450
500
THE GOODMAN CORPORATION
2-8 Tourist Travel Patterns
DRAFT
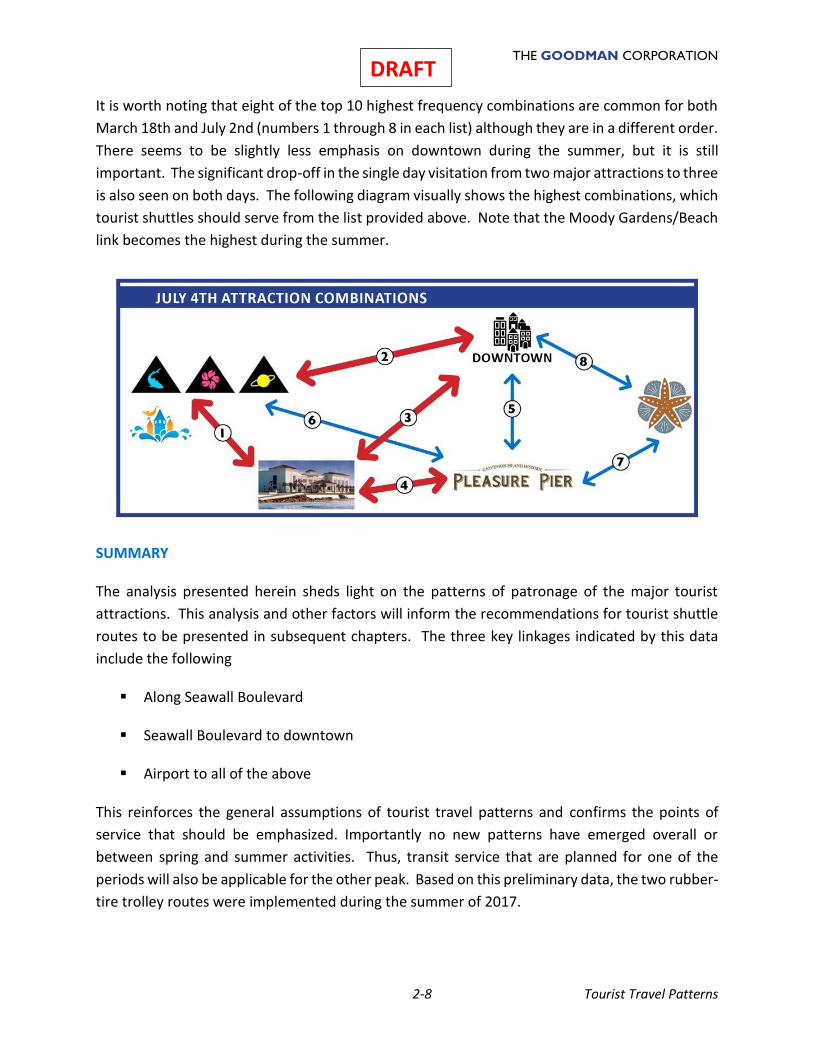
It is worth noting that eight of the top 10 highest frequency combinations are common for both
March 18th and July 2nd (numbers 1 through 8 in each list) although they are in a different order.
There seems to be slightly less emphasis on downtown during the summer, but it is still
important. The significant drop-off in the single day visitation from two major attractions to three
is also seen on both days. The following diagram visually shows the highest combinations, which
tourist shuttles should serve from the list provided above. Note that the Moody Gardens/Beach
link becomes the highest during the summer.
SUMMARY
The analysis presented herein sheds light on the patterns of patronage of the major tourist
attractions. This analysis and other factors will inform the recommendations for tourist shuttle
routes to be presented in subsequent chapters. The three key linkages indicated by this data
include the following
▪ Along Seawall Boulevard
▪ Seawall Boulevard to downtown
▪ Airport to all of the above
This reinforces the general assumptions of tourist travel patterns and confirms the points of
service that should be emphasized. Importantly no new patterns have emerged overall or
between spring and summer activities. Thus, transit service that are planned for one of the
periods will also be applicable for the other peak. Based on this preliminary data, the two rubber-
tire trolley routes were implemented during the summer of 2017.
3-1 Focus Group Feedback
CHAPTER 3 FOCUS GROUP FEEDBACK
In addition to the mobile phone data discussed in Chapter 2, an invaluable source of information
about tourist travel patterns and transportation needs are the managers of major attractions,
hoteliers, and downtown business owners. To gather this feedback, three informal focus group
discussions were held. The attractions, hotel/lodging establishments, and other organizations
represented at the focus groups include:
▪ Galveston Park Board
▪ Moody Gardens
▪ Stewart Beach
▪ Pleasure Pier
▪ Galveston Island Beach Patrol
▪ Downtown Partnership
▪ Wyndham Hotels (representing Hotel Galvez and Tremont House)
▪ Hilton Galveston
▪ Holiday Inn (representing several limited service hotels)
▪ Best Western Plus Galveston Suites
▪ Maceo Spice & Import
▪ Beach Patrol
The major themes discussed are summarized below.
PEAK TIMES
From their hands-on knowledge of the tourist industry and visitor behavior, these individuals are
able to provide the best input on the times when tourist transportation is most needed.
Summer: Even though Memorial Day weekend is traditionally considered the start of summer
(and it is a busy weekend for the Island), according to focus group participants the true summer
season actually intensifies the second week of June, with the end of the season coming in the
third week of August.
THE GOODMAN CORPORATION
3-2 Focus Group Feedback
DRAFT Spring Break: Spring Break can be two weeks, depending on whether the schedules of the
various regional school districts line up or not. Regardless of the total length, there is a steep
drop-off in visitors once all schools are back in session.
Mardi Gras: Even though Mardi Gras is considered good for the
island overall, individual attraction managers feel that it is not
necessarily a good thing for them. This is primarily due to mobility
difficulties inherently associated with the event. One manager
noted that visitors “can’t get to me” during Mardi Gras. Safely
transporting inebriated visitors among limited locations is an
acknowledged need during Mardi Gras (a service the Park Board has
provided for several years) but focus group participants questioned
the feasibility of a broader tourist transportation concept during
Mardi Gras.
Peak Days: As expected, Thursday through Sunday tend to be the peak days in the summer, with
Monday through Wednesday generally lighter (especially Tuesday and Wednesday).
TOURIST TRAVEL PATTERNS
Attraction managers, in fielding questions from
tourists, have a sense of the locations visitors
desire visit on the island. For instance, the
Pleasure Pier manager noted that many visitors
walk to the Pier from their hotels and then ask
where else they can walk to. He also noted
numerous inquiries from tourists wanting to
know how to get to The Strand from the
Pleasure Pier. A Stewart Beach manager noted
regularly receiving questions about how long the
walk is between Stewart Beach and the Pleasure Pier. A Beach Patrol staff member noted that
beachgoers often have questions about the location of eating establishments. Likewise,
Downtown stakeholders classified questions about where to eat as the most often fielded
questions, followed by questions about what to do at night. These responses indicate clear
indications of tourist travel patterns that can be supported by shuttles.
The Pleasure Pier manager also noted that Schlitterbahn and the Pleasure Pier have a cross-
promotion arrangement, capitalizing on the fact that many visitors patronize Schlitterbahn
during the day and then the Pleasure Pier at night (approximately 3 hours each). By contrast, the
Moody Gardens manager stated that his sense is that most of their visitors spend the entire day
(5 hours) at Moody Gardens. Thus, trips to and from hotels would be most desirable.
THE GOODMAN CORPORATION
3-3 Focus Group Feedback
DRAFT These patterns are indicative of tourist transit routes that can be the most effective and closely
meet the needs of visitors. They also indicate a direction for promotions between venues and
transportation providers, such as all the restaurants along the rail trolley route.
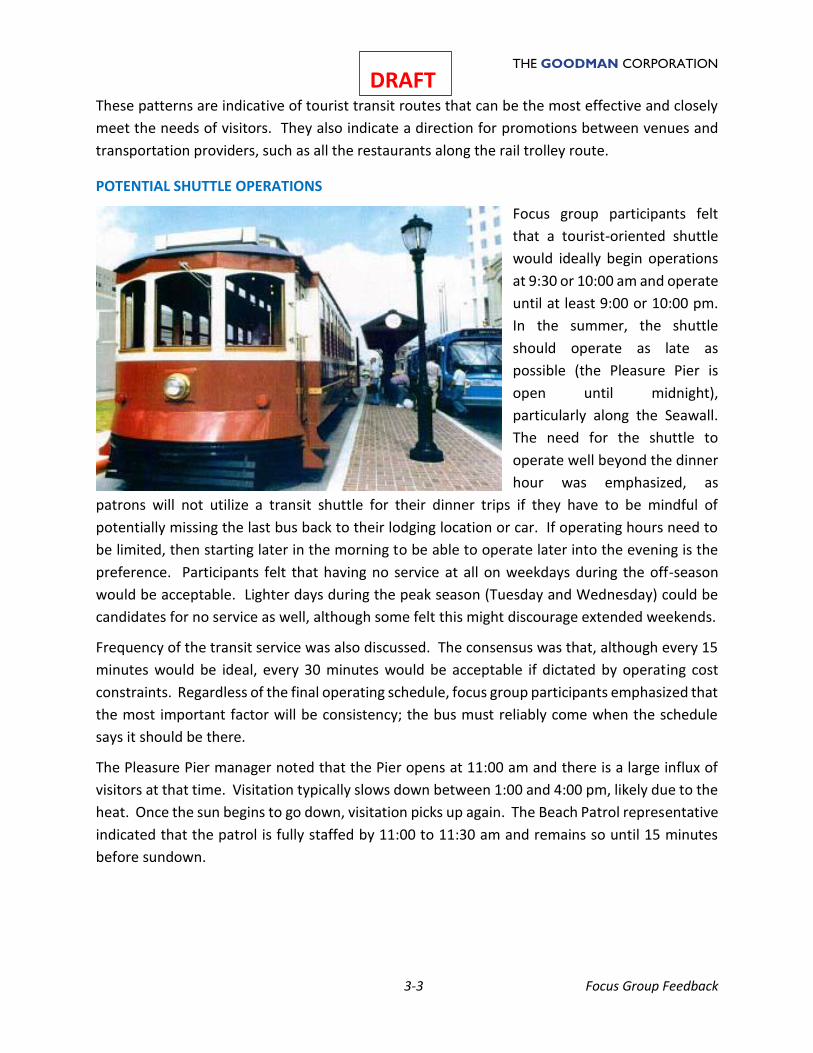
POTENTIAL SHUTTLE OPERATIONS
Focus group participants felt
that a tourist-oriented shuttle
would ideally begin operations
at 9:30 or 10:00 am and operate
until at least 9:00 or 10:00 pm.
In the summer, the shuttle
should operate as late as
possible (the Pleasure Pier is
open until midnight),
particularly along the Seawall.
The need for the shuttle to
operate well beyond the dinner
hour was emphasized, as
patrons will not utilize a transit shuttle for their dinner trips if they have to be mindful of
potentially missing the last bus back to their lodging location or car. If operating hours need to
be limited, then starting later in the morning to be able to operate later into the evening is the
preference. Participants felt that having no service at all on weekdays during the off-season
would be acceptable. Lighter days during the peak season (Tuesday and Wednesday) could be
candidates for no service as well, although some felt this might discourage extended weekends.
Frequency of the transit service was also discussed. The consensus was that, although every 15
minutes would be ideal, every 30 minutes would be acceptable if dictated by operating cost
constraints. Regardless of the final operating schedule, focus group participants emphasized that
the most important factor will be consistency; the bus must reliably come when the schedule
says it should be there.
The Pleasure Pier manager noted that the Pier opens at 11:00 am and there is a large influx of
visitors at that time. Visitation typically slows down between 1:00 and 4:00 pm, likely due to the
heat. Once the sun begins to go down, visitation picks up again. The Beach Patrol representative
indicated that the patrol is fully staffed by 11:00 to 11:30 am and remains so until 15 minutes
before sundown.
THE GOODMAN CORPORATION
3-4 Focus Group Feedback
DRAFT
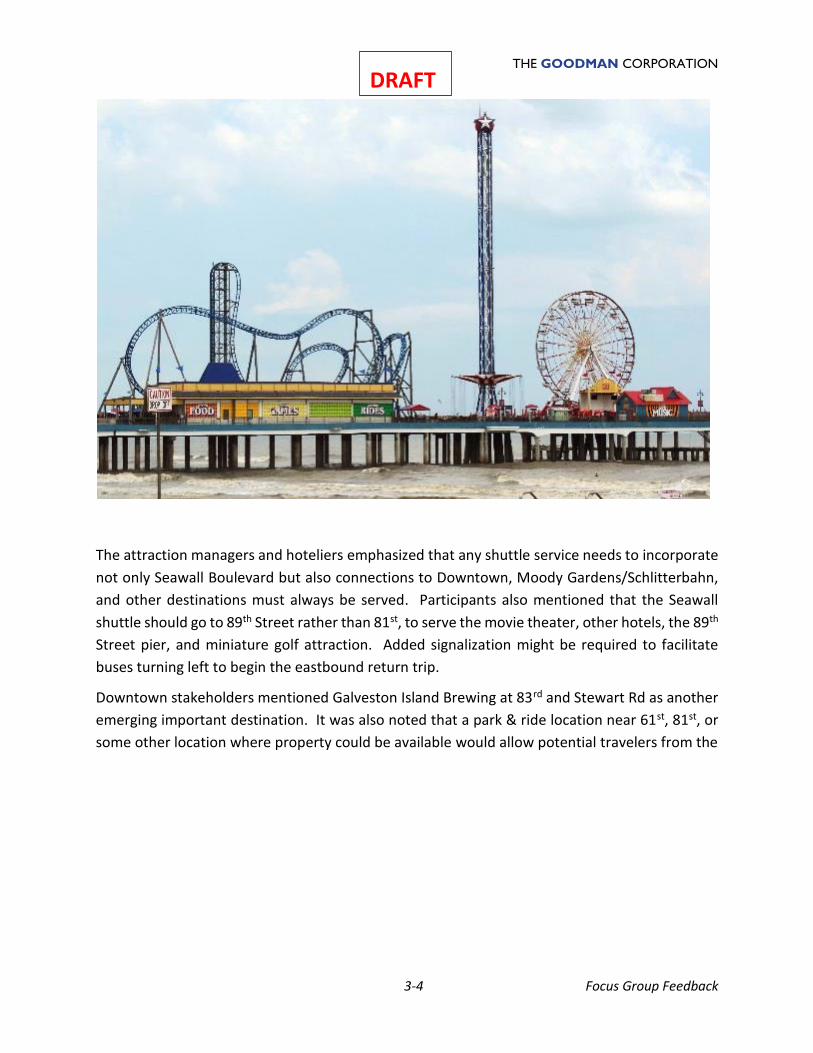
The attraction managers and hoteliers emphasized that any shuttle service needs to incorporate
not only Seawall Boulevard but also connections to Downtown, Moody Gardens/Schlitterbahn,
and other destinations must always be served. Participants also mentioned that the Seawall
shuttle should go to 89th Street rather than 81st, to serve the movie theater, other hotels, the 89th
Street pier, and miniature golf attraction. Added signalization might be required to facilitate
buses turning left to begin the eastbound return trip.
Downtown stakeholders mentioned Galveston Island Brewing at 83rd and Stewart Rd as another
emerging important destination. It was also noted that a park & ride location near 61st, 81st, or
some other location where property could be available would allow potential travelers from the
THE GOODMAN CORPORATION
3-5 Focus Group Feedback
DRAFT
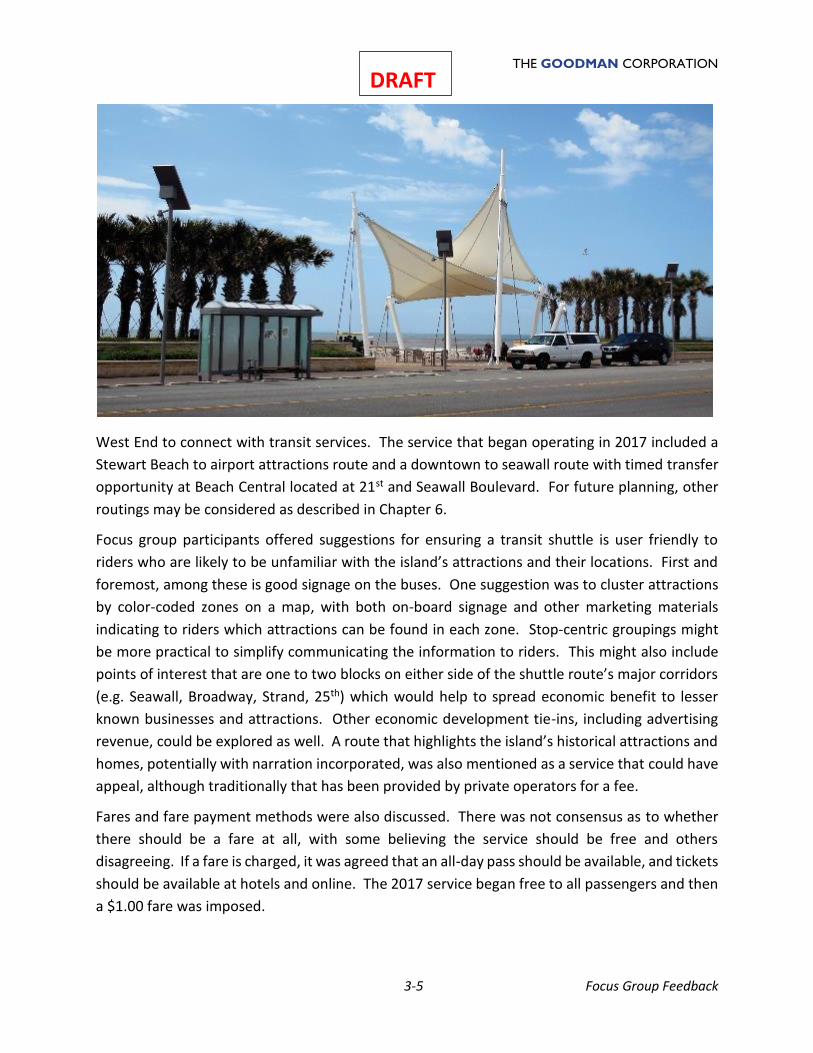
West End to connect with transit services. The service that began operating in 2017 included a
Stewart Beach to airport attractions route and a downtown to seawall route with timed transfer
opportunity at Beach Central located at 21st and Seawall Boulevard. For future planning, other
routings may be considered as described in Chapter 6.
Focus group participants offered suggestions for ensuring a transit shuttle is user friendly to
riders who are likely to be unfamiliar with the island’s attractions and their locations. First and
foremost, among these is good signage on the buses. One suggestion was to cluster attractions
by color-coded zones on a map, with both on-board signage and other marketing materials
indicating to riders which attractions can be found in each zone. Stop-centric groupings might
be more practical to simplify communicating the information to riders. This might also include
points of interest that are one to two blocks on either side of the shuttle route’s major corridors
(e.g. Seawall, Broadway, Strand, 25th) which would help to spread economic benefit to lesser
known businesses and attractions. Other economic development tie-ins, including advertising
revenue, could be explored as well. A route that highlights the island’s historical attractions and
homes, potentially with narration incorporated, was also mentioned as a service that could have
appeal, although traditionally that has been provided by private operators for a fee.
Fares and fare payment methods were also discussed. There was not consensus as to whether
there should be a fare at all, with some believing the service should be free and others
disagreeing. If a fare is charged, it was agreed that an all-day pass should be available, and tickets
should be available at hotels and online. The 2017 service began free to all passengers and then
a $1.00 fare was imposed.
THE GOODMAN CORPORATION
3-6 Focus Group Feedback
DRAFT There was a focus group discussion about pullouts at bus stops where the buses can move out of
traffic. However, because of the subsequent difficulty for the buses to return to the traffic lane
during heavy traffic periods, pullouts are generally not used. The very short dwell time at each
stop is a tradeoff that usually will not impede traffic flow.
DOWNTOWN
Due to the wide variation in operating hours of Downtown establishments, Downtown
stakeholders had a difficult time noting what operating hours would make the most sense for a
tourist transit service in terms of their needs. Some businesses in Downtown close as early as 5
pm, while others, such as The Grand 1894 Opera House, have patronage until 11 pm or midnight.
Although some business owners would like to stay open later, they are reluctant without proven
customer demand, creating a “chicken or egg” situation and the need for many businesses to act
together to reinforce the patterns. It was noted that the initial rubber-tire trolley service or the
restarted rail trolley service will need to be tweaked based on actual experience by the City and
by the riders and by businesses. Enlisting the support of the business owners to boost ridership
will be necessary as well.
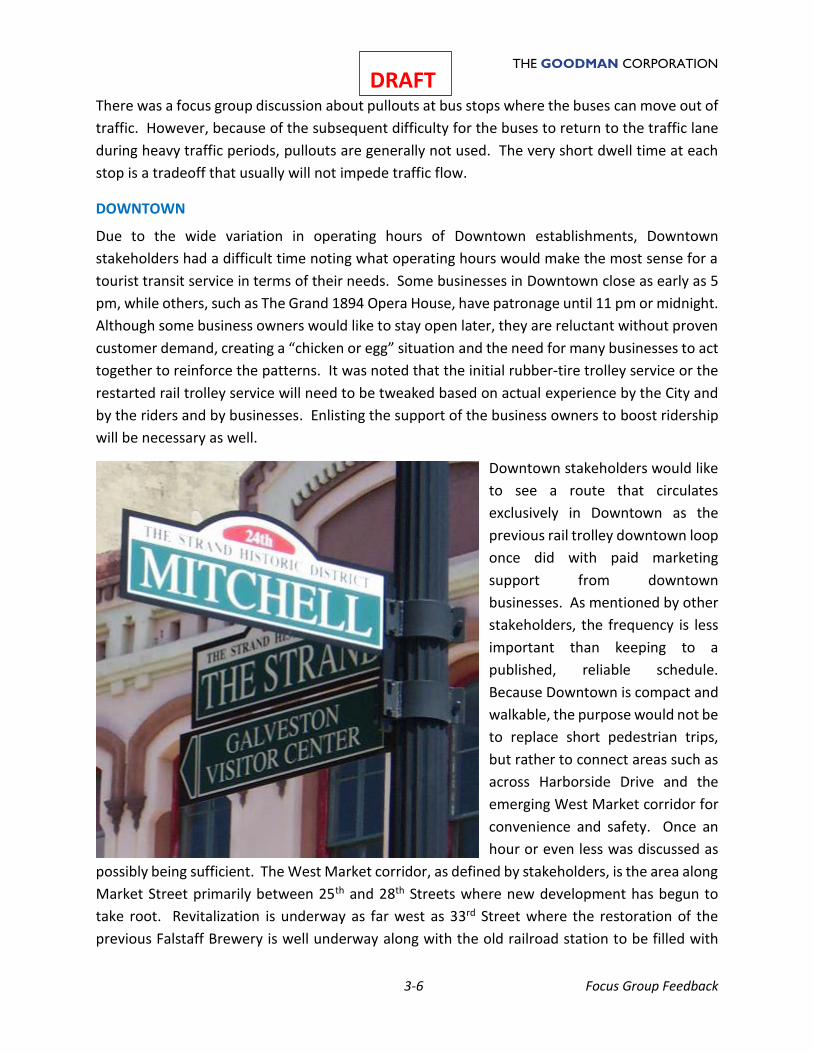
Downtown stakeholders would like
to see a route that circulates
exclusively in Downtown as the
previous rail trolley downtown loop
once did with paid marketing
support from downtown
businesses. As mentioned by other
stakeholders, the frequency is less
important than keeping to a
published, reliable schedule.
Because Downtown is compact and
walkable, the purpose would not be
to replace short pedestrian trips,
but rather to connect areas such as
across Harborside Drive and the
emerging West Market corridor for
convenience and safety. Once an
hour or even less was discussed as
possibly being sufficient. The West Market corridor, as defined by stakeholders, is the area along
Market Street primarily between 25th and 28th Streets where new development has begun to
take root. Revitalization is underway as far west as 33rd Street where the restoration of the
previous Falstaff Brewery is well underway along with the old railroad station to be filled with
THE GOODMAN CORPORATION
3-7 Focus Group Feedback
DRAFT attractions operated by the Galveston Historical Foundation. New development along this
corridor is being promoted as an extension of downtown. The City is constructing streetscape
improvements along Market between 25th and 33rd to help accelerate this concept and
pedestrian linkage.
The concern about a Seawall Boulevard-only service being too limited was echoed by Downtown
stakeholders, from the standpoint of Seawall Boulevard being known to beach goers but not
showcasing everything Galveston has to offer. This is consistent with the desire of many tourists
to have more of a “local” experience when they travel. Likewise, it was emphasized that any
service within Downtown needs to focus not solely on The Strand, but also link other important
corridors such as Postoffice Street, Pier 21, and Market Street.
PARKING
The potential for remote parking scenarios was discussed with focus group participants.
Representatives from Moody Gardens and Stewart Beach (with both paid and free parking)
indicated that they would be open to discussions about providing certain portions of their parking
areas for longer term parking to be used by transit patrons. Further evidence of the Moody
Gardens interest is indicated by their sponsorship of a rubber-tire trolley shuttle stop with shelter
(matching the Seawall Boulevard project) within their parking lot. The Beach Patrol
representative indicated that a central parking hub would be useful since parking can be difficult
to find at peak times and people tend not to give up their parking spaces once they have found
them.
CONGESTION
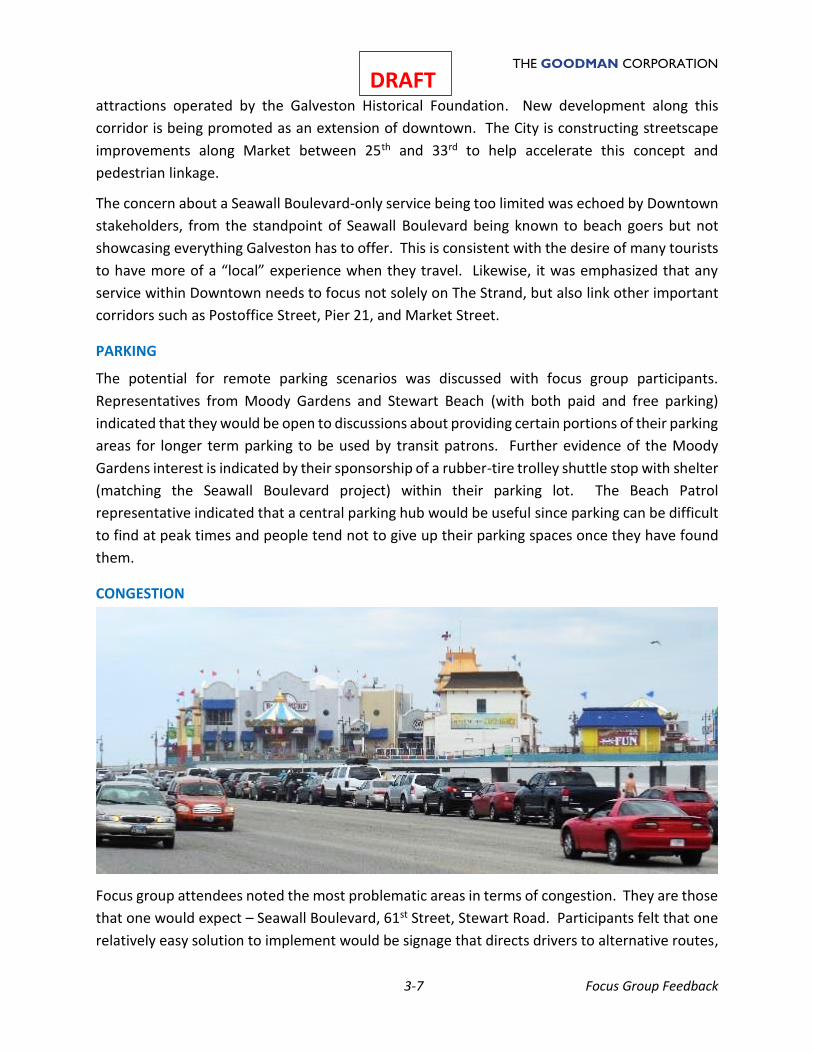
Focus group attendees noted the most problematic areas in terms of congestion. They are those
that one would expect – Seawall Boulevard, 61st Street, Stewart Road. Participants felt that one
relatively easy solution to implement would be signage that directs drivers to alternative routes,
THE GOODMAN CORPORATION
3-8 Focus Group Feedback
DRAFT which is discussed in Chapter 5. For instance, strategically placed signage would alert drivers to
the fact that corridors such as 53rd, 45th, 33rd, and 25th Streets are viable alternatives to 61st St for
accessing Seawall Boulevard from Broadway. Chapter 5 discusses the potential application of
Advance Parking Guidance Systems (APGS) to Galveston. Dynamic links to the city’s coordinated
traffic signal system could optimize transit/parking/traffic integration.
HOTEL TRANSPORTATION/CRUISE PASSENGERS
Most of the participating hoteliers indicated that their hotels provide some sort of transportation
services for their guests. Generally, the limited service hotels have found it necessary to provide
transport solely to and from the cruise terminal, although the full-service hotels are more likely
to offer a more robust service. For instance, the Hotel Galvez and the Tremont House (under the
same management) provide three shuttle vans to transport guests, free of charge, within a 5-
mile radius of the hotels. The highest period of use is typically between the dinner hour and
midnight. The Hilton Galveston uses three to four shuttles to provide half hourly service to the
cruise terminal. Limited other trips are provided, with the Rainforest Café and the Pleasure Pier
being popular destinations. The service is free but advance reservations are required. The
limited service hotels near the west end of the seawall offer cruise terminal transportation only.
Despite providing transportation services, the hoteliers agreed that their preference is not to be
in the transportation business. They would be pleased to see a publicly operated service that, at
a minimum, transports cruise passengers from all of the hotels to the cruise terminal and back.
They note that taxi service available on the island is not adequate and generally not high quality.
As for non-cruise guests, the hoteliers sense that even though most of them have access to an
automobile throughout the duration of their stay and parking is largely free on the island, most
would prefer not to move about the island via their own car. The hoteliers indicated a strong
willingness to support the success of a tourist transit service through activities such as
information dissemination and selling transit passes.
THE GOODMAN CORPORATION
3-9 Focus Group Feedback
DRAFT The topic of attempting to capture cruise passengers
either before or after their cruise to engage in additional
tourist activity in Galveston was also discussed. It was
agreed that the logistics of dealing with luggage and
navigating security screenings pose a significant
challenge to this endeavor. Instead, it was suggested
that perhaps marketing efforts should be focused on
bringing cruise patrons back to Galveston on subsequent
non-cruise trips. Exploring the extended stay seems to
be worth more attention since the potential customers
are already in the city and many of them have been
shuttled from the airport making them ideal transit
candidates. There might also be an opportunity to work
with the cruise lines to encourage early embarkation
check in with a city pass to visit key Galveston
attractions, stores, and eateries.
SUMMARY
A wide range of supportive feedback, opinions, and viewpoints on tourist transit service was
gleaned as a result of the focus group meetings. Several common themes rise to the top as those
seemingly most important to local stakeholders:
▪ The schedule needs to be published and widely available
▪ The service needs to be reliable and consistently run on time
▪ The service needs to be very well marketed
▪ Connections to Downtown and Moody Gardens/Schlitterbahn are equally as
important as Seawall Boulevard service
▪ Service that runs later at night is preferable to service that starts earlier in the
morning, if number of hours related to operating cost is a factor
▪ Developing a user-friendly system is paramount – maps, schedules, fare payment,
and wayfinding must all contribute to easy use of the system
▪ Successful service will require buy-in and support from multiple entities beyond
Island Transit, including business owners, hoteliers, and attraction managers
THE GOODMAN CORPORATION
3-10 Focus Group Feedback
DRAFT
THE GOODMAN CORPORATION
4-1 Parking Options
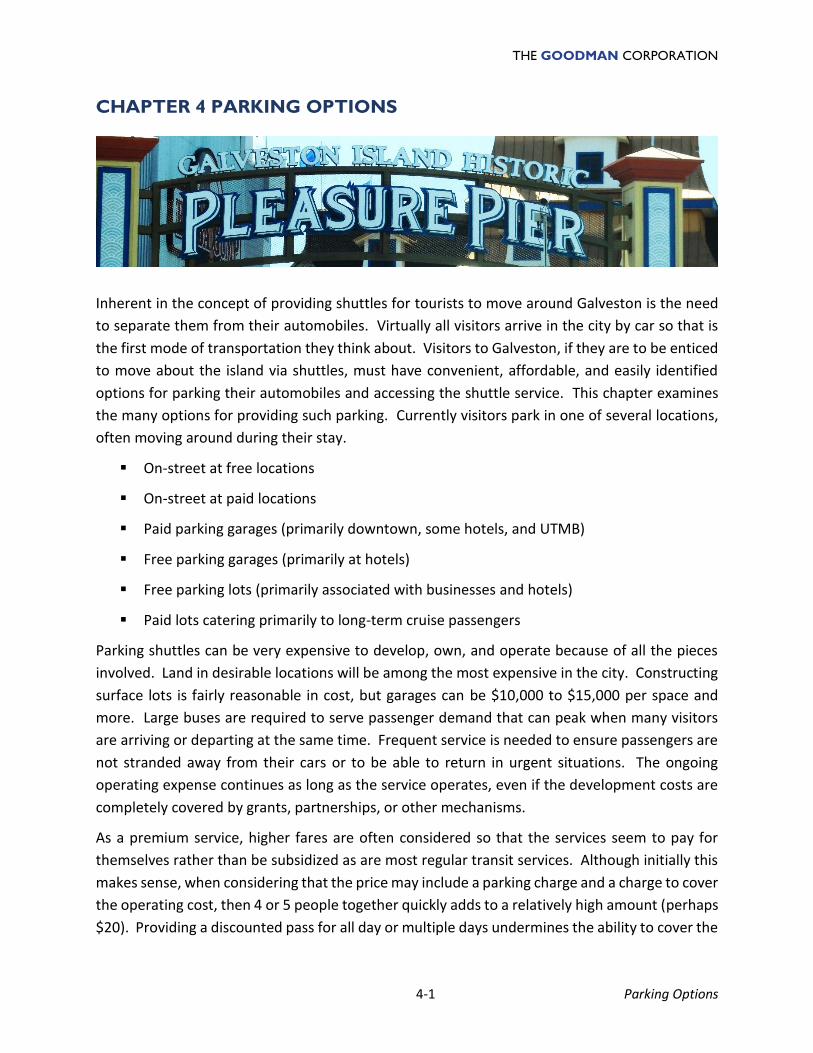
CHAPTER 4 PARKING OPTIONS
Inherent in the concept of providing shuttles for tourists to move around Galveston is the need
to separate them from their automobiles. Virtually all visitors arrive in the city by car so that is
the first mode of transportation they think about. Visitors to Galveston, if they are to be enticed
to move about the island via shuttles, must have convenient, affordable, and easily identified
options for parking their automobiles and accessing the shuttle service. This chapter examines
the many options for providing such parking. Currently visitors park in one of several locations,
often moving around during their stay.
▪ On-street at free locations
▪ On-street at paid locations
▪ Paid parking garages (primarily downtown, some hotels, and UTMB)
▪ Free parking garages (primarily at hotels)
▪ Free parking lots (primarily associated with businesses and hotels)
▪ Paid lots catering primarily to long-term cruise passengers
Parking shuttles can be very expensive to develop, own, and operate because of all the pieces
involved. Land in desirable locations will be among the most expensive in the city. Constructing
surface lots is fairly reasonable in cost, but garages can be $10,000 to $15,000 per space and
more. Large buses are required to serve passenger demand that can peak when many visitors
are arriving or departing at the same time. Frequent service is needed to ensure passengers are
not stranded away from their cars or to be able to return in urgent situations. The ongoing
operating expense continues as long as the service operates, even if the development costs are
completely covered by grants, partnerships, or other mechanisms.
As a premium service, higher fares are often considered so that the services seem to pay for
themselves rather than be subsidized as are most regular transit services. Although initially this
makes sense, when considering that the price may include a parking charge and a charge to cover
the operating cost, then 4 or 5 people together quickly adds to a relatively high amount (perhaps
$20). Providing a discounted pass for all day or multiple days undermines the ability to cover the
THE GOODMAN CORPORATION
4-2 Parking Options
DRAFT costs that set the fare to begin with. Many times, families or other groups traveling together will
see the total cost (parking plus multiple fares) as unreasonable, especially for those on the lower
end of the income scale. Price is always a competitive consideration and lower pricing is always
more attractive.
One consideration includes intercept parking. This approach means leaving one’s car behind as
early as possible during the trip or at the first sign of congestion. This could be a park and ride
facility either on the mainland or immediately upon reaching the island. Although no solution is
a one-size-fits-all, leaving your car off the island is difficult to accept, impossible for overnight
stays, but maybe acceptable for mega-size special events (think Houston rodeo). Another factor
is the longer the distance. There would be more wear and tear on the vehicles and more vehicles
would be needed to deliver a reasonable headway, adding to both capital and operating costs.
An on-island intercept is more reasonable, but then a sea of isolated parking can be created.
A massive, isolated parking operation can impact the community’s fabric or urban structure. A
vast wasteland of parking facilities by themselves can create a gap in development, may create
artificial barriers between communities affecting community cohesion, and may create islands of
security problems. Attaching parking facilities to existing development or as part of existing or
new mixed-use developments can meet a more unified and refined urban development goal,
make public private partnerships more likely, limit incentives that may be required, reduce public
sector development costs, and enhance two-way transportation between fully engaged
developments/attractions/activity centers.
Use of existing facilities is the first consideration to eliminate or drastically reduce the land and
facility development cost. Enhancing revenues through advertising, partnerships, and
sponsorships is another approach.
The analysis in this chapter addresses all the possibilities starting with vacant property, existing
facilities, and a specific focus on Seawall Boulevard as the signature access point, unique to
Galveston, to an urban beach setting renowned throughout the state and the nation. As
discussed above multiple overlapping goals to encourage economic development, shared
parking, and minimize public sector cost to expand tourist parking might point toward public-
private partnerships. Developers could be incentivized to include expanded public parking within
their single-use or mixed-use projects developed on targeted parcels most favorably regarded
for economic development purposes. Many of these parcels are among the vacant Seawall
Boulevard parcels discussed herein. Other scenarios, such as shared parking arrangements with
existing entities and public development of parking by the City itself are also discussed.
In trying to avoid the isolated parking setup, the opposite consideration would be targeting new
shuttle-related tourist parking capacity as close to visitor destinations as possible. This further
underscores a shared parking and private development emphasis. Both options are presented
THE GOODMAN CORPORATION
4-3 Parking Options
DRAFT herein to be considered in final discussion and decision-making. Wayfinding systems, associated
with any parking strategy (even more important with dispersed parking strategies), are discussed
in Chapter 5 on Advance Parking Guidance Systems (APGS).
PARKING REQUIREMENTS, EXISTING AND FUTURE DEMAND
Demand for visitor parking takes many forms in Galveston. It may vary from open beach access
requirements by state law to city land development regulations to other standards which are
established to meet the volume of visitors expected at any particular venue. Each of these is
discussed individually in determining how all components and their individual situations may be
served by a single tourist shuttle system and the resultant impact of shifting around existing
patterns.
GENERAL LAND OFFICE REQUIREMENTS – BEACH ACCESS PARKING
The Texas General Land Office (GLO) enforces state laws that delineate parking requirements1
local governments must meet to comply with state law ensuring beach access by the general
public. According to the regulations, parking must be provided “on or adjacent to the beach
[that] is adequate to accommodate one car for each 15 linear feet of beach.” There should be
no more than one-half mile between beach access points and no farther than 1,000 feet from
the beach. Further requirements2 address the circumstances under which beach user fees are
permitted for parking or other services (“a local government may charge beach users a fee in
exchange for providing services to beach users in general.”). Additionally, when a beach user fee
is utilized for parking, the local government shall also “provid[e] areas where no fee is charged
for parking on or off the beach…” No specific guidelines as to the amount of free parking that is
required (although about 10% is believed to be sufficient) relative to the paid parking is provided,
nor is the required proximity of the free parking relative to the paid parking or to the beach
defined (although within 1000 feet is believed to be sufficient). Designated spaces for the
disabled are also required but without stating a particular percentage or location. The
assumption is that the requirements of the Texas Accessibility Standards or the ADA (2%) would
apply.
The primary applicability of these regulations in this report is regarding the Seawall Urban Park
area where paid on-street parking has been instituted and where change to that policy or shifting
of parking space locations must be implemented in a lawful manner.
The number of parking spaces is constantly changing because of physical modifications along the
corridor (such as the recently completed transit-related enhancement project) and individual
projects such as adding new beach access ramps or new crosswalks. The number of spaces most
1 Texas Administrative Code: Title 31, Part 1, Chapter 15, Subchapter A, Rule §15.7 – “Local Government Management of the Public Beach” 2 Texas Administrative Code: Title 31, Part 1, Chapter 15, Subchapter A, Rule §15.8 – “Beach User Fees”
THE GOODMAN CORPORATION
4-4 Parking Options
DRAFT
recently agreed upon with the GLO is 2,195 (including 31 marked handicap spaces),
encompassing both the north and south sides of Seawall Boulevard, from the west end of the
Seawall to approximately 7th Street (beyond which on-street parking is prohibited due to
insufficient right-of-way). This corresponds with the areas of the Seawall Urban Park where there
is actually beach. The City of Galveston’s GLO-approved Beach Access Plan accounts for parking
for Stewart Beach and Apffel Park separately from parking for the Seawall Urban Park. The
number of handicap spaces is adequate per the requirements of ADA. The City is in the process
of updating its broader dune protection and beach access plans in 2018. Any recommendations
from this parking and transit strategy that are adopted by city council will need to be
incorporated in the overall submissions, as time allows.
EXISTING PARKING DEMAND AT TOURIST ATTRACTIONS
Feedback from focus group participants and other anecdotal evidence suggests that, as a whole,
there may not be a deficit of tourist/attraction parking in Galveston, but as with all supply and
demand situations, there may be peaking situations to address. Although some visitors may
spend longer than they would like to search for a space in a highly convenient location (especially
during peak visitor periods), generally, there may be only a perception of a parking supply
THE GOODMAN CORPORATION
4-5 Parking Options
DRAFT problem. Indeed, the 2015 Tourism Transportation Study3 developed for the Park Board of
Trustees identified “locating available parking,” as opposed to the parking supply itself, as one of
the key mobility challenges for tourists. Chapter 5 describes a number of parking strategies,
including Automated Parking Guidance Systems and intercept wayfinding, that can be
implemented to mitigate the challenges visitors face when trying to locate available parking as
quickly and as proximate to their desired destination as possible.
FUTURE SEAWALL PARKING DEMAND
The lack of an overall parking deficit does not mean that a specific area, such as heavily used
beaches along Seawall Boulevard, may not develop a parking supply challenge over time, given
the growth in tourism levels during the years since Hurricane Ike. In addition, incentivizing new
development along Seawall Boulevard to include tourist-oriented parking will impact the parking
and traffic conditions. Even without a general parking supply problem, there is most certainly a
peak tourist day congestion problem on Seawall Boulevard, exacerbated by visitors driving up
and down Seawall searching for a desirable parking space. Thus, facilitating the ease of the
parking process on Seawall Boulevard for beach-goers, combined with tourist shuttles that allow
visitors to “park once,” will serve to mitigate existing and future levels of congestion.
Galveston tourism has grown by 30 percent over the last seven years, from 5 million visitors in
2010 to 6.5 million visitors in 2016.4 Assuming comparable growth over the next seven years,
approximately 600 additional spaces would be needed along Seawall Boulevard. This number
can be reduced by enticing visitors to park in locations other than Seawall Boulevard and utilize
tourist shuttles.
Another factor that may drive the need to provide new parking opportunities near Seawall
Boulevard is rooted in the discussion by some to eliminate parking on a portion of the south side
of Seawall Boulevard. Assuming the GLO would approve such a plan, the elimination of these
spaces would necessitate their replacement in relative proximity (believed to be one-half mile,
but in practical terms the closer the better). One demonstration program that has been
suggested would be to remove south side parking between 19th and 29th. This would involve
3 Tourism Transportation Study, Galveston Island Park Board of Trustees, Knudson, LP, Co-Plan, LLC, December 2015. 4 The Economic Impact of Tourism on Galveston Island – 2016 Analysis (Galveston Park Board)
THE GOODMAN CORPORATION
4-6 Parking Options
DRAFT
approximately 143 spaces that would need to be replaced in the vicinity even before addressing
growth. That number could be accommodated in a surface lot on currently vacant land or by
converting a little-used fragmented perpendicular city street segment to a parking lot.
Since the referendum which created paid parking along Seawall Boulevard sunsets in 2019, there
will be much discussion during the next year regarding extending versus removing the parking
fees. Although a potentially stressful process for the City and voters, such a change would have
no effect on the parking supply. Free parking may, however, result in less turnover of spaces,
adding to the extended search for a space. Continued paid on-street parking (perhaps at an
increased fee) may result in more demand for beachgoers without a lot of gear to park elsewhere
and use a shuttle.
These scenarios, as they relate to the City’s economic development goals, funding for Seawall
Boulevard enhancements (and their maintenance), and specific recommendations for locating
replacement/additional Seawall Boulevard parking, are discussed in more detail in Chapter 10.
Ultimately, the number of additional spaces beyond the GLO minimum that may be needed on
Seawall Boulevard is highly tied to the number of parkers that can be successfully diverted from
parking on Seawall Boulevard, as well as the number of parking spaces, if any, that are removed
from the south side of Seawall.
THE GOODMAN CORPORATION
4-7 Parking Options
DRAFT SEAWALL BOULEVARD CORRIDOR PARKING OPTIONS
The following sections present the characteristics of the potential parking opportunities
identified along Seawall Boulevard, including vacant parcels, shared parking, and garages.
VACANT PARCELS – SEAWALL URBAN PARK
An inventory of vacant Seawall Boulevard (SUP) frontage parcels resulted in the identification of
nine locations (some consisting of multiple adjacent individual parcels), the key characteristics of
which are detailed in Table 4.1. These locations are shown on Figure 4.1. Note that most of these
Table 4.1: Vacant Seawall Boulevard Parcels
properties are already in the hands of those active in the tourist/hospitality industry in Galveston.
That chould facilitate the targeted joint development strategy being contemplated. The
Galveston Central Appraisal District lists market value, appraisal value, and assessed value as
VACANT SEAWALL BOULEVARD PARCELS
GCAD1 PARCEL NUMBER
LOCATION TOTAL
ACREAGE CURRENT LAND USE
OWNERSHIP GCAD VALUE2
381266 Old Sea-Arama
property 22.675 Vacant
Island Enter-tainment, Inc.
$1,750,040
114998 297043 114994 289148
NE corner of 75th
2.369 Vacant Pino Farinola $1,027,080
409836 Ft. Crockett 2.643 Vacant Island Hospitality,
Inc. $1,727,040
614279, 614281 Between 45th
& 42nd 6.246 Vacant
Galv. ER Realty; Jeff Bowen &
Juan-Hijo Invest. $2,205,815
416091 Ave U & 41st 1.342 Vacant Om Sai
Hospitality, Inc $322,370
109523 Between 35th
& 33rd
(“Seahorse”) 4.089 Vacant
Island Entertainment,
Inc. $2,405,160
109521 35th & Ave S
(former “Island Bowl”)
1.388 Shuttered
improvement
Island Entertainment,
Inc. $543,240
388703 NW 21st (Beach
Central) 1.649 Vacant
Eighteen Seventy Strand Corp
$1,077,750
105691-105698 (8 parcels)
Between 12th & 11th
1.517 Vacant Various $665,170
1Galveston Central Appraisal District 2Market, Appraised, Assessed values shown as equal.
THE GOODMAN CORPORATION
4-8 Parking Options
DRAFT being equal for most properties. In reality, prices to purchase property for development may be
higher. However, the listing shown in Table 4-1 is valuable to compare the nine locations.
Figure 4.1 Seawall Boulevard Vacant Parcels (by GCAD ID #, See Table 4-1)
POTENTIAL SHARED PARKING – SEAWALL BOULEVARD
Commercial establishments with large, somewhat underutilized surface parking lots, can be
strong candidates for shared parking leasing arrangements whereby a certain number of spaces
are made available for the exclusive use of shuttle riders at agreed upon times of the day. This
could be particularly relevant if the peaking characteristics of the business clientele and the
shuttle are at different times. The City may be in a position to offer incentives to facilitate these
arrangements at a lower cost than developing its own facilities. The following are two potential
examples along Seawall Boulevard:
▪ The Premiere movie theater at 89th and Seawall Boulevard is a location to consider for a
shared parking arrangement with the property owner. It also has potential to serve as a
west end park and ride as suggested by the focus groups. This is further discussed in
Chapter 10
381266
105691+
416091
109521
388703
614279+
409836
114998+
109523
THE GOODMAN CORPORATION
4-9 Parking Options
DRAFT ▪ The Academy store near 45th and Seawall also seems to have an excess of parking and is
in the heart of the SUP beach area.
A potential for shared parking cooperation in conjunction with new development may exist with
new hotel and parking garage at 32nd and Seawall Boulevard behind The Spot. Construction has
been announced so quick action may be needed to develop a public private partnership. Chapter
9 discusses in greater detail strategies that the City may employ to incentivize private
development to align with city goals including expansion of public parking within a development
to address tourist needs.
GARAGE PARKING – SEAWALL BOULEVARD
The Hotel Galvez parking garage is located at 21st & Seawall, just north of the “Beach Central”
event lawn. This garage, with approximately 400 spaces, could be a potential candidate for a
shuttle parking partnership, pending discussions with the hotel. Currently it is only open to
registered guests of the hotel. Like other garages in Galveston downtown and at UTMB that were
built during the same era, it was designed to be expanded. Although on the upper end of the
cost range, expansion of the garage, perhaps in conjunction with a mixed-use development on
adjacent property would locate additional parking spaces in the heart of the Seawall Boulevard
action.
Similarly, the Galveston Island Convention Center at the San Luis Resort garage has a capacity of
688 spaces, some of which the City may negotiate for use as shuttle parking, particularly on
summer days when no convention or other major event is being held.
STEWART BEACH PARKING
With approximately 3,000 spaces,
Stewart Beach is a location that
could have utility for shuttle
parking. A Park Board
representative attending the
attractions focus group meeting
indicated that the board would be
open to the possibility of allowing
shuttle parking at Stewart Beach
(paid and/or free spaces). The
transit pedestrian access and
beautification program located an improved bus stop near the vehicular entrance. Situated near
the far eastern end of the island, the location is not ideal for intercepting visitors and getting
them out of their cars and into shuttle vehicles as soon as possible upon entry to the island.
However, with the focus group feedback and mobile phone trip data indicating a large amount
THE GOODMAN CORPORATION
4-10 Parking Options
DRAFT of interchange among attractions at the eastern end of the island (Pleasure Pier, Stewart Beach,
Downtown), a more formalized shuttle parking option at this location adjacent to a major
attraction could still potentially divert some auto trips that would otherwise occur. In addition,
an effective APGS system could direct visitors along express routes (e.g. Harborside to 4th to
Seawall Boulevard) to Stewart Beach to bypass much of the congestion and bring them to this
attraction and to the shuttle system as quickly as possible.
PARKING AT ATTRACTIONS
Moody Gardens currently offers free parking to its patrons, although charging for parking is
something that may occur in the future. There are 1,400 spaces in the West Lot of the complex,
which is the parking that is farthest from the attraction entrances. The Moody Gardens
representative in attendance at the attractions focus group indicated that Moody Gardens would
be willing to entertain a discussion about promoting and directing shuttle parking in the West
Lot. The rubber-tire trolley Seawall Route already serves this lot and Moody Gardens has
installed an improved bus stop with shelter matching those Island Transit installed on Seawall
Boulevard. As would be the case with Stewart Beach shuttle parking, this location is not ideally
situated from an “intercept” standpoint, since visitors would still need to navigate a congested
path on their way to the parking location to access the shuttle service. However, because there
is a known synergy between Moody Gardens and other attractions (particularly Pleasure Pier),
once visitors have made their way there it makes sense for the shuttle system and for the visitors’
peace of mind to leave their car behind. This location may serve the desirable purpose of
removing automobile traffic from Seawall Boulevard as visitors travel between Moody Gardens
and other locations. Those staying at the hotel should be another group ready and willing to
leave the driving to others.
The Pleasure Pier provides 465 spaces in the lot across from the pier, next to Fish Tales. Like
Stewart Beach and Moody Gardens, the Pleasure Pier lot is another location where visitors may
choose to park to access both the proximate attraction and use the shuttle service to visit other
destinations. The charge is currently $10 to park all day, although the Pleasure Pier
representative attending the attractions focus group indicated that they may move to an hourly
charge to encourage turnover at the attraction. That policy would not encourage park and
shuttle activities so negotiations/incentives with that owner might focus on retaining the current
all-day rates or some combination of the two. This also may be a key candidate for constructing
a simple, one-level steel deck over the existing lot. An investment of perhaps $2,000,000 could
almost double the capacity to the benefit of the developer and the parking shuttle service.
OTHER VACANT PARKING
The former grocery store parcel at the northeast corner of 25th Street and Avenue P½ has been
mentioned by as a location in need of redevelopment and having the potential for a public private
THE GOODMAN CORPORATION
4-11 Parking Options
DRAFT partnership to include public parking. Its relative proximity to Seawall Boulevard, and the
Pleasure Pier in particular, make it worthy of consideration.
DOWNTOWN GARAGE PARKING
The Downtown Transit Terminal, opened in February 2016, provides 162 public parking spaces
and is connected to the 400 spaces that were pre-existing in the adjacent Shearn Moody garage
(common entry and management) prior to the construction of the terminal and additional
parking. A flat $10 fee is charged to park in the garage. With proper marketing to make visitors
aware of the parking available here, this is a natural location from which to base tourist shuttle
service along with the other Island Transit fixed-routes and the restored rail trolley that pulse
service from that location. Accessibility from Harborside Drive, away from other traffic
congestion also helps the desirability of this location.
The Frost Bank Garage at 22nd and Market, with a capacity of 580 spaces, is another logical
location from which tourists can base their “park once” excursions. The garage is open 24/7 for
public parking. As with the Downtown Transit Terminal, targeted marketing efforts along with
APGS guidance would be needed to raise awareness of the garage as a parking option for tourists.
Current parking rates in the garage are $3.00 per hour for the first two hours, and $9.00 for up
to 24 hours beyond the first two hours. It is frequently used for major downtown events.
At both locations APGS direction to an express route to downtown (via Harborside Drive) could
minimize congestion encountered and improve the visitor experience.
The Medical Arts Building (302 21st St) is currently being redeveloped to include more than 200
apartment units and a six-story parking garage. The garage will be shared with American National
Insurance Company (ANICO), who will use most of the parking weekdays for ANICO employees.
An opportunity exists for the City to partner with the developer and/or ANICO to utilize some
portion of the parking garage for weekend public parking. The location is adjacent to the rail
trolley route.
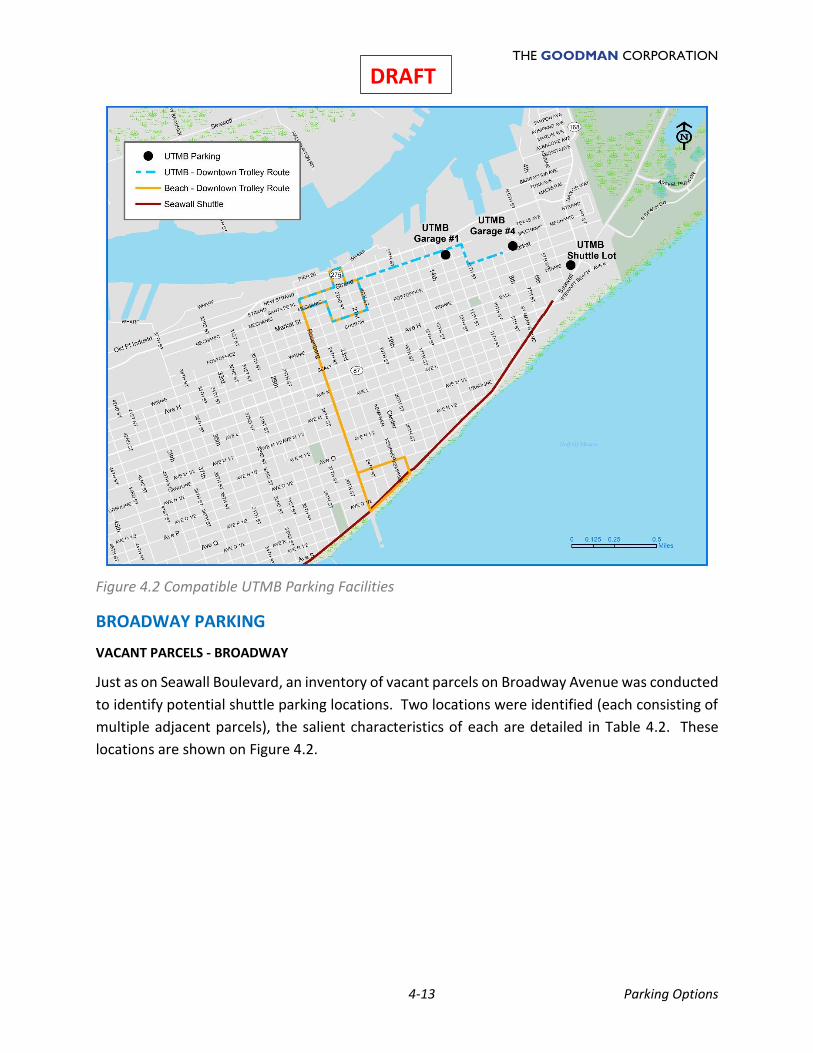
UTMB GARAGE AND SURFACE PARKING
With several parking garages, including two directly on the rail trolley route, the UTMB campus
is a viable candidate for the establishment of tourist shuttle parking arrangements. Since there
is typically very little garage utilization evenings and weekends, UTMB has expressed a willingness
to discuss a partnership with the City in which select UTMB garages could be made available for
shuttle parking during non-UTMB peak usage hours. The garages for which such a partnership
makes the most sense are Garage #4 (778 spaces), located at 13th and Strand, and Garage #1
(242 spaces) at 8th and Market, each of which is served by a nearby rail trolley stop. The garage
at 8th and Market has the additional advantage of being able to be easily served by rubber tire
shuttles in addition to the rail trolley, since rubber tire vehicles could use the circular drive in
THE GOODMAN CORPORATION
4-12 Parking Options
DRAFT front of John Sealy Hospital to ingress and egress the area near the rail trolley stop. During 2017
Garage #1 was closed to the public due to construction. It is unclear whether UTMB will re-open
this garage to the public at the end of campus construction activities.
Current UTMB garage rates for public parking are $2.00 per hour (or portion thereof), with a
$14.00 daily maximum. However, the rates to be charged to shuttle patrons would be
determined as part of the agreement developed between UTMB and the City.
A surface parking lot that is a potential candidate for a shuttle parking partnership with UTMB is
the shuttle lot located at 4th and Seawall Boulevard. The 425-space lot is currently utilized for
transit purposes. Namely, it is served by a UTMB campus shuttle and the League City Park & Ride
bus during the AM and PM peak periods, and by the Island Transit Route 2 bus during non-peak
hours. The weekday users of the lot are primarily UTMB employees, and there is currently no
charge for the use of the lot. Although there is likely little capacity available for tourist shuttle
use during the weekdays, a partnership for use of the lot during evenings and weekends could
be viable, especially with its location adjacent to Stewart Beach. It would only require extending
the existing Seawall Route rubber-tire trolley by one-half mile to include this lot.
Although first-time island visitors may find it counterintuitive to bypass downtown or other
attractions to access use these facilities, good marketing and APGS will demonstrate the potential
for this to be the fastest way to begin enjoying island amenities.
THE GOODMAN CORPORATION
4-13 Parking Options
DRAFT
Figure 4.2 Compatible UTMB Parking Facilities
BROADWAY PARKING
VACANT PARCELS - BROADWAY
Just as on Seawall Boulevard, an inventory of vacant parcels on Broadway Avenue was conducted
to identify potential shuttle parking locations. Two locations were identified (each consisting of
multiple adjacent parcels), the salient characteristics of each are detailed in Table 4.2. These
locations are shown on Figure 4.2.
THE GOODMAN CORPORATION
4-14 Parking Options
DRAFT
VACANT BROADWAY PARCELS
GCAD1 PARCEL NUMBER
LOCATION TOTAL ACREAGE
CURRENT LAND USE
OWNERSHIP GCAD VALUE2
600246, 600237, 600234
Broadway, between 57th & 54th
15.437 Vacant
Lowes Home Center Inc, Galveston County, City of Galveston
$3,139,980
101997, 102462, 102869, 102868
NE corner of Broadway & 53rd
11.505 Vacant Galveston Housing Authority
$1,279,340
1Galveston Central Appraisal District 2Market, Appraised, Assessed values are shown as equal by GCAD.
Table 4.2: Vacant Broadway Parcels
Figure 4.3 Possible Broadway Parcels
600246+ Island Community Center
101997+
Broadway Shared
THE GOODMAN CORPORATION
4-15 Parking Options
DRAFT The Broadway parcels, being farther west, closest to the entry to the island from the I-45
causeway, are ideally situated for serving as true intercept locations where tourists entering the
city can be transferred to shuttle vehicles as early as possible for distribution throughout the
island and maximize the removal of private autos from the street network before they contribute
to congested corridors such as 61st Street and Seawall Boulevard. They would be extremely easy
for first time visitors to find; signage directing visitors to these locations could be easily
implemented in the most simplified manner without using an elaborate APGS system. The size
of each property is ample to develop any amount of parking desired as well as incentivized joint
development in addition to a first-encounter visitor center.
The vacant land at the northeast corner of Broadway and 53rd is the former location of the
Oleander Homes public housing project. The Galveston Housing Authority (GHA) has considered
selling the property and some possible buyers have expressed some interest. The vacant land
between 57th and 54th (comprised of several parcels, some of which are publicly owned by the
County and the City), is just west of the Oleander Homes parcels, is privately owned, and has
been the subject of various development concepts over the years.
The existing visitor center at Ashton Villa, although patronized by over 7,000 visitors monthly, is
small, somewhat difficult to find and easy to miss due to lack of prominent signage. The location
is nearly four and a half miles from the point where most visitors first arrive on the island and
where many turn off Broadway onto 61st. By contrast, a “can’t miss it” visitor center at the west
end of Broadway would likely capture the attention of many more visitors than Ashton Villa
presently does and could integrate seamlessly with tourist shuttle service right outside the door.
This is not to say that the Ashton Villa visitor center should be eliminated. On the contrary, the
two centers could complement each other, with the main, west Broadway location capturing
visitors and tourists when they first arrive on the island, providing valuable information, and
facilitating their understanding of and use of the tourist shuttle service. The Ashton Villa center,
which is likely closer to many of the attractions being visited, could serve as a satellite location
that tourists can patronize later in their visit if they’re in need of additional information. It is also
near the rail trolley route. As discussed in Chapter 6, a stop at the Ashton Villa visitor center
would also be on the proposed Broadway rubber tire trolley route.
In addition to development of this tourist shuttle plan, the City is currently conducting a study
including design standards and other actions to catalyze desirable redevelopment of the
Broadway corridor. A flagship visitor center, serving as the gateway to the rest of the island and
making a memorable first impression on visitors, could serve as a key component of a
redevelopment strategy.
If the City were to consider developing an intercept parking facility, working an agreement with
the public ownership of either of these locations could be simpler, both financially and
logistically, than acquiring private property on the open market.
THE GOODMAN CORPORATION
4-16 Parking Options
DRAFT POTENTIAL SHARED PARKING – BROADWAY
The parking lot at the Island Community Center, at 4700 Broadway, is a potential shared parking
opportunity. Observation seems to indicate the parking lot is underutilized at most times of the
day. The GHA may be open to a lease agreement whereby a certain portion of the parking is
made available to shuttle users. There is a precedent for such an arrangement, albeit on a limited
scale. The existing Island Connect park and ride service between Galveston and League City
makes a stop at the Island Community Center. There is an agreement in place to allocate and
reserve approximately 20 parking spaces for use by commuters.
PORT OF GALVESTON PARKING LOTS
The Port of Galveston controls approximately 2,200 parking spaces for use by cruise passengers.
This parking is available in three lots centered near Harborside Drive and 33rd St.
Prior discussions with port officials have indicated a willingness on the part of the Port to consider
making a portion of their parking available for shuttle usage. The advantage of Harborside parking
is that the route to access the parking is relatively uncongested, potentially serving as an
incentive for visitors to utilize the lots despite the appearance of being out of the way, like the
downtown or UTMB garages discussed above. If desirable to the city and discussions with the
Port prove fruitful, an arrangement for shuttle parking at this site could be accommodated by
slight modification of the Broadway shuttle route discussed in Chapter 6.
A 2010 study5 examined the possibility of constructing a new intermodal terminal/parking garage
on Port property, between Harborside Drive and the existing cruise terminals. Should such a
scenario ever come to pass, providing tourist shuttle parking in this location is another option,
similar to the downtown locations discussed above, that could be explored with the Port.
PRIVATE CRUISE PASSENGER PARKING
To form a complete picture of the availability, capacity, and utilization of parking options on the
island, the following private parking operators were contacted:
1. ABM Parking
2. AMPCO Parking
System
3. Port Parking
4. EZ Cruise
5. Lighthouse Cruise
Parking
6. Discount Cruise
7. Cruise Park
8. 81st & Dolphin Park
Without exception, the proprietors of these parking facilities are unwilling to share any
information regarding the number of spaces they provide or their typical utilization rates. Due
to this, as well as the fact that these facilities cater more toward the longer-term parking needs
of cruise passengers, it is unlikely that the private parking lots serving the cruise industry would
5 Port of Galveston Intermodal Terminal Feasibility Study, The Goodman Corporation, 2010
THE GOODMAN CORPORATION
4-17 Parking Options
DRAFT play any meaningful role in a tourist parking shuttle scenario. That is not to say, however, that
contact from a City official with a palatable proposal would not be well received by these or other
entrepreneurial property owners.
SUMMARY OF PARKING OPTIONS
Table 4.3 summarizes 29 parking location options initially explored for this report. Figure 4.4
maps their locations.
TOURIST PARKING LOCATION OPTIONS
SEAWALL VACANT
1 Old “Sea-Arama” property
2 NE corner of Seawall Boulevard & 75th
3 Seawall Boulevard, across from Ft Crockett
4 Seawall Boulevard, between 45th & 42nd
5 Ave U & 41st
6 Seawall Boulevard between 35th & 33rd (“Seahorse”)
7 35th & Ave S (former “Island Bowl”)
8 NW corner of Seawall & 21st (Beach Central)
9 Seawall Boulevard, between 12th & 11th
SEAWALL SHARED PARKING
10 8902 Seawall Blvd. (movie theatre)
11 4523 Seawall Blvd. (Academy)
12 Pleasure Pier (between 25th & 27th)
13 Stewart Beach
14 New development at The Spot
SEAWALL GARAGE PARKING
15 Convention Center
16 Hotel Galvez garage (21st & Seawall)
OTHER SHARED PARKING
17 Moody Gardens
OTHER VACANT PARKING
18 NE corner of 25th St & Ave P½ (former grocery store)
DOWNTOWN
19 Downtown Transit Terminal/Shearn Moody Garage
20 Frost Bank Garage
21 Medical Arts Building (302 21st St)
UTMB
22 UTMB Garage #4 (13th & Strand)
23 UTMB Garage #1 (8th & Market)
24 UTMB Shuttle Lot (Seawall & 4th)
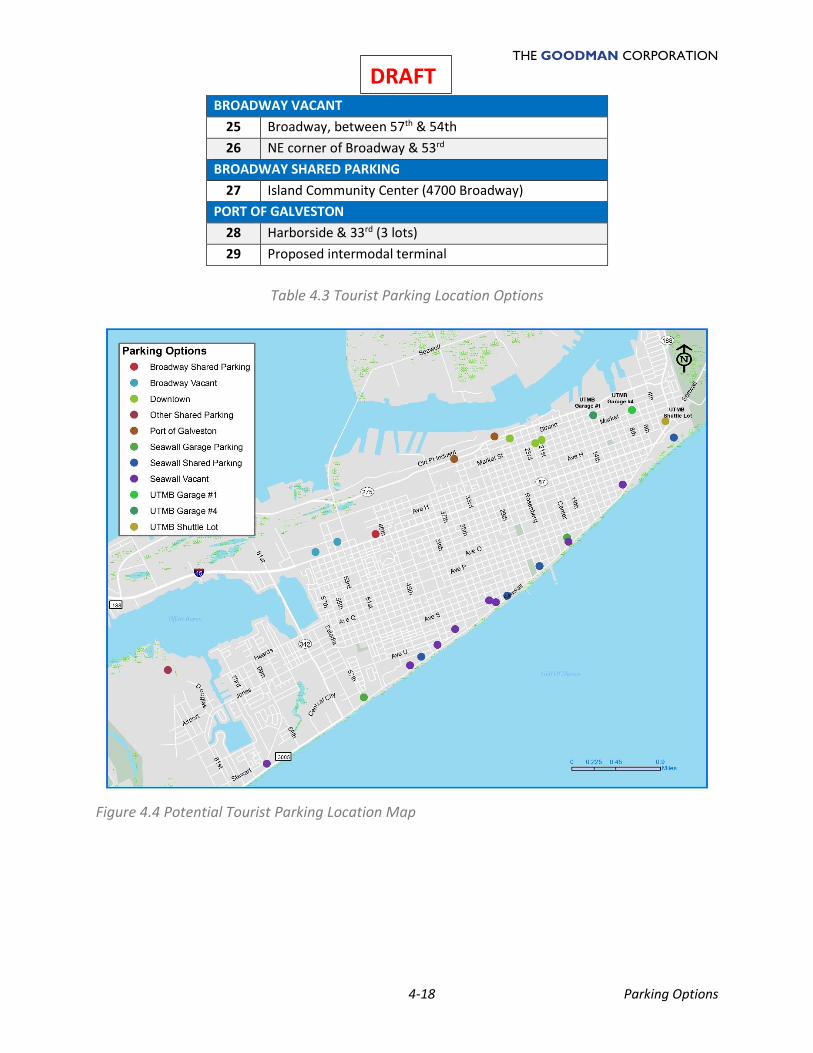
THE GOODMAN CORPORATION
4-18 Parking Options
DRAFT BROADWAY VACANT
25 Broadway, between 57th & 54th
26 NE corner of Broadway & 53rd
BROADWAY SHARED PARKING
27 Island Community Center (4700 Broadway)
PORT OF GALVESTON
28 Harborside & 33rd (3 lots)
29 Proposed intermodal terminal
Table 4.3 Tourist Parking Location Options
Figure 4.4 Potential Tourist Parking Location Map
THE GOODMAN CORPORATION
4-19 Parking Options
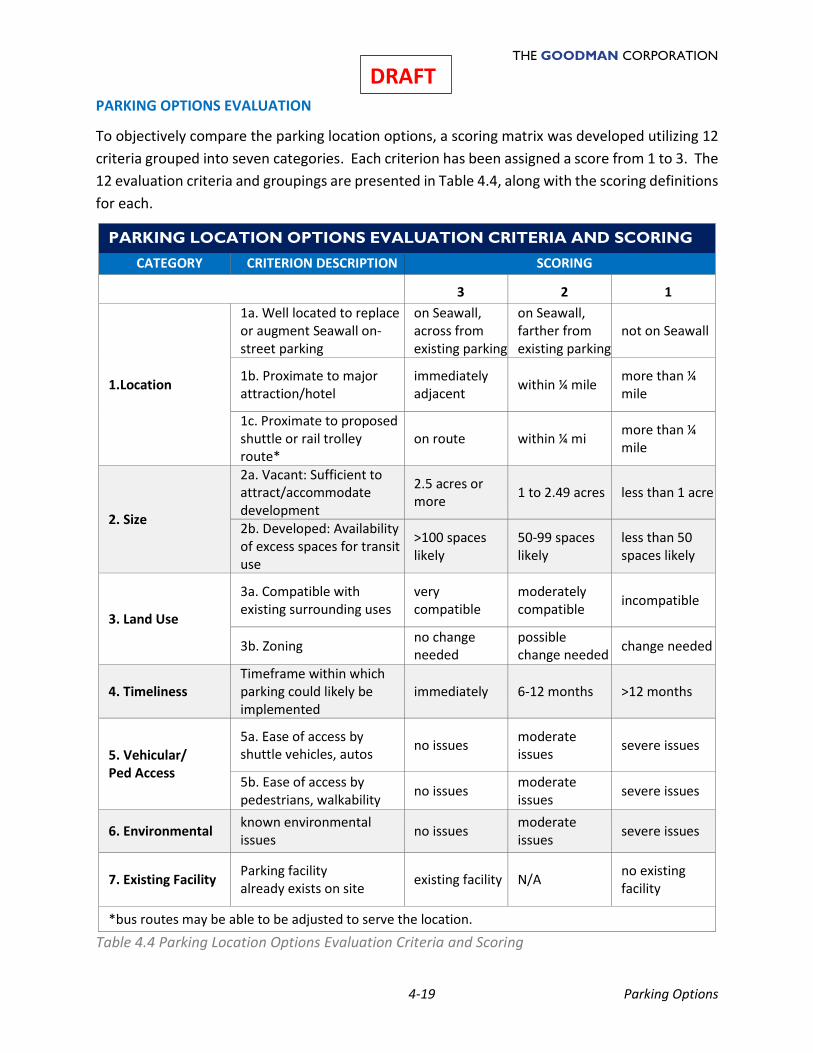
DRAFT PARKING OPTIONS EVALUATION
To objectively compare the parking location options, a scoring matrix was developed utilizing 12
criteria grouped into seven categories. Each criterion has been assigned a score from 1 to 3. The
12 evaluation criteria and groupings are presented in Table 4.4, along with the scoring definitions
for each.
Table 4.4 Parking Location Options Evaluation Criteria and Scoring
PARKING LOCATION OPTIONS EVALUATION CRITERIA AND SCORING
CATEGORY CRITERION DESCRIPTION SCORING
3 2 1
1.Location
1a. Well located to replace or augment Seawall on-street parking
on Seawall, across from existing parking
on Seawall, farther from existing parking
not on Seawall
1b. Proximate to major attraction/hotel
immediately adjacent
within ¼ mile more than ¼ mile
1c. Proximate to proposed shuttle or rail trolley route*
on route within ¼ mi more than ¼ mile
2. Size
2a. Vacant: Sufficient to attract/accommodate development
2.5 acres or more
1 to 2.49 acres less than 1 acre
2b. Developed: Availability of excess spaces for transit use
>100 spaces likely
50-99 spaces likely
less than 50 spaces likely
3. Land Use
3a. Compatible with existing surrounding uses
very compatible
moderately compatible
incompatible
3b. Zoning no change needed
possible change needed
change needed
4. Timeliness Timeframe within which parking could likely be implemented
immediately 6-12 months >12 months
5. Vehicular/ Ped Access
5a. Ease of access by shuttle vehicles, autos
no issues moderate issues
severe issues
5b. Ease of access by pedestrians, walkability
no issues moderate issues
severe issues
6. Environmental known environmental issues
no issues moderate issues
severe issues
7. Existing Facility Parking facility already exists on site
existing facility N/A no existing facility
*bus routes may be able to be adjusted to serve the location.
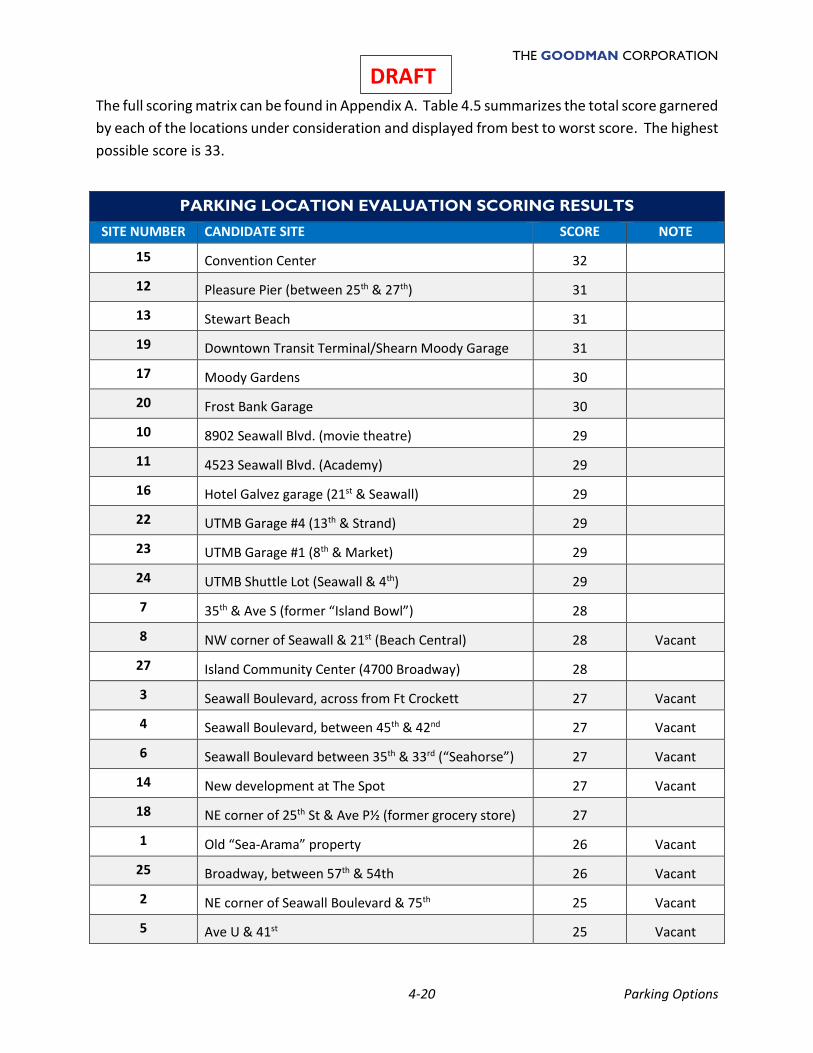
THE GOODMAN CORPORATION
4-20 Parking Options
DRAFT The full scoring matrix can be found in Appendix A. Table 4.5 summarizes the total score garnered
by each of the locations under consideration and displayed from best to worst score. The highest
possible score is 33.
PARKING LOCATION EVALUATION SCORING RESULTS
SITE NUMBER CANDIDATE SITE SCORE NOTE
15 Convention Center 32
12 Pleasure Pier (between 25th & 27th) 31
13 Stewart Beach 31
19 Downtown Transit Terminal/Shearn Moody Garage 31
17 Moody Gardens 30
20 Frost Bank Garage 30
10 8902 Seawall Blvd. (movie theatre) 29
11 4523 Seawall Blvd. (Academy) 29
16 Hotel Galvez garage (21st & Seawall) 29
22 UTMB Garage #4 (13th & Strand) 29
23 UTMB Garage #1 (8th & Market) 29
24 UTMB Shuttle Lot (Seawall & 4th) 29
7 35th & Ave S (former “Island Bowl”) 28
8 NW corner of Seawall & 21st (Beach Central) 28 Vacant
27 Island Community Center (4700 Broadway) 28
3 Seawall Boulevard, across from Ft Crockett 27 Vacant
4 Seawall Boulevard, between 45th & 42nd 27 Vacant
6 Seawall Boulevard between 35th & 33rd (“Seahorse”) 27 Vacant
14 New development at The Spot 27 Vacant
18 NE corner of 25th St & Ave P½ (former grocery store) 27
1 Old “Sea-Arama” property 26 Vacant
25 Broadway, between 57th & 54th 26 Vacant
2 NE corner of Seawall Boulevard & 75th 25 Vacant
5 Ave U & 41st 25 Vacant
THE GOODMAN CORPORATION
4-21 Parking Options
DRAFT
26 NE corner of Broadway & 53rd 25 Vacant
9 Seawall Boulevard, between 12th & 11th 24 Vacant
21 Medical Arts Building (302 21st St) 24
29 Proposed intermodal terminal (POG) 24
28 Harborside & 33rd (3 POG lots) 23
Table 4.5: Parking Location Options Evaluation Scoring Results
The most notable aspect of the scoring results is that, generally, the locations where parking
currently exists rank in the upper half of the list, whereas vacant properties upon which new
development would need to occur are generally in the lower half of the list. This is not to suggest
that the vacant properties are inferior locations. On the contrary, given the City’s desire for
economic development opportunities that may include incentives for developers to include
public parking, these locations may be preferred. However, the higher ranking of the upper half
locations generally reflects the more favorable scoring they received because of the “Timeliness”
and “Existing Facility” criteria. In other words, the locations with existing parking may be better
suited for the near-term establishment of tourist shuttle parking due to the likelihood that
partnerships with these owners could be established within a much shorter timeframe than
incentive deals could be crafted with private developers and parking constructed on their vacant
land.
Thus, if the near-term objective is to establish additional tourist shuttle parking as soon as
possible (over the next two years), the recommended strategy is to pursue partnerships with one
or more of the following highest-ranking candidate locations, each of which have existing parking
and are located either at a major tourist attraction or in proximity to one or more attractions.
They also would provide tests of varying concepts. A full-blown or simplified APGS system would
also enhance their effectiveness. Note that all these locations are currently served by the rubber-
tire trolley routes and four of them are near the rail trolley route.
1. Convention Center
2. Pleasure Pier
3. Stewart Beach
4. Downtown Transit Terminal/Shearn Moody Garage
5. Moody Gardens
6. Frost Bank Garage
For the longer-term objective of incentivizing private development with a public parking
component, the highest ranking recommended locations are the following. The speed at which
THE GOODMAN CORPORATION
4-22 Parking Options
DRAFT their development would be desirable in meeting multiple city goals might dictate the level of
incentives offered as described in Chapter 9:
7. NW corner of Seawall & 21st (Beach Central)
8. Seawall Boulevard, across from Ft Crockett
9. Seawall Boulevard, between 45th & 42nd
10. Seawall Boulevard between 35th & 33rd (“Seahorse”)
11. New hotel development at 32nd
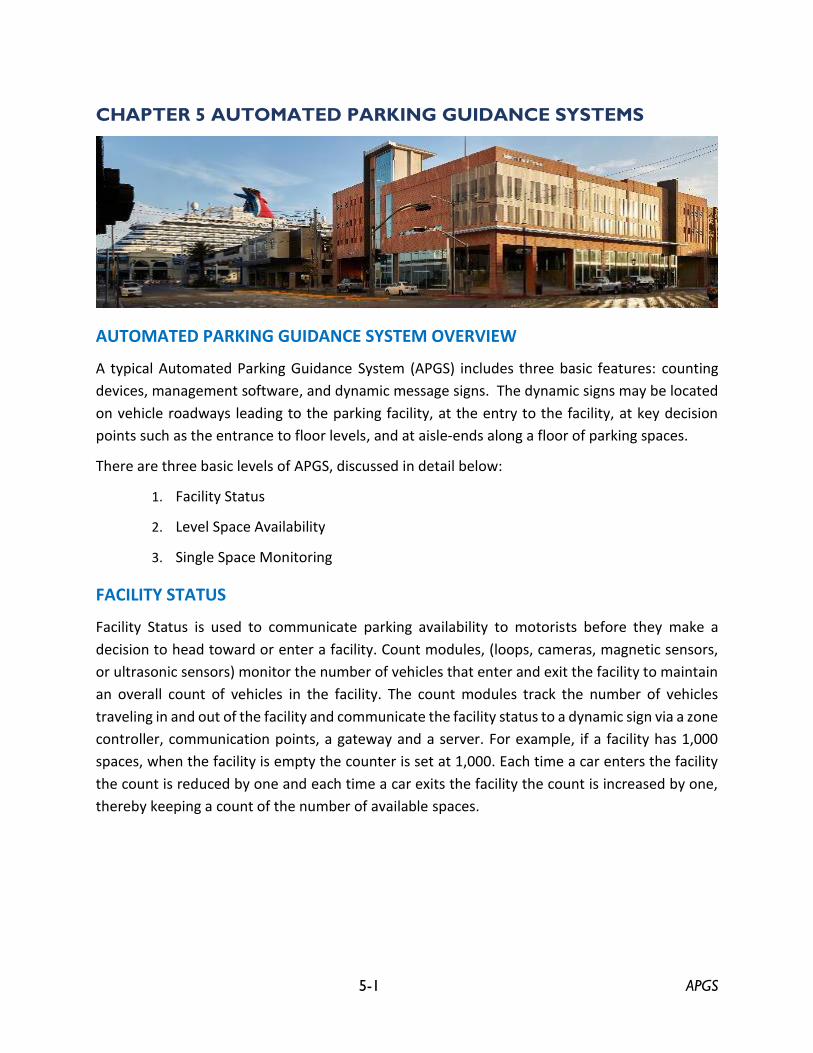
5-1 APGS
CHAPTER 5 AUTOMATED PARKING GUIDANCE SYSTEMS
AUTOMATED PARKING GUIDANCE SYSTEM OVERVIEW
A typical Automated Parking Guidance System (APGS) includes three basic features: counting
devices, management software, and dynamic message signs. The dynamic signs may be located
on vehicle roadways leading to the parking facility, at the entry to the facility, at key decision
points such as the entrance to floor levels, and at aisle-ends along a floor of parking spaces.
There are three basic levels of APGS, discussed in detail below:
1. Facility Status
2. Level Space Availability
3. Single Space Monitoring
FACILITY STATUS
Facility Status is used to communicate parking availability to motorists before they make a
decision to head toward or enter a facility. Count modules, (loops, cameras, magnetic sensors,
or ultrasonic sensors) monitor the number of vehicles that enter and exit the facility to maintain
an overall count of vehicles in the facility. The count modules track the number of vehicles
traveling in and out of the facility and communicate the facility status to a dynamic sign via a zone
controller, communication points, a gateway and a server. For example, if a facility has 1,000
spaces, when the facility is empty the counter is set at 1,000. Each time a car enters the facility
the count is reduced by one and each time a car exits the facility the count is increased by one,
thereby keeping a count of the number of available spaces.
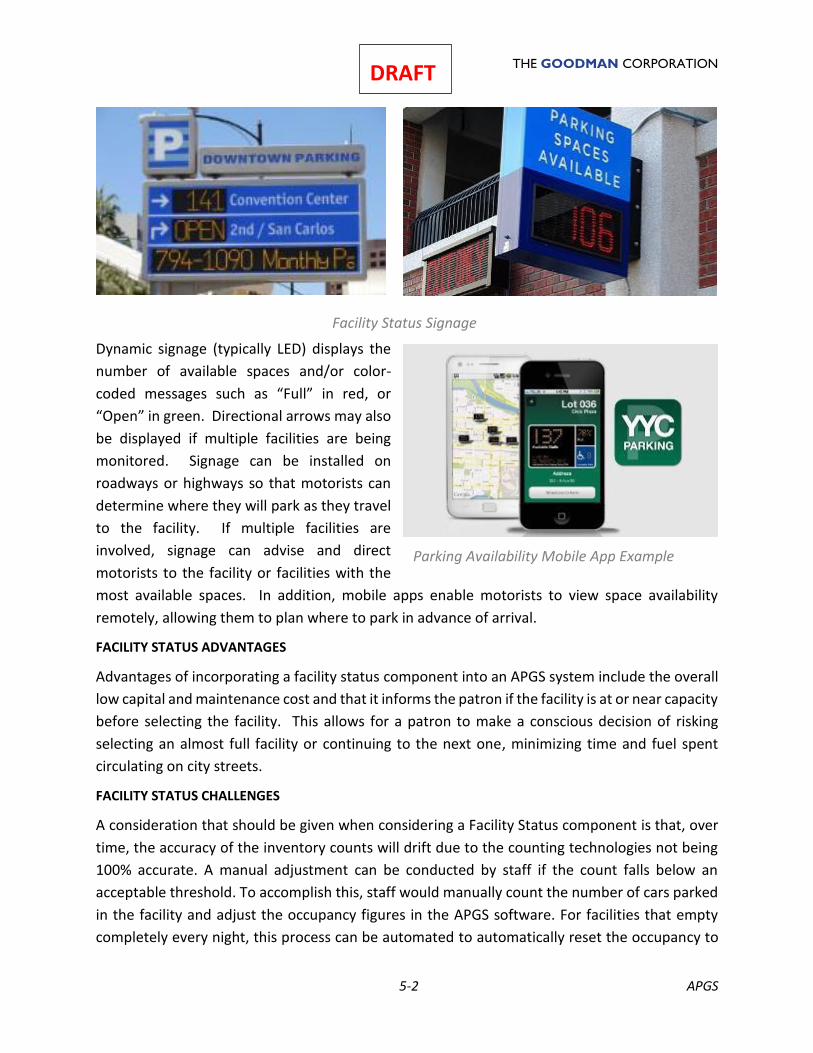
THE GOODMAN CORPORATION
5-2 APGS
DRAFT
Dynamic signage (typically LED) displays the
number of available spaces and/or color-
coded messages such as “Full” in red, or
“Open” in green. Directional arrows may also
be displayed if multiple facilities are being
monitored. Signage can be installed on
roadways or highways so that motorists can
determine where they will park as they travel
to the facility. If multiple facilities are
involved, signage can advise and direct
motorists to the facility or facilities with the
most available spaces. In addition, mobile apps enable motorists to view space availability
remotely, allowing them to plan where to park in advance of arrival.
FACILITY STATUS ADVANTAGES
Advantages of incorporating a facility status component into an APGS system include the overall
low capital and maintenance cost and that it informs the patron if the facility is at or near capacity
before selecting the facility. This allows for a patron to make a conscious decision of risking
selecting an almost full facility or continuing to the next one, minimizing time and fuel spent
circulating on city streets.
FACILITY STATUS CHALLENGES
A consideration that should be given when considering a Facility Status component is that, over
time, the accuracy of the inventory counts will drift due to the counting technologies not being
100% accurate. A manual adjustment can be conducted by staff if the count falls below an
acceptable threshold. To accomplish this, staff would manually count the number of cars parked
in the facility and adjust the occupancy figures in the APGS software. For facilities that empty
completely every night, this process can be automated to automatically reset the occupancy to
Facility Status Signage
Parking Availability Mobile App Example
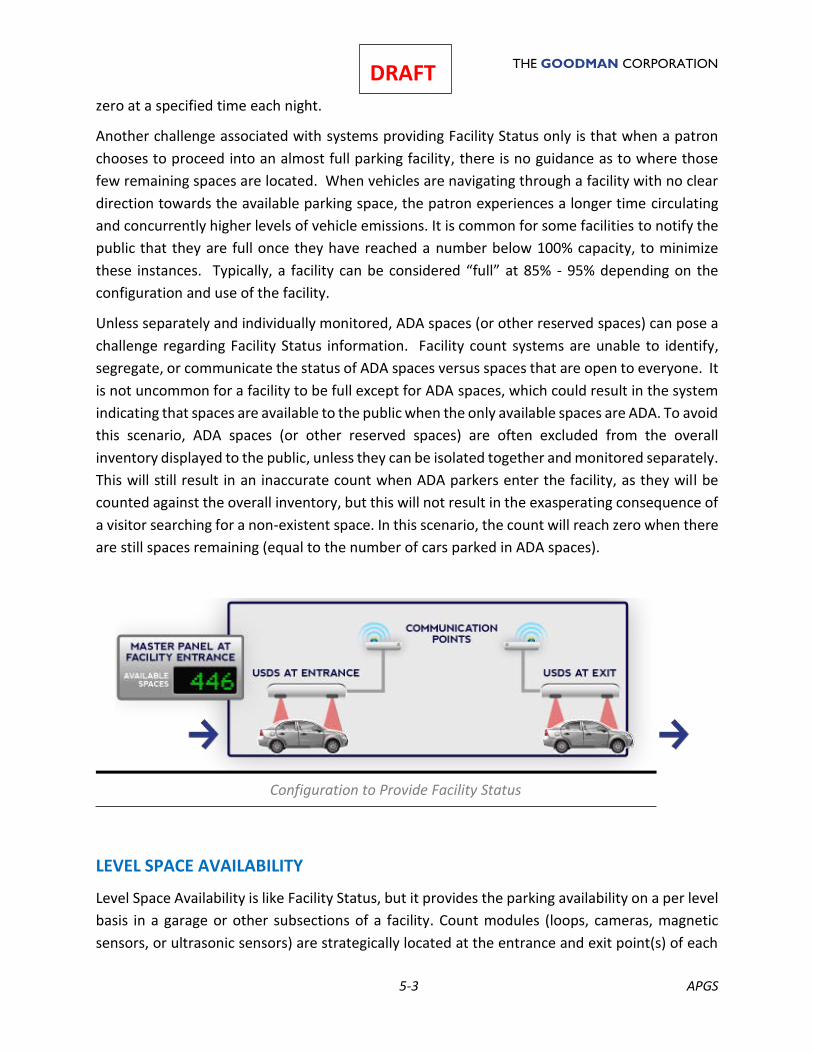
THE GOODMAN CORPORATION
5-3 APGS
DRAFT
zero at a specified time each night.
Another challenge associated with systems providing Facility Status only is that when a patron
chooses to proceed into an almost full parking facility, there is no guidance as to where those
few remaining spaces are located. When vehicles are navigating through a facility with no clear
direction towards the available parking space, the patron experiences a longer time circulating
and concurrently higher levels of vehicle emissions. It is common for some facilities to notify the
public that they are full once they have reached a number below 100% capacity, to minimize
these instances. Typically, a facility can be considered “full” at 85% - 95% depending on the
configuration and use of the facility.
Unless separately and individually monitored, ADA spaces (or other reserved spaces) can pose a
challenge regarding Facility Status information. Facility count systems are unable to identify,
segregate, or communicate the status of ADA spaces versus spaces that are open to everyone. It
is not uncommon for a facility to be full except for ADA spaces, which could result in the system
indicating that spaces are available to the public when the only available spaces are ADA. To avoid
this scenario, ADA spaces (or other reserved spaces) are often excluded from the overall
inventory displayed to the public, unless they can be isolated together and monitored separately.
This will still result in an inaccurate count when ADA parkers enter the facility, as they will be
counted against the overall inventory, but this will not result in the exasperating consequence of
a visitor searching for a non-existent space. In this scenario, the count will reach zero when there
are still spaces remaining (equal to the number of cars parked in ADA spaces).
LEVEL SPACE AVAILABILITY
Level Space Availability is like Facility Status, but it provides the parking availability on a per level
basis in a garage or other subsections of a facility. Count modules (loops, cameras, magnetic
sensors, or ultrasonic sensors) are strategically located at the entrance and exit point(s) of each
Configuration to Provide Facility Status
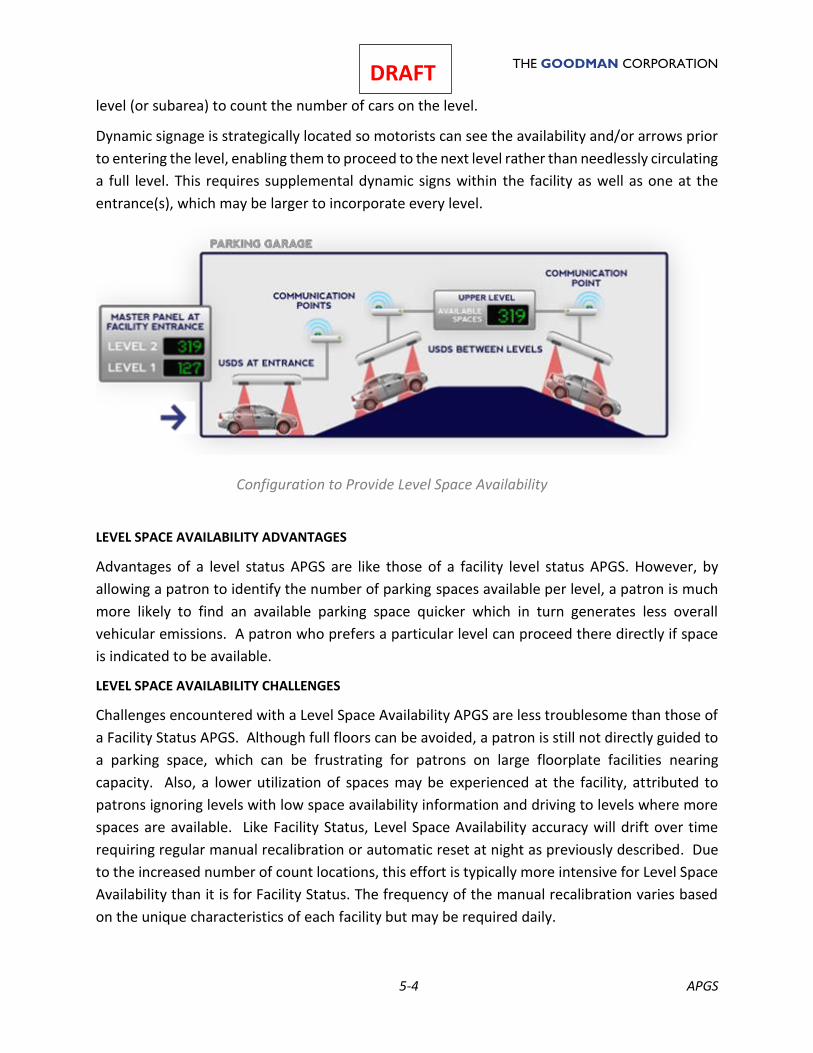
THE GOODMAN CORPORATION
5-4 APGS
DRAFT
level (or subarea) to count the number of cars on the level.
Dynamic signage is strategically located so motorists can see the availability and/or arrows prior
to entering the level, enabling them to proceed to the next level rather than needlessly circulating
a full level. This requires supplemental dynamic signs within the facility as well as one at the
entrance(s), which may be larger to incorporate every level.
LEVEL SPACE AVAILABILITY ADVANTAGES
Advantages of a level status APGS are like those of a facility level status APGS. However, by
allowing a patron to identify the number of parking spaces available per level, a patron is much
more likely to find an available parking space quicker which in turn generates less overall
vehicular emissions. A patron who prefers a particular level can proceed there directly if space
is indicated to be available.
LEVEL SPACE AVAILABILITY CHALLENGES
Challenges encountered with a Level Space Availability APGS are less troublesome than those of
a Facility Status APGS. Although full floors can be avoided, a patron is still not directly guided to
a parking space, which can be frustrating for patrons on large floorplate facilities nearing
capacity. Also, a lower utilization of spaces may be experienced at the facility, attributed to
patrons ignoring levels with low space availability information and driving to levels where more
spaces are available. Like Facility Status, Level Space Availability accuracy will drift over time
requiring regular manual recalibration or automatic reset at night as previously described. Due
to the increased number of count locations, this effort is typically more intensive for Level Space
Availability than it is for Facility Status. The frequency of the manual recalibration varies based
on the unique characteristics of each facility but may be required daily.
Configuration to Provide Level Space Availability
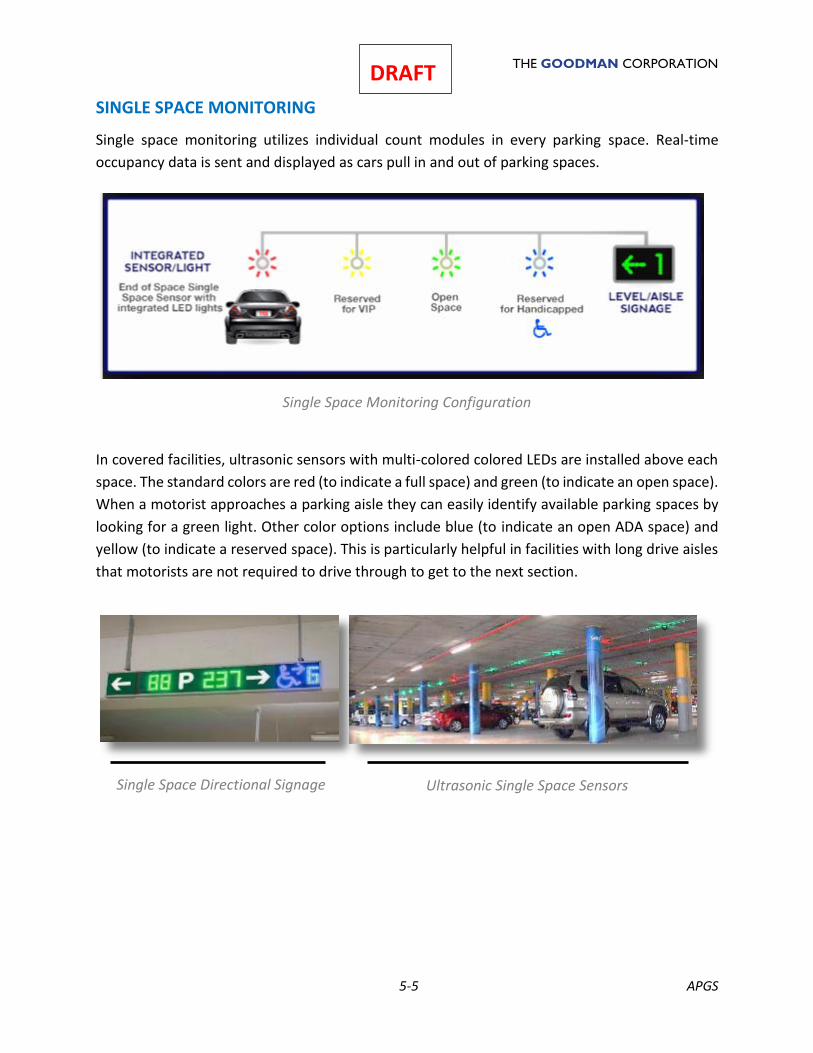
THE GOODMAN CORPORATION
5-5 APGS
DRAFT
SINGLE SPACE MONITORING
Single space monitoring utilizes individual count modules in every parking space. Real-time
occupancy data is sent and displayed as cars pull in and out of parking spaces.
In covered facilities, ultrasonic sensors with multi-colored colored LEDs are installed above each
space. The standard colors are red (to indicate a full space) and green (to indicate an open space).
When a motorist approaches a parking aisle they can easily identify available parking spaces by
looking for a green light. Other color options include blue (to indicate an open ADA space) and
yellow (to indicate a reserved space). This is particularly helpful in facilities with long drive aisles
that motorists are not required to drive through to get to the next section.
Single Space Directional Signage Ultrasonic Single Space Sensors
Single Space Monitoring Configuration
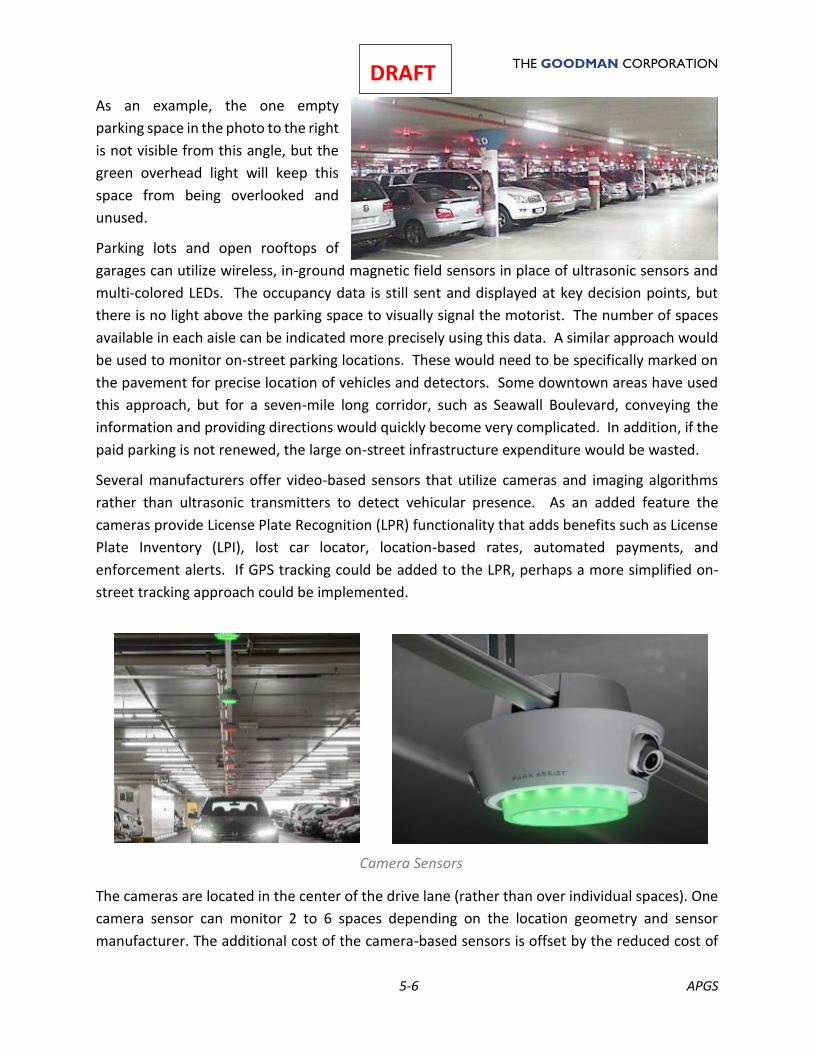
THE GOODMAN CORPORATION
5-6 APGS
DRAFT
As an example, the one empty
parking space in the photo to the right
is not visible from this angle, but the
green overhead light will keep this
space from being overlooked and
unused.
Parking lots and open rooftops of
garages can utilize wireless, in-ground magnetic field sensors in place of ultrasonic sensors and
multi-colored LEDs. The occupancy data is still sent and displayed at key decision points, but
there is no light above the parking space to visually signal the motorist. The number of spaces
available in each aisle can be indicated more precisely using this data. A similar approach would
be used to monitor on-street parking locations. These would need to be specifically marked on
the pavement for precise location of vehicles and detectors. Some downtown areas have used
this approach, but for a seven-mile long corridor, such as Seawall Boulevard, conveying the
information and providing directions would quickly become very complicated. In addition, if the
paid parking is not renewed, the large on-street infrastructure expenditure would be wasted.
Several manufacturers offer video-based sensors that utilize cameras and imaging algorithms
rather than ultrasonic transmitters to detect vehicular presence. As an added feature the
cameras provide License Plate Recognition (LPR) functionality that adds benefits such as License
Plate Inventory (LPI), lost car locator, location-based rates, automated payments, and
enforcement alerts. If GPS tracking could be added to the LPR, perhaps a more simplified on-
street tracking approach could be implemented.
The cameras are located in the center of the drive lane (rather than over individual spaces). One
camera sensor can monitor 2 to 6 spaces depending on the location geometry and sensor
manufacturer. The additional cost of the camera-based sensors is offset by the reduced cost of
Camera Sensors
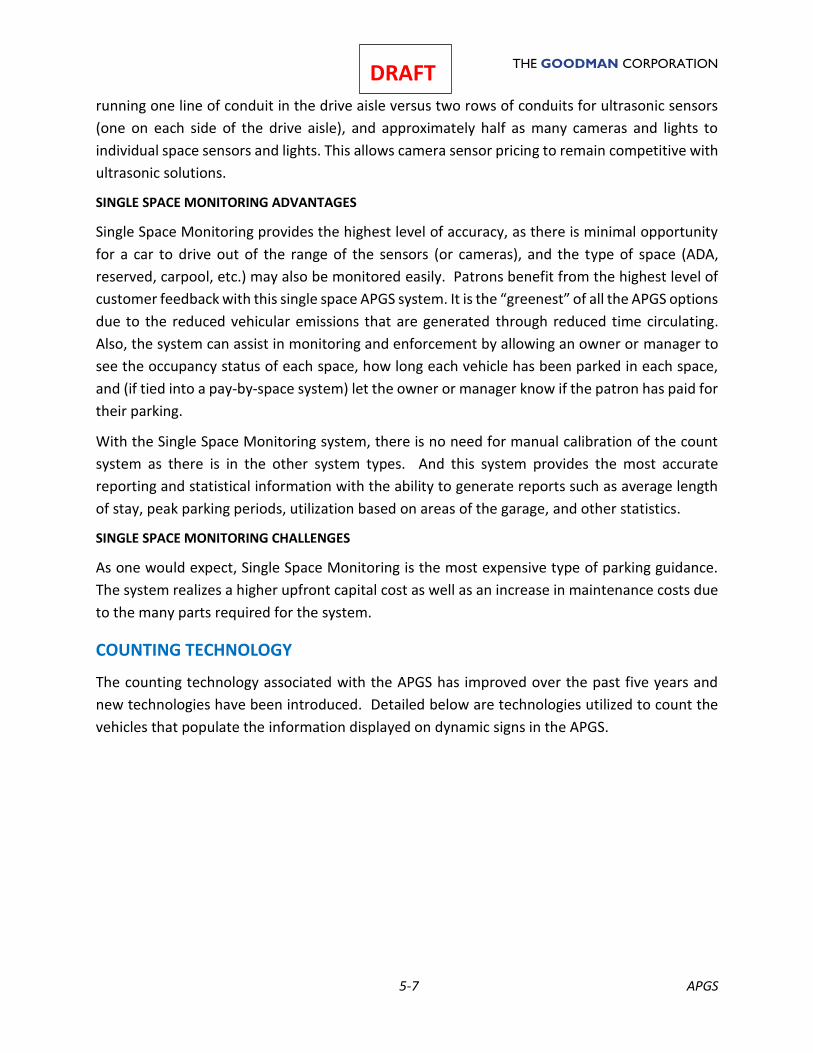
THE GOODMAN CORPORATION
5-7 APGS
DRAFT
running one line of conduit in the drive aisle versus two rows of conduits for ultrasonic sensors
(one on each side of the drive aisle), and approximately half as many cameras and lights to
individual space sensors and lights. This allows camera sensor pricing to remain competitive with
ultrasonic solutions.
SINGLE SPACE MONITORING ADVANTAGES
Single Space Monitoring provides the highest level of accuracy, as there is minimal opportunity
for a car to drive out of the range of the sensors (or cameras), and the type of space (ADA,
reserved, carpool, etc.) may also be monitored easily. Patrons benefit from the highest level of
customer feedback with this single space APGS system. It is the “greenest” of all the APGS options
due to the reduced vehicular emissions that are generated through reduced time circulating.
Also, the system can assist in monitoring and enforcement by allowing an owner or manager to
see the occupancy status of each space, how long each vehicle has been parked in each space,
and (if tied into a pay-by-space system) let the owner or manager know if the patron has paid for
their parking.
With the Single Space Monitoring system, there is no need for manual calibration of the count
system as there is in the other system types. And this system provides the most accurate
reporting and statistical information with the ability to generate reports such as average length
of stay, peak parking periods, utilization based on areas of the garage, and other statistics.
SINGLE SPACE MONITORING CHALLENGES
As one would expect, Single Space Monitoring is the most expensive type of parking guidance.
The system realizes a higher upfront capital cost as well as an increase in maintenance costs due
to the many parts required for the system.
COUNTING TECHNOLOGY
The counting technology associated with the APGS has improved over the past five years and
new technologies have been introduced. Detailed below are technologies utilized to count the
vehicles that populate the information displayed on dynamic signs in the APGS.
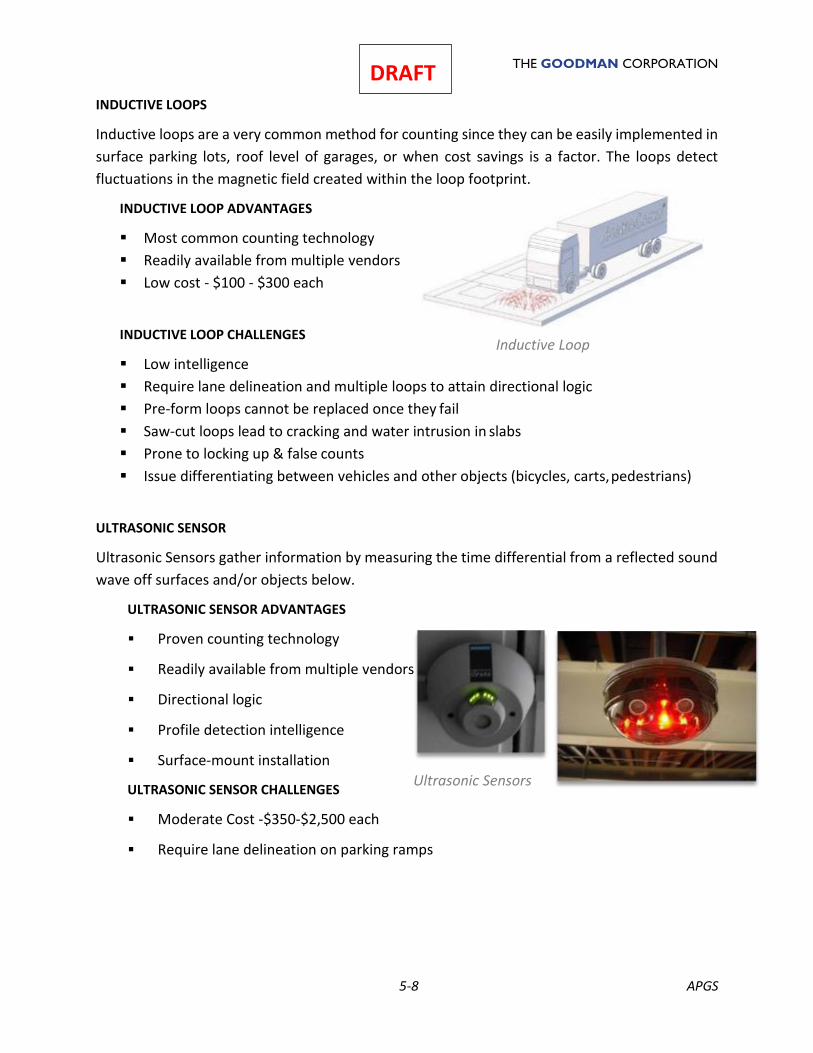
THE GOODMAN CORPORATION
5-8 APGS
DRAFT INDUCTIVE LOOPS
Inductive loops are a very common method for counting since they can be easily implemented in
surface parking lots, roof level of garages, or when cost savings is a factor. The loops detect
fluctuations in the magnetic field created within the loop footprint.
INDUCTIVE LOOP ADVANTAGES
▪ Most common counting technology
▪ Readily available from multiple vendors
▪ Low cost - $100 - $300 each
INDUCTIVE LOOP CHALLENGES
▪ Low intelligence
▪ Require lane delineation and multiple loops to attain directional logic
▪ Pre-form loops cannot be replaced once they fail
▪ Saw-cut loops lead to cracking and water intrusion in slabs
▪ Prone to locking up & false counts
▪ Issue differentiating between vehicles and other objects (bicycles, carts, pedestrians)
ULTRASONIC SENSOR
Ultrasonic Sensors gather information by measuring the time differential from a reflected sound
wave off surfaces and/or objects below.
ULTRASONIC SENSOR ADVANTAGES
▪ Proven counting technology
▪ Readily available from multiple vendors
▪ Directional logic
▪ Profile detection intelligence
▪ Surface-mount installation
ULTRASONIC SENSOR CHALLENGES
▪ Moderate Cost -$350-$2,500 each
▪ Require lane delineation on parking ramps
Inductive Loop
Ultrasonic Sensors
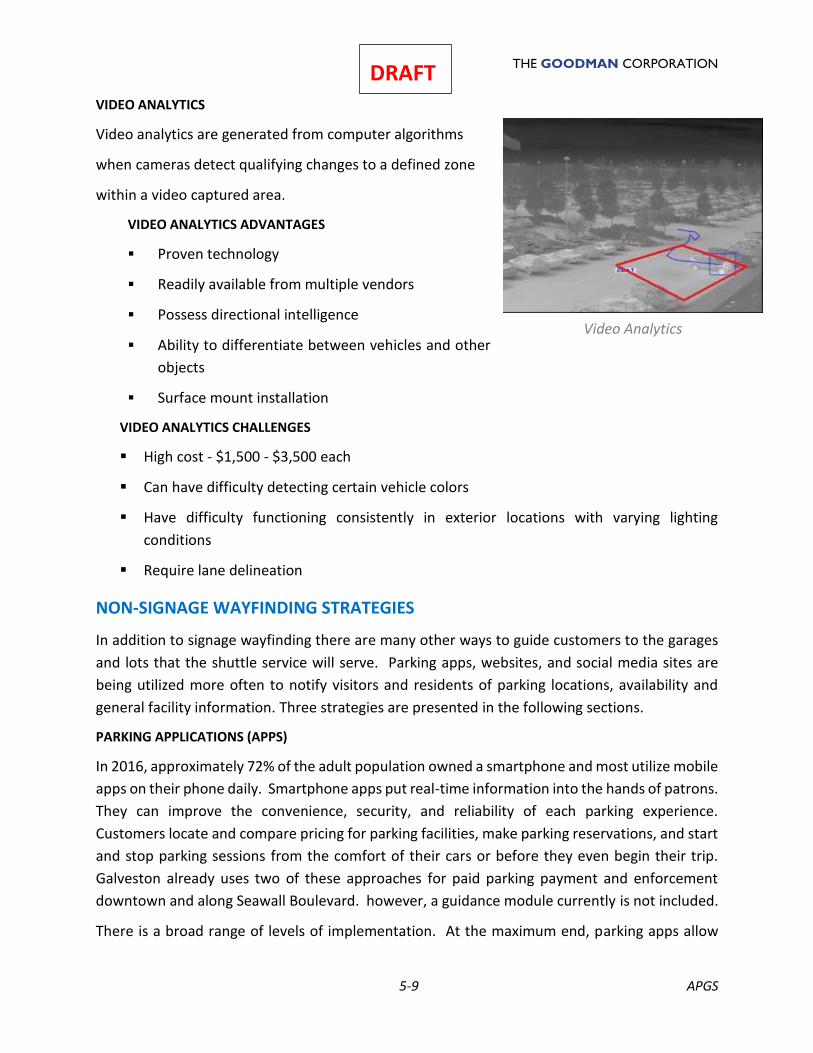
THE GOODMAN CORPORATION
5-9 APGS
DRAFT VIDEO ANALYTICS
Video analytics are generated from computer algorithms
when cameras detect qualifying changes to a defined zone
within a video captured area.
VIDEO ANALYTICS ADVANTAGES
▪ Proven technology
▪ Readily available from multiple vendors
▪ Possess directional intelligence
▪ Ability to differentiate between vehicles and other
objects
▪ Surface mount installation
VIDEO ANALYTICS CHALLENGES
▪ High cost - $1,500 - $3,500 each
▪ Can have difficulty detecting certain vehicle colors
▪ Have difficulty functioning consistently in exterior locations with varying lighting
conditions
▪ Require lane delineation
NON-SIGNAGE WAYFINDING STRATEGIES
In addition to signage wayfinding there are many other ways to guide customers to the garages
and lots that the shuttle service will serve. Parking apps, websites, and social media sites are
being utilized more often to notify visitors and residents of parking locations, availability and
general facility information. Three strategies are presented in the following sections.
PARKING APPLICATIONS (APPS)
In 2016, approximately 72% of the adult population owned a smartphone and most utilize mobile
apps on their phone daily. Smartphone apps put real-time information into the hands of patrons.
They can improve the convenience, security, and reliability of each parking experience.
Customers locate and compare pricing for parking facilities, make parking reservations, and start
and stop parking sessions from the comfort of their cars or before they even begin their trip.
Galveston already uses two of these approaches for paid parking payment and enforcement
downtown and along Seawall Boulevard. however, a guidance module currently is not included.
There is a broad range of levels of implementation. At the maximum end, parking apps allow
Video Analytics
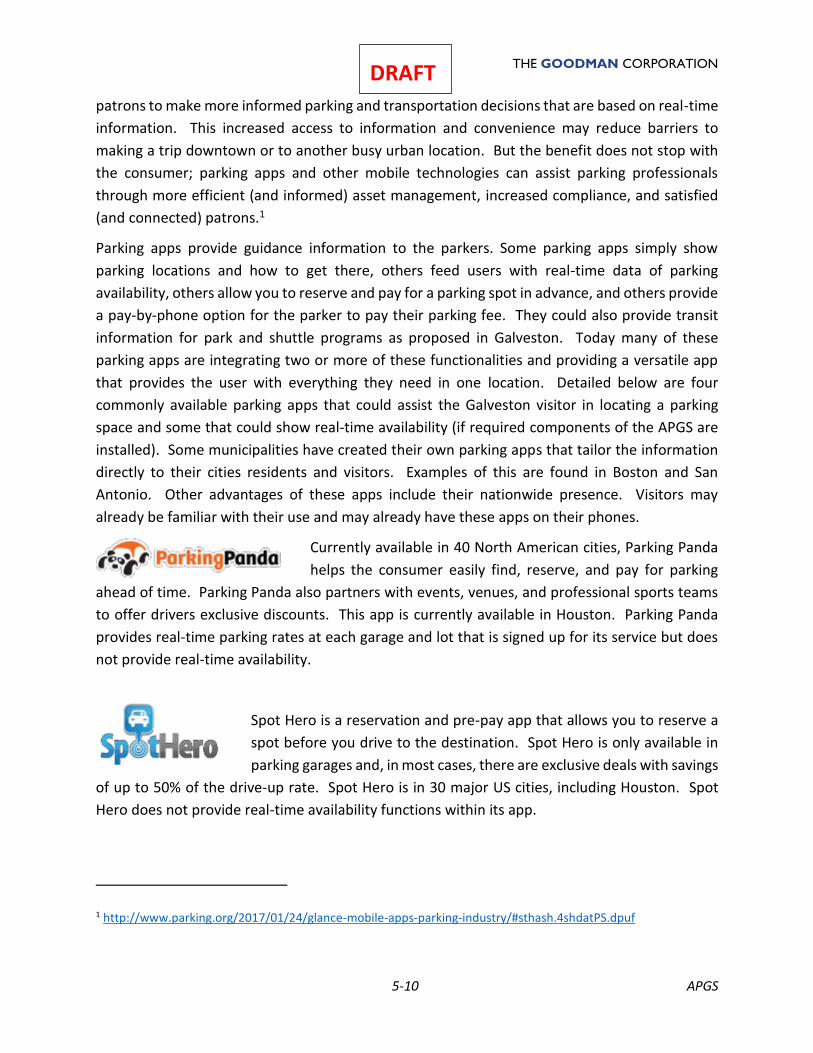
THE GOODMAN CORPORATION
5-10 APGS
DRAFT
patrons to make more informed parking and transportation decisions that are based on real-time
information. This increased access to information and convenience may reduce barriers to
making a trip downtown or to another busy urban location. But the benefit does not stop with
the consumer; parking apps and other mobile technologies can assist parking professionals
through more efficient (and informed) asset management, increased compliance, and satisfied
(and connected) patrons.1
Parking apps provide guidance information to the parkers. Some parking apps simply show
parking locations and how to get there, others feed users with real-time data of parking
availability, others allow you to reserve and pay for a parking spot in advance, and others provide
a pay-by-phone option for the parker to pay their parking fee. They could also provide transit
information for park and shuttle programs as proposed in Galveston. Today many of these
parking apps are integrating two or more of these functionalities and providing a versatile app
that provides the user with everything they need in one location. Detailed below are four
commonly available parking apps that could assist the Galveston visitor in locating a parking
space and some that could show real-time availability (if required components of the APGS are
installed). Some municipalities have created their own parking apps that tailor the information
directly to their cities residents and visitors. Examples of this are found in Boston and San
Antonio. Other advantages of these apps include their nationwide presence. Visitors may
already be familiar with their use and may already have these apps on their phones.
Currently available in 40 North American cities, Parking Panda
helps the consumer easily find, reserve, and pay for parking
ahead of time. Parking Panda also partners with events, venues, and professional sports teams
to offer drivers exclusive discounts. This app is currently available in Houston. Parking Panda
provides real-time parking rates at each garage and lot that is signed up for its service but does
not provide real-time availability.
Spot Hero is a reservation and pre-pay app that allows you to reserve a
spot before you drive to the destination. Spot Hero is only available in
parking garages and, in most cases, there are exclusive deals with savings
of up to 50% of the drive-up rate. Spot Hero is in 30 major US cities, including Houston. Spot
Hero does not provide real-time availability functions within its app.
1 http://www.parking.org/2017/01/24/glance-mobile-apps-parking-industry/#sthash.4shdatPS.dpuf
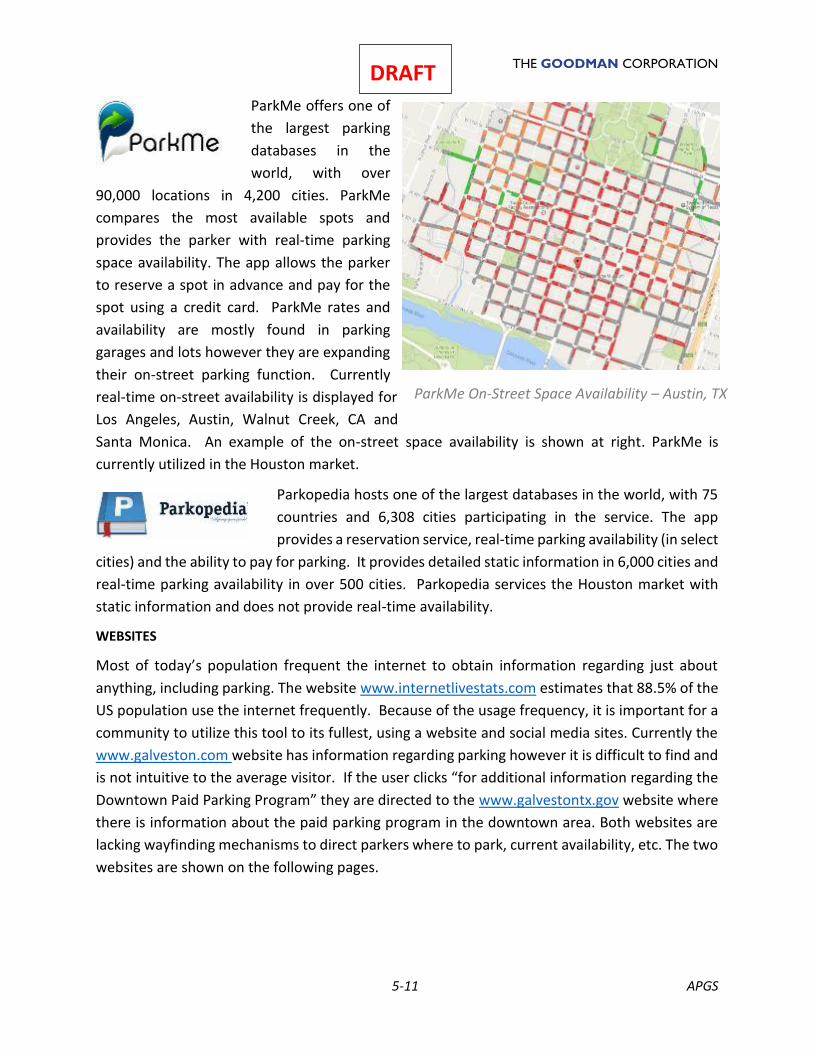
THE GOODMAN CORPORATION
5-11 APGS
DRAFT
ParkMe offers one of
the largest parking
databases in the
world, with over
90,000 locations in 4,200 cities. ParkMe
compares the most available spots and
provides the parker with real-time parking
space availability. The app allows the parker
to reserve a spot in advance and pay for the
spot using a credit card. ParkMe rates and
availability are mostly found in parking
garages and lots however they are expanding
their on-street parking function. Currently
real-time on-street availability is displayed for
Los Angeles, Austin, Walnut Creek, CA and
Santa Monica. An example of the on-street space availability is shown at right. ParkMe is
currently utilized in the Houston market.
Parkopedia hosts one of the largest databases in the world, with 75
countries and 6,308 cities participating in the service. The app
provides a reservation service, real-time parking availability (in select
cities) and the ability to pay for parking. It provides detailed static information in 6,000 cities and
real-time parking availability in over 500 cities. Parkopedia services the Houston market with
static information and does not provide real-time availability.
WEBSITES
Most of today’s population frequent the internet to obtain information regarding just about
anything, including parking. The website www.internetlivestats.com estimates that 88.5% of the
US population use the internet frequently. Because of the usage frequency, it is important for a
community to utilize this tool to its fullest, using a website and social media sites. Currently the
www.galveston.com website has information regarding parking however it is difficult to find and
is not intuitive to the average visitor. If the user clicks “for additional information regarding the
Downtown Paid Parking Program” they are directed to the www.galvestontx.gov website where
there is information about the paid parking program in the downtown area. Both websites are
lacking wayfinding mechanisms to direct parkers where to park, current availability, etc. The two
websites are shown on the following pages.
ParkMe On-Street Space Availability – Austin, TX
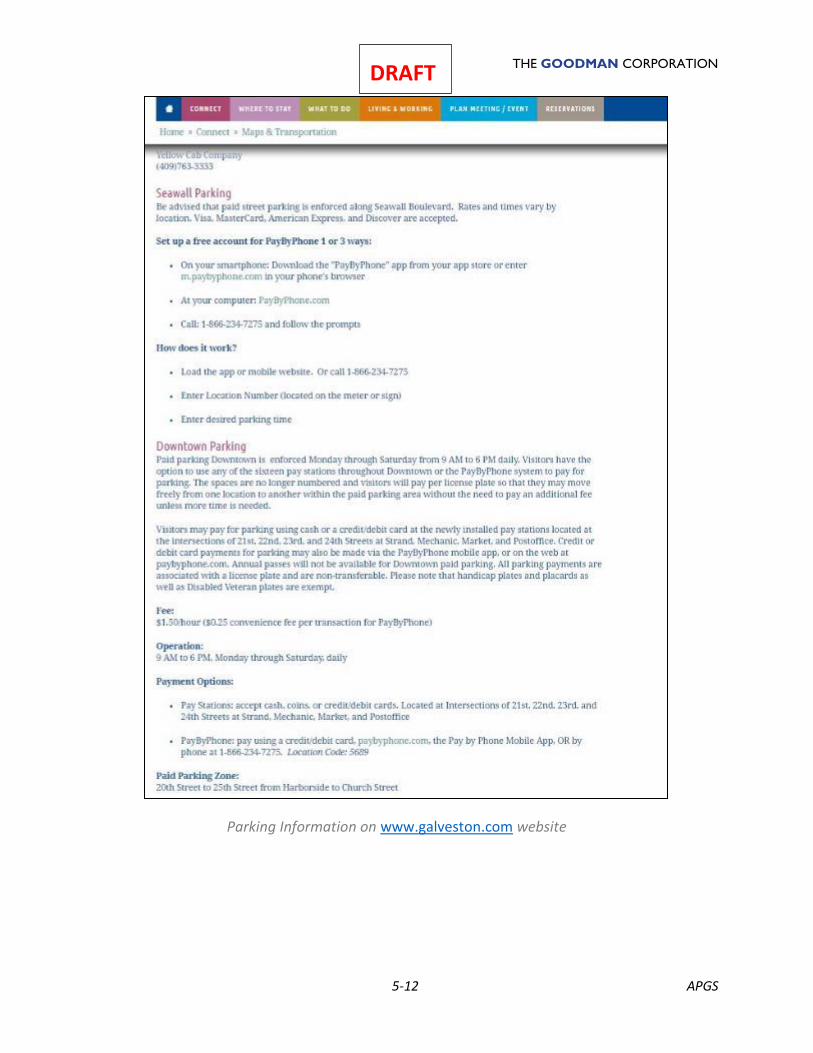
THE GOODMAN CORPORATION
5-12 APGS
DRAFT
Parking Information on www.galveston.com website
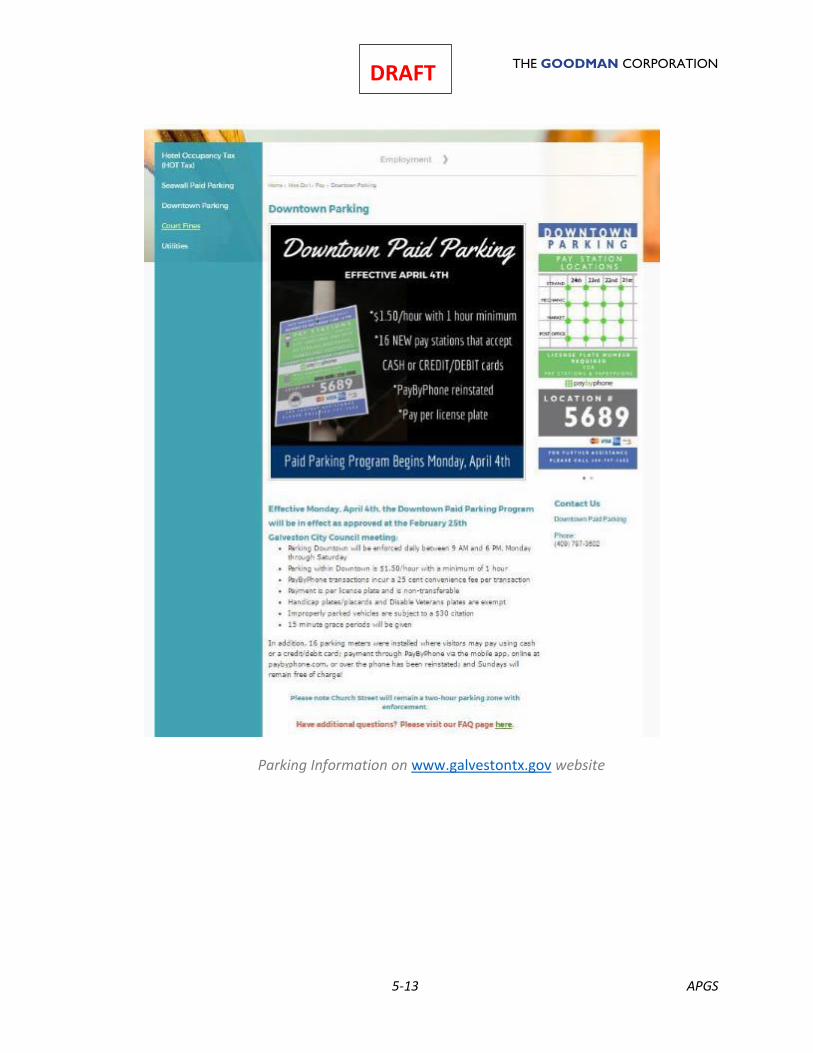
THE GOODMAN CORPORATION
5-13 APGS
DRAFT
Parking Information on www.galvestontx.gov website
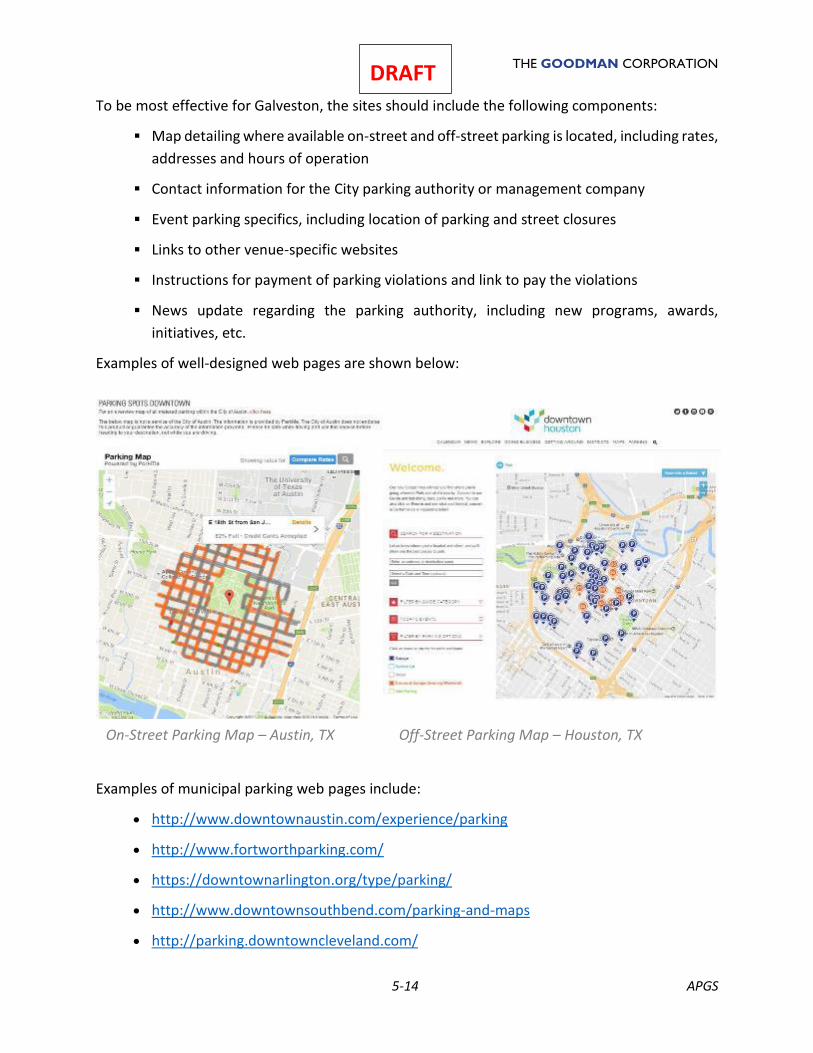
THE GOODMAN CORPORATION
5-14 APGS
DRAFT
To be most effective for Galveston, the sites should include the following components:
▪ Map detailing where available on-street and off-street parking is located, including rates,
addresses and hours of operation
▪ Contact information for the City parking authority or management company
▪ Event parking specifics, including location of parking and street closures
▪ Links to other venue-specific websites
▪ Instructions for payment of parking violations and link to pay the violations
▪ News update regarding the parking authority, including new programs, awards,
initiatives, etc.
Examples of well-designed web pages are shown below:
Examples of municipal parking web pages include:
• http://www.downtownaustin.com/experience/parking
• http://www.fortworthparking.com/
• https://downtownarlington.org/type/parking/
• http://www.downtownsouthbend.com/parking-and-maps
• http://parking.downtowncleveland.com/
On-Street Parking Map – Austin, TX Off-Street Parking Map – Houston, TX
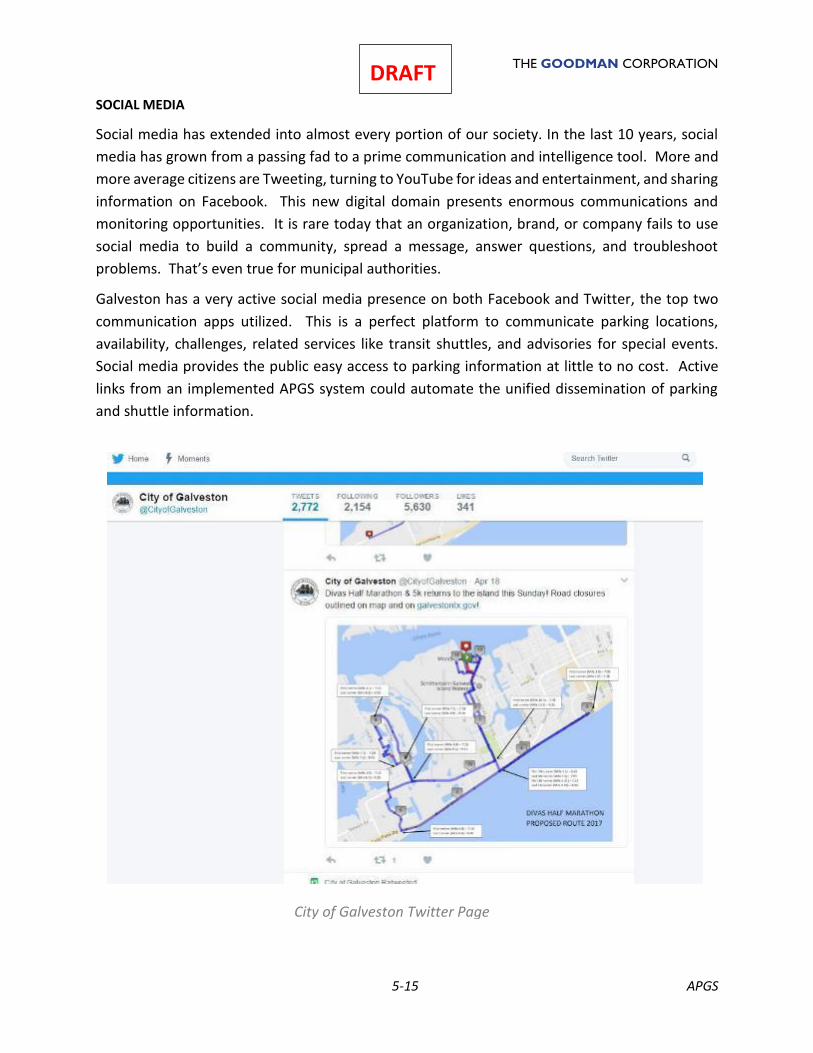
THE GOODMAN CORPORATION
5-15 APGS
DRAFT SOCIAL MEDIA
Social media has extended into almost every portion of our society. In the last 10 years, social
media has grown from a passing fad to a prime communication and intelligence tool. More and
more average citizens are Tweeting, turning to YouTube for ideas and entertainment, and sharing
information on Facebook. This new digital domain presents enormous communications and
monitoring opportunities. It is rare today that an organization, brand, or company fails to use
social media to build a community, spread a message, answer questions, and troubleshoot
problems. That’s even true for municipal authorities.
Galveston has a very active social media presence on both Facebook and Twitter, the top two
communication apps utilized. This is a perfect platform to communicate parking locations,
availability, challenges, related services like transit shuttles, and advisories for special events.
Social media provides the public easy access to parking information at little to no cost. Active
links from an implemented APGS system could automate the unified dissemination of parking
and shuttle information.
City of Galveston Twitter Page
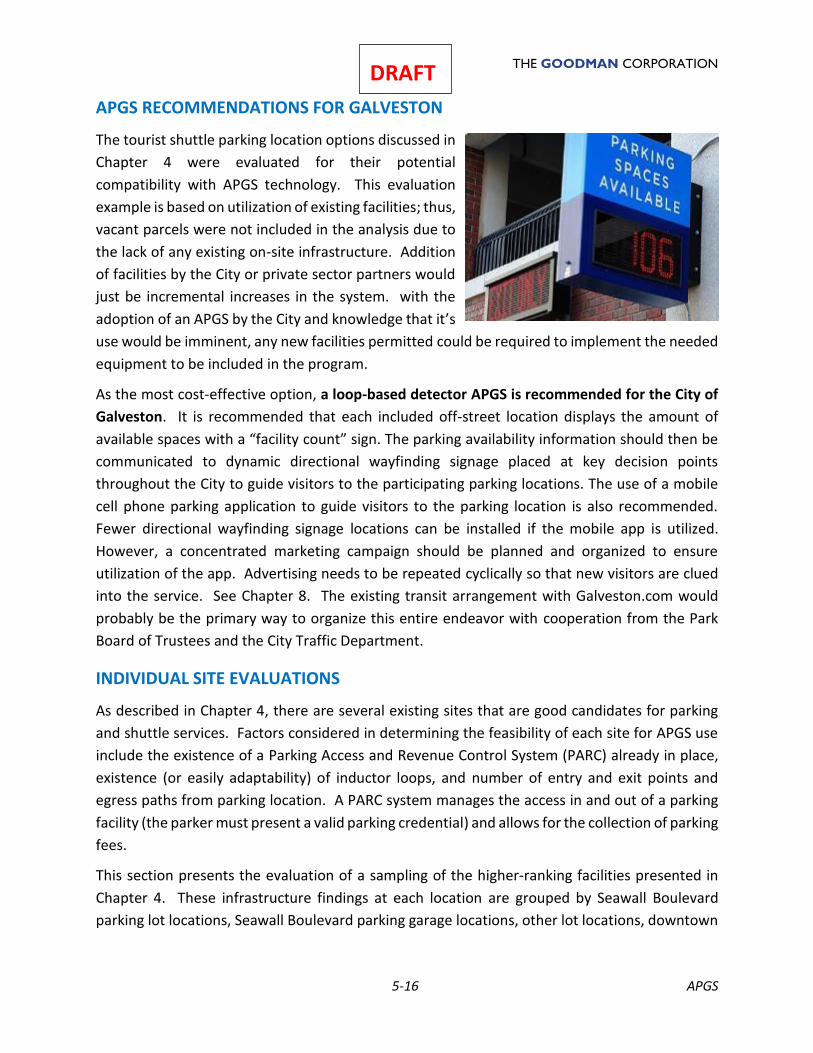
THE GOODMAN CORPORATION
5-16 APGS
DRAFT
APGS RECOMMENDATIONS FOR GALVESTON
The tourist shuttle parking location options discussed in
Chapter 4 were evaluated for their potential
compatibility with APGS technology. This evaluation
example is based on utilization of existing facilities; thus,
vacant parcels were not included in the analysis due to
the lack of any existing on-site infrastructure. Addition
of facilities by the City or private sector partners would
just be incremental increases in the system. with the
adoption of an APGS by the City and knowledge that it’s
use would be imminent, any new facilities permitted could be required to implement the needed
equipment to be included in the program.
As the most cost-effective option, a loop-based detector APGS is recommended for the City of
Galveston. It is recommended that each included off-street location displays the amount of
available spaces with a “facility count” sign. The parking availability information should then be
communicated to dynamic directional wayfinding signage placed at key decision points
throughout the City to guide visitors to the participating parking locations. The use of a mobile
cell phone parking application to guide visitors to the parking location is also recommended.
Fewer directional wayfinding signage locations can be installed if the mobile app is utilized.
However, a concentrated marketing campaign should be planned and organized to ensure
utilization of the app. Advertising needs to be repeated cyclically so that new visitors are clued
into the service. See Chapter 8. The existing transit arrangement with Galveston.com would
probably be the primary way to organize this entire endeavor with cooperation from the Park
Board of Trustees and the City Traffic Department.
INDIVIDUAL SITE EVALUATIONS
As described in Chapter 4, there are several existing sites that are good candidates for parking
and shuttle services. Factors considered in determining the feasibility of each site for APGS use
include the existence of a Parking Access and Revenue Control System (PARC) already in place,
existence (or easily adaptability) of inductor loops, and number of entry and exit points and
egress paths from parking location. A PARC system manages the access in and out of a parking
facility (the parker must present a valid parking credential) and allows for the collection of parking
fees.
This section presents the evaluation of a sampling of the higher-ranking facilities presented in
Chapter 4. These infrastructure findings at each location are grouped by Seawall Boulevard
parking lot locations, Seawall Boulevard parking garage locations, other lot locations, downtown
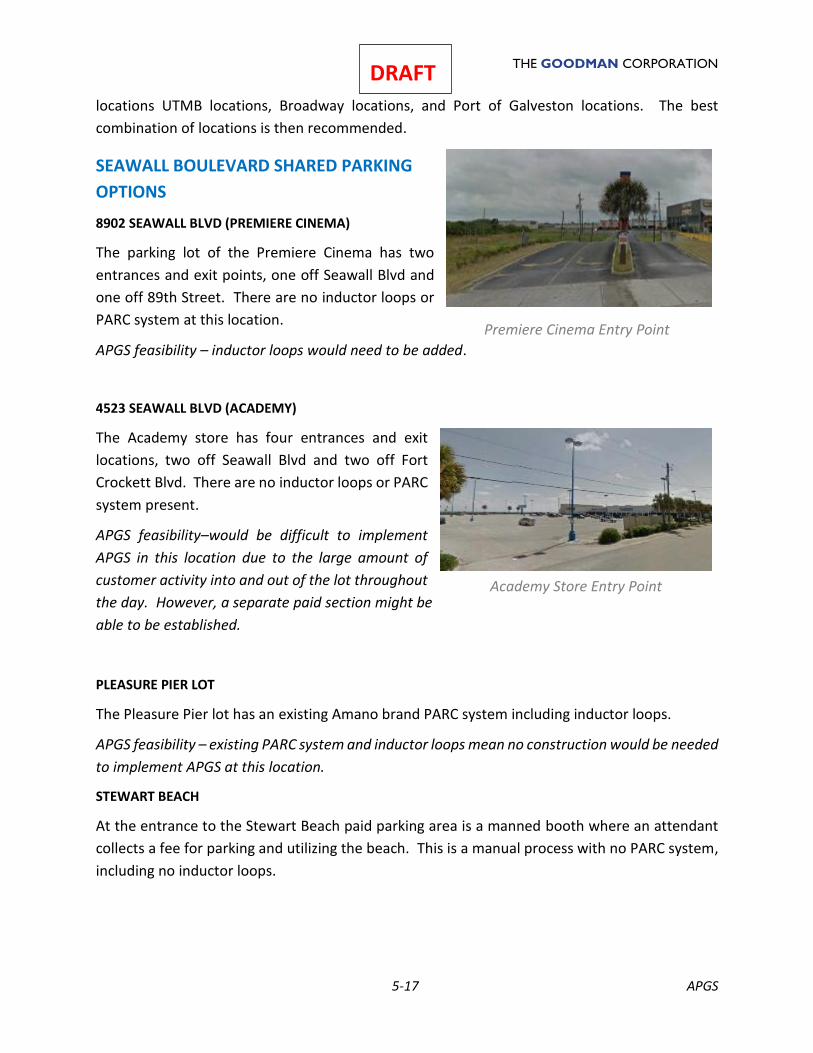
THE GOODMAN CORPORATION
5-17 APGS
DRAFT
locations UTMB locations, Broadway locations, and Port of Galveston locations. The best
combination of locations is then recommended.
SEAWALL BOULEVARD SHARED PARKING
OPTIONS
8902 SEAWALL BLVD (PREMIERE CINEMA)
The parking lot of the Premiere Cinema has two
entrances and exit points, one off Seawall Blvd and
one off 89th Street. There are no inductor loops or
PARC system at this location.
APGS feasibility – inductor loops would need to be added.
4523 SEAWALL BLVD (ACADEMY)
The Academy store has four entrances and exit
locations, two off Seawall Blvd and two off Fort
Crockett Blvd. There are no inductor loops or PARC
system present.
APGS feasibility–would be difficult to implement
APGS in this location due to the large amount of
customer activity into and out of the lot throughout
the day. However, a separate paid section might be
able to be established.
PLEASURE PIER LOT
The Pleasure Pier lot has an existing Amano brand PARC system including inductor loops.
APGS feasibility – existing PARC system and inductor loops mean no construction would be needed
to implement APGS at this location.
STEWART BEACH
At the entrance to the Stewart Beach paid parking area is a manned booth where an attendant
collects a fee for parking and utilizing the beach. This is a manual process with no PARC system,
including no inductor loops.
Premiere Cinema Entry Point
Academy Store Entry Point
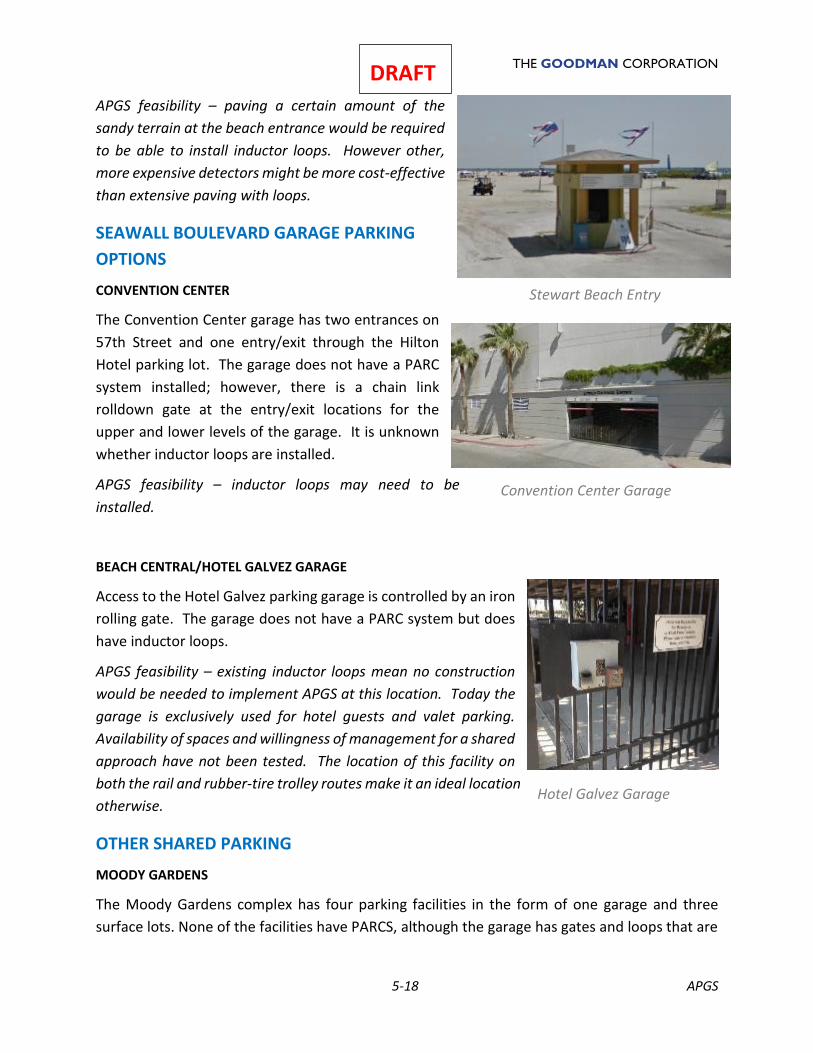
THE GOODMAN CORPORATION
5-18 APGS
DRAFT
APGS feasibility – paving a certain amount of the
sandy terrain at the beach entrance would be required
to be able to install inductor loops. However other,
more expensive detectors might be more cost-effective
than extensive paving with loops.
SEAWALL BOULEVARD GARAGE PARKING
OPTIONS
CONVENTION CENTER
The Convention Center garage has two entrances on
57th Street and one entry/exit through the Hilton
Hotel parking lot. The garage does not have a PARC
system installed; however, there is a chain link
rolldown gate at the entry/exit locations for the
upper and lower levels of the garage. It is unknown
whether inductor loops are installed.
APGS feasibility – inductor loops may need to be
installed.
BEACH CENTRAL/HOTEL GALVEZ GARAGE
Access to the Hotel Galvez parking garage is controlled by an iron
rolling gate. The garage does not have a PARC system but does
have inductor loops.
APGS feasibility – existing inductor loops mean no construction
would be needed to implement APGS at this location. Today the
garage is exclusively used for hotel guests and valet parking.
Availability of spaces and willingness of management for a shared
approach have not been tested. The location of this facility on
both the rail and rubber-tire trolley routes make it an ideal location
otherwise.
OTHER SHARED PARKING
MOODY GARDENS
The Moody Gardens complex has four parking facilities in the form of one garage and three
surface lots. None of the facilities have PARCS, although the garage has gates and loops that are
Stewart Beach Entry
Convention Center Garage
Hotel Galvez Garage
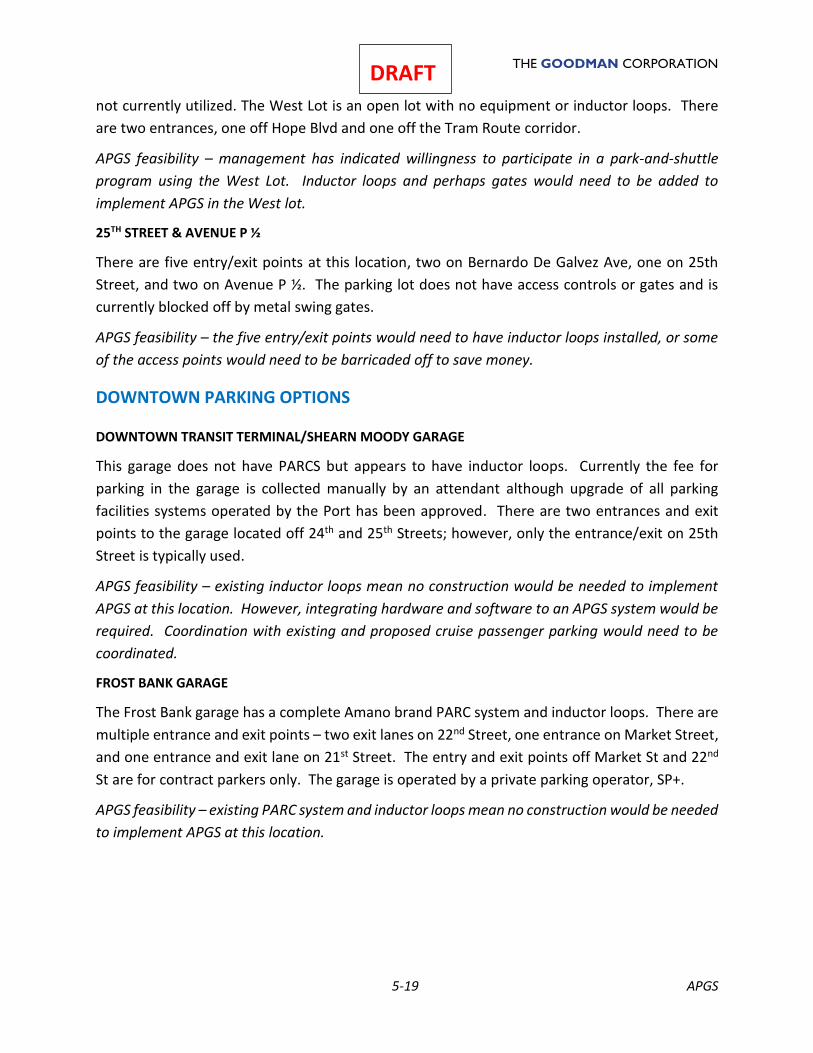
THE GOODMAN CORPORATION
5-19 APGS
DRAFT
not currently utilized. The West Lot is an open lot with no equipment or inductor loops. There
are two entrances, one off Hope Blvd and one off the Tram Route corridor.
APGS feasibility – management has indicated willingness to participate in a park-and-shuttle
program using the West Lot. Inductor loops and perhaps gates would need to be added to
implement APGS in the West lot.
25TH STREET & AVENUE P ½
There are five entry/exit points at this location, two on Bernardo De Galvez Ave, one on 25th
Street, and two on Avenue P ½. The parking lot does not have access controls or gates and is
currently blocked off by metal swing gates.
APGS feasibility – the five entry/exit points would need to have inductor loops installed, or some
of the access points would need to be barricaded off to save money.
DOWNTOWN PARKING OPTIONS
DOWNTOWN TRANSIT TERMINAL/SHEARN MOODY GARAGE
This garage does not have PARCS but appears to have inductor loops. Currently the fee for
parking in the garage is collected manually by an attendant although upgrade of all parking
facilities systems operated by the Port has been approved. There are two entrances and exit
points to the garage located off 24th and 25th Streets; however, only the entrance/exit on 25th
Street is typically used.
APGS feasibility – existing inductor loops mean no construction would be needed to implement
APGS at this location. However, integrating hardware and software to an APGS system would be
required. Coordination with existing and proposed cruise passenger parking would need to be
coordinated.
FROST BANK GARAGE
The Frost Bank garage has a complete Amano brand PARC system and inductor loops. There are
multiple entrance and exit points – two exit lanes on 22nd Street, one entrance on Market Street,
and one entrance and exit lane on 21st Street. The entry and exit points off Market St and 22nd
St are for contract parkers only. The garage is operated by a private parking operator, SP+.
APGS feasibility – existing PARC system and inductor loops mean no construction would be needed
to implement APGS at this location.
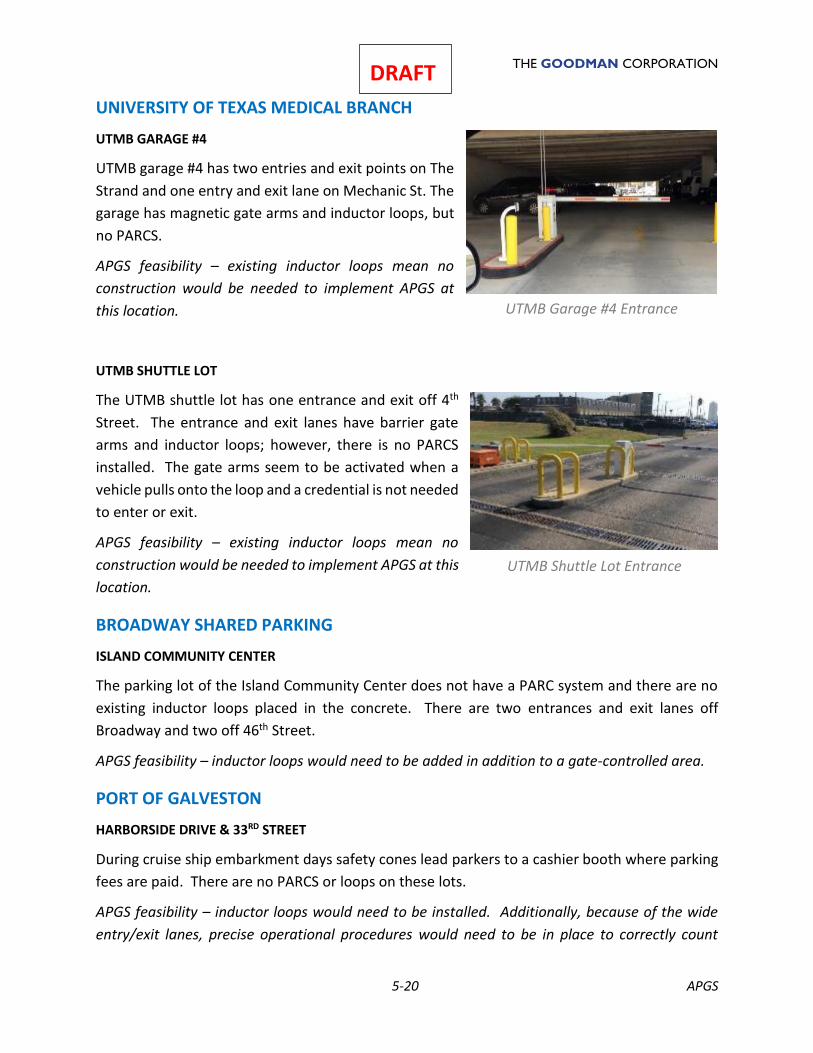
THE GOODMAN CORPORATION
5-20 APGS
DRAFT
UNIVERSITY OF TEXAS MEDICAL BRANCH
UTMB GARAGE #4
UTMB garage #4 has two entries and exit points on The
Strand and one entry and exit lane on Mechanic St. The
garage has magnetic gate arms and inductor loops, but
no PARCS.
APGS feasibility – existing inductor loops mean no
construction would be needed to implement APGS at
this location.
UTMB SHUTTLE LOT
The UTMB shuttle lot has one entrance and exit off 4th
Street. The entrance and exit lanes have barrier gate
arms and inductor loops; however, there is no PARCS
installed. The gate arms seem to be activated when a
vehicle pulls onto the loop and a credential is not needed
to enter or exit.
APGS feasibility – existing inductor loops mean no
construction would be needed to implement APGS at this
location.
BROADWAY SHARED PARKING
ISLAND COMMUNITY CENTER
The parking lot of the Island Community Center does not have a PARC system and there are no
existing inductor loops placed in the concrete. There are two entrances and exit lanes off
Broadway and two off 46th Street.
APGS feasibility – inductor loops would need to be added in addition to a gate-controlled area.
PORT OF GALVESTON
HARBORSIDE DRIVE & 33RD STREET
During cruise ship embarkment days safety cones lead parkers to a cashier booth where parking
fees are paid. There are no PARCS or loops on these lots.
APGS feasibility – inductor loops would need to be installed. Additionally, because of the wide
entry/exit lanes, precise operational procedures would need to be in place to correctly count
UTMB Garage #4 Entrance
UTMB Shuttle Lot Entrance
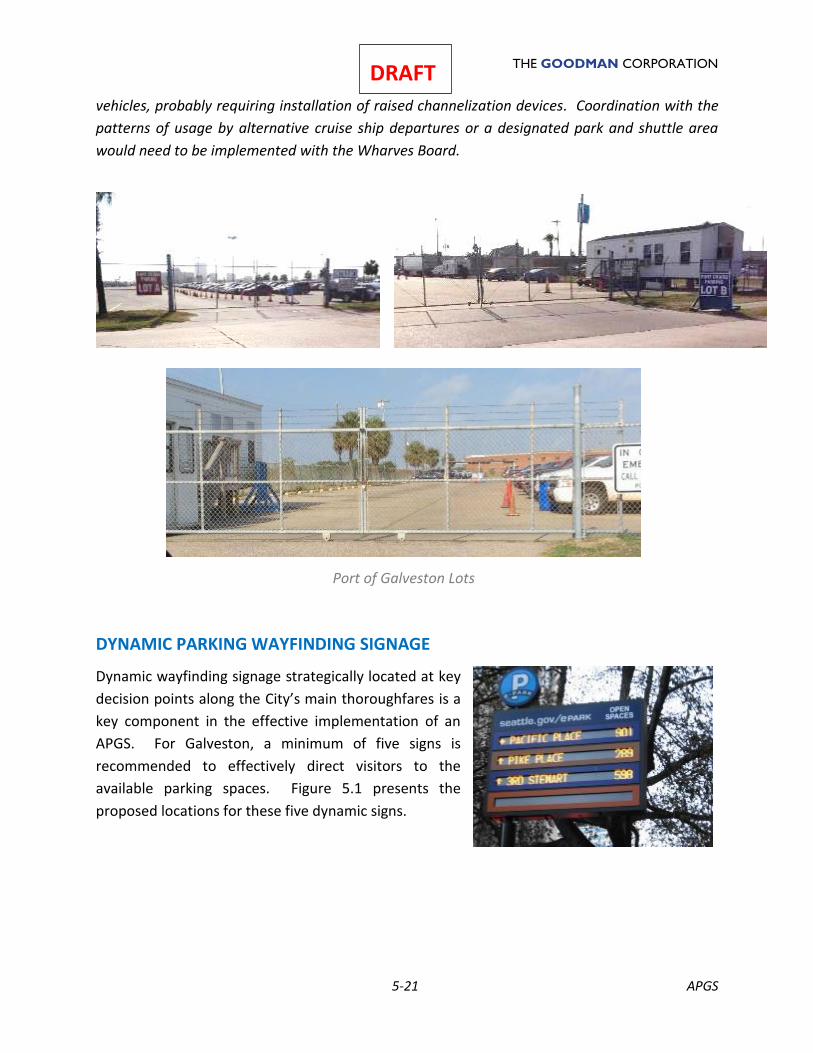
THE GOODMAN CORPORATION
5-21 APGS
DRAFT
vehicles, probably requiring installation of raised channelization devices. Coordination with the
patterns of usage by alternative cruise ship departures or a designated park and shuttle area
would need to be implemented with the Wharves Board.
DYNAMIC PARKING WAYFINDING SIGNAGE
Dynamic wayfinding signage strategically located at key
decision points along the City’s main thoroughfares is a
key component in the effective implementation of an
APGS. For Galveston, a minimum of five signs is
recommended to effectively direct visitors to the
available parking spaces. Figure 5.1 presents the
proposed locations for these five dynamic signs.
Port of Galveston Lots
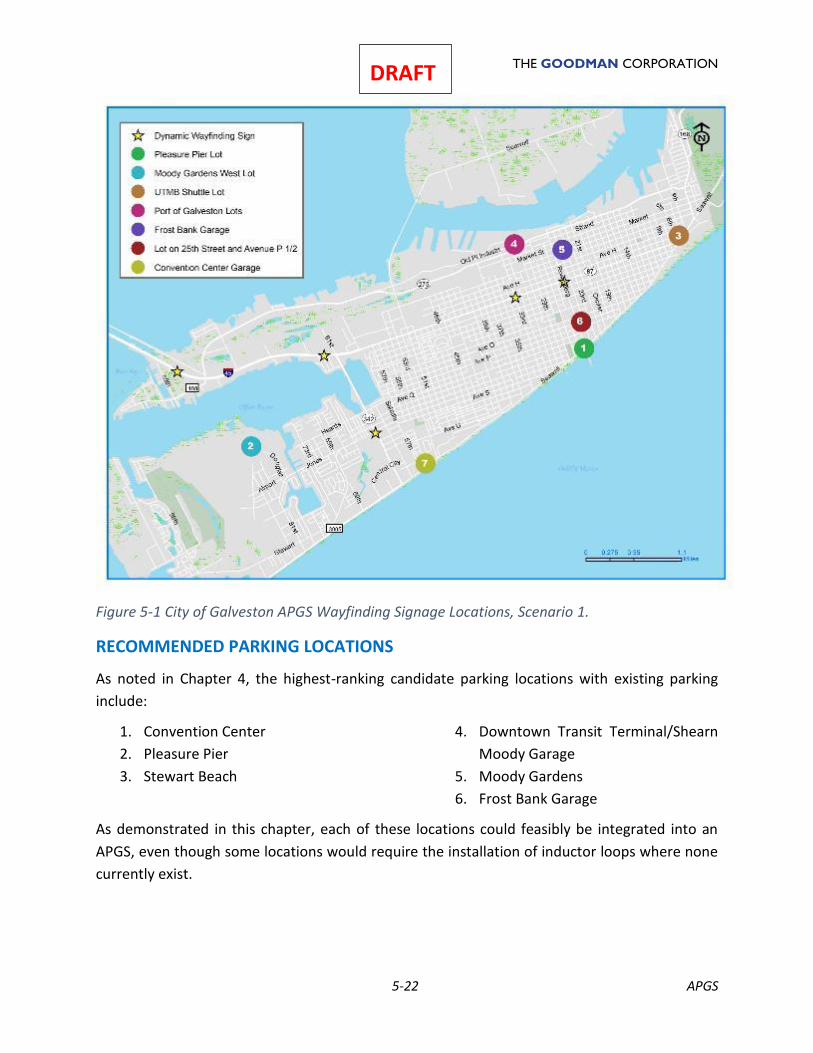
THE GOODMAN CORPORATION
5-22 APGS
DRAFT
Figure 5-1 City of Galveston APGS Wayfinding Signage Locations, Scenario 1.
RECOMMENDED PARKING LOCATIONS
As noted in Chapter 4, the highest-ranking candidate parking locations with existing parking
include:
1. Convention Center
2. Pleasure Pier
3. Stewart Beach
4. Downtown Transit Terminal/Shearn
Moody Garage
5. Moody Gardens
6. Frost Bank Garage
As demonstrated in this chapter, each of these locations could feasibly be integrated into an
APGS, even though some locations would require the installation of inductor loops where none
currently exist.
THE GOODMAN CORPORATION
5-23 APGS
DRAFT
Chapter 4 also recommends the following currently undeveloped parcels for potential parking
partnerships with developers:
1. NW corner of Seawall & 21st (Beach Central)
2. Seawall Boulevard, across from Ft Crockett
3. Seawall Boulevard, between 45th & 42nd
4. Seawall Boulevard between 35th & 33rd (“Seahorse”)
5. New development at The Spot
Should development of any of these locations come to fruition, with a public parking component
included therein, it is recommended that they be considered for integration into the APGS as
well.
APPROXIMATE COSTS
Implementation costs for a conceptual APGS consisting of the six locations noted above and
including the additional inductor loops as needed, facility count signs at each parking location,
five dynamic wayfinding signs, labor, and infrastructure would total approximately $500,000.
This does not include additional supporting static signage, location signage, ticket dispensers,
or barrier gates. Upon selection of the exact locations that will be used, the cost estimate can
be refined to include these costs along with any additional computer hardware and software
needed. Static wayfinding signage will be necessary to guide visitors through the streets of
Galveston to the parking locations at a more granular level than provided by the dynamic signs.
These static signs are generally inexpensive and can be installed and removed as necessary by
the City Traffic Department. It is recommended that an integrated, branded sign package be
used at each of the locations to identify the overall Galveston-specific parking system. The
same design and information should be included on the signs at each location.
The cost estimate will also need to be refined to include any additional parking locations that
may be incorporated into the APGS, particularly as it relates to currently undeveloped parcels.
A package cost for each new facility addition could be developed for potential private partner
consideration.

THE GOODMAN CORPORATION
5-24 APGS
DRAFT
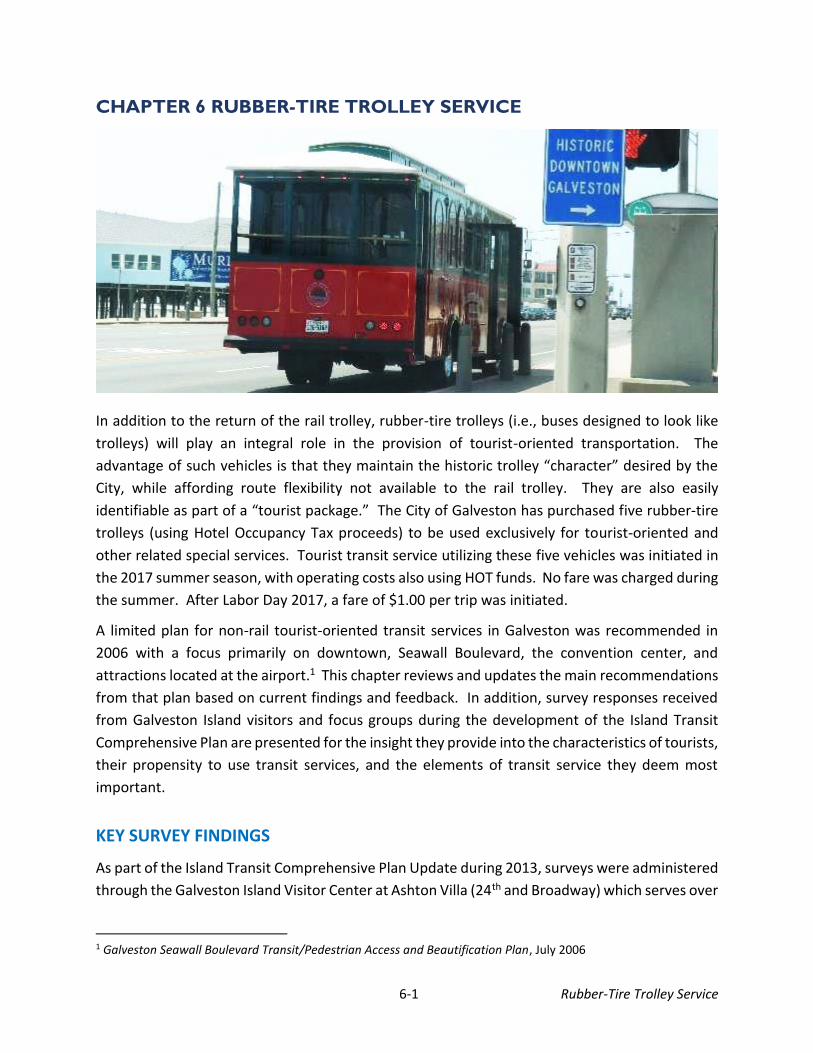
6-1 Rubber-Tire Trolley Service
CHAPTER 6 RUBBER-TIRE TROLLEY SERVICE
In addition to the return of the rail trolley, rubber-tire trolleys (i.e., buses designed to look like
trolleys) will play an integral role in the provision of tourist-oriented transportation. The
advantage of such vehicles is that they maintain the historic trolley “character” desired by the
City, while affording route flexibility not available to the rail trolley. They are also easily
identifiable as part of a “tourist package.” The City of Galveston has purchased five rubber-tire
trolleys (using Hotel Occupancy Tax proceeds) to be used exclusively for tourist-oriented and
other related special services. Tourist transit service utilizing these five vehicles was initiated in
the 2017 summer season, with operating costs also using HOT funds. No fare was charged during
the summer. After Labor Day 2017, a fare of $1.00 per trip was initiated.
A limited plan for non-rail tourist-oriented transit services in Galveston was recommended in
2006 with a focus primarily on downtown, Seawall Boulevard, the convention center, and
attractions located at the airport.1 This chapter reviews and updates the main recommendations
from that plan based on current findings and feedback. In addition, survey responses received
from Galveston Island visitors and focus groups during the development of the Island Transit
Comprehensive Plan are presented for the insight they provide into the characteristics of tourists,
their propensity to use transit services, and the elements of transit service they deem most
important.
KEY SURVEY FINDINGS
As part of the Island Transit Comprehensive Plan Update during 2013, surveys were administered
through the Galveston Island Visitor Center at Ashton Villa (24th and Broadway) which serves over
1 Galveston Seawall Boulevard Transit/Pedestrian Access and Beautification Plan, July 2006
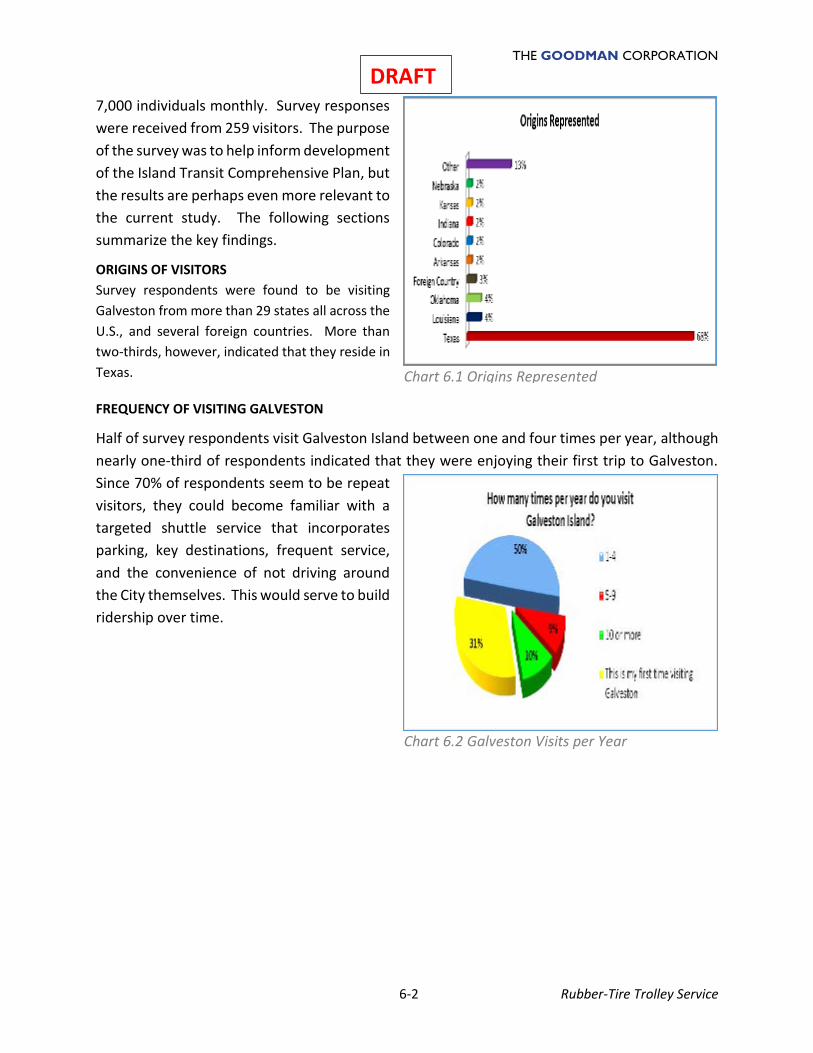
THE GOODMAN CORPORATION
6-2 Rubber-Tire Trolley Service
DRAFT 7,000 individuals monthly. Survey responses
were received from 259 visitors. The purpose
of the survey was to help inform development
of the Island Transit Comprehensive Plan, but
the results are perhaps even more relevant to
the current study. The following sections
summarize the key findings.
ORIGINS OF VISITORS
Survey respondents were found to be visiting
Galveston from more than 29 states all across the
U.S., and several foreign countries. More than
two-thirds, however, indicated that they reside in
Texas.
FREQUENCY OF VISITING GALVESTON
Half of survey respondents visit Galveston Island between one and four times per year, although
nearly one-third of respondents indicated that they were enjoying their first trip to Galveston.
Since 70% of respondents seem to be repeat
visitors, they could become familiar with a
targeted shuttle service that incorporates
parking, key destinations, frequent service,
and the convenience of not driving around
the City themselves. This would serve to build
ridership over time.
Chart 6.2 Galveston Visits per Year
Chart 6.1 Origins Represented
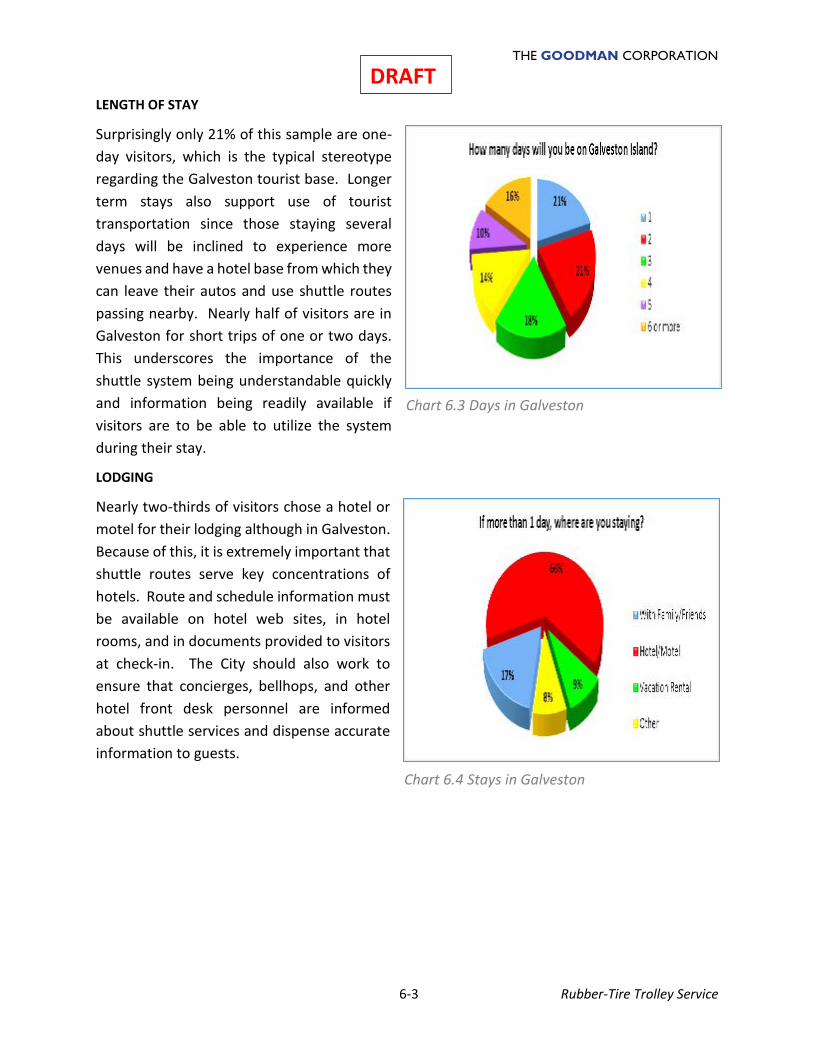
THE GOODMAN CORPORATION
6-3 Rubber-Tire Trolley Service
DRAFT LENGTH OF STAY
Surprisingly only 21% of this sample are one-
day visitors, which is the typical stereotype
regarding the Galveston tourist base. Longer
term stays also support use of tourist
transportation since those staying several
days will be inclined to experience more
venues and have a hotel base from which they
can leave their autos and use shuttle routes
passing nearby. Nearly half of visitors are in
Galveston for short trips of one or two days.
This underscores the importance of the
shuttle system being understandable quickly
and information being readily available if
visitors are to be able to utilize the system
during their stay.
LODGING
Nearly two-thirds of visitors chose a hotel or
motel for their lodging although in Galveston.
Because of this, it is extremely important that
shuttle routes serve key concentrations of
hotels. Route and schedule information must
be available on hotel web sites, in hotel
rooms, and in documents provided to visitors
at check-in. The City should also work to
ensure that concierges, bellhops, and other
hotel front desk personnel are informed
about shuttle services and dispense accurate
information to guests.
Chart 6.3 Days in Galveston
Chart 6.4 Stays in Galveston
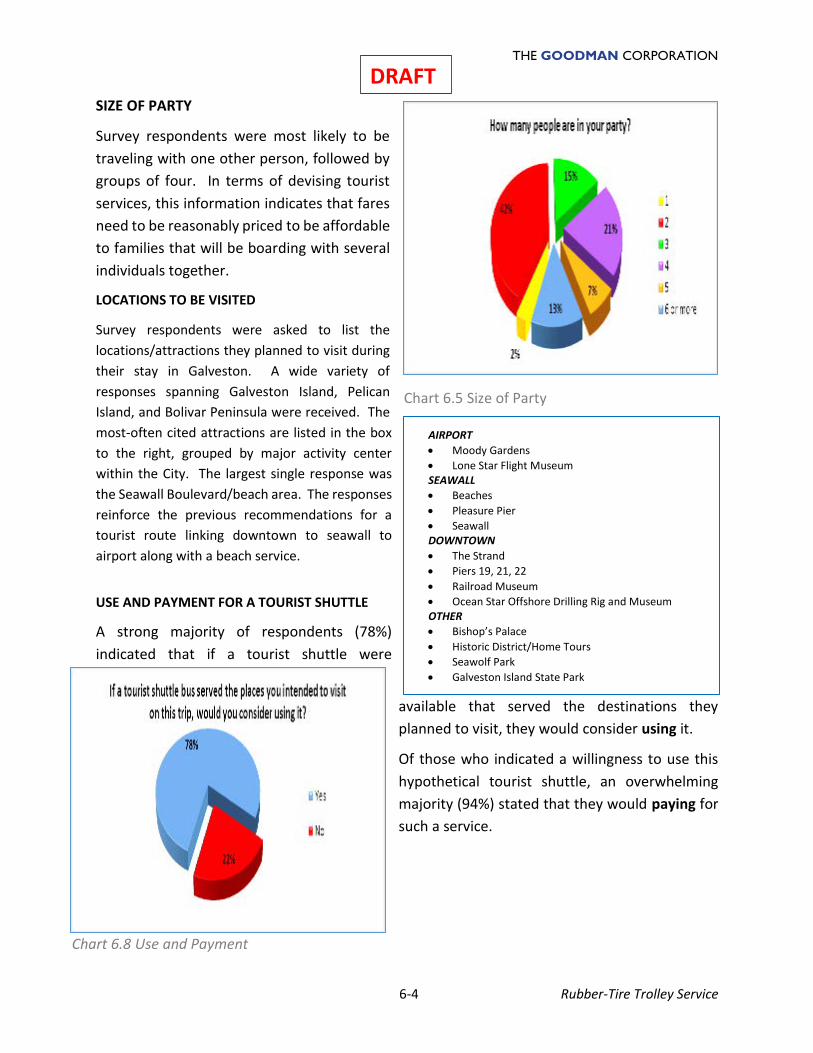
THE GOODMAN CORPORATION
6-4 Rubber-Tire Trolley Service
DRAFT SIZE OF PARTY
Survey respondents were most likely to be
traveling with one other person, followed by
groups of four. In terms of devising tourist
services, this information indicates that fares
need to be reasonably priced to be affordable
to families that will be boarding with several
individuals together.
LOCATIONS TO BE VISITED
Survey respondents were asked to list the
locations/attractions they planned to visit during
their stay in Galveston. A wide variety of
responses spanning Galveston Island, Pelican
Island, and Bolivar Peninsula were received. The
most-often cited attractions are listed in the box
to the right, grouped by major activity center
within the City. The largest single response was
the Seawall Boulevard/beach area. The responses
reinforce the previous recommendations for a
tourist route linking downtown to seawall to
airport along with a beach service.
USE AND PAYMENT FOR A TOURIST SHUTTLE
A strong majority of respondents (78%)
indicated that if a tourist shuttle were
available that served the destinations they
planned to visit, they would consider using it.
Of those who indicated a willingness to use this
hypothetical tourist shuttle, an overwhelming
majority (94%) stated that they would paying for
such a service.
Chart 6.5 Size of Party
AIRPORT
• Moody Gardens
• Lone Star Flight Museum SEAWALL
• Beaches
• Pleasure Pier
• Seawall DOWNTOWN
• The Strand
• Piers 19, 21, 22
• Railroad Museum
• Ocean Star Offshore Drilling Rig and Museum OTHER
• Bishop’s Palace
• Historic District/Home Tours
• Seawolf Park
• Galveston Island State Park
Chart 6.8 Use and Payment
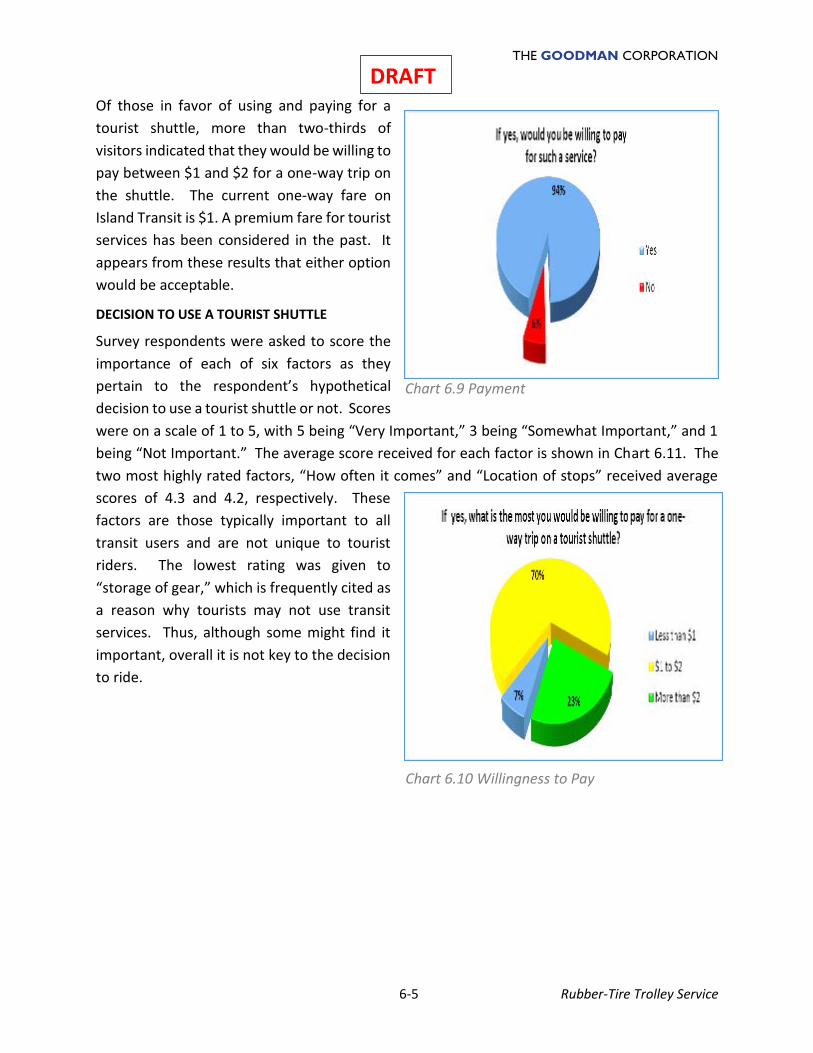
THE GOODMAN CORPORATION
6-5 Rubber-Tire Trolley Service
DRAFT Of those in favor of using and paying for a
tourist shuttle, more than two-thirds of
visitors indicated that they would be willing to
pay between $1 and $2 for a one-way trip on
the shuttle. The current one-way fare on
Island Transit is $1. A premium fare for tourist
services has been considered in the past. It
appears from these results that either option
would be acceptable.
DECISION TO USE A TOURIST SHUTTLE
Survey respondents were asked to score the
importance of each of six factors as they
pertain to the respondent’s hypothetical
decision to use a tourist shuttle or not. Scores
were on a scale of 1 to 5, with 5 being “Very Important,” 3 being “Somewhat Important,” and 1
being “Not Important.” The average score received for each factor is shown in Chart 6.11. The
two most highly rated factors, “How often it comes” and “Location of stops” received average
scores of 4.3 and 4.2, respectively. These
factors are those typically important to all
transit users and are not unique to tourist
riders. The lowest rating was given to
“storage of gear,” which is frequently cited as
a reason why tourists may not use transit
services. Thus, although some might find it
important, overall it is not key to the decision
to ride.
Chart 6.9 Payment
Chart 6.10 Willingness to Pay
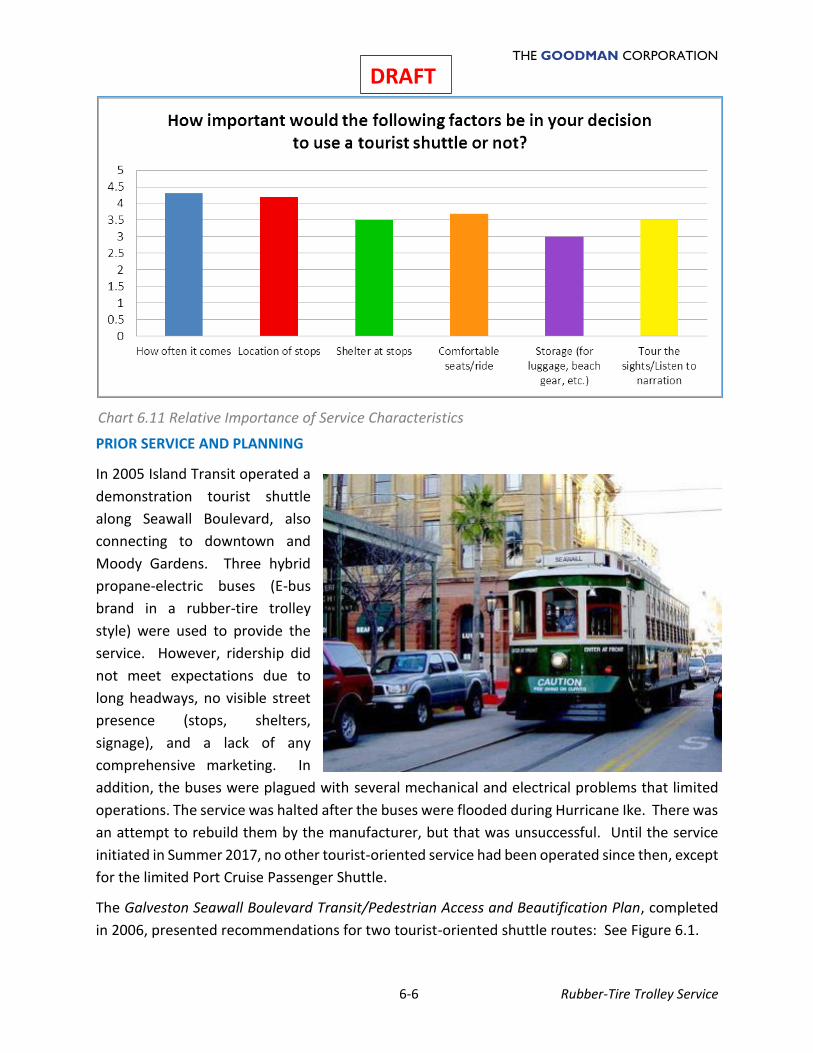
THE GOODMAN CORPORATION
6-6 Rubber-Tire Trolley Service
DRAFT
PRIOR SERVICE AND PLANNING
In 2005 Island Transit operated a
demonstration tourist shuttle
along Seawall Boulevard, also
connecting to downtown and
Moody Gardens. Three hybrid
propane-electric buses (E-bus
brand in a rubber-tire trolley
style) were used to provide the
service. However, ridership did
not meet expectations due to
long headways, no visible street
presence (stops, shelters,
signage), and a lack of any
comprehensive marketing. In
addition, the buses were plagued with several mechanical and electrical problems that limited
operations. The service was halted after the buses were flooded during Hurricane Ike. There was
an attempt to rebuild them by the manufacturer, but that was unsuccessful. Until the service
initiated in Summer 2017, no other tourist-oriented service had been operated since then, except
for the limited Port Cruise Passenger Shuttle.
The Galveston Seawall Boulevard Transit/Pedestrian Access and Beautification Plan, completed
in 2006, presented recommendations for two tourist-oriented shuttle routes: See Figure 6.1.
Chart 6.11 Relative Importance of Service Characteristics
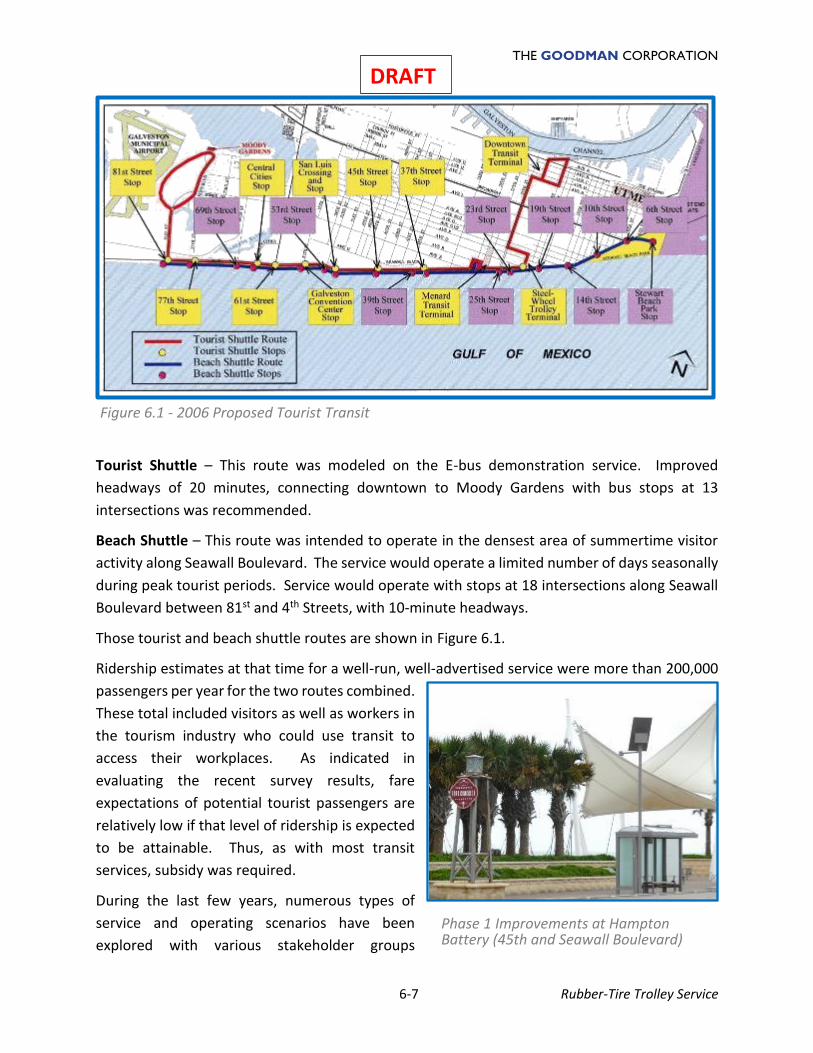
THE GOODMAN CORPORATION
6-7 Rubber-Tire Trolley Service
DRAFT
Tourist Shuttle – This route was modeled on the E-bus demonstration service. Improved
headways of 20 minutes, connecting downtown to Moody Gardens with bus stops at 13
intersections was recommended.
Beach Shuttle – This route was intended to operate in the densest area of summertime visitor
activity along Seawall Boulevard. The service would operate a limited number of days seasonally
during peak tourist periods. Service would operate with stops at 18 intersections along Seawall
Boulevard between 81st and 4th Streets, with 10-minute headways.
Those tourist and beach shuttle routes are shown in Figure 6.1.
Ridership estimates at that time for a well-run, well-advertised service were more than 200,000
passengers per year for the two routes combined.
These total included visitors as well as workers in
the tourism industry who could use transit to
access their workplaces. As indicated in
evaluating the recent survey results, fare
expectations of potential tourist passengers are
relatively low if that level of ridership is expected
to be attainable. Thus, as with most transit
services, subsidy was required.
During the last few years, numerous types of
service and operating scenarios have been
explored with various stakeholder groups
Figure 6.1 - 2006 Proposed Tourist Transit
Routes
Phase 1 Improvements at Hampton Battery (45th and Seawall Boulevard)
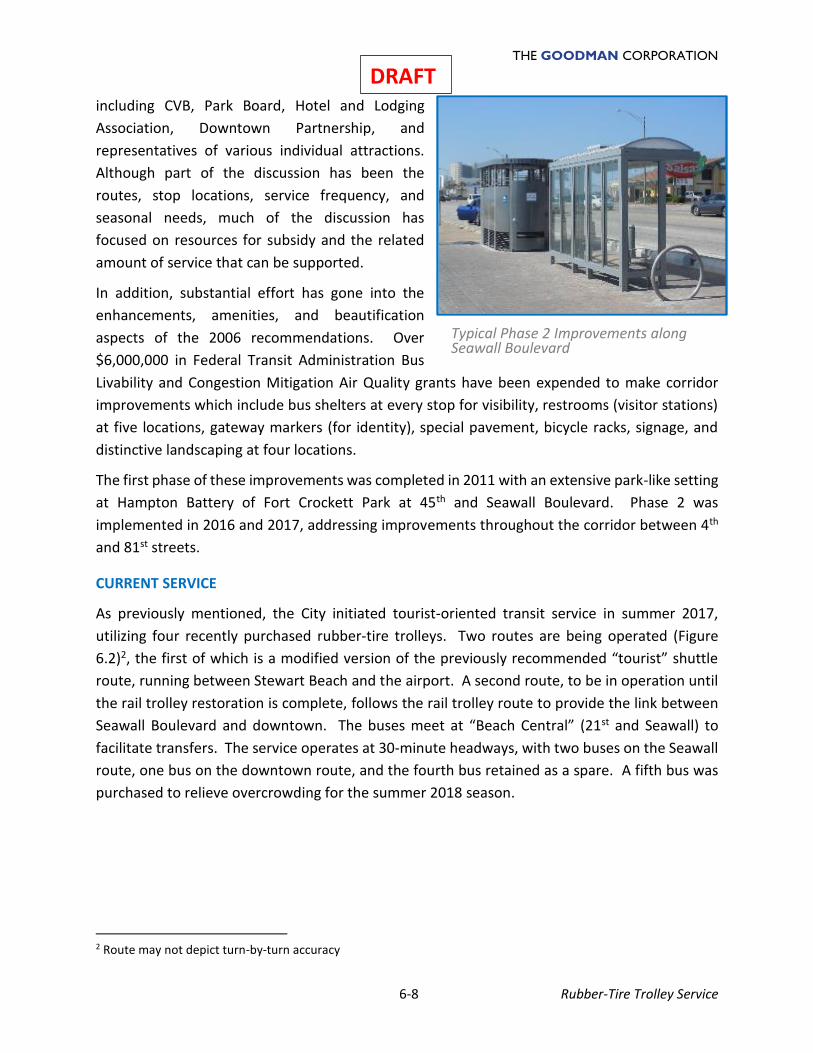
THE GOODMAN CORPORATION
6-8 Rubber-Tire Trolley Service
DRAFT including CVB, Park Board, Hotel and Lodging
Association, Downtown Partnership, and
representatives of various individual attractions.
Although part of the discussion has been the
routes, stop locations, service frequency, and
seasonal needs, much of the discussion has
focused on resources for subsidy and the related
amount of service that can be supported.
In addition, substantial effort has gone into the
enhancements, amenities, and beautification
aspects of the 2006 recommendations. Over
$6,000,000 in Federal Transit Administration Bus
Livability and Congestion Mitigation Air Quality grants have been expended to make corridor
improvements which include bus shelters at every stop for visibility, restrooms (visitor stations)
at five locations, gateway markers (for identity), special pavement, bicycle racks, signage, and
distinctive landscaping at four locations.
The first phase of these improvements was completed in 2011 with an extensive park-like setting
at Hampton Battery of Fort Crockett Park at 45th and Seawall Boulevard. Phase 2 was
implemented in 2016 and 2017, addressing improvements throughout the corridor between 4th
and 81st streets.
CURRENT SERVICE
As previously mentioned, the City initiated tourist-oriented transit service in summer 2017,
utilizing four recently purchased rubber-tire trolleys. Two routes are being operated (Figure
6.2)2, the first of which is a modified version of the previously recommended “tourist” shuttle
route, running between Stewart Beach and the airport. A second route, to be in operation until
the rail trolley restoration is complete, follows the rail trolley route to provide the link between
Seawall Boulevard and downtown. The buses meet at “Beach Central” (21st and Seawall) to
facilitate transfers. The service operates at 30-minute headways, with two buses on the Seawall
route, one bus on the downtown route, and the fourth bus retained as a spare. A fifth bus was
purchased to relieve overcrowding for the summer 2018 season.
2 Route may not depict turn-by-turn accuracy
Typical Phase 2 Improvements along Seawall Boulevard
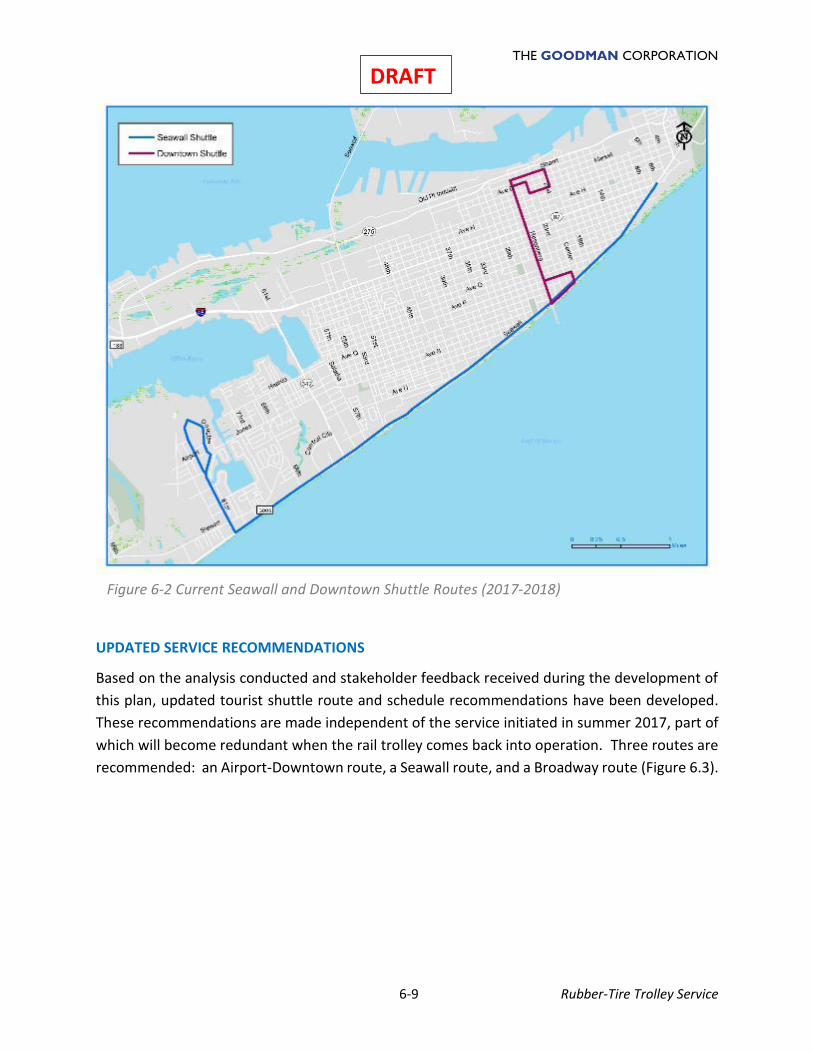
THE GOODMAN CORPORATION
6-9 Rubber-Tire Trolley Service
DRAFT
Figure 6-2 Current Seawall and Downtown Shuttle Routes (2017-2018)
UPDATED SERVICE RECOMMENDATIONS
Based on the analysis conducted and stakeholder feedback received during the development of
this plan, updated tourist shuttle route and schedule recommendations have been developed.
These recommendations are made independent of the service initiated in summer 2017, part of
which will become redundant when the rail trolley comes back into operation. Three routes are
recommended: an Airport-Downtown route, a Seawall route, and a Broadway route (Figure 6.3).
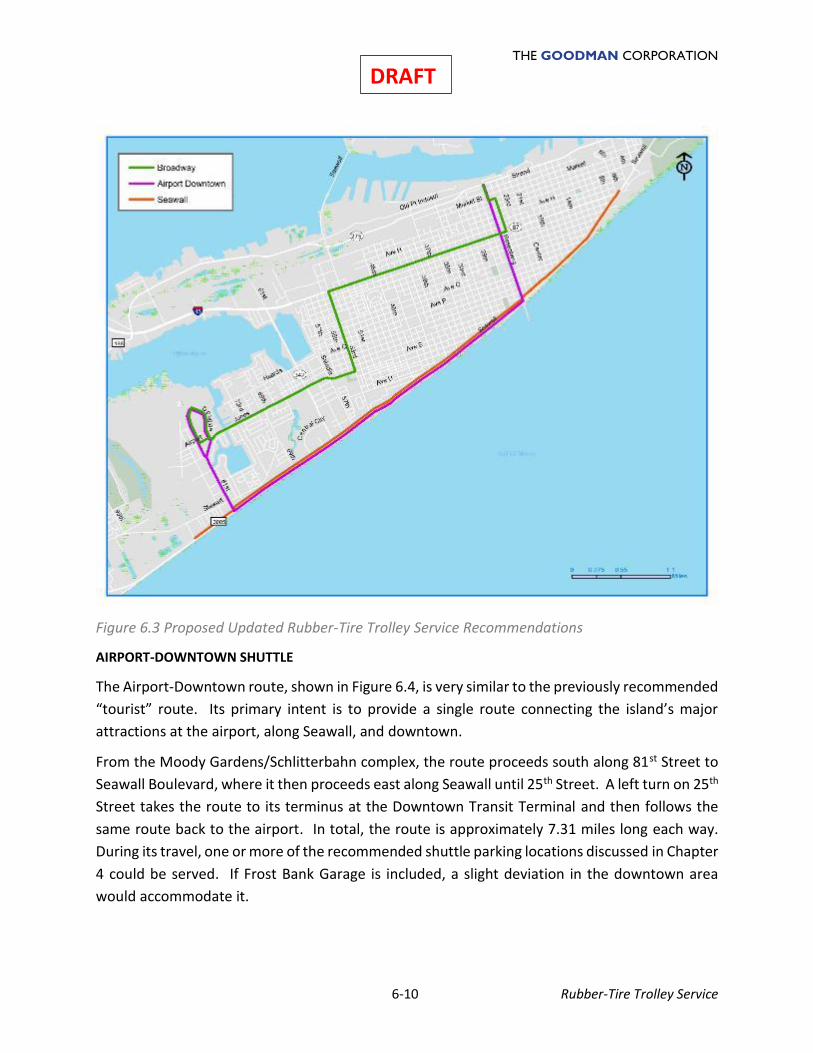
THE GOODMAN CORPORATION
6-10 Rubber-Tire Trolley Service
DRAFT
Figure 6.3 Proposed Updated Rubber-Tire Trolley Service Recommendations
AIRPORT-DOWNTOWN SHUTTLE
The Airport-Downtown route, shown in Figure 6.4, is very similar to the previously recommended
“tourist” route. Its primary intent is to provide a single route connecting the island’s major
attractions at the airport, along Seawall, and downtown.
From the Moody Gardens/Schlitterbahn complex, the route proceeds south along 81st Street to
Seawall Boulevard, where it then proceeds east along Seawall until 25th Street. A left turn on 25th
Street takes the route to its terminus at the Downtown Transit Terminal and then follows the
same route back to the airport. In total, the route is approximately 7.31 miles long each way.
During its travel, one or more of the recommended shuttle parking locations discussed in Chapter
4 could be served. If Frost Bank Garage is included, a slight deviation in the downtown area
would accommodate it.
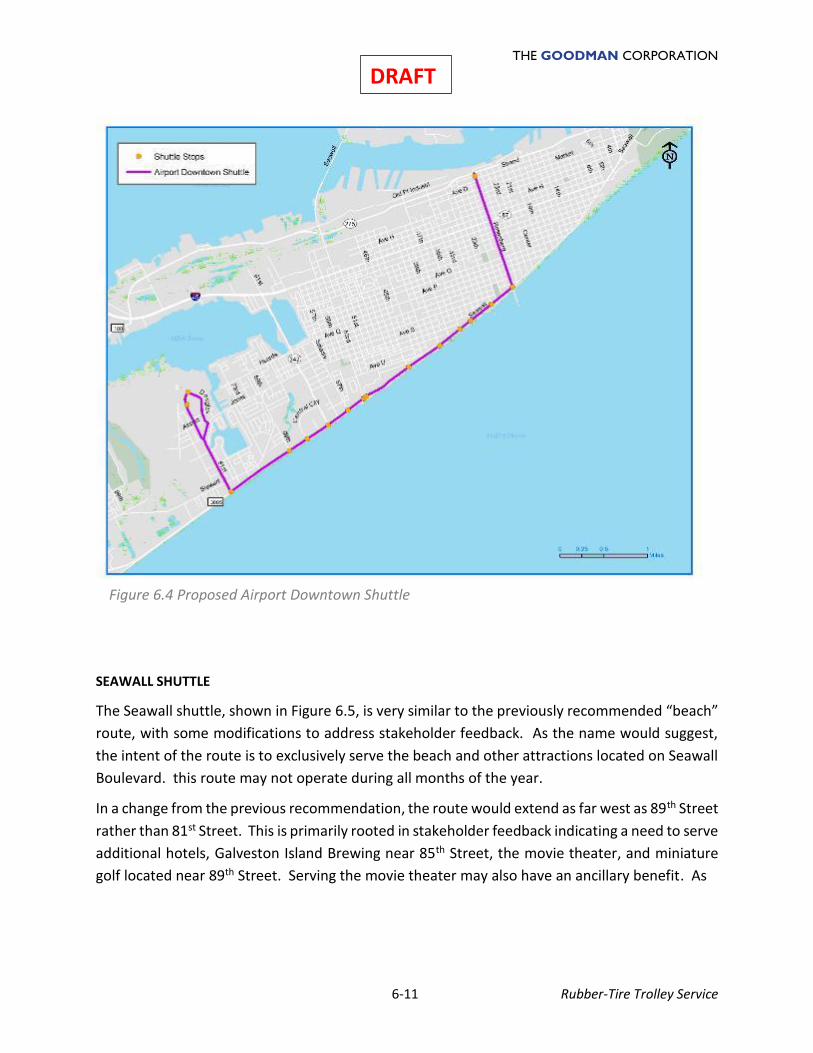
THE GOODMAN CORPORATION
6-11 Rubber-Tire Trolley Service
DRAFT
SEAWALL SHUTTLE
The Seawall shuttle, shown in Figure 6.5, is very similar to the previously recommended “beach”
route, with some modifications to address stakeholder feedback. As the name would suggest,
the intent of the route is to exclusively serve the beach and other attractions located on Seawall
Boulevard. this route may not operate during all months of the year.
In a change from the previous recommendation, the route would extend as far west as 89th Street
rather than 81st Street. This is primarily rooted in stakeholder feedback indicating a need to serve
additional hotels, Galveston Island Brewing near 85th Street, the movie theater, and miniature
golf located near 89th Street. Serving the movie theater may also have an ancillary benefit. As
Figure 6.4 Proposed Airport Downtown Shuttle
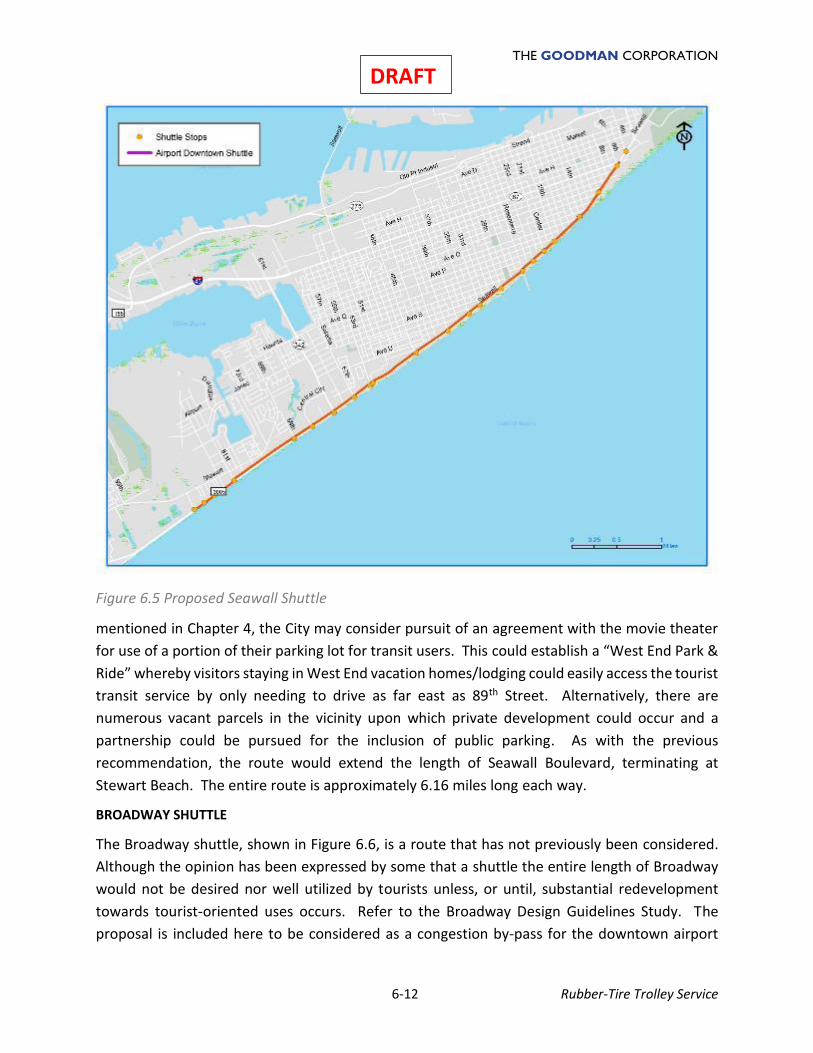
THE GOODMAN CORPORATION
6-12 Rubber-Tire Trolley Service
DRAFT
Figure 6.5 Proposed Seawall Shuttle
mentioned in Chapter 4, the City may consider pursuit of an agreement with the movie theater
for use of a portion of their parking lot for transit users. This could establish a “West End Park &
Ride” whereby visitors staying in West End vacation homes/lodging could easily access the tourist
transit service by only needing to drive as far east as 89th Street. Alternatively, there are
numerous vacant parcels in the vicinity upon which private development could occur and a
partnership could be pursued for the inclusion of public parking. As with the previous
recommendation, the route would extend the length of Seawall Boulevard, terminating at
Stewart Beach. The entire route is approximately 6.16 miles long each way.
BROADWAY SHUTTLE
The Broadway shuttle, shown in Figure 6.6, is a route that has not previously been considered.
Although the opinion has been expressed by some that a shuttle the entire length of Broadway
would not be desired nor well utilized by tourists unless, or until, substantial redevelopment
towards tourist-oriented uses occurs. Refer to the Broadway Design Guidelines Study. The
proposal is included here to be considered as a congestion by-pass for the downtown airport
THE GOODMAN CORPORATION
6-13 Rubber-Tire Trolley Service
DRAFT service and to serve other purposes as described below. In addition, the cell phone data
indicated some tourists staying in the area along the proposed route. There are several
objectives that could be met by this route, driven in large part by stakeholder feedback. The
objectives include:
Figure 6-6 Proposed Broadway Shuttle
▪ Connectivity between the airport attractions and downtown via a less congested, more
“express” route than Seawall Boulevard, and using fewer stops.
▪ Opportunity to provide visitor exposure to the Broadway corridor and surroundings (i.e.,
“there’s more to Galveston than just Seawall”). Over time this may be increasingly true
due to the redevelopment recommendations being made by the separate Broadway
Corridor Redevelopment Plan and Design Guidelines.
▪ Opportunity to serve transit parking locations (if developed) along Broadway operating
as “intercept” parking.
▪ Opportunity to serve directly the Ashton Villa visitor center and/or a new gateway visitor
THE GOODMAN CORPORATION
6-14 Rubber-Tire Trolley Service
DRAFT center (see discussion in Chapter 4.)
▪ Opportunity to incorporate the West Market redevelopment area.
The route proceeds from the Moody Gardens/Schlitterbahn complex eastward along Jones
Dr/Stewart Rd/Ave S, before turning north on 53rd Street to Broadway. A new parking facility
and/or visitor center near 53rd and Broadway (as discussed in Chapter 4) could then be served.
The route then proceeds east on Broadway until turning north on 24th Street, where the Ashton
Villa visitor center and/or the Frost Bank Garage could be served. The route would terminate at
the Downtown Transit Terminal as shown in Figure 6.6. The total length of the route is
approximately 6.51 miles each way.
The Broadway route could be initially operated as a demonstration, to validate that there is
indeed a time savings over traveling along Seawall Boulevard during crowded summer weekends
while connecting the Airport attractions and downtown and that there would be user
satisfaction. Specific efforts to brand the route as “Express” at either end of the route (airport
attractions and downtown) can serve to boost ridership.
As discussed in one of the stakeholder focus groups (Chapter 3), the Market Street corridor
between approximately 25th and 28th Streets is perhaps an “up and coming” area that is being
emphasized by upcoming City streetscape improvements. Although existing demand probably
does not warrant serving this area in the very near term, an extension of the Broadway route to
this area in the future after improvements are constructed (as shown in Figure 6.6) should be
considered. Similarly, the abandoned Falstaff Brewery at 33rd and Market, when the current
redeveloped is completed, might be considered for incorporation into the route as well.
OPERATING SCHEDULES AND COSTS
A transportation service focused on the visitor population will, for obvious reasons, have varying
operating hours depending on the time of year. For the purpose of developing operating
schedules and costs, the following definitions of “peak” and “off-peak” service periods are used:
▪ Peak Season – Memorial Day weekend, every summer day starting 2nd week of June
through 3rd week of August, Labor Day weekend, Spring Break week. Total: 88 days.
▪ Off-Peak Season – Everything else. Total: 277 days.
In response to stakeholder feedback, the recommended operating hours are 10 am to 12
midnight in the peak season (14 daily operating hours), and 10 am to 6 pm (8 daily operating
hours) in the off-peak season for the Airport-Downtown and Seawall routes. Surprisingly
THE GOODMAN CORPORATION
6-15 Rubber-Tire Trolley Service
DRAFT pedestrian counts during August of 2017 indicated peak pedestrian activity during the evening
hours providing an indicator that transit activity could be well served during those hours as well.
If the Broadway route is operated, it is recommended that this be a peak season-only route, as
the Seawall Boulevard congestion intended to be avoided by the Broadway route is largely non-
existent in the off-peak season. Also, due to stakeholder feedback that there is minimal activity
in downtown in the later hours, it is recommended that the Broadway route operate from 10 am
to 8 pm in the peak season.
Variable operating hours are very common in tourist settings and are acceptable for transit
services as long as the variations are clearly stated, updated regularly, and available at bus stops
and in visitor information resources covering all media. Adhering strictly to the schedule and
being on time is extremely important.
SERVICE CHARACTERISTICS
Tables 6.1 through 6.3 below present the operating characteristics and resultant operating costs
for each of the proposed routes. The amount of time required for a one-way trip is determined
by the round-trip length of the route and an assumed average speed of travel confirmed by the
2017 summer experience. Based on the round-trip time, the total number of vehicles that must
be placed into service is then determined by the desired frequency of service (headways).
Additionally, bi-directional service (i.e. buses running in opposite directions simultaneously) is
assumed on all routes at all times with no large loops included.
Based on information provided by the City an hourly operating cost of $55 is being used in this
analysis. Total annual operating costs for each shuttle include amortized vehicle costs assuming
a vehicle purchase price of $160,000, for a vehicle with a 7-year life. As City circumstances change
over time, these rates can be modified with other factors in the tables to update the cost
estimates. Scenarios are presented that assume either 2 or 4 buses (for bi-directional service)
for the Airport-Downtown and Seawall routes. Should the City choose to operate the Broadway
route, it is recommended that 2 buses (one in each direction) would be used.
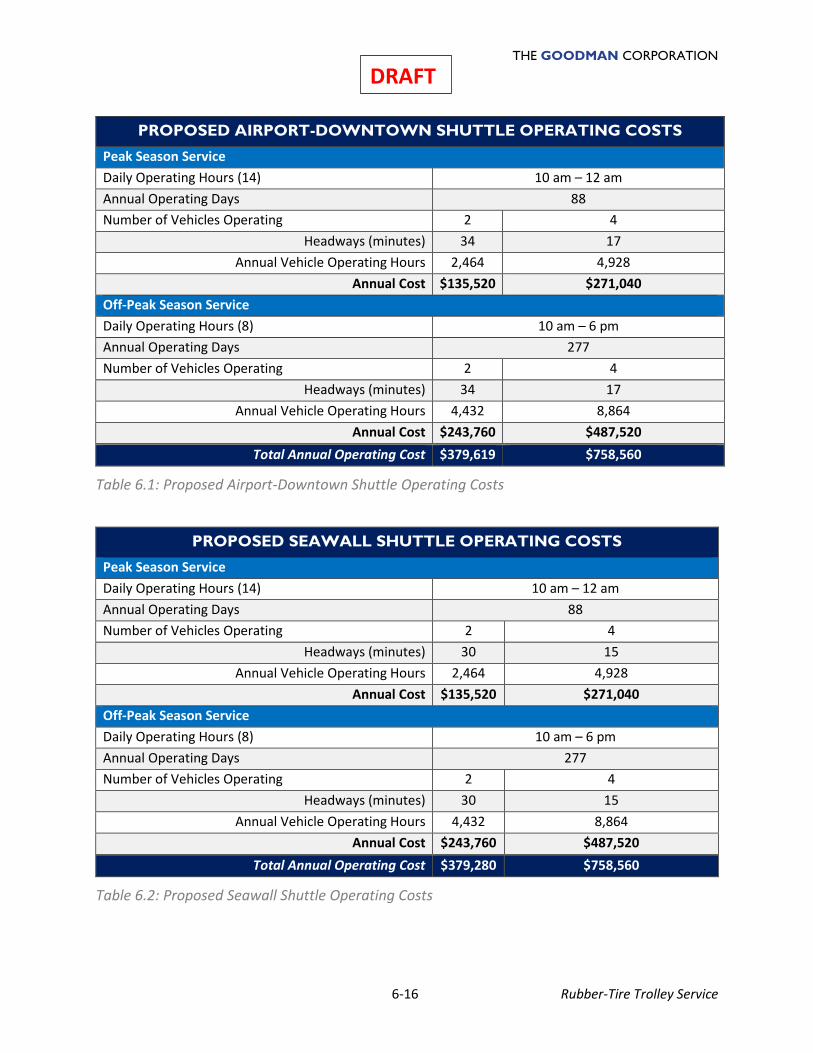
THE GOODMAN CORPORATION
6-16 Rubber-Tire Trolley Service
DRAFT
PROPOSED AIRPORT-DOWNTOWN SHUTTLE OPERATING COSTS
Peak Season Service
Daily Operating Hours (14) 10 am – 12 am
Annual Operating Days 88
Number of Vehicles Operating 2 4
Headways (minutes) 34 17
Annual Vehicle Operating Hours 2,464 4,928
Annual Cost $135,520 $271,040
Off-Peak Season Service
Daily Operating Hours (8) 10 am – 6 pm
Annual Operating Days 277
Number of Vehicles Operating 2 4
Headways (minutes) 34 17
Annual Vehicle Operating Hours 4,432 8,864
Annual Cost $243,760 $487,520
Total Annual Operating Cost $379,619 $758,560
Table 6.1: Proposed Airport-Downtown Shuttle Operating Costs
PROPOSED SEAWALL SHUTTLE OPERATING COSTS
Peak Season Service
Daily Operating Hours (14) 10 am – 12 am
Annual Operating Days 88
Number of Vehicles Operating 2 4
Headways (minutes) 30 15
Annual Vehicle Operating Hours 2,464 4,928
Annual Cost $135,520 $271,040
Off-Peak Season Service
Daily Operating Hours (8) 10 am – 6 pm
Annual Operating Days 277
Number of Vehicles Operating 2 4
Headways (minutes) 30 15
Annual Vehicle Operating Hours 4,432 8,864
Annual Cost $243,760 $487,520
Total Annual Operating Cost $379,280 $758,560
Table 6.2: Proposed Seawall Shuttle Operating Costs
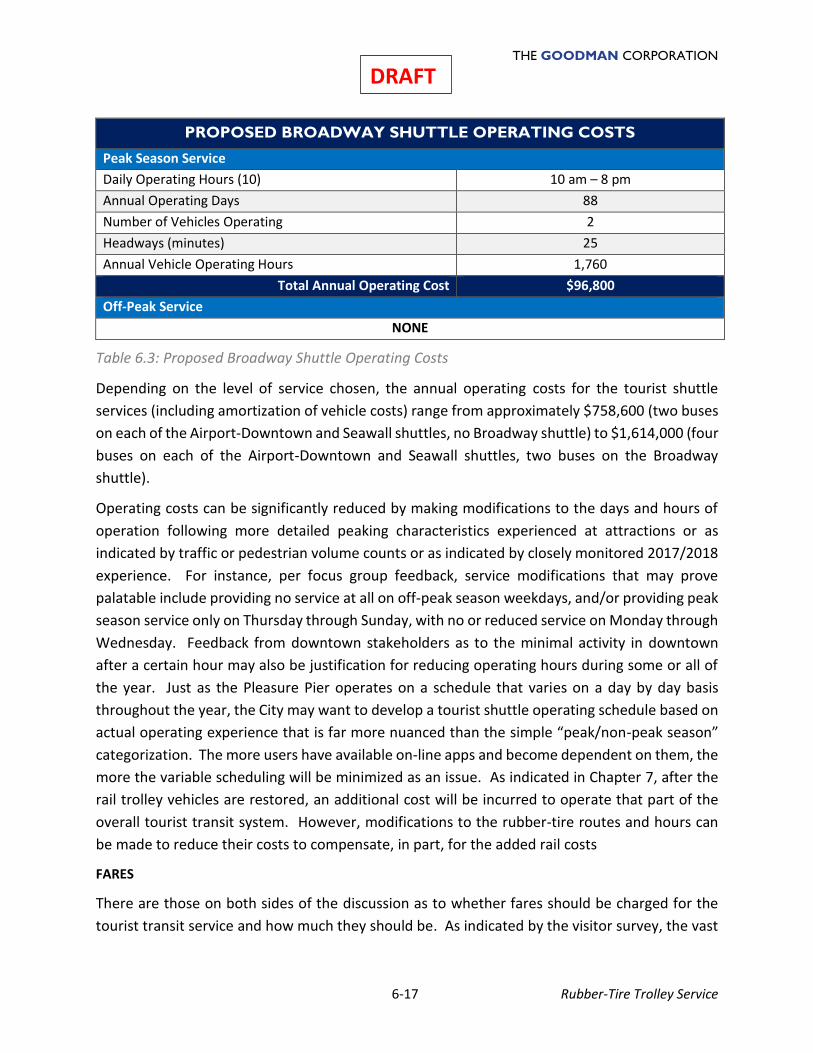
THE GOODMAN CORPORATION
6-17 Rubber-Tire Trolley Service
DRAFT
PROPOSED BROADWAY SHUTTLE OPERATING COSTS
Peak Season Service
Daily Operating Hours (10) 10 am – 8 pm
Annual Operating Days 88
Number of Vehicles Operating 2
Headways (minutes) 25
Annual Vehicle Operating Hours 1,760
Total Annual Operating Cost $96,800
Off-Peak Service
NONE
Table 6.3: Proposed Broadway Shuttle Operating Costs
Depending on the level of service chosen, the annual operating costs for the tourist shuttle
services (including amortization of vehicle costs) range from approximately $758,600 (two buses
on each of the Airport-Downtown and Seawall shuttles, no Broadway shuttle) to $1,614,000 (four
buses on each of the Airport-Downtown and Seawall shuttles, two buses on the Broadway
shuttle).
Operating costs can be significantly reduced by making modifications to the days and hours of
operation following more detailed peaking characteristics experienced at attractions or as
indicated by traffic or pedestrian volume counts or as indicated by closely monitored 2017/2018
experience. For instance, per focus group feedback, service modifications that may prove
palatable include providing no service at all on off-peak season weekdays, and/or providing peak
season service only on Thursday through Sunday, with no or reduced service on Monday through
Wednesday. Feedback from downtown stakeholders as to the minimal activity in downtown
after a certain hour may also be justification for reducing operating hours during some or all of
the year. Just as the Pleasure Pier operates on a schedule that varies on a day by day basis
throughout the year, the City may want to develop a tourist shuttle operating schedule based on
actual operating experience that is far more nuanced than the simple “peak/non-peak season”
categorization. The more users have available on-line apps and become dependent on them, the
more the variable scheduling will be minimized as an issue. As indicated in Chapter 7, after the
rail trolley vehicles are restored, an additional cost will be incurred to operate that part of the
overall tourist transit system. However, modifications to the rubber-tire routes and hours can
be made to reduce their costs to compensate, in part, for the added rail costs
FARES
There are those on both sides of the discussion as to whether fares should be charged for the
tourist transit service and how much they should be. As indicated by the visitor survey, the vast
THE GOODMAN CORPORATION
6-18 Rubber-Tire Trolley Service
DRAFT majority of tourists would be willing to
pay for a shuttle service, with most
indicating that the acceptable fare
amount would be between $1 and $2 per
trip. However, there are examples
nationwide of circulator-type shuttle
services for which no fare is charged; the
rationale typically is that the benefits to
be gained from maximizing ridership
(reduced congestion, improved urban
environment, expected tourist amenity,
exposure of multiple venues, etc.)
outweigh the foregone farebox revenue,
which is rarely sufficient to cover operating costs and there are additional costs associated with
collection of and accounting for fares. In some situations, fareless services are beset by
numerous all-day riders who may not even be tourists.
Because the City has begun to charge a fare for the existing rubber-tire tourist shuttle service, it
is highly recommended, as expressed through stakeholder feedback, that a day pass be offered
to facilitate multiple trips without the need for repeated payment of the one-way fare. Such an
option would further encourage use of the system and is the most accommodating option for
families for whom paying $1-2 per trip for 4-5 family members would quickly become cost
prohibitive as they move among various island venues in the course of a single day. As
recommended in the 2011 City of Galveston Island Transit Comprehensive Plan, multi-day passes
should also be considered as a means to induce ridership by visitors who will make many trips
among various attractions during desirable overnight stays in Galveston. Also note that to the
extent that these types of multi-trip passes represent a discount, the total fare revenue may be
reduced. Passes may also be sold to hotels, attractions, and others who can package them for
their customers as a resale or free benefit. Multiple mechanisms are available for ticket sales
including combined with parking fees as part of a park and shuttle program.
Table 6.4 presents one conceptual fare structure. Currently accompanied children ride free.
When passes are developed, a decision will be required whether children will continue to be free
without needing multi-ride passes. Half price for children’s multi-ride passes are recommended
in the table. No senior discount is currently given or anticipated.
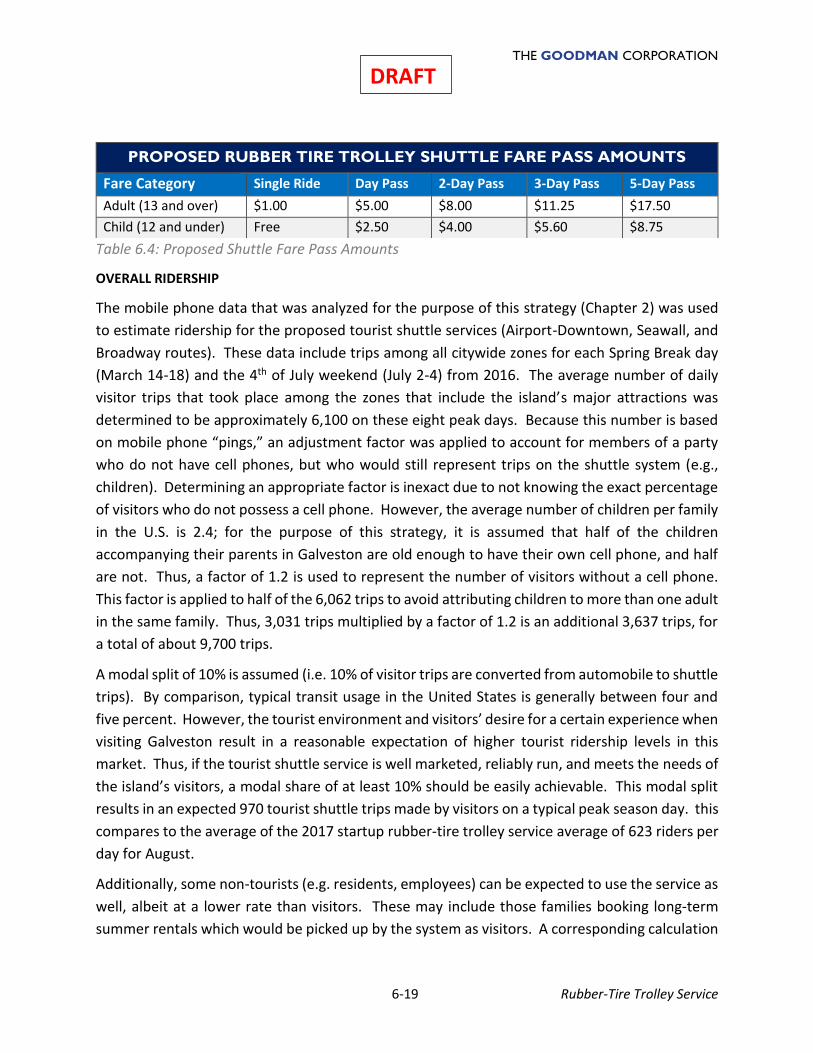
THE GOODMAN CORPORATION
6-19 Rubber-Tire Trolley Service
DRAFT
Table 6.4: Proposed Shuttle Fare Pass Amounts
OVERALL RIDERSHIP
The mobile phone data that was analyzed for the purpose of this strategy (Chapter 2) was used
to estimate ridership for the proposed tourist shuttle services (Airport-Downtown, Seawall, and
Broadway routes). These data include trips among all citywide zones for each Spring Break day
(March 14-18) and the 4th of July weekend (July 2-4) from 2016. The average number of daily
visitor trips that took place among the zones that include the island’s major attractions was
determined to be approximately 6,100 on these eight peak days. Because this number is based
on mobile phone “pings,” an adjustment factor was applied to account for members of a party
who do not have cell phones, but who would still represent trips on the shuttle system (e.g.,
children). Determining an appropriate factor is inexact due to not knowing the exact percentage
of visitors who do not possess a cell phone. However, the average number of children per family
in the U.S. is 2.4; for the purpose of this strategy, it is assumed that half of the children
accompanying their parents in Galveston are old enough to have their own cell phone, and half
are not. Thus, a factor of 1.2 is used to represent the number of visitors without a cell phone.
This factor is applied to half of the 6,062 trips to avoid attributing children to more than one adult
in the same family. Thus, 3,031 trips multiplied by a factor of 1.2 is an additional 3,637 trips, for
a total of about 9,700 trips.
A modal split of 10% is assumed (i.e. 10% of visitor trips are converted from automobile to shuttle
trips). By comparison, typical transit usage in the United States is generally between four and
five percent. However, the tourist environment and visitors’ desire for a certain experience when
visiting Galveston result in a reasonable expectation of higher tourist ridership levels in this
market. Thus, if the tourist shuttle service is well marketed, reliably run, and meets the needs of
the island’s visitors, a modal share of at least 10% should be easily achievable. This modal split
results in an expected 970 tourist shuttle trips made by visitors on a typical peak season day. this
compares to the average of the 2017 startup rubber-tire trolley service average of 623 riders per
day for August.
Additionally, some non-tourists (e.g. residents, employees) can be expected to use the service as
well, albeit at a lower rate than visitors. These may include those families booking long-term
summer rentals which would be picked up by the system as visitors. A corresponding calculation
PROPOSED RUBBER TIRE TROLLEY SHUTTLE FARE PASS AMOUNTS
Fare Category Single Ride Day Pass 2-Day Pass 3-Day Pass 5-Day Pass
Adult (13 and over) $1.00 $5.00 $8.00 $11.25 $17.50
Child (12 and under) Free $2.50 $4.00 $5.60 $8.75
THE GOODMAN CORPORATION
6-20 Rubber-Tire Trolley Service
DRAFT using the non-visitor mobile phone data yields an average of 1,132 non-visitor trips just among
the major attraction zones on peak days. An adjustment factor to account for those without cell
phones will not be used for this group, as 95% of adults in the U.S. now have cell phones3 and it
is assumed that these non-tourist riders are not traveling with children. A lower modal split of
5% (in line with typical nationwide transit usage) yields an expected 57 daily non-visitor trips to
be included. Thus, a total of 1,027 daily shuttle trips (970 visitor plus 57 non-visitor) are projected
on peak days for a reasonably distributed service providing good coverage among zones.
Because mobile phone data was not acquired for any off-peak timeframe, assumptions must be
made regarding the level of ridership on off-peak season days. Using 2016 monthly hotel
occupancy tax (HOT) revenue4 to represent variations in visitor activity, the number of visitors in
each off-peak month can be approximated as a percentage of the highest number of visitors seen
(which occurs in July). For instance, the lowest off-peak season visitor activity occurs in January,
when HOT revenues are 30% of July’s revenues, and the highest occurs in September, when HOT
revenues are 61% of what they are in July. Similar percentages were calculated for each of the
non-peak months, which were then used to project daily ridership for that month (based on the
aforementioned 1,027 daily trips during peak months). Averaging these estimates results in 454
daily shuttle trips (visitor and non-visitor) on days when service operates during the off-peak
seasons.
RIDERSHIP BY ROUTE
To determine how the estimated 1,027 daily peak trips and 454 daily off-peak trips might be
distributed by route, the “trip chain” mobile phone data presented in Chapter 2 was analyzed.
These data give insight into the combinations of attractions that tourists visit in the course of a
single day. The total trips were assigned to one (or more) of the routes based on the attractions
visited and which route(s) a rider would use to visit that combination of attractions. The results
of this analysis indicate the following:
▪ Approximately 60% of riders would utilize the Airport-Downtown route to access
their destinations
▪ Approximately 35% of riders would utilize the Seawall route to access their
destinations
▪ Approximately 5% of riders would utilize the Broadway route to access their
destinations
This equates to a forecast of ridership by route as shown in Table 6.5. Because no service is proposed
on the Broadway route during the off-peak period, the 5% ridership share of the Broadway route in the
peak period is attributed to the Airport-Downtown route in the off-peak period.
3 http://www.pewinternet.org/fact-sheet/mobile/ 4 http://www.galvestonparkboard.org/174/Hotel-Occupancy-Tax
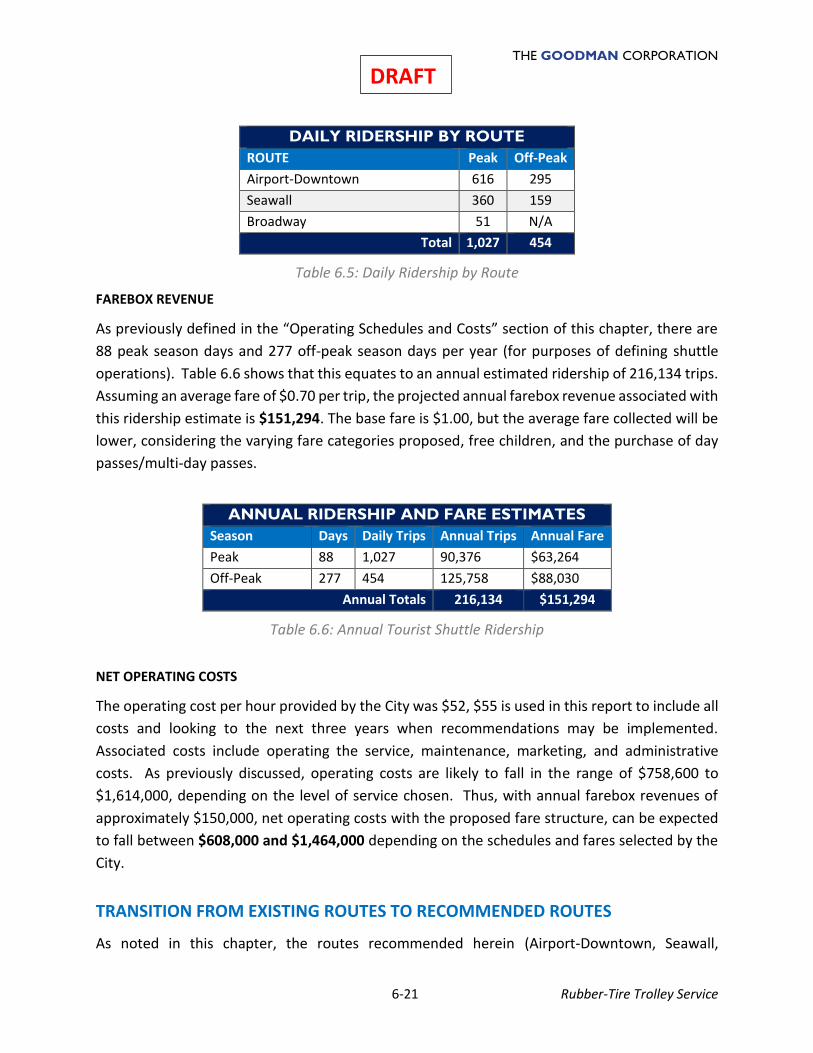
THE GOODMAN CORPORATION
6-21 Rubber-Tire Trolley Service
DRAFT
DAILY RIDERSHIP BY ROUTE
ROUTE Peak Off-Peak
Airport-Downtown 616 295
Seawall 360 159
Broadway 51 N/A
Total 1,027 454
Table 6.5: Daily Ridership by Route
FAREBOX REVENUE
As previously defined in the “Operating Schedules and Costs” section of this chapter, there are
88 peak season days and 277 off-peak season days per year (for purposes of defining shuttle
operations). Table 6.6 shows that this equates to an annual estimated ridership of 216,134 trips.
Assuming an average fare of $0.70 per trip, the projected annual farebox revenue associated with
this ridership estimate is $151,294. The base fare is $1.00, but the average fare collected will be
lower, considering the varying fare categories proposed, free children, and the purchase of day
passes/multi-day passes.
ANNUAL RIDERSHIP AND FARE ESTIMATES
Season Days Daily Trips Annual Trips Annual Fare
Peak 88 1,027 90,376 $63,264
Off-Peak 277 454 125,758 $88,030
Annual Totals 216,134 $151,294
Table 6.6: Annual Tourist Shuttle Ridership
NET OPERATING COSTS
The operating cost per hour provided by the City was $52, $55 is used in this report to include all
costs and looking to the next three years when recommendations may be implemented.
Associated costs include operating the service, maintenance, marketing, and administrative
costs. As previously discussed, operating costs are likely to fall in the range of $758,600 to
$1,614,000, depending on the level of service chosen. Thus, with annual farebox revenues of
approximately $150,000, net operating costs with the proposed fare structure, can be expected
to fall between $608,000 and $1,464,000 depending on the schedules and fares selected by the
City.
TRANSITION FROM EXISTING ROUTES TO RECOMMENDED ROUTES
As noted in this chapter, the routes recommended herein (Airport-Downtown, Seawall,
THE GOODMAN CORPORATION
6-22 Rubber-Tire Trolley Service
DRAFT Broadway) differ from the routes currently being operated. Aside from the advantages of each
recommended route’s design as already discussed, it is also worth noting other considerations
that would make it advantageous to transition from the current routes to the recommended
routes.
▪ The routes currently being operated offer no direct connection between the
airport attractions and downtown. Rather, a rider traveling between these two
trip ends must transfer at Beach Central. The cell phone data presented in Chapter
2 reveals far more trip interchanges between the airport attractions and
downtown than between the airport attractions and Stewart Beach. Thus, it
would be to riders’ advantage to create a “one seat ride” between the airport
attractions and downtown, thereby eliminating the need to transfer. This one seat
ride is provided by the Airport-Downtown route recommended in this study.
▪ The downtown shuttle route currently being operated will become redundant
upon the rail trolley’s return to operation. When this happens, vehicle rubber-tire
vehicle assets will be freed up. This would be a natural transition point at which
to change the current Seawall shuttle routing to the recommended Airport-
Downtown route and re-deploy the available rubber-tire vehicle assets to the
recommended Seawall route (89th to Stewart Beach). This will also double the
service level between 81st and 25th which is the service target for the peak summer
season.
▪ The City may choose not to wait for the rail trolley resumption of service (currently
projected for the first quarter of calendar year 2019) to modify the shuttle routing
for the summer of 2018. Earlier implementation of the recommended routes
would allow for the Airport-Downtown one seat ride to be offered to visitors in
the Summer 2018 season, which may yield higher ridership than was seen in
Summer 2017. If desired, the downtown end of the Airport-Downtown route
could be temporarily modified to include the rail trolley downtown loop (as the
current route does), until rail trolley operations resume.
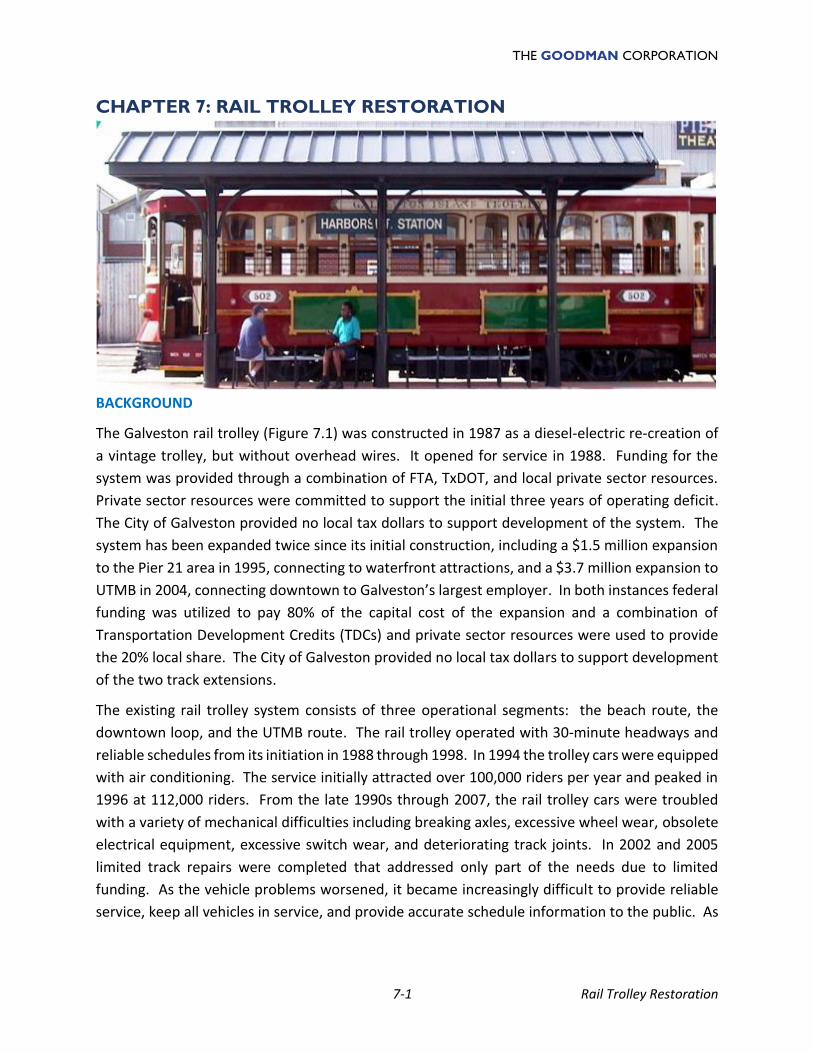
THE GOODMAN CORPORATION
7-1 Rail Trolley Restoration
CHAPTER 7: RAIL TROLLEY RESTORATION
BACKGROUND
The Galveston rail trolley (Figure 7.1) was constructed in 1987 as a diesel-electric re-creation of
a vintage trolley, but without overhead wires. It opened for service in 1988. Funding for the
system was provided through a combination of FTA, TxDOT, and local private sector resources.
Private sector resources were committed to support the initial three years of operating deficit.
The City of Galveston provided no local tax dollars to support development of the system. The
system has been expanded twice since its initial construction, including a $1.5 million expansion
to the Pier 21 area in 1995, connecting to waterfront attractions, and a $3.7 million expansion to
UTMB in 2004, connecting downtown to Galveston’s largest employer. In both instances federal
funding was utilized to pay 80% of the capital cost of the expansion and a combination of
Transportation Development Credits (TDCs) and private sector resources were used to provide
the 20% local share. The City of Galveston provided no local tax dollars to support development
of the two track extensions.
The existing rail trolley system consists of three operational segments: the beach route, the
downtown loop, and the UTMB route. The rail trolley operated with 30-minute headways and
reliable schedules from its initiation in 1988 through 1998. In 1994 the trolley cars were equipped
with air conditioning. The service initially attracted over 100,000 riders per year and peaked in
1996 at 112,000 riders. From the late 1990s through 2007, the rail trolley cars were troubled
with a variety of mechanical difficulties including breaking axles, excessive wheel wear, obsolete
electrical equipment, excessive switch wear, and deteriorating track joints. In 2002 and 2005
limited track repairs were completed that addressed only part of the needs due to limited
funding. As the vehicle problems worsened, it became increasingly difficult to provide reliable
service, keep all vehicles in service, and provide accurate schedule information to the public. As
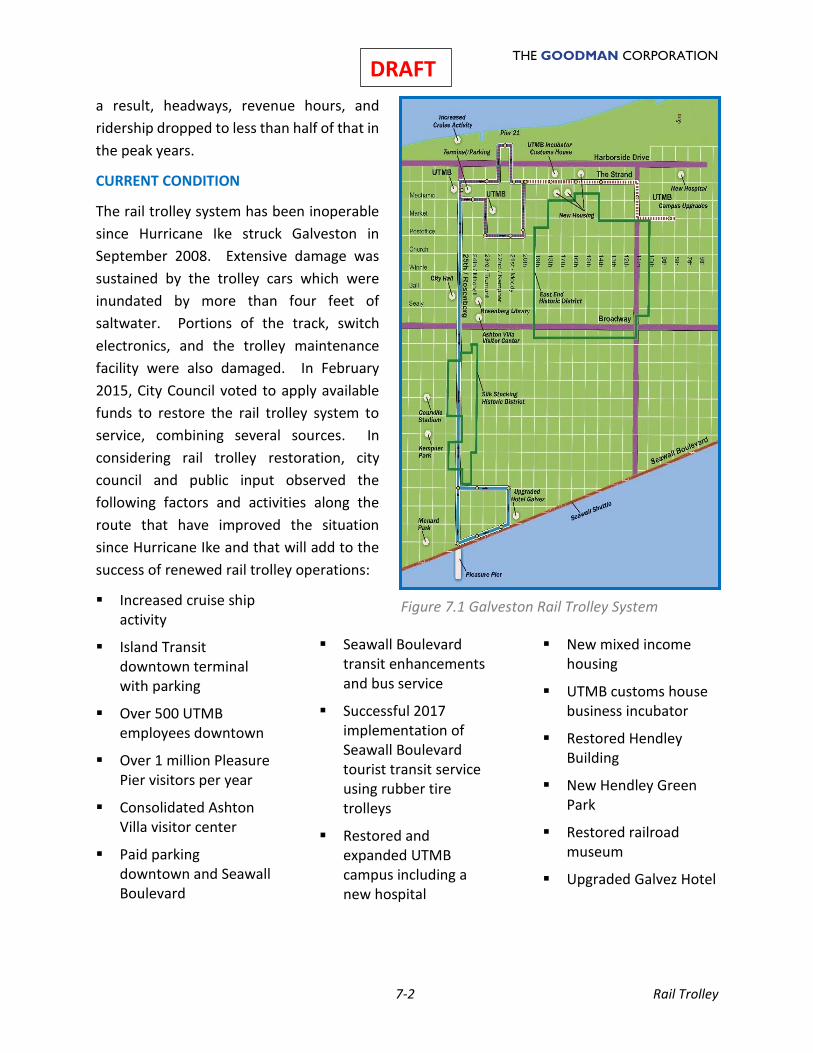
THE GOODMAN CORPORATION
7-2 Rail Trolley
DRAFT
a result, headways, revenue hours, and
ridership dropped to less than half of that in
the peak years.
CURRENT CONDITION
The rail trolley system has been inoperable
since Hurricane Ike struck Galveston in
September 2008. Extensive damage was
sustained by the trolley cars which were
inundated by more than four feet of
saltwater. Portions of the track, switch
electronics, and the trolley maintenance
facility were also damaged. In February
2015, City Council voted to apply available
funds to restore the rail trolley system to
service, combining several sources. In
considering rail trolley restoration, city
council and public input observed the
following factors and activities along the
route that have improved the situation
since Hurricane Ike and that will add to the
success of renewed rail trolley operations:
▪ Increased cruise ship activity
▪ Island Transit downtown terminal with parking
▪ Over 500 UTMB employees downtown
▪ Over 1 million Pleasure Pier visitors per year
▪ Consolidated Ashton Villa visitor center
▪ Paid parking downtown and Seawall Boulevard
▪ Seawall Boulevard transit enhancements and bus service
▪ Successful 2017 implementation of Seawall Boulevard tourist transit service using rubber tire trolleys
▪ Restored and expanded UTMB campus including a new hospital
▪ New mixed income housing
▪ UTMB customs house business incubator
▪ Restored Hendley Building
▪ New Hendley Green Park
▪ Restored railroad museum
▪ Upgraded Galvez Hotel
Figure 7.1 Galveston Rail Trolley System
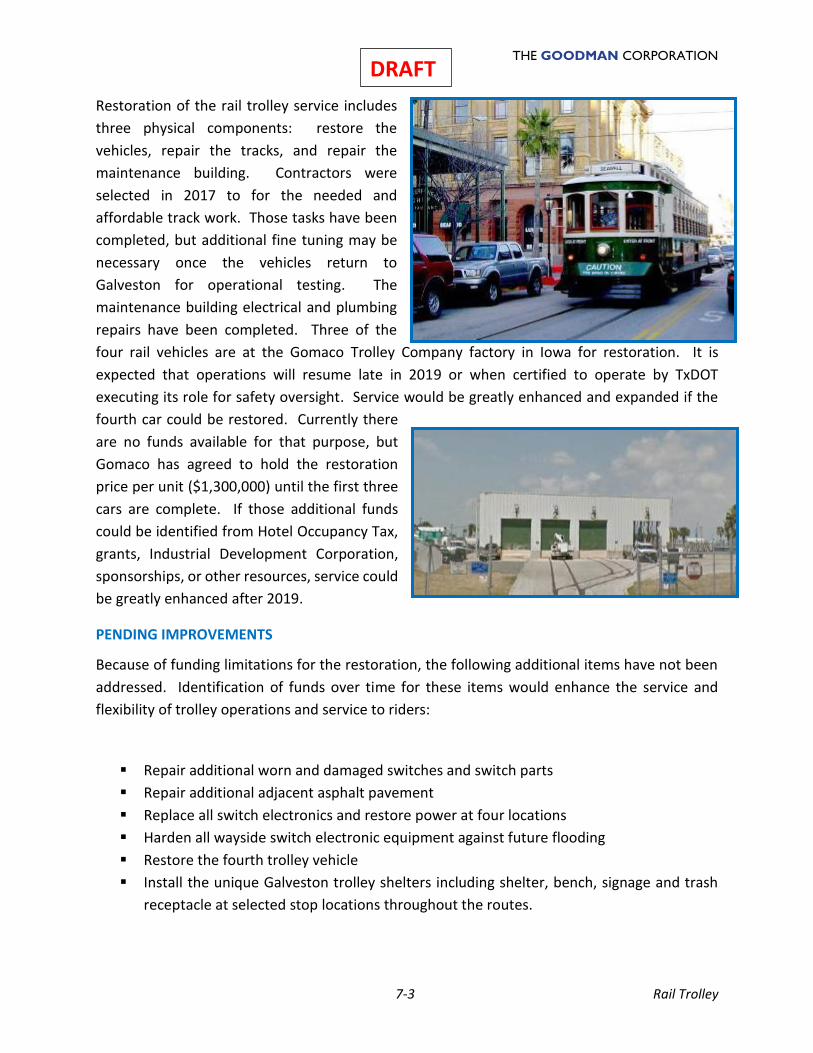
THE GOODMAN CORPORATION
7-3 Rail Trolley
DRAFT
Restoration of the rail trolley service includes
three physical components: restore the
vehicles, repair the tracks, and repair the
maintenance building. Contractors were
selected in 2017 to for the needed and
affordable track work. Those tasks have been
completed, but additional fine tuning may be
necessary once the vehicles return to
Galveston for operational testing. The
maintenance building electrical and plumbing
repairs have been completed. Three of the
four rail vehicles are at the Gomaco Trolley Company factory in Iowa for restoration. It is
expected that operations will resume late in 2019 or when certified to operate by TxDOT
executing its role for safety oversight. Service would be greatly enhanced and expanded if the
fourth car could be restored. Currently there
are no funds available for that purpose, but
Gomaco has agreed to hold the restoration
price per unit ($1,300,000) until the first three
cars are complete. If those additional funds
could be identified from Hotel Occupancy Tax,
grants, Industrial Development Corporation,
sponsorships, or other resources, service could
be greatly enhanced after 2019.
PENDING IMPROVEMENTS
Because of funding limitations for the restoration, the following additional items have not been
addressed. Identification of funds over time for these items would enhance the service and
flexibility of trolley operations and service to riders:
▪ Repair additional worn and damaged switches and switch parts
▪ Repair additional adjacent asphalt pavement
▪ Replace all switch electronics and restore power at four locations
▪ Harden all wayside switch electronic equipment against future flooding
▪ Restore the fourth trolley vehicle
▪ Install the unique Galveston trolley shelters including shelter, bench, signage and trash
receptacle at selected stop locations throughout the routes.
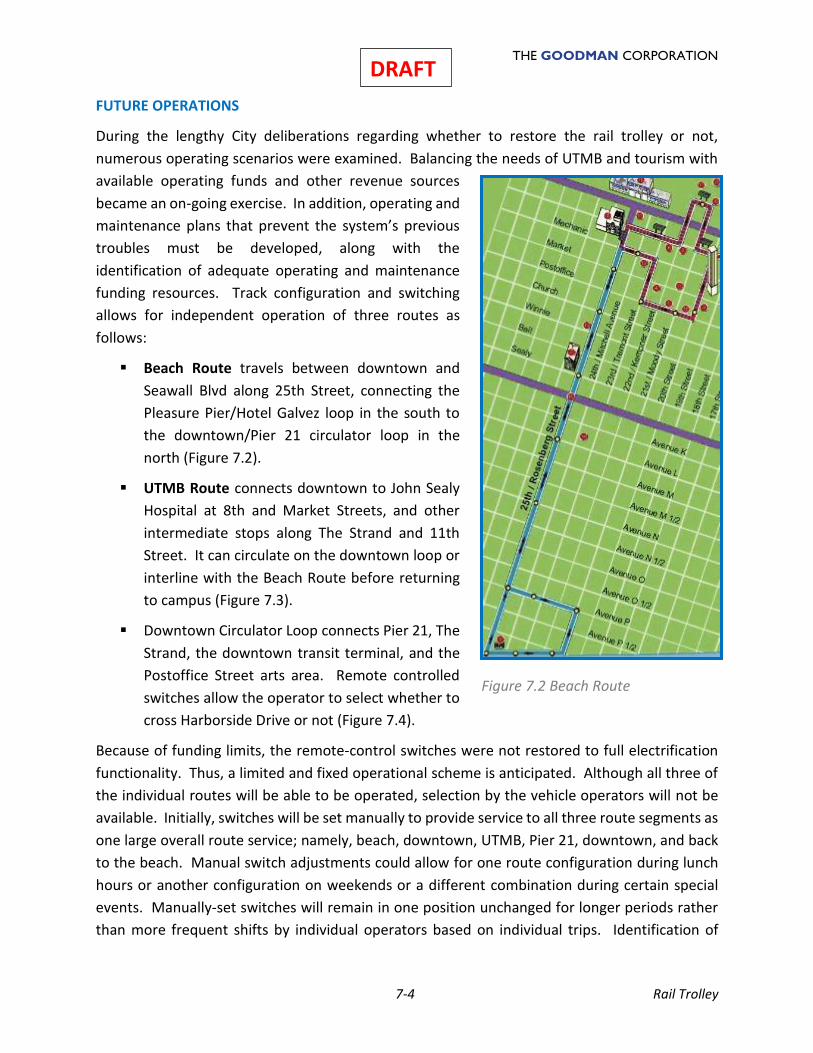
THE GOODMAN CORPORATION
7-4 Rail Trolley
DRAFT
FUTURE OPERATIONS
During the lengthy City deliberations regarding whether to restore the rail trolley or not,
numerous operating scenarios were examined. Balancing the needs of UTMB and tourism with
available operating funds and other revenue sources
became an on-going exercise. In addition, operating and
maintenance plans that prevent the system’s previous
troubles must be developed, along with the
identification of adequate operating and maintenance
funding resources. Track configuration and switching
allows for independent operation of three routes as
follows:
▪ Beach Route travels between downtown and
Seawall Blvd along 25th Street, connecting the
Pleasure Pier/Hotel Galvez loop in the south to
the downtown/Pier 21 circulator loop in the
north (Figure 7.2).
▪ UTMB Route connects downtown to John Sealy
Hospital at 8th and Market Streets, and other
intermediate stops along The Strand and 11th
Street. It can circulate on the downtown loop or
interline with the Beach Route before returning
to campus (Figure 7.3).
▪ Downtown Circulator Loop connects Pier 21, The
Strand, the downtown transit terminal, and the
Postoffice Street arts area. Remote controlled
switches allow the operator to select whether to
cross Harborside Drive or not (Figure 7.4).
Because of funding limits, the remote-control switches were not restored to full electrification
functionality. Thus, a limited and fixed operational scheme is anticipated. Although all three of
the individual routes will be able to be operated, selection by the vehicle operators will not be
available. Initially, switches will be set manually to provide service to all three route segments as
one large overall route service; namely, beach, downtown, UTMB, Pier 21, downtown, and back
to the beach. Manual switch adjustments could allow for one route configuration during lunch
hours or another configuration on weekends or a different combination during certain special
events. Manually-set switches will remain in one position unchanged for longer periods rather
than more frequent shifts by individual operators based on individual trips. Identification of
Figure 7.2 Beach Route
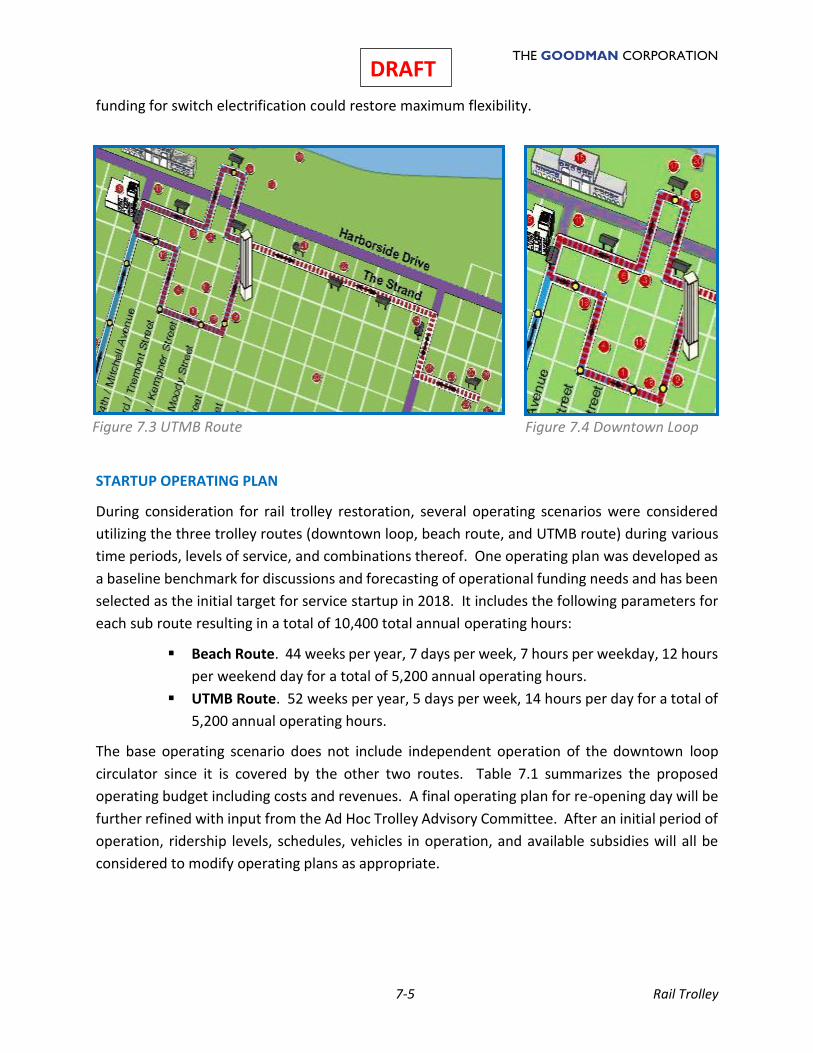
THE GOODMAN CORPORATION
7-5 Rail Trolley
DRAFT
funding for switch electrification could restore maximum flexibility.
STARTUP OPERATING PLAN
During consideration for rail trolley restoration, several operating scenarios were considered
utilizing the three trolley routes (downtown loop, beach route, and UTMB route) during various
time periods, levels of service, and combinations thereof. One operating plan was developed as
a baseline benchmark for discussions and forecasting of operational funding needs and has been
selected as the initial target for service startup in 2018. It includes the following parameters for
each sub route resulting in a total of 10,400 total annual operating hours:
▪ Beach Route. 44 weeks per year, 7 days per week, 7 hours per weekday, 12 hours
per weekend day for a total of 5,200 annual operating hours.
▪ UTMB Route. 52 weeks per year, 5 days per week, 14 hours per day for a total of
5,200 annual operating hours.
The base operating scenario does not include independent operation of the downtown loop
circulator since it is covered by the other two routes. Table 7.1 summarizes the proposed
operating budget including costs and revenues. A final operating plan for re-opening day will be
further refined with input from the Ad Hoc Trolley Advisory Committee. After an initial period of
operation, ridership levels, schedules, vehicles in operation, and available subsidies will all be
considered to modify operating plans as appropriate.
Figure 7.3 UTMB Route
Figure 7.4 Downtown Loop
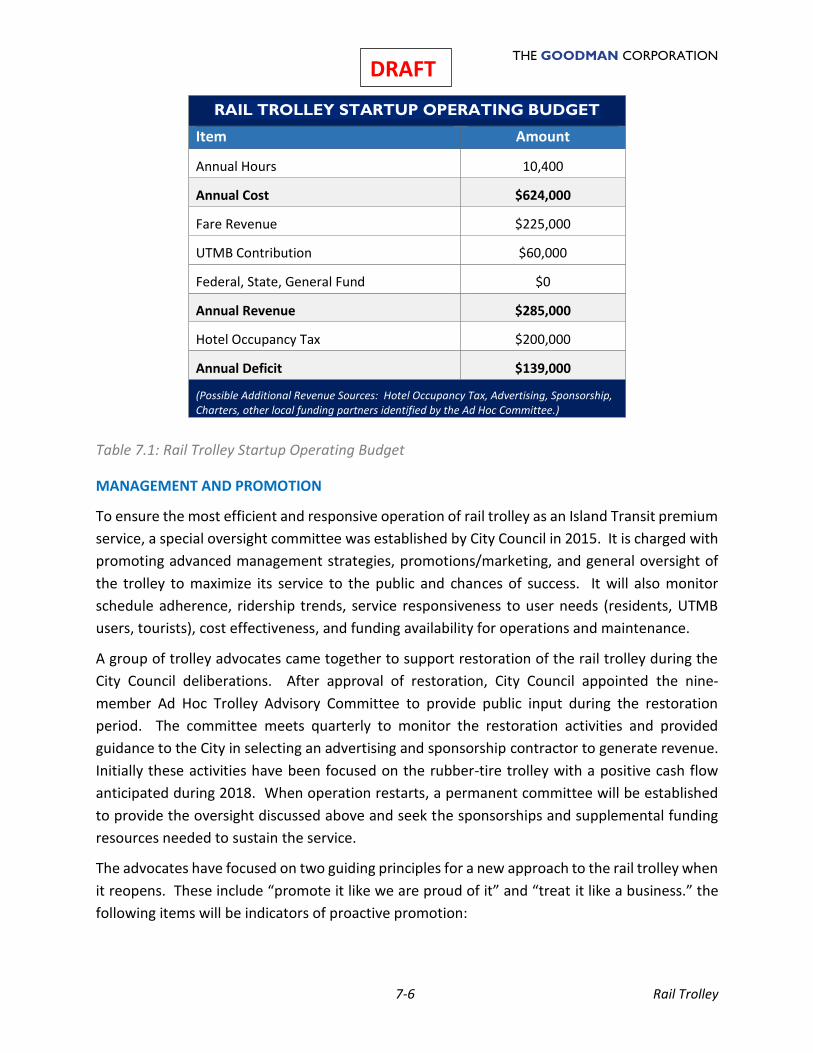
THE GOODMAN CORPORATION
7-6 Rail Trolley
DRAFT
RAIL TROLLEY STARTUP OPERATING BUDGET
Item Amount
Annual Hours 10,400
Annual Cost $624,000
Fare Revenue $225,000
UTMB Contribution $60,000
Federal, State, General Fund $0
Annual Revenue $285,000
Hotel Occupancy Tax $200,000
Annual Deficit $139,000
(Possible Additional Revenue Sources: Hotel Occupancy Tax, Advertising, Sponsorship, Charters, other local funding partners identified by the Ad Hoc Committee.)
Table 7.1: Rail Trolley Startup Operating Budget
MANAGEMENT AND PROMOTION
To ensure the most efficient and responsive operation of rail trolley as an Island Transit premium
service, a special oversight committee was established by City Council in 2015. It is charged with
promoting advanced management strategies, promotions/marketing, and general oversight of
the trolley to maximize its service to the public and chances of success. It will also monitor
schedule adherence, ridership trends, service responsiveness to user needs (residents, UTMB
users, tourists), cost effectiveness, and funding availability for operations and maintenance.
A group of trolley advocates came together to support restoration of the rail trolley during the
City Council deliberations. After approval of restoration, City Council appointed the nine-
member Ad Hoc Trolley Advisory Committee to provide public input during the restoration
period. The committee meets quarterly to monitor the restoration activities and provided
guidance to the City in selecting an advertising and sponsorship contractor to generate revenue.
Initially these activities have been focused on the rubber-tire trolley with a positive cash flow
anticipated during 2018. When operation restarts, a permanent committee will be established
to provide the oversight discussed above and seek the sponsorships and supplemental funding
resources needed to sustain the service.
The advocates have focused on two guiding principles for a new approach to the rail trolley when
it reopens. These include “promote it like we are proud of it” and “treat it like a business.” the
following items will be indicators of proactive promotion:
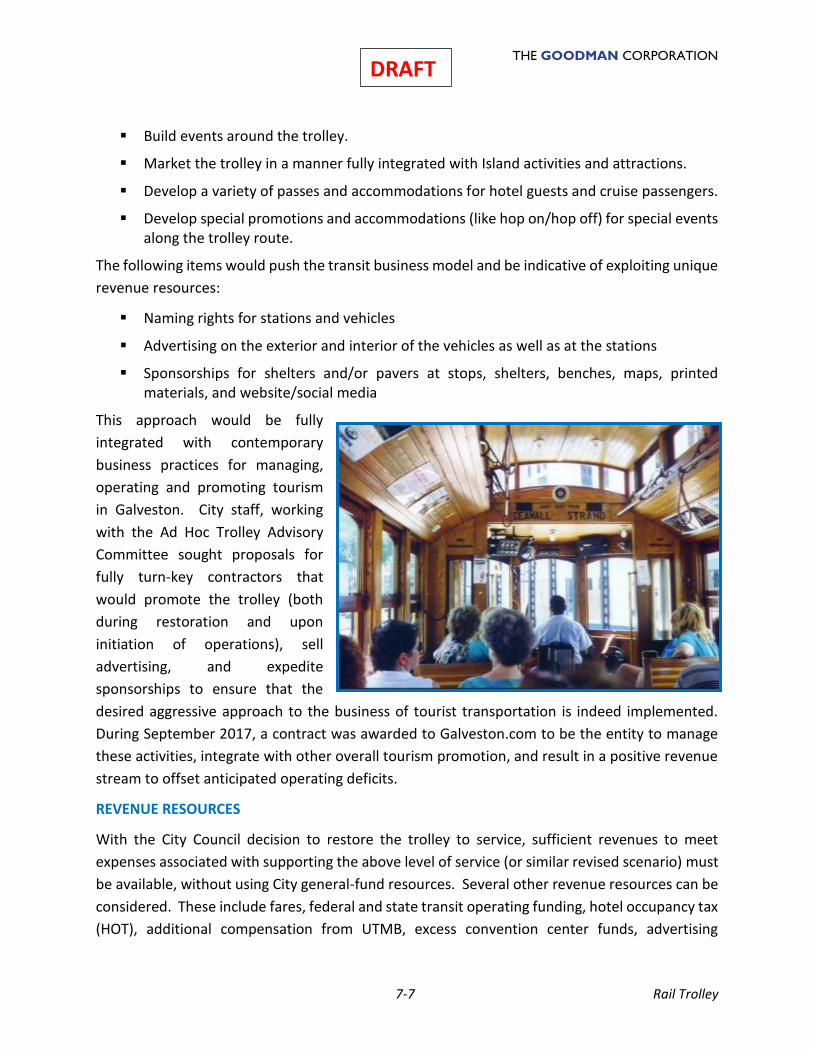
THE GOODMAN CORPORATION
7-7 Rail Trolley
DRAFT
▪ Build events around the trolley.
▪ Market the trolley in a manner fully integrated with Island activities and attractions.
▪ Develop a variety of passes and accommodations for hotel guests and cruise passengers.
▪ Develop special promotions and accommodations (like hop on/hop off) for special events along the trolley route.
The following items would push the transit business model and be indicative of exploiting unique
revenue resources:
▪ Naming rights for stations and vehicles
▪ Advertising on the exterior and interior of the vehicles as well as at the stations
▪ Sponsorships for shelters and/or pavers at stops, shelters, benches, maps, printed materials, and website/social media
This approach would be fully
integrated with contemporary
business practices for managing,
operating and promoting tourism
in Galveston. City staff, working
with the Ad Hoc Trolley Advisory
Committee sought proposals for
fully turn-key contractors that
would promote the trolley (both
during restoration and upon
initiation of operations), sell
advertising, and expedite
sponsorships to ensure that the
desired aggressive approach to the business of tourist transportation is indeed implemented.
During September 2017, a contract was awarded to Galveston.com to be the entity to manage
these activities, integrate with other overall tourism promotion, and result in a positive revenue
stream to offset anticipated operating deficits.
REVENUE RESOURCES
With the City Council decision to restore the trolley to service, sufficient revenues to meet
expenses associated with supporting the above level of service (or similar revised scenario) must
be available, without using City general-fund resources. Several other revenue resources can be
considered. These include fares, federal and state transit operating funding, hotel occupancy tax
(HOT), additional compensation from UTMB, excess convention center funds, advertising
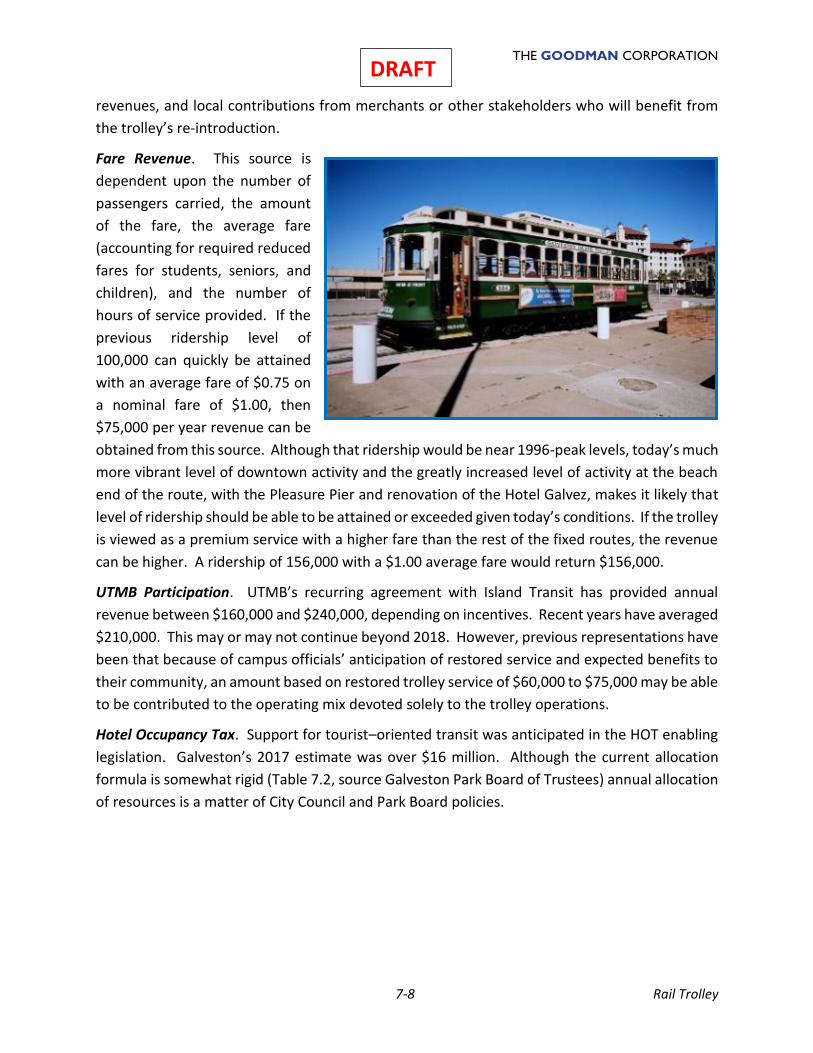
THE GOODMAN CORPORATION
7-8 Rail Trolley
DRAFT
revenues, and local contributions from merchants or other stakeholders who will benefit from
the trolley’s re-introduction.
Fare Revenue. This source is
dependent upon the number of
passengers carried, the amount
of the fare, the average fare
(accounting for required reduced
fares for students, seniors, and
children), and the number of
hours of service provided. If the
previous ridership level of
100,000 can quickly be attained
with an average fare of $0.75 on
a nominal fare of $1.00, then
$75,000 per year revenue can be
obtained from this source. Although that ridership would be near 1996-peak levels, today’s much
more vibrant level of downtown activity and the greatly increased level of activity at the beach
end of the route, with the Pleasure Pier and renovation of the Hotel Galvez, makes it likely that
level of ridership should be able to be attained or exceeded given today’s conditions. If the trolley
is viewed as a premium service with a higher fare than the rest of the fixed routes, the revenue
can be higher. A ridership of 156,000 with a $1.00 average fare would return $156,000.
UTMB Participation. UTMB’s recurring agreement with Island Transit has provided annual
revenue between $160,000 and $240,000, depending on incentives. Recent years have averaged
$210,000. This may or may not continue beyond 2018. However, previous representations have
been that because of campus officials’ anticipation of restored service and expected benefits to
their community, an amount based on restored trolley service of $60,000 to $75,000 may be able
to be contributed to the operating mix devoted solely to the trolley operations.
Hotel Occupancy Tax. Support for tourist–oriented transit was anticipated in the HOT enabling
legislation. Galveston’s 2017 estimate was over $16 million. Although the current allocation
formula is somewhat rigid (Table 7.2, source Galveston Park Board of Trustees) annual allocation
of resources is a matter of City Council and Park Board policies.
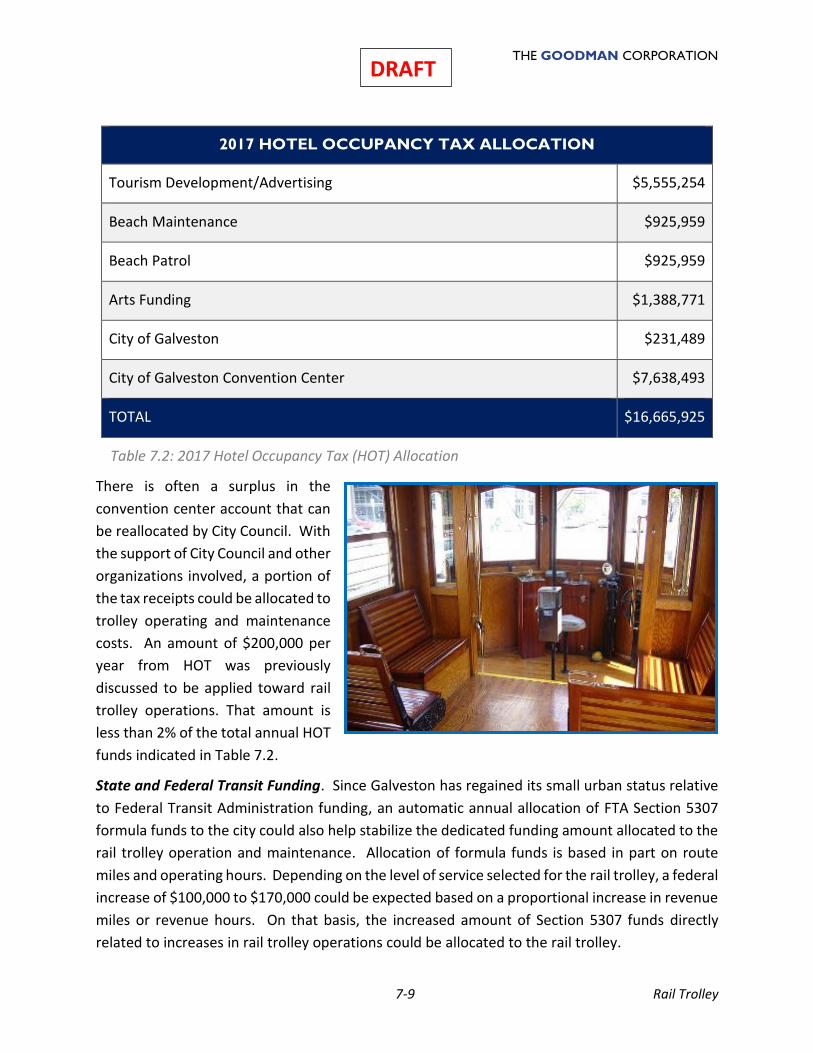
THE GOODMAN CORPORATION
7-9 Rail Trolley
DRAFT
2017 HOTEL OCCUPANCY TAX ALLOCATION
Tourism Development/Advertising $5,555,254
Beach Maintenance $925,959
Beach Patrol $925,959
Arts Funding $1,388,771
City of Galveston $231,489
City of Galveston Convention Center $7,638,493
TOTAL $16,665,925
Table 7.2: 2017 Hotel Occupancy Tax (HOT) Allocation
There is often a surplus in the
convention center account that can
be reallocated by City Council. With
the support of City Council and other
organizations involved, a portion of
the tax receipts could be allocated to
trolley operating and maintenance
costs. An amount of $200,000 per
year from HOT was previously
discussed to be applied toward rail
trolley operations. That amount is
less than 2% of the total annual HOT
funds indicated in Table 7.2.
State and Federal Transit Funding. Since Galveston has regained its small urban status relative
to Federal Transit Administration funding, an automatic annual allocation of FTA Section 5307
formula funds to the city could also help stabilize the dedicated funding amount allocated to the
rail trolley operation and maintenance. Allocation of formula funds is based in part on route
miles and operating hours. Depending on the level of service selected for the rail trolley, a federal
increase of $100,000 to $170,000 could be expected based on a proportional increase in revenue
miles or revenue hours. On that basis, the increased amount of Section 5307 funds directly
related to increases in rail trolley operations could be allocated to the rail trolley.
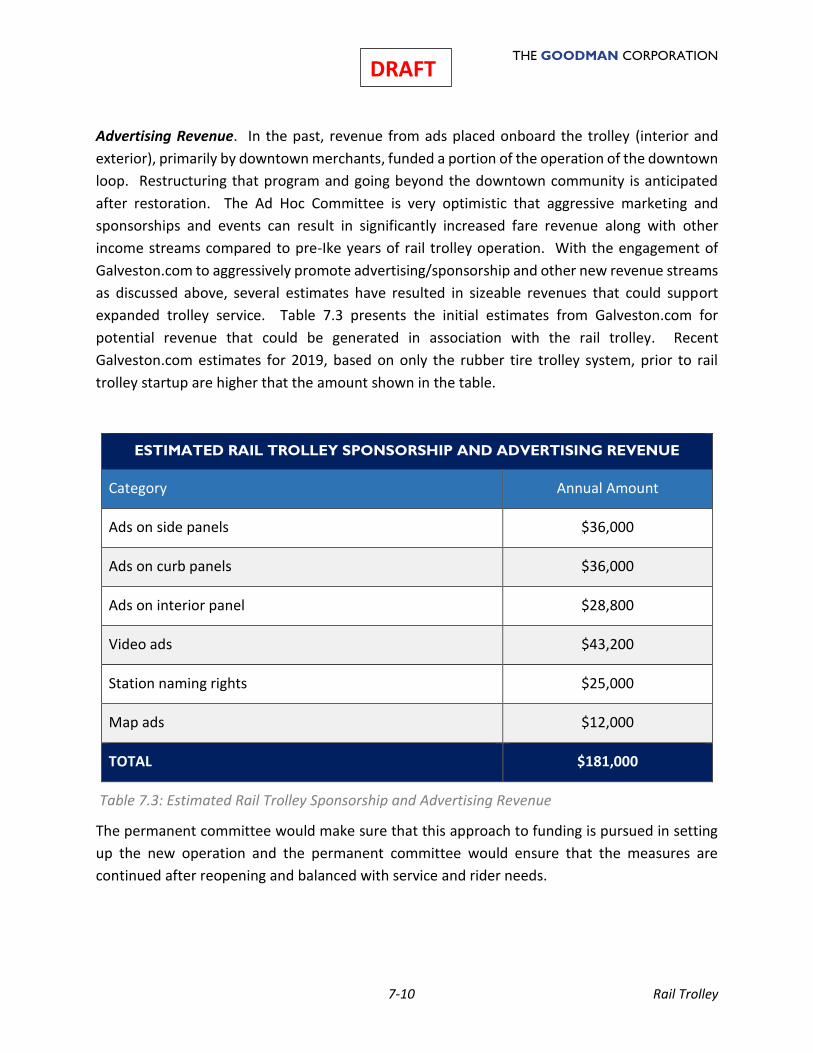
THE GOODMAN CORPORATION
7-10 Rail Trolley
DRAFT
Advertising Revenue. In the past, revenue from ads placed onboard the trolley (interior and
exterior), primarily by downtown merchants, funded a portion of the operation of the downtown
loop. Restructuring that program and going beyond the downtown community is anticipated
after restoration. The Ad Hoc Committee is very optimistic that aggressive marketing and
sponsorships and events can result in significantly increased fare revenue along with other
income streams compared to pre-Ike years of rail trolley operation. With the engagement of
Galveston.com to aggressively promote advertising/sponsorship and other new revenue streams
as discussed above, several estimates have resulted in sizeable revenues that could support
expanded trolley service. Table 7.3 presents the initial estimates from Galveston.com for
potential revenue that could be generated in association with the rail trolley. Recent
Galveston.com estimates for 2019, based on only the rubber tire trolley system, prior to rail
trolley startup are higher that the amount shown in the table.
ESTIMATED RAIL TROLLEY SPONSORSHIP AND ADVERTISING REVENUE
Category Annual Amount
Ads on side panels $36,000
Ads on curb panels $36,000
Ads on interior panel $28,800
Video ads $43,200
Station naming rights $25,000
Map ads $12,000
TOTAL $181,000
Table 7.3: Estimated Rail Trolley Sponsorship and Advertising Revenue
The permanent committee would make sure that this approach to funding is pursued in setting
up the new operation and the permanent committee would ensure that the measures are
continued after reopening and balanced with service and rider needs.
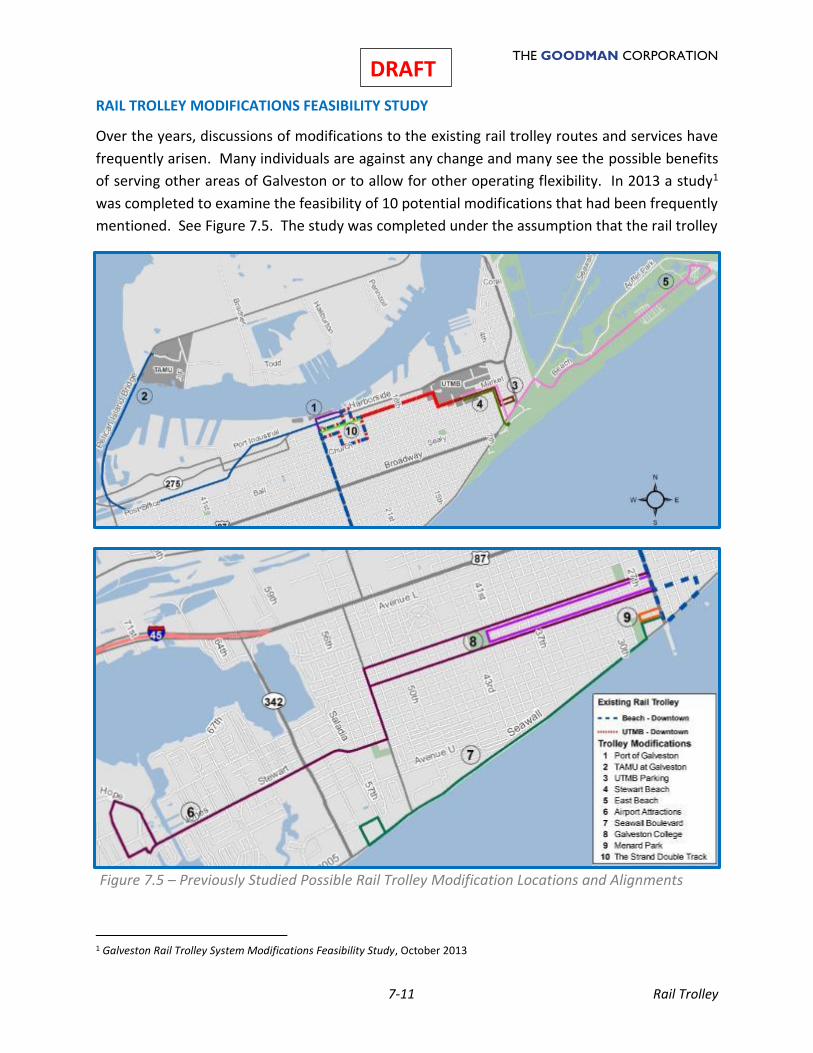
THE GOODMAN CORPORATION
7-11 Rail Trolley
DRAFT
RAIL TROLLEY MODIFICATIONS FEASIBILITY STUDY
Over the years, discussions of modifications to the existing rail trolley routes and services have
frequently arisen. Many individuals are against any change and many see the possible benefits
of serving other areas of Galveston or to allow for other operating flexibility. In 2013 a study1
was completed to examine the feasibility of 10 potential modifications that had been frequently
mentioned. See Figure 7.5. The study was completed under the assumption that the rail trolley
1 Galveston Rail Trolley System Modifications Feasibility Study, October 2013
Figure 7.5 – Previously Studied Possible Rail Trolley Modification Locations and Alignments
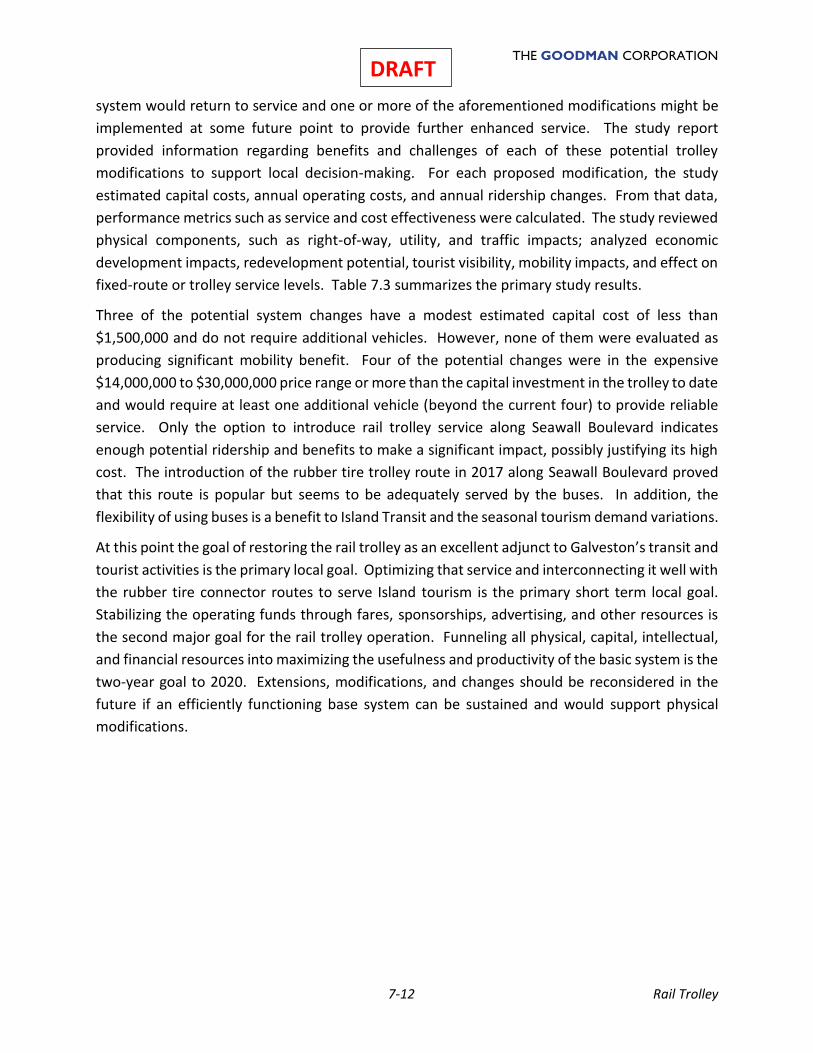
THE GOODMAN CORPORATION
7-12 Rail Trolley
DRAFT
system would return to service and one or more of the aforementioned modifications might be
implemented at some future point to provide further enhanced service. The study report
provided information regarding benefits and challenges of each of these potential trolley
modifications to support local decision-making. For each proposed modification, the study
estimated capital costs, annual operating costs, and annual ridership changes. From that data,
performance metrics such as service and cost effectiveness were calculated. The study reviewed
physical components, such as right-of-way, utility, and traffic impacts; analyzed economic
development impacts, redevelopment potential, tourist visibility, mobility impacts, and effect on
fixed-route or trolley service levels. Table 7.3 summarizes the primary study results.
Three of the potential system changes have a modest estimated capital cost of less than
$1,500,000 and do not require additional vehicles. However, none of them were evaluated as
producing significant mobility benefit. Four of the potential changes were in the expensive
$14,000,000 to $30,000,000 price range or more than the capital investment in the trolley to date
and would require at least one additional vehicle (beyond the current four) to provide reliable
service. Only the option to introduce rail trolley service along Seawall Boulevard indicates
enough potential ridership and benefits to make a significant impact, possibly justifying its high
cost. The introduction of the rubber tire trolley route in 2017 along Seawall Boulevard proved
that this route is popular but seems to be adequately served by the buses. In addition, the
flexibility of using buses is a benefit to Island Transit and the seasonal tourism demand variations.
At this point the goal of restoring the rail trolley as an excellent adjunct to Galveston’s transit and
tourist activities is the primary local goal. Optimizing that service and interconnecting it well with
the rubber tire connector routes to serve Island tourism is the primary short term local goal.
Stabilizing the operating funds through fares, sponsorships, advertising, and other resources is
the second major goal for the rail trolley operation. Funneling all physical, capital, intellectual,
and financial resources into maximizing the usefulness and productivity of the basic system is the
two-year goal to 2020. Extensions, modifications, and changes should be reconsidered in the
future if an efficiently functioning base system can be sustained and would support physical
modifications.
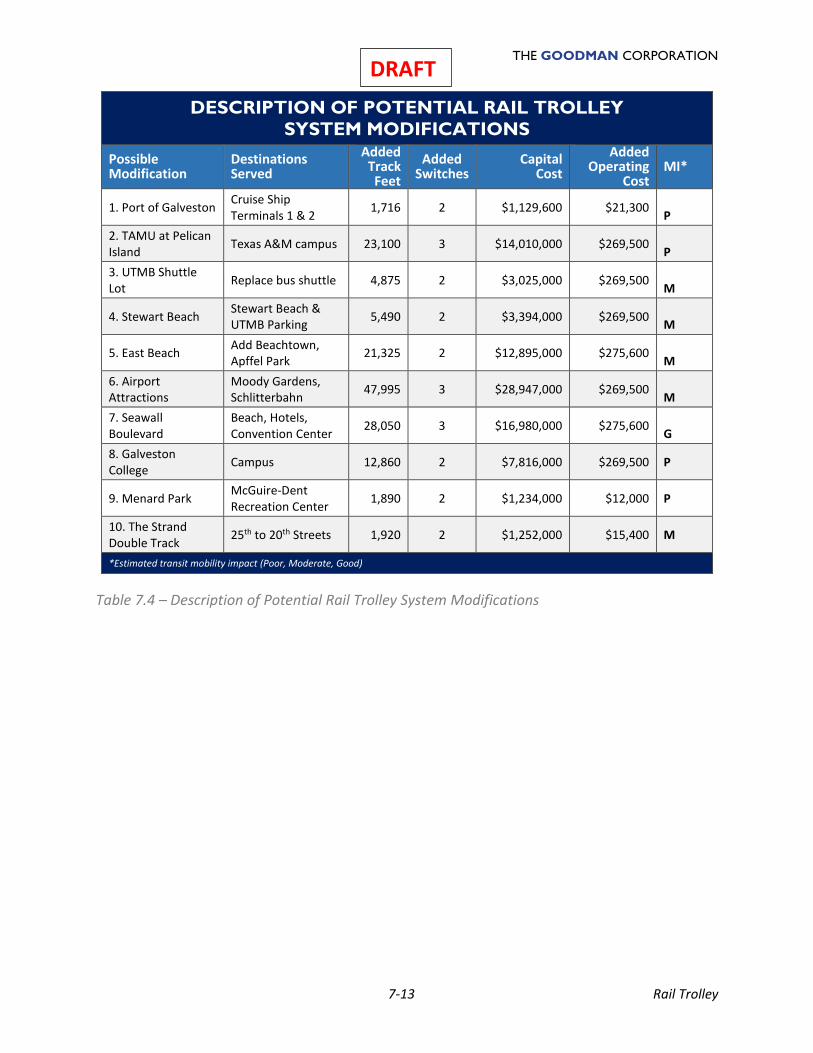
THE GOODMAN CORPORATION
7-13 Rail Trolley
DRAFT
Table 7.4 – Description of Potential Rail Trolley System Modifications
DESCRIPTION OF POTENTIAL RAIL TROLLEY
SYSTEM MODIFICATIONS
Possible Modification
Destinations Served
Added Track Feet
Added Switches
Capital Cost
Added Operating
Cost MI*
1. Port of Galveston Cruise Ship Terminals 1 & 2
1,716 2 $1,129,600 $21,300 P
2. TAMU at Pelican Island
Texas A&M campus 23,100 3 $14,010,000 $269,500 P
3. UTMB Shuttle Lot
Replace bus shuttle 4,875 2 $3,025,000 $269,500 M
4. Stewart Beach Stewart Beach & UTMB Parking
5,490 2 $3,394,000 $269,500 M
5. East Beach Add Beachtown, Apffel Park
21,325 2 $12,895,000 $275,600 M
6. Airport Attractions
Moody Gardens, Schlitterbahn
47,995 3 $28,947,000 $269,500 M
7. Seawall Boulevard
Beach, Hotels, Convention Center
28,050 3 $16,980,000 $275,600 G
8. Galveston College
Campus 12,860 2 $7,816,000 $269,500 P
9. Menard Park McGuire-Dent Recreation Center
1,890 2 $1,234,000 $12,000 P
10. The Strand Double Track
25th to 20th Streets 1,920 2 $1,252,000 $15,400 M
*Estimated transit mobility impact (Poor, Moderate, Good)

THE GOODMAN CORPORATION
7-14 Rail Trolley
DRAFT
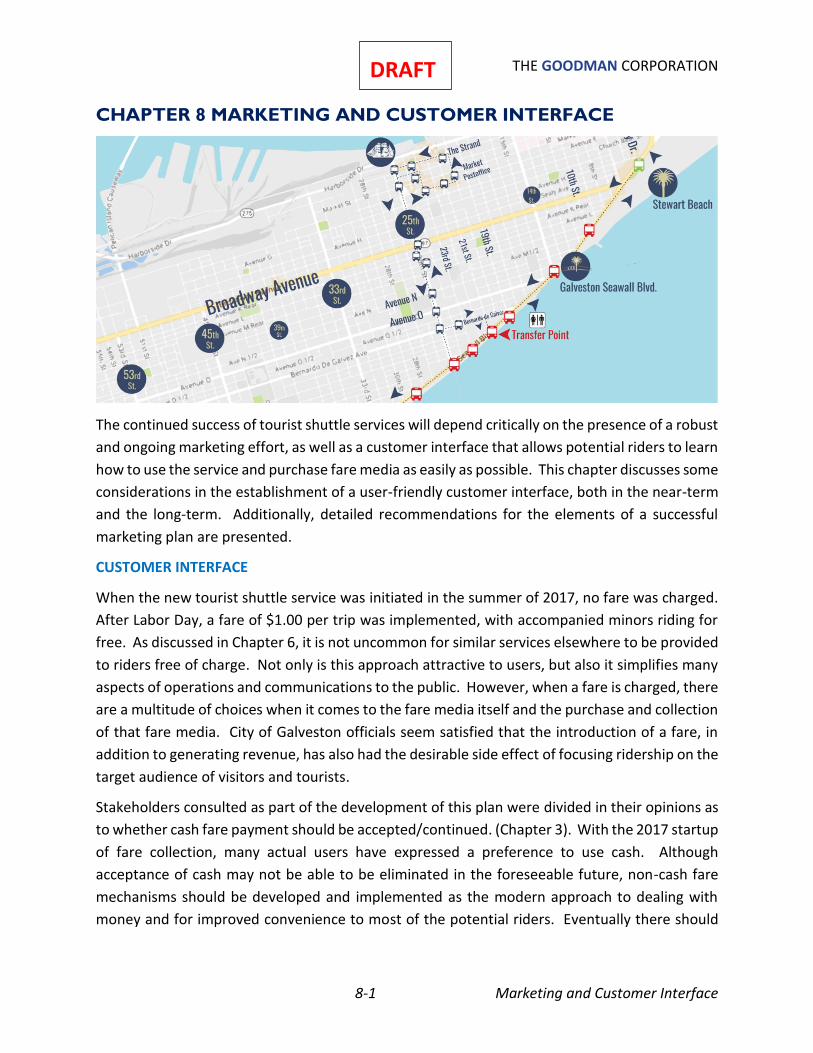
THE GOODMAN CORPORATION
8-1 Marketing and Customer Interface
DRAFT
CHAPTER 8 MARKETING AND CUSTOMER INTERFACE
The continued success of tourist shuttle services will depend critically on the presence of a robust
and ongoing marketing effort, as well as a customer interface that allows potential riders to learn
how to use the service and purchase fare media as easily as possible. This chapter discusses some
considerations in the establishment of a user-friendly customer interface, both in the near-term
and the long-term. Additionally, detailed recommendations for the elements of a successful
marketing plan are presented.
CUSTOMER INTERFACE
When the new tourist shuttle service was initiated in the summer of 2017, no fare was charged.
After Labor Day, a fare of $1.00 per trip was implemented, with accompanied minors riding for
free. As discussed in Chapter 6, it is not uncommon for similar services elsewhere to be provided
to riders free of charge. Not only is this approach attractive to users, but also it simplifies many
aspects of operations and communications to the public. However, when a fare is charged, there
are a multitude of choices when it comes to the fare media itself and the purchase and collection
of that fare media. City of Galveston officials seem satisfied that the introduction of a fare, in
addition to generating revenue, has also had the desirable side effect of focusing ridership on the
target audience of visitors and tourists.
Stakeholders consulted as part of the development of this plan were divided in their opinions as
to whether cash fare payment should be accepted/continued. (Chapter 3). With the 2017 startup
of fare collection, many actual users have expressed a preference to use cash. Although
acceptance of cash may not be able to be eliminated in the foreseeable future, non-cash fare
mechanisms should be developed and implemented as the modern approach to dealing with
money and for improved convenience to most of the potential riders. Eventually there should
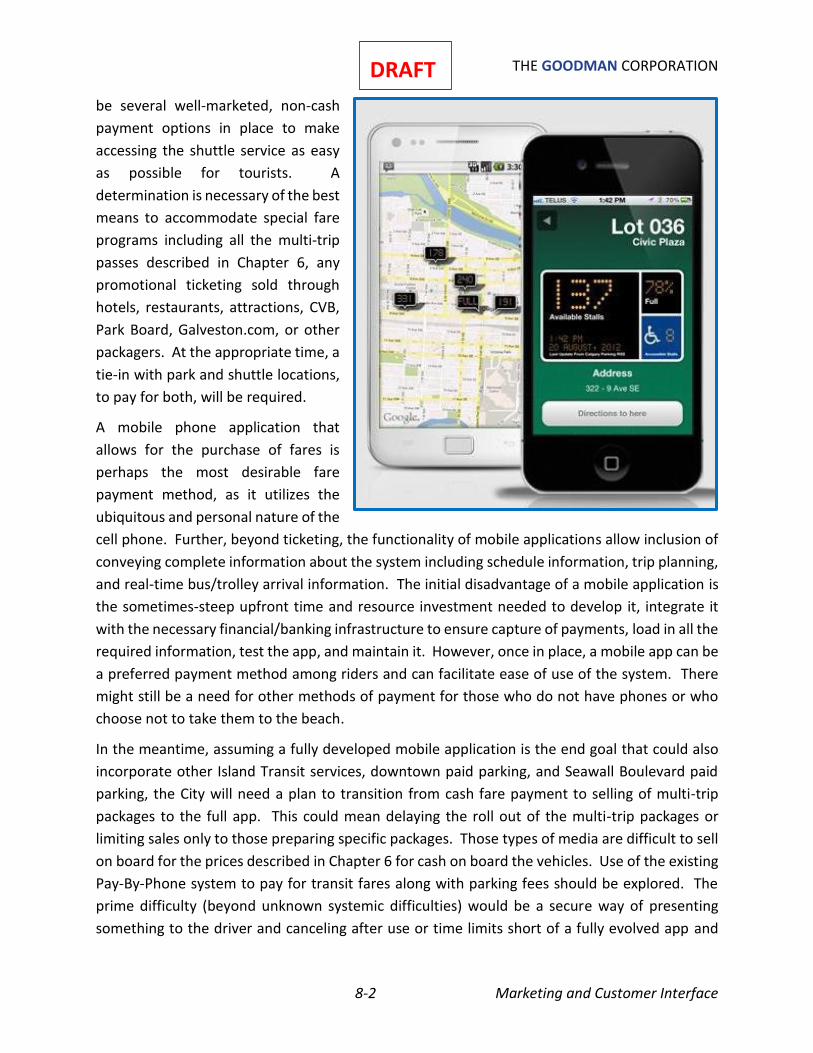
THE GOODMAN CORPORATION
8-2 Marketing and Customer Interface
DRAFT
be several well-marketed, non-cash
payment options in place to make
accessing the shuttle service as easy
as possible for tourists. A
determination is necessary of the best
means to accommodate special fare
programs including all the multi-trip
passes described in Chapter 6, any
promotional ticketing sold through
hotels, restaurants, attractions, CVB,
Park Board, Galveston.com, or other
packagers. At the appropriate time, a
tie-in with park and shuttle locations,
to pay for both, will be required.
A mobile phone application that
allows for the purchase of fares is
perhaps the most desirable fare
payment method, as it utilizes the
ubiquitous and personal nature of the
cell phone. Further, beyond ticketing, the functionality of mobile applications allow inclusion of
conveying complete information about the system including schedule information, trip planning,
and real-time bus/trolley arrival information. The initial disadvantage of a mobile application is
the sometimes-steep upfront time and resource investment needed to develop it, integrate it
with the necessary financial/banking infrastructure to ensure capture of payments, load in all the
required information, test the app, and maintain it. However, once in place, a mobile app can be
a preferred payment method among riders and can facilitate ease of use of the system. There
might still be a need for other methods of payment for those who do not have phones or who
choose not to take them to the beach.
In the meantime, assuming a fully developed mobile application is the end goal that could also
incorporate other Island Transit services, downtown paid parking, and Seawall Boulevard paid
parking, the City will need a plan to transition from cash fare payment to selling of multi-trip
packages to the full app. This could mean delaying the roll out of the multi-trip packages or
limiting sales only to those preparing specific packages. Those types of media are difficult to sell
on board for the prices described in Chapter 6 for cash on board the vehicles. Use of the existing
Pay-By-Phone system to pay for transit fares along with parking fees should be explored. The
prime difficulty (beyond unknown systemic difficulties) would be a secure way of presenting
something to the driver and canceling after use or time limits short of a fully evolved app and
THE GOODMAN CORPORATION
8-3 Marketing and Customer Interface
DRAFT
scanning technology on each bus or trolley. The task of integrating tourist shuttle fare payment
functionality into the existing parking app may prove to be on par with the development of a
new, separate dedicated tourist shuttle/transit app.
Fare cards are another widely used non-cash fare payment option. The infrastructure required
for a fare card system includes the cards themselves (which are typically made of sturdy plastic
intended for long-term use), fare card “loading” machines from which the cards can be dispensed
and/or loaded with a specific dollar amount, fare card readers installed on the buses, and the IT
software and hardware needed to download fare and ridership information when the buses
return to the bus barn. On-line sales may also be included without physically involving the cards.
However, the targeted riders of the Galveston shuttle system are visitors who are typically not in
town long enough for it to make sense to provide them with a fare card that is intended for semi-
permanent use. Thus, because the initial infrastructure and ongoing operating/maintenance
needs for a fare card system are significant, this option is not ideal for the tourist shuttle
application.
As ubiquitous as cell phones are today, there will still be those riders who cannot or do not wish
to use a mobile app to purchase fare media. Not accepting cash fare payments on-board the
vehicles will mean that fare media will need to be widely available for purchase at various
locations where tourists are likely to encounter them. These include hotels, major tourist
attractions, the Visitor Center, the Downtown Transit Terminal, grocery/convenience store
courtesy booths, and perhaps others such as free-standing kiosks or “meters.” The Park Board
has added one dispensing unit along Seawall Boulevard to support the paid parking program
because of their determination that pay-by-phone alone is not sufficient. Agreements will be
required with each of these venues to allow for the sale of fare media, including stocking, tracking
of number and types of media sold, payment collection, and remittance of payment to the City.
MARKETING
A fundamental contributor to the disappointing ridership during the E-bus tourist shuttle
demonstration in 2005-2006 was the failure to adequately market the service to generate
awareness, interest, and excitement among potential riders. As the city moves forward with
once again fielding tourist-oriented shuttle services (bus and rail), it is imperative that mistakes
of the past not be repeated. Any new tourist services must be broadly and comprehensively
marketed such that Galveston visitors are exposed to it via numerous “touches” not only upon
arriving on the island but becoming aware of what is available prior to coming to Galveston as
well as follow-up reminders during their stay.
The 2006 Seawall plan included an extensive list of recommendations for garnering publicity for
available tourist shuttles. It is also very important that all marketing activities be cyclical since
tourists come and go and the shuttles must be marketed and re-marketed continuously to ensure
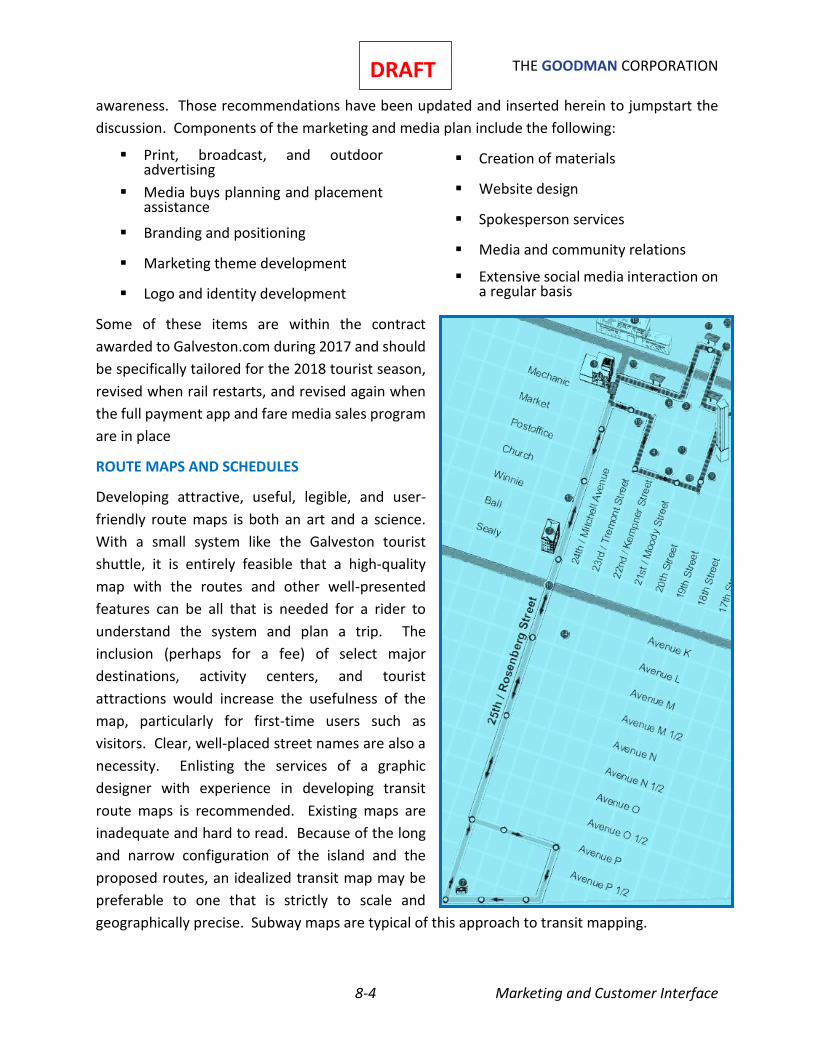
THE GOODMAN CORPORATION
8-4 Marketing and Customer Interface
DRAFT
awareness. Those recommendations have been updated and inserted herein to jumpstart the
discussion. Components of the marketing and media plan include the following:
▪ Print, broadcast, and outdoor advertising
▪ Media buys planning and placement assistance
▪ Branding and positioning
▪ Marketing theme development
▪ Logo and identity development
▪ Creation of materials
▪ Website design
▪ Spokesperson services
▪ Media and community relations
▪ Extensive social media interaction on a regular basis
Some of these items are within the contract
awarded to Galveston.com during 2017 and should
be specifically tailored for the 2018 tourist season,
revised when rail restarts, and revised again when
the full payment app and fare media sales program
are in place
ROUTE MAPS AND SCHEDULES
Developing attractive, useful, legible, and user-
friendly route maps is both an art and a science.
With a small system like the Galveston tourist
shuttle, it is entirely feasible that a high-quality
map with the routes and other well-presented
features can be all that is needed for a rider to
understand the system and plan a trip. The
inclusion (perhaps for a fee) of select major
destinations, activity centers, and tourist
attractions would increase the usefulness of the
map, particularly for first-time users such as
visitors. Clear, well-placed street names are also a
necessity. Enlisting the services of a graphic
designer with experience in developing transit
route maps is recommended. Existing maps are
inadequate and hard to read. Because of the long
and narrow configuration of the island and the
proposed routes, an idealized transit map may be
preferable to one that is strictly to scale and
geographically precise. Subway maps are typical of this approach to transit mapping.
THE GOODMAN CORPORATION
8-5 Marketing and Customer Interface
DRAFT
In addition to physical route maps and schedules, there are also useful online tools available
today that enable the creation of interactive web maps. The placement of such maps on the web
page and through social media for the shuttle service can enable riders to zoom in and out on
selected portions of the route, click on individual stops to get shuttle arrival times, and engage
with the important information in other ways that make the experience a richer one than can be
provided by a paper map. Various cities have implemented this type of on line interactive transit
mapping using readily available GIS and Google Map tools.
Maps and schedules should be available on all shuttles at all times, preferably in a rack where
riders can help themselves. Schedules and maps should also be made available at the same types
of locations recommended for the sale of fare media, such as hotels, major tourist attractions,
the visitor centers, the Downtown Transit Terminal, and the grocery store courtesy booths.
Remember that despite all the media and marketing, many will discover the system when they
happen upon it and see a shelter, visitor station, or the vehicles themselves. Accommodating
that type of interaction is part of the tourist experience.
MARKETING PLAN
Any plan to build awareness about the
shuttle services must be a
comprehensive and focused effort that
occurs continuously to reinforce the
branding of the service and that has a
budget. The goal is to create a multi-
component, pro-active plan to make
news locally, nationally, and
internationally by achieving broad-
based national and local coverage in a
variety of print and electronic media. Gaveston.com, Park Board and CVB excel at these activities
which should all be coordinated as part of the Galveston branding and tourism message. This
will be best accomplished by creating one or more “hooks” that will be newsworthy to the media
and the major publications. The following topics would be of overall general interest to the
media. They are followed by lists of items that should be periodic goals in terms of placement
and exposure on national and local levels in addition to social media saturation:
▪ Political relevance to what is happening in today’s world
▪ Spending of public funds
▪ Human side
o Improved quality of life
o Cost savings
o Environmental impacts
THE GOODMAN CORPORATION
8-6 Marketing and Customer Interface
DRAFT
▪ Enhancement of tourist experience in Galveston
▪ Who the players are and relevance to past and current projects
NATIONAL COVERAGE
▪ Develop and promote at least one story (linked to other tourist collateral) every 90 days
for the following:
o Major national daily
o Network news show during season
o Wire story
▪ Links to relevant websites that can promote the service include the following:
o Galveston Chamber of Commerce
o Convention and Visitors Bureau
o City of Galveston
o Galveston County
o Galveston.com
o Venues being served by shuttles
▪ Supporting ads where necessary
LOCAL COVERAGE
▪ At least three stories in area newspaper with pictures covering local activity each season
▪ At least one story on a local network affiliated news show
▪ Radio coverage on at least two talk show stations
▪ Coverage in alternative local/regional papers
▪ Coverage in civic group publications, newsletters
▪ Letters to the Editor
▪ Public speaking engagements to local groups
▪ Ambassadors training
SUPPORT COMPONENTS
▪ Endorsements and organization support statements
▪ Route maps, recent news clips
▪ Promotional giveaways including bumper stickers, pens, and pencils imprinted with logo,
note pads in hotel rooms
▪ Sales item including T-shirts, caps, and other items that will sell.
THE GOODMAN CORPORATION
8-7 Marketing and Customer Interface
DRAFT
PRESS RELEASES
▪ Develop at least one every two weeks
▪ Suggested related tie-in topics that the shuttle service awareness campaign could
promote via press releases:
o Air quality issues/ shuttle service impact on these
o Peer cities’ similar success stories
o Traffic delays and options for service as an effective alternative
o Projected economic development benefits of service
o Promotional partners
o Ticketing programs
o Charter programs
TACTICS
▪ Develop Media Kit
o Past and current press releases
o Letters to the editor
o Action plan one-pagers
o Endorsement list
▪ Insertions
o Hotel packages
o Cruise packages
o Grocery store receipts
o Newspapers
▪ Moving Billboards
o Back of buses o Side of trolleys
▪ Billboards
o Rotation schedule where boards are moved around city
o Position in high traffic areas near the beachfront/attractions, downtown
o Focus on central branding theme
o Provide information
o Hotline
▪ Develop Website/Apps/Social Media
o Tourist Shuttle Services website where route maps, schedules, fares, ticketing and
other information can be found.
▪ Merchandising Handouts Suggestions
o Pens/pencils
o Bumper stickers
o Lapel pins
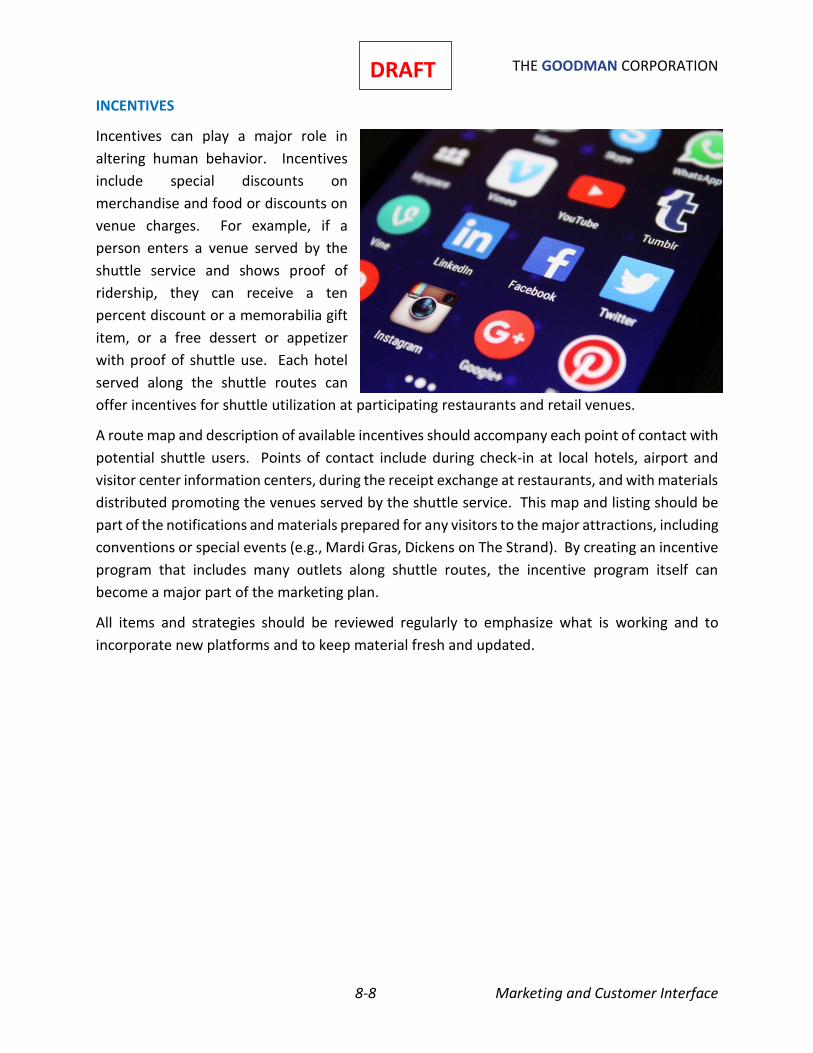
THE GOODMAN CORPORATION
8-8 Marketing and Customer Interface
DRAFT
INCENTIVES
Incentives can play a major role in
altering human behavior. Incentives
include special discounts on
merchandise and food or discounts on
venue charges. For example, if a
person enters a venue served by the
shuttle service and shows proof of
ridership, they can receive a ten
percent discount or a memorabilia gift
item, or a free dessert or appetizer
with proof of shuttle use. Each hotel
served along the shuttle routes can
offer incentives for shuttle utilization at participating restaurants and retail venues.
A route map and description of available incentives should accompany each point of contact with
potential shuttle users. Points of contact include during check-in at local hotels, airport and
visitor center information centers, during the receipt exchange at restaurants, and with materials
distributed promoting the venues served by the shuttle service. This map and listing should be
part of the notifications and materials prepared for any visitors to the major attractions, including
conventions or special events (e.g., Mardi Gras, Dickens on The Strand). By creating an incentive
program that includes many outlets along shuttle routes, the incentive program itself can
become a major part of the marketing plan.
All items and strategies should be reviewed regularly to emphasize what is working and to
incorporate new platforms and to keep material fresh and updated.
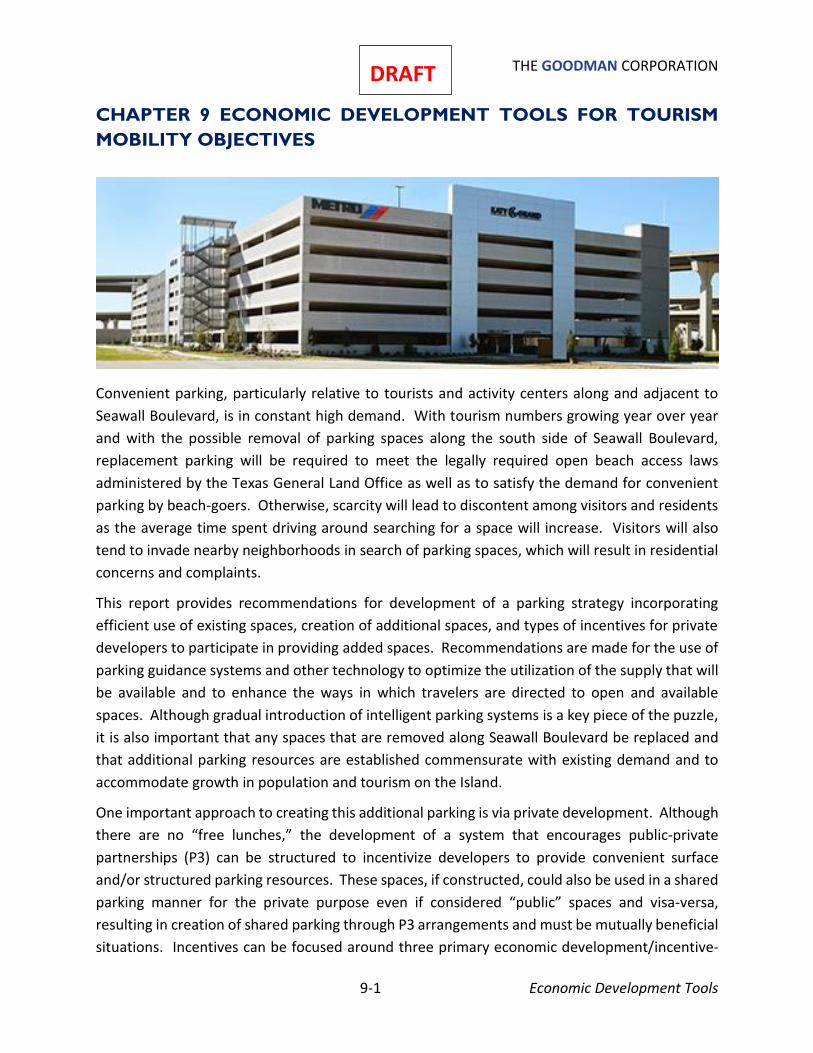
THE GOODMAN CORPORATION
9-1 Economic Development Tools
DRAFT
CHAPTER 9 ECONOMIC DEVELOPMENT TOOLS FOR TOURISM
MOBILITY OBJECTIVES
Convenient parking, particularly relative to tourists and activity centers along and adjacent to
Seawall Boulevard, is in constant high demand. With tourism numbers growing year over year
and with the possible removal of parking spaces along the south side of Seawall Boulevard,
replacement parking will be required to meet the legally required open beach access laws
administered by the Texas General Land Office as well as to satisfy the demand for convenient
parking by beach-goers. Otherwise, scarcity will lead to discontent among visitors and residents
as the average time spent driving around searching for a space will increase. Visitors will also
tend to invade nearby neighborhoods in search of parking spaces, which will result in residential
concerns and complaints.
This report provides recommendations for development of a parking strategy incorporating
efficient use of existing spaces, creation of additional spaces, and types of incentives for private
developers to participate in providing added spaces. Recommendations are made for the use of
parking guidance systems and other technology to optimize the utilization of the supply that will
be available and to enhance the ways in which travelers are directed to open and available
spaces. Although gradual introduction of intelligent parking systems is a key piece of the puzzle,
it is also important that any spaces that are removed along Seawall Boulevard be replaced and
that additional parking resources are established commensurate with existing demand and to
accommodate growth in population and tourism on the Island.
One important approach to creating this additional parking is via private development. Although
there are no “free lunches,” the development of a system that encourages public-private
partnerships (P3) can be structured to incentivize developers to provide convenient surface
and/or structured parking resources. These spaces, if constructed, could also be used in a shared
parking manner for the private purpose even if considered “public” spaces and visa-versa,
resulting in creation of shared parking through P3 arrangements and must be mutually beneficial
situations. Incentives can be focused around three primary economic development/incentive-
THE GOODMAN CORPORATION
9-2 Economic Development Tools
DRAFT oriented tools available to municipalities in Texas, namely tax abatement agreements, tax
increment reinvestment zones (TIRZ), and Chapter 380 agreements.
There is also a tool called a Transportation Infrastructure Zone (TIZ) which exists for use by
Intermunicipal Commuter Rail Districts. It provides the option for a special transportation-
oriented tax increment finance (TIF) mechanism to be created via an interlocal agreement
between such a district and one or more municipalities. One benefit of the TIZ is that the cap on
City-wide captured assessed value is 30% rather than the TIRZ 15%. Although limited to
Intermunicipal Commuter Rail Districts, legislative changes have the potential to extend this
power to other types of entities for other purposes.
TAX ABATEMENT AGREEMENTS
The authority to enter into tax abatement agreements is found in the Property Redevelopment
and Tax Abatement Act1. The code authorizes property taxing entities (not including school
districts) to enter into local agreements with taxpayers that would limit the property taxes
assessed on real property. These abatements are considered economic development tools, and
as such, require the formation of a reinvestment zone.2 3 Administrative requirements include
establishment of criteria and guidelines governing tax abatement agreements,4 adoption of a
resolution for each individual abatement, provision of written notice to other taxing units in
which the property is located (Galveston County, Galveston ISD, etc.), and conducting a public
hearing.
The tax code authorizes the abatement only to the extent its value for that year exceeds its value
for the year in which the agreement is executed. As such, only the increase in property value or
tax may be abated. In other words, the abatement is similar to other mechanisms in that only
the incremental value from creation is considered. These agreements are limited to 10 years in
length. The difference from a TIRZ is that in an abatement scenario the taxes are never levied to
the property owner. In a TIRZ, the taxes are levied, accumulated into the TIRZ, and then paid out
for specific, agreed upon, purposes.
Assuming a City of Galveston Property tax rate per $100 assessed value of $0.559100, Table 9.1
provides an example of how a complete abatement, over a 10-year period, would impact a
property owner with a base value of $1,000,000, assuming an improved value of $3,500,000 in
1 http://www.statutes.legis.state.tx.us/Docs/TX/htm/TX.312.htm 2 Note: this does not refer to a Tax Increment Reinvestment Zone; a Reinvestment Zone is a stand-alone entity that is created by municipal ordinance. 3 Example reinvestment zone ordinance here: https://www.sugarlandtx.gov/DocumentCenter/View/9963 4 Many publicly available examples of these exist, ex: http://www.harriscountytx.gov/CmpDocuments/103/Economic_Development/Tax_Abatement_Guidelines.pdf
THE GOODMAN CORPORATION
9-3 Economic Development Tools
DRAFT year 2 due to completion of construction, and 5% increases in value thereafter. This example
assumes that the tax rate does not change over the period.
TAX ABATEMENT EXAMPLE
YEAR ASSESSED VALUE TAX RATE TAXES
GENERATED TAXES PAID
OWNER
SAVINGS
1 $1,000,000 0.5591 $5,591 $5,591 $0
2 $3,500,000 0.5591 $19,569 $5,591 $13,978
3 $3,675,000 0.5591 $20,547 $5,591 $14,956
4 $3,858,750 0.5591 $21,574 $5,591 $15,983
5 $4,051,688 0.5591 $22,653 $5,591 $17,062
6 $4,254,272 0.5591 $23,786 $5,591 $18,195
7 $4,466,985 0.5591 $24,975 $5,591 $19,384
8 $4,690,335 0.5591 $26,224 $5,591 $20,633
9 $4,924,851 0.5591 $27,535 $5,591 $21,944
10 $5,171,094 0.5591 $28,912 $5,591 $23,321
Total $165,454
Table 9.1: Tax Abatement Example
Although helpful, a total incentive package of $165,454 (6.6% of the total added investment in
this case) alone is unlikely to convince a developer to invest a significant amount of additional
capital in construction of structured or even surface parking at a daily rate conducive to use by
tourists and visitors. This is especially true when the median cost per structured space in the
Houston-region is over $16,500. This offset, over a ten-year period, would support the
construction of about 10 spaces.
Nevertheless, a tax abatement agreement does not have to be used alone and can be used in
conjunction with other instruments to provide a larger, perhaps more meaningful incentive
package to a developer to provide surface and/or structured parking.
THE GOODMAN CORPORATION
9-4 Economic Development Tools
DRAFT TAX INCREMENT REINVESTMENT ZONES (TIRZ)
The TIRZ is one of the most common types of economic development tools utilized by
municipalities in the State of Texas. The authorizing legislation for TIRZ is found in Chapter 311
of the Tax Increment Financing Act.5 Essentially, a TIRZ provides a tool to finance public
improvements in areas that are designated as blighted or underdeveloped areas. This definition
can be interpreted very loosely with the consideration that the TIRZ designation is essential to
prevent an area from becoming blighted or underdeveloped. A TIRZ can be created by a City or
a County or via a landowner’s petition to a city or a county which represents at least 50% of the
proposed TIRZ appraised value. A TIRZ may not be created if more than 10% of the zone’s total
assessed value is residential or if the proposed zone boundaries contain more than 15% of the
total assessed value taxable by a city, county, or independent school district. The lifespan and
boundaries of a TIRZ are set by the authorizing ordinance and can be extended by amendment.
Once formed, a TIRZ Board is selected to oversee how funds should be spent and how actions
should be taken. In Houston, the City has largely ceded administrative authority of each TIRZ to
a locally created Redevelopment Authority. These Authorities essentially serve as the governing
body of each TIRZ and exist to execute contracts, monitor progress, and implement projects.
Without a Redevelopment Authority, the main governing body of the TIRZ creator (city or county)
would serve to administer each TIRZ and the TIRZ funding generated.
A TIRZ can be a vehicle to implement public/private partnerships. A TIRZ can enter into an
agreement with a private developer to construct improvements that are consistent with the TIRZ
project plan. The developer can agree to construct the improvements and pay for them. The TIRZ
would then agree to reimburse the developer for the project costs at some point in the future.
This shifts financial risk from the public to the private sector and conceivably incentivizes the
immediate implementation of the improvements and accelerates (or makes possible in the first
place) economic development.
An example consistent with the City of Galveston’s objectives related to tourism might work as
follows:
The City forms a new TIRZ along Seawall Boulevard. This TIRZ has just started generating
increment and does not have a significant amount of working capital accrued. The TIRZ Board is
approached by a developer who would like to redevelop an existing parcel into a tourist-oriented
mixed-use facility with restaurant and retail uses. The developer has completed a site-specific
study, consistent with City Land Development Regulations, which demonstrates that the proposed
mix of uses justifies parking over and above the required number of spaces necessary for the
5 http://www.statutes.legis.state.tx.us/Docs/TX/htm/TX.311.htm
THE GOODMAN CORPORATION
9-5 Economic Development Tools
DRAFT development itself. Furthermore, the parking study identifies demand for structured parking
which would be used by the general public for beach access. A financial pro forma for the garage
indicates that additional garage spaces are likely a profitable endeavor but that the venture
would bear some risk. Additionally, the developer indicates that without City backing, it will be
difficult to secure a loan to immediately implement such a project with added parking.
In this case, the City could agree that this is a viable and desirable project, promotes economic
development goals, and is consistent with the TIRZ Project Plan. Because of this, it makes sense
to utilize a TIRZ to incentivize the development to occur and perhaps for the City to manage the
public parking in order to manage or control parking rates. In this scenario, the City could
authorize a development agreement to perform the following:
1. Provide the developer with a grant of $1,000,000, from the TIRZ increment, to be paid as increment is generated, for the mixed-use development itself.
2. Provide the developer with an additional $1,500,000, from the TIRZ increment, to be paid as increment is generated, for the construction of the public garage spaces.
3. The City could provide additional grant funds through a Chapter 380 agreement (see next section) concurrent with the TIRZ development agreement if the City found that additional incentive was necessary and would still result in a positive benefit-cost analysis ratio to the City.
4. The City could enter into a management agreement with the developer for the public parking. This could also include a ground lease or other mechanism to ensure City control of those spaces.
In addition to a public/private partnership, TIRZ are often used to directly design and construct
public projects such as roads, bridges, trails, and other infrastructure which is anticipated to yield
a positive return on economic development.
THE GOODMAN CORPORATION
9-6 Economic Development Tools
DRAFT CHAPTER 380 AGREEMENTS
Chapter 380 of the Texas Local Government Code (LGC).6 authorizes Texas home-rule
municipalities to provide assistance and incentives related to economic development. Texas
municipalities can provide these incentives in the form of direct grants, loans, city services (to
include infrastructure) or even through the provision of staff. The governing body may directly
administer the Chapter 380 program or contract with any public or private entity to administer a
program.
For a municipality to provide these types of assistance, the project must serve the purpose of
promoting state or local economic development by stimulating business and commercial activity.
The Texas Constitution also requires that the expenditure of all City funds must serve a “public
purpose.” This requirement flows down to Chapter 380 funds as well.
To utilize a Chapter 380 agreement, a municipality must establish, by ordinance, an economic
development program pursuant to Chapter 380 of the LGC. This program essentially outlines
what the LGC authorizes a municipality to do under Chapter 380 and how the municipality will
administer the program. To establish a simple program, municipalities may just state a minimal
purpose that they will “provide loans, grants, and/or matching funds under any or all sections of
Chapter 380 of the LGC to qualified applicants upon approval by City Council on a case-by-case
basis.”7
The City of Galveston currently has an economic incentive program ordinance, enacted on June
23, 2016, that allows for up to 75% of the cost of reconstruction/rehabilitation of an existing
structure to be funded via granted funds if the structure is within the downtown area between
19th and 27th, and Harborside to Broadway, with an emphasis on preserving the historic
character of the area and structures.
The Chapter 380 ordinance developed by the City provides for the following funding sources to
be applied towards eligible projects:
▪ An amount equal to the portion of the City’s increased ad valorem tax over the base year, for a maximum of twenty years.
▪ An amount equal to the portion of the City’s personal property taxes over the base year, for a maximum of a twenty years.
▪ An amount equal to the City’s portion of the Texas Sales Tax generated by the applicant, for a maximum of twenty years.
6 http://www.statutes.legis.state.tx.us/Docs/LG/htm/LG.380.htm 7 There are several examples of publicly available Economic Development Program Ordinances available: http://www.houstontx.gov/ecodev/380/99-674OrdinanceEcoDev.pdf
THE GOODMAN CORPORATION
9-7 Economic Development Tools
DRAFT ▪ Waiver of permit and license to use (LTU) fees during the period of construction not to
exceed two years.
Subsequently City Council has modified the terms on a project-by-project basis for other projects
such as the former Falstaff Brewery. Chapter 380 agreements are much more flexible than tax
abatement agreements because the administrative and regulatory requirements are much less
burdensome. Chapter 380 agreements also offer greater flexibility to municipalities in how they
desire to structure the agreement. For example, Chapter 380 agreements allow a city to impose
performance conditions or thresholds on estimated sales tax revenue generated, or by even
refunding that sales tax directly to the entity that generated it.
Unlike a tax abatement agreement, there is no statutory limit on the amount of time that a
Chapter 380 agreement can remain in place, although individual agreements usually are
structured around a specific timeframe. Additionally, there are no restrictions on the source of
the funds utilized for a Chapter 380 agreement, so long as they are derived from any source
lawfully available to the municipality under its charter. In other words, a Chapter 380 agreement,
developed on a case-by-case basis, provides the City with nearly unlimited flexibility (based upon
its established criteria within the Chapter 380 ordinance) in how much or how little it wants to
influence certain development activities based only on municipal cash flow considerations and
fiscal responsibility. In fact, Chapter 380 agreements can be coupled with interlocal agreements
to achieve a TIRZ-like structure, whereby a public entity (such as a Management District or even
the City itself) can utilize Chapter 380 funding generated from an area for public improvements.
This provides TIRZ funding without the need to create an additional political subdivision. The
benefit here is the ability to generate funding and implement projects without the burden of
additional administrative costs and other overhead that independent TIRZ boards incur.
BEST PRACTICES
A significant number of municipalities within Texas utilize economic development tools such as
Chapter 380 agreements and TIRZ. Many also have dedicated economic development
departments from which their program is administered. From examining other agencies, best
practices and innovation can be identified which can be applied towards the City of Galveston to
aid in the accomplishment of their tourism objectives.
LEVERAGE
In addition to the local reallocation of financial resources, having dedicated revenue sources
provides local match that can be used to gain even more funds for projects from grants and other
programs leveraging several times more dollars to implement projects advancing local goals. The
City of Houston’s economic development program has been extremely successful in its ability to
leverage TIRZ and Chapter 380 dollars with other resources to expedite project implementation,
increase property values, and incentivize private development. The following example is an
excellent demonstration of how leveraging funding types can serve to accomplish major
THE GOODMAN CORPORATION
9-8 Economic Development Tools
DRAFT objectives. Although not specific to tourism, the example can be extrapolated to be used for any
economic development purposes including tourism:
The City of Houston created a Chapter 380 agreement for the Westchase area in central west
Houston in 2013.8 This Chapter 380 agreement essentially captures the increment within the
stated boundary and those dollars to be reinvested into capital projects as identified by
Westchase stakeholders and programmed into their City-approved Capital Improvement Plan.
(Note, full integration with the City CIP helps with full transparency and city control over the
improvements.) The plan, as originally created, assumed the utilization of $9.5M in federal grant
funds to be used in conjunction with the locally designated Chapter 380 dollars. At the time the
project plan was created, the funding had not been identified and the grant dollars were merely
a placeholder but established a goal and intent to leverage. Several projects within the plan were
related to roadway and back-of-curb reconstruction projects aimed at stimulating a turnover in
older, lower value land uses (commercial along one corridor, multi-family residential along
another corridor).
The District ultimately was successful in pursuing over $19M in federal funds for two projects
within four years of the creation of the Chapter 380 agreement. The agreement was essential in
securing the funding, since it provided the separate Westchase Management District with the
local funding necessary to match the federal dollars. Furthermore, the economic projections
utilized in the creation of the Chapter 380 agreement were used as a component of the benefit
analysis developed to secure the competitive federal grant funding.
SITE SELECTION ASSISTANCE
Since the mid-2000’s, municipal economic development departments have explored the area of
providing on-demand site selection assistance to commercial and industrial business interests.
Some smaller municipalities have documented this by manually canvassing the city, cataloguing
vacant properties, contacting realtors/brokers, and documenting relevant information on a
municipal website. This is similar to the parking location analysis in Chapter 4. More recently,
economic development departments have contracted with companies such as Zoom Prospector,9
LoopNet,10 and/or LocationOne11 to automatically identify vacant locations and provide
information via a web-based application.
For example, the City of Grapevine, TX12 utilizes a modern web-based interface from which
property locations can be identified and reviewed. The City also invites businesses and industries
8 https://www.houstontx.gov/ecodev/380/westchase.pdf 9 https://www.zoomprospector.com/ 10 http://www.loopnet.com/ 11 https://www.locationone.com/ 12 http://grapevinetx.zoomprospector.com/
THE GOODMAN CORPORATION
9-9 Economic Development Tools
DRAFT to coordinate directly with the City on location assistance, since City staff has additional pre-
packaged local knowledge and information (traffic counts, information on activity centers, etc.)
which can aid individuals and businesses interested in relocating within the area.
Utilization of a similar tool, geared towards attracting developments and land uses consistent
with tourism promotion, may be a viable option for the City of Galveston to consider. These
packages are low cost, low maintenance, and relatively low effort, but do require active city staff
management. Major national-chain restaurants and retailers utilize commercial real estate
brokers who have their own data sets and innately understand the wants and needs of the clients,
but interfacing with local programs helps establish a better working relationship. On their own
tools like this may be more suitable for the city to use working with smaller, local restaurants and
retail establishments that do not have the luxury of utilizing major commercial real estate
brokers.
FORMAL POLICIES
Some municipalities have pre-published formal policies which establish the global framework and
goals of their incentive/economic development program. One example is the Town of Flower
Mound, TX.13 In this case, the Town has established a list of qualifying projects that, based upon
their size, are eligible for tax abatement across a variety of years and percentages. The Town also
considers other factors in providing abatement such as job creation, employee wages, and
sustainable development practices as Galveston does through the IDC. Their policy notes that
additional incentives may be considered for the purposes of existing business retention and
expansion. Finally, it is important to note that the Town policy states that additional incentives
may be provided on a case-by-case basis by City Council action regardless of the formal policy.
This language provides the Town with the flexibility needed to step outside the policy should it
be required to maximize effectiveness.
SCORE CARDS
Another aspect of The Town of Flower Mound’s economic development program is its annual
“scorecard”14 which documents the status (and the success) of every incentive package
negotiated or active in a given year. The scorecard documents the obligations of each party, the
performance terms, the total estimated incentive cost, and the total estimated benefit of the
deal. The scorecard also summarizes the net benefits for the Town, a key indicator of whether
the deal is a success. Although this may not be viewed as a traditional “tool” for economic
development, having this in place enhances transparency to the general public as well as the
13 http://www.flower-mound.com/DocumentCenter/View/10283
14 http://www.flower-mound.com/DocumentCenter/View/16796
THE GOODMAN CORPORATION
9-10 Economic Development Tools
DRAFT business community, which has been an issue for special districts in Galveston in the past. It
proves to the private sector that the City is ready, willing, and able to negotiate an incentive
package to bring in new business or retain existing business should the deal make long term
financial sense. Openness relieves some of the negatives associated with perception that back-
room deals are being cut and then mismanaged. Also, the score card analysis and its publication
provide excellent information for setting priorities for the next year or other economic
development timeframe (e.g. five-year plan).
BENEFIT-COST ANALYSIS (BCA)
A major trend nationwide is for public entities to utilize a BCA in the process of negotiating the
terms of an incentive. The framework of the BCA may differ depending on current priorities, the
types of uses that are being attracted, and the types of incentives being offered. A BCA
methodology is helpful in that it provides a repetitive, repeatable, objective, and analytical
approach to the incentive package that helps policy makers ultimately approve the package
based on its merits and serves to generate public buy-in for the economic development program
as a whole. The federal departments increasingly put a great amount of emphasis on the
benefit/cost ratio in considering and awarding discretionary grants.
An effective BCA should result in the estimated net benefit of the project. These benefits could
occur due to property value, employment, sales tax, usage taxes, and/or satisfying specific
economic development goals. There are a variety of ways to derive these benefits and the area
of BCA analytics is constantly evolving to refine methodologies.
Municipalities may complete a BCA via several different ways:
1. Provide a methodology for the interested party to complete a BCA. 2. Ask the interested party to complete a BCA per their own methodology that meets certain
guidelines. 3. Complete an in-house BCA as the only BCA or as a comparison to the interested party’s.
4. Retain an economic development consultant to complete a BCA as the only BCA or as a comparison to the interested party’s.
Regardless of the approach used, it is important that the underlying assumptions used in the
creation of the BCA are well documented in any analysis presented. This will provide the
background information necessary to support the final analysis and conclusions. Once
completed, documentation is also useful in applying for supplemental discretionary grant funding
and other financial resources where BCA analysis may now be required.
REVOLVING LOAN FUNDS/INFRASTRUCTURE BANKS
It has been a common practice for many years in economic development to establish a revolving
loan fund for use by businesses for facility redevelopment, façade upgrades, code compliance,
and other similar improvements. Typically done on a smaller scale, these types of programs are
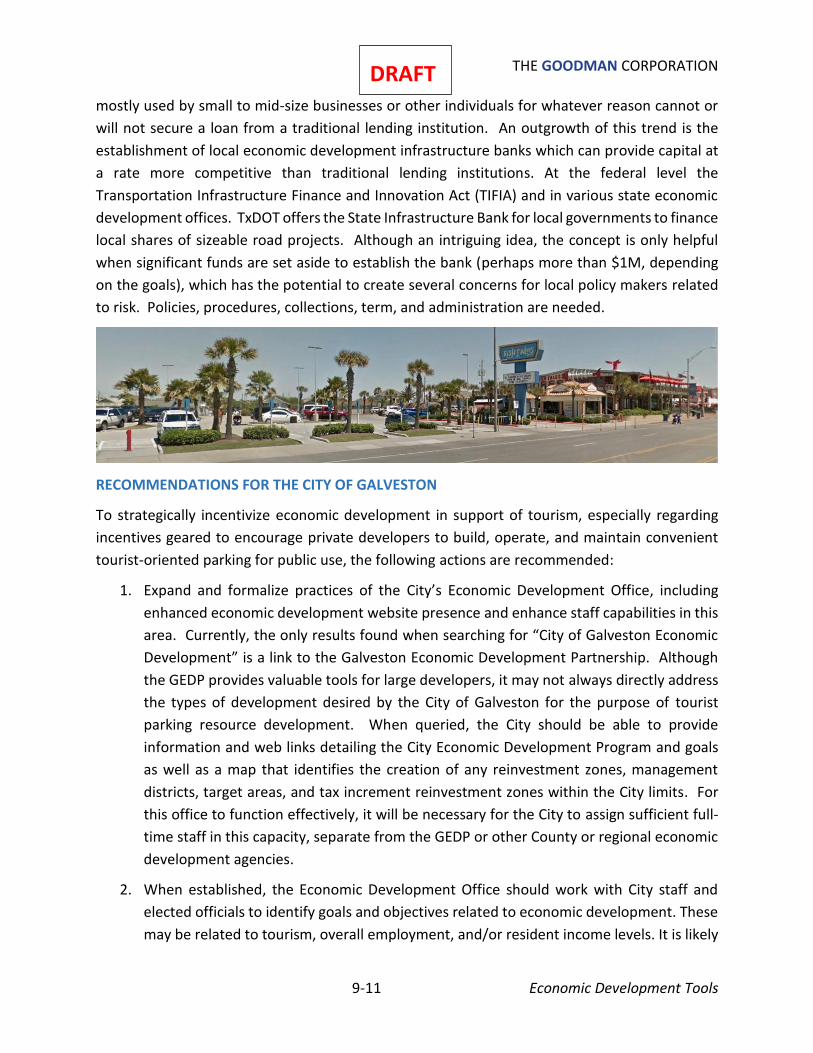
THE GOODMAN CORPORATION
9-11 Economic Development Tools
DRAFT mostly used by small to mid-size businesses or other individuals for whatever reason cannot or
will not secure a loan from a traditional lending institution. An outgrowth of this trend is the
establishment of local economic development infrastructure banks which can provide capital at
a rate more competitive than traditional lending institutions. At the federal level the
Transportation Infrastructure Finance and Innovation Act (TIFIA) and in various state economic
development offices. TxDOT offers the State Infrastructure Bank for local governments to finance
local shares of sizeable road projects. Although an intriguing idea, the concept is only helpful
when significant funds are set aside to establish the bank (perhaps more than $1M, depending
on the goals), which has the potential to create several concerns for local policy makers related
to risk. Policies, procedures, collections, term, and administration are needed.
RECOMMENDATIONS FOR THE CITY OF GALVESTON
To strategically incentivize economic development in support of tourism, especially regarding
incentives geared to encourage private developers to build, operate, and maintain convenient
tourist-oriented parking for public use, the following actions are recommended:
1. Expand and formalize practices of the City’s Economic Development Office, including
enhanced economic development website presence and enhance staff capabilities in this
area. Currently, the only results found when searching for “City of Galveston Economic
Development” is a link to the Galveston Economic Development Partnership. Although
the GEDP provides valuable tools for large developers, it may not always directly address
the types of development desired by the City of Galveston for the purpose of tourist
parking resource development. When queried, the City should be able to provide
information and web links detailing the City Economic Development Program and goals
as well as a map that identifies the creation of any reinvestment zones, management
districts, target areas, and tax increment reinvestment zones within the City limits. For
this office to function effectively, it will be necessary for the City to assign sufficient full-
time staff in this capacity, separate from the GEDP or other County or regional economic
development agencies.
2. When established, the Economic Development Office should work with City staff and
elected officials to identify goals and objectives related to economic development. These
may be related to tourism, overall employment, and/or resident income levels. It is likely
THE GOODMAN CORPORATION
9-12 Economic Development Tools
DRAFT that all the goals identified cannot be solved via the incentive-driven type of economic
development discussed in this chapter. There will also likely be different goals for
different parts of the City (for example, the goals for Seawall Boulevard may be different
than those for the Broadway Corridor). The production of a broader, more holistic
economic development plan will be important to the City ultimately meeting all of its
economic development goals and in coordinating with all City departments.
3. Modify and expand the existing Chapter 380 ordinance adopted in 2016 to incorporate a
broader emphasis on tourism, development, and parking. The current ordinance, as
worded, is restricted geographically and does not allow for City staff to fully and creatively
utilize the economic development tools granted by the State. The revision to the
economic development program ordinance should remove the geographic and
improvement type limitations currently included. Additionally, for purposes of tourism
and parking, the ordinance should include the following:
▪ All applications are reviewed by an assigned director/manager and staff on a case-by-case basis;
▪ All assistance is subject to City Council approval and appropriation of funding;
▪ Eligible projects defined to specifically include (but not limited to) the construction of surface or structured parking improvements within a defined proximity to a major activity center to be targeted with an emphasis on enhancing economic and tourism-oriented activity through the provision of convenient, safe, and accessible public parking spaces.
▪ On a case-by-case basis, creation of a reinvestment zone also may be considered to further enhance the ability of the applicant to provide betterments towards economic development.
▪ Consider the establishment of review fees to defray the cost of staff time to review applications and prevent frivolous applications.
▪ Establish a series of documents to be included with the submission such as a floor plan, site plan, Phase I Environmental Site Assessment, business plan, financial statements, etc.
▪ Establish that grants will be performance-based in nature and will require repayment if performance levels are not met.
It is important that the ordinance satisfy the control desired by City Council (as provided
by their ultimate approval for any deal) although also allowing for staff to be innovative
and flexible in their solicitation of interested parties and implementation of the program.
4. Consider the creation of a formal policy on incentives that generally outlines the goals
and objectives of the City economic development program, the types of projects that are
desirable, and the general net benefit sought after by the City. The formal policy can
include instructions on next steps and incentive application materials.
THE GOODMAN CORPORATION
9-13 Economic Development Tools
DRAFT 5. Consider the development of an annual incentives report for review by the City
management team and City Council. This will help provide a benchmark for the success
of the newly created Economic Development Office and will assist in driving incremental
modifications towards the program. This report card (or score card as discussed above)
should also feature an introduction that reviews the types of economic development
achievements and trends that are occurring throughout the region and the State of Texas.
This will help City staff and elected officials understand and adjust the local economic
development strategy on a continual basis and provide transparent information to the
general public.
6. Develop a BCA methodology for use when evaluating projects. The methodology should
ideally be “plug and play” via Excel or a similar format and utilize existing datasets and
information sources that are available to City staff through in-house means or through a
hired consultant. The methodology should not be an expensive one to produce but should
instead act as the stepping stone to increasingly refined methodologies as the City
Economic Development Office staff becomes more adept in the area of BCA.
7. Coordinate with existing business/property owners on their potential to utilize a
combination of tax abatements and a Chapter 380 agreement to defray the cost of
constructing additional parking for the purposes of an adopted goal regarding
replacement and expansion of tourist-oriented parking. Individual agreements should be
structured based on how many parking spaces are constructed, how many are available
for public use/sharing, and how many will be accessible at a fair and reasonable rate. It
may be preferable to build an internal model for use and review but modify it for
individual application on a case-by-case basis.
Table 9.2 provides a conceptual example of how an incentive program could be structured using
sales tax to guide the grant amount.
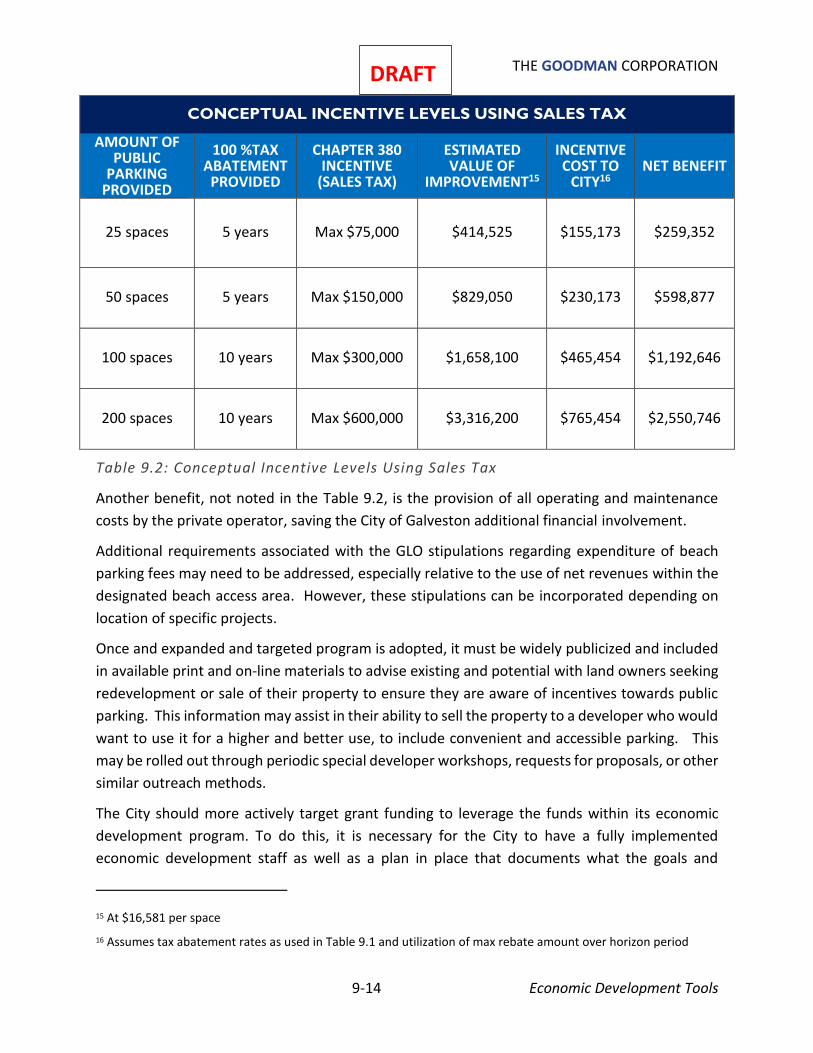
THE GOODMAN CORPORATION
9-14 Economic Development Tools
DRAFT
CONCEPTUAL INCENTIVE LEVELS USING SALES TAX
AMOUNT OF PUBLIC
PARKING PROVIDED
100 %TAX ABATEMENT PROVIDED
CHAPTER 380 INCENTIVE
(SALES TAX)
ESTIMATED VALUE OF
IMPROVEMENT15
INCENTIVE COST TO
CITY16 NET BENEFIT
25 spaces 5 years Max $75,000 $414,525 $155,173 $259,352
50 spaces 5 years Max $150,000 $829,050 $230,173 $598,877
100 spaces 10 years Max $300,000 $1,658,100 $465,454 $1,192,646
200 spaces 10 years Max $600,000 $3,316,200 $765,454 $2,550,746
Table 9.2: Conceptual Incentive Levels Using Sales Tax
Another benefit, not noted in the Table 9.2, is the provision of all operating and maintenance
costs by the private operator, saving the City of Galveston additional financial involvement.
Additional requirements associated with the GLO stipulations regarding expenditure of beach
parking fees may need to be addressed, especially relative to the use of net revenues within the
designated beach access area. However, these stipulations can be incorporated depending on
location of specific projects.
Once and expanded and targeted program is adopted, it must be widely publicized and included
in available print and on-line materials to advise existing and potential with land owners seeking
redevelopment or sale of their property to ensure they are aware of incentives towards public
parking. This information may assist in their ability to sell the property to a developer who would
want to use it for a higher and better use, to include convenient and accessible parking. This
may be rolled out through periodic special developer workshops, requests for proposals, or other
similar outreach methods.
The City should more actively target grant funding to leverage the funds within its economic
development program. To do this, it is necessary for the City to have a fully implemented
economic development staff as well as a plan in place that documents what the goals and
15 At $16,581 per space
16 Assumes tax abatement rates as used in Table 9.1 and utilization of max rebate amount over horizon period
THE GOODMAN CORPORATION
9-15 Economic Development Tools
DRAFT objectives of the Office will be. These goals can then be cross-referenced with goals of other
departments (Public Works, Planning) so that synergistic projects can be identified and funds can
be pursued for accomplishments that will satisfy numerous City objectives.
CONCLUSION
In summary, the City of Galveston has tools at its disposal to incentivize development, expansion,
and/or redevelopment of convenient, accessible, and safe public parking. In order to utilize these
tools, steps must be taken to revise the existing economic development ordinances. Most
importantly, the City must initiate a concerted economic development effort to focus on the
utilization of individual tax abatements and Chapter 380 agreements on targeted properties or
areas within the City. To do this, it is necessary for the City to devote resources to develop and
manage this program. Alternatively, the City could utilize third-party contractors to work
towards individual components of this effort. It is important to note that these economic
development opportunities are not limited to parking; a similar approach can be established to
nearly any type of development the City desires in any area where economic improvement is
necessary.

THE GOODMAN CORPORATION
9-16 Economic Development Tools
DRAFT
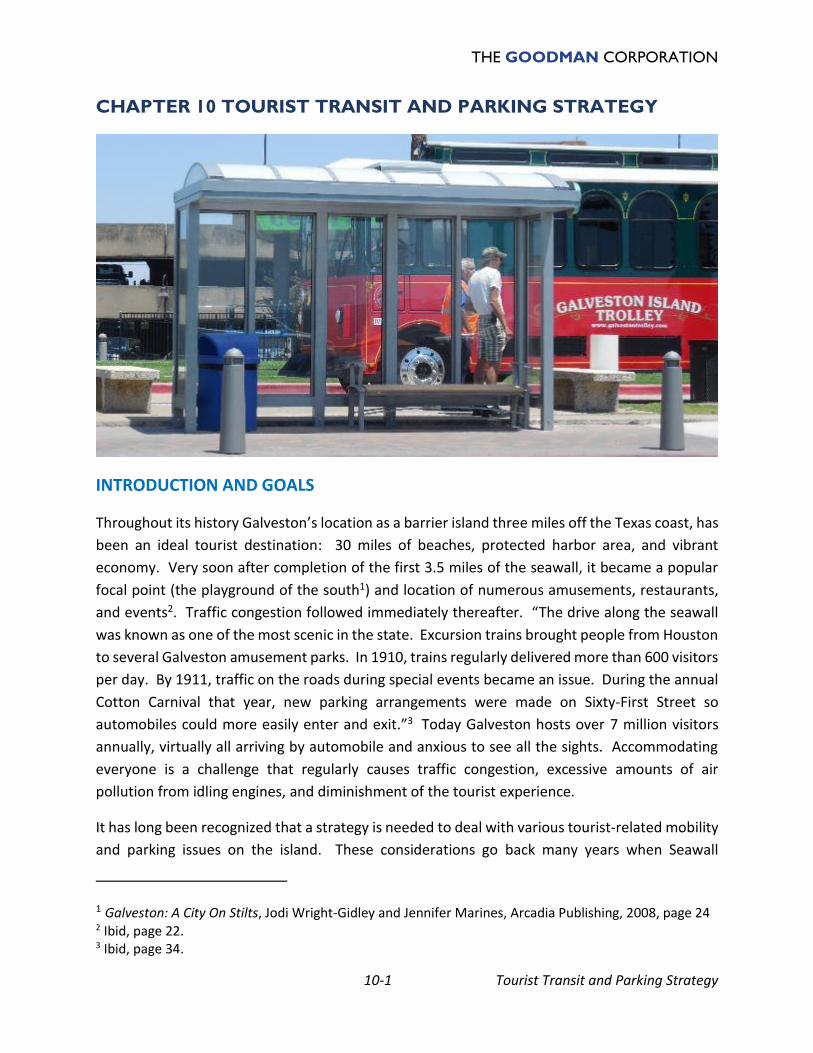
THE GOODMAN CORPORATION
10-1 Tourist Transit and Parking Strategy
CHAPTER 10 TOURIST TRANSIT AND PARKING STRATEGY
INTRODUCTION AND GOALS
Throughout its history Galveston’s location as a barrier island three miles off the Texas coast, has
been an ideal tourist destination: 30 miles of beaches, protected harbor area, and vibrant
economy. Very soon after completion of the first 3.5 miles of the seawall, it became a popular
focal point (the playground of the south1) and location of numerous amusements, restaurants,
and events2. Traffic congestion followed immediately thereafter. “The drive along the seawall
was known as one of the most scenic in the state. Excursion trains brought people from Houston
to several Galveston amusement parks. In 1910, trains regularly delivered more than 600 visitors
per day. By 1911, traffic on the roads during special events became an issue. During the annual
Cotton Carnival that year, new parking arrangements were made on Sixty-First Street so
automobiles could more easily enter and exit.”3 Today Galveston hosts over 7 million visitors
annually, virtually all arriving by automobile and anxious to see all the sights. Accommodating
everyone is a challenge that regularly causes traffic congestion, excessive amounts of air
pollution from idling engines, and diminishment of the tourist experience.
It has long been recognized that a strategy is needed to deal with various tourist-related mobility
and parking issues on the island. These considerations go back many years when Seawall
1 Galveston: A City On Stilts, Jodi Wright-Gidley and Jennifer Marines, Arcadia Publishing, 2008, page 24 2 Ibid, page 22. 3 Ibid, page 34.
THE GOODMAN CORPORATION
10-2 Tourist Transit and Parking Strategy
DRAFT Boulevard shuttles and other schemes were recommended. A service was unsuccessfully
attempted in the 1970s. The action plan for The Strand (1984) evoked Galveston’s streetcars
from the early 20th century linking downtown to the seawall which resulted in the
implementation of the rail trolley system (Chapter 7). As described in Chapter 6, the tourist bus
routes served by electric rubber-tire trolley-style vehicles represented another, more recent
attempt. The 2006 report (Galveston Seawall Boulevard Access and Beautification Plan)
promoted a more complete mix of bus routes and improvements, pointing the way to services
and amenities recently initiated along with those recommended in this report.
The resultant strategy should address what to do about parking, how to move people around,
and where each of these should be addressed.
Chapter 4 introduces the Galveston Park Once concept encouraging visitors to leave their cars
behind to leave the driving to Island Transit, don’t get lost, don’t worry about congestion, and
just enjoy the island: park all day, ride all day. The Galveston Park Once concept will encompass
an island-wide coordinated effort to park at centralized areas, park at destinations, park at
multiple locations, let people know where this is encouraged (designated lots, garages, streets)
and where it is frowned upon (neighborhoods).
To encourage even more transit usage, preferred parking locations must be advertised and
directions provided (Chapter 5, APGS) to promote the Galveston Park Once concept which should
be identified by unique branding for Galveston.
SUMMARY OF KEY POINTS AND RECOMMENDATIONS
The previous nine chapters resulted from the planning and analysis of existing conditions,
evaluation of past experiences, and the goals of providing a superior visitor experience in
Galveston. The following are the findings documented in those chapters that inform the
development of this strategy for the City.
Chapter 2: Tourist Travel Patterns
▪ Analysis of several data sources confirmed the general perceptions of movement
around the city and emphasized the four key movements, namely,
▪ Along Seawall Boulevard
▪ Seawall Boulevard to Downtown
▪ Seawall Boulevard to Airport Attractions
▪ Airport Attractions to Downtown
THE GOODMAN CORPORATION
10-3 Tourist Transit and Parking Strategy
DRAFT ▪ For the most part, these are the same during the spring and summer with
additional emphasis on airport to downtown during the summer
Chapter 3 Focus Group Feedback - Whenever individual opinions are sought there is never 100%
agreement. However, the following items seem to be common to those contacted:
▪ Tourist shuttles are needed, expected, and useful
▪ Tourist shuttles can start later in the morning and should operate later in the
evening.
▪ As more development occurs to the west (Babe’s Beach and beyond) the tourist
shuttle service should follow
▪ The true summer season runs from the second week of June through third week
of August (10 weeks)
▪ Spring break can be one or two weeks depending on school schedules.
▪ Although there may be the need for some very specific or privately funded
shuttles during the two Mardi Gras weekends, generally there is not a perceived
need for an event based massive shuttle service.
▪ Peak days during the summer are Thursday, Friday, Saturday, Sunday. Tuesdays
and Wednesdays are generally considered to be light. Mondays vary and can
carryover from weekend activity depending on events, conventions, and cruises.
▪ The western end of the seawall up to 89th seems to be emerging as a more
important activity center. Babe’s Beach will bring more activity west of 61st.
▪ A route that circulates exclusively within the downtown has been requested.
Since the rail trolley has this capability, it may be the best way to achieve such a
service at certain times, depending on the way shuttle service is spread between
the rail and rubber tire trolleys.
▪ All the key tourist areas must be served by shuttles, including downtown, Seawall
Boulevard attractions, and airport attractions.
▪ Some hotels and attractions seem to be very open to park and ride sharing. In this
situation, the idea of people parking all day within their current or expanded
parking areas and riding shuttles to other parts of the island was well received.
this matches well with the city’s goal of privatizing the provision of parking to the
maximum extent possible.
THE GOODMAN CORPORATION
10-4 Tourist Transit and Parking Strategy
DRAFT ▪ Alternative route signage to guide visitors around congestion and toward available
parking resources was requested. This could be incorporated into the advanced
parking guidance systems discussed in Chapter 5.
▪ All services must be well communicated, well marketed, user friendly, reliable, on
time; serve all; operate later rather than earlier, and build buy-in/consensus
Chapter 4 Parking Options - The broadest range of options was considered; however, the city
should set up a process so that its needs and goals can be incentivized and met through public
private partnerships rather than solo public-sector initiatives.
▪ Future demand 600 spaces over the next seven years.
▪ Target nine vacant parcels
▪ Target two shared existing Seawall Boulevard lots
▪ Target two shared existing garages
▪ Target two shared attraction lots
▪ Target three downtown garages (two existing, one planned)
▪ Target three UTMB facilities
▪ Target three Broadway locations
▪ Target Port of Galveston and private cruise passenger lots
▪ Six short term recommendations
▪ Five medium term recommendations
Chapter 5 Automated Parking Guidance Systems - For any of this to work, especially extensive
parking initiatives, effective communication is the key. Visitors must know what exists, they must
know where parking resources and attractions are located, and they must know what is the most
efficient for their needs. This also blends with the overall marketing approaches from Chapter 8
▪ Implement 4-6 signs to start
▪ Implement 4-7 locations to
start
▪ Incorporate traffic info
▪ Incorporate attraction data
▪ Add facilities as development
warrants (5 locations
suggested)
THE GOODMAN CORPORATION
10-5 Tourist Transit and Parking Strategy
Chapter 6 Rubber Tire Shuttle Services - This has been operational since summer of 2017. The
recommendations presented in this report represent modifications and fine tuning gleaned from
the input and analysis.
▪ Reconfigure airport – downtown shuttle, seasonally
▪ Reconfigure Seawall Boulevard-only shuttle with western extension, seasonally
▪ Add direct airport – downtown shuttle, seasonally via Broadway
▪ Discontinue Seawall – downtown shuttle. Reinforce this route with rail trolley.
▪ Annual operating cost can vary depending on the level of service selected. The
recommended 6,700 to 11,600 annual hours would result in a total annual
operating cost between $758,600 and $1,614,000.
▪ Transition to newly recommended routes in 2019 as the rail trolley becomes fully
operational.
Chapter 7 Rail Trolley - As the system is restored following 30 years of wear-and-tear, neglect,
and storm damage, an operating program is presented along with ways to generate revenue and
feature both the transportation and tourism merits of this service.
▪ Startup operation with Beach Route 80% of the time
▪ Startup operation with UTMB Route all non-holiday weekdays
▪ The startup operating plan calls for 10,400 annual vehicle hours at a cost of
approximately $624,000.
▪ Work with downtown businesses to determine when and if to startup a downtown
circulator, preferably with private sponsorship.
Chapter 8 Marketing and Customer Interface
▪ Implement plan developed by Galveston.com
▪ Determine revenue base per plan
▪ Estimate special revenue per plan
▪ Always keep the parking and transit service in the public eye for the revolving-
door of new visitors.
THE GOODMAN CORPORATION
10-6 Tourist Transit and Parking Strategy
DRAFT Chapter 9 Economic Development Tools for Tourist Mobility
▪ Establish economic development office
▪ Refine City’s tourist and mobility related economic development goals
▪ Revise the existing Chapter 380 ordinance for broader participation
▪ Formalize incentives policies
▪ Publish an annual incentives programs report for transparency and as a score card
▪ Develop a benefit-cost methodology to evaluate projects proposed by private
developers or through City initiatives.
▪ Target properties or districts for parking development, redevelopment, and
incentive initiatives.
PARK BOARD STUDY
In 2015, the Park Board of Trustees completed a Tourism Transportation Study which painted a
broad brush of needs and issues related to tourist transit and individual recommendations
covering the following categories including a multimodal system:
▪ New corridors
▪ Roadway improvements
▪ ITS [signage with TxDOT off island] wayfinding
▪ Signal coordination
▪ Capacity
▪ Wayfinding signage
▪ Access management
▪ Alternative modes
▪ Public/tourism transportation
▪ Event traffic
▪ Pedestrian and bicycle
▪ Parking
Specific issues to be addressed included circulation and connectivity, limited transit, locating
parking, outdated wayfinding. The report challenged the community to provide for short term
parking, long term parking, peak congestion, resident circulation during events. Services are
THE GOODMAN CORPORATION
10-7 Tourist Transit and Parking Strategy
DRAFT necessary to serve destinations, lodging, and attractions. There are an equal number of day
trippers and overnighters to be served along with cruise passengers and conventioneers.
Transit recommendations included bike racks, lighting, rubber trolley (serving Moody Gardens,
Pleasure Pier, Seawall Boulevard, and East Beach), rail trolley, hotel clusters, major destinations
Short term recommendations included rubber tire trolley service on Seawall Boulevard, selling
ticket blocks for resale, development of a transit app, off island connections.
Medium term recommendation included 61st street hub (terminal, parking, taxi/uber, bikes)
shelters with information and real-time data, marketing plan, restore rail with enhanced stops.
Long term recommendation included signal pre-emption and expansion of the rail trolley
eastward to Park Bboard properties.
Parking recommendations included more off-street facilities near destinations, Seawall
Boulevard on-street should remain unless replaced, future development with off-street along
Seawall Boulevard (shared), acknowledgement of a parking surplus but hard to find, highest pay
by phone usage (use for other like transit fares), wayfinding, parking management to maximize
availability and use.
Short range recommendations included wayfinding. Medium range recommendations included
standardize signage. Long range recommendations included public-private partnerships to
construct parking garages along Seawall Boulevard, and to remove the center two-way left turn
lane along Seawall Boulevard to provide room to install angle parking along the south side.
OVERALL STRATEGIC DECISIONS
TOURIST TRANSIT SERVICE
Tourist -oriented transit service is needed in Galveston for many
reasons as described throughout this report. A more concerted
approach has already begun with the implementation in 2017 of
two rubber tire trolley routes and the decision to restore the rail
trolley to service. This report recommends that the two routes
currently operating transition to four routes, including the rail
trolley by 2020, depending on further recommendations by the Ad
Hoc Trolley Advisory Committee, city staff, and City Council. See
Chapters 6 and 7. These services will provide general
transportation among attractions as well as provide an alternative
that will allow visitors to Park Once and reduce the number of autos on the streets throughout
the day. The analysis in Chapter 4 indicates 600 new parking spaces may be needed to
THE GOODMAN CORPORATION
10-8 Tourist Transit and Parking Strategy
DRAFT accommodate tourist growth. An additional 150 spaces may be
needed as replacements for associated with a Seawall Boulevard
demonstration to remove south side spaces for 10 blocks. It is likely
that the recommended routes will overlap with any major parking
facilities, with perhaps minor route deviations. This will allow
service to intensify by adding vehicles to the recommended routes
rather than adding completely new routes to the system.
INTERCEPT PARKING
Some would consider that an ideal situation would be to encourage
change-of-mode as early as possible for as large a group of visitors
as possible with as much coverage of service as possible. Intercept
works best for general day trippers. They can be intercepted at a
central location and provided transit to key destinations. This could
work for many but not all day-visitors. Those with heavy amounts
of gear for surfing, picnicking, or fishing would not be well
accommodated on buses or streetcars.
Overnight visitors want to be at their accommodation (hotels,
motels, bed-and-breakfasts, or other rentals) but later in their stay
may be tired of fighting traffic and finding parking spaces. For these
individuals, shuttles may be welcome at some point. Another group
includes those who are anxious to arrive at their initial day trip
destination but then would just as soon leave their cars behind to
ride shuttles to other locations. Surveys and cell phone data
indicate 40-60% of visitors typically visit multiple destinations
during their stay. In fact, many might be more encouraged to visit
multiple destinations (see Chapter 3) by the thought of not having
to fight traffic.
THE GOODMAN CORPORATION
10-9 Tourist Transit and Parking Strategy
DRAFT ON-STREET PAID PARKING.
In a 2011 referendum, voters approved imposing an
$8 daily parking fee for Seawall Boulevard curbside
parking. The revenues are primarily designated to
maintain and further improve the visitor amenities
along the Seawall Urban Park area. The program was
given only a 7-year life unless further extended by a
subsequent vote. The new City Council seated in June
2018 will need to consider whether to let the fee
system expire in July of 2020 or to update it and
present it to the voters again. Their resultant
decision-making will have a dramatic effect on the
transit and parking landscape. Factors to be
considered again include better control of parking
and turnover and providing a funding stream to
maintain improvements in the corridor and at some
point, to fund additional enhancements. Terms included in the initial referendum set a
termination date for the paid parking of July 27, 2020. Part of the overall tourist transit and
parking strategy must deal with this situation. City Council will be faced with the following
choices (See Figure 10.1):
▪ Let the paid parking
authorization
expire. In this
situation all parking
would be free, all
signs would be
removed, all license
plate recognition
hardware and
software would go
away, Park Bboard
enforcement efforts would go away. Most importantly the revenue stream would
disappear once the then-current balance is spent. These funds are used to
maintain the recently installed visitor/pedestrian/bus passenger enhancements
and will need to be replaced for the now well-kept amenities to continue to be
attractive and functional to all. A replacement source will be required to continue
the excellent upkeep that the City and Park Board of Trustees have been providing.
THE GOODMAN CORPORATION
10-10 Tourist Transit and Parking Strategy
DRAFT Otherwise the improvements will quickly deteriorate into disrepair. If parking fees
go away, the free Seawall Boulevard parking will be a magnet to all-day parkers,
inhibiting desirable turnover and inhibiting the economic development and
directed redevelopment goals of the city in terms of specific parking locations. See
Figure 10-1. City Council could approve another referendum extending the current
time frame for an additional period to be determined and continuing the current
terms. This may or may not be approved by voters. If approved, the situation
would continue as is. If not approved, then the city would go back to free parking
as described in the previous bullet. (See Figure 10-1.)
▪ City Council could approve another referendum but change the provisions that
would be included. Those provisions could be setting a different fee or sliding fee
or annual pass fee, setting different timeframes for the fee, or changing the
designated uses for the fee. Other administrative, political or operational tweaks
could also be included. The revised setup may or may not be acceptable to the
voters resulting in continued fee collection or not. (See Figure 10-1.)
Whichever approach City Council selects, the plan would also need to be approved by the Texas
General Land Office (GLO) as overseer of the open beach requirements. The recently adopted
Galveston Beach Access Plan may also need to be modified as needed.
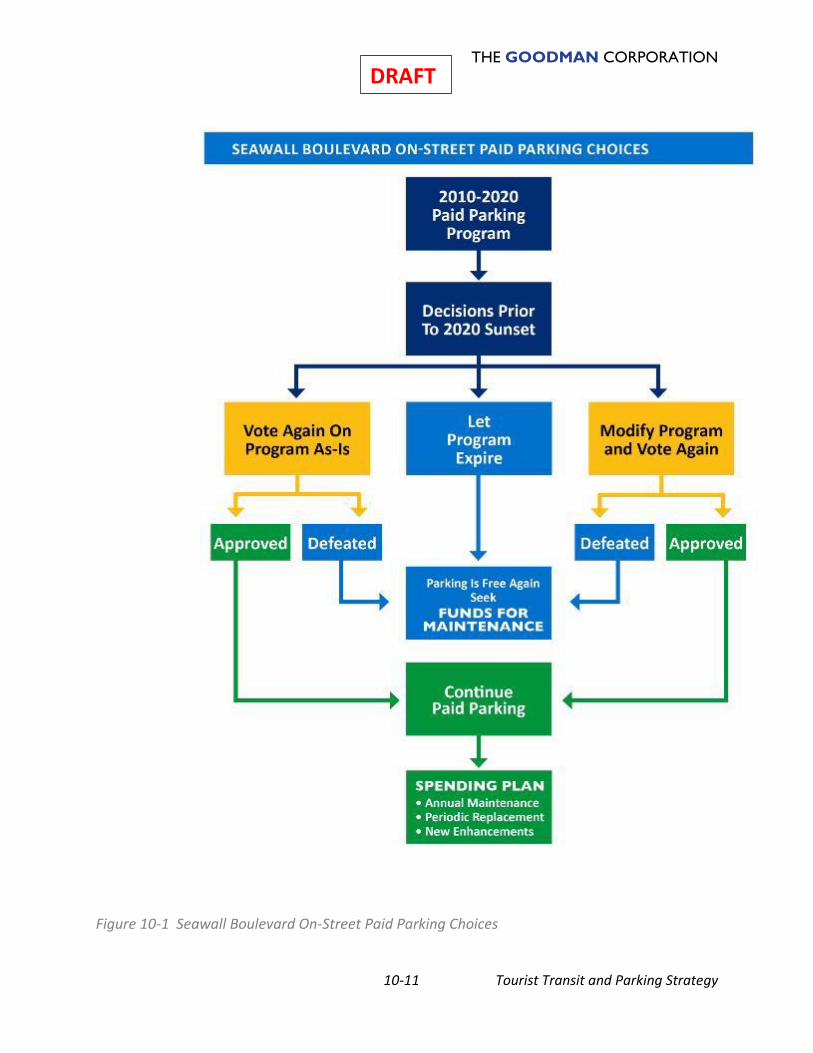
THE GOODMAN CORPORATION
10-11 Tourist Transit and Parking Strategy
DRAFT
Figure 10-1 Seawall Boulevard On-Street Paid Parking Choices
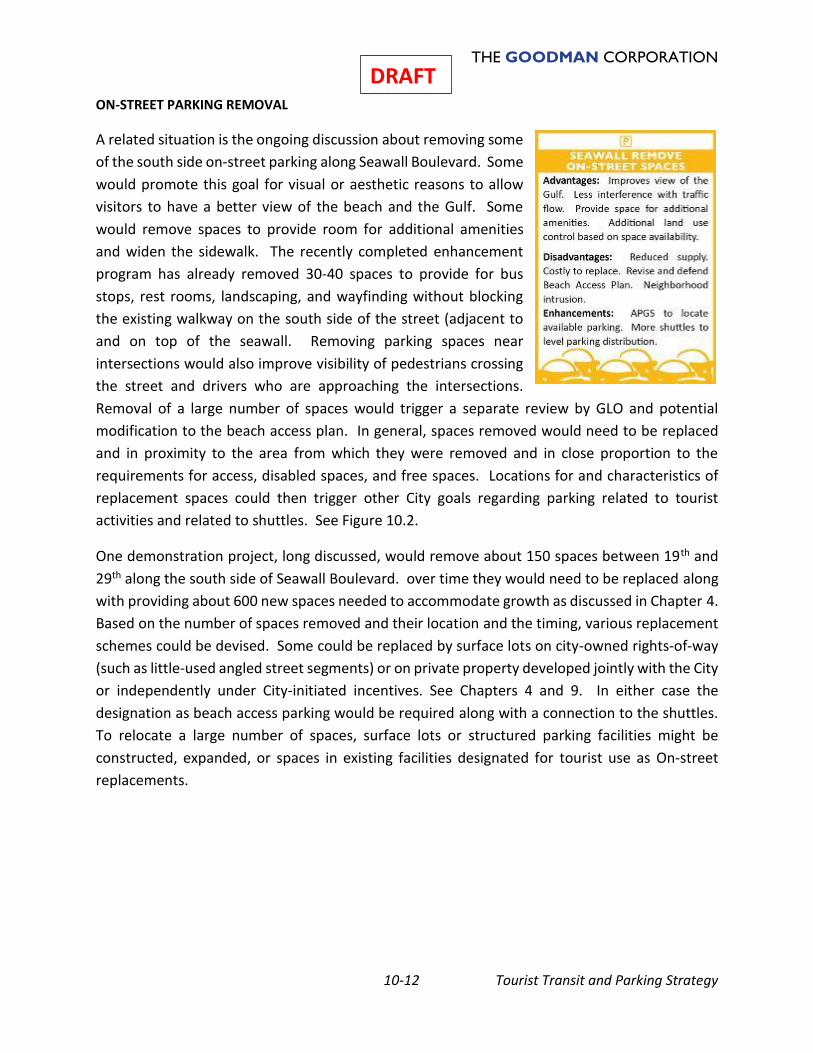
THE GOODMAN CORPORATION
10-12 Tourist Transit and Parking Strategy
DRAFT ON-STREET PARKING REMOVAL
A related situation is the ongoing discussion about removing some
of the south side on-street parking along Seawall Boulevard. Some
would promote this goal for visual or aesthetic reasons to allow
visitors to have a better view of the beach and the Gulf. Some
would remove spaces to provide room for additional amenities
and widen the sidewalk. The recently completed enhancement
program has already removed 30-40 spaces to provide for bus
stops, rest rooms, landscaping, and wayfinding without blocking
the existing walkway on the south side of the street (adjacent to
and on top of the seawall. Removing parking spaces near
intersections would also improve visibility of pedestrians crossing
the street and drivers who are approaching the intersections.
Removal of a large number of spaces would trigger a separate review by GLO and potential
modification to the beach access plan. In general, spaces removed would need to be replaced
and in proximity to the area from which they were removed and in close proportion to the
requirements for access, disabled spaces, and free spaces. Locations for and characteristics of
replacement spaces could then trigger other City goals regarding parking related to tourist
activities and related to shuttles. See Figure 10.2.
One demonstration project, long discussed, would remove about 150 spaces between 19th and
29th along the south side of Seawall Boulevard. over time they would need to be replaced along
with providing about 600 new spaces needed to accommodate growth as discussed in Chapter 4.
Based on the number of spaces removed and their location and the timing, various replacement
schemes could be devised. Some could be replaced by surface lots on city-owned rights-of-way
(such as little-used angled street segments) or on private property developed jointly with the City
or independently under City-initiated incentives. See Chapters 4 and 9. In either case the
designation as beach access parking would be required along with a connection to the shuttles.
To relocate a large number of spaces, surface lots or structured parking facilities might be
constructed, expanded, or spaces in existing facilities designated for tourist use as On-street
replacements.
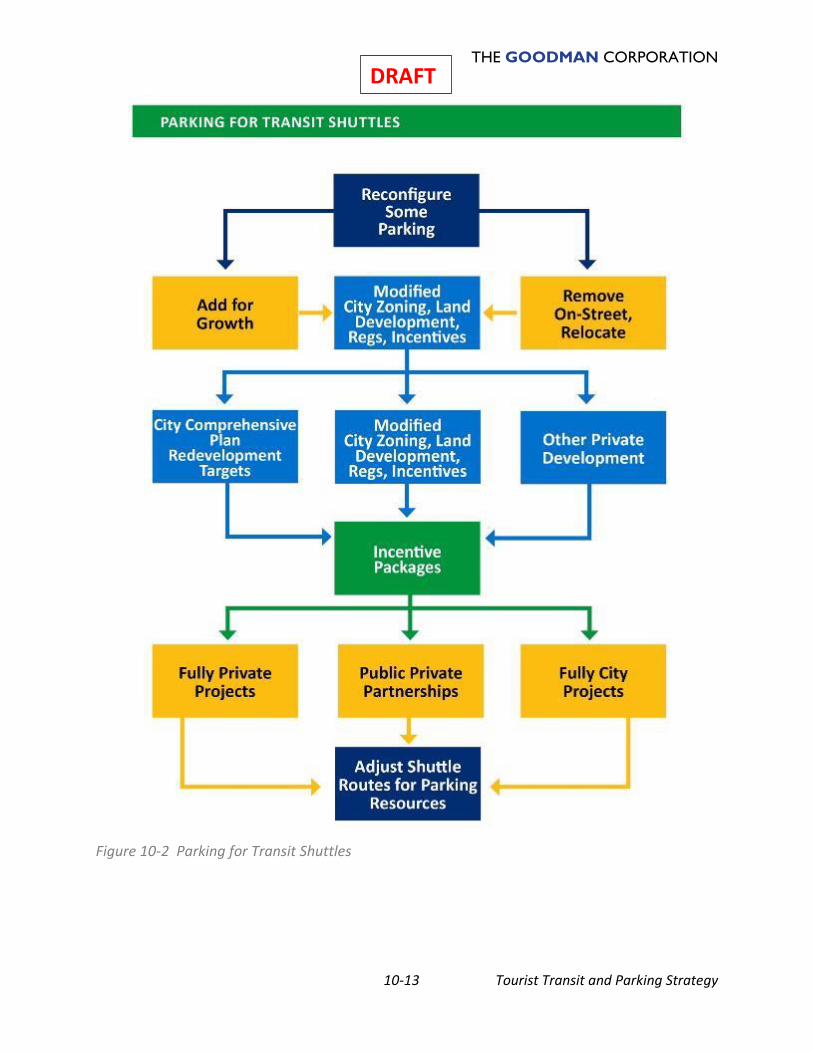
THE GOODMAN CORPORATION
10-13 Tourist Transit and Parking Strategy
DRAFT
Figure 10-2 Parking for Transit Shuttles
THE GOODMAN CORPORATION
10-14 Tourist Transit and Parking Strategy
DRAFT Achieving this situation would then trigger the next strategic decision for the City, namely,
targeting the manner in which the added spaces would be achieved.
Chapter 9 describes various incentives that may be applied to elicit private sector engagement in
an overall parking plan. This would consist of two elements: targeting locations and approving
incentives by ordinance and through zoning and land development regulations.
Any parking program would need to accommodate two factors: anticipated need for additional
parking spaces and relocation or consolidation of spaces. Accommodating growth relates to
increased tourist activity on the island. As described in Chapter 4 there is a need to add about
600 spaces dedicated to tourist parking and shuttle activities over the next 7 years. Achieving
this can be pursued by the City in the following ways:
▪ Targeted redevelopment. As described in Chapter 4 there are several vacant,
abandoned or otherwise underperforming parcels of land along the Seawall
Boulevard corridor. Redevelopment of these parcels would be beneficial to the
City in terms of desirable urban form, increased tax base, and (through incentives
if needed) provide dedicated parking supplies for efficient park-and-shuttle
services.
▪ New development mandates. Through the land development regulations,
developers could be required to incorporate a percentage of planned parking
spaces and/or a fixed increment that would be available under agreeable terms
for use by Galveston’s Park Once tourist transit park and shuttle system during
specified operating periods. This could be attached to new development or
additions to existing developments. Since the areas where service is needed is
limited (see diagrams in Chapter 2) the rules could be incorporated into overlays
that would correspond to either the rail trolley’s fixed operating area or the
corridors where service is recommended in Chapter 8. The rules could be limited
to certain development types such as general commercial, tourist attractions,
restaurants, hotels, or retail. Consideration should be given to exempting
residential or school uses which might be considered incompatible.
THE GOODMAN CORPORATION
10-15 Tourist Transit and Parking Strategy
DRAFT The short-term incentivized consolidated off-street parking recommendations include working
with the owners of the following existing facilities:
1. Convention Center
2. Pleasure Pier
3. Stewart Beach
4. Downtown Transit Terminal/Shearn Moody Garage
5. Moody Gardens
6. Frost Bank Garage
For the longer-term objective of incentivizing private development with a public parking
component, the highest ranking recommended locations are the following. The timing of
implementation and availability of sufficient parking spaces would be greatly enhanced if the City
provides incentives as described in Chapter 9:
7. NW corner of Seawall & 21st (Beach Central)
8. Seawall Boulevard, across from Ft Crockett
9. Seawall Boulevard, between 45th & 42nd
10. Seawall Boulevard between 35th & 33rd (“Seahorse”)
11. New development at The Spot
THE GOODMAN CORPORATION
10-16 Tourist Transit and Parking Strategy
DRAFT BENEFITS OF TOURIST-ORIENTED TRANSIT
Implementation of a more robust transit and parking program oriented to Galveston’s visitors
will have numerous benefits to the community and meet numerous City goals. These have been
stated in generic terms throughout this report. In addition, some of these benefits can be
quantified and monetized using methodologies that have become standardized within the
transportation industry and used as a means of evaluating projects for competitive, discretionary
funding programs.
Periodic notices of funding availability by the Houston-Galveston Area Council (H-GAC) and
United States Department of Transportation’s (USDOT) for its Transportation Improvement
Generating Economic Recovery (TIGER) program have provided recommended methodologies
for evaluating transportation projects. The evaluation process examines the fundamental
question of whether the expected benefits of the project justify the expenditure with the
understanding that some benefits and costs are difficult to quantify. The Galveston tourist transit
and parking program will reduce vehicle miles traveled (VMT) by automobiles which improves
environmental conservation and safety, both of which are goals outlined in the 2040 H-GAC Long
Range Regional Transportation Plan.4 These benefit categories are quantified in this section.
ENVIRONMENTAL CONSERVATION BENEFITS
The United States Environmental Protection Agency (EPA) has classified the Houston-Galveston-
Brazoria area in severe nonattainment of the eight-hour federal ozone air quality standard.
Investments in transit that would produce environmental benefits due to reduction in harmful
air pollutants is a top priority for such areas in nonattainment. H-GAC models the following
harmful air pollutants for the region, for various vehicular speeds and idling times: Nitrogen
Oxides (NOx), Volatile Organic Compounds (VOC), Carbon Monoxide (CO).
Nitrogen Oxides are mixtures of gases composed of nitrogen and oxygen. These mixtures can
form nitric oxide and nitrogen dioxide. These gases contribute to “bad” ozone, known as smog.
The combination of NOx and VOC with sunlight causes smog. Smog can irritate the respiratory
4 Houston-Galveston Area Council. Appendix E. Goals and Performance Measures. Retrieved in August 2017 from http://www.h-gac.com/taq/plan/2040/docs/Appendix%20E%20RTP%20Goals%20and%20Performance%20Measures%20Background.pdf.
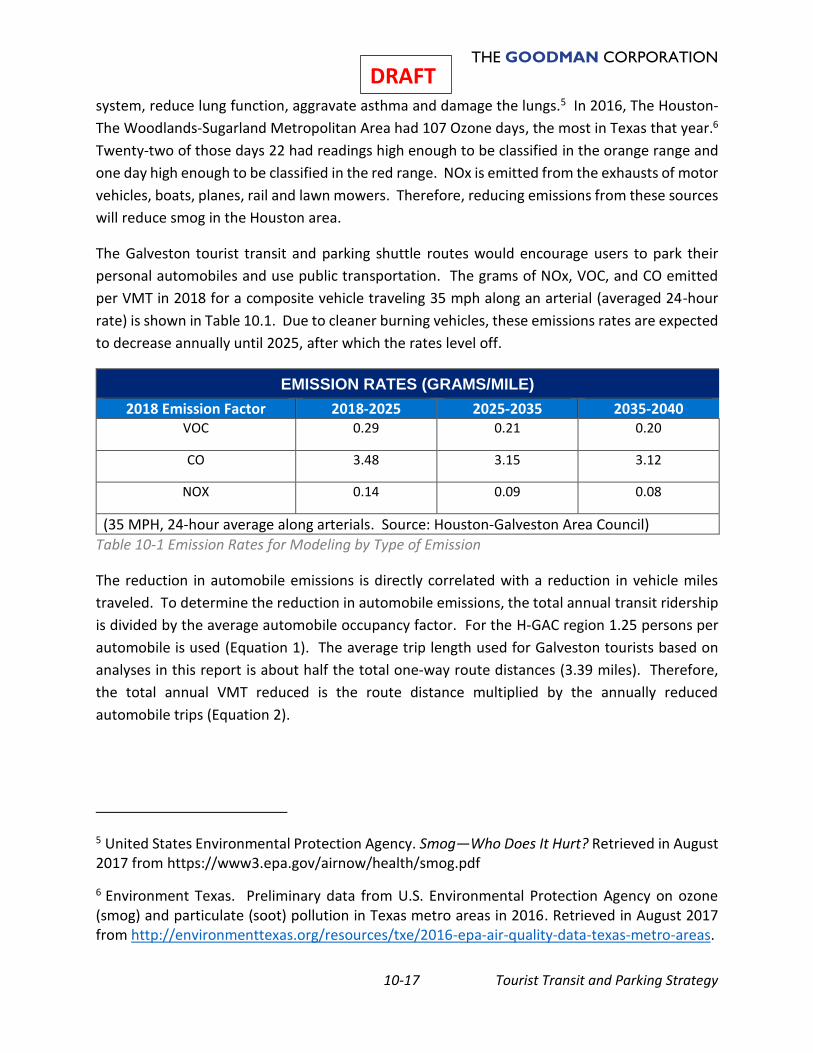
THE GOODMAN CORPORATION
10-17 Tourist Transit and Parking Strategy
DRAFT system, reduce lung function, aggravate asthma and damage the lungs.5 In 2016, The Houston-
The Woodlands-Sugarland Metropolitan Area had 107 Ozone days, the most in Texas that year.6
Twenty-two of those days 22 had readings high enough to be classified in the orange range and
one day high enough to be classified in the red range. NOx is emitted from the exhausts of motor
vehicles, boats, planes, rail and lawn mowers. Therefore, reducing emissions from these sources
will reduce smog in the Houston area.
The Galveston tourist transit and parking shuttle routes would encourage users to park their
personal automobiles and use public transportation. The grams of NOx, VOC, and CO emitted
per VMT in 2018 for a composite vehicle traveling 35 mph along an arterial (averaged 24-hour
rate) is shown in Table 10.1. Due to cleaner burning vehicles, these emissions rates are expected
to decrease annually until 2025, after which the rates level off.
EMISSION RATES (GRAMS/MILE)
2018 Emission Factor 2018-2025 2025-2035 2035-2040 VOC 0.29 0.21 0.20
CO 3.48 3.15 3.12
NOX 0.14 0.09 0.08
(35 MPH, 24-hour average along arterials. Source: Houston-Galveston Area Council)
Table 10-1 Emission Rates for Modeling by Type of Emission
The reduction in automobile emissions is directly correlated with a reduction in vehicle miles
traveled. To determine the reduction in automobile emissions, the total annual transit ridership
is divided by the average automobile occupancy factor. For the H-GAC region 1.25 persons per
automobile is used (Equation 1). The average trip length used for Galveston tourists based on
analyses in this report is about half the total one-way route distances (3.39 miles). Therefore,
the total annual VMT reduced is the route distance multiplied by the annually reduced
automobile trips (Equation 2).
5 United States Environmental Protection Agency. Smog—Who Does It Hurt? Retrieved in August 2017 from https://www3.epa.gov/airnow/health/smog.pdf
6 Environment Texas. Preliminary data from U.S. Environmental Protection Agency on ozone (smog) and particulate (soot) pollution in Texas metro areas in 2016. Retrieved in August 2017 from http://environmenttexas.org/resources/txe/2016-epa-air-quality-data-texas-metro-areas.
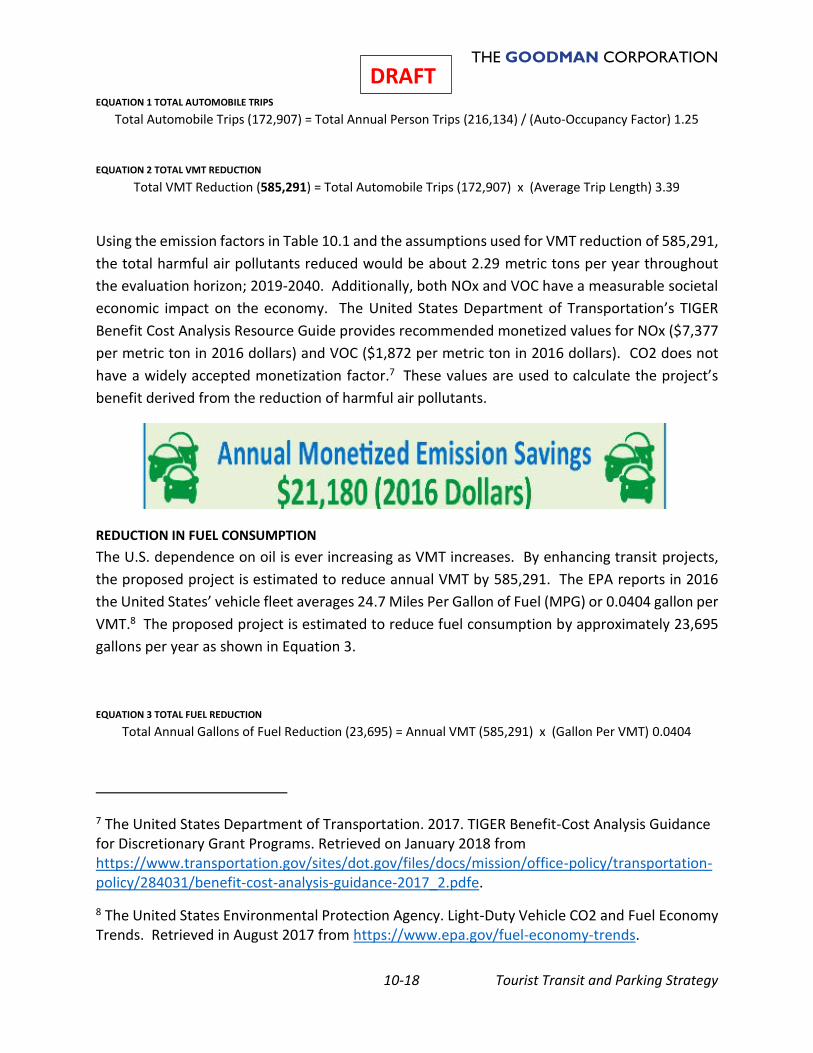
THE GOODMAN CORPORATION
10-18 Tourist Transit and Parking Strategy
DRAFT EQUATION 1 TOTAL AUTOMOBILE TRIPS
Total Automobile Trips (172,907) = Total Annual Person Trips (216,134) / (Auto-Occupancy Factor) 1.25
EQUATION 2 TOTAL VMT REDUCTION
Total VMT Reduction (585,291) = Total Automobile Trips (172,907) x (Average Trip Length) 3.39
Using the emission factors in Table 10.1 and the assumptions used for VMT reduction of 585,291,
the total harmful air pollutants reduced would be about 2.29 metric tons per year throughout
the evaluation horizon; 2019-2040. Additionally, both NOx and VOC have a measurable societal
economic impact on the economy. The United States Department of Transportation’s TIGER
Benefit Cost Analysis Resource Guide provides recommended monetized values for NOx ($7,377
per metric ton in 2016 dollars) and VOC ($1,872 per metric ton in 2016 dollars). CO2 does not
have a widely accepted monetization factor.7 These values are used to calculate the project’s
benefit derived from the reduction of harmful air pollutants.
REDUCTION IN FUEL CONSUMPTION
The U.S. dependence on oil is ever increasing as VMT increases. By enhancing transit projects,
the proposed project is estimated to reduce annual VMT by 585,291. The EPA reports in 2016
the United States’ vehicle fleet averages 24.7 Miles Per Gallon of Fuel (MPG) or 0.0404 gallon per
VMT.8 The proposed project is estimated to reduce fuel consumption by approximately 23,695
gallons per year as shown in Equation 3.
EQUATION 3 TOTAL FUEL REDUCTION
Total Annual Gallons of Fuel Reduction (23,695) = Annual VMT (585,291) x (Gallon Per VMT) 0.0404
7 The United States Department of Transportation. 2017. TIGER Benefit-Cost Analysis Guidance for Discretionary Grant Programs. Retrieved on January 2018 from https://www.transportation.gov/sites/dot.gov/files/docs/mission/office-policy/transportation-policy/284031/benefit-cost-analysis-guidance-2017_2.pdfe.
8 The United States Environmental Protection Agency. Light-Duty Vehicle CO2 and Fuel Economy Trends. Retrieved in August 2017 from https://www.epa.gov/fuel-economy-trends.
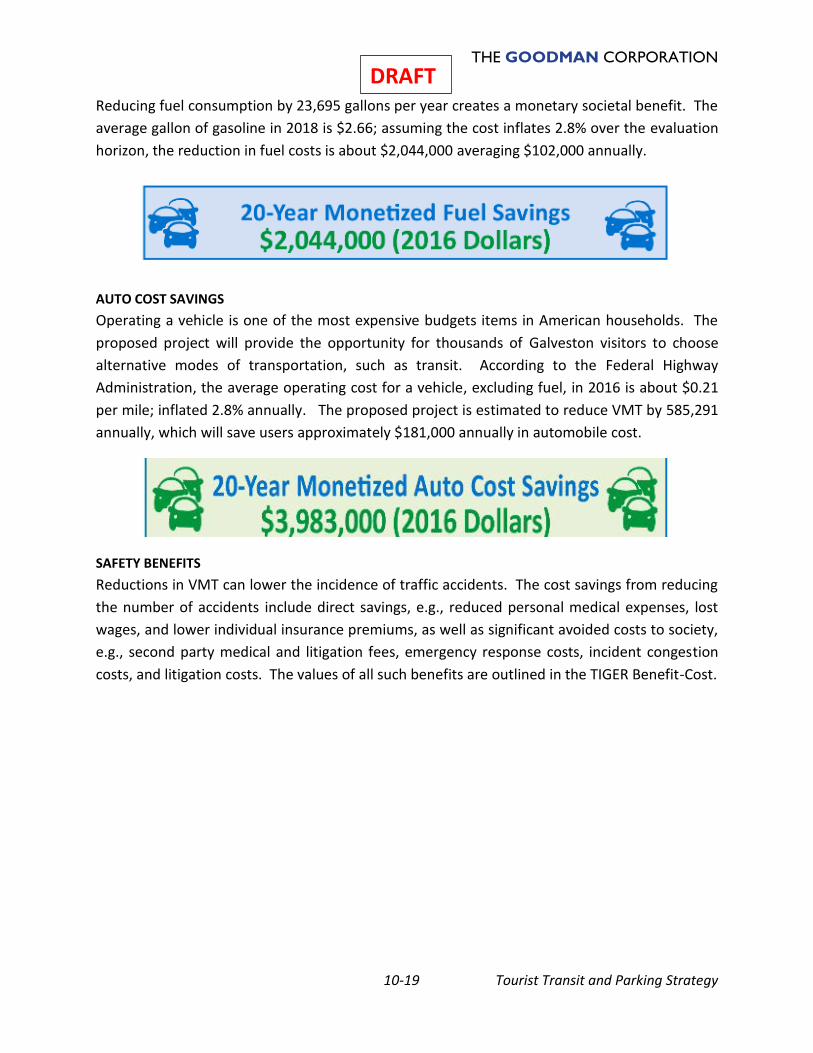
THE GOODMAN CORPORATION
10-19 Tourist Transit and Parking Strategy
DRAFT Reducing fuel consumption by 23,695 gallons per year creates a monetary societal benefit. The
average gallon of gasoline in 2018 is $2.66; assuming the cost inflates 2.8% over the evaluation
horizon, the reduction in fuel costs is about $2,044,000 averaging $102,000 annually.
AUTO COST SAVINGS
Operating a vehicle is one of the most expensive budgets items in American households. The
proposed project will provide the opportunity for thousands of Galveston visitors to choose
alternative modes of transportation, such as transit. According to the Federal Highway
Administration, the average operating cost for a vehicle, excluding fuel, in 2016 is about $0.21
per mile; inflated 2.8% annually. The proposed project is estimated to reduce VMT by 585,291
annually, which will save users approximately $181,000 annually in automobile cost.
SAFETY BENEFITS
Reductions in VMT can lower the incidence of traffic accidents. The cost savings from reducing
the number of accidents include direct savings, e.g., reduced personal medical expenses, lost
wages, and lower individual insurance premiums, as well as significant avoided costs to society,
e.g., second party medical and litigation fees, emergency response costs, incident congestion
costs, and litigation costs. The values of all such benefits are outlined in the TIGER Benefit-Cost.
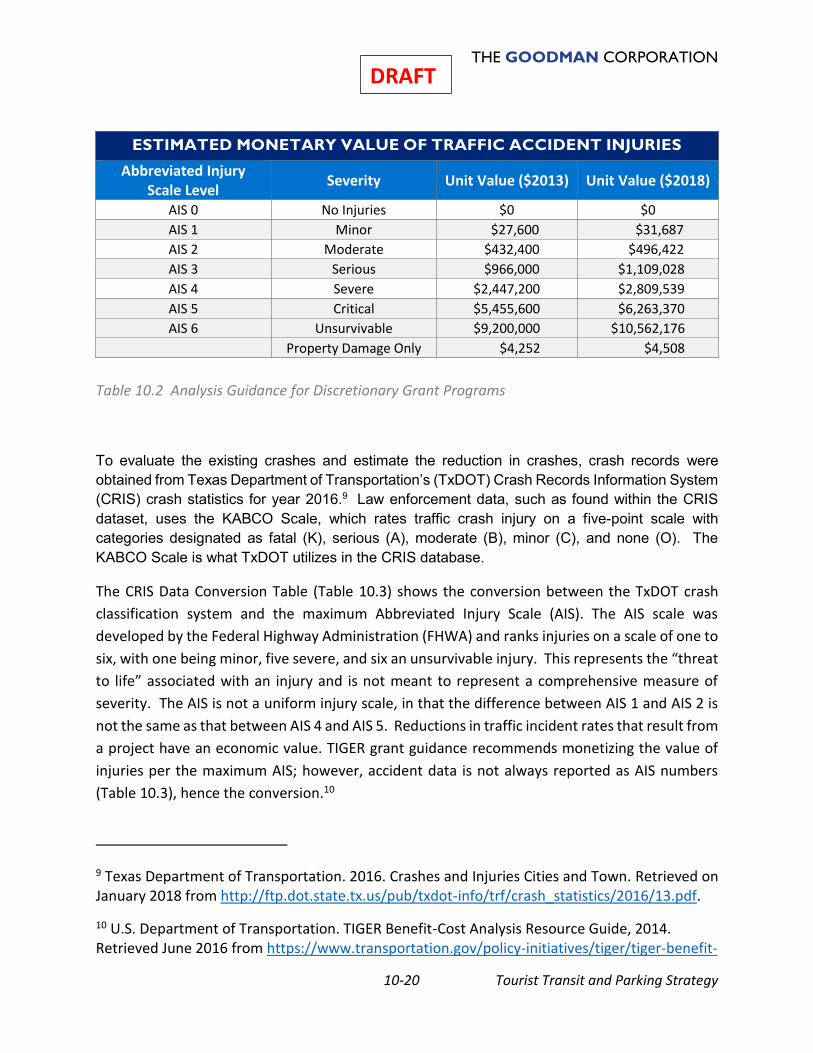
THE GOODMAN CORPORATION
10-20 Tourist Transit and Parking Strategy
DRAFT
ESTIMATED MONETARY VALUE OF TRAFFIC ACCIDENT INJURIES
Abbreviated Injury Scale Level
Severity Unit Value ($2013) Unit Value ($2018)
AIS 0 No Injuries $0 $0
AIS 1 Minor $27,600 $31,687
AIS 2 Moderate $432,400 $496,422
AIS 3 Serious $966,000 $1,109,028
AIS 4 Severe $2,447,200 $2,809,539
AIS 5 Critical $5,455,600 $6,263,370
AIS 6 Unsurvivable $9,200,000 $10,562,176
Property Damage Only $4,252 $4,508
Table 10.2 Analysis Guidance for Discretionary Grant Programs
To evaluate the existing crashes and estimate the reduction in crashes, crash records were obtained from Texas Department of Transportation’s (TxDOT) Crash Records Information System (CRIS) crash statistics for year 2016.9 Law enforcement data, such as found within the CRIS dataset, uses the KABCO Scale, which rates traffic crash injury on a five-point scale with categories designated as fatal (K), serious (A), moderate (B), minor (C), and none (O). The KABCO Scale is what TxDOT utilizes in the CRIS database.
The CRIS Data Conversion Table (Table 10.3) shows the conversion between the TxDOT crash
classification system and the maximum Abbreviated Injury Scale (AIS). The AIS scale was
developed by the Federal Highway Administration (FHWA) and ranks injuries on a scale of one to
six, with one being minor, five severe, and six an unsurvivable injury. This represents the “threat
to life” associated with an injury and is not meant to represent a comprehensive measure of
severity. The AIS is not a uniform injury scale, in that the difference between AIS 1 and AIS 2 is
not the same as that between AIS 4 and AIS 5. Reductions in traffic incident rates that result from
a project have an economic value. TIGER grant guidance recommends monetizing the value of
injuries per the maximum AIS; however, accident data is not always reported as AIS numbers
(Table 10.3), hence the conversion.10
9 Texas Department of Transportation. 2016. Crashes and Injuries Cities and Town. Retrieved on January 2018 from http://ftp.dot.state.tx.us/pub/txdot-info/trf/crash_statistics/2016/13.pdf.
10 U.S. Department of Transportation. TIGER Benefit-Cost Analysis Resource Guide, 2014. Retrieved June 2016 from https://www.transportation.gov/policy-initiatives/tiger/tiger-benefit-
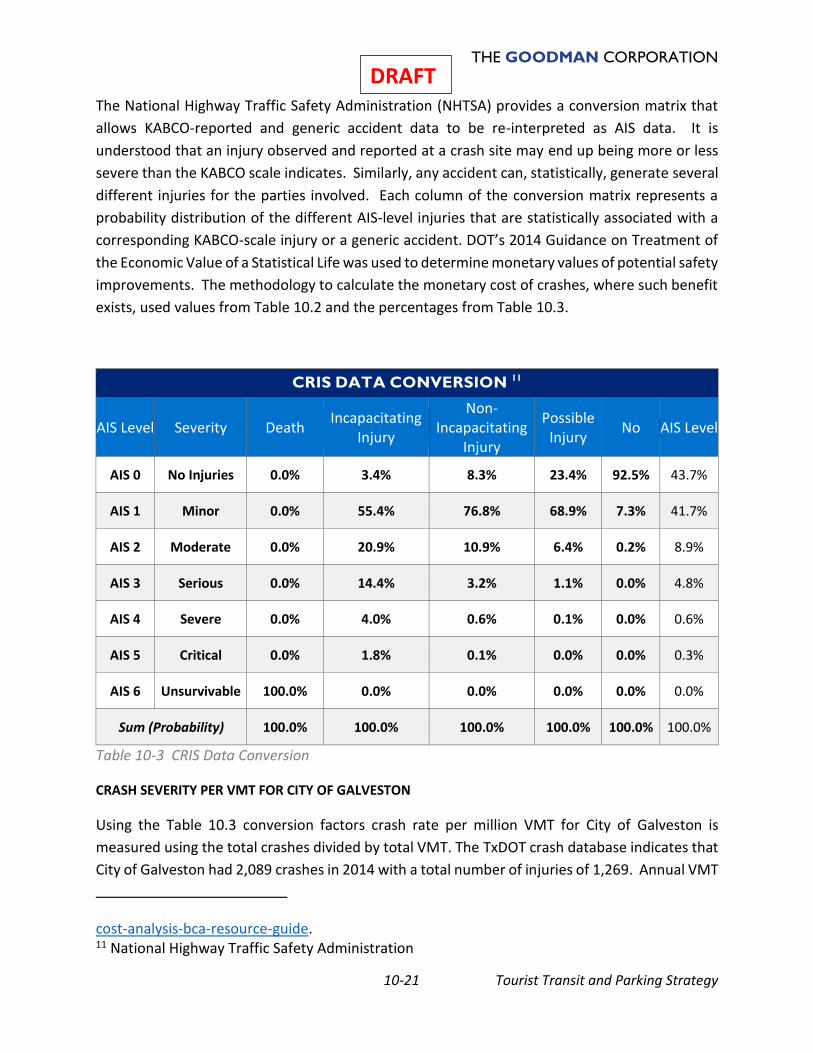
THE GOODMAN CORPORATION
10-21 Tourist Transit and Parking Strategy
DRAFT The National Highway Traffic Safety Administration (NHTSA) provides a conversion matrix that
allows KABCO-reported and generic accident data to be re-interpreted as AIS data. It is
understood that an injury observed and reported at a crash site may end up being more or less
severe than the KABCO scale indicates. Similarly, any accident can, statistically, generate several
different injuries for the parties involved. Each column of the conversion matrix represents a
probability distribution of the different AIS-level injuries that are statistically associated with a
corresponding KABCO-scale injury or a generic accident. DOT’s 2014 Guidance on Treatment of
the Economic Value of a Statistical Life was used to determine monetary values of potential safety
improvements. The methodology to calculate the monetary cost of crashes, where such benefit
exists, used values from Table 10.2 and the percentages from Table 10.3.
CRIS DATA CONVERSION 11
AIS Level Severity Death Incapacitating
Injury
Non-Incapacitating
Injury
Possible Injury
No AIS Level
AIS 0 No Injuries 0.0% 3.4% 8.3% 23.4% 92.5% 43.7%
AIS 1 Minor 0.0% 55.4% 76.8% 68.9% 7.3% 41.7%
AIS 2 Moderate 0.0% 20.9% 10.9% 6.4% 0.2% 8.9%
AIS 3 Serious 0.0% 14.4% 3.2% 1.1% 0.0% 4.8%
AIS 4 Severe 0.0% 4.0% 0.6% 0.1% 0.0% 0.6%
AIS 5 Critical 0.0% 1.8% 0.1% 0.0% 0.0% 0.3%
AIS 6 Unsurvivable 100.0% 0.0% 0.0% 0.0% 0.0% 0.0%
Sum (Probability) 100.0% 100.0% 100.0% 100.0% 100.0% 100.0%
Table 10-3 CRIS Data Conversion
CRASH SEVERITY PER VMT FOR CITY OF GALVESTON
Using the Table 10.3 conversion factors crash rate per million VMT for City of Galveston is
measured using the total crashes divided by total VMT. The TxDOT crash database indicates that
City of Galveston had 2,089 crashes in 2014 with a total number of injuries of 1,269. Annual VMT
cost-analysis-bca-resource-guide. 11 National Highway Traffic Safety Administration
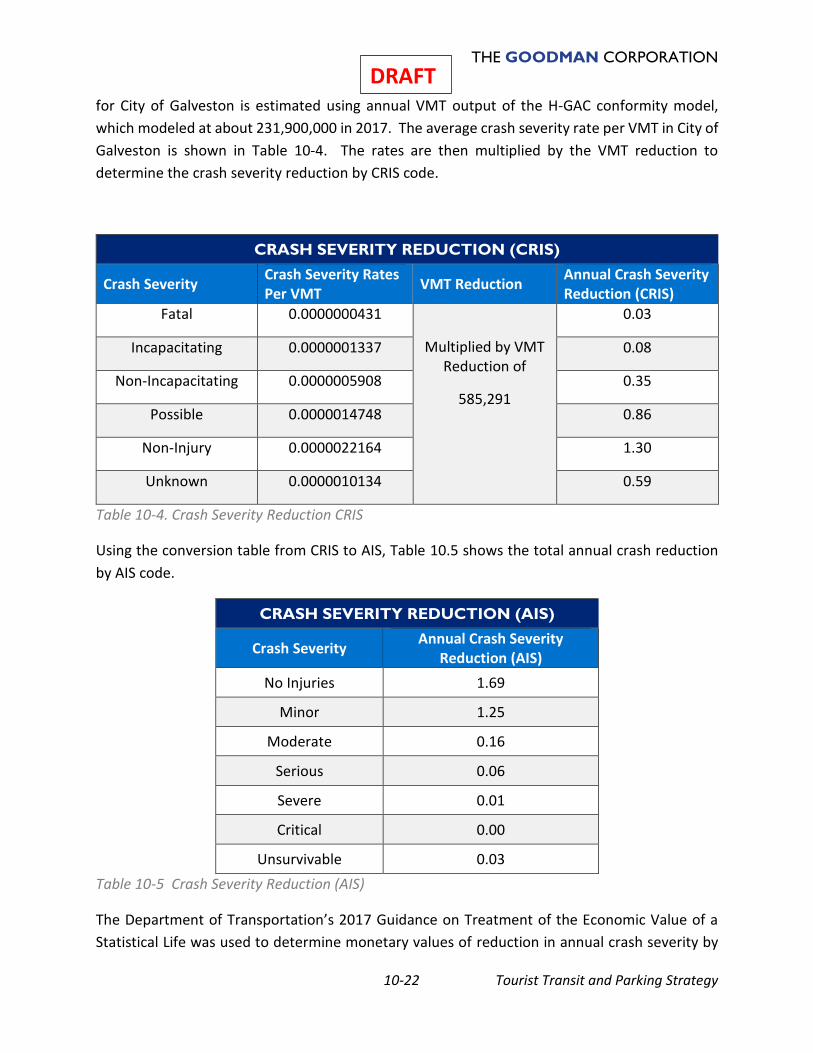
THE GOODMAN CORPORATION
10-22 Tourist Transit and Parking Strategy
DRAFT for City of Galveston is estimated using annual VMT output of the H-GAC conformity model,
which modeled at about 231,900,000 in 2017. The average crash severity rate per VMT in City of
Galveston is shown in Table 10-4. The rates are then multiplied by the VMT reduction to
determine the crash severity reduction by CRIS code.
CRASH SEVERITY REDUCTION (CRIS)
Crash Severity Crash Severity Rates Per VMT
VMT Reduction Annual Crash Severity Reduction (CRIS)
Fatal 0.0000000431
Multiplied by VMT Reduction of
585,291
0.03
Incapacitating 0.0000001337 0.08
Non-Incapacitating 0.0000005908 0.35
Possible 0.0000014748 0.86
Non-Injury 0.0000022164 1.30
Unknown 0.0000010134 0.59
Table 10-4. Crash Severity Reduction CRIS
Using the conversion table from CRIS to AIS, Table 10.5 shows the total annual crash reduction
by AIS code.
CRASH SEVERITY REDUCTION (AIS)
Crash Severity Annual Crash Severity
Reduction (AIS)
No Injuries 1.69
Minor 1.25
Moderate 0.16
Serious 0.06
Severe 0.01
Critical 0.00
Unsurvivable 0.03
Table 10-5 Crash Severity Reduction (AIS)
The Department of Transportation’s 2017 Guidance on Treatment of the Economic Value of a
Statistical Life was used to determine monetary values of reduction in annual crash severity by
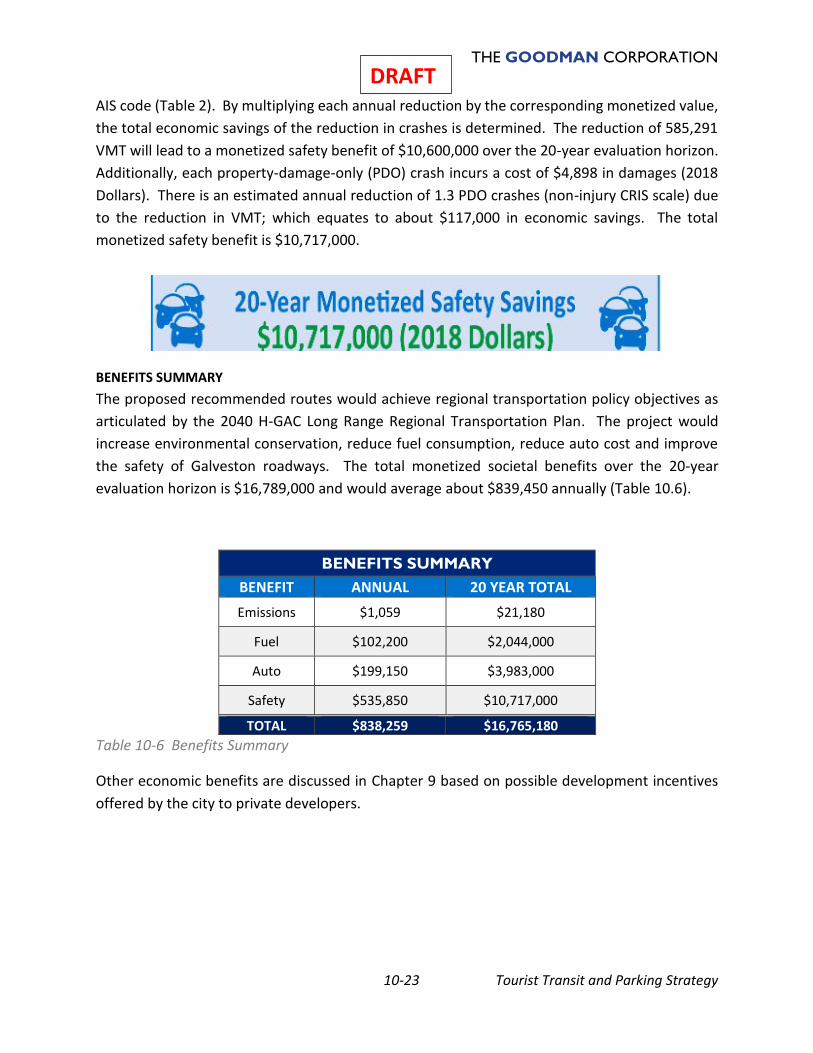
THE GOODMAN CORPORATION
10-23 Tourist Transit and Parking Strategy
DRAFT AIS code (Table 2). By multiplying each annual reduction by the corresponding monetized value,
the total economic savings of the reduction in crashes is determined. The reduction of 585,291
VMT will lead to a monetized safety benefit of $10,600,000 over the 20-year evaluation horizon.
Additionally, each property-damage-only (PDO) crash incurs a cost of $4,898 in damages (2018
Dollars). There is an estimated annual reduction of 1.3 PDO crashes (non-injury CRIS scale) due
to the reduction in VMT; which equates to about $117,000 in economic savings. The total
monetized safety benefit is $10,717,000.
BENEFITS SUMMARY
The proposed recommended routes would achieve regional transportation policy objectives as
articulated by the 2040 H-GAC Long Range Regional Transportation Plan. The project would
increase environmental conservation, reduce fuel consumption, reduce auto cost and improve
the safety of Galveston roadways. The total monetized societal benefits over the 20-year
evaluation horizon is $16,789,000 and would average about $839,450 annually (Table 10.6).
BENEFITS SUMMARY
BENEFIT ANNUAL 20 YEAR TOTAL
Emissions $1,059 $21,180
Fuel $102,200 $2,044,000
Auto $199,150 $3,983,000
Safety $535,850 $10,717,000
TOTAL $838,259 $16,765,180
Table 10-6 Benefits Summary
Other economic benefits are discussed in Chapter 9 based on possible development incentives
offered by the city to private developers.
THE GOODMAN CORPORATION
10-24 Tourist Transit and Parking Strategy
DRAFT


